UNITED STATES
SECURITIES AND EXCHANGE COMMISSION
Washington, D.C. 20549
FORM N-CSR
CERTIFIED SHAREHOLDER REPORT OF REGISTERED MANAGEMENT
INVESTMENT COMPANIES
Investment Company Act file number 811-07619
Nuveen Investment Trust
(Exact name of registrant as specified in charter)
Nuveen Investments
333 West Wacker Drive, Chicago, IL 60606
(Address of principal executive offices) (Zip code)
Kevin J. McCarthy
Nuveen Investments
333 West Wacker Drive
Chicago, IL 60606
(Name and address of agent for service)
Registrant’s telephone number, including area code: (312) 917-7700
Date of fiscal year end: June 30
Date of reporting period: June 30, 2014
Form N-CSR is to be used by management investment companies to file reports with the Commission not later than 10 days after the transmission to stockholders of any report that is required to be transmitted to stockholders under Rule 30e-1 under the Investment Company Act of 1940 (17 CFR 270.30e-1). The Commission may use the information provided on Form N-CSR in its regulatory, disclosure review, inspection, and policy making roles.
A registrant is required to disclose the information specified by Form N-CSR, and the Commission will make this information public. A registrant is not required to respond to the collection of information contained in Form N-CSR unless the Form displays a currently valid Office of Management and Budget (“OMB”) control number. Please direct comments concerning the accuracy of the information collection burden estimate and any suggestions for reducing the burden to Secretary, Securities and Exchange Commission, 450 Fifth Street, NW, Washington, DC 20549-0609. The OMB has reviewed this collection of information under the clearance requirements of 44 U.S.C. ss.3507.
ITEM 1. REPORTS TO STOCKHOLDERS.
| | |
| | |  |
| Mutual Funds | |
| | | | | | |
| | | | | | | Annual Report June 30, 2014 |
| | | | | | | | | | | | | | | | |
| | | | | | | Share Class / Ticker Symbol |
| | | Fund Name | | | | Class A | | Class C | | Class R3 | | Class R6 | | Class I | | |
|
| | Nuveen NWQ Global Equity Fund | | | | NGEAX | | NGECX | | — | | — | | NGEIX | | |
| | Nuveen NWQ Global Equity Income Fund
(formerly Nuveen NWQ Equity Income Fund) | | | | NQGAX | | NQGCX | | — | | — | | NQGIX | | |
| | Nuveen NWQ Multi-Cap Value Fund | | | | NQVAX | | NQVCX | | NMCTX | | — | | NQVRX | | |
| | Nuveen NWQ Large-Cap Value Fund | | | | NQCAX | | NQCCX | | NQCQX | | — | | NQCRX | | |
| | Nuveen NWQ Small/Mid-Cap Value Fund | | | | NSMAX | | NSMCX | | NWQRX | | — | | NSMRX | | |
| | Nuveen NWQ Small-Cap Value Fund | | | | NSCAX | | NSCCX | | NSCQX | | NSCFX | | NSCRX | | |
| | Nuveen Tradewinds Value Opportunities Fund | | | | NVOAX | | NVOCX | | NTVTX | | — | | NVORX | | |
| | | | | | | | | | | | |
| | | | | | |
| | | | |
| | | | | | | | |
| | |
| | | | |
| | NUVEEN INVESTMENTS TO BE ACQUIRED BY TIAA-CREF | | |
| | |
| | On April 14, 2014, TIAA-CREF announced that it had entered into an agreement to acquire Nuveen Investments, the parent company of your fund’s investment adviser, Nuveen Fund Advisors, LLC (“NFAL”) and the Nuveen affiliates that act as sub-advisers to the majority of the Nuveen Funds. TIAA-CREF is a national financial services organization with approximately $569 billion in assets under management (as of March 31, 2014) and is a leading provider of retirement services in the academic, research, medical and cultural fields. Nuveen anticipates that it will operate as a separate subsidiary within TIAA-CREF’s asset management business, and that its current leadership and key investment teams will stay in place. Your fund investment will not change as a result of Nuveen’s change of ownership. You will still own the same fund shares and the underlying value of those shares will not change as a result of the transaction. NFAL and your fund’s sub-adviser(s) will continue to manage your fund according to the same objectives and policies as before, and we do not anticipate any significant changes to your fund’s operations. Under the securities laws, the consummation of the transaction will result in the automatic termination of the investment management agreements between the funds and NFAL and the investment sub-advisory agreements between NFAL and each fund’s sub-adviser(s). The new agreements have been approved by shareholders of Nuveen NWQ Global Equity Fund, Nuveen NWQ Global Equity Income Fund and Nuveen NWQ Multi-Cap Value Fund. Shareholder meetings for Nuveen NWQ Large-Cap Value Fund, Nuveen NWQ Small/Mid-Cap Value Fund, Nuveen NWQ Small-Cap Value Fund and Nuveen Tradewinds Value Opportunities Fund have been adjourned until Friday, September 19, 2014, with respect to approval of the new investment management and investment sub-advisory agreements (as well as the approval of certain fundamental investment policy changes) to permit the continued solicitation of additional votes. The adjourned meetings for these funds will be held at 2:30 p.m., Central time, on Friday, September 19, 2014 at the offices of Nuveen Investments, 333 West Wacker Drive, Chicago, Illinois 60606. Nuveen’s transaction with TIAA-CREF is currently expected to close early in the fourth quarter of 2014, but remains subject to other customary closing conditions. | | |
| | | | |
| | | | | | Must be preceded by or accompanied by a prospectus. NOT FDIC INSURED MAY LOSE VALUE
NO BANK GUARANTEE | | |
| | | | | | | | | | |
| | | | | | | | | | | | | |

Table
of Contents
Chairman’s Letter
to Shareholders

Dear Shareholders,
After significant growth in 2013, domestic and international equity markets have been less com-pelling during the first part of 2014. Concerns about deflation, political uncertainty in many places and the potential for more fragile economies to impact other countries have produced uncertainty in the markets.
Europe is beginning to emerge slowly from the recession in mid-2013, with improved GDP and employment trends in some countries. However, Japan’s deflationary headwinds have resur-faced; and China shows signs of slowing from credit distress combined with declines in manufacturing and exports. Most recently, tensions between Russia and Ukraine may continue to hold back stocks and support government bonds in the near term.
Despite these headwinds, there are some encouraging signs of forward momentum in the mar-kets. In the U.S., the news is more positive with financial risks slowly receding, positive GDP trends, downward trending unemployment and stronger household finances and corporate spending.
It is in such changeable markets that professional investment management is most important. Investment teams who have experienced challenging markets in the past understand how their asset class can behave in rapidly changing times. Remaining committed to their investment disciplines during these times is a critical component to achieving long-term success. In fact, many strong investment track records are established during challenging periods because experienced investment teams understand that volatile markets place a premium on companies and investment ideas that can weather the short-term volatility. By maintaining appropriate time horizons, diversification and relying on practiced investment teams, we believe that investors can achieve their long-term investment objectives.
As always, I encourage you to communicate with your financial consultant if you have any ques-tions about your investment in a Nuveen Fund. On behalf of the other members of the Nuveen Fund Board, we look forward to continuing to earn your trust in the months and years ahead.
Sincerely,

William J. Schneider
Chairman of the Board
August 25, 2014
Portfolio Managers’
Comments
Nuveen NWQ Global Equity Fund
Nuveen NWQ Global Equity Income Fund
Nuveen NWQ Multi-Cap Value Fund
Nuveen NWQ Large-Cap Value Fund
Nuveen NWQ Small/Mid-Cap Value Fund
Nuveen NWQ Small-Cap Value Fund
Nuveen Tradewinds Value Opportunities Fund
The Nuveen NWQ Global Equity Fund, Nuveen NWQ Global Equity Income Fund, Nuveen NWQ Multi-Cap Value Fund, Nuveen NWQ Large-Cap Value Fund, Nuveen NWQ Small/Mid-Cap Value Fund and Nuveen NWQ Small-Cap Value Fund feature portfolio management by NWQ Investment Management Company, LLC (NWQ), an affiliate of Nuveen Investments, Inc. Jon Bosse is the Chief Investment Officer of NWQ and manages the Nuveen NWQ Multi-Cap Value and Large-Cap Value Funds. Phyllis Thomas, CFA, manages the Nuveen NWQ Small/Mid-Cap Value and Small-Cap Value Funds. Gregg Tenser, CFA, manages the Nuveen NWQ Global Equity Fund and James Stephenson, CFA, manages the Nuveen NWQ Global Equity Income Fund.
On December 13, 2013, the Fund’s name changed from Nuveen NWQ Equity Income Fund to Nuveen NWQ Global Equity Income Fund and James T. Stephenson, CFA, became the sole portfolio manager of the Fund. The Principal Investment Strategy was changed to state that the Fund may invest in securities of issuers located anywhere in the world. Under normal market conditions, the Fund will invest at least 40% of its net assets in non-U.S. securities and will invest in securities of at least three different countries (one of which may be the United States). The Fund may invest up to 20% of its net assets in securities of companies located in emerging markets.
The Nuveen Tradewinds Value Opportunities Fund features portfolio management by Tradewinds Global Investors, LLC (Tradewinds), an affiliate of Nuveen Investments, Inc. Joann Barry, CFA and F. Rowe Michels, CFA serve as portfolio managers of the Fund.
Here they discuss the U.S. economy and equity markets, their management strategies and the performance of the Funds for the twelve-month reporting period ended June 30, 2014.
What factors affected the U.S. economy and equity markets during the twelve-month reporting period ended June 30, 2014?
During this reporting period, the U.S. economy continued its bumpy advance toward recovery from recession. The Federal Reserve (Fed) maintained efforts to bolster growth and promote progress toward its mandates of maximum employment and price stability by holding the benchmark fed funds rate at the record low level of zero to 0.25% that it established in December 2008. Based on its view that the underlying strength in the broader economy was enough to support ongoing improvement in the labor market, the Fed began to reduce or taper, its monthly asset purchases in $10 billion increments over the course of five consecutive meetings (December 2013 through June 2014). As of July 2014, the Fed’s monthly purchases comprise $15 billion in mortgage-backed securities (versus the original $40 billion per month) and $20 billion in longer-term Treasury securities (versus $45 billion). Following its June 2014 meeting (subsequent to the close of this reporting period), the Fed reiterated that it would continue to look at a wide range of factors, including labor market conditions, indicators of inflationary pressures and readings on financial developments, in determining future actions, saying that it would likely maintain the current target range for the fed funds rate for a considerable time after the asset purchase program ends, especially if projected inflation continues to run below the Fed’s 2% longer-run goal.
Certain statements in this report are forward-looking statements. Discussions of specific investments are for illustration only and are not intended as recommendations of individual investments. The forward-looking statements and other views expressed herein are those of the portfolio managers as of the date of this report. Actual future results or occurrences may differ significantly from those anticipated in any forward-looking statements and the views expressed herein are subject to change at any time, due to numerous market and other factors. The Funds disclaim any obligation to update publicly or revise any forward-looking statements or views expressed herein.
Portfolio Managers’ Comments (continued)
In the second quarter of 2014, the U.S. economy, as measured by the U.S. gross domestic product (GDP), grew 4%. In the previous quarter, the GDP contracted at an annualized rate of 2.1%, the economy’s weakest quarter since the recession officially ended in June 2009. The decline during this period was attributed in part to the severe weather of the past winter, which deterred consumer spending and disrupted construction, production and shipping. The Consumer Price Index (CPI) rose 2.1% year-over-year as of June 2014, while the core CPI (which excludes food and energy) increased 1.9% during the same period, in line with the Fed’s unofficial longer-term objective of 2% for this inflation measure. As of June 2014, the national unemployment rate was 6.2%, down from the 7.3% reported in July 2013, but still higher than levels that would provide consistent support for optimal GDP growth. The 113,000 net new jobs added in May 2014 meant that the economy finally had regained all of the 8.7 million jobs lost during the recent recession. The housing market continued to post gains, as the average home price in the S&P/Case-Shiller Index of 20 major metropolitan areas rose 9.3% for the twelve months ended May 2014 (most recent data available at the time this report was prepared).
As this reporting period began, several events touched off increased volatility in the financial markets. First, in May 2013, then-Fed Chairman Ben Bernanke’s remarks about tapering the Fed’s asset purchase program triggered widespread uncertainty about the next step for the Fed’s quantitative easing program and its impact on the markets as well as the overall economy. This uncertainty was compounded by headline credit stories involving Detroit’s bankruptcy filing in July 2013, the largest municipal bankruptcy in history and the disappointing news that continued to come out of Puerto Rico, where a struggling economy and years of deficit spending and borrowing led to multiple downgrades on the commonwealth’s bonds. Meanwhile, political debate over federal spending continued, as Congress failed to reach an agreement on the federal budget for Fiscal 2014. On October 1, 2013, the start date for Fiscal 2014, the federal government shut down for 16 days until an interim appropriations bill was signed into law. (Consensus on a $1.1 trillion federal spending bill was ultimately reached in January 2014, and in February 2014, members of Congress agreed to suspend the $16.7 trillion debt ceiling until March 2015).
The U.S. equity markets reached new highs as investors rewarded decent corporate earnings against moderate economic growth, geopolitical concerns, including Russia’s recent annexation of Crimea and continued unrest in the Middle East. The prospect of acquisitions by companies holding a record amount of cash as well as private equity firms also supported stock prices. Part of this activity is being driven by the desire of U.S. companies to reincorporate overseas for tax reasons (corporate inversion) in order to avoid double taxation when repatriating foreign earnings. All sectors of the Russell 1000® Value Index posted double digit gains, led by technology, materials & processing, and producer durables. Emerging markets (EM) were also pressured by concerns of slower growth and capital flight brought on by the prospect for higher long term U.S. interest rates as the Federal Reserve reduces its asset purchases. The Fed ended its tapering speculation in January when it began reducing its pace of monthly purchases of Treasury and mortgage-backed securities (MBS) securities. From an investment standpoint, we continue to be encouraged by the increase in activism and return of capital that is helping to drive returns and create value.
How did the Funds perform during the twelve-month reporting period ended June 30, 2014?
The tables in the Fund Performance and Expense Ratios section of this report provide Class A Share total returns for the Funds for the one-year, five-year, ten-year and/or since inception periods ended June 30, 2014. Each Funds’ Class A Share total returns at net asset value (NAV) are compared with the performance of their corresponding market index and Lipper classification average. A more detailed account of each Fund’s performance is provided later in this report.
What strategies were used to manage the Funds during the twelve-month reporting period ended June 30, 2014 and how did these strategies influence performance?
Nuveen NWQ Global Equity Fund
The Nuveen Global Equity Fund’s Class A Shares at NAV underperformed the MSCI World Index and the comparative Lipper classification during the abbreviated reporting period since its inception on April 1, 2014 through June 30, 2014.
The second quarter 2014 was particularly trying, but not as a result of any one particular stock, rather, a more general malaise in our European holdings detracted from performance. As bottom-up investors, we do not view the world in terms of overweights and underweights, but it is nevertheless mathematically factual that we are overweight continental Europe. The European Central Bank
cut rates to try to stave off deflation, we saw general sluggishness in many of our European holdings. The conflict in the Ukraine also served as a headwind for some of our German companies, particularly those that had exposure in the area.
Several positions contributed to our positive absolute return during the abbreviated reporting period. Dublin-based Jazz Pharmaceuticals, Inc. was a new position in the quarter which we purchased after a rare earnings miss caused the stock to fall 30% below its first quarter 2014 highs. The company has a significant degree of pricing power with its leading product Xyrem (a drug for narcolepsy), sufficient patent protection to keep generics at bay and balance sheet flexibility to bring other drugs in house to further extend its pipeline. In addition to a top flight management team, given its tax-advantaged structure, Jazz has also become an enticing target for a larger U.S. drug company looking for an inversion opportunity.
Japan Tobacco Inc. (JT) appreciated given solid fundamentals, an attractive valuation and the potential for higher capital return to shareholders. Fundamentally, the company is benefiting from higher prices in Russia as that market shifts from low priced products to medium and premium priced brands, areas in which JT is well positioned. There is also the potential for more aggressive price hikes in Japan, as cigarette prices are low relative to other developed countries. More recently, the company acquired British e-cigarette maker, Zandera Ltd. This has lessened concerns of a future decline in JT’s growth given expansion of the electronic cigarette market.
Lastly, Canadian Natural Resources Limited, a name that has remained inexpensive for a number of years, finally showed some signs of closing the gap with our fair value estimate for the company. While the company has invested significant capital over the past few years to ramp up its Horizon oil sands project, we are finally seeing free cash flow projections rising and the company is enjoying a re-rating by the market as we get closer to the immense wave of free cash flow expected in the latter half of the decade as the Horizon expansion phase is completed. Further patience will be required, but trends are finally going in our favor.
Several holdings contributed to the Fund’s underperformance. Management software provider, CA Technologies, Inc., underperformed given concerns of a potential pause in the company’s earnings growth. Fiscal 2015 represents a transition year for the company and management is forecasting a slight decrease in revenues and flat operating margins.
Ericsson, a Swedish multi-national provider of communication technology, declined after the company reported mixed first quarter results that showed sales and earnings below consensus, but better margins as management begins to focus on improving profitability. The company shed 3,000 employees during the reporting period. We believe that 2014 will be a transition year as U.S. projects roll off and capex/infrastructure spending by the telecom companies in China and Europe begins to ramp up. We remain quite enthused, however, as a more stable pricing environment should help margins, while further growth in Europe and Asia will surely keep Ericsson’s top line growing.
Lastly, Swiss bank UBS AG weakened after the company reported weak operating trends relative to peers, and concerns regarding the potential cost of regulatory litigation (dark pools, Libor manipulation). We continue to favor UBS as the company offers leverage to potentially stronger markets through faster deleveraging, improved capital markets revenues, and higher private banking activity. We believe the company’s stronger capital leaves it with a sufficient buffer to meet stricter regulation and litigation constraints, and there is a potential for a greater capital return.
During this invest up period, Bio-Rad Laboratories, Inc., a leading producer of specialty chemicals and instruments for the life science research and clinical diagnostic markets, was added to the Fund. Several developments have caused the company’s profitability to contract meaningfully. We believe the company is working to address its margins with new products, acquired technology, and investments in ERP software. As the company improves its execution, we believe there is the potential for earnings power to exist over the next several quarters. Additionally, increases in academic/government spending should provide a tailwind for revenue growth in the second half of 2014 and into 2015.
INPEX Corporation is Japan’s largest oil and gas exploration & production company with midlevel global production and reserves. Most of the company’s current profits come from the Mahakam block in Indonesia, but the company is also developing a project in Australia called Ichthys for supply to Japan. Steady progress towards the completion of Ichthys should be a catalyst for an upward revaluation for the shares. Demand for liquid natural gas has increased in Japan following the Great Eastern Japan Earthquake in 2011 given the decrease in nuclear power generation. Our analysis suggests that Inpex’s reserves are very inexpensive both on an absolute basis, as well as compared to its peers.
Portfolio Managers’ Comments (continued)
Orkla ASA is a Norwegian consumer and industrial conglomerate that is divesting its non-core assets to focus on its branded packaged foods business. Post transformation, we believe that the remaining brand business could become an attractive takeover target. The company has been marred by setbacks with a key divestiture, difficulties closing a sizable merger with a competing Norwegian foods company, and soft performance across its core food portfolio. We believe these issues are transitory and that the stock represents a particularly compelling risk/reward at current levels.
We also sold several positions including Applied Materials, Inc., which was sold as the stock had rebounded up to our target valuation, and we feared results could be vulnerable to disappointing semiconductor capital equipment orders. Additionally, we sold out of Vodafone Group PLC as the last of our catalysts had played out.
Nuveen NWQ Global Equity Income Fund (formerly Nuveen NWQ Equity Income Fund)
The Nuveen Global Equity Income Fund’s Class A Shares at NAV outperformed its comparative Lipper Category but underperformed the MSCI World Index during the twelve-month ending June 30, 2014.
The Fund is designed to provide high current income and long-term capital appreciation. Under normal market conditions, the Fund invests at least 80% of the sum of its net assets and the amount of any borrowings for investment purposes in equity securities. The Fund may invest in securities of issuers located anywhere in the world. Under normal market conditions, the Fund invests at least 40% of its net assets in non-U.S. securities and invests in securities of companies representing at least three different countries (one of which may be the United States). The Fund may invest up to 20% of its net assets in securities of companies located in emerging markets. The Fund may invest in equity securities issued by companies of any market capitalization, including small- and mid-capitalization companies. The Fund may utilize derivatives, including currency options, currency futures and options on such futures, and currency forwards. The Fund may use these derivatives to manage market or business risk, enhance the Fund’s return, or hedge against adverse movements in currency exchange rates.
Our goals are to provide a high total return to our investors with a lower amount of risk. Managing an equity income based strategy can accomplish this through both capital appreciation and a higher than average proportion of return through dividends. Often these types of stocks have carried less risk, although history is fraught with episodes where this was not the case. That is why we feel it is more important than ever to approach this strategy as a value investor, which has been the core of NWQ’s philosophy since 1982.
With interest rates at low levels, investors continued to look towards many traditional and non-traditional means to achieve yield. Valuations in many industries traditionally favored by equity income investors, such as utilities, real estate investment trusts (REITs) and telecom services are at or near historic highs. We found better valuations globally in other industries such as financials, media, technology and automotive that have the capacity for increasing capital return to shareholders. This may not only lead to increasing returns in the form of dividends, but can also lead to a meaningful re-valuation of the company as investors gain confidence in their ability to allocate capital properly.
We found Europe to be an attractive market both in terms of yield and valuations. Europe and the U.K. have a broad set of industries where the companies exhibit an attractive dividend yield. The broader markets yield over 3% and exhibit high yields across many sectors. This contrasts to the U.S. and Japan where market yields are closer to 2% and the opportunity set for higher yielding companies is much narrower. Valuations and margins in Europe are also well below prior pre-crisis level as the recovery in Europe is behind other parts of the globe such as the U.S. This offers an additional opportunity to participate in a recovery that is still emerging and not priced into the market.
During the reporting period, we continued to find better values and more upside for capital return in the financial and technology spaces. Many financials’ balance sheets are over capitalized with room for share repurchases and dividend increases as the regulatory cloud surrounding them continues to lift. Technology companies with sub-optimal capital structures and too much cash will receive even more pressure over time to return that capital to shareholders. We think both sectors will increase their capital returns, which will in turn allow for a re-rating of the companies. This is where we saw the most opportunity during the reporting period.
Finally, we continued to employ a bottom up approach. We can find interesting names in a variety of industries. Rather than look for the highest dividend paying stocks, we look to invest in the best companies at an attractive valuation with a good risk/reward profile
and catalysts that can change the valuation of the company. Companies that are showing renewed capital discipline can often demonstrate this through a return of capital. Increased dividend payments, as well as share repurchases, become the catalyst for re-rating when it comes from companies that previously were misallocating capital. Often this comes from a management change, for example when the CFO becomes the CEO or perhaps when an outside force such as an activist investor applies the pressure needed to affect change. We are seeing an increasing amount of these types of opportunities across multiple industries.
The Fund’s performance reflects strong gains in several holdings for the year, although returns did underperform the MSCI World Index for the reporting period. The consumer discretionary, energy and utility sectors had the largest positive contribution on absolute and relative performance versus the benchmark as the catalyst for a number of our positions became more apparent. These gains were partially offset by relative underperformance in the financial, health care and technology sectors. Interpublic Group of Companies, Inc. and Vodafone Group PLC were among two of our top investments, while we experienced the largest losses in METRO AG and Royal Philips NV. Geographically, our top performing countries were Japan and Canada, while investments in the U.S., Netherlands and Germany lagged.
Several individual positions contributed positively to performance. AstraZeneca PLC appreciated as the company received a takeout offer from Pfizer, which was rejected based on valuation. Under U.K. takeover laws, Pfizer can submit another bid after six months. In addition to the financial engineering benefits (corporate tax rate inversion), AstraZeneca has a broad drug pipeline and several long term opportunities that Pfizer wants. Astra’s rejection appears to reflect management’s confidence in its own framework for growth for the company.
Daimler AG benefited from improving operational performance and a cycle recovery in many of its key end markets. The company is well positioned to benefit from a recovery in the global truck cycle, particularly in Europe and North America. The company maintains a consistent dividend policy, aiming to pay out on average 40% of its underlying earnings annually to shareholders.
Teva Pharmaceutical Industries has embarked on an aggressive $2 billion cost cutting plan that should help maintain strong profitability in the face of the upcoming patent expiration of its multiple sclerosis drug, Copaxone. Teva received FDA approval in late January for a 3 day/week dosing for Copaxone, and is actively working to shift its patients to the new formulation. We increased our position prior to the stock’s explosive rally, making it one of the larger investments in the Fund. We did modestly trim the position after its substantial gain.
Several positions detracted from performance. We purchased CenturyLink Inc. in August 2013 following a decline in the shares after the company lowered its earnings guidance. The shares declined further in January when management preemptively reduced its dividend to maintain financial flexibility when it becomes a full cash tax payer in 2015. CenturyLink’s business is steadily improving as the company slowly changes its business mix and proceeds with a substantial cost cutting program. We eliminated the position after the stock had rebounded from its lows for more compelling investment opportunities.
Copa Holdings, S.A. is a leading Latin American airline with a strong balance sheet and one of the most modern fleets in the industry. The company’s primary hub in Panama is ideally positioned between North and South America. The shares sold off on concerns that Venezuela, a strategically important market for Copa, would devalue its currency and place restrictions on the repatriation of cash out of the country. The company has $300 million in cash trapped on its balance sheet. Furthermore, Copa had to reduce service in the country and has placed limits on bolivar-denominated ticket sales. Although we believe that Copa’s robust growth and high profitability remain intact despite these headwinds, we eliminated the position due to risk/reward concerns.
Mosaic Company declined sharply last July on news that low cost producer, Uralkali, had splintered the Eastern European potash cartel, bringing instability to the potash market and uncertainty on where prices would ultimately bottom. Mosaic’s stock was able to work its way higher from its lows on anticipation that the Russians & Belarusians would be able to put the cartel back together. However, we felt that with capacity still coming on and little evidence of an increase in demand, higher potash prices would be tough to come by. Therefore, we used a brief rally in the stock that was driven by anticipation of a Chinese import contract being resolved to exit our position.
Portfolio Managers’ Comments (continued)
We added several new positions to the Fund during the reporting period. Agrium Inc. is a low cost producer that generates strong earnings even when nitrogen markets trade down to the low point on the cost curve. At the time of purchase, the company’s valuation reflected near term issues that we believed would be solved this year, providing limited downside on the stock price. Deutsche Borse Group is engaged in the operation of the German stock exchange. We purchased the stock as we believe there are opportunities to bring off-market derivative trading activity on to the exchanges, which could be a growth driver for the company. Deutsche Borse is also poised to benefit from a consolidation of global exchanges, as well as the potential European economic recovery. ProSiebenSat1 Media is a German TV broadcaster with one of the best strategies for structural growth in European media. The company is also poised to benefit from a recovery in the German economy, which would directly feed through to higher advertising rates. ProSieben’s revenue growth is being driven by higher distribution (carriage) fees as the penetration of high definition channels increases. Expansion of the video on demand (VOD) market where the company owns key properties such as Maxdome and myvideo.de is also a positive. ProSieben’s dividend yield is among the highest in the media sector, and the company could re-lever its balance sheet to return capital to shareholders.
Several holdings were eliminated or trimmed during the reporting period based on valuation, deteriorating fundamentals or to raise cash as we rotated into new investment opportunities. Applied Materials, Inc. was sold as the shares approached our target price following strong performance. We also feared the stock could be vulnerable to disappointing semiconductor capital equipment orders in the near term. We moved the proceeds into other semiconductor names including Analog Devices and Microchip Technology. Barrick Gold Corporation was sold on reports that management was in discussions for a merger with Newmont Mining. We viewed this action as contrary to the company’s strategy of shrinking to become more focused and profitable. Metro AG was eliminated due to our concerns surrounding the possible negative effects of the ongoing Ukraine unrest on the firm’s earnings, profitability and restructuring capability.
We also wrote covered call options on individual stocks, while investing in those same stocks, to enhance returns while foregoing some upside potential. This activity made a small positive contribution to the performance during the period.
Nuveen NWQ Multi-Cap Value Fund
Class A Shares at NAV for the Nuveen NWQ Multi-Cap Value Fund underperformed the Russell 3000® Value Index and its Lipper classification average for the twelve-month reporting period ended June 30, 2014.
The Fund seeks long-term capital appreciation by investing in equity securities of companies with large, medium and small market capitalizations that are selected on an opportunistic basis. Generally, the Fund’s manager looks for undervalued companies where catalysts exist that may help unlock value or improve profitability. Such catalysts can be new management, improving fundamentals, renewed management focus, industry consolidation or company restructuring.
The Fund generated a strong gain during the reporting period, although behind the Russell 3000® Value Index. The Fund’s performance reflects gains across several holdings and sectors with the consumer discretionary, staples and utility sectors outperforming. Investments in the energy, health care, materials and technology sectors also generated gains, although lagged the benchmark.
Several positions contributed to performance. Canadian Natural Resources Limited appreciated given lower heavy oil differentials, the company’s accretive purchase of Canadian assets from Encana and the continued expansion of alternatives to transport crude from Canada. We trimmed our position in Canadian Natural in favor of adding to Occidental Petroleum Corporation were we believe the catalysts for value creation/recognition are more timely.
Shares of Harman International Industries significantly outperformed as the company has benefited from accelerating revenue growth and margin expansion in its infotainment business. The company’s new products offer better operating margins than prior generations because they are built on common platforms. The infotainment industry continues to benefit as car companies replace AM/FM/CD players with center-screen consoles, an area in which Harman is well positioned. We recently eliminated the position following a substantial increase in the share price.
Also positively contributing was LSI Corporation. The company received a takeover offer from Avago Technologies for $11.15 per share, which sent the shares meaningfully higher. We purchased the stock as we believed the company was poised to generate sig-
nificant growth from its flash memory products as its third generation flash processor was set to launch and expected to outperform competitor offerings.
Lastly, VeriFone Holdings, Inc. rose sharply as investors recognized new management’s efforts to improve execution of the company’s point of sale terminal business. False concern that VeriFone might have some responsibility in the Target Corporation security breach last December provided us an opportunity to increase our position in the stock. VeriFone’s services business is also growing rapidly, which currently represents roughly 40% of revenues and we believe could expand to 50% in the next few years.
Several positions detracted from performance. Avon Products, Inc. declined as the company’s turnaround is taking longer, costing more and facing far stronger headwinds than originally anticipated. The number of representatives that Avon has selling its product continues to fall and Eastern Europe has proven to be a much tougher challenge than we had envisioned, primarily due to a significant slowdown in Russia. On the positive side, the company appears to have finally settled with the SEC and Justice Department regarding its Foreign Corrupt Practices Act violations, while Brazil continues to show positive momentum. Avon signed a distribution deal in Brazil with cosmetics maker, Coty, Inc. The company has a great deal of heavy lifting yet to go, but we firmly believe the Avon brand continues to have a great deal of value.
Cisco Systems, Inc. declined on concerns that the company is facing several headwinds, including price-based competition from Huawei Technologies Co. Ltd. and Hewlett-Packard Company, technology-based competition from smaller point product vendors and ongoing weakness in the emerging markets. We eliminated the position in October in favor of increasing our position in Oracle Corporation, which we expect to benefit from an expanded and focused sales force, the launch of a new database offering, and growth in its engineered systems products.
In January, we initiated a new position in Express, Inc. following a sharp sell-off in the stock price after the company missed earnings expectations and lowered its earnings outlook. The shares continued to weaken after our purchase given a very difficult environment for apparel retailers. Fundamentals continue to look challenging in the near term, but management is taking efforts to improve profitability by restructuring its store base. Recently, Sycamore Partners, a private equity firm run by the former chairman of Express, disclosed that it had acquired a 9.9% stake and had an interest in acquiring the rest of the company.
Several new positions were added to the Fund during the reporting period. Among them was Impax Laboratories, a drug company that has not participated in the current bull market for pharmaceutical stocks because the company’s primary manufacturing facility has been under a FDA Warning Letter since 2011. This has kept Impax from capitalizing on numerous ‘first to file’ generic drug opportunities. The company also has a branded pipeline drug for Parkinson’s disease that cannot be approved and launched until its clears up its manufacturing problems. A new CEO has recently been appointed and we think it is reasonable to believe that the manufacturing issues are nearing an end. Impax boasts over $6 in cash per share on its balance sheet (more than 25% of its market capitalization); therefore M&A (and perhaps even a tax inversion) could be part of its plan. We anticipate the stock to respond positively once the company is able to capitalize on launching new products.
We also purchased International Game Technology (IGT) in early June 2014 on the belief that management was exploring strategic alternatives, including a possible sale of the company. The risk reward for owning the shares was very compelling, in our view. Shortly thereafter in mid-July (subsequent to the close of this reporting period), GTECH S.p.A., an Italian gaming equipment manufacturer, announced that an agreement had been reached to acquire IGT for $18.25 per share in cash and stock. Even without the merger, we felt that the downside in the shares was limited given the company’s dominant position in the gaming equipment sector as well as regional gaming trends that appear to be bottoming. While IGT has been losing market share in its gaming operations over the last two years, its strong free cash flow generation and the increasing value of DoubleDown Casino (its social gaming segment) would allow it to weather the tougher industry conditions and return capital to shareholders.
We also added Key Energy Services Inc., which provides onshore energy production services. The shares have underperformed its North American peers due to a significant decline in business activity in Mexico ahead of energy policy reform that is currently underway in that country (which is expected to improve foreign participation). A self-reported Foreign Corrupt Practices Act
Portfolio Managers’ Comments (continued)
investigation is also being conducted in Mexico, which has also been a headwind. While we believed these issues are transitory, the stock price seems to imply that they will persist indefinitely. Going forward, we expect Key Energy’s business will improve as it increases its North American activity, getting closer to its fleet’s revenue and margin potential. Furthermore, we anticipate Mexico’s energy policy reform will result in a meaningful uplift for Key Energy beyond 2015.
We eliminated several positions during the reporting period, including PennyMac Financial Services Inc. (PFSI), which was eliminated from the Fund based on valuation. We used the proceeds to purchase PennyMac Mortgage Investment Trust (PMT) where we believe the risk/reward more favorable. PMT is a specialty finance company that invests primarily in residential mortgage loans and mortgage related assets. Tyson Foods, Inc. had also reached our estimate of fair value. We felt the company’s risk profile had increased given headwinds brought on by pricing pressure in its chicken, beef, and pork businesses. We sold Vodafone Group following gains on the announcement that Verizon would purchase Vodafone’s 45% stake in Verizon Wireless, and speculation that AT&T would purchase the company.
Nuveen NWQ Large-Cap Value Fund
The Fund’s Class A Shares at NAV underperformed both the Russell 1000® Value Index and the comparative Lipper classification average for the twelve-month reporting period ended June 30, 2014.
The Fund seeks long-term capital appreciation by investing in equity securities of companies with large market capitalizations that are selected on an opportunistic basis. Generally, the Fund’s manager looks for undervalued companies where catalysts exist that may help unlock value or improve profitability. Such catalysts can be new management, improving fundamentals, renewed management focus, industry consolidation or company restructuring.
The Fund generated a strong gain during the reporting period, although trailed the Russell 1000® Value Index. The Fund’s performance reflects gains across several holdings and sectors with the energy, consumer staples, finance, producer durables and utility sectors outperforming. Investments in the consumer discretionary, health care, materials and technology sectors also generated gains, although lagged the benchmark. Significant and unusual cash flow activity had a negative impact on performance as the Fund, at times, held higher levels of cash than normal.
Those holdings that contributed positively to the Fund’s performance include the insurance broker, Aon PLC, appreciated given strong results, efficiencies from its relocation to the United Kingdom, and excitement over the potential for its private healthcare exchange investments to drive profitability and growth.
Baker Hughes, the oilfield service provider, also positively contributed to performance, which benefited from favorable end market trends in the North American pressure pumping market and improved operational efficiency. For the last two years, the company’s North America margins had been negatively impacted by an oversupply of pressure pumping services and execution missteps. The stock outperformed as these margins appeared to have hit an inflection point due to new technology, better utilization and recent restructuring efforts.
Lastly, Teva Pharmaceutical Industries has embarked on an aggressive $2 billion cost cutting plan that should help maintain strong profitability in the face of the upcoming patent expiration of its multiple sclerosis drug, Copaxone. Teva received FDA approval in late January for a 3 day/week dosing for Copaxone, and is actively working to shift its patients to the new formulation. We increased our position prior to the stock’s explosive rally, making it one of the larger investments in the Fund. We did modestly trim the position after its substantial gain.
Several positions detracted from performance. Avon Products, Inc. declined as the company’s turnaround is taking longer, costing more, and facing far stronger headwinds than originally anticipated. The number of representatives that Avon has selling its product continues to fall, and Eastern Europe has proven to be a much tougher challenge than we had previously envisioned, primarily due to a significant slowdown in Russia. On the positive side, the company appears to have finally settled with the SEC and Justice Department regarding its Foreign Corrupt Practices Act violations, while Brazil continues to show positive momentum. Avon signed a
distribution deal in Brazil with cosmetics maker, Coty, Inc. The company has a great deal of heavy lifting yet to go, but we firmly believe the Avon brand continues to have a great deal of value.
Norwegian Cruise Line declined as additional capacity has entered the Caribbean cruise market, and the company issued conservative guidance. The Getaway, Norwegian’s new ship in that market, is generating double digit premiums. The overhang of an upcoming stock issuance from major holders continues to be a modest headwind, although we believe this will provide an opportunity for better liquidity and investment in an excellent operator with a compelling valuation and earnings ramp. We increased our position on Norwegian Cruise Lines in December in conjunction with a secondary public offering of the shares.
Lastly, Talisman Energy declined notwithstanding the sale of $2+ billion of assets and numerous additional catalysts that should unfold this year. Activist investor Carl Icahn holds 7% of the stock and has two representatives on the board of directors. We believe the continued cash flow burn and misperception over potential abandonment liabilities of the company’s North Sea assets have created an investor overhang on the stock. However, we believe Talisman will be able to successfully divest these assets, among other assets, in order to conserve cash flow and remove the negative sentiment towards the company. The board of directors appears to be aligned with value creation and doing all that is necessary to get the job done.
Several new positions were added to the Fund during the reporting period. Among them was Agrium Inc., a supplier of agricultural products generated strong earnings even when nitrogen markets trade down to the low point on the cost curve. At the time of purchase, the company’s valuation reflected near term issues that we believed would be solved this year, providing limited downside on the stock price.
Shares of Ford Motor Company were purchased after the company announced that it would have a down year in 2014 given a significant amount of investment spending. The company plans to launch twenty-three new products that we believe will drive an earnings recovery in 2015. Ford is also well positioned to benefit from a European economic recovery. The company has a strong balance sheet, generates solid cash flow, and recently increased its dividend by 25%.
Target Corporation was purchased after the stock had declined following a difficult holiday shopping season for retailers as a whole, the company’s disclosure that its internal payment system had been breached, and concerns regarding ongoing losses at the company’s Canadian operations. While the market’s negative sentiment reflected Target’s issues, we felt the stock price was overly discounted. We believe the company is positioned for earnings growth given the improving strength of its core customer and ultimately stabilization in store traffic.
We sold several positions during the reporting period. We exited Applied Materials, Inc. based on our concern that expectations for the company’s capital spending outlook had become too aggressive, as well as issues surrounding its pending acquisition of Tokyo Electron. While Applied Materials’ stock price had recently declined 9% from its high due to industry and company concerns, the stock had appreciated significantly from our original investment initiated in December 2012. Instead we favored a slightly larger position in Teradyne Inc. were we felt the outlook was better and the valuation more attractive. Teradyne is well-positioned to benefit from significant growth in its wireless and cellular testing business.
We also eliminated oil refiner Valero Energy Partners LP in favor of establishing a larger position in Tesoro Corporation, the parent company. Shares of Valero had risen sharply since our purchase and had become a higher expectation stock given the market’s view that the company was the absolute winner as increased crude oil production in the U.S. would create an oversupplied environment that would significantly widen refining margins, particularly in the Gulf Coast. We found it difficult to argue that we had a competitive advantage in our analysis of the company. We believed Tesoro, on the other hand, was extremely undervalued and loaded with catalysts over the coming year, not just in the near term.
We eliminated our position in pharmaceutical company AbbVie Company shortly after our purchase as the company changed course and unexpectedly announced a high premium, high multiple bid to acquire Shire PLC. While the Shire transaction would enable a corporate inversion thereby reducing taxes and avoiding cash repatriation penalties, we were concerned about the price of the acquisition and the potential risk related to AbbVie’s confidence in its promising Hepatitis C drug currently undergoing trials, as well as greater risk to its Humira (anti-inflammatory) franchise once its patent protection expires.
Portfolio Managers’ Comments (continued)
Lastly, Mosaic Company was sold after the stock had moved higher on anticipation that the Russians & Belarusians would put their potash cartel back together. We felt that with capacity still coming on and little evidence of increased demand, higher potash prices would be tough to come by. Shares of Mosaic had rallied prior to our sale on anticipation of a Chinese import contract being resolved. With the stock having reached our estimate of fair value, we no longer felt the risk/reward for continuing to hold the stock was as attractive
Nuveen NWQ Small/Mid-Cap Value Fund
The Fund’s Class A Shares at NAV underperformed both the Russell 2500® Value Index and the comparative Lipper classification average for the twelve-month reporting period ended June 30, 2014.
The Fund continued to follow its disciplined investment approach, which seeks long-term capital appreciation by investing in equity securities of companies with small- to mid-market capitalizations selected using an analyst-driven, value oriented process. The portfolio manager looks for undervalued companies where catalysts exist to unlock value or improve profitability. Such catalysts can be new management, improving fundamentals, renewed management focus, industry consolidation or company restructuring.
For the twelve-month reporting period, strong stock selection in the energy, health care and technology sectors contributed to the Fund’s positive returns. An underweight allocation in the financial services sector and poor stock selection in the consumer discretionary sector detracted from the Fund’s relative performance. In the broader market, value stocks performed better than growth stocks across all capitalizations.
Harman International Industries was a leading contributor to performance during the reporting period as the company’s shares nearly doubled. Harman continues to demonstrate solid operating performance in all its divisions with particular strength in Infotainment, where the company has seen increased adoption of its offerings among consumers and original equipment manufacturers (OEMs). While we modestly trimmed our position on the strength in the shares, our outlook for the company remains favorable.
Carrizo Oil & Gas, Inc. was also a significant contributor to the Fund’s performance as the company’s shares rose significantly. Energy stocks performed well as oil prices climbed as global growth improved and geopolitical risks grew. Carrizo continues to aggressively increase oil production and has made significant strides in reducing debt levels through the sale of non-core assets. We continue to find the shares attractive given the company’s proven ability to generate liquidity as it aggressively increases liquids/oil production
The Fund also benefited from increased mergers and acquisition activity during the reporting period as portfolio holdings Schawk, Inc. and LSI Logic Corporation were acquired by larger competitors. In the case of LSI, the stock price rose significantly after the company announced that it had agreed to be acquired by Avago Technologies for $11.15 per share. The deal represented a 39% premium to LSI’s closing price on the day prior to the announcement. The position was eliminated with the shares trading near the offer price.
Those holdings that detracted from the Fund’s performance include Elizabeth Arden Inc. Shares of the company declined in a volatile second quarter that saw its shares trade substantially higher amid takeover speculation only to close the reporting period lower after LG Household & Health confirmed it was not interested in acquiring the company. Disappointing fiscal third quarter results, released during LG’s evaluation period, did little to bolster Elizabeth Arden’s appeal as a takeover target. While we trimmed our position near the highs for the reporting period, we are nonetheless disappointed by the turn in the events. We believe the stock is near a bottom and are confident that recently announced restructuring and cost savings program can restore the company to profitability. While improvement may take time, we believe sales in the mass channel will recover and that a repositioned Elizabeth Arden fragrance and skincare line will drive performance over the long term. We believe the risk/reward is quite attractive at current levels.
Louisiana-Pacific Corporation also detracted from performance. The company is engaged in the manufacturing of engineered wood building materials, including Oriented Strand Board (OSB), structural framing products and exterior siding for use in residential, industrial and light commercial construction. Shares fell as earnings have missed expectations and have remained weak following the termination of the company’s agreement to acquire Ainsworth Lumber Co. Ltd. in May due to anti-trust hurdles. Despite the recent
results, we believe the company is well-positioned to benefit from multi-year growth in new home construction. We also believe that most of the recent shortfall was the result of cold weather rather than weakening end-demand for the company’s products. We believe this weakness is temporary and expect volumes and pricing to rebound as the weather improves and distributors and retailers rebuild inventories. Lastly, industrial engineering and manufacturer TriMas Corporation declined during the reporting period. We eliminated our positions as acquisition related costs continue to depress margins and earnings growth.
Nuveen NWQ Small-Cap Value Fund
The Fund’s Class A Shares at NAV outperformed the Russell 2000® Value Index and its Lipper classification average for the twelve-month reporting period ended June 30, 2014.
During the reporting period, the Fund continued to follow its disciplined investment approach. The Fund seeks long-term capital appreciation by investing in equity securities of companies with small market capitalizations selected using an analyst-driven, value oriented process. NWQ seeks to provide superior risk-adjusted returns through an analyst-driven, value-oriented process. The Fund’s manager looks for undervalued companies where catalysts exist to unlock value or improve profitability. Such catalysts can be new management, improving fundamentals, renewed management focus, industry consolidation or company restructuring.
For the twelve-month reporting period, positive stock selection in the technology and producer durables was offset by weakness in the financial services and stock selection in consumer discretionary sectors. In the broader market, value stocks performed better than growth stocks across all capitalizations.
Harman International Industries was a leading contributor to performance as the company’s shares nearly doubled over the previous twelve months. Harman continues to demonstrate solid operating performance in all its divisions with particular strength in Infotainment, where the company has seen increased adoption of its offerings among consumers and original equipment manufacturers. While we modestly trimmed our position on the strength in the shares, our outlook for the company remains favorable.
Carrizo Oil & Gas, Inc. was also a significant contributor to the Fund’s performance as the company’s shares rose significantly during the reporting period. Energy stocks performed well as oil prices climbed as global growth improved and geopolitical risks grew. Carrizo continues to aggressively increase oil production and has made significant strides in reducing debt levels through the sale of non-core assets. We continue to find the shares attractive given the company’s proven ability to generate liquidity as it aggressively increases liquids/oil production.
The Fund also benefited from increased mergers and acquisition activity during the reporting period as portfolio holdings Measurement Specialties, TMS International, and Maidenform Brands were all acquired by larger competitors. Also during the reporting period, portfolio holding Orbital Science Corporation announced that it would merge with the aerospace and defense segment of Alliant Techsystems (ATK). We trimmed our position on strength in the shares following the announcement. The transaction is not expected to close until the end of 2014 as the sporting segment of ATK must first be spun-off into a separate entity. While we believe the combined company will benefit from increased scale and significant cost synergies, it is unlikely these synergies will be realized until late 2015.
Those holdings that detracted from the Fund’s performance include Elizabeth Arden Inc. Shares of the company declined in a volatile second quarter that saw its shares trade substantially higher amid takeover speculation only to close lower after LG Household & Health confirmed it was not interested in acquiring the company. Disappointing fiscal third quarter results, released during LG’s evaluation period, did little to bolster Elizabeth Arden’s appeal as a takeover target. We believe the stock is near a bottom and are confident that recently announced restructuring and cost savings program can restore the company to profitability. While improvement may take time, we believe sales in the mass channel will recover and that a repositioned Elizabeth Arden fragrance and skincare line will drive performance over the long term. We believe the risk/reward is quite attractive at current levels.
Shares of Homestreet, Inc. also declined on concerns that rising interest rates would impact loan growth for the company as refinancing activity decreased. While we acknowledge origination volumes may slow, in our view, any declines are already fully discounted in
Portfolio Managers’ Comments (continued)
the company’s share price. Additionally, the company’s operations are highly scalable and we believe operating expenses could be reduced accordingly should a slower mortgage market take hold. While we continue to find the shares attractive, we did trim our position during the reporting period.
Last, industrial engineering and manufacturer TriMas Corporation declined during the reporting period. We eliminated our positions as acquisition related costs continue to depress margins and earnings growth.
Nuveen Tradewinds Value Opportunities Fund
The Fund’s Class A Shares at NAV underperformed the Russell 3000® Value Index and outperformed the Lipper classification average for the twelve-month reporting period ended June 30, 2014.
The Fund seeks long-term capital appreciation by investing in equity securities of companies with varying market capitalizations selected using an eclectic, value-oriented process. Our team assesses each company held in the Fund individually to determine its future prospects and intrinsic value. Attractive valuation is our number one criterion and is a prerequisite for investing in any company. Some other criteria that we look for are sustainable business models, meaningful barriers to entry, and the ability to meet basic needs.
The Fund’s information technology sector was both the largest absolute and relative contributor to results, while the telecommunication services sector was the only negative performing sector of the portfolio and the largest detractor of relative results.
After trading mostly flat for the first half of the reporting period and despite a period of stock price pressure, information technology product distributor and services provider Ingram Micro Inc. resumed its strong stock price growth over latter part of the reporting period. Having modestly missed analyst expectations for the first quarter of 2014, the company has beaten revenue and earnings expectations on improving demand, and we believe management continues to effectively unlock efficiencies and better diversify the business.
Global pharmaceutical firm Merck & Co. Inc. gained during the reporting period partly on plans to sell or spin-off non-pharmaceutical divisions, possibly including the Coppertone and Dr. Scholl’s businesses. Investors appear to appreciate the company’s increased focus on profitable products with healthy growth prospects, which may assist in improving the company’s revenues.
Global advertising holding company The Interpublic Group of Companies Inc. was another contributor to portfolio performance. The company announced well-received results during the latter part of the reporting period. The results also showed operating and interest expenses declining meaningfully. Interpublic’s management has indicated that 2014 organic growth and operating margin targets will be met or exceeded.
Latin America focused telecom company, NII Holdings Inc., which was eliminated from the Fund during the reporting period and was the Fund’s largest individual detractor, enduring a number of challenges. The transition of the company from a 2G to a 3G network operator has proven more difficult than many investors expected. This has caused subscriber losses and profits to come in more negatively than previously forecasted by the company, thus feeding into already extremely pessimistic market sentiment. NII’s management hoped for a turnaround in the near future, with the company having achieved a better competitive position than it has had for years, in our view.
Added to the Fund during the reporting period, French oil/gas supplies firm Vallourec SA was also a detractor from portfolio performance. We believe recently lowered earnings guidance from the company was received poorly by investors. In our view, the factors driving the lowered guidance, namely reductions in planned orders by large Vallourec customers, are onetime issues. We continue to believe the company is well positioned to benefit from long term industry trends.
Canadian oil and gas company Talisman Energy Inc. reported financial results during the reporting period that came in at or below expectations. Overall earnings were impacted by notable one-time impairment charges. With the company focusing on a strategic realigning of its operations, including the potential sale of substantial non-strategic assets, we maintain confidence that Talisman has substantial upside at current prices.
Risk
Considerations
Risk Considerations
Nuveen NWQ Global Equity Fund
Mutual fund investing involves risk; principal loss is possible. There is no guarantee the Fund’s investment objectives will be achieved. Prices of equity securities may decline significantly over short or extended periods of time. Investments in smaller companies are subject to greater volatility than those of larger companies. Non-U.S. investments involve risks such as currency fluctuation, political and economic instability, lack of liquidity and differing legal and accounting standards. These risks are magnified in emerging markets. These and other risk considerations, such as currency and value stock risks, are described in detail in the Fund’s prospectus.
Nuveen NWQ Global Equity Income Fund
Mutual fund investing involves risk; principal loss is possible. There is no guarantee the Fund’s investment objectives will be achieved. Prices of equity securities may decline significantly over short or extended periods of time. Non-U.S. investments involve risks such as currency fluctuation, political and economic instability, lack of liquidity and differing legal and accounting standards. These risks are magnified in emerging markets. These and other risk considerations, such as credit, derivatives, high yield securities, and interest rate risks, are described in detail in the Fund’s prospectus.
Nuveen NWQ Multi-Cap Value Fund
Mutual fund investing involves risk; principal loss is possible. There is no guarantee the Fund’s investment objectives will be achieved. Prices of equity securities may decline significantly over short or extended periods of time. Investments in smaller companies are subject to greater volatility than those of larger companies. Non-U.S. investments involve risks such as currency fluctuation, political and economic instability, lack of liquidity and differing legal and accounting standards. These risks are magnified in emerging markets. These and other risk considerations, such as currency and value stock risks, are described in detail in the Fund’s prospectus.
Nuveen NWQ Large-Cap Value Fund
Mutual fund investing involves risk; principal loss is possible. There is no guarantee the Fund’s investment objectives will be achieved. Prices of equity securities may decline significantly over short or extended periods of time. Non-U.S. investments involve risks such as currency fluctuation, political and economic instability, lack of liquidity and differing legal and accounting standards. These risks are magnified in emerging markets. These and other risk considerations, such as currency, large cap stock, and value stock risks, are described in detail in the Fund’s prospectus.
Nuveen NWQ Small/Mid-Cap Value Fund
Mutual fund investing involves risk; principal loss is possible. There is no guarantee the Fund’s investment objectives will be achieved. Prices of equity securities may decline significantly over short or extended periods of time. Investments in smaller companies are subject to greater volatility than those of larger companies. Non-U.S. investments involve risks such as currency fluctuation, political and economic instability, lack of liquidity and differing legal and accounting standards. These risks are magnified in emerging markets. These and other risk considerations, such as currency and value stock risks, are described in detail in the Fund’s prospectus.
Nuveen NWQ Small-Cap Value Fund
Mutual fund investing involves risk; principal loss is possible. There is no guarantee the Fund’s investment objectives will be achieved. Prices of equity securities may decline significantly over short or extended periods of time. Investments in smaller companies are subject to greater volatility than those of larger companies. Non-U.S. investments involve risks such as currency fluctuation,
Risk Considerations (continued)
political and economic instability, lack of liquidity and differing legal and accounting standards. These risks are magnified in emerging markets. These and other risk considerations, such as currency and value stock risks, are described in detail in the Fund’s prospectus.
Nuveen Tradewinds Value Opportunities Fund
Mutual fund investing involves risk; principal loss is possible. There is no guarantee the Fund’s investment objectives will be achieved. Prices of equity securities may decline significantly over short or extended periods of time. Investments in smaller companies are subject to greater volatility than those of larger companies. Non-U.S. investments involve risks such as currency fluctuation, political and economic instability, lack of liquidity and differing legal and accounting standards. These risks are magnified in emerging markets. These and other risk considerations, such as currency and value stock risks, are described in detail in the Fund’s prospectus.
Fund Performance
and Expense Ratios
The Fund Performance and Expense Ratios for each Fund are shown within this section of the report.
Returns quoted represent past performance, which is no guarantee of future results. Current performance may be higher or lower than the performance shown. Investment returns and principal value will fluctuate so that when shares are redeemed, they may be worth more or less than their original cost. Returns without sales charges would be lower if the sales charge were included. Returns do not reflect the deduction of taxes that a shareholder would pay on Fund distributions or the redemption of Fund shares.
Returns may reflect a contractual agreement between certain Funds and the investment adviser to waive certain fees and expenses; see Notes to Financial Statements, Note 7 — Management Fees and Other Transactions with Affiliates for more information. In addition, returns may reflect a voluntary expense limitation by the Funds’ investment adviser that may be modified or discontinued at any time without notice. For the most recent month-end performance visit www.nuveen.com or call (800) 257-8787.
Returns reflect differences in sales charges and expenses, which are primarily differences in distribution and service fees. Fund returns assume reinvestment of dividends and capital gains.
Comparative index and Lipper return information is provided for the Funds’ Class A Shares at net asset value (NAV) only.
The expense ratios shown reflect the Funds’ total operating expenses (before fee waivers and/or expense reimbursements, if any) as shown in the Funds’ most recent prospectus. The expense ratios include management fees and other fees and expenses.
Fund Performance and Expense Ratios (continued)
Nuveen NWQ Global Equity Fund
Refer to the first page of this Fund Performance and Expense Ratios section for further explanation of the information included within this section. Refer to the Glossary of Terms Used in this Report for definitions of terms used within this section.
Fund Performance
Total Returns as of June 30, 2014
| | |
| | | Cumulative |
| | | Since
Inception* |
Class A Shares at NAV | | 3.35% |
Class A Shares at maximum Offering Price | | (2.59)% |
MSCI World Index | | 4.24% |
Lipper Global Multi-Cap Value Funds Classification Average | | 3.78% |
| |
Class C Shares | | 3.15% |
Class I Shares | | 3.40% |
Indexes and Lipper averages are not available for direct investment.
Class A Shares have a maximum 5.75% sales charge (Offering Price). Class A Share purchases of $1 million or more are sold at net asset value without an up-front sales charge but may be subject to a contingent deferred sales charge (CDSC), also known as a back-end sales charge, if redeemed within twelve months of purchase. Class C Shares have a 1% CDSC for redemptions within less than twelve months, which is not reflected in the one-year total return. Class I Shares have no sales charge and may be purchased under limited circumstances or by specified classes of investors.
Expense Ratios as of Most Recent Prospectus
| | | | | | | | | | | | |
| | | Share Class | |
| | | Class A | | | Class C | | | Class I | |
Gross Expense Ratios | | | 1.43% | | | | 2.18% | | | | 1.18% | |
Net Expense Ratios | | | 1.25% | | | | 2.00% | | | | 1.00% | |
The Fund’s investment adviser has agreed to waive fees and/or reimburse expenses through October 31, 2016 so that total annual Fund operating expenses (excluding 12b-1 distribution and/or service fees, interest expenses, taxes, acquired fund fees and expenses, fees incurred in acquiring and disposing of portfolio securities and extraordinary expenses) do not exceed 1.00% of the average daily net assets of any class of Fund shares. The expense limitation may be terminated or modified prior to that date only with the approval of the Board of Trustees of the Fund.
| * | Since inception returns are from 4/01/14. |
Growth of an Assumed $10,000 Investment as of June 30, 2014 – Class A Shares

The graphs do not reflect the deduction of taxes that a shareholder may pay on Fund distributions or the redemption of Fund shares.
Fund Performance and Expense Ratios (continued)
Nuveen NWQ Global Equity Income Fund
Refer to the first page of this Fund Performance and Expense Ratios section for further explanation of the information included within this section. Refer to the Glossary of Terms Used in this Report for definitions of terms used within this section.
Fund Performance
Average Annual Total Returns as of June 30, 2014
| | | | | | | | |
| | | Average Annual | |
| | | 1-Year | | | Since
Inception* | |
Class A Shares at NAV | | | 22.28% | | | | 13.08% | |
Class A Shares at maximum Offering Price | | | 15.25% | | | | 11.69% | |
MSCI World Index | | | 24.05% | | | | 12.05% | |
Russell 1000® Value Index | | | 23.81% | | | | 16.03% | |
Lipper Global Equity Income Funds Classification Average | | | 21.08% | | | | 11.39% | |
| | |
Class C Shares | | | 21.36% | | | | 12.23% | |
Class R3 Shares** | | | 21.99% | | | | 12.80% | |
Class I Shares | | | 22.63% | | | | 13.36% | |
Indexes and Lipper averages are not available for direct investment.
Performance prior to December 13, 2013, reflects the Fund’s performance using investment strategies that differed significantly from those currently in place.
Class A Shares have a maximum 5.75% sales charge (Offering Price). Class A Share purchases of $1 million or more are sold at net asset value without an up-front sales charge but may be subject to a contingent deferred sales charge (CDSC), also known as a back-end sales charge, if redeemed within twelve months of purchase. Class C Shares have a 1% CDSC for redemptions within less than twelve months, which is not reflected in the one-year total return. Class R3 Shares have no sales charge will only be available for purchase by eligible retirement plans. Class I Shares have no sales charge and may be purchased under limited circumstances or by specified classes of investors.
Expense Ratios as of Most Recent Prospectus
| | | | | | | | | | | | | | | | |
| | | Share Class | |
| | | Class A | | | Class C | | | Class R3** | | | Class I | |
Gross Expense Ratios | | | 5.32% | | | | 6.07% | | | | 5.57% | | | | 5.07% | |
Net Expense Ratios | | | 1.22% | | | | 1.97% | | | | 1.47% | | | | 0.97% | |
The Fund’s investment adviser has agreed to waive fees and/or reimburse expenses through October 31, 2016 so that total annual Fund operating expenses (excluding 12b-1 distribution and/or service fees, interest expenses, taxes, acquired fund fees and expenses, fees incurred in acquiring and disposing of portfolio securities and extraordinary expenses) do not exceed 1.00% of the average daily net assets of any class of Fund shares. The expense limitation may be terminated or modified prior to that date only with the approval of the Board of Trustees of the Fund.
| * | Since inception returns are from 9/15/09. |
| ** | Class R3 Shares are not available for public offering. |
Growth of an Assumed $10,000 Investment as of June 30, 2014 – Class A Shares
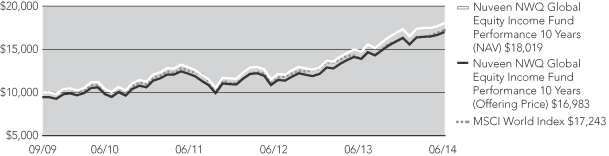
The graphs do not reflect the deduction of taxes that a shareholder may pay on Fund distributions or the redemption of Fund shares.
Fund Performance and Expense Ratios (continued)
Nuveen NWQ Multi-Cap Value Fund
Refer to the first page of this Fund Performance and Expense Ratios section for further explanation of the information included within this section. Refer to the Glossary of Terms Used in this Report for definitions of terms used within this section.
Fund Performance
Average Annual Total Returns as of June 30, 2014*
| | | | | | | | | | | | |
| | | Average Annual | |
| | | 1-Year | | | 5-Year | | | 10-Year | |
Class A Shares at NAV | | | 21.04% | | | | 17.40% | | | | 5.22% | |
Class A Shares at maximum Offering Price | | | 14.10% | | | | 16.01% | | | | 4.60% | |
Russell 3000® Value Index | | | 23.71% | | | | 19.28% | | | | 8.04% | |
S&P 500® Index | | | 24.61% | | | | 18.83% | | | | 7.78% | |
Lipper Multi-Cap Value Funds Classification Average | | | 24.08% | | | | 18.94% | | | | 7.47% | |
| | | |
Class C Shares | | | 20.12% | | | | 16.52% | | | | 4.43% | |
Class R3 Shares | | | 20.72% | | | | 17.10% | | | | 4.93% | |
Class I Shares | | | 21.38% | | | | 17.70% | | | | 5.48% | |
Indexes and Lipper averages are not available for direct investment.
Class A Shares have a maximum 5.75% sales charge (Offering Price). Class A Share purchases of $1 million or more are sold at net asset value without an up-front sales charge but may be subject to a contingent deferred sales charge (CDSC), also known as a back-end sales charge, if redeemed within twelve months of purchase. Class C Shares have a 1% CDSC for redemptions within less than twelve months, which is not reflected in the one-year total return. Class R3 Shares have no sales charge and are only available for purchase by eligible retirement plans. Class I Shares have no sales charge and may be purchased under limited circumstances or by specified classes of investors.
Expense Ratios as of Most Recent Prospectus
| | | | | | | | | | | | | | | | |
| | | Share Class | |
| | | Class A | | | Class C | | | Class R3 | | | Class I | |
Expense Ratios | | | 1.31% | | | | 2.06% | | | | 1.56% | | | | 1.06% | |
| * | The returns for Class A, C and I Shares are actual. The returns for Class R3 Shares are actual for the periods since class inception on 8/04/08; returns prior to class inception are Class I Share returns adjusted for differences in sales charges and expense, which are primarily differences in distribution and service fees. |
Growth of an Assumed $10,000 Investment as of June 30, 2014 – Class A Shares
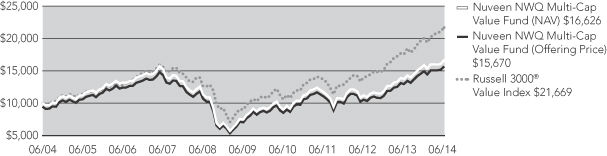
The graphs do not reflect the deduction of taxes that a shareholder may pay on Fund distributions or the redemption of Fund shares.
Fund Performance and Expense Ratios (continued)
Nuveen NWQ Large-Cap Value Fund
Refer to the first page of this Fund Performance and Expense Ratios section for further explanation of the information included within this section. Refer to the Glossary of Terms Used in this Report for definitions of terms used within this section.
Fund Performance
Average Annual Total Returns as of June 30, 2014*
| | | | | | | | | | | | |
| | | Average Annual | |
| | | 1-Year | | | 5-Year | | | Since
Inception | |
Class A Shares at NAV | | | 19.80% | | | | 14.50% | | | | 3.14% | |
Class A Shares at maximum Offering Price | | | 12.91% | | | | 13.14% | | | | 2.34% | |
Russell 1000® Value Index | | | 23.81% | | | | 19.23% | | | | 5.29% | |
Lipper Large-Cap Value Funds Classification Average | | | 22.73% | | | | 17.25% | | | | 4.85% | |
| | | |
Class C Shares | | | 18.90% | | | | 13.63% | | | | 2.37% | |
Class R3 Shares | | | 19.50% | | | | 14.19% | | | | 2.88% | |
Class I Shares | | | 20.10% | | | | 14.77% | | | | 3.40% | |
Indexes and Lipper averages are not available for direct investment.
Class A Shares have a maximum 5.75% sales charge (Offering Price). Class A Share purchases of $1 million or more are sold at net asset value without an up-front sales charge but may be subject to a contingent deferred sales charge (CDSC), also known as a back-end sales charge, if redeemed within twelve months of purchase. Class C Shares have a 1% CDSC for redemptions within less than twelve months, which is not reflected in the one-year total return. Class R3 Shares have no sales charge and are only available for purchase by eligible retirement plans. Class I Shares have no sales charge and may be purchased under limited circumstances or by specified classes of investors.
Expense Ratios as of Most Recent Prospectus
| | | | | | | | | | | | | | | | |
| | | Share Class | |
| | | Class A | | | Class C | | | Class R3 | | | Class I | |
Expense Ratios | | | 1.07% | | | | 1.82% | | | | 1.32% | | | | 0.82% | |
| * | Since inception returns for Class A, C and I Shares, and the comparative index and Lipper classification average, are from 12/15/06. The returns for Class A, C and I Shares are actual. The returns for Class R3 Shares are actual for the periods since class inception on 9/29/09; returns prior to class inception are Class I Share returns adjusted for differences in sales charges and expense, which are primarily differences in distribution and service fees. |
Growth of an Assumed $10,000 Investment as of June 30, 2014 – Class A Shares
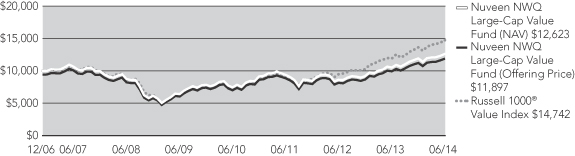
The graphs do not reflect the deduction of taxes that a shareholder may pay on Fund distributions or the redemption of Fund shares.
Fund Performance and Expense Ratios (continued)
Nuveen NWQ Small/Mid-Cap Value Fund
Refer to the first page of this Fund Performance and Expense Ratios section for further explanation of the information included within this section. Refer to the Glossary of Terms Used in this Report for definitions of terms used within this section.
Fund Performance
Average Annual Total Returns as of June 30, 2014*
| | | | | | | | | | | | |
| | | Average Annual | |
| | | 1-Year | | | 5-Year | | | Since
Inception | |
Class A Shares at NAV | | | 22.33% | | | | 22.09% | | | | 5.51% | |
Class A Shares at maximum Offering Price | | | 15.31% | | | | 20.66% | | | | 4.69% | |
Russell 2500® Value Index | | | 24.94% | | | | 21.58% | | | | 6.96% | |
Lipper Small-Cap Core Funds Classification Average | | | 23.73% | | | | 19.79% | | | | 7.19% | |
| | | |
Class C Shares | | | 21.46% | | | | 21.18% | | | | 4.71% | |
Class R3 Shares | | | 22.04% | | | | 21.79% | | | | 5.08% | |
Class I Shares | | | 22.65% | | | | 22.40% | | | | 5.61% | |
Indexes and Lipper averages are not available for direct investment.
Class A Shares have a maximum 5.75% sales charge (Offering Price). Class A Share purchases of $1 million or more are sold at net asset value without an up-front sales charge but may be subject to a contingent deferred sales charge (CDSC), also known as a back-end sales charge, if redeemed within twelve months of purchase. Class C Shares have a 1% CDSC for redemptions within less than twelve months, which is not reflected in the one-year total return. Class R3 Shares have no sales charge and are only available for purchase by eligible retirement plans. Class I Shares have no sales charge and may be purchased under limited circumstances or by specified classes of investors.
Expense Ratios as of Most Recent Prospectus
| | | | | | | | | | | | | | | | |
| | | Share Class | |
| | | Class A | | | Class C | | | Class R3 | | | Class I | |
Gross Expense Ratios | | | 1.32% | | | | 2.07% | | | | 1.58% | | | | 1.09% | |
Net Expense Ratios | | | 1.32% | | | | 2.07% | | | | 1.57% | | | | 1.07% | |
The Fund’s investment adviser has agreed to waive fees and/or reimburse expenses through October 31, 2014 so that total annual Fund operating expenses (excluding 12b-1 distribution and/or service fees, interest expenses, taxes, acquired fund fees and expenses, fees incurred in acquiring and disposing of portfolio securities and extraordinary expenses) do not exceed 1.10% (1.45% after October 31, 2014) of the average daily net assets of any class of Fund shares. The expense limitation expiring October 31, 2014, may be terminated or modified prior to that date only with the approval of the Board of Trustees of the Fund. The expense limitation in effect thereafter may be terminated or modified only with the approval of shareholders of the Fund.
| * | Since inception returns for Class A, C and I Shares, and the comparative index and Lipper classification average, are from 12/15/06. The returns for Class A, C and I Shares are actual. The returns for Class R3 Shares are actual for the periods since class inception on 9/29/09; returns prior to class inception are Class I Share returns adjusted for differences in sales charges and expense, which are primarily differences in distribution and service fees. |
Growth of an Assumed $10,000 Investment as of June 30, 2014 – Class A Shares
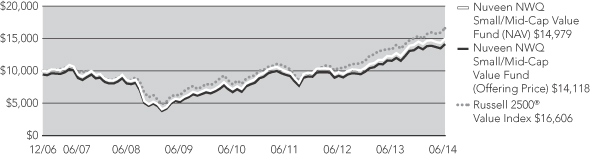
The graphs do not reflect the deduction of taxes that a shareholder may pay on Fund distributions or the redemption of Fund shares.
Fund Performance and Expense Ratios (continued)
Nuveen NWQ Small-Cap Value Fund
Refer to the first page of this Fund Performance and Expense Ratios section for further explanation of the information included within this section. Refer to the Glossary of Terms Used in this Report for definitions of terms used within this section.
Fund Performance
Average Annual Total Returns as of June 30, 2014*
| | | | | | | | | | | | |
| | | Average Annual | |
| | | 1-Year | | | 5-Year | | | Since
Inception | |
Class A Shares at NAV | | | 28.61% | | | | 24.70% | | | | 8.80% | |
Class A Shares at maximum Offering Price | | | 21.22% | | | | 23.24% | | | | 8.13% | |
Russell 2000® Value Index | | | 22.54% | | | | 19.88% | | | | 7.60% | |
Lipper Small-Cap Core Funds Classification Average | | | 23.73% | | | | 19.79% | | | | 8.59% | |
| | | |
Class C Shares | | | 27.61% | | | | 23.78% | | | | 8.01% | |
Class R3 Shares | | | 28.27% | | | | 24.39% | | | | 19.64% | |
Class R6 Shares | | | 29.02% | | | | — | | | | 27.10% | |
Class I Shares | | | 28.89% | | | | 25.01% | | | | 9.08% | |
Indexes and Lipper averages are not available for direct investment.
Class A Shares have a maximum 5.75% sales charge (Offering Price). Class A Share purchases of $1 million or more are sold at net asset value without an up-front sales charge but may be subject to a contingent deferred sales charge (CDSC), also known as a back-end sales charge, if redeemed within twelve months of purchase. Class C Shares have a 1% CDSC for redemptions within less than twelve months, which is not reflected in the one-year total return. Class R3 Shares have no sales charge and are only available for purchase by eligible retirement plans. Class R6 Shares have no sales charge and are available only to certain limited categories of investors as described in the prospectus. Class I Shares have no sales charge and may be purchased under limited circumstances or by specified classes of investors.
Expense Ratios as of Most Recent Prospectus
| | | | | | | | | | | | | | | | | | | | |
| | | Share Class | |
| | | Class A | | | Class C | | | Class R3 | | | Class R6 | | | Class I | |
Expense Ratios | | | 1.38% | | | | 2.12% | | | | 1.68% | | | | 1.10% | | | | 1.12% | |
| * | Since inception returns for Class A, C and I Shares, and the comparative index and Lipper classification average, are from 12/08/04. The returns for Class A, C and I Shares are actual. The returns for Class R3 Shares are actual for the periods since class inception on 9/29/09; returns prior to class inception are Class I Share returns adjusted for differences in sales charges and expense, which are primarily differences in distribution and service fees. The returns for Class R6 Shares are actual for the period since class inception on 2/15/13. |
Growth of an Assumed $10,000 Investment as of June 30, 2014 – Class A Shares
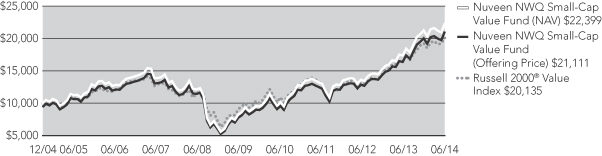
The graphs do not reflect the deduction of taxes that a shareholder may pay on Fund distributions or the redemption of Fund shares.
Fund Performance and Expense Ratios (continued)
Nuveen Tradewinds Value Opportunities Fund
Refer to the first page of this Fund Performance and Expense Ratios section for further explanation of the information included within this section. Refer to the Glossary of Terms Used in this Report for definitions of terms used within this section.
Fund Performance
Average Annual Total Returns as of June 30, 2014*
| | | | | | | | | | | | |
| | | Average Annual | |
| | | 1-Year | | | 5-Year | | | Since
Inception | |
Class A Shares at NAV | | | 22.67% | | | | 14.75% | | | | 11.41% | |
Class A Shares at maximum Offering Price | | | 15.62% | | | | 13.40% | | | | 10.73% | |
Russell 3000® Value Index | | | 23.71% | | | | 19.28% | | | | 7.44% | |
Lipper Global Multi-Cap Value Funds Classification Average | | | 21.81% | | | | 13.72% | | | | 6.28% | |
| | | |
Class C Shares | | | 21.75% | | | | 13.90% | | | | 10.58% | |
Class R3 Shares | | | 22.36% | | | | 14.46% | | | | 11.13% | |
Class I Shares | | | 22.95% | | | | 15.04% | | | | 11.69% | |
Indexes and Lipper averages are not available for direct investment.
Class A Shares have a maximum 5.75% sales charge (Offering Price). Class A Share purchases of $1 million or more are sold at net asset value without an up-front sales charge but may be subject to a contingent deferred sales charge (CDSC), also known as a back-end sales charge, if redeemed within twelve months of purchase. Class C Shares have a 1% CDSC for redemptions within less than twelve months, which is not reflected in the one-year total return. Class R3 Shares have no sales charge and are only available for purchase by eligible retirement plans. Class I Shares have no sales charge and may be purchased under limited circumstances or by specified classes of investors.
Expense Ratios as of Most Recent Prospectus
| | | | | | | | | | | | | | | | |
| | | Share Class | |
| | | Class A | | | Class C | | | Class R3 | | | Class I | |
Expense Ratios | | | 1.35% | | | | 2.09% | | | | 1.58% | | | | 1.09% | |
| * | Since inception returns for Class A, C and I Shares, and the comparative index and Lipper classification average, are from 12/08/04. The returns for Class A, C and I Shares are actual. The returns for Class R3 Shares are actual for the periods since class inception on 8/04/08; returns prior to class inception are Class I Share returns adjusted for differences in sales charges and expense, which are primarily differences in distribution and service fees. |
Growth of an Assumed $10,000 Investment as of June 30, 2014 – Class A Shares
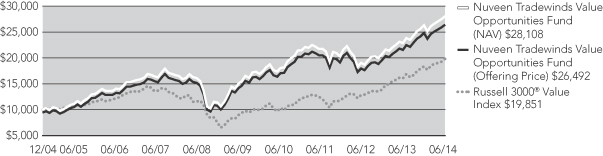
The graphs do not reflect the deduction of taxes that a shareholder may pay on Fund distributions or the redemption of Fund shares.
Holding
Summaries as of June 30, 2014
This data relates to the securities held in each Fund’s portfolio of investments. It should not be construed as a measure of performance for the Fund itself. Holdings are subject to change.
Refer to the Glossary of Terms used in this Report for definitions of terms used within this section.
NWQ Global Equity Fund
Portfolio Allocation
(% of net assets)
| | | | |
Common Stocks | | | 98.5% | |
Other Assets Less Liabilities | | | 1.5% | |
Country Allocation
(% of net assets)
| | | | |
United States | | | 52.9% | |
Japan | | | 10.3% | |
Germany | | | 8.2% | |
Canada | | | 5.5% | |
Switzerland | | | 5.1% | |
France | | | 3.6% | |
Netherlands | | | 3.5% | |
Israel | | | 3.1% | |
Norway | | | 2.5% | |
Sweden | | | 2.0% | |
Spain | | | 1.8% | |
Other Assets Less Liabilities | | | 1.5% | |
Portfolio Composition
(% of net assets)
| | | | |
Pharmaceuticals | | | 17.9% | |
Oil, Gas & Consumable Fuels | | | 7.4% | |
Insurance | | | 6.4% | |
Food & Staples Retailing | | | 5.6% | |
Media | | | 5.6% | |
Semiconductors & Equipment | | | 4.9% | |
Banks | | | 4.5% | |
Machinery | | | 4.2% | |
Chemicals | | | 4.2% | |
Automobiles | | | 3.9% | |
Diversified Financial Services | | | 3.2% | |
Tobacco | | | 3.1% | |
Food Products | | | 2.5% | |
Consumer Finance | | | 2.4% | |
Diversified Telecommunication Services | | | 2.1% | |
Communication Equipment | | | 2.1% | |
Other Industries | | | 18.5% | |
Other Assets Less Liabilities | | | 1.5% | |
Top Five Common Stock Holdings
(% of net assets)
| | | | |
Teva Pharmaceutical Industries Limited, ADR | | | 3.1% | |
International Rectifier Corporation | | | 2.8% | |
Orkla ASA | | | 2.5% | |
Roche Holdings AG, Sponsored ADR | | | 2.5% | |
Daimler AG | | | 2.4% | |
NWQ Global Equity Income
Portfolio Allocation
(% of net assets)
| | | | |
Common Stocks | | | 99.2% | |
Convertible Preferred Securities | | | 0.7% | |
$25 Par (or similar) Retail Preferred | | | 0.9% | |
$1,000 Par (or similar) Institutional Preferred | | | 0.7% | |
Other Assets Less Liabilities | | | (1.5)% | |
Top Five Common Stock Holdings
(% of net assets)
| | | | |
American International Group | | | 3.2% | |
Pfizer Inc. | | | 3.1% | |
Nippon Telegraph and Telephone Corporation, ADR | |
| | | | 3.1% | |
Time Warner Inc. | | | 3.1% | |
Deutsche Borse Group | | | 3.1% | |
Portfolio Composition
(% of net assets)
| | | | |
Pharmaceuticals | | | 16.7% | |
Media | | | 10.8% | |
Insurance | | | 9.3% | |
Banks | | | 7.7% | |
Oil, Gas & Consumable Fuels | | | 7.4% | |
Diversified Telecommunication Services | | | 5.4% | |
Capital Markets | | | 4.9% | |
Diversified Financial Services | | | 4.6% | |
Automobiles | | | 4.1% | |
Food & Staples Retailing | | | 4.0% | |
Software | | | 3.8% | |
Industrial Conglomerates | | | 3.6% | |
Other Industries | | | 19.2% | |
Other Assets Less Liabilities | | | (1.5)% | |
Country Allocation
(% of net assets)
| | | | |
United States | | | 57.1% | |
United Kingdom | | | 8.6% | |
Germany | | | 7.3% | |
France | | | 5.6% | |
Switzerland | | | 4.6% | |
Canada | | | 3.6% | |
Japan | | | 3.1% | |
Israel | | | 3.1% | |
Netherlands | | | 3.1% | |
Sweden | | | 2.1% | |
Denmark | | | 1.6% | |
Other Countries | | | 1.7% | |
Other Assets Less Liabilities | | | (1.5)% | |
Holding Summaries as of June 30, 2014 (continued)
Nuveen NWQ Multi-Cap Value Fund
Portfolio Allocation
(% of net assets)
| | | | |
Common Stocks | | | 99.8% | |
Short-Term Investments | | | 0.2% | |
Other Assets Less Liabilities | | | 0.0% | |
Portfolio Composition
(% of net assets)
| | | | |
Insurance | | | 17.0% | |
Oil, Gas & Consumable Fuels | | | 13.3% | |
Pharmaceuticals | | | 9.0% | |
Software | | | 8.6% | |
Banks | | | 6.4% | |
Media | | | 5.2% | |
Automobiles | | | 4.5% | |
Hotels, Restaurants & Leisure | | | 4.2% | |
Energy Equipment & Services | | | 3.9% | |
Semiconductors & Equipment | | | 3.8% | |
Machinery | | | 3.4% | |
Capital Markets | | | 2.4% | |
Other Industries | | | 18.1% | |
Short-Term Investments | | | 0.2% | |
Other Assets Less Liabilities | | | 0.0% | |
Top Five Common Stock Holdings
(% of net assets)
| | | | |
American International Group, Inc. | | | 4.0% | |
Citigroup Inc. | | | 3.6% | |
Teva Pharmaceutical Industries Limited, Sponsored ADR | | | 3.4% | |
Hartford Financial Services Group, Inc. | | | 3.4% | |
Talisman Energy Inc. | | | 3.4% | |
Nuveen NWQ Large-Cap Value Fund
Portfolio Allocation
(% of net assets)
| | | | |
Common Stocks | | | 97.8% | |
Short-Term Investments | | | 1.5% | |
Other Assets Less Liabilities | | | 0.7% | |
Portfolio Composition
(% of net assets)
| | | | |
Insurance | | | 16.8% | |
Oil, Gas & Consumable Fuels | | | 14.3% | |
Banks | | | 9.7% | |
Software | | | 8.7% | |
Media | | | 7.4% | |
Pharmaceuticals | | | 7.3% | |
Automobiles | | | 4.9% | |
Machinery | | | 3.2% | |
Hotels, Restaurants & Leisure | | | 2.2% | |
Consumer Finance | | | 2.2% | |
Food & Staples Retailing | | | 1.9% | |
Other Industries | | | 19.2% | |
Short-Term Investments | | | 1.5% | |
Other Assets Less Liabilities | | | 0.7% | |
Top Five Common Stock Holdings
(% of net assets)
| | | | |
Citigroup Inc. | | | 4.0% | |
American International Group, Inc. | | | 3.8% | |
Teva Pharmaceutical Industries Limited, Sponsored ADR | | | 3.6% | |
Hartford Financial Services Group, Inc. | | | 3.4% | |
Talisman Energy Inc. | | | 3.4% | |
Holding Summaries as of June 30, 2014 (continued)
Nuveen NWQ Small/Mid-Cap Value Fund
Portfolio Allocation
(% of net assets)
| | | | |
Common Stocks | | | 97.6% | |
Short-Term Investments | | | 2.1% | |
Other Assets Less Liabilities | | | 0.3% | |
Portfolio Composition
(% of net assets)
| | | | |
Semiconductors & Equipment | | | 16.0% | |
Paper & Forest Products | | | 10.0% | |
Insurance | | | 7.9% | |
Banks | | | 5.8% | |
Life Sciences Tools & Services | | | 5.7% | |
Food Products | | | 4.9% | |
Machinery | | | 4.9% | |
Personal Products | | | 4.5% | |
Aerospace & Defense | | | 3.9% | |
Real Estate Management & Development | | | 3.9% | |
Oil, Gas & Consumable Fuels | | | 3.8% | |
Energy Equipment & Services | | | 3.7% | |
IT Services | | | 3.4% | |
Other Industries | | | 19.2% | |
Short-Term Investments | | | 2.1% | |
Other Assets Less Liabilities | | | 0.3% | |
Top Five Common Stock Holdings
(% of net assets)
| | | | |
Microsemi Corporation | | | 4.2% | |
Teradyne Inc. | | | 4.1% | |
International Rectifier Corporation | | | 3.9% | |
Reinsurance Group of America Inc. | | | 3.9% | |
Forestar Real Estate Group Inc. | | | 3.9% | |
Nuveen NWQ Small-Cap Value Fund
Portfolio Allocation
(% of net assets)
| | | | |
Common Stocks | | | 93.0% | |
Short-Term Investments | | | 6.4% | |
Other Assets Less Liabilities | | | 0.6% | |
Portfolio Composition
(% of net assets)
| | | | |
Semiconductors & Equipment | | | 17.4% | |
Paper & Forest Products | | | 8.5% | |
Electronic Equipment & Instruments | | | 7.8% | |
Banks | | | 7.3% | |
Aerospace & Defense | | | 7.2% | |
Personal Products | | | 4.5% | |
Household Durables | | | 4.0% | |
Real Estate Management & Development | | | 3.8% | |
Energy Equipment & Services | | | 3.6% | |
Pharmaceuticals | | | 3.4% | |
Professional Services | | | 3.1% | |
Oil, Gas & Consumable Fuels | | | 2.9% | |
Other Industries | | | 19.5% | |
Short-Term Investments | | | 6.4% | |
Other Assets Less Liabilities | | | 0.6% | |
Top Five Common Stock Holdings
(% of net assets)
| | | | |
Microsemi Corporation | | | 4.1% | |
Forestar Real Estate Group Inc. | | | 3.8% | |
International Rectifier Corporation | | | 3.8% | |
Coherent Inc. | | | 3.3% | |
GP Strategies Corporation | | | 3.1% | |
Holding Summaries as of June 30, 2014 (continued)
Nuveen Tradewinds Value Opportunities Fund
Portfolio Allocation
(% of net assets)
| | | | |
Common Stocks | | | 97.0% | |
Short-Term Investments | | | 2.7% | |
Other Assets Less Liabilities | | | 0.3% | |
Country Allocation
(% of net assets)
| | | | |
United States | | | 75.2% | |
Canada | | | 6.6% | |
Japan | | | 4.0% | |
Netherlands | | | 3.1% | |
Denmark | | | 3.1% | |
Switzerland | | | 3.0% | |
France | | | 2.2% | |
United Kingdom | | | 1.5% | |
Belgium | | | 1.0% | |
Other Assets Less Liabilities | | | 0.3% | |
Portfolio Composition
(% of net assets)
| | | | |
Insurance | | | 13.6% | |
Food Products | | | 9.1% | |
Oil, Gas & Consumable Fuels | | | 8.7% | |
Media | | | 6.9% | |
Pharmaceuticals | | | 6.5% | |
Electric Utilities | | | 5.6% | |
Automobiles | | | 4.0% | |
Banks | | | 3.5% | |
Electronic Equipment & Instruments | | | 3.5% | |
Machinery | | | 3.4% | |
Software | | | 3.1% | |
Chemicals | | | 3.0% | |
Health Care Providers & Services | | | 3.0% | |
Metals & Mining | | | 3.0% | |
Specialty Retail | | | 2.7% | |
Other Industries | | | 17.4% | |
Short-Term Investments | | | 2.7% | |
Other Assets Less Liabilities | | | 0.3% | |
Top Five Common Stock Holdings
(% of net assets)
| | | | |
General Motors Company | | | 4.0% | |
Bayer AG | | | 3.1% | |
Aetna Inc. | | | 3.0% | |
Cabot Oil & Gas Corporation | | | 3.0% | |
Agrium Inc. | | | 3.0% | |
Expense
Examples
As a shareholder of one or more of the Funds, you incur two types of costs: (1) transaction costs, including up-front and back-end sales charges (loads) or redemption fees, where applicable; and (2) ongoing costs, including management fees; distribution and service (12b-1) fees, where applicable; and other Fund expenses. The Examples below are intended to help you understand your ongoing costs (in dollars) of investing in the Funds and to compare these costs with the ongoing costs of investing in other mutual funds. Since the expense examples for Nuveen NWQ Global Equity Fund reflect only the first 91 days of the Fund’s operations they may not provide a meaningful understanding of the Fund’s ongoing expense.
The Examples below are based on an investment of $1,000 invested at the beginning of the period and held through the period ended June 30, 2014.
The beginning of the period for the Funds is January 1, 2014 (except for Nuveen NWQ Global Equity Fund, which the beginning of the period is April 1, 2014, the Fund’s commencement of operations).
The information under “Actual Performance,” together with the amount you invested, allows you to estimate actual expenses incurred over the reporting period. Simply divide your account value by $1,000 (for example, an $8,600 account value divided by $1,000 = 8.60) and multiply the result by the cost shown for your share class, in the row entitled “Expenses Incurred During Period” to estimate the expenses incurred on your account during this period.
The information under “Hypothetical Performance,” provides information about hypothetical account values and hypothetical expenses based on the respective Fund’s actual expense ratio and an assumed rate of return of 5% per year before expenses, which is not the Fund’s actual return. The hypothetical account values and expenses may not be used to estimate the actual ending account balance or expense you incurred for the period. You may use this information to compare the ongoing costs of investing in the Fund and other Funds. To do so, compare this 5% hypothetical example with the 5% hypothetical examples that appear in the shareholder reports of the other funds.
Please note that the expenses shown in the table are meant to highlight your ongoing costs only and do not reflect any transaction costs. Therefore, the hypothetical information is useful in comparing ongoing costs only, and will not help you determine the relative total costs of owning different funds or share classes. In addition, if these transaction costs were included, your costs would have been higher.
Nuveen NWQ Global Equity Fund
| | | | | | | | | | | | |
| | | Share Class | |
| | | Class A | | | Class C | | | Class I | |
Actual Performance | | | | | | | | | | | | |
Beginning Account Value | | $ | 1,000.00 | | | $ | 1,000.00 | | | $ | 1,000.00 | |
Ending Account Value | | $ | 1,033.50 | | | $ | 1,031.50 | | | $ | 1,034.00 | |
Expenses Incurred During Period | | $ | 3.09 | | | $ | 4.99 | | | $ | 2.46 | |
Hypothetical Performance (5% annualized return before expenses) | | | | | | | | | | | | |
Beginning Account Value | | $ | 1,000.00 | | | $ | 1,000.00 | | | $ | 1,000.00 | |
Ending Account Value | | $ | 1,018.74 | | | $ | 1,015.03 | | | $ | 1,019.98 | |
Expenses Incurred During Period | | $ | 3.06 | | | $ | 4.93 | | | $ | 2.43 | |
For each class of the Fund, expenses are equal to the Fund’s annualized net expense ratio of 1.22%, 1.97% and 0.97% for Classes A, C and I, respectively, multiplied by the average account value over the period, multiplied by 91/365 (to reflect the since inception period).
Expense Examples (continued)
Nuveen NWQ Global Equity Income Fund
| | | | | | | | | | | | | | | | |
| | | Share Class | |
| | | Class A | | | Class C | | | Class R3* | | | Class I | |
Actual Performance | | | | | | | | | | | | | | | | |
Beginning Account Value | | $ | 1,000.00 | | | $ | 1,000.00 | | | $ | 1,000.00 | | | $ | 1,000.00 | |
Ending Account Value | | $ | 1,040.20 | | | $ | 1,036.00 | | | $ | 1,038.90 | | | $ | 1,041.50 | |
Expenses Incurred During Period | | $ | 6.02 | | | $ | 9.79 | | | $ | 7.28 | | | $ | 4.76 | |
Hypothetical Performance | | | | | | | | | | | | | | | | |
Beginning Account Value | | $ | 1,000.00 | | | $ | 1,000.00 | | | $ | 1,000.00 | | | $ | 1,000.00 | |
Ending Account Value | | $ | 1,018.89 | | | $ | 1,015.17 | | | $ | 1,017.65 | | | $ | 1,020.08 | |
Expenses Incurred During Period | | $ | 5.96 | | | $ | 9.69 | | | $ | 7.20 | | | $ | 4.76 | |
For each class of the Fund, expenses are equal to the Fund’s annualized net expense ratio of 1.19%, 1.93%, 1.44% and 0.95% for Classes A, C, R3 and I, respectively, multiplied by the average account value over the period, multiplied by 181/365 (to reflect the one-half year period).
| * | Class R3 Shares are not available for public offering. |
Nuveen NWQ Multi-Cap Value Fund
| | | | | | | | | | | | | | | | |
| | | Share Class | |
| | | Class A | | | Class C | | | Class R3 | | | Class I | |
Actual Performance | | | | | | | | | | | | | | | | |
Beginning Account Value | | $ | 1,000.00 | | | $ | 1,000.00 | | | $ | 1,000.00 | | | $ | 1,000.00 | |
Ending Account Value | | $ | 1,049.40 | | | $ | 1,045.20 | | | $ | 1,047.90 | | | $ | 1,050.70 | |
Expenses Incurred During Period | | $ | 6.50 | | | $ | 10.29 | | | $ | 7.77 | | | $ | 5.24 | |
Hypothetical Performance (5% annualized return before expenses) | | | | | | | | | |
Beginning Account Value | | $ | 1,000.00 | | | $ | 1,000.00 | | | $ | 1,000.00 | | | $ | 1,000.00 | |
Ending Account Value | | $ | 1,018.84 | | | $ | 1,014.73 | | | $ | 1,017.21 | | | $ | 1,019.69 | |
Expenses Incurred During Period | | $ | 6.41 | | | $ | 10.14 | | | $ | 7.65 | | | $ | 5.16 | |
For each class of the Fund, expenses are equal to the Fund’s annualized net expense ratio of 1.28%, 2.03%, 1.53% and 1.03% for Classes A, C, R3 and I, respectively, multiplied by the average account value over the period, multiplied by 181/365 (to reflect the one-half year period).
Nuveen NWQ Large-Cap Value Fund
| | | | | | | | | | | | | | | | |
| | | Share Class | |
| | | Class A | | | Class C | | | Class R3 | | | Class I | |
Actual Performance | | | | | | | | | | | | | | | | |
Beginning Account Value | | $ | 1,000.00 | | | $ | 1,000.00 | | | $ | 1,000.00 | | | $ | 1,000.00 | |
Ending Account Value | | $ | 1,058.90 | | | $ | 1,055.00 | | | $ | 1,057.20 | | | $ | 1,060.20 | |
Expenses Incurred During Period | | $ | 5.62 | | | $ | 9.43 | | | $ | 6.89 | | | $ | 4.34 | |
Hypothetical Performance (5% annualized return before expenses) | | | | | | | | | | | | | | | | |
Beginning Account Value | | $ | 1,000.00 | | | $ | 1,000.00 | | | $ | 1,000.00 | | | $ | 1,000.00 | |
Ending Account Value | | $ | 1,109.34 | | | $ | 1,015.62 | | | $ | 1,018.10 | | | $ | 1,020.58 | |
Expenses Incurred During Period | | $ | 5.51 | | | $ | 9.25 | | | $ | 6.76 | | | $ | 4.26 | |
For each class of the Fund, expenses are equal to the Fund’s annualized net expense ratio of 1.09%, 1.84%, 1.34% and .85% for Classes A, C, R3 and I, respectively, multiplied by the average account value over the period, multiplied by 181/365 (to reflect the one-half year period).
Nuveen NWQ Small/Mid-Cap Value Fund
| | | | | | | | | | | | | | | | |
| | | Share Class | |
| | | Class A | | | Class C | | | Class R3 | | | Class I | |
Actual Performance | | | | | | | | | | | | | | | | |
Beginning Account Value | | $ | 1,000.00 | | | $ | 1,000.00 | | | $ | 1,000.00 | | | $ | 1,000.00 | |
Ending Account Value | | $ | 1,032.00 | | | $ | 1,028.30 | | | $ | 1,030.90 | | | $ | 1,033.30 | |
Expenses Incurred During Period | | $ | 6.71 | | | $ | 10.51 | | | $ | 8.01 | | | $ | 5.44 | |
Hypothetical Performance (5% annualized return before expenses) | | | | | | | | | | | | | | | | |
Beginning Account Value | | $ | 1,000.00 | | | $ | 1,000.00 | | | $ | 1,000.00 | | | $ | 1,000.00 | |
Ending Account Value | | $ | 1,018.15 | | | $ | 1,014.53 | | | $ | 1,016.91 | | | $ | 1,019.44 | |
Expenses Incurred During Period | | $ | 6.71 | | | $ | 10.44 | | | $ | 7.95 | | | $ | 5.41 | |
For each class of the Fund, expenses are equal to the Fund’s annualized net expense ratio of 1.34%, 2.07%, 1.58% and 1.08% for Classes A, C, R3 and I, respectively, multiplied by the average account value over the period, multiplied by 181/365 (to reflect the one-half year period).
Nuveen NWQ Small-Cap Value Fund
| | | | | | | | | | | | | | | | | | | | |
| | | Share Class | |
| | | Class A | | | Class C | | | Class R3 | | | Class R6 | | | Class I | |
Actual Performance | | | | | | | | | | | | | | | | | | | | |
Beginning Account Value | | $ | 1,000.00 | | | $ | 1,000.00 | | | $ | 1,000.00 | | | $ | 1,000.00 | | | $ | 1,000.00 | |
Ending Account Value | | $ | 1,050.50 | | | $ | 1,046.60 | | | $ | 1,049.00 | | | $ | 1,051.90 | | | $ | 1,051.50 | |
Expenses Incurred During Period | | $ | 6.81 | | | $ | 10.61 | | | $ | 8.08 | | | $ | 5.14 | | | $ | 5.54 | |
Hypothetical Performance (5% annualized return before expenses) | | | | | | | | | | | | | | | | | | | | |
Beginning Account Value | | $ | 1,000.00 | | | $ | 1,000.00 | | | $ | 1,000.00 | | | $ | 1,000.00 | | | $ | 1,000.00 | |
Ending Account Value | | $ | 1,018.15 | | | $ | 1,014.43 | | | $ | 1,016.91 | | | $ | 1,019.79 | | | $ | 1,019.39 | |
Expenses Incurred During Period | | $ | 6.71 | | | $ | 10.44 | | | $ | 7.95 | | | $ | 5.06 | | | $ | 5.46 | |
For each class of the Fund, expenses are equal to the Fund’s annualized net expense ratio of 1.34%, 208%, 1.58%, 1.01% and 1.09% for Classes A, C, R3, R6 and I, respectively, multiplied by the average account value over the period, multiplied by 181/365 (to reflect the one-half year period).
Nuveen Tradewinds Value Opportunities Fund
| | | | | | | | | | | | | | | | |
| | | Share Class | |
| | | Class A | | | Class C | | | Class R3 | | | Class I | |
Actual Performance | | | | | | | | | | | | | | | | |
Beginning Account Value | | $ | 1,000.00 | | | $ | 1,000.00 | | | $ | 1,000.00 | | | $ | 1,000.00 | |
Ending Account Value | | $ | 1,064.90 | | | $ | 1,060.90 | | | $ | 1,063.20 | | | $ | 1,065.80 | |
Expenses Incurred During Period | | $ | 6.35 | | | $ | 10.22 | | | $ | 7.67 | | | $ | 5.12 | |
Hypothetical Performance (5% annualized return before expenses) | | | | | | | | | | | | | | | | |
Beginning Account Value | | $ | 1,000.00 | | | $ | 1,000.00 | | | $ | 1,000.00 | | | $ | 1,000.00 | |
Ending Account Value | | $ | 1,018.65 | | | $ | 1,014.88 | | | $ | 1,017.36 | | | $ | 1,019.84 | |
Expenses Incurred During Period | | $ | 6.21 | | | $ | 9.99 | | | $ | 7.50 | | | $ | 5.01 | |
For each class of the Fund, expenses are equal to the Fund’s annualized net expense ratio of 1.24%, 2.00%, 1.50% and 1.00% for Classes A, C, R3 and I, respectively, multiplied by the average account value over the period, multiplied by 181/365 (to reflect the one-half year period).
Report of
Independent Registered Public Accounting Firm
To the Board of Trustees and Shareholders of
Nuveen Investment Trust:
In our opinion, the accompanying statements of assets and liabilities, including the portfolios of investments, and the related statements of operations and of changes in net assets and the financial highlights present fairly, in all material respects, the financial position of Nuveen NWQ Global Equity Fund, Nuveen NWQ Global Equity Income Fund (formerly Nuveen NWQ Equity Income Fund), Nuveen NWQ Multi-Cap Value Fund, Nuveen NWQ Large-Cap Value Fund, Nuveen NWQ Small/Mid-Cap Value Fund, Nuveen NWQ Small-Cap Value Fund and Nuveen Tradewinds Value Opportunities Fund (each a series of Nuveen Investment Trust, hereinafter referred to as the “Funds”) at June 30, 2014, the results of each of their operations for the period then ended, the changes in each of their net assets and the financial highlights for each of the periods presented, in conformity with accounting principles generally accepted in the United States of America. These financial statements and financial highlights (hereafter referred to as “financial statements”) are the responsibility of the Funds’ management. Our responsibility is to express an opinion on these financial statements based on our audits. We conducted our audits of these financial statements in accordance with the standards of the Public Company Accounting Oversight Board (United States). Those standards require that we plan and perform the audit to obtain reasonable assurance about whether the financial statements are free of material misstatement. An audit includes examining, on a test basis, evidence supporting the amounts and disclosures in the financial statements, assessing the accounting principles used and significant estimates made by management, and evaluating the overall financial statement presentation. We believe that our audits, which included confirmation of securities at June 30, 2014 by correspondence with the custodian and brokers, provide a reasonable basis for our opinion.
PricewaterhouseCoopers LLP
Chicago, IL
August 27, 2014
Nuveen NWQ Global Equity Fund
Portfolio of Investments June 30, 2014
| | | | | | | | | | | | | | |
| Shares | | | Description (1) | | | | | | | | Value | |
| | | | | |
| | | | LONG-TERM INVESTMENTS – 98.5% | | | | | | | | | | |
| | | | | |
| | | | COMMON STOCKS – 98.5% | | | | | | | | | | |
| | | | | |
| | | | Automobiles – 3.9% | | | | | | | | | | |
| | | | | |
| | 265 | | | Daimler AG | | | | | | | | $ | 24,820 | |
| | | | | |
| | 425 | | | General Motors Company | | | | | | | | | 15,427 | |
| | | | Total Automobiles | | | | | | | | | 40,247 | |
| | | | | |
| | | | Banks – 4.5% | | | | | | | | | | |
| | | | | |
| | 465 | | | Citigroup Inc. | | | | | | | | | 21,901 | |
| | | | | |
| | 225 | | | JPMorgan Chase & Co. | | | | | | | | | 12,965 | |
| | | | | |
| | 225 | | | Wells Fargo & Company | | | | | | | | | 11,826 | |
| | | | Total Banks | | | | | | | | | 46,692 | |
| | | | | |
| | | | Capital Markets – 1.6% | | | | | | | | | | |
| | | | | |
| | 900 | | | UBS AG | | | | | | | | | 16,488 | |
| | | | | |
| | | | Chemicals – 4.2% | | | | | | | | | | |
| | | | | |
| | 160 | | | Agrium Inc. | | | | | | | | | 14,661 | |
| | | | | |
| | 225 | | | Koninklijke DSM NV | | | | | | | | | 16,387 | |
| | | | | |
| | 800 | | | Nissan Chemical Industries Limited | | | | | | | | | 12,438 | |
| | | | Total Chemicals | | | | | | | | | 43,486 | |
| | | | | |
| | | | Communication Equipment – 2.1% | | | | | | | | | | |
| | | | | |
| | 1,750 | | | Ericsson LM, Class B Shares | | | | | | | | | 21,150 | |
| | | | | |
| | | | Consumer Finance – 2.4% | | | | | | | | | | |
| | | | | |
| | 300 | | | Capital One Financial Corporation | | | | | | | | | 24,780 | |
| | | | | |
| | | | Diversified Financial Services – 3.2% | | | | | | | | | | |
| | | | | |
| | 175 | | | Deutsche Borse Group | | | | | | | | | 13,582 | |
| | | | | |
| | 1,400 | | | ING Groep N.V., Ordinary Shares, (2) | | | | | | | | | 19,669 | |
| | | | Total Diversified Financial Services | | | | | | | | | 33,251 | |
| | | | | |
| | | | Diversified Telecommunication Services – 2.1% | | | | | | | | | | |
| | | | | |
| | 350 | | | Nippon Telegraph and Telephone Corporation, ADR | | | | | | | | | 21,828 | |
| | | | | |
| | | | Food & Staples Retailing – 5.6% | | | | | | | | | | |
| | | | | |
| | 525 | | | Carrefour SA | | | | | | | | | 19,367 | |
| | | | | |
| | 300 | | | CVS Caremark Corporation | | | | | | | | | 22,611 | |
| | | | | |
| | 375 | | | Metro AG | | | | | | | | | 16,344 | |
| | | | Total Food & Staples Retailing | | | | | | | | | 58,322 | |
| | | | | |
| | | | Food Products – 2.5% | | | | | | | | | | |
| | | | | |
| | 2,850 | | | Orkla ASA | | | | | | | | | 25,392 | |
| | | | | |
| | | | Hotels, Restaurants & Leisure – 1.3% | | | | | | | | | | |
| | | | | |
| | 425 | | | Norwegian Cruise Line Holdings Limited, (2) | | | | | | | | | 13,472 | |
Nuveen NWQ Global Equity Fund (continued)
Portfolio of Investments June 30, 2014
| | | | | | | | | | | | | | |
| Shares | | | Description (1) | | | | | | | | Value | |
| | | | | |
| | | | Household Durables – 1.7% | | | | | | | | | | |
| | | | | |
| | 1,275 | | | Sekisui House, Ltd. | | | | | | | | $ | 17,482 | |
| | | | | |
| | | | Industrial Conglomerates – 1.5% | | | | | | | | | | |
| | | | | |
| | 115 | | | Siemens AG, Sponsored ADR | | | | | | | | | 15,188 | |
| | | | | |
| | | | Insurance – 6.4% | | | | | | | | | | |
| | | | | |
| | 450 | | | American International Group, Inc. | | | | | | | | | 24,561 | |
| | | | | |
| | 175 | | | AON PLC | | | | | | | | | 15,766 | |
| | | | | |
| | 400 | | | Hartford Financial Services Group, Inc. | | | | | | | | | 14,324 | |
| | | | | |
| | 125 | | | Swiss Re AG | | | | | | | | | 11,121 | |
| | | | Total Insurance | | | | | | | | | 65,772 | |
| | | | | |
| | | | IT Services – 1.9% | | | | | | | | | | |
| | | | | |
| | 525 | | | VeriFone Holdings Inc., (2) | | | | | | | | | 19,294 | |
| | | | | |
| | | | Life Sciences Tools & Services – 1.7% | | | | | | | | | | |
| | | | | |
| | 145 | | | Bio-Rad Laboratories Inc., (2) | | | | | | | | | 17,358 | |
| | | | | |
| | | | Machinery – 4.2% | | | | | | | | | | |
| | | | | |
| | 325 | | | GEA Group AG | | | | | | | | | 15,389 | |
| | | | | |
| | 225 | | | Ingersoll Rand Company Limited, Class A | | | | | | | | | 14,065 | |
| | | | | |
| | 225 | | | PACCAR Inc. | | | | | | | | | 14,136 | |
| | | | Total Machinery | | | | | | | | | 43,590 | |
| | | | | |
| | | | Media – 5.6% | | | | | | | | | | |
| | | | | |
| | 850 | | | Interpublic Group of Companies, Inc. | | | | | | | | | 16,583 | |
| | | | | |
| | 300 | | | Time Warner Inc. | | | | | | | | | 21,075 | |
| | | | | |
| | 235 | | | Viacom Inc., Class B | | | | | | | | | 20,382 | |
| | | | Total Media | | | | | | | | | 58,040 | |
| | | | | |
| | | | Multi-Utilities – 1.7% | | | | | | | | | | |
| | | | | |
| | 310 | | | Target Corporation | | | | | | | | | 17,964 | |
| | | | | |
| | | | Oil, Gas & Consumable Fuels – 7.4% | | | | | | | | | | |
| | | | | |
| | 165 | | | Apache Corporation | | | | | | | | | 16,602 | |
| | | | | |
| | 515 | | | Canadian Natural Resources Limited | | | | | | | | | 23,644 | |
| | | | | |
| | 1,175 | | | INPEX Corporation | | | | | | | | | 17,862 | |
| | | | | |
| | 1,725 | | | Talisman Energy Inc. | | | | | | | �� | | 18,285 | |
| | | | Total Oil, Gas & Consumable Fuels | | | | | | | | | 76,393 | |
| | | | | |
| | | | Personal Products – 1.4% | | | | | | | | | | |
| | | | | |
| | 1,000 | | | Avon Products, Inc. | | | | | | | | | 14,610 | |
| | | | | |
| | | | Pharmaceuticals – 17.9% | | | | | | | | | | |
| | | | | |
| | 350 | | | AbbVie Inc. | | | | | | | | | 19,754 | |
| | | | | |
| | 1,125 | | | Almirall SA | | | | | | | | | 18,255 | |
| | | | | |
| | 555 | | | Impax Laboratories Inc., (2) | | | | | | | | | 16,644 | |
| | | | | |
| | 160 | | | Jazz Pharmaceuticals, Inc., (2) | | | | | | | | | 23,522 | |
| | | | | | | | | | | | | | |
| Shares | | | Description (1) | | | | | | | | Value | |
| | | | | |
| | | | Pharmaceuticals (continued) | | | | | | | | | | |
| | | | | |
| | 500 | | | Otsuka Holdings Company KK | | | | | | | | $ | 15,498 | |
| | | | | |
| | 575 | | | Pfizer Inc. | | | | | | | | | 17,066 | |
| | | | | |
| | 85 | | | Roche Holdings AG, Sponsored ADR | | | | | | | | | 25,352 | |
| | | | | |
| | 165 | | | Sanofi-Synthelabo, SA | | | | | | | | | 17,528 | |
| | | | | |
| | 600 | | | Teva Pharmaceutical Industries Limited, ADR | | | | | | | | | 31,718 | |
| | | | Total Pharmaceuticals | | | | | | | | | 185,337 | |
| | | | | |
| | | | Real Estate Investment Trust – 1.0% | | | | | | | | | | |
| | | | | |
| | 300 | | | Weyerhaeuser Company | | | | | | | | | 9,927 | |
| | | | | |
| | | | Road & Rail – 1.7% | | | | | | | | | | |
| | | | | |
| | 180 | | | Union Pacific Corporation | | | | | | | | | 17,955 | |
| | | | | |
| | | | Semiconductors & Equipment – 4.9% | | | | | | | | | | |
| | | | | |
| | 1,050 | | | International Rectifier Corporation, (2) | | | | | | | | | 29,295 | |
| | | | | |
| | 1,100 | | | Teradyne Inc. | | | | | | | | | 21,560 | |
| | | | Total Semiconductors & Equipment | | | | | | | | | 50,855 | |
| | | | | |
| | | | Software – 1.1% | | | | | | | | | | |
| | | | | |
| | 400 | | | CA Technologies, Inc. | | | | | | | | | 11,496 | |
| | | | | |
| | | | Specialty Retail – 1.9% | | | | | | | | | | |
| | | | | |
| | 11,500 | | | Express Inc., (2) | | | | | | | | | 19,585 | |
| | | | | |
| | | | Tobacco – 3.1% | | | | | | | | | | |
| | | | | |
| | 600 | | | Japan Tobacco Inc. | | | | | | | | | 21,872 | |
| | | | | |
| | 125 | | | Philip Morris International | | | | | | | | | 10,539 | |
| | | | Total Tobacco | | | | | | | | | 32,411 | |
| | | | Total Long-Term Investments (cost $987,856) | | | | | | | | | 1,018,365 | |
| | | | Other Assets Less Liabilities – 1.5% | | | | | | | | | 15,555 | |
| | | | Net Assets – 100% | | | | | | | | $ | 1,033,920 | |
| | For Fund portfolio compliance purposes, the Fund’s industry classifications refer to any one or more of the industry sub-classifications used by one or more widely recognized market indexes or ratings group indexes, and/or as defined by Fund management. This definition may not apply for purposes of this report, which may combine industry sub-classifications into sectors for reporting ease. |
| (1) | All percentages shown in the Portfolio of Investments are based on net assets. |
| (2) | Non-income producing; issuer has not declared a dividend within the past twelve months. |
| ADR | American Depositary Receipt. |
See accompanying notes to financial statements.
Nuveen NWQ Global Equity Income Fund
(formerly Nuveen NWQ Equity Income Fund)
Portfolio of Investments June 30, 2014
| | | | | | | | | | | | | | |
| Shares | | | Description (1) | | | | | | | | Value | |
| | | | | |
| | | | LONG-TERM INVESTMENTS – 101.5% | | | | | | | | | | |
| | | | | |
| | | | COMMON STOCKS – 99.2% | | | | | | | | | | |
| | | | | |
| | | | Automobiles – 4.1% | | | | | | | | | | |
| | | | | |
| | 225 | | | Daimler AG | | | | | | | | $ | 21,073 | |
| | | | | |
| | 1,550 | | | Ford Motor Company | | | | | | | | | 26,722 | |
| | | | | |
| | 600 | | | General Motors Company | | | | | | | | | 21,780 | |
| | | | Total Automobiles | | | | | | | | | 69,575 | |
| | | | | |
| | | | Banks – 6.1% | | | | | | | | | | |
| | | | | |
| | 700 | | | Citigroup Inc. | | | | | | | | | 32,970 | |
| | | | | |
| | 600 | | | JPMorgan Chase & Co. | | | | | | | | | 34,572 | |
| | | | | |
| | 700 | | | Wells Fargo & Company | | | | | | | | | 36,792 | |
| | | | Total Banks | | | | | | | | | 104,334 | |
| | | | | |
| | | | Capital Markets – 4.9% | | | | | | | | | | |
| | | | | |
| | 1,500 | | | Ares Capital Corporation | | | | | | | | | 26,790 | |
| | | | | |
| | 1,000 | | | Bank New York Mellon | | | | | | | | | 37,480 | |
| | | | | |
| | 1,400 | | | Medley Capital Corporation | | | | | | | | | 18,284 | |
| | | | Total Capital Markets | | | | | | | | | 82,554 | |
| | | | | |
| | | | Chemicals – 2.0% | | | | | | | | | | |
| | | | | |
| | 375 | | | Agrium Inc. | | | | | | | | | 34,353 | |
| | | | | |
| | | | Communication Equipment – 3.1% | | | | | | | | | | |
| | | | | |
| | 700 | | | Cisco Systems, Inc. | | | | | | | | | 17,395 | |
| | | | | |
| | 2,900 | | | LM Ericsson Telefonaktiebolaget, Sponsored ADR | | | | | | | | | 35,048 | |
| | | | Total Communication Equipment | | | | | | | | | 52,443 | |
| | | | | |
| | | | Consumer Finance – 1.6% | | | | | | | | | | |
| | | | | |
| | 325 | | | Capital One Financial Corporation | | | | | | | | | 26,845 | |
| | | | | |
| | | | Containers & Packaging – 2.0% | | | | | | | | | | |
| | | | | |
| | 675 | | | Avery Dennison Corporation | | | | | | | | | 34,594 | |
| | | | | |
| | | | Diversified Financial Services – 4.6% | | | | | | | | | | |
| | | | | |
| | 675 | | | Deutsche Borse Group | | | | | | | | | 52,388 | |
| | | | | |
| | 1,800 | | | ING Groep N.V., Ordinary Shares, (2) | | | | | | | | | 25,288 | |
| | | | Total Diversified Financial Services | | | | | | | | | 77,676 | |
| | | | | |
| | | | Diversified Telecommunication Services – 4.7% | | | | | | | | | | |
| | | | | |
| | 850 | | | Nippon Telegraph and Telephone Corporation, ADR | | | | | | | | | 53,011 | |
| | | | | |
| | 2,600 | | | TDC A/S | | | | | | | | | 26,908 | |
| | | | Total Diversified Telecommunication Services | | | | | | | | | 79,919 | |
| | | | | |
| | | | Electric Utilities – 0.2% | | | | | | | | | | |
| | | | | |
| | 100 | | | Abengoa Yield PLC | | | | | | | | | 3,782 | |
| | | | | | | | | | | | | | |
| Shares | | | Description (1) | | | | | | | | Value | |
| | | | | |
| | | | Food & Staples Retailing – 4.0% | | | | | | | | | | |
| | | | | |
| | 700 | | | Carrefour SA | | | | | | | | $ | 25,822 | |
| | | | | |
| | 550 | | | CVS Caremark Corporation | | | | | | | | | 41,454 | |
| | | | Total Food & Staples Retailing | | | | | | | | | 67,276 | |
| | | | | |
| | | | Food Products – 1.0% | | | | | | | | | | |
| | | | | |
| | 2,000 | | | Orkla ASA | | | | | | | | | 17,819 | |
| | | | | |
| | | | Hotels, Restaurants & Leisure – 0.9% | | | | | | | | | | |
| | | | | |
| | 500 | | | Norwegian Cruise Line Holdings Limited, (2),(3) | | | | | | | | | 15,850 | |
| | | | | |
| | | | Industrial Conglomerates – 3.6% | | | | | | | | | | |
| | | | | |
| | 650 | | | General Electric Company | | | | | | | | | 17,082 | |
| | | | | |
| | 850 | | | Koninklijke Philips Electronics NV | | | | | | | | | 26,973 | |
| | | | | |
| | 125 | | | Siemens AG, Sponsored ADR | | | | | | | | | 16,509 | |
| | | | Total Industrial Conglomerates | | | | | | | | | 60,564 | |
| | | | | |
| | | | Insurance – 9.3% | | | | | | | | | | |
| | | | | |
| | 1,000 | | | American International Group | | | | | | | | | 54,580 | |
| | | | | |
| | 850 | | | Hartford Financial Services Group, Inc. | | | | | | | | | 30,438 | |
| | | | | |
| | 500 | | | Swiss Re AG | | | | | | | | | 44,486 | |
| | | | | |
| | 800 | | | Unum Group | | | | | | | | | 27,808 | |
| | | | Total Insurance | | | | | | | | | 157,312 | |
| | | | | |
| | | | Media – 10.8% | | | | | | | | | | |
| | | | | |
| | 2,500 | | | Interpublic Group of Companies, Inc., (3) | | | | | | | | | 48,775 | |
| | | | | |
| | 800 | | | National CineMedia, Inc. | | | | | | | | | 14,008 | |
| | | | | |
| | 375 | | | ProSiebenSat.1 Media AG | | | | | | | | | 16,706 | |
| | | | | |
| | 150 | | | RTL Group SA | | | | | | | | | 16,711 | |
| | | | | |
| | 750 | | | Time Warner Inc. | | | | | | | | | 52,688 | |
| | | | | |
| | 400 | | | Viacom Inc., Class B | | | | | | | | | 34,692 | |
| | | | Total Media | | | | | | | | | 183,580 | |
| | | | | |
| | | | Metals & Mining – 0.4% | | | | | | | | | | |
| | | | | |
| | 1,400 | | | AuRico Gold Inc. | | | | | | | | | 5,964 | |
| | | | | |
| | | | Oil, Gas & Consumable Fuels – 7.4% | | | | | | | | | | |
| | | | | |
| | 400 | | | Phillips 66 | | | | | | | | | 32,172 | |
| | | | | |
| | 900 | | | Royal Dutch Shell PLC, Class A, ADR | | | | | | | | | 37,251 | |
| | | | | |
| | 500 | | | Suncor Energy, Inc. | | | | | | | | | 21,315 | |
| | | | | |
| | 475 | | | Total SA, Sponsored ADR | | | | | | | | | 34,329 | |
| | | | Total Oil, Gas & Consumable Fuels | | | | | | | | | 125,067 | |
| | | | | |
| | | | Pharmaceuticals – 16.7% | | | | | | | | | | |
| | | | | |
| | 650 | | | AbbVie Inc. | | | | | | | | | 36,686 | |
| | | | | |
| | 350 | | | AstraZeneca PLC | | | | | | | | | 26,009 | |
| | | | | |
| | 1,700 | | | GlaxoSmithKline PLC, Sponsored ADR | | | | | | | | | 45,503 | |
Nuveen NWQ Global Equity Income Fund (continued)
Portfolio of Investments June 30, 2014
| | | | | | | | | | | | | | | | | | |
| Shares | | | Description (1) | | | | | | | | | | Value | |
| | | | | |
| | | | Pharmaceuticals (continued) | | | | | | | | | | | | | | |
| | | | | |
| | 1,800 | | | Pfizer Inc. | | | | | | | | | | | | $ | 53,424 | |
| | | | | |
| | 115 | | | Roche Holdings AG, Sponsored ADR | | | | | | | | | | | | | 34,300 | |
| | | | | |
| | 325 | | | Sanofi-Synthelabo, SA | | | | | | | | | | | | | 34,525 | |
| | | | | |
| | 700 | | | Teva Pharmaceutical Industries Limited, ADR | | | | | | | | | | | | | 37,004 | |
| | | | | |
| | 300 | | | Teva Pharmaceutical Industries Limited, Sponsored ADR | | | | | | | | | | | | | 15,726 | |
| | | | Total Pharmaceuticals | | | | | | | | | | | | | 283,177 | |
| | | | | |
| | | | Real Estate Investment Trust – 2.1% | | | | | | | | | | | | | | |
| | | | | |
| | 1,000 | | | PennyMac Mortgage Investment Trust | | | | | | | | | | | | | 21,940 | |
| | | | | |
| | 700 | | | Redwood Trust Inc. | | | | | | | | | | | | | 13,629 | |
| | | | Total Real Estate Investment Trust | | | | | | | | | | | | | 35,569 | |
| | | | | |
| | | | Semiconductors & Equipment – 3.5% | | | | | | | | | | | | | | |
| | | | | |
| | 475 | | | Analog Devices, Inc. | | | | | | | | | | | | | 25,683 | |
| | | | | |
| | 700 | | | Microchip Technology Incorporated | | | | | | | | | | | | | 34,167 | |
| | | | Total Semiconductors & Equipment | | | | | | | | | | | | | 59,850 | |
| | | | | |
| | | | Software – 3.8% | | | | | | | | | | | | | | |
| | | | | |
| | 1,050 | | | Microsoft Corporation | | | | | | | | | | | | | 43,785 | |
| | | | | |
| | 500 | | | Oracle Corporation | | | | | | | | | | | | | 20,265 | |
| | | | Total Software | | | | | | | | | | | | | 64,050 | |
| | | | | |
| | | | Tobacco – 0.5% | | | | | | | | | | | | | | |
| | | | | |
| | 100 | | | Philip Morris International | | | | | | | | | | | | | 8,431 | |
| | | | | |
| | | | Wireless Telecommunication Services – 1.9% | | | | | | | | | | | | | | |
| | | | | |
| | 9,900 | | | Vodafone Group PLC | | | | | | | | | | | | | 33,039 | |
| | | | Total Common Stocks (cost $1,342,235) | | | | | | | | | | | | | 1,683,623 | |
| | | | | |
| Shares | | | Description (1) | | Coupon | | | | | Ratings (4) | | | Value | |
| | | | | |
| | | | CONVERTIBLE PREFERRED SECURITIES – 0.7% | | | | | | | | | | | | | | |
| | | | | |
| | | | Diversified Telecommunication Services – 0.7% | | | | | | | | | | | | | | |
| | | | | |
| | 250 | | | IntelSat SA | | | 5.750 | % | | | | | N/R | | | $ | 12,728 | |
| | | | Total Convertible Preferred Securities (cost $14,438) | | | | | | | | | | | | | 12,728 | |
| | | | | |
| Shares | | | Description (1) | | Coupon | | | | | Ratings (4) | | | Value | |
| | | | | |
| | | | $25 PAR (OR SIMILAR) RETAIL PREFERRED – 0.9% | | | | | | | | | | | | | | |
| | | | | |
| | | | Banks – 0.9% | | | | | | | | | | | | | | |
| | | | | |
| | 625 | | | Texas Capital Bancshares | | | 6.500 | % | | | | | BB+ | | | $ | 15,131 | |
| | | | Total $25 Par (or similar) Retail Preferred (cost $13,589) | | | | | | | | | | | | | 15,131 | |
| | | | | | | | | | | | | | | | | | | | |
| | | | | |
| Shares | | | Description (1) | | Coupon | | | Maturity | | | Ratings (4) | | | Value | |
| | | | | |
| | | | $1,000 PAR (OR SIMILAR) INSTITUTIONAL PREFERRED – 0.7% | | | | | | | | | | | | | | | | |
| | | | | |
| | | | Banks – 0.7% | | | | | | | | | | | | | | | | |
| | | | | |
| | 12,000 | | | JPMorgan Chase & Company | | | 6.000 | % | | | 8/01/64 | | | | BBB | | | $ | 12,240 | |
| | | | Total $1,000 Par (or similar) Institutional Preferred (cost $12,000) | | | | | | | | | | | | | | | 12,240 | |
| | | | Total Long-Term Investments (cost $1,382,262) | | | | | | | | | | | | | | | 1,723,722 | |
| | | | Other Assets Less Liabilities – (1.5)% (5) | | | | | | | | | | | | | | | (25,960 | ) |
| | | | Net Assets – 100% | | | | | | | | | | | | | | $ | 1,697,762 | |
Investments in Derivatives as of June 30, 2014
Options Written outstanding:
| | | | | | | | | | | | | | | | | | | | |
Number of
Contracts | | | Description | | Notional
Amount (6) | | | Expiration
Date | | | Strike
Price | | | Value (5) | |
| | | | | |
| | (3 | ) | | Interpublic Group of Companies, Inc. | | $ | (6,000 | ) | | | 7/19/14 | | | $ | 20.0 | | | $ | (158 | ) |
| | | | | |
| | (5 | ) | | Norwegian Cruise Line Holdings Limited | | | (17,500 | ) | | | 9/20/14 | | | | 35.0 | | | | (200 | ) |
| | (8 | ) | | Total Options Written (premiums received $737) | | $ | (23,500 | ) | | | | | | | | | | $ | (358 | ) |
| | For Fund portfolio compliance purposes, the Fund’s industry classifications refer to any one or more of the industry sub-classifications used by one or more widely recognized market indexes or ratings group indexes, and/or as defined by Fund management. This definition may not apply for purposes of this report, which may combine industry sub-classifications into sectors for reporting ease. |
| (1) | All percentages shown in the Portfolio of Investments are based on net assets. |
| (2) | Non-income producing; issuer has not declared a dividend within the past twelve months. |
| (3) | Investments, or portion of investment, has been pledged as collateral for options written during and/or as of the end of the reporting period. |
| (4) | Ratings (not covered by the report of independent registered public accounting firm): Using the highest of Standard & Poor’s Group (“Standard & Poor’s”), Moody’s Investors Service, Inc. (“Moody’s”) or Fitch, Inc. (“Fitch”) rating. Ratings below BBB by Standard & Poor’s, Baa by Moody’s or BBB by Fitch are considered to be below investment grade. Holdings designated N/R are not rated by any of these national rating agencies. |
| (5) | Other Assets Less Liabilities includes the Value of derivative instruments as listed within Investments in Derivatives as of the end of the reporting period. |
| (6) | For disclosure purposes, Notional Amount is calculated by multiplying the Number of Contracts by the Strike Price by 100. |
| ADR | American Depositary Receipt. |
See accompanying notes to financial statements.
Nuveen NWQ Multi-Cap Value Fund
Portfolio of Investments June 30, 2014
| | | | | | | | | | | | | | |
| Shares | | | Description (1) | | | | | | | | Value | |
| | | | | |
| | | | LONG-TERM INVESTMENTS – 99.8% | | | | | | | | | | |
| | | | | |
| | | | COMMON STOCKS – 99.8% | | | | | | | | | | |
| | | | | |
| | | | Automobiles – 4.5% | | | | | | | | | | |
| | | | | |
| | 135,600 | | | Ford Motor Company | | | | | | | | $ | 2,337,744 | |
| | | | | |
| | 141,300 | | | General Motors Company | | | | | | | | | 5,129,190 | |
| | | | Total Automobiles | | | | | | | | | 7,466,934 | |
| | | | | |
| | | | Banks – 6.4% | | | | | | | | | | |
| | | | | |
| | 127,200 | | | Citigroup Inc. | | | | | | | | | 5,991,120 | |
| | | | | |
| | 60,000 | | | JPMorgan Chase & Co. | | | | | | | | | 3,457,200 | |
| | | | | |
| | 40,450 | | | Privatebancorp, Inc. | | | | | | | | | 1,175,477 | |
| | | | Total Banks | | | | | | | | | 10,623,797 | |
| | | | | |
| | | | Capital Markets – 2.4% | | | | | | | | | | |
| | | | | |
| | 147,600 | | | FBR Capital Markets Corporation, (2) | | | | | | | | | 4,004,388 | |
| | | | | |
| | | | Containers & Packaging – 1.5% | | | | | | | | | | |
| | | | | |
| | 49,500 | | | Avery Dennison Corporation | | | | | | | | | 2,536,875 | |
| | | | | |
| | | | Diversified Telecommunication Services – 1.3% | | | | | | | | | | |
| | | | | |
| | 58,050 | | | CenturyLink Inc. | | | | | | | | | 2,101,410 | |
| | | | | |
| | | | Electric Utilities – 1.5% | | | | | | | | | | |
| | | | | |
| | 67,500 | | | NRG Energy Inc. | | | | | | | | | 2,511,000 | |
| | | | | |
| | | | Energy Equipment & Services – 3.9% | | | | | | | | | | |
| | | | | |
| | 283,000 | | | Key Energy Services Inc., (2) | | | | | | | | | 2,586,620 | |
| | | | | |
| | 478,600 | | | McDermott International Inc., (2) | | | | | | | | | 3,871,874 | |
| | | | Total Energy Equipment & Services | | | | | | | | | 6,458,494 | |
| | | | | |
| | | | Food Products – 1.7% | | | | | | | | | | |
| | | | | |
| | 316,000 | | | Orkla ASA | | | | | | | | | 2,840,840 | |
| | | | | |
| | | | Hotels, Restaurants & Leisure – 4.2% | | | | | | | | | | |
| | | | | |
| | 145,000 | | | International Game Technology | | | | | | | | | 2,306,950 | |
| | | | | |
| | 148,500 | | | Norwegian Cruise Line Holdings Limited, (2) | | | | | | | | | 4,707,450 | |
| | | | Total Hotels, Restaurants & Leisure | | | | | | | | | 7,014,400 | |
| | | | | |
| | | | Insurance – 17.0% | | | | | | | | | | |
| | | | | |
| | 120,700 | | | American International Group, Inc. | | | | | | | | | 6,587,806 | |
| | | | | |
| | 52,900 | | | AON PLC | | | | | | | | | 4,765,761 | |
| | | | | |
| | 159,100 | | | Hartford Financial Services Group, Inc. | | | | | | | | | 5,697,371 | |
| | | | | |
| | 64,400 | | | Loews Corporation | | | | | | | | | 2,834,244 | |
| | | | | |
| | 43,037 | | | Reinsurance Group of America Inc. | | | | | | | | | 3,395,619 | |
| | | | | |
| | 144,300 | | | Unum Group | | | | | | | | | 5,015,868 | |
| | | | Total Insurance | | | | | | | | | 28,296,669 | |
| | | | | | | | | | | | | | |
| Shares | | | Description (1) | | | | | | | | Value | |
| | | | | |
| | | | IT Services – 2.0% | | | | | | | | | | |
| | | | | |
| | 91,300 | | | VeriFone Holdings Inc., (2) | | | | | | | | $ | 3,355,275 | |
| | | | | |
| | | | Life Sciences Tools & Services – 2.2% | | | | | | | | | | |
| | | | | |
| | 30,200 | | | Bio-Rad Laboratories Inc., (2) | | | | | | | | | 3,615,242 | |
| | | | | |
| | | | Machinery – 3.4% | | | | | | | | | | |
| | | | | |
| | 49,400 | | | Ingersoll Rand Company Limited, Class A | | | | | | | | | 3,087,994 | |
| | | | | |
| | 39,600 | | | PACCAR Inc. | | | | | | | | | 2,488,068 | |
| | | | Total Machinery | | | | | | | | | 5,576,062 | |
| | | | | |
| | | | Media – 5.2% | | | | | | | | | | |
| | | | | |
| | 260,600 | | | Interpublic Group of Companies, Inc. | | | | | | | | | 5,084,306 | |
| | | | | |
| | 40,697 | | | Viacom Inc., Class B | | | | | | | | | 3,529,651 | |
| | | | Total Media | | | | | | | | | 8,613,957 | |
| | | | | |
| | | | Metals & Mining – 0.9% | | | | | | | | | | |
| | | | | |
| | 91,099 | | | AngloGold Ashanti Limited, Sponsored ADR, (2) | | | | | | | | | 1,567,814 | |
| | | | | |
| | | | Multi-Utilities – 1.8% | | | | | | | | | | |
| | | | | |
| | 50,600 | | | Target Corporation | | | | | | | | | 2,932,270 | |
| | | | | |
| | | | Oil, Gas & Consumable Fuels – 13.3% | | | | | | | | | | |
| | | | | |
| | 52,800 | | | Apache Corporation | | | | | | | | | 5,312,736 | |
| | | | | |
| | 66,400 | | | Canadian Natural Resources Limited | | | | | | | | | 3,048,424 | |
| | | | | |
| | 142,300 | | | Denbury Resources Inc. | | | | | | | | | 2,626,858 | |
| | | | | |
| | 27,500 | | | Occidental Petroleum Corporation | | | | | | | | | 2,822,325 | |
| | | | | |
| | 535,100 | | | Talisman Energy Inc. | | | | | | | | | 5,672,060 | |
| | | | | |
| | 45,200 | | | Tesoro Corporation | | | | | | | | | 2,651,884 | |
| | | | Total Oil, Gas & Consumable Fuels | | | | | | | | | 22,134,287 | |
| | | | | |
| | | | Personal Products – 1.3% | | | | | | | | | | |
| | | | | |
| | 146,850 | | | Avon Products, Inc. | | | | | | | | | 2,145,478 | |
| | | | | |
| | | | Pharmaceuticals – 9.0% | | | | | | | | | | |
| | | | | |
| | 65,900 | | | Impax Laboratories Inc., (2) | | | | | | | | | 1,976,341 | |
| | | | | |
| | 147,000 | | | Pfizer Inc. | | | | | | | | | 4,362,960 | |
| | | | | |
| | 54,500 | | | Sanofi-Aventis | | | | | | | | | 2,897,765 | |
| | | | | |
| | 108,900 | | | Teva Pharmaceutical Industries Limited, Sponsored ADR | | | | | | | | | 5,708,538 | |
| | | | Total Pharmaceuticals | | | | | | | | | 14,945,604 | |
| | | | | |
| | | | Real Estate Investment Trust – 2.4% | | | | | | | | | | |
| | | | | |
| | 110,700 | | | PennyMac Mortgage Investment Trust | | | | | | | | | 2,428,758 | |
| | | | | |
| | 79,500 | | | Redwood Trust Inc. | | | | | | | | | 1,547,865 | |
| | | | Total Real Estate Investment Trust | | | | | | | | | 3,976,623 | |
| | | | | |
| | | | Semiconductors & Equipment – 3.8% | | | | | | | | | | |
| | | | | |
| | 53,700 | | | MKS Instruments Inc. | | | | | | | | | 1,677,588 | |
Nuveen NWQ Multi-Cap Value Fund (continued)
Portfolio of Investments June 30, 2014
| | | | | | | | | | | | | | | | | | |
| Shares | | | Description (1) | | | | | | | | | | Value | |
| | | | | |
| | | | Semiconductors & Equipment (continued) | | | | | | | | | | | | | | |
| | | | | |
| | 241,100 | | | Teradyne Inc. | | | | | | | | | | | | $ | 4,725,560 | |
| | | | Total Semiconductors & Equipment | | | | | | | | | | | | | 6,403,148 | |
| | | | | |
| | | | Software – 8.6% | | | | | | | | | | | | | | |
| | | | | |
| | 146,177 | | | CA Inc. | | | | | | | | | | | | | 4,201,127 | |
| | | | | |
| | 134,250 | | | Microsoft Corporation | | | | | | | | | | | | | 5,598,225 | |
| | | | | |
| | 110,000 | | | Oracle Corporation | | | | | | | | | | | | | 4,458,300 | |
| | | | Total Software | | | | | | | | | | | | | 14,257,652 | |
| | | | | |
| | | | Specialty Retail – 1.5% | | | | | | | | | | | | | | |
| | | | | |
| | 142,500 | | | Express Inc., (2) | | | | | | | | | | | | | 2,426,775 | |
| | | | Total Long-Term Investments (cost $123,659,269) | | | | | | | | | | | | | 165,804,994 | |
| | | | | |
Pricipal
Amount (000) | | | Description (1) | | Coupon | | | Maturity | | | | | Value | |
| | | | | |
| | | | SHORT-TERM INVESTMENTS – 0.2% | | | | | | | | | | | | | | |
| | | | | |
| $ | 430 | | | Repurchase Agreement with Fixed Income Clearing Corporation, dated 6/30/14,
repurchase price $429,804, collateralized by $445,000 U.S.
Treasury Notes, 1.375%, due 5/31/20, value $443,056 | | | 0.000 | % | | | 7/01/14 | | | | | $ | 429,804 | |
| | | | Total Short-Term Investments (cost $429,804) | | | | | | | | | | | | | 429,804 | |
| | | | Total Investments (cost $124,089,073) – 100.0% | | | | | | | | | | | | | 166,234,798 | |
| | | | Other Assets Less Liabilities – (0.0)% | | | | | | | | | | | | | (61,955 | ) |
| | | | Net Assets – 100% | | | | | | | | | | | | $ | 166,172,843 | |
| | For Fund portfolio compliance purposes, the Fund’s industry classifications refer to any one or more of the industry sub-classifications used by one or more widely recognized market indexes or ratings group indexes, and/or as defined by Fund management. This definition may not apply for purposes of this report, which may combine industry sub-classifications into sectors for reporting ease. |
| (1) | All percentages shown in the Portfolio of Investments are based on net assets. |
| (2) | Non-income producing; issuer has not declared a dividend within the past twelve months. |
| ADR | American Depositary Receipt. |
See accompanying notes to financial statements.
Nuveen NWQ Large-Cap Value Fund
Portfolio of Investments June 30, 2014
| | | | | | | | | | | | | | |
| Shares | | | Description (1) | | | | | | | | Value | |
| | | | | |
| | | | LONG-TERM INVESTMENTS – 97.8% | | | | | | | | | | |
| | | | | |
| | | | COMMON STOCKS – 97.8% | | | | | | | | | | |
| | | | | |
| | | | Aerospace & Defense – 1.4% | | | | | | | | | | |
| | | | | |
| | 108,330 | | | Raytheon Company | | | | | | | | $ | 9,993,442 | |
| | | | | |
| | | | Automobiles – 4.9% | | | | | | | | | | |
| | | | | |
| | 719,000 | | | Ford Motor Company | | | | | | | | | 12,395,560 | |
| | | | | |
| | 626,900 | | | General Motors Company | | | | | | | | | 22,756,470 | |
| | | | Total Automobiles | | | | | | | | | 35,152,030 | |
| | | | | |
| | | | Banks – 9.7% | | | | | | | | | | |
| | | | | |
| | 604,420 | | | Citigroup Inc. | | | | | | | | | 28,468,182 | |
| | | | | |
| | 377,220 | | | JPMorgan Chase & Co. | | | | | | | | | 21,735,416 | |
| | | | | |
| | 375,430 | | | Wells Fargo & Company | | | | | | | | | 19,732,601 | |
| | | | Total Banks | | | | | | | | | 69,936,199 | |
| | | | | |
| | | | Capital Markets – 1.7% | | | | | | | | | | |
| | | | | |
| | 75,000 | | | Goldman Sachs Group, Inc. | | | | | | | | | 12,558,000 | |
| | | | | |
| | | | Chemicals – 1.6% | | | | | | | | | | |
| | | | | |
| | 124,510 | | | Agrium Inc. | | | | | | | | | 11,408,851 | |
| | | | | |
| | | | Communication Equipment – 1.7% | | | | | | | | | | |
| | | | | |
| | 498,100 | | | Cisco Systems, Inc. | | | | | | | | | 12,377,785 | |
| | | | | |
| | | | Consumer Finance – 2.2% | | | | | | | | | | |
| | | | | |
| | 188,430 | | | Capital One Financial Corporation | | | | | | | | | 15,564,318 | |
| | | | | |
| | | | Diversified Telecommunication Services – 1.4% | | | | | | | | | | |
| | | | | |
| | 279,000 | | | CenturyLink Inc. | | | | | | | | | 10,099,800 | |
| | | | | |
| | | | Electric Utilities – 1.4% | | | | | | | | | | |
| | | | | |
| | 278,250 | | | NRG Energy Inc. | | | | | | | | | 10,350,900 | |
| | | | | |
| | | | Energy Equipment & Services – 1.6% | | | | | | | | | | |
| | | | | |
| | 151,000 | | | Baker Hughes Incorporated | | | | | | | | | 11,241,950 | |
| | | | | |
| | | | Food & Staples Retailing – 1.9% | | | | | | | | | | |
| | | | | |
| | 185,000 | | | CVS Caremark Corporation | | | | | | | | | 13,943,450 | |
| | | | | |
| | | | Hotels, Restaurants & Leisure – 2.2% | | | | | | | | | | |
| | | | | |
| | 500,198 | | | Norwegian Cruise Line Holdings Limited, (2) | | | | | | | | | 15,856,277 | |
| | | | | |
| | | | Insurance – 16.8% | | | | | | | | | | |
| | | | | |
| | 495,215 | | | American International Group, Inc. | | | | | | | | | 27,028,835 | |
| | | | | |
| | 207,273 | | | AON PLC | | | | | | | | | 18,673,224 | |
| | | | | |
| | 686,310 | | | Hartford Financial Services Group, Inc. | | | | | | | | | 24,576,761 | |
| | | | | |
| | 247,031 | | | Loews Corporation | | | | | | | | | 10,871,834 | |
Nuveen NWQ Large-Cap Value Fund (continued)
Portfolio of Investments June 30, 2014
| | | | | | | | | | | | | | |
| Shares | | | Description (1) | | | | | | | | Value | |
| | | | | |
| | | | Insurance (continued) | | | | | | | | | | |
| | | | | |
| | 340,280 | | | MetLife, Inc. | | | | | | | | $ | 18,905,957 | |
| | | | | |
| | 610,380 | | | Unum Group | | | | | | | | | 21,216,809 | |
| | | | Total Insurance | | | | | | | | | 121,273,420 | |
| | | | | |
| | | | Machinery – 3.2% | | | | | | | | | | |
| | | | | |
| | 202,670 | | | Ingersoll Rand Company Limited, Class A | | | | | | | | | 12,668,902 | |
| | | | | |
| | 167,000 | | | PACCAR Inc. | | | | | | | | | 10,492,610 | |
| | | | Total Machinery | | | | | | | | | 23,161,512 | |
| | | | | |
| | | | Media – 7.4% | | | | | | | | | | |
| | | | | |
| | 956,890 | | | Interpublic Group of Companies, Inc. | | | | | | | | | 18,668,924 | |
| | | | | |
| | 289,800 | | | Time Warner Inc. | | | | | | | | | 20,358,450 | |
| | | | | |
| | 167,220 | | | Viacom Inc., Class B | | | | | | | | | 14,502,990 | |
| | | | Total Media | | | | | | | | | 53,530,364 | |
| | | | | |
| | | | Metals & Mining – 1.1% | | | | | | | | | | |
| | | | | |
| | 448,051 | | | AngloGold Ashanti Limited, Sponsored ADR, (2) | | | | | | | | | 7,710,958 | |
| | | | | |
| | | | Multi-Utilities – 1.8% | | | | | | | | | | |
| | | | | |
| | 218,800 | | | Target Corporation | | | | | | | | | 12,679,460 | |
| | | | | |
| | | | Oil, Gas & Consumable Fuels – 14.3% | | | | | | | | | | |
| | | | | |
| | 228,830 | | | Apache Corporation | | | | | | | | | 23,024,875 | |
| | | | | |
| | 373,950 | | | Canadian Natural Resources Limited | | | | | | | | | 17,168,044 | |
| | | | | |
| | 208,795 | | | Occidental Petroleum Corporation | | | | | | | | | 21,428,631 | |
| | | | | |
| | 109,000 | | | Phillips 66 | | | | | | | | | 8,766,870 | |
| | | | | |
| | 2,288,970 | | | Talisman Energy Inc. | | | | | | | | | 24,263,082 | |
| | | | | |
| | 144,000 | | | Tesoro Corporation | | | | | | | | | 8,448,480 | |
| | | | Total Oil, Gas & Consumable Fuels | | | | | | | | | 103,099,982 | |
| | | | | |
| | | | Personal Products – 1.6% | | | | | | | | | | |
| | | | | |
| | 773,300 | | | Avon Products, Inc. | | | | | | | | | 11,297,913 | |
| | | | | |
| | | | Pharmaceuticals – 7.3% | | | | | | | | | | |
| | | | | |
| | 505,000 | | | Pfizer Inc. | | | | | | | | | 14,988,400 | |
| | | | | |
| | 229,700 | | | Sanofi-Aventis | | | | | | | | | 12,213,149 | |
| | | | | |
| | 490,430 | | | Teva Pharmaceutical Industries Limited, Sponsored ADR | | | | | | | | | 25,708,341 | |
| | | | Total Pharmaceuticals | | | | | | | | | 52,909,890 | |
| | | | | |
| | | | Road & Rail – 1.5% | | | | | | | | | | |
| | | | | |
| | 107,080 | | | Union Pacific Corporation | | | | | | | | | 10,681,230 | |
| | | | | |
| | | | Semiconductors & Equipment – 1.4% | | | | | | | | | | |
| | | | | |
| | 495,966 | | | Teradyne Inc. | | | | | | | | | 9,720,934 | |
| | | | | |
| | | | Software – 8.7% | | | | | | | | | | |
| | | | | |
| | 687,265 | | | CA Inc. | | | | | | | | | 19,751,996 | |
| | | | | |
| | 578,610 | | | Microsoft Corporation | | | | | | | | | 24,128,037 | |
| | | | | | | | | | | | | | | | | | |
| Shares | | | Description (1) | | | | | | | | | | Value | |
| | | | | |
| | | | Software (continued) | | | | | | | | | | | | | | |
| | | | | |
| | 465,000 | | | Oracle Corporation | | | | | | | | | | | | $ | 18,846,450 | |
| | | | Total Software | | | | | | | | | | | | | 62,726,483 | |
| | | | | |
| | | | Tobacco – 1.0% | | | | | | | | | | | | | | |
| | | | | |
| | 82,220 | | | Philip Morris International | | | | | | | | | | | | | 6,931,968 | |
| | | | Total Long-Term Investments (cost $476,325,119) | | | | | | | | | | | | | 704,207,116 | |
| | | | | |
Pricipal
Amount (000) | | | Description (1) | | Coupon | | | Maturity | | | | | Value | |
| | | | | |
| | | | SHORT-TERM INVESTMENTS – 1.5% | | | | | | | | | | | | | | |
| | | | | |
| $ | 10,994 | | | Repurchase Agreement with Fixed Income Clearing Corporation, dated 6/30/14,
repurchase price $10,994,065, collateralized by $10,680,000 U.S.
Treasury Notes, 2.625%, due 8/15/20, value $11,214,000 | | | 0.000 | % | | | 7/01/14 | | | | | $ | 10,994,065 | |
| | | | Total Short-Term Investments (cost $10,994,065) | | | | | | | | | | | | | 10,994,065 | |
| | | | Total Investments (cost $487,319,184) – 99.3% | | | | | | | | | | | | | 715,201,181 | |
| | | | Other Assets Less Liabilities – 0.7% | | | | | | | | | | | | | 5,348,396 | |
| | | | Net Assets – 100% | | | | | | | | | | | | $ | 720,549,577 | |
| | For Fund portfolio compliance purposes, the Fund’s industry classifications refer to any one or more of the industry sub-classifications used by one or more widely recognized market indexes or ratings group indexes, and/or as defined by Fund management. This definition may not apply for purposes of this report, which may combine industry sub-classifications into sectors for reporting ease. |
| (1) | All percentages shown in the Portfolio of Investments are based on net assets. |
| (2) | Non-income producing; issuer has not declared a dividend within the past twelve months. |
| ADR | American Depositary Receipt. |
See accompanying notes to financial statements.
Nuveen NWQ Small/Mid-Cap Value Fund
Portfolio of Investments June 30, 2014
| | | | | | | | | | | | | | |
| Shares | | | Description (1) | | | | | | | | Value | |
| | | | | |
| | | | LONG-TERM INVESTMENTS – 97.6% | | | | | | | | | | |
| | | | | |
| | | | COMMON STOCKS – 97.6% | | | | | | | | | | |
| | | | | |
| | | | Aerospace & Defense – 3.9% | | | | | | | | | | |
| | | | | |
| | 19,029 | | | Astronics Corporation, (2) | | | | | | | | $ | 1,074,187 | |
| | | | | |
| | 51,400 | | | Orbital Sciences Corporation, (2) | | | | | | | | | 1,518,870 | |
| | | | Total Aerospace & Defense | | | | | | | | | 2,593,057 | |
| | | | | |
| | | | Banks – 5.8% | | | | | | | | | | |
| | | | | |
| | 26,405 | | | Privatebancorp, Inc. | | | | | | | | | 767,329 | |
| | | | | |
| | 26,500 | | | Texas Capital BancShares, Inc., (2) | | | | | | | | | 1,429,675 | |
| | | | | |
| | 69,635 | | | Western Alliance Bancorporation, (2) | | | | | | | | | 1,657,313 | |
| | | | Total Banks | | | | | | | | | 3,854,317 | |
| | | | | |
| | | | Building Products – 1.1% | | | | | | | | | | |
| | | | | |
| | 58,973 | | | Griffon Corporation | | | | | | | | | 731,265 | |
| | | | | |
| | | | Communication Equipment – 3.1% | | | | | | | | | | |
| | | | | |
| | 87,475 | | | JDS Uniphase Corporation, (2) | | | | | | | | | 1,090,813 | |
| | | | | |
| | 89,170 | | | Mitel Networks Corporation, (2) | | | | | | | | | 939,852 | |
| | | | Total Communication Equipment | | | | | | | | | 2,030,665 | |
| | | | | |
| | | | Containers & Packaging – 2.0% | | | | | | | | | | |
| | | | | |
| | 26,115 | | | Avery Dennison Corporation | | | | | | | | | 1,338,394 | |
| | | | | |
| | | | Electrical Equipment – 1.0% | | | | | | | | | | |
| | | | | |
| | 9,390 | | | EnerSys | | | | | | | | | 645,938 | |
| | | | | |
| | | | Electronic Equipment & Instruments – 3.3% | | | | | | | | | | |
| | | | | |
| | 33,330 | | | Coherent Inc., (2) | | | | | | | | | 2,205,446 | |
| | | | | |
| | | | Energy Equipment & Services – 3.7% | | | | | | | | | | |
| | | | | |
| | 112,300 | | | Key Energy Services Inc., (2) | | | | | | | | | 1,026,422 | |
| | | | | |
| | 178,635 | | | McDermott International Inc., (2) | | | | | | | | | 1,445,157 | |
| | | | Total Energy Equipment & Services | | | | | | | | | 2,471,579 | |
| | | | | |
| | | | Food Products – 4.9% | | | | | | | | | | |
| | | | | |
| | 284,825 | | | Orkla ASA | | | | | | | | | 2,560,577 | |
| | | | | |
| | 8,538 | | | Treehouse Foods Inc., (2) | | | | | | | | | 683,637 | |
| | | | Total Food Products | | | | | | | | | 3,244,214 | |
| | | | | |
| | | | Gas Utilities – 1.0% | | | | | | | | | | |
| | | | | |
| | 13,900 | | | Laclede Group Inc. | | | | | | | | | 674,845 | |
| | | | | |
| | | | Hotels, Restaurants & Leisure – 1.5% | | | | | | | | | | |
| | | | | |
| | 13,555 | | | Bob Evans Farms | | | | | | | | | 678,428 | |
| | | | | |
| | 13,225 | | | Texas Roadhouse, Inc. | | | | | | | | | 343,850 | |
| | | | Total Hotels, Restaurants & Leisure | | | | | | | | | 1,022,278 | |
| | | | | | | | | | | | | | |
| Shares | | | Description (1) | | | | | | | | Value | |
| | | | | |
| | | | Household Durables – 2.0% | | | | | | | | | | |
| | | | | |
| | 12,225 | | | Harman International Industries Inc. | | | | | | | | $ | 1,313,332 | |
| | | | | |
| | | | Insurance – 7.9% | | | | | | | | | | |
| | | | | |
| | 41,825 | | | Axis Capital Holdings Limited | | | | | | | | | 1,852,011 | |
| | | | | |
| | 7,175 | | | PartnerRe Limited | | | | | | | | | 783,582 | |
| | | | | |
| | 32,835 | | | Reinsurance Group of America Inc. | | | | | | | | | 2,590,681 | |
| | | | Total Insurance | | | | | | | | | 5,226,274 | |
| | | | | |
| | | | IT Services – 3.4% | | | | | | | | | | |
| | | | | |
| | 21,875 | | | Euronet Worldwide, Inc., (2) | | | | | | | | | 1,055,250 | |
| | | | | |
| | 33,700 | | | VeriFone Holdings Inc., (2) | | | | | | | | | 1,238,475 | |
| | | | Total IT Services | | | | | | | | | 2,293,725 | |
| | | | | |
| | | | Life Sciences Tools & Services – 5.7% | | | | | | | | | | |
| | | | | |
| | 15,700 | | | Bio-Rad Laboratories Inc., (2) | | | | | | | | | 1,879,447 | |
| | | | | |
| | 78,165 | | | Bruker Biosciences Corporation, (2) | | | | | | | | | 1,897,065 | |
| | | | Total Life Sciences Tools & Services | | | | | | | | | 3,776,512 | |
| | | | | |
| | | | Machinery – 4.9% | | | | | | | | | | |
| | | | | |
| | 9,500 | | | Actuant Corporation | | | | | | | | | 328,415 | |
| | | | | |
| | 33,400 | | | Albany International Corporation, Class A | | | | | | | | | 1,267,864 | |
| | | | | |
| | 32,420 | | | Woodward Governor Company | | | | | | | | | 1,626,836 | |
| | | | Total Machinery | | | | | | | | | 3,223,115 | |
| | | | | |
| | | | Oil, Gas & Consumable Fuels – 3.8% | | | | | | | | | | |
| | | | | |
| | 10,590 | | | Carrizo Oil & Gas, Inc., (2) | | | | | | | | | 733,463 | |
| | | | | |
| | 42,500 | | | Comstock Resources Inc. | | | | | | | | | 1,225,700 | |
| | | | | |
| | 31,900 | | | Denbury Resources Inc. | | | | | | | | | 588,874 | |
| | | | Total Oil, Gas & Consumable Fuels | | | | | | | | | 2,548,037 | |
| | | | | |
| | | | Paper & Forest Products – 10.0% | | | | | | | | | | |
| | | | | |
| | 34,549 | | | Clearwater Paper Corporation, (2) | | | | | | | | | 2,132,364 | |
| | | | | |
| | 17,900 | | | Deltic Timber Corporation | | | | | | | | | 1,081,518 | |
| | | | | |
| | 70,205 | | | Glatfelter | | | | | | | | | 1,862,539 | |
| | | | | |
| | 102,715 | | | Louisiana-Pacific Corporation, (2) | | | | | | | | | 1,542,779 | |
| | | | Total Paper & Forest Products | | | | | | | | | 6,619,200 | |
| | | | | |
| | | | Personal Products – 4.5% | | | | | | | | | | |
| | | | | |
| | 80,055 | | | Elizabeth Arden, Inc., (2) | | | | | | | | | 1,714,778 | |
| | | | | |
| | 43,405 | | | Inter Parfums, Inc. | | | | | | | | | 1,282,618 | |
| | | | Total Personal Products | | | | | | | | | 2,997,396 | |
| | | | | |
| | | | Pharmaceuticals – 2.8% | | | | | | | | | | |
| | | | | |
| | 12,575 | | | Jazz Pharmaceuticals, Inc., (2) | | | | | | | | | 1,848,651 | |
| | | | | |
| | | | Real Estate Management & Development – 3.9% | | | | | | | | | | |
| | | | | |
| | 134,720 | | | Forestar Real Estate Group Inc., (2) | | | | | | | | | 2,571,805 | |
Nuveen NWQ Small/Mid-Cap Value Fund (continued)
Portfolio of Investments June 30, 2014
| | | | | | | | | | | | | | | | | | |
| Shares | | | Description (1) | | | | | | | | | | Value | |
| | | | | |
| | | | Semiconductors & Equipment – 16.0% | | | | | | | | | | | | | | |
| | | | | |
| | 92,910 | | | International Rectifier Corporation, (2) | | | | | | | | | | | | $ | 2,592,189 | |
| | | | | |
| | 105,320 | | | Microsemi Corporation, (2) | | | | | | | | | | | | | 2,818,363 | |
| | | | | |
| | 27,300 | | | MKS Instruments Inc. | | | | | | | | | | | | | 852,852 | |
| | | | | |
| | 111,130 | | | Rambus Inc., (2) | | | | | | | | | | | | | 1,589,159 | |
| | | | | |
| | 139,470 | | | Teradyne Inc. | | | | | | | | | | | | | 2,733,612 | |
| | | | Total Semiconductors & Equipment | | | | | | | | | | | | | 10,586,175 | |
| | | | | |
| | | | Trading Companies & Distributors – 1.4% | | | | | | | | | | | | | | |
| | | | | |
| | 11,120 | | | WESCO International Inc., (2) | | | | | | | | | | | | | 960,546 | |
| | | | Total Long-Term Investments (cost $50,937,361) | | | | | | | | | | | | | 64,776,766 | |
| | | | | |
Pricipal
Amount (000) | | | Description (1) | | Coupon | | | Maturity | | | | | Value | |
| | | | | |
| | | | SHORT-TERM INVESTMENTS – 2.1% | | | | | | | | | | | | | | |
| | | | | |
| $ | 1,365 | | | Repurchase Agreement with Fixed Income Clearing Corporation, dated 6/30/14,
repurchase price $1,365,340, collateralized by $1,330,000 U.S.
Treasury Notes, 2.625%, due 8/15/20, value $1,396,500 | | | 0.000 | % | | | 7/01/14 | | | | | $ | 1,365,340 | |
| | | | Total Short-Term Investments (cost $1,365,340) | | | | | | | | | | | | | 1,365,340 | |
| | | | Total Investments (cost $52,302,701) – 99.7% | | | | | | | | | | | | | 66,142,106 | |
| | | | Other Assets Less Liabilities – 0.3% | | | | | | | | | | | | | 191,975 | |
| | | | Net Assets – 100% | | | | | | | | | | | | $ | 66,334,081 | |
| | For Fund portfolio compliance purposes, the Fund’s industry classifications refer to any one or more of the industry sub-classifications used by one or more widely recognized market indexes or ratings group indexes, and/or as defined by Fund management. This definition may not apply for purposes of this report, which may combine industry sub-classifications into sectors for reporting ease. |
| (1) | All percentages shown in the Portfolio of Investments are based on net assets. |
| (2) | Non-income producing; issuer has not declared a dividend within the past twelve months. |
See accompanying notes to financial statements.
Nuveen NWQ Small-Cap Value Fund
Portfolio of Investments June 30, 2014
| | | | | | | | | | | | | | |
| Shares | | | Description (1) | | | | | | | | Value | |
| | | | | |
| | | | LONG-TERM INVESTMENTS – 93.0% | | | | | | | | | | |
| | | | | |
| | | | COMMON STOCKS – 93.0% | | | | | | | | | | |
| | | | | |
| | | | Aerospace & Defense – 7.2% | | | | | | | | | | |
| | | | | |
| | 146,768 | | | Astronics Corporation, (2) | | | | | | | | $ | 8,285,054 | |
| | | | | |
| | 68,785 | | | Esterline Technologies Corporation, (2) | | | | | | | | | 7,918,529 | |
| | | | | |
| | 249,255 | | | Orbital Sciences Corporation, (2) | | | | | | | | | 7,365,485 | |
| | | | Total Aerospace & Defense | | | | | | | | | 23,569,068 | |
| | | | | |
| | | | Auto Components – 1.4% | | | | | | | | | | |
| | | | | |
| | 442,170 | | | Stoneridge Inc., (2) | | | | | | | | | 4,740,062 | |
| | | | | |
| | | | Banks – 7.3% | | | | | | | | | | |
| | | | | |
| | 141,915 | | | Pacwest Bancorp | | | | | | | | | 6,126,471 | |
| | | | | |
| | 139,350 | | | Privatebancorp, Inc. | | | | | | | | | 4,049,511 | |
| | | | | |
| | 127,153 | | | Texas Capital BancShares, Inc., (2) | | | | | | | | | 6,859,904 | |
| | | | | |
| | 294,975 | | | Western Alliance Bancorporation, (2) | | | | | | | | | 7,020,405 | |
| | | | Total Banks | | | | | | | | | 24,056,291 | |
| | | | | |
| | | | Building Products – 1.0% | | | | | | | | | | |
| | | | | |
| | 274,626 | | | Griffon Corporation | | | | | | | | | 3,405,362 | |
| | | | | |
| | | | Communication Equipment – 1.4% | | | | | | | | | | |
| | | | | |
| | 425,860 | | | Mitel Networks Corporation, (2) | | | | | | | | | 4,488,564 | |
| | | | | |
| | | | Electrical Equipment – 0.9% | | | | | | | | | | |
| | | | | |
| | 41,475 | | | EnerSys | | | | | | | | | 2,853,065 | |
| | | | | |
| | | | Electronic Equipment & Instruments – 7.8% | | | | | | | | | | |
| | | | | |
| | 161,971 | | | Coherent Inc., (2) | | | | | | | | | 10,717,621 | |
| | | | | |
| | 630,625 | | | GSI Group, Inc., (2) | | | | | | | | | 8,027,856 | |
| | | | | |
| | 37,815 | | | Measurement Specialties, Inc., (2) | | | | | | | | | 3,254,737 | |
| | | | | |
| | 95,851 | | | Methode Electronics, Inc. | | | | | | | | | 3,662,467 | |
| | | | Total Electronic Equipment & Instruments | | | | | | | | | 25,662,681 | |
| | | | | |
| | | | Energy Equipment & Services – 3.6% | | | | | | | | | | |
| | | | | |
| | 549,400 | | | Key Energy Services Inc., (2) | | | | | | | | | 5,021,516 | |
| | | | | |
| | 846,035 | | | McDermott International Inc., (2) | | | | | | | | | 6,844,423 | |
| | | | Total Energy Equipment & Services | | | | | | | | | 11,865,939 | |
| | | | | |
| | | | Food Products – 1.0% | | | | | | | | | | |
| | | | | |
| | 39,890 | | | Treehouse Foods Inc., (2) | | | | | | | | | 3,193,992 | |
| | | | | |
| | | | Gas Utilities – 1.0% | | | | | | | | | | |
| | | | | |
| | 66,745 | | | Laclede Group Inc. | | | | | | | | | 3,240,470 | |
Nuveen NWQ Small-Cap Value Fund (continued)
Portfolio of Investments June 30, 2014
| | | | | | | | | | | | | | |
| Shares | | | Description (1) | | | | | | | | Value | |
| | | | | |
| | | | Health Care Equipment & Supplies – 2.1% | | | | | | | | | | |
| | | | | |
| | 87,900 | | | Analogic Corporation | | | | | | | | $ | 6,877,296 | |
| | | | | |
| | | | Hotels, Restaurants & Leisure – 1.0% | | | | | | | | | | |
| | | | | |
| | 63,837 | | | Bob Evans Farms | | | | | | | | | 3,195,042 | |
| | | | | |
| | | | Household Durables – 4.0% | | | | | | | | | | |
| | | | | |
| | 60,550 | | | Harman International Industries Inc. | | | | | | | | | 6,504,887 | |
| | | | | |
| | 402,229 | | | Hooker Furniture Corporation | | | | | | | | | 6,491,976 | |
| | | | Total Household Durables | | | | | | | | | 12,996,863 | |
| | | | | |
| | | | IT Services – 1.5% | | | | | | | | | | |
| | | | | |
| | 102,146 | | | Euronet Worldwide, Inc., (2) | | | | | | | | | 4,927,523 | |
| | | | | |
| | | | Machinery – 2.6% | | | | | | | | | | |
| | | | | |
| | 228,425 | | | Albany International Corporation, Class A | | | | | | | | | 8,671,013 | |
| | | | | |
| | | | Metals & Mining – 0.6% | | | | | | | | | | |
| | | | | |
| | 50,790 | | | Materion Corporation | | | | | | | | | 1,878,722 | |
| | | | | |
| | | | Oil, Gas & Consumable Fuels – 2.9% | | | | | | | | | | |
| | | | | |
| | 49,795 | | | Carrizo Oil & Gas, Inc., (2) | | | | | | | | | 3,448,802 | |
| | | | | |
| | 211,810 | | | Comstock Resources Inc. | | | | | | | | | 6,108,600 | |
| | | | Total Oil, Gas & Consumable Fuels | | | | | | | | | 9,557,402 | |
| | | | | |
| | | | Paper & Forest Products – 8.5% | | | | | | | | | | |
| | | | | |
| | 245,850 | | | Boise Cascade Company, (2) | | | | | | | | | 7,041,144 | |
| | | | | |
| | 85,750 | | | Deltic Timber Corporation | | | | | | | | | 5,181,015 | |
| | | | | |
| | 288,355 | | | Glatfelter | | | | | | | | | 7,650,058 | |
| | | | | |
| | 150,607 | | | Neenah Paper, Inc. | | | | | | | | | 8,004,762 | |
| | | | Total Paper & Forest Products | | | | | | | | | 27,876,979 | |
| | | | | |
| | | | Personal Products – 4.5% | | | | | | | | | | |
| | | | | |
| | 389,795 | | | Elizabeth Arden, Inc., (2) | | | | | | | | | 8,349,409 | |
| | | | | |
| | 211,309 | | | Inter Parfums, Inc. | | | | | | | | | 6,244,181 | |
| | | | Total Personal Products | | | | | | | | | 14,593,590 | |
| | | | | |
| | | | Pharmaceuticals – 3.4% | | | | | | | | | | |
| | | | | |
| | 151,407 | | | Impax Laboratories Inc., (2) | | | | | | | | | 4,540,696 | |
| | | | | |
| | 248,915 | | | Sagent Pharmaceuticals Inc., (2) | | | | | | | | | 6,436,942 | |
| | | | Total Pharmaceuticals | | | | | | | | | 10,977,638 | |
| | | | | |
| | | | Professional Services – 3.1% | | | | | | | | | | |
| | | | | |
| | 397,454 | | | GP Strategies Corporation, (2) | | | | | | | | | 10,286,110 | |
| | | | | |
| | | | Real Estate Management & Development – 3.8% | | | | | | | | | | |
| | | | | |
| | 647,970 | | | Forestar Real Estate Group Inc., (2) | | | | | | | | | 12,369,747 | |
| | | | | |
| | | | Road & Rail – 2.7% | | | | | | | | | | |
| | | | | |
| | 391,413 | | | Marten Transport, Ltd. | | | | | | | | | 8,748,081 | |
| | | | | | | | | | | | | | | | | | |
| Shares | | | Description (1) | | | | | | | | | | Value | |
| | | | | |
| | | | Semiconductors & Equipment – 17.4% | | | | | | | | | | | | | | |
| | | | | |
| | 545,670 | | | Entegris Inc., (2) | | | | | | | | | | | | $ | 7,500,234 | |
| | | | | |
| | 642,290 | | | Integrated Device Technology, Inc., (2) | | | | | | | | | | | | | 9,929,803 | |
| | | | | |
| | 441,094 | | | International Rectifier Corporation, (2) | | | | | | | | | | | | | 12,306,523 | |
| | | | | |
| | 1,162,990 | | | Lattice Semiconductor Corporation, (2) | | | | | | | | | | | | | 9,594,668 | |
| | | | | |
| | 504,250 | | | Microsemi Corporation, (2) | | | | | | | | | | | | | 13,493,730 | |
| | | | | |
| | 137,370 | | | MKS Instruments Inc. | | | | | | | | | | | | | 4,291,439 | |
| | | | Total Semiconductors & Equipment | | | | | | | | | | | | | 57,116,397 | |
| | | | | |
| | | | Specialty Retail – 2.1% | | | | | | | | | | | | | | |
| | | | | |
| | 402,695 | | | Express Inc., (2) | | | | | | | | | | | | | 6,857,896 | |
| | | | | |
| | | | Thrifts & Mortgage Finance – 0.2% | | | | | | | | | | | | | | |
| | | | | |
| | 44,070 | | | HomeStreet Inc. | | | | | | | | | | | | | 809,566 | |
| | | | Total Long-Term Investments (cost $234,817,394) | | | | | | | | | | | | | 304,815,359 | |
| | | | | |
Pricipal
Amount (000) | | | Description (1) | | Coupon | | | Maturity | | | | | Value | |
| | | | | |
| | | | SHORT-TERM INVESTMENTS – 6.4% | | | | | | | | | | | | | | |
| | | | | |
| $ | 21,081 | | | Repurchase Agreement with Fixed Income Clearing Corporation, dated 6/30/14,
repurchase price $21,081,242, collateralized by $22,085,000 U.S.
Treasury Notes, 1.375%, due 5/31/20, value $21,505,269 | | | 0.000 | % | | | 7/01/14 | | | | | $ | 21,081,242 | |
| | | | Total Short-Term Investments (cost $21,081,242) | | | | | | | | | | | | | 21,081,242 | |
| | | | Total Investments (cost $255,898,636) – 99.4% | | | | | | | | | | | | | 325,896,601 | |
| | | | Other Assets Less Liabilities – 0.6% | | | | | | | | | | | | | 1,909,182 | |
| | | | Net Assets – 100% | | | | | | | | | | | | $ | 327,805,783 | |
| | For Fund portfolio compliance purposes, the Fund’s industry classifications refer to any one or more of the industry sub-classifications used by one or more widely recognized market indexes or ratings group indexes, and/or as defined by Fund management. This definition may not apply for purposes of this report, which may combine industry sub-classifications into sectors for reporting ease. |
| (1) | All percentages shown in the Portfolio of Investments are based on net assets. |
| (2) | Non-income producing; issuer has not declared a dividend within the past twelve months. |
See accompanying notes to financial statements.
Nuveen Tradewinds Value Opportunities Fund
Portfolio of Investments June 30, 2014
| | | | | | | | | | | | | | |
| Shares | | | Description (1) | | | | | | | | Value | |
| | | | | |
| | | | LONG-TERM INVESTMENTS – 97.0% | | | | | | | | | | |
| | | | | |
| | | | COMMON STOCKS – 97.0% | | | | | | | | | | |
| | | | | |
| | | | Aerospace & Defense – 1.8% | | | | | | | | | | |
| | | | | |
| | 129,727 | | | Triumph Group Inc. | | | | | | | | $ | 9,057,539 | |
| | | | | |
| | | | Automobiles – 4.0% | | | | | | | | | | |
| | | | | |
| | 542,731 | | | General Motors Company | | | | | | | | | 19,701,135 | |
| | | | | |
| | | | Banks – 3.5% | | | | | | | | | | |
| | | | | |
| | 149,307 | | | HSBC Holdings PLC, Sponsored ADR | | | | | | | | | 7,584,795 | |
| | | | | |
| | 2,183,337 | | | Sumitomo Mitsui Trust Holdings, Sponsored ADR, (3) | | | | | | | | | 9,846,850 | |
| | | | Total Banks | | | | | | | | | 17,431,645 | |
| | | | | |
| | | | Capital Markets – 1.5% | | | | | | | | | | |
| | | | | |
| | 406,317 | | | UBS AG | | | | | | | | | 7,443,727 | |
| | | | | |
| | | | Chemicals – 3.0% | | | | | | | | | | |
| | | | | |
| | 161,086 | | | Agrium Inc. | | | | | | | | | 14,760,310 | |
| | | | | |
| | | | Communication Equipment – 2.0% | | | | | | | | | | |
| | | | | |
| | 401,049 | | | Cisco Systems, Inc. | | | | | | | | | 9,966,068 | |
| | | | | |
| | | | Computers & Peripherals – 1.5% | | | | | | | | | | |
| | | | | |
| | 81,948 | | | Western Digital Corporation | | | | | | | | | 7,563,800 | |
| | | | | |
| | | | Construction & Engineering – 0.9% | | | | | | | | | | |
| | | | | |
| | 190,400 | | | KBR Inc. | | | | | | | | | 4,541,040 | |
| | | | | |
| | | | Consumer Finance – 2.4% | | | | | | | | | | |
| | | | | |
| | 504,778 | | | Ally Financial Inc., (2) | | | | | | | | | 12,069,242 | |
| | | | | |
| | | | Diversified Telecommunication Services – 1.9% | | | | | | | | | | |
| | | | | |
| | 263,784 | | | CenturyLink Inc. | | | | | | | | | 9,548,981 | |
| | | | | |
| | | | Electric Utilities – 5.6% | | | | | | | | | | |
| | | | | |
| | 651,044 | | | AES Corporation | | | | | | | | | 10,123,734 | |
| | | | | |
| | 202,959 | | | Exelon Corporation | | | | | | | | | 7,403,944 | |
| | | | | |
| | 292,662 | | | FirstEnergy Corp. | | | | | | | | | 10,161,225 | |
| | | | Total Electric Utilities | | | | | | | | | 27,688,903 | |
| | | | | |
| | | | Electronic Equipment & Instruments – 3.5% | | | | | | | | | | |
| | | | | |
| | 350,395 | | | Ingram Micro, Inc., Class A., (2) | | | | | | | | | 10,235,038 | |
| | | | | |
| | 114,152 | | | Tech Data Corporation, (2) | | | | | | | | | 7,136,783 | |
| | | | Total Electronic Equipment & Instruments | | | | | | | | | 17,371,821 | |
| | | | | |
| | | | Energy Equipment & Services – 1.4% | | | | | | | | | | |
| | | | | |
| | 136,998 | | | Diamond Offshore Drilling, Inc. | | | | | | | | | 6,799,211 | |
| | | | | | | | | | | | | | |
| Shares | | | Description (1) | | | | | | | | Value | |
| | | | | |
| | | | Food Products – 9.1% | | | | | | | | | | |
| | | | | |
| | 222,296 | | | Archer-Daniels-Midland Company | | | | | | | | $ | 9,805,476 | |
| | | | | |
| | 115,295 | | | Bunge Limited | | | | | | | | | 8,720,914 | |
| | | | | |
| | 487,361 | | | Dean Foods Company | | | | | | | | | 8,572,680 | |
| | | | | |
| | 247,812 | | | Fresh Del Monte Produce Inc. | | | | | | | | | 7,595,438 | |
| | | | | |
| | 134,228 | | | Ingredion Inc. | | | | | | | | | 10,072,469 | |
| | | | Total Food Products | | | | | | | | | 44,766,977 | |
| | | | | |
| | | | Health Care Providers & Services – 3.0% | | | | | | | | | | |
| | | | | |
| | 184,551 | | | Aetna Inc. | | | | | | | | | 14,963,395 | |
| | | | | |
| | | | Insurance – 13.6% | | | | | | | | | | |
| | | | | |
| | 599,379 | | | Aegon N.V., ADR | | | | | | | | | 5,256,554 | |
| | | | | |
| | 117,492 | | | Ageas N.V., Sponsored ADR, (3) | | | | | | | | | 4,690,281 | |
| | | | | |
| | 185,324 | | | American International Group, Inc. | | | | | | | | | 10,114,984 | |
| | | | | |
| | 221,990 | | | Axis Capital Holdings Limited | | | | | | | | | 9,829,717 | |
| | | | | |
| | 182,984 | | | CNA Financial Corporation | | | | | | | | | 7,396,213 | |
| | | | | |
| | 192,427 | | | Endurance Specialty Holdings Limited | | | | | | | | | 9,927,309 | |
| | | | | |
| | 225,675 | | | Loews Corporation | | | | | | | | | 9,931,957 | |
| | | | | |
| | 841,039 | | | MS&AD Insurance Group Holdings Inc., Unsponsored ADR, (3) | | | | | | | | | 10,117,699 | |
| | | | Total Insurance | | | | | | | | | 67,264,714 | |
| | | | | |
| | | | Leisure Equipment & Products – 1.4% | | | | | | | | | | |
| | | | | |
| | 175,913 | | | Arctic Cat, Inc. | | | | | | | | | 6,934,490 | |
| | | | | |
| | | | Machinery – 3.4% | | | | | | | | | | |
| | | | | |
| | 187,794 | | | AGCO Corporation | | | | | | | | | 10,557,779 | |
| | | | | |
| | 672,456 | | | Vallourec SA, Sponsored ADR, (3) | | | | | | | | | 6,005,032 | |
| | | | Total Machinery | | | | | | | | | 16,562,811 | |
| | | | | |
| | | | Media – 6.9% | | | | | | | | | | |
| | | | | |
| | 688,756 | | | Interpublic Group of Companies, Inc. | | | | | | | | | 13,437,630 | |
| | | | | |
| | 434,637 | | | Time Inc., (2) | | | | | | | | | 10,526,908 | |
| | | | | |
| | 143,581 | | | Time Warner Inc. | | | | | | | | | 10,086,565 | |
| | | | Total Media | | | | | | | | | 34,051,103 | |
| | | | | |
| | | | Metals & Mining – 3.0% | | | | | | | | | | |
| | | | | |
| | 278,804 | | | Freeport-McMoRan Copper & Gold, Inc. | | | | | | | | | 10,176,346 | |
| | | | | |
| | 585,240 | | | Yamana Gold Inc. | | | | | | | | | 4,810,673 | |
| | | | Total Metals & Mining | | | | | | | | | 14,987,019 | |
| | | | | |
| | | | Oil, Gas & Consumable Fuels – 8.7% | | | | | | | | | | |
| | | | | |
| | 433,395 | | | Cabot Oil & Gas Corporation | | | | | | | | | 14,796,105 | |
| | | | | |
| | 114,881 | | | Royal Dutch Shell PLC, Class B, Sponsored ADR | | | | | | | | | 9,995,796 | |
| | | | | |
| | 1,248,398 | | | Talisman Energy Inc. | | | | | | | | | 13,233,019 | |
| | | | | |
| | 68,529 | | | Total SA, Sponsored ADR | | | | | | | | | 4,947,794 | |
| | | | Total Oil, Gas & Consumable Fuels | | | | | | | | | 42,972,714 | |
Nuveen Tradewinds Value Opportunities Fund (continued)
Portfolio of Investments June 30, 2014
| | | | | | | | | | | | | | | | | | |
| Shares | | | Description (1) | | | | | | | | | | Value | |
| | | | | |
| | | | Pharmaceuticals – 6.5% | | | | | | | | | | | | | | |
| | | | | |
| | 107,091 | | | Bayer AG, Sponsored ADR, (3) | | | | | | | | | | | | $ | 15,128,745 | |
| | | | | |
| | 164,961 | | | Merck & Co. Inc. | | | | | | | | | | | | | 9,542,995 | |
| | | | | |
| | 83,187 | | | Novartis AG, Sponsored ADR | | | | | | | | | | | | | 7,530,919 | |
| | | | Total Pharmaceuticals | | | | | | | | | | | | | 32,202,659 | |
| | | | | |
| | | | Road & Rail – 2.6% | | | | | | | | | | | | | | |
| | | | | |
| | 414,992 | | | CSX Corporation | | | | | | | | | | | | | 12,785,903 | |
| | | | | |
| | | | Software – 3.1% | | | | | | | | | | | | | | |
| | | | | |
| | 117,977 | | | Oracle Corporation | | | | | | | | | | | | | 4,781,608 | |
| | | | | |
| | 463,131 | | | Symantec Corporation | | | | | | | | | | | | | 10,605,700 | |
| | | | Total Software | | | | | | | | | | | | | 15,387,308 | |
| | | | | |
| | | | Specialty Retail – 2.7% | | | | | | | | | | | | | | |
| | | | | |
| | 169,504 | | | Best Buy Co., Inc. | | | | | | | | | | | | | 5,256,319 | |
| | | | | |
| | 234,525 | | | CST Brands Inc. | | | | | | | | | | | | | 8,091,113 | |
| | | | Total Specialty Retail | | | | | | | | | | | | | 13,347,432 | |
| | | | Total Long-Term Investments (cost $406,737,225) | | | | | | | | | | | | | 480,169,947 | |
| | | | | |
Pricipal
Amount (000) | | | Description (1) | | Coupon | | | Maturity | | | | | Value | |
| | | | | |
| | | | SHORT-TERM INVESTMENTS – 2.7% | | | | | | | | | | | | | | |
| | | | | |
| $ | 13,355 | | | Repurchase Agreement with Fixed Income Clearing Corporation, dated 6/30/14, repurchase price $13,354,669, collateralized by $12,975,000 U.S. Treasury Notes, 2.625%, due 8/15/20, value $13,623,750 | | | 0.000 | % | | | 7/01/14 | | | | | $ | 13,354,669 | |
| | | | Total Short-Term Investments (cost $13,354,669) | | | | | | | | | | | | | 13,354,669 | |
| | | | Total Investments (cost $420,091,894) – 99.7% | | | | | | | | | | | | | 493,524,616 | |
| | | | Other Assets Less Liabilities – 0.3% | | | | | | | | | | | | | 1,237,820 | |
| | | | Net Assets – 100% | | | | | | | | | | | | $ | 494,762,436 | |
| | For Fund portfolio compliance purposes, the Fund’s industry classifications refer to any one or more of the industry sub-classifications used by one or more widely recognized market indexes or ratings group indexes, and/or as defined by Fund management. This definition may not apply for purposes of this report, which may combine industry sub-classifications into sectors for reporting ease. |
| (1) | All percentages shown in the Portfolio of Investments are based on net assets. |
| (2) | Non-income producing; issuer has not declared a dividend within the past twelve months. |
| (3) | For fair value measurement disclosure purposes, Common Stocks classified as Level 2. See Notes to Financial Statements, Note 2 – Investment Valuation and Fair Value Measurements, Investment Valuation for more information. |
| ADR | American Depositary Receipt. |
See accompanying notes to financial statements.
Statement of
| | | | |
| | Assets and Liabilities | | June 30, 2014 |
| | | | | | | | | | | | | | | | | | | | | | | | | | | | |
| | | NWQ Global
Equity | | | NWQ Global
Equity Income | | | NWQ
Multi-Cap
Value | | | NWQ
Large-Cap
Value | | | NWQ
Small/Mid-Cap
Value | | | NWQ
Small-Cap
Value | | | Value
Opportunities | |
Assets | | | | | | | | | | | | | | | | | | | | | | | | | | | | |
Long-term investments, at value (cost $987,856, $1,382,262, $123,659,269, $476,325,119, $50,937,361, $234,817,394 and $406,737,225, respectively) | | $ | 1,018,365 | | | $ | 1,723,722 | | | $ | 165,804,994 | | | $ | 704,207,116 | | | $ | 64,776,766 | | | $ | 304,815,359 | | | $ | 480,169,947 | |
Short-term investments, at value (cost approximates value) | | | — | | | | — | | | | 429,804 | | | | 10,994,065 | | | | 1,365,340 | | | | 21,081,242 | | | | 13,354,669 | |
Cash | | | 20,273 | | | | 16,099 | | | | 30,702 | | | | 131,330 | | | | — | | | | — | | | | 71,627 | |
Receivable for: | | | | | | | | | | | | | | | | | | | | | | | | | | | | |
Dividends | | | 541 | | | | 2,765 | | | | 87,527 | | | | 647,908 | | | | 37,668 | | | | 120,061 | | | | 647,840 | |
From Advisor | | | 9,103 | | | | 2,929 | | | | — | | | | — | | | | — | | | | — | | | | — | |
Interest | | | — | | | | 300 | | | | — | | | | — | | | | — | | | | — | | | | — | |
Investments sold | | | 4,518 | | | | — | | | | 617,395 | | | | 3,281,612 | | | | 433,896 | | | | 5,146,327 | | | | 4,970,829 | |
Reclaims | | | 315 | | | | 657 | | | | — | | | | — | | | | — | | | | — | | | | 67,040 | |
Shares sold | | | — | | | | — | | | | 102,342 | | | | 3,270,602 | | | | 107,396 | | | | 1,770,109 | | | | 120,218 | |
Other assets | | | — | | | | — | | | | 57,448 | | | | 51,658 | | | | 24,191 | | | | 79,749 | | | | 102,703 | |
Total assets | | | 1,053,115 | | | | 1,746,472 | | | | 167,130,212 | | | | 722,584,291 | | | | 66,745,257 | | | | 333,012,847 | | | | 499,504,873 | |
Liabilities | | | | | | | | | | | | | | | | | | | | | | | | | | | | |
Options written, at value (premiums received $—, $737, $—, $—, $—, $— and $—, respectively) | | | — | | | | 358 | | | | — | | | | — | | | | — | | | | — | | | | — | |
Payable for: | | | | | | | | | | | | | | | | | | | | | | | | | | | | |
Dividends | | | — | | | | 14,474 | | | | — | | | | — | | | | — | | | | — | | | | — | |
Investments purchased | | | — | | | | — | | | | 416,997 | | | | — | | | | 290,130 | | | | 4,188,333 | | | | 2,848,518 | |
Shares redeemed | | | — | | | | — | | | | 215,132 | | | | 887,686 | | | | 5,584 | | | | 622,032 | | | | 991,375 | |
Accrued expenses: | | | | | | | | | | | | | | | | | | | | | | | | | | | | |
Custodian fees | | | 2,766 | | | | 5,447 | | | | 7,046 | | | | 36,291 | | | | 3,736 | | | | 7,819 | | | | 18,949 | |
Management fees | | | — | | | | — | | | | 124,691 | | | | 408,949 | | | | 58,259 | | | | 242,840 | | | | 329,937 | |
Professional fees | | | 12,229 | | | | 13,710 | | | | 13,242 | | | | 23,438 | | | | 12,971 | | | | 14,809 | | | | 19,918 | |
Shareholder reporting fees | | | 3,340 | | | | 13,148 | | | | 22,088 | | | | 144,995 | | | | 3,261 | | | | 21,336 | | | | 78,594 | |
Shareholder servicing agent fees | | | 164 | | | | 100 | | | | 60,435 | | | | 463,985 | | | | 18,802 | | | | 33,309 | | | | 219,387 | |
Trustees fees | | | 54 | | | | 10 | | | | 46,802 | | | | 40,192 | | | | 415 | | | | 1,572 | | | | 80,620 | |
12b-1 distribution and service fees | | | 52 | | | | 506 | | | | 49,501 | | | | 23,724 | | | | 4,858 | | | | 24,570 | | | | 152,327 | |
Other | | | 590 | | | | 957 | | | | 1,435 | | | | 5,454 | | | | 13,160 | | | | 50,444 | | | | 2,812 | |
Total liabilities | | | 19,195 | | | | 48,710 | | | | 957,369 | | | | 2,034,714 | | | | 411,176 | | | | 5,207,064 | | | | 4,742,437 | |
Net assets | | $ | 1,033,920 | | | $ | 1,697,762 | | | $ | 166,172,843 | | | $ | 720,549,577 | | | $ | 66,334,081 | | | $ | 327,805,783 | | | $ | 494,762,436 | |
Class A Shares | | | | | | | | | | | | | | | | | | | | | | | | | | | | |
Net assets | | $ | 51,672 | | | $ | 351,181 | | | $ | 47,369,307 | | | $ | 66,451,812 | | | $ | 8,881,630 | | | $ | 51,477,319 | | | $ | 225,212,108 | |
Shares outstanding | | | 2,500 | | | | 12,500 | | | | 1,756,450 | | | | 2,800,505 | | | | 296,295 | | | | 1,207,903 | | | | 5,793,069 | |
Net asset value (“NAV”) per share | | $ | 20.67 | | | $ | 28.09 | | | $ | 26.97 | | | $ | 23.73 | | | $ | 29.98 | | | $ | 42.62 | | | $ | 38.88 | |
Offering price per share (NAV per share plus maximum sales charge of 5.75% of offering price) | | $ | 21.93 | | | $ | 29.80 | | | $ | 28.62 | | | $ | 25.18 | | | $ | 31.81 | | | $ | 45.22 | | | $ | 41.25 | |
Class C Shares | | | | | | | | | | | | | | | | | | | | | | | | | | | | |
Net assets | | $ | 51,575 | | | $ | 350,915 | | | $ | 46,826,525 | | | $ | 11,857,145 | | | $ | 3,431,652 | | | $ | 18,003,951 | | | $ | 124,325,997 | |
Shares outstanding | | | 2,500 | | | | 12,500 | | | | 1,841,164 | | | | 515,237 | | | | 121,268 | | | | 450,310 | | | | 3,288,299 | |
NAV and offering price per share | | $ | 20.63 | | | $ | 28.07 | | | $ | 25.43 | | | $ | 23.01 | | | $ | 28.30 | | | $ | 39.98 | | | $ | 37.81 | |
Class R3 Shares(1) | | | | | | | | | | | | | | | | | | | | | | | | | | | | |
Net assets | | | — | | | $ | 351,089 | | | $ | 255,708 | | | $ | 63,585 | | | $ | 769,306 | | | $ | 2,631,843 | | | $ | 4,800,296 | |
Shares outstanding | | | — | | | | 12,500 | | | | 9,583 | | | | 2,689 | | | | 26,162 | | | | 62,099 | | | | 123,484 | |
NAV and offering price per share | | | — | | | $ | 28.09 | | | $ | 26.68 | | | $ | 23.64 | | | $ | 29.41 | | | $ | 42.38 | | | $ | 38.87 | |
Class R6 Shares | | | | | | | | | | | | | | | | | | | | | | | | | | | | |
Net assets | | | — | | | | — | | | | — | | | | — | | | | — | | | $ | 3,138,347 | | | | — | |
Shares outstanding | | | — | | | | — | | | | — | | | | — | | | | — | | | | 72,394 | | | | — | |
NAV and offering price per share | | | — | | | | — | | | | — | | | | — | | | | — | | | $ | 43.35 | | | | — | |
Class I Shares | | | | | | | | | | | | | | | | | | | | | | | | | | | | |
Net assets | | $ | 930,673 | | | $ | 644,577 | | | $ | 71,721,303 | | | $ | 642,177,035 | | | $ | 53,251,493 | | | $ | 252,554,323 | | | $ | 140,424,035 | |
Shares outstanding | | | 45,000 | | | | 22,937 | | | | 2,643,903 | | | | 27,015,405 | | | | 1,768,214 | | | | 5,834,773 | | | | 3,596,777 | |
NAV and offering price per share | | $ | 20.68 | | | $ | 28.10 | | | $ | 27.13 | | | $ | 23.77 | | | $ | 30.12 | | | $ | 43.28 | | | $ | 39.04 | |
Net assets consist of: | | | | | | | | | | | | | | | | | | | | | | | | | | | | |
Capital paid-in | | $ | 999,846 | | | $ | 1,274,983 | | | $ | 343,341,544 | | | $ | 404,094,459 | | | $ | 77,388,038 | | | $ | 275,409,995 | | | $ | 362,100,751 | |
Undistributed (Over-distribution of) net investment income | | | 5,600 | | | | 597 | | | | 756,707 | | | | 8,383,826 | | | | — | | | | — | | | | 3,304,913 | |
Accumulated net realized gain (loss) | | | (2,029 | ) | | | 80,307 | | | | (220,071,402 | ) | | | 80,188,050 | | | | (24,893,362 | ) | | | (17,602,177 | ) | | | 55,924,050 | |
Net unrealized appreciation (depreciation) | | | 30,503 | | | | 341,875 | | | | 42,145,994 | | | | 227,883,242 | | | | 13,839,405 | | | | 69,997,965 | | | | 73,432,722 | |
Net assets | | $ | 1,033,920 | | | $ | 1,697,762 | | | $ | 166,172,843 | | | $ | 720,549,577 | | | $ | 66,334,081 | | | $ | 327,805,783 | | | $ | 494,762,436 | |
Authorized shares – per class | | | Unlimited | | | | Unlimited | | | | Unlimited | | | | Unlimited | | | | Unlimited | | | | Unlimited | | | | Unlimited | |
Par value per share | | $ | .01 | | | $ | .01 | | | $ | .01 | | | $ | .01 | | | $ | .01 | | | $ | .01 | | | $ | .01 | |
| (1) | Class R3 Shares of NWQ Global Equity Income are not available for public offering. |
See accompanying notes to financial statements.
Statement of
| | | | |
| | Operations | | Year Ended June 30, 2014 |
| | | | | | | | | | | | | | | | | | | | | | | | | | | | |
| | | NWQ Global
Equity(1) | | | NWQ Global
Equity Income | | | NWQ
Multi-Cap
Value | | | NWQ
Large-Cap
Value | | | NWQ
Small/Mid-Cap
Value | | | NWQ
Small-Cap
Value | | | Value
Opportunities | |
Investment Income | | | | | | | | | | | | | | | | | | | | | | | | | | | | |
Dividends (net of foreign tax withheld of $926, $2,600, $105,096, $707,025, $30,019, $6,135 and $419,312, respectively) | | $ | 7,893 | | | $ | 55,522 | | | $ | 2,787,079 | | | $ | 26,771,680 | | | $ | 480,381 | | | $ | 1,335,876 | | | $ | 12,207,509 | |
Interest | | | 62 | | | | 664 | | | | 18 | | | | 596 | | | | 18 | | | | 95 | | | | 224 | |
Total investment income | | | 7,955 | | | | 56,186 | | | | 2,787,097 | | | | 26,772,276 | | | | 480,399 | | | | 1,335,971 | | | | 12,207,733 | |
Expenses | | | | | | | | | | | | | | | | | | | | | | | | | | | | |
Management fees | | | 2,032 | | | | 10,563 | | | | 1,276,328 | | | | 9,672,499 | | | | 445,941 | | | | 1,996,508 | | | | 4,219,136 | |
12b-1 service fees – Class A(2) | | | 31 | | | | 835 | | | | 145,088 | | | | 157,316 | | | | 18,176 | | | | 52,034 | | | | 622,551 | |
12b-1 distribution and service fees – Class C | | | 124 | | | | 3,334 | | | | 466,437 | | | | 100,899 | | | | 28,543 | | | | 98,141 | | | | 1,290,545 | |
12b-1 distribution and service fees – Class R3(3) | | | — | | | | 1,668 | | | | 1,200 | | | | 292 | | | | 2,813 | | | | 8,263 | | | | 22,999 | |
Shareholder servicing agent fees and expenses | | | 164 | | | | 346 | | | | 209,929 | | | | 1,230,787 | | | | 63,102 | | | | 206,042 | | | | 793,525 | |
Custodian fees and expenses | | | 4,485 | | | | 23,385 | | | | 37,740 | | | | 209,473 | | | | 20,609 | | | | 42,537 | | | | 120,869 | |
Trustees fees and expenses | | | 54 | | | | 51 | | | | 5,838 | | | | 55,686 | | | | 2,114 | | | | 7,571 | | | | 19,876 | |
Professional fees | | | 12,229 | | | | 14,355 | | | | 28,739 | | | | 147,003 | | | | 20,977 | | | | 45,451 | | | | 38,601 | |
Shareholder reporting expenses | | | 3,340 | | | | 15,631 | | | | 30,177 | | | | 229,506 | | | | 5,101 | | | | 36,091 | | | | 95,926 | |
Federal and state registration fees | | | 129 | | | | 36 | | | | 59,465 | | | | 104,431 | | | | 48,061 | | | | 81,454 | | | | 67,741 | |
Other expenses | | | 1,587 | | | | 2,888 | | | | 10,037 | | | | 49,483 | | | | 6,563 | | | | 11,164 | | | | 24,711 | |
Total expenses before fee
waiver/expense reimbursement | | | 24,175 | | | | 73,092 | | | | 2,270,978 | | | | 11,957,375 | | | | 662,000 | | | | 2,585,256 | | | | 7,316,480 | |
Fee waiver/expense reimbursement | | | (21,614 | ) | | | (54,116 | ) | | | — | | | | — | | | | — | | | | — | | | | — | |
Net expenses | | | 2,561 | | | | 18,976 | | | | 2,270,978 | | | | 11,957,375 | | | | 662,000 | | | | 2,585,256 | | | | 7,316,480 | |
Net investment income (loss) | | | 5,394 | | | | 37,210 | | | | 516,119 | | | | 14,814,901 | | | | (181,601 | ) | | | (1,249,285 | ) | | | 4,891,253 | |
Realized and Unrealized Gain (Loss) | | | | | | | | | | | | | | | | | | | | | | | | | | | | |
Net realized gain (loss) from: | | | | | | | | | | | | | | | | | | | | | | | | | | | | |
Investments and foreign currency | | | (1,977 | ) | | | 86,413 | | | | 22,145,683 | | | | 192,239,689 | | | | 6,025,578 | | | | 18,866,836 | | | | 95,512,047 | |
Options written | | | — | | | | 5,332 | | | | — | | | | — | | | | — | | | | — | | | | — | |
Change in net unrealized appreciation (depreciation) of: | | | | | | | | | | | | | | | | | | | | | | | | | | | | |
Investments and foreign currency | | | 30,503 | | | | 151,252 | | | | 7,663,231 | | | | 26,089,061 | | | | 5,232,114 | | | | 34,850,722 | | | | 9,465,788 | |
Options written | | | — | | | | 186 | | | | — | | | | — | | | | — | | | | — | | | | — | |
Net realized and unrealized gain (loss) | | | 28,526 | | | | 243,183 | | | | 29,808,914 | | | | 218,328,750 | | | | 11,257,692 | | | | 53,717,558 | | | | 104,977,835 | |
Net increase (decrease) in net assets from operations | | $ | 33,920 | | | $ | 280,393 | | | $ | 30,325,033 | | | $ | 233,143,651 | | | $ | 11,076,091 | | | $ | 52,468,273 | | | $ | 109,869,088 | |
| (1) | For the period April 1, 2014 (commencement of operations) through June 30, 2014. |
| (2) | Includes 12b-1 distribution and service fees incurred on NWQ Multi-Cap Value and Value Opportunities’ Class B Shares during the period. Class B Shares of NWQ Multi-Cap Value and Value Opportunities converted to Class A Shares at close of business on June 23, 2014. Class B Shares are no longer available through an exchange from other Nuveen mutual funds. |
| (3) | Class R3 Shares of Global Equity Income are not available for public offering. |
See accompanying notes to financial statements.
Statement of
| | | | | | | | | | | | | | | | |
| | | | | NWQ Global Equity | | | | | NWQ Global Equity Income | |
| | | | | For the Period
4/1/14
(commencement
of operations)
through 6/30/14 | | | | | Year Ended
6/30/14 | | | Year Ended
6/30/13 | |
Operations | | | | | | | | | | | | | | | | |
Net investment income (loss) | | | | $ | 5,394 | | | | | $ | 37,210 | | | $ | 15,959 | |
Net realized gain (loss) from: | | | | | | | | | | | | | | | | |
Investments and foreign currency | | | | | (1,977 | ) | | | | | 86,413 | | | | 6,580 | |
Options written | | | | | — | | | | | | 5,332 | | | | 8,893 | |
Change in net unrealized appreciation (depreciation) of: | | | | | | | | | | | | | | | | |
Investments and foreign currency | | | | | 30,503 | | | | | | 151,252 | | | | 180,930 | |
Options written | | | | | — | | | | | | 186 | | | | (838 | ) |
Net increase (decrease) in net assets from operations | | | | | 33,920 | | | | | | 280,393 | | | | 211,524 | |
Distributions to Shareholders | | | | | | | | | | | | | | | | |
From net investment income: | | | | | | | | | | | | | | | | |
Class A | | | | | — | | | | | | (8,394 | ) | | | (4,480 | ) |
Class B | | | | | — | | | | | | — | | | | — | |
Class C | | | | | — | | | | | | (5,883 | ) | | | (2,404 | ) |
Class R3(1) | | | | | — | | | | | | (7,558 | ) | | | (3,787 | ) |
Class R6 | | | | | — | | | | | | — | | | | — | |
Class I | | | | | — | | | | | | (14,730 | ) | | | (5,174 | ) |
From accumulated net realized gains: | | | | | | | | | | | | | | | | |
Class A | | | | | — | | | | | | (7,595 | ) | | | (475 | ) |
Class B | | | | | — | | | | | | — | | | | — | |
Class C | | | | | — | | | | | | (7,595 | ) | | | (475 | ) |
Class R3(1) | | | | | — | | | | | | (7,595 | ) | | | (475 | ) |
Class R6 | | | | | — | | | | | | — | | | | — | |
Class I | | | | | — | | | | | | (7,595 | ) | | | (475 | ) |
Decrease in net assets from distributions to shareholders | | | | | — | | | | | | (66,945 | ) | | | (17,745 | ) |
Fund Share Transactions | | | | | | | | | | | | | | | | |
Proceeds from sale of shares | | | | | 1,000,000 | | | | | | 275,000 | | | | — | |
Proceeds from shares issued to shareholders due to reinvestment of distributions | | | | | — | | | | | | 5,493 | | | | — | |
| | | | | 1,000,000 | | | | | | 280,493 | | | | — | |
Cost of shares redeemed | | | | | — | | | | | | — | | | | — | |
Net increase (decrease) in net assets from Fund share transactions | | | | | 1,000,000 | | | | | | 280,493 | | | | — | |
Net increase (decrease) in net assets | | | | | 1,033,920 | | | | | | 493,941 | | | | 193,779 | |
Net assets at the beginning of period | | | | | — | | | | | | 1,203,821 | | | | 1,010,042 | |
Net assets at the end of period | | | | $ | 1,033,920 | | | | | $ | 1,697,762 | | | $ | 1,203,821 | |
Undistributed (Over-distribution of) net investment income at the end of period | | | | $ | 5,600 | | | | | $ | 597 | | | $ | 324 | |
| (1) | Class R3 Shares of NWQ Global Equity Income are not available for public offering. |
See accompanying notes to financial statements.
Statement of Changes in Net Assets (continued)
| | | | | | | | | | | | | | | | | | |
| | | NWQ Multi-Cap Value | | | | | NWQ Large-Cap Value | |
| | | Year Ended
6/30/14 | | | Year Ended
6/30/13 | | | | | Year Ended
6/30/14 | | | Year Ended
6/30/13 | |
Operations | | | | | | | | | | | | | | | | | | |
Net investment income (loss) | | $ | 516,119 | | | $ | 632,718 | | | | | $ | 14,814,901 | | | $ | 13,471,351 | |
Net realized gain (loss) from: | | | | | | | | | | | | | | | | | | |
Investments and foreign currency | | | 22,145,683 | | | | 7,948,008 | | | | | | 192,239,689 | | | | (4,505,737 | ) |
Options written | | | — | | | | — | | | | | | — | | | | — | |
Change in net unrealized appreciation (depreciation) of: | | | | | | | | | | | | | | | | | | |
Investments and foreign currency | | | 7,663,231 | | | | 23,938,416 | | | | | | 26,089,061 | | | | 230,483,065 | |
Options written | | | — | | | | — | | | | | | — | | | | — | |
Net increase (decrease) in net assets from operations | | | 30,325,033 | | | | 32,519,142 | | | | | | 233,143,651 | | | | 239,448,679 | |
Distributions to Shareholders | | | | | | | | | | | | | | | | | | |
From net investment income: | | | | | | | | | | | | | | | | | | |
Class A | | | (156,230 | ) | | | (170,290 | ) | | | | | (449,919 | ) | | | (387,543 | ) |
Class B | | | — | | | | — | | | | | | — | | | | — | |
Class C | | | — | | | | — | | | | | | (1,884 | ) | | | (6,290 | ) |
Class R3 | | | (332 | ) | | | (314 | ) | | | | | (283 | ) | | | (343 | ) |
Class R6 | | | — | | | | — | | | | | | — | | | | — | |
Class I | | | (382,951 | ) | | | (427,097 | ) | | | | | (14,278,803 | ) | | | (11,584,222 | ) |
From accumulated net realized gains: | | | | | | | | | | | | | | | | | | |
Class A | | | — | | | | — | | | | | | (1,136,271 | ) | | | (134,102 | ) |
Class B | | | — | | | | — | | | | | | — | | | | — | |
Class C | | | — | | | | — | | | | | | (186,258 | ) | | | (19,357 | ) |
Class R3 | | | — | | | | — | | | | | | (1,059 | ) | | | (167 | ) |
Class R6 | | | — | | | | — | | | | | | — | | | | — | |
Class I | | | — | | | | — | | | | | | (27,219,216 | ) | | | (3,074,540 | ) |
Decrease in net assets from distributions to shareholders | | | (539,513 | ) | | | (597,701 | ) | | | | | (43,273,693 | ) | | | (15,206,564 | ) |
Fund Share Transactions | | | | | | | | | | | | | | | | | | |
Proceeds from sale of shares | | | 19,697,342 | | | | 12,011,285 | | | | | | 623,791,805 | | | | 416,689,288 | |
Proceeds from shares issued to shareholders due to reinvestment of distributions | | | 485,452 | | | | 577,258 | | | | | | 42,843,167 | | | | 14,754,149 | |
| | | 20,182,794 | | | | 12,588,543 | | | | | | 666,634,972 | | | | 431,443,437 | |
Cost of shares redeemed | | | (36,822,329 | ) | | | (61,630,783 | ) | | | | | (1,425,000,267 | ) | | | (474,938,667 | ) |
Net increase (decrease) in net assets from Fund share transactions | | | (16,639,535 | ) | | | (49,042,240 | ) | | | | | (758,365,295 | ) | | | (43,495,230 | ) |
Net increase (decrease) in net assets | | | 13,145,985 | | | | (17,120,799 | ) | | | | | (568,495,337 | ) | | | 180,746,885 | |
Net assets at the beginning of period | | | 153,026,858 | | | | 170,147,657 | | | | | | 1,289,044,914 | | | | 1,108,298,029 | |
Net assets at the end of period | | $ | 166,172,843 | | | $ | 153,026,858 | | | | | $ | 720,549,577 | | | $ | 1,289,044,914 | |
Undistributed (Over-distribution of) net investment income at the end of period | | $ | 756,707 | | | $ | 489,931 | | | | | $ | 8,383,826 | | | $ | 8,147,486 | |
See accompanying notes to financial statements.
| | | | | | | | | | | | | | | | | | |
| | | NWQ Small/Mid-Cap Value | | | | | NWQ Small-Cap Value | |
| | | Year Ended
6/30/14 | | | Year Ended
6/30/13 | | | | | Year Ended
6/30/14 | | | Year Ended
6/30/13 | |
Operations | | | | | | | | | | | | | | | | | | |
Net investment income (loss) | | $ | (181,601 | ) | | $ | (15,251 | ) | | | | $ | (1,249,285 | ) | | $ | (243,425 | ) |
Net realized gain (loss) from: | | | | | | | | | | | | | | | | | | |
Investments and foreign currency | | | 6,025,578 | | | | 1,012,300 | | | | | | 18,866,836 | | | | 7,450,963 | |
Options written | | | — | | | | — | | | | | | — | | | | — | |
Change in net unrealized appreciation (depreciation) of: | | | | | | | | | | | | | | | | | | |
Investments and foreign currency | | | 5,232,114 | | | | 6,199,035 | | | | | | 34,850,722 | | | | 23,838,808 | |
Options written | | | — | | | | — | | | | | | — | | | | — | |
Net increase (decrease) in net assets from operations | | | 11,076,091 | | | | 7,196,084 | | | | | | 52,468,273 | | | | 31,046,346 | |
Distributions to Shareholders | | | | | | | | | | | | | | | | | | |
From net investment income: | | | | | | | | | | | | | | | | | | |
Class A | | | — | | | | — | | | | | | — | | | | — | |
Class B | | | — | | | | — | | | | | | — | | | | — | |
Class C | | | — | | | | — | | | | | | — | | | | — | |
Class R3 | | | — | | | | — | | | | | | — | | | | — | |
Class R6 | | | — | | | | — | | | | | | — | | | | — | |
Class I | | | — | | | | — | | | | | | — | | | | — | |
From accumulated net realized gains: | | | | | | | | | | | | | | | | | | |
Class A | | | — | | | | — | | | | | | — | | | | — | |
Class B | | | — | | | | — | | | | | | — | | | | — | |
Class C | | | — | | | | — | | | | | | — | | | | — | |
Class R3 | | | — | | | | — | | | | | | — | | | | — | |
Class R6 | | | — | | | | — | | | | | | — | | | | — | |
Class I | | | — | | | | — | | | | | | — | | | | — | |
Decrease in net assets from distributions to shareholders | | | — | | | | — | | | | | | — | | | | — | |
Fund Share Transactions | | | | | | | | | | | | | | | | | | |
Proceeds from sale of shares | | | 30,466,188 | | | | 18,968,827 | | | | | | 178,774,306 | | | | 56,734,383 | |
Proceeds from shares issued to shareholders due to reinvestment of distributions | | | — | | | | — | | | | | | — | | | | — | |
| | | 30,466,188 | | | | 18,968,827 | | | | | | 178,774,306 | | | | 56,734,383 | |
Cost of shares redeemed | | | (14,160,973 | ) | | | (9,163,343 | ) | | | | | (58,870,293 | ) | | | (35,047,864 | ) |
Net increase (decrease) in net assets from Fund share transactions | | | 16,305,215 | | | | 9,805,484 | | | | | | 119,904,013 | | | | 21,686,519 | |
Net increase (decrease) in net assets | | | 27,381,306 | | | | 17,001,568 | | | | | | 172,372,286 | | | | 52,732,865 | |
Net assets at the beginning of period | | | 38,952,775 | | | | 21,951,207 | | | | | | 155,433,497 | | | | 102,700,632 | |
Net assets at the end of period | | $ | 66,334,081 | | | $ | 38,952,775 | | | | | $ | 327,805,783 | | | $ | 155,433,497 | |
Undistributed (Over-distribution of) net investment income at the end of period | | $ | — | | | $ | — | | | | | $ | — | | | $ | — | |
See accompanying notes to financial statements.
Statement of Changes in Net Assets (continued)
| | | | | | | | |
| | | Value Opportunities | |
| | | Year Ended
6/30/14 | | | Year Ended
6/30/13 | |
Operations | | | | | | | | |
Net investment income (loss) | | $ | 4,891,253 | | | $ | 3,950,570 | |
Net realized gain (loss) from: | | | | | | | | |
Investments and foreign currency | | | 95,512,047 | | | | 36,781,900 | |
Options written | | | — | | | | — | |
Change in net unrealized appreciation (depreciation) of: | | | | | | | | |
Investments and foreign currency | | | 9,465,788 | | | | 96,620,119 | |
Options written | | | — | | | | — | |
Net increase (decrease) in net assets from operations | | | 109,869,088 | | | | 137,352,589 | |
Distributions to Shareholders | | | | | | | | |
From net investment income: | | | | | | | | |
Class A(1) | | | (2,477,660 | ) | | | (11,825,093 | ) |
Class B | | | — | | | | (94,428 | ) |
Class C | | | (416,572 | ) | | | (4,580,445 | ) |
Class R3 | | | (36,335 | ) | | | (193,408 | ) |
Class R6 | | | — | | | | — | |
Class I | | | (2,165,005 | ) | | | (9,138,482 | ) |
From accumulated net realized gains: | | | | | | | | |
Class A(1) | | | (6,960,291 | ) | | | — | |
Class B | | | — | | | | — | |
Class C | | | (3,810,854 | ) | | | — | |
Class R3 | | | (130,445 | ) | | | — | |
Class R6 | | | — | | | | — | |
Class I | | | (4,910,679 | ) | | | — | |
Decrease in net assets from distributions to shareholders | | | (20,907,841 | ) | | | (25,831,856 | ) |
Fund Share Transactions | | | | | | | | |
Proceeds from sale of shares | | | 46,151,077 | | | | 59,664,619 | |
Proceeds from shares issued to shareholders due to reinvestment of distributions | | | 18,648,941 | | | | 22,528,176 | |
| | | 64,800,018 | | | | 82,192,795 | |
Cost of shares redeemed | | | (218,096,875 | ) | | | (762,560,972 | ) |
Net increase (decrease) in net assets from Fund share transactions | | | (153,296,857 | ) | | | (680,368,177 | ) |
Net increase (decrease) in net assets | | | (64,335,610 | ) | | | (568,847,444 | ) |
Net assets at the beginning of period | | | 559,098,046 | | | | 1,127,945,490 | |
Net assets at the end of period | | $ | 494,762,436 | | | $ | 559,098,046 | |
Undistributed (Over-distribution of) net investment income at the end of period | | $ | 3,304,913 | | | $ | 3,509,232 | |
| (1) | Includes distributions to shareholders of Value Opportunities’ Class B Shares during the period. Class B Shares of Value Opportunities converted to Class A Shares at close of business on June 23, 2014. Class B Shares are no longer available through an exchange from other Nuveen mutual funds. |
See accompanying notes to financial statements.
THIS PAGE INTENTIONALLY LEFT BLANK
Financial
Highlights
NWQ Global Equity Fund
Selected data for a share outstanding throughout each period:
| | | | | | | | | | | | | | | | | | | | | | | | | | | | | | | | | | |
| | | | | |
| | | | | | Investment Operations | | | | | Less Distributions | | | | |
| | | | | | | | | |
Class (Commencement Date) Year Ended June 30, | | Beginning
NAV | | | Net
Investment
Income
(Loss)(a) | | | Net
Realized/
Unrealized
Gain (Loss) | | | Total | | | | | From
Net
Investment
Income | | | From
Accumulated
Net Realized
Gains | | | Total | | | Ending
NAV | |
Class A (4/14) | | | | | | | | | | | | | | | | | | | | | | | | | | | | | | | | | | |
2014(d) | | $ | 20.00 | | | $ | 0.10 | | | $ | 0.57 | | | $ | 0.67 | | | | | $ | — | | | $ | — | | | $ | — | | | $ | 20.67 | |
Class C (4/14) | | | | | | | | | | | | | | | | | | | | | | | | | | | | | | | | | | |
2014(d) | | | 20.00 | | | | 0.06 | | | | 0.57 | | | | 0.63 | | | | | | — | | | | — | | | | — | | | | 20.63 | |
Class I (4/14) | | | | | | | | | | | | | | | | | | | | | | | | | | | | | | | | | | |
2014(d) | | | 20.00 | | | | 0.11 | | | | 0.57 | | | | 0.68 | | | | | | — | | | | — | | | | — | | | | 20.68 | |
| | | | | | | | | | | | | | | | | | | | | | | | | | | | | | |
| | | | Ratios/Supplemental Data | |
| | | | | | | | | Ratios to Average
Net Assets Before
Waiver/Reimbursement | | | | | Ratios to Average
Net Assets After
Waiver/Reimbursement(c) | | | | |
| | | | | | | | |
Total
Return(b) | | | Ending
Net
Assets
(000) | | | | | Expenses | | | Net
Investment
Income
(Loss) | | | | | Expenses | | | Net
Investment
Income
(Loss) | | | Portfolio
Turnover
Rate(e) | |
| | | | | | | | | | | | | | | | | | | | | | | | | | | | | | |
| | 3.35 | % | | $ | 52 | | | | | | 9.90 | %* | | | (6.70 | )%* | | | | | 1.22 | %* | | | 1.98 | %* | | | 11 | % |
| | | | | | | | | | | | | | | | | | | | | | | | | | | | | | |
| | 3.15 | | | | 52 | | | | | | 10.64 | * | | | (7.45 | )* | | | | | 1.97 | * | | | 1.22 | * | | | 11 | |
| | | | | | | | | | | | | | | | | | | | | | | | | | | | | | |
| | 3.40 | | | | 931 | | | | | | 9.64 | * | | | (6.45 | )* | | | | | .97 | * | | | 2.23 | * | | | 11 | |
| (a) | Per share Net Investment Income (Loss) is calculated using the average daily shares method. | |
| (b) | Total return is the combination of changes in NAV without any sales charge, reinvested dividend income at NAV and reinvested capital gains distributions at NAV, if any. Total returns are not annualized. | |
| (c) | After fee waiver and/or expense reimbursement from the Adviser, where applicable. | |
| (d) | For the period April 1, 2014 (commencement of operations) through June 30, 2014. | |
| (e) | Portfolio Turnover Rate is calculated based on the lesser of long-term purchases or sales (as disclosed in Note 5 – Investment Transactions) divided by the average long-term market value during the period. | |
See accompanying notes to financial statements.
Financial Highlights (continued)
NWQ Global Equity Income
Selected data for a share outstanding throughout each period:
| | | | | | | | | | | | | | | | | | | | | | | | | | | | | | | | | | |
| | | | | |
| | | | | | Investment Operations | | | | | Less Distributions | | | | |
| | | | | | | | | |
Class (Commencement Date) Year Ended June 30, | | Beginning
NAV | | | Net
Investment
Income
(Loss)(a) | | | Net
Realized/
Unrealized
Gain (Loss) | | | Total | | | | | From
Net
Investment
Income | | | From
Accumulated
Net Realized
Gains | | | Total | | | Ending
NAV | |
Class A (9/09) | | | | | | | | | | | | | | | | | | | | | | | | | | | | | | | | | | |
2014 | | $ | 24.08 | | | $ | 0.69 | | | $ | 4.60 | | | $ | 5.29 | | | | | $ | (0.67 | ) | | $ | (0.61 | ) | | $ | (1.28 | ) | | $ | 28.09 | |
2013 | | | 20.20 | | | | 0.36 | | | | 3.92 | | | | 4.28 | | | | | | (0.36 | ) | | | (0.04 | ) | | | (0.40 | ) | | | 24.08 | |
2012 | | | 23.57 | | | | 0.39 | | | | (1.40 | ) | | | (1.01 | ) | | | | | (0.39 | ) | | | (1.97 | ) | | | (2.36 | ) | | | 20.20 | |
2011 | | | 19.81 | | | | 0.34 | | | | 4.61 | | | | 4.95 | | | | | | (0.36 | ) | | | (0.83 | ) | | | (1.19 | ) | | | 23.57 | |
2010(d) | | | 20.00 | | | | 0.30 | | | | (0.19 | ) | | | 0.11 | | | | | | (0.30 | ) | | | — | | | | (0.30 | ) | | | 19.81 | |
Class C (9/09) | | | | | | | | | | | | | | | | | | | | | | | | | | | | | | | | | | |
2014 | | | 24.07 | | | | 0.49 | | | | 4.59 | | | | 5.08 | | | | | | (0.47 | ) | | | (0.61 | ) | | | (1.08 | ) | | | 28.07 | |
2013 | | | 20.19 | | | | 0.19 | | | | 3.92 | | | | 4.11 | | | | | | (0.19 | ) | | | (0.04 | ) | | | (0.23 | ) | | | 24.07 | |
2012 | | | 23.56 | | | | 0.23 | | | | (1.40 | ) | | | (1.17 | ) | | | | | (0.23 | ) | | | (1.97 | ) | | | (2.20 | ) | | | 20.19 | |
2011 | | | 19.80 | | | | 0.17 | | | | 4.61 | | | | 4.78 | | | | | | (0.19 | ) | | | (0.83 | ) | | | (1.02 | ) | | | 23.56 | |
2010(d) | | | 20.00 | | | | 0.18 | | | | (0.20 | ) | | | (0.02 | ) | | | | | (0.18 | ) | | | — | | | | (0.18 | ) | | | 19.80 | |
Class R3 (9/09)(f) | | | | | | | | | | | | | | | | | | | | | | | | | | | | | | | | | | |
2014 | | | 24.08 | | | | 0.63 | | | | 4.59 | | | | 5.22 | | | | | | (0.60 | ) | | | (0.61 | ) | | | (1.21 | ) | | | 28.09 | |
2013 | | | 20.20 | | | | 0.31 | | | | 3.91 | | | | 4.22 | | | | | | (0.30 | ) | | | (0.04 | ) | | | (0.34 | ) | | | 24.08 | |
2012 | | | 23.57 | | | | 0.33 | | | | (1.39 | ) | | | (1.06 | ) | | | | | (0.34 | ) | | | (1.97 | ) | | | (2.31 | ) | | | 20.20 | |
2011 | | | 19.80 | | | | 0.29 | | | | 4.62 | | | | 4.91 | | | | | | (0.31 | ) | | | (0.83 | ) | | | (1.14 | ) | | | 23.57 | |
2010(d) | | | 20.00 | | | | 0.26 | | | | (0.20 | ) | | | 0.06 | | | | | | (0.26 | ) | | | — | | | | (0.26 | ) | | | 19.80 | |
Class I (9/09) | | | | | | | | | | | | | | | | | | | | | | | | | | | | | | | | | | |
2014 | | | 24.08 | | | | 0.89 | | | | 4.48 | | | | 5.37 | | | | | | (0.74 | ) | | | (0.61 | ) | | | (1.35 | ) | | | 28.10 | |
2013 | | | 20.21 | | | | 0.42 | | | | 3.90 | | | | 4.32 | | | | | | (0.41 | ) | | | (0.04 | ) | | | (0.45 | ) | | | 24.08 | |
2012 | | | 23.57 | | | | 0.44 | | | | (1.39 | ) | | | (0.95 | ) | | | | | (0.44 | ) | | | (1.97 | ) | | | (2.41 | ) | | | 20.21 | |
2011 | | | 19.81 | | | | 0.40 | | | | 4.61 | | | | 5.01 | | | | | | (0.42 | ) | | | (0.83 | ) | | | (1.25 | ) | | | 23.57 | |
2010(d) | | | 20.00 | | | | 0.35 | | | | (0.20 | ) | | | 0.15 | | | | | | (0.34 | ) | | | — | | | | (0.34 | ) | | | 19.81 | |
| | | | | | | | | | | | | | | | | | | | | | | | | | | | | | |
| | | | Ratios/Supplemental Data | |
| | | | | | | | | Ratios to Average
Net Assets Before
Waiver/Reimbursement | | | | | Ratios to Average
Net Assets After
Waiver/Reimbursement(c) | | | | |
| | | | | | | | |
Total
Return(b) | | | Ending
Net
Assets
(000) | | | | | Expenses | | | Net
Investment
Income
(Loss) | | | | | Expenses | | | Net
Investment
Income
(Loss) | | | Portfolio
Turnover
Rate(e) | |
| | | | | | | | | | | | | | | | | | | | | | | | | | | | | | |
| | 22.28 | % | | $ | 351 | | | | | | 4.86 | % | | | (1.12 | )% | | | | | 1.16 | % | | | 2.58 | % | | | 49 | % |
| | 21.33 | | | | 301 | | | | | | 5.17 | | | | (2.42 | ) | | | | | 1.12 | | | | 1.63 | | | | 44 | |
| | (3.57 | ) | | | 253 | | | | | | 4.16 | | | | (1.19 | ) | | | | | 1.13 | | | | 1.85 | | | | 32 | |
| | 25.34 | | | | 295 | | | | | | 5.29 | | | | (2.65 | ) | | | | | 1.13 | | | | 1.51 | | | | 44 | |
| | 0.48 | | | | 248 | | | | | | 3.79 | * | | | (0.82 | )* | | | | | 1.14 | * | | | 1.83 | * | | | 24 | |
| | | | | | | | | | | | | | | | | | | | | | | | | | | | | | |
| | 21.36 | | | | 351 | | | | | | 5.61 | | | | (1.87 | ) | | | | | 1.91 | | | | 1.83 | | | | 49 | |
| | 20.45 | | | | 301 | | | | | | 5.92 | | | | (3.17 | ) | | | | | 1.87 | | | | 0.88 | | | | 44 | |
| | (4.30 | ) | | | 252 | | | | | | 4.91 | | | | (1.94 | ) | | | | | 1.88 | | | | 1.09 | | | | 32 | |
| | 24.43 | | | | 294 | | | | | | 6.04 | | | | (3.40 | ) | | | | | 1.88 | | | | 0.76 | | | | 44 | |
| | (0.14 | ) | | | 248 | | | | | | 4.54 | * | | | (1.57 | )* | | | | | 1.89 | * | | | 1.08 | * | | | 24 | |
| | | | | | | | | | | | | | | | | | | | | | | | | | | | | | |
| | 21.99 | | | | 351 | | | | | | 5.11 | | | | (1.34 | ) | | | | | 1.41 | | | | 2.37 | | | | 49 | |
| | 21.04 | | | | 301 | | | | | | 5.42 | | | | (2.67 | ) | | | | | 1.37 | | | | 1.38 | | | | 44 | |
| | (3.81 | ) | | | 253 | | | | | | 4.42 | | | | (1.45 | ) | | | | | 1.38 | | | | 1.59 | | | | 32 | |
| | 25.09 | | | | 295 | | | | | | 5.54 | | | | (2.90 | ) | | | | | 1.38 | | | | 1.26 | | | | 44 | |
| | 0.24 | | | | 248 | | | | | | 4.04 | * | | | (1.07 | )* | | | | | 1.39 | * | | | 1.58 | * | | | 24 | |
| | | | | | | | | | | | | | | | | | | | | | | | | | | | | | |
| | 22.63 | | | | 645 | | | | | | 4.79 | | | | (0.55 | ) | | | | | 0.92 | | | | 3.31 | | | | 49 | |
| | 21.57 | | | | 301 | | | | | | 4.92 | | | | (2.17 | ) | | | | | 0.87 | | | | 1.88 | | | | 44 | |
| | (3.28 | ) | | | 253 | | | | | | 3.91 | | | | (0.94 | ) | | | | | 0.88 | | | | 2.10 | | | | 32 | |
| | 25.64 | | | | 295 | | | | | | 5.04 | | | | (2.40 | ) | | | | | 0.88 | | | | 1.76 | | | | 44 | |
| | 0.67 | | | | 248 | | | | | | 3.54 | * | | | (0.57 | )* | | | | | 0.89 | * | | | 2.08 | * | | | 24 | |
| (a) | Per share Net Investment Income (Loss) is calculated using the average daily shares method. | |
| (b) | Total return is the combination of changes in NAV without any sales charge, reinvested dividend income at NAV and reinvested capital gains distributions at NAV, if any. Total returns are not annualized. Performance prior to December 13, 2013, reflects the Fund’s performance using investment strategies that differed significantly from those currently in place. | |
| (c) | After fee waiver and/or expense reimbursement from the Adviser, where applicable. | |
| (d) | For the period September 15, 2009 (commencement of operations) through June 30, 2010. | |
| (e) | Portfolio Turnover Rate is calculated based on the lesser of long-term purchases or sales (as disclosed in Note 5 – Investment Transactions) divided by the average long-term market value during the period. | |
| (f) | Class R3 Shares are not available for public offering. | |
See accompanying notes to financial statements.
Financial Highlights (continued)
NWQ Multi-Cap Value
Selected data for a share outstanding throughout each period:
| | | | | | | | | | | | | | | | | | | | | | | | | | | | | | | | | | | | | | |
| | | | | |
| | | | | | Investment Operations | | | | | Less Distributions | | | | |
| | | | | | | | | | |
Class (Commencement Date) Year Ended June 30, | | Beginning
NAV | | | Net
Investment
Income
(Loss)(a) | | | Net
Realized/
Unrealized
Gain (Loss) | | | Total | | | | | From
Net
Investment
Income | | | From
Accumulated
Net Realized
Gains | | | Return of
Capital | | | Total | | | Ending
NAV | |
Class A (12/02) | | | | | | | | | | | | | | | | | | | | | | | | | | | | | | | | | | | | | | |
2014 | | $ | 22.36 | | | $ | 0.10 | | | $ | 4.60 | | | $ | 4.70 | | | | | $ | (0.09 | ) | | $ | — | | | $ | — | | | $ | (0.09 | ) | | $ | 26.97 | |
2013 | | | 18.29 | | | | 0.11 | | | | 4.04 | | | | 4.15 | | | | | | (0.08 | ) | | | — | | | | — | | | | (0.08 | ) | | | 22.36 | |
2012 | | | 19.11 | | | | 0.04 | | | | (0.86 | ) | | | (0.82 | ) | | | | | — | | | | — | | | | — | | | | — | | | | 18.29 | |
2011 | | | 14.73 | | | | (0.02 | ) | | | 4.40 | | | | 4.38 | | | | | | — | | | | — | | | | — | | | | — | | | | 19.11 | |
2010 | | | 12.22 | | | | (0.06 | ) | | | 2.61 | | | | 2.55 | | | | | | (0.03 | ) | | | — | | | | (0.01 | ) | | | (0.04 | ) | | | 14.73 | |
Class C (12/02) | | | | | | | | | | | | | | | | | | | | | | | | | | | | | | | | | | | | | | |
2014 | | | 21.17 | | | | (0.07 | ) | | | 4.33 | | | | 4.26 | | | | | | — | | | | — | | | | — | | | | — | | | | 25.43 | |
2013 | | | 17.38 | | | | (0.04 | ) | | | 3.83 | | | | 3.79 | | | | | | — | | | | — | | | | — | | | | — | | | | 21.17 | |
2012 | | | 18.29 | | | | (0.09 | ) | | | (0.82 | ) | | | (0.91 | ) | | | | | — | | | | — | | | | — | | | | — | | | | 17.38 | |
2011 | | | 14.21 | | | | (0.14 | ) | | | 4.22 | | | | 4.08 | | | | | | — | | | | — | | | | — | | | | — | | | | 18.29 | |
2010 | | | 11.84 | | | | (0.16 | ) | | | 2.53 | | | | 2.37 | | | | | | — | | | | — | | | | — | | | | — | | | | 14.21 | |
Class R3 (8/08) | | | | | | | | | | | | | | | | | | | | | | | | | | | | | | | | | | | | | | |
2014 | | | 22.13 | | | | 0.05 | | | | 4.53 | | | | 4.58 | | | | | | (0.03 | ) | | | — | | | | — | | | | (0.03 | ) | | | 26.68 | |
2013 | | | 18.11 | | | | 0.06 | | | | 4.00 | | | | 4.06 | | | | | | (0.04 | ) | | | — | | | | — | | | | (0.04 | ) | | | 22.13 | |
2012 | | | 18.96 | | | | — | * | | | (0.85 | ) | | | (0.85 | ) | | | | | — | | | | — | | | | — | | | | — | | | | 18.11 | |
2011 | | | 14.66 | | | | (0.06 | ) | | | 4.36 | | | | 4.30 | | | | | | — | | | | — | | | | — | | | | — | | | | 18.96 | |
2010 | | | 12.16 | | | | (0.08 | ) | | | 2.59 | | | | 2.51 | | | | | | (0.01 | ) | | | — | | | | — | * | | | (0.01 | ) | | | 14.66 | |
Class I (11/97) | | | | | | | | | | | | | | | | | | | | | | | | | | | | | | | | | | | | | | |
2014 | | | 22.48 | | | | 0.18 | | | | 4.62 | | | | 4.80 | | | | | | (0.15 | ) | | | — | | | | — | | | | (0.15 | ) | | | 27.13 | |
2013 | | | 18.40 | | | | 0.16 | | | | 4.05 | | | | 4.21 | | | | | | (0.13 | ) | | | — | | | | — | | | | (0.13 | ) | | | 22.48 | |
2012 | | | 19.17 | | | | 0.07 | | | | (0.84 | ) | | | (0.77 | ) | | | | | — | | | | — | | | | — | | | | — | | | | 18.40 | |
2011 | | | 14.74 | | | | 0.03 | | | | 4.40 | | | | 4.43 | | | | | | — | | | | — | | | | — | | | | — | | | | 19.17 | |
2010 | | | 12.22 | | | | (0.01 | ) | | | 2.60 | | | | 2.59 | | | | | | (0.05 | ) | | | — | | | | (0.02 | ) | | | (0.07 | ) | | | 14.74 | |
| | | | | | | | | | | | | | | | | | | | |
| | | | Ratios/Supplemental Data | |
| | | | | | | | | Ratios to Average
Net Assets | | | | |
| | | | | |
Total
Return(b) | | | Ending
Net
Assets
(000) | | | | | Expenses | | | Net
Investment
Income
(Loss) | | | Portfolio
Turnover
Rate(c) | |
| | | | | | | | | | | | | | | | | | | | |
| | 21.04 | % | | $ | 47,369 | | | | | | 1.28 | % | | | 0.42 | % | | | 37 | % |
| | 22.78 | | | | 42,362 | | | | | | 1.31 | | | | 0.55 | | | | 22 | |
| | (4.29 | ) | | | 42,089 | | | | | | 1.32 | | | | 0.20 | | | | 37 | |
| | 29.74 | | | | 61,438 | | | | | | 1.38 | | | | (0.10 | ) | | | 24 | |
| | 20.85 | | | | 61,514 | | | | | | 1.47 | | | | (0.38 | ) | | | 34 | |
| | | | | | | | | | | | | | | | | | | | |
| | 20.12 | | | | 46,827 | | | | | | 2.03 | | | | (0.30 | ) | | | 37 | |
| | 21.81 | | | | 45,408 | | | | | | 2.06 | | | | (0.20 | ) | | | 22 | |
| | (4.98 | ) | | | 51,646 | | | | | | 2.06 | | | | (0.54 | ) | | | 37 | |
| | 28.71 | | | | 71,116 | | | | | | 2.13 | | | | (0.84 | ) | | | 24 | |
| | 20.02 | | | | 71,209 | | | | | | 2.21 | | | | (1.13 | ) | | | 34 | |
| | | | | | | | | | | | | | | | | | | | |
| | 20.72 | | | | 256 | | | | | | 1.53 | | | | 0.21 | | | | 37 | |
| | 22.43 | | | | 204 | | | | | | 1.56 | | | | 0.30 | | | | 22 | |
| | (4.48 | ) | | | 153 | | | | | | 1.57 | | | | (0.01 | ) | | | 37 | |
| | 29.33 | | | | 156 | | | | | | 1.63 | | | | (0.32 | ) | | | 24 | |
| | 20.62 | | | | 202 | | | | | | 1.65 | | | | (0.55 | ) | | | 34 | |
| | | | | | | | | | | | | | | | | | | | |
| | 21.38 | | | | 71,721 | | | | | | 1.03 | | | | 0.71 | | | | 37 | |
| | 23.01 | | | | 60,074 | | | | | | 1.06 | | | | 0.79 | | | | 22 | |
| | (4.02 | ) | | | 67,250 | | | | | | 1.07 | | | | 0.41 | | | | 37 | |
| | 30.05 | | | | 218,673 | | | | | | 1.13 | | | | 0.18 | | | | 24 | |
| | 21.18 | | | | 222,707 | | | | | | 1.18 | | | | (0.08 | ) | | | 34 | |
| (a) | Per share Net Investment Income (Loss) is calculated using the average daily shares method. | |
| (b) | Total return is the combination of changes in NAV without any sales charge, reinvested dividend income at NAV and reinvested capital gains distributions at NAV, if any. Total returns are not annualized. | |
| (c) | Portfolio Turnover Rate is calculated based on the lesser of long-term purchases or sales (as disclosed in Note 5 – Investment Transactions) divided by the average long-term market value during the period. | |
| * | Rounds to less than $.01 per share. | |
See accompanying notes to financial statements.
Financial Highlights (continued)
NWQ Large-Cap Value
Selected data for a share outstanding throughout each period:
| | | | | | | | | | | | | | | | | | | | | | | | | | | | | | | | | | |
| | | | | |
| | | | | | Investment Operations | | | | | Less Distributions | | | | |
| | | | | | | | | |
Class (Commencement Date) Year Ended June 30, | | Beginning
NAV | | | Net
Investment
Income
(Loss)(a) | | | Net
Realized/
Unrealized
Gain (Loss) | | | Total | | | | | From
Net
Investment
Income | | | From
Accumulated
Net Realized
Gains | | | Total | | | Ending
NAV | |
Class A (12/06) | | | | | | | | | | | | | | | | | | | | | | | | | | | | | | | | | | |
2014 | | $ | 20.32 | | | $ | 0.19 | | | $ | 3.79 | | | $ | 3.98 | | | | | $ | (0.16 | ) | | $ | (0.41 | ) | | $ | (0.57 | ) | | $ | 23.73 | |
2013 | | | 16.84 | | | | 0.17 | | | | 3.51 | | | | 3.68 | | | | | | (0.15 | ) | | | (0.05 | ) | | | (0.20 | ) | | | 20.32 | |
2012 | | | 18.56 | | | | 0.14 | | | | (1.64 | ) | | | (1.50 | ) | | | | | (0.01 | ) | | | (0.21 | ) | | | (0.22 | ) | | | 16.84 | |
2011 | | | 14.73 | | | | 0.03 | | | | 3.83 | | | | 3.86 | | | | | | (0.03 | ) | | | — | | | | (0.03 | ) | | | 18.56 | |
2010 | | | 12.71 | | | | 0.03 | | | | 1.99 | | | | 2.02 | | | | | | — | | | | — | | | | — | | | | 14.73 | |
Class C (12/06) | | | | | | | | | | | | | | | | | | | | | | | | | | | | | | | | | | |
2014 | | | 19.73 | | | | 0.02 | | | | 3.67 | | | | 3.69 | | | | | | — | | | | (0.41 | ) | | | (0.41 | ) | | | 23.01 | |
2013 | | | 16.36 | | | | 0.03 | | | | 3.41 | | | | 3.44 | | | | | | (0.02 | ) | | | (0.05 | ) | | | (0.07 | ) | | | 19.73 | |
2012 | | | 18.15 | | | | 0.01 | | | | (1.59 | ) | | | (1.58 | ) | | | | | — | | | | (0.21 | ) | | | (0.21 | ) | | | 16.36 | |
2011 | | | 14.49 | | | | (0.09 | ) | | | 3.75 | | | | 3.66 | | | | | | — | | | | — | | | | — | | | | 18.15 | |
2010 | | | 12.60 | | | | (0.08 | ) | | | 1.97 | | | | 1.89 | | | | | | — | | | | — | | | | — | | | | 14.49 | |
Class R3 (9/09) | | | | | | | | | | | | | | | | | | | | | | | | | | | | | | | | | | |
2014 | | | 20.25 | | | | 0.13 | | | | 3.78 | | | | 3.91 | | | | | | (0.11 | ) | | | (0.41 | ) | | | (0.52 | ) | | | 23.64 | |
2013 | | | 16.79 | | | | 0.12 | | | | 3.49 | | | | 3.61 | | | | | | (0.10 | ) | | | (0.05 | ) | | | (0.15 | ) | | | 20.25 | |
2012 | | | 18.53 | | | | 0.09 | | | | (1.62 | ) | | | (1.53 | ) | | | | | — | | | | (0.21 | ) | | | (0.21 | ) | | | 16.79 | |
2011 | | | 14.71 | | | | (0.01 | ) | | | 3.83 | | | | 3.82 | | | | | | — | | | | — | | | | — | | | | 18.53 | |
2010(c) | | | 15.24 | | | | — | ** | | | (.53 | ) | | | (.53 | ) | | | | | — | | | | — | | | | — | | | | 14.71 | |
Class I (12/06) | | | | | | | | | | | | | | | | | | | | | | | | | | | | | | | | | | |
2014 | | | 20.35 | | | | 0.24 | | | | 3.80 | | | | 4.04 | | | | | | (0.21 | ) | | | (0.41 | ) | | | (0.62 | ) | | | 23.77 | |
2013 | | | 16.87 | | | | 0.21 | | | | 3.51 | | | | 3.72 | | | | | | (0.19 | ) | | | (0.05 | ) | | | (0.24 | ) | | | 20.35 | |
2012 | | | 18.59 | | | | 0.22 | | | | (1.67 | ) | | | (1.45 | ) | | | | | (0.06 | ) | | | (0.21 | ) | | | (0.27 | ) | | | 16.87 | |
2011 | | | 14.75 | | | | 0.08 | | | | 3.83 | | | | 3.91 | | | | | | (0.07 | ) | | | — | | | | (0.07 | ) | | | 18.59 | |
2010 | | | 12.72 | | | | 0.08 | | | | 1.97 | | | | 2.05 | | | | | | (0.02 | ) | | | — | | | | (0.02 | ) | | | 14.75 | |
| | | | | | | | | | | | | | | | | | | | | | |
| | | | Ratios/Supplemental Data | |
| | | | | | | | | Ratios to Average
Net Assets Before
Waiver/Reimbursement | | | | | | |
| | | | | | |
Total
Return(b) | | | Ending
Net
Assets
(000) | | | | | Expenses | | | Net
Investment
Income
(Loss) | | | | | Portfolio
Turnover
Rate(d) | |
| | | | | | | | | | | | | | | | | | | | | | |
| | 19.80 | % | | $ | 66,452 | | | | | | 1.08 | % | | | 0.85 | % | | | | | 45 | % |
| | 22.04 | | | | 55,055 | | | | | | 1.07 | | | | 0.91 | | | | | | 16 | |
| | (7.99 | ) | | | 39,940 | | | | | | 1.11 | | | | 0.84 | | | | | | 35 | |
| | 26.22 | | | | 26,143 | | | | | | 1.20 | | | | 0.19 | | | | | | 27 | |
| | 15.89 | | | | 13,820 | | | | | | 1.32 | | | | 0.20 | | | | | | 15 | |
| | | | | | | | | | | | | | | | | | | | | | |
| | 18.90 | | | | 11,857 | | | | | | 1.83 | | | | 0.11 | | | | | | 45 | |
| | 21.08 | | | | 8,053 | | | | | | 1.82 | | | | 0.15 | | | | | | 16 | |
| | (8.64 | ) | | | 6,903 | | | | | | 1.86 | | | | 0.04 | | | | | | 35 | |
| | 25.26 | | | | 8,660 | | | | | | 1.95 | | | | (0.55 | ) | | | | | 27 | |
| | 15.00 | | | | 4,665 | | | | | | 2.07 | | | | (0.55 | ) | | | | | 15 | |
| | | | | | | | | | | | | | | | | | | | | | |
| | 19.50 | | | | 64 | | | | | | 1.33 | | | | 0.59 | | | | | | 45 | |
| | 21.68 | | | | 53 | | | | | | 1.32 | | | | 0.64 | | | | | | 16 | |
| | (8.19 | ) | | | 55 | | | | | | 1.36 | | | | 0.55 | | | | | | 35 | |
| | 25.97 | | | | 61 | | | | | | 1.45 | | | | (0.06 | ) | | | | | 27 | |
| | (3.48 | ) | | | 48 | | | | | | 1.58 | * | | | (0.02 | )* | | | | | 15 | |
| | | | | | | | | | | | | | | | | | | | | | |
| | 20.10 | | | | 642,177 | | | | | | 0.83 | | | | 1.06 | | | | | | 45 | |
| | 22.31 | | | | 1,225,884 | | | | | | 0.82 | | | | 1.15 | | | | | | 16 | |
| | (7.73 | ) | | | 1,061,400 | | | | | | 0.85 | | | | 1.29 | | | | | | 35 | |
| | 26.54 | | | | 400,859 | | | | | | 0.95 | | | | 0.45 | | | | | | 27 | |
| | 16.13 | | | | 253,558 | | | | | | 1.08 | | | | 0.53 | | | | | | 15 | |
| (a) | Per share Net Investment Income (Loss) is calculated using the average daily shares method. | |
| (b) | Total return is the combination of changes in NAV without any sales charge, reinvested dividend income at NAV and reinvested capital gains distributions at NAV, if any. Total returns are not annualized. | |
| (c) | For the period September 29, 2009 (commencement of operations) through June 30, 2010. | |
| (d) | Portfolio Turnover Rate is calculated based on the lesser of long-term purchases or sales (as disclosed in Note 5 – Investment Transactions) divided by the average long-term market value during the period. | |
| ** | Rounds to less than $.01 per share. | |
See accompanying notes to financial statements.
Financial Highlights (continued)
NWQ Small/Mid-Cap Value
Selected data for a share outstanding throughout each period:
| | | | | | | | | | | | | | | | | | | | | | | | | | | | | | | | | | |
| | | | | |
| | | | | | Investment Operations | | | | | Less Distributions | | | | |
| | | | | | | | | |
Class (Commencement Date) Year Ended June 30, | | Beginning
NAV | | | Net
Investment
Income
(Loss)(a) | | | Net
Realized/
Unrealized
Gain (Loss) | | | Total | | | | | From
Net
Investment
Income | | | From
Accumulated
Net Realized
Gains | | | Total | | | Ending
NAV | |
Class A (12/06) | | | | | | | | | | | | | | | | | | | | | | | | | | | | | | | |
2014 | | $ | 24.50 | | | $ | (0.12 | ) | | $ | 5.60 | | | $ | 5.48 | | | | | $ | — | | | $ | — | | | $ | — | | | $ | 29.98 | |
2013 | | | 19.63 | | | | (0.04 | ) | | | 4.91 | | | | 4.87 | | | | | | — | | | | — | | | | — | | | | 24.50 | |
2012 | | | 19.91 | | | | (0.09 | ) | | | (0.19 | ) | | | (0.28 | ) | | | | | — | | | | — | | | | — | | | | 19.63 | |
2011 | | | 14.32 | | | | (0.09 | ) | | | 5.68 | | | | 5.59 | | | | | | — | | | | — | | | | — | | | | 19.91 | |
2010 | | | 11.05 | | | | (0.09 | ) | | | 3.36 | | | | 3.27 | | | | | | — | | | | — | | | | — | | | | 14.32 | |
Class C (12/06) | | | | | | | | | | | | | | | | | | | | | | | | | | | | | | | |
2014 | | | 23.30 | | | | (0.33 | ) | | | 5.33 | | | | 5.00 | | | | | | — | | | | — | | | | — | | | | 28.30 | |
2013 | | | 18.81 | | | | (0.20 | ) | | | 4.69 | | | | 4.49 | | | | | | — | | | | — | | | | — | | | | 23.30 | |
2012 | | | 19.22 | | | | (0.23 | ) | | | (0.18 | ) | | | (0.41 | ) | | | | | — | | | | — | | | | — | | | | 18.81 | |
2011 | | | 13.93 | | | | (0.22 | ) | | | 5.51 | | | | 5.29 | | | | | | — | | | | — | | | | — | | | | 19.22 | |
2010 | | | 10.83 | | | | (0.19 | ) | | | 3.29 | | | | 3.10 | | | | | | — | | | | — | | | | — | | | | 13.93 | |
Class R3 (9/09) | | | | | | | | | | | | | | | | | | | | | | | | | | | | | | | |
2014 | | | 24.09 | | | | (0.20 | ) | | | 5.52 | | | | 5.32 | | | | | | — | | | | — | | | | — | | | | 29.41 | |
2013 | | | 19.36 | | | | (0.09 | ) | | | 4.82 | | | | 4.73 | | | | | | — | | | | — | | | | — | | | | 24.09 | |
2012 | | | 19.68 | | | | (0.13 | ) | | | (0.19 | ) | | | (0.32 | ) | | | | | — | | | | — | | | | — | | | | 19.36 | |
2011 | | | 14.19 | | | | (0.13 | ) | | | 5.62 | | | | 5.49 | | | | | | — | | | | — | | | | — | | | | 19.68 | |
2010(d) | | | 13.53 | | | | (0.09 | ) | | | 0.75 | | | | .66 | | | | | | — | | | | — | | | | — | | | | 14.19 | |
Class I (12/06) | | | | | | | | | | | | | | | | | | | | | | | | | | | | | | | |
2014 | | | 24.55 | | | | (0.06 | ) | | | 5.63 | | | | 5.57 | | | | | | — | | | | — | | | | — | | | | 30.12 | |
2013 | | | 19.62 | | | | 0.01 | | | | 4.92 | | | | 4.93 | | | | | | — | | | | — | | | | — | | | | 24.55 | |
2012 | | | 19.85 | | | | (0.04 | ) | | | (0.19 | ) | | | (0.23 | ) | | | | | — | | | | — | | | | — | | | | 19.62 | |
2011 | | | 14.24 | | | | (0.05 | ) | | | 5.66 | | | | 5.61 | | | | | | — | | | | — | | | | — | | | | 19.85 | |
2010 | | | 10.96 | | | | (0.05 | ) | | | 3.33 | | | | 3.28 | | | | | | — | | | | — | | | | — | | | | 14.24 | |
| | | | | | | | | | | | | | | | | | | | | | | | | | | | | | |
| | | | Ratios/Supplemental Data | |
| | | | | | | | | Ratios to Average
Net Assets Before
Waiver/Reimbursement | | | | | Ratios to Average
Net Assets After
Waiver/Reimbursement(c) | | | | |
| | | | | | | | |
Total
Return(b) | | | Ending
Net
Assets
(000) | | | | | Expenses | | | Net
Investment
Income
(Loss) | | | | | Expenses | | | Net
Investment
Income
(Loss) | | | Portfolio
Turnover
Rate(e) | |
| | | | | | | | | | | | | | | | | | | | | | | | | | | | | | |
| | 22.33 | % | | $ | 8,882 | | | | | | 1.31 | % | | | (0.45 | )% | | | | | 1.31 | % | | | (0.45 | )% | | | 48 | % |
| | 24.81 | | | | 5,066 | | | | | | 1.32 | | | | (0.21 | ) | | | | | 1.32 | | | | (0.20 | ) | | | 49 | |
| | (1.41 | ) | | | 4,671 | | | | | | 1.58 | | | | (0.72 | ) | | | | | 1.33 | | | | (0.46 | ) | | | 54 | |
| | 39.13 | | | | 5,261 | | | | | | 1.88 | | | | (1.04 | ) | | | | | 1.33 | | | | (0.50 | ) | | | 46 | |
| | 29.50 | | | | 3,267 | | | | | | 2.32 | | | | (1.51 | ) | | | | | 1.44 | | | | (0.63 | ) | | | 64 | |
| | | | | | | | | | | | | | | | | | | | | | | | | | | | | | |
| | 21.46 | | | | 3,432 | | | | | | 2.05 | | | | (1.24 | ) | | | | | 2.05 | | | | (1.24 | ) | | | 48 | |
| | 23.87 | | | | 2,245 | | | | | | 2.07 | | | | (0.96 | ) | | | | | 2.07 | | | | (0.96 | ) | | | 49 | |
| | (2.13 | ) | | | 1,928 | | | | | | 2.36 | | | | (1.49 | ) | | | | | 2.08 | | | | (1.21 | ) | | | 54 | |
| | 38.07 | | | | 1,202 | | | | | | 2.62 | | | | (1.80 | ) | | | | | 2.08 | | | | (1.26 | ) | | | 46 | |
| | 28.53 | | | | 636 | | | | | | 3.11 | | | | (2.29 | ) | | | | | 2.19 | | | | (1.37 | ) | | | 64 | |
| | | | | | | | | | | | | | | | | | | | | | | | | | | | | | |
| | 22.04 | | | | 769 | | | | | | 1.56 | | | | (0.73 | ) | | | | | 1.56 | | | | (0.73 | ) | | | 48 | |
| | 24.43 | | | | 470 | | | | | | 1.58 | | | | (0.44 | ) | | | | | 1.57 | | | | (0.43 | ) | | | 49 | |
| | (1.63 | ) | | | 202 | | | | | | 1.87 | | | | (1.00 | ) | | | | | 1.58 | | | | (0.70 | ) | | | 54 | |
| | 38.69 | | | | 73 | | | | | | 2.13 | | | | (1.29 | ) | | | | | 1.58 | | | | (0.74 | ) | | | 46 | |
| | 4.88 | | | | 52 | | | | | | 2.54 | * | | | (1.67 | )* | | | | | 1.69 | * | | | (0.81 | )* | | | 64 | |
| | | | | | | | | | | | | | | | | | | | | | | | | | | | | | |
| | 22.65 | | | | 53,251 | | | | | | 1.05 | | | | (0.23 | ) | | | | | 1.05 | | | | (0.23 | ) | | | 48 | |
| | 25.13 | | | | 31,172 | | | | | | 1.09 | | | | 0.04 | | | | | | 1.07 | | | | 0.06 | | | | 49 | |
| | (1.16 | ) | | | 15,150 | | | | | | 1.34 | | | | (0.47 | ) | | | | | 1.08 | | | | (0.20 | ) | | | 54 | |
| | 39.40 | | | | 14,803 | | | | | | 1.62 | | | | (0.80 | ) | | | | | 1.08 | | | | (0.26 | ) | | | 46 | |
| | 29.93 | | | | 7,279 | | | | | | 2.09 | | | | (1.26 | ) | | | | | 1.19 | | | | (0.36 | ) | | | 64 | |
| (a) | Per share Net Investment Income (Loss) is calculated using the average daily shares method. | |
| (b) | Total return is the combination of changes in NAV without any sales charge, reinvested dividend income at NAV and reinvested capital gains distributions at NAV, if any. Total returns are not annualized. | |
| (c) | After fee waiver and/or expense reimbursement from the Adviser, where applicable. | |
| (d) | For the period September 29, 2009 (commencement of operations) through June 30, 2010. | |
| (e) | Portfolio Turnover Rate is calculated based on the lesser of long-term purchases or sales (as disclosed in Note 5 – Investment Transactions) divided by the average long-term market value during the period. | |
See accompanying notes to financial statements.
Financial Highlights (continued)
NWQ Small-Cap Value
Selected data for a share outstanding throughout each period:
| | | | | | | | | | | | | | | | | | | | | | | | | | | | | | | | | | |
| | | | | |
| | | | | | Investment Operations | | | | | Less Distributions | | | | |
| | | | | | | | | |
Class (Commencement Date) Year Ended June 30, | | Beginning
NAV | | | Net
Investment
Income
(Loss)(a) | | | Net
Realized/
Unrealized
Gain (Loss) | | | Total | | | | | From
Net
Investment
Income | | | From
Accumulated
Net Realized
Gains | | | Total | | | Ending
NAV | |
Class A (12/04) | | | | | | | | | | | | | | | | | | | | | | | | | | | | | | | |
2014 | | $ | 33.14 | | | $ | (0.29 | ) | | $ | 9.77 | | | $ | 9.48 | | | | | $ | — | | | $ | — | | | $ | — | | | $ | 42.62 | |
2013 | | | 26.01 | | | | (0.12 | ) | | | 7.25 | | | | 7.13 | | | | | | — | | | | — | | | | — | | | | 33.14 | |
2012 | | | 25.22 | | | | (0.17 | ) | | | 0.96 | | | | 0.79 | | | | | | — | | | | — | | | | — | | | | 26.01 | |
2011 | | | 18.30 | | | | (0.18 | ) | | | 7.10 | | | | 6.92 | | | | | | — | | | | — | | | | — | | | | 25.22 | |
2010 | | | 14.14 | | | | (0.10 | ) | | | 4.27 | | | | 4.17 | | | | | | (0.01 | ) | | | — | | | | (0.01 | ) | | | 18.30 | |
Class C (12/04) | | | | | | | | | | | | | | | | | | | | | | | | | | | | | | | |
2014 | | | 31.33 | | | | (0.55 | ) | | | 9.20 | | | | 8.65 | | | | | | — | | | | — | | | | — | | | | 39.98 | |
2013 | | | 24.77 | | | | (0.31 | ) | | | 6.87 | | | | 6.56 | | | | | | — | | | | — | | | | — | | | | 31.33 | |
2012 | | | 24.20 | | | | (0.34 | ) | | | 0.91 | | | | 0.57 | | | | | | — | | | | — | | | | — | | | | 24.77 | |
2011 | | | 17.68 | | | | (0.35 | ) | | | 6.87 | | | | 6.52 | | | | | | — | | | | — | | | | — | | | | 24.20 | |
2010 | | | 13.76 | | | | (0.21 | ) | | | 4.13 | | | | 3.92 | | | | | | — | | | | — | | | | — | | | | 17.68 | |
Class R3 (9/09) | | | | | | | | | | | | | | | | | | | | | | | | | | | | | | | |
2014 | | | 33.04 | | | | (0.40 | ) | | | 9.74 | | | | 9.34 | | | | | | — | | | | — | | | | — | | | | 42.38 | |
2013 | | | 25.99 | | | | (0.24 | ) | | | 7.29 | | | | 7.05 | | | | | | — | | | | — | | | | — | | | | 33.04 | |
2012 | | | 25.26 | | | | (0.23 | ) | | | 0.96 | | | | 0.73 | | | | | | — | | | | — | | | | — | | | | 25.99 | |
2011 | | | 18.37 | | | | (0.25 | ) | | | 7.14 | | | | 6.89 | | | | | | — | | | | — | | | | — | | | | 25.26 | |
2010(d) | | | 18.07 | | | | (0.08 | ) | | | .38 | | | | 0.30 | | | | | | — | | | | — | | | | — | | | | 18.37 | |
Class R6 (2/13) | | | | | | | | | | | | | | | | | | | | | | | | | | | | | | | |
2014 | | | 33.60 | | | | (0.16 | ) | | | 9.91 | | | | 9.75 | | | | | | — | | | | — | | | | — | | | | 43.35 | |
2013(e) | | | 31.19 | | | | (0.10 | ) | | | 2.51 | | | | 2.41 | | | | | | — | | | | — | | | | — | | | | 33.60 | |
Class I (12/04) | | | | | | | | | | | | | | | | | | | | | | | | | | | | | | | |
2014 | | | 33.58 | | | | (0.20 | ) | | | 9.90 | | | | 9.70 | | | | | | — | | | | — | | | | — | | | | 43.28 | |
2013 | | | 26.29 | | | | (0.04 | ) | | | 7.33 | | | | 7.29 | | | | | | — | | | | — | | | | — | | | | 33.58 | |
2012 | | | 25.42 | | | | (0.11 | ) | | | 0.98 | | | | 0.87 | | | | | | — | | | | — | | | | — | | | | 26.29 | |
2011 | | | 18.40 | | | | (0.14 | ) | | | 7.16 | | | | 7.02 | | | | | | — | | | | — | | | | — | | | | 25.42 | |
2010 | | | 14.21 | | | | (0.04 | ) | | | 4.28 | | | | 4.24 | | | | | | (0.05 | ) | | | — | | | | (0.05 | ) | | | 18.40 | |
| | | | | | | | | | | | | | | | | | | | | | | | | | | | | | |
| | | | Ratios/Supplemental Data | |
| | | | | | | | | Ratios to Average
Net Assets Before
Waiver/Reimbursement | | | | | Ratios to Average
Net Assets After
Waiver/Reimbursement(c) | | | | |
| | | | | | | | |
Total
Return(b) | | | Ending
Net
Assets
(000) | | | | | Expenses | | | Net
Investment
Income
(Loss) | | | | | Expenses | | | Net
Investment
Income
(Loss) | | | Portfolio
Turnover
Rate(f) | |
| | | | | | | | | | | | | | | | | | | | | | | | | | | | | | |
| | 28.61 | % | | $ | 51,477 | | | | | | 1.36 | % | | | (0.73 | )% | | | | | 1.36 | % | | | (0.73 | )% | | | 49 | % |
| | 27.41 | | | | 10,229 | | | | | | 1.38 | | | | (0.40 | ) | | | | | 1.38 | | | | (0.40 | ) | | | 41 | |
| | 3.09 | | | | 7,107 | | | | | | 1.45 | | | | (0.68 | ) | | | | | 1.45 | | | | (0.68 | ) | | | 44 | |
| | 37.94 | | | | 7,365 | | | | | | 1.43 | | | | (0.82 | ) | | | | | 1.43 | | | | (0.82 | ) | | | 51 | |
| | 29.41 | | | | 7,009 | | | | | | 1.47 | | | | (0.56 | ) | | | | | 1.45 | | | | (0.54 | ) | | | 58 | |
| | | | | | | | | | | | | | | | | | | | | | | | | | | | | | |
| | 27.61 | | | | 18,004 | | | | | | 2.11 | | | | (1.50 | ) | | | | | 2.11 | | | | (1.50 | ) | | | 49 | |
| | 26.48 | | | | 5,739 | | | | | | 2.12 | | | | (1.12 | ) | | | | | 2.12 | | | | (1.12 | ) | | | 41 | |
| | 2.36 | | | | 4,308 | | | | | | 2.19 | | | | (1.43 | ) | | | | | 2.19 | | | | (1.43 | ) | | | 44 | |
| | 36.96 | | | | 4,401 | | | | | | 2.18 | | | | (1.58 | ) | | | | | 2.18 | | | | (1.58 | ) | | | 51 | |
| | 28.42 | | | | 3,494 | | | | | | 2.21 | | | | (1.23 | ) | | | | | 2.19 | | | | (1.21 | ) | | | 58 | |
| | | | | | | | | | | | | | | | | | | | | | | | | | | | | | |
| | 28.27 | | | | 2,632 | | | | | | 1.61 | | | | (1.01 | ) | | | | | 1.61 | | | | (1.01 | ) | | | 49 | |
| | 27.13 | | | | 715 | | | | | | 1.68 | | | | (0.78 | ) | | | | | 1.68 | | | | (0.78 | ) | | | 41 | |
| | 2.85 | | | | 72 | | | | | | 1.69 | | | | (0.93 | ) | | | | | 1.69 | | | | (0.93 | ) | | | 44 | |
| | 37.64 | | | | 75 | | | | | | 1.68 | | | | (1.08 | ) | | | | | 1.68 | | | | (1.08 | ) | | | 51 | |
| | 1.60 | | | | 51 | | | | | | 1.68 | * | | | (0.57 | )* | | | | | 1.68 | * | | | (0.57 | )* | | | 58 | |
| | | | | | | | | | | | | | | | | | | | | | | | | | | | | | |
| | 29.02 | | | | 3,138 | | | | | | 1.02 | | | | (0.42 | ) | | | | | 1.02 | | | | (0.42 | ) | | | 49 | |
| | 7.73 | | | | 2,092 | | | | | | 1.10 | * | | | (0.82 | )* | | | | | 1.10 | * | | | (0.82 | )* | | | 41 | |
| | | | | | | | | | | | | | | | | | | | | | | | | | | | | | |
| | 28.89 | | | | 252,554 | | | | | | 1.11 | | | | (0.50 | ) | | | | | 1.11 | | | | (0.50 | ) | | | 49 | |
| | 27.73 | | | | 136,659 | | | | | | 1.12 | | | | (0.14 | ) | | | | | 1.12 | | | | (0.14 | ) | | | 41 | |
| | 3.38 | | | | 91,213 | | | | | | 1.19 | | | | (0.43 | ) | | | | | 1.19 | | | | (0.43 | ) | | | 44 | |
| | 38.28 | | | | 85,136 | | | | | | 1.18 | | | | (0.58 | ) | | | | | 1.18 | | | | (0.58 | ) | | | 51 | |
| | 29.74 | | | | 74,824 | | | | | | 1.21 | | | | (0.23 | ) | | | | | 1.19 | | | | (0.21 | ) | | | 58 | |
| (a) | Per share Net Investment Income (Loss) is calculated using the average daily shares method. | |
| (b) | Total return is the combination of changes in NAV without any sales charge, reinvested dividend income at NAV and reinvested capital gains distributions at NAV, if any. Total returns are not annualized. | |
| (c) | After fee waiver and/or expense reimbursement from the Adviser, where applicable. | |
| (d) | For the period September 29, 2009 (commencement of operations) through June 30, 2010. | |
| (e) | For the period February 15, 2013 (commencement of operations) through June 30, 2013. | |
| (f) | Portfolio Turnover Rate is calculated based on the lesser of long-term purchases or sales (as disclosed in Note 5 – Investment Transactions) divided by the average long-term market value during the period. | |
See accompanying notes to financial statements.
Financial Highlights (continued)
Value Opportunities
Selected data for a share outstanding throughout each period:
| | | | | | | | | | | | | | | | | | | | | | | | | | | | | | | | | | |
| | | | | |
| | | | | | Investment Operations
| | | | | Less Distributions | | | | |
| | | | | | | | | |
Class (Commencement Date) Year Ended June 30, | | Beginning
NAV | | | Net
Investment
Income
(Loss)(a) | | | Net
Realized/
Unrealized
Gain (Loss) | | | Total | | | | | From
Net
Investment
Income | | | From
Accumulated
Net Realized
Gains | | | Total | | | Ending
NAV | |
Class A (12/04) | | | | | | | | | | | | | | | | | | | | | | | | | | | | | | | | | | |
2014 | | $ | 32.96 | | | $ | 0.36 | | | $ | 6.97 | | | $ | 7.33 | | | | | $ | (0.37 | ) | | $ | (1.04 | ) | | $ | (1.41 | ) | | $ | 38.88 | |
2013 | | | 28.51 | | | | 0.18 | | | | 5.40 | | | | 5.58 | | | | | | (1.13 | ) | | | — | | | | (1.13 | ) | | | 32.96 | |
2012 | | | 35.58 | | | | 0.34 | | | | (4.64 | ) | | | (4.30 | ) | | | | | (0.75 | ) | | | (2.02 | ) | | | (2.77 | ) | | | 28.51 | |
2011 | | | 29.76 | | | | 0.23 | | | | 7.26 | | | | 7.49 | | | | | | (0.51 | ) | | | (1.16 | ) | | | (1.67 | ) | | | 35.58 | |
2010 | | | 24.17 | | | | 0.13 | | | | 5.46 | | | | 5.59 | | | | | | — | | | | — | | | | — | | | | 29.76 | |
Class C (12/04) | | | | | | | | | | | | | | | | | | | | | | | | | | | | | | | | | | |
2014 | | | 32.10 | | | | 0.10 | | | | 6.76 | | | | 6.86 | | | | | | (0.11 | ) | | | (1.04 | ) | | | (1.15 | ) | | | 37.81 | |
2013 | | | 27.76 | | | | (0.04 | ) | | | 5.26 | | | | 5.22 | | | | | | (0.88 | ) | | | — | | | | (.88 | ) | | | 32.10 | |
2012 | | | 34.68 | | | | 0.13 | | | | (4.55 | ) | | | (4.42 | ) | | | | | (0.48 | ) | | | (2.02 | ) | | | (2.50 | ) | | | 27.76 | |
2011 | | | 29.06 | | | | (0.03 | ) | | | 7.07 | | | | 7.04 | | | | | | (0.26 | ) | | | (1.16 | ) | | | (1.42 | ) | | | 34.68 | |
2010 | | | 23.77 | | | | (0.09 | ) | | | 5.38 | | | | 5.29 | | | | | | — | | | | — | | | | — | | | | 29.06 | |
Class R3 (8/08) | | | | | | | | | | | | | | | | | | | | | | | | | | | | | | | | | | |
2014 | | | 32.96 | | | | 0.28 | | | | 6.95 | | | | 7.23 | | | | | | (0.28 | ) | | | (1.04 | ) | | | (1.32 | ) | | | 38.87 | |
2013 | | | 28.51 | | | | 0.12 | | | | 5.39 | | | | 5.51 | | | | | | (1.06 | ) | | | — | | | | (1.06 | ) | | | 32.96 | |
2012 | | | 35.57 | | | | 0.30 | | | | (4.67 | ) | | | (4.37 | ) | | | | | (0.67 | ) | | | (2.02 | ) | | | (2.69 | ) | | | 28.51 | |
2011 | | | 29.76 | | | | 0.17 | | | | 7.23 | | | | 7.40 | | | | | | (0.43 | ) | | | (1.16 | ) | | | (1.59 | ) | | | 35.57 | |
2010 | | | 24.23 | | | | 0.07 | | | | 5.46 | | | | 5.53 | | | | | | — | | | | — | | | | — | | | | 29.76 | |
Class I (12/04) | | | | | | | | | | | | | | | | | | | | | | | | | | | | | | | | | | |
2014 | | | 33.09 | | | | 0.45 | | | | 6.99 | | | | 7.44 | | | | | | (0.45 | ) | | | (1.04 | ) | | | (1.49 | ) | | | 39.04 | |
2013 | | | 28.62 | | | | 0.26 | | | | 5.42 | | | | 5.68 | | | | | | (1.21 | ) | | | — | | | | (1.21 | ) | | | 33.09 | |
2012 | | | 35.72 | | | | 0.42 | | | | (4.66 | ) | | | (4.24 | ) | | | | | (0.84 | ) | | | (2.02 | ) | | | (2.86 | ) | | | 28.62 | |
2011 | | | 29.87 | | | | 0.31 | | | | 7.29 | | | | 7.60 | | | | | | (0.59 | ) | | | (1.16 | ) | | | (1.75 | ) | | | 35.72 | |
2010 | | | 24.19 | | | | 0.20 | | | | 5.48 | | | | 5.68 | | | | | | — | | | | — | | | | — | | | | 29.87 | |
| | | | | | | | | | | | | | | | | | | | | | | | | | | | | | |
| | | | Ratios/Supplemental Data | |
| | | | | | | | | Ratios to Average
Net Assets Before
Waiver/Reimbursement | | | | | Ratios to Average
Net Assets After
Waiver/Reimbursement(c) | | | | |
| | | | | | | | |
Total
Return(b) | | | Ending
Net
Assets
(000) | | | | | Expenses | | | Net
Investment
Income
(Loss) | | | | | Expenses | | | Net
Investment
Income
(Loss) | | | Portfolio
Turnover
Rate(d) | |
| | | | | | | | | | | | | | | | | | | | | | | | | | | | | | |
| | 22.67 | % | | $ | 225,212 | | | | | | 1.25 | % | | | 1.01 | % | | | | | 1.25 | % | | | 1.01 | % | | | 107 | % |
| | 20.08 | | | | 244,827 | | | | | | 1.35 | | | | 0.60 | | | | | | 1.35 | | | | 0.60 | | | | 84 | |
| | (12.46 | ) | | | 492,397 | | | | | | 1.17 | | | | 1.05 | | | | | | 1.17 | | | | 1.05 | | | | 97 | |
| | 25.31 | | | | 1,291,888 | | | | | | 1.20 | | | | 0.65 | | | | | | 1.20 | | | | 0.65 | | | | 77 | |
| | 23.13 | | | | 658,037 | | | | | | 1.43 | | | | 0.44 | | | | | | 1.43 | | | | 0.44 | | | | 48 | |
| | | | | | | | | | | | | | | | | | | | | | | | | | | | | | |
| | 21.75 | | | | 124,326 | | | | | | 2.00 | | | | 0.27 | | | | | | 2.00 | | | | 0.27 | | | | 107 | |
| | 19.15 | | | | 130,098 | | | | | | 2.09 | | | | (0.13 | ) | | | | | 2.09 | | | | (0.13 | ) | | | 84 | |
| | (13.11 | ) | | | 224,079 | | | | | | 1.91 | | | | 0.40 | | | | | | 1.91 | | | | 0.40 | | | | 97 | |
| | 24.39 | | | | 436,074 | | | | | | 1.95 | | | | (0.07 | ) | | | | | 1.95 | | | | (0.07 | ) | | | 77 | |
| | 22.25 | | | | 192,332 | | | | | | 2.19 | | | | (0.31 | ) | | | | | 2.19 | | | | (0.31 | ) | | | 48 | |
| | | | | | | | | | | | | | | | | | | | | | | | | | | | | | |
| | 22.36 | | | | 4,800 | | | | | | 1.50 | | | | 0.78 | | | | | | 1.50 | | | | 0.78 | | | | 107 | |
| | 19.77 | | | | 4,503 | | | | | | 1.58 | | | | 0.38 | | | | | | 1.58 | | | | 0.38 | | | | 84 | |
| | (12.67 | ) | | | 6,298 | | | | | | 1.40 | | | | 0.93 | | | | | | 1.40 | | | | 0.93 | | | | 97 | |
| | 25.00 | | | | 6,880 | | | | | | 1.45 | | | | 0.49 | | | | | | 1.45 | | | | 0.49 | | | | 77 | |
| | 22.82 | | | | 1,444 | | | | | | 1.71 | | | | 0.22 | | | | | | 1.71 | | | | 0.22 | | | | 48 | |
| | | | | | | | | | | | | | | | | | | | | | | | | | | | | | |
| | 22.95 | | | | 140,424 | | | | | | 0.99 | | | | 1.25 | | | | | | 0.99 | | | | 1.25 | | | | 107 | |
| | 20.39 | | | | 176,899 | | | | | | 1.09 | | | | 0.84 | | | | | | 1.09 | | | | 0.84 | | | | 84 | |
| | (12.27 | ) | | | 400,383 | | | | | | 0.92 | | | | 1.28 | | | | | | 0.92 | | | | 1.28 | | | | 97 | |
| | 25.64 | | | | 1,749,117 | | | | | | 0.95 | | | | 0.91 | | | | | | 0.95 | | | | 0.91 | | | | 77 | |
| | 23.48 | | | | 1,046,939 | | | | | | 1.18 | | | | 0.69 | | | | | | 1.18 | | | | 0.69 | | | | 48 | |
| (a) | Per share Net Investment Income (Loss) is calculated using the average daily shares method. | |
| (b) | Total return is the combination of changes in NAV without any sales charge, reinvested dividend income at NAV and reinvested capital gains distributions at NAV, if any. Total returns are not annualized. | |
| (c) | After fee waiver and/or expense reimbursement from the Adviser, where applicable. | |
| (d) | Portfolio Turnover Rate is calculated based on the lesser of long-term purchases or sales (as disclosed in Note 5 – Investment Transactions) divided by the average long-term market value during the period. | |
See accompanying notes to financial statements.
Notes to
Financial Statements
1. General Information and Significant Accounting Policies
General Information
Trust Information
The Nuveen Investment Trust (the “Trust”), is an open-end management investment company registered under the Investment Company Act of 1940, as amended. The Trust is comprised of the Nuveen NWQ Global Equity Fund (“NWQ Global Equity”), Nuveen NWQ Global Equity Income Fund, formerly Nuveen NWQ Equity Income Fund (“NWQ Global Equity Income”), Nuveen NWQ Multi-Cap Value Fund (“NWQ Multi-Cap Value”), Nuveen NWQ Large-Cap Value Fund (“NWQ Large-Cap Value”), Nuveen NWQ Small/Mid-Cap Value Fund (“NWQ Small/Mid-Cap Value”), Nuveen NWQ Small-Cap Value Fund (“NWQ Small-Cap Value”) and Nuveen Tradewinds Value Opportunities Fund (“Value Opportunities”) (each a “Fund” and collectively, the “Funds”), as diversified funds, among others. The Trust was organized as a Massachusetts business trust in 1996. NWQ Global Equity commenced operations on April 1, 2014.
Investment Adviser
The Funds’ investment adviser is Nuveen Fund Advisors, LLC (the “Adviser”), a wholly-owned subsidiary of Nuveen Investments, Inc. (“Nuveen”). The Adviser is responsible for each Fund’s overall investment strategy and asset allocation decisions. The Adviser has entered into sub-advisory agreements for NWQ Global Equity, NWQ Global Equity Income, NWQ Multi-Cap Value, NWQ Large-Cap Value, NWQ Small/Mid-Cap Value and NWQ Small-Cap Value with NWQ Investment Management Company, LLC (“NWQ”), an affiliate of Nuveen, and for Tradewinds Value Opportunities with Tradewinds Global Investors, LLC (“Tradewinds”), an affiliate of Nuveen, under which NWQ and Tradewinds manage the investment portfolios for their respective Funds.
Agreement and Plan of Merger
On April 14, 2014, TIAA-CREF, a national financial services organization, announced that it had entered into an agreement (the “Purchase Agreement”) to acquire Nuveen, the parent company of the Adviser. The transaction is expected to be completed by the end of the year, subject to customary closing conditions, including obtaining necessary Nuveen fund and client consents sufficient to satisfy the terms of the Purchase Agreement and obtaining customary regulatory approvals. There can be no assurance that the transaction described above will be consummated as contemplated or that necessary conditions will be satisfied.
The consummation of the transaction will be deemed to be an “assignment” (as defined in the Investment Company Act of 1940) of the investment management agreements between the Nuveen funds and the Adviser and the investment sub-advisory agreements between the Adviser and each Nuveen fund’s sub-adviser or sub-advisers, and will result in automatic termination of each agreement. It is anticipated that the Board of Directors/ Trustees of the Nuveen funds will consider a new investment management agreement with the Adviser and new investment sub-advisory agreements with each sub-adviser.
The transaction is not expected to result in any change in the portfolio management of the Funds or in the Funds’ investment objective or policies.
Class B Shares
During the current fiscal period, NWQ Multi-Cap Value and Value Opportunities offered Class B Shares. Effective at the close of business on June 23, 2014, Class B Shares of NWQ Multi-Cap Value and Value Opportunities converted to Class A Shares and are no longer available through an exchange from other Nuveen mutual funds.
Investment Objectives and Principal Investment Strategies
NWQ Global Equity’s investment objective is to provide investors with long-term capital appreciation. Under normal market conditions, the Fund invests at least 80% of the sum of its net assets and the amount of any borrowings for investment purposes in equity securities. The Fund may invest in securities of issuers located anywhere in the world. Under normal market conditions, the Fund invests at least 40% of its net assets in non-U.S. securities and invests in securities of companies representing at least three different countries (one of which may be the United States). The Fund may invest up to 20% of its net assets in securities of companies located in emerging markets. The Fund may invest in equity securities issued by companies of any market capitalization, including small- and mid-capitalization companies. The Fund may also utilize derivatives, including currency options, currency futures and options on such futures, and currency forwards in an attempt to manage market or business risk, enhance the Fund’s return or hedge against adverse movements in currency exchange rates.
NWQ Global Equity Income’s investment objective is to provide high current income and long-term capital appreciation. During the period July 1, 2013 through December 12, 2013, under normal market conditions, the Fund invests at least 80% of the sum of its net assets and the amount of any borrowings for investment purposes in equity securities. The Fund invested primarily in income producing common stocks, but could also invest in preferred securities, convertible securities and corporate debt securities. The Fund could also write covered call options on securities in which the Fund
held a long position. The Fund could invest up to 20% of its net assets in fixed-income securities, including up to 10% of its net assets in below investment-grade debt securities, commonly referred to as “high yield,” “high risk” or “junk” bonds. The Fund could also invest up to 25% of its net assets in non-U.S. securities, including up to 10% of its net assets in securities of companies located in emerging markets. Effective December 13, 2013, the Fund’s principal investment strategy was changed to allow the Fund to invest in securities of issuers located anywhere in the world. Under normal market conditions, the Fund will invest at least 40% of its net assets in non-U.S. securities and will invest in securities of at least three different countries (one of which may be the United States). The Fund may invest up to 20% of its net assets in securities of companies located in emerging markets. The Fund may also utilize derivatives, including currency options, currency futures and options on such futures, and currency forwards, in an attempt to manage market or business risk, enhance the Fund’s return or hedge against adverse movements in currency exchange rates. Concurrent with these changes, effective December 13, 2013, the Fund changed its name from Nuveen NWQ Equity Income Fund.
NWQ Multi-Cap Value’s investment objective is to provide investors with long-term capital appreciation. Under normal market conditions, the Fund invests at least 80% of its net assets in equity securities of companies with large, medium and small capitalizations. The Fund invests primarily in U.S. equity securities, but it may invest up to 35% of its net assets in non-U.S. equity securities, including up to 10% of its net assets in equity securities of companies located in emerging market countries.
NWQ’s Large-Cap Value’s investment objective is to provide investors with long-term capital appreciation. Under normal market conditions, the Fund invests at least 80% of the sum of its net assets and the amount of any borrowings for investment purposes in equity securities of companies with market capitalizations at the time of investment comparable to companies in the Russell 1000® Value Index. The Fund invests primarily in U.S. equity securities, but it may invest up to 35% of its net assets in non-U.S. equity securities, including up to 10% of its net assets in equity securities of companies located in emerging market countries.
NWQ Small/Mid-Cap Value’s investment objective is to provide investors with long-term capital appreciation. Under normal market conditions, the Fund invests at least 80% of the sum of its net assets and the amount of any borrowings for investment purposes in equity securities of companies with market capitalizations at the time of investment comparable to companies in the Russell 2500® Value Index. The Fund invests primarily in U.S. equity securities, but it may invest up to 35% of its net assets in non-U.S. equity securities, including up to 10% of its net assets in equity securities of companies located in emerging market countries.
NWQ Small-Cap Value’s investment objective is to provide investors with long-term capital appreciation. Under normal market conditions, the Fund invests at least 80% of the sum of its net assets and the amount of any borrowings for investment purposes in equity securities of companies with market capitalizations at the time of investment comparable to companies in either the Russell 2000® Value Index or the Standard & Poor’s SmallCap 600 Index. The Fund invests primarily in U.S. equity securities, but it may invest up to 35% of its net assets in non-U.S. equity securities, including up to 10% of its net assets in equity securities of companies located in emerging market countries.
Value Opportunities’ investment objective is to provide investors with long-term capital appreciation. Under normal market conditions, the Fund invests primarily in equity securities of companies with varying market capitalizations, which may include small-, mid- and large-capitalization companies. The Fund invests primarily in U.S. equity securities, but it may invest up to 35% of its net assets in non-U.S. equity securities, including up to 15% of its net assets in equity securities of companies located in emerging market countries.
The Funds’ most recent prospectus provides further descriptions of each Fund’s investment objective, principal investment strategies and principal risks.
Significant Accounting Policies
The following is a summary of significant accounting policies followed by the Funds in the preparation of their financial statements in accordance with accounting principles generally accepted in the United States (“U.S. GAAP”).
Investment Transactions
Investment transactions are recorded on a trade date basis. Realized gains and losses from investment transactions are determined on the specific identification method, which is the same basis used for federal income tax purposes. Investments purchased on a when-issued/delayed delivery basis may have extended settlement periods. Any investments so purchased are subject to market fluctuation during this period. The Funds have instructed the custodian to earmark securities in the Funds’ portfolios with a current value at least equal to the amount of the when-issued/delayed delivery purchase commitments. As of June 30, 2014, there were no such outstanding purchase commitments in any of the Funds.
Investment Income
Dividend income is recorded on the ex-dividend date or, for foreign securities, when information is available. Interest income, which reflects the amortization of premiums and includes accretion of discounts for financial reporting purposes, is recorded on an accrual basis. Interest income also reflects paydown gains and losses, if any.
Notes to Financial Statements (continued)
Professional Fees
Professional fees presented on the Statement of Operations consist of legal fees incurred in the normal course of operations, audit fees, tax consulting fees and, in some cases, workout expenditures. Workout expenditures are incurred in an attempt to protect or enhance an investment or to pursue other claims or legal actions on behalf of Fund shareholders. If a refund is received for workout expenditures paid in prior reporting period such amounts will be recognized as “Legal fee refund” on the Statement of Operations.
Dividends and Distributions to Shareholders
Dividends from net investment income, if any, are declared and distributed to shareholders at least annually (except for NWQ Global Equity Income, which are declared and distributed to shareholders quarterly). Net realized capital gains from investment transactions, if any, are declared and distributed to shareholders at least annually. Furthermore, capital gains are distributed only to the extent they exceed available capital loss carryforwards.
Distributions to shareholders are recorded on the ex-dividend date. The amount and timing of distributions are determined in accordance with federal income tax regulations, which may differ from U.S. GAAP.
Share Classes and Sales Charges
Class A Shares are generally sold with an up-front sales charge and incur a .25% annual 12b-1 service fee. Class A Share purchases of $1 million or more are sold at net asset value (“NAV”) without an up-front sales charge but may be subject to a contingent deferred sales charge (“CDSC”) if redeemed within twelve months of purchase. NWQ Multi-Cap Value and Value Opportunities issued Class B Shares upon the exchange of Class B Shares from another Nuveen mutual fund or for purposes of dividend reinvestment, but Class B Shares were not available for new accounts or for additional investment into existing accounts. Class B Shares were sold without an up-front sales charge but incurred a .75% annual 12b-1 distribution fee and a .25% annual 12b-1 service fee. Class B Shares were subject to a CDSC of up to 5% depending upon the length of time the shares were held by the investor (CDSC was reduced to 0% at the end of six years). Class B Shares automatically converted to Class A Shares eight years after purchase. Class C Shares are sold without an up-front sales charge but incur a .75% annual 12b-1 distribution fee and a .25% annual 12b-1 service fee. Class C Shares are subject to a CDSC of 1% if redeemed within twelve months of purchase. Class R3 Shares are sold without an up-front sales charge but incur a .25% annual 12b-1 distribution fee and a .25% annual 12b-1 service fee. Class R6 Shares and Class I Shares are not subject to any sales charge or 12b-1 distribution or service fees.
Class R3 Shares of NWQ Global Equity Income are not available for public offering.
Multiclass Operations and Allocations
Income and expenses of the Funds that are not directly attributable to a specific class of shares are prorated among the classes based on the relative net assets of each class. Expenses directly attributable to a class of shares are recorded to the specific class. Currently, the only expenses that are allocated on a class-specific basis are 12b-1 distribution and shareholder service fees. Sub-transfer agent fees, which are recognized as a component of “Shareholder servicing agent fees and expenses” on the Statement of Operations and are prorated among the classes based on the relative net assets of each class, and are not charged to Class R6 Shares.
Income, realized and unrealized capital gains and losses of the Funds are prorated among the classes based on the relative net assets of each class.
Indemnifications
Under the Trust’s organizational documents, its officers and trustees are indemnified against certain liabilities arising out of the performance of their duties to the Trust. In addition, in the normal course of business, the Trust enters into contracts that provide general indemnifications to other parties. The Trust’s maximum exposure under these arrangements is unknown as this would involve future claims that may be made against the Trust that have not yet occurred. However, the Trust has not had prior claims or losses pursuant to these contracts and expects the risk of loss to be remote.
Netting Agreements
In the ordinary course of business, the Funds may enter into transactions subject to enforceable master repurchase agreements, International Swaps and Derivative Association, Inc. (“ISDA”) master agreements or other similar arrangements (“netting agreements”). Generally, the right to offset in netting agreements allows each Fund to offset any exposure to a specific counterparty with any collateral received or delivered to that counterparty based on the terms of the agreements. Generally, each Fund manages its cash collateral and securities collateral on a counterparty basis.
As of June 30, 2014, the Funds were invested in repurchase agreements that are subject to netting agreements and further described in Note 3 –Portfolio Securities and Investments in Derivatives.
Use of Estimates
The preparation of financial statements in conformity with U.S. GAAP requires management to make estimates and assumptions that affect the reported amounts of assets and liabilities at the date of the financial statements and the reported amounts of increases and decreases in net assets from operations during the reporting period. Actual results may differ from those estimates.
2. Investment Valuation and Fair Value Measurements
The fair valuation input levels as described below are for fair value measurement purposes.
Investment Valuation
Common stocks and other equity-type securities are valued at the last sales price on the securities exchange on which such securities are primarily traded and are generally classified as Level 1. Securities primarily traded on the NASDAQ National Market (“NASDAQ”) are valued at the NASDAQ Official Closing Price and are generally classified as Level 1. However, securities traded on a securities exchange or NASDAQ for which there were no transactions on a given day or securities not listed on a securities exchange or NASDAQ are valued at the quoted bid price and are generally classified as Level 2. Prices of certain American Depositary Receipts (“ADR”) held by the Funds that trade in the United States are valued based on the last traded price, official closing price or the most recent bid price of the underlying non-U.S.-traded stock, adjusted as appropriate for the underlying-to-ADR conversion ratio and foreign exchange rate, and from time-to-time may also be adjusted further to take into account material events that may take place after the close of the local non-U.S. market but before the close of the New York Stock Exchange, which may represent a transfer from a Level 1 to a Level 2 security.
Prices of fixed-income securities are provided by a pricing service approved by the Nuveen funds’ Board of Directors/Trustees. These securities are generally classified as Level 2. The pricing service establishes a security’s fair value using methods that may include consideration of the following: yields or prices of investments of comparable quality, type of issue, coupon, maturity and rating, market quotes or indications of value from security dealers, evaluations of anticipated cash flows or collateral, general market conditions and other information and analysis, including the obligor’s credit characteristics considered relevant. In pricing certain securities, particularly less liquid and lower quality securities, the pricing service may consider information about a security, its issuer or market activity provided by the Adviser. These securities are generally classified as Level 2 or Level 3 depending on the priority of the significant inputs.
The value of exchange-traded options are based on the mean of the closing bid and ask prices. Exchange-traded options are generally classified as Level 1. Options traded in the over-the-counter market are valued using an evaluated mean price and are generally classified as Level 2.
Repurchase agreements are valued at contract amount plus accrued interest, which approximates market value. These securities are generally classified as Level 2.
Certain securities may not be able to be priced by the pre-established pricing methods as described above. Such securities may be valued by the Nuveen funds’ Board of Directors/Trustees or its designee at fair value. These securities generally include, but are not limited to, restricted securities (securities which may not be publicly sold without registration under the Securities Act of 1933, as amended) for which a pricing service is unable to provide a market price; securities whose trading has been formally suspended; debt securities that have gone into default and for which there is no current market quotation; a security whose market price is not available from a pre-established pricing source; a security with respect to which an event has occurred that is likely to materially affect the value of the security after the market has closed but before the calculation of a fund’s NAV (as may be the case in non-U.S. markets on which the security is primarily traded) or make it difficult or impossible to obtain a reliable market quotation; and a security whose price, as provided by the pricing service, is not deemed to reflect the security’s fair value. As a general principle, the fair value of a security would appear to be the amount that the owner might reasonably expect to receive for it in a current sale. A variety of factors may be considered in determining the fair value of such securities, which may include consideration of the following: yields or prices of investments of comparable quality, type of issue, coupon, maturity and rating, market quotes or indications of value from security dealers, evaluations of anticipated cash flows or collateral, general market conditions and other information and analysis, including the obligor’s credit characteristics considered relevant. These securities are generally classified as Level 2 or Level 3 depending on the priority of the significant inputs. Regardless of the method employed to value a particular security, all valuations are subject to review by the Nuveen funds’ Board of Directors/Trustees or its designee.
Fair Value Measurements
Fair value is defined as the price that would be received upon selling an investment or transferring a liability in an orderly transaction to an independent buyer in the principal or most advantageous market for the investment. A three-tier hierarchy is used to maximize the use of observable market data and minimize the use of unobservable inputs and to establish classification of fair value measurements for disclosure purposes. Observable inputs reflect the assumptions market participants would use in pricing the asset or liability. Observable inputs are based on market data obtained from sources independent of the reporting entity. Unobservable inputs reflect the reporting entity’s own assumptions about the assumptions market
Notes to Financial Statements (continued)
participants would use in pricing the asset or liability. Unobservable inputs are based on the best information available in the circumstances. The following is a summary of the three-tiered hierarchy of valuation input levels.
| | |
| Level 1 – | | Inputs are unadjusted and prices are determined using quoted prices in active markets for identical securities. |
| Level 2 – | | Prices are determined using other significant observable inputs (including quoted prices for similar securities, interest rates, prepayment speeds, credit risk, etc.). |
| Level 3 – | | Prices are determined using significant unobservable inputs (including management’s assumptions in determining the fair value of investments). |
The inputs or methodologies used for valuing securities are not an indication of the risks associated with investing in those securities. The following is a summary of each Fund’s fair value measurements as of the end of the reporting period:
| | | | | | | | | | | | | | | | |
| NWQ Global Equity | | Level 1 | | | Level 2 | | | Level 3 | | | Total | |
| Long-Term Investments*: | | | | | | | | | | | | | | | | |
Common Stocks | | $ | 1,018,365 | | | $ | — | | | $ | — | | | $ | 1,018,365 | |
| | | | |
| NWQ Global Equity Income | | | | | | | | | | | | |
| Long-Term Investments*: | | | | | | | | | | | | | | | | |
Common Stocks | | $ | 1,683,623 | | | $ | — | | | $ | — | | | $ | 1,683,623 | |
Convertible Preferred Securities | | | 12,728 | | | | — | | | | — | | | | 12,728 | |
$25 Par (or similar) Retail Preferred | | | 15,131 | | | | — | | | | — | | | | 15,131 | |
$1,000 Par (or similar) Institutional Preferred | | | — | | | | 12,240 | | | | — | | | | 12,240 | |
| Investments in Derivatives: | | | | | | | | | | | | | | | | |
Options Written | | | (358 | ) | | | — | | | | — | | | | (358 | ) |
| Total | | $ | 1,711,124 | | | $ | 12,240 | | | $ | — | | | $ | 1,723,364 | |
| | | | |
| NWQ Multi-Cap Value | | | | | | | | | | | | |
| Long-Term Investments*: | | | | | | | | | | | | | | | | |
Common Stocks | | $ | 165,804,994 | | | $ | — | | | $ | — | | | $ | 165,804,994 | |
| Short-Term Investments: | | | | | | | | | | | | | | | | |
Repurchase Agreements | | | — | | | | 429,804 | | | | — | | | | 429,804 | |
| Total | | $ | 165,804,994 | | | $ | 429,804 | | | $ | — | | | $ | 166,234,798 | |
| | | | |
| NWQ Large-Cap Value | | | | | | | | | | | | |
| Long-Term Investments*: | | | | | | | | | | | | | | | | |
Common Stocks | | $ | 704,207,116 | | | $ | — | | | $ | — | | | $ | 704,207,116 | |
| Short-Term Investments: | | | | | | | | | | | | | | | | |
Repurchase Agreements | | | — | | | | 10,994,065 | | | | — | | | | 10,994,065 | |
| Total | | $ | 704,207,116 | | | $ | 10,994,065 | | | $ | — | | | $ | 715,201,181 | |
| | | | |
| NWQ Small/Mid-Cap Value | | | | | | | | | | | | |
| Long-Term Investments*: | | | | | | | | | | | | | | | | |
Common Stocks | | $ | 64,776,766 | | | $ | — | | | $ | — | | | $ | 64,776,766 | |
| Short-Term Investments: | | | | | | | | | | | | | | | | |
Repurchase Agreements | | | — | | | | 1,365,340 | | | | — | | | | 1,365,340 | |
| Total | | $ | 64,776,766 | | | $ | 1,365,340 | | | $ | — | | | $ | 66,142,106 | |
| | | | |
| NWQ Small-Cap Value | | | | | | | | | | | | |
| Long-Term Investments*: | | | | | | | | | | | | | | | | |
Common Stocks | | $ | 304,815,359 | | | $ | — | | | $ | — | | | $ | 304,815,359 | |
| Short-Term Investments: | | | | | | | | | | | | | | | | |
Repurchase Agreements | | | — | | | | 21,081,242 | | | | — | | | | 21,081,242 | |
| Total | | $ | 304,815,359 | | | $ | 21,081,242 | | | $ | — | | | $ | 325,896,601 | |
| | | | | | | | | | | | | | | | |
| Value Opportunities | | Level 1 | | | Level 2 | | | Level 3 | | | Total | |
| Long-Term Investments*: | | | | | | | | | | | | | | | | |
Common Stocks | | $ | 434,381,340 | | | $ | 45,788,607 | | | $ | — | | | $ | 480,169,947 | |
| Short-Term Investments: | | | | | | | | | | | | | | | | |
Repurchase Agreements | | | — | | | | 13,354,669 | | | | — | | | | 13,354,669 | |
| Total | | $ | 434,381,340 | | | $ | 59,143,276 | | | $ | — | | | $ | 493,524,616 | |
| * | Refer to the Fund’s Portfolio of Investments for industry classifications and a breakdown of Common Stocks classified as Level 2, where applicable. |
The Nuveen funds’ Board of Directors/Trustees is responsible for the valuation process and has delegated the oversight of the daily valuation process to the Adviser’s Valuation Committee. The Valuation Committee, pursuant to the valuation policies and procedures adopted by the Board of Directors/Trustees, is responsible for making fair value determinations, evaluating the effectiveness of the funds’ pricing policies and reporting to the Board of Directors/Trustees. The Valuation Committee is aided in its efforts by the Adviser’s dedicated Securities Valuation Team, which is responsible for administering the daily valuation process and applying fair value methodologies as approved by the Valuation Committee. When determining the reliability of independent pricing services for investments owned by the funds, the Valuation Committee, among other things, conducts due diligence reviews of the pricing services and monitors the quality of security prices received through various testing reports conducted by the Securities Valuation Team.
The Valuation Committee will consider pricing methodologies it deems relevant and appropriate when making a fair value determination, based on the facts and circumstances specific to the portfolio instrument. Fair value determinations generally will be derived as follows, using public or private market information:
| | (i) | If available, fair value determinations shall be derived by extrapolating from recent transactions or quoted prices for identical or comparable securities. |
| | (ii) | If such information is not available, an analytical valuation methodology may be used based on other available information including, but not limited to: analyst appraisals, research reports, corporate action information, issuer financial statements and shelf registration statements. Such analytical valuation methodologies may include, but are not limited to: multiple of earnings, discount from market value of a similar freely-traded security, discounted cash flow analysis, book value or a multiple thereof, risk premium/yield analysis, yield to maturity and/or fundamental investment analysis. |
The purchase price of a portfolio instrument will be used to fair value the instrument only if no other valuation methodology is available or deemed appropriate, and it is determined that the purchase price fairly reflects the instrument’s current value.
For each portfolio security that has been fair valued pursuant to the policies adopted by the Board of Directors/Trustees, the fair value price is compared against the last available and next available market quotations. The Valuation Committee reviews the results of such testing and fair valuation occurrences are reported to the Board of Directors/Trustees.
3. Portfolio Securities and Investments in Derivatives
Portfolio Securities
Foreign Currency Transactions
To the extent that the Funds invest in securities and/or contracts that are denominated in a currency other than U.S. dollars, the Funds will be subject to currency risk, which is the risk that an increase in the U.S. dollar relative to the foreign currency will reduce returns or portfolio value. Generally, when the U.S. dollar rises in value against a foreign currency, the Funds’ investments denominated in that currency will lose value because their currency is worth fewer U.S. dollars; the opposite effect occurs if the U.S. dollar falls in relative value. Investments and other assets and liabilities denominated in foreign currencies are converted into U.S. dollars on a spot (i.e. cash) basis at the spot rate prevailing in the foreign currency exchange market at the time of valuation. Purchases and sales of investments and income denominated in foreign currencies are translated into U.S. dollars on the respective dates of such transactions.
Notes to Financial Statements (continued)
NWQ Global Equity, NWQ Global Equity Income and Value Opportunities invest in non-U.S. securities. As of June 30, 2014, each Fund’s investments in non-U.S. securities were as follows:
| | | | | | | | |
| NWQ Global Equity | | Value | | | % of
Net Assets | |
| Country: | | | | | | | | |
Japan | | $ | 106,980 | | | | 10.3 | % |
Germany | | | 85,323 | | | | 8.2 | |
Canada | | | 56,589 | | | | 5.5 | |
Switzerland | | | 52,962 | | | | 5.1 | |
France | | | 36,895 | | | | 3.6 | |
Netherlands | | | 36,056 | | | | 3.5 | |
Israel | | | 31,718 | | | | 3.1 | |
Norway | | | 25,392 | | | | 2.5 | |
Sweden | | | 21,150 | | | | 2.0 | |
Spain | | | 18,254 | | | | 1.8 | |
| Total non-U.S. securities | | $ | 471,319 | | | | 45.6 | % |
| | | | | | | | |
| NWQ Global Equity Income | | Value | | | % of
Net Assets | |
| Country: | | | | | | | | |
United Kingdom | | $ | 145,583 | | | | 8.6 | % |
Germany | | | 123,387 | | | | 7.3 | |
France | | | 94,676 | | | | 5.6 | |
Switzerland | | | 78,786 | | | | 4.6 | |
Canada | | | 61,632 | | | | 3.6 | |
Japan | | | 53,011 | | | | 3.1 | |
Israel | | | 52,730 | | | | 3.1 | |
Netherlands | | | 52,262 | | | | 3.1 | |
Sweden | | | 35,048 | | | | 2.1 | |
Denmark | | | 26,908 | | | | 1.6 | |
Other countries* | | | 30,547 | | | | 1.7 | |
| Total non-U.S. securities | | $ | 754,570 | | | | 44.4 | % |
| * | Includes all other countries less than $26,908. |
| | | | | | | | |
| Value Opportunities | | Value | | | % of
Net Assets | |
| Country: | | | | | | | | |
Canada | | $ | 32,804,002 | | | | 6.6 | % |
Japan | | | 19,964,549 | | | | 4.0 | |
Netherlands | | | 15,252,350 | | | | 3.1 | |
Denmark | | | 15,128,746 | | | | 3.1 | |
Switzerland | | | 14,974,647 | | | | 3.0 | |
France | | | 10,952,826 | | | | 2.2 | |
United Kingdom | | | 7,584,796 | | | | 1.5 | |
Belgium | | | 4,690,281 | | | | 1.0 | |
| Total non-U.S. securities | | $ | 121,352,197 | | | | 24.5 | % |
The books and records of the Funds are maintained in U.S. dollars. Foreign currencies, assets and liabilities are translated into U.S. dollars at 4:00 p.m. Eastern Time. Investment transactions, income and expenses are translated on the respective dates of such transactions. Net realized foreign currency gains and losses resulting from changes in exchange rates include foreign currency gains and losses between trade date and settlement date of the transactions, foreign currency transactions and the difference between the amounts of interest and dividends recorded on the books of a Fund and the amounts actually received.
The realized gains and losses resulting from changes in foreign currency exchange rates and changes in foreign exchange rates associated with other assets and liabilities on investments are recognized as a component of “Net realized gain (loss) from investments and foreign currency,” on the Statement of Operations, when applicable.
The unrealized gains and losses resulting from changes in foreign currency exchange rates and changes in foreign exchange rates associated with other assets and liabilities on investments are recognized as a component of “Change in net unrealized appreciation (depreciation) of investments and foreign currency,” on the Statement of Operations, when applicable.
Repurchase Agreements
In connection with transactions in repurchase agreements, it is each Fund’s policy that its custodian take possession of the underlying collateral securities, the fair value of which exceeds the principal amount of the repurchase transaction, including accrued interest, at all times. If the counterparty defaults, and the fair value of the collateral declines, realization of the collateral may be delayed or limited.
The following table presents the repurchase agreements for the Funds that are subject to netting agreements as of the end of the reporting period, and the collateral delivered related to those repurchase agreements.
| | | | | | | | | | | | | | |
| Fund | | Counterparty | | Short-Term
Investments, at Value | | | Collateral Pledged (From) Counterparty* | | | Net Exposure | |
| NWQ Multi-Cap Value | | Fixed Income Clearing Corporation | | $ | 429,804 | | | $ | (429,804 | ) | | $ | — | |
| NWQ Large-Cap Value | | Fixed Income Clearing Corporation | | | 10,994,065 | | | | (10,994,065 | ) | | | — | |
| NWQ Small/Mid-Cap Value | | Fixed Income Clearing Corporation | | | 1,365,340 | | | | (1,365,340 | ) | | | — | |
| NWQ Small-Cap Value | | Fixed Income Clearing Corporation | | | 21,081,242 | | | | (21,081,242 | ) | | | — | |
| Value Opportunities | | Fixed Income Clearing Corporation | | | 13,354,669 | | | | (13,354,669 | ) | | | — | |
| * | As of June 30, 2014, the value of the collateral pledged from the counterparty exceeded the value of the repurchase agreements. Refer to the Fund’s Portfolios of Investments for details on the repurchase agreements. |
Investments in Derivatives
The Funds record derivative instruments at fair value, with changes in fair value recognized on the Statement of Operations, when applicable. Even though the Funds’ investments in derivatives may represent economic hedges, they are not considered to be hedge transactions for financial reporting purposes.
Options Transactions
When a Fund writes an option, an amount equal to the net premium received (the premium less commission) is recognized as a component of “Options written, at value” on the Statement of Assets and Liabilities and is subsequently adjusted to reflect the current value of the written option until the option is exercised or expires or the Fund enters into a closing purchase transaction. The changes in the value of options written during the fiscal period are recognized as a component of “Change in net unrealized appreciation (depreciation) of options written” on the Statement of Operations. When an option is exercised or expires or the Fund enters into a closing purchase transaction, the difference between the net premium received and any amount paid at expiration or on executing a closing purchase transaction, including commission, is recognized as a component of “Net realized gain (loss) from options written” on the Statement of Operations. The Fund, as writer of an option, has no control over whether the underlying instrument may be sold (called) and as a result bears the risk of an unfavorable change in the market value of the instrument underlying the written option. There is also the risk the Fund may not be able to enter into a closing transaction because of an illiquid market.
During the fiscal year ended June 30, 2014, NWQ Global Equity Income wrote covered call options on individual stocks, while investing in these same stocks, to enhance returns while foregoing some upside potential. The average notional amount of outstanding options written during the fiscal year ended June 30, 2014, was as follows:
| | | | |
| | | NWQ Global Equity Income | |
| Average notional amount of outstanding options written* | | $ | (21,720 | ) |
| * | The average notional amount is calculated based on the outstanding notional at the beginning of the fiscal year and at the end of each fiscal quarter within the current fiscal year. |
The following table presents the fair value of all options held by the Fund as of June 30, 2014, the location of these instruments on the Statement of Assets and Liabilities and the primary underlying risk exposure.
| | | | | | | | | | | | | | |
| | | | | Location on the Statements of Assets and Liabilities | |
| | | | | Asset Derivatives | | | (Liability) Derivatives | |
Underlying
Risk Exposure | | Derivative Instrument | | Location | | Value | | | Location | | Value | |
| NWQ Global Equity Income | | | | | | | | | | | | |
Equity price | | Options | | — | | $ | — | | | Options written, at value | | $ | (358 | ) |
The following table presents the amount of net realized gain (loss) and change in net unrealized appreciation (depreciation) recognized on options contracts on the Statement of Operations during the fiscal year ended June 30, 2014, as well as the primary underlying risk exposure.
| | | | | | | | | | | | |
| Fund | | Underlying
Risk Exposure | | Derivative
Instrument | | Net Realized
Gain (Loss) from
Options Written | | | Change in Net Unrealized
Appreciation (Depreciation) of
Options Written | |
| NWQ Global Equity Income | | Equity price | | Options | | $ | 5,332 | | | $ | 186 | |
Notes to Financial Statements (continued)
Market and Counterparty Credit Risk
In the normal course of business each Fund may invest in financial instruments and enter into financial transactions where risk of potential loss exists due to changes in the market (market risk) or failure of the other party to the transaction to perform (counterparty credit risk). The potential loss could exceed the value of the financial assets recorded on the financial statements. Financial assets, which potentially expose each Fund to counterparty credit risk, consist principally of cash due from counterparties on forward, option and swap transactions, when applicable. The extent of each Fund’s exposure to counterparty credit risk in respect to these financial assets approximates their carrying value as recorded on the Statement of Assets and Liabilities.
Each Fund helps manage counterparty credit risk by entering into agreements only with counterparties the Adviser believes have the financial resources to honor their obligations and by having the Adviser monitor the financial stability of the counterparties. Additionally, counterparties may be required to pledge collateral daily (based on the daily valuation of the financial asset) on behalf of each Fund with a value approximately equal to the amount of any unrealized gain above a pre-determined threshold. Reciprocally, when each Fund has an unrealized loss, the Funds have instructed the custodian to pledge assets of the Funds as collateral with a value approximately equal to the amount of the unrealized loss above a pre-determined threshold. Collateral pledges are monitored and subsequently adjusted if and when the valuations fluctuate, either up or down, by at least the pre-determined threshold amount.
4. Fund Shares
Transactions in Fund shares were as follows:
| | | | | | | | | | | | |
| | | |
| | | | | | | NWQ Global Equity | |
| | | | | | | For the Period 4/1/14
(commencement of
operations) through
6/30/14 | |
| | | | | | | Shares | | | Amount | |
| Shares sold: | | | | | | | | | | | | |
Class A | | | | | | | 2,500 | | | $ | 50,000 | |
Class C | | | | | | | 2,500 | | | | 50,000 | |
Class I | | | | | | | 45,000 | | | | 900,000 | |
| Net increase (decrease) | | | | | | | 50,000 | | | $ | 1,000,000 | |
| | | | | | | | | | | | | | | | |
| |
| | | NWQ Global Equity Income | |
| | | Year Ended
6/30/14 | | | Year Ended
6/30/13 | |
| | | Shares | | | Amount | | | Shares | | | Amount | |
| Shares sold: | | | | | | | | | | | | | | | | |
Class A | | | — | | | $ | — | | | | — | | | $ | — | |
Class C | | | — | | | | — | | | | — | | | | — | |
Class R3 | | | — | | | | — | | | | — | | | | — | |
Class I | | | 10,240 | | | | 275,000 | | | | — | | | | — | |
| Shares issued to shareholders due to reinvestment of distributions: | | | | | | | | | | | | | | | | |
Class A | | | — | | | | — | | | | — | | | | — | |
Class C | | | — | | | | — | | | | — | | | | — | |
Class R3 | | | — | | | | — | | | | — | | | | — | |
Class I | | | 197 | | | | 5,493 | | | | — | | | | — | |
| | | | 10,437 | | | | 280,493 | | | | — | | | | — | |
| Shares redeemed: | | | | | | | | | | | | | | | | |
Class A | | | — | | | | — | | | | — | | | | — | |
Class C | | | — | | | | — | | | | — | | | | — | |
Class R3 | | | — | | | | — | | | | — | | | | — | |
Class I | | | — | | | | — | | | | — | | | | — | |
| Net increase (decrease) | | | 10,437 | | | $ | 280,493 | | | | — | | | $ | — | |
| | | | | | | | | | | | | | | | |
| | | NWQ Multi-Cap Value | |
| | | Year Ended
6/30/14 | | | Year Ended
6/30/13 | |
| | | Shares | | | Amount | | | Shares | | | Amount | |
| Shares sold: | | | | | | | | | | | | | | | | |
Class A | | | 193,963 | | | $ | 4,802,089 | | | | 232,570 | | | $ | 4,660,521 | |
Class A – automatic conversion of Class B Shares | | | 89,102 | | | | 2,404,878 | | | | 18,247 | | | | 358,537 | |
Class C | | | 58,921 | | | | 1,388,617 | | | | 33,949 | | | | 658,842 | |
Class R3 | | | 1,231 | | | | 29,791 | | | | 1,742 | | | | 32,282 | |
Class I | | | 441,328 | | | | 11,071,967 | | | | 315,504 | | | | 6,301,103 | |
| Shares issued to shareholders due to reinvestment of distributions: | | | | | | | | | | | | | | | | |
Class A | | | 5,488 | | | | 140,449 | | | | 8,047 | | | | 152,175 | |
Class B | | | — | | | | — | | | | 2,288 | | | | 42,148 | |
Class C | | | — | | | | — | | | | — | | | | — | |
Class R3 | | | 7 | | | | 178 | | | | 10 | | | | 184 | |
Class I | | | 13,418 | | | | 344,825 | | | | 20,155 | | | | 382,751 | |
| | | | 803,458 | | | | 20,182,794 | | | | 632,512 | | | | 12,588,543 | |
| Shares redeemed: | | | | | | | | | | | | | | | | |
Class A | | | (426,693 | ) | | | (10,549,008 | ) | | | (664,856 | ) | | | (13,244,634 | ) |
Class B | | | (140,737 | ) | | | (3,264,307 | ) | | | (266,373 | ) | | | (4,975,090 | ) |
Class B – automatic conversion to Class A Shares | | | (94,451 | ) | | | (2,404,878 | ) | | | (19,230 | ) | | | (358,537 | ) |
Class C | | | (362,718 | ) | | | (8,508,388 | ) | | | (861,225 | ) | | | (16,195,238 | ) |
Class R3 | | | (893 | ) | | | (22,846 | ) | | | (951 | ) | | | (17,613 | ) |
Class I | | | (482,700 | ) | | | (12,072,902 | ) | | | (1,319,426 | ) | | | (26,839,671 | ) |
| | | | (1,508,192 | ) | | | (36,822,329 | ) | | | (3,132,061 | ) | | | (61,630,783 | ) |
| Net increase (decrease) | | | (704,734 | ) | | $ | (16,639,535 | ) | | | (2,499,549 | ) | | $ | (49,042,240 | ) |
| |
| | | NWQ Large-Cap Value | |
| | | Year Ended
6/30/14 | | | Year Ended
6/30/13 | |
| | | Shares | | | Amount | | | Shares | | | Amount | |
| Shares sold: | | | | | | | | | | | | | | | | |
Class A | | | 1,526,051 | | | $ | 33,400,013 | | | | 1,942,270 | | | $ | 35,838,727 | |
Class C | | | 173,309 | | | | 3,695,980 | | | | 94,895 | | | | 1,726,632 | |
Class R3 | | | 16 | | | | 373 | | | | — | | | | — | |
Class I | | | 26,726,233 | | | | 586,695,439 | | | | 20,495,221 | | | | 379,123,929 | |
| Shares issued to shareholders due to reinvestment of distributions: | | | | | | | | | | | | | | | | |
Class A | | | 71,231 | | | | 1,557,266 | | | | 29,241 | | | | 511,514 | |
Class C | | | 8,436 | | | | 177,046 | | | | 1,362 | | | | 23,158 | |
Class R3 | | | 62 | | | | 1,343 | | | | 30 | | | | 522 | |
Class I | | | 1,872,820 | | | | 41,107,512 | | | | 812,183 | | | | 14,218,955 | |
| | | | 30,378,158 | | | | 666,634,972 | | | | 23,375,202 | | | | 431,443,437 | |
| Shares redeemed: | | | | | | | | | | | | | | | | |
Class A | | | (1,506,361 | ) | | | (33,298,575 | ) | | | (1,633,220 | ) | | | (30,311,637 | ) |
Class C | | | (74,667 | ) | | | (1,597,633 | ) | | | (110,107 | ) | | | (1,944,097 | ) |
Class R3 | | | — | | | | — | | | | (700 | ) | | | (13,504 | ) |
Class I | | | (61,816,758 | ) | | | (1,390,104,059 | ) | | | (23,987,938 | ) | | | (442,669,429 | ) |
| | | | (63,397,786 | ) | | | (1,425,000,267 | ) | | | (25,731,965 | ) | | | (474,938,667 | ) |
| Net increase (decrease) | | | (33,019,628 | ) | | $ | (758,365,295 | ) | | | (2,356,763 | ) | | $ | (43,495,230 | ) |
Notes to Financial Statements (continued)
| | | | | | | | | | | | | | | | |
| |
| | | NWQ Small/Mid-Cap Value | |
| | | Year Ended
6/30/14 | | | Year Ended
6/30/13 | |
| | | Shares | | | Amount | | | Shares | | | Amount | |
| Shares sold: | | | | | | | | | | | | | | | | |
Class A | | | 235,896 | | | $ | 6,563,476 | | | | 54,759 | | | $ | 1,177,332 | |
Class C | | | 40,311 | | | | 1,062,267 | | | | 36,604 | | | | 764,257 | |
Class R3 | | | 18,418 | | | | 512,900 | | | | 14,610 | | | | 302,550 | |
Class I | | | 831,459 | | | | 22,327,545 | | | | 795,372 | | | | 16,724,688 | |
| Shares issued to shareholders due to reinvestment of distributions: | | | | | | | | | | | | | | | | |
Class A | | | — | | | | — | | | | — | | | | — | |
Class C | | | — | | | | — | | | | — | | | | — | |
Class R3 | | | — | | | | — | | | | — | | | | — | |
Class I | | | — | | | | — | | | | — | | | | — | |
| | | | 1,126,084 | | | | 30,466,188 | | | | 901,345 | | | | 18,968,827 | |
| Shares redeemed: | | | | | | | | | | | | | | | | |
Class A | | | (146,387 | ) | | | (4,127,009 | ) | | | (85,854 | ) | | | (1,823,291 | ) |
Class C | | | (15,381 | ) | | | (397,248 | ) | | | (42,745 | ) | | | (888,273 | ) |
Class R3 | | | (11,764 | ) | | | (304,945 | ) | | | (5,553 | ) | | | (120,266 | ) |
Class I | | | (332,870 | ) | | | (9,331,771 | ) | | | (297,820 | ) | | | (6,331,513 | ) |
| | | | (506,402 | ) | | | (14,160,973 | ) | | | (431,972 | ) | | | (9,163,343 | ) |
| Net increase (decrease) | | | 619,682 | | | $ | 16,305,215 | | | | 469,373 | | | $ | 9,805,484 | |
| |
| | | NWQ Small-Cap Value | |
| | | Year Ended
6/30/14 | | | Year Ended
6/30/13 | |
| | | Shares | | | Amount | | | Shares | | | Amount | |
| Shares sold: | | | | | | | | | | | | | | | | |
Class A | | | 1,028,165 | | | $ | 41,025,021 | | | | 220,346 | | | $ | 6,470,599 | |
Class C | | | 310,482 | | | | 11,608,369 | | | | 59,767 | | | | 1,698,662 | |
Class R3 | | | 55,990 | | | | 2,156,946 | | | | 22,719 | | | | 705,900 | |
Class R6 – exchange from Class R3 Shares | | | 21,942 | | | | 861,128 | | | | 62,181 | | | | 2,078,143 | |
Class R6 – exchange from Class R3 Shares | | | — | | | | — | | | | 802 | | | | 25,000 | |
Class I | | | 3,119,748 | | | | 123,122,842 | | | | 1,536,110 | | | | 45,756,079 | |
| Shares issued to shareholders due to reinvestment of distributions: | | | | | | | | | | | | | | | | |
Class A | | | — | | | | — | | | | — | | | | — | |
Class C | | | — | | | | — | | | | — | | | | — | |
Class R3 | | | — | | | | — | | | | — | | | | — | |
Class R6 | | | — | | | | — | | | | — | | | | — | |
Class I | | | — | | | | — | | | | — | | | | — | |
| | | | 4,536,327 | | | | 178,774,306 | | | | 1,901,925 | | | | 56,734,383 | |
| Shares redeemed: | | | | | | | | | | | | | | | | |
Class A | | | (128,917 | ) | | | (5,079,753 | ) | | | (184,960 | ) | | | (5,185,256 | ) |
Class C | | | (43,366 | ) | | | (1,612,182 | ) | | | (50,525 | ) | | | (1,432,875 | ) |
Class R3 | | | (15,524 | ) | | | (609,540 | ) | | | (3,051 | ) | | | (99,773 | ) |
Class R3 – exchange to Class R6 Shares | | | — | | | | — | | | | (802 | ) | | | (25,000 | ) |
Class R6 | | | (11,803 | ) | | | (457,240 | ) | | | (728 | ) | | | (24,729 | ) |
Class I | | | (1,354,681 | ) | | | (51,111,578 | ) | | | (936,434 | ) | | | (28,280,231 | ) |
| | | | (1,554,291 | ) | | | (58,870,293 | ) | | | (1,176,500 | ) | | | (35,047,864 | ) |
| Net increase (decrease) | | | 2,982,036 | | | $ | 119,904,013 | | | | 725,425 | | | $ | 21,686,519 | |
| | | | | | | | | | | | | | | | |
| | | Value Opportunities | |
| | | Year Ended
6/30/14 | | | Year Ended
6/30/13 | |
| | | Shares | | | Amount | | | Shares | | | Amount | |
| Shares sold: | | | | | | | | | | | | | | | | |
Class A | | | 447,753 | | | $ | 16,034,706 | | | | 832,977 | | | $ | 25,347,135 | |
Class A – automatic conversion of Class B Shares | | | 56,618 | | | | 2,203,980 | | | | — | | | | — | |
Class B – exchanges | | | 337 | | | | 11,773 | | | | — | | | | — | |
Class C | | | 115,279 | | | | 3,992,997 | | | | 145,080 | | | | 4,335,918 | |
Class R3 | | | 35,307 | | | | 1,280,822 | | | | 41,574 | | | | 1,271,767 | |
Class I | | | 623,703 | | | | 22,626,799 | | | | 942,301 | | | | 28,709,799 | |
| Shares issued to shareholders due to reinvestment of distributions: | | | | | | | | | | | | | | | | |
Class A | | | 236,502 | | | | 8,399,665 | | | | 360,847 | | | | 10,561,985 | |
Class B | | | 2,313 | | | | 79,351 | | | | 3,619 | | | | 104,037 | |
Class C | | | 106,004 | | | | 3,634,604 | | | | 132,846 | | | | 3,800,738 | |
Class R3 | | | 2,918 | | | | 103,433 | | | | 4,490 | | | | 131,607 | |
Class I | | | 180,012 | | | | 6,431,888 | | | | 270,181 | | | | 7,929,809 | |
| | | | 1,806,746 | | | | 64,800,018 | | | | 2,733,915 | | | | 82,192,795 | |
| Shares redeemed: | | | | | | | | | | | | | | | | |
Class A | | | (2,376,086 | ) | | | (85,737,172 | ) | | | (11,039,157 | ) | | | (332,726,310 | ) |
Class B | | | (30,753 | ) | | | (1,078,527 | ) | | | (89,748 | ) | | | (2,629,667 | ) |
Class B – automatic conversion to Class A Shares | | | (58,183 | ) | | | (2,203,980 | ) | | | — | | | | — | |
Class C | | | (985,732 | ) | | | (34,578,095 | ) | | | (4,296,697 | ) | | | (125,992,319 | ) |
Class R3 | | | (51,337 | ) | | | (1,845,393 | ) | | | (130,395 | ) | | | (4,018,686 | ) |
Class I | | | (2,553,282 | ) | | | (92,653,708 | ) | | | (9,856,725 | ) | | | (297,193,990 | ) |
| | | | (6,055,373 | ) | | | (218,096,875 | ) | | | (25,412,722 | ) | | | (762,560,972 | ) |
| Net increase (decrease) | | | (4,248,627 | ) | | $ | (153,296,857 | ) | | | (22,678,807 | ) | | $ | (680,368,177 | ) |
5. Investment Transactions
Long-term purchases and sales (excluding derivative transactions) during the fiscal year ended June 30, 2014, were as follows:
| | | | | | | | | | | | | | | | | | | | | | | | | | | | |
| | | NWQ Global
Equity | | | NWQ Global
Equity Income | | | NWQ Multi-Cap
Value | | | NWQ Large-Cap
Value | | | NWQ Small/Mid-Cap
Value | | | NWQ Small-Cap
Value | | | Value
Opportunities | |
| Purchases | | $ | 1,097,801 | | | $ | 958,362 | | | $ | 57,705,077 | | | $ | 597,033,516 | | | $ | 42,699,169 | | | $ | 206,231,334 | | | $ | 552,159,509 | |
| Sales | | | 108,037 | | | | 703,814 | | | | 72,595,650 | | | | 1,347,563,842 | | | | 26,169,872 | | | | 101,333,423 | | | | 705,142,439 | |
Transactions in options written for NWQ Global Equity Income during the fiscal year ended June 30, 2014, were as follows:
| | | | | | | | |
| | | Number of
Contracts | | | Premiums
Received | |
| Options outstanding, beginning of period | | | 12 | | | $ | 856 | |
| Options written | | | 95 | | | | 7,537 | |
| Options terminated in closing purchase transactions | | | (38 | ) | | | (3,864 | ) |
| Options expired | | | (36 | ) | | | (2,109 | ) |
| Options exercised | | | (25 | ) | | | (1,683 | ) |
| Options outstanding, end of period | | | 8 | | | $ | 737 | |
6. Income Tax Information
Each Fund is a separate taxpayer for federal income tax purposes. Each Fund intends to distribute substantially all of its net investment income and net capital gains to shareholders and to otherwise comply with the requirements of Subchapter M of the Internal Revenue Code applicable to regulated investment companies. Therefore, no federal income tax provision is required.
For all open tax years and all major taxing jurisdictions, management of the Funds has concluded that there are no significant uncertain tax positions that would require recognition in the financial statements. Open tax years are those that are open for examination by taxing authorities (i.e., generally the last four tax year ends and the interim tax period since then). Furthermore, management of the Funds is also not aware of any tax positions for which it is reasonably possible that the total amounts of unrecognized tax benefits will significantly change in the next twelve months.
Notes to Financial Statements (continued)
The following information is presented on an income tax basis. Differences between amounts for financial statement and federal income tax purposes are primarily due to timing differences in recognizing certain gains and losses on investment transactions. To the extent that differences arise that are permanent in nature, such amounts are reclassified within the capital accounts as detailed below. Temporary differences do not require reclassification. Temporary and permanent differences do not impact the NAVs of the Funds.
As of June 30, 2014, the cost and unrealized appreciation (depreciation) of investments (excluding investments in derivatives), as determined on a federal income tax basis, were as follows:
| | | | | | | | | | | | | | | | | | | | | | | | | | | | |
| | | NWQ
Global
Equity | | | NWQ
Global
Equity Income | | | NWQ
Multi-Cap
Value | | | NWQ
Large-Cap
Value | | | NWQ
Small/Mid-Cap
Value | | | NWQ
Small-Cap
Value | | | Value
Opportunities | |
| Cost of investments | | $ | 990,327 | | | $ | 1,382,535 | | | $ | 125,246,288 | | | $ | 490,390,615 | | | $ | 52,425,366 | | | $ | 257,215,306 | | | $ | 420,787,865 | |
| Gross unrealized: | | | | | | | | | | | | | | | | | | | | | | | | | | | | |
Appreciation | | $ | 46,742 | | | $ | 356,333 | | | $ | 46,063,934 | | | $ | 230,718,716 | | | $ | 14,439,285 | | | $ | 71,803,214 | | | $ | 78,065,853 | |
Depreciation | | | (18,704 | ) | | | (15,146 | ) | | | (5,075,424 | ) | | | (5,908,150 | ) | | | (722,545 | ) | | | (3,121,919 | ) | | | (5,329,102 | ) |
| Net unrealized appreciation (depreciation) of investments | | $ | 28,038 | | | $ | 341,187 | | | $ | 40,988,510 | | | $ | 224,810,566 | | | $ | 13,716,740 | | | $ | 68,681,295 | | | $ | 72,736,751 | |
Permanent differences, primarily due to net operating losses, foreign currency transactions, securities litigation settlements, nondeductible stock issuance costs, tax equalization and adjustments for investments in passive foreign investment companies, resulted in reclassifications among the Funds’ components of net assets as of June 30, 2014, the Funds’ tax year end, as follows:
| | | | | | | | | | | | | | | | |
| | | NWQ Global
Equity | | | NWQ Global
Equity Income | | | NWQ Multi-Cap
Value | | | NWQ Large-Cap
Value | |
| Capital paid-in | | $ | (154 | ) | | $ | (3,830 | ) | | $ | — | | | $ | 77,653,650 | |
| Undistributed (Over-distribution of) net investment income | | | 206 | | | | (372 | ) | | | 290,170 | | | | 152,328 | |
| Accumulated net realized gain (loss) | | | (52 | ) | | | 4,202 | | | | (290,170 | ) | | | (77,805,978 | ) |
| | | | | | | | | | | | |
| | | |
| | | NWQ Small/Mid-Cap
Value | | | NWQ Small-Cap
Value | | | Value
Opportunities | |
| Capital paid-in | | $ | (181,601 | ) | | $ | (1,249,203 | ) | | $ | 8,082,378 | |
| Undistributed (Over-distribution of) net investment income | | | 181,601 | | | | 1,249,285 | | | | — | |
| Accumulated net realized gain (loss) | | | — | | | | (82 | ) | | | (8,082,378 | ) |
The tax components of undistributed net ordinary income and net long-term capital gains as of June 30, 2014, the Funds’ tax year end, were as follows:
| | | | | | | | | | | | | | | | |
| | | NWQ Global
Equity | | | NWQ Global
Equity Income | | | NWQ Multi-Cap
Value | | | NWQ Large-Cap
Value | |
| Undistributed net ordinary income1 | | $ | 8,060 | | | $ | 37,728 | | | $ | 802,479 | | | $ | 33,072,322 | |
| Undistributed net long-term capital gains | | | — | | | | 61,226 | | | | — | | | | 58,570,984 | |
| | | | | | | | | | | | |
| | | |
| | | NWQ Small/Mid-Cap
Value | | | NWQ Small-Cap
Value | | | Value
Opportunities | |
Undistributed net ordinary income1 | | $ | — | | | $ | — | | | $ | 34,919,098 | |
Undistributed net long-term capital gains | | | — | | | | — | | | | 25,083,232 | |
| 1 | Net ordinary income consists of net taxable income derived from dividends, interest, and net short-term capital gains, if any. |
The tax character of distributions paid during the Funds’ tax years ended June 30, 2014 and June 30, 2013, was designated for purposes of the dividends paid deduction as follows:
| | | | | | | | | | | | | | | | |
| 2014 | | NWQ Global
Equity | | | NWQ Global
Equity Income | | | NWQ Multi-Cap
Value | | | NWQ Large-
Cap Value | |
| Distributions from net ordinary income1 | | $ | — | | | $ | 32,460 | | | $ | 539,513 | | | $ | 19,148,647 | |
| Distributions from net long-term capital gains | | | — | | | | 22,540 | | | | — | | | | 24,125,046 | |
| | | | | | | | | | | | |
| | | |
| 2014 | | NWQ Small/Mid-Cap
Value | | | NWQ Small-Cap
Value | | | Value
Opportunities | |
Distributions from net ordinary income1 | | $ | — | | | $ | — | | | $ | 20,907,841 | |
Distributions from net long-term capital gains | | | — | | | | — | | | | — | |
| 1 | Net ordinary income consists of net taxable income derived from dividends, interest, and net short-term capital gains, if any. |
| | | | | | | | | | | | | | | | |
| 2013 | | NWQ Global
Equity | | | NWQ Global
Equity Income | | | NWQ Multi-Cap
Value | | | NWQ Large-Cap
Value | |
| Distributions from net ordinary income1 | | $ | — | | | $ | 17,430 | | | $ | 597,701 | | | $ | 12,759,753 | |
| Distributions from net long-term capital gains | | | — | | | | — | | | | — | | | | 2,446,811 | |
| | | | | | | | | | | | |
2013 | | NWQ Small/Mid-Cap
Value | | | NWQ Small-Cap
Value | | | Value
Opportunities | |
Distributions from net ordinary income1 | | $ | — | | | $ | — | | | $ | 25,831,856 | |
Distributions from net long-term capital gains | | | — | | | | — | | | | — | |
| 1 | Net ordinary income consists of net taxable income derived from dividends, interest, and net short-term capital gains, if any. |
As of June 30, 2014, the Funds’ tax year end, the following Funds had unused capital loss carryforwards available for federal income tax purposes to be applied against future capital gains, if any. If not applied, the carryforwards will expire as shown in the following table. The losses not subject to expiration will be utilized first by a Fund.
| | | | | | | | | | | | | | | | |
| | | NWQ Global
Equity | | | NWQ Multi-Cap
Value | | | NWQ Small/Mid-Cap
Value3 | | | NWQ Small-Cap
Value | |
| Expiration: | | | | | | | | | | | | | | | | |
June 30, 2016 | | $ | — | | | $ | — | | | $ | 2,799,236 | | | $ | — | |
June 30, 2017 | | | — | | | | 118,298,392 | | | | 21,132,667 | | | | — | |
June 30, 2018 | | | — | | | | 100,615,795 | | | | 838,796 | | | | 16,285,506 | |
| Not subject to expiration | | | 2,018 | | | | — | | | | — | | | | — | |
| Total | | $ | 2,018 | | | $ | 218,914,187 | | | $ | 24,770,699 | | | $ | 16,285,506 | |
| 3 | A portion of NWQ Small/Mid-Cap Value’s capital loss carryforward is subject to an annual limitation under the Internal Revenue Code and related regulations. |
During the Funds’ tax year ended June 30, 2014, the following Funds utilized capital loss carryforwards as follows:
| | | | | | | | | | | | | | | | | | | | |
| | | NWQ Multi-Cap
Value
| | | NWQ Large-Cap
Value | | | NWQ Small/Mid-Cap
Value
| | | NWQ Small-Cap
Value
| | | Value
Opportunities | |
| Utilized capital loss carryforwards | | $ | 17,021,608 | | | $ | 2,708,338 | | | $ | 5,870,253 | | | $ | 19,134,771 | | | $ | 2,917,926 | |
7. Management Fees and Other Transactions with Affiliates
Each Fund’s management fee compensates the Adviser for overall investment advisory and administrative services and general office facilities. NWQ and Tradewinds are compensated for their services to the Funds from the management fees paid to the Adviser.
Each Fund’s management fee consists of two components – a fund-level fee, based only on the amount of assets within each individual Fund, and a complex-level fee, based on the aggregate amount of all eligible fund assets managed by the Adviser. This pricing structure enables each Fund’s shareholders to benefit from growth in the assets within their respective Fund as well as from growth in the amount of complex-wide assets managed by the Adviser.
The annual fund-level fee for each Fund, payable monthly, is calculated according to the following schedule:
| | | | | | | | | | | | | | | | |
| Average Daily Net Assets | | NWQ Global
Equity
Fund-Level
Fee Rate | | | NWQ Global
Equity Income
Fund-Level
Fee Rate | | | NWQ Multi-Cap
Value
Fund-Level
Fee Rate | | | NWQ Large-Cap
Value
Fund-Level
Fee Rate | |
| For the first $125 million | | | 0.6500 | % | | | 0.6500 | % | | | 0.6300 | % | | | 0.5500 | % |
| For the next $125 million | | | 0.6375 | | | | 0.6375 | | | | 0.6175 | | | | 0.5375 | |
| For the next $250 million | | | 0.6250 | | | | 0.6250 | | | | 0.6050 | | | | 0.5250 | |
| For the next $500 million | | | 0.6125 | | | | 0.6125 | | | | 0.5925 | | | | 0.5125 | |
| For the next $1 billion | | | 0.6000 | | | | 0.6000 | | | | 0.5800 | | | | 0.5000 | |
| For net assets over $2 billion | | | 0.5750 | | | | 0.5750 | | | | 0.5550 | | | | 0.4750 | |
Notes to Financial Statements (continued)
| | | | | | | | | | | | |
| Average Daily Net Assets | | NWQ Small/Mid-Cap
Value
Fund-Level
Fee Rate | | | NWQ Small-Cap
Value
Fund-Level
Fee Rate | | | Value
Opportunities
Fund-Level
Fee Rate | |
| For the first $125 million | | | 0.6000 | % | | | 0.7500 | % | | | 0.6300 | % |
| For the next $125 million | | | 0.5875 | | | | 0.7375 | | | | 0.6175 | |
| For the next $250 million | | | 0.5750 | | | | 0.7250 | | | | 0.6050 | |
| For the next $500 million | | | 0.5625 | | | | 0.7125 | | | | 0.5925 | |
| For the next $1 billion | | | 0.5500 | | | | 0.7000 | | | | 0.5800 | |
| For net assets over $2 billion | | | 0.5250 | | | | 0.6750 | | | | 0.5550 | |
The annual complex-level fee for each Fund, payable monthly, is calculated according to the following schedule:
| | | | |
| Complex-Level Asset Breakpoint Level* | | Effective Rate at Breakpoint Level | |
| $55 billion | | | 0.2000 | % |
| $56 billion | | | 0.1996 | |
| $57 billion | | | 0.1989 | |
| $60 billion | | | 0.1961 | |
| $63 billion | | | 0.1931 | |
| $66 billion | | | 0.1900 | |
| $71 billion | | | 0.1851 | |
| $76 billion | | | 0.1806 | |
| $80 billion | | | 0.1773 | |
| $91 billion | | | 0.1691 | |
| $125 billion | | | 0.1599 | |
| $200 billion | | | 0.1505 | |
| $250 billion | | | 0.1469 | |
| $300 billion | | | 0.1445 | |
| * | The complex-level fee is calculated based upon the aggregate daily “eligible assets” of all Nuveen Funds. Eligible assets do not include assets attributable to investments in other Nuveen Funds or assets in excess of $2 billion added to the Nuveen Fund complex in connection with the Adviser’s assumption of the management of the former First American Funds effective January 1, 2011. Eligible assets include closed-end fund assets managed by the Adviser that are attributable to certain types of leverage. For these purposes, leverage includes the closed-end funds’ use of preferred stock and borrowings and certain investments in the residual interest certificates (also called inverse floating rate securities) in tender option bond (TOB) trusts, including the portion of assets held by a TOB trust that has been effectively financed by the trust’s issuance of floating rate securities, subject to an agreement by the Adviser as to certain funds to limit the amount of such assets for determining eligible assets in certain circumstances. As of June 30, 2014, the complex-level fee rate for each of these Funds was .1653%. |
The Adviser has agreed to waive fees and/or reimburse expenses (“Expense Cap”) of each Fund so that total annual Fund operating expenses (excluding 12b-1 distribution and/or service fees, interest expenses, taxes, acquired fund fees and expenses fees incurred in acquiring and disposing of portfolio securities and extraordinary expenses) do not exceed the average daily net assets of any class of Fund shares (adjusted downward for Class R6 Shares for savings resulting from the sub-transfer agent and similar fees that are not charged to the Class R6 Shares) in the amounts and for the time periods stated in the following table:
| | | | | | | | | | | | |
| Fund | | Temporary
Expense Cap | | | Temporary
Expense Cap
Expiration Date | | | Permanent
Expense Cap | |
| NWQ Global Equity | | | 1.00 | % | | | October 31, 2016 | | | | N/A | |
| NWQ Global Equity Income | | | 1.00 | | | | October 31, 2016 | | | | N/A | |
| NWQ Multi-Cap Value | | | 1.13 | | | | October 31, 2015 | | | | N/A | |
| NWQ Large-Cap Value | | | N/A | | | | N/A | | | | 1.35 | % |
| NWQ Small/Mid-Cap Value | | | 1.10 | | | | October 31, 2014 | | | | 1.45 | |
| NWQ Small-Cap Value | | | N/A | | | | N/A | | | | 1.50 | |
| Value Opportunities | | | N/A | | | | N/A | | | | 1.50 | |
N/A – Not applicable.
The Trust pays no compensation directly to those of its trustees who are affiliated with the Adviser or to its officers, all of whom receive remuneration for their services to the Trust from the Adviser or its affiliates. The Board of Trustees has adopted a deferred compensation plan for independent trustees that enables trustees to elect to defer receipt of all or a portion of the annual compensation they are entitled to receive from certain Nuveen-advised funds. Under the plan, deferred amounts are treated as though equal dollar amounts had been invested in shares of select Nuveen-advised funds.
During the fiscal year ended June 30, 2014, Nuveen Securities, LLC (the “Distributor”), a wholly-owned subsidiary of Nuveen, collected sales charges on purchases of Class A Shares, the majority of which were paid out as concessions to financial intermediaries as follows:
| | | | | | | | | | | | | | | | |
| | | NWQ Global
Equity | | | NWQ Global
Equity Income | | | NWQ Multi-Cap
Value | | | NWQ Large-Cap
Value | |
| Sales charges collected (Unaudited) | | $ | — | | | $ | — | | | $ | 10,972 | | | $ | 92,716 | |
| Paid to financial intermediaries (Unaudited) | | | — | | | | — | | | | 9,588 | | | | 81,246 | |
| | | | | | | | | | | | |
| | | NWQ Small/Mid-Cap
Value | | | NWQ Small-Cap
Value | | | Value
Opportunities | |
Sales charges collected (Unaudited) | | $ | 21,431 | | | $ | 203,287 | | | $ | 66,017 | |
Paid to financial intermediaries (Unaudited) | | | 19,155 | | | | 181,613 | | | | 57,528 | |
The Distributor also received 12b-1 service fees on Class A Shares, substantially all of which were paid to compensate financial intermediaries for providing services to shareholders relating to their investments.
During the fiscal year ended June 30, 2014, the Distributor compensated financial intermediaries directly with commission advances at the time of purchase as follows:
| | | | | | | | | | | | | | | | |
| | | NWQ Global
Equity | | | NWQ Global
Equity Income | | | NWQ Multi-Cap
Value | | | NWQ Large-Cap
Value | |
| Commission advances (Unaudited) | | $ | — | | | $ | — | | | $ | 7,540 | | | $ | 26,627 | |
| | | | | | | | | | | | |
| | | NWQ Small/Mid-Cap
Value | | | NWQ Small-Cap
Value | | | Value
Opportunities | |
| Commission advances (Unaudited) | | $ | 8,815 | | | $ | 122,084 | | | $ | 16,302 | |
To compensate for commissions advanced to financial intermediaries, all 12b-1 service and distribution fees collected on Class B Shares during the first year following a purchase, all 12b-1 distribution fees collected on Class B Shares, and all 12b-1 service and distribution fees collected on Class C Shares during the first year following a purchase are retained by the Distributor. During the fiscal year ended June 30, 2014, the Distributor retained such 12b-1 fees as follows:
| | | | | | | | | | | | | | | | |
| | | NWQ Global
Equity | | | NWQ Global
Equity Income | | | NWQ Multi-Cap
Value | | | NWQ Large-Cap
Value | |
| 12b-1 fees retained (Unaudited) | | $ | 124 | | | $ | 3,334 | | | $ | — | | | $ | 25,118 | |
| | | | | | | | | | | | |
| | | NWQ Small/Mid-Cap
Value | | | NWQ Small-Cap
Value | | | Value
Opportunities | |
| 12b-1 fees retained (Unaudited) | | $ | 4,760 | | | $ | 35,317 | | | $ | 42,200 | |
The remaining 12b-1 fees charged to the Funds were paid to compensate financial intermediaries for providing services to shareholders relating to their investments.
The Distributor also collected and retained CDSC on share redemptions during the fiscal year ended June 30, 2014, as follows:
| | | | | | | | | | | | | | | | |
| | | NWQ Global
Equity | | | NWQ Global
Equity Income | | | NWQ Multi-Cap
Value | | | NWQ Large-Cap
Value | |
| CDSC retained (Unaudited) | | $ | — | | | $ | — | | | $ | 1,138 | | | $ | — | |
| | | | | | | | | | | | |
| | | NWQ Small/Mid-Cap Value | | | NWQ Small-Cap
Value | | | Value
Opportunities | |
CDSC retained (Unaudited) | | $ | 685 | | | $ | 2,948 | | | $ | 3,683 | |
As of June 30, 2014, Nuveen owned shares of the Funds as follows:
| | | | | | | | | | | | | | | | | | | | | | | | | | | | |
| | | NWQ Global
Equity | | | NWQ Global
Equity Income | | | NWQ Multi-Cap
Value | | | NWQ Large-Cap
Value | | | NWQ Small/Mid-Cap
Value | | | NWQ Small-Cap
Value | | | Value
Opportunities | |
| Class A Shares | | | 2,500 | | | | 12,500 | | | | — | | | | — | | | | — | | | | — | | | | — | |
| Class C Shares | | | 2,500 | | | | 12,500 | | | | — | | | | — | | | | — | | | | — | | | | — | |
| Class R3 Shares | | | — | | | | 12,500 | | | | — | | | | 2,672 | | | | 2,186 | | | | 1,583 | | | | — | |
| Class R6 Shares | | | — | | | | — | | | | — | | | | — | | | | — | | | | 802 | | | | — | |
| Class I Shares | | | 45,000 | | | | 12,500 | | | | — | | | | — | | | | — | | | | — | | | | — | |
Notes to Financial Statements (continued)
8. New Accounting Pronouncement
Financial Accounting Standards Board (“FASB”) Financial Services – Investment Companies (Topic 946): Amendments to the Scope, Measurement, and Disclosure Requirements
During 2013, the FASB issued Accounting Standards Update (“ASU”) 2013-08, “Financial Services – Investment Companies (Topic 946): Amendments to the Scope, Measurement, and Disclosure Requirements,” which amends the criteria that define an investment company and clarifies the measurement guidance and requires new disclosures for investment companies. ASU 2013-08 is effective for fiscal years beginning on or after December 15, 2013. Management has evaluated the implications of ASU 2013-08 and determined that each Fund’s current disclosures already followed this guidance and therefore it does not have an impact on the Fund’s financial statements or footnote disclosures.
9. Subsequent Event
As previously described in Note 1- General Information and Significant Accounting Policies, Agreement and Plan of Merger, the new agreements have been approved by shareholders of NWQ Global Equity, NWQ Global Equity Income and NWQ Multi-Cap Value. Shareholder meetings for NWQ Large-Cap Value, NWQ Small/Mid-Cap Value, NWQ Small-Cap Value and Tradewinds Value Opportunities have been adjourned until Friday, September 19, 2014, with respect to approval of the new investment management and investment sub-advisory agreements (as well as the approval of certain fundamental investment policy changes) to permit the continued solicitation of additional votes. The adjourned meetings for these Funds will be held at 2:30 p.m., Central time, on Friday, September 19, 2014 at the offices of Nuveen Investments, 333 West Wacker Drive, Chicago, Illinois 60606.
Nuveen’s transaction with TIAA-CREF is currently expected to close early in the fourth quarter of 2014, but remains subject to other customary closing conditions.
Additional
Fund Information (Unaudited)
| | | | | | | | | | | | |
| | | | | | |
| | Fund Manager Nuveen Fund Advisors, LLC 333 West Wacker Drive Chicago, IL 60606 Sub-Advisers NWQ Investment Management
Company, LLC 2049 Century Park East, 16th Floor Los Angeles, CA 90067 Tradewinds Global Investors, LLC 2049 Century Park East, 20th Floor Los Angeles, CA 90067 | | Independent Registered
Public Accounting Firm PricewaterhouseCoopers LLP Chicago, IL 60606 Custodian State Street Bank & Trust
Company Boston, MA 02111 | | Transfer Agent and
Shareholder Services Boston Financial Data Services Nuveen Investor Services P.O. Box 8530 Boston, MA 02266-8530 (800) 257-8787 | | Legal Counsel Chapman and Cutler LLP Chicago, IL 60603 | | | | |
| | | | | | | | | | | | | | |
| | | | | |
| | | | | | | | | | |
| | |
| | Long-Term Capital Gain Distributions: The following Funds hereby designate as long-term capital gain dividends, pursuant to Internal Revenue Code Section 852(b)(3), the amount shown in the accompanying table or, if greater, the amount necessary to reduce earnings and profits of the Funds related to net capital gain to zero for the tax year ended June 30, 2014: | | |
| | | | | | | |
| | | Fund | | | | | | | | | | Long-Term Capital Gain
Distributions | | |
| | Nuveen NWQ Global Equity Income Fund | | | | $22,540 | | |
| | Nuveen NWQ Large-Cap Value Fund | | | | $101,930,765 | | |
| | Nuveen Tradewinds Value Opportunities Fund | | | | $8,082,378 | | |
| | | | | |
| | | | | | | | | | |
| | |
| | Distribution Information: The following Funds hereby designate their percentages of dividends paid from net ordinary income as dividends qualifying for the 70% dividends received deduction (“DRD”) for corporations and their percentages as qualified dividend income (“QDI”) for individuals under Section 1(h)(11) of the Internal Revenue Code as shown in the accompanying table. The actual qualified dividend income distributions will be reported to shareholders on Form 1099-DIV which will be sent to shareholders shortly after calendar year end. | | |
| | | | | | | |
| | | Fund | | | | | | | | % of DRD | | % of QDI | | |
| | Nuveen NWQ Global Equity Income Fund | | 81% | | 100% | | |
| | Nuveen NWQ Multi-Cap Value Fund | | 100% | | 100% | | |
| | Nuveen NWQ Large-Cap Value Fund | | 95% | | 100% | | |
| | Nuveen Tradewinds Value Opportunities Fund | | 32% | | 54% | | |
| | | | | |
| | | | | | | | | | |
| | |
| | Quarterly Form N-Q Portfolio of Investments Information: Each Fund is required to file its complete schedule of portfolio holdings with the Securities and Exchange Commission (SEC) for the first and third quarters of each fiscal year on Form N-Q. You may obtain this information directly from the SEC. Visit the SEC on-line at http://www.sec.gov or in person at the SEC’s Public Reference Room in Washington, D.C. Call the SEC toll-free at
(800) SEC-0330 for room hours and operation. | | |
| | | | | |
| | | | | | | | | | |
| | |
| | Nuveen Funds’ Proxy Voting Information: You may obtain (i) information regarding how each fund voted proxies relating to portfolio securities held during the most recent twelve-month period ended June 30, without charge, upon request, by calling Nuveen Investments toll-free at (800) 257-8787 or on Nuveen’s website at www.nuveen.com and (ii) a description of the policies and procedures that each fund used to determine how to vote proxies relating to portfolio securities without charge, upon request, by calling Nuveen Investments toll-free at
(800) 257-8787. You may also obtain this information directly from the SEC. Visit the SEC on-line at http://www.sec.gov. | | |
| | | | | |
| | | | | | | | | | |
| | |
| | FINRA BrokerCheck: The Financial Industry Regulatory Authority (FINRA) provides information regarding the disciplinary history of FINRA member firms and associated investment professionals. This information as well as an investor brochure describing FINRA BrokerCheck is available to the public by calling the FINRA BrokerCheck Hotline number at (800) 289-9999 or by visiting www.FINRA.org. | | |
Glossary of Terms
Used in this Report
Average Annual Total Return: This is a commonly used method to express an investment’s performance over a particular, usually multi-year time period. It expresses the return that would have been necessary each year to equal the investment’s actual cumulative performance (including change in NAV or offer price and reinvested dividends and capital gains distributions, if any) over the time period being considered.
Gross Domestic Product (GDP): The total market value of all final goods and services produced in a country/region in a given year, equal to total consumer, investment and government spending, plus the value of exports, minus the value of imports.
Lipper Global Equity Income Funds Classification Average: Represents the average annualized total return for all reporting funds in the Lipper Global Equity Income Funds Classification. Lipper returns account for the effects of management fees and assume reinvestment of distributions, but do not reflect any applicable sales charge.
Lipper Global Multi-Cap Value Funds Classification Average: Represents the average annualized total return for all reporting funds in the Lipper Global Multi-Cap Value Funds Classification. Lipper returns account for the effects of management fees and assume reinvestment of distributions, but do not reflect any applicable sales charge.
Lipper Large-Cap Value Funds Classification Average: Represents the average annualized total return for all reporting funds in the Lipper Large-Cap Value Funds Classification. The Lipper returns account for the effects of management fees and assume reinvestment of distributions, but do not reflect any applicable sales charge.
Lipper Multi-Cap Value Funds Classification Average: Represents the average annualized total return for all reporting funds in the Lipper Multi-Cap Value Funds Classification. The Lipper returns account for the effects of management fees and assume reinvestment of distributions, but do not reflect any applicable sales charge.
Lipper Small-Cap Core Funds Classification Average: Represents the average annualized total return for all reporting funds in the Lipper Small-Cap Core Funds Classification. The Lipper returns account for the effects of management fees and assume reinvestment of distributions, but do not reflect any applicable sales charge.
Morgan Stanley Capital International (MSCI) World Index: A free float-adjusted market capitalization weighted index that is designed to measure the equity market performance of developed markets. The MSCI World Index consists of the following 23 developed market country indexes: Australia, Austria, Belgium, Canada, Denmark, Finland, France, Germany, Hong Kong, Ireland, Israel, Italy, Japan, Netherlands, New Zealand, Norway, Portugal, Singapore, Spain, Sweden, Switzerland, the U.K. and the U.S. Index returns assume reinvestment of distributions, but do not reflect any applicable sales charges or management fees.
Net Asset Value (NAV) Per Share: A fund’s Net Assets is equal to its total assets (securities, cash and accrued earnings) less its total liabilities. For funds with multiple classes, Net Assets are determined separately for each share class. NAV per share is equal to the fund’s (or share class’) Net Assets divided by its number of shares outstanding.
Russell 1000® Value Index: An index that measures the performance of those Russell 1000 companies with lower price-to-book ratios and lower forecasted growth values. Index returns assume reinvestment of distributions, but do not include the effects of any applicable sales charges or management fees.
Russell 2000® Value Index: An index that measures the performance of those Russell 2000 companies with lower price-to-book ratios and lower forecasted growth values. Index returns assume reinvestment of distributions, but do not include the effects of any applicable sales charges or management fees.
Russell 2500® Value Index: An index that measures the performance of the 2,500 smallest companies in the Russell 3000® Index, which represents approximately 20% of the total market capitalization of the Russell 3000® Index. Index returns assume reinvestment of dividends, but do not include the effects of any applicable sales charges or management fees.
Russell 3000® Value Index: An index that measures the performance of those Russell 3000 companies with lower price-to-book ratios and higher forecasted growth values. Index returns assume reinvestment of distributions, but do not include the effects of any applicable sales charges or management fees.
S&P 500® Index: An unmanaged index generally considered representative of the U.S. stock market. Index returns assume reinvestment of distributions, but do not include the effects of any applicable sales charges or management fees.
Tax Equalization: The practice of treating a portion of the distribution made to a redeeming shareholder, which represents his proportionate part of undistributed net investment income and capital gain as a distribution for tax purposes. Such amounts are referred to as the equalization debits (or payments) and will be considered a distribution to the shareholder of net investment income and capital gain for calculation of the fund’s dividends paid deduction.
Annual Investment Management Agreement
Approval Process (Unaudited)
I.
The Approval Process
The Board of Trustees of each Fund (each, a “Board” and each Trustee, a “Board Member”), including the Board Members who are not parties to the Funds’ advisory or sub-advisory agreements or “interested persons” of any such parties (the “Independent Board Members”), is responsible for overseeing the performance of the investment adviser and the sub-adviser to the respective Fund and determining whether to approve or continue such Fund’s advisory agreement (each, an “Original Investment Management Agreement”) between the Fund and Nuveen Fund Advisors, LLC (the “Adviser”) and sub-advisory agreement (each, an “Original Sub-Advisory Agreement” and, together with the Original Investment Management Agreement, the “Original Advisory Agreements”) between the Adviser and, for each Fund other than the Nuveen Tradewinds Value Opportunities Fund (the “Value Opportunities Fund”), NWQ Investment Management Company, LLC (“NWQ”), and for the Value Opportunities Fund, Tradewinds Global Investors, LLC (“Tradewinds”; Tradewinds and NWQ are each a “Sub-Adviser”). Pursuant to the Investment Company Act of 1940, as amended (the “1940 Act”), after an initial term of up to two years, each Board is required to consider the continuation of the respective Original Advisory Agreements on an annual basis. In addition, prior to its annual review, the Board Members were advised of the potential acquisition of Nuveen Investments, Inc. (“Nuveen”) by TIAA-CREF (the “Transaction”). For purposes of this section, references to “Nuveen” herein include all affiliates of Nuveen Investments, Inc. providing advisory, sub-advisory, distribution or other services to the Funds and references to the “Board” refer to the Board of each Fund. In accordance with the 1940 Act and the terms of the Original Advisory Agreements, the completion of the Transaction would terminate each of the Original Investment Management Agreements and the Original Sub-Advisory Agreements. Accordingly, at an in-person meeting held on April 30, 2014 (the “April Meeting”), the Board, including all of the Independent Board Members, performed its annual review of the Original Advisory Agreements and approved the continuation of the Original Advisory Agreements for the Funds. Furthermore, in anticipation of the termination of the Original Advisory Agreements that would occur upon the consummation of the Transaction, the Board also approved for each Fund a new advisory agreement (each, a “New Investment Management Agreement”) between the Fund and the Adviser and a new sub-advisory agreement (each, a “New Sub-Advisory Agreement” and, together with the New Investment Management Agreement, the “New Advisory Agreements”) between the Adviser and the applicable Sub-Adviser, each on behalf of the respective Fund to be effective following the completion of the Transaction and the receipt of the requisite shareholder approval.
The Board noted that the Original Advisory Agreements for the Nuveen NWQ Global Equity Fund (the “Global Equity Fund”) were recently approved by the Board in February 2014 and therefore would not have been up for review but for the change of control of Nuveen terminating the Original Advisory Agreements upon completion of the Transaction. For administrative convenience, the Board reapproved the Original Advisory Agreements. A discussion of the Board’s initial approval of the Original Advisory Agreements for the Global Equity Fund is set forth in Part III below.
Leading up to the April Meeting, the Independent Board Members had several meetings and deliberations, with and without management from Nuveen present and with the advice of legal counsel, regarding the Original Advisory Agreements, the Transaction and its impact and the New Advisory Agreements. At its meeting held on February 25-27, 2014 (the “February Meeting”), the Board Members met with a senior executive representative of TIAA-CREF to discuss the proposed Transaction. At the February Meeting, the Independent Board Members also established an ad hoc committee comprised solely of the Independent Board Members to monitor and evaluate the Transaction and to keep the Independent Board Members updated with developments regarding the Transaction. On March 20, 2014, the ad hoc committee met telephonically to discuss with management of Nuveen, and separately with independent legal counsel, the terms of the proposed Transaction and its impact on, among other things: the governance structure of Nuveen; the strategic plans for Nuveen; the operations of the Nuveen funds (which include the Funds); the quality or level of services provided to the Nuveen funds; key personnel that service the Nuveen funds and/or the Board and the compensation or incentive arrangements to retain such personnel; Nuveen’s capital structure; the regulatory requirements applicable to Nuveen or fund operations; and the Nuveen funds’ fees and expenses, including the funds’ complex-wide fee arrangement. Following the meeting of the ad hoc committee, the Board met in person (two Independent Board Members participating telephonically) in an executive session on March 26, 2014 to further discuss the proposed Transaction. At the executive session, the Board met privately with independent legal counsel to review its duties with respect to reviewing advisory agreements, particularly in the context of a change of control, and to evaluate further the Transaction and its impact on the Nuveen funds, the Adviser and the Sub-Advisers (collectively, the “Fund Advisers” and each, a “Fund Adviser”) and the services provided. Representatives of Nuveen also met with the Board to update the Board Members on developments regarding the Transaction, to respond to questions and to discuss, among other things: the governance of the Fund Advisers following the Transaction; the background, culture (including with respect to regulatory and compliance matters) and resources of TIAA-CREF; the general plans and intentions of TIAA-CREF for Nuveen; the terms and conditions of the Transaction (including financing terms); any benefits or detriments the Transaction may impose on the Nuveen funds, TIAA-CREF or the Fund Advisers; the reaction from the Fund Advisers’ employees knowledgeable of the Transaction; the incentive and retention plans for key personnel of the Fund Advisers; the potential access to additional distribution platforms and economies of scale; and the impact of any additional regulatory schemes that may be
applicable to the Nuveen funds given the banking and insurance businesses operated in the TIAA-CREF enterprise. As part of its review, the Board also held a separate meeting on April 15-16, 2014 to review the Nuveen funds’ investment performance and consider an analysis provided by the Adviser of each sub-adviser of the Nuveen funds (including the Sub-Advisers) and the Transaction and its implications to the Nuveen funds. During their review of the materials and discussions, the Independent Board Members presented the Adviser with questions and the Adviser responded. Further, the Independent Board Members met in an executive session with independent legal counsel on April 29, 2014 and April 30, 2014.
In connection with their review of the Original Advisory Agreements and the New Advisory Agreements, the Independent Board Members received extensive information regarding the Funds and the Fund Advisers including, among other things: the nature, extent and quality of services provided by each Fund Adviser; the organization and operations of any Fund Adviser; the expertise and background of relevant personnel of each Fund Adviser; a review of performance (including performance comparisons against the performance of peer groups and appropriate benchmarks, to the extent available); a comparison of fund fees and expenses relative to peers (as described below); a description and assessment of shareholder service levels for the Funds; a summary of the performance of certain service providers; a review of fund initiatives and shareholder communications; and an analysis of the Adviser’s profitability with comparisons to peers in the managed fund business. In light of the proposed Transaction, the Independent Board Members, through their independent legal counsel, also requested in writing and received additional information regarding the proposed Transaction and its impact on the provision of services by the Fund Advisers.
The Independent Board Members received, well in advance of the April Meeting, materials which responded to the request for information regarding the Transaction and its impact on Nuveen and the Nuveen funds including, among other things: the structure and terms of the Transaction; the impact of the Transaction on Nuveen, its operations and the nature, quality and level of services provided to the Nuveen funds, including, in particular, any changes to those services that the Nuveen funds may experience following the Transaction; the strategic plan for Nuveen, including any financing arrangements following the Transaction and any cost-cutting efforts that may impact services; the organizational structure of TIAA-CREF, including the governance structure of Nuveen following the Transaction; any anticipated effect on each Nuveen fund’s expense ratios (including changes to advisory and sub-advisory fees) and economies of scale that may be expected; any benefits or conflicts of interest that TIAA-CREF, Nuveen or their affiliates can expect from the Transaction; any benefits or undue burdens or other negative implications that may be imposed on the Nuveen funds as a result of the Transaction; the impact on Nuveen or the Nuveen funds as a result of being subject to additional regulatory schemes that TIAA-CREF must comply with in operating its various businesses; and the costs associated with obtaining necessary shareholder approvals and the bearer of such costs. The Independent Board Members also received a memorandum describing the applicable laws, regulations and duties in approving advisory contracts, including in conjunction with a change of control, from their independent legal counsel.
The materials and information prepared in connection with the review of the Original Advisory Agreements and New Advisory Agreements supplemented the information and analysis provided to the Board during the year. In this regard, throughout the year, the Board, acting directly or through its committees, regularly reviewed the performance and various services provided by the Adviser and Sub-Advisers. The Board met at least quarterly as well as at other times as the need arose. At its quarterly meetings, the Board reviewed reports by the Adviser regarding, among other things, fund performance, fund expenses, premium and discount levels of closed-end funds, the performance of the investment teams and compliance, regulatory and risk management matters. In addition to regular reports, the Adviser provided special reports to the Board or a committee thereof from time to time to enhance the Board’s understanding of various topics that impact some or all the Nuveen funds (such as distribution channels, oversight of omnibus accounts and leverage management topics), to update the Board on regulatory developments impacting the investment company industry or to update the Board on the business plans or other matters impacting the Adviser. The Board also met with key investment personnel managing certain Nuveen fund portfolios during the year.
In addition, the Board has created several standing committees (the Executive Committee; the Dividend Committee; the Audit Committee; the Compliance, Risk Management and Regulatory Oversight Committee; the Nominating and Governance Committee; the Open-End Funds Committee; and the Closed-End Funds Committee). The Open-End Funds Committee and Closed-End Funds Committee are intended to assist the full Board in monitoring and gaining a deeper insight into the distinctive business practices of closed-end and open-end funds. These two Committees have met prior to each quarterly Board meeting, and the Adviser provided presentations to these Committees permitting them to delve further into specific matters or initiatives impacting the respective product line.
Further, the Board continued its program of seeking to have the Board Members or a subset thereof visit each sub-adviser to the Nuveen funds and meet key investment and business personnel at least once over a multiple year rotation. In this regard, the Independent Board Members made site visits to certain teams of each Sub-Adviser in October 2013.
The Board considered the information provided and knowledge gained at these meetings and visits during the year when performing its annual review of the Original Advisory Agreements and its review of the New Advisory Agreements. The Independent Board Members also were assisted throughout the process by independent legal counsel. During the course of the year and during their deliberations regarding the review of advisory contracts, the Independent Board Members met with independent legal counsel in executive sessions without management present. In addition, it is important to
Annual Investment Management Agreement Approval Process (Unaudited) (continued)
recognize that the management arrangements for the funds are the result of many years of review and discussion between the Independent Board Members and Nuveen fund management and that the Board Members’ conclusions may be based, in part, on their consideration of fee arrangements and other factors developed in previous years.
The Board considered all factors it believed relevant with respect to each Fund, including, among other things: (a) the nature, extent and quality of the services provided by the Fund Advisers, (b) the investment performance of the Fund and the Fund Advisers (to the extent available, as described below), (c) the advisory fees and costs of the services to be provided to the Fund and the profitability of the Fund Advisers, (d) the extent of any economies of scale, (e) any benefits derived by the Fund Advisers from the relationship with the Fund and (f) other factors. With respect to the New Advisory Agreements, the Board also considered the Transaction and its impact on the foregoing factors. Each Board Member may have accorded different weight to the various factors in reaching his or her conclusions with respect to a Fund’s Original Advisory Agreements and New Advisory Agreements. The Independent Board Members did not identify any single factor as all-important or controlling. The Independent Board Members’ considerations were instead based on a comprehensive consideration of all the information presented. The principal factors considered by the Board and its conclusions are described below.
A. Nature, Extent and Quality of Services
1. The Original Advisory Agreements
In considering renewal of each Original Advisory Agreement, the Independent Board Members considered the nature, extent and quality of the respective Fund Adviser’s services, including portfolio management services (and the resulting Fund performance, if any, as noted below) and administrative services. The Independent Board Members further considered the overall reputation and capabilities of the Adviser and its affiliates, the commitment of the Adviser to provide high quality service to the Funds, their overall confidence in the capability and integrity of the Adviser and its staff and the Adviser’s responsiveness to questions and concerns raised by them. The Independent Board Members reviewed materials outlining, among other things: each Fund Adviser’s organization and business; the types of services that each Fund Adviser or its affiliates provide to each Fund; the performance record of each Fund (if any, as described in further detail below); and any initiatives Nuveen had taken for the open-end fund product line.
In considering the services provided by the Fund Advisers, the Board recognized that the Adviser provides a myriad of investment management, administrative, compliance, oversight and other services for the Funds, and the Sub-Advisers generally provide the portfolio advisory services to the Funds under the oversight of the Adviser. The Board considered the wide range of services provided by the Adviser to the Nuveen funds beginning with developing the fund and monitoring and analyzing its performance to providing or overseeing the services necessary to support a fund’s daily operations. The Board recognized the Adviser, among other things, provides: (a) product management (such as analyzing ways to better position a fund in the marketplace, maintaining relationships to gain access to distribution platforms and setting dividends); (b) fund administration (such as preparing a fund’s tax returns, regulatory filings and shareholder communications; managing fund budgets and expenses; overseeing a fund’s various service providers; and supporting and analyzing new and existing funds); (c) Board administration (such as supporting the Board and its committees, in relevant part, by organizing and administering the Board and committee meetings and preparing the necessary reports to assist the Board in its duties); (d) compliance (such as monitoring adherence to a fund’s investment policies and procedures and applicable law; reviewing the compliance program periodically and developing new policies or updating existing compliance policies and procedures as considered necessary or appropriate; responding to regulatory requests; and overseeing compliance testing of sub-advisers); (e) legal support (such as preparing or reviewing fund registration statements, proxy statements and other necessary materials; interpreting regulatory requirements and compliance thereof; and maintaining applicable registrations); and (f) investment services (such as overseeing and reviewing sub-advisers and their investment teams; analyzing performance of the funds; overseeing investment and risk management; overseeing the daily valuation process for portfolio securities and developing and recommending valuation policies and methodologies and changes thereto; and participating in fund development, leverage management and the development of investment policies and parameters).
In its review, the Board also considered the new services, initiatives or other changes adopted since the last advisory contract review that were designed to enhance the services and support the Adviser provides to the Nuveen funds. The Board recognized that some initiatives are a multi-year process. In reviewing the activities of 2013, the Board recognized that the year reflected the Adviser’s continued focus on fund rationalization for both closed-end and open-end funds, consolidating certain funds through mergers that were designed to improve efficiencies and economies of scale for shareholders, repositioning various funds through updates in their investment policies and guidelines with the expectation of bringing greater value to shareholders, and liquidating certain funds. As in the past, the Board recognized the Adviser’s significant investment in its technology initiatives, including the continued progress toward a central repository for fund and other Nuveen product data and implementing a data system to support the risk oversight group enabling it to provide more detailed risk analysis for the Nuveen funds. The Board noted the new data system has permitted more in-depth analysis of the investment risks of the Funds and across the complex providing additional feedback and insights to the investment teams and more comprehensive risk reporting to the Board. The Adviser also conducted several workshops for the Board
regarding the new data system, including explaining the risk measures being applied and their purpose. The Board also recognized the enhancements in the valuation group within the Adviser, including centralizing the fund pricing process within the valuation group, trending to more automated and expedient reviews and continuing to expand its valuation team. The Board further considered the expansion of personnel in the compliance department enhancing the collective expertise of the group, investments in additional compliance systems and the updates of various compliance policies.
In addition to the foregoing actions, the Board also considered other initiatives related to the open-end funds, including, among other things: the continued focus on enhancing the product line through the development of new funds, including the development of alternative strategies reflecting trends in the industry; the enhanced support provided to the Board by providing comprehensive in-depth presentations to the Open-End Funds Committee; and the development of a new class of shares for certain funds.
As noted, the Adviser also oversees the Sub-Advisers who provide the portfolio advisory services to the Funds. In reviewing the portfolio advisory services provided to each Fund, the Nuveen Investment Services Oversight Team of the Adviser analyzes the performance of the Sub-Advisers and may recommend changes to the investment team or investment strategies as appropriate. In assisting the Board’s review of the Sub-Advisers, the Adviser provides a report analyzing, among other things, each Sub-Adviser’s investment team and changes thereto, organization and history, assets under management, the investment team’s philosophy and strategies in managing the Fund, developments affecting the applicable Sub-Adviser or Fund and Fund performance. In their review of each Sub-Adviser, the Independent Board Members considered, among other things, the experience and qualifications of the relevant investment personnel, their investment philosophy and strategies, the Sub-Adviser’s organization and stability, its capabilities and any initiatives taken or planned to enhance its current capabilities or support potential growth of business and, as outlined in further detail below, fund performance. The Independent Board Members also reviewed portfolio manager compensation arrangements to evaluate each Fund Adviser’s ability to attract and retain high quality investment personnel, preserve stability, and reward performance while not providing an inappropriate incentive to take undue risks.
Given the importance of compliance, the Independent Board Members also considered Nuveen’s compliance program, including the report of the chief compliance officer regarding the Nuveen funds’ compliance policies and procedures; the resources dedicated to compliance; the record of compliance with the policies and procedures; and Nuveen’s supervision of the Funds’ service providers. The Board recognized Nuveen’s commitment to compliance and strong commitment to a culture of compliance. Given the Adviser’s emphasis on monitoring investment risk, the Board has also appointed two Independent Board Members as point persons to review and keep the Board apprised of developments in this area and work with applicable Fund Adviser personnel.
Based on their review, the Independent Board Members found that, overall, the nature, extent and quality of services provided to each Fund under the respective Original Advisory Agreement were satisfactory.
2. The New Advisory Agreements
In evaluating the nature, quality and extent of the services expected to be provided by the Fund Advisers under the New Investment Management Agreements and the New Sub-Advisory Agreements, the Board Members concluded that no diminution in the nature, quality and extent of services provided to each Fund and its shareholders by the respective Fund Advisers is expected as a result of the Transaction. In making their determination, the Independent Board Members considered, among other things: the expected impact, if any, of the Transaction on the operations, facilities, organization and personnel of each Fund Adviser; the ability of each Fund Adviser to perform its duties after the Transaction, including any changes to the level or quality of services provided to the Funds; the potential implications of any additional regulatory requirements imposed on the Fund Advisers or the Nuveen funds following the Transaction; and any anticipated changes to the investment and other practices of the Nuveen funds.
The Board noted that the terms of each New Investment Management Agreement, including the fees payable thereunder, are substantially identical to those of the Original Investment Management Agreement relating to the same Fund. Similarly, the terms of each New Sub-Advisory Agreement, including fees payable thereunder, are substantially identical to those of the Original Sub-Advisory Agreement relating to the same Fund. The Board considered that the services to be provided and the standard of care under the New Investment Management Agreements and the New Sub-Advisory Agreements are the same as the corresponding original agreements. The Board Members noted the Transaction also does not alter the allocation of responsibilities between the Adviser and the applicable Sub-Adviser. The Sub-Advisers will continue to furnish an investment program, make investment decisions and place all orders for the purchase and sale of securities, all on behalf of each applicable Fund and subject to oversight of the Board and the Adviser. The Board noted that TIAA-CREF did not anticipate any material changes to the advisory, sub-advisory or other services provided to the Nuveen funds as a result of the Transaction. The Independent Board Members recognized that there were not any planned “cost cutting” measures that could be expected to reduce the nature, extent or quality of services. The Independent Board Members further noted that there were currently no plans for material changes to senior personnel at Nuveen or key personnel who provide services to the
Annual Investment Management Agreement Approval Process (Unaudited) (continued)
Nuveen funds and the Board following the Transaction. The key personnel who have responsibility for the Nuveen funds in each area, including portfolio management, investment oversight, fund management, fund operations, product management, legal/compliance and board support functions, are expected to be the same following the Transaction, although such personnel may have additional reporting requirements to TIAA-CREF. The Board also considered the anticipated incentive plans designed to retain such key personnel. Notwithstanding the foregoing, the Board Members recognized that personnel changes may occur in the future as a result of normal business developments or personal career decisions.
The Board Members also considered Nuveen’s proposed governance structure following the Transaction and noted that Nuveen was expected to remain a stand-alone business within the TIAA-CREF enterprise and operate relatively autonomously from the other TIAA-CREF businesses, but would receive the general support and oversight from certain TIAA-CREF functional groups (such as legal, finance, internal audit, compliance, and risk management groups). The Board recognized, however, that Nuveen may be subject to additional reporting requirements as it keeps TIAA-CREF abreast of developments affecting the Nuveen business, may be required to modify certain of its reports, policies and procedures as necessary to conform to the practices followed in the TIAA-CREF enterprise and may need to collaborate with TIAA-CREF with respect to strategic planning for its business.
In considering the implications of the Transaction, the Board Members also recognized the reputation and size of TIAA-CREF and the benefits that the Transaction may bring to the Nuveen funds and Nuveen. In this regard, the Board recognized, among other things, that the increased resources and support that may be available to Nuveen from TIAA-CREF and the improved capital structure of Nuveen Investments, Inc. (the parent of the Adviser) that would result from the significant reduction in its debt level may reinforce and enhance Nuveen’s ability to provide quality services to the Nuveen funds and to invest further into its infrastructure.
Further, with the consummation of the Transaction, the Board recognized the enhanced distribution capabilities for the Nuveen funds as the funds may gain access to TIAA-CREF’s distribution network, particularly through TIAA-CREF’s retirement platform and institutional client base. The Board also considered that investors in TIAA-CREF’s retirement platform may choose to roll their investments as they exit their retirement plans into the Nuveen funds. The Independent Board Members recognized the potential cost savings to the benefit of all shareholders of the Nuveen funds from reduced expenses as assets in the Nuveen fund complex rise pursuant to the complex-wide fee arrangement described in further detail below.
Based on their review, the Independent Board Members found that the expected nature, extent and quality of services to be provided to each Fund under its New Advisory Agreements were satisfactory and supported approval of the New Advisory Agreements.
B. The Investment Performance of the Funds and Fund Advisers
1. The Original Advisory Agreements
With respect to the Global Equity Fund, the Board recognized that such Fund was new with no performance history available at the time of its review. With respect to each of the other Funds, the Board, including the Independent Board Members, considered the performance history of each such Fund over various time periods. For such Funds, the Board reviewed reports, including an analysis of each such Fund’s performance and the applicable investment team. In considering each such Fund’s performance, the Board recognized that a fund’s performance can be reviewed through various measures including the fund’s absolute return, the fund’s return compared to the performance of other peer funds and the fund’s performance compared to its respective benchmark. Accordingly, the Board reviewed, among other things, each such Fund’s historic investment performance as well as information comparing the Fund’s performance information with that of other funds (the “Performance Peer Group”) and with recognized and/or customized benchmarks (i.e., generally benchmarks derived from multiple recognized benchmarks) for the quarter, one-, three- and five-year periods ending December 31, 2013, as well as performance information reflecting the first quarter of 2014 (or for such shorter periods available for the Nuveen NWQ Global Equity Income Fund (the “Global Equity Income Fund”), which did not exist for part of the foregoing time frame). This information supplemented the Nuveen fund performance information provided to the Board at each of its quarterly meetings.
In evaluating performance, the Board recognized several factors that may impact the performance data as well as the consideration given to particular performance data.
| | • | | The performance data reflects a snapshot in time, in this case as of the end of the most recent calendar year or quarter. A different performance period, however, could generate significantly different results. |
| | • | | Long-term performance can be adversely affected by even one period of significant underperformance so that a single investment decision or theme has the ability to disproportionately affect long-term performance. |
| | • | | The investment experience of a particular shareholder in a fund will vary depending on when such shareholder invests in such fund, the class held (if multiple classes offered in the fund) and the performance of the fund (or respective class) during that shareholder’s investment period. |
| | • | | Open-end funds offer multiple classes and the performance of the various classes of a fund should be substantially similar on a relative basis because all of the classes are invested in the same portfolio of securities and differences in performance among classes could be principally attributed to the variations in distribution and servicing expenses of each class. |
| | • | | The usefulness of comparative performance data as a frame of reference to measure a fund’s performance may be limited because the Performance Peer Group, among other things, does not adequately reflect the objectives and strategies of the fund, has a different investable universe, or the composition of the peer set may be limited in size or number as well as other factors. In this regard, the Board noted that the Adviser classified the Performance Peer Groups of the Nuveen funds from highly relevant to less relevant. For funds classified with less relevant Performance Peer Groups, the Board considered a fund’s performance compared to its benchmark to help assess the fund’s comparative performance. A fund was generally considered to have performed comparably to its benchmark if the fund’s performance was within certain thresholds compared to the performance of its benchmark and was considered to have outperformed or underperformed its benchmark if the fund’s performance was beyond these thresholds for the one- and three-year periods, subject to certain exceptions.i While the Board is cognizant of the relative performance of a fund’s peer set and/or benchmark(s), the Board evaluated fund performance in light of the respective fund’s investment objectives, investment parameters and guidelines and considered that the variations between the objectives and investment parameters or guidelines of the fund with its peers and/or benchmarks result in differences in performance results. |
With respect to any Nuveen funds for which the Board has identified performance concerns, the Board monitors such funds closely until performance improves, discusses with the Adviser the reasons for such results, considers those steps necessary or appropriate to address such issues and reviews the results of any efforts undertaken. The Board is aware, however, that shareholders chose to invest or remain invested in a fund knowing that the Adviser manages the fund and knowing the fund’s fee structure.
In considering the performance data, the Independent Board Members noted that the Nuveen NWQ Small/Mid-Cap Value Fund (the “Small/Mid-Cap Value Fund”) and the Nuveen NWQ Small-Cap Value Fund (the “Small-Cap Value Fund”) had demonstrated generally favorable performance in comparison to peers, performing in the first or second quartile over various periods. In addition, they noted that the Nuveen NWQ Multi-Cap Value Fund (the “Multi-Cap Value Fund”) and the Value Opportunities Fund had satisfactory performance compared to peers. In this regard, although the Multi-Cap Value Fund performed in the fourth quartile for the three-year period, it performed in the second quartile in the one-year period and the third quartile in the five-year period, and although the Value Opportunities Fund performed in the fourth quartile for the three-year period, it performed in the second quartile in the one-year period and the first quartile in the five-year period. Further, the Independent Board Members noted that although the Global Equity Income Fund did not have a Performance Peer Group assigned as it was not publicly offered at the time of the Board’s review, such Fund outperformed its benchmark in the one-year period and provided comparable performance to its benchmark in the three-year period.
The Nuveen NWQ Large-Cap Value Fund (the “Large-Cap Value Fund”) lagged its peers and benchmarks over various periods. In this regard, the Large-Cap Value Fund was in the fourth quartile and underperformed its benchmark in the one-, three- and five-year periods. As described above, for Nuveen funds with challenged performance, the Board considered and discussed the factors contributing to the performance results and considered any steps that have been or should be taken to address performance issues. With respect to NWQ, the Board recognized that its deep value style has continued to be challenged in the market in recent years. In reviewing the performance of the Large-Cap Value Fund, the Board noted the factors that contributed to its underperformance, including, among other things, its gold holdings. The Board further noted a change in a research analyst servicing such Fund. Despite the comparative data, the Board recognized that such Fund posted strong absolute performance for 2013. The Board will continue to monitor the Large-Cap Value Fund and any steps proposed or taken to address performance challenges.
Except as otherwise noted above, based on their review, the Independent Board Members determined that each Fund’s investment performance had been satisfactory.
2. The New Advisory Agreements
With respect to the performance of each Fund, the Board considered that the portfolio investment personnel responsible for the management of the respective Fund portfolios were expected to continue to manage such portfolios following the completion of the Transaction and the investment strategies of the Funds were not expected to change as a result of the Transaction (subject to changes unrelated to the Transaction that are approved by the Board and/or shareholders). Accordingly, the findings regarding performance outlined above for the Original Advisory Agreements are applicable to the review of the New Advisory Agreements.
| i | The Board recognized that the Adviser considered a fund to have outperformed or underperformed its benchmark if the fund’s performance was higher or lower than the performance of the benchmark by the following thresholds: for open-end funds (+/- 100 basis points for equity funds excluding index funds; +/- 30 basis points for tax exempt fixed income funds; +/- 40 basis points for taxable fixed income funds) and for closed-end funds (assuming 30% leverage) (+/- 130 basis points for equity funds excluding index funds; +/- 39 basis points for tax exempt funds and +/- 52 basis points for taxable fixed income funds). |
Annual Investment Management Agreement Approval Process (Unaudited) (continued)
C. Fees, Expenses and Profitability
1. Fees and Expenses
As indicated above, the Board noted that the Original Advisory Agreements for the Global Equity Fund were recently approved and therefore would not have been up for review but for the change of control terminating the Original Advisory Agreements upon completion of the Transaction and that for administrative convenience, the Board reapproved such Original Advisory Agreements at the April Meeting. In connection with such reapproval, the Board considered the information concerning the Global Equity Fund provided at earlier meetings. See Part III.C below. In this regard, the Board considered, among other things, such Fund’s management fee structure, the rationale for the fee levels, and its expected expense ratio in absolute terms as well as compared with the fees and expense ratios of comparable funds. Accordingly, the Board reviewed, among other things, the gross management fee and estimated gross and net total expense ratio for the Fund, as well as comparative fee and expense data pertaining to the Fund’s peers in the Lipper category in which it was anticipated to be classified. The Independent Board Members also considered the sub-advisory fee rate for the Fund. The Independent Board Members further considered the fund-level breakpoint schedule and the complex-wide breakpoint schedule and any applicable fee waivers and expense reimbursements.
For Funds other than the Global Equity Fund, the Board evaluated the management fees and expenses of each such Fund, reviewing, among other things, such Fund’s gross management fees, net management fees and net expense ratios in absolute terms as well as compared to the fees and expenses of a comparable universe of funds provided by an independent fund data provider (the “Peer Universe”) and to a more focused subset of funds in the Peer Universe (the “Peer Group”) and any expense limitations.
The Independent Board Members further reviewed the methodology regarding the construction of the applicable Peer Universe and Peer Group. In reviewing the comparisons of fee and expense information, the Independent Board Members took into account that in certain instances various factors such as the limited size and particular composition of the Peer Universe or Peer Group (including the inclusion of other Nuveen funds in the peer set); expense anomalies; changes in the funds comprising the Peer Universe or Peer Group from year to year; levels of reimbursement or fee waivers; and the timing of information used may impact the comparative data thereby limiting somewhat the ability to make a meaningful comparison with peers.
In reviewing the fee schedule for a fund, the Independent Board Members also considered the fund-level and complex-wide breakpoint schedules (described in further detail below) and any fee waivers and reimbursements provided by Nuveen. In reviewing fees and expenses, the Board considered the expenses and fees to be higher if they were over 10 basis points higher, slightly higher if they were approximately 6 to 10 basis points higher, in line if they were within approximately 5 basis points higher than the peer average and below if they were below the peer average of the Peer Group. In reviewing the reports, the Board noted that the majority of the Nuveen funds were at, close to or below their peer average based on the net total expense ratio. The Independent Board Members observed that the Small-Cap Value Fund had a net management fee that was higher than its peer average, but a net expense ratio (including fee waivers and expense reimbursements) that was below its peer average. In addition, they noted that the Global Equity Income Fund, the Multi-Cap Value Fund, the Large-Cap Value Fund, the Small/Mid-Cap Value Fund and the Value Opportunities Fund had net management fees that were below or in line with their respective peer averages and net expense ratios (including fee waivers and expense reimbursements) that were below their respective peer averages.
Based on their review of the fee and expense information provided, the Independent Board Members determined that each Fund’s management fees (as applicable) to a Fund Adviser were reasonable in light of the nature, extent and quality of services provided to the Fund.
2. Comparisons with the Fees of Other Clients
The Board recognized that all Nuveen funds have a sub-adviser, either affiliated or non-affiliated, and therefore the overall fund management fee can be divided into two components, the fee retained by the Adviser and the fee paid to the sub-adviser. In general terms, the fee to the Adviser reflects the administrative and other services it provides to support the Nuveen fund (as described above) and, while some administrative services may occur at the sub-adviser level, the fee to the sub-adviser generally reflects the portfolio management services provided by the sub-adviser. The Independent Board Members considered the fees a Fund Adviser assesses to the Funds compared to that of other clients. With respect to non-municipal funds, such other clients of a Fund Adviser may include: separately managed accounts (both retail and institutional accounts), foreign investment funds offered by Nuveen, collective trust funds and funds that are not offered by Nuveen but are sub-advised by one of Nuveen’s investment management teams.
The Independent Board Members reviewed the nature of services provided by the Adviser, including through its affiliated sub-advisers and the average fee the affiliated sub-advisers assessed such clients as well as the range of fees assessed to the different types of separately managed accounts (such as retail, institutional or wrap accounts) to the extent applicable to the respective sub-adviser. In their review, the Independent Board Members considered the differences in the product types, including, but not limited to: the services provided, the structure and operations, product distribution and costs thereof, portfolio investment policies, investor profiles, account sizes and regulatory requirements. In evaluating the
comparisons of fees, the Independent Board Members noted that the fee rates charged to the Nuveen funds and other clients vary, among other things, because of the different services involved and the additional regulatory and compliance requirements associated with registered investment companies, such as the Funds. The Independent Board Members noted that, as a general matter, higher fee levels reflect higher levels of service, increased investment management complexity, greater product management requirements and higher levels of risk or a combination of the foregoing. The Independent Board Members further noted, in particular, that the range of services provided to the Funds (as discussed above) is generally much more extensive than that provided to separately managed accounts. Many of the additional administrative services provided by the Adviser are not required for institutional clients. The Independent Board Members also recognized that the management fee rates of the foreign funds advised by the Adviser may vary due to, among other things, differences in the client base, governing bodies, operational complexities and services covered by the management fee. Given the inherent differences in the various products, particularly the extensive services provided to the Funds, the Independent Board Members believe such facts justify the different levels of fees.
3. Profitability of Fund Advisers
In conjunction with their review of fees, the Independent Board Members also considered the profitability of Nuveen for its advisory activities and its financial condition. The Independent Board Members reviewed the revenues and expenses of Nuveen’s advisory activities for the last two calendar years, the allocation methodology used in preparing the profitability data, an analysis of the key drivers behind the changes in revenues and expenses that impacted profitability in 2013 and Nuveen’s consolidated financial statements for 2013. The Independent Board Members noted this information supplemented the profitability information requested and received during the year to help keep them apprised of developments affecting profitability (such as changes in fee waivers and expense reimbursement commitments). In this regard, the Independent Board Members noted that two Independent Board Members served as point persons to review the profitability analysis and methodologies employed, and any changes thereto, and to keep the Board apprised of such changes. The Independent Board Members also considered Nuveen’s revenues for advisory activities, expenses and profit margin compared to that of various unaffiliated management firms.
In reviewing profitability, the Independent Board Members noted the Adviser’s continued investment in its business with expenditures to, among other things, upgrade its investment technology and compliance systems and provide for additional personnel and other resources. The Independent Board Members recognized the Adviser’s continued commitment to its business should enhance the Adviser’s capacity and capabilities in providing the services necessary to meet the needs of the Nuveen funds as they grow or change over time. In addition, in evaluating profitability, the Independent Board Members also noted the subjective nature of determining profitability which may be affected by numerous factors including the allocation of expenses and that various allocation methodologies may each be reasonable but yield different results. Further, the Independent Board Members recognized the difficulties in making comparisons as the profitability of other advisers generally is not publicly available, and the profitability information that is available for certain advisers or management firms may not be representative of the industry and may be affected by, among other things, an adviser’s particular business mix, capital costs, size, types of funds managed and expense allocations. Notwithstanding the foregoing, the Independent Board Members noted the Adviser’s adjusted operating margin appears to be reasonable in relation to other investment advisers and sufficient to operate as a viable investment management firm meeting its obligations to the Nuveen funds. Based on their review, the Independent Board Members concluded that the Adviser’s level of profitability for its advisory activities was reasonable in light of the services provided.
With respect to sub-advisers affiliated with Nuveen, including each Sub-Adviser, the Independent Board Members reviewed such sub-advisers’ revenues, expenses and profitability margins (pre- and post-tax) for their advisory activities and the methodology used for allocating expenses among the internal sub-advisers. Based on their review, the Independent Board Members were satisfied that each Sub-Adviser’s level of profitability was reasonable in light of the services provided.
In evaluating the reasonableness of the compensation, the Independent Board Members also considered other amounts paid to a Fund Adviser by the funds as well as indirect benefits (such as soft dollar arrangements), if any, the Fund Adviser and its affiliates receive or are expected to receive that are directly attributable to the management of a Nuveen fund. See Section E below for additional information on indirect benefits the Fund Advisers may receive as a result of its relationship with a Nuveen fund. Based on their review of the overall fee arrangements of each Fund, the Independent Board Members determined that the advisory fees and expenses of the Funds were reasonable.
4. The New Advisory Agreements
As noted above, the terms of the New Advisory Agreements are substantially identical to their corresponding Original Advisory Agreements. The fee schedule, including the breakpoint schedule and complex-wide fee schedule, in each New Advisory Agreement is identical to that under the corresponding Original Advisory Agreement. The Board Members also noted that Nuveen has committed for a period of two years from the date of closing the Transaction (i) not to increase contractual management fee rates for any Nuveen fund and (ii) not to raise expense cap levels for any Nuveen fund from levels currently in effect or scheduled to go into effect prior to the Transaction. This commitment shall not limit or otherwise
Annual Investment Management Agreement Approval Process (Unaudited) (continued)
affect mergers or liquidations of any funds in the ordinary course. Based on the information provided, the Board Members did not believe that the overall expenses would increase as a result of the Transaction. In addition, the Board Members recognized that the Nuveen funds may gain access to the retirement platform and institutional client base of TIAA-CREF, and the investors in the retirement platforms may roll their investments into one or more Nuveen funds as they exit their retirement plans. The enhanced distribution access may result in additional sales of the Nuveen funds resulting in an increase in total assets under management in the complex and a corresponding decrease in overall management fees if additional breakpoints at the fund-level or complex-wide level are met. Based on its review, the Board determined that the management fees and expenses under each New Advisory Agreement were reasonable.
Further, other than from a potential reduction in the debt level of Nuveen Investments, Inc., the Board recognized that it is difficult to predict with any degree of certainty the impact of the Transaction on Nuveen’s profitability. Given the fee schedule was not expected to change under the New Advisory Agreements, however, the Independent Board Members concluded that each Fund Adviser’s level of profitability for its advisory activities under the respective New Advisory Agreements would continue to be reasonable in light of the services provided.
D. Economies of Scale and Whether Fee Levels Reflect These Economies of Scale
1. The Original Advisory Agreements
With respect to economies of scale, the Independent Board Members have recognized the potential benefits resulting from the costs of a fund being spread over a larger asset base, although economies of scale are difficult to measure and predict with precision, particularly on a fund-by-fund basis. One method to help ensure the shareholders share in these benefits is to include breakpoints in the advisory fee schedule. Generally, management fees for funds in the Nuveen complex are comprised of a fund-level component and a complex-level component, subject to certain exceptions. Accordingly, the Independent Board Members reviewed and considered the applicable fund-level breakpoints in the advisory fee schedules that reduce advisory fees as asset levels increase.
In addition to fund-level advisory fee breakpoints, the Board also considered the Nuveen funds’ complex-wide fee arrangement. Pursuant to the complex-wide fee arrangement, the fees of the funds in the Nuveen complex are reduced as the assets in the fund complex reach certain levels. The complex-wide fee arrangement seeks to provide the benefits of economies of scale to fund shareholders when total fund complex assets increase, even if assets of a particular fund are unchanged or have decreased. The approach reflects the notion that some of Nuveen’s costs are attributable to services provided to all its funds in the complex and therefore all funds benefit if these costs are spread over a larger asset base.
Based on their review, the Independent Board Members concluded that the breakpoint schedules and complex-wide fee arrangement (as applicable) were acceptable and reflect economies of scale to be shared with shareholders when assets under management increase.
2. The New Advisory Agreements
As noted, the Independent Board Members recognized that the fund-level and complex-wide schedules will not change under the New Advisory Agreements. Assets in the funds advised by TIAA-CREF or its current affiliates will not be included in the complex-wide fee calculation. Nevertheless, the Nuveen funds may have access to TIAA-CREF’s retirement platform and institutional client base. The access to this distribution network may enhance the distribution of the Nuveen funds which, in turn, may lead to reductions in management and sub-advisory fees if the Nuveen funds reach additional fund-level and complex-wide breakpoint levels. Based on their review, including the considerations in the annual review of the Original Advisory Agreements, the Independent Board Members determined that the fund-level breakpoint schedules and complex-wide fee schedule continue to be appropriate and desirable in ensuring that shareholders participate in the benefits derived from economies of scale under the New Advisory Agreements.
E. Indirect Benefits
1. The Original Advisory Agreements
In evaluating fees, the Independent Board Members received and considered information regarding potential “fall out” or ancillary benefits the respective Fund Adviser or its affiliates may receive as a result of its relationship with each Fund. In this regard, the Independent Board Members considered, among other things, any sales charges, distribution fees and shareholder services fees received and retained by the Funds’ principal underwriter, an affiliate of the Adviser, which include fees received pursuant to any 12b-1 plan. The Independent Board Members, therefore, considered the 12b-1 fees retained by Nuveen during the last calendar year.
In addition to the above, the Independent Board Members considered whether the Fund Advisers received any benefits from soft dollar arrangements whereby a portion of the commissions paid by a fund for brokerage may be used to acquire research that may be useful to a Fund Adviser in managing the assets of the fund and other clients. Each Fund’s portfolio transactions are allocated by its Sub-Adviser. Accordingly, the Independent Board Members considered that each Sub-Adviser may benefit from its soft dollar arrangements pursuant to which it receives research from brokers that execute the applicable Fund’s portfolio transactions. With respect to any fixed income securities, however, the Board recognized
that such securities generally trade on a principal basis that does not generate soft dollar credits. Similarly, the Board recognized that the research received pursuant to soft dollar arrangements by a Sub-Adviser may also benefit the applicable Funds and their shareholders to the extent the research enhances the ability of the Sub-Adviser to manage the respective Funds. The Independent Board Members noted that the Sub-Advisers’ profitability may be somewhat lower if they did not receive the research services pursuant to the soft dollar arrangements and had to acquire such services directly.
Based on their review, the Independent Board Members concluded that any indirect benefits received by a Fund Adviser as a result of its relationship with the Funds were reasonable and within acceptable parameters.
2. The New Advisory Agreements
The Independent Board Members noted that, as the applicable policies and operations of the Fund Advisers with respect to the Nuveen funds were not anticipated to change significantly after the Transaction, such indirect benefits should remain after the Transaction. The Independent Board Members further noted the benefits the Transaction would provide to TIAA-CREF and Nuveen, including a larger-scale fund complex, certain shared services (noted above) and a broader range of investment capabilities, distribution capabilities and product line. Further, the Independent Board Members noted that Nuveen Investments, Inc. (the parent of the Adviser) would benefit from an improved capital structure through a reduction in its debt level.
F. Other Considerations for the New Advisory Agreements
In addition to the factors above, the Board Members also considered the following with respect to the Nuveen funds:
| | • | | Nuveen would rely on the provisions of Section 15(f) of the 1940 Act. In this regard, to help ensure that an unfair burden is not imposed on the Nuveen funds, Nuveen has committed for a period of two years from the date of the closing of the Transaction (i) not to increase contractual management fee rates for any fund and (ii) not to raise expense cap levels for any fund from levels currently in effect or scheduled to go into effect prior to the Transaction. This commitment shall not limit or otherwise affect mergers or liquidations of any funds in the ordinary course. |
| | • | | The Nuveen funds would not incur any costs in seeking the necessary shareholder approvals for the New Investment Management Agreements or the New Sub-Advisory Agreements (except for any costs attributed to seeking shareholder approvals of fund specific matters unrelated to the Transaction, such as election of Board Members or changes to investment policies, in which case a portion of such costs will be borne by the applicable funds). |
| | • | | The reputation, financial strength and resources of TIAA-CREF. |
| | • | | The long-term investment philosophy of TIAA-CREF and anticipated plans to grow Nuveen’s business to the benefit of the Nuveen funds. |
| | • | | The benefits to the Nuveen funds as a result of the Transaction including: (i) increased resources and support available to Nuveen as well as an improved capital structure that may reinforce and enhance the quality and level of services it provides to the funds; (ii) potential additional distribution capabilities for the funds to access new markets and customer segments through TIAA-CREF’s distribution network, including, in particular, its retirement platforms and institutional client base; and (iii) access to TIAA-CREF’s expertise and investment capabilities in additional asset classes. |
G. Other Considerations
The Independent Board Members did not identify any single factor discussed previously as all-important or controlling. The Board Members, including the Independent Board Members, unanimously concluded that the terms of each Original Advisory Agreement and New Advisory Agreement are fair and reasonable, that the respective Fund Adviser’s fees are reasonable in light of the services provided to each Fund and that the Original Advisory Agreements be renewed and the New Advisory Agreements be approved.
II.
Approval of Interim Advisory Agreements
At the April Meeting, the Board Members, including the Independent Board Members, unanimously approved for each Fund an interim advisory agreement (the “Interim Investment Management Agreement”) between the respective Fund and the Adviser and an interim sub-advisory agreement (the “Interim Sub-Advisory Agreement”) between the Adviser and the applicable Sub-Adviser. If necessary to assure continuity of advisory services, each respective Interim Investment Management Agreement and Interim Sub-Advisory Agreement will take effect upon the closing of the Transaction if shareholders have not yet approved the corresponding New Investment Management Agreement or New Sub-Advisory Agreement. The terms of each Interim Investment Management Agreement and Interim Sub-Advisory Agreement are substantially identical to those of the corresponding Original Investment Management Agreement and New Investment Management Agreement and the corresponding Original Sub-Advisory Agreement and
Annual Investment Management Agreement Approval Process (Unaudited) (continued)
New Sub-Advisory Agreement, respectively, except for certain term and fee escrow provisions. In light of the foregoing, the Board Members, including the Independent Board Members, unanimously determined that the scope and quality of services to be provided to the Funds under the respective Interim Investment Management Agreements and Interim Sub-Advisory Agreements are at least equivalent to the scope and quality of services provided under the applicable Original Investment Management Agreements and Original Sub-Advisory Agreements.
III.
Initial Approval of Original Advisory Agreements for the Global Equity Fund
The Board Members are responsible for approving advisory arrangements and, at a meeting held on February 25-27, 2014 (for purposes of this Part III, the “Meeting”), were asked to approve the advisory arrangements for the Global Equity Fund (for purposes of this Part III, the “Fund”). At the Meeting, the Board Members, including the Independent Board Members, considered and approved the investment management agreement (for purposes of this Part III, the “Investment Management Agreement”) between the Fund and the Adviser and the investment sub-advisory agreement (for purposes of this Part III, the “Sub-Advisory Agreement”) between the Adviser and NWQ (for purposes of this Part III, the “Sub-Adviser”), on behalf of the Fund. For purposes of this Part III, the Adviser and the Sub-Adviser are each hereafter a “Fund Adviser” and the Investment Management Agreement and the Sub-Advisory Agreement are each hereafter an “Advisory Agreement.”
To assist the Board in its evaluation of an Advisory Agreement with a Fund Adviser at the Meeting, the Independent Board Members had received, in adequate time in advance of the Meeting or at prior meetings, materials which outlined, among other things:
| | • | | the nature, extent and quality of services expected to be provided by the Fund Adviser; |
| | • | | the organization of the Fund Adviser, including the responsibilities of various departments and key personnel; |
| | • | | the expertise and background of the Fund Adviser with respect to the Fund’s investment strategy; |
| | • | | certain performance-related information (as described below); |
| | • | | the profitability of Nuveen; |
| | • | | the proposed management fees of the Fund Adviser, including comparisons of such fees with the management fees of comparable funds; |
| | • | | the expected expenses of the Fund, including comparisons of the Fund’s expected expense ratio with the expense ratios of comparable funds; and |
| | • | | the soft dollar practices of the Fund Adviser, if any. |
At the Meeting, the Adviser made a presentation to and responded to questions from the Board of the Fund. During the Meeting, the Independent Board Members also met privately with their legal counsel to, among other things, review the Board’s duties under the 1940 Act, the general principles of state law in reviewing and approving advisory contracts, the standards used by courts in determining whether investment company boards of directors have fulfilled their duties, factors to be considered in voting on advisory contracts and an adviser’s fiduciary duty with respect to advisory agreements and compensation. It is with this background that the Independent Board Members considered the Advisory Agreements. As outlined in more detail below, the Independent Board Members considered all factors they believed relevant with respect to the Fund, including among other factors: (a) the nature, extent and quality of the services to be provided by the Fund Advisers; (b) investment performance, as described below; (c) the advisory fees and costs of the services to be provided to the Fund and the profitability of the Fund Advisers; (d) the extent of any anticipated economies of scale; (e) any benefits expected to be derived by the Fund Advisers from their relationships with the Fund; and (f) other factors. Each Board Member may have accorded different weight to the various factors in reaching his or her conclusions with respect to the Fund’s Advisory Agreements.
A. Nature, Extent and Quality of Services
The Independent Board Members considered the nature, extent and quality of the respective Fund Adviser’s services, including advisory services and administrative services. As the Adviser and the Sub-Adviser already serve as adviser and sub-adviser, respectively, to other Nuveen funds overseen by the Board Members, the Board has a good understanding of each such Fund Adviser’s organization, operations and personnel. As the Independent Board Members meet regularly throughout the year to oversee the Nuveen funds, including funds currently advised by the Fund Advisers, the Independent Board Members have relied upon their knowledge from their meetings and any other interactions throughout the year of the respective Fund Adviser and its services in evaluating the Advisory Agreements.
At the Meeting and/or at prior meetings, the Independent Board Members reviewed materials outlining, among other things, the respective Fund Adviser’s organization and business; the types of services that such Fund Adviser or its affiliates provide to the Nuveen funds and are expected to
provide to the Fund; and the experience of the respective Fund Adviser with applicable investment strategies. Further, the Independent Board Members have evaluated the background and experience of the relevant investment personnel.
In addition to advisory services, the Independent Board Members have considered the quality and extent of administrative and other non-investment advisory services that the Adviser and its affiliates will provide to the Fund, including product management, investment services (such as oversight of investment policies and procedures, risk management, and pricing), fund administration, oversight of service providers, shareholder services and communications, administration of Board relations, regulatory and portfolio compliance and legal support. The Independent Board Members also recognized that the Adviser would oversee the Sub-Adviser.
In evaluating the services of the Sub-Adviser, the Independent Board Members noted that the Sub-Adviser was generally expected to supply portfolio investment management services to the Fund. In addition, the Board Members recognized the Sub-Adviser’s investment expertise and track record with a global equity strategy as well as the experience with such strategy of the portfolio manager who was expected to manage the Fund.
Based on their review, the Independent Board Members found that, overall, the nature, extent and quality of services expected to be provided to the Fund under each Advisory Agreement were satisfactory.
B. Investment Performance
The Fund was new and therefore did not have its own performance history. The Independent Board Members, however, are familiar with the performance records of other Nuveen funds advised by the Adviser and sub-advised by the Sub-Adviser. In addition, they recognized that the portfolio manager who was expected to manage the Fund had managed the Sub-Adviser’s global equity ordinary share (ORD) strategy since October 2012 and an American Depositary Receipt (ADR) version of the strategy since May 2012. In that regard, they reviewed performance information, including information pertaining to returns and hypothetical peer group ranks, for these strategies. Moreover, they noted that the Fund would be similar to the Sub-Adviser’s existing global equity (ORD) strategy separately managed account.
C. Fees, Expenses and Profitability
1. Fees and Expenses
In evaluating the management fees and expenses that the Fund was expected to bear, the Independent Board Members considered, among other things, the Fund’s proposed management fee structure, the rationale for its proposed fee levels, and its expected expense ratio in absolute terms as well as compared with the fees and expense ratios of comparable funds. Accordingly, the Independent Board Members reviewed, among other things, the proposed gross management fee and estimated gross and net total expense ratios for the Fund, as well as comparative fee and expense data pertaining to the Fund’s peers in the Lipper category in which it was anticipated to be classified (i.e., the Global Multi-Cap Value category). Further, the Independent Board Members considered the proposed sub-advisory fee rate for the Fund (as a percentage of the Fund’s net management fee) and observed that it was identical to that of other publicly available mutual funds sub-advised by the Sub-Adviser.
In addition, the Independent Board Members considered the fund-level breakpoint schedule and the complex-wide breakpoint schedule (described in further detail below) and any applicable fee waivers and expense reimbursements expected to be provided. Based on their review of the fee and expense information provided, the Independent Board Members determined that the Fund’s management fees to a Fund Adviser were reasonable in light of the nature, extent and quality of services to be provided to the Fund.
2. Comparisons with the Fees of Other Clients
The Board recognized that, like all Nuveen funds, the Fund would have a sub-adviser (which, in the case of the Fund, would be an affiliated sub-adviser), and therefore, the overall fund management fee can be divided into two components, the fee retained by the Adviser and the fee paid to the Sub-Adviser. In general terms, the fee to the Adviser will reflect the administrative services it will provide to support the Fund, and while some administrative services may occur at the sub-adviser level, the fee will generally reflect the portfolio management services provided by the Sub-Adviser. Due to their experience with other Nuveen funds, the Independent Board Members were familiar with the nature of services provided by the Adviser, including through the Sub-Adviser, and the range of fees and average fee the Sub-Adviser has assessed for such services to other clients. Such other clients include separately managed accounts (both retail and institutional accounts), foreign investment funds offered by Nuveen, and funds that are not offered by Nuveen but are sub-advised by one of Nuveen’s investment management teams. In this regard, the Independent Board Members observed that the Fund would be similar to the Sub-Adviser’s existing global equity strategy, which is available as an institutional separately managed account. In evaluating the comparisons of fees, the Independent Board Members have noted, at the Meeting or at prior meetings, that the fee rates charged to a fund (such as the Fund) and charged to other clients vary, among other things, because of the different services involved and the additional regulatory and compliance requirements associated with registered investment companies, such as the Fund. Accordingly, the Independent Board Members have considered the differences in the product types, including, but not limited to, the services to be provided, the structure and operations, product distribution and costs thereof, portfolio investment policies, investor profiles, account sizes and
Annual Investment Management Agreement Approval Process (Unaudited) (continued)
regulatory requirements. The Independent Board Members have noted, in particular, that the range of services, as described above, to be provided to a fund (such as the Fund) is much more extensive than that provided to separately managed accounts. Many of the additional administrative services to be provided by the Adviser are not required for institutional clients. The Independent Board Members have further noted that the management fee rates of the foreign funds advised by the Adviser may vary due to, among other things, differences in the client base, governing bodies, operational complexities and services covered by the management fee. Given the inherent differences in the various products, particularly the extensive services to be provided to the Fund, the Independent Board Members believe such facts justify the different levels of fees.
3. Profitability of Fund Advisers
In conjunction with their review of fees at the Meeting or at prior meetings, the Independent Board Members have considered the profitability of Nuveen for its advisory activities and its financial condition. At the Meeting or at prior meetings, the Independent Board Members reviewed the revenues and expenses of Nuveen’s advisory activities, the allocation methodology used in preparing the profitability data and an analysis of the key drivers behind the changes in revenues and expenses that impacted profitability. Certain Nuveen financial information included in a report dated November 11, 2013 and Nuveen’s September 30, 2013 consolidated financial statements had also been available. The Independent Board Members have also considered, at the Meeting or at prior meetings, Nuveen’s revenues for advisory activities, expenses, and profit margin compared to that of various unaffiliated management firms with comparable assets under management (based on asset size and asset composition).
In reviewing profitability, the Independent Board Members have recognized the Adviser’s continued investment in its business to enhance its services, including capital improvements to investment technology, updated compliance systems, and additional personnel. In addition, in evaluating profitability, the Independent Board Members have also recognized the subjective nature of determining profitability which may be affected by numerous factors, including the allocation of expenses and that various allocation methodologies may each be reasonable but yield different results. Further, the Independent Board Members have recognized the difficulties in making comparisons as the profitability of other advisers generally is not publicly available and the profitability information that is available for certain advisers or management firms may not be representative of the industry and may be affected by, among other things, the adviser’s particular business mix, capital costs, types of funds managed and expense allocations. Notwithstanding the foregoing, the Independent Board Members have reviewed Nuveen’s methodology and assumptions for allocating expenses across product lines to determine profitability. Based on their review, the Independent Board Members concluded that the Adviser’s level of profitability for its advisory activities was reasonable in light of the services to be provided.
With respect to the Sub-Adviser, which is affiliated with Nuveen, the Independent Board Members have previously reviewed its revenues, expenses and profitability margins (pre- and post-tax) for its advisory activities and the methodology used for allocating expenses among the internal sub-advisers. Based on their review, the Independent Board Members were satisfied that the Sub-Adviser’s level of profitability was reasonable in light of the services to be provided to the Fund.
In evaluating the reasonableness of the compensation, the Independent Board Members also considered other amounts expected to be paid to a Fund Adviser by the Fund as well as indirect benefits (such as soft dollar arrangements), if any, the respective Fund Adviser and its affiliates are expected to receive that are directly attributable to the management of the Fund. See Section E below for additional information on indirect benefits a Fund Adviser may receive as a result of its relationship with the Fund. Based on their review of the overall fee arrangements of the Fund, the Independent Board Members determined that the advisory fees and expected expenses of the Fund were reasonable.
D. Economies of Scale and Whether Fee Levels Reflect These Economies of Scale
With respect to economies of scale, the Independent Board Members have recognized the potential benefits resulting from the costs of a fund being spread over a larger asset base, although economies of scale are difficult to measure and predict with precision, particularly on a fund-by-fund basis. The Independent Board Members therefore considered whether the Fund could be expected to benefit from any economies of scale. One method to help ensure that the shareholders share in these benefits is to include breakpoints in the advisory fee schedule. Generally, management fees for funds in the Nuveen complex are comprised of a fund-level component and a complex-level component. Accordingly, the Independent Board Members received and reviewed the schedule of proposed advisory fees for the Fund, including fund-level breakpoints thereto. They observed that the fund-level breakpoints for the Fund were consistent with those of other Nuveen equity funds.
In addition to fund-level advisory fee breakpoints, the Board also considered the Fund’s complex-wide fee arrangement. Pursuant to the complex-wide fee arrangement, the fees of the funds in the Nuveen complex, including the Fund, are generally reduced as the assets in the fund complex reach certain levels. In evaluating the complex-wide fee arrangement, the Independent Board Members have considered that the complex-wide fee arrangement seeks to provide the benefits of economies of scale to fund shareholders when total fund complex assets increase, even if assets of a particular fund are unchanged or have decreased. The approach reflects the notion that some of Nuveen’s costs are attributable to services provided to all its funds in the complex and therefore all funds benefit if these costs are spread over a larger asset base.
Based on their review, the Independent Board Members concluded that the breakpoint schedules and complex-wide fee arrangement were acceptable and reflect economies of scale to be shared with the Fund’s shareholders when assets under management increase.
E. Indirect Benefits
In evaluating fees, the Independent Board Members also considered information received at the Meeting or at prior meetings regarding potential “fall out” or ancillary benefits that a Fund Adviser or its affiliates may receive as a result of its relationship with the Fund. In this regard, the Independent Board Members considered, among other things, any sales charges, distribution fees and shareholder services fees expected to be received and retained by the Fund’s principal underwriter, an affiliate of the Adviser, including fees to be received pursuant to any 12b-1 plan.
In addition to the above, the Independent Board Members considered whether the Fund Advisers will receive any benefits from soft dollar arrangements whereby a portion of the commissions paid by the Fund for brokerage may be used to acquire research that may be useful to a Fund Adviser in managing the assets of the Fund and other clients. The Fund’s portfolio transactions will be determined by the Sub-Adviser. Accordingly, the Independent Board Members considered that the Sub-Adviser may benefit from its soft dollar arrangements pursuant to which it receives research from brokers that execute the Fund’s portfolio transactions. The Board also recognized that the research received pursuant to soft dollar arrangements by the Sub-Adviser may also benefit the Fund and shareholders to the extent the research enhances the ability of the Sub-Adviser to manage the Fund. The Independent Board Members noted that the Sub-Adviser’s profitability may be somewhat lower if it did not receive the research services pursuant to the soft dollar arrangements and had to acquire such services directly.
Based on their review, the Independent Board Members concluded that any indirect benefits expected to be received by a Fund Adviser as a result of its relationship with the Fund were reasonable and within acceptable parameters.
F. Approval
The Independent Board Members did not identify any single factor discussed previously as all-important or controlling. The Board Members, including a majority of the Independent Board Members, concluded that the terms of the Investment Management Agreement and Sub-Advisory Agreement were fair and reasonable, that the respective Fund Adviser’s fees are reasonable in light of the services to be provided to the Fund and that the Investment Management Agreement and Sub-Advisory Agreement should be and were approved on behalf of the Fund.
Trustees
and Officers (Unaudited)
The management of the Funds, including general supervision of the duties performed for the Funds by the Adviser, is the responsibility of the Board of Trustees of the Funds. The number of directors of the Funds is currently set at twelve. None of the trustees who are not “interested” persons of the Funds (referred to herein as “independent trustees”) has ever been a director or employee of, or consultant to, Nuveen or its affiliates. The names and business addresses of the trustees and officers of the Funds, their principal occupations and other affiliations during the past five years, the number of portfolios each oversees and other directorships they hold are set forth below.
The Funds’ Statement of Additional Information (“SAI”) includes more information about the trustees. To request a free copy, call Nuveen Investments at (800) 257-8787 or visit the Funds’ website at www.nuveen.com.
| | | | | | | | |
Name, Year of Birth & Address | | Position(s) Held with the Funds | | Year First Elected or Appointed (1) | | Principal Occupation(s) Including other Directorships During Past 5 Years | | Number of Portfolios in Fund Complex Overseen by Trustee |
| | | |
| Independent Trustee: | | | | |
William J. Schneider 1944 333 W. Wacker Drive Chicago, IL 60606 | | Chairman of the Board and Trustee | | 1996 | | Chairman of Miller-Valentine Partners Med, a real estate investment company; formerly, Senior Partner and Chief Operating Officer (retired 2004) of Miller-Valentine Group; owner in several other Miller-Valentine entities; Board Member of Mid-America Health System, Tech Town, Inc., a not-for-profit community development company, and WDPR Public Radio Station; formerly, member, Business Advisory Council, Cleveland Federal Reserve Bank and University of Dayton Business School Advisory Council. | | 202 |
Robert P. Bremner 1940 333 W. Wacker Drive Chicago, IL 60606 | | Trustee | | 1996 | | Private Investor and Management Consultant; Treasurer and Director, Humanities Council of Washington, D.C.; Board Member, Independent Directors Council affiliated with the Investment Company Institute. | | 202 |
Jack B. Evans 1948 333 W. Wacker Drive Chicago, IL 60606 | | Trustee | | 1999 | | President, The Hall-Perrine Foundation, a private philanthropic corporation (since 1996); Chairman, United Fire Group, a publicly held company; formerly, President Pro-Tem of the Board of Regents for the State of Iowa University System; Director, Source Media Group; Life Trustee of Coe College; formerly, Director, Alliant Energy; formerly, Director, Federal Reserve Bank of Chicago; formerly, President and Chief Operating Officer, SCI Financial Group, Inc., a regional financial services firm. | | 202 |
William C. Hunter 1948 333 W. Wacker Drive Chicago, IL 60606 | | Trustee | | 2004 | | Dean Emeritus (since June 30, 2012), formerly, Dean, Tippie College of Business, University of Iowa (2006-2012); Director (since 2004) of Xerox Corporation; Director (since 2005), and President (since July 2012) Beta Gamma Sigma, Inc., The International Honor Society; Director of Wellmark, Inc. (since 2009); formerly, Dean and Distinguished Professor of Finance, School of Business at the University of Connecticut (2003-2006); previously, Senior Vice President and Director of Research at the Federal Reserve Bank of Chicago (1995-2003); formerly, Director (1997-2007), Credit Research Center at Georgetown University. | | 202 |
| | | | | | | | |
Name, Year of Birth & Address | | Position(s) Held with the Funds | | Year First Elected or Appointed (1) | | Principal Occupation(s) Including other Directorships During Past 5 Years | | Number of Portfolios in Fund Complex Overseen by Trustee |
David J. Kundert 1942 333 W. Wacker Drive Chicago, IL 60606 | | Trustee | | 2005 | | Formerly, Director, Northwestern Mutual Wealth Management Company (2006-2013); retired (since 2004) as Chairman, JPMorgan Fleming Asset Management, President and CEO, Banc One Investment Advisors Corporation, and President, One Group Mutual Funds; prior thereto, Executive Vice President, Banc One Corporation and Chairman and CEO, Banc One Investment Management Group; Regent Emeritus, Member of Investment Committee, Luther College; member of the Wisconsin Bar Association; member of Board of Directors, Friends of Boerner Botanical Gardens; member of Board of Directors and Chair of Investment Committee, Greater Milwaukee Foundation; member of the Board of Directors (Milwaukee), College Possible. | | 202 |
John K. Nelson 1962 333 West Wacker Drive Chicago, IL 60606 | | Trustee | | 2013 | | Senior external advisor to the financial services practice of Deloitte Consulting LLP (since 2012); Member of Board of Directors of Core12 LLC (since 2008), a private firm which develops branding, marketing and communications strategies for clients; Director of The Curran Center for Catholic American Studies (since 2009) and The President’s Council, Fordham University (since 2010); formerly, Chairman of the Board of Trustees of Marian University (2010 as trustee, 2011-2014 as Chairman); formerly, Chief Executive Officer of ABN AMRO N.V. North America, and Global Head of its Financial Markets Division (2007-2008); prior senior positions held at ABN AMRO include Corporate Executive Vice President and Head of Global Markets—the Americas (2006-2007), CEO of Wholesale Banking—North America and Global Head of Foreign Exchange and Futures Markets (2001-2006), and Regional Commercial Treasurer and Senior Vice President Trading—North America (1996-2001); formerly, Trustee at St. Edmund Preparatory School in New York City. | | 202 |
Judith M. Stockdale 1947 333 W. Wacker Drive Chicago, IL 60606 | | Trustee | | 1997 | | Board Member, Land Trust Alliance (since June 2013) and U.S. Endowment for Forestry and Communities (since November 2013); formerly, Executive Director (1994-2012), Gaylord and Dorothy Donnelley Foundation (since 1994); prior thereto, Executive Director, Great Lakes Protection Fund (1990-1994). | | 202 |
Carole E. Stone 1947 333 W. Wacker Drive Chicago, IL 60606 | | Trustee | | 2007 | | Director, Chicago Board Options Exchange (since 2006), C2 Options Exchange, Incorporated (since 2009) Director, CBOE Holdings, Inc. (since 2010); formerly, Commissioner, New York State Commission on Public Authority Reform (2005-2010); formerly, Chair, New York Racing Association Oversight Board (2005-2007). | | 202 |
Virginia L. Stringer 1944 333 W. Wacker Drive Chicago, IL 60606 | | Trustee | | 2011 | | Board Member, Mutual Fund Directors Forum; former governance consultant and non-profit board member; former Owner and President, Strategic Management Resources, Inc., a management consulting firm; former Member, Governing Board, Investment Company Institute’s Independent Directors Council; previously, held several executive positions in general management, marketing and human resources at IBM and The Pillsbury Company; Independent Director, First American Fund Complex (1987-2010) and Chair (1997-2010). | | 202 |
Trustees and Officers (Unaudited) (continued)
| | | | | | | | |
Name, Year of Birth & Address | | Position(s) Held with the Funds | | Year First Elected or Appointed (1) | | Principal Occupation(s) Including other Directorships During Past 5 Years | | Number of Portfolios in Fund Complex Overseen by
Trustee |
Terence J. Toth 1959 333 W. Wacker Drive Chicago, IL 60606 | | Trustee | | 2008 | | Managing Partner, Promus Capital (since 2008); Director, Fulcrum IT Service LLC (since 2010), Quality Control Corporation (since 2012) and LogicMark LLC (since 2012); formerly, Director, Legal & General Investment Management America, Inc. (2008-2013); formerly, CEO and President, Northern Trust Global Investments (2004-2007); Executive Vice President, Quantitative Management & Securities Lending (2000-2004); prior thereto, various positions with Northern Trust Company (since 1994); member: Chicago Fellowship Board (since 2005), Catalyst Schools of Chicago Board (since 2008) and Mather Foundation Board (since 2012), and a member of its investment committee; formerly, Member, Northern Trust Mutual Funds Board (2005-2007), Northern Trust Global Investments Board (2004-2007), Northern Trust Japan Board (2004-2007), Northern Trust Securities Inc. Board (2003-2007) and Northern Trust Hong Kong Board (1997-2004). | | 202 |
| | | |
| Interested Trustee: | | | | |
William Adams IV(2) 1955 333 W. Wacker Drive Chicago, IL 60606 | | Trustee | | 2013 | | Senior Executive Vice President, Global Structured Products (since 2010); Co-President of Nuveen Fund Advisors, LLC (since 2011); President (since 2011), formerly, Managing Director (2010-2011) of Nuveen Commodities Asset Management, LLC; Board Member of the Chicago Symphony Orchestra and of Gilda’s Club Chicago; formerly, Executive Vice President, U.S. Structured Products, of Nuveen Investments, Inc. (1999-2010). | | 202 |
Thomas S. Schreier, Jr.(2) 1962 333 W. Wacker Drive Chicago, IL 60606 | | Trustee | | 2013 | | Vice Chairman, Wealth Management of Nuveen Investments, Inc. (since 2011); Co-President of Nuveen Fund Advisors, LLC; Chairman of Nuveen Asset Management, LLC (since 2011); Co-Chief Executive Officer of Nuveen Securities, LLC (since 2011); Member of Board of Governors and Chairman’s Council of the Investment Company Institute; formerly, Chief Executive Officer (2000-2010) and Chief Investment Officer (2007-2010) of FAF Advisors, Inc.; formerly, President of First American Funds (2001-2010). | | 202 |
| | | | | | | | |
Name,
Year of Birth & Address | | Position(s) Held with the Funds | | Year First Elected or Appointed (2) | | Principal Occupation(s) During Past 5 Years | | Number of Portfolios in Fund Complex Overseen by
Officer |
| | | |
| Officers of the Funds: | | | | |
Gifford R. Zimmerman 1956 333 W. Wacker Drive Chicago, IL 60606 | | Chief Administrative Officer | | 1988 | | Managing Director (since 2002), and Assistant Secretary of Nuveen Securities, LLC; Managing Director (since 2004) and Assistant Secretary (since 1994) of Nuveen Investments, Inc.; Managing Director (since 2002), Assistant Secretary (since 1997) and Co-General Counsel (since 2011) of Nuveen Fund Advisors, LLC; Managing Director, Assistant Secretary and Associate General Counsel of Nuveen Asset Management, LLC (since 2011); Managing Director, Associate General Counsel and Assistant Secretary of Symphony Asset Management LLC (since 2003); Vice President and Assistant Secretary of NWQ Investment Management Company, LLC (since 2002), Nuveen Investments Advisers Inc. (since 2002), Santa Barbara Asset Management, LLC (since 2006) and of Winslow Capital Management, LLC, (since 2010); Vice President and Assistant Secretary (since 2013), formerly, Chief Administrative Officer and Chief Compliance Officer (2006-2013) of Nuveen Commodities Asset Management, LLC; Chartered Financial Analyst. | | 202 |
Margo L. Cook 1964 333 W. Wacker Drive Chicago, IL 60606 | | Vice President | | 2009 | | Executive Vice President (since 2008) of Nuveen Investments, Inc. and of Nuveen Fund Advisors, LLC (since 2011); Managing Director – Investment Services of Nuveen Commodities Asset Management, LLC (since August 2011), previously, Head of Institutional Asset Management (2007-2008) of Bear Stearns Asset Management; Head of Institutional Asset Management (1986-2007) of Bank of NY Mellon; Chartered Financial Analyst. | | 202 |
Lorna C. Ferguson 1945 333 W. Wacker Drive Chicago, IL 60606 | | Vice President | | 1998 | | Managing Director (since 2005) of Nuveen Fund Advisors, LLC and Nuveen Securities, LLC (since 2004). | | 202 |
Stephen D. Foy 1954 333 W. Wacker Drive Chicago, IL 60606 | | Vice President and Controller | | 1998 | | Managing Director (since 2014), formerly, Senior Vice President (2013-2014), and Vice President of Nuveen Fund Advisors, LLC; Chief Financial Officer of Nuveen Commodities Asset Management, LLC (since 2010); Senior Vice President (2010-2011), Formerly Vice President (2005-2010) and Funds Controller of Nuveen Securities, LLC; Certified Public Accountant. | | 202 |
Scott S. Grace 1970 333 W. Wacker Drive Chicago, IL 60606 | | Vice President and Treasurer | | 2009 | | Managing Director, Corporate Finance & Development, Treasurer (since 2009) of Nuveen Securities, LLC; Managing Director and Treasurer (since 2009) of Nuveen Fund Advisors, LLC, Nuveen Investments Advisers, Inc., Nuveen Investments Holdings Inc. and (since 2011) Nuveen Asset Management, LLC; Vice President and Treasurer of NWQ Investment Management Company, LLC, Tradewinds Global Investors, LLC, Symphony Asset Management LLC and Winslow Capital Management, LLC.; Vice President of Santa Barbara Asset Management, LLC; formerly, Treasurer (2006-2009), Senior Vice President (2008-2009), previously, Vice President (2006-2008) of Janus Capital Group, Inc.; formerly, Senior Associate in Morgan Stanley’s Global Financial Services Group (2000-2003); Chartered Accountant Designation. | | 202 |
Walter M. Kelly 1970 333 W. Wacker Drive Chicago, IL 60606 | | Chief Compliance Officer and Vice President | | 2003 | | Senior Vice President (since 2008) of Nuveen Investments Holdings, Inc. | | 202 |
Trustees and Officers (Unaudited) (continued)
| | | | | | | | |
Name,
Year of Birth & Address | | Position(s) Held with the Funds | | Year First Elected or Appointed (2) | | Principal Occupation(s) During Past 5 Years | | Number of Portfolios in Fund Complex Overseen by
Officer |
Tina M. Lazar 1961 333 W. Wacker Drive Chicago, IL 60606 | | Vice President | | 2002 | | Senior Vice President of Nuveen Investment Holdings, Inc. | | 202 |
Kevin J. McCarthy 1966 333 W. Wacker Drive Chicago, IL 60606 | | Vice President and Secretary | | 2007 | | Managing Director and Assistant Secretary (since 2008), Nuveen Securities, LLC; Managing Director (since 2008), Assistant Secretary (since 2007) and Co-General Counsel (since 2011) of Nuveen Fund Advisors, LLC; Managing Director, Assistant Secretary and Associate General Counsel (since 2011) of Nuveen Asset Management, LLC; Managing Director (since 2008), and Assistant Secretary, Nuveen Investment Holdings, Inc.; Vice President (since 2007) and Assistant Secretary of Nuveen Investments Advisers Inc., NWQ Investment Management Company, LLC, Tradewinds Global Investors LLC, Symphony Asset Management LLC, Santa Barbara Asset Management, LLC, and of Winslow Capital Management, LLC. (since 2010); Vice President and Secretary (since 2010) of Nuveen Commodities Asset Management, LLC. | | 202 |
Kathleen L. Prudhomme 1953 901 Marquette Avenue Minneapolis, MN 55402 | | Vice President and Assistant Secretary | | 2011 | | Managing Director, Assistant Secretary and Co-General Counsel (since 2011) of Nuveen Fund Advisors, LLC; Managing Director, Assistant Secretary and Associate General Counsel (since 2011) of Nuveen Asset Management, LLC; Managing Director and Assistant Secretary (since 2011) of Nuveen Securities, LLC; formerly, Deputy General Counsel, FAF Advisors, Inc. (2004-2010). | | 202 |
Joel T. Slager 1978 333 West Wacker Drive Chicago, IL 60606 | | Vice President and Assistant Secretary | | 2013 | | Fund Tax Director for Nuveen Funds (since May, 2013); previously, Vice President of Morgan Stanley Investment Management, Inc., Assistant Treasurer of the Morgan Stanley Funds (from 2010 to 2013); Tax Director at PricewaterhouseCoopers LLP (from 2008 to 2010). | | 202 |
Jeffery M. Wilson 1956 333 West Wacker Drive Chicago, IL 60606 | | Vice President | | 2011 | | Senior Vice President of Nuveen Securities, LLC (since 2011); formerly, Senior Vice President of FAF Advisors, Inc. (2000-2010). | | 107 |
| (1) | Trustees serve an indefinite term until his/her successor is elected or appointed. The year first elected or appointed represents the year in which the trustee was first elected or appointed to any fund in the Nuveen Fund Complex. |
| (2) | Officers serve one year terms through August of each year. The year first elected or appointed represents the year in which the officer was first elected or appointed to any fund in the Nuveen Fund Complex. |
Notes
| | | | | | | | | | | | | | |
| | | | | | | | |
| | | | |
| | | | | | | | |
| | |
| | Nuveen Investments: | | |
| | | | Serving Investors for Generations | | |
| | |
| | | | |
| | | |
| | | | Since 1898, financial advisors and their clients have relied on Nuveen Investments to provide dependable investment solutions through continued adherence to proven, long-term investing principles. Today, we offer a range of high quality equity and fixed-income solutions designed to be integral components of a well-diversified core portfolio. | | |
| | | |
| | | | | | |
| | | | |
| | | | | | Focused on meeting investor needs. Nuveen Investments provides high-quality investment services designed to help secure the longterm goals of institutional and individual investors as well as the consultants and financial advisors who serve them. Nuveen Investments markets a wide range of specialized investment solutions which provide investors access to capabilities of its high-quality boutique investment affiliates-Nuveen Asset Management, Symphony Asset Management, NWQ Investment Management Company, Santa Barbara Asset Management, Tradewinds Global Investors, Winslow Capital Management, and Gresham Investment Management. In total, Nuveen Investments managed approximately $231 billion as of June 30, 2014. | | |
| | | | | |
| | | | | | | | | | |
| | | | | | Find out how we can help you. To learn more about how the products and services of Nuveen Investments may be able to help you meet your financial goals, talk to your financial advisor, or call us at (800) 257-8787. Please read the information provided carefully before you invest. Investors should consider the investment objective and policies, risk considerations, charges and expenses of any investment carefully. Where applicable, be sure to obtain a prospectus, which contains this and other relevant information. To obtain a prospectus, please contact your securities representative or Nuveen Investments, 333 W. Wacker Dr., Chicago, IL 60606. Please read the prospectus carefully before you invest or send money. Learn more about Nuveen Funds at: www.nuveen.com/mf | | |
| | | | | | |
| | | | | | | | | | | | |
| | Distributed by Nuveen Securities, LLC | 333 West Wacker Drive Chicago, IL 60606 | www.nuveen.com | | |
MAN-NWQ-0614D 2831-INV-Y08/15
| | |
| | |  |
| Mutual Funds | |
| | | | | | |
| | | | | | | Annual Report June 30, 2014 |
| | | | | | | | | | | | | | |
| | | | | | | Share Class / Ticker Symbol |
| | | Fund Name | | | | Class A | | Class C | | Class R3 | | Class I | | |
| | | | | | | | | | | | | | |
| | Nuveen Global Total Return Bond Fund | | | | NGTAX | | NGTCX | | NGTRX | | NGTIX | | |
| | Nuveen High Income Bond Fund | | | | FJSIX | | FCSIX | | FANSX | | FJSYX | | |
| | Nuveen Strategic Income Fund | | | | FCDDX | | FCBCX | | FABSX | | FCBYX | | |
| | Nuveen U.S. Infrastructure Income Fund | | | | NUSNX | | NUSCX | | — | | NUSIX | | |
| | | | | | | | | | | | |
| | | | | | |
| | | | |
| | | | | | | | |
| | |
| | | | |
| | NUVEEN INVESTMENTS TO BE ACQUIRED BY TIAA-CREF | | |
| | |
| | On April 14, 2014, TIAA-CREF announced that it had entered into an agreement to acquire Nuveen Investments, the parent company of your fund’s investment adviser, Nuveen Fund Advisors, LLC (“NFAL”) and the Nuveen affiliates that act as sub-advisers to the majority of the Nuveen Funds. TIAA-CREF is a national financial services organization with approximately $569 billion in assets under management (as of March 31, 2014) and is a leading provider of retirement services in the academic, research, medical and cultural fields. Nuveen anticipates that it will operate as a separate subsidiary within TIAA-CREF’s asset management business, and that its current leadership and key investment teams will stay in place. Your fund investment will not change as a result of Nuveen’s change of ownership. You will still own the same fund shares and the underlying value of those shares will not change as a result of the transaction. NFAL and your fund’s sub-adviser(s) will continue to manage your fund according to the same objectives and policies as before, and we do not anticipate any significant changes to your fund’s operations. Under the securities laws, the consummation of the transaction will result in the automatic termination of the investment management agreements between the funds and NFAL and the investment sub-advisory agreements between NFAL and each fund’s sub-adviser(s). The new agreements have been approved by shareholders of your fund. The transaction is currently expected to close early in the fourth quarter of 2014, but remains subject to customary closing conditions. | | |
| | | | | | | | |
| | | | | | |
| | | | | | Must be preceded by or accompanied by a prospectus. NOT FDIC INSURED MAY LOSE VALUE
NO BANK GUARANTEE | | |
| | | | | | | | | | |
| | | | | | | | | | | | | |

Table
of Contents
Chairman’s Letter
to Shareholders

Dear Shareholders,
After significant growth in 2013, domestic and international equity markets have been less compelling during the first part of 2014. Concerns about deflation, political uncertainty in many places and the potential for more fragile economies to impact other countries have produced uncertainty in the markets.
Europe is beginning to emerge slowly from the recession in mid-2013, with improved GDP and employment trends in some countries. However, Japan’s deflationary headwinds have resurfaced; and China shows signs of slowing from credit distress combined with declines in manufacturing and exports. Most recently, tensions between Russia and Ukraine may continue to hold back stocks and support government bonds in the near term.
Despite these headwinds, there are some encouraging signs of forward momentum in the markets. In the U.S., the news is more positive with financial risks slowly receding, positive GDP trends, downward trending unemployment and stronger household finances and corporate spending.
It is in such changeable markets that professional investment management is most important. Investment teams who have experienced challenging markets in the past understand how their asset class can behave in rapidly changing times. Remaining committed to their investment disciplines during these times is a critical component to achieving long-term success. In fact, many strong investment track records are established during challenging periods because experienced investment teams understand that volatile markets place a premium on companies and investment ideas that can weather the short-term volatility. By maintaining appropriate time horizons, diversification and relying on practiced investment teams, we believe that investors can achieve their long-term investment objectives.
As always, I encourage you to communicate with your financial consultant if you have any questions about your investment in a Nuveen Fund. On behalf of the other members of the Nuveen Fund Board, we look forward to continuing to earn your trust in the months and years ahead.
Sincerely,

William J. Schneider
Chairman of the Board
August 25, 2014
Portfolio Managers’
Comments
Nuveen Global Total Return Bond Fund
Nuveen High Income Bond Fund
Nuveen Strategic Income Fund
Nuveen U.S. Infrastructure Income Fund
These Funds feature portfolio management by Nuveen Asset Management, LLC, an affiliate of Nuveen Investments, Inc. In this report, the various portfolio management teams for the Funds discuss economic and fixed income market conditions, key investment strategies and the Funds’ performance for the twelve-month reporting period ended June 30, 2014. These management teams include:
Nuveen Global Total Return Bond Fund
Timothy A. Palmer, CFA, and Steven S. Lee, CFA, have managed the Fund since its inception in 2011.
Nuveen High Income Bond Fund
John T. Fruit, CFA, has managed the Fund since 2006. Jeffrey T. Schmitz, CFA, has been part of the management team for the Fund since 2008.
During this reporting period, the Board of the Nuveen High Income Bond Fund approved changes to the Fund’s principal investment strategies. Effective January 10, 2014, the Fund’s investment policies were amended to allow for the investment of up to 20% of net assets in fixed and floating rate loans, including senior loans and secured and unsecured junior loans.
Nuveen Strategic Income Fund
Timothy A. Palmer, CFA, has been the lead manager of the Fund since 2005. Jeffrey J. Ebert has been on the management team since 2000. Marie A. Newcome, CFA, joined the Fund as a co-portfolio manager in 2011.
During this reporting period, the Board of the Nuveen Strategic Income Fund approved changes to the Fund’s principal investment strategies. Effective January 10, 2014, the Fund’s investment policies were amended to allow for the investment of up to 20% of the Fund’s net assets in municipal securities. In addition, the Fund may invest up to 20% of its net assets in fixed and floating rate loans, including senior loans and secured and unsecured junior loans.
Nuveen U.S. Infrastructure Income Fund
Daniel J. Close, CFA, Jeffrey J. Ebert and Jeffrey T. Schmitz, CFA, have managed the Fund since its inception on May 12, 2014.
What factors affected the U.S. economy and fixed income markets during the twelve-month reporting period ended June 30, 2014?
During this reporting period, the U.S. economy continued its bumpy advance toward recovery from recession. The Federal Reserve (Fed) maintained efforts to bolster growth and promote progress toward its mandates of maximum employment and price stability
Certain statements in this report are forward-looking statements. Discussions of specific investments are for illustration only and are not intended as recommendations of individual investments. The forward-looking statements and other views expressed herein are those of the portfolio managers as of the date of this report. Actual future results or occurrences may differ significantly from those anticipated in any forward-looking statements and the views expressed herein are subject to change at any time, due to numerous market and other factors. The Funds disclaim any obligation to update publicly or revise any forward-looking statements or views expressed herein.
Ratings shown are the highest rating given by one of the following national rating agencies: Standard & Poor’s (S&P), Moody’s Investors Service, Inc. (Moody’s) or Fitch, Inc. (Fitch). Credit ratings are subject to change. AAA, AA, A and BBB are investment grade ratings; BB, B, CCC, CC, C and D are below investment grade ratings. Certain bonds backed by U.S. Government or agency securities are regarded as having an implied rating equal to the rating of such securities. Holdings designated N/R are not rated by these national rating agencies.
Portfolio Managers’ Comments (continued)
by holding the benchmark fed funds rate at the record low level of zero to 0.25% that it established in December 2008. Based on its view that the underlying strength in the broader economy was enough to support ongoing improvement in the labor market, the Fed began to reduce or taper, its monthly asset purchases in $10 billion increments over the course of five consecutive meetings (December 2013 through June 2014). As of July 2014, the Fed’s monthly purchases comprise $15 billion in mortgage-backed securities (versus the original $40 billion per month) and $20 billion in longer-term Treasury securities (versus $45 billion). Following its June 2014 meeting (subsequent to the close of this reporting period), the Fed reiterated that it would continue to look at a wide range of factors, including labor market conditions, indicators of inflationary pressures and readings on financial developments, in determining future actions, saying that it would likely maintain the current target range for the fed funds rate for a considerable time after the asset purchase program ends, especially if projected inflation continues to run below the Fed’s 2% longer-run goal.
In the second quarter of 2014, the U.S. economy, as measured by the U.S. gross domestic product (GDP), grew 4%. In the previous quarter, the GDP contracted at an annualized rate of 2.1%, the economy’s weakest quarter since the recession officially ended in June 2009. The decline during this period was attributed in part to the severe weather of the past winter, which deterred consumer spending and disrupted construction, production and shipping. The Consumer Price Index (CPI) rose 2.1% year-over-year as of June 2014, while the core CPI (which excludes food and energy) increased 1.9% during the same period, in line with the Fed’s unofficial longer-term objective of 2% for this inflation measure. As of June 2014, the national unemployment rate was 6.2%, down from the 7.3% reported in July 2013, but still higher than levels that would provide consistent support for optimal GDP growth. The 113,000 net new jobs added in May 2014 meant that the economy finally had regained all of the 8.7 million jobs lost during the recent recession. The housing market continued to post gains, as the average home price in the S&P/Case-Shiller Index of 20 major metropolitan areas rose 9.3% for the twelve months ended May 2014 (most recent data available at the time this report was prepared).
Several events touched off increased volatility in the financial markets. First, in May 2013, then-Fed Chairman Ben Bernanke’s remarks about tapering the Fed’s asset purchase program triggered widespread uncertainty about the next step for the Fed’s quantitative easing program and its impact on the markets as well as the overall economy. This uncertainty was compounded by headline credit stories involving Detroit’s bankruptcy filing in July 2013, the largest municipal bankruptcy in history and the disappointing news that continued to come out of Puerto Rico, where a struggling economy and years of deficit spending and borrowing led to multiple downgrades on the commonwealth’s bonds. Meanwhile, political debate over federal spending continued, as Congress failed to reach an agreement on the federal budget for fiscal 2014. On October 1, 2013, the start date for Fiscal 2014, the federal government shut down for 16 days until an interim appropriations bill was signed into law. (Consensus on a $1.1 trillion federal spending bill was ultimately reached in January 2014, and in February 2014, members of Congress agreed to suspend the $16.7 trillion debt ceiling until March 2015.)
During the reporting period, fixed income spread sectors produced favorable results as investors worked through a high degree of uncertainty surrounding the Fed’s monetary policy, uneven economic growth and the direction of interest rates. At the beginning of the reporting period, fixed income markets were stressed by the Fed’s discussions surrounding the tapering of its monthly security purchases as a step toward slowly normalizing U.S. monetary policy. The uncertainty roiled fixed income investors, leading to increased risk aversion and significant investor flows out of the bond market, which resulted in sharply higher interest rates, declines in risk assets and stress among emerging markets (EM). For calendar year 2013, investors withdrew more money out of bond funds than they put in for the first time in nearly a decade. After months of “taper talk,” the Fed finally made it official in December, announcing it would begin reducing asset purchases by $10 billion a month starting in January 2014. Policymakers cited improving economic numbers, particularly lower unemployment figures, as the impetus behind the move. At the same time, the Central Bank calmed market fears by reiterating that tapering did not equate to tightening, making a clear commitment to keep short-term interest rates at their current very low levels until at least 2015.
Fixed income markets showed stabilization as 2014 got under way, even as concerns were raised about economic slowdowns in the U.S. due mostly to weather related issues and in China due to policy shifts to slow the country’s credit growth. Demand for domestic fixed income assets resumed in part due to geopolitical concerns stemming from Russia’s military action in Ukraine and concerns about emerging market growth and stability. The second half of the reporting period largely saw improvements in fundamental and
market conditions as investor inflows continued into fixed income markets, yields were generally lower and spreads tightened for risk assets. Markets were further supported by actions taken by policymakers around the globe including various emerging market countries, the Chinese government and the European Central Bank (ECB). The period ended with U.S. economic growth rebounding nicely from its extremely weak first quarter as employment numbers steadily improved, consumer spending picked up and manufacturing increased. With the backdrop of improved U.S. data and reduced policy uncertainty, fixed income markets ended the fiscal year with market volatility declining to historically low levels, prompting some concern from market analysts and policymakers who believed that investors may be growing overly complacent.
Global rates moved lower and yield curves flattened across developed markets against the backdrop of moderate economic growth, accommodative monetary policy and subdued inflation. German rates moved toward historic lows during the period, in some cases reaching fifteen-year lows in spread versus the U.S., while European sovereign bond spreads moved to post-crisis heights. European investment grade credit marginally outperformed U.S. corporates due to the ECB’s actions and investor demand. In Japan, the market awaited additional structural reforms from President Abe’s government. The Bank of Japan provided no additional stimulus despite the drag from its new sales taxes that went into effect in April; however, the country’s investment fund announced increased allocation to equities and foreign assets. New Zealand and Brazil bucked the trend of looser monetary policy and tightened during the reporting period.
After a difficult start during this reporting period, EM debt ended up posting strong results. Domestic political friction in countries such as Turkey and Venezuela provided local market headline risk, but improved global risk appetite and attractive relative valuations later in the period supported the EM sector. Across these markets, rates generally fell based on reduced inflationary pressures, better external demand and traction on tightening policies implemented last year and in early 2014. Export growth improved across these markets with global purchasing managers indexes turning up marginally. A new government in India brought hope for structural reform, while economic data and policy actions in China indicated stabilization. EM domestic conditions were further underpinned by the ECB’s accommodation, the Fed’s steady hand and renewed positive investor inflows.
Currency performance was mixed with the U.S. dollar giving back some gains amid the Fed’s continued dovish stance. The euro remained stubbornly strong, agitating policymakers. Within the developed markets, the New Zealand dollar and British pound were the strongest performing currencies, while the Japanese yen and Canadian dollar lagged. The best performing EM currencies included the Korean won and the Polish zloty, while the weakest currencies were the Indonesian rupiah and the Chilean peso.
How did the Funds perform during the twelve-month reporting period ended June 30, 2014?
The tables in the Fund Performance and Expense Ratios section of this report provide total return performance information for the one-year, five-year, ten-year and/or since inception periods ended June 30, 2014. Each Fund’s Class A Share total returns at net asset value (NAV) are compared with the performance of the appropriate Barclays Index and Lipper classification average.
What strategies were used to manage the Funds during the twelve-month reporting period and how did these strategies influence performance?
All of the Funds continued to employ the same fundamental investment strategies and tactics used previously, although implementation of those strategies depended on the individual characteristics of the portfolios, as well as market conditions. The Funds’ management teams used a highly collaborative, research-driven approach that we believe offers the best opportunity to achieve consistent, superior long-term performance on a risk-adjusted basis across the full range of market environments. During the reporting period, the Funds were generally positioned for an environment of continued moderate economic growth and improving financial conditions, a posture we remained committed to during the reporting period. Nonetheless, we made smaller scaled shifts on an ongoing basis that were geared toward improving each Fund’s profile in response to changing conditions and valuations. These strategic moves are discussed in more detail within each Fund’s section of this report.
Portfolio Managers’ Comments (continued)
Nuveen Global Total Return Bond Fund
The Fund’s Class A Shares at NAV performed in line with the Barclays Global Aggregate Unhedged Bond Index and outperformed the Lipper Global Income Funds Classification Average for the twelve-month reporting period. The strong returns of high yield credit benefited the Fund’s results as that market segment performed exceptionally well with the backdrop of muted volatility and well-contained Treasury rates. Over the twelve-month reporting period, high yield spreads tightened by 155 basis points versus Treasuries on the strength of improved technicals (renewed investor inflows into the asset class and a market-friendly outlook postured by the Fed) and the continued low default environment. The spread tightening continued unabated despite the geopolitical tensions that arose during the reporting period and a greater-than-expected slowdown in the U.S. economy in 2014. The high yield bond segment of the market significantly outpaced the returns of most other fixed income asset classes during the reporting period. The Fund benefited from its exposure to high yield corporates, which ranged from 10-25% of its portfolio during the reporting period, as well as security selection and tactical repositioning within the sector.
The Fund’s ongoing overweight to investment grade credit also added value, largely due to our credit/security selection and focus on BBB-rated issues. The investment grade corporate sector of the market advanced during the reporting period. Credit selection within investment grade was strong, notably the Fund’s positioning within the financial, metals/mining and energy industries. Our downward bias in credit quality proved beneficial as lower rated investment grade securities outperformed higher rated investment grade securities during the reporting period.
In addition, an overweight to emerging markets (EM) credit, both investment grade and high yield, added to performance. EMs started out the reporting period underperforming, dragged down by weak currencies, concerns about the Fed and capital outflows. As the reporting period progressed, increased geopolitical concerns also tested the sector as tensions grew between the West and Russia over the Ukraine situation. EMs were also under pressure due to the belief that the era of rapid growth in particularly China as well as other EMs may be over or at least pausing. However, the tide turned in the final months of the reporting period as EM credits rebounded strongly from their period of underperformance, supported by improvements in fundamentals and investor sentiment. EM debt ended up being one of the best performing segments of the fixed income market during the reporting period.
The Fund’s defensive interest rate positioning detracted marginally amid a general decline in interest rates. While our bias for a flatter yield curve in the U.S. and our exposure to Mexico were both beneficial, these positives were offset by a net underweight exposure to core developed bond markets.
The most significant detractor for the Fund during the reporting period was its currency positioning, particularly due to turmoil in the currency markets in the early months of the reporting period. The U.S. dollar declined versus the euro and the British pound, while EM currencies were hit amid fears of growth and rising rates. The Fund was negatively impacted by our overweight to growth oriented EM currencies, which suffered from capital outflows and concerns about current account imbalances. The most notable detractors were our exposures to the Indian rupee and Turkish lira. Our euro underweight also detracted during the reporting period. The underweight was predicated on the economic growth headwinds we believed the eurozone would face. However, the euro appreciated amid U.S. uncertainty early in the reporting period and stronger-than-expected European economic performance and capital inflows into the eurozone as the reporting period progressed. Offsetting some of the negative effects of these exposures was our significant underweight to the Japanese yen, which proved successful over this time frame. We maintained this underweight due to fundamental reasons surrounding Japanese policy developments. The yen remained under downward pressure, particularly in the first six months of the Fund’s reporting period, due to the quantitative easing efforts put in place by the Bank of Japan to help lift inflation and improve the Japanese economy.
Overall, the Fund’s key sector themes continued to include our positioning in favor of credit sectors with corresponding underweights to mortgage securities and developed government sovereign securities. However, we did make some improvements to the profile of the Fund’s credit exposure through opportunities we found in individual corporate issues, both newly issued and in the secondary market. We continued to retain the Fund’s industry focus on financials as well as cyclically sensitive industries within corporates.
Toward the end of the reporting period, we made some asset class shifts to position the Fund to benefit from a recovery in EM and a firming of global growth. We increased the Fund’s positions in foreign denominated bonds, particularly in select EM such as Mexico, South Africa, Poland, Brazil and Turkey. Many of these foreign markets remained attractively valued amid investor skepticism, despite improved fundamental conditions. Also, we actively repositioned currency exposures based on fundamental developments and valuation shifts throughout the reporting period. We had reduced the Fund’s EM currencies last year as some of those economies experienced deterioration of domestic conditions and increased economic stress. However, as the volatility of global currencies stabilized this year, we added to select EM currencies from countries where policymakers showed a willingness to improve competitiveness, promote structural reforms and enhance fiscal and monetary credibility.
In addition, we continued to actively manage the overall level of the Fund’s global interest rate risk during the reporting period. We increased exposure to take advantage of strong fundamentals for major markets such as the eurozone, while remaining defensive overall during the reporting period. The Fund ended the reporting period at the lower end of its interest rate exposure range.
During the reporting period, we also continued to utilize various derivative instruments. We purchased call options on select currencies during the reporting period in an attempt to benefit from changes in the spot value of these currencies and we used foreign currency exchange contracts to gain exposure to selected foreign currencies, as well as in some cases to hedge the currency risk present in a foreign bond. The overall effect of the option activities was slightly negative and the overall effect of the foreign currency exchange contracts was negative during the reporting period. These derivative exposures are integrated with the overall portfolio construction and as such a portion of losses and gains may be naturally related to and/or may offset impacts elsewhere in the portfolio.
We sold U.S. Treasury futures as part of an overall portfolio construction strategy to manage portfolio duration and yield curve exposure and purchased selected foreign bond futures to actively manage exposure to those markets. The effect of these activities in the period was negative.
We used interest rate swaps as part of an overall portfolio interest rate strategy. For example, we used swaps in which the Fund pays a fixed rate of interest in exchange for a floating rate in anticipation of rising interest rates. The effect of these contracts on the Fund’s performance was negative during the reporting period.
We used credit default swaps to take on credit risk and earn a commensurate credit spread. The Fund no longer held these swap contracts at period end. The effect of these swap positions on performance was positive during the reporting period. These derivative exposures are integrated with the overall portfolio construction and as such a portion of losses and gains may be naturally related to and/or may offset impacts elsewhere in the portfolio.
Nuveen High Income Bond Fund
The Fund’s Class A Shares at NAV outperformed both the Barclays High Yield 2% Issuer Capped Index and the Lipper High Current Yield Funds Classification Average for the twelve-month reporting period. The high yield market performed very well during the reporting period with the backdrop of muted volatility and well-contained Treasury rates. During the reporting period,
high yield spreads tightened by 155 basis points versus Treasuries on the strength of improved technicals (renewed investor inflows into the asset class and a market friendly outlook postured by the Fed) and the continued low default environment. The spread tightening continued unabated despite the geopolitical tensions that arose during the reporting period and a greater-than-expected slowdown in the U.S. economy in 2014. The high yield bond segment of the market outpaced the returns of most other fixed income asset classes during the reporting period.
Credit fundamentals remained sound, spurred on by low yields and a healthy refinancing environment that has allowed companies to substantially lower their cost of debt. Interest coverage for the entire high yield universe was near an all-time high and corporate re-leveraging took a pause after increasing during the 2012-2013 period. Despite a healthy amount of new issue supply, an imbalance remained between supply and demand for higher yielding securities as various market participants continued their search for incremental yield. This imbalance was driven mainly by the easy money policies of central banks, but also the fact that the majority of high yield issuance during the reporting period was refinancing, which does not effectively add new supply to the market.
Portfolio Managers’ Comments (continued)
The Fund produced strong absolute and relative returns during the reporting period with performance primarily benefiting from our individual credit selections. In particular, the Fund’s global exposures made important positive contributions to returns. Results benefited from our holdings in the European high yield sector as the segment raced ahead by 20.82% over the year as measured by Barclays Pan-European High Yield Index. More specifically, Fund returns were aided by our positions in European financial institutions with an added boost from an overweight to this strongly performing area.
The CCC-rated segment of the market extended its period of outperformance as it returned 14% during the period compared to an 11% return for the overall market. The Fund benefited from this trend, as over the course of the reporting period we continued to modestly overweight the lower quality segments of the market (B-rated and CCC-rated securities). However, we did reduce this longstanding overweight for a portion of the reporting period to take advantage of values we found among BB-rated and BBB-rated bonds after the May 2013 sell-off in the market, which was caused by the rise in Treasury rates. By the end of the reporting period, however, we had monetized some of the gains from those purchases and moved back to a 5% overweight in CCC-rated securities in the Fund. We added back some CCC-rated exposure in order to benefit from the additional yield these securities provide in the continued low volatility environment that is friendly to corporate credit. This move was predicated on issue specific, bottom-up credit selection rather than a generic overweight as we are starting to see some stretched valuations within the CCC-rated sector.
Results were flat from the Fund’s security selection in emerging markets (EM) corporate bonds and an overweight exposure to this asset class. EMs started out the period underperforming, dragged down by weak currencies, capital outflows and increased geopolitical concerns as tensions grew between the West and Russia over the Ukraine situation. These markets were also under pressure due to the belief that the era of rapid growth in particularly China as well as other EM may be over or at least pausing. However, the tide turned in the final months of the reporting period as EM credits rebounded strongly from their period of underperformance, supported by improvements in fundamentals and investor sentiment. EM debt ended up being one of the best performing segments of the fixed income market during the reporting period, advancing 10% in U.S. dollar terms according to Barclays Emerging Markets Index.
As interest rate sensitivity represented arguably the greatest perceived risk to credit portfolios, the Fund carried a modest 5% underweight to portfolio duration during the reporting period. However, this lower duration stance had a minimal impact on the Fund’s results. Because rising interest rates continue to be the most significant risk facing credit portfolios, we have maintained a lower duration in the Fund and will most likely continue to do so throughout 2014. It is important to keep in mind, however, that the high yield asset class is inherently low duration to begin with, so high yield investors are already more insulated from prospective rate rises compared to other areas of the fixed income universe.
The Fund’s 5-6% weighting in preferred securities detracted during the reporting period. Preferred securities surged back from last year’s sub-par performance as the asset class generally benefited from its longer duration in the stable to declining rate environment in the first six months of 2014.
Sector and industry exposures overall were a mild drag on performance. The Fund continued to carry an overweight to the more cyclical basic industries based on our view that the coming year should see improved optimism about the economic and financial outlook. This negatively impacted portfolio performance earlier in the period due to a modest overweight to the mining and chemical sectors as the segments were dragged down by poor commodity pricing, cost overruns and concerns about the impact of slowing Chinese economic growth. While our mining investments generally had strong balance sheets, a couple of noteworthy exceptions were the Fund’s worst performers from an individual security standpoint. In addition, an underweight to the technology sector detracted from performance as that group outperformed the overall market. Offsetting some of that weakness, the Fund benefited from exposure to the energy sector due to its overweight in the energy exploration and production (E&P) area.
Other detractors included the Fund’s limited exposure to Russian corporates during the reporting period. However, we subsequently reduced exposure to both Russian and Ukrainian securities given some of the continued unrest seen in those regions.
In addition to the reductions in Russian and Ukrainian corporates, we also steered clear of China. Its commodity sector remained under pressure due to fears about slowing Chinese and Brazilian GDP growth, as well as some slowing in Chinese property sector fundamentals. However, we saw good relative value elsewhere in EM corporates as fundamentals were not systemically affected, despite some of the macroeconomic headwinds these markets have faced over the course of the past year (slower growth, political turmoil and tighter credit conditions). Also, despite the rally seen over the final weeks of the reporting period, EM corporates remained unusually cheap versus their developed market peers. Therefore, we selectively added to higher yielding EM corporates from other countries such as Brazil, Mexico and Turkey.
We continued to add to the Fund’s exposure in certain preferred securities from the financial and real estate sectors, and convertible preferreds within the utility sector. While discounts to NAV within the closed-end fund universe diminished, we still found attractive opportunities to add yield through funds that invest in floating rate bank loans, municipal securities and companies that own or hold loans to middle-market companies.
During the reporting period, we also continued to utilize various derivative instruments. We used Treasury note and bond futures as part of an overall portfolio construction strategy to manage the Fund’s duration and yield curve exposures. To decrease the duration of the Fund’s portfolio, we acquired short Treasury bond or Treasury note futures positions. The effect of these activities detracted from performance during the reporting period. We also used interest rate swaps as part of our portfolio construction strategy to manage the Fund’s duration and overall portfolio yield curve exposure. The interest rate swap detracted from performance during the reporting period.
In addition, we used foreign currency exchange contracts to manage the Fund’s foreign currency exposures. For example, the Fund may reduce unwanted currency exposures from the Fund’s portfolio, or may take long forward positions in select currencies in an attempt to benefit from the potential price appreciation. These positions had a negative impact on performance during the reporting period.
We used credit default swaps to add diversified exposure to a broad segment of the credit markets, or to express a view on credit as part of an overall portfolio sector management strategy. For example, to increase the Fund’s credit exposure to the high yield bond segment of the market, we acquired long CDX High Yield Index swaps. These swap positions detracted from performance during the reporting period.
Nuveen Strategic Income Fund
The Fund’s Class A Shares at NAV outperformed both the Barclays Aggregate Bond Index and the Lipper Multi-Sector Income Funds Classification Average for the twelve-month reporting period. The Fund significantly outpaced both its Barclays benchmark and Lipper peers as most of its strategic investment themes were beneficial during the reporting period. The improvement in credit spreads and the strong performance of high yield credit were two of the key drivers of the Fund’s outperformance, given its ongoing substantial weights to credit and other non-government sectors. The Fund’s positioning in high yield corporates was the largest single contributor as security selection and tactical repositioning within the segment added favorably to results. The high yield bond segment of the market far outpaced the returns of other fixed income asset classes during the reporting period, gaining over 11% as measured by the Barclays High Yield Index.
Exposure to investment grade credit also aided returns during the reporting period, driven largely by individual credit/security selection and a focus on BBB-rated issues. The investment grade corporate sector of the market advanced 7% during the reporting period, according to the Barclays U.S. Corporate Investment Grade Index. Credit selection within investment grade was strong, notably the Fund’s positioning within the financial, metals/mining and energy industries. Our downward bias in credit quality proved beneficial as lower rated investment grade securities outperformed higher-rated investment grade securities.
Foreign exposure made an important positive contribution to the Fund’s performance as well, with gains attributable to both non-dollar denominated bonds and local EM bonds. The emerging markets (EM) debt and non-dollar denominated debt sectors of the market ended up being the second and third best performing fixed income segments, respectively, during the reporting period, both
Portfolio Managers’ Comments (continued)
advancing more than 9% in U.S. dollar terms according to the Barclays Aggregate Bond Index. The Fund’s outperformance in these areas was largely driven by individual country selection, rather than a broad based global move. Positions in Brazilian, Turkish, Mexican and eurozone peripheral debt were most beneficial. On the other hand, our exposure to foreign currencies was a modest net drag on performance during the reporting period.
Meanwhile, an underweight to agency MBS (mortgage-backed securities issued by government agencies such as Fannie Mae, Ginnie Mae and Freddie Mac) detracted from the Fund’s relative performance. The Fund’s underweight was predicated on our view that the risk/reward profile of this sector is not attractive given an approaching end to Fed purchases and our outlook for higher rates. However, the agency MBS segment continued to be supported by a lack of loan origination due to tepid prepayment activity and a slowdown in home purchase activity, while Fed purchase activity absorbed most new supply. The market was also boosted by range bound rates and low levels of implied volatility.
Given our view that short rates would rise more than long rates as the Fed normalized policy, we maintained the Fund’s more defensive positioning in terms of its interest rate sensitivity. This entailed a shorter duration stance for the Fund versus the benchmark throughout the reporting period. For the same reason, we positioned the Fund with a bias to benefit from a flatter yield curve with a relative underweight in shorter to intermediate maturities. In a flattening yield curve environment, yields on shorter maturities will rise more or fall less than yields on longer maturity securities. The impact from the Fund’s duration and yield curve strategies was negligible during the reporting period.
The Fund’s key themes continued to include our positioning in favor of credit sectors with corresponding underweights to MBS and government securities and a defensive interest rate posture. Nonetheless, we saw considerable opportunity to take advantage of market volatility and fundamental developments to make adjustments around these core themes. Toward the end of the reporting period, we meaningfully increased the Fund’s positions in foreign-denominated bonds, particularly in select EM such as Mexico, South Africa, Poland and Brazil. Many of these foreign markets remained cheap amid investor skepticism, despite improved fundamental conditions.
Continued volatility in currency markets also allowed us to tactically add to core conviction markets amid improving global conditions. Therefore, the Fund ended the reporting period with significantly higher currency exposure versus one year ago.
To fund the increased allocations to foreign denominated bonds and currencies, we selectively reduced the Fund’s high yield and investment grade bond exposures as these segments had performed well and some holdings hit target levels. At the same time, we made improvements to the profile of the Fund’s credit exposure through opportunities in individual corporate issues, both newly issued and in the secondary market. We continued to retain the Fund’s industry focus on financials as well as cyclically sensitive industries within corporates.
During the reporting period, we also continued to utilize various derivative instruments. We used foreign currency exchange forward contracts to manage the Fund’s foreign currency exposure. For example, the Fund may reduce unwanted currency exposure from the Fund’s portfolio, or may take long forward positions in select currencies in an attempt to benefit from the potential price appreciation. These positions had a negative impact on performance during the reporting period. We also held call options on select currencies in an attempt to benefit from changes in the spot values of these currencies. The overall effect of these activities during the period was negligible.
We utilized domestic and foreign interest rate futures as part of an overall portfolio construction strategy to manage the Fund’s duration and yield curve exposure. To decrease the duration of the Fund’s portfolio, we established short Treasury bond or Treasury note futures positions. The overall effect on performance during the reporting period was negative. We also utilized interest rate swaps to manage portfolio duration and yield curve exposure and these positions also detracted from performance during the reporting period. These derivative exposures are integrated with the overall portfolio construction and as such losses and gains may be naturally related to/may offset impacts elsewhere in the portfolio.
In addition, we utilized credit default swaps to add diversified exposure to a broad segment of the credit markets, or to express a view on credit as part of an overall portfolio sector management strategy. For example, to increase the Fund’s credit exposure to the high-yield bond segment of the market, we used high yield index swaps. These positions contributed to performance during the reporting period.
Nuveen U.S. Infrastructure Income Fund
The Fund’s Class A Shares at NAV underperformed the Barclays Taxable Municipal Bond Aggregate Eligible Index and outperformed the Lipper General & Insured Municipal Debt Funds Classification Average during the abbreviated reporting period from the Fund’s inception on May 12, 2014, through June 30, 2014. The Fund was launched and became fully invested during this abbreviated reporting period. The goal of the Fund is to provide investors with an attractive level of income by investing in a portfolio of debt securities from various entities that own, operate or develop infrastructure assets in the U.S. These investments include municipal, high yield corporate and investment grade corporate bonds that finance either public or private infrastructure projects. We define infrastructure as the vital structures, facilities and services that support the U.S. economy and society including: transportation; energy and utilities; communications; and social and government functions. We believe the attractive yield potential and
diversification benefits of infrastructure related debt make it a compelling addition to a fixed income portfolio. These debt securities are generally supported by consistent cash flows and usage trends which lead to lower historical default rates than the corporate bond market as a whole. The bonds that we focus on are typically backed by assets that have recurring revenue streams and natural monopolies, for example an electric or gas utility, or long term contracts that offer predictable revenue streams, such as a pipeline.
During the Fund’s initial invest up, we selected securities using an investment process that focuses on fundamental research by Nuveen’s seasoned fixed income investment team. We positioned approximately two-thirds of the Fund’s portfolio in taxable municipal bonds with the remaining one-third split between high yield and investment grade corporate bonds. By the end of the reporting period, the Fund’s seed capital was fully invested in a diversified portfolio of infrastructure related debt securities with the largest concentrations in the transportation, utilities, general obligation, energy, industrials and water/sewer sectors.
During the Fund’s abbreviated reporting period, the municipal bond asset class continued its general rebound as the Fed remained accommodative, the Treasury market rallied and municipal credit fundamentals continued to improve. Fundamentals in the municipal bond market remained strong as state governments overall made good progress in dealing with budget issues. Due to strong growth in personal tax and sales tax collections, year-over-year totals for state tax revenues have increased for 16 consecutive quarters, while on the expense side, many states made headway in cutting and controlling costs, with more than 40 states implementing some type of pension reform. The current lower level of municipal bond issuance reflects the more conservative approach to state budgeting.
Despite some geopolitical tensions and a slower U.S. economy than anticipated, the high yield debt market continued to perform well on the back of muted volatility, a low default environment and well contained Treasury rates. Following the pattern that has persisted since late last year, high yield spreads continued to tighten versus Treasuries on the strength of improved technicals (i.e. renewed inflows into the market and a market friendly outlook postured by the Fed) and the continued low level of defaults. Likewise, investment grade credit had solid performance as spreads tightened modestly against the backdrop of low volatility and stable fundamentals. Lower rated investment grade securities outperformed higher rated investment grade securities over this time frame.
We also shorted U.S. Treasury futures contracts to hedge against potential increases in interest rates. The effect on performance was modestly negative during the reporting period, as interest rates moved lower.
Risk Considerations
and Dividend Information
Risk Considerations
Nuveen Global Total Return Bond Fund
Mutual fund investing involves risk; principal loss is possible. Debt securities such as those held by the Fund, are subject to market risk, credit risk, interest rate risk, call risk, and income risk. As interest rates rise, bond prices fall. Below investment grade or high yield debt securities are subject to liquidity risk and heightened credit risk. Foreign investments involve additional risks, including currency fluctuation, political and economic instability, lack of liquidity and differing legal and accounting standards. The Fund gains additional exposure to currency rates, and therefore to the risk of currency fluctuation, through investment in foreign currency contracts. The risks of foreign investments are magnified in emerging markets. Asset-backed and mortgage-backed securities are also subject to prepayment risk, liquidity risk, default risk and adverse economic developments. The Fund’s potential use of derivative instruments involves a high degree of financial risk and additional transaction costs.
Nuveen High Income Bond Fund
Mutual fund investing involves risk; principal loss is possible. Debt or fixed income securities such as those held by the Fund, are subject to market risk, credit risk, interest rate risk, call risk, derivatives risk, income risk, and other investment company risk. As interest rates rise, bond prices fall. Below investment grade or high yield debt securities are subject to liquidity risk and heightened credit risk. Foreign investments involve additional risks, including currency fluctuation, political and economic instability, lack of liquidity and differing legal and accounting standards.
Nuveen Strategic Income Fund
Mutual fund investing involves risk; principal loss is possible. Debt or fixed income securities such as those held by the Fund, are subject to market risk, credit risk, interest rate risk, call risk, derivatives risk, dollar roll transaction risk, and income risk. As interest rates rise, bond prices fall. Below investment grade or high yield debt securities are subject to liquidity risk and heightened credit risk. Foreign investments involve additional risks, including currency fluctuation, political and economic instability, lack of liquidity and differing legal and accounting standards. These risks are magnified in emerging markets. Asset-backed and mortgage-backed securities are subject to additional risks such as prepayment risk, liquidity risk, default risk and adverse economic developments.
Nuveen U.S. Infrastructure Income Fund
Mutual fund investing involves risk; principal loss is possible. There is no guarantee the Fund’s investment objectives will be achieved. Because the Fund may invest in infrastructure-related securities, the Fund could have greater exposure to adverse economic, regulatory, political, legal and other changes affecting the issuers of such securities. The Fund is subject to interest rate risk; as interest rates rise, bond prices fall. Credit risk refers to an issuer’s ability to make interest and principal payments when due. Investments in below investment grade or high yield securities are subject to liquidity risk and heightened credit risk. The Fund’s use of inverse floaters creates effective leverage. Leverage involves the risk that the Fund could lose more than its original investment and also increases the Fund’s exposure to volatility and interest rate risk. Non-U.S./Emerging Markets involve additional risks, including currency fluctuation, political and economic instability, lack of liquidity and differing legal and accounting standards. These risks are magnified in emerging markets. This Fund is subject to loan settlement risk due to the lack of established settlement standards or remedies for failure to settle. Preferred securities are subordinated to bonds and other debt instruments in a company’s capital structure and therefore are subject to greater credit risk. More information on these risk considerations, as well as information on other risks to which the Fund is subject, such as bond market liquidity, call, convertible security, currency, derivatives, general municipal securities market, income, market, municipal lease obligations, and zero coupon bonds risks, are included in the Fund’s prospectus.
Dividend Information
Each Fund seeks to pay dividends at a rate that reflects the past and projected performance of the Fund. To permit a Fund to maintain a more stable monthly dividend, the Fund may pay dividends at a rate that may be more or less than the amount of net investment income actually earned by the Fund during the period. If the Fund has cumulatively earned more than it has paid in dividends, it will hold the excess in reserve as undistributed net investment income (UNII) as part of the Fund’s NAV. Conversely, if the Fund has cumulatively paid in dividends more than it has earned, the excess will constitute negative UNII that will likewise be reflected in the Fund’s NAV. Each Fund will, over time, pay all its net investment income as dividends to shareholders.
As of June 30, 2014, all of the Funds had positive UNII balances, for tax purposes. The Nuveen Global Total Return Bond Fund, Nuveen Strategic Income Fund and Nuveen U.S. Infrastructure Income Fund had positive UNII balances while the Nuveen High Income Bond Fund had a negative UNII balance for financial reporting purposes.
In certain instances, a portion of each Fund’s monthly distributions may be paid from sources or comprised of elements other than ordinary income, including capital gains and/or a return of capital. The composition and per share amounts of each Fund’s monthly distributions for the fiscal year ended June 30, 2014, are presented in the Statement of Changes in Net Assets and Financial Highlights, respectively (for financial reporting purposes) and in Note 6 – Income Tax Information within the accompany Notes to Financial Statements (for income tax purposes), later in this report.
THIS PAGE INTENTIONALLY LEFT BLANK
Fund Performance
and Expense Ratios
The Fund Performance and Expense Ratios for each Fund are shown within this section of the report.
Returns quoted represent past performance, which is no guarantee of future results. Current performance may be higher or lower than the performance shown. Investment returns and principal value will fluctuate so that when shares are redeemed, they may be worth more or less than their original cost. Returns without sales charges would be lower if the sales charge were included. Returns do not reflect the deduction of taxes that a shareholder would pay on Fund distributions or the redemption of Fund shares.
Returns may reflect a contractual agreement between certain Funds and the investment adviser to waive certain fees and expenses; see Notes to Financial Statements, Note 7—Management Fees and Other Transactions with Affiliates for more information. In addition, returns may reflect a voluntary expense limitation by the Funds’ investment adviser that may be modified or discontinued at any time without notice. For the most recent month-end performance visit www.nuveen.com or call (800) 257-8787.
Returns reflect differences in sales charges and expenses, which are primarily differences in distribution and service fees. Fund returns assume reinvestment of dividends and capital gains.
Comparative index and Lipper return information is provided for the Funds’ Class A Shares at net asset value (NAV) only.
The expense ratios shown reflect the Funds’ total operating expenses (before fee waivers and/or expense reimbursements, if any) as shown in the Funds’ most recent prospectus. The expense ratios include management fees and other fees and expenses.
Fund Performance and Expense Ratios (continued)
Nuveen Global Total Return Bond Fund
Refer to the first page of this Fund Performance and Expense Ratios section for further explanation of the information included within this section. Refer to the Glossary of Terms Used in this Report for definitions of terms used in this section.
Fund Performance
Average Annual Total Returns as of June 30, 2014
| | | | | | | | |
| | | Average Annual | |
| | | 1-Year | | | Since
Inception* | |
Class A Shares at NAV | | | 7.45% | | | | 6.73% | |
Class A Shares at maximum Offering Price | | | 2.35% | | | | 4.73% | |
Barclays Global Aggregate Unhedged Bond Index | | | 7.39% | | | | 2.72% | |
Lipper Global Income Funds Classification Average | | | 6.70% | | | | 4.34% | |
| | |
Class C Shares | | | 6.74% | | | | 6.12% | |
Class R3 Shares | | | 7.26% | | | | 6.59% | |
Class I Shares | | | 7.76% | | | | 7.11% | |
Indexes and Lipper averages are not available for direct investment.
Class A Shares have a maximum 4.75% sales charge (Offering Price). Class A Share purchases of $1 million or more are sold at net asset value without an up-front sales charge but may be subject to a contingent deferred sales charge (CDSC), also known as a back-end sales charge, if redeemed within eighteen months of purchase. Class C Shares have a 1% CDSC for redemptions within less than twelve months, which is not reflected in the one-year total return. Class R3 Shares have no sales charge and are only available for purchase by eligible retirement plans. Class I Shares have no sales charge and may be purchased under limited circumstances or by specified classes of investors.
Expense Ratios as of Most Recent Prospectus
| | | | | | | | | | | | | | | | |
| | | Share Class | |
| | | Class A | | | Class C | | | Class R3 | | | Class I | |
Gross Expense Ratios | | | 2.16% | | | | 2.99% | | | | 2.31% | | | | 1.81% | |
Net Expense Ratios | | | 0.97% | | | | 1.72% | | | | 1.22% | | | | 0.72% | |
The Fund’s investment adviser has agreed to waive fees and/or reimburse expenses through October 31, 2014, so that total annual Fund operating expenses (excluding 12b-1 distribution and/or service fees, interest expenses, taxes, acquired fund fees and expenses, fees incurred in acquiring and disposing of portfolio securities, and extraordinary expenses) do not exceed 0.75% of the average daily net assets of any class of Fund shares. The expense limitation expiring October 31, 2014, may be terminated or modified prior to that date only with the approval of the Board of Trustees of the Fund.
| * | Since inception returns are from 12/02/11. |
Growth of an Assumed $10,000 Investment as of June 30, 2014 – Class A Shares

The graphs do not reflect the deduction of taxes that a shareholder may pay on Fund distributions or the redemption of Fund shares.
Fund Performance and Expense Ratios (continued)
Nuveen High Income Bond Fund
Refer to the first page of this Fund Performance and Expense Ratios section for further explanation of the information included within this section. Refer to Glossary of Terms Used in this Report for definitions of terms used in this section.
Fund Performance
Average Annual Total Returns as of June 30, 2014
| | | | | | | | | | | | |
| | | Average Annual | |
| | | 1-Year | | | 5-Year | | | 10-Year | |
Class A Shares at NAV | | | 12.88% | | | | 14.12% | | | | 8.43% | |
Class A Shares at maximum Offering Price | | | 7.50% | | | | 13.01% | | | | 7.90% | |
Barclays High Yield 2% Issuer Capped Index | | | 11.72% | | | | 13.92% | | | | 9.04% | |
Lipper High Current Yield Funds Classification Average | | | 10.60% | | | | 12.61% | | | | 7.63% | |
| | | |
Class C Shares | | | 11.98% | | | | 13.35% | | | | 7.66% | |
Class R3 Shares | | | 12.65% | | | | 13.84% | | | | 8.15% | |
Class I Shares | | | 13.15% | | | | 14.42% | | | | 8.71% | |
Indexes and Lipper averages are not available for direct investment.
Class A Shares have a maximum 4.75% sales charge (Offering Price). Class A Share purchases of $1 million or more are sold at net asset value without an up-front sales charge but may be subject to a contingent deferred sales charge (CDSC), also known as a back-end sales charge, if redeemed within eighteen months of purchase. Class C Shares have a 1% CDSC for redemptions within less than twelve months, which is not reflected in the one-year total return. Class R3 Shares have no sales charge and are only available for purchase by eligible retirement plans. Class I Shares have no sales charge and may be purchased under limited circumstances or by specified classes of investors.
Expense Ratios as of Most Recent Prospectus
| | | | | | | | | | | | | | | | |
| | | Share Class | |
| | | Class A | | | Class C | | | Class R3 | | | Class I | |
Expense Ratios | | | 0.97% | | | | 1.73% | | | | 1.22% | | | | 0.73% | |
Growth of an Assumed $10,000 Investment as of June 30, 2014 – Class A Shares
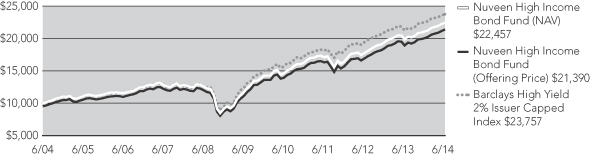
The graphs do not reflect the deduction of taxes that a shareholder may pay on Fund distributions or the redemption of Fund shares.
Fund Performance and Expense Ratios (continued)
Nuveen Strategic Income Fund
Refer to the first page of this Fund Performance and Expense Ratios section for further explanation of the information included within this section. Refer to Glossary of Terms Used in this Report for definitions of terms used in this section.
Fund Performance
Average Annual Total Returns as of June 30, 2014
| | | | | | | | | | | | |
| | | Average Annual | |
| | | 1-Year | | | 5-Year | | | 10-Year | |
Class A Shares at NAV | | | 10.46% | | | | 10.00% | | | | 6.70% | |
Class A Shares at maximum Offering Price | | | 5.76% | | | | 9.05% | | | | 6.24% | |
Barclays Aggregate Bond Index | | | 4.37% | | | | 4.85% | | | | 4.93% | |
Lipper Multi-Sector Income Funds Classification Average | | | 7.79% | | | | 8.95% | | | | 6.30% | |
| | | |
Class C Shares | | | 9.59% | | | | 9.16% | | | | 5.89% | |
Class R3 Shares | | | 10.19% | | | | 9.64% | | | | 6.40% | |
Class I Shares | | | 10.77% | | | | 10.24% | | | | 6.94% | |
Indexes and Lipper averages are not available for direct investment.
Class A Shares have a maximum 4.25% sales charge (Offering Price). Class A Share purchases of $1 million or more are sold at net asset value without an up-front sales charge but may be subject to a contingent deferred sales charge (CDSC), also known as a back-end sales charge, if redeemed within eighteen months of purchase. Class C Shares have a 1% CDSC for redemptions within less than twelve months, which is not reflected in the one-year total return. Class R3 Shares have no sales charge and are only available for purchase by eligible retirement plans. Class I Shares have no sales charge and may be purchased under limited circumstances or by specified classes of investors.
Expense Ratios as of Most Recent Prospectus
| | | | | | | | | | | | | | | | |
| | | Share Class | |
| | | Class A | | | Class C | | | Class R3 | | | Class I | |
Gross Expense Ratios | | | 0.91% | | | | 1.66% | | | | 1.16% | | | | 0.66% | |
Net Expense Ratios | | | 0.85% | | | | 1.60% | | | | 1.10% | | | | 0.60% | |
The Fund’s investment adviser has contractually agreed to waive fees and/or reimburse other Fund expenses through October 31, 2014, so that total annual Fund operating expenses, after fee waivers and/or expense reimbursements and excluding acquired fund fees and expenses, do not exceed 0.84%, 1.59%, 1.09% and 0.59% for Class A, Class C, Class R3 and Class I Shares, respectively. Fee waivers and/or expense reimbursements will not be terminated prior to that time without the approval of the Fund’s Board of Directors.
Growth of an Assumed $10,000 Investment as of June 30, 2014 – Class A Shares
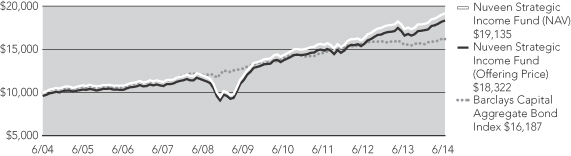
The graphs do not reflect the deduction of taxes that a shareholder may pay on Fund distributions or the redemption of Fund shares.
Fund Performance and Expense Ratios (continued)
Nuveen U.S. Infrastructure Income Fund
Refer to the first page of this Fund Performance and Expense Ratios section for further explanation of the information included within this section. Refer to the Glossary of Terms Used in this Report for definitions of terms used in this section.
Fund Performance
Total Returns as of June 30, 2014
| | | | |
| | | Cumulative | |
| | | Since
Inception* | |
Class A Shares at NAV | | | 1.93% | |
Class A Shares at maximum Offering Price | | | (2.41)% | |
Barclays Taxable Municipal Aggregate Eligible Index | | | 3.05% | |
Lipper General & Insured Municipal Debt Funds Classification Average | | | 0.76% | |
| |
Class C Shares | | | 1.81% | |
Class I Shares | | | 1.95% | |
Indexes and Lipper averages are not available for direct investment.
Class A Shares have a maximum 4.25% sales charge (Offering Price). Class A Share purchases of $1 million or more are sold at net asset value without an up-front sales charge but may be subject to a contingent deferred sales charge (CDSC), also known as a back-end sales charge, if redeemed within eighteen months of purchase. Class C Shares have a 1% CDSC for redemptions within less than twelve months, which is not reflected in the one-year total return. Class I Shares have no sales charge and may be purchased under limited circumstances or by specified classes of investors.
Expense Ratios as of Most Recent Prospectus
| | | | | | | | | | | | |
| | | Share Class | |
| | | Class A | | | Class C | | | Class I | |
Gross Expense Ratios | | | 1.27% | | | | 2.02% | | | | 1.02% | |
Net Expense Ratios | | | 0.99% | | | | 1.74% | | | | 0.74% | |
The Fund’s investment adviser has agreed to waive fees and/or reimburse expenses through October 31, 2017, so that total annual Fund operating expenses (excluding 12b-1 distribution and/or service fees, interest expenses, taxes, acquired fund fees and expenses, fees incurred in acquiring and disposing of portfolio securities, and extraordinary expenses) do not exceed 0.74% of the average daily net assets of any class of Fund shares. The expense limitation may be terminated or modified prior to that date only with the approval of the Board of Trustees.
| * | Since inception returns are from 5/12/14. |
Growth of an Assumed $10,000 Investment as of June 30, 2014 – Class A Shares
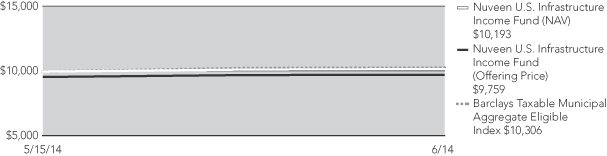
The graphs do not reflect the deduction of taxes that a shareholder may pay on Fund distributions or the redemption of Fund shares.
Yields as of June 30, 2014
Dividend Yield is the most recent dividend per share (annualized) divided by the offering price per share.
The SEC 30-Day Yield is a standardized measure of a Fund’s yield that accounts for the future amortization of premiums or discounts of bonds held in the Fund’s portfolio. The SEC 30-Day Yield is computed under an SEC standardized formula and is based on the maximum offer price per share. Dividend Yield may differ from the SEC 30-Day Yield because the Fund may be paying out more or less than it is earning and it may not include the effect of amortization of bond premium.
Nuveen Global Total Return Bond Fund
| | | | | | | | | | | | | | | | |
| | | Share Class | |
| | | Class A1 | | | Class C | | | Class R3 | | | Class I | |
Dividend Yield | | | 3.30% | | | | 2.71% | | | | 3.22% | | | | 3.71% | |
SEC 30-Day Yield | | | 3.05% | | | | 2.44% | | | | 2.89% | | | | 3.40% | |
Nuveen High Income Bond Fund
| | | | | | | | | | | | | | | | |
| | | Share Class | |
| | | Class A1 | | | Class C | | | Class R3 | | | Class I | |
Dividend Yield | | | 5.85% | | | | 5.44% | | | | 5.89% | | | | 6.38% | |
SEC 30-Day Yield | | | 5.36% | | | | 4.87% | | | | 5.37% | | | | 5.88% | |
Nuveen Strategic Income Fund
| | | | | | | | | | | | | | | | |
| | | Share Class | |
| | | Class A1 | | | Class C | | | Class R3 | | | Class I | |
Dividend Yield | | | 4.61% | | | | 4.11% | | | | 4.59% | | | | 5.07% | |
SEC 30-Day Yield | | | 3.94% | | | | 3.36% | | | | 3.86% | | | | 4.36% | |
Nuveen U.S. Infrastructure Income Fund
| | | | | | | | | | | | |
| | | Share Class | |
| | | Class A1 | | | Class C | | | Class I | |
Dividend Yield | | | 3.68% | | | | 3.07% | | | | 4.07% | |
SEC 30-Day Yield | | | 3.55% | | | | 2.97% | | | | 3.96% | |
| 1 | The SEC Yield for Class A Shares quoted in the table reflects the maximum sales load. Investors paying a reduced load because of volume discounts, investors paying no load because they qualify for one of the several exclusions from the load, and existing shareholders who previously paid a load but would like to know the SEC Yield applicable to their shares on a going-forward basis, should understand that the SEC Yield effectively applicable to them would be higher than the figure quoted in the table. |
Holding
Summaries as of June 30, 2014
This data relates to the securities held in each Fund’s portfolio of investments as of the end of this reporting period. It should not be construed as a measure of performance for the Fund itself. Holdings are subject to change.
Ratings shown are the highest rating given by one of the following national rating agencies: Standard & Poor’s, Moody’s Investors Service, Inc. or Fitch, Inc. Credit ratings are subject to change. AAA, AA, A and BBB are investment grade ratings; BB, B, CCC, CC, C and D are below investment grade ratings. Certain bonds backed by U.S. Government or agency securities are regarded as having an implied rating equal to the rating of such securities. Holdings designated N/R are not rated by these national rating agencies.
Refer to the Glossary of Terms Used in this Report for definitions of terms used within this section.
Nuveen Global Total Return Bond Fund
Fund Allocation
(% of net assets)
| | | | |
Convertible Preferred Securities | | | 0.4% | |
$25 Par (or similar) Retail Preferred | | | 1.5% | |
Corporate Bonds | | | 43.3% | |
Convertible Bonds | | | 0.1% | |
$1,000 (par or similar) Institutional Preferred | | | 3.3% | |
Asset-Backed and Mortgage-Backed Securities | | | 5.9% | |
Sovereign Debt | | | 43.3% | |
Short-Term Investments | | | 6.4% | |
Other Assets Less Liabilities | | | (4.2)% | |
Corporate Debt: Industries
(% of total corporate debt holdings)
| | | | |
Banks | | | 17.5% | |
Oil, Gas & Consumable Fuels | | | 16.2% | |
Metals & Mining | | | 9.9% | |
Chemicals | | | 6.2% | |
Wireless Telecommunication Services | | | 4.9% | |
Energy Equipment & Services | | | 4.8% | |
Capital Markets | | | 4.7% | |
Real Estate Investment Trust | | | 3.9% | |
Media | | | 3.8% | |
Automobiles | | | 3.7% | |
Diversified Telecommunication Services | | | 3.6% | |
Beverages | | | 2.3% | |
Other Industries | | | 18.5% | |
Portfolio Credit Quality
(% of total long-term
investments)1
| | | | |
AAA/U.S. Guaranteed | | | 13.5% | |
AA | | | 6.6% | |
A | | | 24.0% | |
BBB | | | 37.9% | |
BB or Lower | | | 17.3% | |
N/R (not rated) | | | 0.7% | |
Country Allocation
(% of net assets)
| | | | |
United States | | | 37.7% | |
Mexico | | | 13.1% | |
United Kingdom | | | 7.7% | |
Turkey | | | 7.1% | |
Germany | | | 4.9% | |
South Africa | | | 4.7% | |
Poland | | | 3.3% | |
Canada | | | 2.8% | |
Brazil | | | 2.3% | |
Portugal | | | 2.2% | |
Other Countries | | | 18.4% | |
Other Assets Less Liabilities | | | (4.2)% | |
| 1 | Excluding investments in derivatives. |
Holding Summaries as of June 30, 2014 (continued)
Nuveen High Income Bond Fund
Fund Allocation
(% of net assets)
| | | | |
Common Stocks | | | 1.7% | |
Exchange-Traded Funds | | | 0.9% | |
Convertible Preferred Securities | | | 0.4% | |
Variable Rate Senior Loan Interests | | | 1.9% | |
$25 Par (or similar) Retail Preferred | | | 5.5% | |
Corporate Bonds | | | 79.2% | |
Convertible Bonds | | | 0.4% | |
$1,000 (par or similar) Institutional Preferred | | | 5.2% | |
Asset-Backed Securities | | | 0.0% | |
Investment Companies | | | 1.4% | |
Warrants | | | 0.0% | |
Investments Purchased with Collateral from Securities Lending | | | 18.0% | |
Short-Term Investments | | | 3.8% | |
Other Assets Less Liabilities | | | (18.4)% | |
Corporate Debt: Industries
(% of total corporate debt holdings)
| | | | |
Oil, Gas & Consumable Fuels | | | 18.4% | |
Metals & Mining | | | 7.6% | |
Media | | | 6.8% | |
Wireless Telecommunication Services | | | 4.4% | |
Banks | | | 3.9% | |
Chemicals | | | 3.6% | |
Energy Equipment & Services | | | 3.4% | |
Commercial Services & Supplies | | | 3.3% | |
Food Products | | | 2.8% | |
Building Products | | | 2.6% | |
Paper & Forest Products | | | 2.4% | |
Hotels, Restaurants & Leisure | | | 2.4% | |
Health Care Providers & Services | | | 2.4% | |
Diversified Telecommunication Services | | | 2.0% | |
Auto Components | | | 2.0% | |
Real Estate Management & Development | | | 2.0% | |
Marine | | | 2.0% | |
Electric Utilities | | | 1.9% | |
Diversified Financial Services | | | 1.9% | |
Containers & Packaging | | | 1.7% | |
Road & Rail | | | 1.4% | |
Consumer Finance | | | 1.4% | |
Other Industries | | | 19.7% | |
Portfolio Credit Quality
(% of total long-term
investments)1
| | | | |
AA | | | 0.0% | |
A | | | 0.3% | |
BBB | | | 5.9% | |
BB or Lower | | | 79.9% | |
N/R (not rated) | | | 9.7% | |
N/A (not applicable) | | | 4.2% | |
Country Allocation
(% of net assets)
| | | | |
United States | | | 85.3% | |
Canada | | | 6.8% | |
United Kingdom | | | 3.7% | |
Luxembourg | | | 3.1% | |
France | | | 2.4% | |
Norway | | | 1.5% | |
Brazil | | | 1.4% | |
Other Countries | | | 14.2% | |
Other Assets Less Liabilities | | | (18.4)% | |
| 1 | Excluding investments in derivatives. |
Nuveen Strategic Income Fund
Fund Allocation
(% of net assets)
| | | | |
Common Stocks | | | 0.0% | |
Convertible Preferred Securities | | | 0.1% | |
Variable Rate Senior Loan Interests | | | 1.1% | |
$25 Par (or similar) Retail Preferred | | | 2.6% | |
Corporate Bonds | | | 61.0% | |
$1,000 (par or similar) Institutional Preferred | | | 5.7% | |
Asset-Backed and Mortgage-Backed Securities | | | 9.5% | |
Investment Companies | | | 0.3% | |
Sovereign Debt | | | 16.6% | |
Investments Purchased with Collateral from Securities Lending | | | 10.7% | |
Short-Term Investments | | | 3.5% | |
Other Assets Less Liabilities | | | (11.1)% | |
Corporate Debt: Industries
(% of total corporate debt holdings)
| | | | |
Oil, Gas & Consumable Fuels | | | 13.7% | |
Banks | | | 13.2% | |
Metals & Mining | | | 7.6% | |
Media | | | 5.5% | |
Real Estate Investment Trust | | | 5.0% | |
Capital Markets | | | 4.0% | |
Chemicals | | | 3.8% | |
Diversified Telecommunication Services | | | 3.8% | |
Wireless Telecommunication Service | | | 3.4% | |
Electric Utilities | | | 3.2% | |
Insurance | | | 3.1% | |
Energy Equipment & Services | | | 3.0% | |
Consumer Finance | | | 2.1% | |
Building Products | | | 2.0% | |
Commercial Services & Supplies | | | 1.9% | |
Tobacco | | | 1.6% | |
Paper & Forest Products | | | 1.6% | |
Auto Components | | | 1.5% | |
Other Industries | | | 20.0% | |
Portfolio Credit Quality
(% of total long-term
investments)1
| | | | |
AAA/U.S. Guaranteed | | | 6.2% | |
AA | | | 2.7% | |
A | | | 17.8% | |
BBB | | | 41.9% | |
BB or Lower | | | 30.1% | |
N/R (not rated) | | | 1.0% | |
N/A (not applicable) | | | 0.3% | |
Country Allocation
(% of net assets)
| | | | |
United States | | | 73.8% | |
South Africa | | | 4.8% | |
Mexico | | | 4.8% | |
Canada | | | 4.2% | |
United Kingdom | | | 3.3% | |
Brazil | | | 3.3% | |
Turkey | | | 3.1% | |
Poland | | | 1.5% | |
Other Countries | | | 12.2% | |
Other Assets Less Liabilities | | | (11.0)% | |
| 1 | Excluding investments in derivatives. |
Holding Summaries as of June 30, 2014 (continued)
Nuveen U.S. Infrastructure Income Fund
Fund Allocation
(% of net assets)
| | | | |
Corporate Bonds | | | 35.2% | |
Municipal Bonds | | | 63.6% | |
Other Assets Less Liabilities | | | 1.2% | |
Portfolio Composition
(% of net assets)
| | | | |
Transportation | | | 19.8% | |
Tax Obligation/Limited | | | 15.9% | |
Utilities | | | 10.5% | |
Tax Obligation/General | | | 9.7% | |
Oil, Gas, & Consumable Fuels | | | 9.6% | |
Electric Utilities | | | 5.6% | |
Water and Sewer | | | 5.2% | |
Road & Rail | | | 4.9% | |
Other Industries | | | 17.6% | |
Other Assets less liabilities | | | 1.2% | |
Portfolio Credit Quality
(% of net assets)
| | | | |
AAA/U.S. Guaranteed | | | 2.4% | |
AA | | | 41.9% | |
A | | | 19.5% | |
BBB | | | 15.7% | |
BB or Lower | | | 20.5% | |
Expense
Examples
As a shareholder of one or more of the Funds, you incur two types of costs: (1) transaction costs, including up-front and back-end sales charges (loads) or redemption fees, where applicable; and (2) ongoing costs, including management fees; distribution and service (12b-1) fees, where applicable; and other Fund expenses. The Examples below are intended to help you understand your ongoing costs (in dollars) of investing in the Funds and to compare these costs with the ongoing costs of investing in other mutual funds. Since the expense examples for Nuveen U.S. Infrastructure Income Fund reflect only the first 50 days of the Fund’s operations they may not provide a meaningful understanding of the Fund’s ongoing expenses.
The Examples below are based on an investment of $1,000 invested at the beginning of the period and held through the period ended June 30, 2014.
The beginning of the period for all Classes of Nuveen Global Total Return Bond Fund, Nuveen High Income Bond Fund and Nuveen Strategic Income Fund is January 1, 2014. The beginning of the period for all Classes of Nuveen U.S. Infrastructure Income Fund is May 12, 2014.
The information under “Actual Performance,” together with the amount you invested, allows you to estimate actual expenses incurred over the reporting period. Simply divide your account value by $1,000 (for example, an $8,600 account value divided by $1,000 = 8.60) and multiply the result by the cost shown for your share class, in the row entitled “Expenses Incurred During Period” to estimate the expenses incurred on your account during this period.
The information under “Hypothetical Performance,” provides information about hypothetical account values and hypothetical expenses based on each Fund’s actual expense ratios and an assumed rate of return of 5% per year before expenses, which is not the Fund’s actual return. The hypothetical account values and expenses may not be used to estimate the actual ending account balance or expense you incurred for the period. You may use this information to compare the ongoing costs of investing in the Fund and other funds. To do so, compare this 5% hypothetical example with the 5% hypothetical examples that appear in the shareholder reports of the other funds.
Please note that the expenses shown in the table are meant to highlight your ongoing costs only and do not reflect any transaction costs. Therefore, the hypothetical information is useful in comparing ongoing costs only, and will not help you determine the relative total costs of owning different funds or share classes. In addition, if these transaction costs were included, your costs would have been higher.
Nuveen Global Total Return Bond Fund
| | | | | | | | | | | | | | | | |
| | | Share Class | |
| | | Class A | | | Class C | | | Class R3 | | | Class I | |
Actual Performance | | | | | | | | | | | | | | | | |
Beginning Account Value | | $ | 1,000.00 | | | $ | 1,000.00 | | | $ | 1,000.00 | | | $ | 1,000.00 | |
Ending Account Value | | $ | 1,074.20 | | | $ | 1,071.00 | | | $ | 1,073.30 | | | $ | 1,075.90 | |
Expenses Incurred During Period | | $ | 4.99 | | | $ | 8.83 | | | $ | 6.27 | | | $ | 3.71 | |
Hypothetical Performance (5% annualized return before expenses) | | | | | | | | | | | | | | | | |
Beginning Account Value | | $ | 1,000.00 | | | $ | 1,000.00 | | | $ | 1,000.00 | | | $ | 1,000.00 | |
Ending Account Value | | $ | 1,019.98 | | | $ | 1,016.27 | | | $ | 1,018.74 | | | $ | 1,021.22 | |
Expenses Incurred During Period | | $ | 4.86 | | | $ | 8.60 | | | $ | 6.11 | | | $ | 3.61 | |
For each class of the Fund, expenses are equal to the Fund’s annualized net expense ratio of .97%, 1.72%, 1.22% and .72% for Classes A, C, R3 and I, respectively, multiplied by the average account value over the period, multiplied by 181/365 (to reflect the one-half year period).
Expense Examples (continued)
Nuveen High Income Bond Fund
| | | | | | | | | | | | | | | | |
| | | Share Class | |
| | | Class A | | | Class C | | | Class R3 | | | Class I | |
Actual Performance | | | | | | | | | | | | | | | | |
Beginning Account Value | | $ | 1,000.00 | | | $ | 1,000.00 | | | $ | 1,000.00 | | | $ | 1,000.00 | |
Ending Account Value | | $ | 1,064.90 | | | $ | 1,061.20 | | | $ | 1,064.20 | | | $ | 1,066.10 | |
Expenses Incurred During Period | | $ | 5.02 | | | $ | 8.84 | | | $ | 6.24 | | | $ | 3.69 | |
Hypothetical Performance (5% annualized return before expenses) | | | | | | | | | | | | | | | | |
Beginning Account Value | | $ | 1,000.00 | | | $ | 1,000.00 | | | $ | 1,000.00 | | | $ | 1,000.00 | |
Ending Account Value | | $ | 1,019.93 | | | $ | 1,016.22 | | | $ | 1,018.74 | | | $ | 1,021.22 | |
Expenses Incurred During Period | | $ | 4.91 | | | $ | 8.65 | | | $ | 6.11 | | | $ | 3.61 | |
For each class of the Fund, expenses are equal to the Fund’s annualized net expense ratio of .98%, 1.73%, 1.22% and .72% for Classes A, C, R3 and I, respectively, multiplied by the average account value over the period, multiplied by 181/365 (to reflect the one-half year period).
Nuveen Strategic Income Fund
| | | | | | | | | | | | | | | | |
| | | Share Class | |
| | | Class A | | | Class C | | | Class R3 | | | Class I | |
Actual Performance | | | | | | | | | | | | | | | | |
Beginning Account Value | | $ | 1,000.00 | | | $ | 1,000.00 | | | $ | 1,000.00 | | | $ | 1,000.00 | |
Ending Account Value | | $ | 1,064.90 | | | $ | 1,060.50 | | | $ | 1,062.60 | | | $ | 1,065.40 | |
Expenses Incurred During Period | | $ | 4.30 | | | $ | 8.12 | | | $ | 5.57 | | | $ | 3.02 | |
Hypothetical Performance (5% annualized return before expenses) | | | | | | | | | | | | | | | | |
Beginning Account Value | | $ | 1,000.00 | | | $ | 1,000.00 | | | $ | 1,000.00 | | | $ | 1,000.00 | |
Ending Account Value | | $ | 1,020.63 | | | $ | 1,016.91 | | | $ | 1,019.39 | | | $ | 1,021.87 | |
Expenses Incurred During Period | | $ | 4.21 | | | $ | 7.95 | | | $ | 5.46 | | | $ | 2.96 | |
For each class of the Fund, expenses are equal to the Fund’s annualized net expense ratio of .84%, 1.59%, 1.09% and .59% for Classes A, C, R3 and I, respectively, multiplied by the average account value over the period, multiplied by 181/365 (to reflect the one-half year period).
Nuveen U.S. Infrastructure Income Fund
| | | | | | | | | | | | |
| | | Share Class | |
| | | Class A | | | Class C | | | Class I | |
Actual Performance | | | | | | | | | | | | |
Beginning Account Value | | $ | 1,000.00 | | | $ | 1,000.00 | | | $ | 1,000.00 | |
Ending Account Value | | $ | 1,019.30 | | | $ | 1,018.10 | | | $ | 1,019.50 | |
Expenses Incurred During Period | | $ | 1.33 | | | $ | 2.36 | | | $ | 0.98 | |
Hypothetical Performance (5% annualized return before expenses) | | | | | | | | | | | | |
Beginning Account Value | | $ | 1,000.00 | | | $ | 1,000.00 | | | $ | 1,000.00 | |
Ending Account Value | | $ | 1,005.53 | | | $ | 1,004.51 | | | $ | 1,005.88 | |
Expenses Incurred During Period | | $ | 1.32 | | | $ | 2.35 | | | $ | 0.98 | |
For each class of the Fund, expenses are equal to the Fund’s annualized net expense ratio of .96%, 1.71% and .71% for Classes A, C, and I, respectively, multiplied by the average account value over the period, multiplied by 50/365 (to reflect 50 days in the period since commencement of operation).
Report of
Independent Registered Public Accounting Firm
To the Board of Directors/Trustees and Shareholders of
Nuveen Investment Trust and Nuveen Investment Funds, Inc.:
In our opinion, the accompanying statements of assets and liabilities, including the portfolios of investments, and the related statements of operations and of changes in net assets and the financial highlights present fairly, in all material respects, the financial position of Nuveen Global Total Return Bond Fund and Nuveen U.S. Infrastructure Income Fund (each a series of Nuveen Investment Trust), and Nuveen High Income Bond Fund and Nuveen Strategic Income Fund (each a series of Nuveen Investment Funds, Inc.) (hereinafter collectively referred to as the “Funds”) at June 30, 2014, the results of each of their operations, the changes in each of their net assets and the financial highlights for each of the periods presented for each series of Nuveen Investment Trust, and the results of operations for the year then ended, the changes in its net assets for each of the two years in the period then ended and the financial highlights for each of the three years in the period then ended for each series of Nuveen Investment Funds, Inc., in conformity with accounting principles generally accepted in the United States of America. These financial statements and financial highlights (hereafter referred to as “financial statements”) are the responsibility of the Funds’ management. Our responsibility is to express an opinion on these financial statements based on our audits. We conducted our audits of these financial statements in accordance with the standards of the Public Company Accounting Oversight Board (United States). Those standards require that we plan and perform the audit to obtain reasonable assurance about whether the financial statements are free of material misstatement. An audit includes examining, on a test basis, evidence supporting the amounts and disclosures in the financial statements, assessing the accounting principles used and significant estimates made by management, and evaluating the overall financial statement presentation. We believe that our audits, which included confirmation of securities at June 30, 2014 by correspondence with the custodian and brokers, provide a reasonable basis for our opinion. The financial statements of Nuveen High Income Bond Fund and Nuveen Strategic Income Fund for the periods ended June 30, 2011 and prior were audited by other independent auditors whose report dated August 26, 2011 expressed an unqualified opinion on those statements.
PRICEWATERHOUSECOOPERS LLP
Chicago, IL
August 27, 2014
Nuveen Global Total Return Bond Fund
Portfolio of Investments June 30, 2014
| | | | | | | | | | | | | | | | | | | | |
| Shares | | | Description (1) | | Coupon | | | | | | Ratings (2) | | | Value | |
| | | |
| | | | LONG-TERM INVESTMENTS – 97.8% | | | | | | | | | |
| | | |
| | | | CONVERTIBLE PREFERRED SECURITIES – 0.4% | | | | | | | | | |
| | | | | |
| | | | Banks – 0.4% | | | | | | | | | | | | | | | | |
| | | | | |
| | 75 | | | Bank of America Corporation | | | 7.250% | | | | | | | | BB+ | | | $ | 87,525 | |
| | | | Total Convertible Preferred Securities (cost $63,225) | | | | | | | | | | | | 87,525 | |
| | | | | |
| Shares | | | Description (1) | | Coupon | | | | | | Ratings (2) | | | Value | |
| | |
| | | | $25 PAR (OR SIMILAR) RETAIL PREFERRED – 1.5% | | | | | |
| | | | | |
| | | | Banks – 0.8% | | | | | | | | | | | | | | | | |
| | | | | |
| | 1,875 | | | Citigroup Inc. | | | 7.125% | | | | | | | | BB+ | | | $ | 51,842 | |
| | | | | |
| | 2,400 | | | PNC Financial Services | | | 6.125% | | | | | | | | BBB | | | | 65,904 | |
| | | | | |
| | 2,000 | | | Regions Financial Corporation | | | 6.375% | | | | | | | | BB | | | | 50,060 | |
| | | | Total Banks | | | | | | | | | | | | | | | 167,806 | |
| | | | | |
| | | | Consumer Finance – 0.4% | | | | | | | | | | | | | | | | |
| | | | | |
| | 3,000 | | | Discover Financial Services | | | 6.500% | | | | | | | | BB | | | | 75,300 | |
| | | | | |
| | | | Insurance – 0.3% | | | | | | | | | | | | | | | | |
| | | | | |
| | 2,400 | | | Hartford Financial Services Group Inc. | | | 7.875% | | | | | | | | BB+ | | | | 71,856 | |
| | | | Total $25 Par (or similar) Retail Preferred (cost $292,963) | | | | | | | | | | | | 314,962 | |
| | | | | |
Principal
Amount (000) (3) | | | Description (1) | | Coupon | | | Maturity | | | Ratings (2) | | | Value | |
| | | | | |
| | | | CORPORATE BONDS – 43.3% | | | | | | | | | | | | | | | | |
| | | | | |
| | | | Auto Components – 0.7% | | | | | | | | | | | | | | | | |
| | | | | |
| $ | 45 | | | American & Axle Manufacturing Inc. | | | 6.625% | | | | 10/15/22 | | | | B+ | | | $ | 49,275 | |
| | | | | |
| | 50 | | | Stackpole International Intermediate Company, 144A | | | 7.750% | | | | 10/15/21 | | | | B+ | | | | 52,250 | |
| | | | | |
| | 40 | | | TRW Automotive Inc., 144A | | | 4.450% | | | | 12/01/23 | | | | BBB– | | | | 41,000 | |
| | 135 | | | Total Auto Components | | | | | | | | | | | | | | | 142,525 | |
| | | | | |
| | | | Automobiles – 1.6% | | | | | | | | | | | | | | | | |
| | | | | |
| | 200 | EUR | | Fiat Finance & Trade SA | | | 7.000% | | | | 3/23/17 | | | | BB– | | | | 300,644 | |
| | | | | |
| | 30 | | | General Motors Financial Company Inc. | | | 4.250% | | | | 5/15/23 | | | | BB+ | | | | 29,963 | |
| | | | Total Automobiles | | | | | | | | | | | | | | | 330,607 | |
| | | | | |
| | | | Banks – 7.6% | | | | | | | | | | | | | | | | |
| | | | | |
| | 215 | | | Bank of America Corporation | | | 4.000% | | | | 4/01/24 | | | | A | | | | 219,414 | |
| | | | | |
| | 45 | | | CIT Group Inc. | | | 5.000% | | | | 8/01/23 | | | | BB | | | | 46,069 | |
| | | | | |
| | 95 | | | Citigroup Inc. | | | 4.500% | | | | 1/14/22 | | | | A | | | | 103,265 | |
| | | | | |
| | 30 | | | Citigroup Inc. | | | 6.125% | | | | 8/25/36 | | | | A– | | | | 34,356 | |
| | | | | |
| | 130 | | | General Electric Capital Corporation | | | 5.300% | | | | 2/11/21 | | | | AA | | | | 147,825 | |
| | | | | |
| | 25 | | | General Electric Capital Corporation | | | 6.875% | | | | 1/10/39 | | | | AA+ | | | | 33,582 | |
| | | | | |
| | 25 | | | HSBC Holdings PLC | | | 6.800% | | | | 6/01/38 | | | | A+ | | | | 31,897 | |
| | | | | | | | | | | | | | | | | | | | |
Principal
Amount (000) (3) | | | Description (1) | | Coupon | | | Maturity | | | Ratings (2) | | | Value | |
| | | | | |
| | | | Banks (continued) | | | | | | | | | | | | | | | | |
| | | | | |
| $ | 40 | | | JPMorgan Chase & Company | | | 3.375% | | | | 5/01/23 | | | | A | | | $ | 39,261 | |
| | | | | |
| | 45 | | | JPMorgan Chase & Company | | | 6.400% | | | | 5/15/38 | | | | A+ | | | | 57,120 | |
| | | | | |
| | 155 | | | JPMorgan Chase & Company | | | 6.750% | | | | 1/29/49 | | | | BBB | | | | 166,819 | |
| | | | | |
| | 35 | | | Royal Bank of Scotland Group PLC | | | 6.100% | | | | 6/10/23 | | | | BBB– | | | | 38,311 | |
| | | | | |
| | 200 | | | Santander UK PLC, 144A | | | 5.000% | | | | 11/07/23 | | | | A– | | | | 216,006 | |
| | | | | |
| | 200 | | | Societe Generale, 144A | | | 5.000% | | | | 1/17/24 | | | | BBB+ | | | | 209,167 | |
| | | | | |
| | 200 | | | State Bank of India London, 144A | | | 4.875% | | | | 4/17/24 | | | | BBB– | | | | 202,550 | |
| | | | | |
| | 25 | | | Wells Fargo & Company | | | 3.450% | | | | 2/13/23 | | | | A+ | | | | 24,878 | |
| | 1,465 | | | Total Banks | | | | | | | | | | | | | | | 1,570,520 | |
| | | | | |
| | | | Beverages – 1.0% | | | | | | | | | | | | | | | | |
| | | | | |
| | 200 | | | Coca-Cola Icecek AS, 144A | | | 4.750% | | | | 10/01/18 | | | | BBB | | | | 210,620 | |
| | | | | |
| | | | Building Products – 0.3% | | | | | | | | | | | | | | | | |
| | | | | |
| | 60 | | | Owens Corning Incorporated | | | 4.200% | | | | 12/15/22 | | | | BBB– | | | | 61,610 | |
| | | | | |
| | | | Capital Markets – 2.0% | | | | | | | | | | | | | | | | |
| | | | | |
| | 125 | | | Goldman Sachs Group, Inc. | | | 6.000% | | | | 6/15/20 | | | | A | | | | 145,701 | |
| | | | | |
| | 85 | | | Goldman Sachs Group, Inc. | | | 3.625% | | | | 1/22/23 | | | | A | | | | 85,366 | |
| | | | | |
| | 30 | | | Lazard Group LLC | | | 4.250% | | | | 11/14/20 | | | | BBB+ | | | | 31,431 | |
| | | | | |
| | 75 | | | Morgan Stanley Dean Witter & Company | | | 4.875% | | | | 11/01/22 | | | | BBB+ | | | | 80,506 | |
| | | | | |
| | 75 | | | Morgan Stanley | | | 3.750% | | | | 2/25/23 | | | | A | | | | 76,296 | |
| | 390 | | | Total Capital Markets | | | | | | | | | | | | | | | 419,300 | |
| | | | | |
| | | | Chemicals – 2.7% | | | | | | | | | | | | | | | | |
| | | | | |
| | 25 | | | Hexion US Finance | | | 6.625% | | | | 4/15/20 | | | | B1 | | | | 26,500 | |
| | | | | |
| | 25 | | | Huntsman International LLC, Convertible Bond, Series 2011 | | | 8.625% | | | | 3/15/21 | | | | B+ | | | | 27,625 | |
| | | | | |
| | 200 | | | Mexichem SAB de CV, 144A | | | 4.875% | | | | 9/19/22 | | | | BBB | | | | 208,000 | |
| | | | | |
| | 25 | | | Momentive Performance Materials Inc. | | | 8.875% | | | | 10/15/20 | | | | D | | | | 26,688 | |
| | | | | |
| | 200 | | | Office Cherifien Des Phosphates SA, 144A | | | 5.625% | | | | 4/25/24 | | | | BBB– | | | | 209,750 | |
| | | | | |
| | 50 | | | Taminco Global Chemical Corporation, 144A | | | 9.750% | | | | 3/31/20 | | | | B– | | | | 55,875 | |
| | 525 | | | Total Chemicals | | | | | | | | | | | | | | | 554,438 | |
| | | | | |
| | | | Consumer Finance – 1.0% | | | | | | | | | | | | | | | | |
| | | | | |
| | 100 | | | Capital One Bank | | | 3.375% | | | | 2/15/23 | | | | Baa1 | | | | 99,325 | |
| | | | | |
| | 75 | | | Discover Financial Services | | | 5.200% | | | | 4/27/22 | | | | BBB+ | | | | 83,238 | |
| | | | | |
| | 13 | | | First Data Corporation | | | 6.750% | | | | 11/01/20 | | | | BB– | | | | 14,073 | |
| | 188 | | | Total Consumer Finance | | | | | | | | | | | | | | | 196,636 | |
| | | | | |
| | | | Containers & Packaging – 0.2% | | | | | | | | | | | | | | | | |
| | | | | |
| | 50 | CAD | | Cascades Inc., 144A | | | 5.500% | | | | 7/15/21 | | | | Ba3 | | | | 46,800 | |
| | | | | |
| | | | Diversified Consumer Services – 0.1% | | | | | | | | | | | | | | | | |
| | | | | |
| | 20 | | | Nine West Holdings Incorporated, 144A | | | 8.250% | | | | 3/15/19 | | | | CCC | | | | 20,100 | |
Nuveen Global Total Return Bond Fund (continued)
Portfolio of Investments June 30, 2014
| | | | | | | | | | | | | | | | | | | | |
Principal
Amount (000) (3) | | | Description (1) | | Coupon | | | Maturity | | | Ratings (2) | | | Value | |
| | | | | |
| | | | Diversified Telecommunication Services – 1.5% | | | | | | | | | | | | | | | | |
| | | | | |
| $ | 25 | | | AT&T, Inc. | | | 5.550% | | | | 8/15/41 | | | | A | | | $ | 28,031 | |
| | | | | |
| | 35 | | | Brasil Telecom SA, 144A | | | 5.750% | | | | 2/10/22 | | | | Baa3 | | | | 34,930 | |
| | | | | |
| | 20 | | | CyrusOne LP Finance | | | 6.375% | | | | 11/15/22 | | | | B+ | | | | 21,550 | |
| | | | | |
| | 50 | | | IntelSat Jackson Holdings | | | 6.625% | | | | 12/15/22 | | | | B– | | | | 52,188 | |
| | | | | |
| | 65 | | | Qwest Corporation | | | 6.750% | | | | 12/01/21 | | | | BBB– | | | | 75,253 | |
| | | | | |
| | 55 | | | Verizon Communications | | | 5.150% | | | | 9/15/23 | | | | A– | | | | 61,550 | |
| | | | | |
| | 20 | | | Verizon Communications | | | 6.550% | | | | 9/15/43 | | | | A– | | | | 25,169 | |
| | | | | |
| | 20 | | | Windstream Corporation | | | 6.375% | | | | 8/01/23 | | | | BB | | | | 20,275 | |
| | 290 | | | Total Diversified Telecommunication Services | | | | | | | | | | | | | | | 318,946 | |
| | | | | |
| | | | Electric Utilities – 0.6% | | | | | | | | | | | | | | | | |
| | | | | |
| | 55 | | | APT Pipelines Limited, 144A | | | 3.875% | | | | 10/11/22 | | | | BBB | | | | 55,110 | |
| | | | | |
| | 25 | | | Constellation Energy Group | | | 5.150% | | | | 12/01/20 | | | | BBB+ | | | | 28,177 | |
| | | | | |
| | 50 | | | FirstEnergy Corporation | | | 4.250% | | | | 3/15/23 | | | | Baa3 | | | | 49,796 | |
| | 130 | | | Total Electric Utilities | | | | | | | | | | | | | | | 133,083 | |
| | | | | |
| | | | Energy Equipment & Services – 2.1% | | | | | | | | | | | | | | | | |
| | | | | |
| | 20 | | | Diamond Offshore Drilling Inc. | | | 5.700% | | | | 10/15/39 | | | | A | | | | 22,683 | |
| | | | | |
| | 25 | | | Gulfmark Offshore Inc. | | | 6.375% | | | | 3/15/22 | | | | BB– | | | | 26,000 | |
| | | | | |
| | 50 | | | Hercules Offshore LLC, 144A | | | 7.500% | | | | 10/01/21 | | | | B | | | | 49,625 | |
| | | | | |
| | 55 | | | Nabors Industries Inc. | | | 4.625% | | | | 9/15/21 | | | | BBB | | | | 59,575 | |
| | | | | |
| | 30 | | | Offshore Group Investment Limited | | | 7.500% | | | | 11/01/19 | | | | B– | | | | 31,725 | |
| | | | | |
| | 200 | | | Origin Energy Finance Limited, 144A | | | 3.500% | | | | 10/09/18 | | | | BBB | | | | 207,555 | |
| | | | | |
| | 25 | | | Weatherford International Limited | | | 7.000% | | | | 3/15/38 | | | | BBB– | | | | 31,049 | |
| | 405 | | | Total Energy Equipment & Services | | | | | | | | | | | | | | | 428,212 | |
| | | | | |
| | | | Gas Utilities – 0.1% | | | | | | | | | | | | | | | | |
| | | | | |
| | 25 | | | AmeriGas Finance LLC | | | 6.750% | | | | 5/20/20 | | | | Ba2 | | | | 27,125 | |
| | | | | |
| | | | Hotels, Restaurants & Leisure – 0.1% | | | | | | | | | | | | | | | | |
| | | | | |
| | 25 | | | Shearer’s Foods LLC, 144A | | | 9.000% | | | | 11/01/19 | | | | B1 | | | | 27,375 | |
| | | |
| | | | Independent Power & Renewable Electricity Producers – 0.1% | | | | | | | | | |
| | | | | |
| | 20 | | | Genon Energy Inc. | | | 9.500% | | | | 10/15/18 | | | | B | | | | 21,950 | |
| | | | | |
| | | | Industrial Conglomerates – 1.0% | | | | | | | | | | | | | | | | |
| | | | | |
| | 200 | | | Alfa SAB de CV, 144A | | | 5.250% | | | | 3/25/24 | | | | BBB– | | | | 208,700 | |
| | | | | |
| | | | Insurance – 0.4% | | | | | | | | | | | | | | | | |
| | | | | |
| | 50 | | | Genworth Holdings Inc. | | | 4.800% | | | | 2/15/24 | | | | BBB– | | | | 53,429 | |
| | | | | |
| | 30 | | | Liberty Mutual Group Inc., 144A | | | 4.950% | | | | 5/01/22 | | | | BBB | | | | 32,813 | |
| | 80 | | | Total Insurance | | | | | | | | | | | | | | | 86,242 | |
| | | | | |
| | | | Machinery – 0.8% | | | | | | | | | | | | | | | | |
| | | | | |
| | 55 | | | Eaton Corporation | | | 4.150% | | | | 11/01/42 | | | | A– | | | | 53,218 | |
| | | | | |
| | 50 | | | Ingersoll Rand | | | 5.750% | | | | 6/15/43 | | | | BBB | | | | 58,261 | |
| | | | | | | | | | | | | | | | | | | | |
Principal
Amount (000) (3) | | | Description (1) | | Coupon | | | Maturity | | | Ratings (2) | | | Value | |
| | | | | |
| | | | Machinery (continued) | | | | | | | | | | | | | | | | |
| | | | | |
| $ | 40 | | | Terex Corporation | | | 6.000% | | | | 5/15/21 | | | | BB | | | $ | 43,100 | |
| | 145 | | | Total Machinery | | | | | | | | | | | | | | | 154,579 | |
| | | | | |
| | | | Media – 1.7% | | | | | | | | | | | | | | | | |
| | | | | |
| | 20 | | | Cequel Communication Holdings I, 144A | | | 5.125% | | | | 12/15/21 | | | | B– | | | | 19,925 | |
| | | | | |
| | 20 | | | Comcast Corporation | | | 6.400% | | | | 5/15/38 | | | | A– | | | | 25,490 | |
| | | | | |
| | 55 | | | DIRECTV Holdings LLC | | | 3.800% | | | | 3/15/22 | | | | BBB | | | | 56,792 | |
| | | | | |
| | 50 | | | Gannett Company Inc., 144A | | | 5.125% | | | | 7/15/20 | | | | BB+ | | | | 51,312 | |
| | | | | |
| | 30 | | | NBC Universal Media LLC | | | 4.375% | | | | 4/01/21 | | | | A– | | | | 33,106 | |
| | | | | |
| | 70 | | | News America Holdings Inc. | | | 6.650% | | | | 11/15/37 | | | | BBB+ | | | | 88,882 | |
| | | | | |
| | 45 | | | SES SA, 144A | | | 3.600% | | | | 4/04/23 | | | | BBB | | | | 45,503 | |
| | | | | |
| | 25 | CAD | | Videotron Limited, 144A | | | 5.625% | | | | 6/15/25 | | | | BB | | | | 23,781 | |
| | | | Total Media | | | | | | | | | | | | | | | 344,791 | |
| | | | | |
| | | | Metals & Mining – 4.3% | | | | | | | | | | | | | | | | |
| | | | | |
| | 105 | | | Alcoa Inc. | | | 5.400% | | | | 4/15/21 | | | | BBB– | | | | 113,904 | |
| | | | | |
| | 45 | | | Allegheny Technologies Inc. | | | 5.875% | | | | 8/15/23 | | | | BBB– | | | | 49,359 | |
| | | | | |
| | 25 | | | Anglogold Holdings PLC | | | 6.500% | | | | 4/15/40 | | | | Baa3 | | | | 23,996 | |
| | | | | |
| | 55 | | | ArcelorMittal | | | 6.750% | | | | 2/25/22 | | | | BB+ | | | | 61,600 | |
| | | | | |
| | 35 | | | Century Aluminum Company, 144A | | | 7.500% | | | | 6/01/21 | | | | B | | | | 36,925 | |
| | | | | |
| | 70 | | | Cliffs Natural Resources Inc. | | | 4.800% | | | | 10/01/20 | | | | BBB– | | | | 68,500 | |
| | | | | |
| | 25 | | | Coeur d’Alene Mines Corporation, Convertible Bond | | | 7.875% | | | | 2/01/21 | | | | B+ | | | | 25,125 | |
| | | | | |
| | 25 | | | First Quantum Minerals Limited, 144A | | | 6.750% | | | | 2/15/20 | | | | BB | | | | 25,750 | |
| | | | | |
| | 25 | | | First Quantum Minerals Limited, 144A | | | 7.000% | | | | 2/15/21 | | | | BB | | | | 25,719 | |
| | | | | |
| | 50 | | | FMG Resources, 144A | | | 8.250% | | | | 11/01/19 | | | | BB+ | | | | 54,438 | |
| | | | | |
| | 75 | | | Freeport McMoRan, Inc. | | | 3.550% | | | | 3/01/22 | | | | BBB | | | | 74,273 | |
| | | | | |
| | 65 | | | Newmont Mining Corporation | | | 3.500% | | | | 3/15/22 | | | | BBB | | | | 62,669 | |
| | | | | |
| | 35 | | | Teck Resources Limited | | | 6.250% | | | | 7/15/41 | | | | BBB | | | | 37,996 | |
| | | | | |
| | 25 | | | Vale Overseas Limited | | | 6.875% | | | | 11/10/39 | | | | A– | | | | 27,764 | |
| | | | | |
| | 35 | | | WPE International Cooperatief U.A, 144A | | | 10.375% | | | | 9/30/20 | | | | B+ | | | | 18,375 | |
| | | | | |
| | 80 | | | Xstrata Finance Canada Limited, 144A | | | 3.600% | | | | 1/15/17 | | | | BBB | | | | 83,933 | |
| | | | | |
| | 100 | | | Yamana Gold Inc., 144A | | | 4.950% | | | | 7/15/24 | | | | Baa3 | | | | 100,658 | |
| | 875 | | | Total Metals & Mining | | | | | | | | | | | | | | | 890,984 | |
| | | | | |
| | | | Oil, Gas & Consumable Fuels – 7.0% | | | | | | | | | | | | | | | | |
| | | | | |
| | 50 | | | Amerada Hess Corporation | | | 7.125% | | | | 3/15/33 | | | | BBB | | | | 66,359 | |
| | | | | |
| | 50 | | | Anadarko Petroleum Corporation | | | 6.200% | | | | 3/15/40 | | | | BBB– | | | | 63,047 | |
| | | | | |
| | 80 | | | Apache Corporation | | | 4.250% | | | | 1/15/44 | | | | A– | | | | 78,679 | |
| | | | | |
| | 30 | CAD | | Athabasca Oil Corporation, 144A | | | 7.500% | | | | 11/19/17 | | | | B | | | | 28,712 | |
| | | | | |
| | 25 | | | Atlas Pipeline LP Finance | | | 5.875% | | | | 8/01/23 | | | | B+ | | | | 25,438 | |
| | | | | |
| | 25 | | | Bill Barrett Corporation | | | 7.000% | | | | 10/15/22 | | | | B1 | | | | 26,500 | |
Nuveen Global Total Return Bond Fund (continued)
Portfolio of Investments June 30, 2014
| | | | | | | | | | | | | | | | | | | | |
Principal
Amount (000) (3) | | | Description (1) | | Coupon | | | Maturity | | | Ratings (2) | | | Value | |
| | | | | |
| | | | Oil, Gas & Consumable Fuels (continued) | | | | | | | | | | | | | | | | |
| | | | | |
| $ | 25 | | | Calumet Specialty Products | | | 7.625% | | | | 1/15/22 | | | | B+ | | | $ | 26,875 | |
| | | | | |
| | 30 | | | Cenovus Energy Inc. | | | 3.800% | | | | 9/15/23 | | | | BBB+ | | | | 30,926 | |
| | | | | |
| | 200 | | | CNOOC Finance 2014 ULC | | | 4.250% | | | | 4/30/24 | | | | AA– | | | | 205,065 | |
| | | | | |
| | 5 | | | Concho Resources Inc. | | | 5.500% | | | | 10/01/22 | | | | BB+ | | | | 5,381 | |
| | | | | |
| | 30 | | | Key Energy Services Inc. | | | 6.750% | | | | 3/01/21 | | | | BB– | | | | 31,200 | |
| | | | | |
| | 25 | | | Kodiak Oil and Gas Corporation | | | 5.500% | | | | 2/01/22 | | | | B | | | | 25,938 | |
| | | | | |
| | 20 | | | Linn Energy LLC Finance Corporation | | | 6.250% | | | | 11/01/19 | | | | B+ | | | | 20,950 | |
| | | | | |
| | 25 | | | Martin Mid-Stream Partners LP Finance | | | 7.250% | | | | 2/15/21 | | | | B– | | | | 26,500 | |
| | | | | |
| | 20 | CAD | | Paramount Resources Limited, 144A | | | 7.625% | | | | 12/04/19 | | | | B | | | | 20,008 | |
| | | | | |
| | 25 | | | PBF Holding Company LLC | | | 8.250% | | | | 2/15/20 | | | | BB+ | | | | 27,250 | |
| | | | | |
| | 100 | | | Petrobras Global Finance BV | | | 6.250% | | | | 3/17/24 | | | | Baa1 | | | | 106,440 | |
| | | | | |
| | 25 | | | Petrobras International Finance Company | | | 5.375% | | | | 1/27/21 | | | | Baa1 | | | | 26,056 | |
| | | | | |
| | 50 | | | Petrobras International Finance Company | | | 6.875% | | | | 1/20/40 | | | | Baa1 | | | | 52,375 | |
| | | | | |
| | 25 | | | Sandridge Energy Inc. | | | 8.125% | | | | 10/15/22 | | | | B2 | | | | 27,531 | |
| | | | | |
| | 200 | | | Sinopec Group Overseas Development 2012, 144A | | | 3.900% | | | | 5/17/22 | | | | Aa3 | | | | 203,042 | |
| | | | | |
| | 200 | | | Thai Oil PCL, 144A | | | 3.625% | | | | 1/23/23 | | | | Baa1 | | | | 191,214 | |
| | | | | |
| | 85 | | | Transocean Inc. | | | 3.800% | | | | 10/15/22 | | | | BBB– | | | | 84,126 | |
| | | | | |
| | 50 | | | Western Refining Inc. | | | 6.250% | | | | 4/01/21 | | | | B+ | | | | 52,250 | |
| | | | Total Oil, Gas & Consumable Fuels | | | | | | | | | | | | | | | 1,451,862 | |
| | | | | |
| | | | Paper & Forest Products – 0.8% | | | | | | | | | | | | | | | | |
| | | | | |
| | 25 | | | Domtar Corporation | | | 4.400% | | | | 4/01/22 | | | | BBB– | | | | 25,738 | |
| | | | | |
| | 80 | | | Domtar Corporation | | | 6.750% | | | | 2/15/44 | | | | BBB– | | | | 95,358 | |
| | | | | |
| | 50 | | | Resolute Forest Products | | | 5.875% | | | | 5/15/23 | | | | BB– | | | | 49,250 | |
| | 155 | | | Total Paper & Forest Products | | | | | | | | | | | | | | | 170,346 | |
| | | | | |
| | | | Personal Products – 0.2% | | | | | | | | | | | | | | | | |
| | | | | |
| | 30 | | | International Paper Company | | | 8.700% | | | | 6/15/38 | | | | BBB | | | | 45,172 | |
| | | | | |
| | | | Real Estate Investment Trust – 1.6% | | | | | | | | | | | | | | | | |
| | | | | |
| | 70 | | | American Tower Company | | | 5.000% | | | | 2/15/24 | | | | BBB | | | | 76,029 | |
| | | | | |
| | 50 | | | ARC Property Operating Partnership LP, Clark Acquisition LLC, 144A | | | 4.600% | | | | 2/06/24 | | | | BBB– | | | | 51,276 | |
| | | | | |
| | 75 | | | Digital Realty Trust Inc. | | | 3.625% | | | | 10/01/22 | | | | BBB | | | | 71,433 | |
| | | | | |
| | 80 | | | HCP Inc. | | | 3.750% | | | | 2/01/19 | | | | BBB+ | | | | 85,244 | |
| | | | | |
| | 15 | | | Prologis Inc. | | | 6.875% | | | | 3/15/20 | | | | BBB+ | | | | 18,022 | |
| | | | | |
| | 20 | | | Simon Property Group, L.P. | | | 5.650% | | | | 2/01/20 | | | | A | | | | 23,366 | |
| | 310 | | | Total Real Estate Investment Trust | | | | | | | | | | | | | | | 325,370 | |
| | | | | |
| | | | Road & Rail – 0.2% | | | | | | | | | | | | | | | | |
| | | | | |
| | 30 | | | Hertz Corporation | | | 7.375% | | | | 1/15/21 | | | | B | | | | 32,550 | |
| | | | | | | | | | | | | | | | | | | | |
Principal
Amount (000) (3) | | | Description (1) | | Coupon | | | Maturity | | | Ratings (2) | | | Value | |
| | | | | |
| | | | Software – 0.5% | | | | | | | | | | | | | | | | |
| | | | | |
| $ | 25 | | | BMC Software Finance Inc., 144A | | | 8.125% | | | | 7/15/21 | | | | CCC+ | | | $ | 25,719 | |
| | | | | |
| | 75 | | | Computer Sciences Corporation | | | 4.450% | | | | 9/15/22 | | | | BBB+ | | | | 78,641 | |
| | 100 | | | Total Software | | | | | | | | | | | | | | | 104,360 | |
| | | | | |
| | | | Specialty Retail – 0.2% | | | | | | | | | | | | | | | | |
| | | | | |
| | 35 | | | Swiss Re Treasury US Corporation, 144A | | | 4.250% | | | | 12/06/42 | | | | AA– | | | | 33,714 | |
| | | | | |
| | | | Tobacco – 0.6% | | | | | | | | | | | | | | | | |
| | | | | |
| | 100 | | | Altria Group Inc. | | | 2.850% | | | | 8/09/22 | | | | BBB+ | | | | 96,229 | |
| | | | | |
| | 30 | | | Reynolds American Inc. | | | 3.250% | | | | 11/01/22 | | | | Baa2 | | | | 28,943 | |
| | 130 | | | Total Tobacco | | | | | | | | | | | | | | | 125,172 | |
| | | | | |
| | | | Transportation Infrastructure – 0.2% | | | | | | | | | | | | | | | | |
| | | | | |
| | 35 | | | Asciano Finance, 144A | | | 5.000% | | | | 4/07/18 | | | | Baa2 | | | | 38,111 | |
| | | |
| | | | Wireless Telecommunication Services – 2.1% | | | | | | | | | |
| | | | | |
| | 150 | | | Deutsche Telekom International Finance BV, 144A | | | 4.875% | | | | 3/06/42 | | | | BBB+ | | | | 156,900 | |
| | | | | |
| | 200 | | | Softbank Corporation, 144A | | | 4.500% | | | | 4/15/20 | | | | BB+ | | | | 203,248 | |
| | | | | |
| | 50 | | | Sprint Corporation, 144A | | | 7.250% | | | | 9/15/21 | | | | BB– | | | | 55,125 | |
| | | | | |
| | 28 | | | Viacom Inc. | | | 4.375% | | | | 3/15/43 | | | | BBB+ | | | | 25,992 | |
| $ | 428 | | | Total Wireless Telecommunication Services | | | | | | | | | | | | | | | 441,265 | |
| | | | Total Corporate Bonds (cost $8,553,445) | | | | | | | | | | | | | | | 8,963,065 | |
| | | | | |
Principal
Amount (000) | | | Description (1) | | Coupon | | | Maturity | | | Ratings (2) | | | Value | |
| | | | | |
| | | | CONVERTIBLE BONDS – 0.1% | | | | | | | | | | | | | | | | |
| | | | | |
| | | | Real Estate Investment Trust – 0.1% | | | | | | | | | | | | | | | | |
| | | | | |
| $ | 20 | | | Boston Properties Limited Partnership | | | 4.125% | | | | 5/15/21 | | | | A– | | | $ | 21,235 | |
| $ | 20 | | | Total Convertible Bonds (cost $20,323) | | | | | | | | | | | | | | | 21,235 | |
| | | | | |
Principal
Amount (000) (3) | | | Description (1) | | Coupon | | | Maturity | | | Ratings (2) | | | Value | |
| | | |
| | | | $1,000 (PAR OR SIMILAR) INSTITUTIONAL PREFERRED – 3.3% | | | | | | | | | |
| | | | | |
| | | | Banks – 1.2% | | | | | | | | | | | | | | | | |
| | | | | |
| $ | 200 | | | Barclays PLC | | | 8.250% | | | | N/A (4) | | | | BB+ | | | $ | 212,000 | |
| | | | | |
| | 35 | | | Fifth Third Bancorp. | | | 5.100% | | | | N/A (4) | | | | BBB– | | | | 33,626 | |
| | 235 | | | Total Banks | | | | | | | | | | | | | | | 245,626 | |
| | | | | |
| | | | Capital Markets – 1.0% | | | | | | | | | | | | | | | | |
| | | | | |
| | 100 | EUR | | Baggot Securities Limited, 144A | | | 10.240% | | | | N/A (4) | | | | N/A | | | | 150,623 | |
| | | | | |
| | 75 | | | Goldman Sachs Capital II | | | 4.000% | | | | N/A (4) | | | | BB+ | | | | 60,000 | |
| | | | Total Capital Markets | | | | | | | | | | | | | | | 210,623 | |
| | | | | |
| | | | Diversified Financial Services – 0.2% | | | | | | | | | | | | | | | | |
| | | | | |
| | 30 | | | Rabobank Nederland, 144A | | | 11.000% | | | | N/A (4) | | | | A– | | | | 40,281 | |
Nuveen Global Total Return Bond Fund (continued)
Portfolio of Investments June 30, 2014
| | | | | | | | | | | | | | | | | | | | |
Principal
Amount (000) (3) | | | Description (1) | | Coupon | | | Maturity | | | Ratings (2) | | | Value | |
| | | | | |
| | | | Electric Utilities – 0.5% | | | | | | | | | | | | | | | | |
| | | | | |
| $ | 100 | | | Electricite de France, 144A | | | 5.250% | | | | N/A (4) | | | | A3 | | | $ | 102,013 | |
| | | | | |
| | | | Insurance – 0.4% | | | | | | | | | | | | | | | | |
| | | | | |
| | 25 | | | Genworth Financial Inc. | | | 6.150% | | | | 11/15/66 | | | | Ba1 | | | | 23,781 | |
| | | | | |
| | 50 | | | Prudential Financial Inc. | | | 5.200% | | | | 3/15/44 | | | | BBB+ | | | | 51,000 | |
| | 75 | | | Total Insurance | | | | | | | | | | | | | | | 74,781 | |
| | | | Total $1,000 (par or similar) Institutional Preferred (cost $663,813) | | | | | | | | 673,324 | |
| | | | | |
Principal
Amount (000) | | | Description (1) | | Coupon | | | Maturity | | | Ratings (2) | | | Value | |
| | | |
| | | | ASSET-BACKED AND MORTGAGE-BACKED SECURITIES – 5.9% | | | | | | | | | |
| | | | | |
| $ | 74 | | | Banc of America Alternative Loan Trust, Pass Through Certificates, Series 2006-6 | | | 6.000% | | | | 7/25/46 | | | | Caa3 | | | $ | 60,094 | |
| | | | | |
| | 77 | | | Countrywide Asset Backed Certificates, Series 2007-4 A2 | | | 5.530% | | | | 4/25/47 | | | | Caa1 | | | | 73,997 | |
| | | | | |
| | 42 | | | Countrywide Home Loans Mortgage, Series 2005-27 | | | 5.500% | | | | 12/25/35 | | | | Caa1 | | | | 39,382 | |
| | | | | |
| | 145 | | | Fannie Mae TBA Mortgage Pool, (WI/DD) | | | 4.500% | | | | TBA | | | | Aaa | | | | 157,031 | |
| | | | | |
| | 630 | | | Fannie Mae TBA Mortgage Pool, (WI/DD) | | | 4.000% | | | | TBA | | | | Aaa | | | | 668,588 | |
| | | | | |
| | 40 | | | Freddie Mac Mortgage Trust, Multifamily Mortgage Pass-Through Certificates, Series 2013-K712 | | | 3.483% | | | | 5/25/45 | | | | Aaa | | | | 40,952 | |
| | | | | |
| | 180 | | | Holmes Master Issuer PLC, Residential Mortgage Pool, Series 2012-1A, 144A | | | 1.876% | | | | 10/15/54 | | | | AAA | | | | 181,725 | |
| $ | 1,188 | | | Total Asset-Backed and Mortgage-Backed Securities (cost $1,216,926) | | | | | | | | 1,221,769 | |
| | | | | |
Principal
Amount (000) (3) | | | Description (1) | | Coupon | | | Maturity | | | Ratings (2) | | | Value | |
| | | | | |
| | | | SOVEREIGN DEBT – 43.3% | | | | | | | | | | | | | | | | |
| | | | | |
| | | | Bermuda – 0.5% | | | | | | | | | | | | | | | | |
| | | | | |
| $ | 100 | | | Bermuda Government, 144A | | | 5.603% | | | | 7/20/20 | | | | AA– | | | $ | 111,500 | |
| | | | | |
| | | | Brazil – 1.1% | | | | | | | | | | | | | | | | |
| | | | | |
| | 600 | BRL | | Letra De Tesouro Nacional de Brazil | | | 0.000% | | | | 1/01/16 | | | | BBB+ | | | | 230,970 | |
| | | | | |
| | | | Canada – 0.7% | | | | | | | | | | | | | | | | |
| | | | | |
| | 150 | CAD | | Province of Ontario | | | 4.200% | | | | 3/08/18 | | | | Aa2 | | | | 153,153 | |
| | | | | |
| | | | Germany – 4.1% | | | | | | | | | | | | | | | | |
| | | | | |
| | 150 | EUR | | Bundesobligation | | | 1.750% | | | | 2/15/24 | | | | Aaa | | | | 215,513 | |
| | | | | |
| | 150 | EUR | | Deutschland Republic | | | 1.500% | | | | 5/15/24 | | | | Aaa | | | | 210,131 | |
| | | | | |
| | 290 | EUR | | Deutschland Republic | | | 2.500% | | | | 8/15/46 | | | | Aaa | | | | 425,053 | |
| | 590 | EUR | | Total Germany | | | | | | | | | | | | | | | 850,697 | |
| | | | | |
| | | | Greece – 0.8% | | | | | | | | | | | | | | | | |
| | | | | |
| | 120 | EUR | | Hellenic Republic | | | 4.750% | | | | 4/17/19 | | | | B | | | | 167,885 | |
| | | | | |
| | | | Indonesia – 0.5% | | | | | | | | | | | | | | | | |
| | | | | |
| | 100 | | | Republic of Indonesia, 144A | | | 5.875% | | | | 3/13/20 | | | | Baa3 | | | | 111,000 | |
| | | | | | | | | | | | | | | | | | | | |
Principal
Amount (000) (3) | | | Description (1) | | Coupon | | | Maturity | | | Ratings (2) | | | Value | |
| | | | | |
| | | | Malaysia – 1.5% | | | | | | | | | | | | | | | | |
| | | | | |
| | 1,000 | MYR | | Republic of Malaysia | | | 3.172% | | | | 7/15/16 | | | | A | | | $ | 310,690 | |
| | | | | |
| | | | Mexico – 11.1% | | | | | | | | | | | | | | | | |
| | | | | |
| | 2,000 | MXN | | Mexico Bonos de DeSarrollo | | | 8.000% | | | | 12/17/15 | | | | A | | | | 164,576 | |
| | | | | |
| | 9,000 | MXN | | Mexico Bonos de DeSarrollo | | | 4.750% | | | | 6/14/18 | | | | A | | | | 701,664 | |
| | | | | |
| | 8,650 | MXN | | Mexico Bonos de DeSarrollo | | | 8.000% | | | | 12/07/23 | | | | A | | | | 778,950 | |
| | | | | |
| | 3,825 | MXN | | Mexico Bonos de DeSarrollo | | | 7.750% | | | | 11/13/42 | | | | A | | | | 333,869 | |
| | | | | |
| | 4,000 | MXN | | United Mexican States | | | 9.500% | | | | 12/18/14 | | | | A | | | | 317,307 | |
| | 27,475 | MXN | | Total Mexico | | | | | | | | | | | | | | | 2,296,366 | |
| | | | | |
| | | | Norway – 1.0% | | | | | | | | | | | | | | | | |
| | | | | |
| | 1,100 | NOK | | Norwegian Government Bond | | | 3.750% | | | | 5/25/21 | | | | AAA | | | | 198,610 | |
| | | | | |
| | | | Poland – 3.3% | | | | | | | | | | | | | | | | |
| | | | | |
| | 850 | PLN | | Republic of Poland | | | 2.500% | | | | 7/25/18 | | | | A | | | | 275,972 | |
| | | | | |
| | 500 | PLN | | Republic of Poland | | | 5.750% | | | | 9/23/22 | | | | A | | | | 192,466 | |
| | | | | |
| | 600 | PLN | | Republic of Poland | | | 4.000% | | | | 10/25/23 | | | | A | | | | 206,065 | |
| | 1,950 | PLN | | Total Poland | | | | | | | | | | | | | | | 674,503 | |
| | | | | |
| | | | Portugal – 2.2% | | | | | | | | | | | | | | | | |
| | | | | |
| | 200 | EUR | | Portugal Obrigacoes do Tesouro | | | 4.750% | | | | 6/14/19 | | | | Ba1 | | | | 303,651 | |
| | | | | |
| | 100 | EUR | | Portugal Obrigacoes do Tesouro | | | 5.650% | | | | 2/15/24 | | | | Ba1 | | | | 158,710 | |
| | 300 | EUR | | Total Portugal | | | | | | | | | | | | | | | 462,361 | |
| | | | | |
| | | | Romania – 0.6% | | | | | | | | | | | | | | | | |
| | | | | |
| | 100 | | | Republic of Romania, 144A | | | 6.125% | | | | 1/22/44 | | | | BBB– | | | | 113,635 | |
| | | | | |
| | | | South Africa – 4.6% | | | | | | | | | | | | | | | | |
| | | | | |
| | 3,800 | ZAR | | Republic of South Africa | | | 7.250% | | | | 1/15/20 | | | | BBB+ | | | | 348,585 | |
| | | | | |
| | 4,900 | ZAR | | Republic of South Africa | | | 6.750% | | | | 3/31/21 | | | | Baa1 | | | | 431,642 | |
| | | | | |
| | 1,500 | ZAR | | Republic of South Africa | | | 10.500% | | | | 12/21/26 | | | | BBB+ | | | | 164,504 | |
| | 10,200 | ZAR | | Total South Africa | | | | | | | | | | | | | | | 944,731 | |
| | | | | |
| | | | Sweden – 0.8% | | | | | | | | | | | | | | | | |
| | | | | |
| | 1,000 | SEK | | Republic of Sweden | | | 3.500% | | | | 6/01/22 | | | | AAA | | | | 171,788 | |
| | | | | |
| | | | Turkey – 6.1% | | | | | | | | | | | | | | | | |
| | | | | |
| | 1,000 | TRY | | Republic of Turkey, Government Bond | | | 9.000% | | | | 3/08/17 | | | | BBB | | | | 481,209 | |
| | | | | |
| | 785 | TRY | | Republic of Turkey, Government Bond | | | 10.500% | | | | 1/15/20 | | | | BBB | | | | 402,949 | |
| | | | | |
| | 430 | TRY | | Republic of Turkey, Government Bond | | | 7.100% | | | | 3/08/23 | | | | BBB | | | | 183,987 | |
| | | | | |
| | 200 | | | Republic of Turkey, Government Bond | | | 4.875% | | | | 4/16/43 | | | | Baa3 | | | | 188,000 | |
| | | | Total Turkey | | | | | | | | | | | | | | | 1,256,145 | |
| | | | | |
| | | | United Kingdom – 4.4% | | | | | | | | | | | | | | | | |
| | | | | |
| | 270 | GBP | | United Kingdom Gilt | | | 1.250% | | | | 7/22/18 | | | | Aa1 | | | | 452,250 | |
Nuveen Global Total Return Bond Fund (continued)
Portfolio of Investments June 30, 2014
| | | | | | | | | | | | | | | | | | | | |
Principal
Amount (000) (3) | | | Description (1) | | Coupon | | | Maturity | | | Ratings (2) | | | Value | |
| | | | | |
| | | | United Kingdom (continued) | | | | | | | | | | | | | | | | |
| | | | | |
| | 250 | GBP | | United Kingdom, Treasury Bill | | | 3.750% | | | | 9/07/19 | | | | AAA | | | $ | 464,187 | |
| | 520 | GBP | | Total United Kingdom | | | | | | | | | | | | | | | 916,437 | |
| | | | Total Sovereign Debt (cost $9,174,786) | | | | | | | | | | | | | | | 8,970,471 | |
| | | | Total Long-Term Investments (cost $19,985,481) | | | | | | | | 20,252,351 | |
| | | | | |
Principal
Amount (000) | | | Description (1) | | Coupon | | | Maturity | | | | | | Value | |
| | | | | |
| | | | SHORT-TERM INVESTMENTS – 6.4% | | | | | | | | | | | | | | | | |
| | | | | |
| | | | Repurchase Agreements – 6.4% | | | | | | | | | | | | | | | | |
| | | | | |
| $ | 1,328 | | | Repurchase Agreement with Fixed Income Clearing Corporation, dated 6/30/14, repurchase price $1,328,478, collateralized by $1,295,000 U.S. Treasury Notes, 2.625%, due 8/15/20, value $1,359,750 | | | 0.000% | | | | 7/01/14 | | | | | | | $ | 1,328,478 | |
| | | | Total Short-Term Investments (cost $1,328,478) | | | | | | | | 1,328,478 | |
| | | | Total Investments (cost $21,313,959) – 104.2% | | | | | | | | 21,580,829 | |
| | | | Other Assets Less Liabilities – (4.2)% (5) | | | | | | | | | | | | | | | (869,423 | ) |
| | | | Net Assets – 100% | | | | | | | | | | | | | | $ | 20,711,406 | |
Investments in Derivatives as of June 30, 2014
Forward Foreign Currency Exchange Contracts outstanding:
| | | | | | | | | | | | | | | | | | | | | | |
| Counterparty | | Currency Contracts to Deliver | | Amount
(Local Currency) | | | In Exchange
For Currency | | | Amount
(Local Currency) | | | Settlement
Date | | | Unrealized
Appreciation
(Depreciation)
(U.S. Dollars) (5) | |
| Barclays Bank PLC | | Polish Zloty | | | 825,000 | | | | U.S. Dollar | | | | 269,600 | | | | 8/29/14 | | | $ | (1,064 | ) |
| BNP Paribas | | Euro | | | 996,500 | | | | U.S. Dollar | | | | 1,365,888 | | | | 7/31/14 | | | | 1,231 | |
| Citigroup | | Euro | | | 170,000 | | | | U.S. Dollar | | | | 232,994 | | | | 7/31/14 | | | | 188 | |
| Citigroup | | Euro | | | 300,000 | | | | U.S. Dollar | | | | 408,368 | | | | 7/31/14 | | | | (2,467 | ) |
| Citigroup | | Swedish Krona | | | 1,090,000 | | | | U.S. Dollar | | | | 163,000 | | | | 8/29/14 | | | | (34 | ) |
| Citigroup | | U.S. Dollar | | | 326,043 | | | | Australian Dollar | | | | 350,000 | | | | 7/31/14 | | | | 3,306 | |
| Citigroup | | U.S. Dollar | | | 69,558 | | | | Euro | | | | 51,000 | | | | 7/31/14 | | | | 284 | |
| Citigroup | | U.S. Dollar | | | 733,770 | | | | Mexican Peso | | | | 9,630,000 | | | | 8/14/14 | | | | 6,312 | |
| Citigroup | | U.S. Dollar | | | 1,022,310 | | | | Pound Sterling | | | | 600,000 | | | | 8/18/14 | | | | 4,150 | |
| Credit Suisse | | Malaysian Ringgit | | | 1,014,000 | | | | U.S. Dollar | | | | 314,438 | | | | 7/22/14 | | | | (1,262 | ) |
| Credit Suisse | | Norwegian Krone | | | 1,167,000 | | | | U.S. Dollar | | | | 193,883 | | | | 8/29/14 | | | | 4,040 | |
| Credit Suisse | | Norwegian Krone | | | 50,000 | | | | U.S. Dollar | | | | 8,125 | | | | 8/29/14 | | | | (9 | ) |
| Credit Suisse | | U.S. Dollar | | | 402,235 | | | | Brazilian Real | | | | 900,000 | | | | 7/02/14 | | | | 5,097 | |
| Goldman Sachs | | Pound Sterling | | | 542,000 | | | | U.S. Dollar | | | | 907,723 | | | | 7/31/14 | | | | (19,646 | ) |
| Goldman Sachs | | U.S. Dollar | | | 608,047 | | | | Pound Sterling | | | | 360,000 | | | | 7/31/14 | | | | 7,918 | |
| Goldman Sachs | | U.S. Dollar | | | 623,901 | | | | Pound Sterling | | | | 370,000 | | | | 7/31/14 | | | | 9,173 | |
| JPMorgan | | U.S. Dollar | | | 987,106 | | | | Malaysian Ringgit | | | | 3,200,000 | | | | 8/12/14 | | | | 8,557 | |
| JPMorgan | | U.S. Dollar | | | 402,626 | | | | Indonesian Rupiah | | | | 4,600,000,000 | | | | 8/20/14 | | | | (17,288 | ) |
| JPMorgan | | U.S. Dollar | | | 218,310 | | | | South African Rand | | | | 2,340,000 | | | | 8/29/14 | | | | (379 | ) |
| Morgan Stanley | | Canadian Dollar | | | 265,000 | | | | U.S. Dollar | | | | 241,065 | | | | 7/09/14 | | | | (7,241 | ) |
| Morgan Stanley | | Canadian Dollar | | | 50,000 | | | | U.S. Dollar | | | | 45,695 | | | | 7/09/14 | | | | (1,155 | ) |
| Morgan Stanley | | Turkish Lira | | | 1,300,000 | | | | U.S. Dollar | | | | 597,972 | | | | 8/01/14 | | | | (11,684 | ) |
| Morgan Stanley | | U.S. Dollar | | | 22,895 | | | | Canadian Dollar | | | | 25,000 | | | | 7/09/14 | | | | 530 | |
| Morgan Stanley | | U.S. Dollar | | | 193,973 | | | | Turkish Lira | | | | 410,000 | | | | 8/01/14 | | | | (1,697 | ) |
| Nomura Securities | | Brazilian Real | | | 1,795,000 | | | | U.S. Dollar | | | | 811,483 | | | | 7/02/14 | | | | (918 | ) |
| Nomura Securities | | U.S. Dollar | | | 399,197 | | | | Brazilian Real | | | | 895,000 | | | | 7/02/14 | | | | 5,872 | |
| Nomura Securities | | U.S. Dollar | | | 804,175 | | | | Brazilian Real | | | | 1,795,000 | | | | 8/04/14 | | | | 631 | |
| Nomura Securities | | U.S. Dollar | | | 954,778 | | | | New Zealand Dollar | | | | 1,100,000 | | | | 8/20/14 | | | | 3,987 | |
| | | | | | | | | | | | | | | | | | | | | $ | (3,568 | ) |
Interest Rate Swaps outstanding:
| | | | | | | | | | | | | | | | | | | | | | | | | | | | |
| Counterparty | | Notional
Amount | | | Fund
Pay/Receive
Floating Rate | | | Floating Rate Index | | | Fixed Rate
(Annualized) | | | Fixed Rate
Payment
Frequency | | | Termination
Date | | | Unrealized
Appreciation
(Depreciation) (5) | |
JPMorgan | | $ | 200,000 | | | | Receive | | | | 3-Month USD-LIBOR-BBA | | | | 2.078 | % | | | Semi-Annually | | | | 2/19/23 | | | $ | 4,330 | |
Morgan Stanley | | | 1,000,000 | | | | Receive | | | | 3-Month USD-LIBOR-BBA | | | | 2.095 | | | | Semi-Annually | | | | 3/19/23 | | | | 22,607 | |
| | | $ | 1,200,000 | | | | | | | | | | | | | | | | | | | | | | | $ | 26,937 | |
Futures Contracts outstanding:
| | | | | | | | | | | | | | | | | | | | |
| Description | | Contract
Position | | | Number of
Contracts | | | Contract
Expiration | | | Notional
Amount at
Value* | | | Unrealized
Appreciation
(Depreciation) | |
90-Day Eurodollar | | | Short | | | | (18 | ) | | | 6/16 | | | $ | (4,435,200 | ) | | $ | (5,157 | ) |
Euro-Bund | | | Long | | | | 3 | | | | 9/14 | | | | 603,903 | | | | 4,991 | |
U.S. Treasury 5-Year Note | | | Short | | | | (11 | ) | | | 9/14 | | | | (1,314,070 | ) | | | 4,127 | |
U.S. Treasury 10-Year Note | | | Short | | | | (6 | ) | | | 9/14 | | | | (751,031 | ) | | | (108 | ) |
U.S. Treasury Long Bond | | | Short | | | | (3 | ) | | | 9/14 | | | | (411,563 | ) | | | 2,702 | |
U.S. Treasury Ultra Bond | | | Short | | | | (3 | ) | | | 9/14 | | | | (449,813 | ) | | | 2,804 | |
| | | | | | | | | | | | | | | $ | (6,757,774 | ) | | $ | 9,359 | |
| * | Total aggregate Notional Amount at Value of long and short positions is $603,903 and $(7,361,677), respectively. |
| | For Fund portfolio compliance purposes, the Fund’s industry classifications refer to any one or more of the industry sub-classifications used by one or more widely recognized market indexes or ratings group indexes, and/or as defined by Fund management. This definition may not apply for purposes of this report, which may combine industry sub-classifications into sectors for reporting ease. |
| (1) | All percentages shown in the Portfolio of Investments are based on net assets. |
| (2) | Ratings (not covered by the report of independent registered public accounting firm): Using the highest of Standard & Poor’s Group (“Standard & Poor’s”), Moody’s Investors Service, Inc. (“Moody’s”) or Fitch, Inc. (“Fitch”) rating. Ratings below BBB by Standard & Poor’s, Baa by Moody’s or BBB by Fitch are considered to be below investment grade. Holdings designated N/R are not rated by any of these national rating agencies. |
| (3) | Principal Amount (000) denominated in U.S. Dollars, unless otherwise noted. |
| (4) | Perpetual security. Maturity date is not applicable. |
| (5) | Other Assets Less Liabilities includes the Unrealized Appreciation (Depreciation) of certain derivative instruments as listed within Investments in Derivatives as of the end of the reporting period. |
| TBA | To be announced. Maturity date not known prior to settlement of this transaction. |
| WI/DD | Investment, or portion of investment, purchased on a when-issued or delayed delivery basis |
| 144A | Investment is exempt from registration under Rule 144A of the Securities Act of 1933, as amended. These investments may only be resold in transactions exempt from registration, which are normally those transactions with qualified institutional buyers. |
| USD-LIBOR-BBA | United States Dollar-London Inter-Bank Offered Rate British Bankers’ Association. |
See accompanying notes to financial statements.
Nuveen High Income Bond Fund
Portfolio of Investments June 30, 2014
| | | | | | | | | | | | | | |
| Shares | | | Description (1) | | | | | | | | Value | |
| | | | | |
| | | | LONG-TERM INVESTMENTS – 96.6% | | | | | | | | | | |
| | | | | |
| | | | COMMON STOCKS – 1.7% | | | | | | | | | | |
| | | | | |
| | | | Airlines – 0.1% | | | | | | | | | | |
| | | | | |
| | 35,200 | | | Delta Air Lines, Inc. | | | | | | | | $ | 1,362,944 | |
| | | | | |
| | | | Building Products – 0.0% | | | | | | | | | | |
| | | | | |
| | 527 | | | Dayton Superior, Class A, (2), (3) | | | | | | | | | 30,195 | |
| | | | | |
| | 585 | | | Dayton Superior, Class 1, (2), (3) | | | | | | | | | 33,550 | |
| | | | Total Building Products | | | | | | | | | 63,745 | |
| | | | | |
| | | | Capital Markets – 0.2% | | | | | | | | | | |
| | | | | |
| | 52,412 | | | Adamas Finance Asia Limited, (2) | | | | | | | | | 4,193 | |
| | | | | |
| | 75,000 | | | Och-Ziff Capital Management Group, Class A Shares | | | | | | | | | 1,037,250 | |
| | | | | |
| | 67,000 | | | Prospect Capital Corporation | | | | | | | | | 711,875 | |
| | | | | |
| | 48,000 | | | Technology Investment Capital Corporation, (4) | | | | | | | | | 475,200 | |
| | | | Total Capital Markets | | | | | | | | | 2,228,518 | |
| | | | | |
| | | | Chemicals – 0.2% | | | | | | | | | | |
| | | | | |
| | 21,500 | | | LyondellBasell Industries NV | | | | | | | | | 2,099,475 | |
| | | | | |
| | | | Containers & Packaging – 0.2% | | | | | | | | | | |
| | | | | |
| | 21,400 | | | Packaging Corp. of America | | | | | | | | | 1,529,886 | |
| | | | | |
| | | | Media – 0.1% | | | | | | | | | | |
| | | | | |
| | 50,000 | | | Cablevision Systems Corporation | | | | | | | | | 882,500 | |
| | | | | |
| | | | Metals & Mining – 0.1% | | | | | | | | | | |
| | | | | |
| | 23,200 | | | Freeport-McMoRan, Inc. | | | | | | | | | 846,800 | |
| | | | | |
| | 499,059 | | | Northland Resources SA, (2) | | | | | | | | | 101,702 | |
| | | | Total Metals & Mining | | | | | | | | | 948,502 | |
| | | | | |
| | | | Multiline Retail – 0.0% | | | | | | | | | | |
| | | | | |
| | 7,000 | | | Target Corporation, (4) | | | | | | | | | 405,650 | |
| | | | | |
| | | | Oil, Gas & Consumable Fuels – 0.2% | | | | | | | | | | |
| | | | | |
| | 12,500 | | | Bonanza Creek Energy Inc., (2) | | | | | | | | | 714,875 | |
| | | | | |
| | 14,500 | | | Pembina Pipeline Corporation | | | | | | | | | 623,500 | |
| | | | | |
| | 87,000 | | | Pengrowth Energy Corporation | | | | | | | | | 624,660 | |
| | | | Total Oil, Gas & Consumable Fuels | | | | | | | | | 1,963,035 | |
| | | | | |
| | | | Real Estate Investment Trust – 0.4% | | | | | | | | | | |
| | | | | |
| | 15,500 | | | Camden Property Trust | | | | | | | | | 1,102,825 | |
| | | | | |
| | 48,700 | | | Colony Financial Inc. | | | | | | | | | 1,130,814 | |
| | | | | |
| | 24,400 | | | Mid-America Apartment Communities | | | | | | | | | 1,782,420 | |
| | | | Total Real Estate Investment Trust | | | | | | | | | 4,016,059 | |
| | | | | | | | | | | | | | | | | | | | |
| Shares | | | Description (1) | | | | | | | | | | | Value | |
| | | | | |
| | | | Road & Rail – 0.2% | | | | | | | | | | | | | | | | |
| | | | | |
| | 16,100 | | | Norfolk Southern Corporation | | | | | | | | | | | | | | $ | 1,658,783 | |
| | | | Total Common Stocks (cost $13,509,354) | | | | | | | | | | | | | | | 17,159,097 | |
| | | | | |
| Shares | | | Description (1), (5) | | | | | | | | | | | Value | |
| | | | | |
| | | | EXCHANGE-TRADED FUNDS – 0.9% | | | | | | | | | | | | | | | | |
| | | | | |
| | 50,000 | | | PowerShares S&P 500 Low Volatility Portfolio | | | | | | | | | | | | | | $ | 1,779,500 | |
| | | | | |
| | 210,000 | | | PowerShares Senior Loan Portfolio | | | | | | | | | | | | | | | 5,222,700 | |
| | | | | |
| | 35,000 | | | Vanguard FTSE Europe ETF | | | | | | | | | | | | | | | 2,098,250 | |
| | | | Total Exchange-Traded Funds (cost $8,989,336) | | | | | | | | 9,100,450 | |
| | | | | |
| Shares | | | Description (1) | | Coupon | | | | | | Ratings (6) | | | Value | |
| | | |
| | | | CONVERTIBLE PREFERRED SECURITIES – 0.4% | | | | | | | | | |
| | | | | |
| | | | Electric Utilities – 0.3% | | | | | | | | | | | | | | | | |
| | | | | |
| | 25,000 | | | Exelon Corporation | | | 6.500% | | | | | | | | BBB– | | | $ | 1,348,665 | |
| | | | | |
| | 20,000 | | | NextEra Energy Inc. | | | 5.889% | | | | | | | | BBB | | | | 1,299,800 | |
| | | | Total Electric Utilities | | | | | | | | | | | | | | | 2,648,465 | |
| | | | | |
| | | | Metals & Mining – 0.1% | | | | | | | | | | | | | | | | |
| | | | | |
| | 40,000 | | | ArcelorMittal | | | 6.000% | | | | | | | | BB– | | | | 899,600 | |
| | | | Total Convertible Preferred Securities (cost $3,106,976) | | | | | | | | 3,548,065 | |
| | | | | |
Principal
Amount (000) | | | Description (1) | | Coupon (8) | | | Maturity (7) | | | Ratings (6) | | | Value | |
| | | |
| | | | VARIABLE RATE SENIOR LOAN INTERESTS – 1.9% (8) | | | | | | | | | |
| | | | | |
| | | | Construction Materials – 0.2% | | | | | | | | | | | | | | | | |
| | | | | |
| $ | 2,500 | | | Atkore International Inc. | | | 7.750% | | | | 9/27/21 | | | | CCC+ | | | $ | 2,521,875 | |
| | | | | |
| | | | Health Care Providers & Services – 0.3% | | | | | | | | | | | | | | | | |
| | | | | |
| | 3,000 | | | RegionalCare Hospital Partners Inc., Second Lien Term Loan | | | 10.500% | | | | 10/21/19 | | | | CCC+ | | | | 2,985,939 | |
| | | | | |
| | | | Hotels, Restaurants & Leisure – 0.4% | | | | | | | | | | | | | | | | |
| | | | | |
| | 2,000 | | | Caesars Entertainment Corporation, Term Loan B5 | | | 4.402% | | | | 1/29/18 | | | | Caa2 | | | | 1,851,112 | |
| | | | | |
| | 1,985 | | | Rock Ohio Caesar LLC, Term Loan B | | | 5.000% | | | | 3/29/19 | | | | BB– | | | | 1,957,706 | |
| | 3,985 | | | Total Hotels, Restaurants & Leisure | | | | | | | | | | | | | | | 3,808,818 | |
| | | |
| | | | Independent Power & Renewable Electricity Producers – 0.2% | | | | | | | | | |
| | | | | |
| | 130 | | | Empire Generating Company LLC, Term Loan C | | | 5.250% | | | | 3/13/21 | | | | B+ | | | | 131,141 | |
| | | | | |
| | 1,870 | | | Empire Generating Company LLC | | | 5.250% | | | | 3/13/21 | | | | B+ | | | | 1,884,366 | |
| | 2,000 | | | Total Independent Power & Renewable Electricity Producers | | | | | | | | | | | | | | | 2,015,507 | |
| | | | | |
| | | | Oil, Gas & Consumable Fuels – 0.6% | | | | | | | | | | | | | | | | |
| | | | | |
| | 1,990 | | | Arch Coal Inc., Term Loan B | | | 6.250% | | | | 5/16/18 | | | | B+ | | | | 1,957,064 | |
| | | | | |
| | 2,493 | | | Fieldwood Energy LLC, Second Lien Term Loan | | | 8.375% | | | | 9/30/20 | | | | B2 | | | | 2,577,619 | |
| | | | | |
| | 1,000 | | | Samson Investment Company Second Lien Term Loan | | | 5.000% | | | | 9/25/18 | | | | B1 | | | | 1,002,054 | |
| | 5,483 | | | Total Oil, Gas & Consumable Fuels | | | | | | | | | | | | | | | 5,536,737 | |
Nuveen High Income Bond Fund (continued)
Portfolio of Investments June 30, 2014
| | | | | | | | | | | | | | | | | | | | |
Principal
Amount (000) | | | Description (1) | | Coupon (8) | | | Maturity (7) | | | Ratings (6) | | | Value | |
| | | | | |
| | | | Professional Services – 0.2% | | | | | | | | | | | | | | | | |
| | | | | |
| $ | 2,000 | | | Sedgwick Claims Management Service Inc., Second Lien Term Loan | | | 6.750% | | | | 2/11/22 | | | | CCC+ | | | $ | 1,996,876 | |
| $ | 18,968 | | | Total Variable Rate Senior Loan Interests (cost $18,631,880) | | | | | | | | 18,865,752 | |
| | | | | |
| Shares | | | Description (1) | | Coupon | | | | | | Ratings (6) | | | Value | |
| | | |
| | | | $25 PAR (OR SIMILAR) RETAIL PREFERRED – 5.5% | | | | | | | | | |
| | | | | |
| | | | Banks – 1.1% | | | | | | | | | | | | | | | | |
| | | | | |
| | 82,830 | | | Bank of America Corporation | | | 4.000% | | | | | | | | BB+ | | | $ | 1,771,734 | |
| | | | | |
| | 40,000 | | | HSBC USA Inc. | | | 4.000% | | | | | | | | BBB+ | | | | 934,400 | |
| | | | | |
| | 89,536 | | | HSBC USA Inc. | | | 0.980% | | | | | | | | BBB+ | | | | 2,027,095 | |
| | | | | |
| | 127,620 | | | RBS Capital Trust | | | 6.080% | | | | | | | | BB+ | | | | 3,075,642 | |
| | | | | |
| | 110,000 | | | Regions Financial Corporation | | | 6.375% | | | | | | | | BB | | | | 2,753,300 | |
| | | | | |
| | 35,000 | | | Royal Bank of Scotland Group PLC | | | 6.750% | | | | | | | | BB | | | | 871,850 | |
| | | | Total Banks | | | | | | | | | | | | | | | 11,434,021 | |
| | | | | |
| | | | Capital Markets – 0.8% | | | | | | | | | | | | | | | | |
| | | | | |
| | 152,330 | | | Morgan Stanley | | | 4.000% | | | | | | | | BB+ | | | | 3,081,636 | |
| | | | | |
| | 66,903 | | | Saratoga Investment Corporation, (18) | | | 7.500% | | | | | | | | N/R | | | | 1,697,329 | |
| | | | | |
| | 169,434 | | | UBS Preferred Funding Trust IV | | | 0.852% | | | | | | | | BBB | | | | 3,315,823 | |
| | | | Total Capital Markets | | | | | | | | | | | | | | | 8,094,788 | |
| | | | | |
| | | | Consumer Finance – 0.1% | | | | | | | | | | | | | | | | |
| | | | | |
| | 50,000 | | | Discover Financial Services | | | 6.500% | | | | | | | | BB | | | | 1,255,000 | |
| | | | | |
| | | | Household Durables – 0.1% | | | | | | | | | | | | | | | | |
| | | | | |
| | 65,624 | | | Hovnanian Enterprises Incorporated, (2) | | | 7.625% | | | | | | | | Caa2 | | | | 892,486 | |
| | | | | |
| | | | Insurance – 0.3% | | | | | | | | | | | | | | | | |
| | | | | |
| | 60,000 | | | AmTrust Financial Services Inc., (WI/DD), (2) | | | 7.250% | | | | | | | | N/R | | | | 1,489,200 | |
| | | | | |
| | 51,131 | | | Endurance Specialty Holdings Limited | | | 7.500% | | | | | | | | BBB– | | | | 1,346,279 | |
| | | | Total Insurance | | | | | | | | | | | | | | | 2,835,479 | |
| | | | | |
| | | | Marine – 0.2% | | | | | | | | | | | | | | | | |
| | | | | |
| | 70,000 | | | Safe Bulkers Inc. | | | 8.000% | | | | | | | | N/R | | | | 1,766,100 | |
| | | | | |
| | | | Multi-Utilities – 0.1% | | | | | | | | | | | | | | | | |
| | | | | |
| | 17,000 | | | Dominion Resources Inc. | | | 6.375% | | | | | | | | BBB | | | | 894,625 | |
| | | | | |
| | | | Oil, Gas & Consumable Fuels – 0.3% | | | | | | | | | | | | | | | | |
| | | | | |
| | 60,000 | | | BreitBurn Energy Partners LP | | | 8.250% | | | | | | | | N/R | | | | 1,527,000 | |
| | | | | |
| | 50,000 | | | Teekay Offshore Partners LP | | | 7.250% | | | | | | | | N/R | | | | 1,310,500 | |
| | | | Total Oil, Gas & Consumable Fuels | | | | | | | | | | | | | | | 2,837,500 | |
| | | | | |
| | | | Real Estate Investment Trust – 2.5% | | | | | | | | | | | | | | | | |
| | | | | |
| | 51,900 | | | Ashford Hospitality Trust Inc. | | | 8.450% | | | | | | | | N/R | | | | 1,323,969 | |
| | | | | |
| | 50,000 | | | Colony Financial Inc., (2) | | | 7.500% | | | | | | | | N/R | | | | 1,250,000 | |
| | | | | |
| | 40,000 | | | CommomWealth REIT | | | 7.250% | | | | | | | | Ba1 | | | | 1,031,200 | |
| | | | | | | | | | | | | | | | | | | | |
| Shares | | | Description (1) | | Coupon | | | | | | Ratings (6) | | | Value | |
| | | | | |
| | | | Real Estate Investment Trust (continued) | | | | | | | | | | | | | | | | |
| | | | | |
| | 75,000 | | | Coresite Realty Corporation | | | 7.250% | | | | | | | | N/R | | | $ | 1,886,250 | |
| | | | | |
| | 50,000 | | | Corporate Office Properties Trust | | | 7.375% | | | | | | | | BB | | | | 1,280,000 | |
| | | | | |
| | 22,024 | | | First Potomac Realty Trust | | | 7.750% | | | | | | | | N/R | | | | 571,523 | |
| | | | | |
| | 70,000 | | | General Growth Properties | | | 6.375% | | | | | | | | B | | | | 1,687,000 | |
| | | | | |
| | 41,677 | | | Hersha Hospitality Trust | | | 8.000% | | | | | | | | N/R | | | | 1,076,100 | |
| | | | | |
| | 54,000 | | | Kite Realty Group Trust | | | 8.250% | | | | | | | | N/R | | | | 1,418,580 | |
| | | | | |
| | 70,000 | | | LaSalle Hotel Properties, (18) | | | 7.500% | | | | | | | | N/R | | | | 1,824,900 | |
| | | | | |
| | 72,767 | | | Northstar Realty Finance Corporation, (4) | | | 8.500% | | | | | | | | N/R | | | | 1,849,009 | |
| | | | | |
| | 50,000 | | | Pebblebrook Hotel Trust | | | 7.875% | | | | | | | | N/R | | | | 1,317,500 | |
| | | | | |
| | 40,500 | | | Pebblebrook Hotel Trust | | | 6.500% | | | | | | | | N/R | | | | 954,180 | |
| | | | | |
| | 50,000 | | | Realty Income Corporation | | | 6.625% | | | | | | | | Baa2 | | | | 1,307,500 | |
| | | | | |
| | 40,000 | | | Retail Properties of America | | | 7.000% | | | | | | | | N/R | | | | 1,028,400 | |
| | | | | |
| | 40,000 | | | Summit Hotel Properties Inc. | | | 9.250% | | | | | | | | N/R | | | | 1,086,800 | |
| | | | | |
| | 79,000 | | | Summit Hotel Properties Inc. | | | 7.125% | | | | | | | | N/R | | | | 1,974,210 | |
| | | | | |
| | 90,302 | | | Ventas Realty LP, (4) | | | 5.450% | | | | | | | | BBB+ | | | | 2,159,122 | |
| | | | Total Real Estate Investment Trust | | | | | | | | | | | | | | | 25,026,243 | |
| | | | Total $25 Par (or similar) Retail Preferred (cost $51,718,998) | | | | | | | | | | | | | | | 55,036,242 | |
| | | | | |
Principal
Amount (000) (9) | | | Description (1) | | Coupon | | | Maturity | | | Ratings (6) | | | Value | |
| | | | | |
| | | | CORPORATE BONDS – 79.2% | | | | | | | | | | | | | | | | |
| | | | | |
| | | | Aerospace & Defense – 0.2% | | | | | | | | | | | | | | | | |
| | | | | |
| $ | 2,026 | | | Erickson Inc., (4) | | | 8.250% | | | | 5/01/20 | | | | B1 | | | $ | 2,081,715 | |
| | | | | |
| | 200 | | | Spirit AeroSystems Inc., 144A | | | 5.250% | | | | 3/15/22 | | | | Ba3 | | | | 203,000 | |
| | 2,226 | | | Total Aerospace & Defense | | | | | | | | | | | | | | | 2,284,715 | |
| | | | | |
| | | | Airlines – 0.4% | | | | | | | | | | | | | | | | |
| | | | | |
| | 1,950 | | | Air Canada, 144A | | | 8.750% | | | | 4/01/20 | | | | BB | | | | 2,184,000 | |
| | | | | |
| | 2,000 | | | Air Canada, 144A | | | 7.750% | | | | 4/15/21 | | | | B– | | | | 2,125,000 | |
| | 3,950 | | | Total Airlines | | | | | | | | | | | | | | | 4,309,000 | |
| | | | | |
| | | | Auto Components – 1.6% | | | | | | | | | | | | | | | | |
| | | | | |
| | 2,500 | | | Allied Specialty Vehicle Inc., 144A | | | 8.500% | | | | 11/01/19 | | | | B+ | | | | 2,631,250 | |
| | | | | |
| | 3,450 | | | CST Brands Inc., (4) | | | 5.000% | | | | 5/01/23 | | | | BB | | | | 3,450,000 | |
| | | | | |
| | 3,600 | | | Gestamp Funding Luxembourg SA, 144A | | | 5.625% | | | | 5/31/20 | | | | BB | | | | 3,753,000 | |
| | | | | |
| | 2,000 | | | Schaeffler Holding Finance BV, 144A | | | 6.875% | | | | 8/15/18 | | | | B1 | | | | 2,107,500 | |
| | | | | |
| | 3,900 | | | Stackpole International Intermediate Company, 144A | | | 7.750% | | | | 10/15/21 | | | | B+ | | | | 4,075,500 | |
| | 15,450 | | | Total Auto Components | | | | | | | | | | | | | | | 16,017,250 | |
| | | | | |
| | | | Automobiles – 0.3% | | | | | | | | | | | | | | | | |
| | | | | |
| | 3,000 | | | DriveTime Automotive Group Inc, DT Acceptance Corporation, 144A | | | 8.000% | | | | 6/01/21 | | | | B | | | | 3,060,000 | |
Nuveen High Income Bond Fund (continued)
Portfolio of Investments June 30, 2014
| | | | | | | | | | | | | | | | | | | | |
Principal
Amount (000) (9) | | | Description (1) | | Coupon | | | Maturity | | | Ratings (6) | | | Value | |
| | | | | |
| | | | Banks – 3.1% | | | | | | | | | | | | | | | | |
| | | | | |
| $ | 4,000 | | | Banco Do Brasil, 144A | | | 9.000% | | | | 12/18/64 | | | | Ba3 | | | $ | 3,945,000 | |
| | | | | |
| | 2,850 | | | BBVA Bancomer SA Texas, 144A | | | 6.750% | | | | 9/30/22 | | | | Baa2 | | | | 3,263,250 | |
| | | | | |
| | 3,650 | | | CIT Group Inc., (4) | | | 3.875% | | | | 2/19/19 | | | | BB– | | | | 3,706,940 | |
| | | | | |
| | 900 | | | Popular Inc. | | | 7.000% | | | | 7/01/19 | | | | BB– | | | | 913,500 | |
| | | | | |
| | 3,425 | EUR | | Royal Bank of Scotland Group PLC | | | 5.500% | | | | 11/29/49 | | | | BB | | | | 4,579,642 | |
| | | | | |
| | 2,500 | | | Sberbank Capital SA, Loan Participation Note, 144A | | | 5.500% | | | | 2/26/24 | | | | BBB– | | | | 2,431,250 | |
| | | | | |
| | 2,850 | | | ScotiaBank Peru SA, 144A | | | 4.500% | | | | 12/13/27 | | | | A– | | | | 2,728,875 | |
| | | | | |
| | 1,500 | | | Speedy Cash Inc,, 144A | | | 10.750% | | | | 5/15/18 | | | | B | | | | 1,522,500 | |
| | | | | |
| | 2,000 | | | Turkiye Vakiflar Bankasi T.A.O, 144A | | | 6.000% | | | | 11/01/22 | | | | BB+ | | | | 1,972,500 | |
| | | | | |
| | 2,000 | EUR | | UT2 Funding PLC | | | 5.321% | | | | 6/30/16 | | | | BB– | | | | 2,943,996 | |
| | | | | |
| | 3,000 | | | Yapi ve Kredi Bankasi AS, 144A | | | 5.500% | | | | 12/06/22 | | | | BBB– | | | | 2,847,900 | |
| | | | Total Banks | | | | | | | | | | | | | | | 30,855,353 | |
| | | | | |
| | | | Beverages – 0.3% | | | | | | | | | | | | | | | | |
| | | | | |
| | 750 | | | Andalou Efes Biracilik ve Malt Sanayii AS, 144A | | | 3.375% | | | | 11/01/22 | | | | BBB– | | | | 669,375 | |
| | | | | |
| | 2,000 | | | Carolina Beverage Group LLC, 144A | | | 10.625% | | | | 8/01/18 | | | | B– | | | | 2,155,000 | |
| | 2,750 | | | Total Beverages | | | | | | | | | | | | | | | 2,824,375 | |
| | | | | |
| | | | Building Products – 2.1% | | | | | | | | | | | | | | | | |
| | | | | |
| | 1,935 | | | Associated Asphalt Partners LLC, 144A | | | 8.500% | | | | 2/15/18 | | | | B | | | | 2,046,263 | |
| | | | | |
| | 1,500 | | | Atrium Windows and Doors Inc., 144A | | | 7.750% | | | | 5/01/19 | | | | B– | | | | 1,515,000 | |
| | | | | |
| | 3,000 | | | Builders FirstSource Inc., 144A | | | 7.625% | | | | 6/01/21 | | | | B– | | | | 3,210,000 | |
| | | | | |
| | 3,300 | | | Building Materials Holdings Corporation, 144A | | | 9.000% | | | | 9/15/18 | | | | B– | | | | 3,555,750 | |
| | | | | |
| | 2,800 | | | Griffon Corporation | | | 5.250% | | | | 3/01/22 | | | | BB– | | | | 2,782,500 | |
| | | | | |
| | 193 | | | Odebrecht Offshore Drilling Finance Limited, Reg S | | | 6.750% | | | | 10/01/22 | | | | BBB | | | | 206,435 | |
| | | | | |
| | 2,750 | | | Ply Gem Industries Inc., 144A, (4) | | | 6.500% | | | | 2/01/22 | | | | CCC+ | | | | 2,660,625 | |
| | | | | |
| | 2,500 | | | Taylor Morrison Monarch Communities, 144A, (4) | | | 5.250% | | | | 4/15/21 | | | | BB– | | | | 2,537,500 | |
| | | | | |
| | 2,250 | | | US Concrete Inc., 144A | | | 8.500% | | | | 12/01/18 | | | | B | | | | 2,441,250 | |
| | 20,228 | | | Total Building Products | | | | | | | | | | | | | | | 20,955,323 | |
| | | | | |
| | | | Chemicals – 2.8% | | | | | | | | | | | | | | | | |
| | | | | |
| | 4,650 | | | Eagle Spinco Inc. | | | 4.625% | | | | 2/15/21 | | | | BB | | | | 4,615,125 | |
| | | | | |
| | 2,500 | | | Hexion US Finance Corporation | | | 8.875% | | | | 2/01/18 | | | | CCC+ | | | | 2,600,000 | |
| | | | | |
| | 3,500 | | | HIG BBC Intermediate Holdings LLC for Cornerstone Chemical Company | | | 10.500% | | | | 9/15/18 | | | | N/R | | | | 3,587,500 | |
| | | | | |
| | 1,950 | | | Ineos Group Holdings SA, 144A, (4) | | | 6.125% | | | | 8/15/18 | | | | B– | | | | 2,018,250 | |
| | | | | |
| | 3,000 | EUR | | Ineos Group Holdings SA, 144A | | | 5.750% | | | | 2/15/19 | | | | B– | | | | 4,241,408 | |
| | | | | |
| | 2,500 | | | Kissner Milling Company Limited, 144A | | | 7.250% | | | | 6/01/19 | | | | B– | | | | 2,575,000 | |
| | | | | |
| | 2,775 | | | Momentive Performance Materials Inc., (4) | | | 8.875% | | | | 10/15/20 | | | | D | | | | 2,962,313 | |
| | | | | |
| | 2,800 | | | Office Cherifien Des Phosphates SA, 144A | | | 5.625% | | | | 4/25/24 | | | | BBB– | | | | 2,936,500 | |
| | | | | |
| | 425 | | | TPC Group Inc., 144A | | | 8.750% | | | | 12/15/20 | �� | | | B | | | | 470,688 | |
| | | | | |
| | 2,250 | | | Trinseo Materials Operating | | | 8.750% | | | | 2/01/19 | | | | B | | | | 2,424,375 | |
| | | | Total Chemicals | | | | | | | | | | | | | | | 28,431,159 | |
| | | | | | | | | | | | | | | | | | | | |
Principal
Amount (000) (9) | | | Description (1) | | Coupon | | | Maturity | | | Ratings (6) | | | Value | |
| | | | | |
| | | | Commercial Services & Supplies – 2.6% | | | | | | | | | | | | | | | | |
| | | | | |
| $ | 600 | | | ABX Group Inc., 144A | | | 8.750% | | | | 12/01/20 | | | | CCC+ | | | $ | 609,000 | |
| | | | | |
| | 2,860 | | | ABX Group Inc. | | | 8.750% | | | | 12/01/20 | | | | CCC+ | | | | 2,902,900 | |
| | | | | |
| | 3,740 | | | ADT Corporation, (4) | | | 6.250% | | | | 10/15/21 | | | | BBB– | | | | 3,964,400 | |
| | | | | |
| | 3,050 | | | Casella Waste Systems Inc., (4) | | | 7.750% | | | | 2/15/19 | | | | CCC+ | | | | 3,187,250 | |
| | | | | |
| | 2,650 | | | Clean Harbors Inc. | | | 5.250% | | | | 8/01/20 | | | | BB+ | | | | 2,732,813 | |
| | | | | |
| | 4,140 | EUR | | Europcar Groupe SA, 144A | | | 11.500% | | | | 5/15/17 | | | | B– | | | | 6,511,608 | |
| | | | | |
| | 2,840 | CAD | | GFL Environmental Corporation, 144A | | | 7.500% | | | | 6/18/18 | | | | B+ | | | | 2,741,390 | |
| | | | | |
| | 2,000 | | | Square Two Financial Corporation, (4) | | | 11.625% | | | | 4/01/17 | | | | B2 | | | | 1,930,000 | |
| | | | | |
| | 1,500 | | | West Corporation, 144A, (WI/DD) | | | 5.375% | | | | 7/15/22 | | | | B+ | | | | 1,485,000 | |
| | | | Total Commercial Services & Supplies | | | | | | | | | | | | | | | 26,064,361 | |
| | | | | |
| | | | Communications Equipment – 0.5% | | | | | | | | | | | | | | | | |
| | | | | |
| | 3,000 | | | Avaya Inc., 144A, (4) | | | 10.500% | | | | 3/01/21 | | | | CCC+ | | | | 2,767,500 | |
| | | | | |
| | 2,000 | | | Broadview Networks Holdings Inc. | | | 10.500% | | | | 11/15/17 | | | | N/R | | | | 1,950,000 | |
| | 5,000 | | | Total Communications Equipment | | | | | | | | | | | | | | | 4,717,500 | |
| | | | | |
| | | | Computers & Peripherals – 0.3% | | | | | | | | | | | | | | | | |
| | | | | |
| | 1,000 | | | Hutchinson Technology Inc., Convertible Bond | | | 8.500% | | | | 1/15/17 | | | | N/R | | | | 940,000 | |
| | | | | |
| | 2,250 | | | NCR Corporation | | | 5.000% | | | | 7/15/22 | | | | BB | | | | 2,278,125 | |
| | 3,250 | | | Total Computers & Peripherals | | | | | | | | | | | | | | | 3,218,125 | |
| | | | | |
| | | | Construction & Engineering – 0.7% | | | | | | | | | | | | | | | | |
| | | | | |
| | 2,000 | | | Michael Baker Holdings LLC Finance Corporation, 144A | | | 8.875% | | | | 4/15/19 | | | | B– | | | | 2,000,000 | |
| | | | | |
| | 2,500 | | | Michael Baker International LLC / CDL Acquisition Company Inc., 144A | | | 8.250% | | | | 10/15/18 | | | | B+ | | | | 2,662,500 | |
| | | | | |
| | 15,000 | NOK | | VV Holding AS, 144A, (WI/DD) | | | 7.070% | | | | 7/10/19 | | | | N/R | | | | 2,445,446 | |
| | | | Total Construction & Engineering | | | | | | | | | | | | | | | 7,107,946 | |
| | | | | |
| | | | Consumer Finance – 1.1% | | | | | | | | | | | | | | | | |
| | | | | |
| | 3,000 | | | Enova International Inc., 144A | | | 9.750% | | | | 6/01/21 | | | | B | | | | 2,988,750 | |
| | | | | |
| | 2,050 | | | First Data Corporation | | | 12.625% | | | | 1/15/21 | | | | B– | | | | 2,524,063 | |
| | | | | |
| | 3,425 | | | First Data Corporation, (4) | | | 11.750% | | | | 8/15/21 | | | | CCC+ | | | | 4,062,906 | |
| | | | | |
| | 1,500 | | | Home Credit & Finance Bank LLC Eurasia Capital | | | 9.375% | | | | 4/24/20 | | | | BB– | | | | 1,404,375 | |
| | 9,975 | | | Total Consumer Finance | | | | | | | | | | | | | | | 10,980,094 | |
| | | | | |
| | | | Containers & Packaging – 1.3% | | | | | | | | | | | | | | | | |
| | | | | |
| | 240 | | | Ardagh Packaging Finance / MP HD USA, 144A | | | 7.000% | | | | 11/15/20 | | | | CCC+ | | | | 248,400 | |
| | | | | |
| | 2,300 | | | Ardagh Packaging Finance / MP HD USA, 144A, (4) | | | 6.750% | | | | 1/31/21 | | | | CCC+ | | | | 2,374,750 | |
| | | | | |
| | 4,500 | | | Beverage Packaging Holdings Luxembourg II SA / Issuer Inc., 144A | | | 6.000% | | | | 6/15/17 | | | | CCC+ | | | | 4,612,500 | |
| | | | | |
| | 3,000 | | | Cascades Inc., 144A | | | 5.500% | | | | 7/15/22 | | | | Ba3 | | | | 2,992,500 | |
| | | | | |
| | 2,900 | | | Reynolds Group | | | 9.875% | | | | 8/15/19 | | | | CCC+ | | | | 3,211,750 | |
| | 12,940 | | | Total Containers & Packaging | | | | | | | | | | | | | | | 13,439,900 | |
| | | | | |
| | | | Diversified Consumer Services – 1.0% | | | | | | | | | | | | | | | | |
| | | | | |
| | 1,800 | | | Ahern Rentals Inc., 144A, (4) | | | 9.500% | | | | 6/15/18 | | | | B | | | | 1,984,500 | |
Nuveen High Income Bond Fund (continued)
Portfolio of Investments June 30, 2014
| | | | | | | | | | | | | | | | | | | | |
Principal
Amount (000) (9) | | | Description (1) | | Coupon | | | Maturity | | | Ratings (6) | | | Value | |
| | | | | |
| | | | Diversified Consumer Services (continued) | | | | | | | | | | | | | | | | |
| | | | | |
| $ | 3,000 | | | Gibson Brands Inc., 144A | | | 8.875% | | | | 8/01/18 | | | | B– | | | $ | 3,086,250 | |
| | | | | |
| | 3,000 | | | Jones Group Inc. | | | 6.125% | | | | 11/15/34 | | | | CCC | | | | 2,580,000 | |
| | | | | |
| | 2,100 | | | Office Depot de Mexico SA de CV, 144A | | | 6.875% | | | | 9/20/20 | | | | BB+ | | | | 2,241,750 | |
| | 9,900 | | | Total Diversified Consumer Services | | | | | | | | | | | | | | | 9,892,500 | |
| | | | | |
| | | | Diversified Financial Services – 1.5% | | | | | | | | | | | | | | | | |
| | | | | |
| | 4,250 | | | CNG Holdings Inc., 144A | | | 9.375% | | | | 5/15/20 | | | | B– | | | | 3,532,813 | |
| | | | | |
| | 3,000 | | | Jefferies Finance LLC Corporation, 144A | | | 7.375% | | | | 4/01/20 | | | | B1 | | | | 3,150,000 | |
| | | | | |
| | 2,300 | | | Jefferies Finance LLC Corporation, 144A | | | 6.875% | | | | 4/15/22 | | | | B1 | | | | 2,323,000 | |
| | | | | |
| | 1,600 | | | Jefferies LoanCore LLC Finance Corporation, 144A | | | 6.875% | | | | 6/01/20 | | | | B | | | | 1,616,000 | |
| | | | | |
| | 3,960 | | | Nationstar Mortgage LLC Capital Corporation | | | 7.875% | | | | 10/01/20 | | | | B+ | | | | 4,162,950 | |
| | 15,110 | | | Total Diversified Financial Services | | | | | | | | | | | | | | | 14,784,763 | |
| | | | | |
| | | | Diversified Telecommunication Services – 1.6% | | | | | | | | | | | | | | | | |
| | | | | |
| | 5,250 | | | CenturyLink Inc. | | | 7.650% | | | | 3/15/42 | | | | BB+ | | | | 5,236,875 | |
| | | | | |
| | 6,200 | | | IntelSat Jackson Holdings, (4) | | | 6.625% | | | | 12/15/22 | | | | B– | | | | 6,471,250 | |
| | | | | |
| | 3,900 | | | WideOpenWest Finance Capital Corporation | | | 13.375% | | | | 10/15/19 | | | | CCC+ | | | | 4,514,250 | |
| | 15,350 | | | Total Diversified Telecommunication Services | | | | | | | | | | | | | | | 16,222,375 | |
| | | | | |
| | | | Electric Utilities – 1.5% | | | | | | | | | | | | | | | | |
| | | | | |
| | 3,500 | | | Energy Future Intermediate Holding Company LLC, 144A | | | 12.250% | | | | 3/01/22 | | | | D | | | | 4,305,000 | |
| | | | | |
| | 4,775 | | | FirstEnergy Corporation | | | 4.250% | | | | 3/15/23 | | | | Baa3 | | | | 4,755,504 | |
| | | | | |
| | 3,450 | | | Intergen NV, 144A | | | 7.000% | | | | 6/30/23 | | | | B+ | | | | 3,562,125 | |
| | | | | |
| | 760 | | | Midwest Generation LLC | | | 8.560% | | | | 1/02/16 | | | | B | | | | 777,175 | |
| | | | | |
| | 1,000 | | | Star Energy Geothermal Wayang Windu Limited, 144A | | | 6.125% | | | | 3/27/20 | | | | B+ | | | | 1,021,200 | |
| | | | | |
| | 1,000 | | | Texas Competitive Electric Holdings, 144A, (10) | | | 11.500% | | | | 10/01/20 | | | | D | | | | 912,500 | |
| | 14,485 | | | Total Electric Utilities | | | | | | | | | | | | | | | 15,333,504 | |
| | | | | |
| | | | Energy Equipment & Services – 2.7% | | | | | | | | | | | | | | | | |
| | | | | |
| | 3,000 | | | Drill Rigs Holdings Inc., 144A | | | 6.500% | | | | 10/01/17 | | | | B | | | | 3,067,500 | |
| | | | | |
| | 2,500 | | | Hercules Offshore LLC, 144A | | | 8.750% | | | | 7/15/21 | | | | B | | | | 2,643,750 | |
| | | | | |
| | 15,000 | NOK | | North Atlantic Drilling Limited | | | 6.050% | | | | 10/30/18 | | | | N/R | | | | 2,451,560 | |
| | | | | |
| | 2,950 | | | Offshore Group Investment Limited, (4) | | | 7.500% | | | | 11/01/19 | | | | B– | | | | 3,119,625 | |
| | | | | |
| | 3,000 | | | Oro Negro Drilling PTE Limited, 144A | | | 7.500% | | | | 1/24/19 | | | | N/R | | | | 3,052,500 | |
| | | | | |
| | 3,000 | | | Prospector Finance II, SA | | | 7.750% | | | | 6/19/19 | | | | N/R | | | | 3,000,000 | |
| | | | | |
| | 3,500 | | | SAExploration Holdings Inc., 144A, (WI/DD) | | | 10.000% | | | | 7/15/19 | | | | B– | | | | 3,508,750 | |
| | | | | |
| | 2,000 | | | Santa Maria Offshore Limited | | | 8.875% | | | | 7/03/18 | | | | N/R | | | | 2,130,000 | |
| | | | | |
| | 2,500 | | | Seventy Seven Energy Inc., 144A | | | 6.500% | | | | 7/15/22 | | | | B | | | | 2,562,500 | |
| | | | | |
| | 1,500 | | | TMK OAO via TMK Capital SA, 144A | | | 6.750% | | | | 4/03/20 | | | | B+ | | | | 1,462,500 | |
| | | | Total Energy Equipment & Services | | | | | | | | | | | | | | | 26,998,685 | |
| | | | | |
| | | | Food & Staples Retailing – 0.6% | | | | | | | | | | | | | | | | |
| | | | | |
| | 2,500 | | | Kehe Distributors LLC Finance, 144A | | | 7.625% | | | | 8/15/21 | | | | B– | | | | 2,725,000 | |
| | | | | | | | | | | | | | | | | | | | |
Principal
Amount (000) (9) | | | Description (1) | | Coupon | | | Maturity | | | Ratings (6) | | | Value | |
| | | | | |
| | | | Food & Staples Retailing (continued) | | | | | | | | | | | | | | | | |
| | | | | |
| $ | 1,500 | | | Rite Aid Corporation, 144A | | | 6.875% | | | | 12/15/28 | | | | CCC+ | | | $ | 1,518,750 | |
| | | | | |
| | 2,000 | | | Roundy’s Supermarkets Inc., 144A | | | 10.250% | | | | 12/15/20 | | | | B3 | | | | 2,112,500 | |
| | 6,000 | | | Total Food & Staples Retailing | | | | | | | | | | | | | | | 6,356,250 | |
| | | | | |
| | | | Food Products – 2.2% | | | | | | | | | | | | | | | | |
| | | | | |
| | 3,000 | | | B&G Foods Inc. | | | 4.625% | | | | 6/01/21 | | | | BB– | | | | 3,007,500 | |
| | | | | |
| | 2,500 | | | Diamond Foods Inc., 144A | | | 7.000% | | | | 3/15/19 | | | | CCC+ | | | | 2,618,750 | |
| | | | | |
| | 2,500 | | | Dole Food Company, 144A, (4) | | | 7.250% | | | | 5/01/19 | | | | CCC+ | | | | 2,531,250 | |
| | | | | |
| | 4,050 | | | JBS Investments GmbH, 144A, (4) | | | 7.250% | | | | 4/03/24 | | | | BB | | | | 4,191,750 | |
| | | | | |
| | 4,000 | | | Land O Lakes Capital Trust I | | | 7.450% | | | | 3/15/28 | | | | BB | | | | 4,030,000 | |
| | | | | |
| | 3,200 | | | Marfrig Holding Europe BV, 144A, (4) | | | 8.375% | | | | 5/09/18 | | | | B | | | | 3,403,040 | |
| | | | | |
| | 850 | | | Mriya Agro Holding PLC, 144A, (4) | | | 9.450% | | | | 4/19/18 | | | | CCC | | | | 671,500 | |
| | | | | |
| | 2,000 | | | Southern States Cooperative Inc., 144A | | | 10.000% | | | | 8/15/21 | | | | B | | | | 2,030,000 | |
| | 22,100 | | | Total Food Products | | | | | | | | | | | | | | | 22,483,790 | |
| | | | | |
| | | | Gas Utilities – 0.6% | | | | | | | | | | | | | | | | |
| | | | | |
| | 2,925 | | | Ferrellgas LP, 144A | | | 6.750% | | | | 1/15/22 | | | | B+ | | | | 3,056,625 | |
| | | | | |
| | 3,010 | | | LBC Tank Terminals Holdings Netherlands BV, 144A | | | 6.875% | | | | 5/15/23 | | | | B | | | | 3,175,550 | |
| | 5,935 | | | Total Gas Utilities | | | | | | | | | | | | | | | 6,232,175 | |
| | | | | |
| | | | Health Care Equipment & Supplies – 0.6% | | | | | | | | | | | | | | | | |
| | | | | |
| | 1,050 | EUR | | Labco SAS, Reg S | | | 8.500% | | | | 1/15/18 | | | | BB– | | | | 1,524,031 | |
| | | | | |
| | 2,500 | | | Tenet Healthcare Corporation | | | 6.250% | | | | 11/01/18 | | | | BB | | | | 2,775,000 | |
| | | | | |
| | 1,800 | | | Tenet Healthcare Corporation | | | 6.875% | | | | 11/15/31 | | | | B3 | | | | 1,741,500 | |
| | | | Total Health Care Equipment & Supplies | | | | | | | | | | | | | | | 6,040,531 | |
| | | | | |
| | | | Health Care Providers & Services – 1.9% | | | | | | | | | | | | | | | | |
| | | | | |
| | 3,000 | | | Bioscrip Inc., 144A, (4) | | | 8.875% | | | | 2/15/21 | | | | CCC | | | | 3,135,000 | |
| | | | | |
| | 3,000 | | | Community Health Systems, Inc. | | | 5.125% | | | | 8/15/18 | | | | BB+ | | | | 3,146,250 | |
| | | | | |
| | 1,250 | | | HCA Holdings Inc. | | | 6.250% | | | | 2/15/21 | | | | B– | | | | 1,342,188 | |
| | | | | |
| | 3,500 | | | HCA Inc. | | | 6.500% | | | | 2/15/20 | | | | BB+ | | | | 3,937,500 | |
| | | | | |
| | 1,935 | | | Kindred Healthcare Inc., 144A | | | 6.375% | | | | 4/15/22 | | | | B– | | | | 1,944,675 | |
| | | | | |
| | 1,000 | | | National Mentor Holdings, 144A | | | 12.500% | | | | 2/15/18 | | | | CCC+ | | | | 1,062,500 | |
| | | | | |
| | 2,000 | | | Opal Acquisition Inc., 144A | | | 8.875% | | | | 12/15/21 | | | | CCC+ | | | | 2,105,000 | |
| | | | | |
| | 1,000 | | | Select Medical Corporation, 144A | | | 6.375% | | | | 6/01/21 | | | | B– | | | | 1,045,000 | |
| | | | | |
| | 1,150 | | | Select Medical Corporation, (4) | | | 6.375% | | | | 6/01/21 | | | | B– | | | | 1,201,750 | |
| | | | | |
| | — | (11) | | Symbion Inc. | | | 11.000% | | | | 8/23/15 | | | | CCC+ | | | | 494 | |
| | 17,835 | | | Total Health Care Providers & Services | | | | | | | | | | | | | | | 18,920,357 | |
| | | | | |
| | | | Hotels, Restaurants & Leisure – 1.9% | | | | | | | | | | | | | | | | |
| | | | | |
| | 1,250 | | | Caesars Entertainment Resort Properties LLC, 144A | | | 8.000% | | | | 10/01/20 | | | | B+ | | | | 1,306,250 | |
| | | | | |
| | 2,450 | | | Caesars Operating Escrow | | | 9.000% | | | | 2/15/20 | | | | Caa2 | | | | 2,048,813 | |
| | | | | |
| | 3,350 | | | Chukchansi Economic Development Authority, 144A | | | 9.750% | | | | 11/15/20 | | | | CCC+ | | | | 2,344,962 | |
Nuveen High Income Bond Fund (continued)
Portfolio of Investments June 30, 2014
| | | | | | | | | | | | | | | | | | | | |
Principal
Amount (000) (9) | | | Description (1) | | Coupon | | | Maturity | | | Ratings (6) | | | Value | |
| | | | | |
| | | | Hotels, Restaurants & Leisure (continued) | | | | | | | | | | | | | | | | |
| | | | | |
| $ | 30 | | | Greektown Holdings, (3) | | | 10.750% | | | | 12/01/14 | | | | N/R | | | $ | — | |
| | | | | |
| | 3,350 | | | Mohegan Tribal Gaming Authority, (4) | | | 9.750% | | | | 9/01/21 | | | | B3 | | | | 3,718,500 | |
| | | | | |
| | 2,000 | | | Roc Finance LLC and Roc Finance 1 Corporation, 144A, (4) | | | 12.125% | | | | 9/01/18 | | | | B | | | | 2,170,000 | |
| | | | | |
| | 2,750 | | | Shearer’s Foods LLC, 144A | | | 9.000% | | | | 11/01/19 | | | | B1 | | | | 3,011,250 | |
| | | | | |
| | 4,350 | | | Wynn Macau Limited, 144A | | | 5.250% | | | | 10/15/21 | | | | BB | | | | 4,469,625 | |
| | 19,530 | | | Total Hotels, Restaurants & Leisure | | | | | | | | | | | | | | | 19,069,400 | |
| | | | | |
| | | | Household Durables – 0.8% | | | | | | | | | | | | | | | | |
| | | | | |
| | 2,500 | | | Beazer Homes USA, Inc. | | | 7.500% | | | | 9/15/21 | | | | CCC+ | | | | 2,650,000 | |
| | | | | |
| | 2,000 | | | K. Hovnanian Enterprises Inc. | | | 5.000% | | | | 11/01/21 | | | | Ba3 | | | | 1,820,000 | |
| | | | | |
| | 3,000 | | | Rialto Holdings LLC-Rialto Corporation | | | 7.000% | | | | 12/01/18 | | | | B | | | | 3,150,000 | |
| | 7,500 | | | Total Household Durables | | | | | | | | | | | | | | | 7,620,000 | |
| | | | | |
| | | | Independent Power & Renewable Electricity Producers – 1.0% | | | | | | | | | | | | | | | | |
| | | | | |
| | 2,000 | | | Dynegy Inc., (4) | | | 5.875% | | | | 6/01/23 | | | | B+ | | | | 2,015,000 | |
| | | | | |
| | 3,969 | | | Mirant Americas Generation LLC, (4) | | | 9.125% | | | | 5/01/31 | | | | BB– | | | | 4,078,148 | |
| | | | | |
| | 3,500 | | | RRI Energy Inc. | | | 7.875% | | | | 6/15/17 | | | | B | | | | 3,718,750 | |
| | 9,469 | | | Total Independent Power & Renewable Electricity Producers | | | | | | | | | | | | | | | 9,811,898 | |
| | | | | |
| | | | Industrial Conglomerates – 0.6% | | | | | | | | | | | | | | | | |
| | | | | |
| | 9,000 | NOK | | Grieg Seafood ASA | | | 8.820% | | | | 12/21/15 | | | | N/R | | | | 1,540,631 | |
| | | | | |
| | 4,050 | | | Stena AB, 144A, (4) | | | 7.000% | | | | 2/01/24 | | | | BB | | | | 4,313,250 | |
| | | | Total Industrial Conglomerates | | | | | | | | | | | | | | | 5,853,881 | |
| | | | | |
| | | | Internet Software & Services – 0.2% | | | | | | | | | | | | | | | | |
| | | | | |
| | 2,250 | | | Equinix Inc., (4) | | | 5.375% | | | | 4/01/23 | | | | BB | | | | 2,300,625 | |
| | | | | |
| | | | IT Services – 0.2% | | | | | | | | | | | | | | | | |
| | | | | |
| | 2,175 | | | NeuStar Inc., (4) | | | 4.500% | | | | 1/15/23 | | | | BB– | | | | 1,881,375 | |
| | | | | |
| | | | Leisure Equipment & Products – 0.8% | | | | | | | | | | | | | | | | |
| | | | | |
| | 2,900 | | | 24 Hour Holdings III LLC, 144A, (4) | | | 8.000% | | | | 6/01/22 | | | | CCC+ | | | | 2,885,500 | |
| | | | | |
| | 2,000 | | | Cinemark USA Inc. | | | 4.875% | | | | 6/01/23 | | | | BB– | | | | 1,995,000 | |
| | | | | |
| | 2,925 | CAD | | Gateway Casinos & Entertainment Limited | | | 8.500% | | | | 11/26/20 | | | | B+ | | | | 2,799,124 | |
| | | | Total Leisure Equipment & Products | | | | | | | | | | | | | | | 7,679,624 | |
| | | | | |
| | | | Machinery – 1.1% | | | | | | | | | | | | | | | | |
| | | | | |
| | 3,515 | | | Chassix Inc., 144A | | | 9.250% | | | | 8/01/18 | | | | B– | | | | 3,822,563 | |
| | | | | |
| | 3,000 | | | Commercial Vehicle Group, (4) | | | 7.875% | | | | 4/15/19 | | | | B | | | | 3,120,000 | |
| | | | | |
| | 3,730 | | | CTP Transportation Products LLC-Finance Inc., 144A | | | 8.250% | | | | 12/15/19 | | | | B+ | | | | 4,019,075 | |
| | 10,245 | | | Total Machinery | | | | | | | | | | | | | | | 10,961,638 | |
| | | | | |
| | | | Marine – 1.6% | | | | | | | | | | | | | | | | |
| | | | | |
| | 10,450 | NOK | | BOA SBL AS, 144A | | | 7.270% | | | | 4/19/18 | | | | N/R | | | | 1,712,179 | |
| | | | | |
| | 10,103 | NOK | | E Forland AS | | | 8.610% | | | | 9/04/18 | | | | B | | | | 1,692,360 | |
| | | | | |
| | 2,000 | | | Eletson Holdings Inc., 144A | | | 9.625% | | | | 1/15/22 | | | | B | | | | 2,145,000 | |
| | | | | | | | | | | | | | | | | | | | |
Principal
Amount (000) (9) | | | Description (1) | | Coupon | | | Maturity | | | Ratings (6) | | | Value | |
| | | | | |
| | | | Marine (continued) | | | | | | | | | | | | | | | | |
| | | | | |
| $ | 2,750 | | | Global Ship Lease Inc., 144A | | | 10.000% | | | | 4/01/19 | | | | B | | | $ | 2,956,250 | |
| | | | | |
| | 2,000 | | | Navios Maritime Acquisition Corporation, 144A | | | 8.125% | | | | 11/15/21 | | | | B+ | | | | 2,090,000 | |
| | | | | |
| | 2,500 | | | Navios South American Logistics Inc., Finance US Inc., 144A, (4) | | | 7.250% | | | | 5/01/22 | | | | B+ | | | | 2,600,000 | |
| | | | | |
| | 2,200 | | | Topaz Marine SA, 144A | | | 8.625% | | | | 11/01/18 | | | | B– | | | | 2,370,500 | |
| | | | Total Marine | | | | | | | | | | | | | | | 15,566,289 | |
| | | | | |
| | | | Media – 5.4% | | | | | | | | | | | | | | | | |
| | | | | |
| | 2,300 | | | Altice S.A, 144A, (4) | | | 7.750% | | | | 5/15/22 | | | | B | | | | 2,455,250 | |
| | | | | |
| | 1,000 | | | American Media Inc., 144A, (4) | | | 13.500% | | | | 6/15/18 | | | | CCC– | | | | 1,055,000 | |
| | | | | |
| | 932 | | | Baker & Taylor Inc., 144A | | | 15.000% | | | | 4/01/17 | | | | B3 | | | | 876,080 | |
| | | | | |
| | 2,000 | | | Cequel Communication Holdings I, 144A, (4) | | | 5.125% | | | | 12/15/21 | | | | B– | | | | 1,992,500 | |
| | | | | |
| | 2,850 | | | Charter Communications, CCO Holdings LLC | | | 5.125% | | | | 2/15/23 | | | | BB– | | | | 2,874,938 | |
| | | | | |
| | 5,000 | | | Clear Channel Communications, Inc. | | | 11.250% | | | | 3/01/21 | | | | CCC+ | | | | 5,668,750 | |
| | | | | |
| | 800 | | | Dish DBS Corporation, (4) | | | 5.875% | | | | 7/15/22 | | | | BB– | | | | 868,000 | |
| | | | | |
| | 2,975 | | | Gannett Company Inc., 144A | | | 5.125% | | | | 7/15/20 | | | | BB+ | | | | 3,053,094 | |
| | | | | |
| | 2,500 | | | Harron Communications Finance, 144A | | | 9.125% | | | | 4/01/20 | | | | B– | | | | 2,787,500 | |
| | | | | |
| | 3,250 | | | Lee Enterprises Inc., 144A | | | 9.500% | | | | 3/15/22 | | | | B2 | | | | 3,469,375 | |
| | | | | |
| | 1,950 | | | McClatchy Company | | | 9.000% | | | | 12/15/22 | | | | B1 | | | | 2,225,438 | |
| | | | | |
| | 3,000 | | | McGraw-Hill Global Education Holdings | | | 9.750% | | | | 4/01/21 | | | | BB | | | | 3,442,500 | |
| | | | | |
| | 3,600 | | | Midcontinent Communications Finance Company, 144A | | | 6.250% | | | | 8/01/21 | | | | B– | | | | 3,726,000 | |
| | | | | |
| | 3,500 | | | Numericable Group SA, 144A, (4) | | | 4.875% | | | | 5/15/19 | | | | Ba3 | | | | 3,591,875 | |
| | | | | |
| | 1,500 | | | Numericable Group SA, 144A | | | 6.000% | | | | 5/15/22 | | | | Ba3 | | | | 1,560,000 | |
| | | | | |
| | 2,000 | | | Radio One Inc., 144A | | | 9.250% | | | | 2/15/20 | | | | CCC | | | | 2,165,000 | |
| | | | | |
| | 2,750 | | | Sinclair Television Group | | | 5.375% | | | | 4/01/21 | | | | B+ | | | | 2,767,188 | |
| | | | | |
| | 2,325 | | | Sirius XM Radio Inc., 144A | | | 6.000% | | | | 7/15/24 | | | | BB | | | | 2,418,000 | |
| | | | | |
| | 2,500 | | | SiTV Inc., 144A, (WI/DD) | | | 10.375% | | | | 7/01/19 | | | | B– | | | | 2,562,500 | |
| | | | | |
| | 2,000 | | | Time Inc., 144A, (4) | | | 5.750% | | | | 4/15/22 | | | | BB | | | | 2,020,000 | |
| | | | | |
| | 3,150 | CAD | | Videotron Limited, 144A | | | 5.625% | | | | 6/15/25 | | | | BB | | | | 2,996,345 | |
| | | | Total Media | | | | | | | | | | | | | | | 54,575,333 | |
| | | | | |
| | | | Metals & Mining – 6.0% | | | | | | | | | | | | | | | | |
| | | | | |
| | 1,000 | | | Aleris International Inc., (3) | | | 10.000% | | | | 12/15/16 | | | | N/R | | | | 10 | |
| | | | | |
| | 1,600 | | | Anglogold Holdings PLC, (4) | | | 8.500% | | | | 7/30/20 | | | | Baa3 | | | | 1,792,000 | |
| | | | | |
| | 2,450 | | | ArcelorMittal | | | 7.250% | | | | 10/15/39 | | | | BB+ | | | | 2,695,000 | |
| | | | | |
| | 2,250 | | | AuRico Gold Inc., 144A | | | 7.750% | | | | 4/01/20 | | | | B | | | | 2,227,500 | |
| | | | | |
| | 2,965 | | | Century Aluminum Company, 144A, (4) | | | 7.500% | | | | 6/01/21 | | | | B | | | | 3,128,075 | |
| | | | | |
| | 3,225 | | | Coeur d’Alene Mines Corporation, Convertible Bond | | | 7.875% | | | | 2/01/21 | | | | B+ | | | | 3,241,125 | |
| | | | | |
| | 1,023 | | | Commercial Metals Inc. | | | 4.875% | | | | 5/15/23 | | | | BB+ | | | | 997,425 | |
| | | | | |
| | 2,500 | | | Compania Minera Ares SAC, 144A, (4) | | | 7.750% | | | | 1/23/21 | | | | Ba1 | | | | 2,687,500 | |
| | | | | |
| | 3,550 | | | Eldorado Gold Corporation, 144A, (4) | | | 6.125% | | | | 12/15/20 | | | | BB | | | | 3,585,500 | |
Nuveen High Income Bond Fund (continued)
Portfolio of Investments June 30, 2014
| | | | | | | | | | | | | | | | | | | | |
Principal
Amount (000) (9) | | | Description (1) | | Coupon | | | Maturity | | | Ratings (6) | | | Value | |
| | | | | |
| | | | Metals & Mining (continued) | | | | | | | | | | | | | | | | |
| | | | | |
| $ | 2,000 | | | Essar Steel Minnesota LLC, 144A | | | 11.500% | | | | 5/15/20 | | | | CCC+ | | | $ | 2,022,500 | |
| | | | | |
| | 2,360 | | | First Quantum Minerals Limited, 144A, (4) | | | 6.750% | | | | 2/15/20 | | | | BB | | | | 2,430,800 | |
| | | | | |
| | 2,360 | | | First Quantum Minerals Limited, 144A, (4) | | | 7.000% | | | | 2/15/21 | | | | BB | | | | 2,427,850 | |
| | | | | |
| | 4,500 | | | FMG Resources, 144A, (4) | | | 8.250% | | | | 11/01/19 | | | | BB+ | | | | 4,899,373 | |
| | | | | |
| | 2,000 | | | FMG Resources, 144A, (4) | | | 6.875% | | | | 4/01/22 | | | | BB+ | | | | 2,145,000 | |
| | | | | |
| | 2,000 | | | Gold Fields Orogen Holdings BVI Limited, 144A, (4) | | | 4.875% | | | | 10/07/20 | | | | BB+ | | | | 1,840,000 | |
| | | | | |
| | 2,500 | | | GTL Trade Finance Inc., 144A | | | 7.250% | | | | 4/16/44 | | | | BBB– | | | | 2,627,500 | |
| | | | | |
| | 3,100 | | | Imperial Metals Corporation, 144A | | | 7.000% | | | | 3/15/19 | | | | B– | | | | 3,181,375 | |
| | | | | |
| | 3,000 | | | Magnetation LLC Finance Corporation, 144A | | | 11.000% | | | | 5/15/18 | | | | B– | | | | 3,277,500 | |
| | | | | |
| | 1,500 | | | Molycorp Inc., (4) | | | 10.000% | | | | 6/01/20 | | | | B3 | | | | 1,380,000 | |
| | | | | |
| | 3,260 | | | Northland Resources AB | | | 15.000% | | | | 7/15/19 | | | | Caa2 | | | | 1,532,170 | |
| | | | | |
| | 1,552 | | | Northland Resources AB, (10) | | | 4.000% | | | | 10/15/20 | | | | D | | | | 54,318 | |
| | | | | |
| | 2,750 | | | Permian Holdings Incorporated, 144A | | | 10.500% | | | | 1/15/18 | | | | B– | | | | 2,825,625 | |
| | | | | |
| | 1,600 | | | Severstal OAO Via Steel Capital SA, 144A | | | 4.450% | | | | 3/19/18 | | | | BB+ | | | | 1,580,064 | |
| | | | | |
| | 2,000 | | | Tempel Steel Company, 144A, (4) | | | 12.000% | | | | 8/15/16 | | | | CCC+ | | | | 1,980,000 | |
| | | | | |
| | 2,400 | | | Vedanta Resources PLC, 144A | | | 6.000% | | | | 1/31/19 | | | | BB | | | | 2,481,120 | |
| | | | | |
| | 2,400 | | | Wise Metals Group, 144A | | | 8.750% | | | | 12/15/18 | | | | CCC+ | | | | 2,604,000 | |
| | | | | |
| | 1,750 | | | WPE International Cooperatief U.A, 144A | | | 10.375% | | | | 9/30/20 | | | | B+ | | | | 918,750 | |
| | 63,595 | | | Total Metals & Mining | | | | | | | | | | | | | | | 60,562,080 | |
| | | | | |
| | | | Multiline Retail – 0.7% | | | | | | | | | | | | | | | | |
| | | | | |
| | 2,750 | | | Bon-Ton Department Stores Inc., (4) | | | 8.000% | | | | 6/15/21 | | | | B– | | | | 2,619,373 | |
| | | | | |
| | 2,500 | | | J.C. Penney Corporation Inc., (4) | | | 7.400% | | | | 4/01/37 | | | | Caa2 | | | | 2,168,970 | |
| | | | | |
| | 2,450 | | | J.C. Penney Corporation Inc., (4) | | | 6.375% | | | | 10/15/36 | | | | Caa2 | | | | 1,996,750 | |
| | 7,700 | | | Total Multiline Retail | | | | | | | | | | | | | | | 6,785,093 | |
| | | | | |
| | | | Oil, Gas & Consumable Fuels – 14.4% | | | | | | | | | | | | | | | | |
| | | | | |
| | 2,500 | | | Antero Resources Finance Corporation, 144A, (4) | | | 5.125% | | | | 12/01/22 | | | | BB– | | | | 2,568,750 | |
| | | | | |
| | 2,500 | | | Armstrong Energy Inc. | | | 11.750% | | | | 12/15/19 | | | | B– | | | | 2,687,500 | |
| | | | | |
| | 3,000 | CAD | | Athabasca Oil Corporation, 144A | | | 7.500% | | | | 11/19/17 | | | | B | | | | 2,871,234 | |
| | | | | |
| | 3,500 | | | Atlas Energy Holdings Operating Company, (4) | | | 9.250% | | | | 8/15/21 | | | | B– | | | | 3,780,000 | |
| | | | | |
| | 2,500 | | | Baytex Energy Ltd, 144A | | | 5.125% | | | | 6/01/21 | | | | BB | | | | 2,515,625 | |
| | | | | |
| | 2,155 | | | Bill Barrett Corporation, (4) | | | 7.000% | | | | 10/15/22 | | | | B1 | | | | 2,284,300 | |
| | | | | |
| | 2,300 | | | Bluewater Holding BV | | | 10.000% | | | | 12/10/19 | | | | N/R | | | | 2,449,500 | |
| | | | | |
| | 2,159 | | | Calumet Specialty Products | | | 7.625% | | | | 1/15/22 | | | | B+ | | | | 2,320,925 | |
| | | | | |
| | 3,000 | | | CGG SA | | | 6.875% | | | | 1/15/22 | | | | B+ | | | | 2,992,500 | |
| | | | | |
| | 2,000 | | | Chesapeake Energy Corporation | | | 6.875% | | | | 11/15/20 | | | | BB+ | | | | 2,320,000 | |
| | | | | |
| | 3,850 | | | Concho Resources Inc., (4) | | | 5.500% | | | | 10/01/22 | | | | BB+ | | | | 4,143,563 | |
| | | | | |
| | 2,500 | | | Connacher Oil and Gas Limited, 144A, (4) | | | 8.500% | | | | 8/01/19 | | | | B | | | | 1,993,750 | |
| | | | | |
| | 2,750 | | | Crestwood Midstream Partners LP, 144A | | | 6.125% | | | | 3/01/22 | | | | BB | | | | 2,894,375 | |
| | | | | |
| | 2,200 | | | Denbury Resources Incorporated, (4) | | | 4.625% | | | | 7/15/23 | | | | BB | | | | 2,134,462 | |
| | | | | | | | | | | | | | | | | | | | |
Principal
Amount (000) (9) | | | Description (1) | | Coupon | | | Maturity | | | Ratings (6) | | | Value | |
| | | | | |
| | | | Oil, Gas & Consumable Fuels (continued) | | | | | | | | | | | | | | | | |
| | | | | |
| $ | 1,750 | | | Diamondback Energy Inc., 144A | | | 7.625% | | | | 10/01/21 | | | | B– | | | $ | 1,925,000 | |
| | | | | |
| | 3,200 | | | EnQuest PLC, 144A | | | 7.000% | | | | 4/15/22 | | | | B | | | | 3,304,000 | |
| | | | | |
| | 15,000 | NOK | | Exmar NV, (WI/DD) | | | 6.230% | | | | 7/07/17 | | | | N/R | | | | 2,451,560 | |
| | | | | |
| | 20,000 | NOK | | GasLog Limited | | | 7.230% | | | | 6/27/18 | | | | N/R | | | | 3,415,471 | |
| | | | | |
| | 2,875 | | | Gastar Exploration Inc. | | | 8.625% | | | | 5/15/18 | | | | B– | | | | 3,004,375 | |
| | | | | |
| | 3,450 | | | Halcon Resources Corporation, (4) | | | 9.750% | | | | 7/15/20 | | | | CCC+ | | | | 3,764,813 | |
| | | | | |
| | 3,000 | | | Harkand Finance | | | 7.500% | | | | 3/28/19 | | | | N/R | | | | 3,030,000 | |
| | | | | |
| | 2,700 | | | Hiland Partners LP/ Hiland Partners Finance Corp., 144A | | | 5.500% | | | | 5/15/22 | | | | B | | | | 2,733,750 | |
| | | | | |
| | 2,500 | | | Iona Energy Company UK | | | 9.500% | | | | 9/27/18 | | | | N/R | | | | 2,462,500 | |
| | | | | |
| | 2,680 | | | Key Energy Services Inc., (4) | | | 6.750% | | | | 3/01/21 | | | | BB– | | | | 2,787,200 | |
| | | | | |
| | 1,475 | | | Kodiak Oil and Gas Corporation, (4) | | | 5.500% | | | | 2/01/22 | | | | B | | | | 1,530,313 | |
| | | | | |
| | 1,965 | | | Legacy Reserves LP Finance Corporation | | | 6.625% | | | | 12/01/21 | | | | B | | | | 1,994,475 | |
| | | | | |
| | 1,895 | | | Linn Energy LLC Finance Corporation | | | 6.250% | | | | 11/01/19 | | | | B+ | | | | 1,994,488 | |
| | | | | |
| | 2,350 | | | Martin Mid-Stream Partners LP Finance | | | 7.250% | | | | 2/15/21 | | | | B– | | | | 2,491,000 | |
| | | | | |
| | 5,125 | | | MEG Energy Corporation, 144A | | | 7.000% | | | | 3/31/24 | | | | BB | | | | 5,650,313 | |
| | | | | |
| | 3,000 | | | Metro Exploration Holding Inc. | | | 8.000% | | | | 2/14/16 | | | | N/R | | | | 3,007,500 | |
| | | | | |
| | 2,500 | | | Niska Gas Storage Canada ULC Finance Corporation, 144A | | | 6.500% | | | | 4/01/19 | | | | B | | | | 2,400,000 | |
| | | | | |
| | 2,250 | | | Northern Blizzard Resources Inc., 144A | | | 7.250% | | | | 2/01/22 | | | | B– | | | | 2,317,500 | |
| | | | | |
| | 2,300 | | | Oasis Petroleum Inc., 144A | | | 6.875% | | | | 3/15/22 | | | | B+ | | | | 2,507,000 | |
| | | | | |
| | 3,075 | | | Parsley Energy LLC Finance Corporation, 144A | | | 7.500% | | | | 2/15/22 | | | | CCC | | | | 3,282,563 | |
| | | | | |
| | 1,390 | | | PBF Holding Company LLC, (4) | | | 8.250% | | | | 2/15/20 | | | | BB+ | | | | 1,515,100 | |
| | | | | |
| | 2,500 | | | Pertamina PT, 144A | | | 4.875% | | | | 5/03/22 | | | | Baa3 | | | | 2,481,250 | |
| | | | | |
| | 3,150 | | | PetroBakken Energy Limited, 144A, (4) | | | 8.625% | | | | 2/01/20 | | | | B– | | | | 3,307,500 | |
| | | | | |
| | 2,000 | | | Rosetta Resources Inc., (4) | | | 5.875% | | | | 6/01/24 | | | | B+ | | | | 2,080,000 | |
| | | | | |
| | 2,800 | | | Rosneft International Finance, 144A, (4) | | | 4.199% | | | | 3/06/22 | | | | Baa1 | | | | 2,600,500 | |
| | | | | |
| | 3,274 | | | Sabine Pass Liquefaction LLC, (4) | | | 5.625% | | | | 2/01/21 | | | | BB+ | | | | 3,462,255 | |
| | | | | |
| | 2,852 | | | Sabine Pass LNG LP | | | 7.500% | | | | 11/30/16 | | | | BB+ | | | | 3,151,460 | |
| | | | | |
| | 3,000 | | | Sanchez Energy Corporation, 144A | | | 7.750% | | | | 6/15/21 | | | | B– | | | | 3,255,000 | |
| | | | | |
| | 3,800 | | | Sandridge Energy Inc., (4) | | | 8.125% | | | | 10/15/22 | | | | B2 | | | | 4,184,750 | |
| | | | | |
| | 3,000 | | | Sanjel Corporation, 144A | | | 7.500% | | | | 6/19/19 | | | | N/R | | | | 3,000,000 | |
| | | | | |
| | 2,750 | | | Seadrill Limited, 144A, (4) | | | 6.125% | | | | 9/15/20 | | | | N/R | | | | 2,798,125 | |
| | | | | |
| | 2,500 | | | Seitel Inc., (4) | | | 9.500% | | | | 4/15/19 | | | | B | | | | 2,687,500 | |
| | | | | |
| | 11,000 | NOK | | Ship Finance International Limited | | | 6.770% | | | | 10/19/17 | | | | N/R | | | | 1,865,060 | |
| | | | | |
| | 13,000 | NOK | | Ship Finance International Limited | | | 5.930% | | | | 3/19/19 | | | | N/R | | | | 2,119,387 | |
| | | | | |
| | 1,200 | | | Sterling Resources UK Limited | | | 9.000% | | | | 4/30/19 | | | | N/R | | | | 1,206,000 | |
| | | | | |
| | 1,750 | | | Summit Midstream Holdings LLC Finance | | | 7.500% | | | | 7/01/21 | | | | B | | | | 1,907,500 | |
| | | | | |
| | 3,030 | | | Talos Production LLC, 144A | | | 9.750% | | | | 2/15/18 | | | | CCC+ | | | | 3,211,800 | |
| | | | | |
| | 2,025 | | | Vanguard Natural Resources Finance, (4) | | | 7.875% | | | | 4/01/20 | | | | B | | | | 2,192,063 | |
| | | | | |
| | 2,895 | | | Western Refining Inc., (4) | | | 6.250% | | | | 4/01/21 | | | | B+ | | | | 3,025,275 | |
| | | | Total Oil, Gas & Consumable Fuels | | | | | | | | | | | | | | | 144,060,830 | |
Nuveen High Income Bond Fund (continued)
Portfolio of Investments June 30, 2014
| | | | | | | | | | | | | | | | | | | | |
Principal
Amount (000) (9) | | | Description (1) | | Coupon | | | Maturity | | | Ratings (6) | | | Value | |
| | | | | |
| | | | Paper & Forest Products – 1.9% | | | | | | | | | | | | | | | | |
| | | | | |
| $ | 3,500 | | | Appvion Inc., 144A | | | 9.000% | | | | 6/01/20 | | | | B2 | | | $ | 3,482,498 | |
| | | | | |
| | 3,550 | | | Millar Western Forest Products Ltd | | | 8.500% | | | | 4/01/21 | | | | B– | | | | 3,789,625 | |
| | | | | |
| | 2,450 | | | Resolute Forest Products, (4) | | | 5.875% | | | | 5/15/23 | | | | BB– | | | | 2,413,250 | |
| | | | | |
| | 3,050 | | | Sappi Papier Holding GMBH, 144A | | | 6.625% | | | | 4/15/21 | | | | BB | | | | 3,217,750 | |
| | | | | |
| | 1,800 | | | Stora Enso Oyj | | | 7.250% | | | | 4/15/36 | | | | BB | | | | 1,836,000 | |
| | | | | |
| | 2,000 | | | Tembec Industries, Inc. | | | 11.250% | | | | 12/15/18 | | | | B3 | | | | 2,165,000 | |
| | | | | |
| | 1,500 | | | Verso Paper Holdings LLC | | | 11.750% | | | | 1/15/19 | | | | Caa1 | | | | 1,578,750 | |
| | | | | |
| | 1,000 | | | Verso Paper Holdings LLC, (4) | | | 11.750% | | | | 1/15/19 | | | | Caa3 | | | | 910,000 | |
| | 18,850 | | | Total Paper & Forest Products | | | | | | | | | | | | | | | 19,392,873 | |
| | | | | |
| | | | Personal Products – 0.4% | | | | | | | | | | | | | | | | |
| | | | | |
| | 3,750 | | | Albea Beauty Holdings SA, 144A, (4) | | | 8.375% | | | | 11/01/19 | | | | B+ | | | | 4,078,125 | |
| | | | | |
| | | | Pharmaceuticals – 0.5% | | | | | | | | | | | | | | | | |
| | | | | |
| | 2,500 | | | Grifols Worldwide Operations Limited, 144A | | | 5.250% | | | | 4/01/22 | | | | B+ | | | | 2,593,750 | |
| | | | | |
| | 1,975 | | | VP Escrow Corporation, 144A | | | 6.375% | | | | 10/15/20 | | | | B1 | | | | 2,098,438 | |
| | 4,475 | | | Total Pharmaceuticals | | | | | | | | | | | | | | | 4,692,188 | |
| | | | | |
| | | | Real Estate Investment Trust – 0.5% | | | | | | | | | | | | | | | | |
| | | | | |
| | 1,000 | | | CTR Partnership LP/CareTrust Capital Corporation, 144A | | | 5.875% | | | | 6/01/21 | | | | B+ | | | | 1,007,500 | |
| | | | | |
| | 1,750 | | | KWG Property Holdings Limited | | | 13.250% | | | | 3/22/17 | | | | B+ | | | | 2,008,125 | |
| | | | | |
| | 2,235 | | | Realogy Group LLC / Realogy Co-Issuer Corporation, 144A, (4) | | | 4.500% | | | | 4/15/19 | | | | B | | | | 2,229,413 | |
| | 4,985 | | | Total Real Estate Investment Trust | | | | | | | | | | | | | | | 5,245,038 | |
| | | | |
| | | | Real Estate Management & Development – 1.6% | | | | | | | | | | | | | |
| | | | | |
| | 2,000 | | | Country Garden Holding Company, 144A | | | 7.500% | | | | 1/10/23 | | | | BB+ | | | | 1,927,600 | |
| | | | | |
| | 2,000 | | | Gemdale International Investment Limited | | | 7.125% | | | | 11/16/17 | | | | BB– | | | | 2,055,000 | |
| | | | | |
| | 4,000 | | | Hunt Companies Inc. | | | 9.625% | | | | 3/01/21 | | | | N/R | | | | 4,190,000 | |
| | | | | |
| | 3,500 | | | Kaisa Group Holdings Limited, 144A | | | 8.875% | | | | 3/19/18 | | | | BB– | | | | 3,596,250 | |
| | | | | |
| | 3,965 | | | Mattamy Group Corporation, 144A, (4) | | | 6.500% | | | | 11/15/20 | | | | BB | | | | 4,064,125 | |
| | 15,465 | | | Total Real Estate Management & Development | | | | | | | | | | | | | | | 15,832,975 | |
| | | | | |
| | | | Road & Rail – 1.1% | | | | | | | | | | | | | | | | |
| | | | | |
| | 3,750 | | | Hertz Corporation | | | 5.875% | | | | 10/15/20 | | | | B | | | | 3,918,748 | |
| | | | | |
| | 1,950 | | | Jack Cooper Holdings Corporation, 144A | | | 9.250% | | | | 6/01/20 | | | | B2 | | | | 2,145,000 | |
| | | | | |
| | 2,500 | | | JCH Parent Inc., 144A | | | 10.500% | | | | 3/15/19 | | | | Caa2 | | | | 2,506,250 | |
| | | | | |
| | 2,750 | | | Watco Companies LLC Finance, 144A | | | 6.375% | | | | 4/01/23 | | | | B3 | | | | 2,805,000 | |
| | 10,950 | | | Total Road & Rail | | | | | | | | | | | | | | | 11,374,998 | |
| | | | | |
| | | | Semiconductors & Equipment – 0.3% | | | | | | | | | | | | | | | | |
| | | | | |
| | 2,500 | | | Advanced Micro Devices, Inc., 144A | | | 7.000% | | | | 7/01/24 | | | | B | | | | 2,553,125 | |
| | | | | |
| | | | Software – 0.5% | | | | | | | | | | | | | | | | |
| | | | | |
| | 2,000 | | | BCP Singapore VI Cayman Financing Company Limited, 144A | | | 8.000% | | | | 4/15/21 | | | | BB– | | | | 2,045,000 | |
| | | | | |
| | 3,500 | | | Boxer Parent Company Inc./BMC Software, 144A, (4) | | | 9.000% | | | | 10/15/19 | | | | CCC+ | | | | 3,412,500 | |
| | 5,500 | | | Total Software | | | | | | | | | | | | | | | 5,457,500 | |
| | | | | | | | | | | | | | | | | | | | |
Principal
Amount (000) (9) | | | Description (1) | | Coupon | | | Maturity | | | Ratings (6) | | | Value | |
| | | | | |
| | | | Specialty Retail – 1.1% | | | | | | | | | | | | | | | | |
| | | | | |
| $ | 2,000 | | | Guitar Center Inc., 144A, (4) | | | 9.625% | | | | 4/15/20 | | | | CCC | | | $ | 1,905,000 | |
| | | | | |
| | 2,850 | | | Neiman Marcus Mariposa Borrower / Merger Sub LLC, 144A, (4) | | | 8.000% | | | | 10/15/21 | | | | CCC+ | | | | 3,070,875 | |
| | | | | |
| | 1,800 | | | The Men’s Warehouse Inc., 144A, (4) | | | 7.000% | | | | 7/01/22 | | | | B2 | | | | 1,863,000 | |
| | | | | |
| | 1,450 | | | Toys “R” Us, Inc., (4) | | | 10.375% | | | | 8/15/17 | | | | CCC | | | | 1,218,000 | |
| | | | | |
| | 2,500 | | | Toys “R” Us Property Company II LLC, (4) | | | 8.500% | | | | 12/01/17 | | | | Ba3 | | | | 2,553,125 | |
| | 10,600 | | | Total Specialty Retail | | | | | | | | | | | | | | | 10,610,000 | |
| | | | | |
| | | | Technology, Hardware, Storage & Peripherals – 0.3% | | | | | | | | | | | | | | | | |
| | | | | |
| | 2,500 | | | ViaSystems Inc., 144A | | | 7.875% | | | | 5/01/19 | | | | B+ | | | | 2,643,750 | |
| | | | | |
| | | | Textiles, Apparel & Luxury Goods – 0.2% | | | | | | | | | | | | | | | | |
| | | | | |
| | 2,000 | | | Polymer Group Inc., 144A | | | 6.875% | | | | 6/01/19 | | | | CCC+ | | | | 2,032,500 | |
| | | | | |
| | | | Tobacco – 0.2% | | | | | | | | | | | | | | | | |
| | | | | |
| | 2,000 | | | Vector Group Limited, 144A, (4) | | | 7.750% | | | | 2/15/21 | | | | Ba3 | | | | 2,130,000 | |
| | | | | |
| | | | Transportation Infrastructure – 0.9% | | | | | | | | | | | | | | | | |
| | | | | |
| | 2,500 | EUR | | CMA CGM SA, 144A | | | 8.750% | | | | 12/15/18 | | | | B– | | | | 3,612,077 | |
| | | | | |
| | 5,000 | | | Navigator Holdings Limited | | | 9.000% | | | | 12/18/17 | | | | N/R | | | | 5,468,750 | |
| | | | Total Transportation Infrastructure | | | | | | | | | | | | | | | 9,080,827 | |
| | | | | |
| | | | Wireless Telecommunication Services – 3.5% | | | | | | | | | | | | | | | | |
| | | | | |
| | 15,500 | SEK | | AINMT Scandinavia Holdings AB | | | 9.750% | | | | 3/19/19 | | | | N/R | | | | 2,377,815 | |
| | | | | |
| | 2,000 | | | Citizens Communications Company | | | 9.000% | | | | 8/15/31 | | | | Ba2 | | | | 2,155,000 | |
| | | | | |
| | 2,450 | | | Comcel Trust, 144A | | | 6.875% | | | | 2/06/24 | | | | Ba1 | | | | 2,646,000 | |
| | | | | |
| | 2,750 | | | Digicel Group, Limited, 144A | | | 8.250% | | | | 9/30/20 | | | | B– | | | | 2,997,500 | |
| | | | | |
| | 2,075 | | | FairPoint Communications Inc., 144A | | | 8.750% | | | | 8/15/19 | | | | B | | | | 2,235,813 | |
| | | | | |
| | 2,500 | | | Frontier Communications Corporation, (4) | | | 8.500% | | | | 4/15/20 | | | | Ba2 | | | | 2,950,000 | |
| | | | | |
| | 2,350 | | | Inmarsat Finance PLC, 144A | | | 4.875% | | | | 5/15/22 | | | | BB+ | | | | 2,373,500 | |
| | | | | |
| | 2,135 | | | Sprint Capital Corporation | | | 8.750% | | | | 3/15/32 | | | | BB– | | | | 2,465,925 | |
| | | | | |
| | 1,750 | | | Sprint Corporation, 144A | | | 7.250% | | | | 9/15/21 | | | | BB– | | | | 1,929,375 | |
| | | | | |
| | 500 | | | Sprint Nextel Corporation | | | 7.000% | | | | 8/15/20 | | | | BB– | | | | 553,125 | |
| | | | | |
| | 4,300 | | | Telecom Italia SpA, 144A, (4) | | | 5.303% | | | | 5/30/24 | | | | BBB– | | | | 4,316,125 | |
| | | | | |
| | 2,800 | EUR | | Wind Acquisition Finance SA, 144A, (WI/DD) | | | 4.000% | | | | 7/15/20 | | | | BB | | | | 3,824,456 | |
| | | | | |
| | 4,000 | | | Wind Acquisition Finance SA, 144A | | | 7.375% | | | | 4/23/21 | | | | B | | | | 4,270,000 | |
| | | | Total Wireless Telecommunication Services | | | | | | | | | | | | | | | 35,094,634 | |
| | | | Total Corporate Bonds (cost $775,464,904) | | | | | | | | | | | | | | | 794,476,630 | |
| | | | | |
Principal
Amount (000) | | | Description (1) | | Coupon | | | Maturity | | | Ratings (6) | | | Value | |
| | | | | |
| | | | CONVERTIBLE BONDS – 0.4% | | | | | | | | | | | | | | | | |
| | | | | |
| | | | Oil, Gas & Consumable Fuels – 0.3% | | | | | | | | | | | | | | | | |
| | | | | |
| $ | 3,300 | | | DCP Midstream LLC | | | 5.850% | | | | 5/21/43 | | | | Baa3 | | | $ | 3,135,000 | |
Nuveen High Income Bond Fund (continued)
Portfolio of Investments June 30, 2014
| | | | | | | | | | | | | | | | | | | | |
Principal
Amount (000) | | | Description (1) | | Coupon | | | Maturity | | | Ratings (6) | | | Value | |
| | | | | |
| | | | Metals & Mining – 0.1% | | | | | | | | | | | | | | | | |
| | | | | |
| $ | 1,500 | | | Great Western Mineral Group | | | 8.000% | | | | 4/06/17 | | | | N/R | | | $ | 375,000 | |
| $ | 4,800 | | | Total Convertible Bonds (cost $4,710,000) | | | | | | | | | | | | | | | 3,510,000 | |
| | | | | |
Principal
Amount (000) (9) | | | Description (1) | | Coupon | | | Maturity | | | Ratings (6) | | | Value | |
| | | | | |
| | | | $1,000 PAR (OR SIMILAR) INSTITUTIONAL PREFERRED – 5.2% | | | | | | | | | | | | | | | | |
| | | | | |
| | | | Banks – 3.2% | | | | | | | | | | | | | | | | |
| | | | | |
| | 4,970 | EUR | | Barclays PLC | | | 6.500% | | | | N/A (12) | | | | BB+ | | | $ | 6,856,463 | |
| | | | | |
| | 3,000 | EUR | | Barclays PLC | | | 8.000% | | | | N/A (12) | | | | BB+ | | | | 4,473,504 | |
| | | | | |
| $ | 3,385 | | | BBVA International Preferred Uniperson, (4) | | | 5.919% | | | | N/A (12) | | | | BB | | | | 3,528,863 | |
| | | | | |
| | 3,150 | | | Dresdner Funding Trust, 144A | | | 8.152% | | | | 6/30/31 | | | | BB | | | | 3,827,250 | |
| | | | | |
| | 4,138 | | | Lloyd’s Banking Group PLC, (4) | | | 7.500% | | | | N/A (12) | | | | BB | | | | 4,402,832 | |
| | | | | |
| | 2,000 | | | RBS Capital Trust I | | | 2.100% | | | | N/A (12) | | | | BB | | | | 2,000,000 | |
| | | | | |
| | 2,000 | | | RBS Capital Trust IV, (4) | | | 1.034% | | | | N/A (12) | | | | BB | | | | 1,970,000 | |
| | | | | |
| | 2,900 | | | Societe Generale, 144A | | | 0.980% | | | | N/A (12) | | | | BBB– | | | | 2,610,000 | |
| | | | | |
| | 2,000 | | | Societe Generale, 144A, (4) | | | 7.875% | | | | N/A (12) | | | | BB+ | | | | 2,132,500 | |
| | | | Total Banks | | | | | | | | | | | | | | | 31,801,412 | |
| | | | | |
| | | | Capital Markets – 0.7% | | | | | | | | | | | | | | | | |
| | | | | |
| | 3,500 | EUR | | Baggot Securities Limited, 144A | | | 10.240% | | | | N/A (12) | | | | N/R | | | | 5,271,806 | |
| | | | | |
| | 2,840 | | | Goldman Sachs Capital II | | | 4.000% | | | | N/A (12) | | | | BB+ | | | | 2,272,000 | |
| | | | Total Capital Markets | | | | | | | | | | | | | | | 7,543,806 | |
| | | | | |
| | | | Consumer Finance – 0.1% | | | | | | | | | | | | | | | | |
| | | | | |
| | 2,000 | | | AFGC Capital Trust I, 144A | | | 6.000% | | | | 1/15/67 | | | | Caa2 | | | | 1,720,000 | |
| | | | | |
| | | | Industrial Conglomerates – 0.2% | | | | | | | | | | | | | | | | |
| | | | | |
| | 2,000 | | | OAS Financial Limited, 144A | | | 8.875% | | | | N/A (12) | | | | BB– | | | | 1,990,000 | |
| | | | | |
| | | | Insurance – 0.8% | | | | | | | | | | | | | | | | |
| | | | | |
| | 5,000 | | | Genworth Financial Inc., (4) | | | 6.150% | | | | 11/15/66 | | | | Ba1 | | | | 4,756,250 | |
| | | | | |
| | 3,000 | | | Glen Meadows Pass Through Trust | | | 6.505% | | | | 2/12/67 | | | | BB+ | | | | 2,970,000 | |
| | 8,000 | | | Total Insurance | | | | | | | | | | | | | | | 7,726,250 | |
| | | | | |
| | | | Oil, Gas & Consumable Fuels – 0.2% | | | | | | | | | | | | | | | | |
| | | | | |
| | 1,750 | | | Odebrecht Oil and Gas Finance, (4) | | | 7.000% | | | | N/A (12) | | | | BBB– | | | | 1,806,875 | |
| | | | Total $1,000 Par (or similar) Institutional Preferred (cost $46,270,714) | | | | | | | | | | | | | | | 52,588,343 | |
| | | | | |
Principal
Amount (000) | | | Description (1) | | Coupon | | | Maturity | | | Ratings (6) | | | Value | |
| | | | | |
| | | | ASSET-BACKED SECURITIES – 0.0% | | | | | | | | | | | | | | | | |
| | | | | |
| $ | 2 | | | Green Tree Financial Corporation, Manufactured Housing Contract Pass Through Certificates, Series 1998-1 | | | 6.040% | | | | 11/01/29 | | | | AA | | | $ | 2,058 | |
| $ | 2 | | | Total Asset-Backed Securities
(cost $1,997) | | | | | | | | | | | | | | | 2,058 | |
| | | | | | | | | | | | | | | | |
| Shares | | | Description (1), (5) | | | | | | | | | Value | |
| | | | | |
| | | | INVESTMENT COMPANIES – 1.4% | | | | | | | | | | | | |
| | | | | |
| | 191,000 | | | Blackrock Credit Allocation Income Trust IV | | | | | | | | | | $ | 2,626,250 | |
| | | | | |
| | 80,000 | | | BlackRock MuniHoldings Insured Fund Inc. | | | | | | | | | | | 1,056,800 | |
| | | | | |
| | 135,500 | | | First Trust Strategic High Income Fund II | | | | | | | | | | | 2,215,425 | |
| | | | | |
| | 37,500 | | | Gabelli Global Gold Natural Resources and Income Trust | | | | | | | | | | | 411,750 | |
| | | | | |
| | 200,000 | | | Invesco Dynamic Credit Opportunities Fund | | | | | | | | | | | 2,590,000 | |
| | | | | |
| | 55,000 | | | Invesco Municipal Income Opportunities Trust | | | | | | | | | | | 382,800 | |
| | | | | |
| | 208,500 | | | Pimco Income Strategy Fund | | | | | | | | | | | 2,572,890 | |
| | | | | |
| | 187,000 | | | Pioneer Floating Rate Trust | | | | | | | | | | | 2,331,890 | |
| | | | | |
| | 21,351 | | | WhiteHorse Finance Incorporated, (4) | | | | | | | | | | | 305,319 | |
| | | | Total Investment Companies (cost $13,950,933) | | | | | | | | | | | 14,493,124 | |
| | | | | |
| Shares | | | Description (1) | | | | | | | | | Value | |
| | | | | |
| | | | WARRANTS – 0.0% | | | | | | | | | | | | |
| | | | | |
| | 19,654 | | | Adamas Finance Asia Limited, (3) | | | | | | | | | | $ | — | |
| | | | | |
| | 6,706 | | | FairPoint Communications Inc., (19) | | | | | | | | | | | 201 | |
| | | | Total Warrants (cost $0) | | | | | | | | | | | 201 | |
| | | | Total Long-Term Investments (cost $936,355,092) | | | | | | | | | | | 968,779,962 | |
| | | | | |
| Shares | | | Description (1) | | Coupon | | | | | | | Value | |
| | | | |
| | | | INVESTMENTS PURCHASED WITH COLLATERAL FROM SECURITIES LENDING – 18.0% | | | | | | | | | |
| | | | | |
| | | | Money Market Funds – 18.0% | | | | | | | | | | | | |
| | | | | |
| | 180,336,996 | | | Mount Vernon Securities Lending Trust Prime Portfolio, (14) | | | 0.185% (13) | | | | | | | $ | 180,336,996 | |
| | | | Total Investments Purchased with Collateral from Securities Lending (cost $180,336,996) | | | | | | | | 180,336,996 | |
| | | | | |
| Shares | | | Description (1) | | Coupon | | | | | | | Value | |
| | | | | |
| | | | SHORT-TERM INVESTMENTS – 3.8% | | | | | | | | | | | | |
| | | | | |
| | | | Money Market Funds – 3.8% | | | | | | | | | | | | |
| | | | | |
| | 37,742,974 | | | First American Treasury Obligations Fund, Class Z | | | 0.000% (13) | | | | | | | $ | 37,742,974 | |
| | | | Total Short-Term Investments (cost $37,742,974) | | | | | | | | | | | 37,742,974 | |
| | | | Total Investments (cost $1,154,435,062) – 118.4% | | | | | | | | | | | 1,186,859,932 | |
| | | | Other Assets Less Liabilities – (18.4)% (15) | | | | | | | | | | | (184,317,882 | ) |
| | | | Net Assets – 100% | | | | | | | | | | $ | 1,002,542,050 | |
Nuveen High Income Bond Fund (continued)
Portfolio of Investments June 30, 2014
Investments in Derivatives as of June 30, 2014
Forward Foreign Currency Exchange Contracts outstanding:
| | | | | | | | | | | | | | | | | | | | | | |
| Counterparty | | Currency Contracts to Deliver | | Amount
(Local Currency) | | | In Exchange
For Currency | | | Amount
(Local Currency) | | | Settlement
Date | | | Unrealized
Appreciation
(Depreciation)
(U.S. Dollars) (15) | |
| Citigroup | | Canadian Dollar | | | 11,885,000 | | | | U.S. Dollar | | | | 10,912,079 | | | | 8/29/14 | | | $ | (209,221 | ) |
| Citigroup | | Euro | | | 25,845,900 | | | | U.S. Dollar | | | | 35,239,075 | | | | 8/29/14 | | | | (159,721 | ) |
| Citigroup | | Euro | | | 2,500,000 | | | | U.S. Dollar | | | | 3,410,300 | | | | 8/29/14 | | | | (13,724 | ) |
| Citigroup | | Euro | | | 2,100,000 | | | | U.S. Dollar | | | | 2,868,566 | | | | 8/29/14 | | | | (7,614 | ) |
| Citigroup | | Euro | | | 1,500,000 | | | | U.S. Dollar | | | | 2,045,603 | | | | 8/29/14 | | | | (8,812 | ) |
| Citigroup | | Norwegian Krone | | | 90,660,000 | | | | U.S. Dollar | | | | 15,158,507 | | | | 8/29/14 | | | | 412,464 | |
| Citigroup | | Norwegian Krone | | | 15,000,000 | | | | U.S. Dollar | | | | 2,431,907 | | | | 8/29/14 | | | | (7,876 | ) |
| Citigroup | | Norwegian Krone | | | 12,000,000 | | | | U.S. Dollar | | | | 1,955,787 | | | | 8/29/14 | | | | 3,961 | |
| Citigroup | | Norwegian Krone | | | 3,000,000 | | | | U.S. Dollar | | | | 489,676 | | | | 8/29/14 | | | | 1,720 | |
| Citigroup | | Swedish Krona | | | 15,525,000 | | | | U.S. Dollar | | | | 2,337,067 | | | | 8/29/14 | | | | 15,019 | |
| | | | | | | | | | | | | | | | | | | | | $ | 26,196 | |
Credit Default Swaps outstanding:
| | | | | | | | | | | | | | | | | | | | | | | | | | | | | | | | |
| Counterparty | | Referenced Entity | | | Buy/Sell
Protection (16) | | | Current
Credit
Spread (17) | | | Notional
Amount | | | Fixed Rate
(Annualized) | | | Termination
Date | | | Value | | | Unrealized
Appreciation
(Depreciation) | |
Barclays Bank PLC* | | | Markit CDX
NA HY22 Index | | | | Buy | | | | 3.04 | % | | $ | 24,750,000 | | | | 5.000 | % | | | 6/20/19 | | | $ | (2,167,748 | ) | | $ | (301,627 | ) |
| * | Chicago Mercantile Exchange is the clearing house for this transaction. |
Interest Rate Swaps outstanding:
| | | | | | | | | | | | | | | | | | | | | | | | | | | | | | | | |
Counterparty | | Notional
Amount | | | Fund
Pay/Receive
Floating Rate | | | Floating
Rate Index | | | Fixed Rate
(Annualized) | | | Fixed Rate
Payment
Frequency | | | Termination
Date | | | Value | | | Unrealized
Appreciation
(Depreciation) | |
Bank of America* | | $ | 37,000,000 | | | | Receive | | | | 3-Month
USD-LIBOR-BBA | | | | 1.573 | % | | | Semi-Annually | | | | 10/10/18 | | | $ | (269,071 | ) | | $ | (269,555 | ) |
| * | Chicago Mercantile Exchange is the clearing house for this transaction. |
Futures Contracts outstanding:
| | | | | | | | | | | | | | | | | | | | |
| Description | | Contract
Position | | | Number of
Contracts | | | Contract
Expiration | | | Notional
Amount at
Value | | | Unrealized
Appreciation
(Depreciation) | |
U.S. Treasury 5-Year Note | | | Short | | | | (261 | ) | | | 9/14 | | | $ | (31,179,305 | ) | | $ | 59,266 | |
U.S. Treasury Ultra Bond | | | Short | | | | (19 | ) | | | 9/14 | | | | (2,848,812 | ) | | | 17,760 | |
| | | | | | | | | | | | | | | $ | (34,028,117 | ) | | $ | 77,026 | |
| | For Fund portfolio compliance purposes, the Fund’s industry classifications refer to any one or more of the industry sub-classifications used by one or more widely recognized market indexes or ratings group indexes, and/or as defined by Fund management. This definition may not apply for purposes of this report, which may combine industry sub-classifications into sectors for reporting ease. |
| (1) | All percentages shown in the Portfolio of Investments are based on net assets. |
| (2) | Non-income producing; issuer has not declared a dividend within the past twelve months. |
| (3) | Investment valued at fair value using methods determined in good faith by, or at the discretion of, the Nuveen funds’ Board of Directors/Trustees. For fair value measurement disclosure purposes, investment classified as Level 3. See Notes to Financial Statements, Note 2-Investment Valuation and Fair Value Measurements for more information. |
| (4) | Investment, or a portion of investment, is out on loan for securities lending. The total value of securities out on loan as of the end of the reporting period was $175,825,761. |
| (5) | A copy of the most recent financial statements for the exchange-traded funds and investment companies in which the Fund invests can be obtained directly from the Securities and Exchange Commission on its website at http://www.sec.gov. |
| (6) | Ratings (not covered by the report of independent registered public accounting firm): Using the highest of Standard & Poor’s Group (“Standard & Poor’s”), Moody’s Investors Service, Inc. (“Moody’s”) or Fitch, Inc. (“Fitch”) rating. Ratings below BBB by Standard & Poor’s, Baa by Moody’s or BBB by Fitch are considered to be below investment grade. Holdings designated N/R are not rated by any of these national rating agencies. |
| (7) | Senior loans generally are subject to mandatory and/or optional prepayment. Because of these mandatory prepayment conditions and because there may be significant economic incentives for a borrower to prepay, prepayments of senior loans may occur. As a result, the actual remaining maturity of senior loans held may be substantially less than the stated maturities shown. |
| (8) | Senior loans generally pay interest at rates which are periodically adjusted by reference to a base short-term, floating lending rate plus an assigned fixed rate. These floating lending rates are generally (i) the lending rate referenced by the London Inter-Bank Offered Rate (“LIBOR”), or (ii) the prime rate offered by one or more major United States banks. Senior loans may be considered restricted in that the Fund ordinarily is contractually obligated to receive approval from the agent bank and/or borrower prior to the disposition of a senior loan. The rate shown is the coupon as of the end of the reporting period. |
| (9) | Principal Amount (000) denominated in U.S. Dollars, unless otherwise noted. |
| (10) | At or subsequent to the end of the reporting period, this security is non-income producing. Non-income producing, in the case of a fixed-income security, generally denotes that the issuer has (1) defaulted on the payment of principal or interest, (2) is under the protection of the Federal Bankruptcy Court or (3) the Fund’s Adviser has concluded that the issue is not likely to meet its future interest payment obligations and has directed the Fund’s custodian to cease accruing additional income on the Fund’s records. |
| (11) | Principal Amount (000) rounds to less than $1,000. |
| (12) | Perpetual security. Maturity date is not applicable. |
| (13) | The rate shown is the annualized seven-day effective yield as of the end of the reporting period. |
| (14) | The Fund may loan securities representing up to one third of the fair value of its total assets (which includes collateral for securities on loan) to broker-dealers, banks and other institutions. The Fund maintains collateral equal to at least 100% of the fair value of the securities loaned. The cash collateral received by the Fund is invested in this money market fund. See Notes to Financial Statements, Note 3 – Portfolio Securities and Investments in Derivatives, Securities Lending for more information. |
| (15) | Other Assets Less Liabilities includes the Unrealized Appreciation (Depreciation) of certain derivative instruments as listed within Investments in Derivatives as of the end of the reporting period. |
| (16) | The Fund entered into the credit default swaps to gain investment exposure to the referenced entity. Selling protection has a similar credit risk position to owning the referenced entity. Buying protection has a similar credit risk position to selling the referenced entity short. |
| (17) | The credit spread generally serves as an indication of the current status of the payment/performance risk and therefore the likelihood of default of the credit derivative. The credit spread also reflects the cost of buying/selling protection and may include upfront payments required to be made to enter into a credit default swap contract. Higher credit spreads are indicative of higher likelihood of performance by the seller of protection. |
| (18) | For fair value measurement disclosure purposes, $25 Par (or similar) Retail Preferred classified as Level 2. See Notes to Financial Statements, Note 2 – Investment Valuation and Fair Value Measurements for more information. |
| (19) | For fair value measurement disclosure purposes, Warrant classified as Level 2. See Notes to Financial Statements, Note 2 – Investment Valuation and Fair Value Measurements for more information. |
| REIT | Real Estate Investment Trust. |
| Reg S | Regulation S allows U.S. companies to sell securities to persons or entities located outside of the United States without registering those securities with the Securities and Exchange Commission. Specifically, Regulation S provides a safe harbor from the registration requirements of the Securities Act for the offers and sales of securities by both foreign and domestic issuers that are made outside the United States. |
| WI/DD | Investment, or portion of investment, purchased on a when-issued or delayed delivery basis. |
| 144A | Investment is exempt from registration under Rule 144A of the Securities Act of 1933, as amended. These investments may only be resold in transactions exempt from registration, which are normally those transactions with qualified institutional buyers. |
| USD-LIBOR-BBA | United States Dollar-London Inter-Bank Offered Rate British Bankers’ Association. |
See accompanying notes to financial statements.
Nuveen Strategic Income Fund
Portfolio of Investments June 30, 2014
| | | | | | | | | | | | | | | | | | | | |
| Shares | | | Description (1) | | | | | | | | | | | Value | |
| | | | | |
| | | | LONG-TERM INVESTMENTS – 96.9% | | | | | | | | | | | | | | | | |
| | | | | |
| | | | COMMON STOCKS – 0.0% | | | | | | | | | | | | | | | | |
| | | | | |
| | | | Building Products – 0.0% | | | | | | | | | | | | | | | | |
| | | | | |
| | 50 | | | Dayton Superior, Class A, (2), (3) | | | | | | | | | | | | | | $ | 2,839 | |
| | | | | |
| | 55 | | | Dayton Superior, Class 1, (2), (3) | | | | | | | | | | | | | | | 3,154 | |
| | | | Total Building Products | | | | | | | | | | | | | | | 5,993 | |
| | | | Total Common Stocks (cost $20,079) | | | | | | | | | | | | | | | 5,993 | |
| | | | | |
| Shares | | | Description (1) | | Coupon | | | | | | Ratings (4) | | | Value | |
| | | | | |
| | | | CONVERTIBLE PREFERRED SECURITIES – 0.1% | | | | | | | | | | | | | | | | |
| | | | | |
| | | | Electric Utilities – 0.1% | | | | | | | | | | | | | | | | |
| | | | | |
| | 10,000 | | | Exelon Corporation | | | 6.500% | | | | | | | | BBB– | | | $ | 539,466 | |
| | | | Total Convertible Preferred Securities (cost $503,000) | | | | | | | | | | | | | | | 539,466 | |
| | | | | |
Principal
Amount (000) | | | Description (1) | | Coupon (6) | | | Maturity (5) | | | Ratings (4) | | | Value | |
| | | | | |
| | | | VARIABLE RATE SENIOR LOAN INTERESTS – 1.1% (6) | | | | | | | | | | | | | | | | |
| | | | | |
| | | | Auto Components – 0.1% | | | | | | | | | | | | | | | | |
| | | | | |
| $ | 1,000 | | | Cooper-Standard Automotive Inc., Term Loan B | | | 4.000% | | | | 3/28/21 | | | | BB– | | | $ | 1,000,600 | |
| | | | | |
| | | | Electrical Equipment – 0.1% | | | | | | | | | | | | | | | | |
| | | | | |
| | 500 | | | Custom Sensors & Technologies Inc., First Lien Term Loan, (WI/DD) | | | TBD | | | | TBD | | | | B | | | | 503,750 | |
| | | | | |
| | | | Health Care Providers & Services – 0.3% | | | | | | | | | | | | | | | | |
| | | | | |
| | 2,000 | | | RegionalCare Hospital Partners Inc., First Lien Term Loan | | | 6.000% | | | | 4/21/19 | | | | B | | | | 2,005,000 | |
| | | | | |
| | | | Hotels, Restaurants & Leisure – 0.1% | | | | | | | | | | | | | | | | |
| | | | | |
| | 993 | | | Rock Ohio Caesar LLC, Term Loan B | | | 5.000% | | | | 3/29/19 | | | | BB– | | | | 978,853 | |
| | | | | |
| | | | Independent Power & Renewable Electricity Producers – 0.1% | | | | | | | | | | | | | | | | |
| | | | | |
| | 65 | | | Empire Generating Company LLC, Term Loan C | | | 5.250% | | | | 3/13/21 | | | | B+ | | | | 65,570 | |
| | | | | |
| | 935 | | | Empire Generating Company LLC | | | 5.250% | | | | 3/13/21 | | | | B+ | | | | 942,183 | |
| | 1,000 | | | Total Independent Power & Renewable Electricity Producers | | | | | | | | | | | | | | | 1,007,753 | |
| | | | | |
| | | | Oil, Gas & Consumable Fuels – 0.3% | | | | | | | | | | | | | | | | |
| | | | | |
| | 994 | | | Arch Coal Inc., Term Loan B | | | 6.250% | | | | 5/16/18 | | | | B+ | | | | 978,531 | |
| | | | | |
| | 1,000 | | | Samson Investment Company Second Lien Term Loan | | | 5.000% | | | | 9/25/18 | | | | B1 | | | | 1,002,056 | |
| | 1,994 | | | Total Oil, Gas & Consumable Fuels | | | | | | | | | | | | | | | 1,980,587 | |
| | | | | |
| | | | Professional Services – 0.1% | | | | | | | | | | | | | | | | |
| | | | | |
| | 1,000 | | | Sedgwick Claims Management Service Inc., Second Lien Term Loan | | | 6.750% | | | | 2/11/22 | | | | CCC+ | | | | 998,438 | |
| | 8,487 | | | Total Variable Rate Senior Loan Interests (cost $8,456,695) | | | | | | | | | | | | | | | 8,474,981 | |
| | | | | | | | | | | | | | | | | | | | |
| Shares | | | Description (1) | | Coupon | | | | | | Ratings (4) | | | Value | |
| | | | | |
| | | | $25 PAR (OR SIMILAR) RETAIL PREFERRED – 2.6% | | | | | | | | | | | | | | | | |
| | | | | |
| | | | Banks – 1.2% | | | | | | | | | | | | | | | | |
| | | | | |
| | 20,600 | | | AgriBank FCB, (15) | | | 6.875% | | | | | | | | A– | | | $ | 2,176,520 | |
| | | | | |
| | 118,392 | | | PNC Financial Services | | | 6.125% | | | | | | | | BBB | | | | 3,251,044 | |
| | | | | |
| | 95,250 | | | Regions Financial Corporation | | | 6.375% | | | | | | | | BB | | | | 2,384,108 | |
| | | | | |
| | 14,000 | | | Royal Bank of Scotland Group PLC | | | 5.750% | | | | | | | | BB | | | | 322,980 | |
| | | | | |
| | 58,000 | | | Wells Fargo & Company | | | 5.850% | | | | | | | | BBB+ | | | | 1,504,520 | |
| | | | Total Banks | | | | | | | | | | | | | | | 9,639,172 | |
| | | | | |
| | | | Capital Markets – 0.5% | | | | | | | | | | | | | | | | |
| | | | | |
| | 73,000 | | | Goldman Sachs Group, Inc., (7) | | | 5.500% | | | | | | | | BB+ | | | | 1,788,500 | |
| | | | | |
| | 80,000 | | | State Street Corporation | | | 5.900% | | | | | | | | BBB+ | | | | 2,096,000 | |
| | | | Total Capital Markets | | | | | | | | | | | | | | | 3,884,500 | |
| | | | | |
| | | | Consumer Finance – 0.3% | | | | | | | | | | | | | | | | |
| | | | | |
| | 83,000 | | | Discover Financial Services, (7) | | | 6.500% | | | | | | | | BB | | | | 2,083,300 | |
| | | | | |
| | | | Insurance – 0.6% | | | | | | | | | | | | | | | | |
| | | | | |
| | 73,140 | | | Endurance Specialty Holdings Limited | | | 7.500% | | | | | | | | BBB– | | | | 1,925,776 | |
| | | | | |
| | 100,000 | | | Reinsurance Group of America Inc., (7) | | | 6.200% | | | | | | | | BBB | | | | 2,744,000 | |
| | | | Total Insurance | | | | | | | | | | | | | | | 4,669,776 | |
| | | | | |
| | | | Multi-Utilities – 0.0% | | | | | | | | | | | | | | | | |
| | | | | |
| | 5,000 | | | Dominion Resources Inc. | | | 6.375% | | | | | | | | BBB | | | | 263,125 | |
| | | | Total $25 Par (or similar) Retail Preferred (cost $19,469,328) | | | | | | | | | | | | | | | 20,539,873 | |
| | | | | |
Principal
Amount (000) (8) | | | Description (1) | | Coupon | | | Maturity | | | Ratings (4) | | | Value | |
| | | | | |
| | | | CORPORATE BONDS – 61.0% | | | | | | | | | | | | | | | | |
| | | | | |
| | | | Aerospace & Defense – 0.8% | | | | | | | | | | | | | | | | |
| | | | | |
| $ | 1,355 | | | Bombardier Inc., 144A, (7) | | | 6.000% | | | | 10/15/22 | | | | BB– | | | $ | 1,388,875 | |
| | | | | |
| | 683 | | | Erickson Inc., (7) | | | 8.250% | | | | 5/01/20 | | | | B1 | | | | 701,783 | |
| | | | | |
| | 2,140 | | | Exelis, Inc. | | | 5.550% | | | | 10/01/21 | | | | BBB+ | | | | 2,299,884 | |
| | | | | |
| | 2,000 | | | Martin Marietta Materials, 144A, (WI/DD) | | | 4.250% | | | | 7/02/24 | | | | BBB | | | | 2,015,012 | |
| | 6,178 | | | Total Aerospace & Defense | | | | | | | | | | | | | | | 6,405,554 | |
| | | | | |
| | | | Airlines – 0.6% | | | | | | | | | | | | | | | | |
| | | | | |
| | 1,530 | | | Air Canada, 144A | | | 6.750% | | | | 10/01/19 | | | | BB | | | | 1,663,875 | |
| | | | | |
| | 1,578 | | | Delta Air Lines Pass-Through Certificates Series 2012-1A | | | 4.750% | | | | 5/07/20 | | | | A | | | | 1,712,513 | |
| | | | | |
| | 914 | | | Northwest Airlines Trust Pass-Through Certificates 2007-1 | | | 7.027% | | | | 11/01/19 | | | | A– | | | | 1,050,526 | |
| | 4,022 | | | Total Airlines | | | | | | | | | | | | | | | 4,426,914 | |
| | | | | |
| | | | Auto Components – 0.9% | | | | | | | | | | | | | | | | |
| | | | | |
| | 1,025 | | | Allison Transmission Inc., 144A | | | 7.125% | | | | 5/15/19 | | | | B+ | | | | 1,096,750 | |
| | | | | |
| | 1,575 | | | American & Axle Manufacturing Inc., (7) | | | 6.625% | | | | 10/15/22 | | | | B+ | | | | 1,724,625 | |
| | | | | |
| | 1,250 | | | Gestamp Funding Luxembourg SA, 144A | | | 5.625% | | | | 5/31/20 | | | | BB | | | | 1,303,125 | |
Nuveen Strategic Income Fund (continued)
Portfolio of Investments June 30, 2014
| | | | | | | | | | | | | | | | | | | | |
Principal
Amount (000) (8) | | | Description (1) | | Coupon | | | Maturity | | | Ratings (4) | | | Value | |
| | | | | |
| | | | Auto Components (continued) | | | | | | | | | | | | | | | | |
| | | | | |
| $ | 1,250 | | | Stackpole International Intermediate Company, 144A | | | 7.750% | | | | 10/15/21 | | | | B+ | | | $ | 1,306,250 | |
| | | | | |
| | 1,780 | | | TRW Automotive Inc., 144A | | | 4.450% | | | | 12/01/23 | | | | BBB– | | | | 1,824,500 | |
| | 6,880 | | | Total Auto Components | | | | | | | | | | | | | | | 7,255,250 | |
| | | | | |
| | | | Automobiles – 0.3% | | | | | | | | | | | | | | | | |
| | | | | |
| | 1,000 | EUR | | Fiat Finance & Trade SA | | | 7.000% | | | | 3/23/17 | | | | BB– | | | | 1,503,218 | |
| | | | | |
| | 1,240 | | | General Motors Financial Company Inc. | | | 4.250% | | | | 5/15/23 | | | | BB+ | | | | 1,238,450 | |
| | | | Total Automobiles | | | | | | | | | | | | | | | 2,741,668 | |
| | | | | |
| | | | Banks – 8.0% | | | | | | | | | | | | | | | | |
| | | | | |
| | 1,000 | | | Banco Do Brasil, 144A | | | 9.000% | | | | 12/18/64 | | | | Ba3 | | | | 986,250 | |
| | | | | |
| | 2,000 | | | Bancolombia SA | | | 5.950% | | | | 6/03/21 | | | | Baa2 | | | | 2,205,000 | |
| | | | | |
| | 10,750 | | | Bank of America Corporation, (7) | | | 4.000% | | | | 4/01/24 | | | | A | | | | 10,970,708 | |
| | | | | |
| | 1,760 | | | CIT Group Inc. | | | 5.000% | | | | 8/01/23 | | | | BB | | | | 1,801,800 | |
| | | | | |
| | 5,000 | | | Citigroup Inc., (7) | | | 3.875% | | | | 10/25/23 | | | | A | | | | 5,121,300 | |
| | | | | |
| | 5,000 | | | Citigroup Inc. | | | 3.750% | | | | 6/16/24 | | | | A | | | | 5,013,960 | |
| | | | | |
| | 1,835 | | | Citigroup Inc. | | | 6.125% | | | | 8/25/36 | | | | A– | | | | 2,101,440 | |
| | | | | |
| | 2,545 | | | General Electric Capital Corporation | | | 6.875% | | | | 1/10/39 | | | | AA+ | | | | 3,418,643 | |
| | | | | |
| | 2,360 | | | HSBC Holdings PLC | | | 6.800% | | | | 6/01/38 | | | | A+ | | | | 3,011,096 | |
| | | | | |
| | 4,515 | | | JPMorgan Chase & Company, (7) | | | 4.500% | | | | 1/24/22 | | | | A+ | | | | 4,947,262 | |
| | | | | |
| | 680 | | | JPMorgan Chase & Company | | | 3.200% | | | | 1/25/23 | | | | A+ | | | | 675,155 | |
| | | | | |
| | 1,605 | | | JPMorgan Chase & Company, (7) | | | 3.375% | | | | 5/01/23 | | | | A | | | | 1,575,338 | |
| | | | | |
| | 2,280 | | | JPMorgan Chase & Company | | | 6.400% | | | | 5/15/38 | | | | A+ | | | | 2,894,102 | |
| | | | | |
| | 4,620 | | | JPMorgan Chase & Company | | | 6.750% | | | | 1/29/49 | | | | BBB | | | | 4,972,275 | |
| | | | | |
| | 1,220 | | | Royal Bank of Scotland Group PLC, (7) | | | 6.100% | | | | 6/10/23 | | | | BBB– | | | | 1,335,405 | |
| | | | | |
| | 1,500 | EUR | | Royal Bank of Scotland Group PLC | | | 5.500% | | | | 11/29/49 | | | | BB | | | | 2,005,683 | |
| | | | | |
| | 1,335 | | | Santander UK PLC, 144A | | | 5.000% | | | | 11/07/23 | | | | A– | | | | 1,441,841 | |
| | | | | |
| | 2,485 | | | Societe Generale, 144A, (7) | | | 5.000% | | | | 1/17/24 | | | | BBB+ | | | | 2,598,902 | |
| | | | | |
| | 1,960 | | | Standard Chartered PLC, 144A, (7) | | | 5.700% | | | | 3/26/44 | | | | A+ | | | | 2,054,398 | |
| | | | | |
| | 1,500 | | | State Bank of India London, 144A | | | 3.622% | | | | 4/17/19 | | | | BBB– | | | | 1,509,108 | |
| | | | | |
| | 2,000 | | | State Bank of India London, 144A | | | 4.875% | | | | 4/17/24 | | | | BBB– | | | | 2,025,504 | |
| | | | | |
| | 1,140 | | | Wells Fargo & Company | | | 3.450% | | | | 2/13/23 | | | | A+ | | | | 1,134,422 | |
| | | | Total Banks | | | | | | | | | | | | | | | 63,799,592 | |
| | | | | |
| | | | Beverages – 0.4% | | | | | | | | | | | | | | | | |
| | | | | |
| | 750 | | | Andalou Efes Biracilik ve Malt Sanayii AS, 144A | | | 3.375% | | | | 11/01/22 | | | | BBB– | | | | 669,375 | |
| | | | | |
| | 800 | | | Coca-Cola Icecek AS, 144A | | | 4.750% | | | | 10/01/18 | | | | BBB | | | | 842,480 | |
| | | | | |
| | 1,350 | | | Constellation Brands Inc., (7) | | | 4.250% | | | | 5/01/23 | | | | BB+ | | | | 1,355,063 | |
| | 2,900 | | | Total Beverages | | | | | | | | | | | | | | | 2,866,918 | |
| | | | | |
| | | | Building Products – 1.2% | | | | | | | | | | | | | | | | |
| | | | | |
| | 1,000 | | | Building Materials Holdings Corporation, 144A | | | 9.000% | | | | 9/15/18 | | | | B– | | | | 1,077,500 | |
| | | | | |
| | 1,000 | | | Griffon Corporation | | | 5.250% | | | | 3/01/22 | | | | BB– | | | | 993,750 | |
| | | | | | | | | | | | | | | | | | | | |
Principal
Amount (000) (8) | | | Description (1) | | Coupon | | | Maturity | | | Ratings (4) | | | Value | |
| | | | | |
| | | | Building Products (continued) | | | | | | | | | | | | | | | | |
| | | | | |
| $ | 1,875 | | | Masco Corporation | | | 5.950% | | | | 3/15/22 | | | | BBB– | | | $ | 2,071,875 | |
| | | | | |
| | 1,978 | | | Odebrecht Offshore Drilling Finance Limited, 144A, (7) | | | 6.625% | | | | 10/01/22 | | | | BBB | | | | 2,106,357 | |
| | | | | |
| | 1,490 | | | Owens Corning Incorporated | | | 4.200% | | | | 12/15/22 | | | | BBB– | | | | 1,529,990 | |
| | | | | |
| | 750 | | | Ply Gem Industries Inc., 144A, (7) | | | 6.500% | | | | 2/01/22 | | | | CCC+ | | | | 725,625 | |
| | | | | |
| | 1,000 | | | US Concrete Inc., 144A | | | 8.500% | | | | 12/01/18 | | | | B | | | | 1,085,000 | |
| | 9,093 | | | Total Building Products | | | | | | | | | | | | | | | 9,590,097 | |
| | | | | |
| | | | Capital Markets – 2.4% | | | | | | | | | | | | | | | | |
| | | | | |
| | 4,425 | | | Goldman Sachs Group, Inc. | | | 6.000% | | | | 6/15/20 | | | | A | | | | 5,157,802 | |
| | | | | |
| | 1,890 | | | Goldman Sachs Group, Inc. | | | 5.250% | | | | 7/27/21 | | | | A | | | | 2,122,343 | |
| | | | | |
| | 3,500 | | | Goldman Sachs Group, Inc., (7) | | | 4.000% | | | | 3/03/24 | | | | A | | | | 3,562,857 | |
| | | | | |
| | 1,050 | | | Lazard Group LLC | | | 4.250% | | | | 11/14/20 | | | | BBB+ | | | | 1,100,080 | |
| | | | | |
| | 2,640 | | | Morgan Stanley Dean Witter & Company | | | 4.875% | | | | 11/01/22 | | | | BBB+ | | | | 2,833,824 | |
| | | | | |
| | 4,380 | | | Morgan Stanley | | | 3.750% | | | | 2/25/23 | | | | A | | | | 4,455,682 | |
| | 17,885 | | | Total Capital Markets | | | | | | | | | | | | | | | 19,232,588 | |
| | | | | |
| | | | Chemicals – 2.3% | | | | | | | | | | | | | | | | |
| | | | | |
| | 1,625 | | | Braskem Finance Limited, 144A | | | 5.750% | | | | 4/15/21 | | | | BBB– | | | | 1,698,938 | |
| | | | | |
| | 2,000 | | | CF Industries Inc. | | | 5.150% | | | | 3/15/34 | | | | Baa2 | | | | 2,130,700 | |
| | | | | |
| | 1,250 | | | Eagle Spinco Inc. | | | 4.625% | | | | 2/15/21 | | | | BB | | | | 1,240,625 | |
| | | | | |
| | 1,565 | | | Eastman Chemical Company | | | 3.600% | | | | 8/15/22 | | | | BBB | | | | 1,604,836 | |
| | | | | |
| | 1,000 | | | Hexion US Finance, (7) | | | 6.625% | | | | 4/15/20 | | | | B1 | | | | 1,060,000 | |
| | | | | |
| | 1,915 | | | Incitec Pivot Finance, 144A | | | 6.000% | | | | 12/10/19 | | | | BBB | | | | 2,170,492 | |
| | | | | |
| | 750 | | | Ineos Group Holdings SA, 144A, (7) | | | 6.125% | | | | 8/15/18 | | | | B– | | | | 776,250 | |
| | | | | |
| | 1,700 | | | Mexichem SAB de CV, 144A, (7) | | | 4.875% | | | | 9/19/22 | | | | BBB | | | | 1,768,000 | |
| | | | | |
| | 1,730 | | | NOVA Chemicals Corporation, 144A, (7) | | | 5.250% | | | | 8/01/23 | | | | BB+ | | | | 1,890,025 | |
| | | | | |
| | 1,600 | | | Office Cherifien Des Phosphates SA, 144A | | | 5.625% | | | | 4/25/24 | | | | BBB– | | | | 1,678,000 | |
| | | | | |
| | 1,305 | | | PolyOne Corporation | | | 5.250% | | | | 3/15/23 | | | | BB | | | | 1,340,888 | |
| | | | | |
| | 1,130 | | | Tronox Finance LLC, (7) | | | 6.375% | | | | 8/15/20 | | | | BB- | | | | 1,166,725 | |
| | 17,570 | | | Total Chemicals | | | | | | | | | | | | | | | 18,525,479 | |
| | | | | |
| | | | Commercial Services & Supplies – 1.2% | | | | | | | | | | | | | | | | |
| | | | | |
| | 595 | | | ABX Group Inc., (7) | | | 6.375% | | | | 12/01/19 | | | | Ba3 | | | | 617,313 | |
| | | | | |
| | 1,000 | | | ADT Corporation, (7) | | | 6.250% | | | | 10/15/21 | | | | BBB– | | | | 1,060,000 | |
| | | | | |
| | 1,084 | | | Casella Waste Systems Inc., (7) | | | 7.750% | | | | 2/15/19 | | | | CCC+ | | | | 1,132,780 | |
| | | | | |
| | 1,325 | | | Clean Harbors Inc. | | | 5.250% | | | | 8/01/20 | | | | BB+ | | | | 1,366,406 | |
| | | | | |
| | 1,220 | | | Covanta Energy Corporation, Synthetic Letter of Credit, (7) | | | 6.375% | | | | 10/01/22 | | | | Ba3 | | | | 1,323,700 | |
| | | | | |
| | 1,025 | EUR | | Europcar Groupe SA, 144A | | | 11.500% | | | | 5/15/17 | | | | B– | | | | 1,612,174 | |
| | | | | |
| | 1,000 | | | R.R. Donnelley & Sons Company, (7) | | | 7.625% | | | | 6/15/20 | | | | BB | | | | 1,135,000 | |
| | | | | |
| | 1,000 | | | West Corporation, 144A, (WI/DD) | | | 5.375% | | | | 7/15/22 | | | | B+ | | | | 990,000 | |
| | | | Total Commercial Services & Supplies | | | | | | | | | | | | | | | 9,237,373 | |
Nuveen Strategic Income Fund (continued)
Portfolio of Investments June 30, 2014
| | | | | | | | | | | | | | | | | | | | |
Principal
Amount (000) (8) | | | Description (1) | | Coupon | | | Maturity | | | Ratings (4) | | | Value | |
| | | | | |
| | | | Computers & Peripherals – 0.2% | | | | | | | | | | | | | | | | |
| | | | | |
| $ | 1,725 | | | NCR Escrow Corporation, 144A | | | 6.375% | | | | 12/15/23 | | | | BB | | | $ | 1,871,625 | |
| | | | | |
| | | | Construction Materials – 0.1% | | | | | | | | | | | | | | | | |
| | | | | |
| | 1,200 | | | Norbord Inc., 144A | | | 5.375% | | | | 12/01/20 | | | | Ba2 | | | | 1,212,000 | |
| | | | | |
| | | | Consumer Finance – 1.3% | | | | | | | | | | | | | | | | |
| | | | | |
| | 1,938 | | | Capital One Bank, (7) | | | 3.375% | | | | 2/15/23 | | | | Baa1 | | | | 1,924,909 | |
| | | | | |
| | 3,215 | | | Discover Financial Services | | | 5.200% | | | | 4/27/22 | | | | BBB+ | | | | 3,568,142 | |
| | | | | |
| | 710 | | | First Data Corporation | | | 6.750% | | | | 11/01/20 | | | | BB– | | | | 768,575 | |
| | | | | |
| | 3,445 | | | Ford Motor Credit Company, (7) | | | 4.250% | | | | 9/20/22 | | | | BBB– | | | | 3,674,554 | |
| | 9,308 | | | Total Consumer Finance | | | | | | | | | | | | | | | 9,936,180 | |
| | | | | |
| | | | Containers & Packaging – 0.8% | | | | | | | | | | | | | | | | |
| | | | | |
| | 1,500 | | | Ardagh Packaging Finance / MP HD USA, 144A, (7) | | | 6.250% | | | | 1/31/19 | | | | CCC+ | | | | 1,537,500 | |
| | | | | |
| | 745 | | | Ball Corporation | | | 4.000% | | | | 11/15/23 | | | | BB+ | | | | 709,613 | |
| | | | | |
| | 2,100 | CAD | | Cascades Inc., 144A | | | 5.500% | | | | 7/15/21 | | | | Ba3 | | | | 1,965,583 | |
| | | | | |
| | 2,140 | | | Rock-Tenn Company | | | 4.900% | | | | 3/01/22 | | | | BBB | | | | 2,335,801 | |
| | | | Total Containers & Packaging | | | | | | | | | | | | | | | 6,548,497 | |
| | | | | |
| | | | Diversified Consumer Services – 0.9% | | | | | | | | | | | | | | | | |
| | | | | |
| | 1,000 | | | Gibson Brands Inc., 144A | | | 8.875% | | | | 8/01/18 | | | | B– | | | | 1,028,750 | |
| | | | | |
| | 1,220 | | | Nine West Holdings Incorporated, 144A | | | 8.250% | | | | 3/15/19 | | | | CCC | | | | 1,226,100 | |
| | | | | |
| | 4,485 | | | Signet UK Finance PLC | | | 4.700% | | | | 6/15/24 | | | | BBB– | | | | 4,557,343 | |
| | 6,705 | | | Total Diversified Consumer Services | | | | | | | | | | | | | | | 6,812,193 | |
| | | | | |
| | | | Diversified Financial Services – 0.5% | | | | | | | | | | | | | | | | |
| | | | | |
| | 750 | | | CNG Holdings Inc., 144A | | | 9.375% | | | | 5/15/20 | | | | B– | | | | 623,438 | |
| | | | | |
| | 1,000 | | | Jefferies Finance LLC Corporation, 144A | | | 7.375% | | | | 4/01/20 | | | | B1 | | | | 1,050,000 | |
| | | | | |
| | 550 | | | Jefferies LoanCore LLC Finance Corporation, 144A | | | 6.875% | | | | 6/01/20 | | | | B | | | | 555,500 | |
| | | | | |
| | 1,465 | | | Rabobank Nederland | | | 3.875% | | | | 2/08/22 | | | | Aa2 | | | | 1,551,885 | |
| | 3,765 | | | Total Diversified Financial Services | | | | | | | | | | | | | | | 3,780,823 | |
| | | | | |
| | | | Diversified Telecommunication Services – 2.3% | | | | | | | | | | | | | | | | |
| | | | | |
| | 2,050 | | | AT&T, Inc., (7) | | | 5.550% | | | | 8/15/41 | | | | A | | | | 2,298,567 | |
| | | | | |
| | 2,780 | | | Brasil Telecom SA, 144A | | | 5.750% | | | | 2/10/22 | | | | Baa3 | | | | 2,774,440 | |
| | | | | |
| | 1,000 | | | CenturyLink Inc. | | | 6.750% | | | | 12/01/23 | | | | BB+ | | | | 1,092,500 | |
| | | | | |
| | 1,130 | | | CyrusOne LP Finance | | | 6.375% | | | | 11/15/22 | | | | B+ | | | | 1,217,575 | |
| | | | | |
| | 2,360 | | | Qwest Corporation | | | 6.750% | | | | 12/01/21 | | | | BBB– | | | | 2,732,266 | |
| | | | | |
| | 4,885 | | | Verizon Communications | | | 5.150% | | | | 9/15/23 | | | | A– | | | | 5,466,769 | |
| | | | | |
| | 700 | | | Verizon Communications | | | 6.550% | | | | 9/15/43 | | | | A– | | | | 880,909 | |
| | | | | |
| | 550 | | | WideOpenWest Finance Capital Corporation | | | 13.375% | | | | 10/15/19 | | | | CCC+ | | | | 636,625 | |
| | | | | |
| | 1,375 | | | Windstream Corporation, (7) | | | 6.375% | | | | 8/01/23 | | | | BB | | | | 1,393,906 | |
| | 16,830 | | | Total Diversified Telecommunication Services | | | | | | | | | | | | | | | 18,493,557 | |
| | | | | | | | | | | | | | | | | | | | |
Principal
Amount (000) (8) | | | Description (1) | | Coupon | | | Maturity | | | Ratings (4) | | | Value | |
| | | | | |
| | | | Electric Utilities – 1.9% | | | | | | | | | | | | | | | | |
| | | | | |
| $ | 2,030 | | | APT Pipelines Limited, 144A | | | 3.875% | | | | 10/11/22 | | | | BBB | | | $ | 2,034,044 | |
| | | | | |
| | 2,485 | | | Comision Federal de Electricidad of the United States of Mexico, 144A | | | 4.875% | | | | 5/26/21 | | | | BBB+ | | | | 2,672,618 | |
| | | | | |
| | 2,010 | | | Constellation Energy Group | | | 5.150% | | | | 12/01/20 | | | | BBB+ | | | | 2,265,427 | |
| | | | | |
| | 3,145 | | | Exelon Generation Co. LLC | | | 4.250% | | | | 6/15/22 | | | | BBB+ | | | | 3,283,861 | |
| | | | | |
| | 1,250 | | | FirstEnergy Corporation | | | 4.250% | | | | 3/15/23 | | | | Baa3 | | | | 1,244,896 | |
| | | | | |
| | 2,615 | | | FirstEnergy Transmission LLC, 144A, (7) | | | 4.350% | | | | 1/15/25 | | | | Baa3 | | | | 2,641,989 | |
| | | | | |
| | 1,250 | | | Intergen NV, 144A | | | 7.000% | | | | 6/30/23 | | | | B+ | | | | 1,290,625 | |
| | 14,785 | | | Total Electric Utilities | | | | | | | | | | | | | | | 15,433,460 | |
| | | | | |
| | | | Energy Equipment & Services – 1.8% | | | | | | | | | | | | | | | | |
| | | | | |
| | 1,985 | | | Diamond Offshore Drilling Inc. | | | 5.700% | | | | 10/15/39 | | | | A | | | | 2,251,250 | |
| | | | | |
| | 1,250 | | | Drill Rigs Holdings Inc., 144A | | | 6.500% | | | | 10/01/17 | | | | B | | | | 1,278,125 | |
| | | | | |
| | 325 | | | Ensco PLC | | | 4.700% | | | | 3/15/21 | | | | BBB+ | | | | 354,052 | |
| | | | | |
| | 910 | | | Gulfmark Offshore Inc. | | | 6.375% | | | | 3/15/22 | | | | BB– | | | | 946,400 | |
| | | | | |
| | 1,100 | | | Hercules Offshore LLC, 144A, (7) | | | 7.500% | | | | 10/01/21 | | | | B | | | | 1,091,750 | |
| | | | | |
| | 1,835 | | | Nabors Industries Inc., (7) | | | 4.625% | | | | 9/15/21 | | | | BBB | | | | 1,987,646 | |
| | | | | |
| | 1,475 | | | Offshore Group Investment Limited, (7) | | | 7.500% | | | | 11/01/19 | | | | B– | | | | 1,559,813 | |
| | | | | |
| | 2,000 | | | Origin Energy Finance Limited, 144A | | | 3.500% | | | | 10/09/18 | | | | BBB | | | | 2,075,550 | |
| | | | | |
| | 1,200 | | | Seventy Seven Energy Inc., 144A | | | 6.500% | | | | 7/15/22 | | | | B | | | | 1,230,000 | |
| | | | | |
| | 1,385 | | | Weatherford International Limited | | | 7.000% | | | | 3/15/38 | | | | BBB– | | | | 1,720,127 | |
| | 13,465 | | | Total Energy Equipment & Services | | | | | | | | | | | | | | | 14,494,713 | |
| | | | | |
| | | | Food Products – 0.6% | | | | | | | | | | | | | | | | |
| | | | | |
| | 1,500 | | | BRF Brasil Foods SA, 144A | | | 4.750% | | | | 5/22/24 | | | | BBB– | | | | 1,477,500 | |
| | | | | |
| | 2,000 | | | Grupo Bimbo SAB de CV, 144A | | | 3.875% | | | | 6/27/24 | | | | BBB | | | | 1,996,040 | |
| | | | | |
| | 1,000 | | | JBS Investments GmbH, 144A, (7) | | | 7.250% | | | | 4/03/24 | | | | BB | | | | 1,035,000 | |
| | 4,500 | | | Total Food Products | | | | | | | | | | | | | | | 4,508,540 | |
| | | | | |
| | | | Gas Utilities – 0.1% | | | | | | | | | | | | | | | | |
| | | | | |
| | 1,084 | | | AmeriGas Finance LLC | | | 6.750% | | | | 5/20/20 | | | | Ba2 | | | | 1,176,140 | |
| | | | | |
| | | | Health Care Equipment & Supplies – 0.2% | | | | | | | | | | | | | | | | |
| | | | | |
| | 250 | EUR | | Labco SAS, Reg S | | | 8.500% | | | | 1/15/18 | | | | BB– | | | | 362,865 | |
| | | | | |
| | 1,000 | | | Tenet Healthcare Corporation | | | 4.375% | | | | 10/01/21 | | | | BB | | | | 993,750 | |
| | | | Total Health Care Equipment & Supplies | | | | | | | | | | | | | | | 1,356,615 | |
| | | | | |
| | | | Hotels, Restaurants & Leisure – 0.5% | | | | | | | | | | | | | | | | |
| | | | | |
| | 750 | | | Caesars Entertainment Resort Properties LLC, 144A | | | 8.000% | | | | 10/01/20 | | | | B+ | | | | 783,750 | |
| | | | | |
| | 1,000 | | | Caesars Operating Escrow | | | 9.000% | | | | 2/15/20 | | | | Caa2 | | | | 832,500 | |
| | | | | |
| | 775 | | | Shearer’s Foods LLC, 144A | | | 9.000% | | | | 11/01/19 | | | | B1 | | | | 848,625 | |
| | | | | |
| | 1,200 | | | Wynn Macau Limited, 144A | | | 5.250% | | | | 10/15/21 | | | | BB | | | | 1,233,000 | |
| | 3,725 | | | Total Hotels, Restaurants & Leisure | | | | | | | | | | | | | | | 3,697,875 | |
Nuveen Strategic Income Fund (continued)
Portfolio of Investments June 30, 2014
| | | | | | | | | | | | | | | | | | | | |
Principal
Amount (000) (8) | | | Description (1) | | Coupon | | | Maturity | | | Ratings (4) | | | Value | |
| | | | | |
| | | | Household Products – 0.2% | | | | | | | | | | | | | | | | |
| | | | | |
| $ | 1,840 | | | Macys Retail Holdings Inc. | | | 3.875% | | | | 1/15/22 | | | | BBB+ | | | $ | 1,920,647 | |
| | | | | |
| | | | Independent Power & Renewable Electricity Producers – 0.4% | | | | | | | | | | | | | | | | |
| | | | | |
| | 475 | | | Dynegy Inc., (7) | | | 5.875% | | | | 6/01/23 | | | | B+ | | | | 478,563 | |
| | | | | |
| | 1,300 | | | Genon Energy Inc., (7) | | | 9.500% | | | | 10/15/18 | | | | B | | | | 1,426,750 | |
| | | | | |
| | 1,000 | | | RRI Energy Inc. | | | 7.875% | | | | 6/15/17 | | | | B | | | | 1,062,500 | |
| | 2,775 | | | Total Independent Power & Renewable Electricity Producers | | | | | | | | | | | | | | | 2,967,813 | |
| | | | | |
| | | | Industrial Conglomerates – 0.3% | | | | | | | | | | | | | | | | |
| | | | | |
| | 1,000 | | | Alfa SAB de CV, 144A | | | 5.250% | | | | 3/25/24 | | | | BBB– | | | | 1,043,500 | |
| | | | | |
| | 1,000 | | | Stena AB, 144A, (7) | | | 7.000% | | | | 2/01/24 | | | | BB | | | | 1,065,000 | |
| | 2,000 | | | Total Industrial Conglomerates | | | | | | | | | | | | | | | 2,108,500 | |
| | | | | |
| | | | Insurance – 1.9% | | | | | | | | | | | | | | | | |
| | | | | |
| | 2,475 | | | AFLAC Insurance | | | 6.450% | | | | 8/15/40 | | | | A | | | | 3,140,191 | |
| | | | | |
| | 3,255 | | | Genworth Holdings Inc. | | | 4.800% | | | | 2/15/24 | | | | BBB– | | | | 3,478,218 | |
| | | | | |
| | 1,370 | | | Liberty Mutual Group Inc., 144A | | | 4.950% | | | | 5/01/22 | | | | BBB | | | | 1,498,447 | |
| | | | | |
| | 1,498 | | | Lincoln National Corporation | | | 4.200% | | | | 3/15/22 | | | | A– | | | | 1,597,773 | |
| | | | | |
| | 2,840 | | | Pacific LifeCorp. | | | 6.000% | | | | 2/10/20 | | | | BBB+ | | | | 3,243,487 | |
| | | | | |
| | 1,830 | | | UnumProvident Corporation | | | 5.625% | | | | 9/15/20 | | | | BBB | | | | 2,099,398 | |
| | 13,268 | | | Total Insurance | | | | | | | | | | | | | | | 15,057,514 | |
| | | | | |
| | | | IT Services – 0.1% | | | | | | | | | | | | | | | | |
| | | | | |
| | 1,000 | | | NeuStar Inc., (7) | | | 4.500% | | | | 1/15/23 | | | | BB– | | | | 865,000 | |
| | | | | |
| | | | Machinery – 0.7% | | | | | | | | | | | | | | | | |
| | | | | |
| | 820 | | | Blueline Rental Finance Corporation, 144A, (7) | | | 7.000% | | | | 2/01/19 | | | | B | | | | 875,350 | |
| | | | | |
| | 1,000 | | | Chassix Inc., 144A | | | 9.250% | | | | 8/01/18 | | | | B– | | | | 1,087,500 | |
| | | | | |
| | 1,500 | | | CTP Transportation Products LLC-Finance Inc., 144A | | | 8.250% | | | | 12/15/19 | | | | B+ | | | | 1,616,250 | |
| | | | | |
| | 1,640 | | | Terex Corporation | | | 6.000% | | | | 5/15/21 | | | | BB | | | | 1,767,100 | |
| | 4,960 | | | Total Machinery | | | | | | | | | | | | | | | 5,346,200 | |
| | | | | |
| | | | Marine – 0.3% | | | | | | | | | | | | | | | | |
| | | | | |
| | 1,000 | | | Global Ship Lease Inc., 144A | | | 10.000% | | | | 4/01/19 | | | | B | | | | 1,075,000 | |
| | | | | |
| | 1,000 | | | Navios South American Logistics Inc., Finance US Inc., 144A | | | 7.250% | | | | 5/01/22 | | | | B+ | | | | 1,040,000 | |
| | 2,000 | | | Total Marine | | | | | | | | | | | | | | | 2,115,000 | |
| | | | | |
| | | | Media – 3.4% | | | | | | | | | | | | | | | | |
| | | | | |
| | 1,000 | | | Altice S.A, 144A, (7) | | | 7.750% | | | | 5/15/22 | | | | B | | | | 1,067,500 | |
| | | | | |
| | 1,175 | | | Cequel Communication Holdings I, 144A, (7) | | | 5.125% | | | | 12/15/21 | | | | B– | | | | 1,170,594 | |
| | | | | |
| | 740 | | | Charter Communications, CCO Holdings LLC | | | 5.125% | | | | 2/15/23 | | | | BB– | | | | 746,475 | |
| | | | | |
| | 1,000 | | | Clear Channel Communications, Inc. | | | 11.250% | | | | 3/01/21 | | | | CCC+ | | | | 1,133,750 | |
| | | | | |
| | 1,790 | | | Comcast Corporation | | | 6.400% | | | | 5/15/38 | | | | A– | | | | 2,281,355 | |
| | | | | |
| | 5,335 | | | DIRECTV Holdings LLC | | | 3.800% | | | | 3/15/22 | | | | BBB | | | | 5,509,004 | |
| | | | | |
| | 1,460 | | | Dish DBS Corporation | | | 4.250% | | | | 4/01/18 | | | | BB– | | | | 1,518,400 | |
| | | | | | | | | | | | | | | | | | | | |
Principal
Amount (000) (8) | | | Description (1) | | Coupon | | | Maturity | | | Ratings (4) | | | Value | |
| | | | | |
| | | | Media (continued) | | | | | | | | | | | | | | | | |
| | | | | |
| $ | 2,175 | | | Gannett Company Inc., 144A | | | 5.125% | | | | 7/15/20 | | | | BB+ | | | $ | 2,232,094 | |
| | | | | |
| | 1,000 | | | McGraw-Hill Global Education Holdings | | | 9.750% | | | | 4/01/21 | | | | BB | | | | 1,147,500 | |
| | | | | |
| | 2,750 | | | News America Holdings Inc. | | | 6.650% | | | | 11/15/37 | | | | BBB+ | | | | 3,491,780 | |
| | | | | |
| | 1,150 | | | Numericable Group SA, 144A | | | 6.000% | | | | 5/15/22 | | | | Ba3 | | | | 1,196,000 | |
| | | | | |
| | 1,500 | | | SES SA, 144A | | | 3.600% | | | | 4/04/23 | | | | BBB | | | | 1,516,755 | |
| | | | | |
| | 600 | | | Sinclair Television Group | | | 6.375% | | | | 11/01/21 | | | | B+ | | | | 638,250 | |
| | | | | |
| | 1,000 | | | Sirius XM Radio Inc., 144A, (7) | | | 5.750% | | | | 8/01/21 | | | | BB | | | | 1,050,000 | |
| | | | | |
| | 1,000 | CAD | | Videotron Limited, 144A | | | 5.625% | | | | 6/15/25 | | | | BB | | | | 951,221 | |
| | | | | |
| | 1,100 | | | WMG Acquisition Group, 144A | | | 6.000% | | | | 1/15/21 | | | | B+ | | | | 1,135,750 | |
| | | | Total Media | | | | | | | | | | | | | | | 26,786,428 | |
| | | | | |
| | | | Metals & Mining – 4.6% | | | | | | | | | | | | | | | | |
| | | | | |
| | 3,055 | | | Alcoa Inc., (7) | | | 5.400% | | | | 4/15/21 | | | | BBB– | | | | 3,314,073 | |
| | | | | |
| | 1,500 | | | Allegheny Technologies Inc. | | | 5.875% | | | | 8/15/23 | | | | BBB– | | | | 1,645,290 | |
| | | | | |
| | 2,690 | | | Anglogold Holdings PLC | | | 6.500% | | | | 4/15/40 | | | | Baa3 | | | | 2,582,021 | |
| | | | | |
| | 2,040 | | | ArcelorMittal, (7) | | | 6.750% | | | | 2/25/22 | | | | BB+ | | | | 2,284,800 | |
| | | | | |
| | 750 | | | Century Aluminum Company, 144A, (7) | | | 7.500% | | | | 6/01/21 | | | | B | | | | 791,250 | |
| | | | | |
| | 2,795 | | | Cliffs Natural Resources Inc., (7) | | | 4.800% | | | | 10/01/20 | | | | BBB– | | | | 2,735,090 | |
| | | | | |
| | 1,000 | | | Coeur d’Alene Mines Corporation, Convertible Bond | | | 7.875% | | | | 2/01/21 | | | | B+ | | | | 1,005,000 | |
| | | | | |
| | 1,000 | | | Eldorado Gold Corporation, 144A, (7) | | | 6.125% | | | | 12/15/20 | | | | BB | | | | 1,010,000 | |
| | | | | |
| | 718 | | | First Quantum Minerals Limited, 144A | | | 6.750% | | | | 2/15/20 | | | | BB | | | | 739,540 | |
| | | | | |
| | 718 | | | First Quantum Minerals Limited, 144A | | | 7.000% | | | | 2/15/21 | | | | BB | | | | 738,643 | |
| | | | | |
| | 1,000 | | | FMG Resources, 144A, (7) | | | 8.250% | | | | 11/01/19 | | | | BB+ | | | | 1,088,750 | |
| | | | | |
| | 1,165 | | | Freeport McMoRan, Inc., (7) | | | 3.550% | | | | 3/01/22 | | | | BBB | | | | 1,153,700 | |
| | | | | |
| | 1,300 | | | Imperial Metals Corporation, 144A | | | 7.000% | | | | 3/15/19 | | | | B– | | | | 1,334,125 | |
| | | | | |
| | 500 | | | Magnetation LLC Finance Corporation, 144A | | | 11.000% | | | | 5/15/18 | | | | B– | | | | 546,250 | |
| | | | | |
| | 2,610 | | | Newmont Mining Corporation, (7) | | | 3.500% | | | | 3/15/22 | | | | BBB | | | | 2,516,411 | |
| | | | | |
| | 1,775 | | | Teck Resources Limited | | | 6.125% | | | | 10/01/35 | | | | BBB | | | | 1,892,099 | |
| | | | | |
| | 1,140 | | | Teck Resources Limited | | | 6.250% | | | | 7/15/41 | | | | BBB | | | | 1,237,573 | |
| | | | | |
| | 2,410 | | | Vale Overseas Limited | | | 6.875% | | | | 11/10/39 | | | | A– | | | | 2,676,421 | |
| | | | | |
| | 1,800 | | | Vedanta Resources PLC, 144A | | | 6.000% | | | | 1/31/19 | | | | BB | | | | 1,860,840 | |
| | | | | |
| | 1,115 | | | WPE International Cooperatief U.A, 144A | | | 10.375% | | | | 9/30/20 | | | | B+ | | | | 585,375 | |
| | | | | |
| | 1,765 | | | Xstrata Finance Canada Limited, 144A | | | 6.900% | | | | 11/15/37 | | | | BBB | | | | 2,095,575 | |
| | | | | |
| | 3,000 | | | Yamana Gold Inc., 144A | | | 4.950% | | | | 7/15/24 | | | | Baa3 | | | | 3,019,725 | |
| | 35,846 | | | Total Metals & Mining | | | | | | | | | | | | | | | 36,852,551 | |
| | | | | |
| | | | Oil, Gas & Consumable Fuels – 8.4% | | | | | | | | | | | | | | | | |
| | | | | |
| | 740 | | | Amerada Hess Corporation | | | 7.125% | | | | 3/15/33 | | | | BBB | | | | 982,119 | |
| | | | | |
| | 2,170 | | | Anadarko Petroleum Corporation | | | 6.200% | | | | 3/15/40 | | | | BBB– | | | | 2,736,244 | |
| | | | | |
| | 1,350 | | | Antero Resources Finance Corporation, 144A | | | 5.125% | | | | 12/01/22 | | | | BB– | | | | 1,387,125 | |
Nuveen Strategic Income Fund (continued)
Portfolio of Investments June 30, 2014
| | | | | | | | | | | | | | | | | | | | |
Principal
Amount (000) (8) | | | Description (1) | | Coupon | | | Maturity | | | Ratings (4) | | | Value | |
| | | | | |
| | | | Oil, Gas & Consumable Fuels (continued) | | | | | | | | | | | | | | | | |
| | | | | |
| | 1,570 | CAD | | Athabasca Oil Corporation, 144A | | | 7.500% | | | | 11/19/17 | | | | B | | | $ | 1,502,612 | |
| | | | | |
| | 1,260 | | | Atlas Pipeline LP Finance | | | 5.875% | | | | 8/01/23 | | | | B+ | | | | 1,282,050 | |
| | | | | |
| | 1,295 | | | Berkshire Hathaway Energy Company | | | 6.125% | | | | 4/01/36 | | | | A3 | | | | 1,605,590 | |
| | | | | |
| | 1,145 | | | Bill Barrett Corporation, (7) | | | 7.000% | | | | 10/15/22 | | | | B1 | | | | 1,213,700 | |
| | | | | |
| | 750 | | | Breitburn Energy Partners LP, (7) | | | 7.875% | | | | 4/15/22 | | | | B– | | | | 811,875 | |
| | | | | |
| | 1,250 | | | Calumet Specialty Products | | | 7.625% | | | | 1/15/22 | | | | B+ | | | | 1,343,750 | |
| | | | | |
| | 1,700 | | | Canadian Oil Sands Trust | | | 7.750% | | | | 5/15/19 | | | | BBB | | | | 2,092,034 | |
| | | | | |
| | 1,120 | | | Cenovus Energy Inc., (7) | | | 3.800% | | | | 9/15/23 | | | | BBB+ | | | | 1,154,559 | |
| | | | | |
| | 4,300 | | | CNOOC Finance 2014 ULC | | | 4.250% | | | | 4/30/24 | | | | AA– | | | | 4,408,934 | |
| | | | | |
| | 870 | | | Concho Resources Inc., (7) | | | 5.500% | | | | 10/01/22 | | | | BB+ | | | | 936,338 | |
| | | | | |
| | 1,000 | | | CONSOL Energy Inc. | | | 8.250% | | | | 4/01/20 | | | | BB | | | | 1,082,500 | |
| | | | | |
| | 1,965 | | | Continental Resources Inc., (7) | | | 5.000% | | | | 9/15/22 | | | | BBB– | | | | 2,136,938 | |
| | | | | |
| | 500 | | | Diamondback Energy Inc., 144A | | | 7.625% | | | | 10/01/21 | | | | B– | | | | 550,000 | |
| | | | | |
| | 195 | | | Enbridge Energy Partners LP | | | 5.200% | | | | 3/15/20 | | | | BBB | | | | 217,761 | |
| | | | | |
| | 1,000 | | | EnQuest PLC, 144A | | | 7.000% | | | | 4/15/22 | | | | B | | | | 1,032,500 | |
| | | | | |
| | 1,000 | | | Halcon Resources Corporation. | | | 9.750% | | | | 7/15/20 | | | | CCC+ | | | | 1,091,250 | |
| | | | | |
| | 1,345 | | | Key Energy Services Inc., (7) | | | 6.750% | | | | 3/01/21 | | | | BB– | | | | 1,398,800 | |
| | | | | |
| | 600 | | | Kinder Morgan Energy Partners LP | | | 6.950% | | | | 1/15/38 | | | | BBB | | | | 739,723 | |
| | | | | |
| | 825 | | | Kodiak Oil and Gas Corporation | | | 5.500% | | | | 2/01/22 | | | | B | | | | 855,938 | |
| | | | | |
| | 1,185 | | | Linn Energy LLC Finance Corporation | | | 6.250% | | | | 11/01/19 | | | | B+ | | | | 1,247,213 | |
| | | | | |
| | 1,290 | | | Martin Mid-Stream Partners LP Finance | | | 7.250% | | | | 2/15/21 | | | | B– | | | | 1,367,400 | |
| | | | | |
| | 1,000 | | | MEG Energy Corporation, 144A | | | 7.000% | | | | 3/31/24 | | | | BB | | | | 1,102,500 | |
| | | | | |
| | 775 | | | Murphy Oil USA Inc. | | | 6.000% | | | | 8/15/23 | | | | BB | | | | 815,688 | |
| | | | | |
| | 550 | | | Niska Gas Storage Canada ULC Finance Corporation, 144A | | | 6.500% | | | | 4/01/19 | | | | B | | | | 528,000 | |
| | | | | |
| | 1,250 | | | Northern Blizzard Resources Inc., 144A | | | 7.250% | | | | 2/01/22 | | | | B– | | | | 1,287,500 | |
| | | | | |
| | 1,150 | | | Oasis Petroleum Inc., 144A | | | 6.875% | | | | 3/15/22 | | | | B+ | | | | 1,253,500 | |
| | | | | |
| | 1,130 | CAD | | Paramount Resources Limited, 144A | | | 7.625% | | | | 12/04/19 | | | | B | | | | 1,130,477 | |
| | | | | |
| | 1,000 | | | Pertamina PT, 144A | | | 4.875% | | | | 5/03/22 | | | | Baa3 | | | | 992,500 | |
| | | | | |
| | 1,275 | | | Petro Canada | | | 6.800% | | | | 5/15/38 | | | | BBB+ | | | | 1,687,758 | |
| | | | | |
| | 1,000 | | | PetroBakken Energy Limited, 144A | | | 8.625% | | | | 2/01/20 | | | | B– | | | | 1,050,000 | |
| | | | | |
| | 1,000 | | | Petrobras Global Finance BV | | | 6.250% | | | | 3/17/24 | | | | Baa1 | | | | 1,064,400 | |
| | | | | |
| | 1,770 | | | Petrobras International Finance Company | | | 6.875% | | | | 1/20/40 | | | | Baa1 | | | | 1,854,075 | |
| | | | | |
| | 740 | | | Range Resources Corporation | | | 5.000% | | | | 8/15/22 | | | | BB | | | | 784,400 | |
| | | | | |
| | 1,000 | | | Rose Rock Midstream LP / Rose Rock Finance Corporation, 144A | | | 5.625% | | | | 7/15/22 | | | | B1 | | | | 1,012,500 | |
| | | | | |
| | 1,750 | | | Sabine Pass Liquefaction LLC, (7) | | | 5.625% | | | | 2/01/21 | | | | BB+ | | | | 1,850,625 | |
| | | | | |
| | 1,125 | | | Sandridge Energy Inc., (7) | | | 8.125% | | | | 10/15/22 | | | | B2 | | | | 1,238,906 | |
| | | | | |
| | 1,000 | | | Seadrill Limited, 144A, (7) | | | 6.125% | | | | 9/15/20 | | | | N/R | | | | 1,017,500 | |
| | | | | |
| | 6,000 | NOK | | Ship Finance International Limited | | | 6.770% | | | | 10/19/17 | | | | N/R | | | | 1,017,306 | |
| | | | | |
| | 1,845 | | | Sinopec Group Overseas Development 2012, 144A | | | 3.900% | | | | 5/17/22 | | | | Aa3 | | | | 1,873,059 | |
| | | | | | | | | | | | | | | | | | | | |
Principal
Amount (000) (8) | | | Description (1) | | Coupon | | | Maturity | | | Ratings (4) | | | Value | |
| | | | | |
| | | | Oil, Gas & Consumable Fuels (continued) | | | | | | | | | | | | | | | | |
| | | | | |
| $ | 2,600 | | | Southeast Supply Header LLC, 144A | | | 4.250% | | | | 6/15/24 | | | | BBB– | | | $ | 2,646,420 | |
| | | | | |
| | 1,445 | | | Southwestern Energy Company, (7) | | | 4.100% | | | | 3/15/22 | | | | BBB | | | | 1,531,457 | |
| | | | | |
| | 1,520 | | | Targa Resources Inc. | | | 4.250% | | | | 11/15/23 | | | | BB+ | | | | 1,510,500 | |
| | | | | |
| | 1,900 | | | Thai Oil PCL, 144A | | | 3.625% | | | | 1/23/23 | | | | Baa1 | | | | 1,816,537 | |
| | | | | |
| | 1,000 | | | Transocean Inc. | | | 6.375% | | | | 12/15/21 | | | | BBB– | | | | 1,156,841 | |
| | | | | |
| | 2,100 | | | Transocean Inc., (7) | | | 3.800% | | | | 10/15/22 | | | | BBB– | | | | 2,078,418 | |
| | | | | |
| | 1,000 | | | Western Refining Inc. | | | 6.250% | | | | 4/01/21 | | | | B+ | | | | 1,045,000 | |
| | | | Total Oil, Gas & Consumable Fuels | | | | | | | | | | | | | | | 66,522,820 | |
| | | | | |
| | | | Paper & Forest Products – 0.9% | | | | | | | | | | | | | | | | |
| | | | | |
| | 3,100 | | | Domtar Corporation | | | 6.750% | | | | 2/15/44 | | | | BBB– | | | | 3,695,119 | |
| | | | | |
| | 1,750 | | | Resolute Forest Products | | | 5.875% | | | | 5/15/23 | | | | BB– | | | | 1,723,750 | |
| | | | | |
| | 1,000 | | | Sappi Papier Holding GMBH, 144A | | | 6.625% | | | | 4/15/21 | | | | BB | | | | 1,055,000 | |
| | | | | |
| | 1,000 | | | Verso Paper Holdings LLC | | | 11.750% | | | | 1/15/19 | | | | Caa1 | | | | 1,052,500 | |
| | 6,850 | | | Total Paper & Forest Products | | | | | | | | | | | | | | | 7,526,369 | |
| | | | | |
| | | | Personal Products – 0.6% | | | | | | | | | | | | | | | | |
| | | | | |
| | 1,500 | | | Albea Beauty Holdings SA, 144A | | | 8.375% | | | | 11/01/19 | | | | B+ | | | | 1,631,250 | |
| | | | | |
| | 1,860 | | | International Paper Company | | | 8.700% | | | | 6/15/38 | | | | BBB | | | | 2,800,676 | |
| | 3,360 | | | Total Personal Products | | | | | | | | | | | | | | | 4,431,926 | |
| | | | | |
| | | | Pharmaceuticals – 0.2% | | | | | | | | | | | | | | | | |
| | | | | |
| | 1,000 | | | Endo Finance Company, 144A | | | 7.000% | | | | 12/15/20 | | | | B+ | | | | 1,070,000 | |
| | | | | |
| | 720 | | | VP Escrow Corporation, 144A | | | 6.375% | | | | 10/15/20 | | | | B1 | | | | 765,000 | |
| | 1,720 | | | Total Pharmaceuticals | | | | | | | | | | | | | | | 1,835,000 | |
| | | | | |
| | | | Real Estate Investment Trust – 3.1% | | | | | | | | | | | | | | | | |
| | | | | |
| | 3,070 | | | American Tower Company, (7) | | | 5.000% | | | | 2/15/24 | | | | BBB | | | | 3,334,413 | |
| | | | | |
| | 1,795 | | | ARC Property Operating Partnership LP, Clark Acquisition LLC, 144A | | | 4.600% | | | | 2/06/24 | | | | BBB– | | | | 1,840,803 | |
| | | | | |
| | 3,500 | | | Digital Realty Trust Inc. | | | 3.625% | | | | 10/01/22 | | | | BBB | | | | 3,333,540 | |
| | | | | |
| | 1,820 | | | HCP Inc. | | | 3.750% | | | | 2/01/19 | | | | BBB+ | | | | 1,939,356 | |
| | | | | |
| | 750 | | | KWG Property Holdings Limited | | | 13.250% | | | | 3/22/17 | | | | B+ | | | | 860,625 | |
| | | | | |
| | 2,060 | | | Omega Healthcare Investors Inc., 144A | | | 4.950% | | | | 4/01/24 | | | | BBB- | | | | 2,104,006 | |
| | | | | |
| | 2,080 | | | Piedmont Operating Partnership LP | | | 4.450% | | | | 3/15/24 | | | | BBB | | | | 2,130,608 | |
| | | | | |
| | 1,420 | | | Plum Creek Timberlands LP | | | 4.700% | | | | 3/15/21 | | | | BBB | | | | 1,543,365 | |
| | | | | |
| | 2,125 | | | Prologis Inc. | | | 6.875% | | | | 3/15/20 | | | | BBB+ | | | | 2,553,171 | |
| | | | | |
| | 3,000 | | | Senior Housing Properties Trust | | | 4.750% | | | | 5/01/24 | | | | BBB– | | | | 3,066,522 | |
| | | | | |
| | 1,425 | | | Sovereign Bank | | | 8.750% | | | | 5/30/18 | | | | Baa2 | | | | 1,734,631 | |
| | 23,045 | | | Total Real Estate Investment Trust | | | | | | | | | | | | | | | 24,441,040 | |
| | | | | |
| | | | Real Estate Management & Development – 0.7% | | | | | | | | | | | | | | | | |
| | | | | |
| | 1,000 | | | Agile Property Holdings Limited, (7) | | | 8.875% | | | | 4/28/17 | | | | Ba2 | | | | 1,041,200 | |
| | | | | |
| | 1,100 | | | Country Garden Holding Company, 144A, (7) | | | 11.125% | | | | 2/23/18 | | | | BB+ | | | | 1,200,320 | |
Nuveen Strategic Income Fund (continued)
Portfolio of Investments June 30, 2014
| | | | | | | | | | | | | | | | | | | | |
Principal
Amount (000) (8) | | | Description (1) | | Coupon | | | Maturity | | | Ratings (4) | | | Value | |
| | | | | |
| | | | Real Estate Management & Development (continued) | | | | | | | | | | | | | | | | |
| | | | | |
| $ | 500 | | | Crescent Resources LLC, 144A | | | 10.250% | | | | 8/15/17 | | | | B– | | | $ | 560,000 | |
| | | | | |
| | 800 | | | Gemdale International Investment Limited | | | 7.125% | | | | 11/16/17 | | | | BB– | | | | 822,000 | |
| | | | | |
| | 1,100 | | | Kaisa Group Holdings Limited, 144A | | | 8.875% | | | | 3/19/18 | | | | BB– | | | | 1,130,250 | |
| | | | | |
| | 1,000 | | | Mattamy Group Corporation, 144A, (7) | | | 6.500% | | | | 11/15/20 | | | | BB | | | | 1,025,000 | |
| | 5,500 | | | Total Real Estate Management & Development | | | | | | | | | | | | | | | 5,778,770 | |
| | | | | |
| | | | Road & Rail – 0.5% | | | | | | | | | | | | | | | | |
| | | | | |
| | 1,000 | | | Hertz Corporation | | | 7.375% | | | | 1/15/21 | | | | B | | | | 1,085,000 | |
| | | | | |
| | 700 | | | Hertz Corporation, (7) | | | 6.250% | | | | 10/15/22 | | | | B | | | | 741,125 | |
| | | | | |
| | 1,000 | | | Jack Cooper Holdings Corporation, 144A | | | 9.250% | | | | 6/01/20 | | | | B2 | | | | 1,100,000 | |
| | | | | |
| | 932 | | | Watco Companies LLC Finance, 144A | | | 6.375% | | | | 4/01/23 | | | | B3 | | | | 950,640 | |
| | 3,632 | | | Total Road & Rail | | | | | | | | | | | | | | | 3,876,765 | |
| | | | | |
| | | | Semiconductors & Equipment – 0.3% | | | | | | | | | | | | | | | | |
| | | | | |
| | 1,175 | | | Micron Technology, Inc., 144A | | | 5.875% | | | | 2/15/22 | | | | BB | | | | 1,260,188 | |
| | | | | |
| | 1,000 | | | NXP BV, 144A | | | 5.750% | | | | 3/15/23 | | | | BB– | | | | 1,051,250 | |
| | 2,175 | | | Total Semiconductors & Equipment | | | | | | | | | | | | | | | 2,311,438 | |
| | | | | |
| | | | Software – 0.7% | | | | | | | | | | | | | | | | |
| | | | | |
| | 1,000 | | | BMC Software Finance Inc., 144A | | | 8.125% | | | | 7/15/21 | | | | CCC+ | | | | 1,028,750 | |
| | | | | |
| | 2,395 | | | Computer Sciences Corporation | | | 4.450% | | | | 9/15/22 | | | | BBB+ | | | | 2,511,253 | |
| | | | | |
| | 2,500 | | | Total System Services Inc. | | | 3.750% | | | | 6/01/23 | | | | BBB+ | | | | 2,434,070 | |
| | 5,895 | | | Total Software | | | | | | | | | | | | | | | 5,974,073 | |
| | | | | |
| | | | Specialty Retail – 0.6% | | | | | | | | | | | | | | | | |
| | | | | |
| | 1,150 | | | Best Buy Co., Inc. | | | 5.000% | | | | 8/01/18 | | | | Baa2 | | | | 1,206,063 | |
| | | | | |
| | 1,410 | | | Guitar Center Inc., 144A, (7) | | | 6.500% | | | | 4/15/19 | | | | B– | | | | 1,395,900 | |
| | | | | |
| | 2,220 | | | O’Reilly Automotive Inc. | | | 4.875% | | | | 1/14/21 | | | | BBB | | | | 2,428,005 | |
| | 4,780 | | | Total Specialty Retail | | | | | | | | | | | | | | | 5,029,968 | |
| | | | | |
| | | | Tobacco – 1.0% | | | | | | | | | | | | | | | | |
| | | | | |
| | 1,006 | | | Altria Group Inc. | | | 9.950% | | | | 11/10/38 | | | | BBB+ | | | | 1,675,834 | |
| | | | | |
| | 2,800 | | | Imperial Tobacco Finance, 144A | | | 3.500% | | | | 2/11/23 | | | | BBB | | | | 2,774,044 | |
| | | | | |
| | 1,670 | | | Lorillard Tobacco, (7) | | | 6.875% | | | | 5/01/20 | | | | Baa2 | | | | 1,984,560 | |
| | | | | |
| | 1,265 | | | Reynolds American Inc. | | | 3.250% | | | | 11/01/22 | | | | Baa2 | | | | 1,220,424 | |
| | 6,741 | | | Total Tobacco | | | | | | | | | | | | | | | 7,654,862 | |
| | | | | |
| | | | Trading Companies & Distributors – 0.3% | | | | | | | | | | | | | | | | |
| | | | | |
| | 1,995 | | | Air Lease Corporation | | | 3.875% | | | | 4/01/21 | | | | BBB– | | | | 2,034,900 | |
| | | | | |
| | | | Transportation Infrastructure – 0.4% | | | | | | | | | | | | | | | | |
| | | | | |
| | 3,025 | | | Asciano Finance, 144A | | | 5.000% | | | | 4/07/18 | | | | Baa2 | | | | 3,293,841 | |
| | | | | |
| | | | Wireless Telecommunication Services – 2.1% | | | | | | | | | | | | | | | | |
| | | | | |
| | 1,050 | | | Comcel Trust, 144A | | | 6.875% | | | | 2/06/24 | | | | Ba1 | | | | 1,134,000 | |
| | | | | |
| | 750 | | | Digicel Group, Limited, 144A | | | 8.250% | | | | 9/30/20 | | | | B– | | | | 817,500 | |
| | | | | | | | | | | | | | | | | | | | |
Principal
Amount (000) (8) | | | Description (1) | | Coupon | | | Maturity | | | Ratings (4) | | | Value | |
| | | | | |
| | | | Wireless Telecommunication Services (continued) | | | | | | | | | | | | | | | | |
| | | | | |
| $ | 750 | | | FairPoint Communications Inc., 144A | | | 8.750% | | | | 8/15/19 | | | | B | | | $ | 808,125 | |
| | | | | |
| | 1,610 | | | Frontier Communications Corporation, (7) | | | 8.500% | | | | 4/15/20 | | | | Ba2 | | | | 1,899,800 | |
| | | | | |
| | 1,000 | | | Frontier Communications Corporation | | | 7.625% | | | | 4/15/24 | | | | Ba2 | | | | 1,076,250 | |
| | | | | |
| | 1,000 | | | Inmarsat Finance PLC, 144A | | | 4.875% | | | | 5/15/22 | | | | BB+ | | | | 1,010,000 | |
| | | | | |
| | 800 | | | Millicom International Cellular SA, 144A | | | 6.625% | | | | 10/15/21 | | | | BB+ | | | | 860,000 | |
| | | | | |
| | 1,000 | | | Softbank Corporation, 144A, (7) | | | 4.500% | | | | 4/15/20 | | | | BB+ | | | | 1,016,250 | |
| | | | | |
| | 1,000 | | | Sprint Corporation, 144A | | | 7.250% | | | | 9/15/21 | | | | BB– | | | | 1,102,500 | |
| | | | | |
| | 965 | | | Sprint Nextel Corporation, (7) | | | 7.000% | | | | 3/01/20 | | | | BB+ | | | | 1,109,750 | |
| | | | | |
| | 1,845 | | | Telecom Italia SpA, 144A | | | 5.303% | | | | 5/30/24 | | | | BBB– | | | | 1,851,919 | |
| | | | | |
| | 2,306 | | | Viacom Inc. | | | 4.375% | | | | 3/15/43 | | | | BBB+ | | | | 2,140,556 | |
| | | | | |
| | 1,050 | | | Wind Acquisition Finance SA, 144A | | | 7.250% | | | | 2/15/18 | | | | BB | | | | 1,109,325 | |
| | | | | |
| | 500 | | | Wind Acquisition Finance SA, 144A, (WI/DD) | | | 4.750% | | | | 7/15/20 | | | | BB | | | | 503,750 | |
| | 15,626 | | | Total Wireless Telecommunication Services | | | | | | | | | | | | | | | 16,439,725 | |
| | | | Total Corporate Bonds (cost $457,945,002) | | | | | | | | | | | | | | | 484,574,801 | |
| | | | | |
Principal
Amount (000) (8) | | | Description (1) | | Coupon | | | Maturity | | | Ratings (4) | | | Value | |
| | | | | |
| | | | $1,000 PAR (OR SIMILAR) INSTITUTIONAL PREFERRED – 5.7% | | | | | | | | | | | | | | | | |
| | | | | |
| | | | Banks – 3.3% | | | | | | | | | | | | | | | | |
| | | | | |
| $ | 1,500 | | | Barclays PLC, (7) | | | 8.250% | | | | N/A (9) | | | | BB+ | | | $ | 1,590,000 | |
| | | | | |
| | 2,830 | EUR | | Barclays PLC | | | 6.500% | | | | N/A (9) | | | | BB+ | | | | 3,904,183 | |
| | | | | |
| | 2,000 | | | Citigroup Inc. | | | 8.400% | | | | N/A (9) | | | | BB+ | | | | 2,281,000 | |
| | | | | |
| | 1,000 | | | Dresdner Funding Trust, 144A | | | 8.152% | | | | 6/30/31 | | | | BB | | | | 1,215,000 | |
| | | | | |
| | 1,525 | | | Fifth Third Bancorp. | | | 5.100% | | | | N/A (9) | | | | BBB– | | | | 1,465,144 | |
| | | | | |
| | 5,000 | | | General Electric Capital Corporation | | | 7.125% | | | | N/A (9) | | | | AA– | | | | 5,901,000 | |
| | | | | |
| | 1,448 | | | Lloyd’s Banking Group PLC | | | 7.500% | | | | N/A (9) | | | | BB | | | | 1,540,672 | |
| | | | | |
| | 1,000 | | | RBS Capital Trust I | | | 2.100% | | | | N/A (9) | | | | BB | | | | 1,000,000 | |
| | | | | |
| | 1,500 | | | RBS Capital Trust IV | | | 1.034% | | | | N/A (9) | | | | BB | | | | 1,477,500 | |
| | | | | |
| | 500 | | | Societe Generale, 144A | | | 0.980% | | | | N/A (9) | | | | BBB– | | | | 450,000 | |
| | | | | |
| | 5,585 | | | Wachovia Capital Trust III | | | 5.570% | | | | N/A (9) | | | | BBB+ | | | | 5,417,450 | |
| | | | Total Banks | | | | | | | | | | | | | | | 26,241,949 | |
| | | | | |
| | | | Capital Markets – 0.5% | | | | | | | | | | | | | | | | |
| | | | | |
| | 1,100 | EUR | | Baggot Securities Limited, 144A | | | 10.240% | | | | N/A (9) | | | | N/R | | | | 1,656,853 | |
| | | | | |
| | 1,000 | | | Credit Suisse Group AG | | | 7.500% | | | | N/A (9) | | | | BB+ | | | | 1,106,900 | |
| | | | | |
| | 1,495 | | | Goldman Sachs Capital II | | | 4.000% | | | | N/A (9) | | | | BB+ | | | | 1,196,000 | |
| | | | Total Capital Markets | | | | | | | | | | | | | | | 3,959,753 | |
| | | | | |
| | | | Diversified Financial Services – 0.2% | | | | | | | | | | | | | | | | |
| | | | | |
| | 1,170 | | | Rabobank Nederland, 144A | | | 11.000% | | | | N/A (9) | | | | A– | | | | 1,570,947 | |
Nuveen Strategic Income Fund (continued)
Portfolio of Investments June 30, 2014
| | | | | | | | | | | | | | | | | | | | |
Principal
Amount (000) (8) | | | Description (1) | | Coupon | | | Maturity | | | Ratings (4) | | | Value | |
| | | | | |
| | | | Electric Utilities – 0.2% | | | | | | | | | | | | | | | | |
| | | | | |
| $ | 1,570 | | | Electricite de France, 144A | | | 5.250% | | | | N/A (9) | | | | A3 | | | $ | 1,601,604 | |
| | | | | |
| | | | Industrial Conglomerates – 0.1% | | | | | | | | | | | | | | | | |
| | | | | |
| | 1,000 | | | OAS Financial Limited, 144A | | | 8.875% | | | | N/A (9) | | | | BB– | | | | 995,000 | |
| | | | | |
| | | | Insurance – 1.3% | | | | | | | | | | | | | | | | |
| | | | | |
| | 1,500 | | | Allstate Corporation | | | 5.750% | | | | 8/15/53 | | | | Baa1 | | | | 1,611,083 | |
| | | | | |
| | 2,050 | | | Catlin Insurance Company Limited | | | 7.249% | | | | N/A (9) | | | | BBB+ | | | | 2,116,625 | |
| | | | | |
| | 1,485 | | | Genworth Financial Inc. | | | 6.150% | | | | 11/15/66 | | | | Ba1 | | | | 1,412,606 | |
| | | | | |
| | 1,620 | | | Lincoln National Corporation | | | 6.050% | | | | 4/20/67 | | | | BBB | | | | 1,638,225 | |
| | | | | |
| | 1,435 | | | Prudential Financial Inc., (7) | | | 5.200% | | | | 3/15/44 | | | | BBB+ | | | | 1,463,700 | |
| | | | | |
| | 1,860 | | | ZFS Finance USA Trust V | | | 6.500% | | | | 5/09/37 | | | | A | | | | 1,990,200 | |
| | 9,950 | | | Total Insurance | | | | | | | | | | | | | | | 10,232,439 | |
| | | | | |
| | | | Oil, Gas & Consumable Fuels – 0.1% | | | | | | | | | | | | | | | | |
| | | | | |
| | 1,000 | | | Odebrecht Oil and Gas Finance, (7) | | | 7.000% | | | | N/A (9) | | | | BBB– | | | | 1,032,500 | |
| | | | Total $1,000 Par (or similar) Institutional Preferred (cost $41,835,439) | | | | | | | | | | | | | | | 45,634,192 | |
| | | | | |
Principal
Amount (000) | | | Description (1) | | Coupon | | | Maturity | | | Ratings (4) | | | Value | |
| | | | | |
| | | | ASSET-BACKED AND MORTGAGE-BACKED SECURITIES – 9.5% | | | | | | | | | | | | | | | | |
| | | | | |
| $ | 1,389 | | | 321 Henderson Receivables LLC, Series 2010-3A | | | 3.820% | | | | 12/15/48 | | | | Aaa | | | $ | 1,466,835 | |
| | | | | |
| | 1,250 | | | American Homes 4 Rent, Series 2014-SFR1 | | | 2.350% | | | | 6/17/31 | | | | Baa2 | | | | 1,245,871 | |
| | | | | |
| | 2,270 | | | AmeriCold LLC Trust, Series 2010 | | | 6.811% | | | | 1/14/29 | | | | A+ | | | | 2,679,345 | |
| | | | | |
| | 2,877 | | | Banc of America Alternative Loan Trust, Pass-Through Certificates, Series 2006-6 | | | 6.000% | | | | 7/25/46 | | | | Caa3 | | | | 2,343,695 | |
| | | | | |
| | 47 | | | Bank of America Alternative Loan Trust, Series 2005-5 2 CB1 | | | 6.000% | | | | 6/25/35 | | | | Caa1 | | | | 44,865 | |
| | | | | |
| | 350 | | | Bank of America Commercial Mortgage Inc., Commercial Mortgage Pass-Through Certificates, Series 2005-4 | | | 4.933% | | | | 7/10/45 | | | | AAA | | | | 361,789 | |
| | | | | |
| | 1,435 | | | Bayview Opportunity Master Fund Trust, 2013-8NPL | | | 3.228% | | | | 3/28/33 | | | | N/R | | | | 1,438,360 | |
| | | | | |
| | 1,000 | | | CAM Mortgage Trust 2013-1 | | | 5.500% | | | | 12/15/53 | | | | N/R | | | | 998,417 | |
| | | | | |
| | 1,725 | | | CAM Mortgage Trust 2014-2 | | | 4.450% | | | | 5/15/48 | | | | CCC | | | | 1,725,000 | |
| | | | | |
| | 4,780 | | | Colony American Homes Trust 2014-1A | | | 1.400% | | | | 5/17/31 | | | | Aaa | | | | 4,804,266 | |
| | | | | |
| | 3,000 | | | Commercial Mortgage Pass-Through Certificates, Series 2014-SAVA, (WI/DD) | | | 2.550% | | | | 6/15/34 | | | | A | | | | 3,001,758 | |
| | | | | |
| | 469 | | | Countrywide ABS Asset-Backed Certificate Trust 2007-9 | | | 0.282% | | | | 6/25/47 | | | | B– | | | | 467,609 | |
| | | | | |
| | 365 | | | Countrywide Alternative Loan Trust, Mortgage Pass-Through Certificates, Series 2004-24CB | | | 5.000% | | | | 11/25/19 | | | | B3 | | | | 366,259 | |
| | | | | |
| | 706 | | | Countrywide Alternative Loan Trust, Mortgage Pass-Through Certificates, Series 2006-19CB | | | 6.000% | | | | 8/25/36 | | | | Caa3 | | | | 618,586 | |
| | | | | |
| | 2,459 | | | Countrywide Asset Backed Certificates, Series 2007-4 A2 | | | 5.530% | | | | 3/25/29 | | | | Caa1 | | | | 2,367,921 | |
| | | | | |
| | 491 | | | Countrywide Home Loan Mortgage Pass-Through Trust, Series 2004-2 | | | 2.500% | | | | 2/25/34 | | | | A | | | | 478,274 | |
| | | | | |
| | 1,677 | | | Countrywide Home Loans Mortgage, Series 2005-27 | | | 5.500% | | | | 1/25/23 | | | | Caa1 | | | | 1,575,273 | |
| | | | | | | | | | | | | | | | | | | | |
Principal
Amount (000) | | | Description (1) | | Coupon | | | Maturity | | | Ratings (4) | | | Value | |
| | | | | |
| | | | ASSET-BACKED AND MORTGAGE-BACKED SECURITIES (continued) | | | | | | | | | | | | | | | | |
| | | | | |
| $ | 950 | | | Countrywide Home Loans, Asset Backed Certificates Series 2007-7 | | | 0.312% | | | | 10/25/47 | | | | AAA | | | $ | 932,950 | |
| | | | | |
| | 217 | | | Credit Suisse First Boston Mortgage Securities Corporation, Mortgage-Backed Pass-Through Certificates, Series 2003-23 | | | 5.750% | | | | 9/25/33 | | | | AA+ | | | | 231,955 | |
| | | | | |
| | 704 | | | Fannie Mae Mortgage Interest Strips 366 25 (I/O) | | | 5.000% | | | | 9/01/24 | | | | Aaa | | | | 61,409 | |
| | | | | |
| | 437 | | | Fannie Mae Mortgage Pool AA0005 | | | 5.500% | | | | 11/01/38 | | | | Aaa | | | | 488,844 | |
| | | | | |
| | 435 | | | Fannie Mae Mortgage Pool AA0889 | | | 5.500% | | | | 12/01/38 | | | | Aaa | | | | 486,987 | |
| | | | | |
| | 3,000 | | | Fannie Mae Mortgage Pool AC1877 | | | 4.500% | | | | 9/01/39 | | | | Aaa | | | | 3,252,213 | |
| | | | | |
| | 445 | | | Fannie Mae Mortgage Pool AL1187 | | | 5.500% | | | | 7/01/24 | | | | Aaa | | | | 473,120 | |
| | | | | |
| | 5,321 | | | Fannie Mae Mortgage Pool AL3617 | | | 3.500% | | | | 9/01/27 | | | | Aaa | | | | 5,646,440 | |
| | | | | |
| | 450 | | | Fannie Mae Mortgage Pool 255628 | | | 5.500% | | | | 2/01/25 | | | | Aaa | | | | 504,569 | |
| | | | | |
| | 1,640 | | | Fannie Mae Mortgage Pool 255956 | | | 5.500% | | | | 10/01/25 | | | | Aaa | | | | 1,843,808 | |
| | | | | |
| | 218 | | | Fannie Mae Mortgage Pool 256890, (I/O) | | | 6.000% | | | | 9/01/37 | | | | Aaa | | | | 238,920 | |
| | | | | |
| | 197 | | | Fannie Mae Mortgage Pool 725205 | | | 5.000% | | | | 3/01/34 | | | | Aaa | | | | 219,587 | |
| | | | | |
| | 83 | | | Fannie Mae Mortgage Pool 725553 | | | 2.172% | | | | 9/01/33 | | | | Aaa | | | | 88,419 | |
| | | | | |
| | 283 | | | Fannie Mae Mortgage Pool 725773 | | | 5.500% | | | | 9/01/34 | | | | Aaa | | | | 317,636 | |
| | | | | |
| | 109 | | | Fannie Mae Mortgage Pool 735060 | | | 6.000% | | | | 11/01/34 | | | | Aaa | | | | 123,104 | |
| | | | | |
| | 77 | | | Fannie Mae Mortgage Pool 735606 | | | 1.805% | | | | 5/01/35 | | | | Aaa | | | | 80,558 | |
| | | | | |
| | 102 | | | Fannie Mae Mortgage Pool 745101 | | | 6.000% | | | | 4/01/32 | | | | Aaa | | | | 114,088 | |
| | | | | |
| | 302 | | | Fannie Mae Mortgage Pool 745324 | | | 6.000% | | | | 3/01/34 | | | | Aaa | | | | 337,359 | |
| | | | | |
| | 392 | | | Fannie Mae Mortgage Pool 745548 | | | 2.290% | | | | 1/01/35 | | | | Aaa | | | | 415,307 | |
| | | | | |
| | 83 | | | Fannie Mae Mortgage Pool 824163 | | | 5.500% | | | | 4/01/35 | | | | Aaa | | | | 93,612 | |
| | | | | |
| | 228 | | | Fannie Mae Mortgage Pool 831377 | | | 6.500% | | | | 4/01/36 | | | | Aaa | | | | 260,372 | |
| | | | | |
| | 92 | | | Fannie Mae Mortgage Pool 838948 | | | 1.885% | | | | 8/01/35 | | | | Aaa | | | | 98,179 | |
| | | | | |
| | 260 | | | Fannie Mae Mortgage Pool 843435 | | | 5.500% | | | | 6/01/33 | | | | Aaa | | | | 291,679 | |
| | | | | |
| | 105 | | | Fannie Mae Mortgage Pool 852909 | | | 6.500% | | | | 4/01/36 | | | | Aaa | | | | 120,327 | |
| | | | | |
| | — | (10) | | Fannie Mae Mortgage Pool 889618 | | | 5.500% | | | | 5/01/38 | | | | Aaa | | | | 334 | |
| | | | | |
| | 287 | | | Fannie Mae Mortgage Pool 893318 | | | 6.500% | | | | 8/01/36 | | | | Aaa | | | | 327,791 | |
| | | | | |
| | 33 | | | Fannie Mae Mortgage Pool 905597 | | | 5.885% | | | | 12/01/36 | | | | Aaa | | | | 35,386 | |
| | | | | |
| | 735 | | | Fannie Mae Mortgage Pool 932323 | | | 4.500% | | | | 12/01/39 | | | | Aaa | | | | 797,010 | |
| | | | | |
| | 174 | | | Fannie Mae Mortgage Pool 944340 | | | 6.000% | | | | 6/01/37 | | | | Aaa | | | | 196,123 | |
| | | | | |
| | 95 | | | Fannie Mae Mortgage Pool 946228 | | | 6.057% | | | | 9/01/37 | | | | Aaa | | | | 102,451 | |
| | | | | |
| | — | (10) | | Fannie Mae Mortgage Pool 985344 | | | 5.500% | | | | 7/01/38 | | | | Aaa | | | | 180 | |
| | | | | |
| | 8,000 | | | Fannie Mae TBA, (WI/DD) | | | 3.500% | | | | TBA | | | | Aaa | | | | 8,212,504 | |
| | | | | |
| | 1,101 | | | FDIC Structures Sale Guaranteed Notes, Series 2010-S1 | | | 0.701% | | | | 2/25/48 | | | | Aaa | | | | 1,101,782 | |
| | | | | |
| | 16 | | | Federal Home Loan Mortgage Corporation, Mortgage Pool 1B3220 | | | 2.422% | | | | 1/01/37 | | | | Aaa | | | | 16,914 | |
| | | | | |
| | 17 | | | Federal Home Loan Mortgage Corporation, Series 2376 | | | 5.500% | | | | 11/15/16 | | | | Aaa | | | | 17,409 | |
| | | | | |
| | 892 | | | Freddie Mac Gold Pool 1K1238 | | | 2.375% | | | | 7/01/36 | | | | Aaa | | | | 951,715 | |
| | | | | |
| | 489 | | | Freddie Mac Gold Pool 1L0117 | | | 2.655% | | | | 10/01/29 | | | | Aaa | | | | 505,739 | |
| | | | | |
| | 268 | | | Freddie Mac Gold Pool 847240 | | | 2.287% | | | | 7/01/30 | | | | Aaa | | | | 276,602 | |
Nuveen Strategic Income Fund (continued)
Portfolio of Investments June 30, 2014
| | | | | | | | | | | | | | | | | | | | |
Principal
Amount (000) | | | Description (1) | | Coupon | | | Maturity | | | Ratings (4) | | | Value | |
| | | | | |
| | | | ASSET-BACKED AND MORTGAGE-BACKED SECURITIES (continued) | | | | | | | | | | | | | | | | |
| | | | | |
| $ | 181 | | | Freddie Mac Gold Pool 847411 | | | 2.190% | | | | 5/01/33 | | | | Aaa | | | $ | 188,596 | |
| | | | | |
| | 1,815 | | | Freddie Mac Gold Pool 848289 | | | 2.361% | | | | 5/01/38 | | | | Aaa | | | | 1,935,414 | |
| | | | | |
| | 500 | | | Freddie Mac Mortgage Pool, Various A17212 | | | 6.500% | | | | 7/01/31 | | | | Aaa | | | | 569,631 | |
| | | | | |
| | 65 | | | Freddie Mac Mortgage Pool, Various H09059 | | | 7.000% | | | | 8/01/37 | | | | Aaa | | | | 70,527 | |
| | | | | |
| | 1,405 | | | Freddie Mac Mortgage Trust, Multifamily Mortgage Pass-Through Certificates, Series 2013-K712 | | | 3.483% | | | | 5/25/45 | | | | Aaa | | | | 1,438,449 | |
| | | | | |
| | 22 | | | Freddie Mac Non Gold Participation Certificates 847681 | | | 2.422% | | | | 12/01/36 | | | | Aaa | | | | 23,825 | |
| | | | | |
| | 15 | | | Goldman Sachs Mortgage Securities Corporation II, Commercial Mortgage Pass-Through Certificates, Series 2006-GG6 | | | 5.506% | | | | 4/10/38 | | | | AAA | | | | 15,462 | |
| | | | | |
| | 167 | | | Government National Mortgage Association, Guaranteed REMIC Pass-Through Securities and MX Securities Trust | | | 4.500% | | | | 5/16/38 | | | | Aaa | | | | 176,461 | |
| | | | | |
| | 52 | | | GRMT Mortgage Loan Trust 2001-1A | | | 8.272% | | | | 7/20/31 | | | | A3 | | | | 51,221 | |
| | | | | |
| | 1,703 | | | Impac Secured Assets Corporation, Mortgage Pass-Through Certificates, Series 2000-3 | | | 8.000% | | | | 10/25/30 | | | | CCC | | | | 1,583,889 | |
| | | | | |
| | 335 | | | IndyMac INDX Mortgage Loan Trust, Pass-Through Certificates, Series 2005-AR1 | | | 2.438% | | | | 3/25/35 | | | | BBB+ | | | | 336,297 | |
| | | | | |
| | 3,910 | | | Invitation Homes Trust 2014-SFR1 | | | 2.752% | | | | 6/19/31 | | | | Baa2 | | | | 3,935,618 | |
| | | | | |
| | 1,171 | | | JPMorgan Alternative Loan Trust, Mortgage Pass-Through Certificates, Series 2007-S1 | | | 0.432% | | | | 6/25/37 | | | | CCC | | | | 1,022,828 | |
| | | | | |
| | 935 | | | Lehman Mortgage Trust, Mortgage Pass-Through Certificates, Series 2008-6 | | | 5.519% | | | | 4/25/38 | | | | BB+ | | | | 960,227 | |
| | | | | |
| | 3,259 | | | Master RePerforming Loan Trust 2005-1 | | | 7.500% | | | | 8/25/34 | | | | Ba3 | | | | 3,356,259 | |
| | | | | |
| | 230 | | | Merrill Lynch Mortgage Investors Inc, Commercial Mortgage Pass-Through Certificates, Series 2006 | | | 5.204% | | | | 12/12/49 | | | | A1 | | | | 248,733 | |
| | | | | |
| | 1,000 | | | ML_CFC Commercial Mortgage Trust, Pass-Through Certificates, Series 2007-8 | | | 6.079% | | | | 8/12/49 | | | | BB | | | | 1,046,227 | |
| | | | | |
| | 508 | | | National Credit Union Administration Guaranteed Structured Collateral Notes | | | 2.900% | | | | 10/29/20 | | | | Aaa | | | | 527,215 | |
| | | | | |
| | 623 | | | Oaktree Real Estate Investments, Commercial Mortgage Asset Backed Securities ORES NPL LLC 2013-LV2I, 144A | | | 3.081% | | | | 9/25/25 | | | | N/R | | | | 622,655 | |
| | | | | |
| | 772 | | | RBSSP Resecuritization Trust, Series 2012-8 1A1 | | | 0.290% | | | | 10/28/36 | | | | N/R | | | | 738,419 | |
| | | | | |
| | 155 | | | Residential Accredit Loans Inc., Mortgage Asset-Backed Pass-Through Certificates, Series 2005-QS12 | | | 5.500% | | | | 8/25/35 | | | | Caa2 | | | | 140,365 | |
| | | | | |
| | 321 | | | Sequoia Mortgage Trust, Mortgage Pass-Through Certificates, Series 2011-1 | | | 4.125% | | | | 2/25/41 | | | | AAA | | | | 326,710 | |
| | | | | |
| | 4 | | | Stanwich Mortgage Loan Trust, Series 2012-NPL5 | | | 2.981% | | | | 10/16/42 | | | | N/R | | | | 4,460 | |
| | | | | |
| | 552 | | | Wachovia Mortgage Loan Trust LLC, Mortgage Pass-Through Certificates, Series 2005-B | | | 2.610% | | | | 10/20/35 | | | | D | | | | 466,354 | |
| | | | | |
| | 381 | | | Washington Mutual Mortgage Securities Corporation, Mortgage Pass-Through Certificates, Series 2004-RA3 | | | 6.445% | | | | 8/25/38 | | | | AA | | | | 403,090 | |
| | | | | |
| | 26 | | | Wells Fargo Mortgage Backed Securities, 2005-AR16 Class 3A2 | | | 2.616% | | | | 10/25/35 | | | | BBB– | | | | 26,448 | |
| $ | 74,634 | | | Total Asset-Backed and Mortgage-Backed Securities (cost $73,584,241) | | | | | | | | | | | | | | | 75,462,885 | |
| | | | | | | | | | | | | | | | | | | | |
| Shares | | | Description (1), (11) | | | | | | | | | | | Value | |
| | | | | |
| | | | INVESTMENT COMPANIES – 0.3% | | | | | | | | | | | | | | | | |
| | | | | |
| | 36,000 | | | Blackrock Credit Allocation Income Trust IV | | | | | | | | | | | | | | $ | 495,000 | |
| | | | | |
| | 40,000 | | | CBRE Clarion Global Real Estate Income Fund | | | | | | | | | | | | | | | 364,400 | |
| | | | | |
| | 75,000 | | | Invesco Municipal Income Opportunities Trust | | | | | | | | | | | | | | | 522,000 | |
| | | | | |
| | 23,000 | | | NexPoint Credit Strategies Fund | | | | | | | | | | | | | | | 277,610 | |
| | | | | |
| | 16,000 | | | Pioneer Diversified High Income Trust | | | | | | | | | | | | | | | 338,240 | |
| | | | Total Investment Companies (cost $1,648,223) | | | | | | | | | | | | | | | 1,997,250 | |
| | | | | |
Principal
Amount (000) (8) | | | Description (1) | | Coupon | | | Maturity | | | Ratings (4) | | | Value | |
| | | | | |
| | | | SOVEREIGN DEBT – 16.6% | | | | | | | | | | | | | | | | |
| | | | | |
| | | | Bermuda – 0.4% | | | | | | | | | | | | | | | | |
| | | | | |
| $ | 2,840 | | | Bermuda Government, 144A | | | 5.603% | | | | 7/20/20 | | | | AA– | | | $ | 3,166,600 | |
| | | | | |
| | | | Brazil – 1.3% | | | | | | | | | | | | | | | | |
| | | | | |
| | 27,900 | BRL | | Letra De Tesouro Nacional de Brazil | | | 0.000% | | | | 1/01/16 | | | | BBB+ | | | | 10,740,105 | |
| | | | | |
| | | | Costa Rica – 0.1% | | | | | | | | | | | | | | | | |
| | | | | |
| | 1,000 | | | Republic of Costa Rica | | | 7.000% | | | | 4/04/44 | | | | Baa3 | | | | 1,040,000 | |
| | | | | |
| | | | Germany – 0.9% | | | | | | | | | | | | | | | | |
| | | | | |
| | 4,750 | EUR | | Deutschland Republic | | | 2.500% | | | | 8/15/46 | | | | Aaa | | | | 6,962,070 | |
| | | | | |
| | | | Greece – 0.3% | | | | | | | | | | | | | | | | |
| | | | | |
| | 1,900 | EUR | | Hellenic Republic | | | 4.750% | | | | 4/17/19 | | | | B | | | | 2,658,179 | |
| | | | | |
| | | | Indonesia – 0.6% | | | | | | | | | | | | | | | | |
| | | | | |
| | 2,830 | | | Republic of Indonesia, 144A | | | 5.875% | | | | 3/13/20 | | | | Baa3 | | | | 3,141,300 | |
| | | | | |
| | 1,290 | | | Republic of Indonesia, 144A | | | 4.875% | | | | 5/05/21 | | | | Baa3 | | | | 1,354,500 | |
| | 4,120 | | | Total Indonesia | | | | | | | | | | | | | | | 4,495,800 | |
| | | | | |
| | | | Mexico – 3.8% | | | | | | | | | | | | | | | | |
| | | | | |
| | 1,330 | MXN | | Mexico Bonos de DeSarrollo | | | 8.500% | | | | 12/13/18 | | | | A | | | | 11,864,121 | |
| | | | | |
| | 1,226 | MXN | | Mexico Bonos de DeSarrollo | | | 8.000% | | | | 12/07/23 | | | | A | | | | 11,035,876 | |
| | | | | |
| | 848 | MXN | | Mexico Bonos de DeSarrollo | | | 7.750% | | | | 11/13/42 | | | | A | | | | 7,401,860 | |
| | 3,404 | MXN | | Total Mexico | | | | | | | | | | | | | | | 30,301,857 | |
| | | | | |
| | | | Poland – 1.5% | | | | | | | | | | | | | | | | |
| | | | | |
| | 11,700 | PLN | | Republic of Poland | | | 5.750% | | | | 9/23/22 | | | | A | | | | 4,503,704 | |
| | | | | |
| | 21,200 | PLN | | Republic of Poland | | | 4.000% | | | | 10/25/23 | | | | A | | | | 7,280,977 | |
| | 32,900 | PLN | | Total Poland | | | | | | | | | | | | | | | 11,784,681 | |
| | | | | |
| | | | Portugal – 0.5% | | | | | | | | | | | | | | | | |
| | | | | |
| | 1,000 | EUR | | Portugal Obrigacoes do Tesouro | | | 4.750% | | | | 6/14/19 | | | | Ba1 | | | | 1,518,253 | |
| | | | | |
| | 1,500 | EUR | | Portugal Obrigacoes do Tesouro | | | 5.650% | | | | 2/15/24 | | | | Ba1 | | | | 2,380,652 | |
| | 2,500 | EUR | | Total Portugal | | | | | | | | | | | | | | | 3,898,905 | |
Nuveen Strategic Income Fund (continued)
Portfolio of Investments June 30, 2014
| | | | | | | | | | | | | | | | | | | | |
Principal
Amount (000) (8) | | | Description (1) | | Coupon | | | Maturity | | | Ratings (4) | | | Value | |
| | | | | |
| | | | South Africa – 4.3% | | | | | | | | | | | | | | | | |
| | | | | |
| | 20,500 | ZAR | | Republic of South Africa | | | 8.250% | | | | 9/15/17 | | | | Baa1 | | | $ | 1,978,043 | |
| | | | | |
| | 105,000 | ZAR | | Republic of South Africa | | | 8.000% | | | | 12/21/18 | | | | BBB+ | | | | 10,032,807 | |
| | | | | |
| | 75,600 | ZAR | | Republic of South Africa | | | 6.750% | | | | 3/31/21 | | | | Baa1 | | | | 6,659,624 | |
| | | | | |
| | 3,250 | | | Republic of South Africa | | | 5.875% | | | | 9/16/25 | | | | Baa1 | | | | 3,612,375 | |
| | | | | |
| | 18,500 | ZAR | | Republic of South Africa | | | 10.500% | | | | 12/21/26 | | | | BBB+ | | | | 2,028,877 | |
| | | | | |
| | 124,800 | ZAR | | Republic of South Africa | | | 7.000% | | | | 2/28/31 | | | | Baa1 | | | | 9,884,019 | |
| | | | Total South Africa | | | | | | | | | | | | | | | 34,195,745 | |
| | | | | |
| | | | Turkey – 2.9% | | | | | | | | | | | | | | | | |
| | | | | |
| | 5,400 | | | Republic of Turkey | | | 6.250% | | | | 9/26/22 | | | | Baa3 | | | | 6,084,720 | |
| | | | | |
| | 550 | | | Republic of Turkey | | | 4.875% | | | | 4/16/43 | | | | Baa3 | | | | 517,000 | |
| | | | | |
| | 14,250 | TRY | | Turkey Government Bond | | | 10.400% | | | | 3/27/19 | | | | BBB | | | | 7,247,415 | |
| | | | | |
| | 5,500 | TRY | | Turkey Government Bond | | | 10.500% | | | | 1/15/20 | | | | BBB | | | | 2,823,209 | |
| | | | | |
| | 14,600 | TRY | | Turkey Government Bond | | | 7.100% | | | | 3/08/23 | | | | BBB | | | | 6,247,003 | |
| | | | Total Turkey | | | | | | | | | | | | | | | 22,919,347 | |
| | | | Total Sovereign Debt (cost $134,076,589) | | | | | | | | | | | | | | | 132,163,289 | |
| | | | Total Long-Term Investments (cost $737,538,596) | | | | | | | | | | | | | | | 769,392,730 | |
| | | | | |
| Shares | | | Description (1) | | Coupon | | | | | | | | | Value | |
| | | | |
| | | | INVESTMENTS PURCHASED WITH COLLATERAL FROM SECURITIES LENDING – 10.7% | | | | | | | | | | | | | |
| | | | | |
| | | | Money Market Funds – 10.7% | | | | | | | | | | | | | | | | |
| | | | | |
| | 84,532,292 | | | Mount Vernon Securities Lending Trust Prime Portfolio, (13) | | | 0.185% (12) | | | | | | | | | | | $ | 85,180,247 | |
| | | | Total Investments Purchased with Collateral from Securities Lending (cost $85,180,247) | | | | | | | | | | | | 85,180,247 | |
| | | | | |
| Shares | | | Description (1) | | Coupon | | | | | | | | | Value | |
| | | | | |
| | | | SHORT-TERM INVESTMENTS – 3.5% | | | | | | | | | | | | | | | | |
| | | | | |
| | | | Money Market Funds – 3.5% | | | | | | | | | | | | | | | | |
| | | | | |
| | 27,827,846 | | | First American Treasury Obligations Fund, Class Z | | | 0.000% (12) | | | | | | | | | | | $ | 27,827,846 | |
| | | | Total Short-Term Investments (cost $27,827,846) | | | | | | | | | | | | | | | 27,827,846 | |
| | | | Total Investments (cost $850,546,689) – 111.1% | | | | | | | | | | | | | | | 882,400,823 | |
| | | | Other Assets Less Liabilities – (11.1)% (14) | | | | | | | | | | | | | | | (88,341,733 | ) |
| | | | Net Assets – 100% | | | | | | | | | | | | | | $ | 794,059,090 | |
Investments in Derivatives as of June 30, 2014
Forward Foreign Currency Exchange Contracts outstanding:
| | | | | | | | | | | | | | | | | | | | | | |
| Counterparty | | Currency Contracts to Deliver | | Amount
(Local Currency) | | | In Exchange
For Currency | | | Amount
(Local Currency) | | | Settlement
Date | | | Unrealized
Appreciation
(Depreciation)
(U.S. Dollars) (14) | |
| Citigroup | | Canadian Dollar | | | 3,595,000 | | | | U.S. Dollar | | | | 3,300,709 | | | | 8/29/14 | | | $ | (63,286 | ) |
| Citigroup | | Canadian Dollar | | | 2,150,000 | | | | U.S. Dollar | | | | 1,962,057 | | | | 8/29/14 | | | | (49,790 | ) |
| Citigroup | | Euro | | | 3,650,000 | | | | U.S. Dollar | | | | 5,002,526 | | | | 7/31/14 | | | | 3,980 | |
| Citigroup | | Euro | | | 2,860,000 | | | | U.S. Dollar | | | | 3,906,677 | | | | 7/31/14 | | | | (9,992 | ) |
| Citigroup | | Euro | | | 1,100,000 | | | | U.S. Dollar | | | | 1,489,001 | | | | 7/31/14 | | | | (17,410 | ) |
| Citigroup | | Euro | | | 13,389,423 | | | | U.S. Dollar | | | | 18,255,541 | | | | 8/29/14 | | | | (82,743 | ) |
| Citigroup | | Euro | | | 2,100,000 | | | | U.S. Dollar | | | | 2,857,890 | | | | 8/29/14 | | | | (18,290 | ) |
| Citigroup | | Euro | | | 500,000 | | | | U.S. Dollar | | | | 681,868 | | | | 8/29/14 | | | | (2,937 | ) |
| Citigroup | | Japanese Yen | | | 727,000,000 | | | | U.S. Dollar | | | | 7,147,429 | | | | 8/29/14 | | | | (32,105 | ) |
| Citigroup | | Mexican Peso | | | 109,360,000 | | | | U.S. Dollar | | | | 8,332,825 | | | | 8/14/14 | | | | (69,190 | ) |
| Citigroup | | New Zealand Dollar | | | 10,000,000 | | | | U.S. Dollar | | | | 8,605,700 | | | | 8/11/14 | | | | (114,095 | ) |
| Citigroup | | Norwegian Krone | | | 5,800,000 | | | | U.S. Dollar | | | | 963,984 | | | | 8/29/14 | | | | 20,602 | |
| Citigroup | | U.S. Dollar | | | 8,503,000 | | | | New Zealand Dollar | | | | 10,000,000 | | | | 8/11/14 | | | | 216,795 | |
| Citigroup | | U.S. Dollar | | | 10,086,768 | | | | Pound Sterling | | | | 6,000,000 | | | | 8/18/14 | | | | 177,473 | |
| Citigroup | | U.S. Dollar | | | 7,470,684 | | | | Pound Sterling | | | | 4,420,000 | | | | 8/18/14 | | | | 90,641 | |
| Citigroup | | U.S. Dollar | | | 3,833,663 | | | | Pound Sterling | | | | 2,250,000 | | | | 8/18/14 | | | | 15,428 | |
| Credit Suisse | | Brazilian Real | | | 17,000,000 | | | | U.S. Dollar | | | | 7,718,502 | | | | 7/02/14 | | | | 28,928 | |
| Credit Suisse | | U.S. Dollar | | | 7,597,765 | | | | Brazilian Real | | | | 17,000,000 | | | | 7/02/14 | | | | 91,809 | |
| JPMorgan | | South African Rand | | | 52,000,000 | | | | U.S. Dollar | | | | 4,829,395 | | | | 7/31/14 | | | | (32,689 | ) |
| JPMorgan | | South African Rand | | | 21,500,000 | | | | U.S. Dollar | | | | 1,978,703 | | | | 7/31/14 | | | | (31,582 | ) |
| JPMorgan | | South African Rand | | | 15,000,000 | | | | U.S. Dollar | | | | 1,394,521 | | | | 7/31/14 | | | | (8,003 | ) |
| JPMorgan | | Turkish Lira | | | 35,700,000 | | | | U.S. Dollar | | | | 16,589,258 | | | | 7/03/14 | | | | (250,558 | ) |
| JPMorgan | | Turkish Lira | | | 35,700,000 | | | | U.S. Dollar | | | | 16,493,416 | | | | 8/29/14 | | | | (142,572 | ) |
| JPMorgan | | U.S. Dollar | | | 16,693,944 | | | | Turkish Lira | | | | 35,700,000 | | | | 7/03/14 | | | | 145,871 | |
| JPMorgan | | U.S. Dollar | | | 7,094,824 | | | | Malaysian Ringgit | | | | 23,000,000 | | | | 8/12/14 | | | | 43,230 | |
| JPMorgan | | U.S. Dollar | | | 7,352,298 | | | | Indonesian Rupiah | | | | 84,000,000,000 | | | | 8/20/14 | | | | (336,014 | ) |
| JPMorgan | | U.S. Dollar | | | 463,129 | | | | Turkish Lira | | | | 1,000,000 | | | | 8/29/14 | | | | 2,865 | |
| Nomura Securities | | Brazilian Real | | | 26,800,000 | | | | U.S. Dollar | | | | 12,115,732 | | | | 7/02/14 | | | | (6,656 | ) |
| Nomura Securities | | Brazilian Real | | | 7,200,000 | | | | U.S. Dollar | | | | 3,211,418 | | | | 7/02/14 | | | | (45,342 | ) |
| Nomura Securities | | Brazilian Real | | | 17,000,000 | | | | U.S. Dollar | | | | 7,652,487 | | | | 8/04/14 | | | | 40,717 | |
| Nomura Securities | | U.S. Dollar | | | 7,718,502 | | | | Brazilian Real | | | | 17,000,000 | | | | 7/02/14 | | | | (28,928 | ) |
| Nomura Securities | | U.S. Dollar | | | 7,459,412 | | | | Brazilian Real | | | | 17,000,000 | | | | 7/02/14 | | | | 230,162 | |
| Nomura Securities | | U.S. Dollar | | | 12,006,631 | | | | Brazilian Real | | | | 26,800,000 | | | | 8/04/14 | | | | (6,899 | ) |
| Nomura Securities | | U.S. Dollar | | | 15,189,650 | | | | New Zealand Dollar | | | | 17,500,000 | | | | 8/20/14 | | | | 57,367 | |
| | | | | | | | | | | | | | | | | | | | | $ | (183,213 | ) |
Interest Rate Swaps outstanding:
| | | | | | | | | | | | | | | | | | | | | | | | | | | | | | | | |
| Counterparty | | Notional
Amount | | | Fund
Pay/Receive
Floating Rate | | | Floating Rate Index | | | Fixed Rate
(Annualized) | | | Fixed Rate
Payment
Frequency | | | Termination
Date | | | Value | | | Unrealized
Appreciation
(Depreciation) (14) | |
Bank of America* | | $ | 19,000,000 | | | | Receive | | | | 3-Month USD-LIBOR-BBA | | | | 1.573 | % | | | Semi-Annually | | | | 10/10/18 | | | $ | (138,171 | ) | | $ | (138,587 | ) |
JPMorgan | | | 21,000,000 | | | | Receive | | | | 3-Month USD-LIBOR-BBA | | | | 2.113 | | | | Semi-Annually | | | | 2/21/22 | | | | 104,011 | | | | 104,011 | |
JPMorgan | | | 10,800,000 | | | | Receive | | | | 3-Month USD-LIBOR-BBA | | | | 2.078 | | | | Semi-Annually | | | | 2/19/23 | | | | 233,823 | | | | 233,823 | |
JPMorgan* | | | 17,000,000 | | | | Receive | | | | 3-Month USD-LIBOR-BBA | | | | 2.739 | | | | Semi-Annually | | | | 11/21/23 | | | | (342,607 | ) | | | (343,111 | ) |
Morgan Stanley* | | | 26,000,000 | | | | Receive | | | | 3-Month USD-LIBOR-BBA | | | | 2.743 | | | | Semi-Annually | | | | 4/15/24 | | | | (505,990 | ) | | | (505,990 | ) |
| | | $ | 93,800,000 | | | | | | | | | | | | | | | | | | | | | | | $ | (648,934 | ) | | $ | (649,854 | ) |
| * | Citigroup is the clearing house for this transaction |
Nuveen Strategic Income Fund (continued)
Portfolio of Investments June 30, 2014
Futures Contracts outstanding:
| | | | | | | | | | | | | | | | | | | | |
| Description | | Contract
Position | | | Number of
Contracts | | | Contract
Expiration | | | Notional
Amount at
Value | | | Unrealized
Appreciation
(Depreciation) | |
90-Day Eurodollar | | | Short | | | | (200 | ) | | | 3/16 | | | $ | (49,412,500 | ) | | $ | 1,908 | |
90-Day Eurodollar | | | Short | | | | (107 | ) | | | 6/16 | | | | (26,364,800 | ) | | | (43,499 | ) |
U.S. Treasury 5-Year Note | | | Short | | | | (593 | ) | | | 9/14 | | | | (70,840,336 | ) | | | 108,726 | |
U.S. Treasury 10-Year Note | | | Short | | | | (391 | ) | | | 9/14 | | | | (48,942,203 | ) | | | 24,839 | |
| | | | | | | | | | | | | | | $ | (195,559,839 | ) | | $ | 91,974 | |
| | For Fund portfolio compliance purposes, the Fund’s industry classifications refer to any one or more of the industry sub-classifications used by one or more widely recognized market indexes or ratings group indexes, and/or as defined by Fund management. This definition may not apply for purposes of this report, which may combine industry sub-classifications into sectors for reporting ease. |
| (1) | All percentages shown in the Portfolio of Investments are based on net assets. |
| (2) | Non-income producing; issuer has not declared a dividend within the past twelve months. |
| (3) | Investment valued at fair value using methods determined in good faith by, or at the discretion of, the Nuveen funds’ Board of Directors/Trustees. For fair value measurement disclosure purposes, investment classified as Level 3. See Notes to Financial Statements, Note 2-Investment Valuation and Fair Value Measurements for more information. |
| (4) | Ratings (not covered by the report of independent registered public accounting firm): Using the highest of Standard & Poor’s Group (“Standard & Poor’s”), Moody’s Investors Service, Inc. (“Moody’s”) or Fitch, Inc. (“Fitch”) rating. Ratings below BBB by Standard & Poor’s, Baa by Moody’s or BBB by Fitch are considered to be below investment grade. Holdings designated N/R are not rated by any of these national rating agencies. |
| (5) | Senior loans generally are subject to mandatory and/or optional prepayment. Because of these mandatory prepayment conditions and because there may be significant economic incentives for a borrower to prepay, prepayments of senior loans may occur. As a result, the actual remaining maturity of senior loans held may be substantially less than the stated maturities shown. |
| (6) | Senior loans generally pay interest at rates which are periodically adjusted by reference to a base short-term, floating lending rate plus an assigned fixed rate. These floating lending rates are generally (i) the lending rate referenced by the London Inter-Bank Offered Rate (“LIBOR”), or (ii) the prime rate offered by one or more major United States banks. Senior loans may be considered restricted in that the Fund ordinarily is contractually obligated to receive approval from the agent bank and/or borrower prior to the disposition of a senior loan. The rate shown is the coupon as of the end of the reporting period. |
| (7) | Investment, or a portion of investment, is out on loan for securities lending. The total value of securities out on loan as of the end of the reporting period was $83,010,070. |
| (8) | Principal Amount (000) denominated in U.S. Dollars, unless otherwise noted. |
| (9) | Perpetual security. Maturity date is not applicable. |
| (10) | Principal Amount (000) rounds to less than $1,000. |
| (11) | A copy of the most recent financial statements for the investment companies in which the Fund invests can be obtained directly from the Securities and Exchange Commission on its website at http://www.sec.gov. |
| (12) | The rate shown is the annualized seven-day effective yield as of the end of the reporting period. |
| (13) | The Fund may loan securities representing up to one third of the fair value of its total assets (which includes collateral for securities on loan) to broker-dealers, banks and other institutions. The Fund maintains collateral equal to at least 100% of the fair value of the securities loaned. The cash collateral received by the Fund is invested in this money market fund. See Notes to Financial Statements, Note 3 – Portfolio Securities and Investments in Derivatives, Securities Lending for more information. |
| (14) | Other Assets Less Liabilities includes the Unrealized Appreciation (Depreciation) of certain derivative instruments as listed within Investments in Derivatives as of the end of the reporting period. |
| (15) | For fair value measurement disclosure purposes, $25 Par (or similar) Retail Preferred classified as Level 2. See Notes to Financial Statements, Note 2 – Investment Valuation and Fair Value Measurements for more information. |
| Reg S | Regulation S allows U.S. companies to sell securities to persons or entities located outside of the United States without registering those securities with the Securities and Exchange Commission. Specifically, Regulation S provides a safe harbor from the registration requirements of the Securities Act for the offers and sales of securities by both foreign and domestic issuers that are made outside the United States. |
| WI/DD | Investment, or portion of investment, purchased on a when-issued or delayed delivery basis. |
| TBA | To be announced. Maturity date not known prior to settlement of this transaction. |
| TBD | Senior loan purchased on a when-issued or delayed-delivery basis. Certain details associated with this purchase are not known prior to the settlement date of the transaction. In addition, senior loans typically trade without accrued interest and therefore a coupon rate is not available prior to settlement. At settlement, if still unknown, the borrower or counterparty will provide the Fund with the final coupon rate and maturity date. |
| 144A | Investment is exempt from registration under Rule 144A of the Securities Act of 1933, as amended. These investments may only be resold in transactions exempt from registration, which are normally those transactions with qualified institutional buyers. |
| USD-LIBOR-BBA | United States Dollar-London Inter-Bank Offered Rate British Bankers’ Association. |
See accompanying notes to financial statements.
Nuveen U.S. Infrastructure Income Fund
Portfolio of Investments June 30, 2014
| | | | | | | | | | | | | | | | | | | | |
Principal
Amount (000) | | | Description (1) | | Coupon | | | Maturity | | | Ratings (2) | | | Value | |
| | | | | |
| | | | LONG-TERM INVESTMENTS – 98.8% | | | | | | | | | | | | | | | | |
| | | | | |
| | | | CORPORATE BONDS – 35.2% | | | | | | | | | | | | | | | | |
| | | | | |
| | | | Commercial Services & Supplies – 3.0% | | | | | | | | | | | | | | | | |
| | | | | |
| $ | 65 | | | ADS Waste Holdings Inc. | | | 8.250% | | | | 10/01/20 | | | | CCC+ | | | $ | 70,038 | |
| | | | | |
| | 66 | | | Casella Waste Systems Inc. | | | 7.750% | | | | 2/15/19 | | | | CCC+ | | | | 68,970 | |
| | | | | |
| | 69 | | | Covanta Holding Corporation | | | 5.875% | | | | 3/01/24 | | | | Ba3 | | | | 71,329 | |
| | 200 | | | Total Commercial Services & Supplies | | | | | | | | | | | | | | | 210,337 | |
| | | | | |
| | | | Diversified Telecommunication Services – 1.9% | | | | | | | | | | | | | | | | |
| | | | | |
| | 65 | | | CyrusOne LP Finance | | | 6.375% | | | | 11/15/22 | | | | B+ | | | | 70,038 | |
| | | | | |
| | 65 | | | IntelSat Jackson Holdings | | | 6.625% | | | | 12/15/22 | | | | B– | | | | 67,844 | |
| | 130 | | | Total Diversified Telecommunication Services | | | | | | | | | | | | | | | 137,882 | |
| | | | | |
| | | | Electric Utilities – 5.6% | | | | | | | | | | | | | | | | |
| | | | | |
| | 65 | | | Exelon Generation Co. LLC | | | 4.250% | | | | 6/15/22 | | | | BBB+ | | | | 67,870 | |
| | | | | |
| | 95 | | | Mississippi Power Company | | | 4.250% | | | | 3/15/42 | | | | A | | | | 93,028 | |
| | | | | |
| | 100 | | | Northern States Power Company | | | 2.600% | | | | 5/15/23 | | | | Aa3 | | | | 96,480 | |
| | | | | |
| | 70 | | | PPL Capital Funding Inc. | | | 3.500% | | | | 12/01/22 | | | | BBB | | | | 71,143 | |
| | | | | |
| | 70 | | | Progress Energy, Inc. | | | 3.150% | | | | 4/01/22 | | | | Baa1 | | | | 70,208 | |
| | 400 | | | Total Electric Utilities | | | | | | | | | | | | | | | 398,729 | |
| | | | | |
| | | | Gas Utilities – 1.0% | | | | | | | | | | | | | | | | |
| | | | | |
| | 70 | | | Suburban Propane Partners LP | | | 5.500% | | | | 6/01/24 | | | | BB– | | | | 70,875 | |
| | | | | |
| | | | Health Care Equipment & Supplies – 1.0% | | | | | | | | | | | | | | | | |
| | | | | |
| | 65 | | | Tenet Healthcare Corporation | | | 6.750% | | | | 2/01/20 | | | | B3 | | | | 70,606 | |
| | | | | |
| | | | Health Care Providers & Services – 2.8% | | | | | | | | | | | | | | | | |
| | | | | |
| | 65 | | | Community Health Systems, Inc. | | | 6.875% | | | | 2/01/22 | | | | B | | | | 68,900 | |
| | | | | |
| | 65 | | | Kindred Healthcare Inc., 144A | | | 6.375% | | | | 4/15/22 | | | | B– | | | | 65,325 | |
| | | | | |
| | 66 | | | Select Medical Corporation | | | 6.375% | | | | 6/01/21 | | | | B– | | | | 68,970 | |
| | 196 | | | Total Health Care Providers & Services | | | | | | | | | | | | | | | 203,195 | |
| | | | | |
| | | | Internet Software & Services – 1.0% | | | | | | | | | | | | | | | | |
| | | | | |
| | 68 | | | Equinix Inc. | | | 5.375% | | | | 4/01/23 | | | | BB | | | | 69,530 | |
| | | | | |
| | | | Marine – 1.0% | | | | | | | | | | | | | | | | |
| | | | | |
| | 69 | | | Navios South American Logisitics Inc., Finance US Inc., 144A | | | 7.250% | | | | 5/01/22 | | | | B+ | | | | 71,760 | |
| | | | | |
| | | | Oil, Gas & Consumable Fuels – 9.6% | | | | | | | | | | | | | | | | |
| | | | | |
| | 68 | | | Atlas Pipeline LP Finance | | | 5.875% | | | | 8/01/23 | | | | B+ | | | | 69,190 | |
| | | | | |
| | 90 | | | Berkshire Hathaway Energy Company | | | 3.750% | | | | 11/15/23 | | | | A3 | | | | 92,717 | |
| | | | | |
| | 66 | | | Calumet Specialty Products | | | 7.625% | | | | 1/15/22 | | | | B+ | | | | 70,950 | |
| | | | | |
| | 70 | | | Enterprise Products Operating Group LLP | | | 3.350% | | | | 3/15/23 | | | | BBB+ | | | | 70,122 | |
Nuveen U.S. Infrastructure Income Fund (continued)
Portfolio of Investments June 30, 2014
| | | | | | | | | | | | | | | | | | | | |
Principal
Amount (000) | | | Description (1) | | Coupon | | | Maturity | | | Ratings (2) | | | Value | |
| | | | | |
| | | | Oil, Gas & Consumable Fuels (continued) | | | | | | | | | | | | | | | | |
| | | | | |
| $ | 68 | | | Hiland Partners LP/ Hiland Partners Finance Corp., 144A | | | 5.500% | | | | 5/15/22 | | | | B | | | $ | 68,850 | |
| | | | | |
| | 70 | | | Kinder Morgan Energy Partners LP | | | 3.500% | | | | 9/01/23 | | | | BBB | | | | 67,984 | |
| | | | | |
| | 66 | | | Martin Mid-Stream Partners LP Finance | | | 7.250% | | | | 2/15/21 | | | | B– | | | | 69,960 | |
| | | | | |
| | 100 | | | Southeast Supply Header LLC, 144A | | | 4.250% | | | | 6/15/24 | | | | BBB– | | | | 101,785 | |
| | | | | |
| | 68 | | | Western Refining Inc. | | | 6.250% | | | | 4/01/21 | | | | B+ | | | | 71,060 | |
| | 666 | | | Total Oil, Gas, & Consumable Fuels | | | | | | | | | | | | | | | 682,618 | |
| | | | | |
| | | | Real Estate Investment Trust – 3.4% | | | | | | | | | | | | | | | | |
| | | | | |
| | 100 | | | American Tower Company | | | 5.000% | | | | 2/15/24 | | | | BBB | | | | 108,613 | |
| | | | | |
| | 70 | | | Corrections Corporation of America | | | 4.625% | | | | 5/01/23 | | | | BB+ | | | | 68,600 | |
| | | | | |
| | 60 | | | Geo Group Inc. | | | 5.875% | | | | 1/15/22 | | | | B+ | | | | 63,000 | |
| | 230 | | | Total Real Estate Investment Trust | | | | | | | | | | | | | | | 240,213 | |
| | | | | |
| | | | Road & Rail – 4.9% | | | | | | | | | | | | | | | | |
| | | | | |
| | 95 | | | Burlington Northern Santa Fe Corporation | | | 4.375% | | | | 9/01/42 | | | | A3 | | | | 93,787 | |
| | | | | |
| | 90 | | | Norfolk Southern Corporation | | | 3.850% | | | | 1/15/24 | | | | BBB+ | | | | 93,668 | |
| | | | | |
| | 85 | | | Union Pacific Corporation | | | 4.750% | | | | 12/15/43 | | | | A | | | | 92,341 | |
| | | | | |
| | 68 | | | Watco Companies LLC Finance, 144A | | | 6.375% | | | | 4/01/23 | | | | B3 | | | | 69,360 | |
| | 338 | | | Total Road & Rail | | | | | | | | | | | | | | | 349,156 | |
| $ | 2,432 | | | Total Corporate Bonds (cost $2,491,420) | | | | | | | | | | | | | | | 2,504,901 | |
| | | | | |
Principal
Amount (000) | | | Description (1) | | | | | Optional Call
Provisions (3) | | | Ratings (2) | | | Value | |
| | | | | |
| | | | MUNICIPAL BONDS – 63.6% | | | | | | | | | | | | | | | | |
| | | | | |
| | | | Arizona – 3.7% | | | | | | | | | | | | | | | | |
| | | | | |
| $ | 65 | | | Phoenix, Arizona, Various Purpose General Obligation Bonds, Build America Taxable Bonds, Series 2009A, 5.269%, 7/01/34 | | | | | | | No Opt. Call | | | | AA+ | | | $ | 71,774 | |
| | | | | |
| | 65 | | | Salt River Project Agricultural Improvement and Power District, Arizona, Electric System Revenue Bonds, Build America Bonds, Series 2010A, 4.839%, 1/01/41 | | | | | | | No Opt. Call | | | | Aa1 | | | | 74,075 | |
| | | | | |
| | 100 | | | Salt Verde Financial Corporation, Arizona, Senior Gas Revenue Bonds, Citigroup Energy Inc Prepay Contract Obligations, Series 2007, 5.250%, 12/01/28 | | | | | | | No Opt. Call | | | | A– | | | | 115,018 | |
| | 230 | | | Total Arizona | | | | | | | | | | | | | | | 260,867 | |
| | | | | |
| | | | California – 14.3% | | | | | | | | | | | | | | | | |
| | | | | |
| | 250 | | | Alameda Corridor Transportation Authority, California, User Fee Revenue Bonds, Subordinate Lien Series 2004B, 0.000%, 10/01/31 – AMBAC Insured | | | | | | | No Opt. Call | | | | BBB+ | | | | 81,683 | |
| | | | | |
| | 100 | | | Bay Area Toll Authority, California, Revenue Bonds, San Francisco Bay Area Toll Bridge, Build America Federally Taxable Bond Series 2009F-2, 6.263%, 4/01/49 | | | | | | | No Opt. Call | | | | AA | | | | 134,982 | |
| | | | | |
| | 100 | | | California State, Various Purpose General Obligation Bonds, Build America Federally Taxable Bonds, Series 2009, 7.550%, 4/01/39 | | | | | | | No Opt. Call | | | | Aa3 | | | | 149,305 | |
| | | | | |
| | 50 | | | Los Angeles Community College District, California, General Obligation Bonds, Build America Taxable Bonds, Series 2010, 6.600%, 8/01/42 | | | | | | | No Opt. Call | | | | Aa1 | | | | 68,861 | |
| | | | | |
| | 75 | | | Los Angeles Department of Airports, California, Revenue Bonds, Los Angeles International Airport, Build America Taxable Bonds, Series 2009C, 6.582%, 5/15/39 | | | | | | | No Opt. Call | | | | AA– | | | | 95,039 | |
| | | | | | | | | | | | | | | | | | |
Principal
Amount (000) | | | Description (1) | | | | Optional Call
Provisions (3) | | | Ratings (2) | | | Value | |
| | | | | |
| | | | California (continued) | | | | | | | | | | | | | | |
| | | | | |
| $ | 100 | | | Los Angeles Department of Water and Power, California, Power System Revenue Bonds, Federally Taxable – Direct Payment – Build America Bonds, Series 2010A, 5.716%, 7/01/39 | | | | | No Opt. Call | | | | AA– | | | $ | 124,205 | |
| | | | | |
| | 95 | | | Sacramento Municipal Utility District, California, Electric Revenue Bonds, Federally Taxable Build America Bonds, Series 2010W, 6.156%, 5/15/36 | | | | | No Opt. Call | | | | AA– | | | | 114,490 | |
| | | | | |
| | 100 | | | San Francisco City and County Public Utilities Commission, California, Water Revenue Bonds, Build America Taxable Bonds, Series 2010E, 6.000%, 11/01/40 | | | | | No Opt. Call | | | | AA– | | | | 126,876 | |
| | | | | |
| | 100 | | | University of California, General Revenue Bonds, Build America Taxable Bonds, Series 2009R, 5.770%, 5/15/43 | | | | | No Opt. Call | | | | AA | | | | 122,741 | |
| | 970 | | | Total California | | | | | | | | | | | | | 1,018,182 | |
| | | | | |
| | | | Colorado – 0.5% | | | | | | | | | | | | | | |
| | | | | |
| | 100 | | | E-470 Public Highway Authority, Colorado, Toll Revenue Bonds, Refunding Series 2006B, 0.000%, 9/01/35 – NPFG Insured | | | | | 9/26 at 63.78 | | | | AA– | | | | 34,802 | |
| | | | | |
| | | | Illinois – 10.8% | | | | | | | | | | | | | | |
| | | | | |
| | 65 | | | Chicago Greater Metropolitan Water Reclamation District, Illinois, General Obligation Bonds, Build America Taxable Bonds, Series 2009, 5.720%, 12/01/38 | | | | | No Opt. Call | | | | AAA | | | | 78,255 | |
| | | | | |
| | 35 | | | Chicago Transit Authority, Illinois, Sales Tax Receipts Revenue Bonds, Federally Taxable Build America Bonds, Series 2010B, 6.200%, 12/01/40 | | | | | No Opt. Call | | | | AA | | | | 40,033 | |
| | | | | |
| | 100 | | | Chicago, Illinois, General Airport Revenue Bonds, O’Hare International Airport, Third Lien, Build America Taxable Bond Series 2010B, 6.845%, 1/01/38 | | | | | 1/20 at 100.00 | | | | A2 | | | | 112,068 | |
| | | | | |
| | 110 | | | Chicago, Illinois, Wastewater Transmission Revenue Bonds, Build America Taxable Bond Series 2010B, 6.900%, 1/01/40 | | | | | No Opt. Call | | | | AA | | | | 130,015 | |
| | | | | |
| | 100 | | | Cook County, Illinois, General Obligation Bonds, Build America Taxable Bonds, Series 2010D, 6.229%, 11/15/34 | | | | | No Opt. Call | | | | AA | | | | 116,177 | |
| | | | | |
| | 100 | | | Illinois State, General Obligation Bonds, Taxable Build America Bonds, Series 2010-1, 6.630%, 2/01/35 | | | | | No Opt. Call | | | | A– | | | | 113,347 | |
| | | | | |
| | 45 | | | Illinois Toll Highway Authority, Toll Highway Revenue Bonds, Build America Taxable Bonds, Senior Lien Series 2009A, 6.184%, 1/01/34 | | | | | No Opt. Call | | | | AA– | | | | 56,219 | |
| | | | | |
| | 100 | | | Northern Illinois Municipal Power Agency, Power Project Revenue Bonds, Prairie State Project, Build America Bond Series 2009C, 6.859%, 1/01/39 | | | | | No Opt. Call | | | | A2 | | | | 119,358 | |
| | 655 | | | Total Illinois | | | | | | | | | | | | | 765,472 | |
| | | | | |
| | | | Louisiana – 1.6% | | | | | | | | | | | | | | |
| | | | | |
| | 100 | | | East Baton Rouge Sewerage Commission, Louisiana, Revenue Bonds, Build America Taxable Bonds, Series 2010B, 6.087%, 2/01/45 | | | | | 2/20 at 100.00 | | | | AA | | | | 111,330 | |
| | | | | |
| | | | Missouri – 1.0% | | | | | | | | | | | | | | |
| | | | | |
| | 60 | | | Missouri Joint Municipal Electric Utility Commission, Plum Point Project Revenue Bonds, Build America Taxable Bonds – Direct Payment, Series 2009A, 7.730%, 1/01/39 | | | | | No Opt. Call | | | | A– | | | | 73,459 | |
| | | | | |
| | | | New Jersey – 4.3% | | | | | | | | | | | | | | |
| | | | | |
| | 50 | | | New Jersey Economic Development Authority, Special Facilities Revenue Bonds, Continental Airlines Inc., Series 1999, 5.250%, 9/15/29 (Alternative Minimum Tax) | | | | | 9/22 at 101.00 | | | | B | | | | 51,950 | |
| | | | | |
| | 100 | | | New Jersey Transportation Trust Fund Authority, Transportation System Bonds, Build America Bonds Issuer Subsidy Program, Series 2010C, 6.104%, 12/15/28 | | | | | 12/20 at 100.00 | | | | A | | | | 111,538 | |
Nuveen U.S. Infrastructure Income Fund (continued)
Portfolio of Investments June 30, 2014
| | | | | | | | | | | | | | | | | | |
Principal
Amount (000) | | | Description (1) | | | | Optional Call
Provisions (3) | | | Ratings (2) | | | Value | |
| | | | | |
| | | | New Jersey (continued) | | | | | | | | | | | | | | |
| | | | | |
| $ | 100 | | | New Jersey Turnpike Authority, Revenue Bonds, Build America Taxable Bonds, Series 2010A, 7.102%, 1/01/41 | | | | | No Opt. Call | | | | A+ | | | $ | 140,498 | |
| | 250 | | | Total New Jersey | | | | | | | | | | | | | 303,986 | |
| | | | | |
| | | | New York – 7.0% | | | | | | | | | | | | | | |
| | | | | |
| | 100 | | | Metropolitan Transportation Authority, New York, Dedicated Tax Fund Bonds, Build America Taxable Bonds, Series 2010A-2, 6.089%, 11/15/40 | | | | | No Opt. Call | | | | AA | | | | 125,743 | |
| | | | | |
| | 100 | | | Metropolitan Transportation Authority, New York, Transportation Revenue Bonds, Build America Taxable Bonds, Series 2010B-1, 6.648%, 11/15/39 | | | | | No Opt. Call | | | | AA– | | | | 132,221 | |
| | | | | |
| | 100 | | | New York City Transitional Finance Authority, New York, Building Aid Revenue Bonds, Build America Taxable Bond Fiscal 2011 Series 2010S-1B, 6.828%, 7/15/40 | | | | | No Opt. Call | | | | Aa2 | | | | 129,072 | |
| | | | | |
| | 100 | | | Port Authority of New York and New Jersey, Consolidated Revenue Bonds, One Hundred Eighty-First Series 2014, 4.960%, 8/01/46 | | | | | No Opt. Call | | | | AA– | | | | 113,463 | |
| | 400 | | | Total New York | | | | | | | | | | | | | 500,499 | |
| | | | | |
| | | | Ohio – 4.0% | | | | | | | | | | | | | | |
| | | | | |
| | 100 | | | American Municipal Power Inc., Ohio, Combined Hydroelectric Projects Revenue Bonds, Federally Taxable Build America Bonds, Series 2009B, 6.449%, 2/15/44 | | | | | No Opt. Call | | | | A | | | | 123,035 | |
| | | | | |
| | 100 | | | JobsOhio Beverage System, Ohio, Statewide Liquor Profits Revenue Bonds, Senior Lien Taxable Series 2013B, 4.532%, 1/01/35 | | | | | No Opt. Call | | | | AA | | | | 103,903 | |
| | | | | |
| | 50 | | | Ohio State University, General Receipts Bonds, Build America Taxable Bond Series 2010C, 4.910%, 6/01/40 | | | | | No Opt. Call | | | | Aa1 | | | | 56,817 | |
| | 250 | | | Total Ohio | | | | | | | | | | | | | 283,755 | |
| | | | | |
| | | | Oregon – 1.8% | | | | | | | | | | | | | | |
| | | | | |
| | 100 | | | Oregon State Department of Transportation, Highway User Tax Revenue Bonds, Federally Taxable Build America Bonds, Series 2010A, 5.834%, 11/15/34 | | | | | No Opt. Call | | | | AA+ | | | | 125,466 | |
| | | | | |
| | | | Pennsylvania – 2.9% | | | | | | | | | | | | | | |
| | | | | |
| | 100 | | | Commonwealth Financing Authority, Pennsylvania, State Appropriation Lease Bonds, Build America Taxable Bonds, Series 2009D, 6.218%, 6/01/39 | | | | | No Opt. Call | | | | AA– | | | | 120,312 | |
| | | | | |
| | 70 | | | Pennsylvania Turnpike Commission, Turnpike Revenue Bonds, Build America Taxable Bonds, Series 2009A, 6.105%, 12/01/39 | | | | | No Opt. Call | | | | A+ | | | | 86,896 | |
| | 170 | | | Total Pennsylvania | | | | | | | | | | | | | 207,208 | |
| | | | | |
| | | | Tennessee – 1.8% | | | | | | | | | | | | | | |
| | | | | |
| | 100 | | | Metropolitan Government Nashville & Davidson County Convention Center Authority, Tennessee, Tourism Tax Revenue Bonds, Build America Taxable Bonds, Subordinate Lien Series 2010B, 6.731%, 7/01/43 | | | | | No Opt. Call | | | | Aa3 | | | | 128,916 | |
| | | | | |
| | | | Texas – 5.4% | | | | | | | | | | | | | | |
| | | | | |
| | 75 | | | Dalllas County Hospital District, Texas, General Obligation Limited Tax Bonds, Build America Taxable Bonds, Series 2009C, 5.621%, 8/15/44 | | | | | No Opt. Call | | | | AA+ | | | | 90,557 | |
| | | | | |
| | 60 | | | Harris County-Houston Sports Authority, Texas, Special Revenue Bonds, Refunding Junior Lien Series 2001B, 5.250%, 11/15/40 – NPFG Insured | | | | | 11/14 at 100.00 | | | | AA– | | | | 60,026 | |
| | | | | |
| | 100 | | | North Texas Tollway Authority, System Revenue Bonds, Subordinate Lien Taxable Revenue Bonds, Federally Taxable Build America Bonds, Series 2010-B2, 8.910%, 2/01/30 | | | | | 2/20 at 100.00 | | | | Baa3 | | | | 119,842 | |
| | | | | | | | | | | | | | | | | | |
Principal
Amount (000) | | | Description (1) | | | | Optional Call
Provisions (3) | | | Ratings (2) | | | Value | |
| | | | | |
| | | | Texas (continued) | | | | | | | | | | | | | | |
| | | | | |
| $ | 95 | | | Texas Private Activity Bond Surface Transportation Corporation, Senior Lien Revenue Bonds, LBJ Infrastructure Group LLC IH-635 Managed Lanes Project, Series 2010, 7.500%, 6/30/33 | | | | | 6/20 at 100.00 | | | | Baa3 | | | $ | 116,907 | |
| | 330 | | | Total Texas | | | | | | | | | | | | | 387,332 | |
| | | | | |
| | | | Virginia – 3.2% | | | | | | | | | | | | | | |
| | | | | |
| | 100 | | | Metropolitan Washington Airports Authority, Virginia, Dulles Toll Road Second Senior Lien Revenue Bonds, Build America Bonds, Series 2009D, 7.462%, 10/01/46 – AGC Insured | | | | | No Opt. Call | | | | BBB+ | | | | 135,095 | |
| | | | | |
| | 80 | | | Virginia Transportation Board, Transportation Revenue Bonds, Capital Projects, Build America Taxable Bonds, Series 2010A-2, 5.350%, 5/15/35 | | | | | No Opt. Call | | | | AA+ | | | | 93,167 | |
| | 180 | | | Total Virginia | | | | | | | | | | | | | 228,262 | |
| | | | | |
| | | | Washington – 1.3% | | | | | | | | | | | | | | |
| | | | | |
| | 75 | | | Central Puget Sound Regional Transit Authority, Washington, Sales and Use Tax Revenue Bonds, Build America Taxable Bonds, Series 2009S-2T, 5.491%, 11/01/39 | | | | | No Opt. Call | | | | AAA | | | | 89,941 | |
| $ | 3,970 | | | Total Municipal Bonds (cost $4,415,164) | | | | | | | | | | | | | 4,519,477 | |
| | | | Total Long-Term Investments (cost $6,906,584) | | | | | | | | | | | | | 7,024,378 | |
| | | | Other Assets Less Liabilities – 1.2% | | | | | | | | | | | | | 88,621 | |
| | | | Net Assets – 100% | | | | | | | | | | | | $ | 7,112,999 | |
Investments in Derivatives as of June 30, 2014
Futures Contracts outstanding:
| | | | | | | | | | | | | | | | | | | | |
| Description | | Contract
Position | | | Number of
Contracts | | | Contract
Expiration | | | Notional
Amount
at Value | | | Unrealized
Appreciation
(Depreciation) | |
| U.S. Treasury Long Bond | | | Short | | | | (11 | ) | | | 9/14 | | | $ | (1,509,063 | ) | | $ | (15,151 | ) |
| (1) | All percentages shown in the Portfolio of Investments are based on net assets. |
| (2) | Ratings (not covered by the report of independent registered public accounting firm): Using the highest of Standard & Poor’s Group (“Standard & Poor’s”), Moody’s Investors Service, Inc. (“Moody’s”) or Fitch, Inc. (“Fitch”) rating. Ratings below BBB by Standard & Poor’s, Baa by Moody’s or BBB by Fitch are considered to be below investment grade. Holdings designated N/R are not rated by any of these national rating agencies. |
| (3) | Optional Call Provisions (not covered by the report of independent registered public accounting firm): Dates (month and year) and prices of the earliest optional call or redemption. There may be other call provisions at varying prices at later dates. Certain mortgage-backed securities may be subject to periodic principal paydowns. |
| 144A | Investment is exempt from registration under Rule 144A of the Securities Act of 1933, as amended. These investments may only be resold in transactions exempt from registration, which are normally transactions with qualified institutional buyers. |
See accompanying notes to financial statements.
Statement of
| | | | |
| | Assets and Liabilities | | June 30, 2014 |
| | | | | | | | | | | | | | | | |
| | | Global Total
Return Bond | | | High Income
Bond | | | Strategic
Income | | | U.S. Infrastructure
Income | |
Assets | | | | | | | | | | | | | | | | |
Long-term investments, at value (cost $19,985,481, $936,355,092, $737,538,596 and $6,906,584, respectively) | | $ | 20,252,351 | | | $ | 968,779,962 | | | $ | 769,392,730 | | | $ | 7,024,378 | |
Investments purchased with collateral from securities lending, at value (cost approximates value) | | | — | | | | 180,336,996 | | | | 85,180,247 | | | | — | |
Short-term investments, at value (cost approximates value) | | | 1,328,478 | | | | 37,742,974 | | | | 27,827,846 | | | | — | |
Cash denominated in foreign currencies (cost $8,488, $467,590, $219,323 and $—, respectively) | | | 8,499 | | | | 470,977 | | | | 219,024 | | | | — | |
Cash | | | 448 | | | | 19,991 | | | | 8,950 | | | | — | |
Cash collateral at brokers(1) | | | 87,091 | | | | 1,165,205 | | | | 2,065,552 | | | | 30,000 | |
Interest rate swaps premiums paid | | | — | | | | 485 | | | | 919 | | | | — | |
Unrealized appreciation on: | | | | | | | | | | | | | | | | |
Forward foreign currency exchange contracts, net | | | 30,408 | | | | 26,196 | | | | 426,239 | | | | — | |
Interest rate swaps | | | 26,937 | | | | — | | | | 337,834 | | | | — | |
Receivable for: | | | | | | | | | | | | | | | | |
Dividends | | | 2,541 | | | | 398,319 | | | | 41,332 | | | | — | |
Due from broker | | | — | | | | 70,244 | | | | 25,859 | | | | — | |
Interest | | | 240,854 | | | | 14,467,979 | | | | 8,757,549 | | | | 99,588 | |
Investments sold | | | 84,825 | | | | 4,198,182 | | | | 1,637,159 | | | | 55,876 | |
Reclaims | | | — | | | | 523 | | | | 4,875 | | | | — | |
Reimbursement from Adviser | | | 22,459 | | | | — | | | | — | | | | 11,313 | |
Shares sold | | | 1,441 | | | | 3,180,491 | | | | 4,609,306 | | | | — | |
Variation margin on futures contracts | | | 385 | | | | — | | | | 3,517 | | | | — | |
Variation margin on swap contracts | | | — | | | | 2,651,217 | | | | 1,695,349 | | | | — | |
Other assets | | | 13 | | | | 17,598 | | | | 74,240 | | | | — | |
Total assets | | | 22,086,730 | | | | 1,213,527,339 | | | | 902,308,527 | | | | 7,221,155 | |
Liabilities | | | | | | | | | | | | | | | | |
Cash overdraft | | | — | | | | — | | | | — | | | | 55,386 | |
Credit default swap premiums received | | | — | | | | 1,866,121 | | | | — | | | | — | |
Unrealized depreciation on: | | | | | | | | | | | | | | | | |
Forward foreign currency exchange contracts, net | | | 33,976 | | | | — | | | | 609,452 | | | | — | |
Payable for: | | | | | | | | | | | | | | | | |
Collateral from securities lending program | | | — | | | | 180,336,996 | | | | 85,180,247 | | | | — | |
Dividends | | | 44,268 | | | | 2,951,324 | | | | 1,942,051 | | | | 24,098 | |
Investments purchased | | | 1,235,710 | | | | 23,059,561 | | | | 16,457,623 | | | | — | |
Shares redeemed | | | 2,889 | | | | 1,779,664 | | | | 2,519,915 | | | | 504 | |
Swap contracts terminated | | | — | | | | — | | | | 833,544 | | | | — | |
Variation margin on futures contracts | | | 5,122 | | | | 30,820 | | | | 77,703 | | | | 3,094 | |
Accrued expenses: | | | | | | | | | | | | | | | | |
Management fees | | | — | | | | 449,884 | | | | 338,125 | | | | — | |
Directors/Trustees fees | | | 125 | | | | 23,202 | | | | 20,531 | | | | 169 | |
12b-1 distribution and service fees | | | 493 | | | | 102,148 | | | | 65,954 | | | | 52 | |
Other | | | 52,741 | | | | 385,569 | | | | 204,292 | | | | 24,853 | |
Total liabilities | | | 1,375,324 | | | | 210,985,289 | | | | 108,249,437 | | | | 108,156 | |
Net assets | | $ | 20,711,406 | | | $ | 1,002,542,050 | | | $ | 794,059,090 | | | $ | 7,112,999 | |
| (1) | Cash pledged to collateralize the net payment obligations for investments in derivatives. |
See accompanying notes to financial statements.
| | | | | | | | | | | | | | | | |
| | | Global Total
Return Bond | | | High Income
Bond | | | Strategic
Income | | | U.S. Infrastructure
Income | |
Class A Shares | | | | | | | | | | | | | | | | |
Net assets | | $ | 1,377,786 | | | $ | 209,829,502 | | | $ | 128,189,407 | | | $ | 50,800 | |
Shares outstanding | | | 65,703 | | | | 22,591,995 | | | | 11,054,369 | | | | 2,500 | |
Net asset value (“NAV”) per share | | $ | 20.97 | | | $ | 9.29 | | | $ | 11.60 | | | $ | 20.32 | |
Offering price per share (NAV per share plus maximum sales charge of 4.75%,
4.75%, 4.25% and 4.25%, respectively, of offering price) | | $ | 22.02 | | | $ | 9.75 | | | $ | 12.11 | | | $ | 21.22 | |
Class C Shares | | | | | | | | | | | | | | | | |
Net assets | | $ | 204,239 | | | $ | 71,973,674 | | | $ | 48,335,353 | | | $ | 50,781 | |
Shares outstanding | | | 9,706 | | | | 7,765,556 | | | | 4,195,770 | | | | 2,500 | |
NAV and offering price per share | | $ | 21.04 | | | $ | 9.27 | | | $ | 11.52 | | | $ | 20.31 | |
Class R3 Shares | | | | | | | | | | | | | | | | |
Net assets | | $ | 51,258 | | | $ | 1,098,677 | | | $ | 5,320,773 | | | | — | |
Shares outstanding | | | 2,437 | | | | 115,937 | | | | 457,104 | | | | — | |
NAV and offering price per share | | $ | 21.03 | | | $ | 9.48 | | | $ | 11.64 | | | | — | |
Class I Shares | | | | | | | | | | | | | | | | |
Net assets | | $ | 19,078,123 | | | $ | 719,640,197 | | | $ | 612,213,557 | | | $ | 7,011,418 | |
Shares outstanding | | | 906,322 | | | | 77,283,613 | | | | 52,821,299 | | | | 345,000 | |
NAV and offering price per share | | $ | 21.05 | | | $ | 9.31 | | | $ | 11.59 | | | $ | 20.32 | |
Net assets consist of: | | | | | | | | | | | | | | | | |
Capital paid-in | | $ | 19,943,077 | | | $ | 969,168,441 | | | $ | 788,412,393 | | | $ | 6,999,910 | |
Undistributed (Over-distribution of) net investment income | | | 219,048 | | | | (5,000,570 | ) | | | 9,747,103 | | | | 10,036 | |
Accumulated net realized gain (loss) | | | 253,040 | | | | 6,399,327 | | | | (35,210,215 | ) | | | 410 | |
Net unrealized appreciation (depreciation) | | | 296,241 | | | | 31,974,852 | | | | 31,109,808 | | | | 102,643 | |
Net assets | | $ | 20,711,406 | | | $ | 1,002,542,050 | | | $ | 794,059,090 | | | $ | 7,112,999 | |
Authorized shares – per class | | | Unlimited | | | | 2 billion | | | | 2 billion | | | | Unlimited | |
Par value per share | | $ | .01 | | | $ | .0001 | | | $ | .0001 | | | $ | .01 | |
See accompanying notes to financial statements.
Statement of
| | | | |
| | Operations | | Year Ended June 30, 2014 |
| | | | | | | | | | | | | | | | |
| | | Global Total
Return Bond | | | High Income
Bond | | | Strategic
Income | | |
U.S. Infrastructure
Income(2) | |
Investment Income | | | | | | | | | | | | | | | | |
Dividend income (net of foreign dividend tax withheld of $—, $8,999, $— and $—, respectively) | | $ | 24,507 | | | $ | 4,870,680 | | | $ | 1,570,957 | | | $ | — | |
Interest income (net of foreign interest tax withheld of $377, $9,425, $980 and $—, respectively) | | | 918,210 | | | | 56,043,055 | | | | 35,037,405 | | | | 40,917 | |
Securities lending income, net | | | — | | | | 610,639 | | | | 264,526 | | | | — | |
Total investment income | | | 942,717 | | | | 61,524,374 | | | | 36,872,888 | | | | 40,917 | |
Expenses | | | | | | | | | | | | | | | | |
Management fees | | | 110,290 | | | | 4,707,172 | | | | 3,542,314 | | | | 5,959 | |
12b-1 service fees – Class A(1) | | | 2,916 | | | | 443,902 | | | | 227,307 | | | | 17 | |
12b-1 distribution and service fees – Class C | | | 1,720 | | | | 698,426 | | | | 375,776 | | | | 69 | |
12b-1 distribution and service fees – Class R3 | | | 248 | | | | 4,513 | | | | 18,130 | | | | — | |
Shareholder servicing agent fees and expenses | | | 2,700 | | | | 573,491 | | | | 315,147 | | | | 1,200 | |
Custodian fees and expenses | | | 93,949 | | | | 255,672 | | | | 224,010 | | | | 1,499 | |
Directors/Trustees fees and expenses | | | 544 | | | | 24,289 | | | | 18,919 | | | | 169 | |
Professional fees | | | 46,028 | | | | 82,969 | | | | 83,339 | | | | 19,087 | |
Shareholder reporting expenses | | | 26,816 | | | | 128,450 | | | | 68,770 | | | | 1,911 | |
Federal and state registration fees | | | 52,104 | | | | 130,608 | | | | 88,048 | | | | 902 | |
Other expenses | | | 10,852 | | | | 23,938 | | | | 25,490 | | | | 255 | |
Total expenses before fee waiver/expense reimbursement | | | 348,167 | | | | 7,073,430 | | | | 4,987,250 | | | | 31,068 | |
Fee waiver/expense reimbursement | | | (203,274 | ) | | | — | | | | (484,534 | ) | | | (24,150 | ) |
Net expenses | | | 144,893 | | | | 7,073,430 | | | | 4,502,716 | | | | 6,918 | |
Net investment income (loss) | | | 797,824 | | | | 54,450,944 | | | | 32,370,172 | | | | 33,999 | |
Realized and Unrealized Gain (Loss) | | | | | | | | | | | | | | | | |
Net realized gain (loss) from: | | | | | | | | | | | | | | | | |
Investments and foreign currency | | | 275,982 | | | | 10,688,684 | | | | 7,067,274 | | | | 459 | |
Forward foreign currency exchange contracts | | | (355,340 | ) | | | (869,241 | ) | | | (3,086,868 | ) | | | — | |
Futures contracts | | | 6,740 | | | | (77,978 | ) | | | (192,845 | ) | | | — | |
Options purchased | | | (15,802 | ) | | | — | | | | (81,130 | ) | | | — | |
Swaps | | | 80,592 | | | | (2,055,236 | ) | | | 1,328,009 | | | | — | |
Change in net unrealized appreciation (depreciation) of: | | | | | | | | | | | | | | | | |
Investments and foreign currency | | | 693,937 | | | | 41,655,840 | | | | 33,944,503 | | | | 117,794 | |
Forward foreign currency exchange contracts | | | 76,850 | | | | 183,932 | | | | 1,021,813 | | | | — | |
Futures contracts | | | (44,565 | ) | | | (720,436 | ) | | | (955,534 | ) | | | (15,151 | ) |
Options purchased | | | 4,270 | | | | — | | | | 81,130 | | | | — | |
Swaps | | | (22,510 | ) | | | (571,182 | ) | | | (3,796,978 | ) | | | — | |
Net realized and unrealized gain (loss) | | | 700,154 | | | | 48,234,383 | | | | 35,329,374 | | | | 103,102 | |
Net increase (decrease) in net assets from operations | | $ | 1,497,978 | | | $ | 102,685,327 | | | $ | 67,699,546 | | | $ | 137,101 | |
| (1) | Includes 12b-1 distribution and service fees incurred on Class B Shares during the period. Class B Shares of High Income Bond and Strategic Income converted to Class A Shares at the close of business on June 23, 2014. Class B Shares are no longer available through an exchange from other Nuveen mutual funds. |
| (2) | For the period May 12, 2014 (commencement of operations) through June 30, 2014. |
See accompanying notes to financial statements.
Statement of
| | | | | | | | | | | | | | | | | | |
| | | Global Total Return Bond | | | | | High Income Bond | |
| | | Year Ended
6/30/14 | | | Year Ended
6/30/13 | | | | | Year Ended
6/30/14 | | | Year Ended
6/30/13 | |
Operations | | | | | | | | | | | | | | | | | | |
Net investment income (loss) | | $ | 797,824 | | | $ | 593,676 | | | | | $ | 54,450,944 | | | $ | 52,097,551 | |
Net realized gain (loss) from: | | | | | | | | | | | | | | | | | | |
Investments and foreign currency | | | 275,982 | | | | 255,749 | | | | | | 10,688,684 | | | | 32,830,342 | |
Forward foreign currency exchange contracts | | | (355,340 | ) | | | 193,248 | | | | | | (869,241 | ) | | | — | |
Futures contracts | | | 6,740 | | | | 9,324 | | | | | | (77,978 | ) | | | 24,640 | |
Options purchased | | | (15,802 | ) | | | (1,819 | ) | | | | | — | | | | — | |
Options written | | | — | | | | (451 | ) | | | | | — | | | | — | |
Swaps | | | 80,592 | | | | 117,190 | | | | | | (2,055,236 | ) | | | — | |
Change in net unrealized appreciation (depreciation) of: | | | | | | | | | | | | | | | | | | |
Investments and foreign currency | | | 693,937 | | | | (741,357 | ) | | | | | 41,655,840 | | | | (4,035,241 | ) |
Forward foreign currency exchange contracts | | | 76,850 | | | | (131,026 | ) | | | | | 183,932 | | | | (157,736 | ) |
Futures contracts | | | (44,565 | ) | | | 47,954 | | | | | | (720,436 | ) | | | 785,330 | |
Options purchased | | | 4,270 | | | | (4,270 | ) | | | | | — | | | | — | |
Swaps | | | (22,510 | ) | | | 53,666 | | | | | | (571,182 | ) | | | — | |
Net increase (decrease) in net assets from operations | | | 1,497,978 | | | | 391,884 | | | | | | 102,685,327 | | | | 81,544,886 | |
Distributions to Shareholders | | | | | | | | | | | | | | | | | | |
From net investment income: | | | | | | | | | | | | | | | | | | |
Class A(1) | | | (41,491 | ) | | | (35,960 | ) | | | | | (11,488,067 | ) | | | (11,284,624 | ) |
Class B | | | — | | | | — | | | | | | — | | | | (117,102 | ) |
Class C | | | (4,753 | ) | | | (2,925 | ) | | | | | (4,133,973 | ) | | | (4,119,190 | ) |
Class R3 | | | (1,637 | ) | | | (1,997 | ) | | | | | (57,707 | ) | | | (52,093 | ) |
Class I | | | (689,699 | ) | | | (658,553 | ) | | | | | (40,883,363 | ) | | | (39,152,850 | ) |
From accumulated net realized gains: | | | | | | | | | | | | | | | | | | |
Class A(1) | | | (15,286 | ) | | | (17,638 | ) | | | | | (3,748,641 | ) | | | — | |
Class B | | | — | | | | — | | | | | | — | | | | — | |
Class C | | | (2,340 | ) | | | (1,263 | ) | | | | | (1,550,786 | ) | | | — | |
Class R3 | | | (762 | ) | | | (930 | ) | | | | | (18,187 | ) | | | — | |
Class I | | | (279,368 | ) | | | (270,907 | ) | | | | | (12,406,397 | ) | | | — | |
Decrease in net assets from distributions to shareholders | | | (1,035,336 | ) | | | (990,173 | ) | | | | | (74,287,121 | ) | | | (54,725,859 | ) |
Fund Share Transactions | | | | | | | | | | | | | | | | | | |
Proceeds from sale of shares | | | 3,495,146 | | | | 4,253,342 | | | | | | 544,164,005 | | | | 365,971,376 | |
Proceeds from shares issued to shareholders due to reinvestment of distributions | | | 290,859 | | | | 94,699 | | | | | | 32,009,771 | | | | 20,215,234 | |
| | | 3,786,005 | | | | 4,348,041 | | | | | | 576,173,776 | | | | 386,186,610 | |
Cost of shares redeemed | | | (1,174,138 | ) | | | (1,295,217 | ) | | | | | (308,712,801 | ) | | | (314,765,353 | ) |
Net increase (decrease) in net assets from Fund share transactions | | | 2,611,867 | | | | 3,052,824 | | | | | | 267,460,975 | | | | 71,421,257 | |
Net increase (decrease) in net assets | | | 3,074,509 | | | | 2,454,535 | | | | | | 295,859,181 | | | | 98,240,284 | |
Net assets at the beginning of period | | | 17,636,897 | | | | 15,182,362 | | | | | | 706,682,869 | | | | 608,442,585 | |
Net assets at the end of period | | $ | 20,711,406 | | | $ | 17,636,897 | | | | | $ | 1,002,542,050 | | | $ | 706,682,869 | |
Undistributed (Over-distribution of) net investment income at the end of period | | $ | 219,048 | | | $ | 498,232 | | | | | $ | (5,000,570 | ) | | $ | (2,478,940 | ) |
| (1) | Includes distributions to shareholders on High Income Bond’s Class B Shares during the period. Class B Shares of High Income Bond converted to Class A Shares at the close of business on June 23, 2014 and are no longer available through an exchange from other Nuveen mutual funds. |
See accompanying notes to financial statements.
Statement of Changes in Net Assets (continued)
| | | | | | | | | | | | | | |
| | | Strategic Income | | | | | U.S. Infrastructure Income | |
| | | Year Ended
6/30/14 | | | Year Ended
6/30/13 | | | | | Period 5/12/14
commencement of operations)
through 6/30/14 | |
Operations | | | | | | | | | | | | | | |
Net investment income (loss) | | $ | 32,370,172 | | | $ | 30,494,779 | | | | | $ | 33,999 | |
Net realized gain (loss) from: | | | | | | | | | | | | | | |
Investments and foreign currency | | | 7,067,274 | | | | 22,569,723 | | | | | | 459 | |
Forward foreign currency exchange contracts | | | (3,086,868 | ) | | | 4,687,862 | | | | | | — | |
Futures contracts | | | (192,845 | ) | | | (962,426 | ) | | | | | — | |
Options purchased | | | (81,130 | ) | | | (4,865 | ) | | | | | — | |
Options written | | | — | | | | (125,856 | ) | | | | | — | |
Swaps | | | 1,328,009 | | | | 1,742,931 | | | | | | — | |
Change in net unrealized appreciation (depreciation) of: | | | | | | | | | | | | | | |
Investments and foreign currency | | | 33,944,503 | | | | (23,595,326 | ) | | | | | 117,794 | |
Forward foreign currency exchange contracts | | | 1,021,813 | | | | (2,175,164 | ) | | | | | — | |
Futures contracts | | | (955,534 | ) | | | 1,358,805 | | | | | | (15,151 | ) |
Options purchased | | | 81,130 | | | | (81,130 | ) | | | | | — | |
Swaps | | | (3,796,978 | ) | | | 4,672,411 | | | | | | — | |
Net increase (decrease) in net assets from operations | | | 67,699,546 | | | | 38,581,744 | | | | | | 137,101 | |
Distributions to Shareholders | | | | | | | | | | | | | | |
From net investment income: | | | | | | | | | | | | | | |
Class A(1) | | | (4,217,324 | ) | | | (2,828,988 | ) | | | | | (163 | ) |
Class B | | | — | | | | (67,636 | ) | | | | | — | |
Class C | | | (1,540,102 | ) | | | (1,233,628 | ) | | | | | (130 | ) |
Class R3 | | | (167,160 | ) | | | (100,573 | ) | | | | | — | |
Class I | | | (27,194,188 | ) | | | (24,786,771 | ) | | | | | (23,805 | ) |
From accumulated net realized gains: | | | | | | | | | | | | | | |
Class A(1) | | | — | | | | — | | | | | | — | |
Class B | | | — | | | | — | | | | | | — | |
Class C | | | — | | | | — | | | | | | — | |
Class R3 | | | — | | | | — | | | | | | — | |
Class I | | | — | | | | — | | | | | | — | |
Decrease in net assets from distributions to shareholders | | | (33,118,774 | ) | | | (29,017,596 | ) | | | | | (24,098 | ) |
Fund Share Transactions | | | | | | | | | | | | | | |
Proceeds from sale of shares | | | 318,782,287 | | | | 160,424,451 | | | | | | 7,000,500 | |
Proceeds from shares issued to shareholders due to reinvestment of distributions | | | 12,232,390 | | | | 9,591,338 | | | | | | — | |
| | | 331,014,677 | | | | 170,015,789 | | | | | | 7,000,500 | |
Cost of shares redeemed | | | (200,728,971 | ) | | | (172,933,942 | ) | | | | | (504 | ) |
Net increase (decrease) in net assets from Fund share transactions | | | 130,285,706 | | | | (2,918,153 | ) | | | | | 6,999,996 | |
Net increase (decrease) in net assets | | | 164,866,478 | | | | 6,645,995 | | | | | | 7,112,999 | |
Net assets at the beginning of period | | | 629,192,612 | | | | 622,546,617 | | | | | | — | |
Net assets at the end of period | | $ | 794,059,090 | | | $ | 629,192,612 | | | | | $ | 7,112,999 | |
Undistributed (Over-distribution of) net investment income at the end of period | | $ | 9,747,103 | | | $ | 13,956,128 | | | | | $ | 10,036 | |
| (1) | Includes distributions to shareholders on Strategic Income’s Class B Shares during the period. Class B Shares of Strategic Income Bond converted to Class A Shares at the close of business on June 23, 2014 and are no longer available through an exchange from other Nuveen mutual funds. |
See accompanying notes to financial statements.
THIS PAGE INTENTIONALLY LEFT BLANK
Financial
Highlights
Global Total Return Bond
Selected data for a share outstanding throughout each period:
| | | | | | | | | | | | | | | | | | | | | | | | | | | | | | | | | | |
| | | | | |
| | | | | | Investment Operations | | | | | Less Distributions | | | | |
| | | | | | | | | |
Class (Commencement Date) Year Ended June 30, | | Beginning
NAV | | | Net
Investment
Income
(Loss)(a) | | | Net
Realized/
Unrealized
Gain (Loss) | | | Total | | | | | From
Net
Investment
Income | | | From
Accumulated
Net Realized
Gains | | | Total | | | Ending
NAV | |
Class A (12/11) | | | | | | | | | | | | | | | | | | | | | | | |
2014 | | $ | 20.54 | | | $ | .79 | | | $ | .68 | | | $ | 1.47 | | | | | $ | (.73 | ) | | $ | (.31 | ) | | $ | (1.04 | ) | | $ | 20.97 | |
2013 | | | 21.19 | | | | .72 | | | | (.14 | ) | | | .58 | | | | | | (.86 | ) | | | (.37 | ) | | | (1.23 | ) | | | 20.54 | |
2012(d) | | | 20.00 | | | | .41 | | | | 1.07 | | | | 1.48 | | | | | | (.29 | ) | | | — | | | | (.29 | ) | | | 21.19 | |
Class C (12/11) | | | | | | | | | | | | | | | | | | | | | | | |
2014 | | | 20.58 | | | | .63 | | | | .70 | | | | 1.33 | | | | | | (.56 | ) | | | (.31 | ) | | | (.87 | ) | | | 21.04 | |
2013 | | | 21.18 | | | | .56 | | | | (.10 | ) | | | .46 | | | | | | (.69 | ) | | | (.37 | ) | | | (1.06 | ) | | | 20.58 | |
2012(d) | | | 20.00 | | | | .29 | | | | 1.13 | | | | 1.42 | | | | | | (.24 | ) | | | — | | | | (.24 | ) | | | 21.18 | |
Class R3 (12/11) | | | | | | | | | | | | | | | | | | | | | | | |
2014 | | | 20.58 | | | | .74 | | | | .69 | | | | 1.43 | | | | | | (.67 | ) | | | (.31 | ) | | | (.98 | ) | | | 21.03 | |
2013 | | | 21.20 | | | | .66 | | | | (.11 | ) | | | .55 | | | | | | (.80 | ) | | | (.37 | ) | | | (1.17 | ) | | | 20.58 | |
2012(d) | | | 20.00 | | | | .35 | | | | 1.13 | | | | 1.48 | | | | | | (.28 | ) | | | — | | | | (.28 | ) | | | 21.20 | |
Class I (12/11) | | | | | | | | | | | | | | | | | | | | | | | |
2014 | | | 20.61 | | | | .84 | | | | .69 | | | | 1.53 | | | | | | (.78 | ) | | | (.31 | ) | | | (1.09 | ) | | | 21.05 | |
2013 | | | 21.23 | | | | .77 | | | | (.11 | ) | | | .66 | | | | | | (.91 | ) | | | (.37 | ) | | | (1.28 | ) | | | 20.61 | |
2012(d) | | | 20.00 | | | | .42 | | | | 1.12 | | | | 1.54 | | | | | | (.31 | ) | | | — | | | | (.31 | ) | | | 21.23 | |
| | | | | | | | | | | | | | | | | | | | | | | | | | | | | | |
| | | | Ratios/Supplemental Data | |
| | | | | | | | | Ratios to Average
Net Assets Before
Waiver/Reimbursement | | | | | Ratios to Average
Net Assets After
Waiver/Reimbursement(c) | | | | |
| | | | | | | | |
Total
Return(b) | | | Ending
Net
Assets
(000) | | | | | Expenses | | | Net
Investment
Income
(Loss) | | | | | Expenses | | | Net
Investment
Income
(Loss) | | | Portfolio
Turnover
Rate(e) | |
| | | | | | | | | | | | | | | | | | | | | | | | | | | | | | |
| | 7.45 | % | | $ | 1,378 | | | | | | 2.03 | % | | | 2.81 | % | | | | | .97 | % | | | 3.87 | % | | | 109 | % |
| | 2.47 | | | | 1,037 | | | | | | 2.16 | | | | 2.10 | | | | | | .97 | | | | 3.29 | | | | 176 | |
| | 7.42 | | | | 310 | | | | | | 2.44 | * | | | 1.99 | * | | | | | .98 | * | | | 3.46 | * | | | 116 | |
| | | | | | | | | | | | | | | | | | | | | | | | | | | | | | |
| | 6.74 | | | | 204 | | | | | | 2.77 | | | | 2.06 | | | | | | 1.72 | | | | 3.11 | | | | 109 | |
| | 1.94 | | | | 158 | | | | | | 2.99 | | | | 1.29 | | | | | | 1.72 | | | | 2.56 | | | | 176 | |
| | 7.10 | | | | 53 | | | | | | 2.74 | * | | | 1.41 | * | | | | | 1.72 | * | | | 2.42 | * | | | 116 | |
| | | | | | | | | | | | | | | | | | | | | | | | | | | | | | |
| | 7.26 | | | | 51 | | | | | | 2.26 | | | | 2.57 | | | | | | 1.22 | | | | 3.61 | | | | 109 | |
| | 2.34 | | | | 50 | | | | | | 2.31 | | | | 1.91 | | | | | | 1.22 | | | | 3.00 | | | | 176 | |
| | 7.38 | | | | 53 | | | | | | 2.24 | * | | | 1.91 | * | | | | | 1.23 | * | | | 2.92 | * | | | 116 | |
| | | | | | | | | | | | | | | | | | | | | | | | | | | | | | |
| | 7.76 | | | | 19,078 | | | | | | 1.77 | | | | 3.09 | | | | | | .72 | | | | 4.13 | | | | 109 | |
| | 2.86 | | | | 16,392 | | | | | | 1.81 | | | | 2.41 | | | | | | .72 | | | | 3.50 | | | | 176 | |
| | 7.71 | | | | 14,767 | | | | | | 1.74 | * | | | 2.41 | * | | | | | .73 | * | | | 3.42 | * | | | 116 | |
| (a) | Per share Net Investment Income (Loss) is calculated using the average daily shares method. | |
| (b) | Total return is the combination of changes in NAV without any sales charge, reinvested dividend income at NAV and reinvested capital gains distributions at NAV, if any. Total returns are not annualized. | |
| (c) | After fee waiver and/or expense reimbursement from the Adviser, where applicable. | |
| (d) | For the period December 2, 2011 (commencement of operations) through June 30, 2012. | |
| (e) | Portfolio Turnover Rate is calculated based on the lesser of long-term purchases or sales (as disclosed in Note 5 – Investment Transactions) divided by the average long-term market value during the period. | |
See accompanying notes to financial statements.
Financial Highlights (continued)
High Income Bond
Selected data for a share outstanding throughout each period:
| | | | | | | | | | | | | | | | | | | | | | | | | | | | | | | | | | |
| | | | |
| | | | Investment Operations | | | | | Less Distributions | | | | |
| | | | | | | | | |
Class (Commencement Date) Year Ended June 30, | | Beginning
NAV | | | Net
Investment
Income
(Loss)(a) | | | Net
Realized/
Unrealized
Gain (Loss) | | | Total | | | | | From
Net
Investment
Income | | | From
Accumulated
Net Realized
Gains | | | Total | | | Ending
NAV | |
Class A (8/01) | | | | | | | | | | | | | | | | | | | | | | | | | | | | | | | |
2014 | | $ | 8.99 | | | $ | .58 | | | $ | .53 | | | $ | 1.11 | | | | | $ | (.61 | ) | | $ | (.20 | ) | | $ | (.81 | ) | | $ | 9.29 | |
2013 | | | 8.64 | | | | .63 | | | | .39 | | | | 1.02 | | | | | | (.67 | ) | | | — | | | | (.67 | ) | | | 8.99 | |
2012 | | | 9.05 | | | | .69 | | | | (.38 | ) | | | .31 | | | | | | (.69 | ) | | | (.03 | ) | | | (.72 | ) | | | 8.64 | |
2011 | | | 8.28 | | | | .67 | | | | .76 | | | | 1.43 | | | | | | (.66 | ) | | | — | | | | (.66 | ) | | | 9.05 | |
2010 | | | 7.15 | | | | .67 | | | | 1.12 | | | | 1.79 | | | | | | (.66 | ) | | | — | | | | (.66 | ) | | | 8.28 | |
Class C (8/01) | | | | | | | | | | | | | | | | | | | | | | | | | | | | | | | |
2014 | | | 8.98 | | | | .51 | | | | .52 | | | | 1.03 | | | | | | (.54 | ) | | | (.20 | ) | | | (.74 | ) | | | 9.27 | |
2013 | | | 8.62 | | | | .56 | | | | .40 | | | | .96 | | | | | | (.60 | ) | | | — | | | | (.60 | ) | | | 8.98 | |
2012 | | | 9.01 | | | | .63 | | | | (.37 | ) | | | .26 | | | | | | (.62 | ) | | | (.03 | ) | | | (.65 | ) | | | 8.62 | |
2011 | | | 8.25 | | | | .60 | | | | .75 | | | | 1.35 | | | | | | (.59 | ) | | | — | | | | (.59 | ) | | | 9.01 | |
2010 | | | 7.12 | | | | .60 | | | | 1.13 | | | | 1.73 | | | | | | (.60 | ) | | | — | | | | (.60 | ) | | | 8.25 | |
Class R3 (9/01) | | | | | | | | | | | | | | | | | | | | | | | | | | | | | | | |
2014 | | | 9.17 | | | | .57 | | | | .54 | | | | 1.11 | | | | | | (.60 | ) | | | (.20 | ) | | | (.80 | ) | | | 9.48 | |
2013 | | | 8.81 | | | | .62 | | | | .40 | | | | 1.02 | | | | | | (.66 | ) | | | — | | | | (.66 | ) | | | 9.17 | |
2012 | | | 9.23 | | | | .67 | | | | (.38 | ) | | | .29 | | | | | | (.68 | ) | | | (.03 | ) | | | (.71 | ) | | | 8.81 | |
2011 | | | 8.44 | | | | .66 | | | | .77 | | | | 1.43 | | | | | | (.64 | ) | | | — | | | | (.64 | ) | | | 9.23 | |
2010 | | | 7.28 | | | | .66 | | | | 1.14 | | | | 1.80 | | | | | | (.64 | ) | | | — | | | | (.64 | ) | | | 8.44 | |
Class I (8/01) | | | | | | | | | | | | | | | | | | | | | | | | | | | | | | | |
2014 | | | 9.01 | | | | .60 | | | | .53 | | | | 1.13 | | | | | | (.63 | ) | | | (.20 | ) | | | (.83 | ) | | | 9.31 | |
2013 | | | 8.65 | | | | .66 | | | | .39 | | | | 1.05 | | | | | | (.69 | ) | | | — | | | | (.69 | ) | | | 9.01 | |
2012 | | | 9.05 | | | | .71 | | | | (.37 | ) | | | .34 | | | | | | (.71 | ) | | | (.03 | ) | | | (.74 | ) | | | 8.65 | |
2011 | | | 8.29 | | | | .69 | | | | .75 | | | | 1.44 | | | | | | (.68 | ) | | | — | | | | (.68 | ) | | | 9.05 | |
2010 | | | 7.16 | | | | .69 | | | | 1.12 | | | | 1.81 | | | | | | (.68 | ) | | | — | | | | (.68 | ) | | | 8.29 | |
| | | | | | | | | | | | | | | | | | | | | | | | | | | | | | |
| | | | Ratios/Supplemental Data | |
| | | | | | | | | Ratios to Average
Net Assets Before
Waiver/Reimbursement | | | | | Ratios to Average
Net Assets After
Waiver/Reimbursement(c) | | | | |
| | | | | | | | |
Total
Return(b) | | | Ending
Net
Assets
(000) | | | | | Expenses | | | Net
Investment
Income
(Loss) | | | | | Expenses | | | Net
Investment
Income
(Loss) | | | Portfolio
Turnover
Rate(d) | |
| | | | | | | | | | | | | | | | | | | | | | | | | | | | | | |
| | 12.88 | % | | $ | 209,830 | | | | | | .95 | % | | | 6.37 | % | | | | | .95 | % | | | 6.37 | % | | | 85 | % |
| | 11.99 | | | | 141,132 | | | | | | .94 | | | | 6.92 | | | | | | .94 | | | | 6.92 | | | | 133 | |
| | 3.76 | | | | 92,018 | | | | | | 1.06 | | | | 7.98 | | | | | | 1.04 | | | | 7.99 | | | | 124 | |
| | 17.61 | | | | 30,984 | | | | | | 1.22 | | | | 7.38 | | | | | | 1.10 | | | | 7.50 | | | | 130 | |
| | 25.47 | | | | 29,532 | | | | | | 1.29 | | | | 7.93 | | | | | | 1.10 | | | | 8.12 | | | | 132 | |
| | | | | | | | | | | | | | | | | | | | | | | | | | | | | | |
| | 11.98 | | | | 71,974 | | | | | | 1.70 | | | | 5.64 | | | | | | 1.70 | | | | 5.64 | | | | 85 | |
| | 11.33 | | | | 67,466 | | | | | | 1.70 | | | | 6.21 | | | | | | 1.70 | | | | 6.21 | | | | 133 | |
| | 3.18 | | | | 48,667 | | | | | | 1.80 | | | | 7.26 | | | | | | 1.79 | | | | 7.27 | | | | 124 | |
| | 16.67 | | | | 9,792 | | | | | | 1.97 | | | | 6.64 | | | | | | 1.85 | | | | 6.76 | | | | 130 | |
| | 24.67 | | | | 6,969 | | | | | | 2.04 | | | | 7.22 | | | | | | 1.85 | | | | 7.41 | | | | 132 | |
| | | | | | | | | | | | | | | | | | | | | | | | | | | | | | |
| | 12.65 | | | | 1,099 | | | | | | 1.20 | | | | 6.09 | | | | | | 1.20 | | | | 6.09 | | | | 85 | |
| | 11.79 | | | | 697 | | | | | | 1.19 | | | | 6.69 | | | | | | 1.19 | | | | 6.69 | | | | 133 | |
| | 3.46 | | | | 615 | | | | | | 1.31 | | | | 7.66 | | | | | | 1.29 | | | | 7.68 | | | | 124 | |
| | 17.28 | | | | 309 | | | | | | 1.47 | | | | 7.12 | | | | | | 1.35 | | | | 7.25 | | | | 130 | |
| | 25.12 | | | | 343 | | | | | | 1.54 | | | | 7.73 | | | | | | 1.35 | | | | 7.92 | | | | 132 | |
| | | | | | | | | | | | | | | | | | | | | | | | | | | | | | |
| | 13.15 | | | | 719,640 | | | | | | .71 | | | | 6.61 | | | | | | .71 | | | | 6.61 | | | | 85 | |
| | 12.39 | | | | 495,863 | | | | | | .70 | | | | 7.24 | | | | | | .70 | | | | 7.24 | | | | 133 | |
| | 4.15 | | | | 465,299 | | | | | | .84 | | | | 8.19 | | | | | | .80 | | | | 8.23 | | | | 124 | |
| | 17.77 | | | | 460,785 | | | | | | .97 | | | | 7.63 | | | | | | .85 | | | | 7.75 | | | | 130 | |
| | 25.75 | | | | 350,066 | | | | | | 1.04 | | | | 8.19 | | | | | | .85 | | | | 8.38 | | | | 132 | |
| (a) | Per share Net Investment Income (Loss) is calculated using the average daily shares method. | |
| (b) | Total return is the combination of changes in NAV without any sales charge, reinvested dividend income at NAV and reinvested capital gains distributions at NAV, if any. Total returns are not annualized. | |
| (c) | After fee waiver and/or expense reimbursement from the Adviser, where applicable. As of October 31, 2013, the Adviser is no longer reimbursing the Fund for any fees and expenses. | |
| (d) | Portfolio Turnover Rate is calculated based on the lesser of long-term purchases or sales (as disclosed in Note 5 – Investment Transactions) divided by the average long-term market value during the period. | |
See accompanying notes to financial statements.
Financial Highlights (continued)
Strategic Income
Selected data for a share outstanding throughout each period:
| | | | | | | | | | | | | | | | | | | | | | | | | | | | | | | | | | |
| | | | | |
| | | | | | Investment Operations | | | | | Less Distributions | | | | |
| | | | | | | | | |
Class (Commencement Date) Year Ended June 30, | | Beginning
NAV | | | Net
Investment
Income
(Loss)(a) | | | Net
Realized/
Unrealized
Gain (Loss) | | | Total | | | | | From
Net
Investment
Income | | | From
Accumulated
Net Realized
Gains | | | Total | | | Ending
NAV | |
Class A (2/00) | | | | | | | | | | | | | | | | | | | | | | | |
2014 | | $ | 11.02 | | | $ | .53 | | | $ | .59 | | | $ | 1.12 | | | | | $ | (.54 | ) | | $ | — | | | $ | (.54 | ) | | $ | 11.60 | |
2013 | | | 10.83 | | | | .52 | | | | .16 | | | | .68 | | | | | | (.49 | ) | | | — | | | | (.49 | ) | | | 11.02 | |
2012 | | | 10.72 | | | | .44 | | | | .10 | | | | .54 | | | | | | (.43 | ) | | | — | | | | (.43 | ) | | | 10.83 | |
2011 | | | 10.27 | | | | .43 | | | | .45 | | | | .88 | | | | | | (.43 | ) | | | — | | | | (.43 | ) | | | 10.72 | |
2010 | | | 9.01 | | | | .52 | | | | 1.28 | | | | 1.80 | | | | | | (.54 | ) | | | — | | | | (.54 | ) | | | 10.27 | |
Class C (2/00) | | | | | | | | | | | | | | | | | | | | | | | |
2014 | | | 10.94 | | | | .44 | | | | .60 | | | | 1.04 | | | | | | (.46 | ) | | | — | | | | (.46 | ) | | | 11.52 | |
2013 | | | 10.76 | | | | .43 | | | | .16 | | | | .59 | | | | | | (.41 | ) | | | — | | | | (.41 | ) | | | 10.94 | |
2012 | | | 10.65 | | | | .36 | | | | .09 | | | | .45 | | | | | | (.34 | ) | | | — | | | | (.34 | ) | | | 10.76 | |
2011 | | | 10.20 | | | | .35 | | | | .44 | | | | .79 | | | | | | (.34 | ) | | | — | | | | (.34 | ) | | | 10.65 | |
2010 | | | 8.96 | | | | .43 | | | | 1.27 | | | | 1.70 | | | | | | (.46 | ) | | | — | | | | (.46 | ) | | | 10.20 | |
Class R3 (9/01) | | | | | | | | | | | | | | | | | | | | | | | |
2014 | | | 11.05 | | | | .51 | | | | .60 | | | | 1.11 | | | | | | (.52 | ) | | | — | | | | (.52 | ) | | | 11.64 | |
2013 | | | 10.88 | | | | .49 | | | | .15 | | | | .64 | | | | | | (.47 | ) | | | — | | | | (.47 | ) | | | 11.05 | |
2012 | | | 10.77 | | | | .41 | | | | .10 | | | | .51 | | | | | | (.40 | ) | | | — | | | | (.40 | ) | | | 10.88 | |
2011 | | | 10.31 | | | | .41 | | | | .45 | | | | .86 | | | | | | (.40 | ) | | | — | | | | (.40 | ) | | | 10.77 | |
2010 | | | 9.07 | | | | .42 | | | | 1.32 | | | | 1.74 | | | | | | (.50 | ) | | | — | | | | (.50 | ) | | | 10.31 | |
Class I (2/00) | | | | | | | | | | | | | | | | | | | | | | | |
2014 | | | 11.01 | | | | .56 | | | | .59 | | | | 1.15 | | | | | | (.57 | ) | | | — | | | | (.57 | ) | | | 11.59 | |
2013 | | | 10.83 | | | | .55 | | | | .15 | | | | .70 | | | | | | (.52 | ) | | | — | | | | (.52 | ) | | | 11.01 | |
2012 | | | 10.71 | | | | .45 | | | | .12 | | | | .57 | | | | | | (.45 | ) | | | — | | | | (.45 | ) | | | 10.83 | |
2011 | | | 10.26 | | | | .46 | | | | .44 | | | | .90 | | | | | | (.45 | ) | | | — | | | | (.45 | ) | | | 10.71 | |
2010 | | | 9.01 | | | | .55 | | | | 1.25 | | | | 1.80 | | | | | | (.55 | ) | | | — | | | | (.55 | ) | | | 10.26 | |
| | | | | | | | | | | | | | | | | | | | | | | | | | | | | | |
| | | | Ratios/Supplemental Data | |
| | | | | | | | | Ratios to Average
Net Assets Before
Waiver/Reimbursement | | | | | Ratios to Average
Net Assets After
Waiver/Reimbursement(c) | | | | |
| | | | | | | | |
Total
Return(b) | | | Ending
Net
Assets
(000) | | | | | Expenses | | | Net
Investment
Income
(Loss) | | | | | Expenses | | | Net
Investment
Income
(Loss) | | | Portfolio
Turnover
Rate(d)(e) | |
| | | | | | | | | | | | | | | | | | | | | | | | | | | | | | |
| | 10.46 | % | | $ | 128,189 | | | | | | .91 | % | | | 4.65 | % | | | | | .84 | % | | | 4.73 | % | | | 50 | % |
| | 6.25 | | | | 72,341 | | | | | | .90 | | | | 4.50 | | | | | | .84 | | | | 4.57 | | | | 69 | |
| | 5.14 | | | | 52,802 | | | | | | .93 | | | | 4.01 | | | | | | .85 | | | | 4.10 | | | | 199 | |
| | 8.69 | | | | 25,045 | | | | | | 1.05 | | | | 3.93 | | | | | | .88 | | | | 4.10 | | | | 98 | |
| | 20.21 | | | | 28,165 | | | | | | 1.13 | | | | 4.98 | | | | | | .92 | | | | 5.19 | | | | 96 | |
| | | | | | | | | | | | | | | | | | | | | | | | | | | | | | |
| | 9.59 | | | | 48,335 | | | | | | 1.66 | | | | 3.91 | | | | | | 1.59 | | | | 3.98 | | | | 50 | |
| | 5.50 | | | | 35,146 | | | | | | 1.65 | | | | 3.75 | | | | | | 1.59 | | | | 3.81 | | | | 69 | |
| | 4.32 | | | | 31,085 | | | | | | 1.67 | | | | 3.30 | | | | | | 1.60 | | | | 3.37 | | | | 199 | |
| | 7.85 | | | | 8,092 | | | | | | 1.80 | | | | 3.22 | | | | | | 1.73 | | | | 3.29 | | | | 98 | |
| | 19.13 | | | | 6,748 | | | | | | 1.88 | | | | 4.21 | | | | | | 1.75 | | | | 4.34 | | | | 96 | |
| | | | | | | | | | | | | | | | | | | | | | | | | | | | | | |
| | 10.19 | | | | 5,321 | | | | | | 1.16 | | | | 4.41 | | | | | | 1.09 | | | | 4.48 | | | | 50 | |
| | 5.89 | | | | 2,926 | | | | | | 1.15 | | | | 4.27 | | | | | | 1.09 | | | | 4.34 | | | | 69 | |
| | 4.83 | | | | 1,903 | | | | | | 1.19 | | | | 3.73 | | | | | | 1.12 | | | | 3.80 | | | | 199 | |
| | 8.40 | | | | 1,020 | | | | | | 1.29 | | | | 3.73 | | | | | | 1.23 | | | | 3.79 | | | | 98 | |
| | 19.47 | | | | 601 | | | | | | 1.37 | | | | 4.06 | | | | | | 1.24 | | | | 4.19 | | | | 96 | |
| | | | | | | | | | | | | | | | | | | | | | | | | | | | | | |
| | 10.77 | | | | 612,214 | | | | | | .66 | | | | 4.92 | | | | | | .59 | | | | 5.00 | | | | 50 | |
| | 6.42 | | | | 517,292 | | | | | | .65 | | | | 4.75 | | | | | | .59 | | | | 4.81 | | | | 69 | |
| | 5.35 | | | | 534,608 | | | | | | .69 | | | | 4.19 | | | | | | .63 | | | | 4.26 | | | | 199 | |
| | 8.99 | | | | 615,107 | | | | | | .80 | | | | 4.22 | | | | | | .73 | | | | 4.29 | | | | 98 | |
| | 20.31 | | | | 655,301 | | | | | | .87 | | | | 5.31 | | | | | | .74 | | | | 5.44 | | | | 96 | |
| (a) | Per share Net Investment Income (Loss) is calculated using the average daily shares method. | |
| (b) | Total return is the combination of changes in NAV without any sales charge, reinvested dividend income at NAV and reinvested capital gains distributions at NAV, if any. Total returns are not annualized. | |
| (c) | After fee waiver and/or expense reimbursement from the Adviser, where applicable. | |
| (d) | For fiscal years beginning after June 30, 2011, the Fund will no longer exclude dollar roll transactions, where applicable. | |
| (e) | Portfolio Turnover Rate is calculated based on the lesser of long-term purchases or sales (as disclosed in Note 5 – Investment Transactions) divided by the average long-term market value during the period. | |
See accompanying notes to financial statements.
Financial Highlights (continued)
U.S. Infrastructure Income
Selected data for a share outstanding throughout each period:
| | | | | | | | | | | | | | | | | | | | | | | | | | | | | | | | | | |
| | | | | |
| | | | | | Investment Operations | | | | | Less Distributions | | | | |
| | | | | | | | | |
Class (Commencement Date) Year Ended June 30, | | Beginning
NAV | | | Net
Investment
Income
(Loss)(a) | | | Net
Realized/
Unrealized
Gain (Loss) | | | Total | | | | | From
Net
Investment
Income | | | From
Accumulated
Net Realized
Gains | | | Total | | | Ending
NAV | |
Class A (5/14) | | | | | | | | | | | | | | | | | | | | | | | |
2014(d) | | $ | 20.00 | | | $ | .09 | | | $ | .30 | | | $ | .39 | | | | | $ | (.07 | ) | | $ | — | | | $ | (.07 | ) | | $ | 20.32 | |
Class C (5/14) | | | | | | | | | | | | | | | | | | | | | | | |
2014(d) | | | 20.00 | | | | .07 | | | | .29 | | | | .36 | | | | | | (.05 | ) | | | — | | | | (.05 | ) | | | 20.31 | |
Class I (5/14) | | | | | | | | | | | | | | | | | | | | | | | |
2014(d) | | | 20.00 | | | | .10 | | | | .29 | | | | .39 | | | | | | (.07 | ) | | | — | | | | (.07 | ) | | | 20.32 | |
| | | | | | | | | | | | | | | | | | | | | | | | | | | | | | |
| | | | Ratios/Supplemental Data | |
| | | | | | | | | Ratios to Average
Net Assets Before
Waiver/Reimbursement | | | | | Ratios to Average
Net Assets After
Waiver/Reimbursement(c) | | | | |
| | | | | | | | |
Total
Return(b) | | | Ending
Net
Assets
(000) | | | | | Expenses | | | Net
Investment
Income
(Loss) | | | | | Expenses | | | Net
Investment
Income
(Loss) | | | Portfolio
Turnover
Rate(e) | |
| | | | | | | | | | | | | | | | | | | | | | | | | | | | | | |
| | 1.93 | % | | $ | 51 | | | | | | 3.46 | %* | | | .77 | %* | | | | | .96 | %* | | | 3.27 | %* | | | 4 | % |
| | | | | | | | | | | | | | | | | | | | | | | | | | | | | | |
| | 1.81 | | | | 51 | | | | | | 4.20 | * | | | .03 | * | | | | | 1.71 | * | | | 2.52 | * | | | 4 | |
| | | | | | | | | | | | | | | | | | | | | | | | | | | | | | |
| | 1.95 | | | | 7,011 | | | | | | 3.20 | * | | | 1.03 | * | | | | | .71 | * | | | 3.52 | * | | | 4 | |
| (a) | Per share Net Investment Income (Loss) is calculated using the average daily shares method. | |
| (b) | Total return is the combination of changes in NAV without any sales charge, reinvested dividend income at NAV and reinvested capital gains distributions at NAV, if any. Total returns are not annualized. | |
| (c) | After fee waiver and/or expense reimbursement from the Adviser, where applicable. | |
| (d) | For the period May 12, 2014 (commencement of operations) through June 30, 2014. | |
| (e) | Portfolio Turnover Rate is calculated based on the lesser of long-term purchases or sales (as disclosed in Note 5 – Investment Transactions) divided by the average long-term market value during the period. | |
See accompanying notes to financial statements.
Notes to
Financial Statements
1. General Information and Significant Accounting Policies
General Information
Trust Information
Nuveen Investment Funds, Inc. and Nuveen Investment Trust (each a “Trust” and collectively, the “Trusts”), are open-end investment companies registered under the Investment Company Act of 1940, as amended. Nuveen Investment Funds, Inc. is comprised of the Nuveen High Income Bond Fund (“High Income Bond”) and Nuveen Strategic Income Fund (“Strategic Income”) and Nuveen Investment Trust is comprised of the Nuveen Global Total Return Bond Fund (“Global Total Return Bond”) and Nuveen U.S. Infrastructure Income Fund (“U.S. Infrastructure Income”) (each a “Fund” and collectively, the “Funds”), as diversified funds, among others. Nuveen Investment Funds, Inc. was incorporated in the state of Maryland on August 20, 1987. Nuveen Investment Trust was organized as a Massachusetts business trust in May 6, 1996.
Investment Adviser
The Funds’ investment adviser is Nuveen Fund Advisors, LLC (the “Adviser”), a wholly-owned subsidiary of Nuveen Investments, Inc. (“Nuveen”). The Adviser is responsible for each Fund’s overall investment strategy and asset allocation decisions. The Adviser has entered into sub-advisory agreements with Nuveen Asset Management, LLC (the “Sub-Adviser”), a subsidiary of the Adviser, under which the Sub-Adviser manages the investment portfolios of the Funds.
Agreement and Plan of Merger
On April 14, 2014, TIAA-CREF, a national financial services organization, announced that it had entered into an agreement (the “Purchase Agreement”) to acquire Nuveen, the parent company of the Adviser. The transaction is expected to be completed by the end of the year, subject to customary closing conditions, including obtaining necessary Nuveen fund and client consents sufficient to satisfy the terms of the Purchase Agreement and obtaining customary regulatory approvals. There can be no assurance that the transaction described above will be consummated as contemplated or that necessary conditions will be satisfied.
The consummation of the transaction will be deemed to be an “assignment” (as defined in the Investment Company Act of 1940) of the investment management agreements between the Nuveen funds and the Adviser and the investment sub-advisory agreements between the Adviser and each Nuveen fund’s sub-adviser or sub-advisers, and will result in automatic termination of each agreement. It is anticipated that the Board of Directors/Trustees of the Nuveen funds will consider a new investment management agreement with the Adviser and new investment sub-advisory agreements with each sub-adviser.
The transaction is not expected to result in any change in the portfolio management of the Funds or in the Funds’ investment objectives or policies.
Investment Objectives and Principal Investment Strategies
Global Total Return Bond
Global Total Return Bond’s investment objective is to seek total return. Under normal market conditions, the Fund invests at least 80% of the sum of its net assets and the amount of any borrowings for investment purposes, in bonds from issuers located around the world. The bonds in which the Fund may invest may be of any maturity and include: debt obligations of foreign governments; domestic and foreign corporate debt obligations, including obligations issued by special-purpose entities that are backed by corporate debt obligations; U.S. government securities (securities issued or guaranteed by the U.S. government or its agencies or instrumentalities); residential and commercial mortgage-backed securities; and asset-backed securities.
Under normal market conditions, the Fund invests at least 40% of its net assets in non-U.S. issuers and is invested in issuers located in at least three countries (including the U.S.). The Fund may invest in debt obligations issued by governmental and corporate issuers located in emerging markets countries.
The Fund invests in securities that are U.S. dollar-denominated and in securities that are denominated in foreign currencies. As described in more detail below, the Fund may utilize various currency-related derivatives in an effort to enhance the Fund’s total return or to manage risk.
Up to 30% of the Fund’s net assets may be invested in securities rated lower than investment grade or in unrated securities of comparable quality as determined by the Sub-Adviser (such securities commonly referred to as “high yield” or “junk bonds”). If the rating of a security is reduced or the credit quality of an unrated security declines after purchase, the Fund is not required to sell the security, but may consider doing so.
The Fund may utilize the following derivatives: options; futures contracts; options on futures contracts; interest rate caps, collars, and floors; foreign currency contracts; options on foreign currencies; swap agreements, including swap agreements on interest rates, currency rates, security indexes and specific securities, and credit default swap agreements; and options on the foregoing types of swap agreements. The Fund may enter into standardized derivatives contracts traded on domestic or foreign securities exchanges, boards of trade, or similar entities, and non-standardized derivatives contracts traded in the over-the-counter (“OTC”) market. The Fund may use these derivatives in an attempt to manage market risk, currency risk, credit risk and yield curve risk, to manage the effective maturity or duration of securities in the Fund’s portfolio or for speculative purposes in an effort to enhance returns. The Fund may also use derivatives to gain exposure to non-dollar denominated securities markets to the extent it does not do so through direct investments. The use of a derivative is speculative if the Fund is primarily seeking to enhance returns, rather than offset the risk of other positions. The Fund may not use any derivative to gain exposure to a security or type of security that it would be prohibited by its investment restrictions from purchasing directly.
High Income Bond
High Income Bond’s investment objective is to provide investors with a high level of current income. Under normal market conditions, the Fund invests at least 80% of the sum of its net assets and the amount of any borrowings for investment purposes in bonds rated lower than investment grade at the time of purchase or in unrated bonds of comparable quality (securities commonly referred to as “high-yield” securities or “junk bonds”). These bonds generally provide high income in an effort to compensate investors for their higher risk of default, which is the failure to make required interest or principal payments. High-yield bond issuers include small or relatively new companies lacking the history or capital to merit investment-grade status, former blue chip companies downgraded because of financial problems, companies electing to borrow heavily to finance or avoid a takeover or buyout, and firms with heavy debt loads. The Fund may invest in exchange-traded funds (“ETFs”), closed-end funds and other investment companies.
Effective January 10, 2014, the Fund may invest up to 20% of its net assets in fixed and floating rate loans, including senior loans and secured and unsecured junior loans.
There is no minimum rating requirement and no limitation on the average maturity or average effective duration of securities held by the Fund.
The Fund may invest without limitation in debt obligations of foreign corporations and governments, provided that no more than 20% of the Fund’s total assets may be invested in debt obligations issued by governmental and corporate issuers that are located in emerging market countries. A country is considered to have an “emerging market” if it has a relatively low gross national product per capita compared to the world’s major economies, and the potential for rapid economic growth, provided that no issuer included in the Fund’s current benchmark index will be considered to be located in an emerging market country.
The Fund may utilize the following derivatives: options; futures contracts; options on futures contracts; foreign currency contracts; options on foreign currencies; swap agreements, including interest rate swaps, currency swaps, total return swaps, and credit default swaps; and options on swap agreements. The Fund may use these derivatives in an attempt to manage market risk, currency risk, credit risk and yield curve risk, to manage the effective maturity or duration of securities in the Fund’s portfolio or for speculative purposes in an effort to increase the Fund’s yield or to enhance returns. The use of a derivative is speculative if the Fund is primarily seeking to enhance returns, rather than offset the risk of other positions.
Strategic Income
Strategic Income’s investment objective is to provide investors with total return. Under normal market conditions, the Fund invests at least 80% of the sum of its net assets and the amount of any borrowings for investment purposes in debt securities, including U.S. government securities (securities issued or guaranteed by the U.S. government or its agencies or instrumentalities), residential and commercial mortgage-backed securities, asset-backed securities, domestic and foreign corporate debt obligations, including obligations issued by special-purpose entities that are backed by corporate debt obligations and debt obligations of foreign governments.
Effective January 10, 2014, the Fund may invest in fixed and floating rate loans, including senior loans and secured and unsecured junior loans, in an amount not to exceed 20% of the Fund’s net assets and municipal securities in an amount not to exceed 20% of net assets.
The Fund may invest up to 30% of its total assets in non-U.S. dollar denominated debt obligations of foreign corporations and governments, including debt obligations issued by governmental and corporate issuers that are located in emerging market countries. The Fund may invest without limitation in U.S. dollar denominated securities of foreign issuers.
The Fund may invest up to 50% of its total assets in securities rated lower than investment grade or unrated securities of comparable quality as determined by the Sub-Adviser (securities commonly referred to as “high yield” or “junk bonds”). The Fund will not invest in securities rated lower than CCC at the time of purchase or in unrated securities of comparable quality as determined by the Sub-Adviser. If the rating of a security is reduced or the credit quality of an unrated security declines after purchase, the Fund is not required to sell the security, but may consider doing so. Unrated securities will not exceed 25% of the Fund’s total assets.
Notes to Financial Statements (continued)
To generate additional income, the Fund may invest up to 25% of its total assets in dollar roll transactions. In a dollar roll transaction, the Fund sells mortgage-backed securities for delivery in the current month while contracting with the same party to repurchase similar securities at a future date.
Under normal market conditions the Fund attempts to maintain a weighted average effective maturity for its portfolio securities of fifteen years or less and an average effective duration of three to eight years. The Fund’s weighted average effective maturity and average effective duration are measures of how the value of the Fund’s shares may react to interest rate changes.
The Fund may utilize the following derivatives: options; futures contracts; options on futures contracts; interest rate caps, collars, and floors; foreign currency contracts; options on foreign currencies; swap agreements, including swap agreements on interest rates, currency rates, security indexes and specific securities, and credit default swap agreements; and options on the foregoing types of swap agreements. The Fund may enter into standardized derivatives contracts traded on domestic or foreign securities exchanges, boards of trade, or similar entities, and non-standardized derivatives contracts traded in the OTC market. The Fund may use these derivatives in an attempt to manage market risk, currency risk, credit risk and yield curve risk, to manage the effective maturity or duration of securities in the Fund’s portfolio or for speculative purposes in an effort to increase the Fund’s yield or to enhance returns. The Fund may also use derivatives to gain exposure to non-dollar denominated securities markets to the extent it does not do so through direct investments. The use of a derivative is speculative if the Fund is primarily seeking to enhance returns, rather than offset the risk of other positions. The Fund may not use any derivative to gain exposure to a security or type of security that it would be prohibited by its investment restrictions from purchasing directly.
U.S. Infrastructure Income
U.S. Infrastructure Income’s investment objective is to seek current income consistent with limited risk to capital. Under normal market conditions, the Fund invests at least 80% of the sum of its net assets and the amount of any borrowings for investment purposes in infrastructure-related debt securities of U.S. issuers. Such securities include taxable and tax-exempt municipal bonds issued to finance the ownership, development, construction, renovation or operation of infrastructure assets and debt securities issued by, or loans issued to, infrastructure-related companies, which include companies involved in the ownership, development, construction, renovation, financing or operation of infrastructure assets, or that provide the services and raw materials necessary for the construction and maintenance of infrastructure assets.
Infrastructure assets are the physical structures and networks upon which the operation, growth and development of a community depends, which include water, sewer, and energy utilities; transportation and communication networks; health care facilities, schools, government accommodations and other public service facilities; and shipping, timber, steel, alternative energy, and other resources and services necessary for the construction and maintenance of these physical structures and networks.
Municipal bonds in which the Fund invests include obligations issued by U.S. states and their subdivisions, authorities, instrumentalities and corporations, as well as obligations issued by U.S. territories (such as Puerto Rico, the U.S. Virgin Islands and Guam). The Fund may invest in all types of municipal bonds including general obligation bonds, revenue bonds and participation interests in municipal leases. The Fund may invest in zero coupon bonds, which are issued at substantial discounts from their value at maturity and pay no cash income to their holders until they mature.
The Fund does not seek to provide income exempt from federal income tax. The Fund may invest in both taxable and tax-exempt municipal bonds. The Fund does not anticipate investing in tax-exempt bonds to the extent that its dividends will qualify as “exempt-interest dividends” and, as a result, it is expected that the Fund’s dividends will be taxable.
Other debt securities in which the Fund may invest include corporate debt obligations, including obligations issued by special-purpose entities that are backed by corporate debt obligations, fixed and floating rate loans, including senior loans and secured and unsecured junior loans, convertible bonds and preferred securities.
The Fund may invest up to 20% of its total assets in debt obligations of non-U.S. issuers, including debt obligations issued by issuers that are located in emerging market countries.
The Fund may invest up to 40% of its net assets in securities rated below investment grade or, if unrated, judged by the Sub-Adviser to be of comparable quality. Such securities are commonly referred to as “high yield” or “junk” bonds.
The Fund is not subject to any formal restrictions on its average portfolio maturity or duration, or on the duration or maturity of the individual securities in which it invests. However, the Fund generally invests in longer term bonds which are more sensitive to interest rate risk.
The Fund may invest up to 15% of its net assets in securities whose interest payments vary inversely with changes in short-term interest rates (“inverse floaters”). Inverse floaters are derivative securities that provide leveraged exposure to underlying bonds. The Fund’s investments in inverse floaters are designed to increase the Fund’s income and returns through this leveraged exposure. These investments are speculative, however, and also create the possibility that income and returns will be diminished.
The Fund may utilize the following derivatives: options; futures contracts; options on futures contracts; interest rate caps, collars, and floors; foreign currency contracts; options on foreign currencies; swap agreements, including swap agreements on interest rates, currency rates, security indexes and specific securities, and credit default swap agreements; and options on the foregoing types of swap agreements. The Fund may enter into standardized derivatives contracts traded on domestic or foreign securities exchanges, boards of trade, or similar entities, and non-standardized derivatives contracts traded in the OTC market. The Fund may use these derivatives in an attempt to manage market risk, currency risk, credit risk and yield curve risk, to manage the effective maturity or duration of securities in the Fund’s portfolio or for speculative purposes in an effort to increase the Fund’s yield or to enhance returns. The use of a derivative is speculative if the Fund is primarily seeking to enhance returns, rather than offset the risk of other positions.
The Funds’ most recent prospectus provides further descriptions of each Fund’s investment objective, principal investment strategies and principal risks.
Class B Shares
During the current fiscal period, High Income Bond and Strategic Income offered Class B Shares. Effective at the close of business on June 23, 2014, Class B Shares of High Income Bond and Strategic Income were converted to Class A Shares and are no longer available through an exchange from other Nuveen mutual funds.
Significant Accounting Policies
The following is a summary of significant accounting policies followed by the Funds in the preparation of their financial statements in accordance with accounting principles generally accepted in the United States (“U.S. GAAP”).
Investment Transactions
Investment transactions are recorded on a trade date basis. Trade date for senior and subordinated loans purchased in the “primary market” is considered the date on which loan allocations are determined. Trade date for senior and subordinated loans purchased in the “secondary market” is the date on which the transaction is entered into. Realized gains and losses from investment transactions are determined on the specific identification method, which is the same basis used for federal income tax purposes. Investments purchased on a when-issued/delayed delivery basis may have extended settlement periods. Any investments so purchased are subject to market fluctuation during this period. The Funds have instructed the custodian to earmark securities in the Funds’ portfolios with a current value at least equal to the amount of the when-issued/delayed delivery purchase commitments.
As of June 30, 2014, the Funds’ outstanding when-issued/delayed delivery purchase commitments were as follows:
| | | | | | | | | | | | | | | | |
| | | Global Total
Return
Bond | | | High Income
Bond | | | Strategic Income | | | U.S. Infrastructure
Income | |
| Outstanding when-issued/delayed delivery purchase commitments | | $ | 818,495 | | | $ | 17,729,603 | | | $ | 15,192,623 | | | $ | — | |
Investment Income
Dividend income is recorded on the ex-dividend date or, for foreign securities, when information is available. Interest income, which reflects the amortization of premiums and includes accretion of discounts for financial reporting purposes, is recorded on an accrual basis. Interest income also reflects pay down gains and losses, if any. Fee income consists primarily of amendment fees. Amendment fees are earned as compensation for evaluating and accepting changes to an original senior loan agreement and are recognized when received. Fee income and amendment fees, if any, are recognized as “Interest income” on the Statement of Operations. Securities lending income is comprised of fees earned from borrowers and income earned on cash collateral investments, net of lending agent fees.
Professional Fees
Professional fees presented on the Statement of Operations consist of legal fees incurred in the normal course of operations, audit fees, tax consulting fees and, in some cases, workout expenditures. Workout expenditures are incurred in an attempt to protect or enhance an investment, or to pursue other claims or legal actions on behalf of Fund shareholders. If a refund is received for workout expenditures paid in a prior reporting period, such amounts will be recognized as “Legal fee refund” on the Statement of Operations.
Dividends and Distributions to Shareholders
Dividends from net investment income are declared daily and distributed to shareholders monthly. Fund shares begin to accrue dividends on the business day after the day when the monies used to purchase Fund shares are collected by the transfer agent.
Net realized capital gains from investment transactions, if any, are declared and distributed to shareholders at least annually. Furthermore, capital gains are distributed only to the extent they exceed available capital loss carryforwards.
Notes to Financial Statements (continued)
Distributions to shareholders are recorded on the ex-dividend date. The amount and timing of distributions are determined in accordance with federal income tax regulations, which may differ from U.S. GAAP.
Share Classes and Sales Charges
Class A Shares are generally sold with an up-front sales charge and incur a .25% annual 12b-1 service fee. Class A Share purchases of the Funds of $1 million or more are sold at net asset value (“NAV”) without an up-front sales charge. Class A Share purchases may be subject to a contingent deferred sales charge (“CDSC”) if redeemed within eighteen months of purchase. High Income Bond and Strategic Income issued Class B Shares upon the exchange of Class B Shares from another Nuveen mutual fund or for purposes of dividend reinvestment, but Class B Shares of these Funds were not available for new accounts or for additional investment into existing accounts. Class B Shares incurred a .75% annual 12b-1 distribution fee and a .25% annual 12b-1 service fee. Class B Shares were subject to a CDSC of up to 5% depending upon the length of time the shares were held by the investor (CDSC was reduced to 0% at the end of six years). Class B Shares automatically converted to Class A Shares eight years after purchase. Class C Shares are sold without an up-front sales charge but incur a .75% annual 12b-1 distribution fee and a .25% annual 12b-1 service fee. Class C Shares are subject to a CDSC of 1% if redeemed within twelve months of purchase. Class R3 Shares are sold without an up-front sales charge but incur a .25% annual 12b-1 distribution fee and a .25% annual 12b-1 service fee. Class I Shares are not subject to any sales charge or 12b-1 distribution or service fees.
Multiclass Operations and Allocations
Income and expenses of the Funds that are not directly attributable to a specific class of shares are prorated among the classes based on the relative settled shares of each class. Expenses directly attributable to a class of shares, which presently only include 12b-1 distribution and service fees, are recorded to the specific class.
Realized and unrealized capital gains and losses of the Funds are prorated among the classes based on the relative net assets of each class.
Indemnifications
Under each Trust’s organizational documents, its officers and directors/trustees are indemnified against certain liabilities arising out of the performance of their duties to each Trust. In addition, in the normal course of business, each Trust enters into contracts that provide general indemnifications to other parties. Each Trust’s maximum exposure under these arrangements is unknown as this would involve future claims that may be made against each Trust that have not yet occurred. However, each Trust has not had prior claims or losses pursuant to these contracts and expects the risk of loss to be remote.
Netting Agreements
In the ordinary course of business, the Funds may enter into transactions subject to enforceable master repurchase agreements (Global Total Return only), International Swaps and Derivative Association, Inc. (“ISDA”) master agreements or other similar arrangements (“netting agreements”). Generally, the right to offset in netting agreements allows each Fund to offset any exposure to a specific counterparty with any collateral received or delivered to that counterparty based on the terms of the agreements. Generally, each Fund manages its cash collateral and securities collateral on a counterparty basis.
As of June 30, 2014, the Funds (a) entered into securities lending transactions and (b) invested in repurchase agreements, forward foreign currency exchange contracts and interest rate swap contracts that are subject to netting agreements and further described in Note 3 – Portfolio Securities and Investments in Derivatives.
Use of Estimates
The preparation of financial statements in conformity with U.S. GAAP requires management to make estimates and assumptions that affect the reported amounts of assets and liabilities at the date of the financial statements and the reported amounts of increases and decreases in net assets from operations during the reporting period. Actual results may differ from those estimates.
2. Investment Valuation and Fair Value Measurements
The fair valuation input levels as described below are for fair value measurement purposes.
Investment Valuation
Common stocks and other equity-type securities are valued at the last sales price on the securities exchange on which such securities are primarily traded and are generally classified as Level 1. Securities primarily traded on the NASDAQ National Market (“NASDAQ”) are valued at the NASDAQ Official Closing Price and are generally classified as Level 1. However, securities traded on a securities exchange or NASDAQ for which there were no transactions on a given day or securities not listed on a securities exchange or NASDAQ are valued at the quoted bid price and are generally classified as Level 2.
The ETFs in which the Funds invest are valued at the last sales price on the securities exchange on which such securities are primarily traded and are generally classified as Level 1.
Investments in investment companies are valued at their respective NAV on valuation date and are generally classified as Level 1.
Prices of fixed-income securities are provided by a pricing service approved by the Nuveen funds’ Board of Directors/Trustees. The pricing service establishes a security’s fair value using methods that may include consideration of the following: yields or prices of investments of comparable quality, type of issue, coupon, maturity and rating, market quotes or indications of value from security dealers, evaluations of anticipated cash flows or collateral, general market conditions and other information and analysis, including the obligor’s credit characteristics considered relevant. These securities are generally classified as Level 2. In pricing certain securities, particularly less liquid and lower quality securities, the pricing service may consider information about a security, its issuer, or market activity provided by the Adviser. These securities are generally classified as Level 2 or Level 3 depending on the priority of the significant inputs.
Prices of foreign currency exchange contracts and swap contracts are also priced by a pricing service approved by the Nuveen funds’ Board of Directors/Trustees using the same methods as described above, and are generally classified as Level 2.
Investments initially valued in currencies other than the U.S. dollar are converted to the U.S. dollar using exchange rates obtained from pricing services. As a result, the NAV of the funds’ shares may be affected by changes in the value of currencies in relation to the U.S. dollar. The value of securities traded in markets outside the United States or denominated in currencies other than the U.S. dollar may be affected significantly on a day that the NYSE is closed and an investor is not able to purchase, redeem or exchange shares. If significant market events occur between the time of determination of the closing price of a foreign security on an exchange and the time that the funds’ NAV is determined, or if under the funds’ procedures, the closing price of a foreign security is not deemed to be reliable, the security would be valued at fair value as determined in accordance with procedures established in good faith by the Nuveen funds’ Board of Directors/Trustees. These securities are generally classified as Level 2 or Level 3 depending on the priority of the significant inputs.
The value of exchange-traded options are based on the mean of the closing bid and ask prices. Futures contracts are valued using the closing settlement price or, in the absence of such a price, the last traded price. Exchange-traded options and futures contracts are generally classified as Level 1. Options traded in the OTC market are valued using an evaluated mean price and are generally classified as Level 2.
Repurchase agreements are valued at contract amount plus accrued interest, which approximates market value. These securities are generally classified as Level 2.
Certain securities may not be able to be priced by the pre-established pricing methods as described above. Such securities may be valued by the Nuveen funds’ Board of Directors/Trustees or its designee at fair value. These securities generally include, but are not limited to, restricted securities (securities which may not be publicly sold without registration under the Securities Act of 1933, as amended) for which a pricing service is unable to provide a market price; securities whose trading has been formally suspended; debt securities that have gone into default and for which there is no current market quotation; a security whose market price is not available from a pre-established pricing source; a security with respect to which an event has occurred that is likely to materially affect the value of the security after the market has closed but before the calculation of a fund’s NAV (as may be the case in non-U.S. markets on which the security is primarily traded) or make it difficult or impossible to obtain a reliable market quotation; and a security whose price, as provided by the pricing service, is not deemed to reflect the security’s fair value. As a general principle, the fair value of a security would appear to be the amount that the owner might reasonably expect to receive for it in a current sale. A variety of factors may be considered in determining the fair value of such securities, which may include consideration of the following: yields or prices of investments of comparable quality, type of issue, coupon, maturity and rating, market quotes or indications of value from security dealers, evaluations of anticipated cash flows or collateral, general market conditions and other information and analysis, including the obligor’s credit characteristics considered relevant. These securities are generally classified as Level 2 or Level 3 depending on the priority of the significant inputs. Regardless of the method employed to value a particular security, all valuations are subject to review by the Nuveen funds’ Board of Directors/Trustees or its designee.
Fair Value Measurements
Fair value is defined as the price that would be received upon selling an investment or transferring a liability in an orderly transaction to an independent buyer in the principal or most advantageous market for the investment. A three-tier hierarchy is used to maximize the use of observable market data and minimize the use of unobservable inputs and to establish classification of fair value measurements for disclosure purposes. Observable inputs reflect the assumptions market participants would use in pricing the asset or liability. Observable inputs are based on market data obtained from sources independent of the reporting entity. Unobservable inputs reflect the reporting entity’s own assumptions about the assumptions market participants would use in pricing the asset or liability. Unobservable inputs are based on the best information available in the circumstances. The following is a summary of the three-tiered hierarchy of valuation input levels.
Notes to Financial Statements (continued)
| | |
| Level 1 – | | Inputs are unadjusted and prices are determined using quoted prices in active markets for identical securities. |
| Level 2 – | | Prices are determined using other significant observable inputs (including quoted prices for similar securities, interest rates, prepayment speeds, credit risk, etc.). |
| Level 3 – | | Prices are determined using significant unobservable inputs (including management’s assumptions in determining the fair value of investments). |
The inputs or methodologies used for valuing securities are not an indication of the risks associated with investing in those securities. The following is a summary of each Fund’s fair value measurements as of the end of the reporting period:
| | | | | | | | | | | | | | | | |
| Global Total Return Bond | | Level 1 | | | Level 2 | | | Level 3 | | | Total | |
| Long-Term Investments*: | | | | | | | | | | | | | | | | |
Convertible Preferred Securities | | $ | 87,525 | | | $ | — | | | $ | — | | | $ | 87,525 | |
$25 Par (or similar) Retail Preferred | | | 314,962 | | | | — | | | | — | | | | 314,962 | |
Corporate Bonds | | | — | | | | 8,963,065 | | | | — | | | | 8,963,065 | |
Convertible Bonds | | | — | | | | 21,235 | | | | — | | | | 21,235 | |
$1,000 Par (or similar) Institutional Preferred | | | — | | | | 673,324 | | | | — | | | | 673,324 | |
Asset-Backed and Mortgage-Backed Securities | | | — | | | | 1,221,769 | | | | — | | | | 1,221,769 | |
Sovereign Debt | | | — | | | | 8,970,471 | | | | — | | | | 8,970,471 | |
| Short-Term Investments: | | | | | | | | | | | | | | | | |
Repurchase Agreements | | | — | | | | 1,328,478 | | | | — | | | | 1,328,478 | |
| Investments in Derivatives: | | | | | | | | | | | | | | | | |
Forward Foreign Currency Exchange Contracts** | | | — | | | | (3,568 | ) | | | — | | | | (3,568 | ) |
Interest Rate Swaps** | | | — | | | | 26,937 | | | | — | | | | 26,937 | |
Futures Contracts** | | | 9,359 | | | | — | | | | — | | | | 9,359 | |
| Total | | $ | 411,846 | | | $ | 21,201,711 | | | $ | — | | | $ | 21,613,557 | |
| | | | |
High Income Bond | | | | | | | | | | | | |
| Long-Term Investments*: | | | | | | | | | | | | | | | | |
Common Stocks*** | | $ | 17,095,352 | | | $ | — | | | $ | 63,745 | | | $ | 17,159,097 | |
Exchange-Traded Funds | | | 9,100,450 | | | | — | | | | — | | | | 9,100,450 | |
Convertible Preferred Securities | | | 3,548,065 | | | | — | | | | — | | | | 3,548,065 | |
Variable Rate Senior Loan Interests | | | — | | | | 18,865,752 | | | | — | | | | 18,865,752 | |
$25 Par (or similar) Retail Preferred**** | | | 51,514,013 | | | | 3,522,229 | | | | — | | | | 55,036,242 | |
Corporate Bonds | | | — | | | | 794,476,620 | | | | 10 | | | | 794,476,630 | |
Convertible Bonds | | | — | | | | 3,510,000 | | | | — | | | | 3,510,000 | |
$1,000 Par (or similar) Institutional Preferred | | | — | | | | 52,588,343 | | | | — | | | | 52,588,343 | |
Asset-Backed Securities | | | — | | | | 2,058 | | | | — | | | | 2,058 | |
Investment Companies | | | 14,493,124 | | | | — | | | | — | | | | 14,493,124 | |
Warrants**** | | | — | | | | 201 | | | | — | ^ | | | 201 | |
| Investments Purchased with Collateral from Securities Lending | | | 180,336,996 | | | | — | | | | — | | | | 180,336,996 | |
| Short-Term Investments: | | | | | | | | | | | | | | | | |
Money Market Funds | | | 37,742,974 | | | | — | | | | — | | | | 37,742,974 | |
| Investments in Derivatives: | | | | | | | | | | | | | | | | |
Forward Foreign Currency Exchange Contracts** | | | — | | | | 26,196 | | | | — | | | | 26,196 | |
Credit Default Swaps** | | | — | | | | (301,627 | ) | | | — | | | | (301,627 | ) |
Interest Rate Swaps** | | | — | | | | (269,555 | ) | | | — | | | | (269,555 | ) |
Futures Contracts** | | | 77,026 | | | | — | | | | — | | | | 77,026 | |
| Total | | $ | 313,908,000 | | | $ | 872,420,217 | | | $ | 63,755 | | | $ | 1,186,391,972 | |
| * | Refer to the Fund’s Portfolio of Investments for industry, state and country, where applicable, classifications. |
| ** | Represents net unrealized appreciation (depreciation) as reported in the Fund’s Portfolio of Investments. |
| *** | Refer to the Fund’s Portfolio of Investments for a breakdown of securities classified as Level 3. |
| **** | Refer to the Fund’s Portfolio of Investments for a breakdown of securities classified as Level 2. |
| ^ | Value equals zero as of the end of the reporting period. |
| | | | | | | | | | | | | | | | |
| Strategic Income | | Level 1 | | | Level 2 | | | Level 3 | | | Total | |
| Long-Term Investments*: | | | | | | | | | | | | | | | | |
Common Stocks*** | | $ | — | | | $ | — | | | $ | 5,993 | | | $ | 5,993 | |
Convertible Preferred Securities | | | 539,466 | | | | — | | | | — | | | | 539,466 | |
Variable Rate Senior Loan Interests | | | — | | | | 8,474,981 | | | | — | | | | 8,474,981 | |
$25 Par (or similar) Retail Preferred**** | | | 18,363,353 | | | | 2,176,520 | | | | — | | | | 20,539,873 | |
Corporate Bonds | | | — | | | | 484,574,801 | | | | — | | | | 484,574,801 | |
$1,000 Par (or similar) Institutional Preferred | | | — | | | | 45,634,192 | | | | — | | | | 45,634,192 | |
Asset-Backed and Mortgage-Backed Securities | | | — | | | | 75,462,885 | | | | — | | | | 75,462,885 | |
Investment Companies | | | 1,997,250 | | | | — | | | | — | | | | 1,997,250 | |
Sovereign Debt | | | — | | | | 132,163,289 | | | | — | | | | 132,163,289 | |
| Investments Purchased with Collateral from Securities Lending | | | 84,532,292 | | | | — | | | | — | | | | 84,532,292 | |
| Short-Term Investments: | | | | | | | | | | | | | | | | |
Money Market Funds | | | 27,827,846 | | | | — | | | | — | | | | 27,827,846 | |
| Investments in Derivatives: | | | | | | | | | | | | | | | | |
Forward Foreign Currency Exchange Contracts** | | | — | | | | (183,213 | ) | | | — | | | | (183,213 | ) |
Interest Rate Swaps** | | | — | | | | (649,854 | ) | | | — | | | | (649,854 | ) |
Futures Contracts** | | | 91,974 | | | | — | | | | — | | | | 91,974 | |
| Total | | $ | 133,352,181 | | | $ | 747,653,601 | | | $ | 5,993 | | | $ | 881,011,775 | |
| | | | |
| U.S. Infrastructure Income | | | | | | | | | | | | |
| Long-Term Investments*: | | | | | | | | | | | | | | | | |
Corporate Bonds | | $ | — | | | $ | 2,504,901 | | | $ | — | | | $ | 2,504,901 | |
Municipal Bonds | | | — | | | | 4,519,477 | | | | — | | | | 4,519,477 | |
| Investments in Derivatives: | | | | | | | | | | | | | | | | |
Futures Contracts** | | | (15,151 | ) | | | — | | | | — | | | | (15,151 | ) |
| Total | | $ | (15,151 | ) | | $ | 7,024,378 | | | $ | — | | | $ | 7,009,227 | |
| * | Refer to the Fund’s Portfolio of Investments for industry, state and country, where applicable, classifications. |
| ** | Represents net unrealized appreciation (depreciation) as reported in the Fund’s Portfolio of Investments. |
| *** | Refer to the Fund’s Portfolio of Investments for a breakdown of securities classified as Level 3. |
| **** | Refer to the Fund’s Portfolio of Investments for a breakdown of securities classified as Level 2. |
The Nuveen funds’ Board of Directors/Trustees is responsible for the valuation process and has delegated the oversight of the daily valuation process to the Adviser’s Valuation Committee. The Valuation Committee, pursuant to the valuation policies and procedures adopted by the Board of Directors/Trustees, is responsible for making fair value determinations, evaluating the effectiveness of the funds’ pricing policies and reporting to the Board of Directors/Trustees. The Valuation Committee is aided in its efforts by the Adviser’s dedicated Securities Valuation Team, which is responsible for administering the daily valuation process and applying fair value methodologies as approved by the Valuation Committee. When determining the reliability of independent pricing services for investments owned by the funds, the Valuation Committee, among other things, conducts due diligence reviews of the pricing services and monitors the quality of security prices received through various testing reports conducted by the Securities Valuation Team.
The Valuation Committee will consider pricing methodologies it deems relevant and appropriate when making a fair value determination, based on the facts and circumstances specific to the portfolio instrument. Fair value determinations generally will be derived as follows, using public or private market information:
| | (i) | If available, fair value determinations shall be derived by extrapolating from recent transactions or quoted prices for identical or comparable securities. |
| | (ii) | If such information is not available, an analytical valuation methodology may be used based on other available information including, but not limited to: analyst appraisals, research reports, corporate action information, issuer financial statements and shelf registration statements. Such analytical valuation methodologies may include, but are not limited to: multiple of earnings, discount from market value of a similar freely-traded security, discounted cash flow analysis, book value or a multiple thereof, risk premium/yield analysis, yield to maturity and/or fundamental investment analysis. |
The purchase price of a portfolio instrument will be used to fair value the instrument only if no other valuation methodology is available or deemed appropriate, and it is determined that the purchase price fairly reflects the instrument’s current value.
Notes to Financial Statements (continued)
For each portfolio security that has been fair valued pursuant to the policies adopted by the Board of Directors/Trustees, the fair value price is compared against the last available and next available market quotations. The Valuation Committee reviews the results of such testing and fair valuation occurrences are reported to the Board of Directors/Trustees.
3. Portfolio Securities and Investments in Derivatives
Portfolio Securities
Foreign Currency Transactions
To the extent that the Funds invest in securities and/or contracts that are denominated in a currency other than U.S. dollars, the Funds will be subject to currency risk, which is the risk that an increase in the U.S. dollar relative to the foreign currency will reduce returns or portfolio value. Generally, when the U.S. dollar rises in value against a foreign currency, the Funds’ investments denominated in that currency will lose value because their currency is worth fewer U.S. dollars; the opposite effect occurs if the U.S. dollar falls in relative value. Investments and other assets and liabilities denominated in foreign currencies are converted into U.S. dollars on a spot (i.e. cash) basis at the spot rate prevailing in the foreign currency exchange market at the time of valuation. Purchases and sales of investments and income denominated in foreign currencies are translated into U.S. dollars on the respective dates of such transactions.
Each Fund may invest in non-U.S. securities. As of June 30, 2014, Global Total Return Bond’s, High Income Bond’s and Strategic Income’s investments in non-U.S. securities were as follows:
| | | | | | | | |
| Global Total Return Bond | | Value | | | % of
Net Assets | |
| Country: | | | | | | | | |
Mexico | | $ | 2,713,066 | | | | 13.1 | % |
United Kingdom | | | 1,596,376 | | | | 7.7 | |
Turkey | | | 1,466,765 | | | | 7.1 | |
Germany | | | 1,007,597 | | | | 4.9 | |
South Africa | | | 968,728 | | | | 4.7 | |
Poland | | | 674,504 | | | | 3.3 | |
Canada | | | 577,434 | | | | 2.8 | |
Brazil | | | 478,534 | | | | 2.3 | |
Portugal | | | 462,361 | | | | 2.2 | |
Other Countries | | | 3,825,174 | | | | 18.4 | |
| Total non-U.S. securities | | $ | 13,770,539 | | | | 66.5 | % |
| | | | | | | | |
| High Income Bond | | Value | | | % of
Net Assets | |
| Country: | | | | | | | | |
Canada | | $ | 68,171,965 | | | | 6.8 | % |
United Kingdom | | | 37,286,791 | | | | 3.7 | |
Luxembourg | | | 31,133,856 | | | | 3.1 | |
France | | | 24,534,592 | | | | 2.4 | |
Norway | | | 14,759,688 | | | | 1.5 | |
Brazil | | | 14,373,725 | | | | 1.4 | |
Other Countries | | | 142,179,912 | | | | 14.2 | |
| Total non-U.S. securities | | $ | 332,440,529 | | | | 33.1 | % |
| | | | | | | | |
| Strategic Income | | Value | | | % of
Net Assets | |
| Country: | | | | | | | | |
South Africa | | $ | 37,832,766 | | | | 4.8 | % |
Mexico | | | 37,782,014 | | | | 4.8 | |
Canada | | | 33,171,299 | | | | 4.2 | |
United Kingdom | | | 26,568,478 | | | | 3.3 | |
Brazil | | | 26,413,485 | | | | 3.3 | |
Turkey | | | 24,431,202 | | | | 3.1 | |
Poland | | | 11,784,682 | | | | 1.5 | |
Other Countries | | | 97,708,336 | | | | 12.2 | |
| Total non-U.S. securities | | $ | 295,692,262 | | | | 37.2 | % |
The books and records of the Funds are maintained in U.S. dollars. Foreign currencies, assets and liabilities are translated into U.S. dollars at 4:00 p.m. Eastern Time. Investment transactions, income and expenses are translated on the respective dates of such transactions. Net realized foreign currency gains and losses resulting from changes in exchange rates include foreign currency gains and losses between trade date and settlement date of the transactions, foreign currency transactions, and the difference between the amounts of interest and dividends recorded on the books of the Funds and the amounts actually received.
The realized gains and losses resulting from changes in foreign currency exchange rates and changes in foreign exchange rates associated with other assets and liabilities on investments, forward foreign currency exchange contracts, futures, options purchased, options written and swap contracts are recognized as a component of “Net realized gain (loss) from investments and foreign currency” on the Statement of Operations, when applicable.
The unrealized gains and losses resulting from changes in foreign currency exchange rates and changes in foreign exchange rates associated with other assets and liabilities on investments are recognized as a component of “Change in net unrealized appreciation (depreciation) of investments and foreign currency” on the Statement of Operations, when applicable. The unrealized gains and losses resulting from changes in foreign exchange rates associated with forward foreign currency exchange contracts, futures, options purchased, options written and swap contracts are recognized as a component of “Change in net unrealized appreciation (deprecation) of forward foreign currency exchange contracts, futures contracts, options purchased, options written and swaps,’’ respectively, on the Statement of Operations, when applicable.
Repurchase Agreements
Global Total Return Bond and U.S. Infrastructure Income are authorized to invest in repurchase agreements. In connection with transactions in repurchase agreements, it is each Fund’s policy that its custodian take possession of the underlying collateral securities, the fair value of which exceeds the principal amount of the repurchase transaction, including accrued interest, at all times. If the counterparty defaults, and the fair value of the collateral declines, realization of the collateral may be delayed or limited.
The following table presents the repurchase agreements for the Funds that are subject to netting agreements as of the end of the reporting period, and the collateral delivered related to those repurchase agreements.
| | | | | | | | | | | | | | |
| Fund | | Counterparty | | Short-Term
Investments, atValue | | | Collateral
Pledged (From)
Counterparty* | | | Net
Exposure | |
| Global Total Return Bond | | Fixed Income Clearing Corporation | | $ | 1,328,478 | | | $ | (1,328,478 | ) | | $ | — | |
| * | As of June 30, 2014, the value of the collateral pledged from the counterparty exceeded the value of the repurchase agreements. Refer to the Fund’s Portfolio of Investments for details on the repurchase agreements. |
Securities Lending
In order to generate additional income, High Income Bond and Strategic Income may lend securities representing up to one-third of the value of each Fund’s total assets (which includes collateral for securities on loan) to broker-dealers, banks or other institutions. Each Fund’s policy is to receive cash collateral equal to at least 102% of the value of securities loaned, which is recognized as “Collateral from securities lending program” on the Statement of Assets and Liabilities. The adequacy of the collateral is monitored on a daily basis. If the value of the securities on loan increases, such that the level of collateralization falls below 100%, additional collateral is received from the borrower, which is recognized as “Due from broker” on the Statement of Assets and Liabilities, when applicable. As with other extensions of credit, there may be risks of delay in recovery of the securities or even loss of rights in the collateral should the borrower of the security fail financially.
Notes to Financial Statements (continued)
The Funds’ custodian serves as the securities lending agent for the Funds. Each Fund pays the custodian a fee based on the Fund’s proportional share of the custodian’s expense of operating its securities lending program. Collateral for securities on loan is invested in a money market fund, which is recognized as “Investments purchased with collateral from securities lending, at value” on the Statement of Assets and Liabilities.
The following table presents the securities out on loan for the following Funds that are subject to netting agreements as of the end of the reporting period, and the collateral delivered related to those securities.
| | | | | | | | | | | | | | |
| Fund | | Counterparty | | Long-Term
Investments, at Value | | | Collateral
Pledged (From)
Counterparty* | | | Net
Exposure | |
| High Income Bond | | U.S. Bank | | $ | 175,825,761 | | | $ | (175,825,761 | ) | | $ | — | |
| Strategic Income | | U.S. Bank | | | 82,407,459 | | | | (82,407,459 | ) | | | — | |
| * | As of June 30, 2014, the value of the collateral pledged from the counterparty exceeded the value of the securites out on loan. Refer to the Fund's Portfolio of Investments for details on the securites out on loan. |
Income from securities lending, net of fees paid, is recognized on the Statement of Operations as “Securities lending income, net.” Securities lending fees paid by each Fund during the fiscal year ended June 30, 2014, were as follows:
| | | | | | | | |
| | | High Income
Bond | | | Strategic
Income | |
| Securities lending fees paid | | $ | 112,209 | | | $ | 47,688 | |
Zero Coupon Securities
A zero coupon security does not pay a regular interest coupon to its holders during the life of the security. Income to the holder of the security comes from accretion of the difference between the original purchase price of the security at issuance and the par value of the security at maturity and is effectively paid at maturity. The market prices of zero coupon securities generally are more volatile than the market prices of securities that pay interest periodically.
Investments in Derivatives
Each Fund is authorized to invest in certain derivatives. The Funds record derivative instruments at fair value, with changes in fair value recognized on the Statement of Operations, when applicable. Even though the Funds’ investments in derivatives may represent economic hedges, they are not considered to be hedge transactions for financial reporting purposes.
Forward Foreign Currency Exchange Contracts
Each Fund is authorized to enter into forward foreign currency exchange contracts (“forward contract”) under two circumstances: (i) when a Fund enters into a contract for the purchase or sale of a security denominated in a foreign currency to “lock in” the U.S. exchange rate of the transaction, with such period being a short-dated contract covering the period between transaction date and settlement date; or (ii) when the Sub-Adviser, believes that the currency of a particular foreign country may experience a substantial movement against the U.S. dollar or against another foreign currency.
A forward contract is an agreement between two parties to purchase or sell a specified quantity of a currency at or before a specified date in the future at a specified price. Forward contracts are typically traded in the OTC markets and all details of the contract are negotiated between the counterparties to the agreement. Accordingly, the forward contracts are valued by reference to the contracts traded in the OTC markets. The contractual obligations of a buyer or seller may generally be satisfied by taking or making physical delivery of the underlying currency, establishing an opposite position in the contract and recognizing the profit or loss on both positions simultaneously on the delivery date or, in some instances, paying a cash settlement before the designated date of delivery.
Forward contracts are valued daily at the forward rate. The net amount recorded on these transactions for each counterparty is recognized as a component of “Unrealized appreciation and/or depreciation on forward foreign currency exchange contracts, (net)” on the Statement of Assets and Liabilities. The change in value of the forward contracts during the reporting period is recognized as a component of “Change in net unrealized appreciation (depreciation) of forward foreign currency exchange contracts” on the Statement of Operations. When the contract is closed or offset with the same counterparty, a Fund recognizes the difference between the value of the contract at the time it was entered and the value at the time it was closed or offset as a component of “Net realized gain (loss) from forward foreign currency exchange contracts” on the Statement of Operations.
Forward contracts will generally not be entered into for terms greater than three months, but may have maturities of up to six months or more. The use of forward contracts does not eliminate fluctuations in the underlying prices of a Fund’s investment securities; however, it does establish a rate of exchange that can be achieved in the future. The use of forward contracts involves the risk that anticipated currency movements will not be accurately predicted. A forward contract would limit the risk of loss due to a decline in the value of a particular currency; however, it also would limit any potential
gain that might result should the value of the currency increase instead of decrease. These contracts may involve market risk in excess of the unrealized appreciation or depreciation reflected on the Statement of Assets and Liabilities. Forward contracts are subject to counterparty risk if the counterparty fails to perform as specified in the contract due to financial impairment or other reason.
During the fiscal year ended June 30, 2014, Global Total Return Bond, High Income Bond and Strategic Income invested in forward foreign currency exchange contracts. Global Total Return Bond used forward foreign currency exchange contracts to reduce risk and take active currency exposures by hedging select foreign currency risks associated with the Fund’s foreign debt investments. The Fund also actively managed currency exposures through forward foreign currency exchange contracts in an attempt to benefit from the potential appreciation of certain currencies. High Income Bond and Strategic Income used forward foreign currency exchange contracts to manage foreign currency exposure. For example, a Fund may reduce unwanted currency exposure from its portfolio, or may take long forward positions in select currencies in an attempt to benefit from the potential price appreciation.
The average notional amount of forward foreign currency exchange contracts outstanding during the fiscal year ended June 30, 2014, was as follows:
| | | | | | | | | | | | |
| | | Global Total
Return Bond | | | High Income
Bond | | | Strategic
Income | |
| Average notional amount of forward foreign currency exchange contracts outstanding* | | $ | 24,316,043 | | | $ | 59,182,217 | | | $ | 211,869,217 | |
| * | The average notional amount is calculated based on the outstanding notional at the beginning of the fiscal year and at the end of each fiscal quarter within the current fiscal year. |
The following table presents the fair value of all forward foreign currency exchange contracts held by the Funds as of June 30, 2014, the location of these instruments on the Statement of Assets and Liabilities and the primary underlying risk exposure.
| | | | | | | | | | | | | | |
| | | | | Location on the Statement of Assets and Liabilities | |
| | | | | Asset Derivatives | | | (Liability) Derivatives | |
Underlying
Risk Exposure | | Derivative Instrument | | Location | | Value | | | Location | | Value | |
| Global Total Return Bond | | | | | | | | | | | | |
Foreign currency exchange rate | | Forward contracts | | Unrealized appreciation on forward foreign currency exchange contracts, net | | $ | 35,098 | | | Unrealized depreciation on
forward foreign currency
exchange contracts, net | | $ | (60,154 | ) |
Foreign currency exchange rate | | Forward contracts | | Unrealized appreciation on forward foreign currency exchange contracts, net | | | (4,690 | ) | | Unrealized depreciation on
forward foreign currency
exchange contracts, net | | | 26,178 | |
Total | | | | | | $ | 30,408 | | | | | $ | (33,976 | ) |
| High Income Bond | | | | | | | | | | | | |
Foreign currency exchange rate | | Forward contracts | | Unrealized appreciation on forward foreign currency exchange contracts, net | | $ | 433,164 | | | — | | $ | — | |
Foreign currency exchange rate | | Forward contracts | | Unrealized appreciation on forward foreign currency exchange contracts, net | | | (406,968 | ) | | — | | | — | |
Total | | | | | | $ | 26,196 | | | | | $ | — | |
| Strategic Income | | | | | | | | | | | | |
Foreign currency exchange rate | | Forward contracts | | Unrealized appreciation on forward foreign currency exchange contracts, net | | $ | 973,902 | | | Unrealized depreciation on
forward foreign currency
exchange contracts, net | | $ | (801,418 | ) |
Foreign currency exchange rate | | Forward contracts | | Unrealized appreciation on forward foreign currency exchange contracts, net | | | (547,663 | ) | | Unrealized depreciation on
forward foreign currency
exchange contracts, net | | | 191,966 | |
Total | | | | | | $ | 426,239 | | | | | $ | (609,452 | ) |
Notes to Financial Statements (continued)
The following table presents the forward foreign currency exchange contracts, which are subject to netting agreements, and the collateral delivered to those forward foreign currency exchange contracts as of June 30, 2014.
| | | | | | | | | | | | | | | | | | | | | | | | | | |
| Fund | | Counterparty | | Gross
Unrealized
Appreciation on
Forward Foreign
Currency Exchange
Contracts* | | | Gross
Unrealized
(Depreciation) on
Forward Foreign
Currency Exchange
Contracts* | | �� | Amounts
Netted on
Statement of
Assets and
Liabilities | | | Net Unrealized
Appreciation
(Depreciation) on
Forward Foreign
Currency Exchange
Contracts | | | Collateral
Pledged
to (from)
Counterparty | | | Net
Exposure | |
Global Total Return Bond | | | | | | | | | | | | | | | | | | | | | | | | | | |
| | Barclays Bank PLC | | $ | — | | | $ | (1,064 | ) | | $ | — | | | $ | (1,064 | ) | | $ | — | | | $ | (1,064 | ) |
| | BNP Paribas | | | 1,231 | | | | — | | | | — | | | | 1,231 | | | | — | | | | 1,231 | |
| | Citigroup | | | 14,240 | | | | (2,501 | ) | | | (2,501 | ) | | | 11,739 | | | | — | | | | 11,739 | |
| | Credit Suisse | | | 9,137 | | | | (1,271 | ) | | | (1,271 | ) | | | 7,866 | | | | — | | | | 7,866 | |
| | Goldman Sachs | | | 17,091 | | | | (19,646 | ) | | | 17,091 | | | | (2,555 | ) | | | — | | | | (2,555 | ) |
| | JPMorgan | | | 8,557 | | | | (17,667 | ) | | | 8,557 | | | | (9,110 | ) | | | — | | | | (9,110 | ) |
| | Morgan Stanley | | | 530 | | | | (21,777 | ) | | | 530 | | | | (21,247 | ) | | | — | | | | (21,247 | ) |
| | | Nomura Securities | | | 10,490 | | | | (918 | ) | | | (918 | ) | | | 9,572 | | | | — | | | | 9,572 | |
Total | | | | $ | 61,276 | | | $ | (64,844 | ) | | $ | 21,488 | | | $ | (3,568 | ) | | $ | — | | | $ | (3,568 | ) |
High Income Bond | | | | | | | | | | | | | | | | | | | | | | | | | | |
| | | Citigroup | | $ | 433,164 | | | $ | (406,968 | ) | | $ | (406,968 | ) | | $ | 26,196 | | | $ | (26,196 | ) | | $ | — | |
Strategic Income | | | | | | | | | | | | | | | | | | | | | | | | | | |
| | Citigroup | | $ | 524,919 | | | $ | (459,838 | ) | | $ | (459,838 | ) | | $ | 65,081 | | | $ | (65,081 | ) | | $ | — | |
| | Credit Suisse | | | 120,737 | | | | — | | | | — | | | | 120,737 | | | | (120,737 | ) | | | — | |
| | JPMorgan | | | 191,966 | | | | (801,418 | ) | | | 191,966 | | | | (609,452 | ) | | | 280,000 | | | | (329,452 | ) |
| | | Nomura Securities | | | 328,246 | | | | (87,825 | ) | | | (87,825 | ) | | | 240,421 | | | | (240,421 | ) | | | — | |
Total | | | | $ | 1,165,868 | | | $ | (1,349,081 | ) | | | $(355,697) | | | $ | (183,213 | ) | | $ | (146,239 | ) | | $ | (329,452 | ) |
| * | Represents gross unrealized appreciation (depreciation) for the counterparty as reported in the Fund’s Portfolio of Investments. |
The following table presents the amount of net realized gain (loss) and change in net unrealized appreciation (depreciation) recognized on forward foreign currency exchange contracts on the Statement of Operations during the fiscal year ended June 30, 2014, and the primary underlying risk exposure.
| | | | | | | | | | | | | | | | |
| Fund | | Underlying
Risk Exposure | | | Derivative
Instrument | | | Net Realized
Gain(Loss) from
Forward Foreign Currency
Exchange Contracts | | | Change in Net Unrealized
Appreciation (Depreciation) of
Forward Foreign Currency
Exchange Contracts | |
Global Total Return Bond | | | Foreign currency exchange rate | | | | Forward contracts | | | $ | (355,340 | ) | | $ | 76,850 | |
High Income Bond | | | Foreign currency exchange rate | | | | Forward contracts | | | | (869,241 | ) | | | 183,932 | |
| Strategic Income | | | Foreign currency exchange rate | | | | Forward contracts | | | | (3,086,868 | ) | | | 1,021,813 | |
Futures Contracts
Upon execution of a futures contract, a Fund is obligated to deposit cash or eligible securities, also known as “initial margin,” into an account at its clearing broker equal to a specified percentage of the contract amount. Cash held by the broker to cover initial margin requirements on open futures contracts, if any, is recognized as “Cash collateral at brokers” on the Statement of Assets and Liabilities. Investments in futures contracts obligate a Fund and the clearing broker to settle monies on a daily basis representing changes in the prior days “mark-to-market” of the open contracts. If a Fund has unrealized appreciation the clearing broker would credit the Fund’s account with an amount equal to appreciation and conversely if a Fund has unrealized depreciation the clearing broker would debit the Fund’s account with an amount equal to depreciation. These daily cash settlements are also known as “variation margin.” Variation margin is recognized as a receivable and/or payable for “Variation margin on futures contracts” on the Statement of Assets and Liabilities.
During the period the futures contract is open, changes in the value of the contract are recognized as an unrealized gain or loss by “marking-to-market” on a daily basis to reflect the changes in market value of the contract, which is recognized as a component of “Change in net unrealized appreciation (depreciation) of futures contracts” on the Statement of Operations. When the contract is closed or expired, a Fund records a realized gain or loss equal to the difference between the value of the contract on the closing date and value of the contract when originally entered into, which is recognized as a component of “Net realized gain (loss) from futures contracts” on the Statement of Operations.
Risks of investments in futures contracts include the possible adverse movement in the price of the securities or indices underlying the contracts, the possibility that there may not be a liquid secondary market for the contracts and/or that a change in the value of the contract may not correlate with a change in the value of the underlying securities or indices.
During the fiscal year ended June 30, 2014, each of the Funds invested in interest rate futures contracts. Global Total Return Bond used U.S. Treasury futures as part of an overall portfolio construction strategy to manage portfolio duration and yield curve exposure; used selected foreign bond futures to actively manage exposure to those markets. High Income Bond and Strategic Income used U.S. Treasury note and bond futures to manage portfolio duration and yield curve exposure. For example, to decrease the duration of a Fund’s portfolio, a short Treasury bond or Treasury note futures position would be acquired. Strategic Income also invested in selected foreign bond futures to actively manage exposure to those markets. U.S. Infrastructure Income shorted U.S. Treasury futures to hedge against potential increases in interest rates.
The average notional amount of futures contracts outstanding during the fiscal year ended June 30, 2014, was as follows:
| | | | | | | | | | | | | | | | |
| | | Global Total
Return
Bond | | | High Income
Bond | | | Strategic
Income | | | U.S. Infrastructure
Income | |
| Average notional amount of futures contracts outstanding* | | $ | 6,192,152 | | | $ | 33,593,936 | | | $ | 100,232,315 | | | $ | 1,509,063 | |
| * | The average notional amount is calculated based on the absolute aggregate notional of contracts outstanding at the beginning of the fiscal year and at the end of each quarter within the current fiscal year. |
The following table presents the fair value of all futures contracts held by the Funds as of June 30, 2014, the location of these instruments on the Statement of Assets and Liabilities and the primary underlying risk exposure.
| | | | | | | | | | | | | | |
| | | | | Location on the Statement of Assets and Liabilities | |
| | | | | Asset Derivatives | | | (Liability) Derivatives | |
Underlying
Risk Exposure | | Derivative Instrument | | Location | | Value | | | Location | | Value | |
| | | | | |
| Global Total Return Bond | | | | | | | | | | | | |
Interest rate | | Futures contracts | | Receivable for variation margin on futures contracts* | | $ | 4,991 | | | Payable for variation margin
on futures contracts* | | $ | (5,265 | ) |
Interest rate | | Futures contracts | | — | | | — | | | Payable for variation margin
on futures contracts* | | | 9,633 | |
| Total | | | | | | $ | 4,991 | | | | | $ | 4,368 | |
| | | | | |
| High Income Bond | | | | | | | | | | | | |
Interest rate | | Futures contracts | | — | | $ | — | | | Payable for variation margin
on futures contracts* | | $ | 77,026 | |
| | | | | |
| Strategic Income | | | | | | | | | | | | |
Interest rate | | Futures contracts | | Receivable for variation margin on futures contracts* | | $ | — | | | Payable for variation margin
on futures contracts* | | $ | (43,499 | ) |
Interest rate | | Futures contracts | | — | | | — | | | Payable for variation margin
on futures contracts* | | | 135,473 | |
| Total | | | | | | $ | — | | | | | $ | 91,974 | |
| | | | | |
| U.S. Infrastructure Income | | | | | | | | | | | | |
Interest rate | | Futures contracts | | — | | $ | — | | | Payable for variation margin
on futures contracts* | | $ | (15,151 | ) |
| * | Value represents unrealized appreciation (depreciation) of futures contracts as reported in the Fund’s Portfolio of Investments, and not the cash collateral at brokers, if any, or the receivable or payable for variation margin on futures contracts presented on the Statement of Assets and Liabilities. |
The following table presents the amount of net realized gain (loss) and change in net unrealized appreciation (depreciation) recognized on futures contracts on the Statement of Operations during the fiscal year ended June 30, 2014, and the primary underlying risk exposure.
| | | | | | | | | | | | |
| Fund | | Underlying
Risk Exposure | | Derivative
Instrument | | Net Realized
Gain (Loss) from
Futures Contracts | | | Change in Net
Unrealized Appreciation
(Depreciation) of
Futures Contracts | |
| Global Total Return Bond | | Interest rate | | Futures contracts | | $ | 6,740 | | | $ | (44,565 | ) |
| High Income Bond | | Interest rate | | Futures contracts | | | (77,978 | ) | | | (720,436 | ) |
| Strategic Income | | Interest rate | | Futures contracts | | | (192,845 | ) | | | (955,534 | ) |
| U.S. Infrastructure Income | | Interest rate | | Futures contracts | | | — | | | | (15,151 | ) |
Notes to Financial Statements (continued)
Options Transactions
The purchase of options and/or swaptions involves the risk of loss of all or a part of the cash paid for the options (the premium). The market risk associated with purchasing options and/or swaptions is limited to the premium paid. The counterparty credit risk of purchasing options and/or swaptions, however, needs also to take into account the current value of the option, as this is the performance expected from the counterparty. When a Fund purchases an option and/or swaption, an amount equal to the premium paid (the premium plus commission) is recognized as a component of “Options and/or Swaptions purchased, at value” on the Statement of Assets and Liabilities. When a Fund writes an option and/or swaption, an amount equal to the net premium received (the premium less commission) is recognized as a component of “Options and/or Swaptions written, at value” on the Statement of Assets and Liabilities and is subsequently adjusted to reflect the current value of the written option and/or swaption until the option and/or swaption is exercised or expires or the Fund enters into a closing purchase transaction. The changes in the value of options and/or swaptions purchased during the fiscal period are recognized as a component of “Change in net unrealized appreciation (depreciation) of options and/or swaptions purchased” on the Statement of Operations. The changes in the value of options and/or swaptions written during the fiscal period are recognized as a component of “Change in net unrealized appreciation (depreciation) of options and/or swaptions written” on the Statement of Operations. When an option and/or swaption is exercised or expires or the Fund enters into a closing purchase transaction, the difference between the net premium received and any amount paid at expiration or on executing a closing purchase transaction, including commission, is recognized as a component of “Net realized gain (loss) from options and/or swaptions purchased and/or written” on the Statement of Operations. The Fund, as a writer of an option and/or swaption has no control over whether the underlying instrument may be sold (called) or purchased (put) and as a result bears the risk of an unfavorable change in the market value of the instrument underlying the written option and/or swaption. There is also the risk the Fund may not be able to enter into a closing transaction because of an illiquid market.
During the fiscal year ended June 30, 2014, Global Total Return Bond and Strategic Income purchased call options on select currencies during the period in an attempt to benefit from changes in the spot values on these currencies.
The average notional amount of outstanding options purchased during the fiscal year ended June 30, 2014, were as follows:
| | | | | | | | |
| | | Global Total
Return
Bond | | | Strategic
Income | |
| Average notional amount of outstanding options purchased* | | $ | 20,500,000 | | | $ | 3,395,223 | |
| * | The average notional amount is calculated based on the outstanding notional at the beginning of the fiscal year and at the end of each fiscal quarter within the current fiscal year. |
The following table presents the amount of net realized gain (loss) and change in net unrealized appreciation (depreciation) on options purchased on the Statement of Operations during the fiscal year ended June 30, 2014, and the primary underlying risk exposure.
| | | | | | | | | | | | |
| Fund | | Underlying
Risk Exposure | | Derivative
Instrument | | Net Realized
Gain (Loss) from
Options Purchased | | | Change in Net Unrealized
Appreciation (Depreciation) of
Options Purchased | |
| Global Total Return Bond | | Foreign currency exchange rate | | Options purchased | | $ | (15,802 | ) | | $ | 4,270 | |
| Strategic Income | | Foreign currency exchange rate | | Options purchased | | | (81,130 | ) | | | 81,130 | |
Interest Rate Swaps
Interest rate swap contracts involve a Fund’s agreement with the counterparty to pay or receive a fixed rate payment in exchange for the counterparty receiving or paying a variable rate payment. Forward interest rate swap contracts involve a Fund’s agreement with a counterparty to pay, in the future, a fixed or variable rate payment in exchange for the counterparty paying the Fund a variable or fixed rate payment, the accruals for which would begin at a specified date in the future (the “effective date”). The amount of the payment obligation is based on the notional amount of the swap contract. Swap contracts do not involve the delivery of securities or other underlying assets or principal. Accordingly, the risk of loss with respect to the swap counterparty on such transactions is limited to the net amount of interest payments that the Fund is to receive.
Interest rate swap contracts are valued daily. Upon entering into an interest rate swap (and beginning on the effective date for a forward interest rate swap), a Fund accrues the fixed rate payment expected to be paid or received and the variable rate payment expected to be received or paid on the interest rate swap contracts on a daily basis, and recognizes the daily change in the fair value of the Fund’s contractual rights and obligations under the contracts. For OTC swaps, the net amount recorded on these transactions, for each counterparty, is recognized on the Statement of Assets and Liabilities as a component of “Unrealized appreciation or depreciation on interest rate swaps (, net).”
Upon the execution of an exchanged-cleared swap contract, in certain instances a Fund is obligated to deposit cash or eligible securities, also known as “initial margin,” into an account at its clearing broker equal to a specified percentage of the contract amount. Cash held by the broker to cover initial margin requirements on open swap contracts, if any, is recognized as “Cash collateral at brokers” on the Statement of Assets and Liabilities. Investments in exchange-cleared interest rate swap contracts obligate a Fund and the clearing broker to settle monies on a daily basis representing changes in the prior day’s “mark-to-market” of the swap contract. If a Fund has unrealized appreciation, the clearing broker will credit the Fund’s account with an amount equal
to the appreciation. Conversely, if the Fund has unrealized depreciation, the clearing broker will debit the Fund’s account with an amount equal to the depreciation. These daily cash settlements are also known as “variation margin.” Variation margin is recognized as a receivable and/or payable for “Variation margin on swap contracts” on the Statement of Assets and Liabilities.
The net amount of periodic payments settled in cash are recognized as a component of “Net realized gain (loss) from swaps” on the Statement of Operations, in addition to the net realized gain or loss recorded upon the termination of the swap contract. For tax purposes, payments expected to be received or paid on the swap contacts are treated as ordinary income or expense, respectively.
Changes in the value of the swap contracts during the fiscal period are recognized as a component of “Change in net unrealized appreciation (depreciation) of swaps.” In certain instances, payments are made or received upon entering into the swap contract to compensate for differences between the stated terms of the swap agreements and prevailing market conditions (credit spreads, currency exchange rates, interest rates, and other relevant factors). Payments received or made at the beginning of the measurement period, if any, are recognized as “Interest rate swaps premiums paid and/or received” on the Statement of Assets and Liabilities.
During the fiscal year ended June 30, 2014, Global Total Return Bond, High Income Bond and Strategic Income invested in interest rate swap contracts as part of an overall portfolio construction strategy to manage duration and overall portfolio yield curve exposure.
The average notional amount of interest rate swap contracts outstanding during the fiscal year ended June 30, 2014, was as follows:
| | | | | | | | | | | | |
| | | Global Total
Return
Bond | | | High Income
Bond | | | Strategic
Income | |
| Average notional amount of interest rate swap contracts outstanding* | | $ | 1,200,000 | | | $ | 22,200,000 | | | $ | 85,000,000 | |
| * | The average notional amount is calculated based on the outstanding notional at the beginning of the fiscal year and at the end of each fiscal quarter within the current fiscal year. |
Credit Default Swaps
A Fund may enter into a credit default swap contract to seek to maintain a total return on a particular investment or portion of its portfolio, or to take an active long or short position with respect to the likelihood of a particular issuer’s default. Credit default swap contracts involve one party making a stream of payments to another party in exchange for the right to receive a specified return if/ when there is a credit event by a third party. Generally, a credit event means bankruptcy, failure to pay, or restructuring. The specific credit events applicable for each credit default swap are stated in the terms of the particular swap agreement. As a purchaser of a credit default swap contract, the Fund pays to the counterparty a periodic interest fee based on the notional amount of the credit default swap.
Upon occurrence of a specific credit event with respect to the underlying referenced entity, the Fund is obligated to deliver that security, or an equivalent amount of cash, to the counterparty in exchange for receipt of the notional amount from the counterparty. The difference between the value of the security delivered and the notional amount received is recorded as a realized gain or loss. Payments received or made at the beginning of the measurement period are recognized as a component of “Credit default swaps premiums paid and/or received” on the Statement of Assets and Liabilities, when applicable. As a seller of a credit default swap contract, the Fund generally receives from the counterparty a periodic interest fee based on the notional amount of the credit default swap. Upon occurrence of a specific credit event with respect to the underlying referenced entity, the Fund will either receive that security, or an equivalent amount of cash, from the counterparty in exchange for payment of the notional amount to the counterparty, or pay a net settlement amount of the credit default swap contract less the recovery value of the referenced obligation or underlying securities comprising the referenced index. The difference between the value of the security received and the notional amount paid is recorded as a realized loss.
Changes in the value of a credit default swap during the fiscal period are recognized as a component of “Change in net unrealized appreciation (depreciation) of swaps,” and realized gains and losses are recognized as a component of “Net realized gain (loss) from swaps” on the Statement of Operations. Investments in swaps cleared through an exchange obligate a Fund and the clearing broker to settle monies on a daily basis representing changes in the prior days “mark-to-market” of the swap. If a Fund has unrealized appreciation the clearing broker would credit the Fund’s account with an amount equal to appreciation and conversely if a Fund has unrealized depreciation the clearing broker would debit a Fund’s account with an amount equal to depreciation. These daily cash settlements are also known as “variation margin.” Variation margin is recognized as a receivable and/or payable for “Variation margin on swap contracts” on the Statement of Assets and Liabilities. The maximum potential amount of future payments the Fund could incur as a buyer of protection in a credit default swap contract is limited to the notional amount of the contract. The maximum potential amount would be offset by the recovery value, if any, of the respective referenced entity.
During the fiscal year ended June 30, 2014, Global Total Return Bond, High Income Bond and Strategic Income invested in credit default swap contracts. Global Total Return Bond used credit default swaps as a way to take on credit risk and earn a commensurate credit spread. High Income Bond used CDX High Yield swaps to manage exposure to the High Yield segment of the market. For example, to increase the Fund’s credit exposure to the High Yield Bond segment of the market, a long CDX High Yield Index swap would be acquired. Strategic Income used CDX High Yield swaps to manage exposure to the High Yield segment of the market, at times adding exposure, and at times reducing exposure depending on market conditions at the time as part of the overall portfolio construction strategy.
Notes to Financial Statements (continued)
The average notional amount of credit default swap contracts outstanding during the fiscal year ended June 30, 2014, was as follows:
| | | | | | | | | | | | |
| | | Global Total
Return
Bond | | | High Income
Bond | | |
Strategic
Income | |
| Average notional amount of credit default swap contracts outstanding* | | $ | 200,000 | | | $ | 18,450,000 | | | $ | 11,300,000 | |
| * | The average notional amount is calculated based on the outstanding notional at the beginning of the fiscal year and at the end of each fiscal quarter within the current fiscal year. |
The following table presents the fair value of all swap contracts held by the Funds as of June 30, 2014, the location of these instruments on the Statement of Assets and Liabilities and the primary underlying risk exposure.
| | | | | | | | | | | | | | |
| | | | | Location on the Statement of Assets and Liabilities | |
| | | Derivative Instrument | | Asset Derivatives | | | (Liability) Derivatives | |
Underlying
Risk Exposure | | | Location | | Value | | | Location | | Value | |
| | | | | |
| Global Total Return Bond | | | | | | | | | | | | |
Interest rate | | Swaps | | Unrealized appreciation on interest rate swaps** | | $ | 26,937 | | | — | | $ | — | |
| | | | | |
| High Income Bond | | | | | | | | | | | | |
Credit | | Swaps | | Receivable for variation margin on swap contracts* | | $ | (301,627 | ) | | — | | $ | — | |
Interest rate | | Swaps | | Receivable for variation margin on swap contracts* | | | (269,555 | ) | | — | | | — | |
| Total | | | | | | $ | (571,182 | ) | | | | $ | — | |
| | | | | |
| Strategic Income | | | | | | | | | | | | |
Interest rate | | Swaps | | Receivable for variation margin on swap contracts | | $ | (987,688 | ) | | — | | $ | — | |
Interest rate | | Swaps | | Unrealized appreciation on interest rate swaps** | | | 337,834 | | | — | | | — | |
| Total | | | | | | $ | (649,854 | ) | | | | $ | — | |
| * | Value represents unrealized appreciation (depreciation) of swaps as reported in the Fund’s Portfolio of Investments and not the cash collateral at brokers, if any, the receivable or payable for variation margin on swap contracts or the premiums paid or received presented on the Statement of Assets and Liabilities. |
| ** | Some swap contracts require a counterparty to pay or receive a premium, which is disclosed on the Statement of Assets and Liabilities but is not reflected in the cumulative appreciation (depreciation) presented above. |
The following table presents the swap contacts, which are subject to netting agreements, and the collateral delivered related to those swap contracts as of June 30, 2014.
| | | | | | | | | | | | | | | | | | | | | | | | | | |
| Fund | | Counterparty | | Gross
Unrealized
Appreciation on
Interest Rate Swaps*** | | | Gross
Unrealized
(Depreciation) on
Interest Rate Swaps*** | | | Amounts
Netted on
Statement of
Assets and
Liabilities | | | Net Unrealized
Appreciation on
Interest Rate Swaps | | | Collateral
Pledged
to (from)
Counterparty | | | Net
Exposure | |
| Global Total Return Bond | | | | | | | | | | | | | | | | | | | | | | | | | | |
| Interest rate swaps | | JPMorgan | | $ | 4,330 | | | $ | — | | | $ | — | | | $ | 4,330 | | | $ | — | | | $ | 4,330 | |
| Interest rate swaps | | Morgan Stanley | | | 22,607 | | | | — | | | | — | | | | 22,607 | | | | — | | | | 22,607 | |
| Total | | | | $ | 26,937 | | | $ | — | | | $ | — | | | $ | 26,937 | | | $ | — | | | $ | 26,937 | |
| Strategic Income | | | | | | | | | | | | | | | | | | | | | | | | | | |
| Interest rate swaps | | JPMorgan | | $ | 337,834 | | | $ | — | | | $ | — | | | $ | 337,834 | | | $ | — | | | $ | 337,834 | |
| *** | Represents gross unrealized appreciation (depreciation) for the counterparty as reported in the Fund’s Portfolio of Investments. |
The following table presents the amount of net realized gain (loss) and change in net unrealized appreciation (depreciation) recognized on swap contracts on the Statement of Operations during the fiscal year ended June 30, 2014, and the primary underlying risk exposure.
| | | | | | | | | | | | |
| Fund | | Underlying
Risk Exposure | | Derivative
Instrument | | Net Realized
Gain (Loss) from
Swaps | | | Change in Net Unrealized
Appreciation (Depreciation) of
Swaps | |
Global Total Return Bond | | | | | | | | | | | | |
| | Credit | | Swaps | | $ | 99,286 | | | $ | 2,096 | |
| | | Interest rate | | Swaps | | | (18,694 | ) | | | (24,606 | ) |
Total | | | | | | $ | 80,592 | | | $ | (22,510 | ) |
| | | | | | | | | | | | |
| Fund | | Underlying
Risk Exposure | | Derivative
Instrument | | Net Realized
Gain (Loss) from
Swaps | | | Change in Net Unrealized
Appreciation (Depreciation) of
Swaps | |
High Income Bond | | | | | | | | | | | | |
| | Credit | | Swaps | | $ | (1,809,512 | ) | | $ | (301,627 | ) |
| | | Interest rate | | Swaps | | | (245,724 | ) | | | (269,555 | ) |
Total | | | | | | $ | (2,055,236 | ) | | $ | (571,182 | ) |
Strategic Income | | | | | | | | | | | | |
| | Credit | | Swaps | | $ | 624,216 | | | $ | 43,964 | |
| | | Interest rate | | Swaps | | | (703,793 | ) | | | (3,840,942 | ) |
Total | | | | | | $ | 1,328,009 | | | $ | (3,796,978 | ) |
Market and Counterparty Credit Risk
In the normal course of business each Fund may invest in financial instruments and enter into financial transactions where risk of potential loss exists due to changes in the market (market risk) or failure of the other party to the transaction to perform (counterparty credit risk). The potential loss could exceed the value of the financial assets recorded on the financial statements. Financial assets, which potentially expose each Fund to counterparty credit risk, consist principally of cash due from counterparties on forward, option and swap transactions, when applicable. The extent of each Fund’s exposure to counterparty credit risk in respect to these financial assets approximates their carrying value as recorded on the Statement of Assets and Liabilities.
Each Fund helps manage counterparty credit risk by entering into agreements only with counterparties the Adviser believes have the financial resources to honor their obligations and by having the Adviser monitor the financial stability of the counterparties. Additionally, counterparties may be required to pledge collateral daily (based on the daily valuation of the financial asset) on behalf of each Fund with a value approximately equal to the amount of any unrealized gain above a pre-determined threshold. Reciprocally, when each Fund has an unrealized loss, the Funds have instructed the custodian to pledge assets of the Funds as collateral with a value approximately equal to the amount of the unrealized loss above a pre-determined threshold. Collateral pledges are monitored and subsequently adjusted if and when the valuations fluctuate, either up or down, by at least the pre-determined threshold amount.
4. Fund Shares
Transactions in Fund shares were as follows:
| | | | | | | | | | | | | | | | |
| | | Global Total Return Bond | |
| | | Year Ended
6/30/14 | | | Year Ended
6/30/13 | |
| | | Shares | | | Amount | | | Shares | | | Amount | |
| Shares sold: | | | | | | | | | | | | | | | | |
Class A | | | 32,064 | | | $ | 647,508 | | | | 71,096 | | | $ | 1,561,936 | |
Class C | | | 2,561 | | | | 51,759 | | | | 5,331 | | | | 116,818 | |
Class R3 | | | — | | | | — | | | | 148 | | | | 3,261 | |
Class I | | | 135,898 | | | | 2,795,879 | | | | 119,175 | | | | 2,571,327 | |
| Shares issued to shareholders due to reinvestment of distributions: | | | | | | | | | | | | | | | | |
Class A | | | 2,747 | | | | 55,686 | | | | 2,257 | | | | 49,801 | |
Class C | | | 251 | | | | 5,092 | | | | 71 | | | | 1,558 | |
Class R3 | | | 7 | | | | 151 | | | | 2 | | | | 32 | |
Class I | | | 11,324 | | | | 229,930 | | | | 1,966 | | | | 43,308 | |
| | | | 184,852 | | | | 3,786,005 | | | | 200,046 | | | | 4,348,041 | |
| Shares redeemed: | | | | | | | | | | | | | | | | |
Class A | | | (19,617 | ) | | | (401,764 | ) | | | (37,459 | ) | | | (815,809 | ) |
Class C | | | (770 | ) | | | (15,455 | ) | | | (238 | ) | | | (5,218 | ) |
Class R3 | | | — | | | | — | | | | (220 | ) | | | (4,841 | ) |
Class I | | | (36,367 | ) | | | (756,919 | ) | | | (21,318 | ) | | | (469,349 | ) |
| | | | (56,754 | ) | | | (1,174,138 | ) | | | (59,235 | ) | | | (1,295,217 | ) |
| Net increase (decrease) | | | 128,098 | | | $ | 2,611,867 | | | | 140,811 | | | $ | 3,052,824 | |
Notes to Financial Statements (continued)
| | | | | | | | | | | | | | | | |
| | | High Income Bond | |
| | | Year Ended
6/30/14 | | | Year Ended
6/30/13 | |
| | | Shares | | | Amount | | | Shares | | | Amount | |
| Shares sold: | | | | | | | | | | | | | | | | |
Class A | | | 14,494,390 | | | $ | 132,162,411 | | | | 17,418,771 | | | $ | 157,891,772 | |
Class A – automatic conversion of Class B Shares | | | 88,915 | | | | 826,694 | | | | 8,387 | | | | 75,648 | |
Class B – exchanges | | | 3,885 | | | | 35,313 | | | | 5,697 | | | | 51,078 | |
Class C | | | 2,489,184 | | | | 22,649,986 | | | | 3,279,004 | | | | 29,712,726 | |
Class R3 | | | 79,740 | | | | 742,363 | | | | 91,522 | | | | 846,297 | |
Class I | | | 42,439,856 | | | | 387,747,238 | | | | 19,507,879 | | | | 177,393,855 | |
| Shares issued to shareholders due to reinvestment of distributions: | | | | | | | | | | | | | | | | |
Class A | | | 1,411,539 | | | | 12,846,739 | | | | 986,090 | | | | 8,982,586 | |
Class B | | | 10,090 | | | | 91,136 | | | | 11,378 | | | | 102,611 | |
Class C | | | 505,346 | | | | 4,585,469 | | | | 342,032 | | | | 3,104,612 | |
Class R3 | | | 6,442 | | | | 59,876 | | | | 3,201 | | | | 29,717 | |
Class I | | | 1,581,856 | | | | 14,426,551 | | | | 878,551 | | | | 7,995,708 | |
| | | | 63,111,243 | | | | 576,173,776 | | | | 42,532,512 | | | | 386,186,610 | |
| Shares redeemed: | | | | | | | | | | | | | | | | |
Class A | | | (9,096,635 | ) | | | (82,834,295 | ) | | | (13,374,803 | ) | | | (122,270,181 | ) |
Class B | | | (94,861 | ) | | | (863,612 | ) | | | (52,858 | ) | | | (477,921 | ) |
Class B – automatic conversion to Class A Shares | | | (89,394 | ) | | | (826,694 | ) | | | (8,431 | ) | | | (75,648 | ) |
Class C | | | (2,745,982 | ) | | | (24,972,705 | ) | | | (1,750,403 | ) | | | (15,927,665 | ) |
Class R3 | | | (46,274 | ) | | | (432,632 | ) | | | (88,527 | ) | | | (820,112 | ) |
Class I | | | (21,745,368 | ) | | | (198,782,863 | ) | | | (19,153,223 | ) | | | (175,193,826 | ) |
| | | | (33,818,514 | ) | | | (308,712,801 | ) | | | (34,428,245 | ) | | | (314,765,353 | ) |
| Net increase (decrease) | | | 29,292,729 | | | $ | 267,460,975 | | | | 8,104,267 | | | $ | 71,421,257 | |
| |
| | | Strategic Income | |
| | | Year Ended
6/30/14 | | | Year Ended
6/30/13 | |
| | | Shares | | | Amount | | | Shares | | | Amount | |
| Shares sold: | | | | | | | | | | | | | | | | |
Class A | | | 6,807,287 | | | $ | 77,145,009 | | | | 3,841,218 | | | $ | 43,625,656 | |
Class A – automatic conversion of Class B Shares | | | 76,185 | | | | 881,815 | | | | 7,544 | | | | 85,170 | |
Class B – exchanges | | | 5,178 | | | | 56,981 | | | | 15,433 | | | | 174,717 | |
Class C | | | 1,865,289 | | | | 20,993,661 | | | | 956,179 | | | | 10,853,256 | |
Class R3 | | | 313,904 | | | | 3,562,838 | | | | 151,296 | | | | 1,733,433 | |
Class I | | | 19,152,870 | | | | 216,141,983 | | | | 9,103,062 | | | | 103,952,219 | |
| Shares issued to shareholders due to reinvestment of distributions: | | | | | | | | | | | | | | | | |
Class A | | | 323,227 | | | | 3,647,943 | | | | 207,145 | | | | 2,356,102 | |
Class B | | | 3,772 | | | | 42,022 | | | | 5,430 | | | | 61,397 | |
Class C | | | 107,640 | | | | 1,205,845 | | | | 83,134 | | | | 939,722 | |
Class R3 | | | 14,015 | | | | 158,616 | | | | 8,750 | | | | 99,942 | |
Class I | | | 637,344 | | | | 7,177,964 | | | | 539,446 | | | | 6,134,175 | |
| | | | 29,306,711 | | | | 331,014,677 | | | | 14,918,637 | | | | 170,015,789 | |
| Shares redeemed: | | | | | | | | | | | | | | | | |
Class A | | | (2,719,218 | ) | | | (30,498,573 | ) | | | (2,364,331 | ) | | | (26,682,577 | ) |
Class B | | | (68,173 | ) | | | (760,354 | ) | | | (76,824 | ) | | | (869,450 | ) |
Class B – automatic conversion to Class A Shares | | | (76,583 | ) | | | (881,815 | ) | | | (7,581 | ) | | | (85,170 | ) |
Class C | | | (988,539 | ) | | | (10,984,313 | ) | | | (715,688 | ) | | | (8,066,326 | ) |
Class R3 | | | (135,481 | ) | | | (1,526,676 | ) | | | (70,285 | ) | | | (797,920 | ) |
Class I | | | (13,947,269 | ) | | | (156,077,240 | ) | | | (12,041,978 | ) | | | (136,432,499 | ) |
| | | | (17,935,263 | ) | | | (200,728,971 | ) | | | (15,276,687 | ) | | | (172,933,942 | ) |
| Net increase (decrease) | | | 11,371,448 | | | $ | 130,285,706 | | | | (358,050 | ) | | $ | (2,918,153 | ) |
| | | | | | | | |
| |
| | | U.S. Infrastructure Income | |
| | | For the period 5/12/14
(commencement of operations)
through 6/30/14 | |
| | | Shares | | | Amount | |
| Shares sold: | | | | | | | | |
Class A | | | 2,500 | | | $ | 50,000 | |
Class C | | | 2,500 | | | | 50,000 | |
Class I | | | 345,025 | | | | 6,900,500 | |
| Shares issued to shareholders due to reinvestment of distributions: | | | | | | | | |
Class A | | | — | | | | — | |
Class C | | | — | | | | — | |
Class I | | | — | | | | — | |
| | | | 350,025 | | | | 7,000,500 | |
| Shares redeemed: | | | | | | | | |
Class A | | | — | | | | — | |
Class C | | | — | | | | — | |
Class I | | | (25 | ) | | | (504 | ) |
| | | | (25 | ) | | | (504 | ) |
| Net increase (decrease) | | | 350,000 | | | $ | 6,999,996 | |
5. Investment Transactions
Long-term purchases and sales (including maturities but excluding investments purchased with collateral from securities lending and derivative transactions) during the fiscal year ended June 30, 2014, were as follows:
| | | | | | | | | | | | | | | | |
| | | Global
Total Return
Bond | | | High Income
Bond | | | Strategic
Income | | | U.S. Infrastructure
Income | |
| Purchases: | | | | | | | | | | | | | | | | |
Investment securities | | $ | 11,839,327 | | | $ | 918,144,954 | | | $ | 442,288,479 | | | $ | 7,214,169 | |
U.S. Government and agency obligations | | | 11,359,637 | | | | — | | | | 14,410,517 | | | | — | |
| Sales and maturities: | | | | | | | | | | | | | | | | |
Investment securities | | $ | 8,661,093 | | | $ | 691,036,258 | | | $ | 313,627,423 | | | $ | 306,360 | |
U.S. Government and agency obligations | | | 12,043,224 | | | | 1,000,000 | | | | 6,377,327 | | | | — | |
6. Income Tax Information
Each Fund is a separate taxpayer for federal income tax purposes. Each Fund intends to distribute substantially all of its net investment income and net capital gains to shareholders and to otherwise comply with the requirements of Subchapter M of the Internal Revenue Code applicable to regulated investment companies. Therefore, no federal income tax provision is required.
For all open tax years and all major taxing jurisdictions, management of the Funds has concluded that there are no significant uncertain tax positions that would require recognition in the financial statements. Open tax years are those that are open for examination by taxing authorities (i.e., generally the last four tax year ends and the interim tax period since then). Furthermore, management of the Funds is also not aware of any tax positions for which it is reasonably possible that the total amounts of unrecognized tax benefits will significantly change in the next twelve months.
The following information is presented on an income tax basis. Differences between amounts for financial statement and federal income tax purposes are primarily due to timing differences in recognizing certain gains and losses on investment transactions. To the extent that differences arise that are permanent in nature, such amounts are reclassified within the capital accounts as detailed below. Temporary differences do not require reclassification. Temporary and permanent differences do not impact the NAVs of the Funds.
Notes to Financial Statements (continued)
As of June 30, 2014, the cost and unrealized appreciation (depreciation) of investments (excluding investments in derivatives), as determined on a federal income tax basis, were as follows:
| | | | | | | | | | | | | | | | |
| | | Global
Total Return
Bond | | | High Income
Bond | | | Strategic
Income | | | U.S. Infrastructure
Income | |
| Cost of investments | | $ | 21,313,959 | | | $ | 1,155,164,261 | | | $ | 850,554,911 | | | $ | 6,909,252 | |
| Gross unrealized: | | | | | | | | | | | | | | | | |
Appreciation | | $ | 783,008 | | | $ | 41,831,885 | | | $ | 38,964,555 | | | $ | 121,338 | |
Depreciation | | | (516,138 | ) | | | (10,136,214 | ) | | | (7,118,643 | ) | | | (6,212 | ) |
| Net unrealized appreciation (depreciation) of investments | | $ | 266,870 | | | $ | 31,695,671 | | | $ | 31,845,912 | | | $ | 115,126 | |
Permanent differences, primarily due to federal taxes paid, treatment of notional principal contracts, nondeductible stock issuance costs, securities litigation settlements, distribution reallocation, adjustments for investments in real estate investment trusts, investments in partnerships and foreign currency transactions resulted in reclassifications among the Funds’ components of net assets as of June 30, 2014, the Funds’ tax year end, as follows:
| | | | | | | | | | | | | | | | |
| | | Global
Total Return
Bond | | | High Income
Bond | | | Strategic
Income | | | U.S. Infrastructure
Income | |
| Capital paid-in | | $ | (11,559 | ) | | $ | 214,594 | | | $ | — | | | $ | (86 | ) |
| Undistributed (Over-distribution of) net investment income | | | (339,428 | ) | | | (409,464 | ) | | | (3,460,423 | ) | | | 135 | |
| Accumulated net realized gain (loss) | | | 350,987 | | | | 194,870 | | | | 3,460,423 | | | | (49 | ) |
The tax components of undistributed net ordinary income and net long-term capital gains as of June 30, 2014, the Funds’ tax year end, were as follows:
| | | | | | | | | | | | | | | | |
| | | Global
Total Return
Bond | | | High Income
Bond | | | Strategic
Income | | | U.S. Infrastructure
Income | |
| Undistributed net ordinary income1 | | $ | 617,256 | | | $ | 1,517,068 | | | $ | 14,226,528 | | | $ | 36,802 | |
| Undistributed net long-term capital gains | | | 156,028 | | | | 5,587,568 | | | | — | | | | — | |
| 1 | Undistributed net ordinary income (on a tax basis) has not been reduced for the dividend declared during the period June 1, 2014 through June 30, 2014 and paid on July 1, 2014. Net ordinary income consists of net taxable income derived from dividends, interest and net short-term capital gains, if any. |
The tax character of distributions paid during the Funds’ tax years ended June 30, 2014 and June 30, 2013, was designated for purposes of the dividends paid deduction as follows:
| | | | | | | | | | | | | | | | |
| 2014 | | Global
Total Return
Bond | | | High Income
Bond | | | Strategic
Income | | | U.S. Infrastructure
Income | |
| Distributions from net ordinary income2 | | $ | 914,394 | | | $ | 66,420,739 | | | $ | 32,566,945 | | | $ | — | |
| Distributions from net long-term capital gains3 | | | 109,476 | | | | 6,948,022 | | | | — | | | | — | |
| | | | | | | | | | | | | | | | |
| 2013 | | Global
Total Return
Bond | | | High Income
Bond | | | Strategic
Income | | | U.S. Infrastructure
Income | |
| Distributions from net ordinary income2 | | $ | 944,239 | | | $ | 54,643,445 | | | $ | 28,538,703 | | | | N/A | |
| Distributions from net long-term capital gains | | | 50,774 | | | | — | | | | — | | | | N/A | |
| 2 | Net ordinary income consists of net taxable income derived from dividends, interest and net short-term capital gains, if any. |
| 3 | The Funds hereby designates as long-term capital gain dividend, pursuant to the Internal Revenue Code Section 852(b)(3), the amount necessary to reduce earnings and profits of the Funds related to net capital gain to zero for the tax year ended June 30, 2014. |
As of June 30, 2014, the Funds’ tax year end, the following Funds had unused capital loss carryforwards available for federal income tax purposes to be applied against future capital gains, if any. If not applied, the carryforwards will expire as shown in the following table. The losses not subject to expiration will be utilized first by a Fund.
| | | | | | | | |
| | | Strategic
Income | | | U.S. Infrastructure
Income | |
| Expiration June 30, 2018 | | $ | 35,110,019 | | | $ | — | |
| Not subject to expiration | | | — | | | | 14,741 | |
| Total | | $ | 35,110,019 | | | $ | 14,741 | |
During the Funds’ tax year ended June 30, 2014, the following Fund utilized its capital loss carryforwards as follows:
| | | | |
| | | Strategic
Income | |
| Utilized capital loss carryforwards | | $ | 7,537,565 | |
7. Management Fees and Other Transactions with Affiliates
Each Fund’s management fee compensates the Adviser for overall investment advisory and administrative services and general office facilities. The Sub-Adviser is compensated for its services to the Funds from the management fees paid to the Adviser.
Each Fund’s management fee consists of two components – a fund-level fee, based only on the amount of assets within each individual Fund, and a complex-level fee, based on the aggregate amount of all eligible fund assets managed by the Adviser. This pricing structure enables each Fund’s shareholders to benefit from growth in the assets within their respective Fund as well as from growth in the amount of complex-wide assets managed by the Adviser.
The annual fund-level fee for each Fund, payable monthly, is calculated according to the following schedule:
| | | | | | | | | | | | | | | | |
| Average Daily Net Assets | | Global Total
Return Bond
Fund-Level
Fee Rate | | | High Income
Bond
Fund-Level
Fee Rate | | | Strategic
Income
Fund-Level
Fee Rate | | | U.S. Infrastructure
Income
Fund-Level
Fee Rate | |
| For the first $125 million | | | .4000 | % | | | .4000 | % | | | .3600 | % | | | .4500 | % |
| For the next $125 million | | | .3875 | | | | .3875 | | | | .3475 | | | | .4375 | |
| For the next $250 million | | | .3750 | | | | .3750 | | | | .3350 | | | | .4250 | |
| For the next $500 million | | | .3625 | | | | .3625 | | | | .3225 | | | | .4125 | |
| For the next $1 billion | | | .3500 | | | | .3500 | | | | .3100 | | | | .4000 | |
| For net assets over $2 billion | | | .3250 | | | | .3250 | | | | .2850 | | | | .3875 | |
The annual complex-level fee for each Fund, payable monthly, is determined by taking the complex-level fee rate, which is based on the aggregate amount of “eligible assets” of all Nuveen funds as set forth in the schedule below, and for High Income Bond and Strategic Income, making, as appropriate, an upward adjustment to that rate based upon the percentage of the particular fund’s assets that are not “eligible assets.” The complex-level fee schedule for each Fund is as follows:
| | | | |
| Complex-Level Asset Breakpoint Level* | | Effective Rate at Breakpoint Level | |
| $55 billion | | | .2000 | % |
| $56 billion | | | .1996 | |
| $57 billion | | | .1989 | |
| $60 billion | | | .1961 | |
| $63 billion | | | .1931 | |
| $66 billion | | | .1900 | |
| $71 billion | | | .1851 | |
| $76 billion | | | .1806 | |
| $80 billion | | | .1773 | |
| $91 billion | | | .1691 | |
| $125 billion | | | .1599 | |
| $200 billion | | | .1505 | |
| $250 billion | | | .1469 | |
| $300 billion | | | .1445 | |
| * | The complex-level fee is calculated based upon the aggregate daily “eligible assets” of all Nuveen funds. Eligible assets do not include assets attributable to investments in other Nuveen funds or assets in excess of $2 billion added to the Nuveen fund complex in connection with the Adviser’s assumption of the management of the former First American Funds effective January 1, 2011. Eligible assets include closed-end fund assets managed by the Adviser that are attributable to certain types of leverage. For these purposes, leverage includes the closed-end funds’ use of preferred stock and borrowings and investments in the residual interest certificates (also called inverse floating rate securities) in tender option bond (TOB) trusts, including the portion of assets held by the TOB trust that has been effectively financed by the trust’s issuance of floating rate securities, subject to an agreement by the Adviser as to certain funds to limit the amount of such assets for determining eligible assets in certain circumstances. As of June 30, 2014, the complex-level fee rate for each Fund was as follows: |
Notes to Financial Statements (continued)
| | | | |
| Fund | | Complex-Level
Fee Rate | |
| Global Total Return Bond | | | .1653 | % |
| High Income Bond | | | .1803 | |
| Strategic Income | | | .1916 | |
| U.S. Infrastructure Income | | | .1653 | |
The Adviser has agreed to waive fees and/or reimburse expenses through October 31, 2014, so that total annual Fund operating expenses (excluding 12b-1 distribution and/or service fees, interest expenses, taxes, acquired fund fees and expenses, fees incurred in acquiring and disposing of portfolio securities and extraordinary expenses) for Global Total Return Bond do not exceed ..75% of the average daily net assets of any class of Fund shares.
The Adviser has contractually agreed to waive fees and/or reimburse expenses through October 31, 2014, so that total annual Fund operating expenses, (excluding acquired fund fees and expenses) for Strategic Income do not exceed .84%, 1.59%, 1.09% and .59% for Classes A, C, R3 and I, respectively.
The Adviser has agreed to waive fees and/or reimburse expenses through October 31, 2017, so that total annual Fund operating expenses (excluding 12b-1 distribution and/or service fees, interest expenses, taxes, acquired fund fees and expenses, fees incurred in acquiring and disposing of portfolio securities and extraordinary expenses) for U.S. Infrastructure Income do not exceed .74% of the average daily net assets of any class of Fund shares.
Neither Trust pays compensation directly to those of its directors/trustees who are affiliated with the Adviser or to its officers, all of whom receive remuneration for their services to each Trust from the Adviser or its affiliates. The Board of Directors/Trustees has adopted a deferred compensation plan for independent directors/trustees that enable directors/trustees to elect to defer receipt of all or a portion of the annual compensation they are entitled to receive from certain Nuveen-advised funds. Under the plan, deferred amounts are treated as though equal dollar amounts had been invested in shares of select Nuveen-advised funds.
During the fiscal year ended June 30, 2014, Nuveen Securities, LLC. (the “Distributor”), a wholly-owned subsidiary of Nuveen, collected sales charges on purchases of Class A Shares, the majority of which were paid out as concessions to financial intermediaries as follows:
| | | | | | | | | | | | | | | | |
| | | Global
Total Return
Bond | | | High Income
Bond | | | Strategic
Income | | | U.S. Infrastructure
Income | |
| Sales charges collected (Unaudited) | | $ | 7,794 | | | $ | 584,788 | | | $ | 260,559 | | | $ | — | |
| Paid to financial intermediaries (Unaudited) | | | 7,248 | | | | 528,607 | | | | 236,831 | | | | — | |
The Distributor also received 12b-1 service fees on Class A Shares, substantially all of which were paid to compensate financial intermediaries for providing services to shareholders relating to their investments.
During the fiscal year ended June 30, 2014, the Distributor compensated financial intermediaries directly with commission advances at the time of purchase as follows:
| | | | | | | | | | | | | | | | |
| | | Global
Total Return
Bond | | | High Income
Bond | | | Strategic
Income | | | U.S. Infrastructure
Income | |
| Commission advances (Unaudited) | | $ | 3,139 | | | $ | 259,959 | | | $ | 233,119 | | | $ | — | |
To compensate for commissions advanced to financial intermediaries, all 12b-1 service and distribution fees collected on Class B Shares and Class C Shares during the first year following a purchase are retained by the Distributor. During the fiscal year ended June 30, 2014, the Distributor retained such 12b-1 fees as follows:
| | | | | | | | | | | | | | | | |
| | | Global
Total Return
Bond | | | High Income
Bond | | | Strategic
Income | | | U.S. Infrastructure
Income | |
| 12b-1 fees retained (Unaudited) | | $ | 1,008 | | | $ | 185,696 | | | $ | 103,232 | | | $ | 69 | |
The remaining 12b-1 fees charged to the Funds were paid to compensate financial intermediaries for providing services to shareholders relating to their investments.
The Distributor also collected and retained CDSC on share redemptions during the fiscal year ended June 30, 2014, as follows:
| | | | | | | | | | | | | | | | |
| | | Global
Total Return
Bond | | | High Income
Bond | | | Strategic
Income | | | U.S. Infrastructure
Income | |
| CDSC retained (Unaudited) | | $ | — | | | $ | 21,632 | | | $ | 44,797 | | | $
| —
|
|
As of June 30, 2014, Nuveen owned shares of the Funds as follows:
| | | | | | | | |
| | | Global
Total Return
Bond | | | U.S. Infrastructure
Income | |
| Class A | | | — | | | | 2,500 | |
| Class C | | | 2,280 | | | | 2,500 | |
| Class R3 | | | 2,280 | | | | — | |
| Class I | | | 676,175 | | | | 345,000 | |
8. New Accounting Pronouncement
Financial Accounting Standards Board (“FASB”) Financial Services—Investment Companies (Topic 946): Amendments to the Scope, Measurement, and Disclosure Requirements
During 2013, the FASB issued Accounting Standards Update (“ASU”) 2013-08, “Financial Services— Investment Companies (Topic 946): Amendments to the Scope, Measurement, and Disclosure Requirements,” which amends the criteria that define an investment company and clarifies the measurement guidance and requires new disclosures for investment companies. ASU 2013-08 is effective for fiscal years beginning on or after December 15, 2013. Management has evaluated the implications of ASU 2013-08 and determined that each Fund’s current disclosures already followed this guidance and therefore it does not have an impact on the Fund’s financial statements or footnote disclosures.
9. Subsequent Event
As previously described in Note 1- General Information and Significant Accounting Policies, Agreement and Plan of Merger, the new investment management agreements and the new sub-advisory agreements have been approved by shareholders of the Funds.
The transaction is currently expected to close early in the fourth quarter of 2014, but remains subject to customary closing conditions.
Additional
Fund Information
| | | | | | | | | | |
| | | | | |
| | Fund Manager Nuveen Fund Advisors, LLC 333 West Wacker Drive Chicago, IL 60606 Sub-Adviser Nuveen Asset Management, LLC 333 West Wacker Drive Chicago, IL 60606 Legal Counsel Chapman and Cutler LLP Chicago, IL 60603 | | Independent Registered
Public Accounting Firm PricewaterhouseCoopers LLP Chicago, IL 60606 Custodian State Street Bank & Trust
Company Boston, MA 02111 U.S. Bank National
Association Milwaukee, WI 53202 | | Transfer Agent and
Shareholder Services Boston Financial
Data Services Nuveen Investor Services P.O. Box 8530 Bostoxn, MA 02266-8530 (800) 257-8787 | | | | |
| | | | | | | | | | | | | | |
| | | | | |
| | | | | | | | | | |
| | |
| | Distribution Information: The following Funds hereby designate their percentages of dividends paid from net ordinary income as dividends qualifying for the 70% dividends received deduction (“DRD”) for corporations and their percentages as qualified dividend income (“QDI”) for individuals under Section 1(h)(11) of the Internal Revenue Code as shown in the accompanying table. The actual qualified dividend income distributions will be reported to shareholders on Form 1099-DIV which will be sent to shareholders shortly after calendar year end. | | |
| | | | | | | |
| | | Fund | | | | | | | | % of DRD | | % of QDI | | |
| | High Income Bond | | 1.00% | | 2.00% | | |
| | Strategic Income | | 2.00% | | 2.00% | | |
| | | | | |
| | | | | | | | | | |
| | |
| | Quarterly Form N-Q Portfolio of Investments Information: Each Fund is required to file its complete schedule of portfolio holdings with the Securities and Exchange Commission (SEC) for the first and third quarters of each fiscal year on Form N-Q. You may obtain this information directly from the SEC. Visit the SEC on-line at http://www.sec.gov or in person at the SEC’s Public Reference Room in Washington, D.C. Call the SEC toll-free at (800) SEC-0330 for room hours and operation. | | |
| | | |
| | | | | | |
| | |
| | Nuveen Funds’ Proxy Voting Information: You may obtain (i) information regarding how each fund voted proxies relating to portfolio securities held during the most recent twelve-month period ended June 30, without charge, upon request, by calling Nuveen Investments toll-free at (800) 257-8787 or on Nuveen’s website at www.nuveen.com and (ii) a description of the policies and procedures that each fund used to determine how to vote proxies relating to portfolio securities without charge, upon request, by calling Nuveen Investments toll-free at (800) 257-8787. You may also obtain this information directly from the SEC. Visit the SEC on-line at http://www.sec.gov. | | |
| | | |
| | | | | | |
| | |
| | FINRA BrokerCheck: The Financial Industry Regulatory Authority (FINRA) provides information regarding the disciplinary history of FINRA member firms and associated investment professionals. This information as well as an investor brochure describing FINRA BrokerCheck is available to the public by calling the FINRA BrokerCheck Hotline number at (800) 289-9999 or by visiting www.FINRA.org. | | |
Glossary of Terms
Used in this Report
Asset-Backed Securities (ABS): Securities whose value and income payments are derived from and collateralized by a specific pool of underlying assets. The pool of assets typically is a group of small and/or illiquid assets that may be difficult to sell individually. The underlying pools of asset-backed securities often include payments from credit cards, auto loans or mortgage loans.
Average Annual Total Return: This is a commonly used method to express an investment’s performance over a particular, usually multi-year time period. It expresses the return that would have been necessary each year to equal the investment’s actual cumulative performance (including change in NAV or offer price and reinvested dividends and capital gains distributions, if any) over the time period being considered.
BofA/Merrill Lynch Fixed Rate Preferred Securities Index: An index that tracks the performance of fixed rate U.S. dollar denominated preferred securities issued in the U.S. domestic market. Qualifying securities must be rated investment grade (based on an average of Moody’s, S&P, and Fitch) and must have an investment grade rated country of risk (based on an average of Moody’s, S&P, and Fitch foreign currency long-term sovereign debt ratings). In addition, qualifying securities must be issued as public securities or through a 144a filing, must be issued in $25, $50, or $100 par/ liquidation preference increments, must have a fixed coupon or distribution schedule, and must have a minimum amount outstanding of $100 million. Index returns account for the effects of management fees and assume reinvestment of distributions, but do not reflect any applicable sales charges.
Barclays Aggregate Bond Index: An unmanaged index that includes all investment-grade, publicly issued, fixed-rate, dollar denominated, nonconvertible debt issues and commercial mortgage-backed securities with maturities of at least one year and outstanding par values of $150 million or more. Index returns assume reinvestment of distributions, but do not include the effects of any applicable sales charges or management fees.
Barclays Emerging Markets Index: An unmanaged index that tracks total returns for external-currency-denominated debt instruments of the emerging markets. Index returns assume reinvestment of distributions, but do not reflect any applicable sales charges or management fees.
Barclays Global Aggregate Unhedged Bond Index: An index that provides a broad-based measure of the global investment grade fixed-rate debt markets. Index returns assume reinvestment of distributions, but do not include the effects of any applicable sales charges or management fees.
Barclays High Yield 2% Issuer Capped Index: An issuer-constrained version of the U.S. Corporate High-Yield Index that covers the U.S. dollar denominated, non-investment grade, fixed-rate, taxable corporate bond market. Index returns assume reinvestment of distributions, but do not include the effects of any applicable sales charges or management fees.
Barclays Pan-European High Yield Index: An unmanaged index that measures the market of non-investment grade, fixed-rate corporate bonds denominated in the following currencies: euro, Pounds sterling, Norwegian krone, Swedish krona, and Swiss franc. Securities are classified as high yield if the middle rating of Moody’s, Fitch, and S&P is Ba1/BB+/BB+ or below. Inclusion is based on the currency of issue, and not the domicile of the issuer. The index excludes emerging market debt. Index returns account for the effects of management fees and assume reinvestment of distributions, but do not reflect any applicable sales charges.
Barclays Taxable Municipal Aggregate Eligible Index: A rules based, market-value weighted index engineered for the long-term taxable bond market. To be included in the index, the bonds must meet the eligibility requirements of the U.S. Aggregate Index. Index returns assume reinvestment of distributions, but do not reflect any applicable sales charges or management fees.
Barclays U.S. Corporate Investment Grade Index: A broad-based benchmark that measures the investment grade, fixed-rate, taxable corporate bond market. Index returns assume reinvestment of distributions, but do not reflect anyapplicable sales charges or management fees.
Glossary of Terms Used in this Report (continued)
Commercial Mortgage-Backed Securities (CMBS): Commercial mortgage-backed securities are backed by cash flows of a mortgage or pool of mortgages on commercial real estate. CMBS generally are structured to provide protection to the senior class investors against potential losses on the underlying mortgage loans. CMBS are typically characterized by the following: i) loans on multi-family housing, non-residential property, ii) payments based on the amortization schedule of 25-30 years with a balloon payment due usually after 10 years, and iii) restrictions on prepayments.
Duration: Duration is a measure of the expected period over which a bond’s principal and interest will be paid, and consequently is a measure of the sensitivity of a bond’s or bond fund’s value to changes when market interest rates change. Generally, the longer a bond’s or fund’s duration, the more the price of the bond or fund will change as interest rates change.
Lipper General & Insured Municipal Debt Funds Classification Average: Represents the average annualized total return for all reporting funds in the Lipper General & Insured Municipal Debt Funds Classification. Lipper returns account for the effects of management fees and assume reinvestment of distributions, but do not reflect any applicable sales charges.
Lipper Global Income Funds Classification Average: Represents the average annualized returns for all reporting funds in the Lipper Global Income Funds Classification. Lipper returns account for the effects of management fees and assume reinvestment of distributions, but do not reflect any applicable sales charge.
Lipper High Current Yield Funds Classification Average: Represents the average annualized returns for all reporting funds in the Lipper High Current Yield Funds Classification. Lipper returns account for the effects of management fees and assume reinvestment of dividends, but do not reflect any applicable sales charge.
Lipper Multi-Sector Income Funds Classification Average: Represents the average annualized returns for all reporting funds in the Lipper Multi-Sector Income Funds Classification. Lipper returns account for the effects of management fees and assume reinvestment of distributions, but do not reflect any applicable sales charge.
Mortgage-Backed Securities (MBS): Mortgage-backed securities (MBS) are bonds backed by pools of mortgages, usually with similar characteristics, and which return principal and interest in each payment. MBS are composed of residential mortgages (RMBS) or commercial mortgages (CMBS). RMBS are further divided into agency RMBS and non-agency RMBS, depending on the issuer.
Net Asset Value (NAV) Per Share: A fund’s Net Assets is equal to its total assets (securities, cash and accrued earnings) less its total liabilities. For funds with multiple classes, Net Assets are determined separately for each share class. NAV per share is equal to the fund’s (or share class’) Net Assets divided by its number of shares outstanding.
Residential Mortgage-Backed Securities (RMBS): Residential mortgage-backed securities are securities the payments on which depend primarily on the cash flow from residential mortgage loans made to borrowers that are secured by residential real estate. RMBS consist of agency and non-agency RMBS. Agency RMBS have agency guarantees that assure investors that they will receive timely payment of interest and principal, regardless of delinquency or default rates on the underlying loans. Agency RMBS include securities issued by the Government National Mortgage Association, the Federal National Mortgage Association and the Federal Home Loan Mortgage Corporation, and other federal agencies, or issues guaranteed by them. Non-agency RMBS do not have agency guarantees. Non-agency RMBS have credit enhancement built into the structure to shield investors from borrower delinquencies. The spectrum of non-agency residential mortgage loans includes traditional jumbo loans (prime), alternative-A loans (Alt-A), and home equity loans (sub-prime).
Tax Equalization: The practice of treating a portion of the distribution made to a redeeming shareholder, which represents his proportionate part of undistributed net investment income and capital gain as a distribution for tax purposes. Such amounts are referred to as the equalization debits (or payments) and will be considered a distribution to the shareholder of net investment income and capital gain for calculation of the Fund’s dividends paid deduction.
Annual Investment Management Agreement
Approval Process (Unaudited)
I.
The Approval Process
The Board of Trustees or Directors (as the case may be) of each Fund (each, a “Board” and each Trustee or Director, a “Board Member”), including the Board Members who are not parties to the Funds’ advisory or sub-advisory agreements or “interested persons” of any such parties (the “Independent Board Members”), is responsible for overseeing the performance of the investment adviser and the sub-adviser to the respective Fund and determining whether to approve or continue such Fund’s advisory agreement (each, an “Original Investment Management Agreement”) between the Fund and Nuveen Fund Advisors, LLC (the “Adviser”) and sub-advisory agreement (each, an “Original Sub-Advisory Agreement” and, together with the Original Investment Management Agreement, the “Original Advisory Agreements”) between the Adviser and Nuveen Asset Management, LLC (the “Sub-Adviser”). Pursuant to the Investment Company Act of 1940, as amended (the “1940 Act”), after an initial term of up to two years, each Board is required to consider the continuation of the respective Original Advisory Agreements on an annual basis. In addition, prior to its annual review, the Board Members were advised of the potential acquisition of Nuveen Investments, Inc. (“Nuveen”) by TIAA-CREF (the “Transaction”). For purposes of this section, references to “Nuveen” herein include all affiliates of Nuveen Investments, Inc. providing advisory, sub-advisory, distribution or other services to the Funds and references to the “Board” refer to the Board of each Fund. In accordance with the 1940 Act and the terms of the Original Advisory Agreements, the completion of the Transaction would terminate each of the Original Investment Management Agreements and the Original Sub-Advisory Agreements. Accordingly, at an in-person meeting held on April 30, 2014 (the “April Meeting”), the Board, including all of the Independent Board Members, performed its annual review of the Original Advisory Agreements and approved the continuation of the Original Advisory Agreements for all of the Funds except for the Nuveen U.S. Infrastructure Income Fund (the “Infrastructure Income Fund”), which is new. The Board therefore also approved the initial Original Advisory Agreements on behalf of the Infrastructure Income Fund at the April Meeting. Furthermore, in anticipation of the termination of the Original Advisory Agreements that would occur upon the consummation of the Transaction, the Board also approved for each Fund a new advisory agreement (each, a “New Investment Management Agreement”) between the Fund and the Adviser and a new sub-advisory agreement (each, a “New Sub-Advisory Agreement” and, together with the New Investment Management Agreement, the “New Advisory Agreements”) between the Adviser and the Sub-Adviser, each on behalf of the respective Fund to be effective following the completion of the Transaction and the receipt of the requisite shareholder approval.
For the remainder of this Part I and for Part II, the term “Funds” will refer to the Nuveen Global Total Return Bond Fund (the “Total Return Fund”), the Nuveen High Income Bond Fund (the “High Income Fund”) and the Nuveen Strategic Income Fund (the “Strategic Income Fund”). With respect to the Infrastructure Income Fund, Part III below includes a discussion of the Board’s approval of the Original Advisory Agreements and New Advisory Agreements for such Fund.
Leading up to the April Meeting, the Independent Board Members had several meetings and deliberations, with and without management from Nuveen present and with the advice of legal counsel, regarding the Original Advisory Agreements, the Transaction and its impact and the New Advisory Agreements. At its meeting held on February 25-27, 2014 (the “February Meeting”), the Board Members met with a senior executive representative of TIAA-CREF to discuss the proposed Transaction. At the February Meeting, the Independent Board Members also established an ad hoc committee comprised solely of the Independent Board Members to monitor and evaluate the Transaction and to keep the Independent Board Members updated with developments regarding the Transaction. On March 20, 2014, the ad hoc committee met telephonically to discuss with management of Nuveen, and separately with independent legal counsel, the terms of the proposed Transaction and its impact on, among other things: the governance structure of Nuveen; the strategic plans for Nuveen; the operations of the Nuveen funds (which include the Funds); the quality or level of services provided to the Nuveen funds; key personnel that service the Nuveen funds and/or the Board and the compensation or incentive arrangements to retain such personnel; Nuveen’s capital structure; the regulatory requirements applicable to Nuveen or fund operations; and the Nuveen funds’ fees and expenses, including the funds’ complex-wide fee arrangement. Following the meeting of the ad hoc committee, the Board met in person (two Independent Board Members participating telephonically) in an executive session on March 26, 2014 to further discuss the proposed Transaction. At the executive session, the Board met privately with independent legal counsel to review its duties with respect to reviewing advisory agreements, particularly in the context of a change of control, and to evaluate further the Transaction and its impact on the Nuveen funds, the Adviser and the Sub-Adviser (collectively, the “Fund Advisers” and each, a “Fund Adviser”) and the services provided. Representatives of Nuveen also met with the Board to update the Board Members on developments regarding the Transaction, to respond to questions and to discuss, among other things: the governance of the Fund Advisers following the Transaction; the background, culture (including with respect to regulatory and compliance matters) and resources of TIAA-CREF; the general plans and intentions of TIAA-CREF for Nuveen; the terms and conditions of the Transaction (including financing terms); any benefits or detriments the Transaction may impose on the Nuveen funds, TIAA-CREF or the Fund Advisers; the reaction from the Fund Advisers’ employees knowledgeable of the Transaction; the incentive and retention plans for key personnel of the Fund Advisers; the potential access to additional distribution platforms and economies of scale; and the impact of any additional regulatory schemes that may be
Annual Investment Management Agreement Approval Process (Unaudited) (continued)
applicable to the Nuveen funds given the banking and insurance businesses operated in the TIAA-CREF enterprise. As part of its review, the Board also held a separate meeting on April 15-16, 2014 to review the Nuveen funds’ investment performance and consider an analysis provided by the Adviser of each sub-adviser of the Nuveen funds (including the Sub-Adviser) and the Transaction and its implications to the Nuveen funds. During their review of the materials and discussions, the Independent Board Members presented the Adviser with questions and the Adviser responded. Further, the Independent Board Members met in an executive session with independent legal counsel on April 29, 2014 and April 30, 2014.
In connection with their review of the Original Advisory Agreements and the New Advisory Agreements, the Independent Board Members received extensive information regarding the Funds and the Fund Advisers including, among other things: the nature, extent and quality of services provided by each Fund Adviser; the organization and operations of any Fund Adviser; the expertise and background of relevant personnel of each Fund Adviser; a review of each Fund’s performance (including performance comparisons against the performance of peer groups and appropriate benchmarks); a comparison of Fund fees and expenses relative to peers; a description and assessment of shareholder service levels for the Funds; a summary of the performance of certain service providers; a review of fund initiatives and shareholder communications; and an analysis of the Adviser’s profitability with comparisons to peers in the managed fund business. In light of the proposed Transaction, the Independent Board Members, through their independent legal counsel, also requested in writing and received additional information regarding the proposed Transaction and its impact on the provision of services by the Fund Advisers.
The Independent Board Members received, well in advance of the April Meeting, materials which responded to the request for information regarding the Transaction and its impact on Nuveen and the Nuveen funds including, among other things: the structure and terms of the Transaction; the impact of the Transaction on Nuveen, its operations and the nature, quality and level of services provided to the Nuveen funds, including, in particular, any changes to those services that the Nuveen funds may experience following the Transaction; the strategic plan for Nuveen, including any financing arrangements following the Transaction and any cost-cutting efforts that may impact services; the organizational structure of TIAA-CREF, including the governance structure of Nuveen following the Transaction; any anticipated effect on each Nuveen fund’s expense ratios (including changes to advisory and sub-advisory fees) and economies of scale that may be expected; any benefits or conflicts of interest that TIAA-CREF, Nuveen or their affiliates can expect from the Transaction; any benefits or undue burdens or other negative implications that may be imposed on the Nuveen funds as a result of the Transaction; the impact on Nuveen or the Nuveen funds as a result of being subject to additional regulatory schemes that TIAA-CREF must comply with in operating its various businesses; and the costs associated with obtaining necessary shareholder approvals and the bearer of such costs. The Independent Board Members also received a memorandum describing the applicable laws, regulations and duties in approving advisory contracts, including in conjunction with a change of control, from their independent legal counsel.
The materials and information prepared in connection with the review of the Original Advisory Agreements and New Advisory Agreements supplemented the information and analysis provided to the Board during the year. In this regard, throughout the year, the Board, acting directly or through its committees, regularly reviewed the performance and various services provided by the Adviser and Sub-Adviser. The Board met at least quarterly as well as at other times as the need arose. At its quarterly meetings, the Board reviewed reports by the Adviser regarding, among other things, fund performance, fund expenses, premium and discount levels of closed-end funds, the performance of the investment teams and compliance, regulatory and risk management matters. In addition to regular reports, the Adviser provided special reports to the Board or a committee thereof from time to time to enhance the Board’s understanding of various topics that impact some or all the Nuveen funds (such as distribution channels, oversight of omnibus accounts and leverage management topics), to update the Board on regulatory developments impacting the investment company industry or to update the Board on the business plans or other matters impacting the Adviser. The Board also met with key investment personnel managing certain Nuveen fund portfolios during the year.
In addition, the Board has created several standing committees (the Executive Committee; the Dividend Committee; the Audit Committee; the Compliance, Risk Management and Regulatory Oversight Committee; the Nominating and Governance Committee; the Open-End Funds Committee; and the Closed-End Funds Committee). The Open-End Funds Committee and Closed-End Funds Committee are intended to assist the full Board in monitoring and gaining a deeper insight into the distinctive business practices of closed-end and open-end funds. These two Committees have met prior to each quarterly Board meeting, and the Adviser provided presentations to these Committees permitting them to delve further into specific matters or initiatives impacting the respective product line.
Further, the Board continued its program of seeking to have the Board Members or a subset thereof visit each sub-adviser to the Nuveen funds and meet key investment and business personnel at least once over a multiple year rotation. In this regard, the Independent Board Members made site visits to certain equity and fixed income teams of the Sub-Adviser in September 2013 and met with the Sub-Adviser’s municipal team at the August and November 2013 quarterly meetings.
The Board considered the information provided and knowledge gained at these meetings and visits during the year when performing its annual review of the Original Advisory Agreements and its review of the New Advisory Agreements. The Independent Board Members also were assisted throughout
the process by independent legal counsel. During the course of the year and during their deliberations regarding the review of advisory contracts, the Independent Board Members met with independent legal counsel in executive sessions without management present. In addition, it is important to recognize that the management arrangements for the funds are the result of many years of review and discussion between the Independent Board Members and Nuveen fund management and that the Board Members’ conclusions may be based, in part, on their consideration of fee arrangements and other factors developed in previous years.
The Board considered all factors it believed relevant with respect to each Fund, including, among other things: (a) the nature, extent and quality of the services provided by the Fund Advisers, (b) the investment performance of the Fund and the Fund Advisers, (c) the advisory fees and costs of the services to be provided to the Fund and the profitability of the Fund Advisers, (d) the extent of any economies of scale, (e) any benefits derived by the Fund Advisers from the relationship with the Fund and (f) other factors. With respect to the New Advisory Agreements, the Board also considered the Transaction and its impact on the foregoing factors. Each Board Member may have accorded different weight to the various factors in reaching his or her conclusions with respect to a Fund’s Original Advisory Agreements and New Advisory Agreements. The Independent Board Members did not identify any single factor as all-important or controlling. The Independent Board Members’ considerations were instead based on a comprehensive consideration of all the information presented. The principal factors considered by the Board and its conclusions are described below.
A. Nature, Extent and Quality of Services
1. The Original Advisory Agreements
In considering renewal of each Original Advisory Agreement, the Independent Board Members considered the nature, extent and quality of the respective Fund Adviser’s services, including portfolio management services (and the resulting Fund performance) and administrative services. The Independent Board Members further considered the overall reputation and capabilities of the Adviser and its affiliates, the commitment of the Adviser to provide high quality service to the Funds, their overall confidence in the capability and integrity of the Adviser and its staff and the Adviser’s responsiveness to questions and concerns raised by them. The Independent Board Members reviewed materials outlining, among other things: each Fund Adviser’s organization and business; the types of services that each Fund Adviser or its affiliates provide to each Fund; the performance record of each Fund (as described in further detail below); and any initiatives Nuveen had taken for the open-end fund product line.
In considering the services provided by the Fund Advisers, the Board recognized that the Adviser provides a myriad of investment management, administrative, compliance, oversight and other services for the Funds, and the Sub-Adviser generally provides the portfolio advisory services to the Funds under the oversight of the Adviser. The Board considered the wide range of services provided by the Adviser to the Nuveen funds beginning with developing the fund and monitoring and analyzing its performance to providing or overseeing the services necessary to support a fund’s daily operations. The Board recognized the Adviser, among other things, provides: (a) product management (such as analyzing ways to better position a fund in the marketplace, maintaining relationships to gain access to distribution platforms and setting dividends); (b) fund administration (such as preparing a fund’s tax returns, regulatory filings and shareholder communications; managing fund budgets and expenses; overseeing a fund’s various service providers; and supporting and analyzing new and existing funds); (c) Board administration (such as supporting the Board and its committees, in relevant part, by organizing and administering the Board and committee meetings and preparing the necessary reports to assist the Board in its duties); (d) compliance (such as monitoring adherence to a fund’s investment policies and procedures and applicable law; reviewing the compliance program periodically and developing new policies or updating existing compliance policies and procedures as considered necessary or appropriate; responding to regulatory requests; and overseeing compliance testing of sub-advisers); (e) legal support (such as preparing or reviewing fund registration statements, proxy statements and other necessary materials; interpreting regulatory requirements and compliance thereof; and maintaining applicable registrations); and (f) investment services (such as overseeing and reviewing sub-advisers and their investment teams; analyzing performance of the funds; overseeing investment and risk management; overseeing the daily valuation process for portfolio securities and developing and recommending valuation policies and methodologies and changes thereto; and participating in fund development, leverage management and the development of investment policies and parameters).
In its review, the Board also considered the new services, initiatives or other changes adopted since the last advisory contract review that were designed to enhance the services and support the Adviser provides to the Nuveen funds. The Board recognized that some initiatives are a multi-year process. In reviewing the activities of 2013, the Board recognized that the year reflected the Adviser’s continued focus on fund rationalization for both closed-end and open-end funds, consolidating certain funds through mergers that were designed to improve efficiencies and economies of scale for shareholders, repositioning various funds through updates in their investment policies and guidelines with the expectation of bringing greater value to shareholders, and liquidating certain funds. As in the past, the Board recognized the Adviser’s significant investment in its technology initiatives, including the continued progress toward a central repository for fund and other Nuveen product data and implementing a data system to support the risk oversight group enabling it to provide more detailed risk analysis for the Nuveen funds. The Board noted the new data system has permitted more in-depth analysis of the investment risks of the Funds and across the complex providing additional feedback and insights to the investment teams and more comprehensive risk reporting to the Board. The Adviser also conducted several workshops for the Board
Annual Investment Management Agreement Approval Process (Unaudited) (continued)
regarding the new data system, including explaining the risk measures being applied and their purpose. The Board also recognized the enhancements in the valuation group within the Adviser, including centralizing the fund pricing process within the valuation group, trending to more automated and expedient reviews and continuing to expand its valuation team. The Board further considered the expansion of personnel in the compliance department enhancing the collective expertise of the group, investments in additional compliance systems and the updates of various compliance policies.
In addition to the foregoing actions, the Board also considered other initiatives related to the open-end funds, including, among other things: the continued focus on enhancing the product line through the development of new funds, including the development of alternative strategies reflecting trends in the industry; the enhanced support provided to the Board by providing comprehensive in-depth presentations to the Open-End Funds Committee; and the development of a new class of shares for certain funds.
As noted, the Adviser also oversees the Sub-Adviser who provides the portfolio advisory services to the Funds. In reviewing the portfolio advisory services provided to each Fund, the Nuveen Investment Services Oversight Team of the Adviser analyzes the performance of the Sub-Adviser and may recommend changes to the investment team or investment strategies as appropriate. In assisting the Board’s review of the Sub-Adviser, the Adviser provides a report analyzing, among other things, the Sub-Adviser’s investment team and changes thereto, organization and history, assets under management, the investment team’s philosophy and strategies in managing each Fund, developments affecting the Sub-Adviser or the Funds and their performance. In their review of the Sub-Adviser, the Independent Board Members considered, among other things, the experience and qualifications of the relevant investment personnel, their investment philosophy and strategies, the Sub-Adviser’s organization and stability, its capabilities and any initiatives taken or planned to enhance its current capabilities or support potential growth of business and, as outlined in further detail below, the performance of the Funds. The Independent Board Members also reviewed portfolio manager compensation arrangements to evaluate each Fund Adviser’s ability to attract and retain high quality investment personnel, preserve stability, and reward performance while not providing an inappropriate incentive to take undue risks.
Given the importance of compliance, the Independent Board Members also considered Nuveen’s compliance program, including the report of the chief compliance officer regarding the Nuveen funds’ compliance policies and procedures; the resources dedicated to compliance; the record of compliance with the policies and procedures; and Nuveen’s supervision of the Funds’ service providers. The Board recognized Nuveen’s commitment to compliance and strong commitment to a culture of compliance. Given the Adviser’s emphasis on monitoring investment risk, the Board has also appointed two Independent Board Members as point persons to review and keep the Board apprised of developments in this area and work with applicable Fund Adviser personnel.
Based on their review, the Independent Board Members found that, overall, the nature, extent and quality of services provided to each Fund under each respective Original Advisory Agreement were satisfactory.
2. The New Advisory Agreements
In evaluating the nature, quality and extent of the services expected to be provided by the Fund Advisers under the New Investment Management Agreements and the New Sub-Advisory Agreements, the Board Members concluded that no diminution in the nature, quality and extent of services provided to each Fund and its shareholders by the respective Fund Advisers is expected as a result of the Transaction. In making their determination, the Independent Board Members considered, among other things: the expected impact, if any, of the Transaction on the operations, facilities, organization and personnel of each Fund Adviser; the ability of each Fund Adviser to perform its duties after the Transaction, including any changes to the level or quality of services provided to the Funds; the potential implications of any additional regulatory requirements imposed on the Fund Advisers or the Nuveen funds following the Transaction; and any anticipated changes to the investment and other practices of the Nuveen funds.
The Board noted that the terms of each New Investment Management Agreement, including the fees payable thereunder, are substantially identical to those of the Original Investment Management Agreement relating to the same Fund. Similarly, the terms of each New Sub-Advisory Agreement, including fees payable thereunder, are substantially identical to those of the Original Sub-Advisory Agreement relating to the same Fund. The Board considered that the services to be provided and the standard of care under the New Investment Management Agreements and the New Sub-Advisory Agreements are the same as the corresponding original agreements. The Board Members noted the Transaction also does not alter the allocation of responsibilities between the Adviser and the Sub-Adviser. The Sub-Adviser will continue to furnish an investment program, make investment decisions and place all orders for the purchase and sale of securities, all on behalf of each Fund and subject to oversight of the Board and the Adviser. The Board noted that TIAA-CREF did not anticipate any material changes to the advisory, sub-advisory or other services provided to the Nuveen funds as a result of the Transaction. The Independent Board Members recognized that there were not any planned “cost cutting” measures that could be expected to reduce the nature, extent or quality of services. The Independent Board Members further noted that there were currently no plans for material changes to senior personnel at Nuveen or key personnel who provide services to the Nuveen funds and the
Board following the Transaction. The key personnel who have responsibility for the Nuveen funds in each area, including portfolio management, investment oversight, fund management, fund operations, product management, legal/compliance and board support functions, are expected to be the same following the Transaction, although such personnel may have additional reporting requirements to TIAA-CREF. The Board also considered the anticipated incentive plans designed to retain such key personnel. Notwithstanding the foregoing, the Board Members recognized that personnel changes may occur in the future as a result of normal business developments or personal career decisions.
The Board Members also considered Nuveen’s proposed governance structure following the Transaction and noted that Nuveen was expected to remain a stand-alone business within the TIAA-CREF enterprise and operate relatively autonomously from the other TIAA-CREF businesses, but would receive the general support and oversight from certain TIAA-CREF functional groups (such as legal, finance, internal audit, compliance, and risk management groups). The Board recognized, however, that Nuveen may be subject to additional reporting requirements as it keeps TIAA-CREF abreast of developments affecting the Nuveen business, may be required to modify certain of its reports, policies and procedures as necessary to conform to the practices followed in the TIAA-CREF enterprise and may need to collaborate with TIAA-CREF with respect to strategic planning for its business.
In considering the implications of the Transaction, the Board Members also recognized the reputation and size of TIAA-CREF and the benefits that the Transaction may bring to the Nuveen funds and Nuveen. In this regard, the Board recognized, among other things, that the increased resources and support that may be available to Nuveen from TIAA-CREF and the improved capital structure of Nuveen Investments, Inc. (the parent of the Adviser) that would result from the significant reduction in its debt level may reinforce and enhance Nuveen’s ability to provide quality services to the Nuveen funds and to invest further into its infrastructure.
Further, with the consummation of the Transaction, the Board recognized the enhanced distribution capabilities for the Nuveen funds as the funds may gain access to TIAA-CREF’s distribution network, particularly through TIAA-CREF’s retirement platform and institutional client base. The Board also considered that investors in TIAA-CREF’s retirement platform may choose to roll their investments as they exit their retirement plans into the Nuveen funds. The Independent Board Members recognized the potential cost savings to the benefit of all shareholders of the Nuveen funds from reduced expenses as assets in the Nuveen fund complex rise pursuant to the complex-wide fee arrangement described in further detail below.
Based on their review, the Independent Board Members found that the expected nature, extent and quality of services to be provided to each Fund under its New Advisory Agreements were satisfactory and supported approval of the New Advisory Agreements.
B. The Investment Performance of the Funds and Fund Advisers
1. The Original Advisory Agreements
The Board, including the Independent Board Members, considered the performance history of each Fund over various time periods. The Board reviewed reports, including an analysis of each Fund’s performance and the applicable investment team. In considering each Fund’s performance, the Board recognized that a fund’s performance can be reviewed through various measures including the fund’s absolute return, the fund’s return compared to the performance of other peer funds and the fund’s performance compared to its respective benchmark. Accordingly, the Board reviewed, among other things, each Fund’s historic investment performance as well as information comparing the Fund’s performance information with that of other funds (the “Performance Peer Group”) and with recognized and/or customized benchmarks (i.e., generally benchmarks derived from multiple recognized benchmarks) for the quarter, one-, three- and five-year periods ending December 31, 2013, as well as performance information reflecting the first quarter of 2014 (or for such shorter periods available for the Total Return Fund, which did not exist for part of the foregoing time frame). This information supplemented the Nuveen fund performance information provided to the Board at each of its quarterly meetings.
In evaluating performance, the Board recognized several factors that may impact the performance data as well as the consideration given to particular performance data.
| | • | | The performance data reflects a snapshot in time, in this case as of the end of the most recent calendar year or quarter. A different performance period, however, could generate significantly different results. |
| | • | | Long-term performance can be adversely affected by even one period of significant underperformance so that a single investment decision or theme has the ability to disproportionately affect long-term performance. |
| | • | | The investment experience of a particular shareholder in a fund will vary depending on when such shareholder invests in such fund, the class held (if multiple classes offered in the fund) and the performance of the fund (or respective class) during that shareholder’s investment period. |
| | • | | Open-end funds offer multiple classes and the performance of the various classes of a fund should be substantially similar on a relative basis because all of the classes are invested in the same portfolio of securities and differences in performance among classes could be principally attributed to the variations in distribution and servicing expenses of each class. |
Annual Investment Management Agreement Approval Process (Unaudited) (continued)
| | • | | The usefulness of comparative performance data as a frame of reference to measure a fund’s performance may be limited because the Performance Peer Group, among other things, does not adequately reflect the objectives and strategies of the fund, has a different investable universe, or the composition of the peer set may be limited in size or number as well as other factors. In this regard, the Board noted that the Adviser classified the Performance Peer Groups of the Nuveen funds from highly relevant to less relevant. For funds classified with less relevant Performance Peer Groups, the Board considered a fund’s performance compared to its benchmark to help assess the fund’s comparative performance. A fund was generally considered to have performed comparably to its benchmark if the fund’s performance was within certain thresholds compared to the performance of its benchmark and was considered to have outperformed or underperformed its benchmark if the fund’s performance was beyond these thresholds for the one- and three-year periods, subject to certain exceptions.i While the Board is cognizant of the relative performance of a fund’s peer set and/or benchmark(s), the Board evaluated fund performance in light of the respective fund’s investment objectives, investment parameters and guidelines and considered that the variations between the objectives and investment parameters or guidelines of the fund with its peers and/or benchmarks result in differences in performance results. |
With respect to any Nuveen funds for which the Board has identified performance concerns, the Board monitors such funds closely until performance improves, discusses with the Adviser the reasons for such results, considers those steps necessary or appropriate to address such issues and reviews the results of any efforts undertaken. The Board is aware, however, that shareholders chose to invest or remain invested in a fund knowing that the Adviser manages the fund and knowing the fund’s fee structure.
In considering the performance data, the Independent Board Members noted that the Strategic Income Fund and the High Income Fund had demonstrated generally favorable performance in comparison to their respective peers, performing in the first or second quartile over various periods. With respect to the Total Return Fund, the Board noted that such Fund was relatively new with a shorter performance history available, thereby limiting the ability to make a meaningful assessment of performance.
Except as otherwise noted above, based on their review, the Independent Board Members determined that each Fund’s investment performance had been satisfactory.
2. The New Advisory Agreements
With respect to the performance of each Fund, the Board considered that the portfolio investment personnel responsible for the management of the respective Fund portfolios were expected to continue to manage such portfolios following the completion of the Transaction and the investment strategies of the Funds were not expected to change as a result of the Transaction (subject to changes unrelated to the Transaction that are approved by the Board and/or shareholders). Accordingly, the findings regarding performance outlined above for the Original Advisory Agreements are applicable to the review of the New Advisory Agreements.
C. Fees, Expenses and Profitability
1. Fees and Expenses
The Board evaluated the management fees and expenses of each Fund, reviewing, among other things, such Fund’s gross management fees, net management fees and net expense ratios in absolute terms as well as compared to the fees and expenses of a comparable universe of funds provided by an independent fund data provider (the “Peer Universe”) and to a more focused subset of funds in the Peer Universe (the “Peer Group”) and any expense limitations.
The Independent Board Members further reviewed the methodology regarding the construction of the applicable Peer Universe and Peer Group. In reviewing the comparisons of fee and expense information, the Independent Board Members took into account that in certain instances various factors such as the limited size and particular composition of the Peer Universe or Peer Group (including the inclusion of other Nuveen funds in the peer set); expense anomalies; changes in the funds comprising the Peer Universe or Peer Group from year to year; levels of reimbursement or fee waivers; and the timing of information used may impact the comparative data thereby limiting somewhat the ability to make a meaningful comparison with peers.
In reviewing the fee schedule for a fund, the Independent Board Members also considered the fund-level and complex-wide breakpoint schedules (described in further detail below) and any fee waivers and reimbursements provided by Nuveen. In reviewing fees and expenses, the Board
| i | The Board recognized that the Adviser considered a fund to have outperformed or underperformed its benchmark if the fund’s performance was higher or lower than the performance of the benchmark by the following thresholds: for open-end funds (+/- 100 basis points for equity funds excluding index funds; +/- 30 basis points for tax exempt fixed income funds; +/- 40 basis points for taxable fixed income funds) and for closed-end funds (assuming 30% leverage) (+/- 130 basis points for equity funds excluding index funds; +/- 39 basis points for tax exempt funds and +/- 52 basis points for taxable fixed income funds). |
considered the expenses and fees to be higher if they were over 10 basis points higher, slightly higher if they were approximately 6 to 10 basis points higher, in line if they were within approximately 5 basis points higher than the peer average and below if they were below the peer average of the Peer Group. In reviewing the reports, the Board noted that the majority of the Nuveen funds were at, close to or below their peer average based on the net total expense ratio. The Independent Board Members observed that the Funds had net management fees and net expense ratios (including fee waivers and expense reimbursements) that were below their respective peer averages.
Based on their review of the fee and expense information provided, the Independent Board Members determined that each Fund’s management fees (as applicable) to a Fund Adviser were reasonable in light of the nature, extent and quality of services provided to the Fund.
2. Comparisons with the Fees of Other Clients
The Board recognized that all Nuveen funds have a sub-adviser, either affiliated or non-affiliated, and therefore the overall fund management fee can be divided into two components, the fee retained by the Adviser and the fee paid to the sub-adviser. In general terms, the fee to the Adviser reflects the administrative and other services it provides to support the Nuveen fund (as described above) and, while some administrative services may occur at the sub-adviser level, the fee to the sub-adviser generally reflects the portfolio management services provided by the sub-adviser. The Independent Board Members considered the fees a Fund Adviser assesses to the Funds compared to that of other clients. With respect to non-municipal funds, such other clients of a Fund Adviser may include: separately managed accounts (both retail and institutional accounts), foreign investment funds offered by Nuveen, collective trust funds and funds that are not offered by Nuveen but are sub-advised by one of Nuveen’s investment management teams.
The Independent Board Members reviewed the nature of services provided by the Adviser, including through its affiliated sub-advisers and the average fee the affiliated sub-advisers assessed such clients as well as the range of fees assessed to the different types of separately managed accounts (such as retail, institutional or wrap accounts) to the extent applicable to the respective sub-adviser. In their review, the Independent Board Members considered the differences in the product types, including, but not limited to: the services provided, the structure and operations, product distribution and costs thereof, portfolio investment policies, investor profiles, account sizes and regulatory requirements. In evaluating the comparisons of fees, the Independent Board Members noted that the fee rates charged to the Nuveen funds and other clients vary, among other things, because of the different services involved and the additional regulatory and compliance requirements associated with registered investment companies, such as the Funds. The Independent Board Members noted that, as a general matter, higher fee levels reflect higher levels of service, increased investment management complexity, greater product management requirements and higher levels of risk or a combination of the foregoing. The Independent Board Members further noted, in particular, that the range of services provided to the Funds (as discussed above) is generally much more extensive than that provided to separately managed accounts. Many of the additional administrative services provided by the Adviser are not required for institutional clients. The Independent Board Members also recognized that the management fee rates of the foreign funds advised by the Adviser may vary due to, among other things, differences in the client base, governing bodies, operational complexities and services covered by the management fee. Given the inherent differences in the various products, particularly the extensive services provided to the Funds, the Independent Board Members believe such facts justify the different levels of fees.
3. Profitability of Fund Advisers
In conjunction with their review of fees, the Independent Board Members also considered the profitability of Nuveen for its advisory activities and its financial condition. The Independent Board Members reviewed the revenues and expenses of Nuveen’s advisory activities for the last two calendar years, the allocation methodology used in preparing the profitability data, an analysis of the key drivers behind the changes in revenues and expenses that impacted profitability in 2013 and Nuveen’s consolidated financial statements for 2013. The Independent Board Members noted this information supplemented the profitability information requested and received during the year to help keep them apprised of developments affecting profitability (such as changes in fee waivers and expense reimbursement commitments). In this regard, the Independent Board Members noted that two Independent Board Members served as point persons to review the profitability analysis and methodologies employed, and any changes thereto, and to keep the Board apprised of such changes. The Independent Board Members also considered Nuveen’s revenues for advisory activities, expenses and profit margin compared to that of various unaffiliated management firms.
In reviewing profitability, the Independent Board Members noted the Adviser’s continued investment in its business with expenditures to, among other things, upgrade its investment technology and compliance systems and provide for additional personnel and other resources. The Independent Board Members recognized the Adviser’s continued commitment to its business should enhance the Adviser’s capacity and capabilities in providing the services necessary to meet the needs of the Nuveen funds as they grow or change over time. In addition, in evaluating profitability, the Independent Board Members also noted the subjective nature of determining profitability which may be affected by numerous factors including the allocation of expenses and that various allocation methodologies may each be reasonable but yield different results. Further, the Independent Board Members recognized the difficulties in making comparisons as the profitability of other advisers generally is not publicly
Annual Investment Management Agreement Approval Process (Unaudited) (continued)
available, and the profitability information that is available for certain advisers or management firms may not be representative of the industry and may be affected by, among other things, an adviser’s particular business mix, capital costs, size, types of funds managed and expense allocations. Notwithstanding the foregoing, the Independent Board Members noted the Adviser’s adjusted operating margin appears to be reasonable in relation to other investment advisers and sufficient to operate as a viable investment management firm meeting its obligations to the Nuveen funds. Based on their review, the Independent Board Members concluded that the Adviser’s level of profitability for its advisory activities was reasonable in light of the services provided.
With respect to sub-advisers affiliated with Nuveen, including the Sub-Adviser, the Independent Board Members reviewed such sub-advisers’ revenues, expenses and profitability margins (pre- and post-tax) for their advisory activities and the methodology used for allocating expenses among the internal sub-advisers. Based on their review, the Independent Board Members were satisfied that the Sub-Adviser’s level of profitability was reasonable in light of the services provided.
In evaluating the reasonableness of the compensation, the Independent Board Members also considered other amounts paid to a Fund Adviser by the funds as well as indirect benefits (such as soft dollar arrangements), if any, the Fund Adviser and its affiliates receive or are expected to receive that are directly attributable to the management of a Nuveen fund. See Section E below for additional information on indirect benefits the Fund Advisers may receive as a result of its relationship with a Nuveen fund. Based on their review of the overall fee arrangements of each Fund, the Independent Board Members determined that the advisory fees and expenses of the Funds were reasonable.
4. The New Advisory Agreements
As noted above, the terms of the New Advisory Agreements are substantially identical to their corresponding Original Advisory Agreements. The fee schedule, including the breakpoint schedule and complex-wide fee schedule, in each New Advisory Agreement is identical to that under the corresponding Original Advisory Agreement. The Board Members also noted that Nuveen has committed for a period of two years from the date of closing the Transaction (i) not to increase contractual management fee rates for any Nuveen fund and (ii) not to raise expense cap levels for any Nuveen fund from levels currently in effect or scheduled to go into effect prior to the Transaction. This commitment shall not limit or otherwise affect mergers or liquidations of any funds in the ordinary course. Based on the information provided, the Board Members did not believe that the overall expenses would increase as a result of the Transaction. In addition, the Board Members recognized that the Nuveen funds may gain access to the retirement platform and institutional client base of TIAA-CREF, and the investors in the retirement platforms may roll their investments into one or more Nuveen funds as they exit their retirement plans. The enhanced distribution access may result in additional sales of the Nuveen funds resulting in an increase in total assets under management in the complex and a corresponding decrease in overall management fees if additional breakpoints at the fund-level or complex-wide level are met. Based on its review, the Board determined that the management fees and expenses under each New Advisory Agreement were reasonable.
Further, other than from a potential reduction in the debt level of Nuveen Investments, Inc., the Board recognized that it is difficult to predict with any degree of certainty the impact of the Transaction on Nuveen’s profitability. Given the fee schedule was not expected to change under the New Advisory Agreements, however, the Independent Board Members concluded that each Fund Adviser’s level of profitability for its advisory activities under the respective New Advisory Agreements would continue to be reasonable in light of the services provided.
D. Economies of Scale and Whether Fee Levels Reflect These Economies of Scale
1. The Original Advisory Agreements
With respect to economies of scale, the Independent Board Members have recognized the potential benefits resulting from the costs of a fund being spread over a larger asset base, although economies of scale are difficult to measure and predict with precision, particularly on a fund-by-fund basis. One method to help ensure the shareholders share in these benefits is to include breakpoints in the advisory fee schedule. Generally, management fees for funds in the Nuveen complex are comprised of a fund-level component and a complex-level component, subject to certain exceptions. Accordingly, the Independent Board Members reviewed and considered the applicable fund-level breakpoints in the advisory fee schedules that reduce advisory fees as asset levels increase.
In addition to fund-level advisory fee breakpoints, the Board also considered the Nuveen funds’ complex-wide fee arrangement. Pursuant to the complex-wide fee arrangement, the fees of the funds in the Nuveen complex are reduced as the assets in the fund complex reach certain levels. The complex-wide fee arrangement seeks to provide the benefits of economies of scale to fund shareholders when total fund complex assets increase, even if assets of a particular fund are unchanged or have decreased. The approach reflects the notion that some of Nuveen’s costs are attributable to services provided to all its funds in the complex and therefore all funds benefit if these costs are spread over a larger asset base.
Based on their review, the Independent Board Members concluded that the breakpoint schedules and complex-wide fee arrangement (as applicable) were acceptable and reflect economies of scale to be shared with shareholders when assets under management increase.
2. The New Advisory Agreements
As noted, the Independent Board Members recognized that the fund-level and complex-wide schedules will not change under the New Advisory Agreements. Assets in the funds advised by TIAA-CREF or its current affiliates will not be included in the complex-wide fee calculation. Nevertheless, the Nuveen funds may have access to TIAA-CREF’s retirement platform and institutional client base. The access to this distribution network may enhance the distribution of the Nuveen funds which, in turn, may lead to reductions in management and sub-advisory fees if the Nuveen funds reach additional fund-level and complex-wide breakpoint levels. Based on their review, including the considerations in the annual review of the Original Advisory Agreements, the Independent Board Members determined that the fund-level breakpoint schedules and complex-wide fee schedule continue to be appropriate and desirable in ensuring that shareholders participate in the benefits derived from economies of scale under the New Advisory Agreements.
E. Indirect Benefits
1. The Original Advisory Agreements
In evaluating fees, the Independent Board Members received and considered information regarding potential “fall out” or ancillary benefits the respective Fund Adviser or its affiliates may receive as a result of its relationship with each Fund. In this regard, the Independent Board Members considered, among other things, any sales charges, distribution fees and shareholder services fees received and retained by the Funds’ principal underwriter, an affiliate of the Adviser, which include fees received pursuant to any 12b-1 plan. The Independent Board Members, therefore, considered the 12b-1 fees retained by Nuveen during the last calendar year.
In addition to the above, the Independent Board Members considered whether the Fund Advisers received any benefits from soft dollar arrangements whereby a portion of the commissions paid by a fund for brokerage may be used to acquire research that may be useful to a Fund Adviser in managing the assets of the fund and other clients. Each Fund’s portfolio transactions are allocated by the Sub-Adviser. Accordingly, the Independent Board Members considered that the Sub-Adviser may benefit from its soft dollar arrangements pursuant to which it receives research from brokers that execute the applicable Fund’s portfolio transactions. With respect to any fixed income securities, however, the Board recognized that such securities generally trade on a principal basis that does not generate soft dollar credits. Similarly, the Board recognized that the research received pursuant to soft dollar arrangements by the Sub-Adviser may also benefit the Funds and their shareholders to the extent the research enhances the ability of the Sub-Adviser to manage the Funds. The Independent Board Members noted that the Sub-Adviser’s profitability may be somewhat lower if it did not receive the research services pursuant to the soft dollar arrangements and had to acquire such services directly.
Based on their review, the Independent Board Members concluded that any indirect benefits received by a Fund Adviser as a result of its relationship with the Funds were reasonable and within acceptable parameters.
2. The New Advisory Agreements
The Independent Board Members noted that, as the applicable policies and operations of the Fund Advisers with respect to the Nuveen funds were not anticipated to change significantly after the Transaction, such indirect benefits should remain after the Transaction. The Independent Board Members further noted the benefits the Transaction would provide to TIAA-CREF and Nuveen, including a larger-scale fund complex, certain shared services (noted above) and a broader range of investment capabilities, distribution capabilities and product line. Further, the Independent Board Members noted that Nuveen Investments, Inc. (the parent of the Adviser) would benefit from an improved capital structure through a reduction in its debt level.
F. Other Considerations for the New Advisory Agreements
In addition to the factors above, the Board Members also considered the following with respect to the Nuveen funds:
| | • | | Nuveen would rely on the provisions of Section 15(f) of the 1940 Act. In this regard, to help ensure that an unfair burden is not imposed on the Nuveen funds, Nuveen has committed for a period of two years from the date of the closing of the Transaction (i) not to increase contractual management fee rates for any fund and (ii) not to raise expense cap levels for any fund from levels currently in effect or scheduled to go into effect prior to the Transaction. This commitment shall not limit or otherwise affect mergers or liquidations of any funds in the ordinary course. |
| | • | | The Nuveen funds would not incur any costs in seeking the necessary shareholder approvals for the New Investment Management Agreements or the New Sub-Advisory Agreements (except for any costs attributed to seeking shareholder approvals of fund specific matters unrelated to the Transaction, such as election of Board Members or changes to investment policies, in which case a portion of such costs will be borne by the applicable funds). |
| | • | | The reputation, financial strength and resources of TIAA-CREF. |
| | • | | The long-term investment philosophy of TIAA-CREF and anticipated plans to grow Nuveen’s business to the benefit of the Nuveen funds. |
Annual Investment Management Agreement Approval Process (Unaudited) (continued)
| | • | | The benefits to the Nuveen funds as a result of the Transaction including: (i) increased resources and support available to Nuveen as well as an improved capital structure that may reinforce and enhance the quality and level of services it provides to the funds; (ii) potential additional distribution capabilities for the funds to access new markets and customer segments through TIAA-CREF’s distribution network, including, in particular, its retirement platforms and institutional client base; and (iii) access to TIAA-CREF’s expertise and investment capabilities in additional asset classes. |
G. Other Considerations
The Independent Board Members did not identify any single factor discussed previously as all-important or controlling. The Board Members, including the Independent Board Members, unanimously concluded that the terms of each Original Advisory Agreement and New Advisory Agreement are fair and reasonable, that the respective Fund Adviser’s fees are reasonable in light of the services provided to each Fund and that the Original Advisory Agreements be renewed and the New Advisory Agreements be approved.
II.
Approval of Interim Advisory Agreements for the Total Return Fund, High Income Fund and Strategic Income Fund
At the April Meeting, the Board Members, including the Independent Board Members, unanimously approved for each Fund an interim advisory agreement (the “Interim Investment Management Agreement”) between the respective Fund and the Adviser and an interim sub-advisory agreement (the “Interim Sub-Advisory Agreement”) between the Adviser and the Sub-Adviser. If necessary to assure continuity of advisory services, each respective Interim Investment Management Agreement and Interim Sub-Advisory Agreement will take effect upon the closing of the Transaction if shareholders have not yet approved the corresponding New Investment Management Agreement or New Sub-Advisory Agreement. The terms of each Interim Investment Management Agreement and Interim Sub-Advisory Agreement are substantially identical to those of the corresponding Original Investment Management Agreement and New Investment Management Agreement and the corresponding Original Sub-Advisory Agreement and New Sub-Advisory Agreement, respectively, except for certain term and fee escrow provisions. In light of the foregoing, the Board Members, including the Independent Board Members, unanimously determined that the scope and quality of services to be provided to the Funds under the respective Interim Investment Management Agreements and Interim Sub-Advisory Agreements are at least equivalent to the scope and quality of services provided under the applicable Original Investment Management Agreements and Original Sub-Advisory Agreements.
III.
Approval of Original Advisory Agreements and New Advisory Agreements for the Infrastructure Income Fund
The Board Members are responsible for approving advisory arrangements and, at the April Meeting, were asked to approve the advisory arrangements for the Infrastructure Income Fund (for purposes of this Part III, the “Fund”). At the April Meeting, the Board Members, including the Independent Board Members, considered the investment management agreement (for purposes of this Part III, the “Original Investment Management Agreement”) between the Fund and the Adviser, and the investment sub-advisory agreement (for purposes of this Part III, the “Original Sub-Advisory Agreement”) between the Adviser and the Sub-Adviser, on behalf of the Fund. For purposes of this Part III, the Adviser and the Sub-Adviser are each hereafter a “Fund Adviser” and the Original Investment Management Agreement and the Original Sub-Advisory Agreement are each hereafter an “Original Advisory Agreement.”
At the April Meeting, the Adviser made a presentation to and responded to questions from the Board of the Fund. During the April Meeting, the Independent Board Members also met privately with their legal counsel to, among other things, review the Board’s duties under the 1940 Act, the general principles of state law in reviewing and approving advisory contracts, the standards used by courts in determining whether investment company boards of directors have fulfilled their duties, factors to be considered in voting on advisory contracts and an adviser’s fiduciary duty with respect to advisory agreements and compensation. It is with this background that the Independent Board Members considered the Original Advisory Agreements.
In addition, prior to the April Meeting, the Board Members were advised of the potential Transaction. For purposes of this section, references to “Nuveen” herein include all affiliates of Nuveen Investments, Inc. providing advisory, sub-advisory, distribution or other services to the Nuveen funds. In accordance with the 1940 Act and the terms of the Original Advisory Agreements, the completion of the Transaction would terminate the Original Investment Management Agreement and the Original Sub-Advisory Agreement. Accordingly, at the April Meeting, in addition to approving the Original Advisory Agreements, in anticipation of the termination of the Original Advisory Agreements that would occur upon the consummation of the Transaction, the Board also approved a new advisory agreement (for purposes of this Part III, the “New Investment Management Agreement”) between the Fund and the Adviser and a new sub-advisory agreement (for purposes of this Part III, the “New Sub-Advisory Agreement” and, together with the
New Investment Management Agreement, the “New Advisory Agreements”) between the Adviser and the Sub-Adviser, each on behalf of the Fund to be effective following the completion of the Transaction and the receipt of the requisite shareholder approval. The initial sole shareholder of the Fund approved the New Advisory Agreements.
The Independent Board Members also serve as such to other Nuveen funds. Leading up to the April Meeting, the Independent Board Members had several meetings and deliberations, with and without management from Nuveen present and with the advice of legal counsel, regarding the Transaction. At the February Meeting, the Board Members met with a senior executive representative of TIAA-CREF to discuss the proposed Transaction. At the February Meeting, the Independent Board Members also established an ad hoc committee comprised solely of the Independent Board Members to monitor and evaluate the Transaction and to keep the Independent Board Members updated with developments regarding the Transaction. On March 20, 2014, the ad hoc committee met telephonically to discuss with management of Nuveen, and separately with independent legal counsel, the terms of the proposed Transaction and its impact on, among other things: the governance structure of Nuveen; the strategic plans for Nuveen; the operations of the Nuveen funds; the quality or level of services provided to the Nuveen funds; key personnel that service the Nuveen funds and/or the Board and the compensation or incentive arrangements to retain such personnel; Nuveen’s capital structure; the regulatory requirements applicable to Nuveen or fund operations; and the Nuveen funds’ fees and expenses, including the funds’ complex-wide fee arrangement. Following the meeting of the ad hoc committee, the Board met in person (two Independent Board Members participating telephonically) in an executive session on March 26, 2014 to further discuss the proposed Transaction. At the executive session, the Board met privately with independent legal counsel to review its duties with respect to reviewing advisory agreements, particularly in the context of a change of control, and to evaluate further the Transaction and its impact on the Nuveen funds, the Adviser and the Sub-Adviser, and the services provided. Representatives of Nuveen also met with the Board to update the Board Members on developments regarding the Transaction, to respond to questions and to discuss, among other things: the governance of the Fund Advisers following the Transaction; the background, culture (including with respect to regulatory and compliance matters) and resources of TIAA-CREF; the general plans and intentions of TIAA-CREF for Nuveen; the terms and conditions of the Transaction (including financing terms); any benefits or detriments the Transaction may impose on the Nuveen funds, TIAA-CREF or the Fund Advisers; the reaction from the Fund Advisers’ employees knowledgeable of the Transaction; the incentive and retention plans for key personnel of the Fund Advisers; the potential access to additional distribution platforms and economies of scale; and the impact of any additional regulatory schemes that may be applicable to the Nuveen funds given the banking and insurance businesses operated in the TIAA-CREF enterprise. As part of its review, the Board also held a separate meeting on April 15-16, 2014 to review the Nuveen funds’ investment performance and consider an analysis provided by the Adviser of each sub-adviser of the Nuveen funds (including the Sub-Adviser) and the Transaction and its implications to the Nuveen funds. During their review of the materials and discussions, the Independent Board Members presented the Adviser with questions and the Adviser responded. Further, the Independent Board Members met in an executive session with independent legal counsel on April 29, 2014 and April 30, 2014.
In connection with their review of the Original Advisory Agreements and the New Advisory Agreements, the Independent Board Members received extensive information regarding the Fund and the Fund Advisers including, among other things: the nature, extent and quality of services expected to be provided by each Fund Adviser; the organization and operations of each Fund Adviser; the expertise and background of relevant personnel of each Fund Adviser; certain performance-related information; the proposed management fees for the Fund, including comparisons of such fees with the management fees of comparable funds; the expected expenses of the Fund, including comparisons of the Fund’s expected expense ratio with the expense ratios of comparable funds; and an analysis of the Adviser’s profitability with comparisons to peers in the managed fund business. In light of the proposed Transaction, the Independent Board Members, through their independent legal counsel, also requested in writing and received additional information regarding the proposed Transaction and its impact on the provision of services by the Fund Advisers.
The Independent Board Members received, well in advance of the April Meeting, materials which responded to the request for information regarding the Transaction and its impact on Nuveen and the Nuveen funds including, among other things: the structure and terms of the Transaction; the impact of the Transaction on Nuveen, its operations and the nature, quality and level of services provided to the Nuveen funds, including, in particular, any changes to those services that the Nuveen funds may experience following the Transaction; the strategic plan for Nuveen, including any financing arrangements following the Transaction and any cost-cutting efforts that may impact services; the organizational structure of TIAA-CREF, including the governance structure of Nuveen following the Transaction; any anticipated effect on each Nuveen fund’s expense ratios (including changes to advisory and sub-advisory fees) and economies of scale that may be expected; any benefits or conflicts of interest that TIAA-CREF, Nuveen or their affiliates can expect from the Transaction; any benefits or undue burdens or other negative implications that may be imposed on the Nuveen funds as a result of the Transaction; the impact on Nuveen or the Nuveen funds as a result of being subject to additional regulatory schemes that TIAA-CREF must comply with in operating its various businesses; and the costs associated with obtaining necessary shareholder approvals and the bearer of such costs. The Independent Board Members also received a memorandum describing the applicable laws, regulations and duties in approving advisory contracts, including in conjunction with a change of control, from their independent legal counsel.
Annual Investment Management Agreement Approval Process (Unaudited) (continued)
As outlined in more detail below, the Independent Board Members considered all factors they believed relevant with respect to the Fund, including, among other things: (a) the nature, extent and quality of the services to be provided by the Fund Advisers; (b) investment performance, as described below; (c) the advisory fees and costs of the services to be provided to the Fund and the profitability of the Fund Advisers; (d) the extent of any anticipated economies of scale; (e) any benefits expected to be derived by the Fund Advisers from their relationships with the Fund; and (f) other factors. With respect to the New Advisory Agreements, the Board also considered the Transaction and its impact on the foregoing factors. Each Board Member may have accorded different weight to the various factors in reaching his or her conclusions with respect to the Original Advisory Agreements and the New Advisory Agreements. The Independent Board Members did not identify any single factor as all-important or controlling. The Independent Board Members’ considerations were instead based on a comprehensive consideration of all the information presented. The principal factors considered by the Board and its conclusions are described below.
A. Nature, Extent and Quality of Services
1. The Original Advisory Agreements
In considering the approval of the Original Advisory Agreements, the Independent Board Members considered the nature, extent and quality of the respective Fund Adviser’s services, including portfolio management services and administrative services. As the Adviser and the Sub-Adviser already serve as adviser and sub-adviser, respectively, to other Nuveen funds overseen by the Board Members, the Board has a good understanding of each such Fund Adviser’s organization, operations and personnel. In addition, the Independent Board Members have reviewed materials outlining, among other things: each Fund Adviser’s organization and business and the types of services that each Fund Adviser or its affiliates are expected to provide to the Fund.
At the April Meeting and/or at prior meetings, the Independent Board Members reviewed materials outlining, among other things, the respective Fund Adviser’s organization and business; the types of services that such Fund Adviser or its affiliates provide to the Nuveen funds and are expected to provide to the Fund; and the investment experience of the respective Fund Adviser. Further, the Independent Board Members have evaluated the background and experience of the relevant investment personnel.
In considering the services that were expected to be provided by the Fund Advisers, the Board recognized that the Adviser would provide a myriad of investment management, administrative, compliance, oversight and other services for the Fund, and the Sub-Adviser would generally provide the portfolio advisory services to the Fund under the oversight of the Adviser. The Board considered the wide range of services provided by the Adviser to the Nuveen funds beginning with developing the fund and monitoring and analyzing its performance to providing or overseeing the services necessary to support a fund’s daily operations. The Board recognized the Adviser, among other things, provides: (a) product management (such as analyzing ways to better position a fund in the marketplace, maintaining relationships to gain access to distribution platforms and setting dividends); (b) fund administration (such as preparing a fund’s tax returns, regulatory filings and shareholder communications; managing fund budgets and expenses; overseeing a fund’s various service providers; and supporting and analyzing new and existing funds); (c) Board administration (such as supporting the Board and its committees, in relevant part, by organizing and administering the Board and committee meetings and preparing the necessary reports to assist the Board in its duties); (d) compliance (such as monitoring adherence to a fund’s investment policies and procedures and applicable law; reviewing the compliance program periodically and developing new policies or updating existing compliance policies and procedures as considered necessary or appropriate; responding to regulatory requests; and overseeing compliance testing of sub-advisers); (e) legal support (such as preparing or reviewing fund registration statements, proxy statements and other necessary materials; interpreting regulatory requirements and compliance thereof; and maintaining applicable registrations); and (f) investment services (such as overseeing and reviewing sub-advisers and their investment teams; analyzing performance of the funds; overseeing investment and risk management; overseeing the daily valuation process for portfolio securities and developing and recommending valuation policies and methodologies and changes thereto; and participating in fund development, leverage management and the development of investment policies and parameters). In addition, the Board Members recognized the Sub-Adviser’s investment experience.
Based on their review, the Independent Board Members found that, overall, the nature, extent and quality of services expected to be provided to the Fund under the respective Original Advisory Agreement were satisfactory.
2. The New Advisory Agreements
In evaluating the nature, quality and extent of the services expected to be provided by the Fund Advisers under the New Investment Management Agreement and the New Sub-Advisory Agreement, the Board Members concluded that no diminution in the nature, quality and extent of services provided to the Fund and its shareholders by the respective Fund Advisers is expected as a result of the Transaction. In making their determination, the Independent Board Members considered, among other things: the expected impact, if any, of the Transaction on the operations, facilities, organization and personnel of each Fund Adviser; the ability of each Fund Adviser to perform its duties after the Transaction, including any changes to the level or quality of services provided to the Fund; the potential implications of any additional regulatory requirements imposed on the Fund Advisers or the Nuveen funds following the Transaction; and any anticipated changes to the investment and other practices of the Nuveen funds.
The Board noted that the terms of the New Investment Management Agreement, including the fees payable thereunder, are substantially identical to those of the Original Investment Management Agreement. Similarly, the terms of the New Sub-Advisory Agreement, including fees payable thereunder, are substantially identical to those of the Original Sub-Advisory Agreement. The Board considered that the services to be provided and the standard of care under the New Investment Management Agreement and the New Sub-Advisory Agreement are the same as the corresponding original agreements. The Board Members noted the Transaction also does not alter the allocation of responsibilities between the Adviser and the Sub-Adviser. The Sub-Adviser will continue to furnish an investment program, make investment decisions and place all orders for the purchase and sale of securities, all on behalf of the Fund and subject to oversight of the Board and the Adviser. The Board noted that TIAA-CREF did not anticipate any material changes to the advisory, sub-advisory or other services provided to the Nuveen funds as a result of the Transaction. The Independent Board Members recognized that there were not any planned “cost cutting” measures that could be expected to reduce the nature, extent or quality of services. The Independent Board Members further noted that there were currently no plans for material changes to senior personnel at Nuveen or key personnel who provide services to the Nuveen funds and the Board following the Transaction. The key personnel who have responsibility for the Nuveen funds in each area, including portfolio management, investment oversight, fund management, fund operations, product management, legal/compliance and board support functions, are expected to be the same following the Transaction, although such personnel may have additional reporting requirements to TIAA-CREF. The Board also considered the anticipated incentive plans designed to retain such key personnel. Notwithstanding the foregoing, the Board Members recognized that personnel changes may occur in the future as a result of normal business developments or personal career decisions.
The Board Members also considered Nuveen’s proposed governance structure following the Transaction and noted that Nuveen was expected to remain a stand-alone business within the TIAA-CREF enterprise and operate relatively autonomously from the other TIAA-CREF businesses, but would receive the general support and oversight from certain TIAA-CREF functional groups (such as legal, finance, internal audit, compliance, and risk management groups). The Board recognized, however, that Nuveen may be subject to additional reporting requirements as it keeps TIAA-CREF abreast of developments affecting the Nuveen business, may be required to modify certain of its reports, policies and procedures as necessary to conform to the practices followed in the TIAA-CREF enterprise and may need to collaborate with TIAA-CREF with respect to strategic planning for its business.
In considering the implications of the Transaction, the Board Members also recognized the reputation and size of TIAA-CREF and the benefits that the Transaction may bring to the Nuveen funds and Nuveen. In this regard, the Board recognized, among other things, that the increased resources and support that may be available to Nuveen from TIAA-CREF and the improved capital structure of Nuveen Investments, Inc. (the parent of the Adviser) that would result from the significant reduction in its debt level may reinforce and enhance Nuveen’s ability to provide quality services to the Nuveen funds and to invest further into its infrastructure.
Further, with the consummation of the Transaction, the Board recognized the enhanced distribution capabilities for the Nuveen funds as the funds may gain access to TIAA-CREF’s distribution network, particularly through TIAA-CREF’s retirement platform and institutional client base. The Board also considered that investors in TIAA-CREF’s retirement platform may choose to roll their investments as they exit their retirement plans into the Nuveen funds. The Independent Board Members recognized the potential cost savings to the benefit of all shareholders of the Nuveen funds from reduced expenses as assets in the Nuveen fund complex rise pursuant to the complex-wide fee arrangement described in further detail below.
Based on their review, the Independent Board Members found that the expected nature, extent and quality of services to be provided to the Fund under its New Advisory Agreements were satisfactory and supported approval of the New Advisory Agreements.
B. Investment Performance
1. The Original Advisory Agreements
The Fund was new and, therefore, did not have its own performance history. The Independent Board Members, however, are familiar with the performance records of other Nuveen funds advised by the Adviser and sub-advised by the Sub-Adviser, although they recognized that the Sub-Adviser did not manage any funds that were similar to the Fund.
2. The New Advisory Agreements
The Board considered that the portfolio investment personnel responsible for the management of the Fund’s portfolio were expected to continue to manage the portfolio following the completion of the Transaction and the investment strategies of the Fund were not expected to change as a result of the Transaction. Accordingly, the findings regarding performance noted above for the Original Advisory Agreements are applicable to the review of the New Advisory Agreements.
C. Fees, Expenses and Profitability
1. Fees and Expenses
In evaluating the management fees and expenses that the Fund was expected to bear, the Independent Board Members considered, among other things, the Fund’s proposed management fee structure, the rationale for its proposed fee levels, and its expected expense ratio in absolute terms
Annual Investment Management Agreement Approval Process (Unaudited) (continued)
as well as compared with the fees and expense ratios of comparable funds. Accordingly, the Independent Board Members reviewed, among other things, the proposed gross management fee and estimated gross and net total expense ratios for the Fund, as well as comparative fee and expense data pertaining to the Fund’s peers in the Lipper category in which it was anticipated to be classified (i.e., the General Bond category). Further, the Independent Board Members considered the proposed sub-advisory fee rate for the Fund (as a percentage of the Fund’s net management fee).
In addition, the Independent Board Members considered the fund-level breakpoint schedule and the complex-wide breakpoint schedule (described in further detail below) and any applicable fee waivers and expense reimbursements expected to be provided. Based on their review of the fee and expense information provided, the Independent Board Members determined that the Fund’s management fees (as applicable) to a Fund Adviser were reasonable in light of the nature, extent and quality of services to be provided to the Fund.
2. Comparisons with the Fees of Other Clients
The Board recognized that, like all Nuveen funds, the Fund would have a sub-adviser (which, in the case of the Fund, would be an affiliated sub-adviser), and therefore, the overall fund management fee can be divided into two components, the fee retained by the Adviser and the fee paid to the Sub-Adviser. In general terms, the fee to the Adviser will reflect the administrative and other services it will provide to support the Fund, and, while some administrative services may occur at the sub-adviser level, the fee to the Sub-Adviser will generally reflect the portfolio management services provided by the Sub-Adviser. The Independent Board Members considered the fees a Fund Adviser was expected to assess to the Fund compared to that of other clients. Such other clients of a Fund Adviser may include: separately managed accounts (both retail and institutional accounts), foreign investment funds offered by Nuveen, collective trust funds and funds that are not offered by Nuveen but are sub-advised by one of Nuveen’s investment management teams. The Independent Board Members have reviewed the nature of services provided by the Adviser, including through its affiliated sub-advisers and the average fee the affiliated sub-advisers assessed such clients as well as the range of fees assessed to the different types of separately managed accounts (such as retail, institutional or wrap accounts) to the extent applicable to the respective sub-adviser. In their review, the Independent Board Members have considered the differences in the product types, including, but not limited to: the services provided, the structure and operations, product distribution and costs thereof, portfolio investment policies, investor profiles, account sizes and regulatory requirements. In evaluating the comparisons of fees, the Independent Board Members have noted that the fee rates charged to the Nuveen funds and other clients vary, among other things, because of the different services involved and the additional regulatory and compliance requirements associated with registered investment companies, such as the Fund. The Independent Board Members have noted that, as a general matter, higher fee levels reflect higher levels of service, increased investment management complexity, greater product management requirements and higher levels of risk or a combination of the foregoing. The Independent Board Members have further noted, in particular, that the range of services provided to a fund (such as those to be provided to the Fund, as described above) is generally much more extensive than that provided to separately managed accounts. Many of the additional administrative services to be provided by the Adviser are not required for institutional clients. The Independent Board Members have also recognized that the management fee rates of the foreign funds advised by the Adviser may vary due to, among other things, differences in the client base, governing bodies, operational complexities and services covered by the management fee. Given the inherent differences in the various products, particularly the extensive services to be provided to the Fund, the Independent Board Members believe such facts justify the different levels of fees.
3. Profitability of Fund Advisers
In conjunction with their review of fees, the Independent Board Members also considered the profitability of Nuveen for its advisory activities and its financial condition. At the April Meeting, the Independent Board Members reviewed the revenues and expenses of Nuveen’s advisory activities for the last two calendar years, the allocation methodology used in preparing the profitability data and an analysis of the key drivers behind the changes in revenues and expenses that impacted profitability in 2013. Certain Nuveen financial information included in a report dated March 10, 2014 and Nuveen’s 2013 consolidated financial statements had also been available. The Independent Board Members noted this information supplemented the profitability information requested and received during the year to help keep them apprised of developments affecting profitability (such as changes in fee waivers and expense reimbursement commitments). In this regard, the Independent Board Members noted that two Independent Board Members served as point persons to review the profitability analysis and methodologies employed, and any changes thereto, and to keep the Board apprised of such changes. The Independent Board Members also considered Nuveen’s revenues for advisory activities, expenses and profit margin compared to that of various unaffiliated management firms.
In reviewing profitability, the Independent Board Members noted the Adviser’s continued investment in its business with expenditures to, among other things, upgrade its investment technology and compliance systems and provide for additional personnel and other resources. The Independent Board Members recognized the Adviser’s continued commitment to its business should enhance the Adviser’s capacity and capabilities in providing the services necessary to meet the needs of the Nuveen funds as they grow or change over time. In addition, in evaluating profitability, the Independent Board Members also noted the subjective nature of determining profitability which may be affected by numerous factors, including the allocation of expenses and that various allocation methodologies may each be reasonable but yield different results. Further,
the Independent Board Members recognized the difficulties in making comparisons as the profitability of other advisers generally is not publicly available, and the profitability information that is available for certain advisers or management firms may not be representative of the industry and may be affected by, among other things, an adviser’s particular business mix, capital costs, size, types of funds managed and expense allocations. Notwithstanding the foregoing, the Independent Board Members noted the Adviser’s adjusted operating margin appears to be reasonable in relation to other investment advisers and sufficient to operate as a viable investment management firm meeting its obligations to the Nuveen funds. Based on their review, the Independent Board Members concluded that the Adviser’s level of profitability for its advisory activities was reasonable in light of the services to be provided.
With respect to sub-advisers affiliated with Nuveen, including the Sub-Adviser, the Independent Board Members reviewed such sub-advisers’ revenues, expenses and profitability margins (pre- and post-tax) for their advisory activities and the methodology used for allocating expenses among the internal sub-advisers. Based on their review, the Independent Board Members were satisfied that the Sub-Adviser’s level of profitability was reasonable in light of the services to be provided to the Fund.
In evaluating the reasonableness of the compensation, the Independent Board Members also considered other amounts expected to be paid to a Fund Adviser by the Fund as well as indirect benefits (such as soft dollar arrangements), if any, the respective Fund Adviser and its affiliates are expected to receive that are directly attributable to the management of the Fund. See Section E below for additional information on indirect benefits a Fund Adviser may receive as a result of its relationship with the Fund. Based on their review of the overall fee arrangements of the Fund, the Independent Board Members determined that the advisory fees and expected expenses of the Fund were reasonable.
4. The New Advisory Agreements
As noted above, the terms of the New Advisory Agreements are substantially identical to their corresponding Original Advisory Agreements. The fee schedule, including the breakpoint schedule and complex-wide fee schedule, in each New Advisory Agreement is identical to that under the corresponding Original Advisory Agreement. The Board Members also noted that Nuveen has committed for a period of two years from the date of closing the Transaction (i) not to increase contractual management fee rates for any Nuveen fund and (ii) not to raise expense cap levels for any Nuveen fund from levels currently in effect or scheduled to go into effect prior to the Transaction. This commitment shall not limit or otherwise affect mergers or liquidations of any funds in the ordinary course. Based on the information provided, the Board Members did not believe that the overall expenses would increase as a result of the Transaction. In addition, the Board Members recognized that the Nuveen funds may gain access to the retirement platform and institutional client base of TIAA-CREF, and the investors in the retirement platforms may roll their investments into one or more Nuveen funds as they exit their retirement plans. The enhanced distribution access may result in additional sales of the Nuveen funds resulting in an increase in total assets under management in the complex and a corresponding decrease in overall management fees if additional breakpoints at the fund-level or complex-wide level are met. Based on its review, the Board determined that the management fees and expenses under each New Advisory Agreement were reasonable.
Further, other than from a potential reduction in the debt level of Nuveen Investments, Inc., the Board recognized that it is difficult to predict with any degree of certainty the impact of the Transaction on Nuveen’s profitability. Given the fee schedule was not expected to change under the New Advisory Agreements, however, the Independent Board Members concluded that each Fund Adviser’s level of profitability for its advisory activities under the respective New Advisory Agreements would continue to be reasonable in light of the services provided.
D. Economies of Scale and Whether Fee Levels Reflect These Economies of Scale
1. The Original Advisory Agreements
With respect to economies of scale, the Independent Board Members have recognized the potential benefits resulting from the costs of a fund being spread over a larger asset base, although economies of scale are difficult to measure and predict with precision, particularly on a fund-by-fund basis. The Independent Board Members therefore considered whether the Fund could be expected to benefit from any economies of scale. One method to help ensure that the shareholders share in these benefits is to include breakpoints in the advisory fee schedule. Generally, management fees for funds in the Nuveen complex are comprised of a fund-level component and a complex-level component. Accordingly, the Independent Board Members received and reviewed the schedule of proposed advisory fees for the Fund, including fund-level breakpoints thereto. They observed that the fund-level breakpoints for the Fund were consistent with those of other Nuveen taxable fixed income funds.
In addition to fund-level advisory fee breakpoints, the Board also considered the Fund’s complex-wide fee arrangement. Pursuant to the complex-wide fee arrangement, the fees of the funds in the Nuveen complex, including the Fund, are generally reduced as the assets in the fund complex reach certain levels. In evaluating the complex-wide fee arrangement, the Independent Board Members have considered that the complex-wide fee arrangement seeks to provide the benefits of economies of scale to fund shareholders when total fund complex assets increase, even if assets of a particular fund are unchanged or have decreased. The approach reflects the notion that some of Nuveen’s costs are attributable to services provided to all its funds in the complex and therefore all funds benefit if these costs are spread over a larger asset base.
Annual Investment Management Agreement Approval Process (Unaudited) (continued)
Based on their review, the Independent Board Members concluded that the breakpoint schedules and complex-wide fee arrangement were acceptable and reflect economies of scale to be shared with the Fund’s shareholders when assets under management increase.
2. The New Advisory Agreements
As noted, the Independent Board Members recognized that the fund-level and complex-wide schedules will not change under the New Advisory Agreements. Assets in the funds advised by TIAA-CREF or its current affiliates will not be included in the complex-wide fee calculation. Nevertheless, the Nuveen funds may have access to TIAA-CREF’s retirement platform and institutional client base. The access to this distribution network may enhance the distribution of the Nuveen funds which, in turn, may lead to reductions in management and sub-advisory fees if the Nuveen funds reach additional fund-level and complex-wide breakpoint levels. Based on their review, including the considerations in the annual review of the Original Advisory Agreements, the Independent Board Members determined that the fund-level breakpoint schedules and complex-wide fee schedule continue to be appropriate and desirable in ensuring that shareholders participate in the benefits derived from economies of scale under the New Advisory Agreements.
E. Indirect Benefits
1. The Original Advisory Agreements
In evaluating fees, the Independent Board Members received and considered information regarding potential “fall out” or ancillary benefits that the respective Fund Adviser or its affiliates may receive as a result of its relationship with the Fund. In this regard, the Independent Board Members considered, among other things, any sales charges, distribution fees and shareholder services fees expected to be received and retained by the Fund’s principal underwriter, an affiliate of the Adviser, including fees to be received pursuant to any 12b-1 plan.
In addition to the above, the Independent Board Members considered whether the Fund Advisers will receive any benefits from soft dollar arrangements whereby a portion of the commissions paid by the Fund for brokerage may be used to acquire research that may be useful to a Fund Adviser in managing the assets of the Fund and other clients. The Fund’s portfolio transactions will be allocated by the Sub-Adviser. Accordingly, the Independent Board Members considered that the Sub-Adviser may benefit from its soft dollar arrangements pursuant to which it receives research from brokers that execute the Fund’s portfolio transactions. With respect to any fixed income securities, however, the Board recognized that such securities generally trade on a principal basis that does not generate soft dollar credits. Similarly, the Board recognized that the research received pursuant to soft dollar arrangements by the Sub-Adviser may also benefit the Fund and its shareholders to the extent the research enhances the ability of the Sub-Adviser to manage the Fund. The Independent Board Members noted that the Sub-Adviser’s profitability may be somewhat lower if it did not receive the research services pursuant to the soft dollar arrangements and had to acquire such services directly.
Based on their review, the Independent Board Members concluded that any indirect benefits expected to be received by a Fund Adviser as a result of its relationship with the Fund were reasonable and within acceptable parameters.
2. The New Advisory Agreements
The Independent Board Members noted that as the applicable policies and operations of the Fund Advisers with respect to the Nuveen funds were not anticipated to change significantly after the Transaction, such indirect benefits should remain after the Transaction. The Independent Board Members further noted the benefits the Transaction would provide to TIAA-CREF and Nuveen, including a larger-scale fund complex, certain shared services (noted above) and a broader range of investment capabilities, distribution capabilities and product line. Further, the Independent Board Members noted that Nuveen Investments, Inc. (the parent of the Adviser) would benefit from an improved capital structure through a reduction in its debt level.
F. Other Considerations for the New Advisory Agreements
In addition to the factors above, the Board Members also considered the following with respect to the Nuveen funds:
| | • | | Nuveen would rely on the provisions of Section 15(f) of the 1940 Act. In this regard, to help ensure that an unfair burden is not imposed on the Nuveen funds, Nuveen has committed for a period of two years from the date of the closing of the Transaction (i) not to increase contractual management fee rates for any fund and (ii) not to raise expense cap levels for any fund from levels currently in effect or scheduled to go into effect prior to the Transaction. This commitment shall not limit or otherwise affect mergers or liquidations of any funds in the ordinary course. |
| | • | | The Nuveen funds would not incur any costs in seeking the necessary shareholder approvals for the new investment management agreements or the new sub-advisory agreements (except for any costs attributed to seeking shareholder approvals of fund specific matters unrelated to the Transaction, such as election of Board Members or changes to investment policies, in which case a portion of such costs will be borne by the applicable funds). |
| | • | | The reputation, financial strength and resources of TIAA-CREF. |
| | • | | The long-term investment philosophy of TIAA-CREF and anticipated plans to grow Nuveen’s business to the benefit of the Nuveen funds. |
| | • | | The benefits to the Nuveen funds as a result of the Transaction including: (i) increased resources and support available to Nuveen as well as an improved capital structure that may reinforce and enhance the quality and level of services it provides to the funds; (ii) potential additional distribution capabilities for the funds to access new markets and customer segments through TIAA-CREF’s distribution network, including, in particular, its retirement platforms and institutional client base; and (iii) access to TIAA-CREF’s expertise and investment capabilities in additional asset classes. |
G. Other Considerations
The Independent Board Members did not identify any single factor discussed previously as all-important or controlling. The Board Members, including the Independent Board Members, unanimously concluded that the terms of each Original Advisory Agreement and New Advisory Agreement are fair and reasonable, that the respective Fund Adviser’s fees are reasonable in light of the services provided to the Fund and that the Original Advisory Agreements and New Advisory Agreements be approved.
Directors/Trustees
and Officers (Unaudited)
The management of the Funds, including general supervision of the duties performed for the Funds by the Adviser, is the responsibility of the Board of Directors of the Funds. The number of directors of the Funds is currently set at twelve. None of the directors who are not “interested” persons of the Funds (referred to herein as “independent directors”) has ever been a director or employee of, or consultant to, Nuveen or its affiliates. The names and business addresses of the directors and officers of the Funds, their principal occupations and other affiliations during the past five years, the number of portfolios each oversees and other directorships they hold are set forth below.
The Funds’ Statement of Additional Information (“SAI”) includes more information about the directors. To request a free copy, call Nuveen Investments at (800) 257-8787 or visit the Funds’ website at www.nuveen.com.
| | | | | | | | |
Name, Year of Birth & Address | | Position(s) Held with the Funds | | Year First Elected or Appointed (1) | | Principal Occupation(s) Including other Directorships During Past 5 Years | | Number of Portfolios in Fund Complex Overseen by Director |
| | | |
| Independent Directors: | | | | |
William J. Schneider 1944 333 W. Wacker Drive Chicago, IL 60606 | | Chairman and Director/Trustee | | 1996 | | Chairman of Miller-Valentine Partners, a real estate investment company; formerly, Senior Partner and Chief Operating Officer (retired 2004) of Miller-Valentine Group; owner in several other Miller-Valentine entities; Board Member of Med-America Health System, Tech Town, Inc., a not-for-profit community development company, and WDPR Public Radio station; formerly, member, Business Advisory Council, Cleveland Federal Reserve Bank and University of Dayton Business School Advisory Council. | | 202 |
Robert P. Bremner 1940 333 W. Wacker Drive Chicago, IL 60606 | | Director/Trustee | | 1996 | | Private Investor and Management Consultant; Treasurer and Director, Humanities Council of Washington, D.C.; Board Member, Independent Directors Council affiliated with the Investment Company Institute. | | 202 |
Jack B. Evans 1948 333 W. Wacker Drive Chicago, IL 60606 | | Director/Trustee | | 1999 | | President, The Hall-Perrine Foundation, a private philanthropic corporation (since 1996); Chairman, United Fire Group, a publicly held company; formerly, President Pro-Tem of the Board of Regents for the State of Iowa University System; Director, Source Media Group; Life Trustee of Coe College; formerly, Director, Alliant Energy; formerly, Director, Federal Reserve Bank of Chicago; formerly, President and Chief Operating Officer, SCI Financial Group, Inc., a regional financial services firm. | | 202 |
William C. Hunter 1948 333 W. Wacker Drive Chicago, IL 60606 | | Director/Trustee | | 2004 | | Dean Emeritus (since June 30, 2012), formerly, Dean, Tippie College of Business, University of Iowa (2006-2012); Director (since 2004) of Xerox Corporation; Director (since 2005), and President (since July 2012) Beta Gamma Sigma, Inc., The International Honor Society; Director of Wellmark, Inc. (since 2009); formerly, Dean and Distinguished Professor of Finance, School of Business at the University of Connecticut (2003-2006); previously, Senior Vice President and Director of Research at the Federal Reserve Bank of Chicago (1995-2003); formerly, Director (1997-2007), Credit Research Center at Georgetown University. | | 202 |
| | | | | | | | |
Name, Year of Birth & Address | | Position(s) Held with the Funds | | Year First Elected or Appointed (1) | | Principal Occupation(s) Including other Directorships During Past 5 Years | | Number of Portfolios in Fund Complex Overseen by Director |
David J. Kundert 1942 333 W. Wacker Drive Chicago, IL 60606 | | Director/Trustee | | 2005 | | Formerly, Director, Northwestern Mutual Wealth Management Company (2006-2013); retired (since 2004) as Chairman, JPMorgan Fleming Asset Management, President and CEO, Banc One Investment Advisors Corporation, and President, One Group Mutual Funds; prior thereto, Executive Vice President, Banc One Corporation and Chairman and CEO, Banc One Investment Management Group; Regent Emeritus, Member of Investment Committee, Luther College; member of the Wisconsin Bar Association; member of Board of Directors, Friends of Boerner Botanical Gardens; member of Board of Directors and Chair of Investment Committee, Greater Milwaukee Foundation; member of the Board of Directors (Milwaukee), College Possible. | | 202 |
John K. Nelson 1962 333 West Wacker Drive Chicago, IL 60606 | | Director/Trustee | | 2013 | | Senior external advisor to the financial services practice of Deloitte Consulting LLP (since 2012); Member of Board of Directors of Core12 LLC (since 2008), a private firm which develops branding, marketing and communications strategies for clients; Chairman of the Board of Trustees of Marian University (since 2010 as trustee, 2011-2014 as Chairman); Director of The Curran Center for Catholic American Studies (since 2009) and The President’s Council, Fordham University (since 2010); formerly, Chief Executive Officer of ABN AMRO N.V. North America, and Global Head of its Financial Markets Division (2007-2008); prior senior positions held at ABN AMRO include Corporate Executive Vice President and Head of Global Markets—the Americas (2006-2007), CEO of Wholesale Banking North America and Global Head of Foreign Exchange and Futures Markets (2001-2006), and Regional Commercial Treasurer and Senior Vice President Trading—North America (1996-2001); formerly, Trustee at St. Edmund Preparatory School in New York City. | | 202 |
Judith M. Stockdale 1947 333 W. Wacker Drive Chicago, IL 60606 | | Director/Trustee | | 1997 | | Board Member, Land Trust Alliance (since June 2013) and U.S. Endowment for Forestry and communities (Since November 2013); formerly, Executive Director (1994-2012), Gaylord and Dorothy Donnelley Foundation (since 1994); prior thereto, Executive Director, Great Lakes Protection Fund (1990-1994). | | 202 |
Carole E. Stone 1947 333 W. Wacker Drive Chicago, IL 60606 | | Director/Trustee | | 2007 | | Director, Chicago Board Options Exchange (since 2006), C2 Options Exchange, Incorporated (since 2009) Director, CBOE Holdings, Inc. (since 2010); formerly, Commissioner, New York State Commission on Public Authority Reform (2005-2010); formerly, Chair, New York Racing Association Oversight Board (2005-2007). | | 202 |
Virginia L. Stringer 1944 333 W. Wacker Drive Chicago, IL 60606 | | Director/Trustee | | 2011 | | Board Member, Mutual Fund Directors Forum; former governance consultant and non-profit board member; former Owner and President, Strategic Management Resources, Inc., a management consulting firm; former Member, Governing Board, Investment Company Institute’s Independent Directors Council; previously, held several executive positions in general management, marketing and human resources at IBM and The Pillsbury Company; Independent Director, First American Fund Complex (1987-2010) and Chair (1997-2010). | | 202 |
Directors/Trustees and Officers (Unaudited) (continued)
| | | | | | | | |
Name, Year of Birth & Address | | Position(s) Held with the Funds | | Year First Elected or Appointed (1) | | Principal Occupation(s) Including other Directorships During Past 5 Years | | Number of Portfolios in Fund Complex Overseen by Director |
Terence J. Toth 1959 333 W. Wacker Drive Chicago, IL 60606 | | Director/Trustee | | 2008 | | Managing Partner, Promus Capital (since 2008); Director, Fulcrum IT Service LLC (since 2010), Quality Control Corporation (since 2012) and LogicMark LLC (since 2012); formerly, Director, Legal & General Investment Management America, Inc. (2008-2013); formerly, CEO and President, Northern Trust Global Investments (2004-2007); Executive Vice President, Quantitative Management & Securities Lending (2000-2004); prior thereto, various positions with Northern Trust Company (since 1994); member: Chicago Fellowship Board (since 2005), Catalyst Schools of Chicago Board (since 2008) and Chairman and Mather Foundation Board (since 2012), and a member of its investment committee; formerly, Member, Northern Trust Mutual Funds Board (2005-2007), Northern Trust Global Investments Board (2004-2007), Northern Trust Japan Board (2004-2007), Northern Trust Securities Inc. Board (2003-2007) and Northern Trust Hong Kong Board (1997-2004). | | 202 |
| | | |
| Interested Board Members: | | | | |
William Adams IV(2) 1955 333 W. Wacker Drive Chicago, IL 60606 | | Director/Trustee | | 2013 | | Senior Executive Vice President, Global Structured Products (since 2010); Co-President of Nuveen Fund Advisors, LLC (since 2011); President (since 2011), formerly, Managing Director (2010-2011) of Nuveen Commodities Asset Management, LLC; Board Member of the Chicago Symphony Orchestra and of Gilda’s Club Chicago; formerly, Executive Vice President, U.S. Structured Products, of Nuveen Investments, Inc. (1999-2010). | | 202 |
Thomas S. Schreier, Jr.(2) 1962 333 W. Wacker Drive Chicago, IL 60606 | | Director/Trustee | | 2013 | | Vice Chairman, Wealth Management of Nuveen Investments, Inc. (since 2011); Co-President of Nuveen Fund Advisors, LLC; Chairman of Nuveen Asset Management, LLC (since 2011); Co-Chief Executive Officer of Nuveen Securities, LLC (since 2011); Member of Board of Governors and Chairman’s Council of the Investment Company Institute; formerly, Chief Executive Officer (2000-2010) and Chief Investment Officer (2007-2010) of FAF Advisors, Inc.; formerly, President of First American Funds (2001-2010). | | 202 |
| | | | | | | | |
Name,
Year of Birth & Address | | Position(s) Held with the Funds | | Year First Elected or Appointed (2) | | Principal Occupation(s) During Past 5 Years | | Number of Portfolios in Fund Complex Overseen by Officer |
| | | |
| Officers of the Funds: | | | | |
Gifford R. Zimmerman 1956 333 W. Wacker Drive Chicago, IL 60606 | | Chief Administrative Officer | | 1988 | | Managing Director (since 2002), and Assistant Secretary of Nuveen Securities, LLC; Managing Director (since 2004) and Assistant Secretary (since 1994) of Nuveen Investments, Inc.; Managing Director (since 2002), Assistant Secretary (since 1997) and Co-General Counsel (since 2011) of Nuveen Fund Advisors, LLC; Managing Director, Assistant Secretary and Associate General Counsel of Nuveen Asset Management, LLC (since 2011); Managing Director, Associate General Counsel and Assistant Secretary of Symphony Asset Management LLC (since 2003); Vice President and Assistant Secretary of NWQ Investment Management Company, LLC (since 2002), Nuveen Investments Advisers Inc. (since 2002), Santa Barbara Asset Management, LLC (since 2006) and of Winslow Capital Management, LLC, (since 2010); Vice President and Assistant Secretary (since 2013), formerly, Chief Administrative Officer and Chief Compliance Officer (2006-2013) of Nuveen Commodities Asset Management, LLC; Chartered Financial Analyst. | | 202 |
Margo L. Cook 1964 333 W. Wacker Drive Chicago, IL 60606 | | Vice President | | 2009 | | Executive Vice President (since 2008) of Nuveen Investments, Inc. and of Nuveen Fund Advisors, LLC (since 2011); Managing Director – Investment Services of Nuveen Commodities Asset Management, LLC (since August 2011), previously, Head of Institutional Asset Management (2007-2008) of Bear Stearns Asset Management; Head of Institutional Asset Management (1986-2007) of Bank of NY Mellon; Chartered Financial Analyst. | | 202 |
Lorna C. Ferguson 1945 333 W. Wacker Drive Chicago, IL 60606 | | Vice President | | 1998 | | Managing Director (since 2005) of Nuveen Fund Advisors, LLC and Nuveen Securities, LLC (since 2004). | | 202 |
Stephen D. Foy 1954 333 W. Wacker Drive Chicago, IL 60606 | | Vice President and Controller | | 1998 | | Managing Director (since 2014), formerly, Senior Vice President (2013-2014), and Vice President of Nuveen Fund Advisors, LLC; Chief Financial Officer of Nuveen Commodities Asset Management, LLC (since 2010); Senior Vice President (2010-2011), Formerly Vice President (2005-2010) and Funds Controller of Nuveen Securities, LLC; Certified Public Accountant. | | 202 |
Scott S. Grace 1970 333 W. Wacker Drive Chicago, IL 60606 | | Vice President and Treasurer | | 2009 | | Managing Director, Corporate Finance & Development, Treasurer (since 2009) of Nuveen Securities, LLC; Managing Director and Treasurer (since 2009) of Nuveen Fund Advisors, LLC, Nuveen Investments Advisers, Inc., Nuveen Investments Holdings Inc. and (since 2011) Nuveen Asset Management, LLC; Vice President and Treasurer of NWQ Investment Management Company, LLC, Tradewinds Global Investors, LLC, Symphony Asset Management LLC and Winslow Capital Management, LLC.; Vice President of Santa Barbara Asset Management, LLC; formerly, Treasurer (2006-2009), Senior Vice President (2008-2009), previously, Vice President (2006-2008) of Janus Capital Group, Inc.; formerly, Senior Associate in Morgan Stanley’s Global Financial Services Group (2000-2003); Chartered Accountant Designation. | | 202 |
Walter M. Kelly 1970 333 W. Wacker Drive Chicago, IL 60606 | | Chief Compliance Officer and Vice President | | 2003 | | Senior Vice President (since 2008) of Nuveen Investment Holdings, Inc. | | 202 |
Directors/Trustees and Officers (Unaudited) (continued)
| | | | | | | | |
Name,
Year of Birth & Address | | Position(s) Held with the Funds | | Year First Elected or Appointed (2) | | Principal Occupation(s) During Past 5 Years | | Number of Portfolios in Fund Complex Overseen by Officer |
Tina M. Lazar 1961 333 W. Wacker Drive Chicago, IL 60606 | | Vice President | | 2002 | | Senior Vice President of Nuveen Investment Holdings, Inc. | | 202 |
Kevin J. McCarthy 1966 333 W. Wacker Drive Chicago, IL 60606 | | Vice President and Secretary | | 2007 | | Managing Director and Assistant Secretary (since 2008), Nuveen Securities, LLC; Managing Director (since 2008), Assistant Secretary (since 2007) and Co-General Counsel (since 2011) of Nuveen Fund Advisors, LLC; Managing Director, Assistant Secretary and Associate General Counsel (since 2011) of Nuveen Asset Management, LLC; Managing Director (since 2008), and Assistant Secretary, Nuveen Investment Holdings, Inc.; Vice President (since 2007) and Assistant Secretary of Nuveen Investments Advisers Inc., NWQ Investment Management Company, LLC, NWQ Holdings, LLC, Symphony Asset Management LLC, Santa Barbara Asset Management, LLC, and of Winslow Capital Management, LLC. (since 2010); Vice President and Secretary (since 2010) of Nuveen Commodities Asset Management, LLC. | | 202 |
Kathleen L. Prudhomme 1953 901 Marquette Avenue Minneapolis, MN 55402 | | Vice President and Assistant Secretary | | 2011 | | Managing Director, Assistant Secretary and Co-General Counsel (since 2011) of Nuveen Fund Advisors, LLC; Managing Director, Assistant Secretary and Associate General Counsel (since 2011) of Nuveen Asset Management, LLC; Managing Director and Assistant Secretary (since 2011) of Nuveen Securities, LLC; formerly, Deputy General Counsel, FAF Advisors, Inc. (2004-2010). | | 202 |
Joel T. Slager 1978 333 West Wacker Drive Chicago, IL 60606 | | Vice President and Assistant Secretary | | 2013 | | Fund Tax Director for Nuveen Funds (since May, 2013); previously, Vice President of Morgan Stanley Investment Management, Inc., Assistant Treasurer of the Morgan Stanley Funds (from 2010 to 2013); Tax Director at PricewaterhouseCoopers LLP (from 2008 to 2010). | | 202 |
Jeffery M. Wilson 1956 333 West Wacker Drive Chicago, IL 60606 | | Vice President | | 2011 | | Senior Vice President of Nuveen Securities, LLC (since 2011); formerly, Senior Vice President of FAF Advisors, Inc. (2000-2010). | | 107 |
| (1) | Each director serves an indefinite term until his/her successor is elected. |
| (2) | Officers serve one year terms through August of each year. The year first elected or appointed represents the year in which the officer was first elected or appointed to any fund in the Nuveen Fund Complex. |
Notes
Notes
Notes
| | | | | | | | | | | | | | |
| | | | | | | | |
| | | | |
| | | | | | | | |
| | | | | |
| | Nuveen Investments: | | | | | | | | |
| | | | Serving Investors for Generations | | |
| | |
| | | | |
| | | |
| | | | Since 1898, financial advisors and their clients have relied on Nuveen Investments to provide dependable investment solutions through continued adherence to proven, long-term investing principles. Today, we offer a range of high quality equity and fixed-income solutions designed to be integral components of a well-diversified core portfolio. | | |
| | | |
| | | | | | |
| | | | |
| | | | | | Focused on meeting investor needs. Nuveen Investments provides high-quality investment services designed to help secure the longterm goals of institutional and individual investors as well as the consultants and financial advisors who serve them. Nuveen Investments markets a wide range of specialized investment solutions which provide investors access to capabilities of its high-quality boutique investment affiliates-Nuveen Asset Management, Symphony Asset Management, NWQ Investment Management Company, Santa Barbara Asset Management, Tradewinds Global Investors, Winslow Capital Management, and Gresham Investment Management. In total, Nuveen Investments managed approximately $231 billion as of June 30, 2014. | | |
| | | | | |
| | | | | | | | | | |
| | | | | | Find out how we can help you. To learn more about how the products and services of Nuveen Investments may be able to help you meet your financial goals, talk to your financial advisor, or call us at (800) 257-8787. Please read the information provided carefully before you invest. Investors should consider the investment objective and policies, risk considerations, charges and expenses of any investment carefully. Where applicable, be sure to obtain a prospectus, which contains this and other relevant information. To obtain a prospectus, please contact your securities representative or Nuveen Investments, 333 W. Wacker Dr., Chicago, IL 60606. Please read the prospectus carefully before you invest or send money. Learn more about Nuveen Funds at: www.nuveen.com/mf | | |
| | | | | | |
| | | | | | | | | | | | |
| | Distributed by Nuveen Securities, LLC | 333 West Wacker Drive Chicago, IL 60606 | www.nuveen.com | | |
MAN-GHSU-0614D 2830-INV-Y08/15
ITEM 2. CODE OF ETHICS.
As of the end of the period covered by this report, the registrant has adopted a code of ethics that applies to the registrant’s principal executive officer, principal financial officer, principal accounting officer or controller, or persons performing similar functions. There were no amendments to or waivers from the code during the period covered by this report. The registrant has posted the code of ethics on its website at www.nuveen.com/MutualFunds/ShareholderResources/FundGovernance.aspx. (To view the code, click on Code of Conduct.)
ITEM 3. AUDIT COMMITTEE FINANCIAL EXPERT.
The registrant’s Board of Directors determined that the registrant has at least one “audit committee financial expert” (as defined in Item 3 of Form N-CSR) serving on its Audit Committee. The registrant’s audit committee financial expert is Carole E. Stone, who is “independent” for purposes of Item 3 of Form N-CSR.
Ms. Stone served for five years as Director of the New York State Division of the Budget. As part of her role as Director, Ms. Stone was actively involved in overseeing the development of the State’s operating, local assistance and capital budgets, its financial plan and related documents; overseeing the development of the State’s bond-related disclosure documents and certifying that they fairly presented the State’s financial position; reviewing audits of various State and local agencies and programs; and coordinating the State’s system of internal audit and control. Prior to serving as Director, Ms. Stone worked as a budget analyst/examiner with increasing levels of responsibility over a 30 year period, including approximately five years as Deputy Budget Director. Ms. Stone has also served as Chair of the New York State Racing Association Oversight Board, as Chair of the Public Authorities Control Board, as a Commissioner on the New York State Commission on Public Authority Reform and as a member of the Boards of Directors of several New York State public authorities. These positions have involved overseeing operations and finances of certain entities and assessing the adequacy of project/entity financing and financial reporting. Currently, Ms. Stone is on the Board of Directors of CBOE Holdings, Inc., of the Chicago Board Options Exchange, and of C2 Options Exchange. Ms. Stone’s position on the boards of these entities and as a member of both CBOE Holdings’ Audit Committee and its Finance Committee has involved, among other things, the oversight of audits, audit plans and preparation of financial statements.
ITEM 4. PRINCIPAL ACCOUNTANT FEES AND SERVICES.
The following tables show the amount of fees that PricewaterhouseCoopers LLP, the Funds’ auditor, billed to the Funds’ during the Funds’ last two full fiscal years. The Audit Committee approved in advance all audit services and non-audit services that PricewaterhouseCoopers LLP provided to the Funds, except for those non-audit services that were subject to the pre-approval exception under Rule 2-01 of Regulation S-X (the “pre-approval exception”). The preapproval exception for services provided directly to the Funds waives the pre-approval requirement for services other than audit, review or attest services if: (A) the aggregate amount of all such services provided constitutes no more than 5% of the total amount of revenues paid by the Funds during the fiscal year in which the services are provided; (B) the Funds did not recognize the services as non-audit services at the time of the engagement; and (C) the services are promptly brought to the Audit Committee’s attention, and the Committee (or its delegate) approves the services before the audit is completed.
The Audit Committee has delegated certain pre-approval responsibilities to its Chairman (or, in his absence, any other member of the Audit Committee).
SERVICES THAT THE AUDITOR BILLED TO THE FUNDS
| | | | | | | | | | | | | | | | |
Fiscal Year Ended June 30, 2014 | | Audit Fees Billed
to Funds 1 | | | Audit-Related Fees
Billed to Funds 2 | | | Tax Fees
Billed to Funds 3 | | | All Other Fees
Billed to Funds 4 | |
Fund Name | | | | | | | | | | | | | | | | |
5 Nuveen NWQ Global Equity Income Fund | | | 12,407 | | | | 0 | | | | 0 | | | | 0 | |
6 Nuveen NWQ Global Equity Fund | | | 11,620 | | | | 0 | | | | 0 | | | | 0 | |
Nuveen Global Total Return Bond Fund | | | 38,563 | | | | 0 | | | | 2,080 | | | | 0 | |
Nuveen NWQ Multi-Cap Value Fund | | | 13,124 | | | | 0 | | | | 2,540 | | | | 0 | |
Nuveen NWQ Small-Cap Value Fund | | | 13,542 | | | | 0 | | | | 2,540 | | | | 0 | |
7 Nuveen U.S. Infrastructure Income Fund | | | 18,200 | | | | 0 | | | | 0 | | | | 0 | |
Nuveen Tradewinds Value Opportunities Fund | | | 14,634 | | | | 0 | | | | 2,540 | | | | 0 | |
Nuveen NWQ Large-Cap Value Fund | | | 19,677 | | | | 0 | | | | 2,540 | | | | 0 | |
Nuveen NWQ Small/Mid-Cap Value Fund | | | 12,695 | | | | 0 | | | | 2,540 | | | | 0 | |
| | | | | | | | | | | | | | | | |
Total | | $ | 154,462 | | | $ | 0 | | | $ | 14,780 | | | $ | 0 | |
| 1 | | “Audit Fees” are the aggregate fees billed for professional services for the audit of the Fund’s annual financial statements and services provided in connection with statutory and regulatory filings or engagements. |
| 2 | | “Audit-Related Fees” are the aggregate fees billed for assurance and related services reasonably related to the performance of the audit or review of financial statements that are not reported under “Audit Fees”. |
| 3 | | “Tax Fees” are the aggregate fees billed for professional services for tax advice, tax compliance, and tax planning. These fees include: all global withholding tax services; excise and state tax reviews; capital gain, tax equalization and taxable basis calculations performed by the principal accountant. |
| 4 | | “All Other Fees” are the aggregate fees billed for products and services other than “Audit Fees”, “Audit-Related Fees” and “Tax Fees”. |
| 5 | | Fund formerly known as Nuveen NWQ Equity Income Fund. |
| 6 | | Fund commenced operations on 04/01/2014. |
| 7 | | Fund commenced operations on 05/12/2014. |
| | | | | | | | | | | | | | | | |
| | | Percentage Approved Pursuant to Pre-approval Exception | |
| | | Audit Fees Billed
to Funds | | | Audit-Related Fees
Billed to Funds | | | Tax Fees
Billed to Funds | | | All Other Fees
Billed to Funds | |
Fund Name | | | | | | | | | | | | | | | | |
Nuveen NWQ Global Equity Income Fund | | | 0 | % | | | 0 | % | | | 0 | % | | | 0 | % |
Nuveen NWQ Global Equity Fund | | | 0 | % | | | 0 | % | | | 0 | % | | | 0 | % |
Nuveen Global Total Return Bond Fund | | | 0 | % | | | 0 | % | | | 0 | % | | | 0 | % |
Nuveen NWQ Multi-Cap Value Fund | | | 0 | % | | | 0 | % | | | 0 | % | | | 0 | % |
Nuveen NWQ Small-Cap Value Fund | | | 0 | % | | | 0 | % | | | 0 | % | | | 0 | % |
Nuveen U.S. Infrastructure Income Fund | | | 0 | % | | | 0 | % | | | 0 | % | | | 0 | % |
Nuveen Tradewinds Value Opportunities Fund | | | 0 | % | | | 0 | % | | | 0 | % | | | 0 | % |
Nuveen NWQ Large-Cap Value Fund | | | 0 | % | | | 0 | % | | | 0 | % | | | 0 | % |
Nuveen NWQ Small/Mid-Cap Value Fund | | | 0 | % | | | 0 | % | | | 0 | % | | | 0 | % |
| | | | |
June 30, 2013 | | Audit Fees Billed
to Funds 1 | | | Audit-Related Fees
Billed to Funds 2 | | | Tax Fees
Billed to Funds 3 | | | All Other Fees
Billed to Funds 4 | |
Fund Name | | | | | | | | | | | | | | | | |
5 Nuveen NWQ Global Equity Income Fund | | | 11,930 | | | | 0 | | | | 0 | | | | 0 | |
6 Nuveen NWQ Global Equity Fund | | | 0 | | | | 0 | | | | 0 | | | | 0 | |
Nuveen Global Total Return Bond Fund | | | 37,170 | | | | 0 | | | | 4,643 | | | | 0 | |
Nuveen NWQ Multi-Cap Value Fund | | | 12,579 | | | | 0 | | | | 2,500 | | | | 0 | |
Nuveen NWQ Small-Cap Value Fund | | | 12,515 | | | | 3,000 | | | | 2,500 | | | | 0 | |
7 Nuveen U.S. Infrastructure Income Fund | | | 0 | | | | 0 | | | | 0 | | | | 0 | |
Nuveen Tradewinds Value Opportunities Fund | | | 14,472 | | | | 0 | | | | 2,500 | | | | 0 | |
Nuveen NWQ Large-Cap Value Fund | | | 16,958 | | | | 0 | | | | 2,500 | | | | 0 | |
Nuveen NWQ Small/Mid-Cap Value Fund | | | 12,076 | | | | 0 | | | | 2,500 | | | | 0 | |
| | | | | | | | | | | | | | | | |
Total | | $ | 117,700 | | | $ | 3,000 | | | $ | 17,143 | | | $ | 0 | |
| 1 | | “Audit Fees” are the aggregate fees billed for professional services for the audit of the Fund’s annual financial statements and services provided in connection with statutory and regulatory filings or engagements. |
| 2 | | “Audit-Related Fees” are the aggregate fees billed for assurance and related services reasonably related to the performance of the audit or review of financial statements that are not reported under “Audit Fees”. |
| 3 | | “Tax Fees” are the aggregate fees billed for professional services for tax advice, tax compliance, and tax planning. These fees include: all global withholding tax services; excise and state tax reviews; capital gain, tax equalization and taxable basis calculations performed by the principal accountant. |
| 4 | | “All Other Fees” are the aggregate fees billed for products and services other than “Audit Fees”, “Audit-Related Fees” and “Tax Fees”. |
| 5 | | Fund formerly known as Nuveen NWQ Equity Income Fund. |
| 6 | �� | Fund commenced operations on 04/01/2014. |
| 7 | | Fund commenced operations on 05/12/2014. |
| | | | | | | | | | | | | | | | |
| | | Percentage Approved Pursuant to Pre-approval Exception | |
| | | Audit Fees Billed
to Funds | | | Audit-Related Fees
Billed to Funds | | | Tax Fees
Billed to Funds | | | All Other Fees
Billed to Funds | |
Fund Name | | | | | | | | | | | | | | | | |
Nuveen NWQ Global Equity Income Fund | | | 0 | % | | | 0 | % | | | 0 | % | | | 0 | % |
Nuveen NWQ Global Equity Fund | | | 0 | % | | | 0 | % | | | 0 | % | | | 0 | % |
Nuveen Global Total Return Bond Fund | | | 0 | % | | | 0 | % | | | 0 | % | | | 0 | % |
Nuveen NWQ Multi-Cap Value Fund | | | 0 | % | | | 0 | % | | | 0 | % | | | 0 | % |
Nuveen NWQ Small-Cap Value Fund | | | 0 | % | | | 0 | % | | | 0 | % | | | 0 | % |
Nuveen U.S. Infrastructure Income Fund | | | 0 | % | | | 0 | % | | | 0 | % | | | 0 | % |
Nuveen Tradewinds Value Opportunities Fund | | | 0 | % | | | 0 | % | | | 0 | % | | | 0 | % |
Nuveen NWQ Large-Cap Value Fund | | | 0 | % | | | 0 | % | | | 0 | % | | | 0 | % |
Nuveen NWQ Small/Mid-Cap Value Fund | | | 0 | % | | | 0 | % | | | 0 | % | | | 0 | % |
| | | | | | | | | | | | |
Fiscal Year Ended June 30, 2014 | | Audit-Related Fees
Billed to Adviser and
Affiliated Fund
Service Providers | | | Tax Fees Billed to
Adviser and
Affiliated Fund
Service Providers | | | All Other Fees
Billed to Adviser
and Affiliated Fund
Service Providers | |
Nuveen Investment Trust | | $ | 0 | | | $ | 0 | | | $ | 0 | |
| |
| | | Percentage Approved Pursuant to Pre-approval Exception | |
| | | Audit-Related Fees
Billed to Adviser and
Affiliated Fund
Service Providers | | | Tax Fees Billed to
Adviser and
Affiliated Fund
Service Providers | | | All Other Fees
Billed to Adviser
and Affiliated Fund
Service Providers | |
| | | 0 | % | | | 0 | % | | | 0 | % |
| | | |
Fiscal Year Ended June 30, 2013 | | Audit-Related Fees
Billed to Adviser and
Affiliated Fund
Service Providers | | | Tax Fees Billed to
Adviser and
Affiliated Fund
Service Providers | | | All Other Fees
Billed to Adviser
and Affiliated Fund
Service Providers | |
Nuveen Investment Trust | | $ | 0 | | | $ | 0 | | | $ | 0 | |
| |
| | | Percentage Approved Pursuant to Pre-approval Exception | |
| | | Audit-Related Fees
Billed to Adviser and
Affiliated Fund
Service Providers | | | Tax Fees Billed to
Adviser and
Affiliated Fund
Service Providers | | | All Other Fees
Billed to Adviser
and Affiliated Fund
Service Providers | |
| | | 0 | % | | | 0 | % | | | 0 | % |
| | | | | | | | | | | | | | | | |
Fiscal Year Ended June 30, 2014 | | Total Non-Audit Fees
Billed to Trust | | | Total Non-Audit Fees
billed to Adviser and
Affiliated Fund Service
Providers (engagements
related directly to the
operations and financial
reporting of the Trust) | | | Total Non-Audit Fees
billed to Adviser and
Affiliated Fund Service
Providers (all other
engagements) | | | Total | |
Fund Name | | | | | | | | | | | | | | | | |
1 Nuveen NWQ Global Equity Income Fund | | | 0 | | | | 0 | | | | 0 | | | | 0 | |
2 Nuveen NWQ Global Equity Fund | | | 0 | | | | 0 | | | | 0 | | | | 0 | |
Nuveen Global Total Return Bond Fund | | | 2,080 | | | | 0 | | | | 0 | | | | 2,080 | |
Nuveen NWQ Multi-Cap Value Fund | | | 2,540 | | | | 0 | | | | 0 | | | | 2,540 | |
Nuveen NWQ Small-Cap Value Fund | | | 2,540 | | | | 0 | | | | 0 | | | | 2,540 | |
3 Nuveen U.S. Infrastructure Income Fund | | | 0 | | | | 0 | | | | 0 | | | | 0 | |
Nuveen Tradewinds Value Opportunities Fund | | | 2,540 | | | | 0 | | | | 0 | | | | 2,540 | |
Nuveen NWQ Large-Cap Value Fund | | | 2,540 | | | | 0 | | | | 0 | | | | 2,540 | |
Nuveen NWQ Small/Mid-Cap Value Fund | | | 2,540 | | | | 0 | | | | 0 | | | | 2,540 | |
| | | | | | | | | | | | | | | | |
Total | | $ | 14,780 | | | $ | 0 | | | $ | 0 | | | $ | 14,780 | |
“Non-Audit Fees billed to Fund” for both fiscal year ends represent “Tax Fees” and “All Other Fees” billed to Fund in their respective amounts from the previous table.
Less than 50 percent of the hours expended on the principal accountant’s engagement to audit the registrant’s financial statements for the most recent fiscal year were attributed to work performed by persons other than the principal accountant’s full-time, permanent employees.
| 1 | | Fund formerly known as Nuveen NWQ Equity Income Fund. |
| 2 | | Fund commenced operations on 04/01/2014. |
| 3 | | Fund commenced operations on 05/12/2014. |
| | | | | | | | | | | | | | | | |
Fiscal Year Ended June 30, 2013 | | Total Non-Audit Fees
Billed to Trust | | | Total Non-Audit Fees
billed to Adviser and
Affiliated Fund Service
Providers (engagements
related directly to the
operations and financial
reporting of the Trust) | | | Total Non-Audit Fees
billed to Adviser and
Affiliated Fund Service
Providers (all other
engagements) | | | Total | |
Fund Name | | | | | | | | | | | | | | | | |
1 Nuveen NWQ Global Equity Income Fund | | | 0 | | | | 0 | | | | 0 | | | | 0 | |
2 Nuveen NWQ Global Equity Fund | | | 0 | | | | 0 | | | | 0 | | | | 0 | |
Nuveen Global Total Return Bond Fund | | | 4,643 | | | | 0 | | | | 0 | | | | 4,643 | |
Nuveen NWQ Multi-Cap Value Fund | | | 2,500 | | | | 0 | | | | 0 | | | | 2,500 | |
Nuveen NWQ Small-Cap Value Fund | | | 2,500 | | | | 0 | | | | 0 | | | | 2,500 | |
3 Nuveen U.S. Infrastructure Income Fund | | | 0 | | | | 0 | | | | 0 | | | | 0 | |
Nuveen Tradewinds Value Opportunities Fund | | | 2,500 | | | | 0 | | | | 0 | | | | 2,500 | |
Nuveen NWQ Large-Cap Value Fund | | | 2,500 | | | | 0 | | | | 0 | | | | 2,500 | |
Nuveen NWQ Small/Mid-Cap Value Fund | | | 2,500 | | | | 0 | | | | 0 | | | | 2,500 | |
| | | | | | | | | | | | | | | | |
Total | | $ | 17,143 | | | $ | 0 | | | $ | 0 | | | $ | 17,143 | |
“Non-Audit Fees billed to Fund” for both fiscal year ends represent “Tax Fees” and “All Other Fees” billed to Fund in their respective amounts from the previous table.
| 1 | | Fund formerly known as Nuveen NWQ Equity Income Fund. |
| 2 | | Fund commenced operations on 04/01/2014. |
| 3 | | Fund commenced operations on 05/12/2014. |
Audit Committee Pre-Approval Policies and Procedures. Generally, the Audit Committee must approve (i) all non-audit services to be performed for the Funds by the Funds’ independent accountant and (ii) all audit and non-audit services to be performed by the Funds’ independent accountant for the Affiliated Fund Service Providers with respect to the operations and financial reporting of the Funds. Regarding tax and research projects conducted by the independent accountant for the Funds and Affiliated Fund Service Providers (with respect to operations and financial reports of the Trust), such engagements will be (i) pre-approved by the Audit Committee if they are expected to be for amounts greater than $10,000; (ii) reported to the Audit Committee Chairman for his verbal approval prior to engagement if they are expected to be for amounts under $10,000 but greater than $5,000; and (iii) reported to the Audit Committee at the next Audit Committee meeting if they are expected to be for an amount under $5,000.
ITEM 5. AUDIT COMMITTEE OF LISTED REGISTRANTS.
Not applicable to this registrant.
ITEM 6. SCHEDULE OF INVESTMENTS.
| a) | | See Portfolio of Investments in Item 1. |
ITEM 7. DISCLOSURE OF PROXY VOTING POLICIES AND PROCEDURES FOR CLOSED-END
MANAGEMENT INVESTMENT COMPANIES.
Not applicable to this registrant.
ITEM 8. PORTFOLIO MANAGERS OF CLOSED-END MANAGEMENT INVESTMENT COMPANIES.
Not applicable to this registrant.
ITEM 9. PURCHASES OF EQUITY SECURITIES BY CLOSED-END MANAGEMENT INVESTMENT COMPANY AND AFFILIATED PURCHASERS.
Not applicable to this registrant.
ITEM 10. SUBMISSION OF MATTERS TO A VOTE OF SECURITY HOLDERS.
There have been no material changes to the procedures by which shareholders may recommend nominees to the registrant’s Board of Trustees implemented after the registrant last provided disclosure in response to this Item.
ITEM 11. CONTROLS AND PROCEDURES.
| | (a) | | The registrant’s principal executive and principal financial officers, or persons performing similar functions, have concluded that the registrant’s disclosure controls and procedures (as defined in Rule 30a-3(c) under the Investment Company Act of 1940, as amended (the “1940 Act”) (17 CFR 270.30a-3(c))) are effective, as of a date within 90 days of the filing date of this report that includes the disclosure required by this paragraph, based on their evaluation of the controls and procedures required by Rule 30a-3(b) under the 1940 Act (17 CFR 270.30a-3(b)) and Rules 13a-15(b) or 15d-15(b) under the Securities Exchange Act of 1934, as amended (the “Exchange Act”) (17 CFR 240.13a-15(b) or 240.15d-15(b)). |
| | (b) | | There were no changes in the registrant’s internal control over financial reporting (as defined in Rule 30a-3(d) under the 1940 Act (17 CFR 270.30a-3(d)) that occurred during the second fiscal quarter of the period covered by this report that has materially affected, or is reasonably likely to materially affect, the registrant’s internal control over financial reporting. |
ITEM 12. EXHIBITS.
File the exhibits listed below as part of this Form.
| | |
| (a)(1) | | Any code of ethics, or amendment thereto, that is the subject of the disclosure required by Item 2, to the extent that the registrant intends to satisfy the Item 2 requirements through filing of an exhibit: Not applicable because the code is posted on registrant’s website at www.nuveen.com/MutualFunds/ShareholderResources/FundGovernance.aspx and there were no amendments during the period covered by this report. (To view the code, click on Code of Conduct.) |
| |
| (a)(2) | | A separate certification for each principal executive officer and principal financial officer of the registrant as required by Rule 30a-2(a) under the 1940 Act (17 CFR 270.30a-2(a)) in the exact form set forth below: See EX-99.CERT attached hereto. |
| |
| (a)(3) | | Any written solicitation to purchase securities under Rule 23c-1 under the 1940 Act (17 CFR 270.23c-1) sent or given during the period covered by the report by or on behalf of the registrant to 10 or more persons: Not applicable to this registrant. |
| |
| (b) | | If the report is filed under Section 13(a) or 15(d) of the Exchange Act, provide the certifications required by Rule 30a-2(b) under the 1940 Act (17 CFR 270.30a-2(b)), Rule 13a-14(b) or Rule 15d-14(b) under the Exchange Act (17 CFR 240.13a-14(b) or 240.15d-14(b)), and Section 1350 of Chapter 63 of Title 18 of the United States Code (18 U.S.C. 1350) as an Exhibit. A certification furnished pursuant to this paragraph will not be deemed “filed” for purposes of Section 18 of the Exchange Act (15 U.S.C. 78r), or otherwise subject to the liability of that section. Such certification will not be deemed to be incorporated by reference into any filing under the Securities Act of 1933 or the Exchange Act, except to the extent that the registration specifically incorporates it by reference: See EX-99.906 CERT attached hereto. |
SIGNATURES
Pursuant to the requirements of the Securities Exchange Act of 1934 and the Investment Company Act of 1940, the registrant has duly caused this report to be signed on its behalf by the undersigned, thereunto duly authorized.
(Registrant) Nuveen Investment Trust
| | |
| |
By (Signature and Title) | | /s/ Kevin J. McCarthy |
| | Kevin J. McCarthy |
| | Vice President and Secretary |
Date: September 5, 2014
Pursuant to the requirements of the Securities Exchange Act of 1934 and the Investment Company Act of 1940, this report has been signed below by the following persons on behalf of the registrant and in the capacities and on the dates indicated.
| | |
| |
By (Signature and Title) | | /s/ Gifford R. Zimmerman |
| | Gifford R. Zimmerman |
| | Chief Administrative Officer |
| | (principal executive officer) |
Date: September 5, 2014
| | |
| |
| By (Signature and Title) | | /s/ Stephen D. Foy |
| | Stephen D. Foy |
| | Vice President and Controller |
| | (principal financial officer) |
Date: September 5, 2014