UNITED STATES
SECURITIES AND EXCHANGE COMMISSION
Washington, D.C. 20549
FORM N‑CSR
CERTIFIED SHAREHOLDER REPORT OF REGISTERED
MANAGEMENT INVESTMENT COMPANIES
| | |
| Investment Company Act file number | | 811-07619 |
Nuveen Investment Trust
(Exact name of registrant as specified in charter)
Nuveen Investments
333 West Wacker Drive
Chicago, Illinois 60606
(Address of principal executive offices) (Zip code)
Mark J. Czarniecki
Vice President and Secretary
901 Marquette Avenue
Minneapolis, Minnesota 55402
(Name and address of agent for service)
Registrant’s telephone number, including area code: (312) 917‑7700
Date of fiscal year end: June 30
Date of reporting period: December 31, 2024
| Item 1. | Reports to Stockholders. |
| | |
 | |
Semi-Annual Shareholder Report
December 31, 2024 |
Nuveen Global Equity Income Fund
Class A Shares/NQGAX
Semi-Annual Shareholder Report
This semi-annual shareholder report contains important information about the Class A Shares of the Nuveen Global Equity Income Fund for the period of July 1, 2024 to December 31, 2024. You can find additional information at https://www.nuveen.com/en‑us/mutual‑funds/prospectuses. You can also request this information by contacting us at (800) 257‑8787.
What were the Fund costs for the last six months? (based on a hypothetical $10,000 investment)
| | | | |
| | |
| | | Cost of a $10,000 investment | | Costs paid as a percentage of
$10,000 investment* |
| | | |
| Class A Shares | | $57 | | 1.11% |
* Annualized for period less than one year.
Fund Statistics (as of December 31, 2024)
| | | | |
| |
| Fund net assets | | | $131,135,832 | |
| |
| Total number of portfolio holdings | | | 59 | |
| |
| Portfolio turnover (%) | | | 15% | |
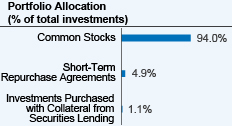
What did the Fund invest in? (as of December 31, 2024)
Availability of additional information about the Fund
You can find additional information about the Fund at https://www.nuveen.com/en‑us/mutual‑funds/prospectuses, including its:
| | • | | prospectus • financial statements and other information • fund holdings • proxy voting information |
You can also request this information at (800) 257‑8787.
| | |
67064Y321_SAR_1224 4148377-0226 | |  |
| | |
| |
Semi-Annual Shareholder Report
December 31, 2024 |
Nuveen Global Equity Income Fund
Class C Shares/NQGCX
Semi-Annual Shareholder Report
This semi-annual shareholder report contains important information about the Class C Shares of the Nuveen Global Equity Income Fund for the period of July 1, 2024 to December 31, 2024. You can find additional information at https://www.nuveen.com/en‑us/mutual‑funds/prospectuses. You can also request this information by contacting us at (800) 257‑8787.
What were the Fund costs for the last six months? (based on a hypothetical $10,000 investment)
| | | | |
| | |
| | | Cost of a $10,000 investment | | Costs paid as a percentage of
$10,000 investment* |
| | | |
| Class C Shares | | $95 | | 1.86% |
* Annualized for period less than one year.
Fund Statistics (as of December 31, 2024)
| | | | |
| |
| Fund net assets | | | $131,135,832 | |
| |
| Total number of portfolio holdings | | | 59 | |
| |
| Portfolio turnover (%) | | | 15% | |
What did the Fund invest in? (as of December 31, 2024)
Availability of additional information about the Fund
You can find additional information about the Fund at https://www.nuveen.com/en‑us/mutual‑funds/prospectuses, including its:
| | • | | prospectus • financial statements and other information • fund holdings • proxy voting information |
You can also request this information at (800) 257‑8787.
| | |
67064Y313_SAR_1224 4148377-0226 | | |
| | |
| |
Semi-Annual Shareholder Report
December 31, 2024 |
Nuveen Global Equity Income Fund
Class I Shares/NQGIX
Semi-Annual Shareholder Report
This semi-annual shareholder report contains important information about the Class I Shares of the Nuveen Global Equity Income Fund for the period of July 1, 2024 to December 31, 2024. You can find additional information at https://www.nuveen.com/en‑us/mutual‑funds/prospectuses. You can also request this information by contacting us at (800) 257‑8787.
What were the Fund costs for the last six months? (based on a hypothetical $10,000 investment)
| | | | |
| | |
| | | Cost of a $10,000 investment | | Costs paid as a percentage of
$10,000 investment* |
| | | |
| Class I Shares | | $44 | | 0.86% |
* Annualized for period less than one year.
Fund Statistics (as of December 31, 2024)
| | | | |
| |
| Fund net assets | | | $131,135,832 | |
| |
| Total number of portfolio holdings | | | 59 | |
| |
| Portfolio turnover (%) | | | 15% | |
What did the Fund invest in? (as of December 31, 2024)
Availability of additional information about the Fund
You can find additional information about the Fund at https://www.nuveen.com/en‑us/mutual‑funds/prospectuses, including its:
| | • | | prospectus • financial statements and other information • fund holdings • proxy voting information |
You can also request this information at (800) 257‑8787.
| | |
67064Y297_SAR_1224 4148377-0226 | | |
| | |
| |
Semi-Annual Shareholder Report
December 31, 2024 |
Nuveen Large Cap Value Opportunities Fund
Class A Shares/NQCAX
Semi-Annual Shareholder Report
This semi-annual shareholder report contains important information about the Class A Shares of the Nuveen Large Cap Value Opportunities Fund for the period of July 1, 2024 to December 31, 2024. You can find additional information at https://www.nuveen.com/en‑us/mutual‑funds/prospectuses. You can also request this information by contacting us at (800) 257‑8787.
What were the Fund costs for the last six months? (based on a hypothetical $10,000 investment)
| | | | |
| | |
| | | Cost of a $10,000 investment | | Costs paid as a percentage of
$10,000 investment* |
| | | |
| Class A Shares | | $51 | | 0.99% |
* Annualized for period less than one year.
Fund Statistics (as of December 31, 2024)
| | | | |
| |
| Fund net assets | | | $22,060,585 | |
| |
| Total number of portfolio holdings | | | 58 | |
| |
| Portfolio turnover (%) | | | 14% | |
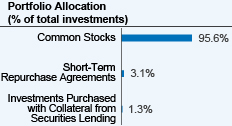
What did the Fund invest in? (as of December 31, 2024)
Availability of additional information about the Fund
You can find additional information about the Fund at https://www.nuveen.com/en‑us/mutual‑funds/prospectuses, including its:
| | • | | prospectus • financial statements and other information • fund holdings • proxy voting information |
You can also request this information at (800) 257‑8787.
| | |
67064Y628_SAR_1224 4148409-0226 | | |
| | |
| |
Semi-Annual Shareholder Report
December 31, 2024 |
Nuveen Large Cap Value Opportunities Fund
Class C Shares/NQCCX
Semi-Annual Shareholder Report
This semi-annual shareholder report contains important information about the Class C Shares of the Nuveen Large Cap Value Opportunities Fund for the period of July 1, 2024 to December 31, 2024. You can find additional information at https://www.nuveen.com/en‑us/mutual‑funds/prospectuses. You can also request this information by contacting us at (800) 257‑8787.
What were the Fund costs for the last six months? (based on a hypothetical $10,000 investment)
| | | | |
| | |
| | | Cost of a $10,000 investment | | Costs paid as a percentage of
$10,000 investment* |
| | | |
| Class C Shares | | $90 | | 1.74% |
* Annualized for period less than one year.
Fund Statistics (as of December 31, 2024)
| | | | |
| |
| Fund net assets | | | $22,060,585 | |
| |
| Total number of portfolio holdings | | | 58 | |
| |
| Portfolio turnover (%) | | | 14% | |
What did the Fund invest in? (as of December 31, 2024)
Availability of additional information about the Fund
You can find additional information about the Fund at https://www.nuveen.com/en‑us/mutual‑funds/prospectuses, including its:
| | • | | prospectus • financial statements and other information • fund holdings • proxy voting information |
You can also request this information at (800) 257‑8787.
| | |
67064Y594_SAR_1224 4148409-0226 | | |
| | |
| |
Semi-Annual Shareholder Report
December 31, 2024 |
Nuveen Large Cap Value Opportunities Fund
Class I Shares/NQCRX
Semi-Annual Shareholder Report
This semi-annual shareholder report contains important information about the Class I Shares of the Nuveen Large Cap Value Opportunities Fund for the period of July 1, 2024 to December 31, 2024. You can find additional information at https://www.nuveen.com/en‑us/mutual‑funds/prospectuses. You can also request this information by contacting us at (800) 257‑8787.
What were the Fund costs for the last six months? (based on a hypothetical $10,000 investment)
| | | | |
| | |
| | | Cost of a $10,000 investment | | Costs paid as a percentage of
$10,000 investment* |
| | | |
| Class I Shares | | $38 | | 0.74% |
* Annualized for period less than one year.
Fund Statistics (as of December 31, 2024)
| | | | |
| |
| Fund net assets | | | $22,060,585 | |
| |
| Total number of portfolio holdings | | | 58 | |
| |
| Portfolio turnover (%) | | | 14% | |
What did the Fund invest in? (as of December 31, 2024)
Availability of additional information about the Fund
You can find additional information about the Fund at https://www.nuveen.com/en‑us/mutual‑funds/prospectuses, including its:
| | • | | prospectus • financial statements and other information • fund holdings • proxy voting information |
You can also request this information at (800) 257‑8787.
| | |
67064Y586_SAR_1224 4148409-0226 | | |
| | |
| |
Semi-Annual Shareholder Report
December 31, 2024 |
Nuveen Multi Cap Value Fund
Class A Shares/NQVAX
Semi-Annual Shareholder Report
This semi-annual shareholder report contains important information about the Class A Shares of the Nuveen Multi Cap Value Fund for the period of July 1, 2024 to December 31, 2024. You can find additional information at https://www.nuveen.com/en‑us/mutual‑funds/prospectuses. You can also request this information by contacting us at (800) 257‑8787.
What were the Fund costs for the last six months? (based on a hypothetical $10,000 investment)
| | | | |
| | |
| | | Cost of a $10,000 investment | | Costs paid as a percentage of
$10,000 investment* |
| | | |
| Class A Shares | | $60 | | 1.15% |
* Annualized for period less than one year.
Fund Statistics (as of December 31, 2024)
| | | | |
| |
| Fund net assets | | $ | 498,311,060 | |
| |
| Total number of portfolio holdings | | | 60 | |
| |
| Portfolio turnover (%) | | | 19% | |
What did the Fund invest in? (as of December 31, 2024)
Availability of additional information about the Fund
You can find additional information about the Fund at https://www.nuveen.com/en‑us/mutual‑funds/prospectuses, including its:
| | • | | prospectus • financial statements and other information • fund holdings • proxy voting information |
You can also request this information at (800) 257‑8787.
| | |
67064Y792_SAR_1224 4148396-0226 | | |
| | |
| |
Semi-Annual Shareholder Report
December 31, 2024 |
Nuveen Multi Cap Value Fund
Class C Shares/NQVCX
Semi-Annual Shareholder Report
This semi-annual shareholder report contains important information about the Class C Shares of the Nuveen Multi Cap Value Fund for the period of July 1, 2024 to December 31, 2024. You can find additional information at https://www.nuveen.com/en‑us/mutual‑funds/prospectuses. You can also request this information by contacting us at (800) 257‑8787.
What were the Fund costs for the last six months? (based on a hypothetical $10,000 investment)
| | | | |
| | |
| | | Cost of a $10,000 investment | | Costs paid as a percentage of
$10,000 investment* |
| | | |
| Class C Shares | | $99 | | 1.90% |
* Annualized for period less than one year.
Fund Statistics (as of December 31, 2024)
| | | | |
| |
| Fund net assets | | $ | 498,311,060 | |
| |
| Total number of portfolio holdings | | | 60 | |
| |
| Portfolio turnover (%) | | | 19% | |
What did the Fund invest in? (as of December 31, 2024)
Availability of additional information about the Fund
You can find additional information about the Fund at https://www.nuveen.com/en‑us/mutual‑funds/prospectuses, including its:
| | • | | prospectus • financial statements and other information • fund holdings • proxy voting information |
You can also request this information at (800) 257‑8787.
| | |
67064Y776_SAR_1224 4148396-0226 | | |
| | |
| |
Semi-Annual Shareholder Report
December 31, 2024 |
Nuveen Multi Cap Value Fund
Class I Shares/NQVRX
Semi-Annual Shareholder Report
This semi-annual shareholder report contains important information about the Class I Shares of the Nuveen Multi Cap Value Fund for the period of July 1, 2024 to December 31, 2024. You can find additional information at https://www.nuveen.com/en‑us/mutual‑funds/prospectuses. You can also request this information by contacting us at (800) 257‑8787.
What were the Fund costs for the last six months? (based on a hypothetical $10,000 investment)
| | | | |
| | |
| | | Cost of a $10,000 investment | | Costs paid as a percentage of
$10,000 investment* |
| | | |
| Class I Shares | | $47 | | 0.90% |
* Annualized for period less than one year.
Fund Statistics (as of December 31, 2024)
| | | | |
| |
| Fund net assets | | | $498,311,060 | |
| |
| Total number of portfolio holdings | | | 60 | |
| |
| Portfolio turnover (%) | | | 19% | |
What did the Fund invest in? (as of December 31, 2024)
Availability of additional information about the Fund
You can find additional information about the Fund at https://www.nuveen.com/en‑us/mutual‑funds/prospectuses, including its:
| | • | | prospectus • financial statements and other information • fund holdings • proxy voting information |
You can also request this information at (800) 257‑8787.
| | |
67064Y768_SAR_1224 4148396-0226 | | |
| | |
| |
Semi-Annual Shareholder Report
December 31, 2024 |
Nuveen Small Cap Value Opportunities Fund
Class A Shares/NSCAX
Semi-Annual Shareholder Report
This semi-annual shareholder report contains important information about the Class A Shares of the Nuveen Small Cap Value Opportunities Fund for the period of July 1, 2024 to December 31, 2024. You can find additional information at https://www.nuveen.com/en‑us/mutual‑funds/prospectuses. You can also request this information by contacting us at (800) 257‑8787.
What were the Fund costs for the last six months? (based on a hypothetical $10,000 investment)
| | | | |
| | |
| | | Cost of a $10,000 investment | | Costs paid as a percentage of
$10,000 investment* |
| | | |
| Class A Shares | | $64 | | 1.20% |
* Annualized for period less than one year.
Fund Statistics (as of December 31, 2024)
| | | | |
| |
| Fund net assets | | | $217,028,185 | |
| |
| Total number of portfolio holdings | | | 66 | |
| |
| Portfolio turnover (%) | | | 42% | |
What did the Fund invest in? (as of December 31, 2024)
Availability of additional information about the Fund
You can find additional information about the Fund at https://www.nuveen.com/en‑us/mutual‑funds/prospectuses, including its:
| | • | | prospectus • financial statements and other information • fund holdings • proxy voting information |
You can also request this information at (800) 257‑8787.
| | |
67064Y750_SAR_1224 4148428-0226 | | |
| | |
| |
Semi-Annual Shareholder Report
December 31, 2024 |
Nuveen Small Cap Value Opportunities Fund
Class C Shares/NSCCX
Semi-Annual Shareholder Report
This semi-annual shareholder report contains important information about the Class C Shares of the Nuveen Small Cap Value Opportunities Fund for the period of July 1, 2024 to December 31, 2024. You can find additional information at https://www.nuveen.com/en‑us/mutual‑funds/prospectuses. You can also request this information by contacting us at (800) 257‑8787.
What were the Fund costs for the last six months? (based on a hypothetical $10,000 investment)
| | | | |
| | |
| | | Cost of a $10,000 investment | | Costs paid as a percentage of
$10,000 investment* |
| | | |
| Class C Shares | | $104 | | 1.95% |
* Annualized for period less than one year.
Fund Statistics (as of December 31, 2024)
| | | | |
| |
| Fund net assets | | | $217,028,185 | |
| |
| Total number of portfolio holdings | | | 66 | |
| |
| Portfolio turnover (%) | | | 42% | |
What did the Fund invest in? (as of December 31, 2024)
Availability of additional information about the Fund
You can find additional information about the Fund at https://www.nuveen.com/en‑us/mutual‑funds/prospectuses, including its:
| | • | | prospectus • financial statements and other information • fund holdings • proxy voting information |
You can also request this information at (800) 257‑8787.
| | |
67064Y735_SAR_1224 4148428-0226 | | |
| | |
| |
Semi-Annual Shareholder Report
December 31, 2024 |
Nuveen Small Cap Value Opportunities Fund
Class R6 Shares/NSCFX
Semi-Annual Shareholder Report
This semi-annual shareholder report contains important information about the Class R6 Shares of the Nuveen Small Cap Value Opportunities Fund for the period of July 1, 2024 to December 31, 2024. You can find additional information at https://www.nuveen.com/en‑us/mutual‑funds/prospectuses. You can also request this information by contacting us at (800) 257‑8787.
What were the Fund costs for the last six months? (based on a hypothetical $10,000 investment)
| | | | |
| | |
| | | Cost of a $10,000 investment | | Costs paid as a percentage of
$10,000 investment* |
| | | |
| Class R6 Shares | | $44 | | 0.83% |
* Annualized for period less than one year.
Fund Statistics (as of December 31, 2024)
| | | | |
| |
| Fund net assets | | | $217,028,185 | |
| |
| Total number of portfolio holdings | | | 66 | |
| |
| Portfolio turnover (%) | | | 42% | |
What did the Fund invest in? (as of December 31, 2024)
Availability of additional information about the Fund
You can find additional information about the Fund at https://www.nuveen.com/en‑us/mutual‑funds/prospectuses, including its:
| | • | | prospectus • financial statements and other information • fund holdings • proxy voting information |
You can also request this information at (800) 257‑8787.
| | |
670729847_SAR_1224 4148428-0226 | | |
| | |
| |
Semi-Annual Shareholder Report
December 31, 2024 |
Nuveen Small Cap Value Opportunities Fund
Class I Shares/NSCRX
Semi-Annual Shareholder Report
This semi-annual shareholder report contains important information about the Class I Shares of the Nuveen Small Cap Value Opportunities Fund for the period of July 1, 2024 to December 31, 2024. You can find additional information at https://www.nuveen.com/en‑us/mutual‑funds/prospectuses. You can also request this information by contacting us at (800) 257‑8787.
What were the Fund costs for the last six months? (based on a hypothetical $10,000 investment)
| | | | |
| | |
| | | Cost of a $10,000 investment | | Costs paid as a percentage of
$10,000 investment* |
| | | |
| Class I Shares | | $51 | | 0.95% |
* Annualized for period less than one year.
Fund Statistics (as of December 31, 2024)
| | | | |
| |
| Fund net assets | | | $217,028,185 | |
| |
| Total number of portfolio holdings | | | 66 | |
| |
| Portfolio turnover (%) | | | 42% | |
What did the Fund invest in? (as of December 31, 2024)
Availability of additional information about the Fund
You can find additional information about the Fund at https://www.nuveen.com/en‑us/mutual‑funds/prospectuses, including its:
| | • | | prospectus • financial statements and other information • fund holdings • proxy voting information |
You can also request this information at (800) 257‑8787.
| | |
67064Y727_SAR_1224 4148428-0226 | | |
| | |
| |
Semi-Annual Shareholder Report
December 31, 2024 |
Nuveen Small/Mid Cap Value Fund
Class A Shares/NSMAX
Semi-Annual Shareholder Report
This semi-annual shareholder report contains important information about the Class A Shares of the Nuveen Small/Mid Cap Value Fund for the period of July 1, 2024 to December 31, 2024. You can find additional information at https://www.nuveen.com/en‑us/mutual‑funds/prospectuses. You can also request this information by contacting us at (800) 257‑8787.
What were the Fund costs for the last six months? (based on a hypothetical $10,000 investment)
| | | | |
| | |
| | | Cost of a $10,000 investment | | Costs paid as a percentage of
$10,000 investment* |
| | | |
| Class A Shares | | $69 | | 1.31% |
* Annualized for period less than one year.
Fund Statistics (as of December 31, 2024)
| | | | |
| |
| Fund net assets | | | $109,493,923 | |
| |
| Total number of portfolio holdings | | | 66 | |
| |
| Portfolio turnover (%) | | | 31% | |
What did the Fund invest in? (as of December 31, 2024)
Availability of additional information about the Fund
You can find additional information about the Fund at https://www.nuveen.com/en‑us/mutual‑funds/prospectuses, including its:
| | • | | prospectus • financial statements and other information • fund holdings • proxy voting information |
You can also request this information at (800) 257‑8787.
| | |
67064Y578_SAR_1224 4148421-0226 | | |
| | |
| |
Semi-Annual Shareholder Report
December 31, 2024 |
Nuveen Small/Mid Cap Value Fund
Class C Shares/NSMCX
Semi-Annual Shareholder Report
This semi-annual shareholder report contains important information about the Class C Shares of the Nuveen Small/Mid Cap Value Fund for the period of July 1, 2024 to December 31, 2024. You can find additional information at https://www.nuveen.com/en‑us/mutual‑funds/prospectuses. You can also request this information by contacting us at (800) 257‑8787.
What were the Fund costs for the last six months? (based on a hypothetical $10,000 investment)
| | | | |
| | |
| | | Cost of a $10,000 investment | | Costs paid as a percentage of
$10,000 investment* |
| | | |
| Class C Shares | | $108 | | 2.06% |
* Annualized for period less than one year.
Fund Statistics (as of December 31, 2024)
| | | | |
| |
| Fund net assets | | $ | 109,493,923 | |
| |
| Total number of portfolio holdings | | | 66 | |
| |
| Portfolio turnover (%) | | | 31% | |
What did the Fund invest in? (as of December 31, 2024)
Availability of additional information about the Fund
You can find additional information about the Fund at https://www.nuveen.com/en‑us/mutual‑funds/prospectuses, including its:
| | • | | prospectus • financial statements and other information • fund holdings • proxy voting information |
You can also request this information at (800) 257‑8787.
| | |
67064Y552_SAR_1224 4148421-0226 | | |
| | |
| |
Semi-Annual Shareholder Report
December 31, 2024 |
Nuveen Small/Mid Cap Value Fund
Class R6 Shares/NWQFX
Semi-Annual Shareholder Report
This semi-annual shareholder report contains important information about the Class R6 Shares of the Nuveen Small/Mid Cap Value Fund for the period of July 1, 2024 to December 31, 2024. You can find additional information at https://www.nuveen.com/en‑us/mutual‑funds/prospectuses. You can also request this information by contacting us at (800) 257‑8787.
What were the Fund costs for the last six months? (based on a hypothetical $10,000 investment)
| | | | |
| | |
| | | Cost of a $10,000 investment | | Costs paid as a percentage of
$10,000 investment* |
| | | |
| Class R6 Shares | | $47 | | 0.89% |
* Annualized for period less than one year.
Fund Statistics (as of December 31, 2024)
| | | | |
| |
| Fund net assets | | $ | 109,493,923 | |
| |
| Total number of portfolio holdings | | | 66 | |
| |
| Portfolio turnover (%) | | | 31% | |
What did the Fund invest in? (as of December 31, 2024)
Availability of additional information about the Fund
You can find additional information about the Fund at https://www.nuveen.com/en‑us/mutual‑funds/prospectuses, including its:
| | • | | prospectus • financial statements and other information • fund holdings • proxy voting information |
You can also request this information at (800) 257‑8787.
| | |
670729466_SAR_1224 4148421-0226 | | |
| | |
| |
Semi-Annual Shareholder Report
December 31, 2024 |
Nuveen Small/Mid Cap Value Fund
Class I Shares/NSMRX
Semi-Annual Shareholder Report
This semi-annual shareholder report contains important information about the Class I Shares of the Nuveen Small/Mid Cap Value Fund for the period of July 1, 2024 to December 31, 2024. You can find additional information at https://www.nuveen.com/en‑us/mutual‑funds/prospectuses. You can also request this information by contacting us at (800) 257‑8787.
What were the Fund costs for the last six months? (based on a hypothetical $10,000 investment)
| | | | |
| | |
| | | Cost of a $10,000 investment | | Costs paid as a percentage of
$10,000 investment* |
| | | |
| Class I Shares | | $56 | | 1.06% |
* Annualized for period less than one year.
Fund Statistics (as of December 31, 2024)
| | | | |
| |
| Fund net assets | | $ | 109,493,923 | |
| |
| Total number of portfolio holdings | | | 66 | |
| |
| Portfolio turnover (%) | | | 31% | |
What did the Fund invest in? (as of December 31, 2024)
Availability of additional information about the Fund
You can find additional information about the Fund at https://www.nuveen.com/en‑us/mutual‑funds/prospectuses, including its:
| | • | | prospectus • financial statements and other information • fund holdings • proxy voting information |
You can also request this information at (800) 257‑8787.
| | |
67064Y545_SAR_1224 4148421-0226 | | |
Not applicable to this filing.
| Item 3. | Audit Committee Financial Expert. |
Not applicable to this filing.
| Item 4. | Principal Accountant Fees and Services. |
Not applicable to this filing.
| Item 5. | Audit Committee of Listed Registrants. |
Not applicable to this registrant.
| (a) | Schedule of Investments is included as part of the financial statements filed under Item 7 of this Form N-CSR. |
| Item 7. | Financial Statements and Financial Highlights for Open-End Management Investment Companies. |
Item
7.
Financial
Statements
and
Financial
Highlights
for
Open-End
Management
Investment
Companies
Portfolio
of
Investments
December
31,
2024
Global
Equity
Income
See
Notes
to
Financial
Statements
(Unaudited)
SHARES
DESCRIPTION
VALUE
LONG-TERM
INVESTMENTS
-
99.3%
130207386
COMMON
STOCKS
-
99.3%
AUSTRALIA
-
1.7%
92,413
BHP
Group
Ltd
$
2,254,392
TOTAL
AUSTRALIA
2,254,392
BELGIUM
-
2.5%
16,619
UCB
SA
3,308,239
TOTAL
BELGIUM
3,308,239
CANADA
-
1.1%
31,394
Nutrien
Ltd
1,404,753
TOTAL
CANADA
1,404,753
FINLAND
-
1.4%
164,692
Nordea
Bank
Abp
1,796,913
TOTAL
FINLAND
1,796,913
FRANCE
-
2.8%
10,530
Airbus
SE
1,686,177
18,135
Publicis
Groupe
SA
1,930,645
TOTAL
FRANCE
3,616,822
GERMANY
-
6.5%
6,264
Allianz
SE
1,925,321
9,218
Deutsche
Boerse
AG
2,123,423
68,961
Deutsche
Post
AG
2,434,486
10,304
Siemens
AG
2,009,225
TOTAL
GERMANY
8,492,455
HONG
KONG
-
2.8%
1,084,000
Hang
Lung
Properties
Ltd
864,201
355,492
Prudential
PLC
2,821,191
TOTAL
HONG
KONG
3,685,392
ITALY
-
1.4%
262,243
Enel
SpA
1,871,411
TOTAL
ITALY
1,871,411
JAPAN
-
7.2%
43,340
Kao
Corp
1,753,603
102,850
Mitsubishi
Electric
Corp
1,736,698
93,760
Mitsui
&
Co
Ltd
1,944,499
176,000
Sumitomo
Mitsui
Trust
Group
Inc
4,111,276
TOTAL
JAPAN
9,546,076
NETHERLANDS
-
4.1%
22,056
Heineken
NV
1,571,912
112,217
ING
Groep
NV
1,758,617
44,965
NN
Group
NV
1,960,857
TOTAL
NETHERLANDS
5,291,386
NORWAY
-
1.5%
175,623
Telenor
ASA
1,959,455
TOTAL
NORWAY
1,959,455
SINGAPORE
-
1.7%
184,520
Oversea-Chinese
Banking
Corp
Ltd
2,253,556
TOTAL
SINGAPORE
2,253,556
SOUTH
KOREA
-
0.9%
42,268
Samsung
Electronics
Co
Ltd
1,255,442
TOTAL
SOUTH
KOREA
1,255,442
SWITZERLAND
-
3.2%
20,012
DSM-Firmenich
AG
2,022,892
3,650
Zurich
Insurance
Group
AG
2,170,895
TOTAL
SWITZERLAND
4,193,787
UNITED
KINGDOM
-
4.2%
43,479
AstraZeneca
PLC,
Sponsored
ADR
2,848,744
216,511
National
Grid
PLC
2,572,205
TOTAL
UNITED
KINGDOM
5,420,949
See
Notes
to
Financial
Statements
Investments
in
Derivatives
SHARES
DESCRIPTION
VALUE
UNITED
STATES
-
56.3%
14,771
AbbVie
Inc
$
2,624,807
33,263
Alliant
Energy
Corp
1,967,174
175,411
AT&T
Inc
3,994,108
13,000
(a)
Boeing
Co/The
2,301,000
22,334
(b)
Broadcom
Inc
5,177,915
13,461
Chevron
Corp
1,949,691
36,860
Cisco
Systems
Inc
2,182,112
24,189
Coca-Cola
Co/The
1,506,007
39,411
Delta
Air
Lines
Inc
2,384,366
5,772
Eaton
Corp
PLC
1,915,554
5,355
Elevance
Health
Inc
1,975,460
78,974
Enterprise
Products
Partners
LP
2,476,625
4,903
Everest
Group
Ltd
1,777,141
29,379
Eversource
Energy
1,687,236
50,461
(b)
Fifth
Third
Bancorp
2,133,491
6,770
General
Dynamics
Corp
1,783,827
53,426
(b)
General
Motors
Co
2,846,003
416,756
Haleon
PLC
1,965,067
5,906
(b)
Home
Depot
Inc/The
2,297,375
4,884
Honeywell
International
Inc
1,103,247
42,038
Intel
Corp
842,862
13,417
JPMorgan
Chase
&
Co
3,216,189
38,082
Las
Vegas
Sands
Corp
1,955,892
19,241
Oracle
Corp
3,206,320
28,471
Sanofi
SA
2,767,687
110,368
Shell
PLC
3,440,280
44,916
Smurfit
WestRock
PLC
2,419,176
2,756
UnitedHealth
Group
Inc
1,394,150
39,987
Walmart
Inc
3,612,825
14,788
Walt
Disney
Co/The
1,646,644
47,069
Wells
Fargo
&
Co
3,306,127
TOTAL
UNITED
STATES
73,856,358
TOTAL
COMMON
STOCKS
(Cost
$95,167,219)
130,207,386
TOTAL
LONG-TERM
INVESTMENTS
(Cost
$95,167,219)
130,207,386
OTHER
ASSETS
&
LIABILITIES,
NET
- 0.7%
928,446
NET
ASSETS
-
100%
$
131,135,832
ADR
American
Depositary
Receipt
(a)
Non-income
producing;
issuer
has
not
declared
an
ex-dividend
date
within
the
past
twelve
months.
(b)
Investment,
or
portion
of
investment,
has
been
pledged
to
collateralize
the
net
payment
obligations
for
investments
in
derivatives.
Options
Written
Type
Description
(a)
Number
of
Contracts
Notional
Amount
(b)
Exercise
Price
Expiration
Date
Value
Call
Boeing
Co/The
(130)
$
(
2,210,000
)
$
170
4/17/25
$
(
244,400
)
Total
Options
Written
(premiums
received
$141,452)
(130)
$(2,210,000)
$(244,400)
(a)
Exchange-traded,
unless
otherwise
noted.
(b)
For
disclosure
purposes,
Notional
Amount
is
calculated
by
multiplying
the
Number
of
Contracts
by
the
Exercise
Price
by
100.
Portfolio
of
Investments
December
31,
2024
International
Value
See
Notes
to
Financial
Statements
(Unaudited)
SHARES
DESCRIPTION
VALUE
LONG-TERM
INVESTMENTS
-
99.4%
103680213
COMMON
STOCKS
-
99.4%
AUSTRALIA
-
1.1%
48,837
BHP
Group
Ltd
$
1,191,367
TOTAL
AUSTRALIA
1,191,367
BELGIUM
-
1.1%
16,282
Groupe
Bruxelles
Lambert
NV
1,113,295
TOTAL
BELGIUM
1,113,295
CANADA
-
3.4%
26,652
Agnico
Eagle
Mines
Ltd
2,084,453
32,996
Nutrien
Ltd
1,476,436
TOTAL
CANADA
3,560,889
CHINA
-
0.8%
9,799
(a)
Baidu
Inc,
Sponsored
ADR
826,154
TOTAL
CHINA
826,154
FINLAND
-
1.0%
93,800
Nordea
Bank
Abp
1,023,428
TOTAL
FINLAND
1,023,428
FRANCE
-
12.1%
35,002
Accor
SA
1,702,413
147,043
Alstom
SA
3,280,979
25,521
Publicis
Groupe
SA
2,716,956
37,814
Societe
Generale
SA
1,061,268
80,919
Technip
Energies
NV
2,161,468
12,006
Thales
SA
1,724,005
TOTAL
FRANCE
12,647,089
GERMANY
-
11.3%
44,499
AIXTRON
SE
699,227
6,037
Allianz
SE
1,855,549
56,296
Deutsche
Post
AG
1,987,382
34,535
Fresenius
Medical
Care
AG
1,572,406
9,683
SAP
SE
2,381,767
16,689
Siemens
AG
3,254,265
TOTAL
GERMANY
11,750,596
HONG
KONG
-
2.3%
916,000
Hang
Lung
Properties
Ltd
730,266
214,698
Prudential
PLC
1,703,848
TOTAL
HONG
KONG
2,434,114
JAPAN
-
21.8%
60,100
FUJIFILM
Holdings
Corp
1,243,446
99,600
Japan
Airlines
Co
Ltd
1,570,135
56,585
Komatsu
Ltd
1,541,508
95,462
Mabuchi
Motor
Co
Ltd
1,349,644
121,600
Mitsubishi
Electric
Corp
2,053,306
59,807
(b)
Nippon
Telegraph
&
Telephone
Corp,
ADR
1,503,165
90,000
Rohm
Co
Ltd
836,245
87,464
Sekisui
House
Ltd
2,085,501
102,600
Seven
&
i
Holdings
Co
Ltd
1,608,524
82,000
Sompo
Holdings
Inc
2,124,642
139,500
Sumitomo
Mitsui
Trust
Group
Inc
3,258,653
12,561
(b)
Toyota
Motor
Corp,
Sponsored
ADR
2,444,496
151,100
Yamaha
Corp
1,074,789
TOTAL
JAPAN
22,694,054
MACAU
-
1.8%
717,091
(a)
Sands
China
Ltd
1,909,327
TOTAL
MACAU
1,909,327
NETHERLANDS
-
8.2%
21,049
Heineken
NV
1,500,144
234,768
ING
Groep
NV
3,679,184
27,975
NN
Group
NV
1,219,949
See
Notes
to
Financial
Statements
SHARES
DESCRIPTION
VALUE
NETHERLANDS
(continued)
12,680
Wolters
Kluwer
NV
$
2,106,710
TOTAL
NETHERLANDS
8,505,987
SINGAPORE
-
1.7%
143,232
Oversea-Chinese
Banking
Corp
Ltd
1,749,303
TOTAL
SINGAPORE
1,749,303
SOUTH
AFRICA
-
1.4%
49,978
Anglo
American
PLC
1,477,707
TOTAL
SOUTH
AFRICA
1,477,707
SOUTH
KOREA
-
1.3%
13,324
Hyundai
Motor
Co
1,367,477
TOTAL
SOUTH
KOREA
1,367,477
SWITZERLAND
-
5.7%
28,156
Adecco
Group
AG
695,530
707
Barry
Callebaut
AG
941,343
11,964
DSM-Firmenich
AG
1,209,368
103,718
UBS
Group
AG
3,144,731
TOTAL
SWITZERLAND
5,990,972
TAIWAN
-
1.6%
50,000
Taiwan
Semiconductor
Manufacturing
Co
Ltd
1,625,001
TOTAL
TAIWAN
1,625,001
UNITED
KINGDOM
-
10.8%
721,930
Barclays
PLC
2,414,996
824,951
Dowlais
Group
PLC
693,033
299,714
Melrose
Industries
PLC
2,071,137
180,846
National
Grid
PLC
2,148,496
1,014,006
Taylor
Wimpey
PLC
1,543,321
532,571
Tesco
PLC
2,449,479
TOTAL
UNITED
KINGDOM
11,320,462
UNITED
STATES
-
12.0%
33,986
Axis
Capital
Holdings
Ltd
3,011,839
87,182
GSK
PLC
1,470,522
7,039
Roche
Holding
AG
1,968,151
25,261
Sanofi
SA
2,455,641
57,252
Shell
PLC,
ADR
3,586,838
TOTAL
UNITED
STATES
12,492,991
TOTAL
COMMON
STOCKS
(Cost
$71,810,161)
103,680,213
TOTAL
LONG-TERM
INVESTMENTS
(Cost
$71,810,161)
103,680,213
SHARES
DESCRIPTION
Coupon
VALUE
INVESTMENTS
PURCHASED
WITH
COLLATERAL
FROM
SECURITIES
LENDING
-
2.0%
2,112,112
(c)
State
Street
Navigator
Securities
Lending
Government
Money
Market
Portfolio
4
.460
%
(d)
2,112,112
TOTAL
INVESTMENTS
PURCHASED
WITH
COLLATERAL
FROM
SECURITIES
LENDING
(Cost
$2,112,112)
2,112,112
PRINCIPAL
DESCRIPTION
RATE
MATURITY
VALUE
SHORT-TERM
INVESTMENTS
-
0.1%
75,000
REPURCHASE
AGREEMENTS
-
0.1%
$
75,000
(e)
Fixed
Income
Clearing
Corporation
4
.430
01/02/25
75,000
TOTAL
REPURCHASE
AGREEMENTS
(Cost
$75,000)
75,000
TOTAL
SHORT-TERM
INVESTMENTS
(Cost
$75,000)
75,000
TOTAL
INVESTMENTS
(Cost
$
73,997,273
)
-
101
.5
%
105,867,325
OTHER
ASSETS
&
LIABILITIES,
NET
- (1.5)%
(
1,527,220
)
NET
ASSETS
-
100%
$
104,340,105
Portfolio
of
Investments
December
31,
2024
(continued)
International
Value
See
Notes
to
Financial
Statements
ADR
American
Depositary
Receipt
(a)
Non-income
producing;
issuer
has
not
declared
an
ex-dividend
date
within
the
past
twelve
months.
(b)
Investment,
or
a
portion
of
investment,
is
out
on
loan
for
securities
lending.
The
total
value
of
the
securities
out
on
loan
as
of
the
end
of
the
reporting
period
was
$2,045,141.
(c)
Investments
made
with
cash
collateral
received
from
securities
on
loan.
(d)
The
rate
shown
is
the
one-day
yield
as
of
the
end
of
the
reporting
period.
(e)
Agreement
with
Fixed
Income
Clearing
Corporation,
4.430%
dated
12/31/24
to
be
repurchased
at
$75,018
on
1/2/25,
collateralized
by
Government
Agency
Securities,
with
coupon
rate
3.250%
and
maturity
date
5/15/42,
valued
at
$76,616.
Portfolio
of
Investments
December
31,
2024
Large
Cap
Value
Opportunities
See
Notes
to
Financial
Statements
(Unaudited)
SHARES
DESCRIPTION
VALUE
LONG-TERM
INVESTMENTS
-
99.8%
21999113
COMMON
STOCKS
-
99
.8
%
21999113
AUTOMOBILES
&
COMPONENTS
-
4.3%
28,105
Ford
Motor
Co
$
278,240
12,541
General
Motors
Co
668,058
TOTAL
AUTOMOBILES
&
COMPONENTS
946,298
BANKS
-
9.1%
7,795
Citigroup
Inc
548,690
2,869
JPMorgan
Chase
&
Co
687,728
10,783
Wells
Fargo
&
Co
757,398
TOTAL
BANKS
1,993,816
CAPITAL
GOODS
-
14.2%
3,262
(a)
Boeing
Co/The
577,374
10,556
Flowserve
Corp
607,181
2,124
General
Dynamics
Corp
559,653
725
Hubbell
Inc
303,695
6,282
nVent
Electric
PLC
428,182
2,203
Regal
Rexnord
Corp
341,751
2,732
RTX
Corp
316,147
TOTAL
CAPITAL
GOODS
3,133,983
CONSUMER
DURABLES
&
APPAREL
-
0.6%
1,145
PulteGroup
Inc
124,691
TOTAL
CONSUMER
DURABLES
&
APPAREL
124,691
CONSUMER
STAPLES
DISTRIBUTION
&
RETAIL
-
3.0%
7,488
Walmart
Inc
676,541
TOTAL
CONSUMER
STAPLES
DISTRIBUTION
&
RETAIL
676,541
ENERGY
-
9.5%
8,462
Baker
Hughes
Co
347,111
1,302
Cheniere
Energy
Inc
279,761
2,833
Hess
Corp
376,817
24,182
Permian
Resources
Corp
347,737
11,866
Shell
PLC,
ADR
743,405
TOTAL
ENERGY
2,094,831
EQUITY
REAL
ESTATE
INVESTMENT
TRUSTS
(REITS)
-
2.6%
2,861
Alexandria
Real
Estate
Equities
Inc
279,091
2,582
Camden
Property
Trust
299,615
TOTAL
EQUITY
REAL
ESTATE
INVESTMENT
TRUSTS
(REITS)
578,706
FINANCIAL
SERVICES
-
10.7%
3,496
Discover
Financial
Services
605,612
2,809
(a)
Fiserv
Inc
577,025
3,276
KKR
&
Co
Inc
484,553
2,853
Morgan
Stanley
358,679
3,240
State
Street
Corp
318,006
TOTAL
FINANCIAL
SERVICES
2,343,875
FOOD,
BEVERAGE
&
TOBACCO
-
1.2%
2,204
Philip
Morris
International
Inc
265,251
TOTAL
FOOD,
BEVERAGE
&
TOBACCO
265,251
HEALTH
CARE
EQUIPMENT
&
SERVICES
-
3.9%
2,308
Quest
Diagnostics
Inc
348,185
1,015
UnitedHealth
Group
Inc
513,448
TOTAL
HEALTH
CARE
EQUIPMENT
&
SERVICES
861,633
HOUSEHOLD
&
PERSONAL
PRODUCTS
-
2.2%
50,425
(b)
Haleon
PLC,
ADR
481,055
TOTAL
HOUSEHOLD
&
PERSONAL
PRODUCTS
481,055
INSURANCE
-
4.2%
4,770
American
International
Group
Inc
347,256
740
Aon
PLC,
Class
A
265,778
1,300
RenaissanceRe
Holdings
Ltd
323,453
TOTAL
INSURANCE
936,487
Portfolio
of
Investments
December
31,
2024
(continued)
Large
Cap
Value
Opportunities
See
Notes
to
Financial
Statements
SHARES
DESCRIPTION
VALUE
MATERIALS
-
5.9%
3,908
BHP
Group
Ltd,
Sponsored
ADR
$
190,828
6,093
Corteva
Inc
347,057
6,088
DuPont
de
Nemours
Inc
464,210
5,418
Smurfit
WestRock
PLC
291,813
TOTAL
MATERIALS
1,293,908
MEDIA
&
ENTERTAINMENT
-
4.4%
2,483
Alphabet
Inc,
Class
A
470,032
6,003
(a)
TripAdvisor
Inc
88,664
2,913
Walt
Disney
Co/The
324,363
8,986
(a)
Warner
Bros
Discovery
Inc
94,982
TOTAL
MEDIA
&
ENTERTAINMENT
978,041
PHARMACEUTICALS,
BIOTECHNOLOGY
&
LIFE
SCIENCES
-
8.8%
5,506
AstraZeneca
PLC,
Sponsored
ADR
360,753
5,841
Gilead
Sciences
Inc
539,533
2,683
Merck
&
Co
Inc
266,905
12,023
Pfizer
Inc
318,970
9,317
Sanofi
SA,
ADR
449,359
TOTAL
PHARMACEUTICALS,
BIOTECHNOLOGY
&
LIFE
SCIENCES
1,935,520
SEMICONDUCTORS
&
SEMICONDUCTOR
EQUIPMENT
-
0.9%
10,440
Intel
Corp
209,322
TOTAL
SEMICONDUCTORS
&
SEMICONDUCTOR
EQUIPMENT
209,322
SOFTWARE
&
SERVICES
-
4.4%
15,494
Gen
Digital
Inc
424,226
3,158
Oracle
Corp
526,249
TOTAL
SOFTWARE
&
SERVICES
950,475
TECHNOLOGY
HARDWARE
&
EQUIPMENT
-
1.7%
3,504
Seagate
Technology
Holdings
PLC
302,430
9,009
(a)
Viasat
Inc
76,667
TOTAL
TECHNOLOGY
HARDWARE
&
EQUIPMENT
379,097
TELECOMMUNICATION
SERVICES
-
2.9%
27,954
AT&T
Inc
636,512
TOTAL
TELECOMMUNICATION
SERVICES
636,512
UTILITIES
-
5.3%
4,465
Alliant
Energy
Corp
264,060
2,286
Duke
Energy
Corp
246,294
5,610
FirstEnergy
Corp
223,166
5,256
Pinnacle
West
Capital
Corp
445,551
TOTAL
UTILITIES
1,179,071
TOTAL
COMMON
STOCKS
(Cost
$13,665,347)
21,999,113
TOTAL
LONG-TERM
INVESTMENTS
(Cost
$13,665,347)
21,999,113
SHARES
DESCRIPTION
RATE
VALUE
INVESTMENTS
PURCHASED
WITH
COLLATERAL
FROM
SECURITIES
LENDING
-
0.0%
4,999
(c)
State
Street
Navigator
Securities
Lending
Government
Money
Market
Portfolio
4
.460
%
(d)
4,999
TOTAL
INVESTMENTS
PURCHASED
WITH
COLLATERAL
FROM
SECURITIES
LENDING
(Cost
$4,999)
4,999
See
Notes
to
Financial
Statements
PRINCIPAL
DESCRIPTION
RATE
MATURITY
VALUE
SHORT-TERM
INVESTMENTS
-
0.1%
25,000
REPURCHASE
AGREEMENTS
-
0
.1
%
25,000
$
25,000
(e)
Fixed
Income
Clearing
Corporation
4
.430
%
01/02/25
$
25,000
TOTAL
REPURCHASE
AGREEMENTS
(Cost
$25,000)
25,000
TOTAL
SHORT-TERM
INVESTMENTS
(Cost
$25,000)
25,000
TOTAL
INVESTMENTS
-
99
.9
%
(Cost
$
13,695,346
)
22,029,112
OTHER
ASSETS
&
LIABILITIES,
NET
- 0.1%
31,473
NET
ASSETS
-
100%
$
22,060,585
ADR
American
Depositary
Receipt
(a)
Non-income
producing;
issuer
has
not
declared
an
ex-dividend
date
within
the
past
twelve
months.
(b)
Investment,
or
a
portion
of
investment,
is
out
on
loan
for
securities
lending.
The
total
value
of
the
securities
out
on
loan
as
of
the
end
of
the
reporting
period
was
$3,711.
(c)
Investments
made
with
cash
collateral
received
from
securities
on
loan.
(d)
The
rate
shown
is
the
one-day
yield
as
of
the
end
of
the
reporting
period.
(e)
Agreement
with
Fixed
Income
Clearing
Corporation,
4.430%
dated
12/31/24
to
be
repurchased
at
$25,006
on
1/2/25,
collateralized
by
Government
Agency
Securities,
with
coupon
rate
3.250%
and
maturity
date
5/15/42,
valued
at
$25,648.
Portfolio
of
Investments
December
31,
2024
Multi
Cap
Value
See
Notes
to
Financial
Statements
(Unaudited)
SHARES
DESCRIPTION
VALUE
LONG-TERM
INVESTMENTS
-
99.9%
497738966
COMMON
STOCKS
-
99
.9
%
497738966
AUTOMOBILES
&
COMPONENTS
-
4.3%
650,353
Ford
Motor
Co
$
6,438,495
281,112
General
Motors
Co
14,974,836
TOTAL
AUTOMOBILES
&
COMPONENTS
21,413,331
BANKS
-
12.0%
253,620
Bank
of
NT
Butterfield
&
Son
Ltd/The
9,269,811
172,766
Citigroup
Inc
12,160,999
63,230
JPMorgan
Chase
&
Co
15,156,863
235,903
Wells
Fargo
&
Co
16,569,826
80,448
Western
Alliance
Bancorp
6,720,626
TOTAL
BANKS
59,878,125
CAPITAL
GOODS
-
14.6%
72,529
(a)
Boeing
Co/The
12,837,633
19,978
Curtiss-Wright
Corp
7,089,593
282,720
Flowserve
Corp
16,262,054
44,709
General
Dynamics
Corp
11,780,374
16,119
Hubbell
Inc
6,752,088
150,401
nVent
Electric
PLC
10,251,332
49,555
Regal
Rexnord
Corp
7,687,467
TOTAL
CAPITAL
GOODS
72,660,541
CONSUMER
DURABLES
&
APPAREL
-
0.6%
26,219
PulteGroup
Inc
2,855,249
TOTAL
CONSUMER
DURABLES
&
APPAREL
2,855,249
CONSUMER
STAPLES
DISTRIBUTION
&
RETAIL
-
3.0%
165,234
Walmart
Inc
14,928,892
TOTAL
CONSUMER
STAPLES
DISTRIBUTION
&
RETAIL
14,928,892
ENERGY
-
10.3%
249,487
(b)
Atlas
Energy
Solutions
Inc
5,533,622
184,058
Baker
Hughes
Co
7,550,059
25,486
Cheniere
Energy
Inc
5,476,177
56,457
Hess
Corp
7,509,346
594,670
Permian
Resources
Corp
8,551,355
269,129
Shell
PLC,
ADR
16,860,932
TOTAL
ENERGY
51,481,491
EQUITY
REAL
ESTATE
INVESTMENT
TRUSTS
(REITS)
-
3.7%
63,271
Alexandria
Real
Estate
Equities
Inc
6,172,086
55,541
Camden
Property
Trust
6,444,978
168,816
STAG
Industrial
Inc
5,709,357
TOTAL
EQUITY
REAL
ESTATE
INVESTMENT
TRUSTS
(REITS)
18,326,421
FINANCIAL
SERVICES
-
8.1%
79,564
Discover
Financial
Services
13,782,872
58,975
(a)
Fiserv
Inc
12,114,645
61,094
Morgan
Stanley
7,680,738
68,303
State
Street
Corp
6,703,939
TOTAL
FINANCIAL
SERVICES
40,282,194
HEALTH
CARE
EQUIPMENT
&
SERVICES
-
2.3%
22,900
UnitedHealth
Group
Inc
11,584,194
TOTAL
HEALTH
CARE
EQUIPMENT
&
SERVICES
11,584,194
HOUSEHOLD
&
PERSONAL
PRODUCTS
-
2.2%
1,142,813
(b)
Haleon
PLC,
ADR
10,902,436
TOTAL
HOUSEHOLD
&
PERSONAL
PRODUCTS
10,902,436
INSURANCE
-
3.7%
14,655
Aon
PLC,
Class
A
5,263,490
16,113
Everest
Group
Ltd
5,840,318
29,226
RenaissanceRe
Holdings
Ltd
7,271,720
TOTAL
INSURANCE
18,375,528
See
Notes
to
Financial
Statements
SHARES
DESCRIPTION
VALUE
MATERIALS
-
4.9%
142,153
DuPont
de
Nemours
Inc
$
10,839,166
63,817
Innospec
Inc
7,023,699
125,081
Smurfit
WestRock
PLC
6,736,863
TOTAL
MATERIALS
24,599,728
MEDIA
&
ENTERTAINMENT
-
4.8%
48,733
Alphabet
Inc,
Class
A
9,225,157
374,471
(a)
TripAdvisor
Inc
5,530,937
61,738
Walt
Disney
Co/The
6,874,526
220,143
(a)
Warner
Bros
Discovery
Inc
2,326,912
TOTAL
MEDIA
&
ENTERTAINMENT
23,957,532
PHARMACEUTICALS,
BIOTECHNOLOGY
&
LIFE
SCIENCES
-
9.9%
446,050
(a)
ADMA
Biologics
Inc
7,649,758
102,749
AstraZeneca
PLC,
Sponsored
ADR
6,732,114
130,222
Gilead
Sciences
Inc
12,028,606
58,055
Merck
&
Co
Inc
5,775,311
243,502
Pfizer
Inc
6,460,108
216,055
Sanofi
SA,
ADR
10,420,333
TOTAL
PHARMACEUTICALS,
BIOTECHNOLOGY
&
LIFE
SCIENCES
49,066,230
SEMICONDUCTORS
&
SEMICONDUCTOR
EQUIPMENT
-
1.3%
95,311
Intel
Corp
1,910,986
86,260
(a)
Rambus
Inc
4,559,703
TOTAL
SEMICONDUCTORS
&
SEMICONDUCTOR
EQUIPMENT
6,470,689
SOFTWARE
&
SERVICES
-
5.8%
360,686
Gen
Digital
Inc
9,875,583
71,781
Oracle
Corp
11,961,586
221,469
(a)
Teradata
Corp
6,898,759
TOTAL
SOFTWARE
&
SERVICES
28,735,928
TECHNOLOGY
HARDWARE
&
EQUIPMENT
-
0.3%
202,661
(a)
Viasat
Inc
1,724,645
TOTAL
TECHNOLOGY
HARDWARE
&
EQUIPMENT
1,724,645
TELECOMMUNICATION
SERVICES
-
2.9%
640,534
AT&T
Inc
14,584,959
TOTAL
TELECOMMUNICATION
SERVICES
14,584,959
UTILITIES
-
5.2%
99,558
Alliant
Energy
Corp
5,887,860
51,456
Duke
Energy
Corp
5,543,869
113,429
FirstEnergy
Corp
4,512,206
117,576
Pinnacle
West
Capital
Corp
9,966,918
TOTAL
UTILITIES
25,910,853
TOTAL
COMMON
STOCKS
(Cost
$397,318,603)
497,738,966
TOTAL
LONG-TERM
INVESTMENTS
(Cost
$397,318,603)
497,738,966
SHARES
DESCRIPTION
RATE
VALUE
INVESTMENTS
PURCHASED
WITH
COLLATERAL
FROM
SECURITIES
LENDING
-
1.2%
6,176,318
(c)
State
Street
Navigator
Securities
Lending
Government
Money
Market
Portfolio
4
.460
%
(d)
6,176,318
TOTAL
INVESTMENTS
PURCHASED
WITH
COLLATERAL
FROM
SECURITIES
LENDING
(Cost
$6,176,318)
6,176,318
Portfolio
of
Investments
December
31,
2024
(continued)
Multi
Cap
Value
See
Notes
to
Financial
Statements
PRINCIPAL
DESCRIPTION
RATE
MATURITY
VALUE
SHORT-TERM
INVESTMENTS
-
0.1%
325,000
REPURCHASE
AGREEMENTS
-
0
.1
%
325,000
$
325,000
(e)
Fixed
Income
Clearing
Corporation
4
.430
%
01/02/25
$
325,000
TOTAL
REPURCHASE
AGREEMENTS
(Cost
$325,000)
325,000
TOTAL
SHORT-TERM
INVESTMENTS
(Cost
$325,000)
325,000
TOTAL
INVESTMENTS
-
101
.2
%
(Cost
$
403,819,921
)
504,240,284
OTHER
ASSETS
&
LIABILITIES,
NET
- (1.2)%
(
5,929,224
)
NET
ASSETS
-
100%
$
498,311,060
ADR
American
Depositary
Receipt
(a)
Non-income
producing;
issuer
has
not
declared
an
ex-dividend
date
within
the
past
twelve
months.
(b)
Investment,
or
a
portion
of
investment,
is
out
on
loan
for
securities
lending.
The
total
value
of
the
securities
out
on
loan
as
of
the
end
of
the
reporting
period
was
$5,908,775.
(c)
Investments
made
with
cash
collateral
received
from
securities
on
loan.
(d)
The
rate
shown
is
the
one-day
yield
as
of
the
end
of
the
reporting
period.
(e)
Agreement
with
Fixed
Income
Clearing
Corporation,
4.430%
dated
12/31/24
to
be
repurchased
at
$325,080
on
1/2/25,
collateralized
by
Government
Agency
Securities,
with
coupon
rate
3.250%
and
maturity
date
5/15/42,
valued
at
$331,618.
Portfolio
of
Investments
December
31,
2024
Small
Cap
Value
Opportunities
See
Notes
to
Financial
Statements
(Unaudited)
SHARES
DESCRIPTION
VALUE
LONG-TERM
INVESTMENTS
-
95.0%
206228680
COMMON
STOCKS
-
95
.0
%
206228680
BANKS
-
16.1%
106,725
(a)
Chain
Bridge
Bancorp
Inc
$
2,675,596
47,284
Enterprise
Financial
Services
Corp
2,666,818
171,693
Home
BancShares
Inc/AR
4,858,912
90,358
Independent
Bank
Corp/MI
3,147,169
133,079
Pacific
Premier
Bancorp
Inc
3,316,329
173,713
Seacoast
Banking
Corp
of
Florida
4,782,318
57,397
SouthState
Corp
5,709,853
59,795
(a)
Texas
Capital
Bancshares
Inc
4,675,969
37,678
Western
Alliance
Bancorp
3,147,620
TOTAL
BANKS
34,980,584
CAPITAL
GOODS
-
12.0%
28,809
Atkore
Inc
2,404,111
112,641
Columbus
McKinnon
Corp/NY
4,194,751
34,839
EnerSys
3,220,169
19,837
ESCO
Technologies
Inc
2,642,487
86,266
Flowserve
Corp
4,962,020
137,902
Mueller
Water
Products
Inc,
Class
A
3,102,795
17,378
(a)
MYR
Group
Inc
2,585,325
60,837
(a)
Vicor
Corp
2,939,644
TOTAL
CAPITAL
GOODS
26,051,302
COMMERCIAL
&
PROFESSIONAL
SERVICES
-
3.8%
480,995
Alight
Inc,
Class
A
3,328,485
54,992
Barrett
Business
Services
Inc
2,388,852
303,484
(a)
TrueBlue
Inc
2,549,266
TOTAL
COMMERCIAL
&
PROFESSIONAL
SERVICES
8,266,603
CONSUMER
DISCRETIONARY
DISTRIBUTION
&
RETAIL
-
1.6%
61,367
Academy
Sports
&
Outdoors
Inc
3,530,443
TOTAL
CONSUMER
DISCRETIONARY
DISTRIBUTION
&
RETAIL
3,530,443
CONSUMER
DURABLES
&
APPAREL
-
1.2%
358,863
(a)
Under
Armour
Inc,
Class
C
2,677,118
TOTAL
CONSUMER
DURABLES
&
APPAREL
2,677,118
CONSUMER
SERVICES
-
4.5%
209,004
(a)
El
Pollo
Loco
Holdings
Inc
2,411,906
172,064
Perdoceo
Education
Corp
4,554,534
26,828
(a)
Stride
Inc
2,788,234
TOTAL
CONSUMER
SERVICES
9,754,674
CONSUMER
STAPLES
DISTRIBUTION
&
RETAIL
-
1.2%
168,073
(a)
Grocery
Outlet
Holding
Corp
2,623,620
TOTAL
CONSUMER
STAPLES
DISTRIBUTION
&
RETAIL
2,623,620
ENERGY
-
4.9%
207,593
Antero
Midstream
Corp
3,132,578
101,460
(b)
Atlas
Energy
Solutions
Inc
2,250,383
64,293
California
Resources
Corp
3,336,164
84,201
Magnolia
Oil
&
Gas
Corp,
Class
A
1,968,619
TOTAL
ENERGY
10,687,744
EQUITY
REAL
ESTATE
INVESTMENT
TRUSTS
(REITS)
-
8.0%
115,187
CareTrust
REIT
Inc
3,115,808
135,468
Independence
Realty
Trust
Inc
2,687,685
69,932
PotlatchDeltic
Corp
2,744,831
70,668
SL
Green
Realty
Corp
4,799,771
119,707
STAG
Industrial
Inc
4,048,491
TOTAL
EQUITY
REAL
ESTATE
INVESTMENT
TRUSTS
(REITS)
17,396,586
FINANCIAL
SERVICES
-
7.2%
691,532
BGC
Group
Inc,
Class
A
6,265,280
249,222
DigitalBridge
Group
Inc
2,811,224
120,165
Marex
Group
PLC
3,745,543
Portfolio
of
Investments
December
31,
2024
(continued)
Small
Cap
Value
Opportunities
See
Notes
to
Financial
Statements
SHARES
DESCRIPTION
VALUE
FINANCIAL
SERVICES
(continued)
28,985
(a)
Mr
Cooper
Group
Inc
$
2,782,850
TOTAL
FINANCIAL
SERVICES
15,604,897
FOOD,
BEVERAGE
&
TOBACCO
-
1.6%
89,657
(a)
Simply
Good
Foods
Co/The
3,494,830
TOTAL
FOOD,
BEVERAGE
&
TOBACCO
3,494,830
HEALTH
CARE
EQUIPMENT
&
SERVICES
-
3.4%
78,522
(a)
Castle
Biosciences
Inc
2,092,611
172,103
(a)
Pediatrix
Medical
Group
Inc
2,257,992
174,902
(a)
Tactile
Systems
Technology
Inc
2,996,071
TOTAL
HEALTH
CARE
EQUIPMENT
&
SERVICES
7,346,674
INSURANCE
-
4.6%
61,523
Axis
Capital
Holdings
Ltd
5,452,168
90,824
(a)
Skyward
Specialty
Insurance
Group
Inc
4,590,245
TOTAL
INSURANCE
10,042,413
MATERIALS
-
2.4%
28,467
Materion
Corp
2,814,817
78,510
Worthington
Steel
Inc
2,498,188
TOTAL
MATERIALS
5,313,005
MEDIA
&
ENTERTAINMENT
-
2.2%
68,187
John
Wiley
&
Sons
Inc,
Class
A
2,980,454
267,542
(a)
Vimeo
Inc
1,712,269
TOTAL
MEDIA
&
ENTERTAINMENT
4,692,723
PHARMACEUTICALS,
BIOTECHNOLOGY
&
LIFE
SCIENCES
-
5.7%
242,746
(a)
ADMA
Biologics
Inc
4,163,094
110,863
(a)
Alkermes
PLC
3,188,420
54,345
(a)
Biohaven
Ltd
2,029,786
17,689
(a)
Cytokinetics
Inc
832,090
43,327
(a)
Halozyme
Therapeutics
Inc
2,071,464
TOTAL
PHARMACEUTICALS,
BIOTECHNOLOGY
&
LIFE
SCIENCES
12,284,854
SEMICONDUCTORS
&
SEMICONDUCTOR
EQUIPMENT
-
2.2%
64,128
(a)
Ambarella
Inc
4,664,671
TOTAL
SEMICONDUCTORS
&
SEMICONDUCTOR
EQUIPMENT
4,664,671
SOFTWARE
&
SERVICES
-
2.0%
310,147
Adeia
Inc
4,335,855
TOTAL
SOFTWARE
&
SERVICES
4,335,855
TECHNOLOGY
HARDWARE
&
EQUIPMENT
-
5.8%
207,867
(a)
Arlo
Technologies
Inc
2,326,032
290,235
(a)
Harmonic
Inc
3,839,809
33,441
(a)
Lumentum
Holdings
Inc
2,807,372
544,356
(a)
Powerfleet
Inc
NJ
3,625,411
TOTAL
TECHNOLOGY
HARDWARE
&
EQUIPMENT
12,598,624
UTILITIES
-
4.6%
33,140
IDACORP
Inc
3,621,539
32,265
MGE
Energy
Inc
3,031,620
47,594
Spire
Inc
3,228,301
TOTAL
UTILITIES
9,881,460
TOTAL
COMMON
STOCKS
(Cost
$172,400,748)
206,228,680
TOTAL
LONG-TERM
INVESTMENTS
(Cost
$172,400,748)
206,228,680
SHARES
DESCRIPTION
RATE
VALUE
INVESTMENTS
PURCHASED
WITH
COLLATERAL
FROM
SECURITIES
LENDING
-
1.1%
2,319,649
(c)
State
Street
Navigator
Securities
Lending
Government
Money
Market
Portfolio
4
.460
%
(d)
2,319,649
TOTAL
INVESTMENTS
PURCHASED
WITH
COLLATERAL
FROM
SECURITIES
LENDING
(Cost
$2,319,649)
2,319,649
See
Notes
to
Financial
Statements
PRINCIPAL
DESCRIPTION
RATE
MATURITY
VALUE
SHORT-TERM
INVESTMENTS
-
5.0%
10784827
REPURCHASE
AGREEMENTS
-
5
.0
%
10784827
$
10,450,000
(e)
Fixed
Income
Clearing
Corporation
4
.430
%
01/02/25
$
10,450,000
334,827
(f)
Fixed
Income
Clearing
Corporation
1
.360
01/02/25
334,827
TOTAL
REPURCHASE
AGREEMENTS
(Cost
$10,784,827)
10,784,827
TOTAL
SHORT-TERM
INVESTMENTS
(Cost
$10,784,827)
10,784,827
TOTAL
INVESTMENTS
-
101
.1
%
(Cost
$
185,505,224
)
219,333,156
OTHER
ASSETS
&
LIABILITIES,
NET
- (1.1)%
(
2,304,971
)
NET
ASSETS
-
100%
$
217,028,185
REIT
Real
Estate
Investment
Trust
(a)
Non-income
producing;
issuer
has
not
declared
an
ex-dividend
date
within
the
past
twelve
months.
(b)
Investment,
or
a
portion
of
investment,
is
out
on
loan
for
securities
lending.
The
total
value
of
the
securities
out
on
loan
as
of
the
end
of
the
reporting
period
was
$2,227,870.
(c)
Investments
made
with
cash
collateral
received
from
securities
on
loan.
(d)
The
rate
shown
is
the
one-day
yield
as
of
the
end
of
the
reporting
period.
(e)
Agreement
with
Fixed
Income
Clearing
Corporation,
4.430%
dated
12/31/24
to
be
repurchased
at
$10,452,572
on
1/2/25,
collateralized
by
Government
Agency
Securities,
with
coupon
rate
3.250%
and
maturity
date
5/15/42,
valued
at
$10,659,152.
(f)
Agreement
with
Fixed
Income
Clearing
Corporation,
1.360%
dated
12/31/24
to
be
repurchased
at
$334,852
on
1/2/25,
collateralized
by
Government
Agency
Securities,
with
coupon
rate
4.500%
and
maturity
date
12/31/31,
valued
at
$341,686.
Portfolio
of
Investments
December
31,
2024
Small/Mid
Cap
Value
See
Notes
to
Financial
Statements
(Unaudited)
SHARES
DESCRIPTION
VALUE
LONG-TERM
INVESTMENTS
-
96.9%
106084997
COMMON
STOCKS
-
96
.9
%
106084997
BANKS
-
7.5%
17,944
East
West
Bancorp
Inc
$
1,718,317
14,433
Popular
Inc
1,357,568
34,820
Prosperity
Bancshares
Inc
2,623,687
25,641
SouthState
Corp
2,550,767
TOTAL
BANKS
8,250,339
CAPITAL
GOODS
-
19.7%
20,365
AECOM
2,175,389
9,447
BWX
Technologies
Inc
1,052,301
11,800
(a)
Chart
Industries
Inc
2,251,912
8,387
Crane
Co
1,272,727
3,926
Curtiss-Wright
Corp
1,393,220
18,512
EnerSys
1,711,064
51,040
Flowserve
Corp
2,935,820
13,060
ITT
Inc
1,866,013
16,371
(a)
Middleby
Corp/The
2,217,452
19,359
nVent
Electric
PLC
1,319,509
13,521
Regal
Rexnord
Corp
2,097,514
27,132
(a)
Vicor
Corp
1,311,018
TOTAL
CAPITAL
GOODS
21,603,939
CONSUMER
DISCRETIONARY
DISTRIBUTION
&
RETAIL
-
2.3%
27,316
Academy
Sports
&
Outdoors
Inc
1,571,489
21,090
(a)
Wayfair
Inc,
Class
A
934,709
TOTAL
CONSUMER
DISCRETIONARY
DISTRIBUTION
&
RETAIL
2,506,198
CONSUMER
DURABLES
&
APPAREL
-
2.5%
83,353
Levi
Strauss
&
Co,
Class
A
1,442,008
179,579
(a)
Under
Armour
Inc,
Class
C
1,339,659
TOTAL
CONSUMER
DURABLES
&
APPAREL
2,781,667
CONSUMER
STAPLES
DISTRIBUTION
&
RETAIL
-
1.6%
19,630
(a)
BJ's
Wholesale
Club
Holdings
Inc
1,753,941
TOTAL
CONSUMER
STAPLES
DISTRIBUTION
&
RETAIL
1,753,941
ENERGY
-
5.7%
43,965
(a)
Antero
Resources
Corp
1,540,973
63,934
(b)
Atlas
Energy
Solutions
Inc
1,418,056
17,774
Expand
Energy
Corp
1,769,402
101,472
Permian
Resources
Corp
1,459,167
TOTAL
ENERGY
6,187,598
EQUITY
REAL
ESTATE
INVESTMENT
TRUSTS
(REITS)
-
7.3%
24,907
BXP
Inc
1,852,085
16,621
Camden
Property
Trust
1,928,700
21,006
Equity
LifeStyle
Properties
Inc
1,399,000
24,036
PotlatchDeltic
Corp
943,413
56,306
STAG
Industrial
Inc
1,904,269
TOTAL
EQUITY
REAL
ESTATE
INVESTMENT
TRUSTS
(REITS)
8,027,467
FINANCIAL
SERVICES
-
9.0%
156,393
AGNC
Investment
Corp
1,440,380
366,087
BGC
Group
Inc,
Class
A
3,316,747
133,168
DigitalBridge
Group
Inc
1,502,135
20,220
(a)
Mr
Cooper
Group
Inc
1,941,322
15,657
Stifel
Financial
Corp
1,660,895
TOTAL
FINANCIAL
SERVICES
9,861,479
FOOD,
BEVERAGE
&
TOBACCO
-
1.8%
62,384
Primo
Brands
Corp
1,919,555
TOTAL
FOOD,
BEVERAGE
&
TOBACCO
1,919,555
HEALTH
CARE
EQUIPMENT
&
SERVICES
-
1.4%
33,513
(a)
QuidelOrtho
Corp
1,493,004
TOTAL
HEALTH
CARE
EQUIPMENT
&
SERVICES
1,493,004
See
Notes
to
Financial
Statements
SHARES
DESCRIPTION
VALUE
INSURANCE
-
5.8%
11,563
American
Financial
Group
Inc/OH
$
1,583,322
30,504
Axis
Capital
Holdings
Ltd
2,703,264
5,787
Everest
Group
Ltd
2,097,556
TOTAL
INSURANCE
6,384,142
MATERIALS
-
6.5%
6,069
Avery
Dennison
Corp
1,135,692
17,043
Crown
Holdings
Inc
1,409,286
31,467
FMC
Corp
1,529,611
15,433
Materion
Corp
1,526,015
5,500
Reliance
Inc
1,480,930
TOTAL
MATERIALS
7,081,534
MEDIA
&
ENTERTAINMENT
-
1.4%
35,369
John
Wiley
&
Sons
Inc,
Class
A
1,545,979
TOTAL
MEDIA
&
ENTERTAINMENT
1,545,979
PHARMACEUTICALS,
BIOTECHNOLOGY
&
LIFE
SCIENCES
-
7.5%
121,605
(a)
ADMA
Biologics
Inc
2,085,525
55,538
(a)
Alkermes
PLC
1,597,273
23,627
Bruker
Corp
1,385,015
90,697
(a)
Elanco
Animal
Health
Inc
1,098,341
5,863
(a)
United
Therapeutics
Corp
2,068,701
TOTAL
PHARMACEUTICALS,
BIOTECHNOLOGY
&
LIFE
SCIENCES
8,234,855
REAL
ESTATE
MANAGEMENT
&
DEVELOPMENT
-
1.4%
21,886
(a)
Zillow
Group
Inc,
Class
A
1,550,623
TOTAL
REAL
ESTATE
MANAGEMENT
&
DEVELOPMENT
1,550,623
SEMICONDUCTORS
&
SEMICONDUCTOR
EQUIPMENT
-
3.6%
31,907
(a)
Ambarella
Inc
2,320,914
30,610
(a)
Rambus
Inc
1,618,045
TOTAL
SEMICONDUCTORS
&
SEMICONDUCTOR
EQUIPMENT
3,938,959
TECHNOLOGY
HARDWARE
&
EQUIPMENT
-
7.0%
20,120
(a)
Ciena
Corp
1,706,378
28,234
Cognex
Corp
1,012,471
17,173
(a)
Lumentum
Holdings
Inc
1,441,673
21,861
Seagate
Technology
Holdings
PLC
1,886,823
4,285
(a)
Zebra
Technologies
Corp,
Class
A
1,654,953
TOTAL
TECHNOLOGY
HARDWARE
&
EQUIPMENT
7,702,298
TRANSPORTATION
-
1.2%
29,015
(a)
GXO
Logistics
Inc
1,262,153
TOTAL
TRANSPORTATION
1,262,153
UTILITIES
-
3.7%
12,161
IDACORP
Inc
1,328,954
32,849
OGE
Energy
Corp
1,355,022
15,516
Pinnacle
West
Capital
Corp
1,315,291
TOTAL
UTILITIES
3,999,267
TOTAL
COMMON
STOCKS
(Cost
$85,528,234)
106,084,997
TOTAL
LONG-TERM
INVESTMENTS
(Cost
$85,528,234)
106,084,997
SHARES
DESCRIPTION
RATE
VALUE
INVESTMENTS
PURCHASED
WITH
COLLATERAL
FROM
SECURITIES
LENDING
-
1.3%
1,461,269
(c)
State
Street
Navigator
Securities
Lending
Government
Money
Market
Portfolio
4
.460
%
(d)
1,461,269
TOTAL
INVESTMENTS
PURCHASED
WITH
COLLATERAL
FROM
SECURITIES
LENDING
(Cost
$1,461,269)
1,461,269
Portfolio
of
Investments
December
31,
2024
(continued)
Small/Mid
Cap
Value
See
Notes
to
Financial
Statements
PRINCIPAL
DESCRIPTION
RATE
MATURITY
VALUE
SHORT-TERM
INVESTMENTS
-
3.2%
3462301
REPURCHASE
AGREEMENTS
-
3
.2
%
3462301
$
112,301
(e)
Fixed
Income
Clearing
Corporation
1
.360
%
01/02/25
$
112,301
3,350,000
(f)
Fixed
Income
Clearing
Corporation
4
.430
01/02/25
3,350,000
TOTAL
REPURCHASE
AGREEMENTS
(Cost
$3,462,301)
3,462,301
TOTAL
SHORT-TERM
INVESTMENTS
(Cost
$3,462,301)
3,462,301
TOTAL
INVESTMENTS
-
101
.4
%
(Cost
$
90,451,804
)
111,008,567
OTHER
ASSETS
&
LIABILITIES,
NET
- (1.4)%
(
1,514,644
)
NET
ASSETS
-
100%
$
109,493,923
(a)
Non-income
producing;
issuer
has
not
declared
an
ex-dividend
date
within
the
past
twelve
months.
(b)
Investment,
or
a
portion
of
investment,
is
out
on
loan
for
securities
lending.
The
total
value
of
the
securities
out
on
loan
as
of
the
end
of
the
reporting
period
was
$1,403,861.
(c)
Investments
made
with
cash
collateral
received
from
securities
on
loan.
(d)
The
rate
shown
is
the
one-day
yield
as
of
the
end
of
the
reporting
period.
(e)
Agreement
with
Fixed
Income
Clearing
Corporation,
1.360%
dated
12/31/24
to
be
repurchased
at
$112,309
on
1/2/25,
collateralized
by
Government
Agency
Securities,
with
coupon
rate
4.500%
and
maturity
date
12/31/31,
valued
at
$114,660.
(f)
Agreement
with
Fixed
Income
Clearing
Corporation,
4.430%
dated
12/31/24
to
be
repurchased
at
$3,350,825
on
1/2/25,
collateralized
by
Government
Agency
Securities,
with
coupon
rate
4.625%
and
maturity
date
11/15/44,
valued
at
$3,417,128.
Statement
of
Assets
and
Liabilities
See
Notes
to
Financial
Statements
December
31,
2024
(Unaudited)
Global
Equity
Income
International
Value
Large
Cap
Value
Opportunities
Multi
Cap
Value
Small
Cap
Value
Opportunities
Small/Mid
Cap
Value
ASSETS
Long-term
investments,
at
value
†‡
$
130,207,386
$
103,680,213
$
21,999,113
$
497,738,966
$
206,228,680
$
106,084,997
Investments
purchased
with
collateral
from
securities
lending,
at
value
(cost
approximates
value)
–
2,112,112
4,999
6,176,318
2,319,649
1,461,269
Short-term
investments,
at
value
◊
–
75,000
25,000
325,000
10,784,827
3,462,301
Cash
1,099,786
23,866
11,704
23,219
–
–
Cash
denominated
in
foreign
currencies
^
–
102
–
–
–
–
Receivables:
Dividends
108,401
108,484
20,357
361,368
208,760
186,226
Interest
–
9
3
40
1,299
417
Investments
sold
932,075
302,881
–
–
–
–
Reclaims
104,019
155,543
–
5,442
–
–
Reimbursement
from
Adviser
41,261
16,128
22,836
76,075
173,496
43,420
Shares
sold
10,379
92,960
1,787
402,409
156,959
111,882
Other
102,482
92,889
43,231
61,117
48,358
38,917
Total
assets
132,605,789
106,660,187
22,129,030
505,169,954
219,922,028
111,389,429
LIABILITIES
Written
options,
at
value
#
244,400
–
–
–
–
–
Payables:
Management
fees
80,131
64,150
12,711
301,339
162,749
72,550
Collateral
from
securities
lending
54
2,112,112
4,999
6,176,318
2,319,649
1,461,269
Interest
26
21
5
89
41
20
Investments
purchased
-
regular
settlement
879,179
–
–
–
–
–
Shares
redeemed
38,257
7,973
320
118,263
166,886
256,835
Accrued
expenses:
Custodian
fees
37,570
24,333
10,517
28,596
20,606
19,135
Trustees
fees
89,181
39,041
13,007
23,803
20,223
1,929
Professional
fees
33,615
24,702
13,796
33,206
28,149
21,548
Shareholder
reporting
expenses
12,665
13,050
5,831
–
35,425
14,932
Shareholder
servicing
agent
fees
35,295
29,938
4,213
162,560
133,509
45,433
12b-1
distribution
and
service
fees
19,584
4,762
3,046
14,720
6,606
1,855
Total
liabilities
1,469,957
2,320,082
68,445
6,858,894
2,893,843
1,895,506
Net
assets
$
131,135,832
$
104,340,105
$
22,060,585
$
498,311,060
$
217,028,185
$
109,493,923
NET
ASSETS
CONSIST
OF:
Paid-in
capital
$
322,947,148
$
271,720,354
$
13,233,743
$
396,540,310
$
173,494,969
$
84,614,758
Total
distributable
earnings
(loss)
(191,811,316)
(167,380,249)
8,826,842
101,770,750
43,533,216
24,879,165
Net
assets
$
131,135,832
$
104,340,105
$
22,060,585
$
498,311,060
$
217,028,185
$
109,493,923
†
Long-term
investments,
cost
$
95,167,219
$
71,810,161
$
13,665,347
$
397,318,603
$
172,400,748
$
85,528,234
◊
Short-term
investments,
cost
—
75,000
25,000
325,000
10,784,827
3,462,301
‡
Includes
securities
loaned
of
$
—
$
2,045,141
$
3,711
$
5,908,775
$
2,227,870
$
1,403,861
#
Written
options,
premiums
received
$
141,452
$
–
$
–
$
–
$
–
$
–
^
Cash
denominated
in
foreign
currencies,
cost
$
–
$
103
$
–
$
–
$
–
$
–
Statement
of
Assets
and
Liabilities
(continued)
See
Notes
to
Financial
Statements
Global
Equity
Income
International
Value
Large
Cap
Value
Opportunities
Multi
Cap
Value
Small
Cap
Value
Opportunities
Small/Mid
Cap
Value
CLASS
A:
Net
assets
$
86,960,664
$
20,201,145
$
8,932,720
$
52,387,947
$
23,020,437
$
6,830,046
Shares
outstanding
2,509,226
729,061
1,840,067
962,054
474,731
213,936
Net
asset
value
("NAV")
per
share
$
34.66
$
27.71
$
4.85
$
54.45
$
48.49
$
31.93
Maximum
sales
charge
5.75%
5.75%
5.75%
5.75%
5.75%
5.75%
Offering
price
per
share
(NAV
per
share
plus
maximum
sales
charge)
$
36.77
$
29.40
$
5.15
$
57.77
$
51.45
$
33.88
CLASS
C:
Net
assets
$
855,812
$
383,981
$
1,277,632
$
4,040,784
$
1,660,403
$
450,218
Shares
outstanding
24,761
14,633
357,580
79,974
43,399
17,774
NAV
and
offering
price
per
share
$
34.56
$
26.24
$
3.57
$
50.53
$
38.26
$
25.33
CLASS
R6:
Net
assets
$
—
$
—
$
—
$
—
$
6,780,321
$
26,018,751
Shares
outstanding
—
—
—
—
129,710
779,150
NAV
and
offering
price
per
share
$
—
$
—
$
—
$
—
$
52.27
$
33.39
CLASS
I:
Net
assets
$
43,319,356
$
83,754,979
$
11,850,233
$
441,882,329
$
185,567,024
$
76,194,908
Shares
outstanding
1,249,797
3,002,964
2,417,488
8,027,129
3,617,294
2,304,332
NAV
and
offering
price
per
share
$
34.66
$
27.89
$
4.90
$
55.05
$
51.30
$
33.07
Authorized
shares
-
per
class
Unlimited
Unlimited
Unlimited
Unlimited
Unlimited
Unlimited
Par
value
per
share
$
0.01
$
0.01
$
0.01
$
0.01
$
0.01
$
0.01
See
Notes
to
Financial
Statements
Six
Months
Ended
December
31,
2024
(Unaudited)
Global
Equity
Income
International
Value
Large
Cap
Value
Opportunities
Multi
Cap
Value
INVESTMENT
INCOME
Affiliated
income
$
36,357
$
13,455
$
4,839
$
180,769
Dividends
1,690,859
1,243,195
246,406
5,365,583
Interest
—
29,678
4,243
244,413
Securities
lending
income,
net
257
12,637
997
24,315
Tax
withheld
(
90,970
)
(
78,834
)
—
—
Total
investment
income
1,636,503
1,220,131
256,485
5,815,080
EXPENSES
–
–
–
–
Management
fees
479,634
390,518
74,553
1,792,620
12b-1
service
fees
-
Class
A
113,495
26,916
11,499
65,235
12b-1
distribution
and
service
fees
-
Class
C
4,680
2,183
6,317
17,708
Shareholder
servicing
agent
fees
-
Class
A
47,161
11,392
3,404
53,846
Shareholder
servicing
agent
fees
-
Class
C
487
231
467
3,662
Shareholder
servicing
agent
fees
-
Class
I
22,907
46,807
4,518
477,647
Interest
expense
606
82
20
404
Trustees
fees
2,738
2,236
446
10,755
Custodian
expenses
28,104
18,921
9,223
35,267
Registration
fees
25,114
26,415
23,810
25,302
Professional
fees
21,122
22,527
14,987
27,496
Shareholder
reporting
expenses
19,944
22,892
16,283
44,395
Other
21,239
16,885
2,181
5,115
Total
expenses
before
fee
waiver/expense
reimbursement
787,231
588,005
167,708
2,559,452
Fee
waiver/expense
reimbursement
(
86,636
)
(
63,773
)
(
65,451
)
(
148,440
)
Net
expenses
700,595
524,232
102,257
2,411,012
Net
investment
income
(loss)
935,908
695,899
154,228
3,404,068
REALIZED
AND
UNREALIZED
GAIN
(LOSS)
Realized
gain
(loss)
from:
Investments
3,497,527
(
1,269,177
)
711,052
7,811,691
Foreign
currency
transactions
(
6,089
)
(
15,940
)
—
—
Net
realized
gain
(loss)
3,491,438
(
1,285,117
)
711,052
7,811,691
Change
in
unrealized
appreciation
(depreciation)
on:
Investments
1,518,429
2,307,657
881,718
32,480,850
Written
options
(
102,948
)
—
—
—
Foreign
currency
translations
(
775
)
(
2,016
)
—
—
Net
change
in
unrealized
appreciation
(depreciation)
1,414,706
2,305,641
881,718
32,480,850
Net
realized
and
unrealized
gain
(loss)
4,906,144
1,020,524
1,592,770
40,292,541
Net
increase
(decrease)
in
net
assets
from
operations
$
5,842,052
$
1,716,423
$
1,746,998
$
43,696,609
Statement
of
Operations
(continued)
See
Notes
to
Financial
Statements
Six
Months
Ended
December
31,
2024
(Unaudited)
Small
Cap
Value
Opportunities
Small/Mid
Cap
Value
INVESTMENT
INCOME
Affiliated
income
$
382,727
$
56,447
Dividends
1,879,610
1,040,043
Interest
265,429
86,429
Securities
lending
income,
net
1,918
1,311
Tax
withheld
(
17,636
)
(
9,526
)
Total
investment
income
2,512,048
1,174,704
EXPENSES
–
–
Management
fees
955,347
413,566
12b-1
service
fees
-
Class
A
29,835
7,447
12b-1
distribution
and
service
fees
-
Class
C
8,776
1,796
Shareholder
servicing
agent
fees
-
Class
A
14,771
4,992
Shareholder
servicing
agent
fees
-
Class
C
1,089
302
Shareholder
servicing
agent
fees
-
Class
R6
152
643
Shareholder
servicing
agent
fees
-
Class
I
127,539
66,308
Interest
expense
1,173
2,932
Trustees
fees
4,734
2,090
Custodian
expenses
19,327
15,389
Registration
fees
33,437
30,003
Professional
fees
20,982
18,651
Shareholder
reporting
expenses
38,158
21,850
Other
8,989
3,520
Total
expenses
before
fee
waiver/expense
reimbursement
1,264,309
589,489
Fee
waiver/expense
reimbursement
(
99,677
)
(
22,990
)
Net
expenses
1,164,632
566,499
Net
investment
income
(loss)
1,347,416
608,205
REALIZED
AND
UNREALIZED
GAIN
(LOSS)
Realized
gain
(loss)
from:
Investments
26,716,705
9,549,740
Net
realized
gain
(loss)
26,716,705
9,549,740
Change
in
unrealized
appreciation
(depreciation)
on:
Investments
947,502
(
687,985
)
Net
change
in
unrealized
appreciation
(depreciation)
947,502
(
687,985
)
Net
realized
and
unrealized
gain
(loss)
27,664,207
8,861,755
Net
increase
(decrease)
in
net
assets
from
operations
$
29,011,623
$
9,469,960
Statement
of
Changes
in
Net
Assets
See
Notes
to
Financial
Statements
Global
Equity
Income
International
Value
Unaudited
Six
Months
Ended
12/31/24
Year
Ended
6/30/24
Unaudited
Six
Months
Ended
12/31/24
Year
Ended
6/30/24
OPERATIONS
Net
investment
income
(loss)
$
935,908
$
3,278,251
$
695,899
$
2,518,052
Net
realized
gain
(loss)
3,491,438
2,663,387
(
1,285,117
)
1,327,916
Net
change
in
unrealized
appreciation
(depreciation)
1,414,706
11,639,974
2,305,641
5,219,238
Net
increase
(decrease)
in
net
assets
from
operations
5,842,052
17,581,612
1,716,423
9,065,206
DISTRIBUTIONS
TO
SHAREHOLDERS
Dividends:
Class
A
(
589,969
)
(
2,118,642
)
(
442,383
)
(
398,900
)
Class
C
(
3,162
)
(
19,513
)
(
5,498
)
(
5,861
)
Class
I
(
341,443
)
(
1,146,457
)
(
2,037,864
)
(
1,682,661
)
Total
distributions
(
934,574
)
(
3,284,612
)
(
2,485,745
)
(
2,087,422
)
FUND
SHARE
TRANSACTIONS
Subscriptions
1,927,299
6,360,477
11,799,062
20,714,366
Reinvestments
of
distributions
882,511
3,103,251
2,398,425
2,015,669
Redemptions
(
9,717,115
)
(
23,330,763
)
(
12,951,071
)
(
23,887,313
)
Net
increase
(decrease)
from
Fund
share
transactions
(
6,907,305
)
(
13,867,035
)
1,246,416
(
1,157,278
)
Net
increase
(decrease)
in
net
assets
(
1,999,827
)
429,965
477,094
5,820,506
Net
assets
at
the
beginning
of
period
133,135,659
132,705,694
103,863,011
98,042,505
Net
assets
at
the
end
of
period
$
131,135,832
$
133,135,659
$
104,340,105
$
103,863,011
See
Notes
to
Financial
Statements
Statement
of
Changes
in
Net
Assets
(continued)
Large
Cap
Value
Opportunities
Multi
Cap
Value
Unaudited
Six
Months
Ended
12/31/24
Year
Ended
6/30/24
Unaudited
Six
Months
Ended
12/31/24
Year
Ended
6/30/24
OPERATIONS
Net
investment
income
(loss)
$
154,228
$
305,531
$
3,404,068
$
4,310,300
Net
realized
gain
(loss)
711,052
853,608
7,811,691
(
758,269
)
Net
change
in
unrealized
appreciation
(depreciation)
881,718
1,814,481
32,480,850
48,512,553
Net
increase
(decrease)
in
net
assets
from
operations
1,746,998
2,973,620
43,696,609
52,064,584
DISTRIBUTIONS
TO
SHAREHOLDERS
Dividends:
Class
A
(
562,967
)
(
149,690
)
(
838,874
)
(
485,789
)
Class
C
(
90,441
)
(
15,296
)
(
35,759
)
(
4,798
)
Class
I
(
778,014
)
(
249,427
)
(
8,082,180
)
(
3,011,559
)
Total
distributions
(
1,431,422
)
(
414,413
)
(
8,956,813
)
(
3,502,146
)
FUND
SHARE
TRANSACTIONS
Subscriptions
1,000,285
1,764,393
33,291,724
333,207,830
Reinvestments
of
distributions
1,367,659
396,643
8,819,645
3,427,870
Redemptions
(
2,246,341
)
(
3,029,144
)
(
60,689,106
)
(
23,475,336
)
Net
increase
(decrease)
from
Fund
share
transactions
121,603
(
868,108
)
(
18,577,737
)
313,160,364
Net
increase
(decrease)
in
net
assets
437,179
1,691,099
16,162,059
361,722,802
Net
assets
at
the
beginning
of
period
21,623,406
19,932,307
482,149,001
120,426,199
Net
assets
at
the
end
of
period
$
22,060,585
$
21,623,406
$
498,311,060
$
482,149,001
See
Notes
to
Financial
Statements
Small
Cap
Value
Opportunities
Small/Mid
Cap
Value
Unaudited
Six
Months
Ended
12/31/24
Year
Ended
6/30/24
Unaudited
Six
Months
Ended
12/31/24
Year
Ended
6/30/24
OPERATIONS
Net
investment
income
(loss)
$
1,347,416
$
1,354,393
$
608,205
$
1,073,409
Net
realized
gain
(loss)
26,716,705
31,528,647
9,549,740
4,935,548
Net
change
in
unrealized
appreciation
(depreciation)
947,502
1,256,815
(
687,985
)
11,246,237
Net
increase
(decrease)
in
net
assets
from
operations
29,011,623
34,139,855
9,469,960
17,255,194
DISTRIBUTIONS
TO
SHAREHOLDERS
Dividends:
Class
A
(
4,997,460
)
(
144,508
)
(
696,792
)
(
16,659
)
Class
C
(
431,089
)
(
5,472
)
(
50,568
)
(
1,171
)
Class
R6
(
1,380,064
)
(
59,351
)
(
2,563,053
)
(
165,869
)
Class
I
(
43,085,559
)
(
1,447,900
)
(
7,734,130
)
(
700,108
)
Total
distributions
(
49,894,172
)
(
1,657,231
)
(
11,044,543
)
(
883,807
)
FUND
SHARE
TRANSACTIONS
Subscriptions
26,473,208
22,816,913
21,032,546
53,146,102
Reinvestments
of
distributions
47,655,601
1,577,333
10,992,363
881,046
Redemptions
(
51,375,053
)
(
39,866,511
)
(
20,909,604
)
(
55,975,595
)
Net
increase
(decrease)
from
Fund
share
transactions
22,753,756
(
15,472,265
)
11,115,305
(
1,948,447
)
Net
increase
(decrease)
in
net
assets
1,871,207
17,010,359
9,540,722
14,422,940
Net
assets
at
the
beginning
of
period
215,156,978
198,146,619
99,953,201
85,530,261
Net
assets
at
the
end
of
period
$
217,028,185
$
215,156,978
$
109,493,923
$
99,953,201
The
following
data
is
for
a
share outstanding
for
each
fiscal year
end
unless
otherwise
noted:
Investment
Operations
Less
Distributions
Net
Asset
Value,
Beginning
of
Period
Net
Investment
Income
(NII)
(Loss)
(a)
Net
Realized/
Unrealized
Gain
(Loss)
Total
From
NII
From
Net
Realized
Gains
Total
Net
Asset
Value,
End
of
Period
Global
Equity
Income
Class
A
12/31/24
(e)
$
33.43
$
0.23
$
1.23
$
1.46
$
(0.23)
$
—
$
(0.23)
$
34.66
6/30/24
29.94
0.76
3.51
4.27
(0.78)
—
(0.78)
33.43
6/30/23
27.43
0.67
3.21
3.88
(1.37)
—
(1.37)
29.94
6/30/22
32.13
0.74
(4.26)
(3.52)
(1.18)
—
(1.18)
27.43
6/30/21
23.44
0.68
8.70
9.38
(0.69)
—
(0.69)
32.13
6/30/20
26.59
0.57
(3.10)
(2.53)
(0.62)
—
(0.62)
23.44
Class
C
12/31/24
(e)
33.36
0.10
1.22
1.32
(0.12)
—
(0.12)
34.56
6/30/24
29.89
0.48
3.54
4.02
(0.55)
—
(0.55)
33.36
6/30/23
27.37
0.47
3.20
3.67
(1.15)
—
(1.15)
29.89
6/30/22
32.06
0.44
(4.19)
(3.75)
(0.94)
—
(0.94)
27.37
6/30/21
23.40
0.44
8.70
9.14
(0.48)
—
(0.48)
32.06
6/30/20
26.54
0.40
(3.11)
(2.71)
(0.43)
—
(0.43)
23.40
Class
I
12/31/24
(e)
33.43
0.27
1.23
1.50
(0.27)
—
(0.27)
34.66
6/30/24
29.95
0.83
3.51
4.34
(0.86)
—
(0.86)
33.43
6/30/23
27.43
0.73
3.23
3.96
(1.44)
—
(1.44)
29.95
6/30/22
32.14
0.83
(4.28)
(3.45)
(1.26)
—
(1.26)
27.43
6/30/21
23.45
0.75
8.70
9.45
(0.76)
—
(0.76)
32.14
6/30/20
26.60
0.63
(3.10)
(
2.47)
(0.68)
—
(0.68)
23.45
(a)
Based
on
average
shares
outstanding.
(b)
Total
returns
are
at
NAV
and
do
not
include
any
sales
charge.
Total
returns
are
not
annualized.
(c)
After
fee
waiver
and/or
expense
reimbursement
from
the
Adviser,
where
applicable.
See
Notes
to
Financial
Statements
for
more
information.
(d)
Includes
voluntary
compensation
from
the
Adviser
as
further
described
in
the
Notes
to
Financial
Statements.
(e)
Unaudited.
(f)
Annualized.
See
Notes
to
Financial
Statements
Ratio/Supplemental
Data
Ratios
to
Average
Net
Assets
Total
Return
(b)
Net
Assets,
End
of
Period
(000)
Gross
Expenses
Net
Expenses
(c)
NII
(Loss)
(c),(d)
Portfolio
Turnover
Rate
4.35
%
$
86,961
1.23
%
(f)
1.11
%
(f)
1.30
%
(f)
15
%
14.40
89,171
1.27
1.11
2.45
27
14.46
86,807
1.28
1.11
2.35
29
(11.30)
86,811
1.26
1.10
2.33
59
40.43
105,751
1.26
1.11
2.44
42
(9.53)
80,897
1.24
1.11
2.37
53
3.94
856
1.98
(f)
1.86
(f)
0.59
(f)
15
13.51
1,003
2.02
1.86
1.55
27
13.61
1,879
2.03
1.86
1.62
29
(11.95)
1,649
2.01
1.85
1.37
59
39.34
4,660
2.01
1.86
1.64
42
(10.18)
14,342
1.99
1.86
1.61
53
4.48
43,319
0
.98
(f)
0.86
(f)
1.55
(f)
15
14.64
42,961
1.02
0.86
2.67
27
14.79
44,020
1.03
0.86
2.55
29
(11.10)
52,423
1.01
0.85
2.61
59
40.76
55,826
1.01
0.86
2.69
42
(9.25)
43,978
0.99
0.86
2.62
53
Financial
Highlights
(continued)
The
following
data
is
for
a
share outstanding
for
each
fiscal year
end
unless
otherwise
noted:
Investment
Operations
Less
Distributions
Net
Asset
Value,
Beginning
of
Period
Net
Investment
Income
(NII)
(Loss)
(a)
Net
Realized/
Unrealized
Gain
(Loss)
Total
From
NII
From
Net
Realized
Gains
Total
Net
Asset
Value,
End
of
Period
International
Value
Class
A
12/31/24
(e)
$
27.95
$
0.15
$
0.23
$
0.38
$
(
0.62
)
$
—
$
(
0.62
)
$
27.71
6/30/24
26.11
0.60
1.74
2.34
(
0.50
)
—
(
0.50
)
27.95
6/30/23
23.20
0.58
3.45
4.03
(
1.12
)
—
(
1.12
)
26.11
6/30/22
27.73
0.60
(
4.05
)
(
3.45
)
(
1.08
)
—
(
1.08
)
23.20
6/30/21
20.17
0.70
7.34
8.04
(
0.48
)
—
(
0.48
)
27.73
6/30/20
23.39
0.32
(
2.83
)
(
2.51
)
(
0.71
)
—
(
0.71
)
20.17
Class
C
12/31/24
(e)
26.36
0.04
0.22
0.26
(
0.38
)
—
(
0.38
)
26.24
6/30/24
24.64
0.36
1.65
2.01
(
0.29
)
—
(
0.29
)
26.36
6/30/23
21.89
0.43
3.21
3.64
(
0.89
)
—
(
0.89
)
24.64
6/30/22
26.37
0.35
(
3.80
)
(
3.45
)
(
1.03
)
—
(
1.03
)
21.89
6/30/21
19.20
0.43
7.04
7.47
(
0.30
)
—
(
0.30
)
26.37
6/30/20
22.28
0.16
(
2.73
)
(
2.57
)
(
0.51
)
—
(
0.51
)
19.20
Class
I
12/31/24
(e)
28.16
0.19
0.23
0.42
(
0.69
)
—
(
0.69
)
27.89
6/30/24
26.31
0.68
1.73
2.41
(
0.56
)
—
(
0.56
)
28.16
6/30/23
23.37
0.65
3.48
4.13
(
1.19
)
—
(
1.19
)
26.31
6/30/22
27.87
0.64
(
4.05
)
(
3.41
)
(
1.09
)
—
(
1.09
)
23.37
6/30/21
20.27
0.75
7.38
8.13
(
0.53
)
—
(
0.53
)
27.87
6/30/20
23.50
0.36
(
2.82
)
(
2.46
)
(
0.77
)
—
(
0.77
)
20.27
(a)
Based
on
average
shares
outstanding.
(b)
Total
returns
are
at
NAV
and
do
not
include
any
sales
charge.
Total
returns
are
not
annualized.
(c)
After
fee
waiver
and/or
expense
reimbursement
from
the
Adviser,
where
applicable.
See
Notes
to
Financial
Statements
for
more
information.
(d)
Includes
voluntary
compensation
from
the
Adviser
as
further
described
in
the
Notes
to
Financial
Statements.
(e)
Unaudited.
(f)
Annualized.
See
Notes
to
Financial
Statements
Ratio/Supplemental
Data
Ratios
to
Average
Net
Assets
Total
Return
(b)
Net
Assets,
End
of
Period
(000)
Gross
Expenses
Net
Expenses
(c)
NII
(Loss)
(c),(d)
Portfolio
Turnover
Rate
1
.38
%
$
20,201
1
.26
%
(f)
1
.15
%
(f)
1
.05
%
(f)
14
%
8
.97
20,976
1
.31
1
.15
2
.24
13
18
.00
21,524
1
.33
1
.15
2
.44
18
(
12
.90
)
19,329
1
.33
1
.14
2
.26
28
40
.20
22,153
1
.28
1
.15
2
.88
24
(
11
.24
)
17,579
1
.33
1
.15
1
.55
22
0
.99
384
2
.01
(f)
1
.90
(f)
0
.32
(f)
14
8
.18
443
2
.06
1
.90
1
.43
13
17
.12
466
2
.08
1
.90
1
.88
18
(
13
.58
)
266
2
.08
1
.89
1
.41
28
39
.17
365
2
.03
1
.90
1
.93
24
(
11
.88
)
963
2
.08
1
.90
0
.76
22
1
.50
83,755
1
.01
(f)
0
.90
(f)
1
.32
(f)
14
9
.25
82,445
1
.06
0
.90
2
.52
13
18
.33
76,052
1
.08
0
.90
2
.70
18
(
12
.71
)
64,558
1
.08
0
.89
2
.38
28
40
.51
99,311
1
.03
0
.90
3
.10
24
(
11
.00
)
91,781
1
.08
0
.90
1
.68
22
Financial
Highlights
(continued)
The
following
data
is
for
a
share outstanding
for
each
fiscal year
end
unless
otherwise
noted:
Investment
Operations
Less
Distributions
Net
Asset
Value,
Beginning
of
Period
Net
Investment
Income
(NII)
(Loss)
(a)
Net
Realized/
Unrealized
Gain
(Loss)
Total
From
NII
From
Net
Realized
Gains
Total
Net
Asset
Value,
End
of
Period
Large
Cap
Value
Opportunities
Class
A
12/31/24
(e)
$
4.79
$
0.03
$
0.35
$
0.38
$
(
0.09
)
$
(
0.23
)
$
(
0.32
)
$
4.85
6/30/24
4.22
0.06
0.60
0.66
(
0.07
)
(
0.02
)
(
0.09
)
4.79
6/30/23
3.80
0.06
0.54
0.60
(
0.03
)
(
0.15
)
(
0.18
)
4.22
6/30/22
4.84
0.06
(
0.22
)
(
0.16
)
(
0.05
)
(
0.83
)
(
0.88
)
3.80
6/30/21
3.96
0.03
1.57
1.60
(
0.15
)
(
0.57
)
(
0.72
)
4.84
6/30/20
5.15
0.12
(
0.62
)
(
0.50
)
(
0.09
)
(
0.60
)
(
0.69
)
3.96
Class
C
12/31/24
(e)
3.57
0.01
0.26
0.27
(
0.04
)
(
0.23
)
(
0.27
)
3.57
6/30/24
3.15
0.02
0.45
0.47
(
0.03
)
(
0.02
)
(
0.05
)
3.57
6/30/23
2.88
0.02
0.40
0.42
—
(
0.15
)
(
0.15
)
3.15
6/30/22
3.88
0.02
(
0.15
)
(
0.13
)
(
0.04
)
(
0.83
)
(
0.87
)
2.88
6/30/21
3.28
0.01
1.26
1.27
(
0.10
)
(
0.57
)
(
0.67
)
3.88
6/30/20
4.36
0.07
(
0.51
)
(
0.44
)
(
0.04
)
(
0.60
)
(
0.64
)
3.28
Class
I
12/31/24
(e)
4.84
0.04
0.35
0.39
(
0.10
)
(
0.23
)
(
0.33
)
4.90
6/30/24
4.27
0.07
0.60
0.67
(
0.08
)
(
0.02
)
(
0.10
)
4.84
6/30/23
3.84
0.07
0.55
0.62
(
0.04
)
(
0.15
)
(
0.19
)
4.27
6/30/22
4.87
0.07
(
0.22
)
(
0.15
)
(
0.05
)
(
0.83
)
(
0.88
)
3.84
6/30/21
3.98
0.05
1.57
1.62
(
0.16
)
(
0.57
)
(
0.73
)
4.87
6/30/20
5.17
0.13
(
0.62
)
(
0.49
)
(
0.10
)
(
0.60
)
(
0.70
)
3.98
(a)
Based
on
average
shares
outstanding.
(b)
Total
returns
are
at
NAV
and
do
not
include
any
sales
charge.
Total
returns
are
not
annualized.
(c)
After
fee
waiver
and/or
expense
reimbursement
from
the
Adviser,
where
applicable.
See
Notes
to
Financial
Statements
for
more
information.
(d)
Includes
voluntary
compensation
from
the
Adviser
as
further
described
in
the
Notes
to
Financial
Statements.
(e)
Unaudited.
(f)
Annualized.
See
Notes
to
Financial
Statements
Ratio/Supplemental
Data
Ratios
to
Average
Net
Assets
Total
Return
(b)
Net
Assets,
End
of
Period
(000)
Gross
Expenses
Net
Expenses
(c)
NII
(Loss)
(c),(d)
Portfolio
Turnover
Rate
7
.85
%
$
8,933
1
.57
%
(f)
0
.99
%
(f)
1
.27
%
(f)
14
%
15
.77
8,842
1
.61
1
.00
1
.42
35
15
.95
7,320
1
.56
1
.00
1
.38
40
(
4
.84
)
6,927
1
.80
0
.99
1
.26
35
44
.10
5,419
1
.76
1
.00
0
.79
42
(
12
.08
)
4,233
1
.40
1
.00
2
.56
59
7
.44
1,278
2
.32
(f)
1
.74
(f)
0
.51
(f)
14
14
.97
1,173
2
.36
1
.75
0
.67
35
14
.84
1,163
2
.31
1
.75
0
.62
40
(
5
.24
)
951
2
.55
1
.74
0
.47
35
42
.65
1,368
2
.51
1
.75
0
.19
42
(
12
.62
)
1,758
2
.15
1
.75
1
.82
59
8
.05
11,850
1
.32
(f)
0
.74
(f)
1
.52
(f)
14
15
.87
11,608
1
.36
0
.75
1
.67
35
16
.35
11,449
1
.31
0
.75
1
.63
40
(
4
.55
)
11,112
1
.55
0
.74
1
.50
35
44
.50
13,008
1
.51
0
.75
1
.11
42
(
11
.81
)
13,196
1
.15
0
.75
2
.81
59
Financial
Highlights
(continued)
The
following
data
is
for
a
share outstanding
for
each
fiscal year
end
unless
otherwise
noted:
Investment
Operations
Less
Distributions
Net
Asset
Value,
Beginning
of
Period
Net
Investment
Income
(NII)
(Loss)
(a)
Net
Realized/
Unrealized
Gain
(Loss)
Total
From
NII
From
Net
Realized
Gains
Return
of
Capital
Total
Net
Asset
Value,
End
of
Period
Multi
Cap
Value
Class
A
12/31/24
(e)
$
50.93
$
0.30
$
4.11
$
4.41
$
(
0.71
)
$
(
0.18
)
$
—
$
(
0.89
)
$
54.45
6/30/24
44.63
0.60
6.19
6.79
(
0.49
)
—
—
(
0.49
)
50.93
6/30/23
37.48
0.43
7.19
7.62
(
0.47
)
—
—
(
0.47
)
44.63
6/30/22
41.46
0.26
(
3.73
)
(
3.47
)
(
0.51
)
—
—
(
0.51
)
37.48
6/30/21
27.13
0.22
15.15
15.37
(
0.69
)
—
(
0.35
)
(
1.04
)
41.46
6/30/20
32.55
0.66
(
5.70
)
(
5.04
)
(
0.38
)
—
—
(
0.38
)
27.13
Class
C
12/31/24
(e)
47.12
0.08
3.81
3.89
(
0.30
)
(
0.18
)
—
(
0.48
)
50.53
6/30/24
41.31
0.24
5.72
5.96
(
0.15
)
—
—
(
0.15
)
47.12
6/30/23
34.69
0.11
6.67
6.78
(
0.16
)
—
—
(
0.16
)
41.31
6/30/22
38.66
(
0.05
)
(
3.45
)
(
3.50
)
(
0.47
)
—
—
(
0.47
)
34.69
6/30/21
25.32
(
0.03
)
14.14
14.11
(
0.42
)
—
(
0.35
)
(
0.77
)
38.66
6/30/20
30.40
0.42
(
5.37
)
(
4.95
)
(
0.13
)
—
—
(
0.13
)
25.32
Class
I
12/31/24
(e)
51.54
0.37
4.17
4.54
(
0.85
)
(
0.18
)
—
(
1.03
)
55.05
6/30/24
45.16
0.74
6.25
6.99
(
0.61
)
—
—
(
0.61
)
51.54
6/30/23
37.92
0.54
7.28
7.82
(
0.58
)
—
—
(
0.58
)
45.16
6/30/22
41.84
0.36
(
3.76
)
(
3.40
)
(
0.52
)
—
—
(
0.52
)
37.92
6/30/21
27.37
0.30
15.30
15.60
(
0.78
)
—
(
0.35
)
(
1.13
)
41.84
6/30/20
32.83
0.75
(
5.75
)
(
5.00
)
(
0.46
)
—
—
(
0.46
)
27.37
(a)
Based
on
average
shares
outstanding.
(b)
Total
returns
are
at
NAV
and
do
not
include
any
sales
charge.
Total
returns
are
not
annualized.
(c)
After
fee
waiver
and/or
expense
reimbursement
from
the
Adviser,
where
applicable.
See
Notes
to
Financial
Statements
for
more
information.
(d)
Includes
voluntary
compensation
from
the
Adviser
as
further
described
in
the
Notes
to
Financial
Statements.
(e)
Unaudited.
(f)
Annualized.
See
Notes
to
Financial
Statements
Ratio/Supplemental
Data
Ratios
to
Average
Net
Assets
Total
Return
(b)
Net
Assets,
End
of
Period
(000)
Gross
Expenses
Net
Expenses
(c)
NII
(Loss)
(c),(d)
Portfolio
Turnover
Rate
8
.64
%
$
52,388
1
.20
%
(f)
1
.15
%
(f)
1
.09
%
(f)
19
%
15
.32
49,371
1
.18
1
.17
1
.28
24
20
.46
44,442
1
.28
1
.23
1
.04
22
(
8
.49
)
40,006
1
.35
1
.25
0
.62
34
57
.70
43,489
1
.29
1
.15
0
.64
58
(
15
.73
)
29,133
1
.30
1
.15
2
.30
54
8
.23
4,041
1
.95
(f)
1
.90
(f)
0
.33
(f)
19
14
.47
3,022
1
.92
1
.91
0
.56
24
19
.58
1,287
2
.03
1
.98
0
.30
22
(
9
.17
)
1,168
2
.10
2
.00
(
0
.13
)
34
56
.54
1,347
2
.04
1
.90
(
0
.09
)
58
(
16
.37
)
1,632
2
.05
1
.90
1
.56
54
8
.79
441,882
0
.95
(f)
0
.90
(f)
1
.34
(f)
19
15
.60
429,756
0
.92
0
.91
1
.54
24
20
.78
74,697
1
.03
0
.98
1
.29
22
(
8
.26
)
38,624
1
.10
1
.00
0
.87
34
58
.09
37,441
1
.04
0
.90
0
.88
58
(
15
.51
)
24,403
1
.05
0
.90
2
.56
54
Financial
Highlights
(continued)
The
following
data
is
for
a
share outstanding
for
each
fiscal year
end
unless
otherwise
noted:
Investment
Operations
Less
Distributions
Net
Asset
Value,
Beginning
of
Period
Net
Investment
Income
(NII)
(Loss)
(a)
Net
Realized/
Unrealized
Gain
(Loss)
Total
From
NII
From
Net
Realized
Gains
Total
Net
Asset
Value,
End
of
Period
Small
Cap
Value
Opportunities
Class
A
12/31/24
(e)
$
53.74
$
0.27
$
7.27
$
7.54
$
(
0.46
)
$
(
12.33
)
$
(
12.79
)
$
48.49
6/30/24
45.69
0.23
8.14
8.37
(
0.20
)
(
0.12
)
(
0.32
)
53.74
6/30/23
41.31
0.20
6.94
7.14
—
(
2.76
)
(
2.76
)
45.69
6/30/22
55.06
0.10
(
8.11
)
(
8.01
)
(
0.08
)
(
5.66
)
(
5.74
)
41.31
6/30/21
33.98
(
0.02
)
21.36
21.34
(
0.26
)
—
(
0.26
)
55.06
6/30/20
42.97
0.11
(
6.36
)
(
6.25
)
(
0.01
)
(
2.73
)
(
2.74
)
33.98
Class
C
12/31/24
(e)
44.46
0.04
6.13
6.17
(
0.04
)
(
12.33
)
(
12.37
)
38.26
6/30/24
37.95
(
0.11
)
6.74
6.63
—
(
0.12
)
(
0.12
)
44.46
6/30/23
34.99
(
0.11
)
5.83
5.72
—
(
2.76
)
(
2.76
)
37.95
6/30/22
47.84
(
0.25
)
(
6.87
)
(
7.12
)
(
0.07
)
(
5.66
)
(
5.73
)
34.99
6/30/21
29.57
(
0.31
)
18.58
18.27
—
—
—
47.84
6/30/20
37.99
(
0.16
)
(
5.53
)
(
5.69
)
—
(
2.73
)
(
2.73
)
29.57
Class
R6
12/31/24
(e)
57.22
0.40
7.70
8.10
(
0.72
)
(
12.33
)
(
13.05
)
52.27
6/30/24
48.62
0.44
8.68
9.12
(
0.40
)
(
0.12
)
(
0.52
)
57.22
6/30/23
43.77
0.38
7.37
7.75
(
0.14
)
(
2.76
)
(
2.90
)
48.62
6/30/22
57.78
0.31
(
8.57
)
(
8.26
)
(
0.09
)
(
5.66
)
(
5.75
)
43.77
6/30/21
35.66
0.17
22.41
22.58
(
0.46
)
—
(
0.46
)
57.78
6/30/20
44.93
0.28
(
6.63
)
(
6.35
)
(
0.19
)
(
2.73
)
(
2.92
)
35.66
Class
I
12/31/24
(e)
56.31
0.36
7.59
7.95
(
0.63
)
(
12.33
)
(
12.96
)
51.30
6/30/24
47.85
0.37
8.54
8.91
(
0.33
)
(
0.12
)
(
0.45
)
56.31
6/30/23
43.12
0.32
7.25
7.57
(
0.08
)
(
2.76
)
(
2.84
)
47.85
6/30/22
57.08
0.22
(
8.43
)
(
8.21
)
(
0.09
)
(
5.66
)
(
5.75
)
43.12
6/30/21
35.21
0.08
22.15
22.23
(
0.36
)
—
(
0.36
)
57.08
6/30/20
44.43
0.20
(
6.57
)
(
6.37
)
(
0.12
)
(
2.73
)
(
2.85
)
35.21
(a)
Based
on
average
shares
outstanding.
(b)
Total
returns
are
at
NAV
and
do
not
include
any
sales
charge.
Total
returns
are
not
annualized.
(c)
After
fee
waiver
and/or
expense
reimbursement
from
the
Adviser,
where
applicable.
See
Notes
to
Financial
Statements
for
more
information.
(d)
Includes
voluntary
compensation
from
the
Adviser
as
further
described
in
the
Notes
to
Financial
Statements.
(e)
Unaudited.
(f)
Annualized.
See
Notes
to
Financial
Statements
Ratio/Supplemental
Data
Ratios
to
Average
Net
Assets
Total
Return
(b)
Net
Assets,
End
of
Period
(000)
Gross
Expenses
Net
Expenses
(c)
NII
(Loss)
(c),(d)
Portfolio
Turnover
Rate
12
.78
%
$
23,020
1
.28
%
(f)
1
.20
%
(f)
0
.91
%
(f)
42
%
18
.36
22,385
1
.35
1
.20
0
.46
71
17
.62
20,932
1
.31
1
.20
0
.44
71
(
16
.01
)
19,467
1
.33
1
.19
0
.20
58
63
.00
27,091
1
.37
1
.36
(
0
.04
)
86
(
15
.95
)
24,846
1
.35
1
.35
0
.28
43
12
.35
1,660
2
.03
(f)
1
.95
(f)
0
.15
(f)
42
17
.49
1,643
2
.10
1
.95
(
0
.28
)
71
16
.71
2,447
2
.06
1
.95
(
0
.29
)
71
(
16
.61
)
3,933
2
.08
1
.94
(
0
.57
)
58
61
.79
8,429
2
.12
2
.11
(
0
.80
)
86
(
16
.58
)
7,644
2
.10
2
.10
(
0
.49
)
43
12
.98
6,780
0
.91
(f)
0
.83
(f)
1
.28
(f)
42
18
.83
5,970
0
.96
0
.81
0
.85
71
18
.06
5,879
0
.93
0
.82
0
.81
71
(
15
.68
)
4,893
0
.94
0
.80
0
.59
58
63
.67
6,160
0
.95
0
.94
0
.36
86
(
15
.55
)
6,315
0
.91
0
.91
0
.70
43
12
.92
185,567
1
.03
(f)
0
.95
(f)
1
.16
(f)
42
18
.68
185,160
1
.10
0
.95
0
.72
71
17
.88
168,888
1
.06
0
.95
0
.69
71
(
15
.79
)
145,461
1
.08
0
.94
0
.42
58
63
.42
263,394
1
.11
1
.10
0
.16
86
(
15
.75
)
154,309
1
.10
1
.10
0
.51
43
Financial
Highlights
(continued)
The
following
data
is
for
a
share outstanding
for
each
fiscal year
end
unless
otherwise
noted:
Investment
Operations
Less
Distributions
Net
Asset
Value,
Beginning
of
Period
Net
Investment
Income
(NII)
(Loss)
(a)
Net
Realized/
Unrealized
Gain
(Loss)
Total
From
NII
From
Net
Realized
Gains
Total
Net
Asset
Value,
End
of
Period
Small/Mid
Cap
Value
Class
A
12/31/24
(e)
$
32.28
$
0.15
$
3.05
$
3.20
$
(0.38)
$
(3.17)
$
(3.55)
$
31.93
6/30/24
27.67
0.21
4.53
4.74
(0.07)
(0.06)
(0.13)
32.28
6/30/23
24.60
0.14
4.32
4.46
—
(1.39)
(1.39)
27.67
6/30/22
32.13
0.03
(2.89)
(2.86)
(0.11)
(4.56)
(4.67)
24.60
6/30/21
20.05
0.01
12.13
12.14
(0.06)
—
(0.06)
32.13
6/30/20
23.47
0.11
(3.45)
(3.34)
(0.08)
—
(0.08)
20.05
Class
C
12/31/24
(e)
26.10
0.02
2.49
2.51
(0.11)
(3.17)
(3.28)
25.33
6/30/24
22.50
(0.02)
3.68
3.66
—
(0.06)
(0.06)
26.10
6/30/23
20.38
(0.04)
3.55
3.51
—
(1.39)
(1.39)
22.50
6/30/22
27.57
(0.17)
(2.37)
(2.54)
(0.09)
(4.56)
(4.65)
20.38
6/30/21
17.29
(0.14)
10.42
10.28
—
—
—
27.57
6/30/20
20.33
(0.03)
(3.01)
(3.04)
—
—
—
17.29
Class
R6
12/31/24
(e)
33.71
0.23
3.17
3.40
(0.55)
(3.17)
(3.72)
33.39
6/30/24
28.87
0.35
4.75
5.10
(0.20)
(0.06)
(0.26)
33.71
6/30/23
25.54
0.24
4.50
4.74
(0.02)
(1.39)
(1.41)
28.87
6/30/22
33.06
0.16
(3.01)
(2.85)
(0.11)
(4.56)
(4.67)
25.54
6/30/21
20.64
0.10
12.49
12.59
(0.17)
—
(0.17)
33.06
6/30/20
24.15
0.21
(3.54)
(3.33)
(0.18)
—
(0.18)
20.64
Class
I
12/31/24
(e)
33.37
0.20
3.15
3.35
(0.48)
(3.17)
(3.65)
33.07
6/30/24
28.60
0.29
4.69
4.98
(0.15)
(0.06)
(0.21)
33.37
6/30/23
25.32
0.23
4.44
4.67
—
(1.39)
(1.39)
28.60
6/30/22
32.86
0.10
(2.97)
(2.87)
(0.11)
(4.56)
(4.67)
25.32
6/30/21
20.49
0.07
12.42
12.49
(0.12)
—
(0.12)
32.86
6/30/20
23.99
0.19
(3.55)
(3.36)
(0.14)
—
(0.14)
20.49
(a)
Based
on
average
shares
outstanding.
(b)
Total
returns
are
at
NAV
and
do
not
include
any
sales
charge.
Total
returns
are
not
annualized.
(c)
After
fee
waiver
and/or
expense
reimbursement
from
the
Adviser,
where
applicable.
See
Notes
to
Financial
Statements
for
more
information.
(d)
Includes
voluntary
compensation
from
the
Adviser
as
further
described
in
the
Notes
to
Financial
Statements.
(e)
Unaudited.
(f)
Annualized.
See
Notes
to
Financial
Statements
Ratio/Supplemental
Data
Ratios
to
Average
Net
Assets
Total
Return
(b)
Net
Assets,
End
of
Period
(000)
Gross
Expenses
Net
Expenses
(c)
NII
(Loss)
(c),(d)
Portfolio
Turnover
Rate
9.48
%
$
6,830
1.35
%
(f)
1.31
%
(f)
0.88
%
(f)
31
%
17.21
4,710
1.42
1.31
0.70
81
18.50
3,627
1.41
1.31
0.53
39
(10.81)
3,003
1.61
1.30
0.10
42
60.64
3,321
1.64
1.31
0.06
57
(14.29)
2,599
1.85
1.31
0.54
58
9.07
450
2.11
(f)
2.06
(f)
0.12
(f)
31
16.31
386
2.17
2.06
(0.07)
81
17.65
426
2.16
2.06
(0.20)
39
(11.48)
341
2.36
2.05
(0.67)
42
59.46
538
2.39
2.06
(0.65)
57
(14.95)
763
2.60
2.06
(0.19)
58
9.68
26,019
0.94
(f)
0.89
(f)
1.26
(f)
31
17.75
21,258
0.97
0.86
1.15
81
18.92
18,080
1.06
0.96
0.88
39
(10.44)
16,015
1.19
0.88
0.53
42
61.19
19,155
1.28
0.95
0.37
57
(13.93)
8,747
1.43
0.88
0.96
58
9.61
76,195
1.10
(f)
1.06
(f)
1.09
(f)
31
17.48
73,600
1.17
1.06
0.96
81
18.82
63,397
1.16
1.06
0.83
39
(10.57)
15,577
1.36
1.05
0.34
42
61.03
23,554
1.39
1.06
0.26
57
(14.07)
8,457
1.60
1.06
0.89
58
Notes
to
Financial
Statements
(Unaudited)
1.
General
Information
Trust
and
Fund
Information:
The
Nuveen
Investment
Trust
and
Nuveen
Investment
Trust
II
(each
a
“Trust”
and
collectively,
the
“Trusts”),
are
open-end
management
investment
companies
registered
under
the
Investment
Company
Act
of
1940
(the
“1940
Act”),
as
amended.
Nuveen
Investment
Trust
is
comprised
of
the
Nuveen
Global
Equity
Income
Fund
(“Global
Equity
Income”),
Nuveen
Large
Cap
Value
Opportunities
Fund
(“Large
Cap
Value
Opportunities”),
Nuveen
Multi
Cap
Value
Fund
(“Multi
Cap
Value”),
Nuveen
Small
Cap
Value
Opportunities
Fund
(“Small
Cap
Value
Opportunities”)
and
Nuveen
Small/Mid
Cap
Value
Fund
(“Small/Mid
Cap
Value”)
and
Nuveen
Investment
Trust
II
is
comprised
of
Nuveen
International
Value
Fund
(“International
Value”),
among
others
(each
a
“Fund”
and
collectively,
the
“Funds”).
Nuveen
Investment
Trust
and
Nuveen
Investment
Trust
II
were
each
organized
as
Massachusetts
business
trusts
in
1996
and
1997,
respectively.
Current
Fiscal
Period:
The
end
of
the
reporting
period
for
the
Funds
is
December
31,
2024,
and
the
period
covered
by
these
Notes
to
Financial
Statements
is
the
six
months
ended
December
31,
2024
(the
"current
fiscal
period").
Investment
Adviser
and
Sub-Adviser:
The
Funds’
investment
adviser
is
Nuveen
Fund
Advisors,
LLC
(the
“Adviser”),
a
subsidiary
of
Nuveen,
LLC
(“Nuveen”).
Nuveen
is
the
investment
management
arm
of
Teachers
Insurance
and
Annuity
Association
of
America
(TIAA).
The
Adviser
has
overall
responsibility
for
management
of
the
Funds,
oversees
the
management
of
the
Funds’
portfolios,
manages
the
Funds’
business
affairs
and
provides
certain
clerical,
bookkeeping
and
other
administrative
services,
and,
if
necessary,
asset
allocation
decisions.
The
Adviser
has
entered
into
sub-
advisory
agreements
with
Nuveen
Asset
Management,
LLC
(the
“Sub-Adviser”),
a
subsidiary
of
the
Adviser,
under
which
the
Sub-Adviser
manages
the
investment
portfolios
of
the
Funds.
Share
Classes
and
Sales
Charges
:
Class
A
Shares
are
generally
sold
with
an
up-front
sales
charge.
Class
A
Share
purchases
of
$1
million
or
more
are
sold
at
net
asset
value
(“NAV”)
without
an
up-front
sales
charge
but
may
be
subject
to
a
contingent
deferred
sales
charge
(“CDSC”)
of
1%
if
redeemed
within
eighteen
months
of
purchase.
Class
C
Shares
are
sold
without
an
up-front
sales
charge.
Class
C
Shares
are
subject
to
a
CDSC
of
1%
if
redeemed
within
twelve
months
of
purchase.
Class
C
Shares
automatically
convert
to
Class
A
Shares
eight
years
after
purchase.
Class
R6
Shares
and
Class
I
Shares
are
sold
without
an
upfront
sales
charge.
2.
Significant
Accounting
Policies
The
accompanying
financial
statements
were
prepared
in
accordance
with
accounting
principles
generally
accepted
in
the
United
States
of
America
(“U.S.
GAAP”),
which
may
require
the
use
of
estimates
made
by
management
and
the
evaluation
of
subsequent
events.
Actual
results
may
differ
from
those
estimates.
Each
Fund
is
an
investment
company
and
follows
accounting
guidance
in
the
Financial
Accounting
Standards
Board
(“FASB”)
Accounting
Standards
Codification
946,
Financial
Services
—
Investment
Companies.
The
NAV
for
financial
reporting
purposes
may
differ
from
the
NAV
for
processing
security
and shareholder
transactions.
The
NAV
for
financial
reporting
purposes
includes
security
and
common
share
transactions
through
the
date
of
the
report.
Total
return
is
computed
based
on
the
NAV
used
for
processing
security
and
common
share
transactions.
The
following
is
a
summary
of
the
significant
accounting
policies
consistently
followed
by
the
Funds.
Compensation:
Neither
Trust
pays
compensation
directly
to
those
of
its
officers,
all
of
whom
receive
remuneration
for
their
services
to
each
Trust
from
the
Adviser
or
its
affiliates.
The
Funds'
Board
of
Trustees
(the "Board")
has
adopted
a
deferred
compensation
plan
for
independent
trustees
that
enables
trustees
to
elect
to
defer
receipt
of
all
or
a
portion
of
the
annual
compensation
they
are
entitled
to
receive
from
certain
Nuveen-advised
funds.
Under
the
plan,
deferred
amounts
are
treated
as
though
equal
dollar
amounts
had
been
invested
in
shares
of
select
Nuveen-advised
funds.
Distributions
to
Shareholders:
Distributions
to
shareholders
are
recorded
on
the
ex-dividend
date.
The
amount,
character
and
timing
of
distributions
are
determined
in
accordance
with
federal
income
tax
regulations,
which
may
differ
from
U.S.
GAAP.
Foreign
Currency
Transactions
and
Translation:
The
books
and
records
of
the
Fund
are
maintained
in
U.S.
dollars.
Assets,
including
investments,
and
liabilities
denominated
in
foreign
currencies
are
translated
into
U.S.
dollars
at
the
end
of
each
day.
Purchases
and
sales
of
securities,
income
and
expenses
are
translated
into
U.S.
dollars
at
the
prevailing
exchange
rate
on
the
respective
dates
of
the
transactions.
Net
realized
foreign
currency
gains
and
losses
resulting
from
changes
in
exchange
rates
associated
with
(i)
foreign
currency,
(ii)
investments
and
(iii)
derivatives
include
foreign
currency
gains
and
losses
between
trade
date
and
settlement
date
of
the
transactions,
foreign
currency
transactions,
and
the
difference
between
the
amounts
of
interest
and
dividends
recorded
on
the
books
of
the
Fund
and
the
amounts
actually
received
are
recognized
as
a
component
of
“Net
realized
gain
(loss)
from
foreign
currency
transactions”
on
the
Statement
of
Operations,
when
applicable.
The
unrealized
gains
and
losses
resulting
from
changes
in
foreign
currency
exchange
rates
and
changes
in
foreign
exchange
rates
associated
with
(i)
investments
and
(ii)
other
assets
and
liabilities
are
recognized
as
a
component
of
“Change
in
unrealized
appreciation
(depreciation)
on foreign
currency
translations”
on
the
Statement
of
Operations,
when
applicable.
The
unrealized
gains
and
losses
resulting
from
changes
in
foreign
exchange
rates
associated
with
investments
in
derivatives
are
recognized
as
a
component
of
the
respective
derivative’s
related
“Change
in
unrealized
appreciation
(depreciation)”
on
the
Statement
of
Operations,
when
applicable.
Foreign
Taxes:
The
Funds
may
be
subject
to
foreign
taxes
on
income,
gains
on
investments
or
foreign
currency
repatriation,
a
portion
of
which
may
be
recoverable.
The
Funds
will
accrue
such
taxes
and
recoveries
as
applicable,
based
upon
the
current
interpretation
of
tax
rules
and
regulations
that
exist
in
the
markets
in
which
the
Funds
invest.
Indemnifications:
Under each
Trust’s
organizational
documents,
its
officers
and
trustees
are
indemnified
against
certain
liabilities
arising
out
of
the
performance
of
their
duties
to each
Trust.
In
addition,
in
the
normal
course
of
business, each
Trust
enters
into
contracts
that
provide
general
indemnifications
to
other
parties. Each
Trust’s
maximum
exposure
under
these
arrangements
is
unknown
as
this
would
involve
future
claims
that
may
be
made
against each
Trust
that
have
not
yet
occurred.
However, each
Trust
has
not
had
prior
claims
or
losses
pursuant
to
these
contracts
and
expects
the
risk
of
loss
to
be
remote.
Investments
and
Investment
Income:
Securities
transactions
are
accounted
for
as
of
the
trade
date
for
financial
reporting
purposes.
Realized
gains
and
losses
on
securities
transactions
are
based
upon
the
specific
identification
method.
Dividend
income
is
recorded
on
the
ex-dividend
date
or,
for
certain
foreign
securities,
when
information
is
available.
Non-cash
dividends
received
in
the
form
of
stock,
if
any,
are
recognized
on
the
ex-
dividend
date
and
recorded
at
fair
value.
Interest
income
is
recorded
on
an
accrual
basis.
Securities
lending
income
is
comprised
of
fees
earned
from
borrowers
and
income
earned
on
cash
collateral
investments.
Multiclass
Operations
and
Allocations:
Income
and
expenses
of
the
Funds
that
are
not
directly
attributable
to
a
specific
class
of
shares
are
prorated
among
the
classes
based
on
the
relative
net
assets
of
each
class.
Expenses
directly
attributable
to
a
class
of
shares
are
recorded
to
the
specific
class.
12b-1
distribution
and
service
fees
are
allocated
on
a
class-specific
basis.
Sub-transfer
agent
fees
and
similar
fees,
which
are
recognized
as
a
component
of
“Shareholder
servicing
agent
fees”
on
the
Statement
of
Operations,
are
not
charged
to
Class
R6
Shares
and
are
prorated
among
the
other
classes
based
on
their
relative
net
assets.
Realized
and
unrealized
capital
gains
and
losses
of
the
Funds
are
prorated
among
the
classes
based
on
the
relative
net
assets
of
each
class.
Netting
Agreements:
In
the
ordinary
course
of
business,
the
Funds
may
enter
into
transactions
subject
to
enforceable
master
repurchase
agreements,
International
Swaps
and
Derivatives
Association,
Inc.
(ISDA)
master
agreements
or
other
similar
arrangements
(“netting
agreements”).
Generally,
the
right
to
offset
in
netting
agreements
allows
each
Fund
to
offset
certain
securities
and
derivatives
with
a
specific
counterparty,
when
applicable,
as
well
as
any
collateral
received
or
delivered
to
that
counterparty
based
on
the
terms
of
the
agreements.
Generally,
each
Fund
manages
its
cash
collateral
and
securities
collateral
on
a
counterparty
basis.
With
respect
to
certain
counterparties,
in
accordance
with
the
terms
of
the
netting
agreements,
collateral
posted
to
the
Funds
is
held
in
a
segregated
account
by
the
Funds’
custodian
and/or
with
respect
to
those
amounts
which
can
be
sold
or
repledged,
are
presented
in
the
Funds’
Portfolio
of
Investments
or
Statement
of
Assets
and
Liabilities.
The
Funds’
investments
subject
to
netting
agreements
as
of
the
end
of
the
reporting
period,
if
any,
are
further
described
later
in
these
Notes
to
Financial
Statements.
Segment
Reporting:
In
November
2023,
the
FASB
issued
Accounting
Standard
Update
(“ASU”)
No.
2023-07,
Segment
Reporting
(Topic
280)
Improvements
to
Reportable
Segment
Disclosures
(“ASU
2023-07”).
The
amendments
in
ASU
2023-07
improve
reportable
segment
disclosure
requirements,
primarily
through
enhanced
disclosures
about
significant
segment
expenses.
ASU
2023-07
also
requires
a
public
entity
that
has
a
single
reportable
segment
to
provide
all
the
disclosures
required
by
the
amendments
in
ASU
2023-07
and
all
existing
segment
disclosures
in
Topic
280.
The
amendments
in
ASU
2023-07
are
effective
for
fiscal
years
beginning
after
December
15,
2023,
and
interim
periods
within
fiscal
years
beginning
after
December
15,
2024.
The
Funds
adopted
ASU
2023-07
during
the
current
reporting
period.
Adoption
of
the
new
standard
impacted
financial
statement
disclosures
only
and
did
not
affect
the
Funds’
financial
positions
or
the
results
of
their
operations.
The
officers
of
the
Funds
act
as
the
chief
operating
decision
maker
(“CODM”).
Each
Fund
represents
a
single
operating
segment.
The
CODM
monitors
the
operating
results
of
each
Fund
as
a
whole
and
is
responsible
for
each
Fund’s
long-term
strategic
asset
allocation
in
accordance
with
the
terms
of
its
prospectus,
based
on
a
defined
investment
strategy
which
is
executed
by
the
Fund’s
portfolio
managers
as
a
team.
The
financial
information
in
the
form
of
the
Fund’s
portfolio
composition,
total
returns,
expense
ratios
and
changes
in
net
assets
(i.e.,
changes
in
net
assets
resulting
from
operations,
subscriptions
and
redemptions),
which
are
used
by
the
CODM
to
assess
the
segment’s
performance
versus
the
Fund’s
comparative
benchmarks
and
to
make
resource
allocation
decisions
for
the
Fund’s
single
segment,
is
consistent
with
that
presented
within
the
Fund’s
financial
statements.
Segment
assets
are
reflected
on
the
Statement
of
Assets
and
Liabilities
as
“total
assets”
and
significant
segment
revenues
and
expenses
are
listed
on
the
Statement
of
Operations.
3.
Investment
Valuation
and
Fair
Value
Measurements
The
Funds’
investments
in
securities
are
recorded
at
their
estimated
fair
value
utilizing
valuation
methods
approved
by
the
Adviser,
subject
to
oversight
of
the Board.
Fair
value
is
defined
as
the
price
that
would
be
received
upon
selling
an
investment
or
transferring
a
liability
in
an
orderly
transaction
to
an
independent
buyer
in
the
principal
or
most
advantageous
market
for
the
investment.
U.S.
GAAP
establishes
the
three-tier
hierarchy
which
is
used
to
maximize
the
use
of
observable
market
data
and
minimize
the
use
of
unobservable
inputs
and
to
establish
classification
of
fair
value
measurements
for
disclosure
purposes.
Observable
inputs
reflect
the
assumptions
market
participants
would
use
in
pricing
the
asset
or
liability.
Observable
inputs
are
based
on
market
data
obtained
from
sources
independent
of
the
reporting
entity.
Unobservable
inputs
reflect
management’s
assumptions
about
the
assumptions
market
participants
would
use
in
pricing
the
asset
or
liability.
Unobservable
inputs
are
based
on
the
best
information
available
in
the
circumstances.
The
following
is
a
summary
of
the
three-tiered
hierarchy
of
valuation
input
levels.
Level
1
–
Inputs
are
unadjusted
and
prices
are
determined
using
quoted
prices
in
active
markets
for
identical
securities.
Level
2
–
Prices
are
determined
using
other
significant
observable
inputs
(including
quoted
prices
for
similar
securities,
interest
rates,
credit
spreads,
etc.).
Level
3
–
Prices
are
determined
using
significant
unobservable
inputs
(including
management’s
assumptions
in
determining
the
fair
value
of
investments).
A
description
of
the
valuation
techniques
applied
to
the
Funds’
major
classifications
of
assets
and
liabilities
measured
at
fair
value
follows:
Notes
to
Financial
Statements
(continued)
Equity
securities
and
exchange-traded
funds
listed
or
traded
on
a
national
market
or
exchange
are
valued
based
on
their
last
reported sales
price
or
official
closing
price of such
market
or
exchange
on
the
valuation
date.
Foreign
equity
securities
and
registered
investment
companies
that
trade
on
a
foreign
exchange
are
valued
at
the
last
reported sales
price
or
official
closing
price
on
the
principal
exchange
where
traded,
and
converted
to
U.S.
dollars
at
the
prevailing
rates
of
exchange
on
the valuation
date.
For
events affecting
the value
of
foreign
securities
between
the
time
when
the
exchange
on
which
they
are
traded
closes
and
the
time
when
the
Funds'
net
assets
are
calculated,
such
securities
will
be
valued
at
fair
value
in
accordance
with
procedures
adopted
by
the
Adviser,
subject
to
the
oversight
of
the
Board. To
the
extent
these
securities
are
actively
traded
and
no
valuation
adjustments
are
applied,
they
are
generally
classified
as
Level
1. When
valuation
adjustments
are
applied
to
the
most
recent
last
sales
price
or
official
closing
price, these
securities
are
generally
classified
as
Level
2.
Prices
of
certain
American
Depositary
Receipts
(“ADR”)
held
by
the
Funds
that
trade
in
the
United
States
are
valued
based
on
the
last
traded
price,
official
closing
price,
or
an
evaluated
price
provided
by
the
pricing
services and
are
generally
classified
as
Level
1
or
2.
Repurchase
agreements
are
valued
at
contract
amount
plus
accrued
interest,
which
approximates
market
value.
These
securities
are
generally
classified
as
Level
2.
Investments
in
investment
companies
are
valued
at
their
respective
NAVs
or
share
price on
the
valuation
date
and
are
generally
classified
as
Level
1.
Purchased
and
written
options
traded
and
listed
on
a
national
market
or
exchange
are
valued
at
the
mean
of
the
closing
bid
and
asked
prices
and
are
generally
classified
as
Level
1.
For
any
portfolio
security
or
derivative
for
which
market
quotations
are
not
readily
available
or
for
which
the
Adviser
deems
the
valuations
derived
using
the
valuation
procedures
described
above
not
to
reflect
fair
value,
the
Adviser
will
determine
a
fair
value
in
good
faith
using
alternative
procedures
approved
by
the
Adviser,
subject
to
the
oversight
of
the
Board.
As
a
general
principle,
the
fair
value
of
a
security
is
the
amount
that
the
owner
might
reasonably
expect
to
receive
for
it
in
a
current
sale.
A
variety
of
factors
may
be
considered
in
determining
the
fair
value
of
such
securities,
which
may
include
consideration
of
the
following:
yields
or
prices
of
investments
of
comparable
quality,
type
of
issue,
coupon,
maturity
and
rating,
market
quotes
or
indications
of
value
from
security
dealers,
evaluations
of
anticipated
cash
flows
or
collateral,
general
market
conditions
and
other
information
and
analysis,
including
the
obligor’s
credit
characteristics
considered
relevant.
To
the
extent
the
inputs
are
observable
and
timely,
the
values
would
be
classified
as
Level
2;
otherwise
they
would
be
classified
as
Level
3.
The
following
table
summarizes
the
market
value
of
the
Funds’
investments
as
of
the
end
of
the
reporting
period,
based
on
the
inputs
used
to
value
them:
Global
Equity
Income
Level
1
Level
2
Level
3
Total
Long-Term
Investments:
Common
Stocks
$
69,936,821
$
60,270,565
$
–
$
130,207,386
Investments
in
Derivatives:
Options
Written
(244,400)
–
–
(244,400)
Total
$
69,692,421
$
60,270,565
$
–
$
129,962,986
International
Value
Level
1
Level
2
Level
3
Total
Long-Term
Investments:
Common
Stocks
$
18,078,112
$
85,602,101
$
–
$
103,680,213
Investments
Purchased
with
Collateral
from
Securities
Lending
2,112,112
–
–
2,112,112
Short-Term
Investments:
Repurchase
Agreements
–
75,000
–
75,000
Total
$
20,190,224
$
85,677,101
$
–
$
105,867,325
Large
Cap
Value
Opportunities
Level
1
Level
2
Level
3
Total
Long-Term
Investments:
Common
Stocks
$
21,999,113
$
–
$
–
$
21,999,113
Investments
Purchased
with
Collateral
from
Securities
Lending
4,999
–
–
4,999
Short-Term
Investments:
Repurchase
Agreements
–
25,000
–
25,000
Total
$
22,004,112
$
25,000
$
–
$
22,029,112
4.
Portfolio
Securities
Repurchase
Agreements:
In
connection
with
transactions
in
repurchase
agreements,
it
is
each
Fund's
policy
that
its
custodian
take
possession
of
the
underlying
collateral
securities,
the
fair
value
of
which
exceeds
the
principal
amount
of
the
repurchase
transaction,
including
accrued
interest,
at
all
times.
If
the
counterparty
defaults,
and
the
fair
value
of
the
collateral
declines,
realization
of
the
collateral
may
be
delayed
or
limited.
The
following
table
presents
the
repurchase
agreements
for
the
Funds
that
are
subject
to
netting
agreements
as
of
the
end
of
the
reporting
period,
and
the
collateral
delivered
related
to
those
repurchase
agreements.
Securities
Lending:
Each
Fund
may
lend
securities
representing
up
to
one-third
of
the
value
of
its
total
assets
to
broker-dealers,
banks,
and
other
institutions
in
order
to
generate
additional
income.
When
loaning
securities,
the
Fund
retains
the
benefits
of
owning
the
securities,
including
the
economic
equivalent
of
dividends
or
interest
generated
by
the
security.
The
loans
are
continuous,
can
be
recalled
at
any
time,
and
have
no
set
maturity.
The
Funds’
custodian,
State
Street
Bank
and
Trust
Company,
serves
as
the
securities
lending
agent
(the
“Agent”).
When
a
Fund
loans
its
portfolio
securities,
it
will
receive,
at
the
inception
of
each
loan,
cash
collateral
equal
to
an
amount
not
less
than
100%
of
the
market
value
of
the
loaned
securities.
The
actual
percentage
of
the
cash
collateral
will
vary
depending
upon
the
asset
type
of
the
loaned
securities.
Collateral
for
the
loaned
securities
is
invested
in
a
government
money
market
vehicle
maintained
by
the
Agent,
which
is
subject
to
the
requirements
of
Rule
2a-7
under
the
1940
Act.
The
value
of
the
loaned
securities
and
the
liability
to
return
the
cash
collateral
received
are
recognized
on
the
Statement
of
Assets
and
Liabilities.
If
the
market
value
of
the
loaned
securities
increases,
the
borrower
must
furnish
additional
collateral
to
the
Fund,
which
is
also
recognized
on
the
Statement
of
Assets
and
Liabilities.
Securities
out
on
loan
are
subject
to
termination
at
any
time
at
the
option
of
the
borrower
or
the
Fund.
Upon
termination,
the
borrower
is
required
to
return
to
the
Fund
securities
identical
to
the
securities
loaned.
During
the
term
of
the
loan,
the
Fund
bears
the
market
risk
with
respect
to
the
investment
of
collateral
and
the
risk
that
the
Agent
may
default
on
its
contractual
obligations
to
the
Fund.
The
Agent
bears
the
risk
that
the
borrower
may
default
on
its
obligation
to
return
the
loaned
securities
as
the
Agent
is
contractually
obligated
to
indemnify
the
Fund
if
at
the
time
of
a
default
by
a
borrower
some
or
all
of
the
loan
securities
have
not
been
returned.
Multi
Cap
Value
Level
1
Level
2
Level
3
Total
Long-Term
Investments:
Common
Stocks
$
497,738,966
$
–
$
–
$
497,738,966
Investments
Purchased
with
Collateral
from
Securities
Lending
6,176,318
–
–
6,176,318
Short-Term
Investments:
Repurchase
Agreements
–
325,000
–
325,000
Total
$
503,915,284
$
325,000
$
–
$
504,240,284
Small
Cap
Value
Opportunities
Level
1
Level
2
Level
3
Total
Long-Term
Investments:
Common
Stocks
$
206,228,680
$
–
$
–
$
206,228,680
Investments
Purchased
with
Collateral
from
Securities
Lending
2,319,649
–
–
2,319,649
Short-Term
Investments:
Repurchase
Agreements
–
10,784,827
–
10,784,827
Total
$
208,548,329
$
10,784,827
$
–
$
219,333,156
Small/Mid
Cap
Value
Level
1
Level
2
Level
3
Total
Long-Term
Investments:
Common
Stocks
$
106,084,997
$
–
$
–
$
106,084,997
Investments
Purchased
with
Collateral
from
Securities
Lending
1,461,269
–
–
1,461,269
Short-Term
Investments:
Repurchase
Agreements
–
3,462,301
–
3,462,301
Total
$
107,546,266
$
3,462,301
$
–
$
111,008,567
Fund
Counterparty
Short-term
Investments,
at
Value
Collateral
Pledged
(From)
Counterparty
International
Value
Fixed
Income
Clearing
Corporation
$
75,000
$
(76,616)
Large
Cap
Value
Opportunities
Fixed
Income
Clearing
Corporation
25,000
(25,648)
Multi
Cap
Value
Fixed
Income
Clearing
Corporation
325,000
(331,618)
Small
Cap
Value
Opportunities
Fixed
Income
Clearing
Corporation
10,784,827
(11,000,838)
Small/Mid
Cap
Value
Fixed
Income
Clearing
Corporation
3,462,301
(3,531,788)
Notes
to
Financial
Statements
(continued)
Securities
lending
income
recognized
by
a
Fund
consists
of
earnings
on
invested
collateral
and
lending
fees,
net
of
any
rebates
to
the
borrower
and
compensation
to
the
Agent.
Such
income
is
recognized
on
the
Statement
of
Operations.
As
of
the
end
of
the
current
fiscal
period,
the
total
value
of
the
loaned
securities
and
the
total
value
of
collateral
received
were
as
follows:
Purchases
and
Sales:
Long-term
purchases
and
sales during
the
current fiscal
period
were
as
follows:
The
Funds
may
purchase
securities
on
a
when-issued
or
delayed-delivery
basis.
Securities
purchased
on
a
when-issued
or
delayed-delivery
basis
may
have
extended
settlement
periods;
interest
income
is
not
accrued
until
settlement
date.
Any
securities
so
purchased
are
subject
to
market
fluctuation
during
this
period. If
a
Fund
has
outstanding
when-issued/delayed-delivery
purchases
commitments
as
of
the
end
of
the
reporting
period,
such
amounts
are
recognized
on
the
Statement
of
Assets
and
Liabilities.
5.
Derivative
Investments
Each
Fund
is
authorized
to
invest
in
certain
derivative
instruments.
As
defined
by
U.S.
GAAP,
a
derivative
is
a
financial
instrument
whose
value
is
derived
from
an
underlying
security
price,
foreign
exchange
rate,
interest
rate,
index
of
prices
or
rates,
or
other
variables.
Investments
in
derivatives
as
of
the
end
of
and/or
during
the
current
fiscal
period,
if
any,
are
included
within
the
Statement
of
Assets
and
Liabilities
and
the
Statement
of
Operations,
respectively.
Options
Transactions:
The
Funds
may
purchase
(buy)
or
write
(sell)
put
and
call
options
on
specific
securities
(including
groups
or
"baskets"
of
specific
securities),
interest
rates,
stock
indices
and/or
bond
indices
(each
a
“financial
instrument”).
Options
can
be
settled
either
directly
with
the
counterparty
(over
the
counter)
or
through
a
central
clearing
house
(exchange
traded).
Call
and
put
options
give
the
holder
the
right,
in
return
for
a
premium
paid,
to
purchase
or
sell,
respectively,
a
financial
instrument
at
a
specified
exercise
price
at
any
time
during
the
period
of
the
option.
When
a
Fund
purchases
an
option,
an
amount
equal
to
the
premium
paid
(the
premium
plus
commission)
is
recognized
as
an
asset
on
the
Statement
of
Asset
and
Liabilities.
When
a
Fund
writes
an
option,
an
amount
equal
to
the
net
premium
received
(the
premium
less
commission)
is
recognized
as
a
liability
on
the
Statement
of
Assets
and
Liabilities
and
is
subsequently
adjusted
to
reflect
the
current
value
of
the
written
option
until
the
option
is
exercised
or
expires
or
the
Fund
enters
into
a
closing
purchase
transaction.
The
changes
in
the
value
of
options
purchased
and/or
written
during
the
fiscal
period
are
recognized
as
in
unrealized
appreciation
(depreciation)
on
the
Statement
of
Operations.
When
an
option
expires,
the
premiums
received
or
paid
are
recognized
as
realized
gains
or
losses
on
the
Statement
of
Operations.
When
an
option
is
exercised
or
a
closing
purchase
transaction
is
entered
into,
the
difference
between
the
premium
and
the
amount
received
or
paid
in
a
closing
transaction
is
recognized
as
a
realized
gain
or
loss
on
the
Statement
of
Operations.
The
market
risk
associated
with
purchasing
options
is
limited
to
the
premium
paid.
The
Fund,
as
writer
of
an
option,
has
no
control
over
whether
the
underlying
instrument
may
be
sold
(called)
or
purchased
(put)
and
as
a
result
bears
the
risk
of
an
unfavorable
change
in
the
market
value
of
the
instrument
underlying
the
written
option.
There
is
also
the
risk
the
Fund
may
not
be
able
to
enter
into
a
closing
transaction
because
of
an
illiquid
market.
t
During
the
current
fiscal
period,
Global
Equity
Income
wrote
call
options
to
manage
risk
and
hedge
against
adverse
movement
in
a
security
held
in
the
portfolio.
The
average
notional
amount
of
outstanding
options
written
during
the
current
fiscal
period,
was
as
follows:
Fund
Asset
Class
out
on
Loan
Long-Term
Investments,
at
Value
Total
Collateral
Received
International
Value
Common
Stock
$2,045,141
$2,112,112
Large
Cap
Value
Opportunities
Common
Stock
3,711
4,999
Multi
Cap
Value
Common
Stock
5,908,775
6,176,318
Small
Cap
Value
Opportunities
Common
Stock
2,227,870
2,319,649
Small/Mid
Cap
Value
Common
Stock
1,403,861
1,461,269
Fund
Non-U.S.
Government
Purchases
Non-U.S.
Government
Sales
Global
Equity
Income
$
19,995,332
$
27,429,722
International
Value
15,346,753
16,213,290
Large
Cap
Value
Opportunities
3,115,185
4,235,151
Multi
Cap
Value
94,102,229
104,646,354
Small
Cap
Value
Opportunities
94,797,721
120,711,509
Small/Mid
Cap
Value
32,402,040
34,429,015
As
of the
end
of
the
reporting
period,
the
following
Fund
has
invested
in
derivative
contracts
which
is
reflected
in
the
Statement
of
Assets
and
Liabilities
as
follows:
During
the
current
fiscal
period,
the
effect
of
derivative
contracts
on
the
Fund’s
Statement
of
Operations
was
as
follows:
Market
and
Counterparty
Credit
Risk:
In
the
normal
course
of
business
each
Fund
may
invest
in
financial
instruments
and
enter
into
financial
transactions
where
risk
of
potential
loss
exists
due
to
changes
in
the
market
(market
risk)
or
failure
of
the
other
party
to
the
transaction
to
perform
(counterparty
credit
risk).
The
potential
loss
could
exceed
the
value
of
the
financial
assets
recorded
on
the
financial
statements.
Financial
assets,
which
potentially
expose
each
Fund
to
counterparty
credit
risk,
consist
principally
of
cash
due
from
counterparties
on
forward,
option
and
swap
transactions,
when
applicable.
The
extent
of
each
Fund’s
exposure
to
counterparty
credit
risk
in
respect
to
these
financial
assets
approximates
their
carrying
value
as
recorded
on
the
Statement
of
Assets
and
Liabilities.
Each
Fund
helps
manage
counterparty
credit
risk
by
entering
into
agreements
only
with
counterparties
the
Adviser
believes
have
the
financial
resources
to
honor
their
obligations
and
by
having
the
Adviser
monitor
the
financial
stability
of
the
counterparties.
Additionally,
counterparties
may
be
required
to
pledge
collateral
daily
(based
on
the
daily
valuation
of
the
financial
asset)
on
behalf
of
each
Fund
with
a
value
approximately
equal
to
the
amount
of
any
unrealized
gain
above
a
pre-determined
threshold.
Reciprocally,
when
each
Fund
has
an
unrealized
loss,
the
Funds
have
instructed
the
custodian
to
pledge
assets
of
the
Funds
as
collateral
with
a
value
approximately
equal
to
the
amount
of
the
unrealized
loss
above
a
pre-determined
threshold.
Collateral
pledges
are
monitored
and
subsequently
adjusted
if
and
when
the
valuations
fluctuate,
either
up
or
down,
by
at
least
the
pre-determined
threshold
amount.
Fund
Average
Notional
Amount
of
Written
Options
Contracts
Outstanding
*
Global
Equity
Income
$
736,667
*
The
average
notional
amount
is
calculated
based
on
the
outstanding
notional
amount
of
contracts
at
the
beginning
of
the
current
fiscal
period
and
at
the
end
of
each
fiscal
quarter
within
the
current
fiscal
period.
Asset
Derivatives
Liability
Derivatives
Derivative
Instrument
Risk
Exposure
Location
Value
Location
Value
Global
Equity
Income
Options
Written
Equity
-
$
–
Options
written,
at
value
$
(244,400)
1
1
1
1
1
1
1
1
Derivative
Instrument
Risk
Exposure
Net
Realized
Gain
(Loss)
Change
in
Unrealized
Appreciation
(Depreciation)
Global
Equity
Income
Written
options
Equity
$
–
$
(102,948)
Notes
to
Financial
Statements
(continued)
6.
Fund
Shares
Transactions
in Fund
shares
during
the
current
and
prior
fiscal
period
were
as
follows:
Six
Months
Ended
12/31/24
Year
Ended
6/30/24
Global
Equity
Income
Shares
Amount
Shares
Amount
Subscriptions:
Class
A
8,954
$309,677
84,189
$2,638,537
Class
C
125
4,350
2,214
68,102
Class
I
46,098
1,613,272
118,887
3,653,838
Total
subscriptions
55,177
1,927,299
205,290
6,360,477
Reinvestments
of
distributions:
Class
A
15,402
546,918
61,232
1,969,644
Class
C
86
3,082
601
19,140
Class
I
9,378
332,511
34,720
1,114,467
Total
reinvestments
of
distributions
24,866
882,511
96,553
3,103,251
Redemptions:
Class
A
(182,854)
(6,382,609)
(376,703)
(11,716,943)
Class
C
(5,521)
(189,911)
(35,610)
(1,064,362)
Class
I
(90,812)
(3,144,595)
(338,491)
(10,549,458)
Total
redemptions
(279,187)
(9,717,115)
(750,804)
(23,330,763)
Net
increase
(decrease)
(199,144)
$(6,907,305)
(448,961)
$(13,867,035)
Six
Months
Ended
12/31/24
Year
Ended
6/30/24
International
Value
Shares
Amount
Shares
Amount
Subscriptions:
Class
A
42,478
$1,230,492
90,186
$2,401,951
Class
C
46
1,250
6,680
162,084
Class
I
371,452
10,567,320
681,428
18,150,331
Total
subscriptions
413,976
11,799,062
778,294
20,714,366
Reinvestments
of
distributions:
Class
A
14,696
406,926
13,494
365,547
Class
C
210
5,498
228
5,861
Class
I
71,234
1,986,001
60,296
1,644,261
Total
reinvestments
of
distributions
86,140
2,398,425
74,018
2,015,669
Redemptions:
Class
A
(78,697)
(2,262,313)
(177,601)
(4,765,851)
Class
C
(2,415)
(65,328)
(9,040)
(225,171)
Class
I
(366,941)
(10,623,430)
(705,599)
(18,896,291)
Total
redemptions
(448,053)
(12,951,071)
(892,240)
(23,887,313)
Net
increase
(decrease)
52,063
$1,246,416
(39,928)
$(1,157,278)
Six
Months
Ended
12/31/24
Year
Ended
6/30/24
Large
Cap
Value
Opportunities
Shares
Amount
Shares
Amount
Subscriptions:
Class
A
60,207
$304,019
289,155
$1,284,054
Class
C
9,667
35,293
25,511
88,015
Class
I
126,527
660,973
87,875
392,324
Total
subscriptions
196,401
1,000,285
402,541
1,764,393
Reinvestments
of
distributions:
Class
A
104,389
520,510
31,409
138,443
Class
C
24,643
90,442
4,653
15,296
Class
I
150,210
756,707
54,585
242,904
Total
reinvestments
of
distributions
279,242
1,367,659
90,647
396,643
Redemptions:
Class
A
(171,601)
(875,858)
(206,782)
(912,713)
Class
C
(5,664)
(20,857)
(69,906)
(224,572)
Class
I
(259,257)
(1,349,626)
(426,197)
(1,891,859)
Total
redemptions
(436,522)
(2,246,341)
(702,885)
(3,029,144)
Net
increase
(decrease)
39,121
$121,603
(209,697)
$(868,108)
Six
Months
Ended
12/31/24
Year
Ended
6/30/24
Multi
Cap
Value
Shares
Amount
Shares
Amount
Subscriptions:
Class
A
34,186
$1,849,322
86,310
$3,956,204
Class
C
17,955
902,072
44,184
1,903,811
Class
I
570,820
30,540,330
6,996,485
327,347,815
Total
subscriptions
622,961
33,291,724
7,126,979
333,207,830
Reinvestments
of
distributions:
Class
A
13,361
731,956
9,227
429,968
Class
C
701
35,759
111
4,798
Class
I
145,483
8,051,930
63,548
2,993,104
Total
reinvestments
of
distributions
159,545
8,819,645
72,886
3,427,870
Redemptions:
Class
A
(54,836)
(2,929,261)
(121,865)
(5,659,139)
Class
C
(2,824)
(139,288)
(11,320)
(479,509)
Class
I
(1,027,200)
(57,620,557)
(376,188)
(17,336,688)
Total
redemptions
(1,084,860)
(60,689,106)
(509,373)
(23,475,336)
Net
increase
(decrease)
(302,354)
$(18,577,737)
6,690,492
$313,160,364
Notes
to
Financial
Statements
(continued)
7.
Income
Tax
Information
Each
Fund
is
a
separate
taxpayer
for
federal
income
tax
purposes.
Each
Fund
intends
to
distribute
substantially
all
of
its
net
investment
income
and
net
capital
gains
to
shareholders
and
otherwise
comply
with
the
requirements
of
Subchapter
M
of
the
Internal
Revenue
Code
applicable
to
regulated
investment
companies.
Therefore,
no
federal
income
tax
provision
is
required.
Each
Fund
files
income
tax
returns
in
U.S.
federal
and
applicable
state
and
local
jurisdictions.
A
Fund's
federal
income
tax
returns
are
generally
subject
to
examination
for
a
period
of
three
fiscal
years
after
being
filed.
State
and
local
tax
returns
may
be
subject
to
examination
for
an
additional
period
of
time
depending
on
the
jurisdiction.
Management
has
analyzed
each
Fund's
tax
positions
taken
for
all
open
tax
years
and
has
concluded
that
no
provision
for
income
tax
is
required
in
the
Fund's
financial
statements.
Six
Months
Ended
12/31/24
Year
Ended
6/30/24
Small
Cap
Value
Opportunities
Shares
Amount
Shares
Amount
Subscriptions:
Class
A
38,307
$2,199,827
51,394
$2,555,925
Class
C
6,791
332,972
4,457
182,340
Class
R6
16,677
999,131
20,312
1,086,748
Class
I
382,786
22,941,278
360,921
18,991,900
Total
subscriptions
444,561
26,473,208
437,084
22,816,913
Reinvestments
of
distributions:
Class
A
88,359
4,562,734
2,407
121,511
Class
C
8,926
361,699
120
4,951
Class
R6
17,905
998,814
769
41,409
Class
I
762,599
41,732,354
26,602
1,409,462
Total
reinvestments
of
distributions
877,789
47,655,601
29,898
1,577,333
Redemptions:
Class
A
(68,447)
(3,923,696)
(95,452)
(4,713,180)
Class
C
(9,272)
(444,789)
(32,099)
(1,288,046)
Class
R6
(9,198)
(573,098)
(37,680)
(1,979,232)
Class
I
(816,104)
(46,433,470)
(628,781)
(31,886,053)
Total
redemptions
(903,021)
(51,375,053)
(794,012)
(39,866,511)
Net
increase
(decrease)
419,329
$22,753,756
(327,030)
$(15,472,265)
Six
Months
Ended
12/31/24
Year
Ended
6/30/24
Small/Mid
Cap
Value
Shares
Amount
Shares
Amount
Subscriptions:
Class
A
59,573
$2,107,647
45,031
$1,387,731
Class
C
6,580
186,339
483
11,946
Class
R6
216,868
7,851,373
158,489
4,874,839
Class
I
301,016
10,887,187
1,594,016
46,871,586
Total
subscriptions
584,037
21,032,546
1,798,019
53,146,102
Reinvestments
of
distributions:
Class
A
19,364
649,784
484
14,244
Class
C
1,904
50,568
50
1,171
Class
R6
72,899
2,559,739
5,383
165,637
Class
I
222,370
7,732,272
22,968
699,994
Total
reinvestments
of
distributions
316,537
10,992,363
28,885
881,046
Redemptions:
Class
A
(10,910)
(361,225)
(30,708)
(908,546)
Class
C
(5,486)
(145,064)
(4,696)
(120,015)
Class
R6
(141,248)
(5,065,861)
(159,443)
(4,850,073)
Class
I
(424,725)
(15,337,454)
(1,628,360)
(50,096,961)
Total
redemptions
(582,369)
(20,909,604)
(1,823,207)
(55,975,595)
Net
increase
(decrease)
318,205
$11,115,305
3,697
$(1,948,447)
As
of
the
end
of
the
reporting
period,
the
aggregate
cost
and
the
net
unrealized
appreciation/(depreciation)
of
all
investments
for
federal
income
tax
purposes
were
as
follows:
For
purposes
of
this
disclosure,
tax
cost
generally
includes
the
cost
of
portfolio
investments
as
well
as
up-front
fees
or
premiums
exchanged
on
derivatives
and
any
amounts
unrealized
for
income
statement
reporting
but
realized
income
and/or
capital
gains
for
tax
reporting,
if
applicable.
As
of
prior
fiscal
period
end,
the
components
of
accumulated
earnings
on
a
tax
basis
were
as
follows:
As
of
prior
fiscal
period
end,
the
Funds
had
capital
loss
carryforwards,
which
will
not
expire:
8.
Management
Fees
and
Other
Transactions
with
Affiliates
Management
Fees:
Each
Fund’s
management
fee
compensates
the
Adviser
for
the
overall
investment
advisory
and
administrative
services
and
general
office
facilities.
The
Sub-Adviser
is
compensated
for
its
services
to
the
Funds
from
the
management
fees
paid
to
the
Adviser.
Each
Fund’s
management
fee
consists
of
two
components
–
a
fund-level
fee,
based
only
on
the
amount
of
assets
within
each
individual
Fund,
and
a
complex-level
fee,
based
on
the
aggregate
amount
of
all
eligible
fund
assets
managed
by
the
Adviser.
This
pricing
structure
enables
each
Fund’s
shareholders
to
benefit
from
growth
in
the
assets
within
their
respective
Fund
as
well
as
from
growth
in
the
amount
of
complex-wide
assets
managed
by
the
Adviser.
Fund
Tax
Cost
Gross
Unrealized
Appreciation
Gross
Unrealized
(Depreciation)
Net
Unrealized
Appreciation
(Depreciation)
Global
Equity
Income
$
97,078,263
$
38,337,026
$
(5,452,303)
$
32,884,723
International
Value
77,231,135
36,042,174
(7,405,984)
28,636,190
Large
Cap
Value
Opportunities
13,721,417
8,667,261
(359,566)
8,307,695
Multi
Cap
Value
404,821,692
110,750,041
(11,331,449)
99,418,592
Small
Cap
Value
Opportunities
185,725,096
40,025,864
(6,417,804)
33,608,060
Small/Mid
Cap
Value
90,822,373
23,766,641
(3,580,447)
20,186,194
Fund
Undistributed
Ordinary
Income
Undistributed
Long-Term
Capital
Gains
Unrealized
Appreciation
(Depreciation)
Capital
Loss
Carryforwards
Late-Year
Loss
Deferrals
Other
Book-to-Tax
Differences
Total
Global
Equity
Income
$
1,974,884
$
—
$
31,447,161
$
(228,656,653)
$
—
$
(1,484,186)
$
(196,718,794)
International
Value
2,483,345
—
26,313,005
(195,407,278)
—
—
(166,610,928)
Large
Cap
Value
Opportunities
268,319
816,970
7,425,977
—
—
—
8,511,266
Multi
Cap
Value
698,980
—
66,937,742
(589,389)
—
(16,377)
67,030,956
Small
Cap
Value
Opportunities
1,226,244
30,516,209
32,673,312
—
—
—
64,415,765
Small/Mid
Cap
Value
1,324,424
4,253,281
20,876,043
—
—
—
26,453,748
Fund
Short-Term
Long-Term
Total
Global
Equity
Income
1
$
7,174,460
$
221,482,193
$
228,656,653
International
Value
6,723,036
188,684,242
195,407,278
Large
Cap
Value
Opportunities
—
—
—
Multi
Cap
Value
—
589,389
589,389
Small
Cap
Value
Opportunities
—
—
—
Small/Mid
Cap
Value
—
—
—
1
Global
Equity
Income’s
capital
loss
carryforward
is
subject
to
significant
limitations
under
the
Internal
Revenue
Code
and
related
regulations.
In
particular,
it
is
expected
that
the
Fund
will
only
be
able
to
annually
utilize
approximately
$4
million
of
its
outstanding
capital
loss
carryforward
for
the
next
fifteen
years,
at
which
point
the
annual
limitation
will
further
be
reduced
to
approximately
$1.2
million.
Notes
to
Financial
Statements
(continued)
The
annual
fund-level
fee,
payable
monthly,
for
each
Fund
is
calculated
according
to
the
following
schedule:
The
annual
complex-level
fee,
payable
monthly,
for
each
Fund
is
calculated
according
to
the
following
schedule:
*
The
complex-level
fee
is
calculated
based
upon
the
aggregate
daily
“eligible
assets”
of
all
Nuveen-branded
closed-end
funds
and
Nuveen
branded
open-end
funds
(“Nuveen
Mutual
Funds”).
Except
as
described
below,
eligible
assets
include
the
assets
of
all
Nuveen-branded
closed-end
funds
and
Nuveen
Mutual
Funds
organized
in
the
United
States.
Eligible
assets
do
not
include
the
net
assets
of:
Nuveen
fund-of-funds,
Nuveen
money
market
funds,
Nuveen
index
funds,
Nuveen
Large
Cap
Responsible
Equity
Fund
or
Nuveen
Life
Large
Cap
Responsible
Equity
Fund.
In
addition,
eligible
assets
include
a
fixed
percentage
of
the
aggregate
net
assets
of
the
active
equity
and
fixed
income
Nuveen
Mutual
Funds
advised
by
the
Adviser’s
affiliate,
Teachers
Advisors,
LLC
(except
those
identified
above).
The
fixed
percentage
will
increase
annually
until
May
1,
2033,
at
which
time
eligible
assets
will
include
all
of
the
aggregate
net
assets
of
the
active
equity
and
fixed
income
Nuveen
Mutual
Funds
advised
by
Teachers
Advisors,
LLC
(except
those
identified
above).
Eligible
assets
include
closed-end
fund
assets
managed
by
the
Adviser
that
are
attributable
to
financial
leverage.
For
these
purposes,
financial
leverage
includes
the
closed-end
funds’
use
of
preferred
stock
and
borrowings
and
certain
investments
in
the
residual
interest
certificates
(also
called
inverse
floating
rate
securities)
in
tender
option
bond
(TOB)
trusts,
including
the
portion
of
assets
held
by
a
TOB
trust
that
has
been
effectively
financed
by
the
trust’s
issuance
of
floating
rate
securities,
subject
to
an
agreement
by
the
Adviser
as
to
certain
funds
to
limit
the
amount
of
such
assets
for
determining
eligible
assets
in
certain
circumstances.
As
of
December
31,
2024,
the
complex-level
fee
for
each
Fund
was
as
follows:
The
Adviser
has
agreed
to
waive
fees
and/or
reimburse
expenses
(“Expense
Cap”)
of
the
Funds
so
that
the
total
annual
Fund
operating
expenses
(excluding
12b-1
distribution
and/or
service
fees,
interest
expenses,
taxes,
acquired
fund
fees
and
expenses,
fees
incurred
in
acquiring
and
disposing
of
portfolio
securities
and
extraordinary
expenses)
do
not
exceed
the
average
daily
net
assets
of
any
class
of
Fund
shares
in
the
amounts
and
for
the
time
periods
stated
in
the
following
table.
However,
because
Class
R6
Shares
are
not
subject
to
sub-transfer
agent
and
similar
fees,
the
total
annual
fund
operating
expense
for
the
Class
R6
Shares
will
be
less
than
the
expense
limitation.
The
temporary
expense
limitations
may
be
terminated
or
modified
prior
to
expiration
date
only
with
the
approval
of
the
Board.
The
expense
limitations
in
effect
thereafter
may
be
terminated
or
modified
only
with
the
approval
of
shareholders
of
each
Fund.
Average
Daily
Net
Assets
Global
Equity
Income
International
Value
Large
Cap
Value
Opportunities
Multi
Cap
Value
Small
Cap
Value
Opportunities
Small/Mid
Cap
Value
For
the
first
$125
million
0.5500
%
0.5500
%
0.5000
%
0.5500
%
0.6500
%
0.6000
%
For
the
next
$125
million
0.5375
0.5375
0.4875
0.5375
0.6375
0.5875
For
the
next
$250
million
0.5250
0.5250
0.4750
0.5250
0.6250
0.5750
For
the
next
$500
million
0.5125
0.5125
0.4625
0.5125
0.6125
0.5625
For
the
next
$1
billion
0.5000
0.5000
0.4500
0.5000
0.6000
0.5500
For
the
next
$3
billion
0.4750
0.4750
0.4250
0.4750
0.5750
0.5250
For
the
next
$2.5
billion
0.4500
0.4500
0.4000
0.4500
0.5500
0.5000
For
the
next
$2.5
billion
0.4375
0.4375
0.3875
0.4375
0.5375
0.4875
For
net
assets
over
$10
billion
0.4250
0.4250
0.3750
0.4250
0.5250
0.4750
Complex-Level
Asset
Breakpoint
Level*
Complex-Level
Fee
For
the
first
$124.3
billion
0.1600
%
For
the
next
$75.7
billion
0.1350
For
the
next
$200
billion
0.1325
For
eligible
assets
over
$400
billion
0.1300
Fund
Complex-Level
Fee
Global
Equity
Income
0.1575%
International
Value
0.1575%
Large
Cap
Value
Opportunities
0.1575%
Multi
Cap
Value
0.1575%
Small
Cap
Value
Opportunities
0.1575%
Small/Mid
Cap
Value
0.1575%
Distribution
and
Service
Fees:
Each
Fund
has
adopted
a
distribution
and
service
plan
under
rule
12b-1
under
the
1940
Act.
Class
A
Shares
incur
a
0.25%
annual
12b-1
service
fee.
Class
C
Shares
incur
a
0.75%
annual
12b-1
distribution
fee
and
a
0.25%
annual
12b-1
service
fee.
Class
R6
Shares
and
Class
I
Shares
are
not
subject
to
12b-1
distribution
or
service
fees.
The
fees
under
this
plan
compensate
Nuveen
Securities,
LLC,
(the
“Distributor”),
a
wholly-owned
subsidiary
of
Nuveen,
for
services
provided
and
expenses
incurred
in
distributing
shares
of
the
Funds
and
establishing
and
maintaining
shareholder
accounts.
Other
Transactions
with
Affiliates:
The
Funds
receive
voluntary
compensation
from
the
Adviser
in
amounts
that
approximate
the
cost
of
research
services
obtained
from
broker-dealers
and
research
providers
if
the
Adviser
had
purchased
the
research
services
directly.
This
income
received
by
the
Funds
is
recognized
in
"Affiliated
income"
on
the
Statement
of
Operations
and
any
amounts
due
to
the Funds
at
the
end
of
the
reporting
period
is
recognized
in
"Reimbursement
from
Adviser"
on
the
Statement
of
Assets
and Liabilities. During
the
current
fiscal
period,
the
values
of
voluntary
compensation
were
as
follows:
Each
Fund
is
permitted
to
purchase
or
sell
securities
from
or
to
certain
other
funds
or
accounts
managed
by
the
Sub-Adviser
or
by
an
affiliate
of
the
Adviser
(each
an
“Affiliated
Entity”)
under
specified
conditions
outlined
in
procedures
adopted
by
the
Board
("cross-trade").
These
procedures
have
been
designed
to
ensure
that
any
cross-trade
of
securities
by
the
Fund
from
or
to
an
Affiliated
Entity
by
virtue
of
having
a
common
investment
adviser
(or
affiliated
investment
adviser),
common
officer
and/or
common
trustee
complies
with
Rule
17a-7
under
the
1940
Act.
These
transactions
are
effected
at
the
current
market
price
(as
provided
by
an
independent
pricing
service)
without
incurring
broker
commissions.
During
the
current
fiscal
period,
the
Funds
did
not engage
in
cross-trades
pursuant
to
these
procedures.
During
the
current
fiscal
period,
the
Distributor,
collected
sales
charges
on
purchases
of
Class
A
Shares,
the
majority
of
which
were
paid
out
as
concessions
to
financial
intermediaries
as
follows:
The
Distributor
also
received
12b-1
service
fees
on
Class
A
Shares,
substantially
all
of
which
were
paid
to
compensate
financial
intermediaries
for
providing
services
to
shareholders
relating
to
their
investments.
During
the
current
fiscal
period,
the
Distributor
compensated
financial
intermediaries
directly
with
commission
advances
at
the
time
of
purchase
as
follows:
Fund
Temporary
Expense
Cap
Temporary
Expense
Cap
Expiration
Date
Permanent
Expense
Cap
Global
Equity
Income
0.90%
July
31,
2026
N/A
International
Value
0.94
July
31,
2026
N/A
Large
Cap
Value
Opportunities
0.79
July
31,
2026
1.35%
Multi
Cap
Value
0.94
July
31,
2026
N/A
Small
Cap
Value
Opportunities
0.99
July
31,
2026
1.50%
Small/Mid
Cap
Value
1.10
July
31,
2026
1.45%
N/A
-
Not
Applicable.
Fund
Amount
Global
Equity
Income
$
36,357
International
Value
13,455
Large
Cap
Value
Opportunities
4,839
Multi
Cap
Value
180,769
Small
Cap
Value
Opportunities
382,727
Small/Mid
Cap
Value
56,447
Fund
Sales
Charges
Collected
Paid
to
Financial
Intermediaries
Global
Equity
Income
$
2,878
$
2,518
International
Value
8,645
7,695
Large
Cap
Value
Opportunities
1,794
1,581
Multi
Cap
Value
14,465
12,654
Small
Cap
Value
Opportunities
7,171
6,300
Small/Mid
Cap
Value
19,314
16,981
Notes
to
Financial
Statements
(continued)
To
compensate
for
commissions
advanced
to
financial
intermediaries,
all
12b-1
service
and
distribution
fees
collected
on
Class
C
Shares
during
the
first
year
following
a
purchase
are
retained
by
the
Distributor.
During
the
current
fiscal
period,
the
Distributor
retained
such
12b-1
fees
as
follows:
The
remaining
12b-1
fees
charged
to
each
Fund
were
paid
to
compensate
financial
intermediaries
for
providing
services
to
shareholders
relating
to
their
investments.
The
Distributor
also
collected
and
retained
CDSC
on
share
redemptions
during
the
current
fiscal
period,
as
follows:
As
of
the
end
of
the
reporting
period,
the
percentage
of
Fund
shares
owned
by
affiliates
was
as
follows:
9.
Borrowing
Arrangements
Committed
Line
of
Credit:
The
Funds,
along
with
certain
funds
managed
by
the
Adviser
and
by
an
affiliate
of
the
Adviser
(“Participating
Funds”),
have
established
a
364-day,
$2.700
billion
standby
credit
facility
with
a
group
of
lenders,
under
which
the
Participating
Funds
may
borrow
for
temporary
purposes
(other
than
on-going
leveraging
for
investment
purposes).
Each
Participating
Fund
is
allocated
a
designated
proportion
of
the
facility’s
capacity
(and
its
associated
costs,
as
described
below)
based
upon
a
multi-factor
assessment
of
the
likelihood
and
frequency
of
its
need
to
draw
on
the
facility,
the
size
of
the
Fund
and
its
anticipated
draws,
and
the
potential
importance
of
such
draws
to
the
operations
and
well-being
of
the
Fund,
relative
to
those
of
the
other
Funds.
A
Fund
may
effect
draws
on
the
facility
in
excess
of
its
designated
capacity
if
and
to
the
extent
that
other
Participating
Funds
have
undrawn
capacity.
The
credit
facility
expires
in
June
2025
unless
extended
or
renewed.
The
credit
facility
has
the
following
terms:
0.15%
per
annum
on
unused
commitment
amounts
and
a
drawn
interest
rate
equal
to
the
higher
of
(a)
OBFR
(Overnight
Bank
Funding
Rate)
plus
1.20%
per
annum
or
(b)
the
Fed
Funds
Effective
Rate
plus
1.20%
per
annum
on
amounts
borrowed.
Interest
expense
incurred
by
the
Participating
Funds,
when
applicable,
is
recognized
as
a
component
of
“Interest
expense”
on
the
Statement
of
Operations.
Participating
Funds
paid
administration,
legal
and
arrangement
fees,
which
are
recognized
as
a
component
of
“Interest
expense”
on
the
Statement
of
Operations,
and
along
with
commitment
fees,
have
been
allocated
among
such
Participating
Funds
based
upon
the
relative
proportions
of
the
facility’s
aggregate
capacity
reserved
for
them
and
other
factors
deemed
relevant
by
the
Adviser
and
the
Board
of
each
Participating
Fund.
Fund
Commission
Advances
Global
Equity
Income
$
124
International
Value
1,013
Large
Cap
Value
Opportunities
188
Multi
Cap
Value
6,073
Small
Cap
Value
Opportunities
1,683
Small/Mid
Cap
Value
2,036
Fund
12b-1
Fees
Retained
Global
Equity
Income
$
85
International
Value
126
Large
Cap
Value
Opportunities
8
Multi
Cap
Value
6,906
Small
Cap
Value
Opportunities
545
Small/Mid
Cap
Value
275
Fund
CDSC
Retained
Global
Equity
Income
$
—
International
Value
—
Large
Cap
Value
Opportunities
—
Multi
Cap
Value
1,377
Small
Cap
Value
Opportunities
40
Small/Mid
Cap
Value
886
Fund
Nuveen
Owned
Shares
Small
Cap
Value
Opportunities
-%*
Small/Mid
Cap
Value
-%*
*Rounds
to
less
than
1%.
During
the
current
fiscal
period,
the
Funds
did
not
utilize
this
facility.
| Item 8. | Changes in and Disagreements with Accountants for Open-End Management Investment Companies. |
Not applicable.
| Item 9. | Proxy Disclosures for Open-End Management Investment Companies. |
Not applicable.
| Item 10. | Remuneration Paid to Directors, Officers, and Others of Open-End Management Investment Companies. |
The aggregate remuneration paid to the trustees (all of whom are independent) by each Fund is reported as “Trustees fees” on the Statement of Operations under Item 7 of this Form N-CSR.
The Funds do not pay any remuneration to their officers. The aggregate remuneration paid to Nuveen Fund Advisors, LLC, the Funds’ investment adviser and an affiliate of the Funds’ officers, is reported as “Management fees” on the Statement of Operations under Item 7 of this Form N-CSR.
| Item 11. | Statement Regarding Basis for Approval of Investment Advisory Contract. |
Not applicable to this filing.
| Item 12. | Disclosure of Proxy Voting Policies and Procedures for Closed-End Management Investment Companies. |
Not applicable to open-end investment companies.
| Item 13. | Portfolio Managers of Closed-End Management Investment Companies. |
Not applicable to open-end investment companies.
| Item 14. | Purchases of Equity Securities by Closed-End Management Investment Company and Affiliated Purchasers. |
Not applicable to open-end investment companies.
| Item 15. | Submission of Matters to a Vote of Security Holders. |
There have been no material changes to the procedures by which shareholders may recommend nominees to the registrant’s Board implemented after the registrant last provided disclosure in response to this Item.
| Item 16. | Controls and Procedures. |
| (a) | The registrant’s principal executive and principal financial officers, or persons performing similar functions, have concluded that the registrant’s disclosure controls and procedures (as defined in Rule 30a-3(c) under the Investment Company Act of 1940, as amended (the “1940 Act”) (17 CFR 270.30a-3(c))) are effective, as of a date within 90 days of the filing date of this report that includes the disclosure required by this paragraph, based on their evaluation of the controls and procedures required by Rule 30a-3(b) under the 1940 Act (17 CFR 270.30a-3(b)) and Rules 13a-15(b) or 15d-15(b) under the Securities Exchange Act of 1934, as amended (the “Exchange Act”) (17 CFR 240.13a-15(b) or 240.15d-15(b)). |
| (b) | There were no changes in the registrant’s internal control over financial reporting (as defined in Rule 30a-3(d) under the 1940 Act (17 CFR 270.30a-3(d)) that occurred during the period covered by this report that has materially affected, or is reasonably likely to materially affect, the registrant’s internal control over financial reporting. |
| Item 17. | Disclosure of Securities Lending Activities for Closed-End Management Investment Companies. |
| (a) | Not applicable to open-end investment companies. |
| (b) | Not applicable to open-end investment companies. |
| Item 18. | Recovery of Erroneously Awarded Compensation. |
| (a)(1) | Not applicable to this filing. |
| (a)(2) | Not applicable to this filing. |
SIGNATURES
Pursuant to the requirements of the Securities Exchange Act of 1934 and the Investment Company Act of 1940, the registrant has duly caused this report to be signed on its behalf by the undersigned, thereunto duly authorized.
Nuveen Investment Trust
| | | | | | |
| Date: March 7, 2025 | | | | By: | | /s/ Jordan M. Farris |
| | | | | | Jordan M. Farris Chief Administrative Officer |
Pursuant to the requirements of the Securities Exchange Act of 1934 and the Investment Company Act of 1940, this report has been signed below by the following persons on behalf of the registrant and in the capacities and on the dates indicated.
| | | | | | |
| Date: March 7, 2025 | | | | By: | | /s/ Jordan M. Farris |
| | | | | | Jordan M. Farris |
| | | | | | Chief Administrative Officer (principal executive officer) |
| | | |
| Date: March 7, 2025 | | | | By: | | /s/ Marc Cardella |
| | | | | | Marc Cardella |
| | | | | | Vice President and Controller (principal financial officer) |