Exhibit 99.1
| STRAYER EDUCATION, INC. Repayment Rate Analysis August 16, 2010 |

| Safe Harbor This presentation contains statements that are - harbor#148; provisions of the Private Securities statements are based on the Company’s current uncertainties and risks. In connection with the safe harbor provisions of the Reform Act, the Company has identified important factors that could uncertainties and risks include the pace of growth of student enrollment, our continued compliance with Title IV of the Higher Education Act, and the regulations thereunder, as well as regional accreditation standards and state regulatory requirements, competitive factors, risks associated with the opening of new campuses, risks associated with the offering of new educational programs and adapting to other changes, risks associated with the acquisition of existing educational institutions, risks relating to the timing of regulatory approvals, our ability to implement our growth strategy, risks associated with the ability of our students to finance their education in a timely manner, and general economic and market conditions. Further information about these and other relevant risks and uncertainties may be found in the -K and Company’s its other filings with the Securities and Exchange Commission, all of which are incorporated herein by reference and which are available from the Commission. We undertake no obligation to update or revise forward looking statements. |
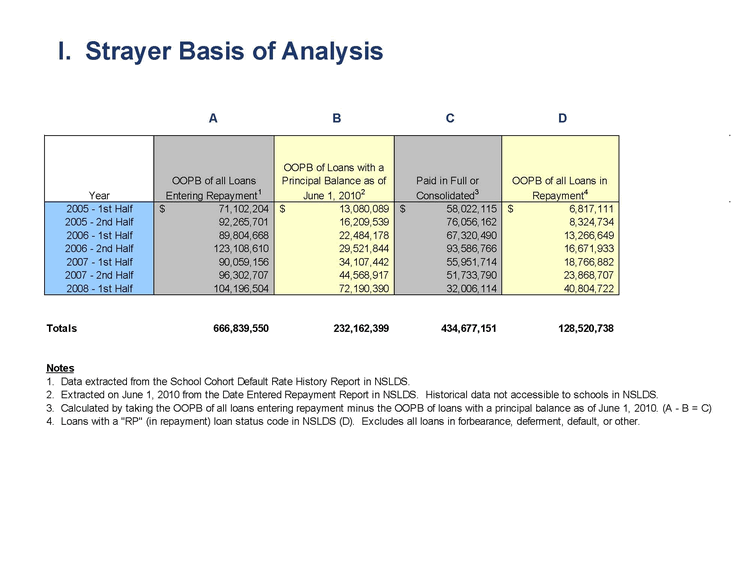
| I. Strayer Basis of Analysis A B C D OOPB of Loans with a OOPB of all Loans Principal Balance as of Paid in Full or OOPB of all Loans in Year Entering Repayment1 June 1, 20102 Consolidated3 Repayment4 2005 - 1st Half $ 71,102,204 $ 13,080,089 $ 58,022,115 $ 6,817,111 2005 - 2nd Half 92,265,701 16,209,539 76,056,162 8,324,734 2006 - 1st Half 89,804,668 22,484,178 67,320,490 13,266,649 2006 - 2nd Half 123,108,610 29,521,844 93,586,766 16,671,933 2007 - 1st Half 90,059,156 34,107,442 55,951,714 18,766,882 2007 - 2nd Half 96,302,707 44,568,917 51,733,790 23,868,707 2008 - 1st Half 104,196,504 72,190,390 32,006,114 40,804,722 Totals 666,839,550 232,162,399 434,677,151 128,520,738 Notes 1. Data extracted from the School Cohort Default Rate History Report in NSLDS. 2. Extracted on June 1, 2010 from the Date Entered Repayment Report in NSLDS. Historical data not accessible to schools in NSLDS. 3. Calculated by taking the OOPB of all loans entering repayment minus the OOPB of loans with a principal balance as of June 1, 2010. (A - B = C) 4. Loans with a "RP" (in repayment) loan status code in NSLDS (D). Excludes all loans in forbearance, deferment, default, or other. |
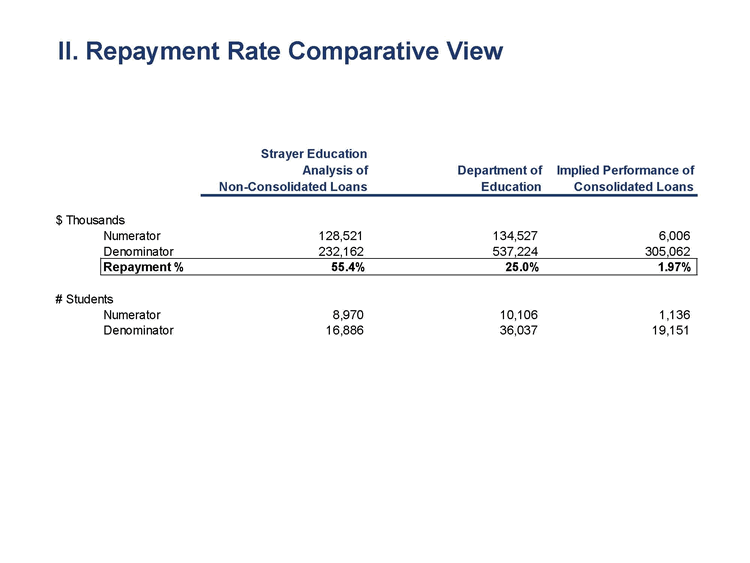
| II. Repayment Rate Comparative View Strayer Education Analysis of Department of Implied Performance of Non-Consolidated Loans Education Consolidated Loans $ Thousands Numerator 128,521 134,527 6,006 Denominator 232,162 537,224 305,062 Repayment % 55.4% 25.0% 1.97% # Students Numerator 8,970 10,106 1,136 Denominator 16,886 36,037 19,151 |