with the Immigration and Naturalization Service of the U.S. Department of Justice (the Department of Homeland Security’s predecessor agency with respect to, among other matters, foreign students and exchange visitors) and state approving agencies for veterans benefits in Washington, D.C., Maryland and Virginia. All of the applicable agencies approved the transaction, which closed in May 2001.
In February 2004, New Mountain transferred 350,000 of its shares of the Company’s Series A Convertible Redeemable Preferred Stock (together with all associated accrued cash and stock dividends), representing approximately 2.6% of the outstanding common stock equivalents of Strayer, (the ‘‘Trust Shares’’) to the New Mountain Strayer Trust, an irrevocable trust. The beneficiaries of the trust are all of New Mountain’s partners, at the time of a distribution from the trust, who are U.S. citizens or residents for tax purposes. Before transferring the Trust Shares to the trust, New Mountain irrevocably deposited into escrow the Trust Shares and gave to the trustee an irrevocable proxy to vote the Trust Shares during the escrow period. In connection with the transfer to escrow and the associated reduction in New Mountain’s ownership and control below the Department of Education’s 25% regulatory threshold, Strayer University was required to make a number of submissions to educational regulatory bodies, including, among others, filing an application for approval to continue to participate in federal student financial aid programs with the Department of Education. All of the applicable regulatory agencies approved the transaction. As is customary for institutions undergoing a change of ownership resulting in a change of control, the Department of Education recertified the University on a provisional basis through December 2006. After the Department of Education and other relevant regulatory agencies approved the change in ownership and control resulting from the transfer of the Trust Shares into escrow, the escrow agent transferred the Trust Shares to the New Mountain Strayer Trust. The University’s education regulators, including the Department of Education, Middle States and relevant state education agencies, either did not require or provided approval in connection with the subsequent public offering in February 2004.
If Strayer University underwent a change of control that required approval by any state authority, Middle States or any federal agency, and any required regulatory approval were significantly delayed, limited or denied, there could be a material adverse effect on Strayer University’s ability to offer certain educational programs, award certain degrees, diplomas or certificates, operate one or more of its locations, admit certain students or participate in Title IV programs, which in turn would materially and adversely affect Strayer University’s operations. A change that required approval by a state regulatory authority, Middle States or a federal agency could also delay Strayer University’s ability to establish new campuses or educational programs and may have other adverse regulatory effects. Furthermore, the suspension from Title IV programs and the necessity of obtaining regulatory approvals in connection with a change of control may materially limit Strayer University’s flexibility in future financing or acquisition transactions.
We maintain a website at http://www.strayereducation.com. The information on our website is not incorporated by reference in this Annual Report on Form 10-K and our web address is included as an inactive textual reference only. We make available on our website our Annual Report on Form 10-K, Quarterly Reports on Form 10-Q, Current Reports on Form 8-K and amendments to those reports filed or furnished pursuant to Section 13(a) or 15(d) of the Exchange Act as soon as reasonably practicable after we electronically file such material with, or furnish it to, the SEC.
The Form 10-K and other reports filed with the SEC can be read or copied at the SEC’s Public Reference Room at 100 F Street, NE, Washington, D.C. 20549. Information on the operation of the Public Reference Room can be obtained by calling the SEC at 1-800-SEC-0330. The SEC maintains a website that contains reports, proxy and information statements, and other information regarding issuers that file electronically with the SEC; the website address is http://www.sec.gov.
Investing in our common stock involves a high degree of risk. You should carefully consider the following risk factors and all other information contained in this Annual Report on Form 10-K or in the
Table of Contentsdocuments incorporated by reference herein before deciding to purchase our common stock. The occurrence of any of the following risks could materially harm our business, and you could suffer a complete loss of your investment. See ‘‘Cautionary Notice Regarding Forward-Looking Statements.’’
Risks Related to Extensive Regulation of Our Business
If we fail to comply with the extensive regulatory requirements for our business, we could face significant monetary liabilities, fines and penalties, including loss of access to federal student loans and grants for our students.
As a provider of higher education, we are subject to extensive regulation on both the federal and state levels. In particular, the Higher Education Act of 1965, as amended (the ‘‘Higher Education Act’’), and related regulations subject Strayer University and all other higher education institutions that participate in the various federal student financial aid programs under Title IV of the Higher Education Act (‘‘Title IV programs’’) to significant regulatory scrutiny.
The Higher Education Act mandates specific regulatory responsibilities for each of the following components of the higher education regulatory triad: (1) the federal government through the U.S. Department of Education (the ‘‘Department of Education’’); (2) the accrediting agencies recognized by the U.S. Secretary of Education and (3) state education regulatory bodies.
The regulations, standards and policies of these regulatory agencies frequently change, and changes in, or new interpretations of, applicable laws, regulations or standards could have a material adverse effect on our accreditation, authorization to operate in various states, permissible activities, receipt of funds under Title IV programs or costs of doing business.
If we are found to be in noncompliance with any of these regulations, standards or policies, we could lose our access to Title IV program funds, which would have a material adverse effect on our business. In the 2006 fall term, approximately 57% of our students participated in one or more Title IV programs. Findings of noncompliance also could result in our being required to pay monetary damages, or being subjected to fines, penalties, injunctions, restrictions on our access to Title IV program funds or other censure that could have a material adverse effect on our business.
If we fail to maintain our institutional accreditation, we would lose our ability to participate in Title IV programs.
Strayer University is institutionally accredited by the Middle States Commission on Higher Education (‘‘Middle States’’), one of the six regional accrediting agencies recognized by the U.S. Secretary of Education as a reliable authority as to educational quality. Accreditation by an accrediting agency recognized by the Secretary of Education is required in order for an institution to become and remain eligible to participate in Title IV programs. The loss of accreditation would, among other things, render Strayer University ineligible to participate in Title IV programs and would have a material adverse effect on our business. In addition, an adverse action by Middle States other than loss of accreditation, such as issuance of a warning, could have a material adverse effect on our business or have an adverse effect on the market price of our common stock.
If we fail to maintain any of our state authorizations, we would lose our ability to operate in that state and to participate in Title IV programs there.
With respect to each campus, Strayer University is authorized to operate and to grant degrees, diplomas or certificates by the applicable education agency of the state where the campus is located. Such state authorization is required in order for students at the campus to be eligible to participate in Title IV programs. The loss of authorization in a state would, among other things, render Strayer University ineligible to participate in Title IV programs at least at those state campus locations and could have a material adverse effect on our business.
Student loan defaults could result in the loss of eligibility to participate in Title IV programs.
In general, under the Higher Education Act, an educational institution may lose its eligibility to participate in some or all Title IV programs if, for three consecutive federal fiscal years, 25% or more
25
Table of Contentsof its students who were required to begin repaying their student loans in the relevant federal fiscal year default on their payment by the end of the next federal fiscal year. In addition, an institution may lose its eligibility to participate in some or all Title IV programs if its default rate for a federal fiscal year was greater than 40%. If we lose eligibility to participate in Title IV programs because of high student loan default rates, it would have a material adverse effect on our business. Strayer University’s default rates calculated by the Department of Education on Federal Family Education Loan Program loans for the 2002, 2003 and 2004 federal fiscal years, the three most recent years for which this information is available, were 3.7%, 2.7% and 4.5%, respectively. The average cohort default rates for proprietary institutions nationally, as calculated by the Department of Education, were 8.7%, 7.3% and 8.6% in federal fiscal years 2002, 2003 and 2004, respectively.
A failure to demonstrate ‘‘administrative capability’’ or ‘‘financial responsibility’’ may result in the loss of eligibility to participate in Title IV programs.
If we fail to maintain ‘‘administrative capability’’ as defined by the Department of Education, we could lose our eligibility to participate in Title IV programs or have that eligibility adversely conditioned, which would have a material adverse effect on our business. Furthermore, if we fail to demonstrate ‘‘financial responsibility’’ under the Department of Education’s regulations, we could lose our eligibility to participate in Title IV programs or have that eligibility adversely conditioned, which would have a material adverse effect on our business.
We are subject to sanctions if we fail to calculate and make timely payment of refunds of Title IV program funds for students who withdraw before completing their educational program.
The Higher Education Act and Department of Education regulations require us to calculate refunds of unearned Title IV program funds disbursed to students who withdraw from their educational program before completing it. If refunds are not properly calculated or timely paid, we may be sanctioned or subject to other adverse actions by the Department of Education, which could have a material adverse effect on our business.
We are dependent on the renewal and maintenance of Title IV programs.
Congress reauthorizes the Higher Education Act, which is the law governing Title IV programs, approximately every five to six years. Congress is currently considering reauthorization of the Higher Education Act. Additionally, Congress determines the funding level for each Title IV program on an annual basis. Any action by Congress that significantly reduces funding for Title IV programs or the ability of our school or students to participate in these programs could materially harm our business. A reduction in government funding levels could lead to lower enrollments at our school and require us to arrange for alternative sources of financial aid for our students. Lower student enrollments or our inability to arrange such alternative sources of funding could adversely affect our business.
Our school would lose its eligibility to participate in federal student financial aid programs if the percentage of our revenues derived from those programs were too high.
A proprietary institution loses its eligibility to participate in the federal student financial aid programs if it derives more than 90% of its revenues, on a cash basis, from these programs in any fiscal year. Using the Department of Education’s formula, we derived approximately 71% of our cash-basis revenues from these programs in 2005.
Our failure to comply with the Department of Education’s incentive compensation rules could result in sanctions.
If we pay a bonus, commission or other incentive payment in violation of applicable requirements, we could be subject to sanctions, which could have a material adverse effect on our business.
Risks Related to Our Business
We may not be able to sustain our recent growth rate, and we may not be able to manage future growth effectively.
We have experienced a period of significant growth since the beginning of 2001. Over this period, we opened 33 new campuses and our revenue increased 22% between 2000 and 2006 on a compound
26
Table of Contentsannual basis. Our ability to sustain our current rate of growth depends on a number of factors, including our ability to obtain regulatory approvals, our ability to recruit and retain high quality academic and administrative personnel at new campuses and competitive factors. In addition, growth and expansion of our operations may place a significant strain on our resources and increased demands on our management information and reporting systems, financial management controls and personnel. Although we have made a substantial investment in augmenting our financial and management information systems and other resources to support future growth, we cannot assure you that we will be able to manage further expansion effectively. Failure to do so could adversely affect our business.
Our success depends in part on our ability to update and expand the content of existing programs and develop new programs in a cost-effective manner and on a timely basis.
Our success depends in part on our ability to update and expand the content of our programs, develop new programs in a cost-effective manner and meet students’ needs in a timely manner. Prospective employers of our graduates increasingly demand that their entry-level employees possess appropriate technological and other skills. The update and expansion of our existing programs and the development of new programs may not be accepted by students, prospective employers or the online education market. If we cannot respond to changes in industry requirements, our business may be adversely affected. Even if we are able to develop acceptable new programs, we may not be able to introduce these new programs as quickly as students require due to regulatory constraints or as quickly as our competitors introduce competing new programs.
Our strategy of opening new schools and adding new services is dependent on regulatory approvals and requires significant resources.
Establishing new schools and locations and adding new services require us to make investments in management and capital expenditures, incur marketing expenses and reallocate other resources. To open a new school or location, we are required to obtain appropriate federal, state, and accrediting agency approvals, which may be conditioned or delayed in a manner which could significantly affect our growth plans. In addition, to be eligible for federal student financial aid programs, the new school or location would have to be approved by the Department of Education. We cannot assure you that we will be able to open successfully new campus locations or add new services in the future. Our failure to manage effectively the operations of newly established schools and locations could adversely affect our business.
Our financial performance depends in part on our ability to continue to develop awareness of the programs we offer among working adult students.
The continued development of awareness of the programs we offer among working adult students is critical to the continued acceptance and growth of our programs. If we are unable to continue to develop awareness of the programs we offer, this could limit our enrollments and negatively impact our business. The following are some of the factors that could prevent us from successfully marketing our programs:
 | | |
| • | the emergence of more successful competitors; |
| | |
| • | customer dissatisfaction with our services and programs; |
| | |
| • | performance problems with our online systems; and |
| | |
| • | our failure to maintain or expand our brand or other factors related to our marketing. |
We face strong competition in the post-secondary education market.
Post-secondary education in our market area is highly competitive. We compete with traditional public and private two-year and four-year colleges, other for-profit schools and alternatives to higher education, such as employment and military service. Public colleges may offer programs similar to those of Strayer University at a lower tuition level as a result of government subsidies, government
27
Table of Contentsand foundation grants, tax-deductible contributions and other financial sources not available to proprietary institutions. Some of our competitors in both the public and private sectors have substantially greater financial and other resources than we do. This strong competition could adversely affect our business.
Strayer University Online and Strayer University do not rely on exclusive proprietary rights and intellectual property, and competitors may attempt to duplicate Strayer programs and methods.
Third parties may attempt to develop competing programs or duplicate or copy aspects of Strayer University’s curriculum, online library, quality management and other proprietary content. Any such attempt, if successful, could adversely affect our business. In the ordinary course of its business, Strayer develops intellectual property of many kinds that is or will be the subject of copyright, trademark, service mark, patent, trade secret or other protections. Such intellectual property includes but is not limited to Strayer’s courseware materials for classes taught via the Internet or via other distance learning means and business know-how and internal processes and procedures developed to respond to the requirements of its various education regulatory agencies.
Our future success depends in part upon our ability to recruit and retain key personnel.
In connection with our May 2001 recapitalization, we hired a new management team, including Robert S. Silberman, our Chairman and Chief Executive Officer, to implement our new growth strategy. Our success to date has been, and our continuing success will be, substantially dependent upon our ability to attract and retain highly qualified executive officers, faculty and administrators and other key personnel. If we cease to employ any of these integral personnel or fail to manage a smooth transition to new personnel, our business could suffer.
Seasonal and other fluctuations in our operating results could adversely affect the trading price of our common stock.
Our business is subject to seasonal fluctuations, which cause our operating results to fluctuate from quarter to quarter. This fluctuation may result in volatility or have an adverse effect on the market price of our common stock. We experience, and expect to continue to experience, seasonal fluctuations in our revenue. Historically, our quarterly revenues and income have been lowest in the third quarter (July through September) because fewer students are enrolled during the summer months. We also incur significant expenses in preparing for our peak enrollment in the fourth quarter (October through December), including investing in online infrastructure necessary to support increased usage. These investments result in fluctuations in our operating results which could result in volatility or have an adverse effect on the market price of our common stock. In addition, because of the recent increase in the use of personal computers and access to the Internet, the online education market is a rapidly evolving market, and we may not be able to accurately forecast future enrollment growth and revenues.
Regulatory requirements may make it more difficult to acquire us.
A change in ownership resulting in a change of control of Strayer would trigger a requirement for recertification of Strayer University by the Department of Education for purposes of participation in federal student financial aid programs, a review of Strayer University’s accreditation by Middle States and reauthorization of Strayer University by certain state licensing and other regulatory agencies. If we underwent a change of control that required approval by any state authority, Middle States or any federal agency, and any required regulatory approval were significantly delayed, limited or denied, there could be a material adverse effect on our ability to offer certain educational programs, award certain degrees, diplomas or certificates, operate one or more of our locations, admit certain students or participate in Title IV programs, which in turn could have a material adverse effect on our business. These factors may discourage takeover attempts.
Capacity constraints or system disruptions to Strayer University Online’s computer networks could damage the reputation of Strayer University and limit our ability to attract and retain students.
The performance and reliability of Strayer University Online’s program infrastructure is critical to our reputation and ability to attract and retain students. Any system error or failure, or a sudden and
28
Table of Contentssignificant increase in traffic, could result in the unavailability of Strayer University Online’s computer networks. We cannot assure you that Strayer University Online will be able to expand its program infrastructure on a timely basis sufficient to meet demand for its programs. Strayer University Online’s computer systems and operations could be vulnerable to interruption or malfunction due to events beyond its control, including natural disasters and telecommunications failures. Any interruption to Strayer University Online’s computer systems or operations could have a material adverse effect on our ability to attract and retain students.
Strayer University Online’s computer networks may be vulnerable to security risks that could disrupt operations and require it to expend significant resources.
Strayer University Online’s computer networks may be vulnerable to unauthorized access, computer hackers, computer viruses and other security problems. A user who circumvents security measures could misappropriate proprietary information or cause interruptions or malfunctions in operations. As a result, Strayer University Online may be required to expend significant resources to protect against the threat of these security breaches or to alleviate problems caused by these breaches.
Strayer University Online operates in a highly competitive market with rapid technological changes and it may not compete successfully.
Online education is a highly fragmented and competitive market that is subject to rapid technological change. Competitors vary in size and organization from traditional colleges and universities, many of which have some form of online education programs, to for-profit schools, corporate universities and software companies providing online education and training software. We expect the online education and training market to be subject to rapid changes in technologies. Strayer University Online’s success will depend on its ability to adapt to these changing technologies.
Government regulations relating to the Internet could increase Strayer University Online’s cost of doing business, affect its ability to grow or otherwise have a material adverse effect on our business.
The increasing popularity and use of the Internet and other online services for the delivery of education has led and may lead to the adoption of new laws and regulatory practices in the United States or foreign countries or to the interpretation of the application of existing laws and regulations to such services. These new laws and interpretations may relate to issues such as online privacy, copyright, trademark and service mark, sales taxes, fair business practices and the requirement that online education institutions qualify to do business as a foreign corporation or be licensed as a school in one or more jurisdictions where they have no physical location. New laws, regulations or interpretations related to doing business over the Internet could increase Strayer University Online’s cost of doing business, affect its ability to increase enrollments and revenues or otherwise have a material adverse effect on our business.
In addition, as of July 1, 2006, if Strayer University fails to meet Middle States’ standards with respect to distance education, its otherwise eligible distance education programs could lose eligibility for federal student financial aid programs. Such an occurrence would have a material adverse effect on our business.
We may not be able to successfully complete or integrate future acquisitions.
As part of our growth strategy, we expect to consider selective acquisitions. We cannot assure you that we will be able to complete successfully any acquisitions on favorable terms, or that if we do, we will be able to successfully integrate the personnel, operations and technologies of any such acquisitions. Our failure to successfully complete or integrate future acquisitions could disrupt our business and materially and adversely affect our profitability and liquidity by distracting our management and employees and increasing our expenses. In addition, because an acquisition is considered a change in ownership and control of the acquired institution under applicable regulatory standards, we must seek approval from the Department of Education and most applicable state agencies and accrediting agencies and possibly other regulatory bodies when we acquire an institution. If we were unable to obtain such approvals of an institution we acquired, depending on the size of that acquisition, that failure could have a material adverse effect on our business.
29
Table of ContentsItem 1B. Unresolved Staff Comments
There are no SEC staff comments on the Company’s periodic SEC reports which are unresolved.
Item 2. Properties
We lease all of our campus and administrative facilities except for six campus facilities which we own. Our campuses are located in Pennsylvania, Delaware, Maryland, Washington, D.C., Virginia, North Carolina, South Carolina, Georgia, Tennessee, Florida, Alabama and Kentucky, and our corporate headquarters is located in Virginia. Our leases generally range from five to ten years with one to two renewal options for extended terms. As of December 31, 2006, we leased 46 campus and administrative facilities consisting of approximately 640,000 square feet. The facilities that we own consist of approximately 140,000 square feet.
We evaluate current utilization of our facilities and projected enrollment growth to determine facility needs. We anticipate that approximately an additional 130,000 square feet will be leased in 2007.
Item 3. Legal Proceedings
From time to time, the Company is involved in litigation and other legal proceedings arising out of the ordinary course of its business. There are no pending material legal proceedings to which the Company is subject or to which the Company’s property is subject.
Item 4. Submission of Matters to a Vote of Security Holders
No matters were voted upon by stockholders during the fourth quarter of 2006.
30
Table of ContentsPART II
Item 5. Market for Registrant’s Common Equity, Related Stockholder Matters and Issuer Purchases of Equity Securities
Our common stock is traded on the Nasdaq National Market under the symbol ‘‘STRA.’’ The following table sets forth, for the periods indicated, the high, low, and closing sale prices of the Company’s common stock, as reported on the Nasdaq National Market.
| | | | | | | | | | | | | | | | | | |
| | | | High | | | Low | | | Close |
| 2006 | | | | | | | | | | | | | | | | | | |
| First Quarter | | | | $ | 104.49 | | | | | $ | 87.07 | | | | | $ | 102.26 | |
| Second Quarter | | | | $ | 112.00 | | | | | $ | 94.34 | | | | | $ | 97.12 | |
| Third Quarter | | | | $ | 111.49 | | | | | $ | 92.59 | | | | | $ | 108.21 | |
| Fourth Quarter | | | | $ | 118.88 | | | | | $ | 100.84 | | | | | $ | 106.05 | |
| 2005 | | | | | | | | | | | | | | | | | | |
| First Quarter | | | | $ | 115.96 | | | | | $ | 102.18 | | | | | $ | 113.32 | |
| Second Quarter | | | | $ | 115.21 | | | | | $ | 77.24 | | | | | $ | 86.26 | |
| Third Quarter | | | | $ | 103.27 | | | | | $ | 78.27 | | | | | $ | 94.52 | |
| Fourth Quarter | | | | $ | 102.70 | | | | | $ | 85.37 | | | | | $ | 93.70 | |
|
Peer Group Performance Graph
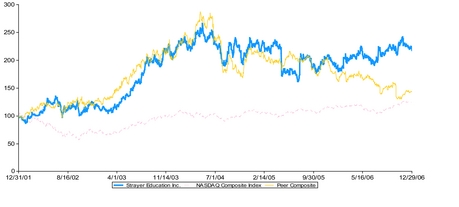
The following performance graph compares the Company’s cumulative stockholder return on its common stock since December 31, 2001 with The NASDAQ Stock Market (U.S.) Index and a self-determined peer group consisting of Apollo Group, Inc. (APOL), Career Education Corporation (CECO), Corinthian Colleges, Inc. (COCO), DeVry, Inc. (DV), and ITT Educational Services, Inc. (ESI). At present, there is no comparative index for the education industry. This graph is not deemed to be ‘‘soliciting material’’ or to be filed with the SEC or subject to the SEC’s proxy rules or to the liabilities of Section 18 of the Securities Exchange Act, and the graph shall not be deemed to be incorporated by reference into any prior or subsequent filing by the Company under the Securities Act or the Securities Exchange Act.
31
Table of ContentsComparison of 60 Month Cumulative Total Return*
Among Strayer Education, Inc.
The NASDAQ Stock Market (U.S.) Index and a Peer Group
| | | | | | | | | | | | | | | | | | | | | | | | | | | | | | | | | | | | |
| Name | | | 12/31/01 | | | 12/31/02 | | | 12/31/03 | | | 12/31/04 | | | 12/30/05 | | | 12/29/06 |
| Strayer Education, Inc. | | | | | 100 | | | | | | 118 | | | | | | 223 | | | | | | 225 | | | | | | 192 | | | | | | 218 | |
| NASDAQ Stock Market (U.S.) | | | | | 100 | | | | | | 68 | | | | | | 103 | | | | | | 112 | | | | | | 113 | | | | | | 124 | |
| Peer Group | | | | | 100 | | | | | | 127 | | | | | | 207 | | | | | | 215 | | | | | | 177 | | | | | | 143 | |
|
| |
| * | The comparison assumes $100 was invested on December 31, 2001 in the Company’s common stock, the NASDAQ Stock Market (U.S.) Index and the peer companies selected by the Company. |
NOTE: Peer group consists of Apollo Group, Inc., Career Education Corporation, Corinthian Colleges, Inc., DeVry, Inc. and ITT Educational Services, Inc.
As of January 31, 2007, there were 14,293,584 shares of common stock outstanding, and approximately 80 holders of record. In addition, there exist a number (approximately 17,000 as of December 2006) of institutional and other holders of common stock whose shares are held in nominee accounts by brokers.
As announced on November 3, 2003, the Company’s Board of Directors initially authorized the Company to repurchase up to an aggregate of $15 million in value of common stock through December 31, 2004 in open market purchases from time to time at the discretion of the Company’s management, depending on market conditions and other corporate considerations. The Company’s Board of Directors amended the program on various dates, increasing the repurchase amount authorized and extending the expiration date. Since inception, a total of $145 million has been authorized by the Company’s Board of Directors for share repurchases through December 31, 2007, of which $32 million was remaining at December 31, 2006. All of the Company’s share repurchases were effected in compliance with Rule 10b-18 under the Securities Exchange Act of 1934, as amended. This share repurchase plan may be modified, suspended or terminated at any time by the Company without notice.
32
Table of ContentsA summary of the Company’s share repurchases since the inception of the plan is as follows:
| | | | | | | | | | | | | | | | | | |
| | | | Shares
repurchased | | | Average price
paid per share | | | Cost of share
repurchases |
| | | | (#) | | | ($) | | | ($ mil.) |
| 2003 | | | | | 32,350 | | | | | | 99.57 | | | | | | 3.2 | |
| 2004 | | | | | 346,444 | | | | | | 106.13 | | | | | | 36.8 | |
| 2005 | | | | | 410,071 | | | | | | 92.59 | | | | | | 38.0 | |
| 2006 | | | | | 349,066 | | | | | | 100.39 | | | | | | 35.0 | |
| Total | | | | | 1,137,931 | | | | | | 99.30 | | | | | | 113.0 | |
|
A summary of the Company’s share repurchases during the three months ended December 31, 2006 is as follows:
| | | | | | | | | | | | | | | | | | |
| | | | Total number
of shares
repurchased1 | | | Average price
paid per share | | | Remaining
authorization
under the plan |
| | | | (#) | | | ($) | | | ($ mil.) |
| October | | | | | — | | | | | | — | | | | | | | |
| November | | | | | 12,800 | | | | | | 110.88 | | | | | | | |
| December | | | | | 59,500 | | | | | | 110.64 | | | | | | | |
| Total | | | | | 72,300 | | | | | | 110.69 | | | | | | 32.0 | |
|
| |
| 1. | All shares repurchased were part of a publicly announced plan. |
We have established a policy of declaring quarterly cash dividends on our common stock. Consistent with this policy, we have paid common stock dividends on a quarterly basis for more than the past six years. The Company announced in October 2006 that, commencing with its fourth quarter dividend to be paid on December 11, 2006, it was increasing its annual common stock dividend by 25% to $1.25 per share from $1.00 per share. This increase in annual dividend will result in a quarterly dividend payment of $0.3125 per share. Whether to declare dividends and the amount of dividends to be paid in the future will be reviewed periodically by our Board of Directors in light of the Company’s earnings, cash flow, financial condition, capital needs, investment opportunities and regulatory considerations. There is no requirement or assurance that common dividends will continue to be paid.
In 2001, we issued to New Mountain Partners, LP and MidOcean Capital Investors, LP (formerly DB Capital Partners, Inc) our Series A Convertible Redeemable Preferred Stock, the terms of which are described in detail in Note 7 to the Consolidated Financial Statements below. In March 2004, 3.1 million outstanding and accrued shares of the Series A Convertible Redeemable Preferred Stock were converted into shares of common stock on a one for one basis and sold in a secondary public offering. The Company received no proceeds from such offering other than $4.2 million associated with certain management option exercises in connection with the exercise by the underwriters of the ‘‘green shoe’’ with respect to the secondary offering. In June 2004, the remaining 875,120 outstanding and accrued shares of Series A Convertible Redeemable Preferred Stock were called for redemption by the Company and in lieu of being redeemed for cash, were converted by the holders into 875,120 common shares in accordance with the terms of the Series A shares. As a result, the Company has no more preferred shares outstanding.
33
Table of ContentsSet forth in the table below is information pertaining to securities authorized for issuance under our equity compensation plans. There are options but no warrants or other rights existing under these plans.
Equity Compensation Plan Information
as of December 31, 2006
| | | | | | | | | | | | | | | | | | | | | | | | |
| Plan Category | | | Number of securities to
be issued upon exercise
of outstanding options,
warrants and rights | | | Weighted average
exercise
price of outstanding
options, warrants
and rights | | | Number of
securities remaining
available for future
issuance under
equity compensation
plans (excluding
securities reflected
in column (a)) |
| | | | (a) | | | (b) | | | (c) |
| 1. | | | Equity compensation plans previously approved by security holders | | | | | | | | | | | | | | | | | | |
| | | | A. | | | 1996 Stock Option Plan as amended at the May 2001, the May 2005, and the May 2006 Annual Shareholders’ Meetings | | | | | 762,334 | | | | | $ | 56.42 | | | | | | 485,088 | |
| 2. | | | Equity compensation plans not previously approved by security holders | | | | | — | | | | | | — | | | | | | — | |
| | | | Total | | | | | 762,334 | | | | | $ | 56.42 | | | | | | 485,088 | |
|
Item 6. Selected Financial Data.
The following table sets forth, for the periods and at the dates indicated, selected consolidated financial and operating data. The financial information has been derived from our consolidated financial statements.
The information set forth below is qualified by reference to and should be read in conjunction with our consolidated financial statements and notes thereto and ‘‘Management’s Discussion and Analysis of Financial Condition and Results of Operations’’ and other information included elsewhere or incorporated by reference in this Annual Report on Form 10-K.
34
Table of Contents
| | | | | | | | | | | | | | | | | | | | | | | | | | | | | | |
| | | | Year Ended December 31, |
| | | | 2002 | | | 2003 | | | 2004 | | | 2005 | | | 2006 |
| | | | (in thousands, except per share, enrollment and campus data) |
| Income Statement Data: | | | | | | | | | | | | | | | | | | | | | | | | | | | | | | |
| Revenues | | | | $ | 116,710 | | | | | $ | 147,025 | | | | | $ | 183,194 | | | | | $ | 220,507 | | | | | $ | 263,648 | |
| Costs and expenses: | | | | | | | | | | | | | | | | | | | | | | | | | | | | | | |
| Instruction and educational support | | | | | 41,601 | | | | | | 53,116 | | | | | | 63,860 | | | | | | 76,977 | | | | | | 91,120 | |
| Selling and promotion | | | | | 16,773 | | | | | | 22,768 | | | | | | 29,435 | | | | | | 41,090 | | | | | | 52,269 | |
| General and administration | | | | | 17,107 | | | | | | 20,013 | | | | | | 24,416 | | | | | | 27,576 | | | | | | 40,723 | |
| Gain on sale of asset | | | | | — | | | | | | 1,772 | | | | | | — | | | | | | — | | | | | | — | |
| Income from operations | | | | | 41,229 | | | | | | 52,900 | | | | | | 65,483 | | | | | | 74,864 | | | | | | 79,536 | |
| Investment and other income | | | | | 1,775 | | | | | | 2,420 | | | | | | 1,595 | | | | | | 2,982 | | | | | | 4,542 | |
| Secondary offering expenses | | | | | 490 | | | | | | — | | | | | | — | | | | | | — | | | | | | — | |
| Income before income taxes | | | | | 42,514 | | | | | | 55,320 | | | | | | 67,078 | | | | | | 77,846 | | | | | | 84,078 | |
| Provision for income taxes | | | | | 16,730 | | | | | | 21,646 | | | | | | 25,838 | | | | | | 29,781 | | | | | | 31,771 | |
| Net income | | | | | 25,784 | | | | | | 33,674 | | | | | | 41,240 | | | | | | 48,065 | | | | | | 52,307 | |
| Preferred stock dividends and accretion | | | | | 7,344 | | | | | | 5,136 | | | | | | 1,389 | | | | | | — | | | | | | — | |
| Net income available to common stockholders | | | | $ | 18,440 | | | | | $ | 28,538 | | | | | $ | 39,851 | | | | | $ | 48,065 | | | | | $ | 52,307 | |
| Net income per share: | | | | | | | | | | | | | | | | | | | | | | | | | | | | | | |
| Basic | | | | $ | 2.14 | | | | | $ | 2.67 | | | | | $ | 2.91 | | | | | $ | 3.32 | | | | | $ | 3.69 | |
| Diluted | | | | $ | 1.78 | | | | | $ | 2.27 | | | | | $ | 2.74 | | | | | $ | 3.26 | | | | | $ | 3.61 | |
| Weighted average shares outstanding: | | | | | | | | | | | | | | | | | | | | | | | | | | | | | | |
| Basic | | | | | 8,617 | | | | | | 10,694 | | | | | | 13,674 | | | | | | 14,472 | | | | | | 14,187 | |
| Diluted(a) | | | | | 14,516 | | | | | | 14,857 | | | | | | 15,057 | | | | | | 14,741 | | | | | | 14,492 | |
| Other Data: | | | | | | | | | | | | | | | | | | | | | | | | | | | | | | |
| Depreciation and amortization | | | | $ | 3,642 | | | | | $ | 4,367 | | | | | $ | 5,375 | | | | | $ | 6,619 | | | | | $ | 7,059 | |
| Stock-based compensation expense(b) | | | | | — | | | | | | — | | | | | | — | | | | | $ | 48 | | | | | $ | 8,049 | |
| Capital expenditures | | | | $ | 17,113 | | | | | $ | 6,840 | | | | | $ | 11,063 | | | | | $ | 12,275 | | | | | $ | 13,183 | |
| Cash dividends per common share | | | | $ | 0.26 | | | | | $ | 0.26 | | | | | $ | 0.41 | | | | | $ | 0.63 | | | | | $ | 1.06 | |
| Enrollment(d) | | | | | 16,532 | | | | | | 20,138 | | | | | | 23,539 | | | | | | 27,305 | | | | | | 31,372 | |
| Campuses(e) | | | | | 20 | | | | | | 25 | | | | | | 30 | | | | | | 35 | | | | | | 43 | |
|
| | | | | | | | | | | | | | | | | | | | | | | | | | | | | | |
| | | | At December 31, |
| | | | 2002 | | | 2003 | | | 2004 | | | 2005 | | | 2006 |
| | | | (in thousands) |
| Balance Sheet Data: | | | | | | | | | | | | | | | | | | | | | | | | | | | | | | |
| Cash, cash equivalents and marketable securities | | | | $ | 67,256 | | | | | $ | 108,040 | | | | | $ | 122,757 | | | | | $ | 119,806 | | | | | $ | 128,426 | |
| Working capital(f) | | | | | 55,901 | | | | | | 94,760 | | | | | | 112,726 | | | | | | 110,886 | | | | | | 122,204 | |
| Total assets | | | | | 140,124 | | | | | | 182,556 | | | | | | 210,114 | | | | | | 225,845 | | | | | | 270,844 | |
| Long-term liabilities | | | | | 2,055 | | | | | | 2,894 | | | | | | 5,784 | | | | | | 6,569 | | | | | | 7,689 | |
| Total liabilities | | | | | 39,942 | | | | | | 53,892 | | | | | | 61,192 | | | | | | 74,005 | | | | | | 99,317 | |
Series A convertible redeemable
preferred stock | | | | | 93,807 | | | | | | 95,686 | | | | | | — | | | | | | — | | | | | | — | |
| Total stockholders’ equity | | | | | 6,375 | | | | | | 32,978 | | | | | | 148,922 | | | | | | 151,840 | | | | | | 171,527 | |
|
| |
| (a) | Diluted weighted average shares outstanding include common shares issued and outstanding, the assumed conversion of Series A Preferred Stock issued in May 2001, accrued payment-in-kind dividends on and assumed conversion of the Series A Preferred Stock, the dilutive impact of restricted stock and outstanding stock options using the Treasury Stock Method. |
35
Table of Contents | |
| (b) | In 2006, the Company adopted FAS 123(R), Share-based Payment, and began recording expense for all forms of stock-based compensation. Prior to 2006, only stock-based compensation expense for restricted stock grants was being recorded. |
| |
| (c) | Reflects the purchase for $12 million of three previously leased campus facilities in January 2002. |
| |
| (d) | Reflects student enrollment as of the beginning of the fall academic term for each year indicated. |
| |
| (e) | Reflects number of campuses offering classes during the fourth quarter of each year indicated. |
| |
| (f) | Working capital is calculated by subtracting current liabilities from current assets. |
Item 7. Management’s Discussion and Analysis of Financial Condition and Results of Operations
You should read the following discussion in conjunction with ‘‘Selected Historical Financial and Other Information,’’ our consolidated financial statements and the notes thereto, the ‘‘Cautionary Notice Regarding Forward-Looking Statements,’’ Item 1A entitled ‘‘Risk Factors’’ and the other information appearing elsewhere, or incorporated by reference, in this Annual Report on Form 10-K.
Background and Overview
We are an education services holding company that owns Strayer University, Inc. and Education Loan Processing, Inc. (‘‘ELP’’). The University is an institution of higher education which offers undergraduate and graduate degree programs at 47 campuses (including two new campuses opened for the 2007 winter term enrollment and two new campuses opened for the 2007 spring term enrollment) in Pennsylvania, Delaware, Maryland, Washington, D.C., Virginia, North Carolina, South Carolina, Tennessee, Georgia, Florida, Alabama, Kentucky, and worldwide through Strayer University Online. The Company is planning to open a total of eight new campuses in 2007, including four that have already been opened.
ELP was created to administer the Company’s student loan portfolio. In 2003, the Company sold its loan portfolio to a financial institution. ELP continued to originate loans for immediate sale and administered them. Now, ELP only administers existing loans and helps students obtain new loans directly from third party lenders without the Company’s origination.
As set forth below, enrollment (measured by fall term to fall term), full-time tuition rates, revenues, income from operations and net income have all increased in each of the last three years.
| | | | | | | | | | | | | | | | | | |
| | | | Year Ended December 31, |
| | | | 2004 | | | 2005 | | | 2006(a) |
| Fall term enrollment | | | | | 23,539 | | | | | | 27,305 | | | | | | 31,372 | |
| % Change from prior year | | | | | 17 | | | | | | 16 | | | | | | 15 | |
| Full-time tuition (per course) | | | | $ | 1,096 | | | | | $ | 1,152 | | | | | $ | 1,215 | |
| % Change from prior year | | | | | 5 | | | | | | 5 | | | | | | 5 | |
| Revenues (in thousands) | | | | $ | 183,194 | | | | | $ | 220,507 | | | | | $ | 263,648 | |
| % Change from prior year | | | | | 25 | | | | | | 20 | | | | | | 20 | |
| Income from operations (in thousands) | | | | $ | 65,483 | | | | | $ | 74,864 | | | | | $ | 79,536 | |
| % Change from prior year | | | | | 24 | | | | | | 14 | | | | | | 6 | |
| Net income (in thousands) | | | | $ | 41,240 | | | | | $ | 48,065 | | | | | $ | 52,307 | |
| % Change from prior year | | | | | 22 | | | | | | 17 | | | | | | 9 | |
| Diluted net income per share | | | | $ | 2.74 | | | | | $ | 3.26 | | | | | $ | 3.61 | |
| % Change from prior year | | | | | 21 | | | | | | 19 | | | | | | 11 | |
|
| |
| (a) | In 2006, the Company adopted FAS 123(R) related to stock-based compensation and began recording stock-based compensation expense for all forms of stock-based compensation. |
36
Table of ContentsStrayer University derives approximately 97% of its revenue from tuition collected from its students. The academic year of the University is divided into four quarters, which approximately coincide with the four quarters of the calendar year. Students make payment arrangements for the tuition for each course prior to the beginning of the quarter. When students register for courses, tuition is recorded as unearned tuition, and is recognized in the quarter of instruction. If a student withdraws from a course prior to completion, the University refunds a portion of the tuition depending on when the withdrawal occurs. Tuition revenue is shown net of any refunds, withdrawals, corporate discounts, employee tuition discounts and scholarships. The University also derives revenue from other sources such as textbook-related income, application fees, commencement fees, placement test fees, withdrawal fees, loan administration fees, and other income, which are all recognized when incurred.
At the time of registration, unearned tuition (a liability) is recorded for academic services to be provided and a tuition receivable is recorded for the portion of the tuition not paid upfront in cash. Because the University’s academic quarters coincide with the calendar quarters, tuition receivable at the end of any calendar quarter largely represents student tuition due for the following academic quarter. Based upon past experience and judgment, the University establishes an allowance for doubtful accounts with respect to accounts receivable not included in unearned tuition. Any uncollected account more than six months past due for students who have left the University is charged against the allowance. Our bad debt expense as a percentage of revenue for the years ended December 31, 2004, 2005 and 2006 was 2.3%, 2.5% and 2.9%, respectively.
Strayer University’s expenses consist of instruction and educational support expenses, selling and promotion expenses, and general and administration expenses. Instruction and educational support expenses generally contain items of expense directly attributable to the educational activity of the University. This expense category includes salaries and benefits of faculty and academic administrators and, beginning in 2006, stock-based compensation expense. Instruction and educational support expenses also include costs of educational supplies and facilities, including rent for campus facilities, certain costs of establishing and maintaining computer laboratories and all other physical plant and occupancy costs, with the exception of costs attributable to the corporate offices.
Selling and promotion expenses include salaries, benefits and, beginning in 2006, stock-based compensation expense of personnel engaged in recruitment, admissions, retention, promotion and development, as well as costs of advertising and production of marketing materials.
General and administration expenses include salaries, benefits and, beginning in 2006, stock-based compensation expense of management and employees engaged in student services, accounting, human resources, compliance and other corporate functions, along with the occupancy costs attributable to such functions. Bad debt expense is also included as a general and administration expense.
Investment and other income consists primarily of earnings and realized gains or losses on investments.
Critical Accounting Policies and Estimates
‘‘Management’s Discussion and Analysis of Financial Condition and Results of Operations’’ discusses our consolidated financial statements, which have been prepared in accordance with accounting principles generally accepted in the United States of America. The preparation of these consolidated financial statements requires management to make estimates and judgments that affect the reported amounts of assets, liabilities, revenues and expenses and the related disclosures of contingent assets and liabilities. On an ongoing basis, management evaluates its estimates and judgments related to its allowance for uncollectible accounts, income tax provisions, valuation of deferred tax assets, forfeiture rates for stock-based compensation plans and accrued expenses. Management bases its estimates and judgments on historical experience and various other factors and assumptions that are believed to be reasonable under the circumstances, the results of which form the basis for making judgments regarding the carrying values of assets and liabilities that are not readily apparent from other sources. Actual results may differ from these estimates under different assumptions or conditions.
37
Table of ContentsManagement believes that the following critical accounting policies are its more significant judgments and estimates used in the preparation of its consolidated financial statements. Tuition revenue is deferred at the time of registration and is recognized as income, net of any refunds or withdrawals, in the respective quarter of instruction. Advance registrations for the next quarter are recorded as unearned tuition. We record estimates for our allowance for uncollectible accounts for tuition receivable from students. If the financial condition of our students were to deteriorate, resulting in impairment of their ability to make required payments for tuition payable to us, additional allowances may be required. We record estimates for our accrued expenses and income tax liabilities. We periodically review our assumed forfeiture rates for stock-based awards and adjust them as necessary. Should actual results differ from our estimates, revisions to our accrued expenses, stock-based compensation expenses, and income tax liabilities may be required.
New Campuses
The Company’s goal is to serve the demand for post secondary adult education nationwide by opening new campuses every year. A new campus typically requires up to $1 million in upfront capital costs for leasehold improvements, furniture and fixtures, and computer equipment. In the first year of operation, assuming a midyear opening, the Company expects to incur operating losses of approximately $1 million including depreciation related to the upfront capital costs. A new campus is typically expected to begin generating operating income on a quarterly basis after four to six quarters of operation, which is generally upon reaching an enrollment level of about 300 students. The Company’s new campus notional model assumes an increase of average enrollment by 100-150 students per year until reaching a level of about 1,000 students. Given the potential internal rate of return achieved with each new campus (an estimated 70%), opening new campuses is an important part of the Company’s strategy. The Company believes it has sufficient capital resources from cash, cash equivalents, marketable securities and cash generated from operating activities to continue to open new campuses for at least the next 12 months.
The Company plans to open eight new campuses in 2007 including four already opened. In 2006, the Company opened eight new campuses. The Company opened five new campuses in each of the preceding three years. See ‘‘New Campuses Opened’’ table in Item 1 for information regarding the locations of these new campuses.
Results of Operations
In 2006, the Company generated $263.6 million in revenue, a 20% increase compared to 2005, primarily as a result of average enrollment growth of 15% and a 5% tuition increase which commenced in January 2006. Income from operations was $79.5 million for 2006, an increase of 6% compared to 2005. In 2006, the Company began recording stock-based compensation expense which amounted to $8.1 million before tax for the year ended December 31, 2006. Net income in 2006 was $52.3 million, an increase of 9% compared to 2005. Net income for the year ended December 31, 2006 includes the effect of a $5.1 million after tax expense related to stock-based compensation. Earnings per diluted share was $3.61 in 2006 compared to $3.26 in 2005, an increase of 11%. Diluted earnings per share for the year ended December 31, 2006 includes the effect of a $0.35 per share after tax expense related to stock-based compensation.
38
Table of ContentsThe following table sets forth certain income statement data as a percentage of revenues for the periods indicated:
| | | | | | | | | | | | | | | | | | |
| | | | Year Ended December 31, |
| | | | 2004 | | | 2005 | | | 2006 |
| Revenues | | | | | 100.0 | | | | | | 100.0 | | | | | | 100.0 | |
| Costs and expenses: | | | | | | | | | | | | | | | | | | |
| Instruction and educational support | | | | | 34.9 | | | | | | 34.9 | | | | | | 34.6 | |
| Selling and promotion | | | | | 16.1 | | | | | | 18.6 | | | | | | 19.8 | |
| General and administration | | | | | 13.3 | | | | | | 12.5 | | | | | | 15.4 | |
| Income from operations | | | | | 35.7 | | | | | | 34.0 | | | | | | 30.2 | |
| Investment and other income | | | | | 0.9 | | | | | | 1.3 | | | | | | 1.7 | |
| Income before income taxes | | | | | 36.6 | | | | | | 35.3 | | | | | | 31.9 | |
| Provision for income taxes | | | | | 14.1 | | | | | | 13.5 | | | | | | 12.1 | |
| Net income | | | | | 22.5 | | | | | | 21.8 | | | | | | 19.8 | |
| Tax rate | | | | | 38.5 | | | | | | 38.3 | | | | | | 37.8 | |
|
Year Ended December 31, 2006 Compared To Year Ended December 31, 2005
Enrollment. Average enrollment increased 15% from 23,903 students for the year ended December 31, 2005 to 27,554 students for the same period in 2006. This growth is principally due to new campus openings, stable growth in our mature markets and the rapid growth in markets outside of commuting distance to a Strayer University physical campus served by Strayer University Online.
Revenues. Revenues increased 20% from $220.5 million in 2005 to $263.6 million in 2006 principally due to a 15% increase in the average enrollment and a 5% tuition increase which commenced in January 2006.
Instruction and educational support expenses. Instruction and educational support expenses increased $14.1 million, or 18%, from $77.0 million in 2005 to $91.1 million in 2006. This increase was principally due to direct costs necessary to support the increase in student enrollments including faculty compensation, related academic staff salaries, and campus facility costs which increased $4.7 million, $3.0 million, and $2.9 million, respectively. The increase is also partly attributable to $0.6 million in stock-based compensation expense which the Company began recording in 2006. These costs as a percentage of revenues decreased slightly to 34.6% in 2006 from 34.9% in 2005.
Selling and promotion expenses. Selling and promotion expenses increased $11.2 million, or 27%, from $41.1 million in 2005 to $52.3 million in 2006. This increase was principally due to the direct costs required to generate leads for enrollment growth, the addition of admissions personnel, particularly at new campuses and at Strayer University Online, the increase in the number of new campuses opened in 2006 compared to 2005 (eight, up from five in 2005) and stock-based compensation expense. These expenses as a percentage of revenues increased from 18.6% in 2005 to 19.8% in 2006 largely attributable to both marketing costs and staffing costs growing faster than tuition revenue, as the Company has increased the number of new campuses opened.
General and administration expenses. General and administration expenses increased $13.1 million, or 48%, from $27.6 million in 2005 to $40.7 million in 2006. The increase is largely attributable to $6.9 million of stock-based compensation expense which the Company began recording in 2006. This increase was also due to increased employee compensation and related expenses at both corporate and campus locations and higher bad debt expense, each increasing by $2.2 million. General and administration expenses as a percentage of revenues increased to 15.4% in 2006 from 12.5% in 2005 primarily due to the inclusion of stock-based compensation.
Income from operations. Income from operations increased $4.6 million, or 6%, from $74.9 million in 2005 to $79.5 million in 2006 due to the aforementioned factors.
Investment and other income. Investment and other income increased $1.5 million, or 52%, from $3.0 million in 2005 to $4.5 million in 2006. This increase was principally due to higher yields from the
39
Table of ContentsCompany’s investments in a short-term tax-exempt bond fund and tax-exempt money market funds. In addition, a higher average cash balance in 2006 partly contributed to this increase.
Provision for income taxes. Income tax expense increased $2.0 million, or 7%, from $29.8 million in 2005 to $31.8 million in 2006 primarily due to the increase in income before taxes attributable to the factors discussed above. This was partly offset by a lower effective tax rate of 37.8% in 2006, compared to 38.3% in 2005, resulting primarily from higher income from tax-exempt securities.
Net income. Net income increased $4.2 million, or 9%, from $48.1 million in 2005 to $52.3 million in 2006 because of the factors discussed above.
Year Ended December 31, 2005 Compared To Year Ended December 31, 2004
Enrollment. Average enrollment increased 18% from 20,340 students for the year ended December 31, 2004 to 23,903 students for the same period in 2005. This growth is principally due to new campus openings, stable growth in our mature markets and the rapid growth in markets outside of commuting distance to a Strayer University physical campus served by Strayer University Online.
Revenues. Revenues increased 20% from $183.2 million in 2004 to $220.5 million in 2005 principally due to a 18% increase in the average enrollment. Although tuition increased 5% in 2005, revenue per student increased only 2%, affected by a mix shift to graduate students who, on average, take fewer classes than undergraduate students.
Instruction and educational support expenses. Instruction and educational support expenses increased $13.1 million, or 21%, from $63.9 million in 2004 to $77.0 million in 2005. This increase was principally due to direct costs necessary to support the increase in student enrollments including faculty compensation, related academic staff salaries, and campus facility costs which increased $4.5 million, $3.1 million, and $3.0 million, respectively. These costs as a percentage of revenues were 34.9% in 2005 as well as in 2004.
Selling and promotion expenses. Selling and promotion expenses increased $11.7 million, or 40%, from $29.4 million in 2004 to $41.1 million in 2005. This increase was principally due to the direct costs required to generate leads for enrollment growth and the addition of admissions personnel, particularly at new campuses and at Strayer University Online. These expenses as a percentage of revenues increased from 16.1% in 2004 to 18.6% in 2005 largely attributable to both marketing costs and staffing costs growing faster than tuition revenue, as the Company prepared to open an increased number of new campuses in 2006.
General and administration expenses. General and administration expenses increased $3.2 million, or 13%, from $24.4 million in 2004 to $27.6 million in 2005. This increase was principally due to increased employee compensation and related expenses at both corporate and campus locations and higher bad debt expense, which increased $0.7 million and $1.3 million, respectively. General and administration expenses as a percentage of revenues decreased slightly to 12.5% in 2005 from 13.3% in 2004 primarily due to greater revenues being spread over the largely fixed costs of various centralized functions.
Income from operations. Income from operations increased $9.4 million, or 14%, from $65.5 million in 2004 to $74.9 million in 2005 due to the aforementioned factors.
Investment and other income. Investment and other income increased $1.4 million, or 87%, from $1.6 million in 2004 to $3.0 million in 2005. This increase was principally due to higher yields from the Company’s investments in a short-term tax-exempt bond fund and tax-exempt money market funds.
Provision for income taxes. Income tax expense increased $4.0 million, or 15%, from $25.8 million in 2004 to $29.8 million in 2005 primarily due to the increase in income before taxes attributable to the factors discussed above. This was partly offset by a lower effective tax rate of 38.3% in 2005, compared to 38.5% in 2004, resulting primarily from higher income from tax-exempt securities.
Net income. Net income increased $6.9 million, or 16.6%, from $41.2 million in 2004 to $48.1 million in 2005 because of the factors discussed above.
40
Table of ContentsSeasonality
Our quarterly results of operations tend to vary significantly within a year because of student enrollment patterns. Enrollment generally is highest in the fourth quarter, or fall term, and lowest in the third quarter, or summer term. In 2006, enrollments by term were as follows:
2006 Enrollment by Term
| | | | | | |
| Term | | | Enrollment |
| Winter | | | | | 27,621 | |
| Spring | | | | | 27,289 | |
| Summer | | | | | 23,932 | |
| Fall | | | | | 31,372 | |
| Average | | | | | 27,554 | |
|
The following table sets forth our revenues on a quarterly basis for the years ended December 31, 2004, 2005 and 2006:
Quarterly Revenues
(dollars in thousands)
| | | | | | | | | | | | | | | | | | | | | | | | | | | | | | | | | | | | |
| | | | 2004 | | | 2005 | | | 2006 |
| Three Months Ended | | | Amount | | | Percent | | | Amount | | | Percent | | | Amount | | | Percent |
| March 31 | | | | $ | 46,106 | | | | | | 25 | | | | | $ | 56,153 | | | | | | 26 | | | | | $ | 67,090 | | | | | | 25 | |
| June 30 | | | | | 46,811 | | | | | | 26 | | | | | | 55,249 | | | | | | 25 | | | | | | 65,558 | | | | | | 25 | |
| September 30 | | | | | 38,009 | | | | | | 21 | | | | | | 47,087 | | | | | | 21 | | | | | | 56,693 | | | | | | 22 | |
| December 31 | | | | | 52,268 | | | | | | 28 | | | | | | 62,018 | | | | | | 28 | | | | | | 74,307 | | | | | | 28 | |
| Total for Year | | | | $ | 183,194 | | | | | | 100 | | | | | $ | 220,507 | | | | | | 100 | | | | | $ | 263,648 | | | | | | 100 | |
|
Costs generally are not affected by the seasonal factors as much as enrollment and revenue, and do not vary significantly on a quarterly basis.
Liquidity and Capital Resources
At December 31, 2006, the Company had cash, cash equivalents and marketable securities of $128.4 million compared to $119.8 million at December 31, 2005. Most of the Company’s excess cash is invested in tax-exempt money market funds and a diversified, short-term, investment grade, tax-exempt bond fund to minimize the Company’s principal risk and to benefit from the tax efficiency of the funds’ underlying securities. As of December 31, 2006, the Company had a total of $75.7 million invested in the short-term, tax-exempt bond fund, having added $30 million to it in the first quarter of 2006. At December 31, 2006, the 429 issues in this fund had an average credit rating of AA, an average maturity and an average duration of 1.2 years, as well as an average yield to maturity of 3.8%. We had no debt as of December 31, 2006 or December 31, 2005.
For the year ended December 31, 2006, the Company generated $61.8 million net cash from operating activities compared to $55.1 million for the same period in 2005. Capital expenditures were $13.2 million for the year ended December 31, 2006 compared to $12.3 million for the same period in 2005. Capital expenditures for the year ending December 31, 2007 are expected to be in the range of $15-18 million inclusive of the expected openings of eight new campuses. For the year ended December 31, 2006, we paid $15.3 million in cash dividends to our common stockholders and spent $35.0 million repurchasing our common shares in the open market.
In 2006, bad debt expense as a percentage of revenue was 2.9% compared to 2.5% for the same period in 2005. Days sales outstanding, adjusted to exclude tuition receivable related to future quarters, was 13 days at the end of the fourth quarter 2006 compared to 10 days in 2005. This increase was partly attributable to the growth of corporate sponsored students which tend to receive extended payment terms.
41
Table of ContentsCurrently, the Company invests its cash in bank overnight deposits, money market funds and a short-term tax-exempt bond fund. In addition, the Company has available two $10.0 million credit facilities from two banks. There have been no borrowings by the Company under these credit facilities. The Company believes that existing cash, cash equivalents, and marketable securities, cash generated from operating activities, and if necessary, cash borrowed under the credit facilities, will be sufficient to meet the Company’s requirements for at least the next 12 months.
The table below sets forth the Company’s cash and cash equivalents and marketable securities as of December 31, 2004, 2005 and 2006:
Cash and Marketable Securities
(in millions)
| | | | | | | | | | | | | | | | | | |
| | | | At December 31, |
| | | | 2004 | | | 2005 | | | 2006 |
| Cash and cash equivalents | | | | $ | 97.0 | | | | | $ | 74.2 | | | | | $ | 52.7 | |
| Marketable securities (short-term bond fund) | | | | | 25.8 | | | | | | 45.6 | | | | | | 75.7 | |
| Total | | | | $ | 122.8 | | | | | $ | 119.8 | | | | | $ | 128.4 | |
|
| | | | | | | | | | | | | | | | | | |
| | | | Year Ended December 31, |
| | | | 2004 | | | 2005 | | | 2006 |
| Investment and other income | | | | $ | 1.6 | | | | | $ | 3.0 | | | | | $ | 4.5 | |
|
The table below sets forth our contractual commitments associated with operating leases as of December 31, 2006:
| | | | | | | | | | | | | | | | | | | | | | | | | | | | | | |
| | | | Payments Due By Period (in thousands) |
| | | | Total | | | Less than 1
Year | | | 1-3 Years | | | 3-5 Years | | | More than 5
Years |
| Operating leases | | | | $ | 109,227 | | | | | $ | 13,941 | | | | | $ | 29,384 | | | | | $ | 26,604 | | | | | $ | 39,298 | |
|
Impact of Inflation
Inflation has not had a significant impact on the Company’s historical operations.
Off-Balance Sheet Arrangements
As of December 31, 2006, the Company does not have any off-balance sheet arrangements as defined by Item 303(a)(4) of the Securities Exchange Commission Regulation S-K.
Item 7A. Quantitative and Qualitative Disclosures about Market Risk
The Company is subject to the impact of interest rate changes and may be subject to changes in the market values of its current and future investments. The Company invests its excess cash in bank overnight deposits, money market funds and a short-term tax-exempt bond fund. The Company has not used derivative financial instruments in its investment portfolio.
Earnings from investments in bank overnight deposits, money market mutual funds and short-term tax-exempt bond funds may be adversely affected in the future should interest rates change. The Company’s future investment income may fall short of expectations due to changes in interest rates or the Company may suffer losses in principal if forced to sell securities that have declined in market value due to changes in interest rates. As of December 31, 2006, a 10% increase or decline in interest rates will not have a material impact on the Company’s future earnings, fair values or cash flows related to investments in cash equivalents or interest earning marketable securities.
42
Table of ContentsItem 8. Financial Statements and Supplementary Data
INDEX TO CONSOLIDATED FINANCIAL STATEMENTS
| | | |
| | | | Page |
| Strayer Education, Inc. | | | |
| Report of Independent Registered Public Accounting Firm | | | 44 |
| Consolidated Balance Sheets as of December 31, 2005 and 2006 | | | 46 |
| Consolidated Statements of Income for each of the three years in the period ended December 31, 2006 | | | 47 |
| Consolidated Statements of Comprehensive Income for each of the three years in the period ended December 31, 2006 | | | 47 |
| Consolidated Statements of Stockholders’ Equity for each of the three years in the period ended December 31, 2006 | | | 48 |
| Consolidated Statements of Cash Flows for each of the three years in the period ended December 31, 2006 | | | 49 |
| Notes to Consolidated Financial Statements | | | 50 |
| Schedule II-Valuation and Qualifying Accounts | | | 64 |
|
All other schedules are omitted because they are not applicable or the required information is included in the consolidated financial statements or notes thereto.
43
Table of ContentsReport of Independent Registered Public Accounting Firm
To Board of Directors and Stockholders
Strayer Education, Inc.
We have completed integrated audits of Strayer Education, Inc.’s consolidated financial statements and of its internal control over financial reporting as of December 31, 2006, in accordance with the standards of the Public Company Accounting Oversight Board (United States). Our opinions, based on our audits, are presented below.
Consolidated financial statements and financial statement schedule
In our opinion, the consolidated financial statements listed in the accompanying index present fairly, in all material respects, the financial position of Strayer Education, Inc. and its subsidiaries at December 31, 2006 and 2005, and the results of their operations and their cash flows for each of the three years in the period ended December 31, 2006 in conformity with accounting principles generally accepted in the United States of America. In addition, in our opinion, the financial statement schedule listed in the accompanying index presents fairly, in all material respects, the information set forth therein when read in conjunction with the related consolidated financial statements. These financial statements and financial statement schedule are the responsibility of the Company’s management. Our responsibility is to express an opinion on these financial statements and financial statement schedule based on our audits. We conducted our audits of these statements in accordance with the standards of the Public Company Accounting Oversight Board (United States). Those standards require that we plan and perform the audit to obtain reasonable assurance about whether the financial statements are free of material misstatement. An audit of financial statements includes examining, on a test basis, evidence supporting the amounts and disclosures in the financial statements, assessing the accounting principles used and significant estimates made by management, and evaluating the overall financial statement presentation. We believe that our audits provide a reasonable basis for our opinion.
As discussed in Note 2 to the consolidated financial statements, the Company changed the manner in which it accounts for share-based compensation in 2006.
Internal control over financial reporting
Also, in our opinion, management’s assessment, included in Management’s Report on Internal Control Over Financial Reporting appearing under Item 9A, that the Company maintained effective internal control over financial reporting as of December 31, 2006 based on criteria established in Internal Control – Integrated Framework issued by the Committee of Sponsoring Organizations of the Treadway Commission (COSO), is fairly stated, in all material respects, based on those criteria. Furthermore, in our opinion, the Company maintained, in all material respects, effective internal control over financial reporting as of December 31, 2006, based on criteria established in Internal Control – Integrated Framework issued by the COSO. The Company’s management is responsible for maintaining effective internal control over financial reporting and for its assessment of the effectiveness of internal control over financial reporting. Our responsibility is to express opinions on management’s assessment and on the effectiveness of the Company’s internal control over financial reporting based on our audit. We conducted our audit of internal control over financial reporting in accordance with the standards of the Public Company Accounting Oversight Board (United States). Those standards require that we plan and perform the audit to obtain reasonable assurance about whether effective internal control over financial reporting was maintained in all material respects. An audit of internal control over financial reporting includes obtaining an understanding of internal control over financial reporting, evaluating management’s assessment, testing and evaluating the design and operating effectiveness of internal control, and performing such other procedures as we consider necessary in the circumstances. We believe that our audit provides a reasonable basis for our opinions.
A company’s internal control over financial reporting is a process designed to provide reasonable assurance regarding the reliability of financial reporting and the preparation of financial statements for external purposes in accordance with generally accepted accounting principles. A company’s internal control over financial reporting includes those policies and procedures that (i) pertain to the maintenance of records that, in reasonable detail, accurately and fairly reflect the transactions and
44
Table of Contentsdispositions of the assets of the company; (ii) provide reasonable assurance that transactions are recorded as necessary to permit preparation of financial statements in accordance with generally accepted accounting principles, and that receipts and expenditures of the company are being made only in accordance with authorizations of management and directors of the company; and (iii) provide reasonable assurance regarding prevention or timely detection of unauthorized acquisition, use, or disposition of the company’s assets that could have a material effect on the financial statements.
Because of its inherent limitations, internal control over financial reporting may not prevent or detect misstatements. Also, projections of any evaluation of effectiveness to future periods are subject to the risk that controls may become inadequate because of changes in conditions, or that the degree of compliance with the policies or procedures may deteriorate.
PricewaterhouseCoopers LLP
McLean, Virginia
February 26, 2007
45
Table of ContentsSTRAYER EDUCATION, INC.
CONSOLIDATED BALANCE SHEETS
(in thousands, except share and per share data)
| | | | | | | | | | | | |
| | | | December 31, |
| ASSETS | | | 2005 | | | 2006 |
| Current assets: | | | | | | | | | | | | |
| Cash and cash equivalents | | | | $ | 74,212 | | | | | $ | 52,663 | |
| Marketable securities available for sale, at fair value | | | | | 45,594 | | | | | | 75,763 | |
| Tuition receivable, net of allowances for doubtful accounts of $1,927 and $3,029 in 2005 and 2006, respectively | | | | | 55,935 | | | | | | 80,753 | |
| Other current assets | | | | | 2,581 | | | | | | 4,653 | |
| Total current assets | | | | | 178,322 | | | | | | 213,832 | |
| Property and equipment, net | | | | | 46,684 | | | | | | 52,748 | |
| Deferred income taxes | | | | | — | | | | | | 3,400 | |
| Restricted cash | | | | | 500 | | | | | | 500 | |
| Other assets | | | | | 339 | | | | | | 364 | |
| Total assets | | | | $ | 225,845 | | | | | $ | 270,844 | |
| LIABILITIES AND STOCKHOLDERS’ EQUITY | | | | | | | | | | | | |
| Current liabilities: | | | | | | | | | | | | |
| Accounts payable | | | | $ | 6,402 | | | | | $ | 10,923 | |
| Accrued expenses | | | | | 1,483 | | | | | | 1,830 | |
| Income taxes payable | | | | | 3,773 | | | | | | 4,979 | |
| Unearned tuition | | | | | 55,778 | | | | | | 73,896 | |
| Total current liabilities | | | | | 67,436 | | | | | | 91,628 | |
| Deferred income taxes | | | | | 205 | | | | | | — | |
| Long-term liabilities | | | | | 6,364 | | | | | | 7,689 | |
| Total liabilities | | | | | 74,005 | | | | | | 99,317 | |
| Commitments and contingencies | | | | | | | | | | | | |
| Stockholders’ equity: | | | | | | | | | | | | |
Common stock, par value $.01; 20,000,000 shares authorized;
14,292,249 and 14,293,584 shares issued and outstanding as of
December 31, 2005 and 2006, respectively | | | | | 143 | | | | | | 141 | |
| Additional paid-in capital | | | | | 104,923 | | | | | | 87,487 | |
| Retained earnings | | | | | 47,020 | | | | | | 84,043 | |
| Accumulated other comprehensive income (loss) | | | | | (246 | | | | | | (144 | |
| Total stockholders’ equity | | | | | 151,840 | | | | | | 171,527 | |
| Total liabilities and stockholders’ equity | | | | $ | 225,845 | | | | | $ | 270,844 | |
|
The accompanying notes are an integral part of these consolidated financial statements.
46
Table of ContentsSTRAYER EDUCATION, INC.
CONSOLIDATED STATEMENTS OF INCOME
(in thousands, except per share data)
| | | | | | | | | | | | | | | | | | |
| | | | For the Year Ended
December 31, |
| | | | 2004 | | | 2005 | | | 2006 |
| Revenues | | | | $ | 183,194 | | | | | $ | 220,507 | | | | | $ | 263,648 | |
| Costs and expenses: | | | | | | | | | | | | | | | | | | |
| Instruction and educational support | | | | | 63,860 | | | | | | 76,977 | | | | | | 91,120 | |
| Selling and promotion | | | | | 29,435 | | | | | | 41,090 | | | | | | 52,269 | |
| General and administration | | | | | 24,416 | | | | | | 27,576 | | | | | | 40,723 | |
| Income from operations | | | | | 65,483 | | | | | | 74,864 | | | | | | 79,536 | |
| Investment and other income | | | | | 1,595 | | | | | | 2,982 | | | | | | 4,542 | |
| Income before income taxes | | | | | 67,078 | | | | | | 77,846 | | | | | | 84,078 | |
| Provision for income taxes | | | | | 25,838 | | | | | | 29,781 | | | | | | 31,771 | |
| Net income | | | | $ | 41,240 | | | | | $ | 48,065 | | | | | $ | 52,307 | |
| Preferred stock dividends and accretion | | | | | 1,389 | | | | | | — | | | | | | — | |
| Net income available to common stockholders | | | | $ | 39,851 | | | | | $ | 48,065 | | | | | $ | 52,307 | |
| Net income per share: | | | | | | | | | | | | | | | | | | |
| Basic | | | | $ | 2.91 | | | | | $ | 3.32 | | | | | $ | 3.69 | |
| Diluted | | | | $ | 2.74 | | | | | $ | 3.26 | | | | | $ | 3.61 | |
| Weighted average shares outstanding: | | | | | | | | | | | | | | | | | | |
| Basic | | | | | 13,674 | | | | | | 14,472 | | | | | | 14,187 | |
| Diluted | | | | | 15,057 | | | | | | 14,741 | | | | | | 14,492 | |
|
STRAYER EDUCATION, INC.
CONSOLIDATED STATEMENTS OF COMPREHENSIVE INCOME
(in thousands)
| | | | | | | | | | | | | | | | | | |
| | | | For the Year Ended
December 31, |
| | | | 2004 | | | 2005 | | | 2006 |
| Net income | | | | $ | 41,240 | | | | | $ | 48,065 | | | | | $ | 52,307 | |
| Other comprehensive income: | | | | | | | | | | | | | | | | | | |
| Unrealized gains (losses) on investments, net of taxes | | | | | (102 | | | | | | (95 | | | | | | 102 | |
| Comprehensive income | | | | $ | 41,138 | | | | | $ | 47,970 | | | | | $ | 52,409 | |
|
The accompanying notes are an integral part of these consolidated financial statements.
47
Table of ContentsSTRAYER EDUCATION, INC.
CONSOLIDATED STATEMENTS OF STOCKHOLDERS’ EQUITY
(in thousands, except share data)
| | | | | | | | | | | | | | | | | | | | | | | | | | | | | | | | | | | | |
| | | | Common Stock | | | Additional
Paid-in
Capital | | | Retained
Earnings
(Accumulated
Deficit) | | | Accumulated
Other
Comprehensive
Income (Loss) | | | Total |
| Shares | | | Par Value |
| Balance, December 31, 2003 | | | | | 10,703,395 | | | | | $ | 107 | | | | | $ | 59,838 | | | | | $ | (26,918 | | | | | $ | (49 | | | | | $ | 32,978 | |
| Exercise of stock options | | | | | 335,416 | | | | | | 3 | | | | | | 11,945 | | | | | | — | | | | | | — | | | | | | 11,948 | |
| Tax benefit from exercise of stock options | | | | | — | | | | | | — | | | | | | 9,758 | | | | | | — | | | | | | — | | | | | | 9,758 | |
Issuance of common stock for
redemption of preferred
stock | | | | | 3,977,120 | | | | | | 40 | | | | | | 96,166 | | | | | | — | | | | | | — | | | | | | 96,206 | |
| Repurchase of common stock | | | | | (346,444 | | | | | | (3 | | | | | | (36,764 | | | | | | — | | | | | | — | | | | | | (36,767 | |
| Preferred stock dividends and accretion | | | | | — | | | | | | — | | | | | | — | | | | | | (1,389 | | | | | | — | | | | | | (1,389 | |
| Common stock dividends | | | | | — | | | | | | — | | | | | | — | | | | | | (4,950 | | | | | | — | | | | | | (4,950 | |
| Change in net unrealized gains (losses) on marketable securities, net of income tax | | | | | — | | | | | | — | | | | | | — | | | | | | — | | | | | | (102 | | | | | | (102 | |
| Net income | | | | | — | | | | | | — | | | | | | — | | | | | | 41,240 | | | | | | — | | | | | | 41,240 | |
| Balance, December 31, 2004 | | | | | 14,669,487 | | | | | $ | 147 | | | | | $ | 140,943 | | | | | $ | 7,983 | | | | | $ | (151 | | | | | $ | 148,922 | |
| Exercise of stock options | | | | | 28,333 | | | | | | — | | | | | | 1,336 | | | | | | — | | | | | | — | | | | | | 1,336 | |
| Tax benefit from exercise of stock options | | | | | — | | | | | | — | | | | | | 560 | | | | | | — | | | | | | — | | | | | | 560 | |
| Repurchase of common stock | | | | | (410,071 | | | | | | (4 | | | | | | (37,964 | | | | | | — | | | | | | — | | | | | | (37,968 | |
| Restricted stock grant | | | | | 4,500 | | | | | | — | | | | | | — | | | | | | — | | | | | | — | | | | | | — | |
| Stock-based compensation | | | | | — | | | | | | — | | | | | | 48 | | | | | | — | | | | | | — | | | | | | 48 | |
| Common stock dividends | | | | | — | | | | | | — | | | | | | — | | | | | | (9,028 | | | | | | — | | | | | | (9,028 | |
| Change in net unrealized gains (losses) on marketable securities, net of income tax | | | | | — | | | | | | — | | | | | | — | | | | | | — | | | | | | (95 | | | | | | (95 | |
| Net income | | | | | — | | | | | | — | | | | | | — | | | | | | 48,065 | | | | | | — | | | | | | 48,065 | |
| Balance, December 31, 2005 | | | | | 14,292,249 | | | | | $ | 143 | | | | | $ | 104,923 | | | | | $ | 47,020 | | | | | $ | (246 | | | | | $ | 151,840 | |
| Exercise of stock options | | | | | 149,334 | | | | | | 1 | | | | | | 6,594 | | | | | | — | | | | | | — | | | | | | 6,595 | |
| Tax benefit from exercise of stock options | | | | | — | | | | | | — | | | | | | 3,595 | | | | | | — | | | | | | — | | | | | | 3,595 | |
| Repurchase of common stock | | | | | (349,066 | | | | | | (3 | | | | | | (35,038 | | | | | | — | | | | | | — | | | | | | (35,041 | |
| Restricted stock grant | | | | | 201,067 | | | | | | — | | | | | | — | | | | | | — | | | | | | — | | | | | | — | |
| Stock-based compensation | | | | | — | | | | | | — | | | | | | 7,413 | | | | | | — | | | | | | — | | | | | | 7,413 | |
| Common stock dividends | | | | | — | | | | | | — | | | | | | — | | | | | | (15,284 | | | | | | — | | | | | | (15,284 | |
| Change in net unrealized gains (losses) on marketable securities, net of income tax | | | | | — | | | | | | — | | | | | | — | | | | | | — | | | | | | 102 | | | | | | 102 | |
| Net income | | | | | — | | | | | | — | | | | | | — | | | | | | 52,307 | | | | | | — | | | | | | 52,307 | |
| Balance, December 31, 2006 | | | | | 14,293,584 | | | | | $ | 141 | | | | | $ | 87,487 | | | | | $ | 84,043 | | | | | $ | (144 | | | | | $ | 171,527 | |
|
The accompanying notes are an integral part of these consolidated financial statements.
48
Table of ContentsSTRAYER EDUCATION, INC.
CONSOLIDATED STATEMENTS OF CASH FLOWS
(in thousands)
| | | | | | | | | | | | | | | | | | |
| | | | For the Year Ended December 31, |
| | | | 2004 | | | 2005 | | | 2006 |
| Cash flows from operating activities: | | | | | | | | | | | | | | | | | | |
| Net income | | | | $ | 41,240 | | | | | $ | 48,065 | | | | | $ | 52,307 | |
| Adjustments to reconcile net income to net cash provided by operating activities: | | | | | | | | | | | | | | | | | | |
| Loss on disposal of assets | | | | | 30 | | | | | | 37 | | | | | | — | |
| Amortization of deferred rent | | | | | 614 | | | | | | 230 | | | | | | 190 | |
| Depreciation and amortization | | | | | 5,375 | | | | | | 6,619 | | | | | | 7,059 | |
| Provision for student loan losses | | | | | (227 | | | | | | (162 | | | | | | (120 | |
| Deferred income taxes | | | | | (101 | | | | | | (63 | | | | | | (4,034 | |
| Stock-based compensation | | | | | — | | | | | | 48 | | | | | | 7,413 | |
| Changes in assets and liabilities: | | | | | | | | | | | | | | | | | | |
| Tuition receivable, net | | | | | (5,672 | | | | | | (14,266 | | | | | | (24,818 | |
| Other current assets | | | | | (899 | | | | | | 630 | | | | | | (1,710 | |
| Other assets | | | | | 25 | | | | | | 4 | | | | | | (25 | |
| Accounts payable | | | | | 287 | | | | | | 1,503 | | | | | | 4,581 | |
| Accrued expenses | | | | | (11 | | | | | | (835 | | | | | | 347 | |
| Income taxes payable | | | | | 13,650 | | | | | | (2,804 | | | | | | 4,801 | |
| Excess tax benefits from stock-based payment arrangements | | | | | — | | | | | | — | | | | | | (3,595 | |
| Unearned tuition | | | | | 2,925 | | | | | | 13,719 | | | | | | 18,118 | |
| Deferred lease incentives | | | | | 745 | | | | | | 2,342 | | | | | | 1,235 | |
| Student loans originated or acquired | | | | | (1,361 | | | | | | (686 | | | | | | (3 | |
| Collections on student loans receivable | | | | | 1,506 | | | | | | 762 | | | | | | 23 | |
| Net cash provided by operating activities | | | | | 58,126 | | | | | | 55,143 | | | | | | 61,769 | |
| Cash flows from investing activities: | | | | | | | | | | | | | | | | | | |
| Purchases of property and equipment | | | | | (11,063 | | | | | | (12,275 | | | | | | (13,183 | |
| Purchases of marketable securities | | | | | — | | | | | | (20,000 | | | | | | (30,000 | |
| Net cash used in investing activities | | | | | (11,063 | | | | | | (32,275 | | | | | | (43,183 | |
| Cash flows from financing activities: | | | | | | | | | | | | | | | | | | |
| Common dividends paid | | | | | (5,645 | | | | | | (9,028 | | | | | | (15,284 | |
| Preferred dividends paid | | | | | (1,684 | | | | | | — | | | | | | — | |
| Proceeds from exercise of stock options | | | | | 11,948 | | | | | | 1,336 | | | | | | 6,595 | |
| Excess tax benefits from stock-based payment arrangements | | | | | — | | | | | | — | | | | | | 3,595 | |
| Repurchase of common stock | | | | | (36,767 | | | | | | (37,968 | | | | | | (35,041 | |
| Net cash used in financing activities | | | | | (32,148 | | | | | | (45,660 | | | | | | (40,135 | |
| Net increase (decrease) in cash and cash equivalents | | | | | 14,915 | | | | | | (22,792 | | | | | | (21,549 | |
| Cash and cash equivalents – beginning of year | | | | | 82,089 | | | | | | 97,004 | | | | | | 74,212 | |
| Cash and cash equivalents – end of year | | | | $ | 97,004 | | | | | $ | 74,212 | | | | | $ | 52,663 | |
| Non-cash transactions: | | | | | | | | | | | | | | | | | | |
| Purchases of property and equipment included in accounts payable | | | | $ | 633 | | | | | $ | 561 | | | | | $ | 501 | |
|
The accompanying notes are an integral part of these consolidated financial statements.
49
STRAYER EDUCATION, INC.
NOTES TO CONSOLIDATED FINANCIAL STATEMENTS
1. Nature of Operations
Strayer Education, Inc. (the ‘‘Company’’), a Maryland corporation, conducts its operations through its subsidiaries, Strayer University, Inc. (the ‘‘University’’) and Education Loan Processing, Inc. (‘‘ELP’’). The University is an accredited institution of higher education that provides undergraduate and graduate degrees in various fields of study through 47 campuses (including two campuses opened for the 2007 winter term and two opened for the 2007 spring term) in Pennsylvania, Delaware, Maryland, Washington, D.C., Virginia, North Carolina, South Carolina, Tennessee, Georgia, Florida, Alabama and Kentucky, and worldwide via the Internet through Strayer University Online. With the Company’s focus on the customer, regardless of whether he or she chooses to take classes at a physical campus or online, we have only one reporting segment.
2. Significant Accounting Policies
Principles of Consolidation
The consolidated financial statements include the accounts of the Company and its subsidiaries, the University, ELP, and Professional Education, Inc. (which is currently inactive). All inter-company accounts and transactions have been eliminated in the consolidated financial statements.
Cash and Cash Equivalents
Cash and cash equivalents consist of cash invested in bank overnight deposits and money market mutual funds. The Company places its cash and temporary cash investments with high quality credit institutions. The Company considers all highly liquid instruments purchased with a maturity of three months or less at the date of purchase to be cash equivalents.
Marketable Securities
Most of the Company’s excess cash is invested in tax-exempt money market funds and a diversified, short-term, investment grade, tax-exempt bond fund to minimize the Company’s principal risk and to benefit from the tax efficiency of the funds’ underlying securities. As of December 31, 2006, the Company had a total of $75.8 million invested in the short-term tax-exempt bond fund. The investments are considered ‘‘available-for-sale’’ as they are not held for trading and will not be held to maturity, in accordance with Statement of Financial Accounting Standards No. 115, Accounting for Certain Investments in Debt and Equity Securities. The Company records the net unrealized gains and losses for changes in fair value as a component of accumulated other comprehensive income in stockholders’ equity. Realized gains and losses from the sale of marketable securities are based on the specific identification method.
Revenues
The Company’s educational programs are offered on a quarterly basis. Approximately 97% of the Company’s revenues during the year ended December 31, 2006 consisted of tuition revenue. Tuition revenue is recognized in the quarter of instruction. Tuition revenue is shown net of any refunds, withdrawals, corporate discounts, scholarships and employee tuition discounts. At the time of registration, a liability (unearned tuition) is recorded for academic services to be provided and a tuition receivable is recorded for the portion of the tuition not paid upfront in cash. Revenues also include textbook-related income, application fees, commencement fees, placement test fees, withdrawal fees, loan administration fees and other income, which are all recognized when incurred.
50
STRAYER EDUCATION, INC.
NOTES TO CONSOLIDATED FINANCIAL STATEMENTS (Continued)
Concentration of Credit Risk
The Company places its cash and temporary cash investments in money market mutual funds and bank overnight deposits with high credit quality institutions. Cash and cash equivalent balances are in excess of the FDIC insurance limit. The Company has not experienced any losses on its cash and cash equivalents. The Company has also invested its excess cash in a diversified, short-term, investment grade, tax-exempt bond fund that is classified under ‘‘Marketable Securities.’’
Tuition receivables are not collateralized; however, credit risk is minimized as a result of the diverse nature of the University’s student base. The University establishes an allowance for doubtful tuition accounts based upon historical trends and other information.
Property and Equipment
Property and equipment are stated at cost less accumulated depreciation. In accordance with Statement of Financial Accounting Standards No. 144, Accounting for the Impairment or Disposal of Long-Lived Assets, the carrying values of the Company’s assets are re-evaluated when events or changes in circumstances indicate that the carrying amount of an asset may not be recoverable. If it is determined that an impairment loss has occurred based on expected undiscounted future cash flows, then a loss is recognized using a fair-value based model. Through 2006, no such impairment loss had occurred. Depreciation of property and equipment is calculated using the straight-line method over the estimated useful lives ranging from 3 to 40 years. Depreciation and amortization amounted to $5.4 million, $6.6 million and $7.1 million for the years ended December 31, 2004, 2005 and 2006, respectively.
Purchases of property and equipment and changes in accounts payable for each of the three years in the period ended December 31, 2006 in the Consolidated Statements of Cash Flows have been adjusted to exclude non-cash purchases of property and equipment transactions during that period. In 2004, non-cash transactions were included in these line items. This change in classification had no impact on net increase (decrease) in cash and cash equivalents, and is immaterial to prior periods.
Income Taxes
The Company provides for deferred income taxes based on temporary differences between financial statement and income tax bases of assets and liabilities using enacted tax rates in effect in the year in which the differences are expected to reverse.
Advertising Costs
The Company expenses advertising costs in the quarter in which incurred, except for costs associated with the production of television commercials which are expensed when the commercial is first used.
Long-Term Liabilities
The Company has no debt; most of its long-term liabilities are for lease incentives related to the opening of new campuses and for the straight-lining of rent expense. In conjunction with the opening of some new campuses and other facilities, the Company was reimbursed by the lessors for improvements made to those leased properties. In accordance with Financial Accounting Standards Board Technical Bulletin No. 88-1, these reimbursements were capitalized as leasehold improvements and a long-term liability established. The leasehold improvements and the long-term liability are amortized on a straight-line basis over the corresponding lease terms, which range from five to ten years. In accordance with the FASB Technical Bulletin No. 85-3, ‘‘Accounting for Operating Leases with Schedule Rent Increases’’, the Company records rent expense on a straight-line basis over the initial term of a lease. The difference between the rent payment and the straight-line rent expense is recorded as a long-term liability. (See Note 8 below for more information.)
51
STRAYER EDUCATION, INC.
NOTES TO CONSOLIDATED FINANCIAL STATEMENTS (Continued)
Stock-Based Compensation
On January 1, 2006, the Company adopted Statement of Financial Accounting Standards No. 123(R), Share-based Payment (‘‘FAS 123(R)’’), which requires the measurement and recognition of compensation expense for all share-based payment awards made to employees and directors, including employee stock options and employee stock purchases related to the Company’s Employee Stock Purchase Plan based on estimated fair values. FAS 123(R) supersedes the Company’s previous accounting under Accounting Principles Board Opinion No. 25, Accounting for Stock Issued to Employees (‘‘APB 25’’) for periods beginning January 1, 2006. In March 2005, the Securities and Exchange Commission issued Staff Accounting Bulletin No. 107 (‘‘SAB 107’’) relating to FAS 123(R). The Company has applied the provisions of SAB 107 in its adoption of FAS 123(R).
The Company adopted FAS 123(R) using the modified prospective transition method provided under the rule, which requires the application of the accounting standard as of January 1, 2006. In adopting FAS 123(R), the Company used the long-form method for calculating the accumulated windfall tax benefit. The Company’s consolidated financial statements as of and for the twelve months ended December 31, 2006 reflect the impact of FAS 123(R). In accordance with the modified prospective transition method provided under the rule, the Company’s consolidated financial statements for prior periods have not been restated to reflect, and do not include, the impact of FAS 123(R). Stock-based compensation expense related to restricted stock grants is expensed over the vesting period using the straight-line method for Company employees and the graded-vesting method for members of the Board of Directors. Stock-based compensation expense recognized under FAS 123(R) for the year ended December 31, 2006 was $8.1 million (or $5.1 million after tax) and reduced diluted EPS by $0.35.
FAS 123(R) requires companies to estimate the fair value of share-based payment awards on the date of grant using an option-pricing model. The Company has elected to estimate fair value using the Black-Scholes option pricing valuation model. The value of the portion of the award that is ultimately expected to vest is recognized as expense over the requisite service periods in the Company’s Consolidated Statements of Income. Prior to the adoption of FAS 123(R), the Company accounted for stock-based awards to employees and directors using the intrinsic value method in accordance with APB 25 pursuant to Statement of Financial Accounting Standards No. 123, Accounting for Stock-based Compensation (‘‘FAS 123’’). Under the intrinsic value method, no stock-based compensation expense was recognized in the Company’s Consolidated Statements of Income for stock options because the exercise price of the Company’s stock options granted to employees and directors equaled the fair market value of the underlying stock at the date of grant.
Stock-based compensation expense recognized in the Company’s Consolidated Statements of Income for the twelve months ended December 31, 2006 included compensation expense for share-based payment awards granted prior to, but not yet vested as of December 31, 2005, based on the grant date fair value estimated in accordance with the pro forma provisions of FAS 123 and compensation expense for the share-based payment awards granted subsequent to December 31, 2005, based on the grant date fair value estimated in accordance with the provisions of FAS 123(R). As stock-based compensation expense recognized in the Consolidated Statements of Income for the year ended December 31, 2006 is based on awards ultimately expected to vest, the amounts have been reduced for estimated forfeitures. FAS 123(R) requires forfeitures to be estimated at the time of grant and revised, if necessary, in subsequent periods if actual forfeitures differ from those estimates. Forfeitures were estimated based on historical experience.
The Company’s determination of fair value of share-based payment awards on the date of grant using an option-pricing model is affected by the Company’s stock price as well as assumptions regarding a number of highly complex and subjective variables. These variables include, but are not limited to, the Company’s expected stock price volatility over the term of the awards, and actual and projected employee stock option exercise behaviors.
52
STRAYER EDUCATION, INC.
NOTES TO CONSOLIDATED FINANCIAL STATEMENTS (Continued)
No stock options were granted in 2006. For the years ended December 31, 2004 and 2005, the Black-Scholes option pricing model was used to estimate fair value as of the date of grant using the following assumptions:
| | | | | | | | | | | | |
| | | | For the year ended
December 31, |
| | | | 2004 | | | 2005 |
| Dividend yield(1) | | | | | 0.24 | | | | | | 0.48 | |
| Expected volatility(2) | | | | | 34 | | | | | | 34 | |
| Risk-free interest rate(3) | | | | | 3.8 | | | | | | 3.9 | |
| Expected option term (in years)(4) | | | | | 6.1 | | | | | | 6.1 | |
| Weighted average fair value of options granted | | | | $ | 45.27 | | | | | $ | 39.61 | |
|
| |
| (1) | The dividend yield assumption is based on the Company’s history and expectation of dividend payouts. |
| |
| (2) | The Company analyzed historical volatility of the Company’s stock to estimate the expected volatility. |
| |
| (3) | The risk-free interest rate assumption is based on observed interest rates appropriate for the term of the Company’s employee stock options. |
| |
| (4) | The expected option term was determined using the simplified method for estimating expected option life. |
Net Income Per Share
Basic earnings per share is computed by dividing net income available to common stockholders by the weighted average number of shares of common stock outstanding during the periods. Diluted earnings per share reflects the potential dilution that could occur assuming conversion or exercise of all dilutive unexercised stock options and restricted stock. The dilutive effect of stock options was determined using the treasury stock method. Under the treasury stock method, the proceeds received from the exercise of stock options, the amount of compensation cost for future service not yet recognized by the Company and the amount of tax benefits that would be recorded in additional paid in capital when the stock options become deductible for income tax purposes are assumed to be used to repurchase shares of the Company’s common stock. Stock options are not included in the computation of diluted earnings per share when the stock option exercise price of an individual grant exceeds the average market price for the period. At December 31, 2006, the Company had 10,000 issued and outstanding stock options that were excluded from the calculation. A reconciliation of shares used to calculate basic and diluted earnings per share is as follows (in thousands):
| | | | | | | | | | | | | | | | | | |
| | | | 2004 | | | 2005 | | | 2006 |
| Weighted average shares outstanding used to compute basic earnings per share | | | | | 13,674 | | | | | | 14,472 | | | | | | 14,187 | |
Incremental shares issuable upon the assumed conversion of
Series A Convertible Redeemable Preferred Stock | | | | | 1,047 | | | | | | — | | | | | | — | |
| Incremental shares issuable upon the assumed exercise of stock options | | | | | 336 | | | | | | 269 | | | | | | 282 | |
| Unvested restricted stock | | | | | — | | | | | | — | | | | | | 23 | |
| Shares used to compute diluted earnings per share | | | | | 15,057 | | | | | | 14,741 | | | | | | 14,492 | |
|
Use of Estimates
The preparation of financial statements in conformity with accounting principles generally accepted in the United States of America requires management to make estimates and assumptions that affect the reported amounts of assets and liabilities at the date of the financial statements and the reported amounts of expenses during the period reported. The most significant management estimates included allowances for uncollectible accounts, accrued expenses, forfeiture rates for stock-based awards, and the provision for income taxes. Actual results could differ from those estimates.
53
STRAYER EDUCATION, INC.
NOTES TO CONSOLIDATED FINANCIAL STATEMENTS (Continued)
Comprehensive Income
Comprehensive income consists of net income and unrealized gains (losses) on investments in marketable securities, net of income taxes.
Recent Accounting Pronouncements
In May 2005, the FASB issued Statement of Financial Accounting Standards No. 154, Accounting Changes and Error Corrections – a replacement of APB Opinion No. 20 and FASB Statement No. 3 (‘‘SFAS 154’’). SFAS 154 requires retrospective application to prior periods’ financial statements of changes in accounting principle, unless it is impracticable to determine either the period-specific effects or the cumulative effect of the change. SFAS 154 also requires that retrospective application of a change in accounting principle be limited to the direct effects of the change. Indirect effects of a change in accounting principle should be recognized in the period of the accounting change. SFAS 154 also requires that a change in depreciation, amortization, or depletion method for long-lived, nonfinancial assets be accounted for as a change in accounting estimate effected by a change in accounting principle. SFAS 154 is effective for accounting changes and corrections of errors made in fiscal years beginning after December 15, 2005. The Company adopted SFAS 154 beginning in the first quarter of 2006.
In July 2006, the Financial Accounting Standards Board issued FASB Interpretation No. 48, Accounting for Uncertainty in Income Taxes (‘‘FIN 48’’). This Interpretation prescribes a recognition threshold and measurement attribute for the financial statement recognition and measurement of a tax position taken or expected to be taken in a tax and penalties, accounting in interim periods, disclosure, and transition. The Interpretation is effective for fiscal years beginning after December 15, 2006. The Company adopted FIN 48 beginning in the first quarter of 2007. The adoption of FIN 48 is not expected to have a material impact on its financial condition and results of operations.
In September 2006, the FASB issued Statement of Financial Accounting Standards No. 157 (‘‘SFAS 157’’), Fair Value Measurements, which defines fair value, establishes guidelines for measuring fair value and expands disclosures regarding fair value measurements. SFAS 157 does not require any new fair value measurements but rather eliminates inconsistencies in guidance found in various prior accounting pronouncements. SFAS 157 is effective for fiscal years beginning after November 15, 2007. Earlier adoption is permitted, provided that the company has not yet issued financial statements, including for interim periods, for that fiscal year. We are currently evaluating the impact of SFAS 157, but do not expect the adoption of SFAS 157 to have a material impact on our consolidated financial position, results of operations or cash flows.
3. Investments – Marketable Securities
The cost and fair value for investments in marketable securities as of December 31, 2005 and 2006 are as follows (in thousands):
| | | | | | | | | | | | |
| | | | 2005 | | | 2006 |
| Cost | | | | $ | 46,000 | | | | | $ | 76,000 | |
| Gross unrealized loss | | | | | (406 | | | | | | (237 | |
| Fair value | | | | $ | 45,594 | | | | | $ | 75,763 | |
|
The Company has invested some of its excess cash in a diversified, no load, short-term, investment grade, tax-exempt bond fund. At December 31, 2006, the 429 issues in this fund had an average credit rating of AA, an average maturity and an average duration of 1.2 years, and an average yield to maturity of 3.8%.
54
STRAYER EDUCATION, INC.
NOTES TO CONSOLIDATED FINANCIAL STATEMENTS (Continued)
4. Property and Equipment
The composition of property and equipment as of December 31, 2005 and 2006 is as follows (in thousands):
| | | | | | | | | | | | | | | | | | |
| | | | 2005 | | | 2006 | | | Estimated useful life
(years) |
| Land | | | | $ | 6,526 | | | | | $ | 6,526 | | | | | | — | |
| Buildings and improvements | | | | | 19,399 | | | | | | 20,181 | | | | | | 5-40 | |
| Furniture and equipment | | | | | 29,467 | | | | | | 37,377 | | | | | | 5-7 | |
| Leasehold improvements | | | | | 13,528 | | | | | | 16,785 | | | | | | 3-10 | |
| Vehicles | | | | | 22 | | | | | | 22 | | | | | | 5 | |
| Construction in progress | | | | | 98 | | | | | | 807 | | | | | | — | |
| | | | | | 69,040 | | | | | | 81,698 | | | | | | | |
| Accumulated depreciation and amortization | | | | | (22,356 | | | | | | (28,950 | | | | | | | |
| | | | | $ | 46,684 | | | | | $ | 52,748 | | | | | | | |
|
In 2005 and 2006, the Company recorded leasehold improvements of $1,542,000 and $1,235,000, respectively, which were reimbursed by lessors as lease incentives. In 2006, the Company wrote-off $0.5 million in fixed assets that were fully depreciated and no longer in service.
5. Restricted Cash
In 2003, as part of commencing operations in Pennsylvania, the Company was required to maintain a ‘‘minimum protective endowment’’ of at least $500,000. These funds are required as long as the Company operates its campuses in the state. The Company accounts for these funds as a long-term asset.
6. Stock Options and Restricted Stock
In July 1996, the Company’s stockholders approved 1,500,000 shares of common stock for grants under the Company’s 1996 Stock Option Plan (as amended, the ‘‘Plan’’). This Plan was amended by the stockholders at the May 2001 Annual Stockholders’ Meeting and at the May 2005 Annual Stockholders’ Meeting to increase the number of shares authorized for issuance thereunder by 1,000,000 and 500,000, respectively. A total of 3,000,000 shares have therefore been approved for grant under the Plan. The Plan was again amended at the May 2006 Annual Stockholders’ Meeting to authorize a one-time exchange of stock options for restricted stock by employees (excluding the five highest compensated executive officers) and to permit restricted stock and cash awards to qualify for favorable tax treatment under Section 162(m) of the Internal Revenue Code. The Plan provides for the grant of options intended to qualify as incentive stock options, and also provides for the grant of non-qualifying options and restricted stock to employees, officers and directors of the Company. Options and restricted stock may be granted to eligible employees, officers or directors of the Company at the discretion of the Board of Directors. Vesting provisions are also at the discretion of the Board of Directors. Options may be granted at option prices based at or above the fair market value of the shares at the date of grant. The maximum term of the options granted under the Plan is ten years.
In February 2006, the Company granted 19,500 shares of restricted stock to several employees. These shares vest 100% on February 14, 2010. The Company’s stock price closed at $91.27 on the date of the restricted stock grant.
In February 2006, the Company’s Board of Directors approved cash payments to the holders of vested stock options in an amount equivalent to the Company’s common stock dividend. These cash payments are to be remitted on the same dates as the Company’s dividends and amounted to $0.6 million in 2006.
55
STRAYER EDUCATION, INC.
NOTES TO CONSOLIDATED FINANCIAL STATEMENTS (Continued)
In February 2006, the Company’s Board of Directors approved a grant of 131,478 shares of restricted stock to the Chairman and Chief Executive Officer. These shares vest 100% on December 1, 2008 based on the achievement of certain performance criteria. The performance criteria categories contained in the grant are covered by the May 2006 amendment to the Plan, so that this restricted stock grant is eligible for favorable tax treatment by the Company under Section 162(m) of the Internal Revenue Code. Expensing of these shares commenced following stockholder approval of this Plan amendment on May 3, 2006. The Company’s stock price closed at $103.60 on that date.
In the second quarter of 2006, the Company granted 32,765 shares of restricted stock to employees in exchange for 105,000 stock options pursuant to the one-time exchange offer approved by the shareholders. Of the 11 eligible employees, 10 chose to participate in the offer. The incremental stock-based compensation expense incurred by the Company as a result of this offer was immaterial. The Company’s stock price closed at $103.60 on the date that the exchange offer was approved by the shareholders and priced.
In May 2006, the Company’s Board of Directors granted 4,632 shares of restricted stock to various members of the Board of Directors. These shares vest equally over a three year period. The Company’s stock price closed at $103.60 on the date of the restricted stock grant.
In July 2006, the Company’s Board of Directors approved a grant of 20,192 shares of restricted stock to the Company’s newly appointed President and Chief Operating Officer. These shares vest 100% on July 25, 2010 based on the achievement of certain performance criteria. The performance criteria categories contained in the grant are covered by the May 2006 amendment to the Plan, so that this restricted stock grant is eligible for favorable tax treatment by the Company under Section 162(m) of the Internal Revenue Code. The Company’s stock price closed at $99.05 on the date of the restricted stock grant.
Stock Options
All stock options granted after 2000 vest over three to four years with exercise prices ranging from $33.69 to $119.72. These options expire within six to eight years from date of grant and had a weighted-average contractual life of 2.6 years as of December 31, 2006.
56
STRAYER EDUCATION, INC.
NOTES TO CONSOLIDATED FINANCIAL STATEMENTS (Continued)
The table below sets forth the stock option activity for the years ended December 31, 2004, 2005 and 2006 and other stock option information at December 31, 2006:
| | | | | | | | | | | | | | | | | | | | | | | | |
| | | | Number of
shares | | | Weighted-average
exercise price | | | Weighted-
average
remaining
contractual
life (yrs.) | | | Aggregate
intrinsic value(1)
(in thousands) |
| Balance, December 31, 2003 | | | | | 1,131,667 | | | | | $ | 41.05 | | | | | | | | | | | | | |
| Grants | | | | | 85,000 | | | | | | 113.54 | | | | | | | | | | | | | |
| Exercises | | | | | (335,416 | | | | | | 35.62 | | | | | | | | | | | | | |
| Forfeitures | | | | | (26,667 | | | | | | 78.40 | | | | | | | | | | | | | |
| Balance, December 31, 2004 | | | | | 854,584 | | | | | $ | 49.22 | | | | | | 3.7 | | | | | | 52,277 | |
| Grants | | | | | 277,083 | | | | | | 103.04 | | | | | | | | | | | | | |
| Exercises | | | | | (28,333 | | | | | | 47.18 | | | | | | | | | | | | | |
| Forfeitures | | | | | — | | | | | | — | | | | | | | | | | | | | |
| Balance, December 31, 2005 | | | | | 1,103,334 | | | | | $ | 62.79 | | | | | | 3.6 | | | | | | 38,620 | |
| Grants | | | | | — | | | | | | — | | | | | | | | | | | | | |
| Exercises | | | | | (149,334 | | | | | | 44.17 | | | | | | | | | | | | | |
| Forfeitures/Exchanges | | | | | (191,666 | | | | | | 102.64 | | | | | | | | | | | | | |
| Balance, December 31, 2006 | | | | | 762,334 | | | | | $ | 56.42 | | | | | | 2.6 | | | | | $ | 37,338 | |
| Vested, December 31, 2006 | | | | | 561,917 | | | | | $ | 41.88 | | | | | | 1.5 | | | | | $ | 36,058 | |
| Exercisable, December 31, 2006 | | | | | 561,917 | | | | | $ | 41.88 | | | | | | 1.5 | | | | | $ | 36,058 | |
|
| |
| (1) | The aggregate intrinsic value in the table above represents the total pre-tax intrinsic value (the difference between the Company’s closing stock price on December 31 of each year and the exercise price, multiplied by the number of in-the-money options) that would have been received by the option holders had all option holders exercised their options on December 31 of that year. The amount of aggregate intrinsic value will change based on the fair market value of our stock. |
The number of shares exercisable as of December 31, 2004, 2005 and 2006 are as follows:
| | | | | | | | | | | | |
| | | | Number of shares | | | Weighted-average
exercise price |
| Exercisable, December 31, 2004 | | | | | 536,248 | | | | | $ | 39.04 | |
| Exercisable, December 31, 2005 | | | | | 621,247 | | | | | $ | 40.86 | |
| Exercisable, December 31, 2006 | | | | | 561,917 | | | | | $ | 41.88 | |
|
The following table summarizes information regarding stock option exercises for the years ended December 31, 2004, 2005 and 2006 (in thousands):
| | | | | | | | | | | | | | | | | | |
| | | | For the year ended
December 31, |
| | | | 2004 | | | 2005 | | | 2006 |
| Proceeds from stock options exercised | | | | $ | 11,948 | | | | | $ | 1,336 | | | | | $ | 6,595 | |
| Tax benefits related to stock options exercised | | | | $ | 9,758 | | | | | $ | 560 | | | | | $ | 3,595 | |
| Intrinsic value of stock options exercised(1) | | | | $ | 26,135 | | | | | $ | 1,434 | | | | | $ | 9,225 | |
|
| |
| (1) | Intrinsic value of stock options exercised is estimated by taking the difference between the Company’s closing stock price on the date of exercise and the exercise price, multiplied by the number of options exercised for each option holder and then aggregated. |
57
STRAYER EDUCATION, INC.
NOTES TO CONSOLIDATED FINANCIAL STATEMENTS (Continued)
The following table summarizes information about the stock options to purchase the Company’s common stock at December 31, 2006:
| | | | | | | | | | | | | | | | | | | | | | | | | | | | | | |
| | | | Options Outstanding | | | Options Exercisable |
| Range of exercise prices | | | Number
outstanding
at 12/31/06 | | | Weighted-
average
remaining
contractual
life (yrs.) | | | Weighted-
average
exercise price | | | Number
exercisable at
12/31/06 | | | Weighted-
average
exercise price |
| $33.69 – 67.84 | | | | | 601,917 | | | | | | 1.7 | | | | | $ | 42.66 | | | | | | 561,917 | | | | | $ | 41.88 | |
| $107.28 – 107.28 | | | | | 150,417 | | | | | | 6.1 | | | | | $ | 107.28 | | | | | | — | | | | | | — | |
| $119.72 – 119.72 | | | | | 10,000 | | | | | | 5.4 | | | | | $ | 119.72 | | | | | | — | | | | | | — | |
| $33.69 – 119.72 | | | | | 762,334 | | | | | | 2.6 | | | | | $ | 56.42 | | | | | | 561,917 | | | | | $ | 41.88 | |
|
Restricted Stock
The table below sets forth the restricted stock activity for the years ended December 31, 2005 and 2006:
| | | | | | | | | | | | |
| | | | Number of
shares | | | Weighted-average
grant price |
| Balance, December 31, 2004 | | | | | — | | | | | | — | |
| Grants | | | | | 4,500 | | | | | $ | 100.58 | |
| Vested shares | | | | | — | | | | | | — | |
| Forfeitures | | | | | — | | | | | | — | |
| Balance, December 31, 2005 | | | | | 4,500 | | | | | $ | 100.58 | |
| Grants | | | | | 208,567 | | | | | | 102.01 | |
| Vested shares | | | | | — | | | | | | — | |
| Forfeitures | | | | | (7,500 | | | | | | 91.27 | |
| Balance, December 30, 2006 | | | | | 205,567 | | | | | $ | 102.37 | |
|
Valuation and Expense Information Under FAS 123(R) and Pro forma Information Under FAS 123 for Periods Prior to January 1, 2006.
At December 31, 2006, total stock-based compensation cost which has not yet been recognized was $18.5 million, representing $15.1 million for unvested restricted stock and $3.4 million for unvested stock options. This cost is expected to be recognized over the next 43 months on a weighted-average basis.
For the years ended December 31, 2004 and 2005, had compensation expense been determined based on the fair value of the options at grant dates computed in accordance with FAS 123, the pro forma amounts would be as follows (in thousands except per share data):
58
STRAYER EDUCATION, INC.
NOTES TO CONSOLIDATED FINANCIAL STATEMENTS (Continued)
| | | | | | | | | | | | |
| | | | For the year ended
December 31, |
| | | | 2004 | | | 2005 |
| (Pro forma) | | | (Pro forma) |
| Net income | | | | $ | 41,240 | | | | | $ | 48,065 | |
| Stock-based compensation expense, net of tax | | | | | 2,821 | | | | | | 3,383 | |
| Pro forma net income | | | | $ | 38,419 | | | | | $ | 44,682 | |
| Net income per share: | | | | | | | | | | | | |
| As reported: | | | | | | | | | | | | |
| Basic | | | | $ | 2.91 | | | | | $ | 3.32 | |
| Diluted | | | | | 2.74 | | | | | | 3.26 | |
| Pro forma | | | | | | | | | | | | |
| Basic | | | | $ | 2.71 | | | | | $ | 3.09 | |
| Diluted | | | | | 2.55 | | | | | | 3.02 | |
|
The following table summarizes the pro forma stock-based compensation expense related to employee stock options under FAS 123 for the years ended December 31, 2004 and 2005. The table also includes the actual stock-based compensation expense recorded for the year ended December 31, 2006 by expense line item (in thousands):
| | | | | | | | | | | | | | | | | | |
| | | | For the year ended December 31, |
| | | | 2004
(Pro forma) | | | 2005
(Pro forma) | | | Actual
2006 |
| Instruction and educational support | | | | $ | 726 | | | | | $ | 821 | | | | | $ | 638 | |
| Selling and promotion | | | | | 188 | | | | | | 547 | | | | | | 545 | |
| General and administration | | | | | 3,675 | | | | | | 4,106 | | | | | | 6,866 | |
| Stock-based compensation expense included in operating expense | | | | | 4,589 | | | | | | 5,474 | | | | | | 8,049 | |
| Tax benefit | | | | | 1,768 | | | | | | 2,091 | | | | | | 2,992 | |
| Stock-based compensation expense, net of tax | | | | $ | 2,821 | | | | | $ | 3,383 | | | | | $ | 5,057 | |
|
7. Series A Convertible Mandatorily Redeemable Preferred Stock
A total of 6,000,000 shares of Series A Convertible Redeemable Preferred Stock, par value $.01, have been authorized. In May 2001, the Company underwent a $150 million recapitalization and change of control transaction in which it issued 5,769,231 shares of its Series A Convertible Mandatorily Redeemable Preferred Stock (the ‘‘Series A Convertible Redeemable Preferred Stock’’) of the Company to an investor group consisting of New Mountain Partners, L.P. and MidOcean Capital Investors, L.P. (formerly DB Capital Partners, Inc.) (collectively, the ‘‘Original Investors’’). The Series A Convertible Redeemable Preferred Stock had an effective dividend yield of 5.43% and each share of Series A Convertible Redeemable Preferred Stock was convertible into one share common stock, subject to adjustment under certain circumstances. The Company used the $150 million, together with approximately $36.4 million of its cash and marketable securities, to repurchase 7,175,000 shares of outstanding common stock of the Company in a tender offer at $25.00 per share open to all shareholders; as the Company’s shares had traded above $25.00 per share, only the Company’s then CEO and majority stockholder tendered shares. In March 2004, 3.1 million outstanding and accrued shares of the Series A Convertible Redeemable Preferred Stock were converted into shares of common stock on a one for one basis and sold in a secondary public offering. The Company received no proceeds from such offering other than $4.2 million associated with certain management option exercises in connection with the secondary offering. In June 2004, the remaining 875,120 outstanding and accrued shares of Series A Convertible Redeemable Preferred Stock were
59
STRAYER EDUCATION, INC.
NOTES TO CONSOLIDATED FINANCIAL STATEMENTS (Continued)
called for redemption by the Company and in lieu of being redeemed for cash, were converted by the holders into 875,120 common shares in accordance with the terms of the Series A shares. As a result, the Company does not have any preferred shares outstanding.
8. Long-Term Liabilities
Lease Incentives
In conjunction with the opening of new campuses during 2005 and 2006, the Company recorded reimbursements by the lessors for improvements made to the leased properties in the amount of $1.5 million and $1.2 million, respectively. In accordance with Financial Accounting Standards Board Technical Bulletin No. 88-1, these reimbursements were capitalized as leasehold improvements and a long-term liability established. The leasehold improvements and the long-term liability will be amortized on a straight-line basis over the corresponding lease terms, which range from five to 10 years. As of December 31, 2005 and 2006, the Company had deferred lease incentives of $3.5 million and $3.9 million, respectively.
Lease Obligations
In accordance with the FASB Technical Bulletin No. 85-3, ‘‘Accounting for Operating Leases with Schedule Rent Increases,’’ the Company records rent expense on a straight-line basis over the initial term of a lease. The difference between the rent payment and the straight-line rent expense is recorded as a long-term liability. As of December 31, 2005 and 2006, the Company had lease obligations of $2.8 million and $3.8 million, respectively.
9. Other Employee Benefit Plans
The Company has a 401(k) plan covering all eligible employees of the Company. Participants may contribute up to $15,500 (effective January 1, 2007) of their base compensation. Employee contributions are voluntary. Discretionary contributions were made by the Company, matching up to 3% of annual wages contributed to the plan in 2006 and 2005 and up to 2% in 2004. The Company’s contributions totaled $400,000, $660,000 and $744,000 for the years ended December 31, 2004, 2005 and 2006, respectively.
In May 1998, the Company adopted the Strayer Education, Inc. Employee Stock Purchase Plan (‘‘ESPP’’). Under the ESPP, eligible employees may purchase shares of the Company’s common stock, subject to certain limitations, at 90 percent of its market value at the date of purchase. Purchases are limited to 10 percent of an employee’s eligible compensation. The aggregate number of shares of common stock that may be made available for purchase by participating employees under the ESPP is 2,500,000 shares. Shares purchased in the open market for employees for the years ended December 31, 2004, 2005 and 2006 were as follows:
| | | | | | | | | | | | |
| | | | Shares purchased | | | Average price
per share |
| 2004 | | | | | 4,186 | | | | | $ | 98.78 | |
| 2005 | | | | | 4,758 | | | | | $ | 89.17 | |
| 2006 | | | | | 4,767 | | | | | $ | 91.33 | |
|
10. Stock Repurchase Plan
As announced on November 3, 2003, the Company’s Board of Directors initially authorized the Company to repurchase up to an aggregate of $15 million in value of common stock through December 31, 2004 in open market purchases from time to time at the discretion of the Company’s management depending on market conditions and other corporate considerations. The authorization
60
STRAYER EDUCATION, INC.
NOTES TO CONSOLIDATED FINANCIAL STATEMENTS (Continued)
was increased by an additional $25 million in May 2004, an additional $25 million in October 2004, an additional $25 million in July 2005, an additional $20 million in October 2005, and an additional $35 million in October 2006. Accordingly, a total of $145 million has been authorized by the Company’s Board of Directors for share repurchase. All of the Company’s share repurchases were effected in compliance with Rule 10b-18 under the Securities Exchange Act of 1934, as amended. This stock repurchase plan may be modified, suspended or terminated at any time by the Company without notice.
A summary of the Company’s stock repurchase activity for the years ended December 31, 2004, 2005 and 2006, all of which was part of a publicly announced plan, is set forth in the table below:
| | | | | | | | | | | | | | | | | | |
| | | | Number of shares
repurchased | | | Average price paid
per share | | | Amount available for
future repurchases
($mil.) |
| 2004 | | | | | 346,444 | | | | | $ | 106.13 | | | | | | | |
| 2005 | | | | | 410,071 | | | | | $ | 92.59 | | | | | | | |
| 2006 | | | | | 349,066 | | | | | $ | 100.39 | | | | | | | |
| | | | | | 1,105,581 | | | | | $ | 99.29 | | | | | $ | 32.0 | |
|
11.�� Commitments and Contingencies
The University participates in various federal student financial assistance programs which are subject to audit. Management believes that the potential effects of audit adjustments, if any, for the periods currently under audit will not have a material adverse effect on the Company’s financial position, results of operations or cash flows.
As of December 31, 2006, the Company had 46 long-term operating leases for campuses and other administrative locations. Rent expense was $8,645,000, $10,509,000 and $12,828,000 for the years ended December 31, 2004, 2005 and 2006, respectively. The Company had one lease with affiliates of the Company’s former CEO and majority stockholder. This lease expired in 2006; however, the Company’s former CEO and majority stockholder sold his interest in this building in February 2005. Rent paid to entities affiliated with the Company’s former CEO and majority stockholder were $356,000 and $45,000 and for the years ended December 31, 2004 and 2005, respectively.
The rents on the Company’s leases are subject to annual increases. The minimum rental commitments for the Company as of December 31, 2006, are as follows (in thousands):
| | | | | | |
| | | | Minimum
rental
commitments |
| 2007 | | | | | 13,941 | |
| 2008 | | | | | 14,557 | |
| 2009 | | | | | 14,827 | |
| 2010 | | | | | 14,236 | |
| 2011 | | | | | 12,368 | |
| Thereafter | | | | | 39,298 | |
| Total | | | | $ | 109,227 | |
|
In addition, the Company has available two $10 million credit facilities from two banks. Interest on any borrowings under either facility will accrue at an annual rate not to exceed 0.75% above the London Interbank Offered Rate. The Company does not pay a fee for these facilities. There have been no borrowings by the Company under these credit facilities. An unsecured letter of credit in the amount of $938,000, which expires in July 2007, was issued by Strayer University in favor of regulators in connection with their periodic approval activities.
61
STRAYER EDUCATION, INC.
NOTES TO CONSOLIDATED FINANCIAL STATEMENTS (Continued)
12. Income Taxes
The income tax provision for the years ended December 31, 2004, 2005 and 2006 is summarized below (in thousands):
| | | | | | | | | | | | | | | | | | |
| | | | 2004 | | | 2005 | | | 2006 |
| Current: | | | | | | | | | | | | | | | | | | |
| Federal | | | | $ | 21,184 | | | | | $ | 25,502 | | | | | $ | 29,486 | |
| State | | | | | 4,024 | | | | | | 5,421 | | | | | | 6,319 | |
| Total current | | | | | 25,208 | | | | | | 30,923 | | | | | | 35,805 | |
| Deferred: | | | | | | | | | | | | | | | | | | |
| Federal | | | | | 561 | | | | | | (798 | | | | | | (3,680 | |
| State | | | | | 69 | | | | | | (344 | | | | | | (354 | |
| Total deferred | | | | | 630 | | | | | | (1,142 | | | | | | (4,034 | |
| Total provision for income taxes | | | | $ | 25,838 | | | | | $ | 29,781 | | | | | $ | 31,771 | |
|
The tax effects of the principal temporary differences that give rise to the Company’s deferred tax assets (liabilities) are as follows as of December 31, 2005 and 2006 (in thousands):
| | | | | | | | | | | | |
| | | | 2005 | | | 2006 |
| Tuition receivable and student loans | | | | $ | 798 | | | | | $ | 1,192 | |
| Accrued vacation payable | | | | | 118 | | | | | | 151 | |
| Unrealized losses on marketable securities | | | | | 159 | | | | | | 93 | |
| Current net deferred tax asset | | | | | 1,075 | | | | | | 1,436 | |
| Student loans | | | | | 2 | | | | | | 1 | |
| Property and equipment | | | | | (1,322 | | | | | | (1,012 | |
| Deferred leasing costs | | | | | 1,096 | | | | | | 1,503 | |
| Stock-based compensation | | | | | 19 | | | | | | 2,908 | |
| Long-term net deferred tax asset (liability) | | | | | (205 | | | | | | 3,400 | |
| Net deferred tax asset | | | | $ | 870 | | | | | $ | 4,836 | |
|
A reconciliation between the Company’s statutory tax rate and the effective tax rate for the years ended December 31, 2004, 2005 and 2006 is as follows:
| | | | | | | | | | | | | | | | | | |
| | | | 2004 | | | 2005 | | | 2006 |
| Statutory federal rate | | | | | 35.0 | | | | | | 35.0 | | | | | | 35.0 | |
| State income taxes, net of federal benefits | | | | | 4.3 | | | | | | 4.4 | | | | | | 4.9 | |
| Non-taxable interest income | | | | | (0.8 | | | | | | (1.3 | | | | | | (1.8 | |
| Other | | | | | — | | | | | | 0.2 | | | | | | (0.3 | |
| Effective tax rate | | | | | 38.5 | | | | | | 38.3 | | | | | | 37.8 | |
|
Cash payments for income taxes were $12.3 million in 2004, $32.6 million in 2005, and $31.0 million in 2006.
62
STRAYER EDUCATION, INC.
NOTES TO CONSOLIDATED FINANCIAL STATEMENTS (Continued)
13. Summarized Quarterly Financial Data (Unaudited)
Quarterly financial information for 2005 and 2006 is as follows (in thousands except per share data):
| | | | | | | | | | | | | | | | | | | | | | | | |
| | | | Quarter |
| | | | First | | | Second | | | Third | | | Fourth |
| 2005 | | | | | | | | | | | | |
| Revenues | | | | $ | 56,153 | | | | | $ | 55,249 | | | | | $ | 47,087 | | | | | $ | 62,018 | |
| Income from operations | | | | | 22,488 | | | | | | 19,492 | | | | | | 9,572 | | | | | | 23,312 | |
| Net income | | | | | 14,091 | | | | | | 12,525 | | | | | | 6,438 | | | | | | 15,011 | |
| Net income per share: | | | | | | | | | | | | | | | | | | | | | | | | |
| Basic | | | | $ | 0.96 | | | | | $ | 0.86 | | | | | $ | 0.45 | | | | | $ | 1.05 | |
| Diluted | | | | $ | 0.94 | | | | | $ | 0.85 | | | | | $ | 0.44 | | | | | $ | 1.03 | |
|
| | | | | | | | | | | | | | | | | | | | | | | | |
| | | | Quarter |
| | | | First | | | Second | | | Third | | | Fourth |
| 2006 | | | | | | | | | | | | |
| Revenues | | | | $ | 67,090 | | | | | $ | 65,558 | | | | | $ | 56,693 | | | | | $ | 74,307 | |
| Income from operations | | | | | 24,986 | | | | | | 21,473 | | | | | | 8,998 | | | | | | 24,079 | |
| Net income | | | | | 15,956 | | | | | | 14,018 | | | | | | 6,336 | | | | | | 15,997 | |
| Net income per share: | | | | | | | | | | | | | | | | | | | | | | | | |
| Basic | | | | $ | 1.12 | | | | | $ | 0.99 | | | | | $ | 0.45 | | | | | $ | 1.13 | |
| Diluted | | | | $ | 1.10 | | | | | $ | 0.97 | | | | | $ | 0.44 | | | | | $ | 1.11 | |
|
63
Table of ContentsSTRAYER EDUCATION, INC.
Schedule II – Valuation and Qualifying Accounts
(in thousands)
| | | | | | | | | | | | | | | | | | | | | | | | | | | |
| Description | | | Balance
beginning of
period | | | Additions
charged to
expense | | | Deductions | | | Balance
end of
period | | | Bad debt
expense as
a % of
revenue |
| Deduction from asset account: | | | | | | | | | | | | | | | | | | | | | | | | | | | |
| Allowance for doubtful accounts: | | | | | | | | | | | | | | | | | | | | | | | | | | | |
| Year ended December 31, 2006 | | | | $ | 1,927 | | | | | $ | 7,776 | | | | | $ | (6,674 | | | | | $ | 3,029 | | | | 2.9% |
| Year ended December 31, 2005 | | | | | 1,301 | | | | | | 5,499 | | | | | | (4,873 | | | | | | 1,927 | | | | 2.5% |
| Year ended December 31, 2004 | | | | | 785 | | | | | | 4,208 | | | | | | (3,692 | | | | | | 1,301 | | | | 2.3% |
|
Item 9. Changes in and Disagreements With Accountants on Accounting and Financial Disclosure
None.
Item 9A. Controls and Procedures
The Company’s Chief Executive Officer and Chief Financial Officer have evaluated the effectiveness of the Company’s disclosure controls and procedures as of December 31, 2006. Based upon such review, the Chief Executive Officer and Chief Financial Officer have concluded that the Company had in place, as of December 31, 2006, effective controls and procedures designed to ensure that information required to be disclosed by the Company (including consolidated subsidiaries) in the reports it files or submits under the Securities Exchange Act of 1934, as amended, and the rules thereunder, is recorded, processed, summarized and reported within the time periods specified in the Commission’s rules and forms. Disclosure controls and procedures include, without limitation, controls and procedures designed to ensure that information required to be disclosed by an issuer in reports it files or submits under the Securities Exchange Act is accumulated and communicated to the Company’s management, including its principal executive officer or officers and principal financial officer or officers, or persons performing similar functions, as appropriate to allow timely decisions regarding required disclosure.
Management’s Report on Internal Control Over Financial Reporting
The Company’s management is responsible for establishing and maintaining adequate internal control over financial reporting, as such term is defined in Exchange Act Rule 13a-15(f). A company’s internal control over financial reporting is a process designed to provide reasonable assurance regarding the reliability of financial reporting and the preparation of financial statements for external purposes in accordance with generally accepted accounting principles. A company’s internal control over financial reporting includes those policies and procedures that (i) pertain to the maintenance of records that, in reasonable detail, accurately and fairly reflect the transactions and dispositions of the assets of the company; (ii) provide reasonable assurance that transactions are recorded as necessary to permit preparation of financial statements in accordance with generally accepted accounting principles, and that receipts and expenditures are being made only in accordance with authorizations of management and directors of the company; and (iii) provide reasonable assurance regarding prevention or timely detection of unauthorized acquisition, use or disposition of the company’s assets that could have a material effect on the financial statements.
Because of its inherent limitations, internal control over financial reporting may not prevent or detect misstatements. Also, projections of any evaluation of effectiveness to future periods are subject to the risk that controls may become inadequate because of changes in conditions, or that the degree of compliance with the policies or procedures may deteriorate.
Under the supervision and with the participation of the Company’s principal executive officer and principal financial officer, the Company’s management assessed the effectiveness of the registrant’s internal control over financial reporting, as of December 31, 2006 based on the framework in Internal
64
Table of ContentsControl – Integrated Framework issued by the Committee of Sponsoring Organizations of the Treadway Commission. Based on our assessment under the framework in Internal Control – Integrated Framework, our management concluded that our internal control over financial reporting was effective as of December 31, 2006.
Our management’s assessment of the effectiveness of the Company’s internal control over financial reporting as of December 31, 2006 has been audited by PricewaterhouseCoopers LLP, an independent registered public accounting firm, as stated in their report which appears herein.
Changes in Internal Controls over Financial Reporting
The Company’s Chief Executive Officer and Chief Financial Officer have evaluated any changes in the Company’s internal control over financial reporting that occurred during the quarter ended December 31, 2006, and have concluded that there was no change during such quarter that has materially affected, or is reasonably likely to materially affect, the Company’s internal control over financial reporting.
Item 9B. Other Information
None.
65
Table of ContentsPART III
Item 10. Directors and Executive Officers
The following table sets forth certain information with respect to the Company’s directors and executive officers.
| | | | | | | | | |
| Name | | | Age | | | Position |
| Directors: | | | | | | | | | |
| Robert S. Silberman | | | | | 49 | | | | Chairman of the Board and Chief Executive Officer |
| Dr. Charlotte F. Beason | | | | | 59 | | | | Director |
| William E. Brock | | | | | 76 | | | | Director |
| David A. Coulter | | | | | 59 | | | | Director |
| Gary Gensler | | | | | 49 | | | | Director |
| Robert R. Grusky | | | | | 49 | | | | Director |
| Robert L. Johnson | | | | | 60 | | | | Director |
| Todd A. Milano | | | | | 54 | | | | Director |
| G. Thomas Waite, III | | | | | 55 | | | | Director |
| J. David Wargo | | | | | 53 | | | | Director |
| Executive Officers: | | | | | | | | | |
| Karl McDonnell | | | | | 40 | | | | President and Chief Operating Officer |
| Mark C. Brown | | | | | 47 | | | | Senior Vice President and Chief Financial Officer |
| Gregory Ferenbach | | | | | 47 | | | | Senior Vice President and General Counsel |
| Michael J. Fortunato | | | | | 43 | | | | Controller |
| Lysa A. Hlavinka | | | | | 39 | | | | Senior Vice President – Marketing and
Administration |
| Kevin P. O’Reagan | | | | | 47 | | | | Vice President and Chief Technology Officer |
| Sonya G. Udler | | | | | 39 | | | | Vice President – Corporate Communications |
| University Officers: | | | | | | | | | |
| Dr. Joel O. Nwagbaraocha | | | | | 64 | | | | Interim University President, Provost, and
Chief Academic Officer |
| Randi S. Reich | | | | | 33 | | | | Senior Vice President – Academic Administration |
| Patricia Ardoline-Pellicci | | | | | 41 | | | | Vice President – Operations |
| Daniel W. Jackson | | | | | 32 | | | | Vice President – Operations |
| James F. McCoy | | | | | 47 | | | | Vice President – Operations |
| Reginald Rainey | | | | | 39 | | | | Vice President – Operations |
|
Directors
Mr. Robert S. Silberman has been Chairman of the Board since February 2003 and Chief Executive Officer since March 2001. From 1995 to 2000, Mr. Silberman served in a variety of senior management positions at CalEnergy Company, Inc., including as President and Chief Operating Officer. From 1993 to 1995, Mr. Silberman was Assistant to the Chairman and Chief Executive Officer of International Paper Company. From 1989 to 1993, Mr. Silberman served in several senior positions in the U.S. Department of Defense, including as Assistant Secretary of the Army. Mr. Silberman has been a Director of Strayer since March 2001. He serves on the Board of Directors of Covanta Holding Company, NewPage Holding Corporation, and on the Management Advisory Board of New Mountain Capital, LLC. He also serves on the Board of Visitors of The Johns Hopkins University
66
Table of ContentsSchool of Advanced International Studies. Mr. Silberman is a member of the Council on Foreign Relations. Mr. Silberman holds a bachelor’s degree in history from Dartmouth College and a master’s degree in international policy from The Johns Hopkins University.
Dr. Charlotte F. Beason is a former consultant in education and health care administration. From 1988 to 1996, she was Director of Health Professions Education Service and the Health Professional Scholarship Program at the Department of Veterans Affairs. From 2000 to 2003, Dr. Beason was Chair and Vice Chair of the Commission on Collegiate Nursing Education (an autonomous agency accrediting baccalaureate and graduate programs in nursing). She is also a member of the Accreditation Review Committee of the American Nurses Credentialing Commission. Dr. Beason has served on the Board since 1996 and is a member of the Nominating/Governance Committee of the Board. She is also Chairwoman of the Strayer University Board of Trustees. Dr. Beason holds a bachelor’s degree in nursing from Berea College, a master’s degree in psychiatric nursing from Boston University and a doctorate in clinical psychology and public practice from Harvard University.
Mr. William E. Brock is the Founder and Chairman of the Brock Offices, a firm specializing in international trade, investment and human resources. From 1985 to 1987, Mr. Brock served in the President’s Cabinet as the U.S. Secretary of Labor, and from 1981 to 1985, as the U.S. Trade Representative. Elected Chairman of the Republican National Committee from 1977 to 1981, Mr. Brock previously served as a Member of Congress and, subsequently, as U.S. Senator for the State of Tennessee. Mr. Brock serves as a Counselor and Trustee of the Center for Strategic and International Studies, and as a member of the Board of Directors of On Assignment, Inc., and Health Extras, Inc., and ResCare, Inc. Mr. Brock has been a member of the Board since 2001 and is Chair of the Nominating/Governance Committee of the Board. He holds a bachelor’s degree in commerce from Washington and Lee University. Mr. Brock has also received a number of honorary degrees.
Mr. David A. Coulter is currently Managing Director and Senior Advisor at Warburg Pincus, LLC. He was Vice Chairman of J.P. Morgan & Chase Co. from December 2000 to December 2005. Mr. Coulter was Vice Chairman of The Chase Manhattan Corporation from July 2000 to December 2000. Prior to joining Chase, Mr. Coulter led the West Coast operations of the Beacon Group, a private investment and strategic advisory firm, and prior to that, Mr. Coulter served as the Chairman and Chief Executive Officer of the BankAmerica Corporation. Mr. Coulter is a member of the Board of Directors of PG&E Corporation, First Data Corporation and the Irvine Company. Mr. Coulter is currently serving as the Presiding Independent Director of the Strayer Education, Inc. Board of Directors, on which he has served since 2002. Mr. Coulter holds a bachelor’s degree in mathematics and economics and a master’s degree in industrial administration, both from Carnegie Mellon University.
Mr. Gary Gensler served as Under Secretary of the U.S. Department of the Treasury from 1999 to 2001, and as Assistant Secretary of the Treasury from 1997 to 1999. From 1988 to 1997, Mr. Gensler was a partner of The Goldman Sachs Group, LP, where he served in various capacities including Co-head of Finance, responsible for controllers and treasury worldwide. He serves as a Trustee of the Baltimore Museum of Art, the Bryn Mawr School, and Enterprise Community Partners, and is a member of the Board of Visitors of the University of Maryland, Baltimore County, and the Board of The Johns Hopkins Center for Talented Youth as well as the Board of WageWorks, Inc., and the Washington Hospital Center. Mr. Gensler also serves on the Management Advisory Board of New Mountain Capital, LLC. Mr. Gensler has served on the Board since 2001 and is Chair of the Audit Committee of the Board. Mr. Gensler holds a bachelor’s degree in economics and an MBA from the Wharton School of the University of Pennsylvania.
Mr. Robert R. Grusky is the Founder and Managing Member of Hope Capital Management, LLC, an investment manager, since 2000. He co-founded New Mountain Capital, LLC, a private equity firm, in 2000 and was a Principal and Member from 2000 to 2005, and has been a Senior Advisor since then. From 1998 to 2000, Mr. Grusky served as President of RSL Investments Corporation. From 1985 to 1997, with the exception of 1990 to 1991 when he was on a leave of absence to serve as a White House Fellow and Assistant for Special Projects to the Secretary of Defense, Mr. Grusky served in a variety of capacities at Goldman, Sachs & Co., first in its Mergers & Acquisitions Department and
67
Table of Contentsthen in its Principal Investment Area. He is also on the Board of Directors of AutoNation, Inc., and National Medical Health Card Systems, Inc., as well as a member of the Board of Trustees of Hackley School. Mr. Grusky has served on the Board since 2001, and is a member of the Audit Committee of the Board. He holds a bachelor’s degree in history from Union College and an MBA from Harvard University.
Mr. Robert L. Johnson is the Chairman and Chief Executive Officer of RLJ Companies, where he owns or holds interests in companies operating in the professional sports, hospitality, real estate, gaming, banking and financial services, and film production industries. Mr. Johnson is the founder of Black Entertainment Television (BET), a subsidiary of Viacom and the leading African-American operated media and entertainment company in the United States, and served as its Chief Executive Officer until January 2006. In 2002, Mr. Johnson became the first African-American majority owner of a major sports franchise, the Charlotte Bobcats of the NBA. From 1976 to 1979, he served as Vice President of Governmental Relations for the National Cable & Telecommunications Association (NCTA). Mr. Johnson also served as Press Secretary for the Honorable Walter E. Fauntroy, Congressional Delegate from the District of Columbia. He also serves on the following boards: NBA Board of Governors, The Johns Hopkins University, Lowe’s Companies, IMG, Deutsch Bank Advisory Board, Wal-Mart Diversity Committee, and the Business Council. Mr. Johnson has served on the Board since 2003, and is a member of the Compensation Committee of the Board. He holds a bachelor’s degree in social studies from the University of Illinois and a master’s degree in international affairs from the Woodrow Wilson School of Public and International Affairs at Princeton University.
Mr. Todd A. Milano has been President and Chief Executive Officer of Central Pennsylvania College since 1989. Mr. Milano has served on the Board since 1996 and is a member of the Compensation Committee of the Board and is also a member of the Strayer University Board of Trustees. Mr. Milano holds a bachelor’s degree in industrial management from Purdue University.
Mr. G. Thomas Waite, III has been Treasurer and Chief Financial Officer of the Humane Society of the United States since 1993. In 1992, Mr. Waite was the Director of Commercial Management of The National Housing Partnership. Mr. Waite has served on the Board since 1996, is a member of the Audit Committee of the Board and is also a member of the Strayer University Board of Trustees. Mr. Waite holds a bachelor’s degree in commerce from the University of Virginia and is a Certified Public Accountant.
Mr. J. David Wargo is a co-founder and has been a Member of New Mountain Capital, LLC, since January 2000. Since 1993, Mr. Wargo has also been President of Wargo and Company, Inc., an investment management company. From 1989 to 1992, Mr. Wargo was a Managing Director and Senior Analyst of The Putnam Companies, a Boston-based investment management company. From 1985 to 1989, Mr. Wargo was a partner and held other positions at Marble Arch Partners. Mr. Wargo is a Director of Liberty Global, Inc., Discovery Holding Company and OpenTV Corporation. Mr. Wargo has served on the Board since 2001 and is Chair of the Compensation Committee of the Board. Mr. Wargo holds a bachelor’s degree in physics and a master’s degree in nuclear engineering, both from the Massachusetts Institute of Technology. He also holds a master’s degree in management from the Sloan School of Management, Massachusetts Institute of Technology.
Executive Officers
Mr. Karl McDonnell joined Strayer Education in July 2006 as President and Chief Operating Officer. Previously, he served as Chief Operating Officer of InteliStaf Healthcare, Inc., one of the nation’s largest privately-held healthcare staffing firms. Prior to his tenure at InteliStaf, he served as Vice President of the Investment Banking Division at Goldman, Sachs & Co. Mr. McDonnell has held senior management positions with several Fortune 100 companies, including The Walt Disney Company. Mr. McDonnell holds a bachelor’s degree in political science and American history from Virginia Wesleyan College and an MBA from Duke University.
Mr. Mark C. Brown joined Strayer in September 2001 as Senior Vice President and Chief Financial Officer. Mr. Brown was most recently the Chief Financial Officer of the Kantar Group, the information and consultancy division of WPP Group, a multi-national communications services
68
Table of Contentscompany. Prior to that, for nearly 12 years, Mr. Brown held a variety of management positions at PepsiCo, Inc., including Director of Corporate Planning for Pepsi Bottling Group and Business Unit Chief Financial Officer for Pepsi-Cola International. Mr. Brown is a Certified Public Accountant who started his career with PricewaterhouseCoopers, LLP. Mr. Brown holds a bachelor’s degree in accounting from Duke University and an MBA from Harvard University.
Mr. Gregory Ferenbach has served as Senior Vice President and General Counsel for the Company since September 2006. Mr. Ferenbach joined Strayer in 2002 and was previously General Counsel of Strayer University where he was responsible for obtaining regulatory approvals to begin operations in new states. Mr. Ferenbach has more than 20 years of experience in the practice of law. Prior to joining Strayer, Mr. Ferenbach was Senior Vice President and General Counsel to the Public Broadcasting Service (PBS) for 10 years and an attorney in corporate practice at the law firms of Piper & Marbury in Baltimore, Md., and Dow, Lohnes & Albertson in Washington, D.C. Mr. Ferenbach holds a bachelor’s degree in history from Yale University and a juris doctorate degree from the University of Virginia.
Mr. Michael J. Fortunato joined Strayer as its Controller in September 2002. Prior to joining Strayer, Mr. Fortunato spent 17 years working in a variety of industries including health care, real estate, international investing and software development. Mr. Fortunato began his career with the accounting firm KPMG Peat Marwick. He holds a bachelor’s degree in business administration from Loyola College and is a Certified Public Accountant.
Ms. Lysa A. Hlavinka is Senior Vice President – Marketing and Administration. Ms. Hlavinka has been working in the for-profit education field for the past 17 years and joined Strayer in May 2001 as Vice President – Marketing. Ms. Hlavinka started her career as an account executive at an advertising agency and joined the University of Phoenix in 1990. As that company grew, Ms. Hlavinka held positions as Marketing Manager, Director of Administrative Services, and, most recently, National Director of Advertising. She has taught marketing and public relations classes both at the University of Phoenix and Strayer University. Ms. Hlavinka holds a bachelor’s degree in advertising from Arizona State University and an MBA from the University of Phoenix.
Mr. Kevin P. O’Reagan is Vice President and Chief Technology Officer. He has been active in the technology field for more than 20 years and joined Strayer in July 2001. Mr. O’Reagan started his career with Andersen Consulting and later joined Prudential Mortgage as the Director of Technology. Prior to joining Strayer, he held a number of IT management positions including Chief Technology Officer of the RIA Group of the Thompson Corporation. Prior to joining Strayer, Mr. O’Reagan developed and taught courses at the post-graduate level as an adjunct faculty member at The Johns Hopkins University in its Information Technology Program. Mr. O’Reagan holds a bachelor’s degree in information systems management from the University of Maryland and a master’s degree in technology from The Johns Hopkins University.
Ms. Sonya G. Udler is Vice President, Corporate Communications. Ms. Udler joined Strayer in 2002, and brings more than 15 years of public relations and marketing communications experience to Strayer. For the two years prior to joining Strayer, she served as a public relations and media strategies consultant. She previously served as Senior Vice President at Young & Associates, Inc., a public relations agency, where she developed communications strategies and media programs for Bell Atlantic, Siemens, Verizon and other leading technology companies. Ms. Udler holds a bachelor’s degree in journalism from the University of Maryland.
University Officers
Dr. Joel O. Nwagbaraocha serves as Interim University President, Provost, and Chief Academic Officer. Dr. Nwagbaraocha joined Strayer University in 1994 as Adjunct Faculty. He has since held several positions at the University, including Campus Dean. Dr. Nwagbaraocha has more than 35 years of experience as an academician, education administrator and education consultant. Prior to joining Strayer, he was President of Barber-Scotia College in Concord, N.C. Dr. Nwagbaraocha advises graduate students at Strayer University’s Washington Campus on their Directed Research Projects and
69
Table of Contentsteaches education courses at the campus. He holds a bachelor’s degree in mathematics from Norfolk State University and master’s and doctoral degrees in education planning and management from Harvard University.
Ms. Randi S. Reich is Senior Vice President – Academic Administration. Ms. Reich has been with the University for six years and has served as Director of Online Operations, Director of Business Processes, Director of New Campus Openings, and as an Adjunct Faculty Member. Prior to joining Strayer in 2001, Ms. Reich co-founded and managed business and strategic development for Mascot Network, an application service provider serving the higher education market. Ms. Reich also served several years in city government with the City of New York as the Assistant Director in the Mayor’s Office of Transportation. Ms. Reich holds a bachelor’s degree in psychology and political science from the University of Pennsylvania and an MBA from Harvard University.
Ms. Patricia Ardoline-Pellicci is Vice President – Operations. Ms. Ardoline-Pellicci has been with Strayer University for 15 years, and has served in a variety of roles, including Financial Aid Manager, Student Services Manager, University Bursar, Campus Manager, and Regional Director. Ms. Ardoline-Pellicci holds a bachelor’s degree in communications from Marywood College and an MBA from Strayer University.
Mr. Daniel W. Jackson is Vice President – Operations. Mr. Jackson has been with the University since 2003, previously holding the positions of Director of Business Operations, Manager of Financial Analysis, Campus Director and as an Adjunct Faculty Member. Mr. Jackson has over nine years of experience in proprietary education, including roles as Equity Research Associate at Legg Mason Wood Walker, and Director of Operations at Fairmont Schools, Inc. Mr. Jackson holds a bachelor’s degree in international affairs from the University of Colorado at Boulder and an MBA from Georgetown University.
Mr. James F. McCoy is Vice President – Operations. Mr. McCoy has been active in proprietary education for the past 22 years and joined Strayer in 1994. He has served in a variety of roles, including as a Faculty Member, Campus Dean and Campus Director. Mr. McCoy holds a bachelor’s degree in political science from Landor University and an MBA from Strayer University.
Mr. Reginald Rainey is Vice President – Operations. Mr. Rainey has been with Strayer University for 20 years and has held a number of positions, including Campus Director. Mr. Rainey holds a bachelor’s degree in accounting from Strayer University.
Audit Committee and Audit Committee Financial Expert
The Company has a separately-designated standing Audit Committee established in accordance with section 3(a)(58)(A) of the Exchange Act. The Audit Committee is composed of Gary Gensler, Robert R. Grusky and G. Thomas Waite, each of whom are independent as that term is used in Item 7(d)(3)(IV) of Schedule 14A under the Exchange Act.
The Board of Directors has determined that Gary Gensler qualifies as an ‘‘audit committee financial expert,’’ as defined by SEC regulations, based on his education, experience and background.
Section 16(a) Beneficial Ownership Reporting Compliance
The Securities Exchange Act of 1934 requires the Company’s directors, executive officers and 10% stockholders to file reports of beneficial ownership of equity securities of the Company and to furnish copies of such reports to the Company. Based on a review of such reports, and upon written representations from certain reporting persons, the Company believes that, during the fiscal year ended December 31, 2006, all such filing requirements were met.
Code of Ethics
The Board of Directors adopted a Code of Ethics in February 2004, meeting the requirements of Section 406 of the Sarbanes-Oxley Act of 2002 and applicable NASDAQ requirements. The Company will provide to any person without charge, upon request, a copy of such Code of Ethics. Copies are
70
Table of Contentsalso available on our website, www.strayereducation.com in the Investor Relations section. Persons wishing to make such a request should contact Sonya G. Udler, Vice President of Corporate Communications, 1100 Wilson Blvd. Suite 2500, Arlington, VA 22209, (703) 247-2500. In the event that we make any amendment to, or grant any waiver from, a provision of the Code of Ethics that applies to our principal executive officer, principal financial officer, principal accounting officer or controller and requires disclosure under applicable SEC rules, we intend to disclose such amendment or waiver and the reasons for the amendment or waiver on our website, located at www.strayereducation.com, and as required by NASDAQ, file a Current Report on Form 8-K with the SEC reporting the amendment or waiver.
Item 11. Executive Compensation
The information required by this Item is hereby incorporated by reference from the information to be contained in the Company’s Proxy Statement, which will be filed no later than 120 days following December 31, 2006.
Item 12. Security Ownership of Certain Beneficial Owners and Management
The information required by this Item is hereby incorporated by reference from the information contained under the caption ‘‘Beneficial Ownership of Common Stock’’ in the Company’s Proxy Statement, which will be filed no later than 120 days following December 31, 2006.
Item 13. Certain Relationships and Related Transactions
The information required by this Item is hereby incorporated by reference from the information contained under the caption ‘‘Certain Transactions with Related Parties’’ in the Company’s Proxy Statement, which will be filed no later than 120 days following December 31, 2006.
Item 14. Principal Accounting Fees and Services
Set forth below are the services rendered and related fees billed by PricewaterhouseCoopers, LLP for 2005 and 2006. All of such services have been pre-approved by the Company’s Audit Committee.
| | | | | | | | | | | | |
| | | | 2005 | | | 2006 |
| Audit Fees | | | | | | | | | | | | |
| Recurring: | | | | | | | | | | | | |
| Consolidated financial statements audit | | | | $ | 354,000 | | | | | $ | 375,000 | |
| Non recurring: | | | | | | | | | | | | |
| Implementation of FAS 123(R) | | | | | — | | | | | | 39,625 | |
| Other | | | | | 3,310 | | | | | | 5,610 | |
| | | | | | 357,310 | | | | | | 420,235 | |
| Tax Fees | | | | | | | | | | | | |
| Preparation of corporate tax returns | | | | | 28,950 | | | | | | 33,000 | |
| All Other Fees | | | | | | | | | | | | |
| License fee for accounting database | | | | | 1,000 | | | | | | 1,500 | |
| | | | | $ | 387,260 | | | | | $ | 454,735 | |
|
71
Table of ContentsPART IV
Item 15. Exhibits and Financial Statement Schedules
(A)(1) Financial Statements
All required financial statements of the registrant are set forth under Item 8 of this report on Form 10-K.
(A)(2) Financial Statement Schedules
All required financial statement schedules of the registrant are set forth under Item 8 of this report on Form 10-K.
(A)(3) Exhibits
| | | |
Exhibit
Number | | | Description |
| 3.01 | | | Amended Articles of Incorporation and Articles Supplementary of the Company (incorporated by reference to Exhibit 3.01 of the Company’s Annual Report on Form 10-K filed with the Commission on March 28, 2002). |
| 3.02 | | | Amended and Restated Bylaws of the Company (incorporated by reference to Exhibit 3.02 of the Company’s Registration Statement on Form S-1 (File No. 333-3967) filed with the Commission on May 17, 1996). |
| 4.01 | | | Specimen Stock Certificate (incorporated by reference to Exhibit 4.01 of Amendment No. 3 to the Company’s Registration Statement on Form S-1 (File No. 333-3967) filed with the Commission on July 16, 1996). |
| 10.03 | | | Employment Agreement, dated as of April 6, 2001, between Strayer Education, Inc. and Robert S. Silberman (incorporated by reference to Exhibit 10.03 of the Company’s Annual Report on From 10-K filed with the Commission on March 28, 2002). |
| 10.04 | | | 1996 Amended Stock Option Plan (incorporated by reference to Exhibit B of the Company’s Proxy Statement filed with the Commission on April 27, 2001 and Exhibits B & C to the Company’s Proxy Statement filed with the Commission on April 3, 2006). |
| 21.01 | | | Subsidiaries of Registrant (incorporated by reference to Exhibit 21.01 of the Company’s Annual Report on Form 10-K filed with the Commission on March 28, 2002). |
| 23.1* | | | Consent of PricewaterhouseCoopers LLP. |
| 24.1* | | | Power of Attorney (included in signature page hereto). |
| 31.1* | | | Certification of Chief Executive Officer pursuant to Rule 13a-14(a) of the Securities Act. |
| 31.2* | | | Certification of Chief Financial Officer pursuant to Rule 13a-14(a) of the Securities Act. |
| 32.1* | | | Certification of Chief Executive Officer pursuant to 18 U.S.C. Section 1350, as adopted pursuant to Section 906 of the Sarbanes-Oxley Act of 2002. |
| 32.2* | | | Certification of Chief Financial Officer pursuant to 18 U.S.C. Section 1350, as adopted pursuant to Section 906 of the Sarbanes-Oxley Act of 2002. |
|
| |
| * | Filed herewith. |
72
Table of ContentsSIGNATURES
Pursuant to the requirements of Section 13 or 15(d) of the Securities Exchange Act of 1934, the registrant has duly caused this Report to be signed on its behalf by the undersigned, thereunto duly authorized.
| STRAYER EDUCATION, INC. |
| By: /s/ Robert S. Silberman |
| Robert S. Silberman
Chairman of the Board and
Chief Executive Officer |
Date: February 27, 2007
POWER OF ATTORNEY
KNOW ALL MEN BY THESE PRESENTS, that each person whose signature appears below constitutes and appoints Robert S. Silberman and Gregory Ferenbach and Mark C. Brown, and each of them individually, as his true and lawful attorneys-in-fact and agents, with full power of substitution and resubstitution, for him and his name, place and stead in any and all capacities, to sign the report and any and all amendments to this report, and to file the same, with all exhibits thereto, and other documents in connection therewith, with the Securities and Exchange Commission, granting unto said attorneys-in-fact and agents, full power and authority to perform each and every act and thing requisite and necessary to be done in and about the premises, as fully to all intents and purposes as he might or could do in person, hereby ratifying and confirming all that said attorneys-in-fact and agents, or their substitutes, may lawfully do or cause to be done by virtue thereof.
Pursuant to the requirements of the Securities Exchange Act of 1934, this Report has been signed below by the following persons on behalf of the registrant in the capacities and on the date indicated.
| | | | |
| SIGNATURES | | TITLE | | DATE |
|
| /s/ Robert S. Silberman | | Chairman of the Board and
Chief Executive Officer
(Principal Executive Officer) | | February 27, 2007 |
|
| (Robert S. Silberman) |
|
| /s/ Mark C. Brown | | Chief Financial Officer
(Principal Financial and
Accounting Officer) | | February 27, 2007 |
|
| (Mark C. Brown) |
|
| /s/ Charlotte F. Beason | | Director | | February 27, 2007 |
|
| (Charlotte F. Beason) |
|
| /s/ William E. Brock | | Director | | February 27, 2007 |
|
| (William E. Brock) |
|
| /s/ David A. Coulter | | Director | | February 27, 2007 |
|
| (David A. Coulter) |
|
| /s/ Gary Gensler | | Director | | February 27, 2007 |
|
| (Gary Gensler) |
|
| /s/ Robert R. Grusky | | Director | | February 27, 2007 |
|
| (Robert R. Grusky) |
|
| /s/ Robert L. Johnson | | Director | | February 27, 2007 |
|
| (Robert L. Johnson) |
|
73
Table of Contents | | | | |
| SIGNATURES | | TITLE | | DATE |
|
| /s/ Todd A. Milano | | Director | | February 27, 2007 |
|
| (Todd A. Milano) |
|
| /s/ G. Thomas Waite, III | | Director | | February 27, 2007 |
|
| (G. Thomas Waite, III) |
|
| /s/ J. David Wargo | | Director | | February 27, 2007 |
|
| (J. David Wargo) |
|
74