FORM 6-K
SECURITIES AND EXCHANGE COMMISSION
Washington, D.C. 20459
Report of Foreign Private Issuer
Pursuant to Rule 13a-16 or 15d-16
under the Securities Exchange Act of 1934
February 23, 2004
Commission File Number: 001-14404
Telefónica del Perú S.A.A.
(Exact name of registrant as specified in its charter)
Telefonica of Peru
(Translation of registrant’s name into English)
Avenida Arequipa 1155 Santa Beatriz, Lima, Perú
(Address of principal executive office)
Indicate by check mark whether the registrant files or will file annual reports under cover of Form 20-F or Form 40-F: Form 20-F x Form 40-F ¨
Indicate by check mark if the registrant is submitting the Form 6-K in paper as permitted by Regulation S-T Rule 101(b)(1): Yes ¨ No x
Indicate by check mark if the registrant is submitting the Form 6-K in paper as permitted by Regulation S-T Rule 101(b)(7):Yes ¨ No x
Indicate by check mark whether the registrant by furnishing the information contained in this Form, the Registrant is also thereby furnishing the information to the Commission pursuant to Rule 12g3-2(b) under the Securities Exchange Act of 1934: Yes ¨ No x
If “Yes” is marked, indicate below the file number assigned to the registrant in connection with Rule 12g3-2(b): N/A
Telefónica del Perú S.A.A.
TABLE OF CONTENTS
| Item | ||
| 1. | Translation of a letter to CONASEV, dated February 12, 2004 regarding the fourth quarter results for Telefónica del Perú S.A.A. | |
| 2. | Translation of Management’s Discussion and Analysis of the Consolidated Financial Statements for the fourth quarter ended December 31, 2003. | |
Item 1
TRANSLATION
GGR—2003
Lima, February 12, 2004
Messrs.
Comisión Nacional Supervisora
De Empresas y Valores—CONASEV
Lima.-
Re: Key Events
Dear Sirs,
According to the Peruvian Capital Markets Law and CONASEV Resolution No. 107-2002-EF/94.10 on Key Events, Private Information and Other Communications, we hereby inform you that on February 11th, 2004 the Board of Directors of Telefónica del Perú S.A.A. approved the consolidated and non-consolidated financial statements of the fourth quarter of the year 2003. The results will be duly registered through the system MVNet, and have been ordered to be submitted to the Comisión Nacional Supervisora de Valors—CONASEV, the Bolsa de Valores de Lima and other stock market institutions that may be concerned.
Please find the management report enclosed herewith relating to the financial statements above mentioned.
Sincerely yours,
Julia María Morales Valentín
Telefónica del Perú S.A:A.
Representative to the Stock Exchange
Item 2.
TRANSLATION
Translation of Management’s Discussion and Analysis of the Consolidated Financial Statements for the fourth quarter ended December 31, 2003.

Quarterly Results
Telefónica del Perú S.A.A. and subsidiaries
October—December 2003
Significant Events
A summary containing the most significant events that have occurred since October 2003 is presented below:
| 1. | The Board of Directors, at a meeting held on October 28th, approved the individual and consolidated financial statements of the Company corresponding to the third quarter of 2003 and their filing with the Comisión Nacional Supervisora de Empresas y Valores, the Lima Stock Exchange and other relevant institutions of the stock market. |
| 2. | On October 29th, risk agency Moody’s downgraded the rating of the certificates issued by Telefónica del Perú Grantor Trust in December 1998 from Baa1 to Baa3 and remain under review for further possible downgrade. The balance of those certificates on December 31st amounts to US$ 39.3 million, and corresponds to the securitization of international long distance net receivables. Additionally, on November 4th, risk agency Fitch Ratings downgraded the rating of the same certificates from BBB+ to BBB and changed the outlook from negative to stable. It is worth noting that the downgrade on the certificates’ rating is applied on the trustee’s equity and not on the international corporate rating of Telefónica del Perú, which remains at BB-. |
| 3. | On December 4th, the General Shareholders’ Meeting of Telefónica Perú Holding S.A.C., a company that belongs to Telefónica Group, resolved the dissolution of the company in accordance with the procedures of the Corporate Law (Ley General de Sociedades). |
| 4. | On December 15th, the Company informed CONASEV that the Board of Directors accepted the resignation of Mr. José Luis García Vélez from the positions as Director and Chief Executive Officer of Servicios Globales de Telecomunicaciones S.A.C (SERTEL) and as Director of Transportes Urgentes de Mensajería S.A.C. (TUMSAC). As a result, the Board appointed Mr. Michael Duncan Cary-Barnard in those positions. |
| 5. | The Board of Directors, at a meeting held on December 17th, approved the following resolutions: |
| a. | Accepted the resignation of Mr. José Luis García Vélez from the position of Residential Central Manager and as an Alternate Director of the Telefónica del Perú S.A.A. |
| b. | Appointed Mr. Michael Duncan Cary-Barnard as Residential Central Manager of the Company. |
| c. | Authorized the Management, at its discretion, to start the necessary procedures to: (i) delist the American Depositary Shares (ADS) from the New York Stock Exchange (NYSE); (ii) modify the Deposit Contract among Telefónica del Perú S.A.A., Morgan Guaranty Trust of New York and the ADS holders; (iii) cancel the Deposit Program of such instruments; and (iv) proceed with their delisting from the Securities and Exchange Commission (SEC) in accordance with the procedures of such institution. |
| 6. | The Executive Committee of the Board, at a meeting held on December 22nd, authorized the Company to initiate, in accordance with the contractual procedures currently in place, the actions for the second gradual renewal of the terms contemplated on the Concession Contract subscribed between the Ministry of Transportation, Communications, Housing and Construction and Compañía Peruana de Teléfonos S.A. and Entel Perú (presently merged under Telefónica del Perú S.A.A.). |
| 7. | On January 27th, Telefónica del Perú S.A.A. announced that it would cancel its ADR (American Depositary Receipt) program, effective on February 27th, 2004. The Company decided to cancel said program in accordance with, and subject to, the terms and conditions of the deposit agreement governing the ADRs. The Company requested that its ADSs be deslisted from the New York Stock Exchange (NYSE) in accordance with Rule 806 of the NYSE Listed Companies Manual and Rule 12d2-2 of the Securities Exchange Act of 1934, as amended. The class B shares underlying the ADSs will continue to be traded in the Lima Stock Exchange. |
TELEFÓNICA DEL PERÚ S.A.A. AND SUBSIDIARIES
Management’s discussion and analysis of the consolidated results
for the fourth quarter ended December 31, 2003
It is recommended that the reading of this report be made along with the corresponding financial statements and their notes that have been presented simultaneously, since they form an integral part of this document and contain complementary information.
Economic Environment
During the 4Q03, the Gross Domestic Product may have grown around 2.7%, the lowest increase since 3Q01 when it expanded by 1.7%. This fact could represent a deceleration of the economic activity or even, for some analysts, the end of the economic expansion phase. This quarterly growth may have been fueled by the good performance of exports, especially mining and textiles. In effect, the increase in main commodities prices (gold, copper and zinc) and the return from investments made in the textile sector could have prompted an upturn in the growth of exports, reaching levels up to 7%.
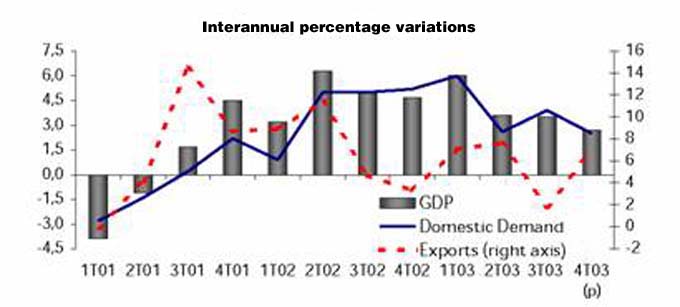
On the supply side, the deceleration of 4Q03 could be tied, to a lower activity in the Agribusiness sector (-1.0%). Likewise, although positive, the growth rate of the Manufacturing sector (1.1%), slowed from the first quarter of 2003. The Construction Sector has performed at a growing rate since March 2002, finally leveling off and stabilizing at a rate of around 3.5%. During the 4Q03, these last two sectors showed a lower performance than that of last year’s average. On the demand side, the lower growth of the GDP in 4Q03 could be explained by (i) the moderate growth in private investment, stemming from specific projects like the Camisea export and the expansion of the textile export sector (ATPDEA); and (ii) deceleration of public investment since early 2003.
Prices remained relatively stable in 4Q03, allowing the Central Bank to develop a loose monetary policy, needed to avoid a greater appreciation of the Nuevo Sol. In effect, the Consumer Price Index (CPI) reported a 0.82% increase during 4Q03, while core inflation (excluding the volatile components of the CPI) registered a 0.54% variation in the same period. With this result, annual inflation remained within the Central Bank target (2.48% compared to 2.5% target). It is worth noting that, during the year, core inflation has remained steadily below the reported inflation, which could imply that a significant part of the inflation belonged to variations in transportation and fuel.
As for the fiscal sector, during the 4Q03, current revenues of the central government could have increased due to two factors: (i) improved efficiency of SUNAT; and (ii) the increase of the key tax rates for the economy such as the Value Added Tax (VAT) and Consumption Selective Tax (ISC). In effect, these factors were present throughout most of the year allowing the fiscal pressure to reach levels of 13% of the GDP (12.1% in 2002). As a result of that, the government would have reached its fiscal target (deficit of 1.9% of the GDP). On the other hand, the expenses of the central government maintain an upward trend, though slowed by a reduction in public investment.
The exchange rate continued its stable performance during 2003, with a slight trend towards appreciation during the last quarter of the year, totaling a level of S/. 3.464 per dollar at the end of 2003. The low volatility responds to a favorable regional context, in which financial markets are discounting for the future effect of Brazil’s reforms, as well as the active participation of the Central Bank in the foreign exchange market, in which it bought US$ 1,050 million along the year.
Operating revenues
During 2003, among the main factors driving lower revenues were the aggressive competitive environment in the Long Distance and Public and Rural Telephony businesses, the impact of the new tariff plans put in place since March 2003 and the impact of the productivity factor. Operating revenues for 4Q03 totaled S/. 869 million, 1.6% lower than registered in 4Q02, explained by the decrease in revenues in the businesses of Public and Rural Telephony (12.9%), Local Telephony (5.9%) and Long Distance (5.4%), which were not offset by the increases in revenues for the segments of Business Communications (39.6%), Cable Television (8.4%) and Other Operating Revenues (16.5%).
Operating revenues for 12M03 totaled S/. 3,447 million, a 2.2% reduction compared to 12M02, due to the lower revenues from Long Distance (17.5%), Local Telephony (6.0%) and Public and Rural Telephony (7.7%), partially offset by the increases in revenues from the segments of Business Communications (31.2%), Cable Television (6.6%) and Other Operating Revenues (35.9%).
In segments of fixed and public telephony, the main competitors are AT&T Perú, recently acquired by Telmex, and BellSouth, both of which are still focused in specific segments.
Revenues fromLocal Telephonytotaled S/. 376 million in 4Q03, showing a 5.9% reduction compared to 4Q02. The introduction of the new tariff plans, in place since 1Q03, as well as the application of the productivity factor, impacted the revenues of monthly fees and local measured service. In addition, the Internet billed traffic dropped due to the increase of Flat Tariff (148.5%) and ADSL (219.2%) clients. As a result of the aforementioned factors, the revenues for 12M03 totaled S/. 1,532 million, a 6.0% decrease compared to 12M02. Lines in service by the end of 2003 showed an 8.6% increase compared to 2002, due to the increase in lines corresponding to the new tariff plans. Five hundred fifty thousand classic lines, or those under the old tariff plan migrated to the new tariff plans.
The revenues fromPublic and Rural Telephony totaled S/. 172 million in 4Q03 (a decrease of 12.9% from those reported in 4Q02), while 12M03 results totaled S/. 702 million, 7.7% lower than in 12M02. The reduction is explained primarily by the lower revenues from fixed-to-fixed domestic long distance traffic—due to market’s pressure on tariffs as a result of an important migration from coin use to the use of prepaid cards both from TDP and other operators-, the increase in the mobile subscriber base, the increase of prepaid lines in basic telephony and the effect of competition in public telephony.
In 2003,Long Distance faced the highest level of competition among the Company’s business lines, from Americatel as the main competitor, followed by AT&T Perú and IDT. The development of the prepaid cards market and the consolidation of the multi-carrier system have also affected this segment.
Besides becoming more competitive—more than 20 operators with an aggressive price strategy—the long distance business showed new characteristics during 4Q03. On the supply side, the target segments of the market were small companies, VIP and mass markets. On the demand side, the customer’s preferred new technologies such as Voice over IP (Internet Protocol), which despite its early development stage achieved higher revenues than the traditional Long Distance services.
As a result, Long Distance revenues during 4Q03 decreased 5.4% compared to 4Q02, totaling S/. 85 million, due to lower tariffs in DLD and ILD due to increased competition. Likewise, revenues for 12M03 totaled S/. 360 million, 17.5% lower than those in 12M02 due to lower tariffs from continuous promotions and the market’s competitive pressure. Such effects were partially offset by increased revenues from the sale of Hola Perú cards resulting from the development of the cards market during 2003.
Revenues fromBusiness Communicationsincreased 39.6% to S/. 86 million in 4Q03 from S/. 62 million in 4Q02. 12M03 revenues totaled S/. 267 million, 31.2% higher than in 12M02.
It is worth noting that the company has placed strong interest in the growth of broadband in Peru. This is reflected in the increase of lines in service from 34,000 at the end of 2002 to 91,000 in December, an 163.7% improvement.
Cable Television increased its revenues compared to last year, both in 4Q03 and in 12M03. During 4Q03, revenues totaled S/. 85 million, 8.4% higher than in 4Q02. Revenues for 12M03 totaled S/. 320 million, a 6.6% increase compared to 12M02. The increased revenues in 12M03 are mainly explained by a 4.0% increase in Cable TV revenues—due to a higher average billable plant in Cable TV (7.0%).
Other Operating Revenues in 4Q03 grew 16.5% compared to 4Q02, totaling S/. 64 million, while they totaled S/.265 million in 12M03, a 35.9% increase compared to 12M02, mainly due to the higher interconnection revenues, related to the higher traffic, and network adaptation, resulting from an increase in the number of operators in the market.
Operating expenses
Operating expenses totaled S/. 688 million in 4Q03, representing a 13.2% increase compared to 4Q02, due, among other issues, to an increase of S/. 2 million in materials and supply resulting from the increase and development of the ADSL product, S/. 5 million in personnel expenses, as a result of the reinstatement of employees in accordance with a ruling of the Constitutional Court and S/. 2 million in provisions. This was partially offset by the reduction of S/. 2 million in general and administrative expenses, as well as lower depreciation expenses (S/. 2 million).
Accumulated operating expenses for 12M03 increased S/. 101 million compared to 12M02 totaling S/. 2,794 million, due, among other factors, to the increase of S/. 38 million in general and administrative expenses. This growth is mainly explained by the increased in advertising and promotion related to the new tariff plans, the contract with Terra for development of advertising services, broad band content and email services, and higher expenses for sports events and signal rental, due to the 7% increase in the average billable plant of Cable TV. Furthermore, this increase is explained by the depreciation (S/. 8 million), as well as materials and supplies ( S/. 4 million), due to the same aforementioned effects, and provisions (S/. 5 million), mainly explained by bad debt collection from accounts receivable. These variations were partially offset by lower personnel expenses (S/. 19 million).
EBITDA and Operating Result
During 4Q03, EBITDA decreased 18.3% compared to 4Q02, totaling S/. 428 million, as a result of higher operating expenses reported in 4Q03 and, to a lesser degree, the reduction in revenues. Consequently, EBITDA margin decreased from 59.4% in 4Q02 to 49.3% in 4Q03. This reduction, together with an increase in provisions, contributed to the decrease in the operating result of S/. 94 million in 4Q03 compared to 4Q02, totaling S/. 181 million.
Likewise, the accumulated EBITDA decreased 9.4% in 12M03 compared to 12M02, mainly as a consequence of higher expenses and, to a lesser degree, lower revenues. Thus, EBITDA margin fell from 51.8% in 12M02 to 48.0% in 12M03, while the operating result decreased by S/. 180 million in 12M03 compared to the same period of the previous year.
Non-operating Result
During 4Q03, the non-operating loss was lower than in 4Q02—S/. 217 million in 4Q02 compared to S/. 127 million in 4Q03. The improvement was due to lower losses stemming from a decrease in S/. 75 million in “others net”, a decrease of S/. 8 million in lower financial expenses—as a result of the reduction in the debt balance throughout the year and lower interest rates—and a greater positive effect of the monetary correction (REI) reported in 4Q03 (S/. 17 million) compared to 4Q02 (S/. 10 million).
In 12M03, non-operating losses decreased by S/. 159 million compared to 12M02, due to the reduction of net financial expenses by S/. 71 million during the period mainly because of lower debt levels resulting from the cash flow generation and the lower interest rates obtained by the Company, and to the positive effect of the monetary correction (REI) by S/. 7 million compared to a loss of S/. 16 million in December 2002. The losses registered in “others net” amounted to S/. 281 million in 12M03, a S/. 65 million decrease compared to 12M02.
Net result
As a result of the reduction in the non-operating loss, the net loss decreased from S/. 56 million in 4Q02 to S/. 36 million in 4Q03. On the other hand, the net result fell from S/. 31 million in 12M02 to S/. 22 million in 12M03, due to the decreases in operating results.
Consolidated Balance Sheet
The liquidity levels of the Company, measured by current assets over current liabilities ratio, increased from 0.58 in 3Q03 to 0.66 in 4Q03 (0.45 in the 4Q02). The increase is mainly explained by the increase of 53.2% in the other accounts receivable in 4Q03.
Furthermore, the Company has continued its debt reduction process due to the higher free cash flow that has been generated in the last years. Thus, the financial debt in 4Q03 was reduced by S/. 128 million compared to 3Q03, while in 2003, the debt was reduced by S/. 695 million. Therefore, the 2003 debt closed at S/. 1,751 million. The lower leverage rate was reflected in a decrease of the “debt over debt plus equity” ratio, going from 36.0% in the 3Q03 to 34.7% in 4Q03 (41.3% in the 4Q02). Likewise, the “interest coverage” ratio—EBITDA over net interests—rose from 14.2 in 4Q02 to 14.6 in 4Q03; and the “debt coverage” ratio—debt over EBITDA—fell from 1.3 in 2002 to 1.1 in the last 12 months.
TABLE 1
TELEFONICA DEL PERU S.A.A. AND SUBSIDIARIES
CONSOLIDATED INCOME STATEMENT SOLES (000) AS OF DECEMBER 31, 20031/
(Prepared In Accordance With Peruvian GAAP)
| 4Q02 | 4Q03 | Abs. Var. 4Q03-4Q02 | % Var. 4Q03-4Q02 | 12M02 | 12M02 | Var. Abs. 12M03-12M02 | Var. % 12M03-12M02 | |||||||||||||||||||||||||||||
| % | % | % | % | % | % | |||||||||||||||||||||||||||||||
Local Telephone Service | 399,915 | 45.3 | 376,472 | 43.3 | (23,443 | ) | (5.9 | ) | 1,629,631 | 46.2 | 1,532,076 | 44.4 | (97,555 | ) | (6.0 | ) | ||||||||||||||||||||
Long Distance | 89,885 | 10.2 | 85,045 | 9.8 | (4,840 | ) | (5.4 | ) | 436,703 | 12.4 | 360,213 | 10.4 | (76,490 | ) | (17.5 | ) | ||||||||||||||||||||
Public Telephones | 197,975 | 22.4 | 172,384 | 19.8 | (25,591 | ) | (12.9 | ) | 760,761 | 21.6 | 702,240 | 20.4 | (58,521 | ) | (7.7 | ) | ||||||||||||||||||||
Cable TV | 78,482 | 8.9 | 85,085 | 9.8 | 6,603 | 8.4 | 300,196 | 8.5 | 320,003 | 9.3 | 19,807 | 6.6 | ||||||||||||||||||||||||
Business Communications | 61,818 | 7.0 | 86,303 | 9.9 | 24,485 | 39.6 | 203,531 | 5.8 | 267,129 | 7.7 | 63,598 | 31.2 | ||||||||||||||||||||||||
Other | 54,578 | 6.2 | 63,606 | 7.3 | 9,028 | 16.5 | 195,403 | 5.5 | 265,470 | 7.7 | 70,067 | 35.9 | ||||||||||||||||||||||||
Total Operating Revenue | 882,653 | 100.0 | 868,895 | 100.0 | (13,758 | ) | (1.6 | ) | 3,526,225 | 100.0 | 3,447,131 | 100.0 | (79,094 | ) | (2.2 | ) | ||||||||||||||||||||
Personnel | 91,835 | 10.4 | 96,928 | 11.2 | 5,093 | 5.5 | 422,928 | 12.0 | 404,110 | 11.7 | (18,818 | ) | (4.4 | ) | ||||||||||||||||||||||
General and Administrative | 235,562 | 26.7 | 233,793 | 26.9 | (1,769 | ) | (0.8 | ) | 912,767 | 25.9 | 951,134 | 27.6 | 38,367 | 4.2 | ||||||||||||||||||||||
Depreciation | 249,291 | 28.2 | 246,969 | 28.4 | (2,322 | ) | (0.9 | ) | 994,282 | 28.2 | 1,002,593 | 29.1 | 8,311 | 0.8 | ||||||||||||||||||||||
Technology Transfer and Management Fees | — | — | 74,415 | 8.6 | 74,415 | — | 234,910 | 6.7 | 295,429 | 8.6 | 60,519 | 25.8 | ||||||||||||||||||||||||
Materials and Supplies | 15,620 | 1.8 | 18,038 | 2.1 | 2,418 | 15.5 | 56,262 | 1.6 | 60,548 | 1.8 | 4,286 | 7.6 | ||||||||||||||||||||||||
Provisions | 28,055 | 3.2 | 30,542 | 3.5 | 2,487 | 8.9 | 120,098 | 3.4 | 125,483 | 3.6 | 5,385 | 4.5 | ||||||||||||||||||||||||
Own Work Capitalized | (12,876 | ) | (1.5 | ) | (13,129 | ) | (1.5 | ) | (253 | ) | 2.0 | (47,776 | ) | (1.4 | ) | (45,101 | ) | (1.3 | ) | 2,675 | (5.6 | ) | ||||||||||||||
Total Operating Costs and Expenses | 607,487 | 68.8 | 687,556 | 79.1 | 80,069 | 13.2 | 2,693,471 | 76.4 | 2,794,196 | 81.1 | 100,725 | 3.7 | ||||||||||||||||||||||||
Operating Income | 275,166 | 31.2 | 181,339 | 20.9 | (93,827 | ) | (34.1 | ) | 832,754 | 23.6 | 652,935 | 18.9 | (179,819 | ) | (21.6 | ) | ||||||||||||||||||||
EBITDA | 524,457 | 59.4 | 428,308 | 49.3 | (96,149 | ) | (18.3 | ) | 1,827,038 | 51.8 | 1,655,528 | 48.0 | (171,510 | ) | (9.4 | ) | ||||||||||||||||||||
Operating Income (Expenses) | ||||||||||||||||||||||||||||||||||||
Interest Income | 13,131 | 1.5 | 7,657 | 0.9 | (5,474 | ) | (41.7 | ) | 53,467 | 1.5 | 30,776 | 0.9 | (22,691 | ) | (42.4 | ) | ||||||||||||||||||||
Interest Expenses | (50,090 | ) | (5.7 | ) | (36,905 | ) | (4.2 | ) | 13,185 | (26.3 | ) | (232,244 | ) | (6.6 | ) | (138,770 | ) | (4.0 | ) | 93,474 | (40.2 | ) | ||||||||||||||
Others Net | (190,072 | ) | (21.5 | ) | (114,749 | ) | (13.2 | ) | 75,323 | (39.6 | ) | (346,412 | ) | (9.8 | ) | (281,307 | ) | (8.2 | ) | 65,105 | (18.8 | ) | ||||||||||||||
Inflation Gain (Loss) | 10,012 | 1.1 | 16,803 | 1.9 | 6,791 | 67.8 | (16,383 | ) | (0.5 | ) | 6,812 | 0.2 | 23,195 | (141.6 | ) | |||||||||||||||||||||
Total Other Income (Expenses) | (217,019 | ) | (24.6 | ) | (127,194 | ) | (14.6 | ) | 89,825 | (41.4 | ) | (541,572 | ) | (15.4 | ) | (382,489 | ) | (11.1 | ) | 159,083 | (29.4 | ) | ||||||||||||||
Income before Taxes and Participations | 58,147 | 6.6 | 54,145 | 6.2 | (4,002 | ) | (6.9 | ) | 291,182 | 8.3 | 270,446 | 7.8 | (20,736 | ) | (7.1 | ) | ||||||||||||||||||||
Worker’s Participation | (31,252 | ) | (3.5 | ) | (24,625 | ) | (2.8 | ) | 6,627 | (21.2 | ) | (70,383 | ) | (2.0 | ) | (66,604 | ) | (1.9 | ) | 3,779 | (5.4 | ) | ||||||||||||||
Income Tax | (83,373 | ) | (9.4 | ) | (65,889 | ) | (7.6 | ) | 17,484 | (21.0 | ) | (189,546 | ) | (5.4 | ) | (181,894 | ) | (5.3 | ) | 7,652 | (4.0 | ) | ||||||||||||||
Net Income | (56,478 | ) | (6.4 | ) | (36,369 | ) | (4.2 | ) | 20,109 | (35.6 | ) | 31,253 | 0.9 | 21,948 | 0.6 | (9,305 | ) | (29.8 | ) | |||||||||||||||||
Data is adjusted according to the WPI published by the National Statistics Institute
TABLE 2
TELEFONICA DEL PERU S.A.A. AND SUBSIDIARIES
CONSOLIDATED BALANCE SHEET IN ADJUSTED SOLES (000) AS OF DECEMBER 31, 2003 (1)
(End of Period Figures)
ASSETS | |||||||||||||||
| 4T03 | 3T03 | 2T03 | 1T03 | 4T02 | |||||||||||
CURRENT ASSETS | |||||||||||||||
Cash and cash equivalents | 50,007 | 30,276 | 100,240 | 66,967 | 56,392 | ||||||||||
Negotiable securities | 46,351 | 59,340 | 51,915 | 69,470 | 54,940 | ||||||||||
Accounts and notes receivable—net | 729,566 | 723,375 | 683,210 | 694,307 | 658,712 | ||||||||||
Other accounts receivable | 356,470 | 232,663 | 223,919 | 215,056 | 200,320 | ||||||||||
Materials and supplies | 27,998 | 33,921 | 33,257 | 34,251 | 28,741 | ||||||||||
Prepaid taxes and expenses | 68,042 | 84,926 | 64,760 | 73,818 | 96,165 | ||||||||||
Total current assets | 1,278,434 | 1,164,501 | 1,157,301 | 1,153,869 | 1,095,270 | ||||||||||
Accounts receivable—LT wit T. Móviles | 0 | 227,908 | 228,846 | 227,689 | 268,745 | ||||||||||
LONG-TERM INVESTMENTS | 86,552 | 71,230 | 138,047 | 137,895 | 156,007 | ||||||||||
PROPERTY, PLANT AND EQUIPMENT | 14,319,158 | 14,042,727 | 13,944,947 | 13,887,406 | 13,981,483 | ||||||||||
Accumulated depreciation | (8,256,381 | ) | (7,991,454 | ) | (7,772,207 | ) | (7,557,719 | ) | (7,392,284 | ) | |||||
Write-off Provision | (62,298 | ) | (62,298 | ) | (62,298 | ) | (62,298 | ) | (62,298 | ) | |||||
| 6,000,479 | 5,988,975 | 6,110,442 | 6,267,389 | 6,526,901 | |||||||||||
OTHER ASSETS, net | 225,282 | 280,560 | 311,425 | 342,354 | 298,815 | ||||||||||
TOTAL ASSETS | 7,590,747 | 7,733,174 | 7,946,061 | 8,129,196 | 8,345,738 | ||||||||||
| LIABILITIES AND SHAREHOLDERS’ EQUITY | |||||||||||||||
| 4T03 | 3T03 | 2T03 | 1T03 | 4T02 | |||||||||||
CURRENT LIABILITIES | |||||||||||||||
Overdrafts | 22,009 | — | — | — | — | ||||||||||
Accounts payable and accrued liabilities | 551,596 | 464,859 | 328,283 | 457,490 | 480,812 | ||||||||||
Other accounts payable | 868,095 | 899,429 | 1,092,625 | 948,283 | 776,102 | ||||||||||
Provision for severance indemnities | 2,649 | — | 340 | 1,884 | 1,162 | ||||||||||
Bank Loans | 141,600 | 209,731 | 354,679 | 372,209 | 484,194 | ||||||||||
Current maturities of long-term debt | 85,512 | 58,195 | 58,528 | 296,200 | 59,527 | ||||||||||
Current maturities of bonds | 26,255 | 82,059 | 200,235 | 265,436 | 302,251 | ||||||||||
Commercial Papers | 252,864 | 308,370 | 378,007 | 341,343 | 320,186 | ||||||||||
Total current liabilities | 1,950,580 | 2,022,643 | 2,412,697 | 2,682,845 | 2,424,234 | ||||||||||
LONG-TERM DEBT | 314,334 | 361,315 | 372,260 | 314,350 | 819,525 | ||||||||||
BONDS | 908,221 | 859,556 | 680,296 | 513,624 | 459,895 | ||||||||||
GUARANTY DEPOSITS | 104,226 | 104,792 | 103,249 | 100,261 | 99,069 | ||||||||||
DEFERRED EARNINGS | 1,011,826 | 1,040,718 | 1,052,516 | 1,036,814 | 1,073,031 | ||||||||||
SHAREHOLDERS’ EQUITY | |||||||||||||||
Capital stock | 2,953,479 | 2,953,479 | 2,953,479 | 2,953,479 | 2,953,479 | ||||||||||
Legal reserve | 352,676 | 352,676 | 352,676 | 349,450 | 349,450 | ||||||||||
Retained earnings | (4,595 | ) | 37,995 | 18,888 | 178,373 | 167,055 | |||||||||
TOTAL SHAREHOLDERS’ EQUITY | 3,301,560 | 3,344,150 | 3,325,043 | 3,481,302 | 3,469,984 | ||||||||||
TOTAL LIABILITIES AND SHAREHOLDERS’ EQUITY | 7,590,747 | 7,733,174 | 7,946,061 | 8,129,196 | 8,345,738 | ||||||||||
| (1) | Data is adjusted according to the WPI published by the National Statistics Institute |
| (2) | Accounts receivable—LT with T. Móviles current maturity is S/.224 998 thousand, which is included at “other accounts receivable” |
TABLE 3
TELEFONICA DEL PERU S.A.A. AND SUBSIDIARIES
Statistical Data, End of Period Figures
| 4Q02 | 1Q03 | 2Q03 | 3Q03 | 4Q03 | 4Q03- 4Q02 | 4Q03/4Q02 | ||||||||||
Fixed-Wire Telephone Service: Local and Long Distance | ||||||||||||||||
Lines Installed | 2,028,913 | 2,032,817 | 2,037,097 | 2,107,791 | 2,145,345 | 116,432 | 5.7 | |||||||||
Profits (losses) in Lines in Service, net | 21,574 | 16,661 | 33,991 | 46,152 | 49,052 | 27,478 | 127.4 | |||||||||
Lines in Service Including Public Telephones (1) | 1,809,598 | 1,828,732 | 1,866,171 | 1,915,191 | 1,963,554 | 153,956 | 8.5 | |||||||||
Local Traffic—Minutes (000) (2) | 1,682,638 | 1,633,096 | 1,499,533 | 1,482,289 | 1,466,274 | (236,364 | ) | (14.0 | ) | |||||||
Long Distance—Minutes (000) (3) | 198,524 | 205,907 | 226,751 | 239,200 | 241,167 | 42,643 | 21.5 | |||||||||
Number of Employees (Telefónica del Perú and Subsidiaries) | 4,874 | 5,217 | 5,058 | 5,004 | 4,920 | 46 | 0.9 | |||||||||
Number of Employees (Telefónica del Perú) | 3,366 | 3,566 | 3,454 | 3,413 | 3,316 | (50 | ) | (1.5 | ) | |||||||
Lines in Service per Employee (Telefónica del Perú) (1) | 538 | 513 | 540 | 561 | 592 | 54 | 10.1 | |||||||||
Digitalization Rate (%) | 96.1 | 96.1 | 96.1 | 96.2 | 96.3 | 0.2 | 0.2 | |||||||||
Lines in Service per 100 inhabitants | 6.8 | 6.8 | 6.9 | 7.0 | 7.2 | 0.4 | 5.9 | |||||||||
PUBLIC TELEPHONES | ||||||||||||||||
Lines in Service (4) | 107,280 | 109,788 | 113,285 | 116,159 | 115,614 | 8,334 | 7.8 | |||||||||
BROAD BAND | ||||||||||||||||
Lines in Service | 34,389 | 43,543 | 54,435 | 68,197 | 90,689 | 56,300 | 163.7 | |||||||||
CABLE TV | ||||||||||||||||
Subscribers | 340,001 | 340,163 | 345,016 | 355,011 | 363,088 | 23,087 | 6.8 | |||||||||
| (1) | Excluding Cellular Public Phones, Publifón and rurals |
| (2) | Including traffic F2F billing (voice and internet), M2F anf F2M |
| (3) | Including prepaid F2F prepaid (voice and internet). |
| (4) | Including Cellular Public Phones |
SIGNATURES
Pursuant to the requirements of the Securities Exchange Act of 1934, the registrant has duly caused this report to be signed on its behalf by the undersigned, thereunto duly authorized.
| TELEFÓNICA DEL PERÚ S.A.A. | ||||||
Date: February 23, 2004 | By: | /s/ MARÍA ANA BRIGNETI SUITO | ||||
| Name: | María Ana Brigneti Suito | |||||
| Title: | Director of Legal Matters and Proceedings | |||||