UNITED STATES
SECURITIES AND EXCHANGE COMMISSION
Washington, D.C. 20549
FORM 10-K
| (Mark One) | ||
ý | ANNUAL REPORT PURSUANT TO SECTION 13 OR 15(d) OF THE SECURITIES EXCHANGE ACT OF 1934 | |
For the fiscal year ended December 31, 2008 | ||
or | ||
o | TRANSITION REPORT PURSUANT TO SECTION 13 OR 15(d) OF THE SECURITIES EXCHANGE ACT OF 1934 | |
For the transition period from to . | ||
Commission file number: 000-28229
Caliper Life Sciences, Inc.
(Exact name of registrant as specified in its charter)
| Delaware (State or other jurisdiction of incorporation or organization) | 33-0675808 (I.R.S. Employer Identification No.) | |
68 Elm Street, Hopkinton, MA (Address of principal executive offices) | 01748 (Zip Code) |
(Registrant's telephone number, including area code)(508) 435-9500
Securities registered pursuant to Section 12(b) of the Exchange Act:
| Title of each class | Name of exchange on which registered | |
|---|---|---|
| Common Stock, $0.001 Par Value Per Share | The NASDAQ Stock Market LLC |
Securities registered pursuant to Section 12(g) of the Exchange Act: None
Indicate by check mark if the registrant is a well-known seasoned issuer, as defined in Rule 405 of the Securities Act. Yes o No ý
Indicate by check mark if the registrant is not required to file reports pursuant to Section 13 or Section 15(d) of the Exchange Act. Yes o No ý
Indicate by check mark whether the registrant (1) has filed all reports required to be filed by Section 13 or 15(d) of the Securities Exchange Act of 1934 during the preceding 12 months (or for such shorter period that the registrant was required to file such reports), and (2) has been subject to such filing requirements for the past 90 days. Yes ý No o
Indicate by check mark if disclosure of delinquent filers pursuant to Item 405 of Regulation S-K is not contained herein, and will not be contained, to the best of registrant's knowledge, in definitive proxy or information statements incorporated by reference in Part III of this Annual Report on 10-K or any amendment to this Annual Report on 10-K. ý
Indicate by check mark whether the registrant is a large accelerated filer, an accelerated filer, a non-accelerated filer, or a smaller reporting company. See the definitions of "accelerated filer," "large accelerated filer" and "smaller reporting company" in Rule 12b-2 of the Exchange Act. (Check one):
| Large accelerated filer o | Accelerated filer ý | Non-accelerated filer o (Do not check if a smaller reporting company) | Smaller reporting company o |
Indicate by check mark whether the registrant is a shell company (as defined in Rule 12b-2 of the Exchange Act). Yes o No ý
The aggregate market value of the registrant's voting and non-voting common stock held by non-affiliates of the registrant (without admitting that any person whose shares are not included in such calculation is an affiliate), as of the last business day of the registrant's most recently completed second fiscal quarter was $125.0 million.
As of February 28, 2009, the registrant had 48,638,148 shares of common stock outstanding.
DOCUMENTS INCORPORATED BY REFERENCE
Certain information required in Part III of this Annual Report on Form 10-K is either incorporated from the Registrant's Definitive Proxy Statement for the Registrant's 2009 Annual Meeting of Stockholders or from a future amendment to this Annual Report on Form 10-K, in either case to be filed with the Securities and Exchange Commission not later than 120 days after the end of the fiscal year covered by this Annual Report on Form 10-K.
CALIPER LIFE SCIENCES, INC.
FORM 10-K
For the Fiscal Year Ended December 31, 2008
TABLE OF CONTENTS
INFORMATION REGARDING FORWARD-LOOKING STATEMENTS
This Annual Report on Form 10-K contains forward-looking statements within the meaning of Section 27A of the Securities Act of 1933, and Section 21E of the Securities Exchange Act of 1934. These statements relate to future events or our future financial performance. We have identified forward-looking statements by terminology denoting future events such as "anticipates," "believes," "can," "continue," "could," "estimates," "expects," "intends," "may," "plans," "potential," "predicts," "should" or "will" or the negative of these terms or other comparable terminology. These statements are only predictions and involve known and unknown risks, uncertainties and other factors, including the risks outlined under Part I, Item 1A, "Risk Factors," and under "Factors Affecting Operating Results" contained in Part II, Item 7, "Management's Discussion and Analysis of Financial Condition and Results of Operations," that may cause our actual results, levels of activity, performance or achievements to be materially different from any future results, levels or activity, performance or achievements expressed or implied by these forward-looking statements.
Although we believe that the expectations reflected in the forward-looking statements are reasonable, we cannot guarantee future results, levels of activity, performance or achievements. Our expectations are as of the date we file this Annual Report on Form 10-K, and we do not intend to update any of the forward-looking statements after the date we file this Annual Report on Form 10-K to conform these statements to actual results, unless required by law.
Overview
Caliper Life Sciences, Inc. develops and sells innovative and enabling products and services to the life sciences research community, a customer base that includes pharmaceutical and biotechnology companies, and government and other not-for-profit research institutions. We believe our integrated systems, consisting of instruments, software and reagents, our laboratory automation tools and our assay and discovery services enable researchers to better understand the basis for disease and more effectively discover safe and effective drugs. Our strategy is to transform drug discovery and development by offering technologies and services that ultimately enhance the ability to predict the effects that new drug candidates will have on humans.
We believe that increasing the clinical relevance of drug discovery experimentation, whether at early stage, lower cost in vitro (in an artificial environment) testing or later stage, more expensive, pre-clinical in vivo (in a living organism) testing, will have a profound impact in helping our customers to determine the ultimate likelihood of success of drugs in treating humans. With enabling offerings in both the in vitro and in vivo testing arenas, and a unique strategy of enhancing the "bridge" or linkages between in vitro, in vivo and the clinic in order to optimize the cost of the experiment versus the clinical insight gained, we expect to continue to address growing, unmet needs in the market and drive on-going demand for our products and services. These market needs are underscored by key challenges that face the pharmaceutical and biotechnology industry, including late-stage drug failures and unforeseen side effects coming to light late in the development process or even after drugs are on the market.
We presently offer an array of products and services, many based on highly enabling proprietary technologies that address critical experimental needs in drug discovery and pre-clinical development, and related processes including drug formulation and quality control. Our technologies are also enabling for other life sciences applications beyond drug discovery, such as environmental-related testing, and in applied markets such as agriculture and forensics. We also believe that our technology
1
platforms may be able to provide ease of use, cost and data quality benefits for certain in vitro and in vivo diagnostic applications.
Caliper was organized under the laws of the State of Delaware on July 26, 1995. Our principal executive offices are located at 68 Elm Street, Hopkinton, Massachusetts 01748, and our telephone number is (508) 435-9500. Our website address iswww.caliperLS.com. Our Annual Reports on Form 10-K, Quarterly Reports on Form 10-Q, Current Reports on Form 8-K, and all amendments to those reports, are available to you free of charge through the Investor Relations section of our website as soon as reasonably practicable after such materials have been electronically filed with, or furnished to, the SEC. The contents of our website are not part of this Annual Report.
Market Opportunity
We serve a worldwide market that consists of tens of thousands of laboratories in pharmaceutical and biotechnology companies, and governmental and not-for-profit institutions engaged in life sciences research. These companies and institutions seek to understand ways to increase the quality and length of human life by gaining new insights related to basic human biology, discovering and developing new cost-effective therapies and diagnosing disease, at a molecular level, in vitro, in living cells and in live animal models.
The pharmaceutical and biotechnology industries faces intense competitive and regulatory pressure to more effectively discover and deliver safe new drugs. The regulatory bodies seek to improve the drug approval process to ensure that the right drugs are approved as quickly as possible and drugs with dangerous side-effects are not brought to market. Governments want cost-effective drugs for their populations. As highlighted in the FDA Critical Path Initiative, new research methods and better experimentation models are essential to improve predictability and efficiency along the long and expensive path leading from discovery in the laboratory to commercially available drugs. We believe our solutions directly enable efficiencies derived from improved quality of data, novel biological insights, cost-effective experiments and better translation of early stage experimentation into expected results in the clinic.
We believe that the combination of our proprietary in vivo imaging and in vitro microfluidic technologies along with our automation expertise address these key research needs. We also believe that our technologies offer insights that cannot be obtained through other means, exceptional data quality and productivity advantages, and that the portfolio of solutions we provide is a novel foundation to offer a highly correlated suite of products and services that should result in earlier, clinically relevant insights in the drug discovery process.
More specifically, our products and services are designed to enable researchers performing drug discovery functions such as in vitro and in vivo screening and profiling of compounds against disease targets, lead optimization, toxicology, biomolecule separation and quantification, sample preparation and cell-based assays (which are the various steps that are typically used to identify, advance and validate potential preclinical drug candidates) to reduce costs, increase data quality and standardize efficient analytical techniques. We also provide solutions for drug dosage and formulation testing.
Our in vitro product and service offerings incorporate microfluidic and automation technology to provide tools, services and complete integrated systems to perform assays. Our high quality in vitro application solutions allow researchers to integrate and automate experiments to achieve improved data accuracy and reproducibility at a reduced cost and higher speed, leading to expanded individual researcher capability and improved enterprise-wide productivity.
We believe that our in vivo product and service offerings allow researchers unprecedented visibility into molecular level biological processes inside living animal models. Single animals can be studied over a period of time to track, for example, disease progression or the effect of a drug candidate compound.
2
Conventional technology requires a larger population of animals and the animals would have to be sacrificed at various time points to allow them to be invasively examined. Further, since our proprietary imaging technology is highly sensitive, we can enable researchers to see just a few cells of interest within the living animal model. This provides enabling capabilities in a variety of therapeutic areas including cancer, for example, where metastases can be detected well before conventional methods allow. Light Producing Transgenic Animal (LPTA) models can be engineered to allow detection of biological events of interest at the molecular level, such as gene expression, and this level of direct insight goes far beyond what can be determined from a test tube experiment.
Our product and service offerings are organized into three core business areas—Optical Molecular Imaging (Imaging), Discovery Research (Research), and Caliper Discovery Alliances and Services (CDAS)—with the goal of creating a more scalable infrastructure while putting increased focus on growth and profitability.
- •
- The Imaging business is focused on preclinical imaging, where Caliper holds a global leadership position in the high growth optical molecular imaging market. Principal activities of this business area include the expansion of the IVIS imaging instrument and related reagent product lines, development of new therapeutic area applications and facilitating additional imaging modalities.
- •
- Research is responsible for utilizing Caliper's core automation and microfluidic technologies to address an expanding array of opportunities in drug discovery and life science research, including molecular biology sample preparation for genomics, proteomics, cellular screening and forensics.
- •
- CDAS is responsible for expanding drug discovery collaborations and alliances, and increasing sales of drug discovery services. The focus of CDAS is to capitalize on market "outsourcing" trends and to maximize the large contract opportunity with the Environmental Protection Agency under its ToxCast screening program.
Technologies
Imaging
Our optical imaging solutions allow researchers to observe and quantify, noninvasively and at the molecular level, biological events such as disease progression and drug efficacy in living small animal models. We refer to this process as "molecular imaging." Our technology enables researchers to follow, for example, the quantitative spread of a disease, or effects of a drug at the molecular level, in the same animal over a period of time. These noninvasive "longitudinal studies" provide more meaningful information and require a smaller number of animals to complete a study than conventional methods.
In vivo preclinical research involves studies on animal models and is a required step before clinical (human) research. Experiments performed on mice, for example, are expected to provide insights regarding disease in humans and how particular drug candidate compounds may impact the disease. Conventional approaches to preclinical research may involve, for example, phenotypic observations regarding mouse appearance and behavior, measurement of tumor size with mechanical calipers and/or sacrificing the animal for pathological examination. In contrast, our proprietary optical imaging technology enables real-time quantitative observation of molecular activity within the living animal. For example, the researcher can determine if a cancer is spreading, even a few cells at a time. They can explore whether a tumor that is growing in size is actually dying and filling with water, or whether the cancer cells are continuing to divide and grow at an uncontrolled rate. We provide optimized imaging systems, animal models and reagents to enable this research.
We have a proprietary method for noninvasive imaging. A key component of this method is the genetic modification of an organism, cell or animal to produce light that can be detected noninvasively when a specific molecular event of interest occurs from within a living animal model. We offer two detection modalities—bioluminescence and fluorescence. Bioluminescence entails inserting the firefly
3
gene, luciferase, into the genetic makeup of the animal or cells injected into the animal so when a gene of interest is expressed, the firefly gene is also expressed. The expression of the firefly gene (luciferase), when the right reagent substrate is present, produces light which can be detected through the skin of the animal. The other mode of detection, fluorescence, occurs when an external light source excites a molecule within the animal, causing the molecule to produce its own light at a different wavelength. These fluorescent molecules can be genetically inserted into the animal, or can consist of dye that is injected into the animal or cell line going into the animal. We offer a full line of LPTA models, proprietary cell lines and microorganisms, and reagents to support both bioluminescence and fluorescence based research.
Microfluidics
We believe our LabChip products provide significant advances in laboratory experimentation based on microfluidic chips, which consist of a network of miniaturized channels in which experiments are performed. Our systems include an instrument, software that controls the experiment and detects results, and a kit containing the chip and reagents optimized for the assay to be performed. Our chip technology can be configured for automated processing of large numbers of samples, or on a "personal scale" for just a few samples at a time in a more interactive mode with the researcher. The chip provides a highly controlled, miniaturized environment that integrates multiple experimental steps into a single workflow, thus resulting in an easy to use solution designed to produce exceptional quality results.
Features of LabChip System
- •
- Miniaturization. By fitting entire experiments onto a microfluidic chip, the environment of the experiment can be highly controlled for reproducible and accurate results. Additional benefits include requiring only a very small amount of what is often a precious sample and reduced consumption of often very expensive reagents. In many applications using our LabChip systems, the sample volume needed can be reduced up to 100,000-fold over conventional systems. In some processes within the chip, reagents are dispensed in the microchannels in volumes down to as low as a trillionth of a liter.
- •
- Integration. Integration involves combining multiple processes into a single process, or the inclusion of multiple functions into one device. Today many laboratory systems perform only one or two steps of an experimental protocol. Our LabChip systems can integrate complete experiments involving half a dozen or more steps into one continuous process performed on a single chip.
- •
- Automation. Many laboratory experiments are performed in multiple manual steps. With our LabChip systems, entire experiments can be automated and performed inside a chip using one instrument, freeing up valuable research time and laboratory space and reducing labor requirements.
Key Benefits of LabChip Systems
- •
- Improved Data Quality and Accuracy. Our LabChip systems are designed to produce data that are more clear, accurate, consistent and reproducible. We achieve this by reducing the opportunity for human error through increased automation, reducing the variability caused by the use of multiple instruments through integration of an application on a single system, and establishing a highly-controlled environment inside the chip that ensures consistent processing of samples. Further, the microfluidic environment can enable expanded analytical capabilities in the workflow. For example, biochemical screening assays typically call for fast measurements of a complex experimental mixture that contains the molecules of interest as well as other materials.
4
- •
- Improved Sensitivity. When screening against drug targets, such as kinases, the higher quality data from our LabChip systems allows customers to detect more subtle drug compound activities than can be detected with traditional microplate well-based assays. This has two advantages: (1) an increase in the pool of potential lead compounds, and (2) the possibility that a "hit" found at lower levels of inhibition will be more selective for the target of interest than a hit found at higher levels of inhibition because compounds that hit at higher levels of inhibition may also produce unacceptable levels of inhibition on other, non-target kinases.
- •
- Reduced Reagent and Labor Cost. Our LabChip systems utilize only a small fraction of the usual amount of expensive reagents used in experiments performed in test tubes, 96-well plates, or 384-well plates, and reduce the labor involved in each experiment. We believe that saving on reagent and labor costs will enable pharmaceutical companies to expand the scale of experimentation in ways that would otherwise not be commercially feasible.
- •
- High Speed. We believe our LabChip systems can, depending on the application, accelerate the time it takes to conduct some experiments as much as 100-fold or more. For example, molecular separations such as electrophoresis may take two hours or more using conventional equipment. Using a chip, however, these separations can be performed in less than one minute.
- •
- Faster Assay Development. Traditional assays, particularly those used for enzymatic screening, can require complex and time-consuming assay development. For example, some popular assays rely on developing specific antibodies for the assay—a process that can take up to six weeks or more. Because our LabChip assays eliminate the requirement for assay development steps such as antibody preparation, they are much faster to develop. In addition, we have exploited the predictable nature of fluid and reagent movement inside microfluidic channels and have developed software tools to facilitate the process of optimizing the experimental conditions necessary for a successful enzymatic assay on a LabChip device, such as separating a substrate peptide from its product. Typically, our customers have found that these combined benefits shorten a two- to three-month assay development process for a traditional assay to just a week or two for a LabChip assay.
- •
- Expanded Individual Researcher Capability. Because our LabChip systems can combine a multi-step, complex experiment into one step, we believe that individual researchers can perform experiments that were previously outside their areas of expertise. By comparison, with conventional, non-integrated equipment, researchers need to master the complexities of performing each individual step.
- •
- Improved Enterprise-Wide Productivity. We believe that our LabChip systems improve data quality and reproducibility so much that researchers will be able to utilize data generated outside their laboratory or organization if such data was generated on a LabChip system. This has the potential to greatly improve enterprise-wide productivity by supporting data sharing and reducing the need to repeat experiments. For example, a typical primary screen produces approximate, "yes/no" answers about the activity of library compounds against a particular kinase target, and therefore the information from such primary screens is only useful for one primary screening experiment. With LabChip assays, the primary screening data is more specific in terms of the degree of inhibition, and more reproducible. This could enable an organization to build a
Reducing the volume size of the experiment allows for rapid separation and measurement of individual molecular species in the test mixture, which in turn enhances the accuracy of the overall result. With higher quality data, our customers can make better decisions earlier in the drug discovery and development process. This enables our customers to avoid the time and expense of performing additional analyses and experiments on "false positive" results from their primary screening experiments.
5
database of primary screening data that could ultimately be mined by other scientists within the organization who are interested in a particular compound/target interaction.
Automation and Liquid Handling
We offer a full range of in vitro technologies that includes high-throughput screening systems, liquid handlers, advanced robotics and storage devices which are primarily marketed to the drug discovery and life sciences research market.
Our advanced liquid handling systems provide fast and accurate liquid transfers for 96-, 384- and 1536-well microplates, and are designed to enable scientists to automate and accelerate time- and labor-intensive tasks resulting in increased walkaway time and improved data quality. Our family of liquid handling instruments and integrated systems supports a wide range of applications related to the target identification and target validation phases of the drug discovery process. Adapted to support the rapidly changing nature of research in life science, our liquid handlers are well-suited for genomics applications, cell-based assays, absorption, distribution, metabolism, excretion, and toxicity (ADME/Tox) screening and enzymatic assays.
Our microplate management and storage automation systems provide users with the ability to automate several lab instruments and build completely automated work cells, with expandable storage capacity, to enable valuable walk-away time for scientists and researchers.
Genetically Modified Animals
Additionally, through CDAS, comprised of our NovaScreen Biosciences and Xenogen Biosciences subsidiaries, we offer to biopharmaceutical companies and biomedical researchers animal production and phenotyping services to create both traditional and bioluminescent transgenic animal models to test the effects of a drug on, or the role of a gene or protein in, these relevant model systems. Whereas previously, biopharmaceutical companies tended to perform all research and development in-house, there is a trend in recent years to focus in-house research and development departments on core competencies, and to outsource specific technologies and products to specialized service providers and vendors. As a result, a large industry segment has formed in recent years to deliver various specialized technologies and services to biopharmaceutical companies. Over the years, our scientists have offered many of these specialized technologies, including the creation and phenotypic characterization of transgenic and gene knockout animals, in vivo evaluation of compounds at various stages of development (including repositioning of existing drugs for new therapeutic uses), and utilization of molecular imaging to perform biodistribution, drug delivery and/or drug efficacy studies. Specifically, the technology most relied upon for target validation within the pharmaceutical industry today is gene knockout technology in concert with comprehensive phenotypic analysis. Genetically engineered mice can be highly informative in the discovery of gene function and pharmaceutical utility of a potential drug target, as well as in the determination of the potential side effects associated with a given target. Aside from whether a gene is a good drug target, genetically engineered animals also provide invaluable models to assess the pharmacology, and increasingly the toxicology, of drug candidates, making them well-accepted validation models. CDAS' experience includes creating and characterizing these types of animal models, creating transgenic animal models, and producing thousands of unique genetically-modified lines for academic, government and commercial customers.
Products and Services
The following discussion summarizes our products and services portfolio as of December 31, 2008.
6
Imaging Systems
IVIS Imaging Systems and Living Image Software. Our IVIS imaging systems are the leading preclinical optical molecular imaging solution. IVIS imaging systems are an integrated instrument solution for the researcher, at the core of which are a highly sensitive camera, optimized optics for high sensitivity detection of light produced from within animal models, and specialized software to capture and analyze images of the light producing animals. Caliper IVIS systems enable both bioluminescence and fluorescence detection, a useful combination of capabilities that enables a broad range of research. The original IVIS system was introduced in 2000, and since then, new models have been introduced that offer assorted new features and benefits, including higher throughput and sensitivity. The throughput, image resolution and analytical capabilities differ by IVIS model, and address different end user needs. From the leading optical imaging platform for in vivo analysis, IVIS systems are supported by a range of practical accessories developed through experience in research laboratories worldwide. IVIS optical imaging systems offer advantages, including ease of use, higher throughput and no radioactivity, all in a reasonably priced instrument platform. Further, Caliper's Living Image software and mouse handling accessory items facilitate efficient workflows for animal studies. Our portfolio of imaging systems includes the following:
IVIS Spectrum. The IVIS Spectrum in vivo optical imaging system can perform high sensitivity bioluminescent imaging and advanced fluorescent imaging, including spectral unmixing, trans-illumination, and 3 dimensional (3D) tomographic capabilities. With an optical switch to move from epi-illumination (reflection or top illumination) to trans-illumination (bottom illumination), IVIS Spectrum maintains high throughput capability, while providing increased sensitivity in fluorescent imaging. This dual illumination capability enables tomographic localization of both shallow and deep tumors in 3 dimensional and reduces background interference.
IVIS 200. The IVIS Imaging System 200 Series is an advanced single-view 3D optical imaging system designed to improve quantitative outcomes of in vivo imaging, using Caliper's novel patented optical imaging technology to facilitate noninvasive longitudinal monitoring of disease progression, cell trafficking and gene expression patterns in living animals. IVIS 200 Series' instrumentation and software allow researchers to better account for the effects of photon absorption and scattering in tissue, making bioluminescent source measurements more quantitative.
IVIS Kinetic. Introduced in 2008, the IVIS Kinetic system provides a real time, fast imaging system enabling acquisition of biologically relevant events within milliseconds. The IVIS Kinetic system can perform both quantitative luminescence and fluorescence as a standard high signal to noise imager and as a high speed imager. The system includes a highly sensitive EMCCD camera for signal enhancement and the ability to reduce exposure times enabling fast kinetics. The IVIS Kinetic system also offers a light-tight injection port which supports a syringe injector system enabling real time compound and/or substrate administration.
IVIS Lumina II. The IVIS Lumina II provides an expandable, sensitive imaging system that is easy to use for both fluorescent and bioluminescent imagingin vivo. The system includes a highly sensitive CCD camera, light-tight imaging chamber and complete automation and analysis capabilities.
Method Licenses. We control fundamental method patent rights that we provide to our customers covering certain methods of optical imaging. Commercial customers pay us a license fee for the right to practice our proprietary optical imaging methods.
IVIS Options and Accessories. We offer numerous options and accessories to expand our IVIS workstations, which are sold separately from the imaging systems. Our standard accessory package includes a calibration unit to ensure the overall performance and accuracy of the light sources used in the system as well as a small animal holding unit. We also offer an anesthesia accessory package, which
7
is designed to work with all of our IVIS imaging systems. Our anesthesia package integrates a gas delivery system into the imaging chamber, so that mice or other small animals can be anesthetized when placed in the IVIS imaging system, thus minimizing gas exposure to lab personnel. We also provide an electrocardiograph monitoring accessory to monitor animal heart activity during imaging.
Bioware Products—Light-Producing Cells and Microorganisms. Our Bioware lines of light-producing cells and microorganisms enable researchers to analyze the spread and treatment of cancer and infectious diseases, as well as to study immunology. In April 2008, we introduced Bioware Ultra cell lines. Bioware Ultra cell lines are 10 to 100 times brighter than cell lines created using traditional methods, which allows researchers, for the first time ever, to detect a single cancer cell in an animal via noninvasive in vivo imaging. We currently offer approximately 29 lines of light-producing microorganisms, including E. coli, Pseudomonas, Salmonella and other gram negative bacteria, as well as Staphylococcus aureus, Streptococcus pneumonia and other gram positive bacteria. We have also developed approximately 16 tumor cell lines for breast, melanoma and prostate cancer. In addition, we are able to create custom light-producing microorganisms and tumor cell lines in accordance with the needs of our customers. All of our Bioware products are optimized to work with our IVIS imaging systems.
LPTA Models. Our LPTA models are mouse models that have been genetically altered to incorporate the firefly gene, luciferase, into pathway-specific model animals that enable researchers to analyze gene expression, protein activity and disease progression. We currently have over 40 types of commercially available, therapeutically-relevant LPTA models designed to assist researchers in the areas of metabolic diseases and liver failure, inflammation and drug metabolism. We are developing and in-licensing other types of LPTA models for use in the areas of cardiovascular disease, diabetes, cancer, inflammation, metabolic disease, neurodegeneration and toxicity. In addition, we are able to create customized LPTA models in accordance with customer specifications. All of our LPTA models are optimized to work with our IVIS imaging systems.
Reagents. We offer several types of reagents for use in connection with our Bioware products and LPTA models. Our offerings include luciferin, a chemical compound that is introduced into cells and organisms to produce bioluminescence, and XenoFluor fluorescent labeling kits for fluorescent imaging.
Microfluidics Systems
LabChip GX and GXII Microfluidic Systems. In July 2008, we introduced two microfluidics-based separations products, the LabChip GX and LabChip GXII benchtop systems, for fast, automated, one dimensional electrophoretic separations of protein, DNA, and RNA samples. The LabChip GX represents a low price entry system targeted at genomics applications, while the GXII combines both genomics and protein research applications. The LabChip GX series of instruments is designed to provide scientists novel benefits including extended walk away time, higher throughput and economical plate processing ability.
LabChip EZ Reader, EZ Reader II and ProfilerPro Kits. The EZ Reader systems and ProfilerPro reagent kits provide a convenient, affordable approach to turnkey kinase profiling and screening and mechanistic studies for a broad range of enzymatic targets which includes phosphodiesterases, histone deacetylases, proteases, phosphatases, G-protein coupled receptors (GPCRs) and many other target classes. In particular, kinases are an important class of drug discovery targets since they have been shown to play a role in cancer and cardiovascular disease, as well as other diseases. A typical kinase drug development program will focus on finding lead compounds that inhibit a particular kinase thought to play a role in the disease being studied. As scientists learn more about the human "kinome," the collective term for the 518 different kinases found in the human body, they also are becoming increasingly concerned about the interactions of lead compounds on non-target kinases, and
8
the potential adverse side effects resulting from these interactions. As a result, selectivity or "profiling" screens, where lead compounds are screened against a representative group of human kinases, are increasingly becoming a routine part of drug discovery programs. Our ProfilerPro kinase panel plate kits presently consist of a representative 96 kinases that are pre-dispensed into 384-well microplates, and the library continues to grow. This diverse set of kinases spans the human kinome, and is highly relevant in a variety of therapeutic research areas including oncology, the central nervous system, cardiovascular disease, inflammation and diabetes.
Automation and Liquid Handling Systems
Caliper Sciclone. Our Caliper Sciclone Automated Liquid Handling (ALH) series features interchangeable 96- and 384-channel pipetting heads that can pipette and dispense volumes from 100 nanoliters to 200 microliters into and out of standard laboratory testing microplates. The Caliper Sciclone liquid handler offers multiple accessories such as an independent 8-channel pipettor for single-well access, and bulk reagent dispense modules for efficient reagent broadcasting. Other available accessories include the Sciclone gripper, microplate shakers, a positive pressure filtration system, and temperature-controlled locators. The control software enables ease-of-use capabilities and supports 21 CFR Part 11 compliance, an important regulatory requirement for researchers developing drugs. The Caliper Sciclone liquid handler can be used as a standalone instrument, or integrated in a more complete system that incorporates automated microplate carriers such as our Twister robot, and other analytical instruments.
Zephyr. The Zephyr liquid handling instrument is a compact, low-cost, multi-channel liquid handling system. Zephyr is designed to handle key applications for compound management, high-throughput screening (HTS), genomics, proteomics and bio-analytical assays, as well as numerous commercially available kits. These applications include: DNA/RNA purification clean-ups, polymerase chain reaction (PCR) setup, protein precipitation, solid phase extraction (SPE), protein purification solubility assays, kinase assays and cell-based assays. Zephyr's small footprint makes it ideal for workbench operation, while the convenient deck design provides ready access to consumables and accessories from all four sides.
Staccato Automated Workstations. Staccato workstations provide fast, reliable and scalable automation for drug discovery, genomics, proteomics and drug development laboratories. Staccato systems are available in three base configurations: Mini Workstation Series, Application Series and Custom Systems Series. Staccato Mini Workstations offer the minimal amount of equipment required to automate basic liquid handling and material management tasks. Staccato Application Series are pre-configured and pre-integrated solutions for common applications such as plate reformatting and replication, hit-picking, enzyme-linked immunosorbent assays (ELISA), and a variety of cell-based assays. Staccato custom systems use proven automation-friendly building blocks, iBlox, that are designed into custom configurations as dictated by the needs of the user. In January 2008, we announced the formation of our Automation, Consulting, Engineering & Services (ACES) team to create customized, multi-vendor automation solutions. The ACES team includes engineers and scientists with deep experience in mechanical and electrical engineering, software development, assay development, automation and project management. The team works with biotech, pharmaceutical and academic R&D laboratories to create solutions that leverage existing and new technology investments from multiple vendors via one Caliper-supported, integrated solution.
Twister I and II. The Twister Universal Microplate Handler automates the movement of microplates to and from a microplate reader, washer, or other microplate-processing instrument. Twister I has a capacity of 80 microplates, and is used as a dedicated autoloader with a wide variety of scientific instruments. The Twister II provides increased integration capabilities and increased handling up to 320 standard microplates.
9
TurboVaps. The TurboVap family of evaporators covers a wide range of formats from microplates to tubes and accommodates the fast unattended concentration or evaporation of any size sample up to 500mL.
RapidTrace. The RapidTrace SPE Workstation is a modular, highly scalable, automated sample prep high throughput Solid Phase Extraction (SPE) platform. Utilizing 1 mL or 3 mL industry standard SPE cartridges, the RapidTrace can process up to 100 samples in less than two hours unattended. Each module can be loaded with 10 cartridges, and up to 10 modules can be connected together and controlled through a simple, easy-to-use software package. The RapidTrace has been designed to eliminate SPE bottlenecks, so that labs can realize the full benefit of today's powerful and costly analytical instruments.
Services
We provide a wide range of services to our customers. Our service offerings include:
Contract Research and Transgenic Animal Services. We perform research projects and studies for customers on a contract basis, including in vivo compound profiling and animal model research and development. In addition, we provide professional services for the production of transgenic and gene knockout animals. We have created a portfolio of transgenic animals comprising over 9,000 unique lines proprietary to our clients for use by researchers in a wide range of research and drug discovery and development areas.
Most of this work entails contracts for which the performance extends over multiple years. For example, we have collaborative research agreements with Pfizer, Bristol-Myers Squibb and other companies to characterize the physiological effects associated with the loss of function of a single gene. Multi-year agreements such as these allow us to utilize our in vivo serial phenotyping compression technology (SPCT) to interrogate the functional profile of knockout mice by "knocking out" specific genetic targets in mice. Over the years, the phenotypic characterization of genetically-modified mice, when compared to non-modified control groups, using SPCT has produced extensive data about numerous drug discovery targets and has contributed to timely and cost-effective decision-making. CDAS has phenotypically characterized over 150 gene knockout lines of mice for Pfizer.
CDAS' phenotyping program includes over 85 standardized and validated bioassays, or challenge assays, designed to profile key physiological pathways associated with various disorders, including allergic disorders, arthritis, cardiovascular diseases, diabetes, immunology/inflammation, neuron-degeneration, obesity, osteoporosis, pain, psychiatric disorders, sexual health, and urological disorders. More importantly, CDAS' proprietary methodology allows our scientists to perform multiple assays on a group of animals, maximizing the data set per animal without compromising data integrity, resulting in fewer animals used, faster timelines and significantly improved cost economics.
In addition, CDAS entered into a 10-year animal production agreement with the National Institute of Environmental Health Sciences (NIEHS) in September 2007. This multi-year agreement focuses on the development of novel genetically-modified animal models, either via gene addition (i.e., transgenic mice) or gene targeting (i.e., gene knockout mice).
Drug Discovery and Development Services. Through CDAS, we are also able to provide innovative drug discovery and development services designed to improve the productivity, accelerate the pace and reduce the cost of pharmaceutical research and development. CDAS develops and offers a wide range of primary and secondary screening, profiling and assay development services to major pharmaceutical, biotechnology and academic research institutions worldwide. In addition to its core screening and assay development services in pharmacology, CDAS provides in vitro ADME/TOX services. We also offer screening, pharmacological testing and database development to government agencies such as the National Institutes of Health (NIH), in particular, the National Institute on Drug Abuse (NIDA). In
10
addition, we have developed a content database and pharmacoinformatics tools that provide statistical predictability in the drug discovery process.
Environmental Testing. Under the U.S. Environmental Protection Agency's ToxCast program, CDAS was awarded a contract to assist the EPA in developing new approaches to identify toxic environmental chemicals. Under this contract, CDAS will test compounds provided by EPA through up to 240 different in vitro screening assays for molecular targets that may potentially play a role in mechanisms of toxicity in humans or other animals. During 2007 and 2008, screening was performed by CDAS for the first set of 320 chemicals from EPA. These screening data will be used to create a database and build predictive models for identifying toxicity risk profiles of chemicals that may be released into the environment. An ultimate goal of the ToxCast program is to improve the efficiency and reduce the cost of regulatory review and approval of EPA-regulated chemicals through use of predictive in vitro assays validated under the ToxCast program to supplement or replace current regulatory processes based on animal testing.
Product Support. In our worldwide technical support centers, service engineers and application specialists provide support for our customers' specific needs, thereby maximizing each product's efficiency and productivity. The range of product support services we provide includes technical telephone support, field engineering support for both emergency and preventative maintenance, field applications support, formal classroom training at Caliper and customer locations, a repair depot, and loaner support. Our maintenance contracts are typically for one- to three-year terms.
Sales and Marketing
We have multiple channels of distribution for our products and services: direct sales to end-user customers, indirect sales to end-user customers through our international network of distributors, OEM sales through partnership channels under our Caliper Driven program, and through joint marketing agreements.
Direct Sales. We sell our products and services principally through our direct sales and marketing organization. Our sales force includes regional sales representatives and technical field representatives in North America, Europe and Japan. Within each region we have sales representatives with a particular product, service or customer focus. Our applied science and technical application group is integrated into the sales process to support our highly technical products. Many of the application group individuals have Ph.D. degrees in biology, biochemistry or physics, and provide support for the sales and marketing team, as well as providing customer service support in the areas of biology, imaging and microfluidics. We generate customer leads through presentations, exhibiting at and attending scientific and partnering meetings, tradeshows, publications and advertisements in scientific journals. We also receive many qualified leads through our website, targeted promotional efforts to strategic accounts and referrals from current customers.
Distributors. We work with local distributors in certain markets where we do not have a direct presence. We currently have over 40 distributor arrangements covering countries located in Africa, Europe, the Middle East, the Pacific Rim, Scandinavia and South America. Under our distribution agreements, most of the distributors assume responsibility for the installation and post-sales support of systems. In 2008, sales through distributors comprised approximately 13% of our total sales.
Caliper Driven Program. Our Caliper Driven program is an important component of our business strategy and is complementary to our direct sales and distribution network activities as it enables us to extend the commercial potential of our LabChip and advanced liquid handling technologies into new industries and new application areas through collaboration with experienced commercial partners. Under this program, we supply liquid handling products, microfluidics chips, and other products on an OEM (original equipment manufacturer) basis, and in certain situations, provide product development
11
expertise and services to our commercial partners, who then typically integrate an application solution and market it to their end customers. In addition, as part of our Caliper Driven program, we license our patent estate to other companies for various applications. We view out-licensing under our Caliper Driven program as a way for us to extend our technologies into certain application areas that we do not have a present strategic intent to address directly, or that may require the greater technical, marketing or financial resources of our licensing partner in order to obtain more rapid adoption of our technology in a particular application area. By using direct and indirect distribution, and out-licensing our technology under our Caliper Driven program, we seek to maximize penetration of our products and technologies into the marketplace, and to position us as a leader in the life sciences tools market.
Currently, our two most significant OEM partners include Agilent Technologies and Bio-Rad Laboratories as described below:
Agilent Technologies. In June 2005, we entered into a new five-year supply agreement to be the exclusive supplier of planar chips to Agilent for both research and diagnostic applications. The planar chips, based on our microfluidic LabChip technologies, are utilized on the Agilent 2100 Bioanalyzer which Agilent first introduced in September 1999. The Agilent 2100 Bioanalyzer is a desktop instrument designed to perform a menu of analyses including DNA, RNA, protein and cell assays, based on the particular chip utilized. Agilent continues to expand the menu of applications offered for the 2100 Bioanalyzer.
Bio-Rad Laboratories. In the fall of 2004, Bio-Rad launched its Experion™ automated electrophoresis system as a result of a product development and commercialization agreement we entered into with Bio-Rad in June 2003. Bio-Rad is a long-established leader in gel electrophoresis separations, particularly protein separations. The Experion system represents Bio-Rad's first microfluidics-based product for this market, and it provides rapid, reproducible analysis of protein, DNA and RNA samples. Under the terms of the agreement, we currently receive royalties on all future sales of co-developed instruments, and we are the exclusive manufacturer of LabChip devices for use with such instruments.
Customers
Our current customers include a majority of the world's leading biomedical and pharmaceutical companies, prestigious not-for-profit research institutions and other life sciences vendor companies who incorporate our technology and products into their products. Approximately 58% of our total revenues for 2008 were derived from customers in the United States. See Note 17 of the Notes to Consolidated Financial Statements included in this Annual Report on Form 10-K for revenues from customers and long-lived assets attributable to geographic areas outside of the United States. During 2008, no single customer accounted for 10% or more of our total revenue.
We have typically experienced higher revenues in the second half of our fiscal year as a result of the capital spending patterns of our customers. In addition, our revenue trends may be affected by variations in grant funding, especially among government and other not-for-profit research institutions, such as academic institutions, and customer budget cycles. For example, in the biomedical research community, grant proposals are typically due in October, February and June with funds delivered the following June, October and March, respectively. Due to the grant cycle, we may achieve higher revenues in the second and fourth quarters.
Backlog
For a portion of our sales, we manufacture products based on our forecast of customer demand and maintain inventories in advance of receipt of purchase orders. Our net sales in any given quarter depend upon a combination of (1) orders received in that quarter for shipment in the same quarter, (2) shipments from our backlog of orders from previous quarters, and (3) recognition of revenues that
12
had been previously recorded as deferred revenue pursuant to our revenue recognition policy. Our products are typically shipped within ninety days of purchase order receipt. As a result, we do not believe that the amount of backlog at any particular date is indicative of our future level of sales in any succeeding quarter. The level of backlog at December 31, 2008 was $7.4 million. In our backlog, we include only the total value of open purchase orders for products and services that management has concluded have a reasonable probability of being delivered over the subsequent twelve-month period. This amount specifically excludes deferred revenue, and products and services to be provided in the future pursuant to terms of contractual agreements for which we have not yet received purchase orders.
Our backlog at the beginning of each quarter does not include all product sales needed to achieve expected revenues for that quarter. Consequently, we are dependent on obtaining orders for products to be shipped in the same quarter that the order is received. Moreover, customers may reschedule shipments, and production difficulties could delay shipments. Accordingly, we have limited visibility into future product shipments, and our results of operations are subject to variability from quarter to quarter.
Research and Development
Research and Development Infrastructure
We employ personnel with legal and scientific expertise to help manage our intellectual property and acquire new intellectual property. We also have biological scientists who work with our electromechanical engineers, physicists and imaging experts to create scientific applications in oncology, inflammation, and drug metabolism, cardiovascular disease, metabolic disease and toxicology. We also employ a technical applications group to interact at the scientific level with our customers, in order to understand our customers' technological needs, both for future product development purposes and to help our customers understand new applications that we have developed.
Technology Research
Today we have ongoing core technology research and applied product development efforts in several areas:
Microfluidics. We continue the development of new microfluidic chips and related instruments, software and reagents. Analytical and computer simulation models are employed to more effectively produce new functional chip designs. These modeling capabilities are also essential for optimizing assay conditions for specific analytes and reagents, on-chip thermal control, and determining quality control parameters for production chips. Our engineers continue to develop new generations of instrument systems with better performance, smaller footprints, lower cost and increased ease of use. We have made substantial investments in lab-on-a-chip research since our inception, and believe that we have established a leading position in lab-on-a-chip technology.
Chip Manufacturing. We continue to seek ways to improve the yield and decrease the cost of manufacturing our microfluidic chips, and also continue to explore novel fabrication techniques and the use of new materials, including plastic, that offer functional advantages, such as superior optical features or lower manufacturing costs. Plastic devices potentially offer cost advantages and can offer favorable surface chemistry or design features for some applications. One area in which we seek continuous improvement is micromachining technology for precisely attaching capillaries to our sipper chips. In automated experimentation, the number of these capillaries governs the level of throughput. Accordingly, we have developed high-yield fabrication methods to enable us to cost-effectively manufacture chips with many capillaries. Another important area of development is surface chemistry—in particular, controlling the reproducibility of channel surface characteristics in our LabChip products.
13
Imaging Instrumentation and Software. Our imaging systems research and development department is responsible for new imaging instrument product development. With a strong leadership position in the noninvasive optical imaging field, we continue to be on the forefront of advancing the technology to provide new levels of performance, cost and/or integrated support for developing technologies such as fluorescence and 3-dimensional tomography. This department works closely with our biology group to ensure that new systems will enable continued breakthroughs in application enablement.
Reagents and Bioware Products. Our biology group is responsible for developing new applications and associated reagents, cell lines, microorganisms and animal models. Our biology group produces these validated new applications comprising animal models and cell lines from three different sources: (1) we in-license and perform quality control on reagents that have already been made by others for conventional methodologies that complement our noninvasive imaging methodology; (2) we build and validate proprietary cell lines and models in our research laboratories; and (3) we in-license rights to cell lines and animal models made by certain of our customers who have used our technology to create animal models. Through these strategies, we are able to leverage the research and development expenditures of third parties to further our sales and the adoption of our technology.
Liquid Handling and Automation Instrument Manufacturing and Software Design. Our skilled electrical engineers, optical engineers, mechanical engineers, product designers and software engineers create new liquid handling and automation instruments and software that are designed to optimize liquid handling and automation of life science laboratory applications. Software engineers write computer programs to manage tasks such as controlling chip functionality, collecting data, communicating between different instrument modules and communicating between our instruments and those of other manufacturers.
Systems and Assay Integration. When developing commercial products, we seek to incorporate functionalities that are necessary to perform a specific experiment, and configure the assay so that it offers tangible benefits to users as compared to existing, traditional technologies. By carefully characterizing the problems and existing bottlenecks in an end-user's workflow, as well as the solution, we are able to define precise product specifications to meet customer needs. The resulting complete solution often includes a LabChip device, liquid handling to manage "bulk" reagent needs of the chip, instrumentation to control flow and temperature, robotics for automating the handling of sample plates and detection optics, computer software for instrument control and data analysis, and reagents. Our recent development efforts have focused on continuing to increase functional integration on chip, including sample purification, reaction reagent assembly, reaction incubation (sometimes with temperature cycling), post reaction separation, and detection.
Our research and development expenses for the years ended December 31, 2008, 2007, and 2006 were approximately $19.9 million, $24.8 million and $24.6 million, respectively. As a percentage of revenues, we expect research and development spending to decrease in the future to the extent that our revenues grow, and as we slow the pace of discretionary spending on research programs by focusing on those opportunities with maximum commercial viability, and sharing the funding of R&D programs with our partners.
Manufacturing and Supply
All of our instrument manufacturing is performed in our Hopkinton, Massachusetts manufacturing facility, which is ISO 9001:2000 compliant. The International Standards Organization, or ISO, sets international standards for quality in product design, manufacturing and distribution.
We manufacture some subassemblies, and other components are made to our specifications by outside vendors. To ensure the quality and on-time delivery of parts and subassemblies, we track our
14
top suppliers and score them on a monthly basis. The subassemblies are inspected and tested before being placed into final product assemblies. Production cycle times range from several hours to five days for more complex workstations.
Systems and workstations are produced from components based on a wide variety of proprietary technologies, including intricate mechanical actuators, precision fluid handling systems, computers and software. We produce systems by combining certain of our products with third-party vendor equipment, primarily detection instrumentation. The systems are a combination of standard components, assembled in either standard or custom configurations to meet a customer's specific needs. A typical production cycle ranges from 30 to 90 days from receipt of an order to shipment of a system. The final products are then put through an extensive testing cycle before being released for shipment. Testing at our factory and/or the customer's site establishes that the system is performing to the customer's specifications.
We manufacture all of our chips in a Class 1000 clean room facility in Mountain View, California. We are ISO 9001:2000 compliant for the development, manufacture and distribution of our chips and reagents. We contract with third parties to supply raw materials, component parts and sub-assemblies used in our chips and reagents kits. For a discussion of the methods we use to manufacture our chips see the sections above titled "Technologies," "Products and Services" and "Research and Development."
We use OEM providers for various parts of the imaging systems including the cameras, boxes, certain subassemblies, filters and lenses. We rely on two primary camera vendors to provide cameras for all of our IVIS imaging systems, one of which is under a supply agreement as of December 31, 2008.
We obtain key components of our chips, instruments and reagent-based products from a number of suppliers, including, in certain cases, single-source or limited-source suppliers. For instance, we receive proprietary dyes, which are used in many of our LabChip products, from a single source. Furthermore, we depend on a foreign single-source supplier for the glass used in the manufacture of certain types of our chips. However, the majority of key components for our chips and instruments are available on a short lead time from our suppliers. The only component requiring any significant lead time to acquire is our glass stock, as our supplier requires a minimum order to cover an entire production run. We anticipate that current inventories and purchase commitments of this material, at current production levels, will be sufficient for the next 12 months.
Although we have established licensing arrangements and supply agreements with most of our suppliers, there can be no assurances that these companies could not in some way be adversely affected in the future, and be unable to meet our critical supply needs. If the supply of components from these suppliers were interrupted, we might not be able to manufacture our products at all or in a timely fashion, which would disrupt our delivery of products to our customers.
We believe our current manufacturing capacity is sufficient to meet current and anticipated demand through 2013.
Animal Production
Our CDAS in vivo operation in Cranbury, New Jersey, houses our animal production facility including a large barrier animal vivarium that is accredited by the Association for the Assessment and Accreditation of Laboratory Animal Care, or AAALAC, and has an Assurance of Compliance with OLAW (Office of Lab Animal Welfare). In this Specific Pathogen Free (SPF) facility, we perform genetically modified animal production, characterization of genetically modified animals (phenotyping), and in vivo compound profiling. We ship animals to our clients and provide in vivo research capabilities to our customers from this facility. We have scientists and animal resources personnel specially trained
15
in animal care, handling, and science who provide services to our customers and support our internal needs. Proprietary animal strains that are distributed non-exclusively are shipped from the Cranbury facility. In addition, some of the strains most widely used by our customers can also be housed and distributed by one of two outside vendors, Charles River Laboratories or Taconic. Proprietary animal strains are also preserved as frozen embryos which can be used to regenerate each strain in the event of a disease outbreak.
Our Alameda, California research and development facility has one vivarium and a separate animal imaging suite. We perform breeding and model validation in this facility, which has an animal resources program with personnel specially trained in animal care and handling.
Each facility has individual environmental controls, environmental monitoring systems, as well as a veterinary consultant to assist us in monitoring the health of our animal population.
Reagents and Bioware
We maintain laboratory space in our Alameda facility to create and maintain stocks of microorganisms and cell line reagents. We have a supply agreement with Promega Corporation which requires us to acquire all of our supply for luciferin from Promega. Luciferin is a chemical compound that is introduced into cells and organisms in order to produce bioluminescence, and which we, and our customers, use with our Bioware products and LPTA models. Luciferin is stored and shipped out of our Mountain View, California facility. VivoFluor fluorescent labeling kits for in vivo imaging, which are custom-developed for us by Invitrogen (now Life Technologies), are also stored and shipped out of our Mountain View facility.
Competition
In general, markets for life science research tools and services are very competitive, and we believe these markets will remain competitive in the future. We compete with other companies selling similar tools and services and with companies selling alternative tools and services who are competing for the same funds in a potential customer budget. Although we believe that we have significant intellectual property protection to prevent competitors from developing many of our products, there are other manufacturers of similar technologies.
Imaging. We compete with conventional, non-imaging based approaches such as using mechanical calipers to measure tumor size, invasive surgical techniques, as well as with other molecular imaging technologies applied in the preclinical arena, including modalities such as PET, MRI, x-ray, CT, SPECT and ultrasound, which utilize the penetrating radiation of positrons, radio waves, x-rays, gamma rays and sound. Most of these technologies require operation by a highly trained technician. In addition, some are limited by the need for radioactivity and concomitant shielding, storage and disposal issues. Certain of these technologies image anatomy, rather than molecular events. By comparison, our in vivo molecular bioluminescent and fluorescent imaging methods involve optical imaging approaches that provide molecular level insight, are generally easier to perform, are higher throughput and require no radioactive substances.
We believe we are the leading supplier of integrated systems of equipment, software and reagents for the noninvasive optical imaging of small animal models. While we believe that our integrated system of instruments and equipment, software and reagents enable valuable insights and improve the productivity and efficiency of drug discovery and development, the up-front costs and commercial customer licensing fees associated with the use of our systems make the investment required for their use more expensive than conventional approaches for preclinical small animal testing.
Numerous companies sell cameras or camera systems capable of certain forms of optical imaging, including Carestream, Berthold Detection Systems GmbH, Hamamatsu Photonics, Olympus
16
Corporation, Roper Scientific, Inc., Biospace, VisEn Medical and CRi, Inc. While certain of these cameras share certain similar features and imaging capabilities of our IVIS imaging systems, none of those companies has the right to sell their cameras for in vivo imaging methods claimed by our patents, which includes patents we exclusively license from Stanford University, nor do they have rights to our instrumentation patents.
Automation and Liquid Handling Systems. There are many companies providing competitive liquid handling products, automation products and integration services for applications such as high throughput screening, ADME and Active Pharmaceutical Ingredient (API) analyses. We believe the primary competitive factors in these markets are productivity enhancement, breadth of applications, accuracy, ease-of-use, price, performance, product reliability and service support. Direct and indirect competition for these types of products and services comes from many companies, including Beckman Coulter, BioTek Instruments, CyBio, Hamilton, Innovadyne, Gilson, LabCyte, MDS Inc., PerkinElmer, Tecan, Thermo Fisher Scientific, Tomtec, Velocity 11 (now owned by Agilent) and Symyx.
In Vitro Compound Profiling Services. We compete with other companies that provide in vitro assay development, screening and profiling services to drug discovery and development laboratories. We believe the primary competitive factors in these markets are breadth of assays offered, cost per compound tested, data quality, innovation, and turn-around time. Competition for these types of services comes from many companies, including Cerep, MDS Inc., Millipore, Invitrogen (now Life Technologies), and Carna Biosciences.
LabChip Drug Discovery. We compete directly with established alternative technologies for enzymatic assays such as Promega, Invitrogen (now Life Technologies), Millipore and Cisbio as well as potentially with companies developing their own microfluidics or lab-on-a-chip technologies and products, such as Fluidigm, Micronics, BioTrove, Microfluidic Systems, 3M, Applied Biosystems (now Life Technologies) and Cepheid. Microfluidic technologies are still a relatively new technology and our future success will depend in large part on our ability to establish and maintain a competitive position in these and future technologies, which we may not be able to do. Rapid technological development may result in our products or technologies becoming obsolete. Products offered by us could be made obsolete either by less expensive or more effective products based on similar or other technologies.
LabChip Electrophoresis Separations. We compete with companies that supply both traditional gel technologies, capillary electrophoresis and more contemporary microfluidic technologies, for gel electrophoresis separations for proteins, DNA and/or RNA. We believe the primary competitive factors in these markets are cost per sample analyzed, throughput and productivity enhancement, data quality, ease of use and service support. Competition for these types of products and services comes from many companies, including Agilent, Bio-Rad Laboratories, General Electric, Beckman Coulter, Qiagen and Invitrogen (now Life Technologies). In 2008, Shimadzu Corporation introduced its MCE-202 MultiNA microchip electrophoresis system for performing DNA and RNA separations. We believe the MCE MultiNA system infringes a number of different patents owned or controlled by Caliper, and in January, 2009 we initiated a patent infringement suit against Shimadzu Corporation and its U.S. subsidiary, Shimadzu Scientific Instruments, Inc., in the United States District Court for the Eastern District of Texas. In this suit, Caliper alleges that Shimadzu's MCE-202 MultiNA instrument system infringes 11 different U.S. patents owned by Caliper. See the section titled "Legal Proceedings" elsewhere in this Annual Report on Form 10-K.
In markets where we sell products based on our LabChip technology, we not only need to demonstrate the advantages of our products over competing technologies and products, but we must also often overcome a customer's resistance to switching from a well-established, traditional technology to a fundamentally new technology.
17
We have entered into several licenses granting non-exclusive licenses to certain of our proprietary LabChip technologies. Present licensees include Agilent, Affymetrix, Canon, Wako Pure Chemical and Bio-Rad. In addition, these licensees may sell products which compete with our own products.
Light-Producing Reagents. Although our patented noninvasive imaging patents protect certain methods of imaging light through opaque tissue (e.g., skin) in mammals, there are many companies who have light producing reagent products and related intellectual property. We therefore compete with numerous companies that develop light-producing reagents used in in vitro and in vivo applications, including large companies such as GE Healthcare Discovery Systems and Invitrogen (now Life Technologies). Related to bioluminescence, we have agreements in place with Promega Corporation and The Regents of the University of California, under which we non-exclusively license several patents on a royalty-bearing basis for use of a modified firefly luciferase gene in living organisms, such as our LPTA models and certain of our Bioware products. Other companies must obtain similar licenses from those two entities in order to use that gene as a tagging reagent in animal models for commercial purposes. Related to fluorescence, many companies have technology for fluorescent label and/or fluorescent proteins. We purchase certain fluorescent reagents from Invitrogen (now Life Technologies) for resale and are actively working on in-licensing, partnering and/or developing additional fluorescent animal models, cell lines and reagents.
Creation of Genetically-Modified Animals. We also compete with companies who produce genetically-modified animals (i.e., transgenics or gene knockouts), including Lexicon Pharmaceuticals, genOway, Ingenious Targeting Laboratory, Taconic-Artemis and OzGene. All of these companies use animal models based on knockout mice technology. Lexicon, however, primarily focuses on developing its own pipeline of therapeutic products, rather than providing in vivo animal products and services to third parties. One other company, Deltagen, has re-organized under Chapter 11 and now offers access to previously made gene knockout models by providing embryonic stem (ES) cells. We believe that, for certain applications, the combination of our genetically-modified animal models with our in vivo optical imaging technology provides more predictive data than our competitors can offer. Additionally, none of these companies offers a complete package of instrumentation, reagents and applications for use in accelerating preclinical development.
Phenotyping. Although many pharmaceutical companies perform phenotyping services internally, only a small number of companies offer phenotypic analysis of animal models on a fee-for-service basis, including Jackson Laboratories, Taconic Farms, MDS Inc., PsychoGenics, Inc., Charles River Laboratories, and RIKEN Yokohama Institute-Genomic Sciences Center. However, we believe that Xenogen Biosciences, now part of CDAS, offers a greater breadth and scope of pharmacologically-validated bioassays and challenge assays. Additionally, we believe that the proprietary nature of our phenotyping program offers customers services that use fewer mice, and therefore are more cost-efficient, than those offered by competitors or those available to large pharmaceutical companies from internal resources.
In Vivo Compound Profiling Analysis. In addition to those competitors that conduct therapeutically-focused or comprehensive phenotypic analysis of genetically-modified animal models, there are other companies that have developed scientific platforms for the in vivo characterization of lead compounds, drug development candidates and/or clinical development candidates. This chemical characterization platform is known by various designations, but primarily as compound/drug repositioning, repurposing and/or indications discovery. Competitors in the in vivo chemical characterization space consist of those that focus primarily in one or a few therapeutic areas, such as Sention, Inc., Vela Pharmaceuticals, Inc., Bionaut Pharmaceuticals Inc., ChemGenex Therapeutics Inc., and CombinatoRx Inc., and those that have designed and validated comprehensive programs, such as Ore Pharmaceuticals, MDS Pharma Services, Covance, and Melior Discovery, Inc.
18
In many instances, our competitors have or may have substantially greater financial, technical, research and other resources and larger, more established marketing, sales, distribution and service organizations than we do. Many of our competitors also have greater name recognition than we do, and may offer more favorable pricing as a competitive tactic. In addition, given the larger scale of their operations, many of our competitors spend more on research and development than we do. Accordingly, we cannot be sure that our competitors will not succeed in developing or marketing technologies or products that are more effective or commercially attractive than our products or that would render our technologies and products obsolete. Also, we may not have the financial resources, technical expertise or marketing, distribution or support capabilities to compete successfully in the future. Our success will depend in large part on our ability to maintain a competitive position with our technologies.
Intellectual Property
We consistently seek patent protection for our key imaging, microfluidics and other technologies. As of December 31, 2008, we owned approximately 300 issued U.S. patents and 100 pending U.S. patent applications, some of which derive from a common parent application. We are also the exclusive licensee of approximately 100 U.S. patents. Foreign counterparts of many of these patents and applications have been filed and/or issued in one or more other countries. We also rely upon trade secrets, know-how, continuing technological innovation and in-licensing opportunities to develop and maintain our competitive intellectual property position. Our success will depend, in part, on our ability to obtain patent protection for our products and processes, to preserve our copyrights and trade secrets, to operate without infringing the proprietary rights of third parties, and to acquire licenses to enabling technology and products. In addition, U.S. patents filed since 1995 generally have a term of 20 years from the date of filing. In the life sciences industry, it often takes several years from the date of filing of a patent application to the date of a patent issuance, often resulting in a shortened period of patent protection, which may adversely affect our ability to exclude competitors from our markets.
Microfluidics. A majority of our patents and applications are directed to various technological areas which we believe are valuable to our microfluidics businesses, including:
- •
- control of movement of fluid and other material through interconnected microchannels;
- •
- continuous flow, high-throughput screening assay methods and systems;
- •
- chip-based assay chemistries and methods;
- •
- chip-compatible sample access;
- •
- software for control of microfluidic based systems and data analysis;
- •
- chip manufacturing processes;
- •
- analytical and control instrumentation; and
- •
- analytical system architecture.
We are also a party to various exclusive and non-exclusive license agreements with third parties which give us rights to use certain technologies in our microfluidics and laboratory automation business. For example, we have exclusive licenses from UT-Battelle, LLC, relating to patents covering inventions by Dr. J. Michael Ramsey, and from the Trustees of the University of Pennsylvania covering certain microfluidic applications and chip structures. We also have an exclusive license from Monogram BioSciences, Inc. covering a variety of microfluidic applications, chip structures and chip fabrication techniques, particularly in the area of polymeric substrates. These licenses extend for the duration of the life of the licensed patents. A failure to maintain some or all of the rights to these technologies could adversely impact our business.
19
Imaging. We believe that our patent portfolio relating to in vivo imaging methods is a valuable resource for licensing to our customers and also presents a barrier to entry for the practice of our patented optical imaging methods. Our imaging patent portfolio is built on two foundations: (i) methods, applications and materials relating to the biological aspects of optical imaging; and (ii) methods and apparatus relating to the instrumentation aspects of optical imaging. We have also non-exclusively licensed patents relating to methods of animal production that add value and accelerate the production of specific types of modified animals. In addition to our foundational claims for certain methods of noninvasive optical imaging, our patent portfolio includes issued and pending patent claims for specific applications of optical imaging along with a number of areas that we believe will be valuable to our business, including animal models of disease, transgenic animals useful in drug discovery research, imaging system components and computer-implemented methods for image acquisition and analysis.
We license several patents from third parties that are important to our imaging business. Our core imaging patents and related applications are licensed from Stanford University on an exclusive basis. The license is worldwide, royalty-bearing and includes the right to grant sublicenses. The term of this license is for the life of the patents resulting from the applications, which do not begin to expire until 2014. One of the patents that we have licensed from Stanford covering our methods of in vivo optical imaging was subject to a re-examination proceeding before the U.S. Patent and Trademark Office (USPTO). The re-examination concluded in 2004, and the Patent and Trademark Office issued a re-examination certificate for that patent with narrowed claims. Such narrowed claims do not affect our current licenses or business. Another one of the in vivo optical imaging patents we license from Stanford is currently the subject of a re-examination proceeding with the USPTO that was requested by a third party in 2007. While this re-examination process is still ongoing, on February 18, 2009, the USPTO issued an "Action Closing Prosecution," in which the USPTO rejected the claims of the patent under re-examination. We intend to file a response to the USPTO's rejection of the claims contained in the '851 patent arguing that certain of the amended claims of the '851 patent should be allowed by the USPTO.
As discussed in Note 10 of the Notes to Consolidated Financial Statements included elsewhere in this Annual Report on Form 10-K, in 2006 Stanford raised an issue with us regarding the scope of imaging products that are subject to the royalty provisions of the Stanford license agreement. We believe that Stanford's interpretation of the license agreement is not correct. However, as a result of Stanford's view of the license agreement, the parties may amend the agreement to change the royalties we pay to Stanford for future sales.
In connection with the settlement of our litigation with AntiCancer, Inc. in February, 2008, we obtained license rights under AntiCancer's portfolio of patents covering various methods of in vivo imaging utilizing fluorescent proteins. We now can provide sub-license rights to these AntiCancer patents in connection with our granting of license rights under our other imaging method patents.
The right to use the specific luciferase gene in our LPTA models and certain of our Bioware products is licensed from Promega Corporation and The Regents of the University of California (UC), under non-exclusive, royalty-bearing licenses. The Promega agreement continues for the life of the subject patent, which expires in 2014. Promega, however, may terminate the agreement for breach of contract. The agreement with the UC Regents continues for the life of those subject patents, which expire in 2013; however, this agreement may also be terminated for breach of contract or failure to sufficiently commercialize luciferase-bearing products.
Patents relating to the production of genetically-engineered animals by using gene-targeting methods have been licensed from Medarex, Inc., successor-in-interest to GenPharm International, Inc., since 1991. This license is non-exclusive, royalty-bearing and worldwide. Financial terms include a license issue fee, an annual fee that is creditable against earned royalties due, and a milestone fee in
20
the event the FDA approves a pharmaceutical product that includes a product produced through practice under the licensed patents. The term of this license is for the life of the licensed patents, which are set to expire in 2014.
Trademarks. We have registered and applied to register a number of trademarks in the U.S. and in foreign markets where our products are sold. Trademarks currently used by us include: Caliper, the Caliper logo, Caliper Driven, LabChip, the LabChip logo, Discovery Alliance and Services, CDAS, Allegro, CLARA, RapidPlate, RapidTrace, Staccato, TurboVap, Twister, iLink, inL10, Maestro, EZ Reader, ProfilerPro, Zephyr, and Sciclone, NovaScreen is a trademark of NovaScreen Biosciences Corporation, which is a wholly-owned subsidiary of Caliper. Xenogen, the Xenogen logo, IVIS, Living Image, LPTA, Bioware, Xenofluor, Lumina, Spectrum and Kinetic are trademarks of Xenogen Corporation, which is a wholly-owned subsidiary of Caliper.
Environmental Matters
Our manufacturing and laboratory sites utilize chemicals and other potentially hazardous materials, and generate both hazardous and non-hazardous waste, the transportation, treatment, storage and disposal of which are regulated by various governmental agencies. Although we believe that our safety procedures for handling and disposing of such materials comply with state and federal laws and regulations, the risk of accidental contamination or injury from these materials cannot be completely eliminated. In the event of such an accident, we could be held liable for any damages that result and any liability could exceed our resources.
We continuously assess the compliance of our operations with applicable federal, state and local environmental laws and regulations. Our policy is to record liabilities for environmental matters when loss amounts are probable and reasonably determinable. When needed, we have engaged environmental consultants to assist with our compliance efforts. We believe we are currently in compliance with all applicable environmental permits and are aware of our responsibilities under applicable environmental laws. Any expenditure necessitated by changes in law and permitting requirements cannot be predicted at this time, although we do not expect such costs to be material to our financial position, results of operations or competitive position.
Government Regulation
Our products and services are not regulated by any governmental agency. Our subsidiary, Xenogen Biosciences' line of business associated with animal production, however, may, in the future, be subject to various laws and regulations regarding the treatment of animals if the federal Animal Welfare Act, or AWA, is amended. The AWA does not currently apply to rats of the genus Rattus or mice of the genus Mus, bred for use in research, and consequently, we are not currently required to be in compliance with the AWA. Where applicable, the AWA imposes a wide variety of specific requirements on producers and users of research animals, including requirements related to personnel, facilities, sanitation, cage size, feeding, watering and shipping conditions. Although the AWA does not currently apply to our animal production business, we have voluntarily sought and received accreditation by AAALAC, which sets industry standards for care and treatment of animals used in research. In the event that the AWA is amended to include mice or rats within the scope of regulated animals, and consequently, our animal production business, we believe compliance with such regulations would require us to modify our current practices and procedures, which could require significant financial and management resources. We are not currently aware of legislation pending before the U.S. Congress to amend the AWA to cover the mice or rats used by us. In addition, some states have their own regulations, including general anti-cruelty legislation, which establishes certain standards in handling animals. With respect to the products and services we provide overseas, we also are required to comply with foreign laws, such as the European Convention for the Protection of Animals During International
21
Transport and other anti-cruelty laws. The Council of Europe is presently considering proposals to more stringently regulate animal research.
Many of our pharmaceutical and biotechnology licensees employ our technology to develop preclinical animal data on therapeutic products in development that may be submitted to governmental agencies as part of a regulatory application to commence human clinical testing or to commercialize their products. It is our belief that preclinical data collected using our technology has been submitted by several of our clients and accepted by the FDA to support commencement of clinical trials, and that in several cases regulatory approval has been received for a therapeutic product based, in part, on data collected using our technology. There can be no assurance that the FDA or other regulatory agencies will continue to accept preclinical data collected using our technology and submitted as part of an application to support initiation of clinical trials, or that such data can or will be used to support regulatory approval to commercialize therapeutic products.
Additionally, exports of certain products and biological reagents to foreign customers and distributors are governed by the International Traffic in Arms Regulations, the Export Administration Regulations, the Patriot Act and the Bioterrorism Safety Act. Although these laws and regulations do not restrict our present foreign sales programs, there can be no assurance that future changes to these regulatory regimes will not affect or limit our foreign sales.
Other Business Risks
In addition to the risks to our business associated with suppliers, competition and intellectual property discussed above, our business is subject to a number of other significant risks, including the risks that our products may not achieve wide market acceptance and that we may not be successful in developing new and enhanced products. These and other risks that may cause our actual results, financial performance or achievements to be materially different from our present expectations are discussed in more detail below under Item 1A, "Risk Factors".
Employees
As of December 31, 2008, we had a total of 489 employees, including 82 in research and development, 241 in operations and service, 97 in sales and marketing and 69 in administration and finance. None of our employees is represented by a collective bargaining agreement, nor have we experienced any work stoppage. We consider our relations with our employees to be good.
Executive Officers of the Registrant
Listed below are our executive officers and key employees as of February 28, 2009. No family relationship exists between any one of these individuals and any of the other executive officers or directors.
E. Kevin Hrusovsky, age 47, was appointed President and CEO immediately following the acquisition of Zymark Corporation, a liquid handling instruments company, by us in July 2003. Prior to the acquisition, Mr. Hrusovsky had served as President and CEO of Zymark since 1996. From 1992 to 1996, Mr. Hrusovsky was Director of International Business, Agricultural Chemical Division, and President of the Pharmaceutical Division, for FMC Corporation, a diversified holding company. From 1983 to 1992, Mr. Hrusovsky held several management positions at E.I. DuPont de Nemours, including North American Sales and Marketing Head, Teflon. He has also served as a board member of the Association for Laboratory Automation since January 2003. He received his B.S. in Mechanical Engineering from Ohio State University, an M.B.A. from Ohio University, and an honorary doctorate from Framingham State University.
22
Bruce J. Bal, 50, currently serves as Senior Vice President, Operations, and was appointed to the position of Vice President, Operations and Aftermarket Businesses following the combination of Caliper with Zymark. Mr. Bal joined Zymark in 1997 as Vice President of R&D and Operations. He previously worked at FMC Corporation, a diversified holding company, in the Biotechnology Division as Director of Operations. He has also held a wide range of management positions in his 13 years at E.I. DuPont de Nemours and was General Manager of United States Pollution Control, Inc. in Utah. Mr. Bal received a B.S. in Chemical Engineering from the University of Wisconsin in 1981 and an MBA from Loyola University, Louisiana in 1986.
Enrique Bernal, 70, was promoted to Senior Vice President, In vitro Business Development in May 2008. He was Vice President, Instrument R&D following the acquisition of Zymark. Mr. Bernal joined Zymark in February 1999, prior to which he worked at Galileo Corporation of Sturbridge, Massachusetts, a developer and manufacturer of electron multipliers and optical fiber products, where he was responsible for all engineering functions and product development. Previously, he had spent 29 years at Honeywell Inc. He received a B.S. in Physics from the College of St. Thomas, and a Masters in Physics from the University of Minnesota.
Paula J. Cassidy, 40, was appointed Vice President, Human Resources in November 2005. Ms. Cassidy previously was Vice President, Human Resources at Virtusa, Corp., a global provider of software development and related IT services. In that position, Ms. Cassidy was responsible for all aspects of the human resources function and she established a cohesive and unified global HR practice. Prior to joining Virtusa Corp in 2003, Ms. Cassidy was with Innoveda, Inc., a publicly traded provider of software and services for the electronic design automation industry. Innoveda had facilities all over the world including the United States, Europe, Israel and Asia. Prior to Innoveda, Ms. Cassidy was Vice President, Human Resources for a wholly-owned subsidiary of Synopsys, Inc. Ms. Cassidy started her career in Human Resources at Viewlogic Systems, Inc. and held various management positions while at Viewlogic. Ms. Cassidy holds a bachelors degree from St. Anselm College.
Stephen E. Creager, 55, currently serves as Senior Vice President, General Counsel and Secretary. Mr. Creager joined the company in October 2002 as Associate General Counsel and was appointed to the position of Vice President, General Counsel and Secretary following the combination of Caliper with Zymark. Previously, Mr. Creager was Vice President of Business Development for Tyco Electronics, an operating unit of Tyco International involved in the development and manufacture of electronic components. In this role, he provided the legal support for the business development initiatives of Tyco Electronics, including the acquisition of over 40 businesses. Prior to taking on these business development responsibilities at Tyco Electronics, Mr. Creager served as the General Counsel of Tyco Electronics. Prior to that, Mr. Creager served as Associate General Counsel of Raychem Corporation, a manufacturer of electronic components, from November 1993 until August 1999, when Raychem was acquired by Tyco Electronics. Prior to his experience at Raychem, Mr. Creager was in private legal practice for nine years. Mr. Creager received a B.A. degree from The Evergreen State College, and a Masters of Philosophy degree in economics and a J.D. degree, both from Yale University.
Joseph H. Griffith IV, 34, was promoted to Vice President, Finance in April 2008. He previously served as Corporate Controller since July 2003 having also served as Corporate Controller for Zymark Corporation, which was acquired by Caliper, since 2002. Mr. Griffith was previously employed by Arthur Andersen, LLP in its Boston, MA audit practice from 1997 to 2002. He received his B.S. in Accounting from Villanova University, and is a licensed Certified Public Accountant in the State of Pennsylvania.
William C. Kruka, 48, currently serves as Senior Vice President, Corporate Business Development, and joined the Company in 2002 as Vice President, Business Development. Previously, Mr. Kruka was Senior Manager of Business Development with leading life science tool provider Applied Biosystems
23
Group, an Applera Corporation business. In that role, he led the business development initiatives for proteomics, including related mass spectrometry, sample preparation, chromatography and microfluidic technologies. These initiatives included developing strategy, formulating deal structures and negotiating collaborations, licensing deals and divestitures. He also chaired an internal business development council that addressed strategic and operational matters from a cross-functional business and technology perspective. Prior to Applied Biosystems, Mr. Kruka held a number of corporate business development, sales, marketing and administration positions with Applera and its predecessors, PE Corporation and The Perkin-Elmer Corporation, from 1983 to 2002.
Jerome Leclercq, 44, was promoted to Vice President International Research Sales & Aftermarket Service & General Manager International Operations, in August 2008. From March 2007 up to his most recent appointment, Mr. Leclercq previously served as General Manager, EMEA Commercial Operations for Caliper. In the years prior to serving as General Manager EMEA, Mr. Leclercq held positions of increasing responsibility within Caliper and Zymark Corporation, which he joined in October 1987. He received his Masters Degree in Biochemical Engineering from University of Clermont-Ferrand in 1987.
Nicholas C. Mitropoulos, 51, was appointed Vice President North America Research Sales & Aftermarket Service in August 2008. Mr. Mitropoulos joined Caliper as Divisional Vice President of Commercial Operations in August 2007. Prior to joining Caliper, Mr. Mitropoulos served as Vice President of Worldwide Sales for GenomeQuest, Inc., a venture- backed life science software company. From 1988-2005, Mr. Mitropoulos held various management positions, elevating to Vice President of Worldwide Sales for Accelyrs, Inc, a life science scientific software company. Mr. Mitropoulos started his career as a Financial Analyst with GCA Corporation, a leading manufacturer of capital equipment for the semiconductor industry. He received his B.S. and an MBA in Finance and Marketing from Babson College.
David M. Manyak, Ph.D., 56, is currently Executive Vice President, Caliper Discovery Alliances & Services, and joined the Company in 2005 as Executive Vice President, Drug Discovery Services. Previously, Dr. Manyak was Chief Executive Officer of NovaScreen Biosciences, which was acquired in October 2005, since January 1993. Dr. Manyak has more than 20 years of experience in research, financial analysis, and management of biotechnology companies. Dr. Manyak was a biotechnology industry consultant and was co-founder and former Director of GeneMedicine Inc., a gene therapy company that had its initial public offering in 1994 and has since merged to form Valentis Corp. He was previously employed by Merrill Lynch & Co. (from 1985 to 1990) as Vice President, Senior Biotechnology Industry Analyst for Merrill Lynch & Co. and held a similar position with Value Line Inc. (from 1983 to 1985). Dr. Manyak holds a Ph.D. in Zoology/Biochemistry from Duke University and a B.A. from Brown University.
Peter F. McAree, 44, has served as Senior Vice President and Chief Financial Officer since April 2008 after having held the position of Vice President of Finance since 2003. Mr. McAree was Chief Financial Officer of Zymark Corporation from May 2000, until the acquisition of Zymark by Caliper in 2003. From January 2000 through November 2000, Mr. McAree served as Chief Financial Officer of Iconomy.com, Inc., a commerce solutions provider. From January 1999 through December 1999, Mr. McAree was an independent consultant. From January 1997 through December 1998, Mr. McAree served as Executive Vice President and Vice President, Finance at Elcom International, Inc., a commercial distributor of personal computers, and as President of its wholly-owned subsidiary, Elcom Systems. Prior to Elcom, Mr. McAree was Chief Financial Officer of Geerlings & Wade, Inc., a direct marketer of wine, from 1995 through 1996. Mr. McAree began his career with Arthur Andersen, Boston, where he held various positions, most recently as Senior Manager in 1995. He received his B.S. in Accountancy from Bentley College, and is a licensed Certified Public Accountant in Massachusetts.
24
Bradley W. Rice, Ph.D., 49, was promoted to Senior Vice President, Systems R&D in May 2008. Dr. Rice had served as the Chief Technical Officer and Vice President of Xenogen since January 2005. From 1999 through 2004, he served as the Senior Director of Imaging R&D and played a key role in developing the suite of IVIS imaging systems. Prior to joining Xenogen, Dr. Rice worked for 15 years as a scientist at Lawrence Livermore National Laboratory developing optical diagnostic instrumentation in the magnetic fusion energy program. Dr. Rice received his B.A. in Physics from Colorado College, M.S. in Electrical Engineering from the University of Wisconsin-Madison, and his Ph.D. in Applied Science from the University of California-Davis.
Mark T. Roskey, Ph.D., 49, currently serves as Vice President, Reagents and Biology R&D, and was appointed to the position of Vice President, Worldwide Marketing following the acquisition of Zymark, where he had held this role since he joined Zymark in December 2001. Prior to that, Dr. Roskey worked for six years at Applied Biosystems, a life sciences company, where he served as Director of Marketing. He has more than 15 years of experience in product research, development and strategic marketing with complex biological solutions and automated instrument systems. Dr. Roskey holds a B.S. in Biology from Framingham State College, a Ph.D. in Microbiology from the University of Notre Dame and completed a postdoctoral fellowship in Molecular Immunobiology at the Harvard Medical School.
Risks Related To Our Business
Failure to maintain our credit facility borrowing base, raise additional capital or generate the significant capital necessary to expand our operations and invest in new products could reduce our ability to compete and result in lower revenue.
We anticipate that our existing capital resources, including amounts available under our credit facility, together with the revenue to be derived from our commercial partners and from commercial sales of our products and services, will enable us to maintain currently planned operations through at least January 1, 2010. However, this expectation is based on our current operating plan, and our ability to maintain our borrowing base and remain in compliance with various covenants of our bank credit facility, which may change as a result of many factors, including conditions in the market for our products and services as well as the prospect of future acquisitions or other investing activities that could require substantial additional financing. Consequently, we may need additional funding sooner than anticipated. The past year has seen virtually unprecedented turmoil in the world's financial markets, and this turmoil may make it difficult or impossible for us to raise additional capital. Our inability to raise needed capital would seriously harm our business and product development efforts. Alternatively, in the event that we are able to do so, we may choose to raise additional capital due to market conditions or strategic considerations even if we believe that we have sufficient funds for our current or future operating plans. To the extent that additional capital is raised through the sale of equity or convertible debt securities, the issuance of these securities could result in dilution to our stockholders.
In addition, to the extent that operating and capital resources are insufficient to meet future requirements, we will have to raise additional funds to continue the development and commercialization of our technologies. These funds may not be available on favorable terms, or at all. If adequate funds are not available on attractive terms, we may be required to curtail operations significantly or to obtain funds by entering into financing, supply or collaboration agreements on unattractive terms.
25
Failure to remain in compliance with the covenants included in our revolving credit facility could interfere with or prevent our ability to obtain additional advances under this credit facility.
On March 6, 2009, we entered into a second amended and restated credit facility with a bank, which permits us to borrow up to $25 million in the form of revolving loan advances, including up to $5 million in the form of letters of credit. Principal borrowings under the credit facility accrue interest at a floating annual rate equal to the prime rate plus one percent if our unrestricted cash held at the bank exceeds or is equal to $20 million, or prime plus two percent if our unrestricted cash held at the bank is below $20 million. Under the credit facility, we are permitted to borrow up to $25 million, subject to a borrowing base limit consisting of (a) 80% of eligible accounts receivable plus (b) the lesser of 70% of our unrestricted cash at the bank or $12 million; provided, that on each of the first three business days and each of the last three business days of each fiscal quarter, our borrowing base is (a) 80% of eligible accounts receivable plus (b) the lesser of 90% of our unrestricted cash at the bank or $12 million. Eligible accounts receivable do not include internationally billed receivables, unbilled receivables, and receivables aged over 90 days from invoice date. The credit facility matures on November 30, 2010. As of December 31, 2008, $14.9 million was outstanding under the previous credit facility. The credit facility serves as a source of capital for ongoing operations and working capital needs.
The credit facility includes traditional lending and reporting covenants, including certain financial covenants applicable to liquidity and earnings that are to be maintained by us and tested as of the last day of each quarter. The credit facility also includes rights for the bank to accelerate the maturity of the debt, lower the borrowing base or stop making advances, if based upon its good faith business judgment, the bank determines that events or conditions may adversely affect the value of the collateral securing the credit facility or our ability to repay amounts outstanding under the facility. The credit facility also includes a net liquidity clause. Under this clause, if our cash, cash equivalents and marketable securities held at the bank, net of debt outstanding under the credit facility, is less than $0.5 million, the bank will apply all of our accounts receivable collections, received within our lockbox arrangement with the bank to the outstanding principal. Such amounts are eligible to be re-borrowed by us subject to the borrowing base limit described above. The credit facility is more fully discussed in Footnote 9 of Notes to Consolidated Financial Statements in Item 15 of this Annual Report on Form 10-K.
As of December 31, 2008, we were not in compliance with the covenants under the credit facility. We subsequently received a waiver for the covenant violation. The credit facility also includes several potential events of default that could cause interest to be charged at an annual rate which is two percentage points above the floating rate in effect immediately before the event of default, or, in the event of any uncured events of default, could result in the bank's right to declare all outstanding obligations immediately due and payable, reduce our borrowing base or reduce any additional requested borrowings. Our ability to remain in compliance with applicable loan covenants through the credit facility's maturity in 2010 depends upon our ability to achieve results that are materially consistent with our internal operating plans. If a material adverse change occurs within our business, or we fail to achieve our anticipated operating results, we may become in default of one or more covenants under the credit facility, which would require us to ask the bank to waive the covenants and these waivers may or may not be granted. If such events were to occur, we have no alternative committed sources of capital.
Our LabChip products may not achieve widespread market acceptance, which could cause our revenue to grow slowly or decline and make it more difficult for us to achieve or maintain profitability.
The commercial success of our LabChip products depends upon market acceptance of the merits of our drug discovery and automated electrophoresis separations systems by pharmaceutical and biotechnology companies, academic research centers and other companies that rely upon laboratory
26
experimentation. Although our microfluidic drug discovery and automated electrophoresis systems have been marketed and sold commercially for over five years, their accuracy, reliability, ease-of-use and commercial value have not yet gained widespread commercial acceptance. During 2008, we introduced a wholly redesigned automated electrophoresis separations system, the LabChip GX and LabChip GXII, which is intended to replace our LabChip 90 automated electrophoresis separations system. Although the initial market reaction to our new LabChip GX systems has been positive, if these systems do not continue to gain further market acceptance, our revenue may grow more slowly than expected or decline.
Our strategy for our microfluidic-based screening products, such as the EZ Reader, and for our recently launched automated electrophoresis separations systems, such as the LabChip GX and GXII instruments, depends upon the early users of these systems buying additional units as they spread the adoption of this technology throughout their organizations worldwide. New customers for our LabChip GX systems may wait for indications from these early users that our drug discovery and automated electrophoresis separations systems work effectively and generate substantial benefits. If the early users of our EZ Reader and LabChip GX instrument systems do not endorse the further adoption of these systems because they fail to generate the expected quantities and quality of data, are too difficult or costly to use, or are otherwise deficient in meeting the needs of these customers, further sales of these systems to these early users may be limited, and sales to new users will be more difficult.
Because drug screening and automated electrophoresis separations systems represent substantial capital expenditures, it is important that these systems be capable of performing a wide variety of different types of assays and experiments in order to justify the cost of the systems. We intend to continue to lower the cost of these systems and to develop new versions of our microfluidic-based products with enhanced features and/or lower costs that address existing and emerging customer needs, such as offering a broad range of standardized, easy-to-use assays. In this regard, during 2007 we launched a new LabChip system based on our microfluidic LabChip technology, the EZ Reader instrument system, which is designed specifically to facilitate secondary kinase screening by providing a more highly automated system capable of utilizing our recently launched ProfilerPro reaction ready plates already loaded with required reagents. In addition, as note above, during 2008, we introduced a wholly redesigned automated electrophoresis separations system, the LabChip GX and LabChip GXII, which is targeted at customers with high throughput DNA, RNA and/or protein separations requirements. If the commercial adoption of these existing LabChip products is slower than we presently expect, we may experience a decline in revenue or slow revenue growth and may not achieve or maintain profitability.
For all of the foregoing reasons, we cannot assure you that our efforts to increase the adoption of our LabChip-based drug screening and automated electrophoresis systems, by both existing and new users, will be expeditious or effective.
In summary, market acceptance of our LabChip systems will depend on many factors, including:
- •
- our ability to demonstrate the advantages and potential economic value of our LabChip drug discovery and automated electrophoresis separations systems over alternative, well-established technologies;
- •
- our ability to penetrate new markets, such as next-gen sequencing laboratories and protein fermentation facilities, with our LabChip GX and GX II automated electrophoresis separations systems;
- •
- our ability to develop a broader range of standard assays and applications that enable customers and potential customers to perform many different types of experiments on a single LabChip instrument system; and
27
- •
- our ability to penetrate the market for secondary kinase screening with our EZ Reader systems and ProfilerPro reaction ready plates.
If our in vivo optical imaging products and services do not become more widely used by pharmaceutical, biotechnology and life sciences researchers, our revenue will grow more slowly than expected or decline and make it more difficult for us to achieve or maintain profitability.
Pharmaceutical, biotechnology and life sciences researchers have historically conducted in vivo biological assessment using physical measurement devices such as Caliper's noninvasive surgical techniques, or a variety of imaging technologies, including X-ray, MRI, ultrasound, PET and SPECT. Compared to these other technologies, our noninvasive optical imaging technology is relatively new, and the number of companies and institutions using our technology is relatively limited. We have expanded the fluorescence imaging capabilities of our imaging instruments with the IVIS Spectrum instrument, which we launched in late 2006. We believe the IVIS Spectrum instrument offers the most advanced bioluminescence and fluorescence pre-clinical in vivo imaging capability in the market today. However, the commercial success of all of our IVIS imaging systems will depend upon the continuing adoption of our technology as a preferred method to perform in vivo biological assessment. Such continuing adoption depends upon these products meeting the technical and cost requirements for in vivo biological assessment within the life sciences industry. Widespread market acceptance will depend on many factors, including:
- •
- the willingness and ability of researchers and prospective customers to adopt a relatively new technology;
- •
- our ability to convince prospective strategic partners and customers that our technology is an attractive alternative to other methods of in vivo biological assessment; and
- •
- creating a belief on the part of our customers that our products can accelerate timelines and reduce costs in drug development.
We receive significant licensing revenue from commercial users of our patented in vivo optical imaging methods, and our ability to continue to receive this licensing revenue in the future will depend upon our ability to convince commercial users of the value of our patented imaging methods and our ability to enforce and defend the validity of such patents.
We exclusively in-license from Stanford University a portfolio of patents covering a broad range of methods for in vivo, noninvasive imaging of light generated from within mammals, which portfolio of patents includes, among other patents, U.S. Patent No. 5,650,135 and U.S. Patent No. 7,255,851, which was issued by USPTO in August 2007 based upon a continuation application relating to the '135 patent. The patents in this portfolio prior to the recent issuance of the '851 patent cover broad methods of in vivo imaging of generated light. The '851 patent expanded the scope of this patent portfolio to include in vivo, noninvasive imaging methods based on light sources that are conjugated (or combined) with any of a variety of biocompatible entities and administered to the mammal to be imaged. We actively out-license these patents to entities performing pre-clinical drug discovery and development research. These licenses, in the case of commercial entities, require the payment of fees in order to perform the patented imaging methods. We believe that the expanded patent coverage afforded by the '851 patent should enable us to extend our existing licensing program to a larger group of companies and to increase the revenue we obtain from this licensing program. However, our ability to maintain and increase the revenue we obtain from this licensing program will depend upon our continuing ability to convince researchers of the value of these patented imaging methods, including the optical imaging methods with conjugated probes covered by the '851 patent, as well as our ability to successfully defend the validity of the patents in this portfolio. It is possible that entities will seek to invalidate one or more patents included in this portfolio, either through litigation or through a reexamination process
28
with the USPTO to challenge the patentability of the patent claims. For example, in November 2007 VisEn Medical filed a request with the USPTO for anInter Partes Reexamination of the '851 patent, in January 2008 the USPTO granted VisEn's request for a reexamination of the '851 patent, and in February 2009 the USPTO issued an "Action Closing Prosecution" which rejected the claims of the '851 patent. We intend to file a response to the USPTO's rejection of the claims contained in the '851 patent arguing that certain of the amended claims of the '851 patent should be allowed by the USPTO. However, it is possible that the '851 patent, or one or more of the other patents included in our in vivo imaging patent portfolio, could be held to be invalid or unpatentable, or the scope of their claim coverage could be a narrowed. If this occurs, our revenue from out-licensing this portfolio may decline.
Because we receive revenue principally from pharmaceutical and biotechnology companies and biomedical research institutions, the current economic conditions faced by and regulatory requirements imposed upon those companies and institutions, as well as their capital spending policies, may have a significant effect on the demand for our products.
We market our products to pharmaceutical and biotechnology companies and to academic and other biomedical research institutions, and the changes to capital spending policies of these entities could have a significant effect on the demand for our products. These policies vary significantly among different customers and are based on a wide variety of factors, including the resources available for purchasing research equipment, the spending priorities among various types of research companies and the policies regarding capital expenditures. In particular, economic conditions and regulatory requirements faced by pharmaceutical and biotechnology companies have at certain times directly affected their capital spending budgets. In addition, continued consolidation within the pharmaceutical industry, including the cost reductions often implemented during such consolidations, will likely delay and may potentially reduce capital spending by pharmaceutical companies involved in such consolidations. During the past several years, many of our customers and potential customers, particularly in the biopharmaceutical industry, have reduced their capital spending budgets because of these generally adverse prevailing economic conditions, consolidation in the industry and increased pressure on the profitability of such companies, due in part to competition from generic drugs. If our customers and potential customers do not increase their capital spending budgets, because of continuing adverse economic conditions or further consolidation in the industry, we could face weak demand for our products. Similarly, changes in availability of grant money, as well as reductions in the value of university endowments due to recent significant worldwide declines in the value of financial and real estate assets, may impact our sales to academic customers. Developments involving safety issues for widely used drugs, including actual and/or threatened litigation, also may affect capital spending by pharmaceutical companies. Any decrease or delay in capital spending by life sciences or chemical companies or biomedical researchers could cause our revenue to decline and harm our profitability.
In addition, consolidation within the pharmaceutical industry may not only affect demand for our products, but also existing business relationships. For example, if two or more of our present or future optical imaging customers merge, we may not receive the same aggregate amount of fees under one license agreement with the combined entity that we received under separate license agreements with these customers prior to their combination. Moreover, if one of our optical imaging customers merges with an entity that is not such a customer, the new combined entity may seek to terminate or not renew our license agreement. Any of these developments could cause our revenue to decline, or to grow more slowly than we anticipate.
29
Our future revenue is unpredictable and could cause our operating results to fluctuate significantly from quarter to quarter.
Our quarterly and annual operating results have fluctuated in the past and are likely to do so in the future. Our operating results have been historically strongest in the fourth quarter due to customer budget cycles and are also influenced in the second and fourth quarters by academic grant funding cycles. The sale of many of our products typically involves a scientific evaluation and commitment of capital by customers. Accordingly, the initial sales cycles of many of our products are lengthy and subject to a number of significant risks that are beyond our control, including customers' budgetary constraints and internal acceptance reviews. As a result of this lengthy and unpredictable sales cycle, our operating results have historically fluctuated significantly from quarter to quarter, and we expect this trend to continue. In addition, a large portion of our expenses are relatively fixed. Historically, customer buying patterns and our revenue growth have caused a substantial portion of our revenues to occur in the last month of the quarter. Delays in the receipt of orders, our recognition of product or service revenue, or manufacturing delays near the end of the quarter could cause quarterly revenues to fall short of anticipated levels. Because our operating expenses are based on anticipated revenue levels and a high percentage of our expenses are relatively fixed, lower than anticipated revenues for a quarter could have a significant adverse impact on our operating results. Accordingly, if our revenue declines or does not increase as we anticipate, we might not be able to correspondingly reduce our operating expenses in a timely enough manner to avoid incurring additional losses. Our failure to achieve our anticipated level of revenue could significantly harm our operating results for a particular fiscal period.
The following are some of the factors that could cause our operating results to fluctuate significantly from period to period:
- •
- changes in the demand for, and increased pricing for, our products and services;
- •
- lengthy sales cycles and buying patterns of our customers, which may cause a decrease in our operating results for a quarterly period;
- •
- termination, non-renewal, or changes in the terms of our renewable contracts, including licenses;
- •
- our ability to find new partners to out-license our microfluidics intellectual property technology under our Caliper Driven licensing program, which license agreements generally include substantial upfront fees as well as future royalties based on sales of licensed products;
- •
- our ability to obtain key components for products and manufacture and install them on a timely basis to meet demand;
- •
- decreases in the research and development budgets of our customers;
- •
- commercial customer resistance to paying technology licensing fees in conjunction with future IVIS imaging system purchases;
- •
- acquisition, licensing and other costs related to the expansion of our product portfolio;
- •
- expenses related to patent infringement litigation and defense of our patents; and
- •
- expenses related to, and the results of, patent filings and other proceedings relating to intellectual property rights.
Due to the possibility of fluctuations in our revenue and expenses, we believe that quarter to quarter or annual comparisons of our operating results are not a good indication of our future performance.
30
Our intellectual property rights may not provide meaningful commercial protection for our products, which could enable third parties to use our technology, or very similar technology, and could reduce our ability to compete in the market.
We rely on patent, copyright, trade secret and trademark laws to limit the ability of others to compete with us using the same or similar technology in the U.S. and other countries. However, these laws afford only limited protection and may not adequately protect our rights to the extent necessary to sustain any competitive advantage we may have. In addition, our current and future patent applications may not result in the issuance of patents in the U.S. or foreign countries. The laws of some foreign countries do not protect proprietary rights to the same extent as the laws of the U.S., and many companies have encountered significant problems in protecting their proprietary rights abroad. These problems can be caused by the absence of adequate rules and methods for defending and enforcing intellectual property rights.
We will be able to protect our technology from unauthorized use by third parties only to the extent that they are covered by valid and enforceable patents or are effectively maintained as trade secrets. The patent positions of companies developing tools for pharmaceutical, biotechnology, and biomedical industries generally are uncertain and involve complex legal and factual questions, particularly as to questions concerning the enforceability of such patents against alleged infringement. The biotechnology patent situation outside the U.S. is even more uncertain. Changes in either the patent laws or in interpretations of patent laws in the U.S. and other countries may therefore diminish the value of our intellectual property. Moreover, our patents and patent applications may not be sufficiently broad to prevent others from practicing our technologies or from developing competing products. We also face the risk that others may independently develop similar or alternative technologies or design around our patented technologies.
We own, or control through exclusive licenses, a variety of issued patents and pending patent applications. However, the patents on which we rely may be challenged and invalidated, and our patent applications may not result in issued patents.
We have taken measures to protect our proprietary information, especially proprietary information that is not covered by patents or patent applications. These measures, however, may not provide adequate protection of our trade secrets or other proprietary information. We seek to protect our proprietary information by entering into confidentiality agreements with employees, collaborators, customers and consultants. Nevertheless, employees, collaborators, customers or consultants may still disclose our proprietary information, and we may not be able to protect our trade secrets in a meaningful way. If we lose employees, we may not be able to prevent the unauthorized disclosure or use of our technical knowledge or other trade secrets by those former employees despite the existence of nondisclosure and confidentiality agreements and other contractual restrictions to protect our proprietary technology. In addition, others may independently develop substantially equivalent proprietary information or techniques.
We have previously been and are currently involved in patent litigation. In connection with this litigation, the patents on which we rely may be challenged and invalidated. We are also currently involved in a reexamination by the USPTO of one of our issued patents. We may need to initiate other lawsuits to protect or enforce our patents or other proprietary rights. Patent litigation tends to be expensive and, if we lose, may cause us to lose some of our intellectual property rights, which would reduce our ability to compete in the market and may cause our stock price to decline.
Through our Xenogen subsidiary, we were involved in patent infringement litigation with AntiCancer, Inc. for approximately two and a half years until the litigation settled in February 2008. In this patent litigation, AntiCancer had alleged infringement of various patents owned by AntiCancer and requested that the court declare invalid certain of our patents covering methods of in vivo optical
31
imaging, and we had alleged AntiCancer's infringement of various of our patents and sought to invalidate AntiCancer's asserted patents. For a description of the settlement reached in this litigation, see the section titled "Legal Proceedings" elsewhere in this Annual Report on Form 10-K. In addition, in order to protect or enforce our patent rights, we may initiate patent infringement litigation against third parties. For example, in January 2009 we initiated litigation against Shimadzu Corporation and its U.S. subsidiary alleging that Shimadzu's importing, marketing and selling of its MCE-202 MultiNA microchip electrophoresis system infringes 11 different U.S. patents owned by us. As another example, as noted above, in November 2007 VisEn Medical filed a request with the USPTO for aninter partes reexamination of U.S. Patent No. 7,255,851, which we exclusively license from Stanford University, and in February 2009 the USPTO issued an "Action Closing Prosecution" which rejected the claims of the '851 patent. We intend to file a response to the USPTO's rejection of the claims contained in the '851 patent arguing that certain of the amended claims of the '851 patent should be allowed by the USPTO.
These lawsuits and proceedings before the USPTO tend to be expensive, take significant time and can divert management's attention from other business concerns. This risk is exacerbated by the fact that the other parties involved in the lawsuits or USPTO proceedings may have access to substantially greater financial resources than we have to conduct such litigation or proceeding. These lawsuits and proceedings put our patents at risk of being invalidated or interpreted narrowly and our patent applications at risk of not issuing. Additionally, we may suffer reduced instrumentation sales and/or license revenue as a result of pending lawsuits or following final resolution of lawsuits or USPTO reexamination proceedings. Further, these lawsuits may also provoke these third parties to assert claims against us. Attempts to enforce our patents may trigger third party claims that our patents are invalid. We may not prevail in any of these suits and any damage or other remedies awarded to us, if any, may not be commercially valuable. During the course of these suits, there may be public announcements of results of hearings, motions and other interim proceedings or developments in the litigation. If securities analysts or others perceive any of these results to be negative, such perception could cause our stock price to decline.
LabChip Electrophoresis Separations. We compete with companies that supply both traditional gel technologies, capillary electrophoresis and more contemporary microfluidic technologies, for gel electrophoresis separations for proteins, DNA and/or RNA. We believe the primary competitive factors in these markets are cost per sample analyzed, throughput and productivity enhancement, data quality, ease of use and service support. Competition for these types of products and services comes from many companies, including Agilent, Bio-Rad Laboratories, General Electric, Beckman Coulter, Qiagen and Invitrogen (now Life Technologies). In 2008, Shimadzu Corporation introduced its MCE-202 MultiNA microchip electrophoresis system for performing DNA and RNA separations. We believe the MCE MultiNA system infringes a number of different patents owned or controlled by Caliper, and in January, 2009 we initiated a patent infringement suit against Shimadzu Corporation and its U.S. subsidiary, Shimadzu Scientific Instruments, Inc., in the United States District Court for the Eastern District of Texas. In this suit, Caliper alleges that Shimadzu's MCE-202 MultiNA instrument system infringes 11 different U.S. patents owned by Caliper. See the section titled "Legal Proceedings" elsewhere in this Annual Report on Form 10-K.
Acquisitions may have unexpected consequences or impose additional costs on us.
Our business is highly competitive and our growth is dependent upon market growth and our ability to enhance our existing products, introduce new products on a timely basis and offer our customers products that provide a more complete solution. One of the ways we may address the need to develop new products is through acquisitions of complementary businesses and technologies, such as our acquisition of Zymark in July 2003, our acquisition of NovaScreen in October 2005, and our acquisition of Xenogen in August 2006. From time to time, we consider and evaluate potential business combinations involving our acquisition of another company and transactions involving the sale of our
32
company through, among other things, a possible merger or consolidation of our business into that of another entity.
Acquisitions involve numerous risks, including the following:
- •
- difficulties in integration of the operations, technologies and products and services of the acquired companies;
- •
- the risk of diverting management's attention from normal daily operations of the business;
- •
- potential cost and disruptions caused by the integration of financial reporting systems and development of uniform standards, controls, procedures and policies;
- •
- accounting consequences, including amortization of acquired intangible assets or other required purchase accounting adjustments, resulting in variability or reductions of our reported earnings;
- •
- potential difficulties in completing projects associated with purchased in-process research and development;
- •
- risks of entering markets in which we have no or limited direct prior experience and where competitors in these markets have stronger market positions;
- •
- the potential loss of our key employees or those of the acquired company due to the employment uncertainties inherent in the acquisition process;
- •
- the assumption of known and potentially unknown liabilities of the acquired company;
- •
- the risk that we may find that the acquired company or business does not further our business strategy or that we paid more than what the company or business was worth;
- •
- our relationship with current and new employees and customers could be impaired;
- •
- the acquisition may result in litigation from terminated employees or third parties who believe a claim against us would be valuable to pursue;
- •
- our due diligence process may fail to identify significant issues with product quality, product architecture and legal contingencies, among other matters; and
- •
- there may be insufficient revenues to offset increased expenses associated with acquisitions.
Acquisitions may also cause us to issue common stock that would dilute our current stockholders' percentage ownership; record goodwill and non-amortizable intangible assets that will be subject to impairment testing and potential periodic impairment charges; incur amortization expenses related to certain intangible assets; or incur other large and immediate write-offs.
We cannot assure you that future acquisitions will be successful and will not adversely affect our business. We must also maintain our ability to manage growth effectively. Failure to manage growth effectively and successfully integrate acquisitions that we make could harm our business.
We expect to incur future operating losses and may not achieve profitability.
We have experienced significant operating losses each year since our inception and we expect to incur an operating loss in 2009. As of December 31, 2008, we had an accumulated deficit of approximately $302.4 million. Our losses have resulted principally from costs incurred in research and development and product marketing and from general and administrative costs associated with our operations. These costs have exceeded our cumulative cash proceeds which, to date, have been generated principally from product sales, collaborative research and development agreements, technology access fees, license fees, litigation settlement proceeds and interest income on cash and investment balances. To achieve profitability, we will need to generate and sustain higher revenue than
33
we have to date, while achieving reasonable costs and expense levels. We may not be able to generate enough revenue to achieve profitability. We may not achieve or maintain reasonable costs and expense levels. Even if we become profitable, we may not be able to sustain or increase profitability on a quarterly or annual basis. If we fail to achieve profitability within the timeframe expected by securities analysts or investors, the market price of our common stock will likely decline.
The termination or non-renewal of a large multi-year contract or the loss of, or a significant reduction in, sales to any of our significant customers could harm our operating results.
We currently derive, and we expect to continue to derive, a significant percentage of our total revenue from a relatively small number of customers. If any one of these customers terminates or substantially diminishes its relationship with us, our revenue could decline significantly. We have contractual arrangements with certain customers that encompass the sale of products, licensing of imaging intellectual property and provision of in vivo services pursuant to agreements that are renewable on an annual or multi-year basis. Failure to renew or the cancellation of these agreements by any one of our larger customers could result in a significant loss of revenue. In addition, in April 2007 we entered into a contract with the Environmental Protection Agency (EPA) to perform in vitro compound toxicity screening pursuant to which the EPA periodically issues task orders to us. If the EPA experiences a reduction in its federal funding, elects not to proceed with the program or elects to reduce the number of compounds to be screened by us pursuant to this contract, our revenue may decline or grow more slowly than we currently expect.
The temporary or permanent closure of a leased facility could harm our operating results.
We currently manufacture our products in various leased facilities. We rely on a single manufacturing location to produce our microfluidic chips in Mountain View, California, and a single manufacturing location in Hopkinton, Massachusetts to produce laboratory automation, microfluidic instrument, imaging and robotics systems, with no alternative facilities. We rely principally on our facility in Cranbury, New Jersey, to produce LPTA models and our facility in Alameda, California to produce Bioware cells and microorganisms. Our Alameda, California facility is also able to serve as a back-up facility for producing our LPTA models. Our in vitro screening services are performed at a single facility located in Hanover, Maryland. These facilities and some pieces of manufacturing equipment are difficult to replace and could require substantial replacement lead-time. If any of our facilities are closed on a temporary or permanent basis, our revenue could decline significantly.
Our success will depend partly on our ability to operate without infringing or misappropriating the proprietary rights of others.
We may be exposed to future litigation by third parties based on claims that our products infringe the intellectual property rights of others. This risk is exacerbated because there are numerous issued and pending patents in the life sciences industry and the validity and breadth of life sciences patents involve complex legal and factual questions. Our competitors may assert that their U.S. or foreign patents may cover our products and the methods we employ. For example, until February 2008 we were involved in patent litigation with AntiCancer, Inc. in which AntiCancer had alleged that we have infringed certain of its patents. Although this litigation was resolved through a settlement and cross-license agreement between the parties, there can be no assurance that we will be able to settle other infringement claims on a favorable basis in the future. For a description of our settled litigation with AntiCancer, see the section titled "Legal Proceedings" elsewhere in this Annual Report on Form 10-K. Also, because patent applications can take many years to issue, there may be currently pending applications of which we are unaware that may later result in issued patents that our products may infringe. There could also be existing patents of which we are not aware that one or more of our products may inadvertently infringe.
34
From time to time, we have received, and may receive in the future, letters from third parties asking us to license certain technologies that the third party believes we may be using or would like us to use. If we do not accept a license, we may be subject to claims of infringement, or may receive letters alleging infringement. Infringement and other intellectual property claims, with or without merit, can be expensive and time-consuming to litigate and can divert management's attention from our core business.
If we lose a patent infringement lawsuit, we could be prevented from selling our products unless we can obtain a license to use technology or ideas covered by such patent or are able to redesign the products to avoid infringement. A license may not be available at all or on terms acceptable to us, or we may not be able to redesign our products to avoid any infringement. If we are not successful in obtaining a license or redesigning our products, we may be unable to sell our products and our business could suffer.
Our rights to the use of technologies licensed to us by third parties are not within our control, and without these technologies, our products and programs may not be successful and our business prospects could be harmed.
We rely on licenses to use various technologies that are material to our business, including licenses, with sublicense rights, to certain microfluidic technologies and in vivo imaging methods, licenses to the use of certain biological materials, and licenses to engineer and commercialize transgenic animals. We do not own the patents that underlie these licenses. Our rights to use these technologies and employ the inventions claimed in the licensed patents are subject to the continuation of compliance with the terms of those licenses. In some cases, we do not control the prosecution or filing of the patents to which we hold licenses, or the enforcement of these patents against third parties. For example, under the Promega Corporation and The Regents of the University of California licenses for one or more patented forms of firefly luciferase used in our LPTA models and certain of our Bioware, we do not have the right to enforce the patent, and neither licensor is obligated to do so on our behalf. Certain of our licenses contain diligence obligations, as well as provisions that allow the licensor to terminate the license upon specific conditions. Some of the licenses under which we have rights, such as our licenses from the University of Pennsylvania and from UT Battelle for certain microfluidic technologies and from Stanford University for certain optical imaging methods, provide us with exclusive rights in specified fields, including the right to enforce the licensed patents, but the scope of our rights and obligations under these and other licenses may become subject to dispute by our licensors or third parties. For example, in 2006 Stanford raised an issue regarding the scope of products that we sell which are subject to the royalty provisions of our Stanford license agreement. Although we believe Stanford's interpretation of the license agreement is incorrect, as a result of Stanford's view of the license agreement we may amend the license agreement to change the royalties we pay to Stanford for future sales. The amendment may also include the payment of back royalties to Stanford for products we have already sold. While we have not discussed with Stanford the specific terms and conditions of an amendment or the amount of any back royalty payments, any increase in the royalties we pay to Stanford would negatively impact our gross margins.
Our tax net operating losses and credit carryforwards may expire if we do not achieve or maintain profitability.
As of December 31, 2008, we had federal and state net operating loss carryforwards of approximately $299.1 million and $102.5 million, respectively. We also had federal and state research and development tax credit carryforwards of approximately $7.9 million and $4.9 million, respectively. The federal net operating loss and credit carryforwards will expire at various dates through 2028 if not utilized. The current remaining state net operating losses have varying expiration dates through 2028.
35
Utilization of the federal and state net operating losses and credits may be subject to a substantial limitation due to the change in ownership provisions of the Internal Revenue Code of 1986 and similar state provisions. The annual limitation may result in the expiration of net operating losses and credits before utilization. Because of our lack of earnings history and the uncertainty of realizing these net operating losses, the deferred tax assets have been substantially offset by a valuation allowance.
If we are unable to meet customer demand, it would adversely impact our financial results and restrict our sales growth.
We may not be able to meet the expectations of our customers for a number of reasons. For example, our lab automation, microfluidic, and IVIS imaging instruments are all relatively complex systems, and certain components of these systems are specially manufactured by our limited and/or single-source suppliers. Supply of these parts to us requires adequate lead-time that can result in production delays. If we experience unexpected shifts in customer demand that require increases to planned manufacturing, we may experience production delays that could restrict our sales growth. Also, if we do not consistently manufacture these systems at a sufficiently high level of quality, we could lose customers and fail to acquire new customers if they choose a competitor's product because our systems do not perform in accordance with our customers' expectations. If we are unable to meet customer expectations for any of our instrument systems, it would adversely affect our financial results and restrict our sales growth.
We depend on a limited number of suppliers for components of IVIS imaging systems, and we will be unable to manufacture or deliver our products if shipments from these suppliers are interrupted or are not supplied on a timely basis.
We use original equipment manufacturers, or OEMs, to supply various components of our IVIS imaging systems, including the cameras, imaging chambers, and certain subassemblies, filters and lenses. We obtain these key components from a small number of sources. For example, the lens for our IVIS Spectrum is obtained from a single source on a purchase order basis, and the CCD cameras for all of our IVIS imaging systems are obtained from two sources. We have a binding supply agreement with one of the camera suppliers. From time to time, we may experience delays in obtaining components from certain of our suppliers, which may have a negative impact on our ability to produce imaging systems. In the event of a disruption or discontinuation in supply, we believe that alternative sources for certain of these components would not be available on a timely basis, which would disrupt our operations and impair our ability to manufacture and sell our IVIS imaging systems.
Our dependence upon outside suppliers and OEMs exposes us to risks, including:
- •
- the possibility that one or more of our suppliers could terminate their services at any time;
- •
- the potential inability of our suppliers to obtain required components or products;
- •
- reduced control over pricing, quality and timely delivery due to the difficulties in switching to alternative suppliers;
- •
- the potential delays and expense of seeking alternative suppliers; and
- •
- increases in prices of key components.
We face competition from companies with established technologies for in vivo biological assessment, which may prevent us from achieving significant market share for our products.
We compete with a variety of established technologies for in vivo biological assessment that several competitors and customers may be using to analyze animal models. The most basic of these technologies have remained relatively unchanged for the past 40 years, are well established and are
36
routinely used by researchers. We believe it may take several years for all researchers to become fully educated about our in vivo optical imaging technology.
We believe that in the near term, the market for in vivo biological assessment will be subject to rapid change and will be significantly affected by new technology introductions and other market activities of industry participants. As other companies develop new technologies and products to conduct in vivo biological assessment, we may be required to compete with larger companies that enjoy several competitive advantages, including:
- •
- established distribution networks;
- •
- established relationships with life science, pharmaceutical, biotechnology and chemical companies as well as with biomedical researchers;
- •
- additional lines of products, and the ability to offer rebates or bundle products to offer higher discounts or incentives to gain a competitive advantage; and
- •
- greater resources for technology and product development, sales and marketing and patent litigation.
Our principal competitors that use established technologies for in vivo biological assessment include MDS Pharma Services, Ore Pharmaceuticals, Exelixis, Inc. and Lexicon Pharmaceuticals. Each of these companies uses animal models in the area of target validation in drug discovery and utilizes methods of assessment based upon knockout mice as well as other organisms such as fruit flies, worms and yeast. We also face competition from several companies including Carestream Health, Inc., Berthold Detection Systems GmbH, Hamamatsu Photonics, Biospace, Olympus Corporation, and Roper Scientific, Inc., which market systems which may be used to perform optical imaging when accompanied by the appropriate intellectual property licenses. Many of these companies have greater resources than we do. There are also several privately-held companies that have recently begun to market systems that may be used to perform optical imaging with the appropriate intellectual property licenses. At any time, other companies may develop additional directly competitive products that could achieve greater market acceptance or render our products obsolete.
Contamination in our animal populations could damage our inventory, harm our reputation and result in decreased sales.
We offer a portfolio of transgenic animals and LPTA models for use by researchers in a wide range of research and drug discovery programs and also perform breeding and model validation. We maintain animal facilities in Alameda, California and Cranbury, New Jersey. These animals and facilities must be free of contaminants, viruses or bacteria, or pathogens that would compromise the quality of research results. Contamination of our isolated breeding rooms could disrupt our models, delay delivery to customers of data generated from phenotyping and result in decreased sales. In 2003, one of Xenogen's animal facilities in Alameda was contaminated by a mouse virus introduced through one of our animal vendors. That facility was closed for decontamination, and the most valuable strains were transferred to third party breeders for rederivation so that Xenogen could continue to provide animals to its customers. The decontamination process took approximately three months. A similar contamination occurred again in 2005. Additional contamination would result in inventory loss, clean-up and start-up costs and reduced sales as a result of lost customer orders.
Accounting for goodwill and other intangible assets may have a significant adverse effect on us.
In accordance with the provisions of Statement of Financial Accounting Standards (SFAS) No. 144,Accounting for the Impairment or Disposal of Long-Lived Assets, we assess the recoverability of identifiable intangibles with finite lives and other long-lived assets, such as property, plant and equipment, for impairment whenever events or changes in circumstances indicate that the carrying
37
value may not be recoverable. In accordance with SFAS No. 142,Goodwill and Other Intangible Assets, goodwill and intangible assets with indefinite lives from acquisitions are evaluated annually, or more frequently, if events or circumstances indicate there may be an impairment, to determine whether any portion of the remaining balance of goodwill and indefinite lived intangibles may not be recoverable. If it is determined in the future that a portion of our goodwill and other intangible assets is impaired, we will be required to write off that portion of the asset according to the methods defined by SFAS No. 144 and SFAS No. 142, which will have an adverse effect on our reported GAAP net income for the period in which the write-off occurs.
The goodwill impairment analysis is a two-step process. We are comprised of a single reporting unit, and as such the first step used to identify potential impairment involves comparing the entity's estimated fair value to its carrying value, including goodwill. Fair value is determined by utilizing information about our Company as well as publicly available industry information. In our annual determination, we principally rely on the income approach, pursuant to which we determine fair value based on the estimated future cash flows, discounted by an estimated weighted-average cost of capital which reflects the overall level of inherent risk of the Company and the rate of return an outside investor would expect to earn. Determining fair value involves judgment by our management and requires the use of significant estimates and assumptions, including point-in-time estimates of revenue growth rates, profit margin percentages, discount rates, perpetuity growth rates, future capital expenditures and future market conditions, among others. Our projections are based on an internal strategic review. Key assumptions, strategies, opportunities and risks from this strategic review along with a market evaluation are the basis for our assessment. If the estimated fair value of a reporting unit exceeds its carrying value, goodwill is not considered to be impaired. However, if the carrying value exceeds estimated fair value, there is an indication of potential impairment and the second step is performed to measure the amount of impairment.
The second step of the goodwill impairment process involves the calculation of an implied fair value of goodwill. The implied fair value of goodwill is determined in a manner that is similar to how goodwill is calculated in a business combination, by measuring the excess of the estimated fair value of the reporting unit as calculated in step one, over the estimated fair values of the individual assets, liabilities and identifiable intangibles as if the reporting unit was being acquired in a business combination. If the carrying value of goodwill assigned to a reporting unit exceeds the implied fair value of the goodwill, an impairment charge is recorded for the excess. In determining the fair value of our net assets we determined the fair value of leases and certain intangible assets, including trademarks, patents, core and developed technologies and customer relationships.
Our annual goodwill impairment assessment has historically been completed at the beginning of the fourth quarter. With the contemporaneous sales of our PDQ and AutoTrace product lines in the fourth quarter of 2008, which met the criteria for assets held for sale prior to the goodwill impairment test date, we first determined the amount of goodwill ($14.3 million) that was to be allocated to these divestitures based upon a relative fair value basis considering their recent transaction values, and then applied our annual goodwill impairment analysis to the remaining goodwill balance ($66.3 million) which resulted in the determination that the fair value of the entity was less than its carrying value. The second step of the goodwill impairment test involved us calculating the implied goodwill for the entity. The carrying value of the goodwill assigned to the overall business exceeded the implied fair value of goodwill, resulting in a goodwill impairment of $43.4 million, which has been recorded in our results of operations in the fourth quarter of 2008.
Goodwill is not amortized, but is reviewed for impairment at least annually. The results of this year's impairment test are as of a point in time. If the future growth and operating results of our business are not as strong as anticipated and/or our market capitalization declines further, this could impact the assumptions used in calculating the fair value in subsequent years. To the extent goodwill is impaired in future periods, its carrying value will be further written down to its implied fair value and a
38
charge will be made to our earnings. Such an impairment charge would materially and adversely affect our GAAP reported operating results. As of December 31, 2008, we had recorded goodwill and other intangibles of $22.9 million in our consolidated balance sheet. The goodwill impairment charge is non-cash in nature and does not affect our liquidity, cash flows from operating activities, or debt covenants, or have any impact on future operations. No impairment was identified in fiscal years 2007 and 2006.
If our accounting estimates are incorrect, our financial results could be adversely affected.
Management judgment and estimates are necessarily required in the application of our critical accounting policies. We discuss these estimates in Item 7 of this Annual Report on Form 10-K in the subsection entitled "Critical Accounting Estimates." If our estimates are incorrect, our future financial operating results and financial condition could be adversely affected.
Terrorist acts, acts of war and natural disasters may seriously harm our business and revenues, costs and expenses and financial condition.
We rely on a single manufacturing location to produce our microfluidic chips and drug discovery systems, and a single location to produce laboratory automation, imaging and robotics systems, with no alternative facilities. We rely principally on our facility in Cranbury, New Jersey, to produce LPTA models and our facility in Alameda, California to produce Bioware cells and microorganisms. Alameda, California is also able to serve as a back-up facility for producing our LPTA models. These facilities and some pieces of manufacturing equipment are difficult to replace and could require substantial replacement lead-time. Our manufacturing facilities may be affected by natural disasters, such as earthquakes and floods. Earthquakes are of particular significance because our LabChip product manufacturing facility is located in Mountain View, California, an earthquake-prone area. In the event that our existing manufacturing facilities or equipment are affected by man-made or natural disasters, we would be unable to manufacture products for sale, meet customer demands or meet sales projections, which would harm our business.
Terrorist acts, acts of war and natural disasters (wherever located around the world) may cause damage or disruption to us, our employees, facilities, partners, suppliers, distributors and customers, any and all of which could significantly impact our revenues, expenses and financial condition. The terrorist attacks that took place in the United States on September 11, 2001 were unprecedented events that have created many economic and political uncertainties. The potential for future terrorist attacks, the national and international responses to terrorist attacks and other acts of war or hostility have created many economic and political uncertainties that could adversely affect our business and results of operations that cannot presently be predicted. We are largely uninsured for losses and interruptions caused by terrorist acts, acts of war and natural disasters.
We use hazardous materials in our business. Any claims relating to improper handling, storage or disposal of these materials could be time consuming and costly.
Our research and development processes, our anesthesia systems used with our optical imaging systems to anesthetize the animals being imaged, and our general biology operations involve the controlled storage, use and disposal of hazardous materials including, but not limited to, biological hazardous materials and radioactive compounds. We are subject to federal, state and local regulations governing the use, manufacture, storage, handling and disposal of these materials and waste products. Although we believe that our safety procedures for handling and disposing of these hazardous materials comply with the standards prescribed by law and regulation, the risk of accidental contamination or injury from hazardous materials cannot be completely eliminated. In the event of an accident, we could be held liable for any damages that result, and any liability could exceed the limits or fall outside the coverage of our insurance. We currently maintain a limited pollution cleanup insurance policy in the
39
amount of $1.0 million. We may not be able to maintain insurance on acceptable terms, or at all. We could be required to incur significant costs to comply with current or future environmental laws and regulations.
Compliance with governmental regulations could increase our operating costs, which would adversely affect the commercialization of our technology.
The Animal Welfare Act, or AWA, is the federal law that covers the treatment of certain animals used in research. The AWA currently does not cover rats of the genusRattus or mice of the genusMus bred for use in research, and consequently, we are not currently required to be in compliance with this law.
Currently, the AWA imposes a wide variety of specific regulations that govern the humane handling, care, treatment and transportation of certain animals by producers and users of research animals, most notably personnel, facilities, sanitation, cage size, feeding, watering and shipping conditions. If in the future the AWA is amended to include mice or rats bred for use in research in the scope of regulated animals, we will become subject to registration, inspections and reporting requirements. We believe compliance with such regulations would require us to modify our current practices and procedures, which could require significant financial and management resources.
Furthermore, some states have their own regulations, including general anti-cruelty legislation, which establish certain standards in handling animals. To the extent that we provide products and services overseas, we also have to comply with foreign laws, such as the European Convention for the Protection of Animals During International Transport and other anti-cruelty laws. In addition, customers of our mice in certain countries may need to comply with requirements of the European Convention for the Protection of Vertebrate Animals Used for Experimental and Other Scientific Purposes. Additional regulations in this area could impact our sales of laboratory animals into signatory countries. Since we develop animals containing changes in their genetic make-up, we may become subject to a variety of laws, guidelines, regulations and treaties specifically directed at genetically modified organisms. The area of environmental releases of genetically modified organisms is rapidly evolving and is currently subject to intense regulatory scrutiny, particularly overseas. If we become subject to these laws, we could incur substantial compliance costs. For example, the Biosafety Protocol, an international treaty adopted in 2000 to which the U.S. is not a party, regulates the transit of living modified organisms, a category that includes our transgenic mice, into countries party to the treaty. As our mice are not intended for release into the environment or for use for food, feed or processing, the treaty imposes only identification, handling, packaging and transport requirements for shipments into signatory countries. However, additional requirements may be imposed on such shipments in the future.
Additionally, exports of our optical imaging systems and biological reagents to foreign customers and distributors are governed by the International Traffic in Arms Regulations, the Export Administration Regulations, Patriot Act and Bioterrorism Safety Act. Although these laws and regulations do not restrict our present foreign sales programs, any future changes to these regulatory regimes may negatively affect or limit our foreign sales.
Public perception of ethical and social issues may limit or discourage the use of mice for scientific experimentation, which could reduce our revenues and adversely affect our business.
Governmental authorities could, for social or other purposes, limit the use of genetic modifications or prohibit the practice of our technology. Public attitudes may be influenced by claims that genetically engineered products are unsafe for use in research or pose a danger to the environment. The subject of genetically modified organisms, like genetically altered mice and rats, has received negative publicity and aroused significant public debate. In addition, animal rights activists could protest or make threats against our facilities, which may result in property damage. Ethical and other concerns about our
40
methods, particularly our use of genetically altered mice and rats, could adversely affect our market acceptance.
Risks Related to Owning Our Common Stock
Our stock price is extremely volatile, and you could lose a substantial portion of your investment.
Our stock has been trading on the NASDAQ Global Market since mid-December 1999. We initially offered our common stock to the public at $16.00 per share. Since then our stock price has been extremely volatile and has ranged, through February 28, 2009 from a high of approximately $202.00 per share on March 2, 2000 to a low of $0.81 per share on December 1, 2008. Our stock price may drop substantially following an investment in our common stock. We expect that our stock price will remain volatile as a result of a number of factors, including:
- •
- announcements by analysts regarding their assessment of us and our prospects;
- •
- announcements by our competitors of complementary or competing products and technologies;
- •
- announcements of our financial results, particularly if they differ from investors' expectations; and
- •
- general market volatility for technology stocks.
These factors and fluctuations, as well as general economic, political and market conditions, may materially adversely affect the market price of our common stock.
We have been sued, and are at risk of future securities class action litigation.
In the spring and summer of 2001, class action lawsuits were filed against certain leading investment banks and over 300 companies that did public offerings during the prior several years, including lawsuits against Caliper and certain of its officers and directors as described under Part I, Item 3, "Legal Proceedings." This and other securities litigation could result in potential liability, cause us to incur litigation costs and divert management's attention and resources, any of which could harm our business. In addition, announcements of future lawsuits of this or some other nature, and announcements of events occurring during the course of the current and any future lawsuits, could cause our stock price to drop.
Provisions of our charter documents and Delaware law may inhibit a takeover, which could limit the price investors might be willing to pay in the future for our common stock.
Provisions in our certificate of incorporation and bylaws may have the effect of delaying or preventing an acquisition in which we are not the surviving company or which results in changes in our management. In addition, because we are incorporated in Delaware, we are governed by the provisions of Section 203 of the Delaware General Corporation Law. These provisions may prohibit stockholders owning 15% or more of the outstanding voting stock, from consummating a merger or combination which includes us. These provisions could limit the price that investors might be willing to pay in the future for our common stock.
Item 1B. Unresolved Staff Comments
None.
41
All of our operations are carried out in properties which we lease from others. We do not currently own any real estate properties. We believe that, based upon our long-term strategic facilities plan, our current facilities are adequate for our needs for the foreseeable future.
Our business locations as of December 31, 2008 were as follows:
Location | Principal Activities | Square Footage | Lease Expiration | |||
|---|---|---|---|---|---|---|
Corporate Headquarters Hopkinton, MA | —Manufacturing | 137,000 | December 2015; plus two 5-year renewal options | |||
Mountain View, CA | —LabChip Manufacturing | 17,000 occupied | November 2013 | |||
Alameda, CA | —Molecular imaging, microfluidic and biology research and development | 54,000 | March 2019 | |||
Cranbury, NJ | —In vivo services business (office, laboratory and vivarium space) | 58,000 | September 2014 | |||
Hanover, MD | —In vitro services business (office and laboratory space) | 47,000 | February 2017 | |||
St. Louis, MO | —Idled facility | 25,000 (100% sublet) | April 2010 | |||
International | —Sales and service operations | Approximately 34,000 in | Various through 2011 |
Commencing on June 7, 2001, Caliper and three of its officers and directors (David V. Milligan, Daniel L. Kisner and James L. Knighton) were named as defendants in three securities class action lawsuits filed in the United States District Court for the Southern District of New York. The cases have been consolidated under the caption, In re Caliper Technologies Corp. Initial Public Offering Securities Litigation, 01 Civ. 5072 (SAS) (GBD). Similar complaints were filed against approximately 300 other public companies that conducted initial public offerings of their common stock during the late 1990s (the "IPO Lawsuits"). On August 8, 2001, the IPO Lawsuits were consolidated for pretrial purposes before United States Judge Shira Scheindlin of the Southern District of New York. Together, those cases are denominated In re Initial Public Offering Securities Litigation, 21 MC 92(SAS). On April 19, 2002, a Consolidated Amended Complaint was filed alleging claims against Caliper and the individual defendants under Sections 11 and 15 of the Securities Act of 1933, and under Sections 10(b) and 20(a) of the Securities Exchange Act of 1934, as well as Rule 10b-5 promulgated thereunder. The Consolidated Amended Complaint also names certain underwriters of Caliper's December 1999 initial public offering of common stock as defendants. The Complaint alleges that these underwriters charged excessive, undisclosed commissions to investors and entered into improper agreements with investors relating to aftermarket transactions. The Complaint seeks an unspecified amount of money damages. Caliper and the other issuers named as defendants in the IPO Lawsuits moved on July 15, 2002, to dismiss all claims on multiple grounds. By Stipulation and Order dated October 9, 2002, the claims against Messrs. Milligan, Kisner and Knighton were dismissed without prejudice. On February 19, 2003, the Court granted Caliper's motion to dismiss all claims against it. Plaintiffs were not given the right to replead the claims against Caliper. The time to appeal the dismissal has not yet expired. On
42
December 5, 2006 the Court of Appeals for the Second Circuit issued an opinion reversing Judge Scheindlin's prior certification of the plaintiff classes in several "focus" cases pending before her as part of the consolidated IPO Lawsuits. As a result of this ruling, on June 25, 2007, Judge Scheindlin issued an order terminating the settlement that had previously been agreed to among the plaintiffs, the issuers and their insurers. The parties in the "focus" cases subsequently briefed plaintiffs' motion seeking certification of a new class of plaintiffs; that motion was withdrawn without prejudice on October 10, 2008. It is Caliper's understanding that the parties to this litigation are negotiating a global settlement of the claims at issue in this litigation. The final resolution of this litigation is not expected to have a material impact on Caliper.
�� Previously, Caliper was party to a lawsuit brought by AntiCancer, Inc. against Xenogen Corporation (now a wholly owned subsidiary of Caliper) in 2005, which initially alleged that Xenogen infringed five patents of AntiCancer. Xenogen counterclaimed against AntiCancer in 2005, alleging that AntiCancer infringed four of Xenogen's patents. The case was scheduled to proceed to a Markman hearing in May 2008. However, on February 25, 2008, Caliper and AntiCancer entered into a settlement agreement pursuant to which the parties agreed to dismiss with prejudice all claims and counterclaims brought against each other in connection with this litigation. In connection with the settlement agreement, Caliper and AntiCancer also entered into a cross-licensing agreement. Under the cross-license agreement Caliper acquired the right to sublicense AntiCancer's fluorescent protein optical imaging patents to third-parties, alongside Caliper's own portfolio of in vivo fluorescent and bioluminescent optical imaging patents, and AntiCancer acquired the right to sublicense Caliper's optical imaging patents, in the field of fluorescent protein imaging, to a specified annual number of third parties throughout the life of the cross-license agreement, alongside AntiCancer's own fluorescent protein optical imaging patents. In addition, each company received a royalty free license from the other for internal and contract research operations. Under the cross-license agreement, Caliper and AntiCancer will share in any revenues generated by the licensing of their proprietary imaging technologies in the field of fluorescent protein imaging. No other payments will be made for either the settlement or cross-licensing agreements.
Caliper had been engaged in litigation in New York State Supreme Court with Young & Partners LLC (Young), an investment banking firm that was engaged by Caliper between August 2004 and September 2005, regarding whether Caliper owed a fee to Young for Caliper's acquisition of Xenogen Corporation, which closed in August 2006. The lawsuit was filed by Young in October 2006. Young sought payment of the fee that it believed it was owed, approximately $1.1 million, plus accrued interest, and payment of attorneys' fees. A two-day bench trial regarding this dispute was held on February 7 and 8, 2008. On April 2, 2008, Caliper settled this litigation with Young. In connection with this settlement, Caliper paid approximately $1.4 million to Young in full settlement and release of all claims. This amount was accrued for in full at December 31, 2007.
On January 23, 2009, Caliper filed and served a patent infringement suit against Shimadzu Corporation and its U.S. subsidiary, Shimadzu Scientific Instruments, Inc., in the United States District Court for the Eastern District of Texas. In this suit, Caliper alleges that Shimadzu's MCE-202 MultiNA instrument system, which performs electrophoretic separations analysis of nucleic acids, infringes 11 different U.S. patents owned by Caliper. Shimadzu is not required to file an answer to this complaint until March 17, 2009.
From time to time Caliper is involved in litigation arising out of claims in the normal course of business, and when a probable loss contingency arises, records a loss provision based upon actual or possible claims and assessments. The amount of possible claim recorded is determined on the basis of the amount of the actual claim, when the amount is both probable and the amount of the claim can be reasonably estimated. If a loss is deemed probable, but the range of potential loss is wide, Caliper records a loss provision based upon the low end estimate of the probable range and may adjust that estimate in future periods as more information becomes available. Litigation loss provisions, when
43
made, are reflected within general and administrative expenses in our statement of operations and are included within accrued legal expenses in the accompanying balance sheet. Based on the information presently available, management believes that there are no outstanding claims or actions pending or threatened against Caliper, the ultimate resolution of which will have a material adverse effect on our financial position, liquidity or results of operations, although the results of litigation are inherently uncertain, and adverse outcomes are possible.
Item 4. Submission of Matters to a Vote of Security Holders
No matters were submitted to a vote of security holders during the fourth quarter of the year ended on December 31, 2008.
44
Item 5. Market for Registrant's Common Equity, Related Stockholder Matters and Issuer Purchases of Equity Securities
Market Information
Our common stock is traded on the NASDAQ Global Market under the symbol "CALP." The following table shows the high and low close prices per share of our common stock as reported by the NASDAQ Global Market for the periods indicated.
| | High | Low | ||||||
|---|---|---|---|---|---|---|---|---|
Fiscal 2008: | ||||||||
First Quarter | $ | 5.58 | $ | 3.67 | ||||
Second Quarter | $ | 4.15 | $ | 2.59 | ||||
Third Quarter | $ | 4.19 | $ | 2.24 | ||||
Fourth Quarter | $ | 3.12 | $ | 0.81 | ||||
Fiscal 2007: | ||||||||
First Quarter | $ | 6.27 | $ | 5.36 | ||||
Second Quarter | $ | 5.86 | $ | 4.11 | ||||
Third Quarter | $ | 5.93 | $ | 4.48 | ||||
Fourth Quarter | $ | 6.15 | $ | 5.10 | ||||
Stockholders
As of February 28, 2009, there were approximately 300 holders of record of the 48,638,148 outstanding shares of our common stock.
Dividends
We have never declared or paid any dividends on our capital stock. We currently expect to retain future earnings, if any, for use in the operation and expansion of our business. Although we have no restrictions on paying cash dividends, we do not anticipate paying any cash dividends in the foreseeable future.
Unregistered Sales of Securities
There were no sales of unregistered securities during the year ended December 31, 2008.
Issuer Purchases of Equity Securities
None.
Performance Graph.
The following graph shows the total stockholder return of an investment of $100 in cash on December 31, 2003 for (i) Caliper's common stock, (ii) the NASDAQ Composite Index, (iii) The
45
Caliper Peer Group and (iv) the NASDAQ Pharmaceutical Index. All values assume reinvestment of the full amount of all dividends and are calculated as of December 31 of each year:
Comparison of 5 Year Cumulative Total Return
Assumes Initial Investment of $100
December 2008
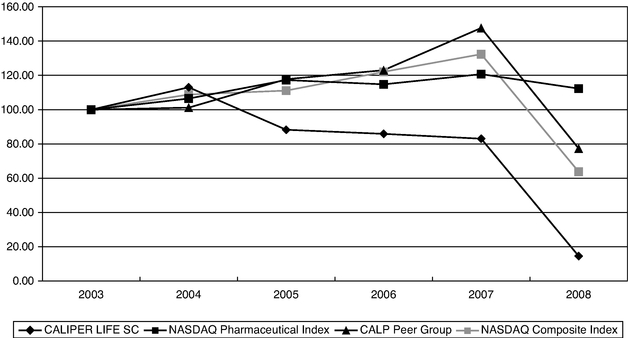
This Section is not "soliciting material," is not deemed "filed" with the SEC and is not to be incorporated by reference in any filing of Caliper under the 1933 Act or the 1934 Act whether made before or after the date hereof and irrespective of any general incorporation language in any such filing.
Item 6. Selected Financial Data
The following table sets forth selected consolidated financial data for each of our last five fiscal years. The selected financial data for each of the five years in the period ended December 31, 2008 have been derived from the consolidated financial statements of the Company, which financial statements have been audited by Ernst & Young LLP, independent registered public accounting firm. The aforementioned consolidated financial statements and the report thereon are included elsewhere in this Annual Report on Form 10-K. This data should be read in conjunction with the detailed information, financial statements and related notes, as well as "Management's Discussion and Analysis
46
of Financial Condition and Results of Operations" included in Item 7. The historical results are not necessarily indicative of the results of operations to be expected in the future.
| | Years Ended December 31, | |||||||||||||||
|---|---|---|---|---|---|---|---|---|---|---|---|---|---|---|---|---|
| | 2008 | 2007 | 2006 | 2005 | 2004 | |||||||||||
| | (In thousands, except share data) | |||||||||||||||
Statements of Operations Data(1)(2): | ||||||||||||||||
Revenues | $ | 134,054 | $ | 140,707 | $ | 107,871 | $ | 87,009 | $ | 80,127 | ||||||
Costs and expenses | 203,585 | 164,535 | 137,856 | 101,558 | 112,669 | |||||||||||
Operating loss | (69,531 | ) | (23,828 | ) | (29,985 | ) | (14,549 | ) | (32,542 | ) | ||||||
Interest income (expense), net | (794 | ) | (547 | ) | 478 | 895 | 846 | |||||||||
Other income (expense), net | 2,640 | 579 | 469 | (689 | ) | 517 | ||||||||||
Loss before income taxes | (67,685 | ) | (23,796 | ) | (29,038 | ) | (14,343 | ) | (31,179 | ) | ||||||
Benefit (provision) for income taxes | (607 | ) | (284 | ) | 104 | (114 | ) | (377 | ) | |||||||
Net loss | $ | (68,292 | ) | $ | (24,080 | ) | $ | (28,934 | ) | $ | (14,457 | ) | $ | (31,556 | ) | |
Net loss per common share, basic and diluted | $ | (1.42 | ) | $ | (0.51 | ) | $ | (0.75 | ) | $ | (0.46 | ) | $ | (1.08 | ) | |
Shares used in computing net loss per common share, basic and diluted | 48,114 | 47,301 | 38,743 | 31,313 | 29,273 | |||||||||||
| | As of December 31, | |||||||||||||||
|---|---|---|---|---|---|---|---|---|---|---|---|---|---|---|---|---|
| | 2008 | 2007 | 2006 | 2005 | 2004 | |||||||||||
| | (In thousands) | |||||||||||||||
Balance Sheet Data(1)(2): | ||||||||||||||||
Cash, cash equivalents, marketable securities and short-term restricted cash | $ | 26,701 | $ | 18,955 | $ | 24,937 | $ | 31,704 | $ | 50,237 | ||||||
Working capital, including credit facility borrowings (long-term) | 19,890 | 12,837 | 18,265 | 33,205 | 52,234 | |||||||||||
Total assets | 143,078 | 207,929 | 225,053 | 158,209 | 147,947 | |||||||||||
Total stockholders' equity | 76,738 | 141,186 | 157,409 | 118,438 | 111,579 | |||||||||||
- (1)
- The statement of operations data includes the results of NovaScreen beginning October 3, 2005, and the results of Xenogen beginning August 9, 2006, the respective dates of these acquisitions. The balance sheet data incorporates the effects of these acquisitions as of December 31 of the year in which each respective acquisition was completed.
- (2)
- The statement of operations data excludes the results of the PDQ and AutoTrace product lines beginning November 10, 2008, the date of these divestitures. The balance sheet data incorporates the effects of these divestitures as of December 31 of the year in which each respective divestiture was completed.
47
Item 7. Management's Discussion and Analysis of Financial Condition and Results of Operations
The following discussion and analysis should be read with "Selected Financial Data" and our financial statements and notes included elsewhere in this Annual Report on Form 10-K. The discussion in this Annual Report on Form 10-K contains forward-looking statements that involve risks and uncertainties, such as statements of our plans, objectives, expectations and intentions. The cautionary statements made in this Annual Report on Form 10-K should be read as applying to all related forward-looking statements wherever they appear in this Annual Report on Form 10-K. Our actual results could differ materially from those discussed here. Factors that could cause or contribute to these differences include those discussed in Part I, Item 1A, "Risk Factors," and "Factors Affecting Operating Results" below, as well as those discussed elsewhere.
The following discussion and analysis is based upon our financial statements, which have been prepared in accordance with accounting principles generally accepted in the United States.
Overview
Caliper develops and sells innovative and enabling products and services to the life sciences research community, a customer base that includes pharmaceutical and biotechnology companies, and government and other not-for-profit research institutions. We believe our integrated systems, consisting of instruments, software and reagents, our laboratory automation tools and our assay and discovery services enable researchers to better understand the basis for disease and more effectively discover safe and effective drugs. Our strategy is to transform drug discovery and development by offering technologies and services that ultimately enhance the ability to predict the effects that new drug candidates will have on humans. Our offerings leverage our extensive portfolio of molecular imaging, microfluidics, automation and liquid handling technologies, and scientific applications expertise to address key limitations in the drug discovery and development process—namely, the complex and costly process to conceive of and bring a new drug to market.
We believe that increasing the clinical relevance of drug discovery experimentation, whether at early stage, lower cost, in vitro (artificial environment) testing or later stage, more expensive preclinical in vivo (in a living organism) testing, will have a profound impact in helping our customers to determine the ultimate likelihood of success of drugs in treating humans. With enabling offerings in both the in vitro and in vivo testing arenas, and a unique strategy of enhancing the "bridge" or linkages between in vitro, in vivo and the clinic in order to optimize the cost of the experiment versus the clinical insight gained, we expect to continue to address growing, unmet needs in the market and drive on-going demand for our products and services. These market needs are underscored by key challenges that face the pharmaceutical and biotechnology industry, including late-stage drug failures and unforeseen side effects coming to light late in the development process or even after drugs are on the market.
We presently offer an array of products and services, many based on highly enabling proprietary technologies that address critical experimental needs in drug discovery and preclinical development and related processes. Our technologies are also enabling for other life sciences applications beyond drug discovery, such as environmental-related testing, and in applied markets such as agriculture and forensics. We also believe that our technology platforms may be able to provide ease of use, cost and data quality benefits for certain in vitro and in vivo diagnostic applications.
We have multiple channels of distribution for our products: direct to customers, indirect through our international network of distributors, through partnership channels under our Caliper Driven program and through joint marketing agreements. Through our direct and indirect channels, we sell products, services and complete system solutions, developed by us, to end customers. Our Caliper Driven program is core to our business strategy and complementary to our direct sales and distribution network activities, as it enables us to extend the commercial potential of our LabChip and advanced
48
liquid handling technologies into new industries and new applications with experienced commercial partners. We also utilize joint marketing agreements to enable others to market and distribute our products. By using direct and indirect distribution, and out-licensing our technology under our Caliper Driven program, we seek to maximize penetration of our products and technologies into the marketplace and position Caliper as a leader in the life sciences tools market.
2008 Key Highlights
During 2008, we placed significant emphasis on our continued strategic transformation to higher growth, higher profit product lines. In pursuing this objective, we further consolidated and streamlined our operations in order to both reduce costs as well as sharpen our focus on the core areas of our business. Key highlights of the year included:
Product Line Divestitures
On November 10, 2008, we completed, in two unrelated transactions, the sales of our Pharmaceutical Development and Quality ("PDQ") and AutoTrace product lines. The PDQ product line was comprised of instruments used for drug content uniformity and dissolution rate testing and related services. The purchase price paid to us was approximately $15.8 million, including approximately $13.8 million in cash together with certain assumed liabilities which are estimated at approximately $2.0 million. The AutoTrace product line was designed for water sample clean-up by solid phase extraction prior to analysis of the sample for contamination. The purchase price paid to us was approximately $5.0 million in cash. We recorded a gain of approximately $2.1 million in 2008 related to these product line divestitures. In addition to the benefit of the cash proceeds generated from the sales of these two business lines, we believe the narrowed product line focus on our remaining core technologies will improve our ability to become profitable.
Business Realignment
During the third quarter of 2008, we reorganized our various products and services along three core business areas—Optical Molecular Imaging (Imaging), Discovery Research (Research), and Drug Discovery Services (Services or CDAS which stands for Caliper Discovery Alliances and Services).
- •
- The Imaging business is focused on preclinical imaging, where Caliper holds a global leadership position in the high growth optical molecular imaging market. Principal activities of this business area include the expansion of the IVIS imaging instrument and related reagent product lines, development of new therapeutic area applications and facilitating additional imaging modalities.
- •
- Research is responsible for utilizing Caliper's core automation and microfluidic technologies to address an expanding array of opportunities in drug discovery and life science research, including molecular biology sample preparation for genomics, proteomics, cellular screening and forensics.
- •
- CDAS is responsible for expanding drug discovery collaborations and alliances, and increasing sales of drug discovery services. The focus of CDAS is to capitalize on market "outsourcing" trends and to maximize the large contract opportunity with the Environmental Protection Agency under its ToxCast screening program.
Cost Reduction Initiatives
Over the course of 2008, we completed several cost reduction initiatives to conserve our cash needs as well as increase productivity. During the first quarter of 2008, we approved and initiated the consolidation of our research and development operations into our Alameda, California location, which was completed during the third quarter of 2008. This research and development consolidation was coupled with certain general and administrative streamlining actions, including the resolution of certain
49
ongoing lawsuits. Also, in connection with the business realignment discussed above, we reduced our workforce, including the elimination of certain management positions. The aggregate effect of cost reduction initiatives implemented in 2008 reduced our annualized operating expenses by approximately $5.7 million and resulted in restructuring charges which totaled $4.6 million. In addition to these actions, leases related to previously closed facilities expired in June 2008, which will result in annualized cash savings of approximately $3.5 million.
2008 Summary GAAP Financial Performance
- •
- We achieved $134.1 million of total revenue in 2008, a decrease of 5% from $140.7 million of total revenue in 2007. The key elements of the decline were the substantial microfluidic license transactions and collaboration arrangements completed in 2007 which were non-recurring by nature, the divestiture of two product lines (PDQ and AutoTrace) in November 2008, and reduced revenues within CDAS related to our (1) ToxCast screening contract with the Environmental Protection Agency and (2) in vivo phenotyping and compound profiling service revenues from one customer. Offsetting these items were our key growth drivers in 2008 which were optical imaging product revenues, an increase in optical imaging license revenue, an increase in Staccato Automated Workstations and Zephyr liquid handling instrument sales, and the continued expansion of our microfluidic installed base, especially within the LabChip GX and EZ Reader platforms. On a pro forma basis, when excluding the product line divestitures and imaging licensing revenues which were reduced as a result of fair value purchase accounting, our total revenues of $122.8 million in 2008 grew by 7% compared to 2007.
- •
- Product gross margins decreased to 39% in 2008 versus 40% in 2007 primarily as a result of the increased material costs from the concentration of Staccato Automated Workstation revenue as offset by the benefit due to increased volume.
- •
- Service gross margins decreased to 34% in 2008 from 41% in 2007 due largely to the fixed cost base of our in vitro and in vivo facilities and the delay in timing of work within our in vivo services business, as well as an increase in the service costs, primarily headcount related, of the instrument services business, including costs of material.
- •
- Operating expenses increased $35.3 million in 2008 in comparison to 2007, primarily due to the goodwill impairment of $43.4 million and the restructuring charge related to the Mountain View, California facility of $4.6 million which are discussed below. All other operating expenses decreased $12.6 million in 2008 in comparison to 2007. This decrease resulted from reduced research and development spending of $3.0 million as a result of our West Coast consolidation and reduced funded collaboration work, and lower legal expenses including reduced litigation defense and settlement costs of $3.0 million. We also realized $4.8 million of reduced expenses primarily through efforts to streamline operations and gain efficiencies through reduced headcount and spending, and as a result of a decrease in incentive compensation expense in 2008. Other effects on operating expenses included a $1.8 million reduction in amortization expense from the Zymark intangibles that became fully amortized in July 2008.
- •
- Our annual goodwill impairment assessment has historically been completed at the beginning of the fourth quarter. With the sales of our PDQ and AutoTrace product lines in November 2008, we first determined the amount of goodwill that was to be allocated to these product groupings based upon their recent transaction values, and then applied our annual analysis (see Footnote 3 of Notes to Consolidated Financial Statements in Item 15 of this Annual Report on Form 10-K). As a result of our analysis we determined that the carrying value of the goodwill assigned to the overall business exceeded the implied fair value of goodwill resulting in a goodwill impairment of $43.4 million which was recorded in the fourth quarter.
50
- •
- During 2008, we recorded a restructuring charge of $4.6 million related to our West Coast consolidation and the related abandonment of approximately 36,500 square feet of space in Mountain View, California. We estimate that ongoing facility cash outflow, primarily rent payments net of sublease income, will be spread over the approximately 5 years remaining on our Mountain View, California lease. We expect this initiative to result in lower expensed facility costs of approximately $1.3 million per year.
- •
- Net loss for 2008 was $68.3 million, or $1.42 per share, compared to net loss of $24.1 million, or $0.51 per share in 2007. The increase in net loss was primarily due to the goodwill impairment charge of $43.4 million.
Performance Trends and Economic Conditions
The table below provides a reconciliation of our GAAP basis revenue to pro forma revenue results for 2008 and 2007, after giving effect to the divestures of the PDQ and AutoTrace product lines which occurred in 2008. We believe this is a useful measure in evaluating revenue performance among comparative periods, but these non-GAAP comparisons are not intended to substitute for GAAP financial measures.
| | Year Ended December 31, | | | ||||||||||||||||||||||
|---|---|---|---|---|---|---|---|---|---|---|---|---|---|---|---|---|---|---|---|---|---|---|---|---|---|
| | GAAP | Non-GAAP Adjustments | Non-GAAP | | | ||||||||||||||||||||
| | GAAP % Chg | Non-GAAP % Chg | |||||||||||||||||||||||
| | 2008 | 2007 | 2008 | 2007 | 2008 | 2007 | |||||||||||||||||||
| | (In thousands) | | | ||||||||||||||||||||||
| $ | (11,217 | )(1) | |||||||||||||||||||||||
| $ | (11,308 | )(2) | (15,492 | )(2) | |||||||||||||||||||||
Research | $ | 68,519 | $ | 80,673 | (11,308 | ) | (26,709 | ) | $ | 57,211 | $ | 53,964 | (15% | ) | 6% | ||||||||||
Imaging | 45,765 | 39,084 | 23 | (3) | 1,037 | (3) | 45,788 | 40,121 | 17% | 14% | |||||||||||||||
Services (CDAS) | 19,770 | 20,950 | — | — | 19,770 | 20,950 | (6% | ) | (6% | ) | |||||||||||||||
Total revenue | $ | 134,054 | $ | 140,707 | $ | (11,285 | ) | $ | (25,672 | ) | $ | 122,769 | $ | 115,035 | (5% | ) | 7% | ||||||||
For purposes of comparing growth rates for each of the three principal areas of our business, the above non-GAAP table reconciliation excludes the following:
- (1)
- Reflects elimination of certain collaboration-related microfluidic license and contract revenue recognized during the year ended 2007 which were concluded in 2007.
- (2)
- Reflects elimination of the revenues related to the PDQ and AutoTrace product lines divested in November 2008.
- (3)
- Reflects the add back of the deferred revenue adjustments recorded in purchase accounting that reduce revenues that would otherwise be recognized on a continuing GAAP basis.
Significant developments and trends among each of our key product families during 2008 included:
Imaging
In 2008, cumulative placements of IVIS imaging systems surpassed 675 units, making, we believe, our IVIS instrument one of the most successful platforms ever offered for pre-clinical molecular imaging. In 2008, overall imaging revenues increased 14% on a pro forma basis, including 13% product and service growth. We believe that there is continued market opportunity for this product line to grow, with instrument placements as well as expansion of the product line through aftermarket services and accessories, as well as reagents. We believe the opportunity for this product line to grow is enabled by i) continuing to expand beyond our historic core emphasis on oncology, to include therapeutic areas
51
such as central nervous system disorders, infectious disease, inflammation and stem cell research, and ii) extension of the product line to further detection modalities beyond bioluminescence and fluorescence detection through organic investment and acquisition.
Research
In 2008, overall research revenues comprised of our microfluidics and automation product groups increased 6% on a pro forma basis, when excluding revenues for the divested product lines and non-recurring microfluidic contract and license revenues. Key factors were as follows:
Microfluidics. During 2008, we experienced a 1% decline in total microfluidics products and services revenue on a pro forma basis. This decline was caused by a fall off in market demand for our LabChip 3000 system and lost datapoint revenues from a single customer who is no longer in business, offset by increasing demand for our LabChip GX instruments, which replaced the LabChip 90 in July 2008, and our EZ reader and ProfilerPro kinase profiling and reagent systems which replaced the LabChip 3000 in 2007. Our plans for 2009 and beyond are to capitalize on the successful 2008 consolidation of our West Coast research and development resources in order to broaden the capabilities and market attractiveness of our microfluidics product offerings, an example being the launch of the LabChip GX in 2008, across both our direct and indirect distribution channels. We are also exploring forensics and next generation sequencing sample preparation and molecular diagnostics as opportunities for longer-term growth.
Automation and Liquid Handling. During 2008, liquid handling and automation revenues increased 10% on a pro forma basis. The increase was driven by strong market demand for our core liquid handling offerings including Staccato Automated Workstations and Zephyr liquid handling instruments. We see the markets for liquid handling and automation as mature and intensely competitive; however, we believe we can continue to achieve success in these areas in a number of ways. We reorganized our sales and service teams during the third quarter of 2008, to expand our focus on utilizing our core automation and microfluidic technologies to address expanding market opportunities such as molecular biology sample preparation for genomics, proteomics, and cellular screening and forensics.
CDAS
During 2008, CDAS service revenues decreased by approximately 6%. The decrease was balanced among both in vivo and in vitro services. In vivo decreases resulted primarily from a decline in phenotyping and compound profiling services provided to one large pharmaceutical company, and in vitro services decreased as a result of reduced level of services requested by the EPA in 2008 under the ToxCast screening contract we were awarded in 2007. The goal of the ToxCast screening program is for the EPA to shift more of its agricultural chemicals testing toward in vitro analysis as opposed to animal testing. This program has the potential to generate significant revenues over the next several years; however, the program is in its early beginning stages and relies on federal budget authorization.
Overall Economic Outlook
Current economic conditions have led to an unprecedented level of uncertainty across industries, including the life sciences tools and services industry. Principal among concerns are that capital equipment and outsourced services budgets will be reduced and that companies will experience enhanced seasonality that could delay business to the second half of the calendar year. Coupled with these effects, the recent strengthening of the dollar in relation to certain currencies is expected to have an unfavorable impact on our reported revenues in 2009 versus 2008. If current exchange rates were to remain in effect over 2009, we estimate that this would have a potential negative impact of approximately 2 - 3% on our overall revenue growth. On the positive side, we have introduced several
52
potentially high impact products such as LabChip GX, IVIS Kinetic and Zephyr which are designed to benefit customers in the areas of genomics and molecular imaging, two fields in particular where research funding appears to remain strong. In addition, we believe that we will see at least a partial rebound in EPA task orders under the ToxCast screening program in 2009. The recent American Reinvestment and Recovery Act of 2009 (Stimulus Package) includes $10 billion in incremental funding to the NIH's annual budget. While these funds are yet to be dispersed, we believe that we will achieve some level of benefit from the Stimulus Package directly or indirectly from government and academic labs which draw upon NIH funding.
Results of Operations
Revenue
| | Year Ended December 31, 2008 | $ Change | % Change | Year Ended December 31, 2007 | $ Change | % Change | Year Ended December 31, 2006 | |||||||||||||||
|---|---|---|---|---|---|---|---|---|---|---|---|---|---|---|---|---|---|---|---|---|---|---|
| | (In thousands) | |||||||||||||||||||||
Product revenue | $ | 85,149 | $ | 2,188 | 3% | $ | 82,961 | $ | 13,713 | 20% | $ | 69,248 | ||||||||||
Service revenue | 37,734 | 177 | —% | 37,557 | 13,103 | 54% | 24,454 | |||||||||||||||
License fees and contract revenue | 11,171 | (9,018 | ) | (45% | ) | 20,189 | 6,020 | 42% | 14,169 | |||||||||||||
Total revenue | $ | 134,054 | $ | (6,653 | ) | (5% | ) | $ | 140,707 | $ | 32,836 | 30% | $ | 107,871 | ||||||||
Product Revenue. Product revenue increased during 2008 compared to 2007, primarily due to strong imaging sales which increased by $2.9 million, or 10%, driven by IVIS instrument growth, including an 8% increase in instrument placements. Research product sales decreased $0.7 million, or 1%, during 2008 as compared to 2007, primarily as a result of sales decreases caused by (a) weaker sales of non-core focus products, including the PDQ and AutoTrace product lines, which we divested in November 2008 which decreased by $3.8 million in 2008; (b) lower revenue from kinase screening (LabChip 3000 systems and EZ Reader instruments) due to increased competition from kinase screening outsourcing, which decreased by $0.3 million; and (c) overall decreases within our OEM relationships and other research product lines which decreased by $2.5 million, of which $1.1 million was related to lost datapoint revenues from a single customer that is no longer in business. Offsetting these decreases within Research were (a) strong sales in our automated sample preparation solutions led by sales of Staccato Automated Workstations and Zephyr liquid handling instruments, which increased by $4.9 million; and (b) sales of LabChip GX and GXII, our latest microfluidic benchtop instruments launched in mid-2008 for genomic sample preparation and analysis, which resulted in a $1.0 million increase.
Product revenue increased during 2007 compared to 2006, primarily as a result of sales of optical imaging products which were added to our product portfolio as a result of our acquisition of Xenogen in August 2006. Overall, optical imaging products, which includes IVIS imaging systems and related consumables and reagents, accounted for $15.7 million of our increase in revenue in 2007, and 35% of total product revenue, with 2007 being the first full year of sales of this product line. We had a 10% increase in sales of IVIS imaging systems in 2007, compared to 2006, including during the period in which Xenogen was a standalone entity. Sales of microfluidic products, comprised of LabChip instruments and chips, increased by approximately $1.8 million, or 11%, from $15.8 million in 2006 to $17.6 million in 2007. The key reasons for this improvement were the introduction of the EZ Reader Kinase screening platform and associated ProfilerPro reagent kits in the first quarter of 2007, and continued strong demand for the LabChip 90 automated electrophoresis system. During 2007 we placed a total of 69 new LabChip systems with customers, which represented a 17% increase in units sold compared to 2006. Sales of liquid handling and automation products declined by $3.8 million on a net
53
basis overall, or 10%, from $39.5 million in 2006 to $35.8 million in 2007. This decline was driven mainly by a substantial decrease of $6.6 million in sales of liquid handling and automation products, primarily as a result of weakness experienced in OEM sales and integrated Staccato platform sales, which was partially offset by a $2.8 million increase in sales of analytical instruments for drug development and other specialty applications. We believe that the decline in liquid handling and automation product sales was due, in part, to temporary market conditions as evidenced by an increase in customer orders in our fiscal fourth quarter which led to a stronger ending backlog for such products at the end of 2007 in comparison to the end of 2006. In addition, during 2007 we introduced Zephyr, a lower-priced, desktop version of our Sciclone liquid handler and have begun to see strong initial customer interest in this newer liquid handling product. Finally, in response to the decrease in OEM product sales, we took steps to realign sales management and focus greater resources on the OEM channel effective at the start of 2008.
Service Revenue. Service revenue was flat during 2008 compared to 2007, consisting of a $1.8 million increase from instrument-based services driven primarily by increases in the installed bases of IVIS imaging and LabChip microfluidic instruments, net of a $0.8 million decrease from service revenues related to the PDQ and AutoTrace product lines which were sold in the fourth quarter of 2008 and a $0.8 million decrease in CDAS service revenues. The CDAS revenue decline included the loss of $1.7 million from a single customer contract that was not renewed in 2008, a $1.5 million decrease related to timing delays under a single contract with a particular customer in comparison to similar prior year revenues, and a $1.0 million decrease under the EPA ToxCast screening contract in comparison to 2007 revenues. The effects of these declines were partially offset by revenue increases from other CDAS service platforms including imaging studies, transgenic animal production, and in vitro screening projects.
Service revenue increased during 2007 compared to 2006 primarily as a result of in vivo drug discovery services performed by Xenogen Biosciences which became part of CDAS in 2006. Overall, the in vivo arm of CDAS generated $7.9 million of incremental service revenue for us in 2007, adding to $1.8 million of in vitro service revenue growth (performed by our NovaScreen business unit), the majority of which resulted from the ToxCast screening contract that we were awarded by the EPA during 2007. In addition, we experienced a $3.5 million increase in billable services and support contracts associated with our installed instrument base. This increase was primarily driven by substantial new placements of IVIS imaging systems in 2007.
License Fees and Contract Revenue. License fees and contract revenue decreased during 2008 compared to 2007 primarily as a result of anticipated declines in both non-recurring microfluidic license revenues of $8.7 million and contract research collaboration revenue of $2.5 million. These declines were due to collaboration arrangements completed in 2007, including related license revenues stemming from these arrangements. These decreases were partially offset by increases in imaging license revenues of $2.7 million during 2008 compared to 2007. The increase in imaging license revenue was due in part to favorable purchase accounting effects of $1.1 million which resulted from contract renewals at "full" value versus the lower recorded "fair" value of such contracts pursuant to purchase accounting rules applied to the purchase of Xenogen in 2006.
License fees and contract revenue increased during 2007 compared to 2006 primarily as a result of $4.5 million of optical imaging license revenue, and an increase of $4.2 million in revenue from license rights granted under our microfluidic patent portfolio, the latter of which is not expected to be a material source of ongoing revenue beyond 2007. These sources of revenue were partially offset by a decrease in collaboration research revenue of $2.0 million in 2007 as compared to 2006 and a decrease in certain government funded research projects of approximately $0.7 million over this same period.
54
Cost of Revenue
| | Year Ended December 31, 2008 | $ Change | % Change | Year Ended December 31, 2007 | $ Change | % Change | Year Ended December 31, 2006 | ||||||||||||||||
|---|---|---|---|---|---|---|---|---|---|---|---|---|---|---|---|---|---|---|---|---|---|---|---|
| | (In thousands) | ||||||||||||||||||||||
Cost of | |||||||||||||||||||||||
Product revenue | $ | 52,178 | $ | 2,418 | 5% | $ | 49,760 | $ | 4,301 | 9% | $ | 45,459 | |||||||||||
Service revenue | 24,739 | 2,382 | 11% | 22,357 | 7,440 | 50% | 14,917 | ||||||||||||||||
License revenue | 1,477 | (1,038 | ) | (41% | ) | 2,515 | 2,296 | 1,048% | 219 | ||||||||||||||
Total cost of revenue | $ | 78,394 | $ | 3,762 | 5% | $ | 74,632 | $ | 14,037 | 23% | $ | 60,595 | |||||||||||
Cost of Product Revenue. Cost of product revenue increased during 2008 primarily due to the overall increase in product sales. The impact of increased revenues, however, was further affected by higher material costs which resulted from third-party manufactured components which comprise Staccato system sales which accounted for a substantial portion of the product revenue increase as discussed above. Material costs within cost of product revenue were approximately 34.1% of sales in 2008 versus 33.6% in 2007, while other variable product costs were approximately 10.7% of product sales versus 9.0% in 2007, reflecting increased inventory reserve allowance and other manufacturing variances. Offsetting these higher material and other variable costs was a $0.7 million decrease in installation and product warranty labor costs compared to 2007.
Cost of product revenue increased during 2007 primarily due to the overall increase in product sales, including in particular sales of optical imaging products as discussed above. Material costs within cost of product revenue were approximately 33.6% of sales in 2007 versus 34.8% of sales in 2006, reflecting improvement related to strategic sourcing initiatives while other variable product costs were approximately 9.0% of product sales versus 7.6% in 2006 reflecting primarily increased sales subject to third party royalties and incremental inventory reserve allowances due to parts made obsolete by recent product introductions. Overall labor and manufacturing overhead decreased by approximately $1.6 million, from $16.1 million or 23% of sales in 2006, to $14.5 million, or 18% of sales in 2007 leading to overall product gross margin percentage improvement, as discussed below. The labor and overhead spending reductions resulted primarily from indirect labor cost reductions implemented in our Hopkinton, Massachusetts manufacturing plant during 2007 and reduced warranty support labor.
Cost of Service Revenue. Cost of service revenue increased during 2008 as compared to 2007 primarily related to increases in facility costs of our CDAS businesses which increased by $1.0 million over 2007 as a result of the renewal of leases in both our Cranbury, New Jersey and Hanover, Maryland locations, coupled with an expansion of space in Hanover. In addition, an increase in project materials spending accounted for an additional $0.2 million of the overall increase. Beyond these factors, the remaining increase is driven by the allocation of resources to support instrument-driven service revenues (service contracts, billables and training) due in large part to the increase in the installed base of IVIS imaging and micro fluidic instruments being serviced.
Cost of service revenue increased during 2007 compared to 2006 primarily due to having a full year of Xenogen Biosciences within our CDAS operations which caused service costs to increase by $4.9 million. Also within CDAS, NovaScreen's service costs increased by approximately $1.0 million during 2007 compared to 2006 as a result of increased staffing and material costs primarily associated with the EPA ToxCast screening program. In addition to these primary increases, labor and other costs related to billable services and support contracts associated with our installed instrument base increased by approximately $1.5 million worldwide.
Cost of License Revenue. Cost of license revenue, which is comprised of sublicense fees and royalty payments, decreased during 2008 compared to 2007 primarily as a result of the substantial
55
microfluidic revenue decline discussed above. The cost of license revenue increase during 2007 as compared to 2006 incorporated the first full year impact of royalties due to Stanford University on the basis of our Imaging license revenues, together with all other pre-existing royalties and license arrangements with certain other third parties from whom we in-license technologies.
Gross Margins. Product gross margins decreased to 39%, from 40% in 2007, despite the overall increase in product revenues and a $0.7 million reduction in manufacturing spending as noted inCost of Revenues above. The primary reason for this decrease was the mix of revenues, which featured, for example, a greater percentage of sales from Staccato automated workstations compared to 2007, which carried a much higher material cost content. Gross margin on service revenue was 34% for 2008 and 41% for 2007. Approximately 500 basis points of the decrease in service margin resulted primarily from higher facility costs and project material costs within CDAS, and the effect of lower revenues in relation to fixed spending levels as a result of certain contract delays that resulted during the year. The remaining decline in service gross margin was driven by an increase of labor and material costs incurred related to instrument service revenues.
Gross margin on product revenue was 40% for 2007, as compared to 34% in 2006 which was a result of the combined effects of reduced manufacturing labor and overhead costs in relation to higher sales volumes as described above. Gross margin on service revenue was 41% for 2007 and 39% for 2006. This modest improvement reflected improved productivity leverage achieved at CDAS in vitro operations related to the EPA ToxCast contract, partially offset by lower gross margins associated with CDAS' in vivo drug discovery service revenues. In relation to service revenue, CDAS' in vivo operations cost structure is comparably higher than our historic service cost structure (prior to our acquisition of Xenogen), thus weighing down our service gross margins when compared to historic periods.
Operating Expenses
| | Year Ended December 31, 2008 | $ Change | % Change | Year Ended December 31, 2007 | $ Change | % Change | Year Ended December 31, 2006 | |||||||||||||||
|---|---|---|---|---|---|---|---|---|---|---|---|---|---|---|---|---|---|---|---|---|---|---|
| | (In thousands) | |||||||||||||||||||||
Research and development | $ | 19,921 | $ | (4,870 | ) | (20% | ) | $ | 24,791 | $ | 200 | 1% | $ | 24,591 | ||||||||
Selling, general and administrative | 48,987 | (5,967 | ) | (11% | ) | 54,954 | 11,384 | 26% | 43,570 | |||||||||||||
Impairment of goodwill | 43,365 | 43,365 | nm | — | — | nm | — | |||||||||||||||
Amortization of intangible assets | 8,313 | (1,793 | ) | (18% | ) | 10,106 | 1,264 | 14% | 8,842 | |||||||||||||
Restructuring charges, net | 4,605 | 4,553 | nm | 52 | (206 | ) | (80% | ) | 258 | |||||||||||||
| $ | 125,191 | $ | 35,288 | 39% | $ | 89,903 | $ | 12,642 | 16% | $ | 77,261 | |||||||||||
Research and Development Expenses. Research and development spending decreased by $4.9 million during the year ended December 31, 2008 compared to the same period in 2007. These cost reductions were the result of reduced spending related to microfluidic collaboration projects that ended in 2007, savings from cost reduction initiatives implemented in the second quarter of 2007, and the consolidation of our West Coast research and development operations in the first quarter of 2008. The overall net decrease was comprised of cost reductions including $3.0 million in personnel related costs, $1.0 million in material and operating supplies, $1.1 million in allocated facility and information technology costs, and $0.2 million of all other costs, which were partially offset by $0.4 million of severance charges. We continue to evaluate research and development spending based on anticipated revenues and market opportunities.
Research and development spending increased by $0.2 million, net, in 2007 versus 2006. This increase consisted of a number of changes in spending, including the following: a $2.9 million reduction
56
for in-process research and development projects acquired from Xenogen in 2006 that were completed by us in 2007; a $1.3 million overall decrease in liquid handling and microfluidics project spending consisting of $0.6 million in reduced labor-related costs, $0.6 million in reduced material and operating supplies and $0.1 million of reduction in all other costs; and a $4.5 million increase in optical imaging research and development costs consisting primarily of approximately $2.1 million in increased labor-related costs, $1.0 million in increased facilities-related costs (as a result of a full year of Xenogen's operations) and $1.4 million of increase in all other costs.
As a percentage of revenues, we expect research and development spending to generally decrease in the future, to the extent our revenues continue to grow, and as we continue to closely manage discretionary spending on research programs with attractive commercial potential.
Selling, General and Administrative Expenses. Selling, general and administrative expenses decreased by $6.0 million during the year ended December 31, 2008 compared to the same period in 2007. This decrease was primarily general and administration related ($5.6 million) and included $1.4 million reduction of litigation costs related to a settlement charge incurred in 2007 and paid in 2008, a $1.5 million reduction in litigation defense costs which included $1.0 million of proceeds from a mediated settlement in our favor, a $0.6 million reduction related to legal and advisory services related to merger and acquisition activities in 2007, a $0.8 million reduction in personnel-related costs due to headcount reductions, a $0.7 million reduction in SFAS 123R stock compensation expense, and a decrease in all other general and administrative costs of $0.6 million. In addition to the foregoing, selling and marketing expenses decreased by $0.4 million during 2008 primarily due to the decrease in SFAS 123R stock compensation expense.
Selling, general and administrative expenses increased by $11.4 million during 2007 compared to 2006 primarily due to the full year results of Xenogen included in our 2007 operations. In general, costs and expenses were affected by the integration of Xenogen's business with our ongoing operations as follows. Sales and marketing expenses increased by approximately $1.8 million due to the full year impact of, on average, approximately 20 additional sales and marketing employees and $0.3 million in increased legal expenses. The remaining increase of $9.3 million related primarily to sales and marketing expenses of $5.3 million and $4.0 million in general and administrative costs. The increase in selling, general and administrative expenses resulted from $2.6 million of labor-related expenses (including a reallocation of existing personnel resources from other areas of the business), $2.3 million of legal spending for litigation and other legal costs, $1.6 million of sales and marketing related expenses, $0.5 million of legal and advisory services related to merger and acquisition activity, $0.6 million of increased provision for doubtful accounts, and $1.9 million of other costs, offset by a decrease of $0.2 million in stock-based compensation expense.
Impairment of Goodwill. We perform an annual impairment analysis of goodwill to determine if impairment exists, and may perform a test for the impairment of goodwill more frequently if events or circumstances indicate that goodwill may be impaired. Our annual goodwill impairment assessment has historically been completed at the beginning of the fourth quarter. With the sales of our PDQ and AutoTrace product lines in the fourth quarter, we first determined the amount of goodwill that was to be allocated to these product groupings based upon their recent transaction values, and then applied our annual analysis which resulted in the determination that impairment had occurred. The second step of the goodwill impairment test involved our calculating the implied goodwill for the entity. The carrying value of the goodwill assigned to the overall business exceeded the implied fair value of goodwill resulting in a goodwill impairment of $43.4 million. The goodwill impairment charge is non-cash in nature and does not affect our liquidity, cash flows from operating activities, or debt covenants. No impairment was identified in fiscal years 2007 and 2006. The goodwill impairment assessment is more fully discussed in Footnote 7 of Notes to Consolidated Financial Statements in Item 15 of this Annual Report on Form 10-K.
57
Amortization of Intangible Assets. Amortization expense was $8.3 million, $10.1 million and $8.8 million during the years ended December 31, 2008, 2007 and 2006, respectively, related to assets acquired with our acquisitions of Zymark, NovaScreen and Xenogen. Amortization is computed based upon the estimated timing of the undiscounted cash flows used to value each respective asset over the estimated useful life of the particular intangible asset, or using the straight-line method over the estimated useful life of the intangible asset when the pattern of cash flows is not necessarily reflective of the true consumption rate of the particular intangible asset. The decrease in amortization during 2008 is related to the fact that the Zymark intangibles were 100% amortized as of July 13, 2008. The increase in 2007 relates to the acquisition of Xenogen in 2006 and the inclusion of the related amortization for a full year.
Amortization expense in 2006 included a charge of $1.7 million related to the impairment of certain intangible assets established with the acquisition of NovaScreen. The charge consisted of $990,000 related to the NovaScreen trade name and $719,000 related to government grants and contracts, each of which was written off during the fourth quarter of 2006. The charge for the trade name relates to Caliper's decision to combine its drug discovery screening and profiling services for both in vitro and in vivo research under a new trade name, Caliper Discovery and Alliance Services. The charge for government contracts and grants resulted from a relative lack of success in obtaining new sources of government research and development funding, due to increased competition for funding.
Restructuring Charges, net. We incurred restructuring charges in 2008, 2007 and 2006 related to acquisition and integration activities that are more fully discussed in Footnote 11 of Notes to Consolidated Financial Statements in Item 15 of this Annual Report on Form 10-K. Restructuring charges during 2008 related to recording a restructuring charge of $4.6 million related to the West Coast consolidation which included a $2.8 million charge in the third quarter along with a revision to the sublease assumption of $1.8 million during the fourth quarter based on the deteriorating sublease market in Mountain View, California, and the related abandonment of approximately 36,500 square feet of space in Mountain View, California. We estimate that ongoing facility-related cash outflow, primarily rent payments net of sublease income, will be spread over the 5.1 years remaining on our Mountain View, California lease. This facility closure has been accounted for in accordance with SFAS No. 146, pursuant to which we have recorded a liability equal to the fair value of the remaining lease payments, net of expected sublease payments, as of the cease-use date. We expect this initiative to result in lower expensed facility costs of approximately $1.3 million per year.
Restructuring charges during 2007 related to accretion of interest on facilities, net of sub-lease income. Restructuring charges during 2006 relate to a charge for increased operating costs on idle facilities and accretion of interest on facilities, net of sub-lease income.
Interest and Other Income and Expenses
| | Year Ended December 31, 2008 | $ Change | % Change | Year Ended December 31, 2007 | $ Change | % Change | Year Ended December 31, 2006 | |||||||||||||||
|---|---|---|---|---|---|---|---|---|---|---|---|---|---|---|---|---|---|---|---|---|---|---|
| | (In thousands) | |||||||||||||||||||||
Interest income | $ | 259 | $ | (391 | ) | (60% | ) | $ | 650 | (258 | ) | (28% | ) | $ | 908 | |||||||
Interest expense | (1,053 | ) | 144 | 12% | (1,197 | ) | (767 | ) | (178% | ) | (430 | ) | ||||||||||
Gain on divestiture of product lines | 2,119 | 2,119 | nm | — | — | nm | — | |||||||||||||||
Other income (expense), net | 521 | (58 | ) | (10% | ) | 579 | 110 | 23% | 469 | |||||||||||||
| $ | 1,846 | $ | 1,814 | nm | $ | 32 | $ | (915 | ) | (97% | ) | $ | 947 | |||||||||
58
Interest Income. Interest income decreased in both 2008 and 2007 primarily due to lower cash, cash equivalents and marketable securities balances, on average, over the previous years due to cash used in operating and investing activities.
Interest Expense. Interest expense modestly declined during 2008 compared to 2007 primarily as a result of the decrease in the prime interest rate, even though outstanding borrowings increased by $2.0 million in 2008. Interest expense increased in 2007 compared to 2006 as a result of a full year of interest charges under the credit facility which was established in August 2006, including a $4.3 million increase in average outstanding borrowings during the second-half of 2007. Interest expense in 2006 reflected a partial year of interest expense of approximately $8.5 million of outstanding borrowing from August through December 2006.
Gain on Divestiture of Product Lines. In November 2008, we divested our PDQ and AutoTrace product lines and recorded a gain of $2.1 million which is more fully discussed in Note 3 of Notes to Consolidated Financial Statements in Item 15 of this Annual Report on Form 10-K.
Other Income, Net. Other income, net decreased $0.1 million in 2008 compared to 2007 primarily from reduced gains on account balances denominated in non-U.S. currencies. Other income, net increased $0.1 million in 2007 compared to 2006 primarily from gains associated with recording account balances denominated in non-U.S. currencies at fair market value. During 2007, we incurred foreign currency transaction gains of approximately $576,000 compared to $434,000 in 2006.
Liquidity and Capital Resources
As of December 31, 2008, we had $26.7 million in cash, cash equivalents, marketable securities and short-term restricted cash in addition to approximately $8.0 million of additional borrowing capacity under our existing Credit Facility upon which we had outstanding borrowings of $14.9 million and outstanding letter of credit reserves of approximately $1.7 million. Our Credit Facility, which was amended and restated on March 6, 2009 provides for up to $25 million of available borrowing as further described below.
On March 6, 2009, we entered into a Second Amended and Restated Loan and Security Agreement (the "Credit Facility") with a bank, which permits us to borrow up to $25 million in the form of revolving loan advances, including up to $5 million in the form of letters of credit and other contingent reserves. Principal borrowings under the credit facility accrue interest at a floating annual rate equal to the prime rate plus one percent if our unrestricted cash held at the bank exceeds or is equal to $20 million, or prime plus two percent if our unrestricted cash held at the bank is below $20 million. Under the credit facility, we are permitted to borrow up to $25 million, subject to a borrowing base limit consisting of (a) 80% of eligible accounts receivable plus (b) the lesser of 70% of our unrestricted cash at the bank or $12 million; provided, that on each of the first three (3) business days and each of the last three (3) business days of each fiscal quarter, the borrowing base is (a) 80% of eligible accounts receivable plus (b) the lesser of 90% of our unrestricted cash at the bank or $12 million. Eligible accounts receivable do not include internationally billed receivables, unbilled receivables, and receivables aged over 90 days from invoice date. The Credit Facility matures on November 30, 2010. As of December 31, 2008, $14.9 million was outstanding under the previous credit facility. The Credit Facility serves as a source of capital for ongoing operations and working capital needs.
The Credit Facility includes traditional lending and reporting covenants including that certain financial covenants applicable to liquidity and earnings are to be maintained by us and tested as of the last day of each quarter. The credit facility also includes a net liquidity clause. Under this clause if our cash, cash equivalents and marketable securities held at the bank, net of debt outstanding under the Credit Facility, is less than $0.5 million, then the bank will apply all of our accounts receivable
59
collections, received within our lockbox arrangement with the bank, to the outstanding principal. Such amounts are eligible to be re-borrowed by us subject to the borrowing base limit described above. Based on our current forecast, we expect that we will operate under the net liquidity clause beginning in the third quarter of 2009 and continue in effect for the remainder of 2009. As of December 31, 2008, we were not in compliance with one of our covenants for which we subsequently received a waiver from the bank. We expect to remain in compliance with the covenants through the Credit Facility's maturity date based on current forecasts.
The Credit Facility also includes subjective rights for the bank to accelerate the maturity date of the debt, lower the borrowing base or stop making advances, which are typical within asset based lending arrangements. We do not believe the bank will exercise these rights as long as we are meeting our covenants and are achieving our forecasts. The Credit Facility also includes several potential events of default such as payment default, material adverse change conditions and insolvency conditions that could cause interest to be charged at the interest rate in effect as of the date of default plus two percentage points, or in the event of any uncured events of default (including non-compliance with liquidity and earnings financial covenants), could result in the bank's right to declare all outstanding obligations immediately due and payable, to modify the borrowing base formula described above to reduce credit availability, or to cease making advances to us. Should an event of default occur, including the exercise of a material adverse change condition, and based on such default the bank were to decide to either (i) declare all outstanding obligations immediately due and payable, (ii) reduce our borrowing base, or (iii) stop making credit advances to us, we may be required to significantly reduce our costs and expenses, sell additional equity or debt securities, or restructure portions of our business which could involve the sale of certain assets. We believe, based on our current projections that the bank will continue to lend to us subject to the terms and conditions of the Credit Facility. The sale of additional equity or convertible debt securities may result in additional dilution to our stockholders. Furthermore, additional capital may not be available on terms favorable to us, if at all. In this circumstance, if we could not significantly reduce our costs and expenses, obtain adequate financing on acceptable terms when such financing is required or restructure portions of our business, our business would be adversely affected. In addition, the amount of available capital that we are able to access under the Credit Facility at any particular time is dependent upon the borrowing base formula, which ultimately relies on the underlying performance of the business. If economic conditions worsen and our business performance is not as strong as anticipated, then we could experience an event of default or a reduction in borrowing capacity under the Credit Facility, which if not cured to the bank's satisfaction, could have a potential adverse impact on our ability to access capital under our Credit Facility in order to fund 2009 operations. If such events were to occur, our business would be adversely affected.
We assess our liquidity in terms of our ability to generate cash to fund our operating, investing, and financing activities. Our primary ongoing cash requirements will be to fund operating activities, capital expenditures, investments in businesses, product development, restructured facility obligations, and debt service. Our primary sources of liquidity are internally generated cash flows and borrowings under our credit facility. Significant factors affecting the management of our ongoing cash requirements are the adequacy of available bank lines of credit and our ability to attract long term capital with satisfactory terms. The sources of our liquidity are subject to all of the risks of our business and could be adversely affected by, among other factors, a decrease in demand for our products, our ability to integrate acquisitions, deterioration in certain financial ratios, and market changes in general.
We believe our cash balance, working capital on hand at December 31, 2008 and access to available capital under our credit facility will be sufficient to fund continuing operations through at least January 1, 2010. Nevertheless, our actual cash needs could vary considerably, depending on opportunities and circumstances that arise over time. If, at any time, cash generated by operations is insufficient to satisfy our liquidity requirements, we may need to reduce our costs and expenses, sell additional equity or debt securities or draw down on our current credit facility if we have borrowing
60
capacity. The inability to obtain additional financing may force other actions such as the sale of certain assets, or, ultimately, cause us to cease operations.
On November 21, 2007, we filed, and the Securities and Exchange Commission subsequently declared effective, a universal shelf registration statement on Form S-3 that will permit us to raise up to $100 million of any combination of common stock, preferred stock, debt securities, warrants or units, either individually or in units, as described by the prospectus. The sale of additional equity or convertible debt securities may result in additional dilution to our stockholders. Furthermore, additional capital may not be available on terms favorable to us, if at all. Accordingly, no assurances can be given that we will be successful in these endeavors.
We maintain cash balances in many subsidiaries through which we conduct our business. The repatriation of cash balances from certain of our subsidiaries could have adverse tax consequences. However, these cash balances are generally available without legal restrictions to fund ordinary business operations. We have transferred, and will continue to transfer, cash from our subsidiaries to us and to other international subsidiaries when it is cost effective to do so.
Cash Flows
| | Year Ended December 31, 2008 | $ Change | Year Ended December 31, 2007 | $ Change | Year Ended December 31, 2006 | |||||||||||
|---|---|---|---|---|---|---|---|---|---|---|---|---|---|---|---|---|
| | (In thousands) | |||||||||||||||
Cash provided by (used in) | ||||||||||||||||
Operating Activities | $ | (11,197 | ) | $ | (1,085 | ) | $ | (10,112 | ) | $ | 5,093 | $ | (15,205 | ) | ||
Investing Activities | $ | 15,794 | $ | 8,801 | $ | 6,993 | $ | (9,128 | ) | $ | 16,121 | |||||
Financing Activities | $ | 3,075 | $ | (3,933 | ) | $ | 7,008 | $ | 4,684 | $ | 2,324 | |||||
Operating Activities. In 2008 we used $11.2 million of cash for operating activities which included $8.1 million of net cash used to fund daily operations. This usage included approximately $0.8 million in personnel severance costs related to cost reduction initiatives. In addition, we made a payment of approximately $2.7 million on idle leased space in Mountain View, California and incurred approximately $0.4 million in net litigation costs.
Investing Activities. During 2008, net proceeds from the sale of the PDQ and AutoTrace product lines generated $17.8 million of cash and the refund of a security deposit on one of our facilities provided $0.7 million. Purchases, sales and maturities of marketable securities generated $0.2 million of cash, which we used primarily for operations. Our primary investing activities were the purchases of $2.9 million of property and equipment which mainly consisted of leasehold improvements within our current facilities.
Financing Activities. During 2008, financing cash proceeds were principally comprised of $2.0 million of net borrowings under our credit facility. Other proceeds were from stock proceeds realized from employee participation in our employee stock purchase plan and option exercises.
61
Contractual Obligations
As of December 31, 2008, we had commitments under leases and other contractual obligations as follows (in thousands):
| | Payments due by Period | ||||||||||||||||
|---|---|---|---|---|---|---|---|---|---|---|---|---|---|---|---|---|---|
Contractual Obligations | Total | Less than 1 Year | 1-3 Years | 3-5 Years | More than 5 years | ||||||||||||
Borrowings under credit facility | $ | 14,900 | $ | 14,900 | $ | — | — | $ | — | ||||||||
Operating lease obligations | 47,827 | 7,012 | 14,026 | 14,176 | 12,613 | ||||||||||||
Idle facility obligations | 4,476 | 1,806 | 2,003 | 667 | — | ||||||||||||
Total obligations | $ | 67,203 | $ | 23,718 | $ | 16,029 | $ | 14,843 | $ | 12,613 | |||||||
In addition to the commitments in the table above, as of December 31, 2008, we had a non-cancelable purchase commitment in the amount of approximately $0.4 million with the foreign supplier of our glass stock used in the manufacturing of certain types of chips and approximately $2.9 million with our suppliers of cameras and filters for in vivo imaging instrumentation. These commitments are excluded from the above table due to the fact they are not specifically related to a given time period. We also have minimum royalty obligations under separate license agreements with UT-Battelle, LLC, the Trustees of the University of Pennsylvania, Monogram Biosciences, Inc., and certain other licensors that in the aggregate are approximately $0.4 million per year. As of December 31, 2008, we have established $1.7 million in standby letters-of-credit, which restrict available borrowing under our credit facility, related to facility leases and customer deposits.
Our capital requirements depend on numerous factors, including market acceptance of our products, the resources we devote to developing and supporting our products, and acquisitions. We expect to devote substantial capital resources to continuing our research and development efforts, expanding our support and product development activities, and for other general corporate activities. Our future capital requirements will depend on many factors, including:
- •
- continued market acceptance of our microfluidic and lab automation products, and the demand for our services;
- •
- the magnitude and scope of our research and product development programs;
- •
- our ability to maintain existing, and establish additional, corporate partnerships and licensing arrangements;
- •
- the time and costs involved in expanding and maintaining our manufacturing facilities;
- •
- the potential need to develop, acquire or license new technologies and products; and
- •
- other factors not within our control.
2009 Financial Projections
- •
- Our revenue projection for the first quarter of 2009 is $25.0 to $28.0 million. The midpoint of this range is approximately flat compared to pro forma first quarter revenue in 2008, and assumes an unfavorable currency effect of approximately 3% at current exchange rates.
- •
- For the full year, we are currently estimating revenue growth of between 2 - 5% over 2008 pro forma revenue of $122.8 million. Our full year estimate assumes an unfavorable currency effect of 2% based on current rates. As previously communicated, growth is expected to be greater in the second half of 2009 than in the first half, and is expected to result primarily from our proprietary imaging and microfluidic technologies for molecular applications.
62
The financial projections that we have provided above are forward-looking statements that are subject to risks and uncertainties, and are only made as of the date of the filing of this Annual Report on Form 10-K. These projections are based upon assumptions that we have made and believe to be reasonable. However, actual results may vary significantly from these projections due to the risks and uncertainties inherent in our business as described in Item 1A, "Risk Factors".
Impact of Inflation
The effect of inflation and changing prices on our operations was not significant during the periods presented.
Off-Balance Sheet Arrangements
As of December 31, 2008, Caliper did not have any "off-balance sheet arrangements," as that term is defined in the rules and regulations of the SEC.
Critical Accounting Estimates
Our financial statements have been prepared in accordance with accounting principles generally accepted in the United States. The preparation of our financial statements requires management to make estimates and assumptions that affect the reported amounts of revenue and expenses, and assets and liabilities during the periods reported. We use estimates when accounting for certain items such as warranty expense, sales and marketing programs, employee compensation programs, depreciation and amortization periods, taxes, inventory values, and valuations of investments and intangible assets. We base our estimates on historical experience, where applicable, and other assumptions that we believe are reasonable under the circumstances. Actual results may differ from our estimates due to changing conditions or the validity of our assumptions. We believe that the following critical accounting policies affect our more significant judgments and estimates used in the preparation of our financial statements.
Revenue Recognition. Revenue arrangements that include multiple deliverables are divided into separate units of accounting if the deliverables meet certain criteria, including whether the delivered items have stand alone value and whether there is objective and reliable evidence of fair value of the undelivered items. In addition, we allocate the consideration among the separate units of accounting based on their fair values, and consider the applicable revenue recognition criteria separately for each of the separate units of accounting. We determine "fair value" of undelivered items based upon our historic selling prices, or where no historic information exists, based upon management's estimate of the probable selling prices for such undelivered items. The amount of our product revenue is affected by our judgments as to whether an arrangement includes multiple elements and if so, whether there is objective evidence of fair value for those elements. Changes to the elements in an arrangement and the ability to establish objective evidence of fair value for those elements could affect the timing of revenue recognition. These conditions are sometimes subjective and actual results could vary from the estimated outcome, requiring future adjustments to revenue. We recognize certain service and contract revenue for certain arrangements based upon proportional performance which requires that we estimate resources required to perform the work. The extent to which our resource estimates prove to be inaccurate could affect the timing of the revenue recognition for a particular contract arrangement.
Goodwill. We perform an annual impairment analysis of goodwill to determine if impairment exists. We may perform a test for the impairment of goodwill more frequently if events or circumstances indicate that goodwill may be impaired. The goodwill impairment analysis is a two-step process. The first step of the goodwill impairment test, used to identify potential impairment, compares the fair value of a reporting unit with its carrying amount, including goodwill. Caliper is comprised of a single segment which is our sole reporting unit. If the fair value of a reporting unit exceeds its carrying amount, goodwill of the reporting unit is not impaired. However, if the carrying value exceeds
63
estimated fair value, there is an indication of potential impairment and a second step is performed to measure the amount of impairment. Fair value is determined by utilizing information about our company as well as publicly available industry information. Determining fair value involves judgments by our management and requires the use of significant estimates and assumptions, including point-in-time estimates of revenue growth rates, profit margin percentages, discount rates, perpetuity growth rates, future capital expenditures and future market conditions, among others. Our projections are based on an internal strategic review. Key assumptions, strategies, opportunities and risks from this strategic review along with a market evaluation are the basis for our assessment.
The second step of the goodwill impairment process involves the calculation of an implied fair value of goodwill. The implied fair value of goodwill is determined in a manner that is similar to how goodwill is calculated in a business combination, by measuring the excess of the estimated fair value of the reporting unit as calculated in step one, over the estimated fair values of the individual assets, liabilities and identifiable intangibles as if the reporting unit was being acquired in a business combination. If the carrying value of goodwill assigned to a reporting unit exceeds the implied fair value of the goodwill, an impairment charge is recorded for the excess. In determining the fair value of net assets we determined the fair value of leases and certain intangible assets, including trademarks, patents, core and developed technologies and customer relationships.
Our annual goodwill impairment assessment has historically been completed at the beginning of the fourth quarter. With the contemporaneous sales of our PDQ and AutoTrace product lines in the fourth quarter of 2008, which met the criteria for assets held for sale in October 2008, prior to our goodwill impairment test date, we first determined the amount of goodwill ($14.3 million) that was to be allocated to these product groupings based upon their recent transaction values, and then applied our annual analysis to the remaining goodwill balance ($66.3 million), which resulted in the determination that impairment had occurred. The second step of the goodwill impairment test involved us calculating the implied goodwill. The carrying value of the goodwill exceeded the implied fair value of goodwill, resulting in a goodwill impairment of $43.4 million, which has been recorded in our results of operations in the fourth quarter of 2008.
Goodwill is not amortized, but is reviewed for impairment at least annually. The results of this year's impairment test are as of a point in time. If the future growth and operating results of our business are not as strong as anticipated and/or our market capitalization declines, this could impact the assumptions used in calculating the fair value in subsequent years. To the extent goodwill is impaired, its carrying value will be further written down to its implied fair value and a charge will be made to our earnings. Such an impairment charge would materially and adversely affect our GAAP reported operating results. As of December 31, 2008, we had recorded goodwill and other intangibles of $22.9 million in our consolidated balance sheet. The goodwill impairment charge is non-cash in nature and does not affect Caliper's liquidity, cash flows from operating activities, or debt covenants, or have any impact on future operations. No impairment was identified in fiscal years 2007 and 2006.
Valuation of Intangibles. Our business acquisitions have resulted in intangible assets, net of accumulated amortization of $34.4 million as of December 31, 2008. The determination of the value of such assets requires management to make estimates and assumptions that affect our consolidated financial statements.
We acquired Xenogen on August 9, 2006. In connection with this acquisition we used an independent appraisal to determine the fair value of intangibles related to the Xenogen business. The fair value was determined based upon projected future discounted cash flows of identified intangible assets taking into account risks related to the characteristics and applications of the technology, existing and future markets and assessments of the life cycle stage of developed technology. The valuation approach took into consideration discount rates commensurate with the inherent risk and projected
64
financial results associated with each identified intangible asset. Applicable discount rates used ranged from 20% to 23%.
��We acquired NovaScreen on October 3, 2005. In connection with this acquisition we used an independent appraisal to determine the fair value of intangibles related to the NovaScreen business. The fair value was determined based upon projected future discounted cash flows of identified intangible assets taking into account risks related to the characteristics and applications of the technology, existing and future markets and assessments of the life cycle stage of developed technology. The valuation approach took into consideration discount rates commensurate with the inherent risk and projected financial results associated with each identified intangible asset. Applicable discount rates used ranged from 12% to 17%.
Impairment. We review long-lived assets and identifiable intangibles for impairment whenever events or changes in circumstances indicate that the carrying amount of an asset may not be recoverable. If indicators of impairment exist, we assess recoverability of assets to be held and used by a comparison of the carrying amount of an asset to future undiscounted net cash flows expected to be generated by the asset. We perform the recoverability measurement and estimate undiscounted cash flows at the lowest possible level for which there are identifiable assets. If the aggregate undiscounted cash flows are less than the carrying value of the asset, we calculate the resulting impairment charge to be recorded based on the amount by which the carrying amount of assets exceeds the fair value of the assets. Actual cash flows could vary from the assumptions used in our assessment which could require future adjustments to our valuation of the assets. We report assets to be disposed of at the lower of the carrying amount or fair value less costs to sell.
Stock-Based Compensation. We account for stock-based compensation in accordance with SFAS 123R, which requires all share-based payments, including grants of stock options, to be recognized in the income statement as an operating expense, based on their fair values.
We estimate the fair value of each option award on the date of grant using a Black-Scholes-Merton based option-pricing model. Various assumptions are used in these estimations, including:
- •
- Expected volatility, which is based on historical volatility of our stock and warrants;
- •
- Expected option term, which is based on our historical option exercise data taking into consideration the exercise patterns of the option holders during the option's life;
- •
- Risk-free interest rate, based on the U.S. Treasury yield curve in effect at the time of the grant; and
- •
- Forfeiture rate.
A 10% unfavorable change in expected volatility and option term, which represent the most sensitive and judgmental assumptions, would not have a material effect on our financial statements.
Accounts Receivable Reserves. We grant credit to customers based on evaluations of their financial condition, generally without requiring collateral. We attempt to limit credit risk by monitoring our exposure for credit losses. This analysis may involve review of historical bad debts, customer concentrations, customer credit-worthiness, and current economic trends. We establish allowances for those accounts considered uncollectible based on the analysis of the recoverability of our trade accounts receivable performed at the end of each reporting period. Establishing an adequate allowance for doubtful accounts involves the use of considerable judgment and subjectivity. Actual results could vary from the assumptions we use to estimate the adequacy of our accounts receivable reserves which could require future adjustment to our reserve provisions. Our allowance for doubtful accounts was $0.7 million, and $1.3 million as of December 31, 2008 and 2007, respectively. We wrote off $719,000, $55,000, and $48,000 of accounts deemed uncollectible in 2008, 2007 and 2006, respectively. The write
65
off in 2008 relates to a distributor of our PDQ product line. The amount of the write off was fully reserved in prior years and was written off in 2008 as it was deemed uncollectible.
Inventory Reserves. We reserve or write off 100% of the cost of inventory that we specifically identify and consider obsolete or excess. We define obsolete inventory as inventory that will no longer be used in the manufacturing process. Excess inventory is generally defined as inventory in excess of projected usage, and is determined using management's best estimate of future demand at the time, based upon information then available to us. We use a twelve-month demand forecast and, in addition to the demand forecast, we also consider: (1) parts and subassemblies that can be used in alternative finished products; (2) parts and subassemblies that are unlikely to be impacted by engineering changes; and (3) known design changes which would reduce our ability to use the inventory as planned. Determination of the excess balance is highly subjective and relies in part on the accuracy of our forecasts and our assessment of market conditions. If actual conditions are less favorable than conditions upon which we base our estimates, additional write-downs may be required. Conversely, if conditions are more favorable than conditions upon which we base our estimates, inventory previously written down may be sold, resulting in lower cost of sales and higher income from operations in that period. During 2008, 2007 and 2006, respectively, we recorded charges of $1.7 million, $1.3 million, and $0.2 million, to cost of product revenues for excess and obsolete inventories. The 2008 and 2007 increases in excess and obsolete inventories occurred primarily as a result of product evolution and new product introductions.
Warranty Provision. At the time revenue is recognized, we establish an accrual for estimated warranty expenses associated with sales, recorded as a component of cost of revenue. We offer a one-year limited warranty on instrumentation products and a 90-day warranty on chips, which is included in the sales price of many of its products. Our standard limited warranty covers repair or replacement of defective goods, a preventative maintenance visit on certain products, and telephone based technical support. No upgrades are included in the standard warranty. Provision is made for estimated future warranty costs at the time of sale.
Factors that affect our warranty liability include the number of installed units, historical and anticipated rates of warranty claims, and cost per claim. We periodically assess the adequacy of our recorded warranty liabilities and adjust amounts as necessary. During 2008, 2007 and 2006, respectively, we recorded charges of $1.8 million, $1.1 million and $2.1 million to cost of product revenues for estimated warranty costs. The increase in 2008 relates primarily to the increase in product sales of liquid handling and automation products. The decrease in 2007 relates primarily to the overall decrease in sales of liquid handling and automation products, especially Staccato and LabChip 3000 sales that are no longer under warranty that have historically incurred a higher rate of warranty incidents. Actual results could vary from the assumptions we use to establish the warranty liability which could require future adjustments to our reserve positions.
Restructuring Charges. During the years ended December 31, 2008, 2007 and 2006, we recorded restructuring charges of $4.6 million, $0.1 million and $0.3 million, respectively, for exit plan activities which took place in the period 2005-2008 and accounted for these plans in accordance with Emerging Issues Task Force (EITF) Issue No. 94-3,Liability Recognition for Certain Employee Benefits and Other Costs to Exit an Activity (including Certain Costs incurred in a Restructuring), SFAS No. 146,Accounting for Costs Associated with Exit or Disposal Activities, and SEC Staff Accounting Bulletin No. 100 (SAB 100),Restructuring and Impairment. In accordance with such standards, management makes certain judgmental estimates related to these restructuring charges. For example, the consolidation of facilities required us to make estimates including with respect to contractual rental commitments or lease buy-outs for office space being vacated and related costs, and ability of the tenant to pay leasehold improvement write-downs, offset by estimated sublease income. We review on at least a quarterly basis our sublease assumptions. These estimates include anticipated rates to be charged to a
66
sub-tenant and the timing of the sublease arrangement. If the rental markets change, our sublease assumptions may not be accurate and changes in these estimates might be necessary and could materially affect our financial condition and results of operations. For example, in December 2005, we recorded a restructuring credit of approximately $1.4 million to recognize the net present value of future sublease rental income based upon subleases we were able to secure during 2005. For a further discussion of our restructuring activities, see Note 11 of the Notes to Consolidated Financial Statements in Item 15 of this Annual Report on Form 10-K.
Recent Accounting Pronouncements
In November 2007, the EITF issued EITF Issue No. 07-1 (EITF No. 07-1),Accounting for Collaborative Arrangements Related to the Development and Commercialization of Intellectual Property. Companies may enter into arrangements with other companies to jointly develop, manufacture, distribute, and market a product. Often the activities associated with these arrangements are conducted by the collaborators without the creation of a separate legal entity (that is, the arrangement is operated as a "virtual joint venture"). The arrangements generally provide that the collaborators will share, based on contractually defined calculations, the profits or losses from the associated activities. Periodically, the collaborators share financial information related to product revenues generated (if any) and costs incurred that may trigger a sharing payment for the combined profits or losses. The consensus requires collaborators in such an arrangement to present the result of activities for which they act as the principal on a gross basis and report any payments received from (made to) other collaborators based on other applicable GAAP or, in the absence of other applicable GAAP, based on analogy to authoritative accounting literature or a reasonable, rational, and consistently applied accounting policy election. EITF No. 07-1 is effective for collaborative arrangements in place at the beginning of the annual period beginning after December 15, 2008. As our collaborative agreements do not incorporate such revenue- and cost-sharing arrangements, we do not expect the adoption of EITF No. 07-1 to have a material impact on our financial statements.
In December 2007, the FASB issued SFAS No. 141(R) (SFAS 141R),Business Combinations. This Standard will require an acquiring company to measure all assets acquired and liabilities assumed, including contingent considerations and all contractual contingencies, at fair value as of the acquisition date. In addition, an acquiring company is required to capitalize IPR&D and either amortize it over the life of the product, or write it off if the project is abandoned or impaired. The Standard is effective for transactions occurring on or after January 1, 2009.
In April 2008, the FASB issued FASB Staff Position (FSP) FAS 142-3,Determination of the Useful Life of Intangible Assets, or FSP FAS 142-3. FSP FAS 142-3 amends the factors that should be considered in developing renewal or extension assumptions used to determine the useful life of a recognized intangible asset under FASB Statement No. 142,Goodwill and Other Intangible Assets. FSP FAS 142-3 is effective for fiscal years beginning after December 15, 2008 and early adoption is prohibited. We are evaluating the impact of the pending adoption of FSP FAS 142-3 on our consolidated financial statements.
67
Item 7A. Quantitative and Qualitative Disclosures About Market Risk
Foreign Currency
As a multinational company, we are subject to changes in foreign currency fluctuations. We have operations in the United Kingdom, France, Germany, Belgium, Switzerland, Canada and Japan. To the extent our sales and operating expenses are denominated in foreign currencies, our operating results may be adversely impacted by changes in exchange rates. While foreign exchange gains and losses have historically been immaterial, we cannot predict whether such gains and losses will continue to be immaterial. We performed a sensitivity analysis assuming a hypothetical 10% movement in exchange rates applied to our projected foreign operations for the fiscal year 2008. A hypothetical 10% movement in exchange rates could materially impact our reported sales. However, because both sales and expenses are denominated in local currency, this analysis indicated that such movement would not have a material effect on net operating results or financial condition. Translation gains and losses related to our foreign subsidiaries are accumulated as a separate component of stockholders' equity. We do not currently engage in foreign currency hedging transactions, but may do so in the future.
Interest Rate Sensitivity
Our exposure to market risk for changes in interest rates relates primarily to our investment portfolio. Fixed rate securities may have their fair market value adversely impacted due to fluctuations in interest rates, while floating rate securities may produce less income than expected if interest rates fall. Due in part to these factors, our future investment income may fall short of expectations due to changes in interest rates, or we may suffer losses in principal if forced to sell securities that have declined in market value due to changes in interest rates.
The potential change in fair value for interest rate sensitive instruments has been assessed on a hypothetical 100 basis point adverse movement across all maturities. We estimate that such hypothetical adverse 100 basis point movement would not have materially impacted net income or materially affected the fair value of interest rate sensitive instruments at either December 31, 2008 or 2007.
As of December 31, 2008 we had $14.9 million in debt outstanding under our credit facility. The interest rate on the facility is based on the prime rate (currently 3.25%) and therefore has direct and immediate response to changes in interest rates.
Our primary investment objective is to preserve principal while at the same time maximizing yields without significantly increasing risk. Our portfolio includes money markets funds, commercial paper, medium-term notes, corporate notes, government securities, and corporate bonds. Our portfolio excludes auction rate securities. The diversity of our portfolio helps us to achieve our investment objective. As of December 31, 2008 and 2007, the average remaining maturities of our investment portfolio were approximately one and five months, respectively. All of our instruments are held other than for trading purposes. As of December 31, 2008 and 2007, unrealized losses were considered to be temporary due to the fact, although available to be sold to meet operating needs or otherwise, securities are generally held to maturity.
68
The following table presents by year of maturity the amounts of our cash equivalents and investments, and related weighted average interest rates that may be subject to interest rate risk as of December 31, 2008:
| | 2009 | 2010 | Total | Fair Value December 31, 2008 | |||||||||||
|---|---|---|---|---|---|---|---|---|---|---|---|---|---|---|---|
Cash and money market funds: | |||||||||||||||
Fixed rate securities (in thousands) | $ | 23,667 | $ | — | $ | 23,667 | $ | 23,667 | |||||||
Average interest rate | 0.02 | % | 0.02 | % | |||||||||||
Available for sale marketable securities: | |||||||||||||||
Fixed rate securities (in thousands) | $ | 2,801 | $ | 233 | $ | 3,034 | $ | 3,034 | |||||||
Average interest rate | 2.84 | % | 6.68 | % | 3.12 | % | |||||||||
Total securities (in thousands) | $ | 26,468 | $ | 233 | $ | 26,701 | $ | 26,701 | |||||||
Average interest rate | 0.32 | % | 6.68 | % | 0.37 | % | |||||||||
This differs from our position at December 31, 2007, which the following table presents (dollars in thousands):
| | 2008 | 2009 | Total | Fair Value December 31, 2007 | |||||||||||
|---|---|---|---|---|---|---|---|---|---|---|---|---|---|---|---|
Cash and money market funds: | |||||||||||||||
Fixed rate securities (in thousands) | $ | 15,709 | $ | — | $ | 15,709 | $ | 15,709 | |||||||
Average interest rate | 3.27 | % | — | 3.27 | % | ||||||||||
Available for sale marketable securities: | |||||||||||||||
Fixed rate securities (in thousands) | $ | 2,751 | $ | 494 | $ | 3,245 | $ | 3,246 | |||||||
Average interest rate | 4.66 | % | 3.37 | % | 4.46 | % | |||||||||
Total securities (in thousands) | $ | 18,460 | $ | 494 | $ | 18,954 | $ | 18,955 | |||||||
Average interest rate | 3.97 | % | 3.37 | % | 3.48 | % | |||||||||
Item 8. Financial Statements and Supplementary Data
- (a)
- The following documents are filed as a part of this Annual Report on Form 10-K:
- (1)
- Financial Statements:
- (2)
- Financial Statement Schedules:
The financial statements and supplementary data are included herein under Item 6 and in the Consolidated Financial Statements and related notes thereto. See Item 15 of this Annual Report on Form 10-K.
Schedule II, "Valuation and Qualifying Accounts" is included on page F-44 of this Annual Report on Form 10-K. All other schedules are omitted because they are not applicable or the required information is shown in the financial statements or notes thereto.
Item 9. Changes in and Disagreements with Accountants on Accounting and Financial Disclosure
Not applicable.
Item 9A. Controls and Procedures
Evaluation of disclosure controls and procedures. We have established disclosure controls and procedures (as defined in Exchange Act Rules 13a-15 (e) and 15d-15(e)) that are designed to provide reasonable assurance that information required to be disclosed in our reports filed under the Securities
69
Exchange Act of 1934, such as this Annual Report on Form 10-K, is recorded, processed, summarized and reported within the time periods specified in the SEC's rules and forms. Disclosure controls are also designed to provide reasonable assurance that such information is accumulated and communicated to our management, including the principal executive officer and principal financial officer, as appropriate to allow timely decisions regarding required disclosure.
Based on their evaluation as of December 31, 2008, our principal executive officer and principal financial officer have concluded that our disclosure controls and procedures are effective to provide reasonable assurance that information we are required to disclose in reports that we file or submit under the Securities Exchange Act of 1934 is recorded, processed, summarized and reported within the time periods specified in SEC rules and forms.
Limitations on the Effectiveness of Disclosure Controls and Procedures. Our management, including our principal executive officer and principal financial officer, does not expect that our disclosure controls and procedures will prevent all error and all fraud. A control system can provide only reasonable, not absolute, assurance that the objectives of the control system are met. Further, the design of a control system must reflect the fact that there are resource constraints, and the benefits of controls must be considered relative to their costs. Because of the inherent limitations in all control systems, no evaluation of controls can provide absolute assurance that all control issues and instances of fraud, if any, within Caliper have been detected. These inherent limitations include the realities that judgments in decision-making can be faulty, and that breakdowns can occur because of simple error or mistake. Additionally, controls can be circumvented by the individual acts of some persons, by collusion of two or more people or by management override of the control. Because of the inherent limitations in a cost-effective control system, misstatements due to error or fraud may occur and not be detected.
Changes in internal controls. There were no changes in our internal control over financial reporting, identified in connection with the evaluation of such internal control that occurred during the fourth quarter of our last fiscal year that have materially affected, or are reasonably likely to materially affect, our internal control over financial reporting.
Management's report on internal control over financial reporting. Our management is responsible for establishing and maintaining adequate internal control over financial reporting, as defined in Exchange Act Rules 13a-15(f), and 15d-15(f) for Caliper. As part of that process, as of December 31, 2008, the end of the fiscal year covered by this annual report on Form 10-K, under the supervision and with the participation of our management, including our principal executive officer and principal financial officer, we carried out an assessment of the effectiveness of Caliper's internal control over financial reporting. The assessment was conducted following the framework in Committee of Sponsoring Organizations of the Treadway Commission (COSO) Internal Control—Integrated Framework (1992). The assessment did not identify any material weaknesses in our internal control over financial reporting and our management concluded that our internal control over financial reporting was effective as of December 31, 2008. The effectiveness of our internal control over financial reporting as of December 31, 2008 has been audited by Ernst & Young LLP, an independent registered public accounting firm, as stated in their report which is included herein.
REPORT OF INDEPENDENT REGISTERED PUBLIC ACCOUNTING FIRM
The Board of Directors and Stockholders of Caliper Life Sciences, Inc.
We have audited Caliper Life Sciences' internal control over financial reporting as of December 31, 2008, based on criteria established in Internal Control—Integrated Framework issued by the Committee of Sponsoring Organizations of the Treadway Commission (the COSO criteria). Caliper Life Sciences' management is responsible for maintaining effective internal control over financial reporting, and for its assessment of the effectiveness of internal control over financial reporting
70
included in the accompanying Report of Management on Internal Control Over Financial Reporting. Our responsibility is to express an opinion on the company's internal control over financial reporting based on our audit.
We conducted our audit in accordance with the standards of the Public Company Accounting Oversight Board (United States). Those standards require that we plan and perform the audit to obtain reasonable assurance about whether effective internal control over financial reporting was maintained in all material respects. Our audit included obtaining an understanding of internal control over financial reporting, assessing the risk that a material weakness exists, testing and evaluating the design and operating effectiveness of internal control based on the assessed risk, and performing such other procedures as we considered necessary in the circumstances. We believe that our audit provides a reasonable basis for our opinion.
A company's internal control over financial reporting is a process designed to provide reasonable assurance regarding the reliability of financial reporting and the preparation of financial statements for external purposes in accordance with generally accepted accounting principles. A company's internal control over financial reporting includes those policies and procedures that (1) pertain to the maintenance of records that, in reasonable detail, accurately and fairly reflect the transactions and dispositions of the assets of the company; (2) provide reasonable assurance that transactions are recorded as necessary to permit preparation of financial statements in accordance with generally accepted accounting principles, and that receipts and expenditures of the company are being made only in accordance with authorizations of management and directors of the company; and (3) provide reasonable assurance regarding prevention or timely detection of unauthorized acquisition, use, or disposition of the company's assets that could have a material effect on the financial statements.
Because of its inherent limitations, internal control over financial reporting may not prevent or detect misstatements. Also, projections of any evaluation of effectiveness to future periods are subject to the risk that controls may become inadequate because of changes in conditions, or that the degree of compliance with the policies or procedures may deteriorate.
In our opinion, Caliper Life Sciences maintained, in all material respects, effective internal control over financial reporting as of December 31, 2008, based on the COSO criteria.
We also have audited, in accordance with the standards of the Public Company Accounting Oversight Board (United States), the consolidated balance sheets of Caliper Life Sciences as of December 31, 2007 and 2008, and the related consolidated statements of income, stockholders' equity and comprehensive income, and cash flows for each of the three years in the period ended December 31, 2008 of Caliper Life Sciences and our report dated March 12, 2009 expressed an unqualified opinion thereon.
| | | |
|---|---|---|
| /s/ Ernst & Young LLP | ||
Boston, Massachusetts March 12, 2009 |
Not applicable.
71
Item 10. Directors, Executive Officers and Corporate Governance
Information concerning our Executive Officers is set forth under "Executive Officers of the Registrant" in Part I of this Annual Report on Form 10-K and is incorporated by reference here. The remainder of the response to this item is incorporated by reference from the discussion responsive thereto under the captions "Executive Officers and Key Employees," "Section 16(a) Beneficial Ownership Reporting Compliance," "Code of Business Conduct and Ethics," and "Nominating and Corporate Governance Committee" in the Proxy Statement for our 2009 Annual Meeting of Stockholders or in a future amendment to this Annual Report on 10-K and is incorporated herein by reference.
We have adopted a Code of Business Conduct and Ethics that applies to all officers, directors and employees. The Code of Business Conduct and Ethics is available for free on our website atwww.caliperLS.com under "Investor Relations." If we make any substantive amendments to the Code of Business Conduct and Ethics or grant any waiver from a provision of the Code to any executive officer or director, we will promptly disclose the nature of the amendment or waiver in a Current Report on Form 8-K.
Item 11. Executive Compensation
Information concerning director and executive compensation required by this Item 11 will be set forth in the sections entitled "Directors Compensation," "Summary of Compensation," "Compensation Committee Interlocks and Insider Participation" and "Compensation Committee Report" contained in our Proxy Statement for our 2009 Annual Meeting of Stockholders or contained in a future amendment to this Annual Report on Form 10-K and incorporated herein by reference.
Item 12. Security Ownership of Certain Beneficial Owners and Management and Related Stockholder Matters
Information concerning security ownership of certain beneficial owners and management required by this Item 12 will be set forth in the section entitled "Security Ownership of Certain Beneficial Owners and Management" contained in our Proxy Statement for our 2009 Annual Meeting of Stockholders or in a future amendment to this Annual Report on 10-K and is incorporated herein by reference.
Information concerning securities authorized for issuance under equity compensation plans required by this Item 12 will be set forth in the table entitled "Equity Compensation Plan Information" and information thereunder contained in our Proxy Statement for our 2009 Annual Meeting of Stockholders or in a future amendment to this Annual Report on Form 10-K and is incorporated herein by reference.
Item 13. Certain Relationships and Related Transactions and Director Independence
Information concerning certain relationships and related transactions required by this Item 13 will be set forth in the section entitled "Certain Relationships and Related Transactions" and "Compensation Discussion and Analysis" contained in our Proxy Statement for our 2009 Annual Meeting of Stockholders or in a future amendment to this Annual Report on 10-K and is incorporated herein by reference.
Item 14. Principal Accountant Fees and Services
Information concerning principal accountant fees and services required by this Item 14 will be set forth in the section entitled "Principal Accountant Fees and Services" contained in our Proxy Statement for our 2009 Annual Meeting of Stockholders or in a future amendment to this Annual Report on 10-K and is incorporated herein by reference.
72
Item 15. Exhibits and Financial Statement Schedules
- (a)
- The following documents are filed as a part of this Annual Report on Form 10-K:
- (1)
- Financial Statements:
See "Index to Consolidated Financial Statements and Financial Statement Schedules" at Item 8 to this Annual Report on Form 10-K. Other financial statement schedules have not been included because they are not applicable or the information is included in the financial statements or notes thereto.
| | Page | |
|---|---|---|
Report of Ernst & Young LLP, Independent Registered Public Accounting Firm | F-1 | |
Consolidated Balance Sheets at December 31, 2008 and 2007 | F-2 | |
Consolidated Statements of Operations—For the Years Ended December 31, 2008, 2007 and 2006 | F-3 | |
Consolidated Statement of Stockholders' Equity—For the Years Ended December 31, 2008, 2007 and 2006 | F-4 | |
Consolidated Statements of Cash Flows—For the Years Ended December 31, 2008, 2007 and 2006 | F-5 | |
Notes to Consolidated Financial Statements | F-6 |
- (2)
- Financial Statement Schedules:
Schedule II, "Valuation and Qualifying Accounts" is included on page F-44 of this report. All other schedules are omitted because they are not applicable or the required information is shown in the financial statements or notes thereto.
- (3)
- Exhibits:
The following is a list of exhibits filed as part of this Annual Report on Form 10-K:
| Exhibit Number | Description of Document | ||
|---|---|---|---|
| 2.1(14) | Stock Purchase Agreement, by and among Caliper, Berwind Corporation and The Berwind Company LLC, dated June 9, 2003. | ||
2.2(14) | Amendment No. 1 to the Stock Purchase Agreement, by and among Caliper, Berwind Corporation and The Berwind Company LLC, dated July 10, 2003. | ||
2.3(17) | Amendment No. 2 to the Stock Purchase Agreement, by and among Caliper, Berwind Corporation and The Berwind Company LLC, dated April 1, 2004. | ||
2.4(18) | Agreement and Plan of Merger, among Caliper Life Sciences, Inc., Caliper Services, Inc. and NovaScreen Biosciences Corporation, dated as of September 7, 2005. | ||
2.5(22) | Agreement and Plan of Merger, among Caliper Life Sciences, Inc., Caliper Holdings, Inc. and Xenogen Corporation, dated as of February 10, 2006. | ||
2.6(21) | Asset Sale and Purchase Agreement, dated as of October 29, 2008, by and between Sotax Corporation and Caliper Life Sciences, Inc. | ||
2.7(21) | Asset Purchase Agreement, dated as of November 10, 2008, by and between Dionex Corporation and Caliper Life Sciences, Inc. | ||
3.1(17) | Amended and Restated Certificate of Incorporation of Caliper. | ||
3.2(7) | Certificate of Designation of Series A Junior Participating Preferred Stock. | ||
73
| Exhibit Number | Description of Document | ||
|---|---|---|---|
| 3.3(25) | Amended and Restated Bylaws of Caliper. | ||
4.1 | Reference is made to Exhibits 3.1, 3.2, 3.3 and 3.4. | ||
4.11(26) | Registration Rights Agreement by and between Caliper and The Berwind Company LLC, dated as of December 18, 2007. | ||
4.2(19) | Specimen Stock Certificate. | ||
4.3(8) | Rights Agreement, dated as of December 18, 2001, between Caliper and Wells Fargo Bank Minnesota, N.A., as Rights Agent. | ||
10.1(1) | Lease Agreement, dated December 1, 1998, between Caliper and 605 East Fairchild Associates, L.P. | ||
10.2(1)(2) | 1996 Equity Incentive Plan. | ||
10.3(1)(2) | 1999 Equity Incentive Plan. | ||
10.4(1)(2) | 1999 Employee Stock Purchase Plan. | ||
10.5(2)(23) | 1999 Non-Employee Directors' Stock Option Plan. | ||
10.6(2)(19) | Form of Grant Agreement for 1999 Equity Incentive Plan—Option Awards. | ||
10.7(2)(19) | Form of Grant Agreement for 1999 Equity Incentive Plan—Restricted Stock Unit Awards. | ||
10.8(2)(19) | Form of Grant Agreement for 1999 Non-Employee Directors' Stock Option Plan. | ||
10.9(1)(2) | Form of Indemnification Agreement entered into between Caliper and its directors and executive officers. | ||
10.10(1)(3) | Collaboration Agreement, dated May 2, 1998, between Caliper and Hewlett-Packard Company (now Agilent Technologies, Inc.). | ||
10.11(2)(19) | Form of Stock Option Grant Agreement for Acquisition Equity Incentive Plan. | ||
10.12(2)(19) | Form of Stock Award Agreement for Acquisition Equity Incentive Plan (pro rata vesting). | ||
10.13(2)(19) | Form of Stock Award Agreement for Acquisition Equity Incentive Plan (5 year cliff vesting). | ||
10.14 | Lease Agreement, dated as of April 25, 2005, between Caliper and BCIA New England Holdings LLC. | ||
10.17(2)(19) | Non-Employee Directors' Cash Compensation Plan. | ||
10.18(2)(10) | Caliper Performance Bonus Plan. | ||
10.20(2)(10) | Summary Cash Compensation Sheet. | ||
10.23(1)(2) | The Corporate Plan for Retirement Select Plan Adoption Agreement and related Basic Plan Document. | ||
10.27(5) | Lease Agreement, dated June 23, 2000 and effective July 5, 2000, between Caliper and Martin CBP Associates, L.P. | ||
10.29(2) | Key Employee Change of Control and Severance Benefit Plan. | ||
74
| Exhibit Number | Description of Document | ||
|---|---|---|---|
| 10.30(4)(7) | Cross-License Agreement, dated March 12, 2001 between Aclara Biosciences, Inc. and Caliper. | ||
10.32(3)(6) | Settlement Agreement and Mutual General Release dated March 12, 2001 between Aclara Biosciences, Inc. and Caliper. | ||
10.39(2)(8) | 2001 Non-Statutory Stock Option Plan. | ||
10.46(2)(19) | Form of Grant Agreement for 2001 Non-Statutory Stock Option Plan. | ||
10.48(2)(9) | Key Employee Agreement, dated July 1, 2002, between Caliper and Dr. Daniel Kisner. | ||
10.52(3)(15) | Sole Commercial Patent License Agreement, effective September 1, 1995, between UT-Battelle, LLC, the successor to Lockheed Martin Energy Research Corporation, and Caliper, as amended on November 1, 2002. | ||
10.55(3)(11) | Collaboration Agreement, dated June 4, 2003, between Caliper and Bio-Rad Laboratories, Inc. | ||
10.56(2)(12) | Key Employee Agreement, dated July 14, 2003, between Caliper and E. Kevin Hrusovsky. | ||
10.62(2)(13) | Acquisition Equity Incentive Plan. | ||
10.63(2)(16) | Key Employee Agreement Amendment, dated December 24, 2003, between Caliper and Dr. Daniel L. Kisner. | ||
10.64(2)(16) | Consulting Agreement, dated January 1, 2004, between Caliper and Dr. David V. Milligan. | ||
10.66(3)(16) | Collaboration and Supply Agreement, dated January 9, 2004, among Caliper, Zymark Corporation and Affymetrix, Inc. | ||
10.67(2) | Offer Letter dated September 7, 2005 between Caliper Life Sciences, Inc. and David M. Manyak, Ph.D. | ||
10.68(27) | Loan and Security Agreement, dated as of August 9, 2006, by and among Caliper, Silicon Valley Bank and NovaScreen Biosciences Corporation. | ||
10.69(28) | Joinder Agreement, dated as of September 28, 2006, by and among Caliper, Silicon Valley Bank, Xenogen Corporation, Xenogen Biosciences Corporation, and NovaScreen Biosciences Corporation. | ||
10.70(29) | First Loan Modification Agreement dated as of February 26, 2007, by and among Caliper, Silicon Valley Bank, NovaScreen Biosciences Corporation, Xenogen Corporation, and Xenogen Biosciences Corporation. | ||
10.71(20)(3) | Agreement, dated as of May 5, 2000, between the Board of Trustees of the Leland Stanford Junior University and Xenogen Corporation. | ||
10.72(2) | Consulting Agreement, dated as of October 17, 2006, between Caliper and Pamela Contag. | ||
10.73(30) | Amended and Restated Loan and Security Agreement, dated as of February 15, 2008, by and among Caliper, Silicon Valley Bank, Xenogen Corporation, Xenogen Biosciences Corporation and NovaScreen Biosciences Corporation. | ||
10.74(31) | Amendment to Lease Agreement dated as of March 18, 2008, by and between 605 Fairchild Associates, L.P., as landlord, and Caliper Life Sciences, Inc., as tenant. | ||
75
| Exhibit Number | Description of Document | ||
|---|---|---|---|
| 10.75(32) | Consulting Agreement, dated March 10, 2008, between Caliper and Dr. Daniel Kisner. | ||
10.76(33) | Separation Agreement dated April 4, 2008, between Caliper and Mr. Thomas Higgins. | ||
10.77(34) | Consulting Agreement, dated April 5, 2008, between Caliper and Mr. Thomas Higgins. | ||
10.78(35) | Amendment to Lease Agreement dated as of June 27, 2008, by and between Cedar Brook 5 Corporate Center, L.P., as landlord and Caliper Life Sciences, Inc., as tenant. | ||
21.1(24) | Subsidiaries of the Registrant. | ||
23.1 | Consent of Ernst & Young LLP, Independent Registered Public Accounting Firm. | ||
24.1 | Power of Attorney (reference is made to the signature page of this report). | ||
31.1 | Certification of Chief Executive Officer pursuant to Rule 13a-14(a) and 15d-14(a) | ||
31.2 | Certification of Chief Financial Officer pursuant to Rule 13a-14(a) and 15d-14(a). | ||
32.1 | Certification Pursuant to 18 U.S.C. Section 1350, as adopted pursuant to Section 906 of the Sarbanes-Oxley Act of 2002. | ||
32.2 | Certification Pursuant to 18 U.S.C. Section 1350, as adopted pursuant to Section 906 of the Sarbanes-Oxley Act of 2002. | ||
- (1)
- Previously filed as the like-numbered Exhibit to our Registration Statement on Form S-1, as amended, File No. 333-88827, filed on October 12, 1999 and incorporated by reference herein.
- (2)
- Management contract or compensatory plan or arrangement.
- (3)
- Confidential treatment has been granted for certain portions of this exhibit, which portions have been omitted and filed separately with the Securities and Exchange Commission.
- (4)
- Previously filed as the like-numbered exhibit to Annual Report of Form 10-K for the year ended December 31, 1999 and incorporated by reference herein.
- (5)
- Previously filed as the like-numbered Exhibit to our Registration Statement on Form S-1, as amended, File No. 333-45942, filed on September 15, 2000, and incorporated by reference herein.
- (6)
- Previously filed as the like-numbered Exhibit to Form 10-Q for the quarterly period ended March 31, 2001 and incorporated by reference herein.
- (7)
- Previously filed as Exhibit 99.1 to Current Report on Form 8-K filed December 19, 2001 and incorporated by reference herein.
- (8)
- Previously filed as Exhibit 99.1 to our Registration Statement on Form S-8, File No. 333-76636, filed January 11, 2002 and incorporated by reference herein.
- (9)
- Previously filed as the like-numbered Exhibit to Form 10-Q for the quarterly period ended September 30, 2002 and incorporated by reference herein.
- (10)
- Previously filed as the like-numbered Exhibit to Current Report on Form 8-K filed March 16, 2005 and incorporated by reference herein.
- (11)
- Previously filed as the like-numbered Exhibit to Form 10-Q for the quarterly period ended June 30, 2003 and incorporated by reference herein.
- (12)
- Previously filed as the like-numbered Exhibit to Form 10-Q for the quarterly period ended September 30, 2003 and incorporated by reference herein.
76
- (13)
- Previously filed as Exhibit 99.1 to our Registration Statement on Form S-8, File No. 333-106946, filed June 10, 2003 and incorporated by reference herein.
- (14)
- Previously filed as the like-numbered Exhibit to Form 8-K filed July 25, 2003 and incorporated by reference herein.
- (15)
- Previously filed as the like-numbered Exhibit to Form 10-K for the year ended December 31, 2002 and incorporated by reference herein.
- (16)
- Previously filed as the like-numbered Exhibit to Form 10-K for the year ended December 31, 2003 and incorporated by reference herein.
- (17)
- Previously filed as the like-numbered Exhibit to Form 10-Q for the quarterly period ended March 31, 2004 and incorporated by reference herein.
- (18)
- Previously filed as Exhibit 2.1 to our Registration Statement on Form S-3, File No. 333-129192, filed October 21, 2005 and incorporated by reference herein.
- (19)
- Previously filed as the like-numbered Exhibit to Form 10-K for the year ended December 31, 2004 and incorporated by reference herein.
- (20)
- Previously filed as Exhibit 10.3 to Form 10-Q for the quarterly period ended September 30, 2006 and incorporated by reference herein.
- (21)
- Confidential treatment has been requested for certain portions of this exhibit which portions have been omitted and filed separately with the Securities and Exchange Commission.
- (22)
- Previously filed as the like numbered Exhibit to Form 10-K for the year ended December 31, 2005 and incorporated by reference herein.
- (23)
- Previously filed as Exhibit 10.2 to Form 10-Q for the quarterly period ended June 30, 2007 and incorporated by reference herein.
- (24)
- Previously filed as the like numbered Exhibit to Form 10-K for the year ended December 31, 2006 and incorporated by reference herein.
- (25)
- Previously filed as Exhibit 3.1 to Current Report on Form 8-K filed on March 2, 2007 and incorporated by reference herein.
- (26)
- Previously filed as the like-numbered Exhibit to our Registration Statement on Form S-3, as amended, File No. 333-147571, filed on November 21, 2007 and incorporated by reference herein.
- (27)
- Previously filed as Exhibit 10.1 to Form 10-Q for the quarterly period ended September 30, 2006 and incorporated by reference herein.
- (28)
- Previously filed as Exhibit 10.2 to Form 10-Q for the quarterly period ended September 30, 2006 and incorporated by reference herein.
- (29)
- Previously filed as Exhibit 10.1 to Form 8-K filed March 2, 2007 and incorporated by reference herein.
- (30)
- Previously filed as Exhibit 10.2 to Form 10-Q for the quarterly period ended June 30, 2008 and incorporated by reference herein.
- (31)
- Previously filed as Exhibit 10.1 to Form 10-Q for the quarterly period ended March 31, 2008 and incorporated by reference herein.
- (32)
- Previously filed as Exhibit 10.2 to Form 10-Q for the quarterly period ended March 31, 2008 and incorporated by reference herein.
77
- (33)
- Previously filed as Exhibit 10.3 to Form 10-Q for the quarterly period ended March 31, 2008 and incorporated by reference herein.
- (34)
- Previously filed as Exhibit 10.4 to Form 10-Q for the quarterly period ended March 31, 2008 and incorporated by reference herein.
- (35)
- Previously filed as Exhibit 10.1 to Form 10-Q for the quarterly period ended June 30, 2008 and incorporated by reference herein.
78
Pursuant to the requirements of Section 13 or 15(d) of the Securities Exchange Act of 1934, the Registrant has duly caused this Report to be signed on its behalf by the undersigned, thereunto duly authorized.
| CALIPER LIFE SCIENCES, INC. | |||
By: | /s/ E. KEVIN HRUSOVSKY E. Kevin Hrusovsky Chief Executive Officer | ||
Date: March 13, 2009
Pursuant to the requirements of the Securities Exchange Act of 1934, this Report has been signed by the following persons on behalf of the Registrant and in the capacities and on the dates indicated.
Signature | Title | Date | ||
|---|---|---|---|---|
| /s/ E. KEVIN HRUSOVSKY E. Kevin Hrusovsky | President and Chief Executive Officer and Director(Principal Executive Officer) | March 13, 2009 | ||
/s/ PETER F. MCAREE Peter F. McAree | Senior Vice President and Chief Financial Officer(Principal Financial Officer) | March 13, 2009 | ||
/s/ JOSEPH H. GRIFFITH IV Joseph H. Griffith IV | Vice President, Finance and Corporate Controller(Principal Accounting Officer) | March 13, 2009 | ||
/s/ ROBERT C. BISHOP, PH.D Robert C. Bishop, Ph.D. | Chairman of the Board of Directors | March 13, 2009 | ||
/s/ VAN BILLET Van Billet | Director | March 13, 2009 | ||
/s/ DAVID W. CARTER David W. Carter | Director | March 13, 2009 | ||
/s/ ALLAN L. COMSTOCK Allan L. Comstock | Director | March 13, 2009 | ||
/s/ DAVID V. MILLIGAN, PH.D. David V. Milligan, Ph.D. | Director | March 13, 2009 | ||
/s/ KATHRYN A. TUNSTALL Kathryn A. Tunstall | Director | March 13, 2009 |
79
REPORT OF INDEPENDENT REGISTERED PUBLIC ACCOUNTING FIRM
The Board of Directors and Stockholders of Caliper Life Sciences, Inc.
We have audited the accompanying consolidated balance sheets of Caliper Life Sciences as of December 31, 2007 and 2008, and the related consolidated statements of income, stockholders' equity and comprehensive income, and cash flows for each of the three years in the period ended December 31, 2008. Our audits also included the financial statement schedule listed in the Index at Item 15(a). These financial statements and schedule are the responsibility of the Company's management. Our responsibility is to express an opinion on these financial statements and schedule based on our audits.
We conducted our audits in accordance with the standards of the Public Company Accounting Oversight Board (United States). Those standards require that we plan and perform the audit to obtain reasonable assurance about whether the financial statements are free of material misstatement. An audit includes examining, on a test basis, evidence supporting the amounts and disclosures in the financial statements. An audit also includes assessing the accounting principles used and significant estimates made by management, as well as evaluating the overall financial statement presentation. We believe that our audits provide a reasonable basis for our opinion.
In our opinion, the financial statements referred to above present fairly, in all material respects, the consolidated financial position of Caliper Life Sciences at December 31, 2007 and 2008, and the consolidated results of its operations and its cash flows for each of the three years in the period ended December 31, 2008, in conformity with U.S. generally accepted accounting principles. Also, in our opinion, the related financial statement schedule, when considered in relation to the basic financial statements taken as a whole, presents fairly in all material respects the information set forth therein.
We also have audited, in accordance with the standards of the Public Company Accounting Oversight Board (United States), Caliper Life Sciences' internal control over financial reporting as of December 31, 2008, based on criteria established in Internal Control-Integrated Framework issued by the Committee of Sponsoring Organizations of the Treadway Commission and our report dated March 12, 2009 expressed an unqualified opinion thereon.
/s/ Ernst & Young LLP
Boston, Massachusetts
March 12, 2009
F-1
CALIPER LIFE SCIENCES, INC.
CONSOLIDATED BALANCE SHEETS
| | December 31, | |||||||||
|---|---|---|---|---|---|---|---|---|---|---|
| | 2008 | 2007 | ||||||||
| | (In thousands, except share and per share data) | |||||||||
ASSETS | ||||||||||
Current assets: | ||||||||||
Cash and cash equivalents | $ | 23,667 | $ | 15,709 | ||||||
Marketable securities | 3,034 | 3,246 | ||||||||
Accounts receivable, net of allowance for doubtful accounts of $740 and $1,320 in 2008 and 2007, respectively | 27,396 | 30,248 | ||||||||
Inventories | 17,579 | 19,572 | ||||||||
Prepaid expenses and other current assets | 2,481 | 2,353 | ||||||||
Total current assets | 74,157 | 71,128 | ||||||||
Property and equipment, net | 10,735 | 11,477 | ||||||||
Intangible assets, net | 34,399 | 42,862 | ||||||||
Goodwill | 22,905 | 80,836 | ||||||||
Other assets | 882 | 1,626 | ||||||||
Total assets | $ | 143,078 | $ | 207,929 | ||||||
LIABILITIES AND STOCKHOLDERS' EQUITY | ||||||||||
Current liabilities: | ||||||||||
Accounts payable | $ | 8,377 | $ | 8,371 | ||||||
Accrued compensation | 5,175 | 6,530 | ||||||||
Other accrued liabilities | 9,725 | 12,825 | ||||||||
Deferred revenue and customer deposits | 14,284 | 15,553 | ||||||||
Current portion of accrued restructuring | 1,806 | 2,112 | ||||||||
Borrowings under credit facility, current portion (Note 9) | 14,900 | — | ||||||||
Total current liabilities | 54,267 | 45,391 | ||||||||
Noncurrent portion of accrued restructuring | 2,670 | 506 | ||||||||
Borrowings under credit facility (Note 9) | — | 12,900 | ||||||||
Other noncurrent liabilities | 8,275 | 6,816 | ||||||||
Deferred tax liability | 1,128 | 1,130 | ||||||||
Commitments and contingencies (Note 10) | ||||||||||
Stockholders' equity: | ||||||||||
Preferred stock, $0.001 par value; 5,000,000 shares authorized; no shares issued and outstanding | — | — | ||||||||
Common stock, $0.001 par value; 100,000,000 shares authorized; 48,596,233 and 47,678,611 shares issued and outstanding in 2008 and 2007, respectively | 49 | 48 | ||||||||
Additional paid-in capital | 378,919 | 374,629 | ||||||||
Accumulated deficit | (302,412 | ) | (234,120 | ) | ||||||
Accumulated other comprehensive income | 182 | 629 | ||||||||
Total stockholders' equity | 76,738 | 141,186 | ||||||||
Total liabilities and stockholders' equity | $ | 143,078 | $ | 207,929 | ||||||
See accompanying notes.
F-2
CALIPER LIFE SCIENCES, INC.
CONSOLIDATED STATEMENTS OF OPERATIONS
| | Years Ended December 31, | |||||||||||
|---|---|---|---|---|---|---|---|---|---|---|---|---|
| | 2008 | 2007 | 2006 | |||||||||
| | (In thousands, except per share data) | |||||||||||
Revenue: | ||||||||||||
Product revenue | $ | 85,149 | $ | 82,961 | $ | 69,248 | ||||||
Service revenue | 37,734 | 37,557 | 24,454 | |||||||||
License fees and contract revenue | 11,171 | 20,189 | 14,169 | |||||||||
Total revenue | 134,054 | 140,707 | 107,871 | |||||||||
Costs and expenses: | ||||||||||||
Cost of product revenue | 52,178 | 49,760 | 45,459 | |||||||||
Cost of service revenue | 24,739 | 22,357 | 14,917 | |||||||||
Cost of license revenue | 1,477 | 2,515 | 219 | |||||||||
Research and development | 19,921 | 24,791 | 24,591 | |||||||||
Selling, general and administrative | 48,987 | 54,954 | 43,570 | |||||||||
Impairment of goodwill (Note 7) | 43,365 | — | — | |||||||||
Amortization of intangible assets | 8,313 | 10,106 | 8,842 | |||||||||
Restructuring charges, net | 4,605 | 52 | 258 | |||||||||
Total costs and expenses | 203,585 | 164,535 | 137,856 | |||||||||
Operating loss | (69,531 | ) | (23,828 | ) | (29,985 | ) | ||||||
Interest income | 259 | 650 | 908 | |||||||||
Interest expense | (1,053 | ) | (1,197 | ) | (430 | ) | ||||||
Gain on divestiture of product lines (Note 3) | 2,119 | — | — | |||||||||
Other income, net | 521 | 579 | 469 | |||||||||
Loss before income taxes | (67,685 | ) | (23,796 | ) | (29,038 | ) | ||||||
Benefit (provision) for income taxes | (607 | ) | (284 | ) | 104 | |||||||
Net loss | $ | (68,292 | ) | $ | (24,080 | ) | $ | (28,934 | ) | |||
Net loss per common share, basic and diluted | $ | (1.42 | ) | $ | (0.51 | ) | $ | (0.75 | ) | |||
Shares used in computing net loss per common share, basic and diluted | 48,114 | 47,301 | 38,743 | |||||||||
See accompanying notes.
F-3
CALIPER LIFE SCIENCES, INC.
CONSOLIDATED STATEMENT OF STOCKHOLDERS' EQUITY
| | Stockholders' Equity | ||||||||||||||||||||||
|---|---|---|---|---|---|---|---|---|---|---|---|---|---|---|---|---|---|---|---|---|---|---|---|
| | Common Stock | | | | Accumulated Other Comprehensive Income/(Loss) | | |||||||||||||||||
| | Additional Paid-In Capital | Deferred Stock Compensation | Accumulated Deficit | Total Stockholders' Equity | |||||||||||||||||||
| | Shares | Amount | |||||||||||||||||||||
| | (In thousands, except shares) | ||||||||||||||||||||||
Balances at December 31, 2005 | 33,785,792 | $ | 34 | $ | 302,412 | $ | (3,003 | ) | (181,106 | ) | $ | 101 | $ | 118,438 | |||||||||
Net loss | — | — | — | — | (28,934 | ) | — | (28,934 | ) | ||||||||||||||
Foreign currency translation loss | — | — | — | — | — | 228 | 228 | ||||||||||||||||
Change in unrealized gain on available-for-sale securities | — | — | — | — | — | 131 | 131 | ||||||||||||||||
Comprehensive loss | (28,575 | ) | |||||||||||||||||||||
Issuance of common stock and warrants upon acquisition of Xenogen | 12,108,877 | 12 | 59,227 | — | — | — | 59,239 | ||||||||||||||||
Issuance of common stock pursuant to stock plans | 917,646 | 1 | 2,736 | — | — | — | 2,737 | ||||||||||||||||
Deferred compensation reclass due to adoption of SFAS 123R | — | — | (3,003 | ) | 3,003 | — | — | — | |||||||||||||||
Stock-based compensation expense | — | — | 5,570 | — | — | — | 5,570 | ||||||||||||||||
Balances at December 31, 2006 | 46,812,315 | 47 | 366,942 | — | (210,040 | ) | 460 | 157,409 | |||||||||||||||
Net loss | — | — | — | — | (24,080 | ) | — | (24,080 | ) | ||||||||||||||
Foreign currency translation gain | — | — | — | — | — | 148 | 148 | ||||||||||||||||
Change in unrealized gain on available-for-sale securities | — | — | — | — | — | 21 | 21 | ||||||||||||||||
Comprehensive loss | (23,911 | ) | |||||||||||||||||||||
Issuance of common stock pursuant to stock plans | 866,296 | 1 | 2,526 | — | — | — | 2,527 | ||||||||||||||||
Stock-based compensation expense | — | — | 5,161 | — | — | — | 5,161 | ||||||||||||||||
Balances at December 31, 2007 | 47,678,611 | 48 | 374,629 | — | (234,120 | ) | 629 | 141,186 | |||||||||||||||
Net loss | — | — | — | — | (68,292 | ) | — | (68,292 | ) | ||||||||||||||
Foreign currency translation gain | — | — | — | — | — | (400 | ) | (400 | ) | ||||||||||||||
Change in unrealized gain on available-for-sale securities | — | — | — | — | — | (47 | ) | (47 | ) | ||||||||||||||
Comprehensive loss | (68,739 | ) | |||||||||||||||||||||
Issuance of common stock pursuant to stock plans | 917,622 | 1 | 710 | — | — | — | 711 | ||||||||||||||||
Stock-based compensation expense | — | — | 3,580 | — | — | — | 3,580 | ||||||||||||||||
Balances at December 31, 2008 | 48,596,233 | $ | 49 | $ | 378,919 | $ | — | $ | (302,412 | ) | $ | 182 | $ | 76,738 | |||||||||
See accompanying notes.
F-4
CALIPER LIFE SCIENCES, INC.
CONSOLIDATED STATEMENTS OF CASH FLOWS
| | Years Ended December 31, | ||||||||||||
|---|---|---|---|---|---|---|---|---|---|---|---|---|---|
| | 2008 | 2007 | 2006 | ||||||||||
| | (In thousands) | ||||||||||||
Operating activities | |||||||||||||
Net loss | $ | (68,292 | ) | $ | (24,080 | ) | $ | (28,934 | ) | ||||
Adjustments to reconcile net loss to net cash from operating activities: | |||||||||||||
Depreciation and amortization | 12,042 | 13,990 | 12,528 | ||||||||||
Stock-based compensation expense, net | 3,580 | 5,161 | 5,570 | ||||||||||
In-process research and development | — | — | 2,898 | ||||||||||
Gain on divestiture of product lines | (2,119 | ) | — | — | |||||||||
Impairment of goodwill | 43,365 | — | — | ||||||||||
Non-cash restructuring charges, net | 4,605 | 52 | 258 | ||||||||||
Other charges | — | 639 | — | ||||||||||
Foreign currency transaction gains | (466 | ) | (576 | ) | (434 | ) | |||||||
Changes in operating assets and liabilities, net of acquisitions: | |||||||||||||
Accounts receivable | 2,125 | 1,402 | (3,771 | ) | |||||||||
Inventories | (1,213 | ) | (538 | ) | (2,054 | ) | |||||||
Prepaid expenses and other current assets | (254 | ) | 304 | 2,021 | |||||||||
Accounts payable and other accrued liabilities | (2,432 | ) | 1,005 | 1,526 | |||||||||
Accrued compensation | (1,555 | ) | (1,141 | ) | (1,149 | ) | |||||||
Deferred revenue and customer deposits | 646 | 30 | 106 | ||||||||||
Other noncurrent liabilities | 1,457 | 979 | 224 | ||||||||||
Payments of accrued restructuring obligations, net | (2,686 | ) | (7,339 | ) | (3,994 | ) | |||||||
Net cash from operating activities | (11,197 | ) | (10,112 | ) | (15,205 | ) | |||||||
Investing activities | |||||||||||||
Purchases of marketable securities | (2,946 | ) | (2,366 | ) | (21,255 | ) | |||||||
Proceeds from sales of marketable securities | 400 | 4,102 | 11,529 | ||||||||||
Proceeds from maturities of marketable securities | 2,711 | 8,344 | 20,205 | ||||||||||
Changes in restricted cash | — | — | 3,624 | ||||||||||
Other assets | 729 | — | — | ||||||||||
Purchases of property and equipment | (2,900 | ) | (2,087 | ) | (4,887 | ) | |||||||
Purchase of intangible and other assets | — | (1,000 | ) | (86 | ) | ||||||||
Proceeds from divestiture of product lines | 17,800 | — | — | ||||||||||
Acquisitions, net of cash acquired | — | — | 6,991 | ||||||||||
Net cash from investing activities | 15,794 | 6,993 | 16,121 | ||||||||||
Financing activities | |||||||||||||
Payments of obligations under sale-leaseback arrangements | — | (98 | ) | (242 | ) | ||||||||
Borrowings under credit facility | 4,000 | 8,500 | 8,587 | ||||||||||
Payments of credit facility, loans payable and other obligations | (2,000 | ) | (4,187 | ) | (8,587 | ) | |||||||
Proceeds from issuance of common stock | 1,075 | 2,793 | 2,566 | ||||||||||
Net cash from financing activities | 3,075 | 7,008 | 2,324 | ||||||||||
Effect of exchange rates on changes in cash and cash equivalents | 286 | 186 | 298 | ||||||||||
Net increase in cash and cash equivalents | 7,958 | 4,075 | 3,538 | ||||||||||
Cash and cash equivalents at beginning of year | 15,709 | 11,634 | 8,096 | ||||||||||
Cash and cash equivalents at end of year | $ | 23,667 | $ | 15,709 | $ | 11,634 | |||||||
Supplemental disclosure of cash flow information | |||||||||||||
Interest paid | $ | 1,220 | $ | 1,099 | $ | 369 | |||||||
Income taxes paid | $ | 415 | $ | 457 | $ | 203 | |||||||
See accompanying notes.
F-5
CALIPER LIFE SCIENCES, INC.
NOTES TO CONSOLIDATED FINANCIAL STATEMENTS
1. Organization and Basis of Presentation
Caliper Life Sciences, Inc. (Caliper) was incorporated in the state of Delaware on July 26, 1995. Caliper develops and sells innovative and enabling products and services to the life sciences research community, a customer base that includes pharmaceutical and biotechnology companies, and government and other not-for-profit research institutions. Caliper's strategy is to transform drug discovery and development by offering technologies and services that ultimately enhance the ability to predict the effects that new drug candidates will have on humans. Caliper believes that its integrated systems, consisting of instruments, software and reagents, laboratory automation tools and assay and discovery services enable researchers to better understand the basis for disease and more effectively discover safe and effective drugs.
Financial Statement Presentation and Principles of Consolidation
Caliper's financial statements include the accounts of its wholly owned operating subsidiaries including Xenogen Corporation, Xenogen Biosciences Corporation (together, Xenogen Corporation and Xenogen Biosciences Corporation are herein referred to as Xenogen), NovaScreen Biosciences Corporation (NovaScreen), Caliper Life Sciences Limited (United Kingdom), Caliper Life Sciences Ltd. (Canada), Caliper Life Sciences N.V. (Belgium), Caliper Life Sciences GmbH (Germany), Caliper Life Sciences SA (France), and Caliper Life Sciences AG (Switzerland). All significant intercompany balances and transactions have been eliminated in consolidation.
As shown in the consolidated financial statements, at December 31, 2008, Caliper has a total cash, cash equivalents and marketable securities balance of $26.7 million and an accumulated deficit of $302.4 million. On March 6, 2009, Caliper entered into a Second Amended and Restated Loan and Security Agreement (Credit Facility) with a bank. The accompanying financial statements assume that Caliper's cash, cash equivalents and marketable securities balance at December 31, 2008 and access to available capital under its Credit Facility are sufficient to fund operations through at least January 1, 2010, based upon its current operating plan. Caliper's ability to fund its operations through the end of 2009 will depend on many factors, including particularly its ability to increase product and service sales, control margins and operating costs and maintain its borrowing capacity and compliance with the covenants of its Credit Facility. As more fully described in Note 9, the amount of available capital that Caliper is able to access under the Credit Facility at any particular time is dependent upon a borrowing base formula, which ultimately relies on the underlying performance of the business. The Credit Facility also contains certain subjective rights which, if exercised by the lender, could result in any or all of the following; an acceleration of the maturity date of any outstanding debt, a reduction in borrowing capacity, and a termination of advances. If economic conditions worsen and Caliper's business performance is not as strong as anticipated, then Caliper could experience an event of default or a reduction in its borrowing capacity under the Credit Facility, which if not cured to the bank's satisfaction, could have a potential adverse impact on its ability to access capital under its Credit Facility in order to fund planned 2009 operations. If such events were to occur, Caliper's business would be adversely affected.
2. Summary of Significant Accounting Policies
Use of Estimates
The preparation of financial statements in conformity with accounting principles generally accepted in the United States requires management to make estimates and assumptions that affect the amounts
F-6
CALIPER LIFE SCIENCES, INC.
NOTES TO CONSOLIDATED FINANCIAL STATEMENTS (Continued)
2. Summary of Significant Accounting Policies (Continued)
reported in the financial statements and accompanying notes. Actual results could differ from those estimates.
Cash Equivalents and Marketable Securities
Caliper considers all highly liquid investments with maturities of three months or less from the date of purchase to be cash equivalents. Management determines the appropriate classification of its investment securities at the time of purchase and re-evaluates such determination at each reporting date. Management has classified Caliper's marketable securities as available-for-sale securities in the accompanying financial statements. Available-for-sale securities are carried at fair value based on quoted market prices, with unrealized gains and losses reported in a separate component of stockholders' equity. Realized gains and losses and declines in value, if any, judged to be other than temporary on available-for-sale securities are reported in other income or expense. The cost of securities sold is based on the specific identification method.
Caliper invests its excess cash in U.S. government and agency securities, debt instruments of financial institutions and corporations, and money market funds with strong credit ratings. Caliper has established guidelines regarding diversification of its investments and their maturities to maintain safety and liquidity.
Customer Accounts Receivable
Customer accounts receivable are stated at billed amounts, net of related reserves. No collateral is required on these trade receivables. The majority of sales made by Caliper do not include any return rights or privileges. Caliper has historically not experienced significant credit losses in connection with its customer receivables.
Inventories
Inventories for use in the manufacture of Caliper's instruments include electronic and optical components, devices and accessories either produced or purchased from original equipment manufacturers. Inventories for use in the manufacture of LabChip technologies consist primarily of glass, quartz and reagents. Inventories are stated at the lower of cost or market, reflect appropriate reserves for potential obsolete, slow moving or otherwise impaired material, and include appropriate elements of material, labor and overhead.
Property and Equipment
Additions to property and equipment are recorded at cost. Major replacements and improvements are capitalized, while general repairs and maintenance are expensed as incurred. Depreciation commences once the assets have been placed in service, and is computed using the straight-line method over the shorter of the financing period or the estimated useful lives of the assets, which primarily range from three to five years. Furniture and equipment acquired under equipment sale and lease back arrangements are amortized over the shorter of the useful lives or the financing period, generally four years. Leasehold improvements are amortized over the shorter of the estimated useful life of the assets or the lease term, generally four to ten years.
F-7
CALIPER LIFE SCIENCES, INC.
NOTES TO CONSOLIDATED FINANCIAL STATEMENTS (Continued)
2. Summary of Significant Accounting Policies (Continued)
Impairment of Long-Lived Assets
Caliper reviews long-lived assets and identifiable intangibles which have definite lives for impairment whenever events or changes in circumstances indicate that the carrying amount of an asset may not be recoverable. If indicators of impairment exist, recoverability of assets to be held and used is assessed by a comparison of the carrying amount of an asset to future undiscounted net cash flows expected to be generated by the asset. Recoverability measurement and estimating of undiscounted cash flows is done at the lowest possible level for which there is identifiable assets. If the aggregate undiscounted cash flows are less than the carrying value of the asset, the resulting impairment charge to be recorded is calculated based on the amount by which the carrying amount of assets exceeds the fair value of the assets. Caliper also performs an annual assessment of impairment for all indefinitely-lived intangible assets. If the fair value exceeds the carrying value of the asset, then the intangible is not impaired. If the fair value is less than the carrying value, then an impairment charge is recorded equal to the difference. Assets to be disposed of are reported at the lower of the carrying amount or fair value less costs to sell.
Fair Value of Financial Instruments
The carrying amounts reflected in the consolidated balance sheets for cash and cash equivalents, accounts receivable, other current assets, accounts payable and other accrued expenses approximate fair value due to their short-term maturities. Caliper's available-for-sale marketable securities are carried at fair value based on quoted market prices, consistent with the requirements of Statement of Financial Accounting Standards (SFAS) No. 115,Accounting for Certain Investments in Debt and Equity Securities. Caliper's credit facility is carried at book value as outstanding amounts approximate fair value as monthly interest payments are indexed based on the prime rate.
The fair values of Caliper's cash, cash equivalents and marketable securities are subject to change as a result of potential changes in market interest rates. The potential change in fair value for interest rate-sensitive instruments has been assessed on a hypothetical 100 basis point adverse movement across all maturities. Caliper estimates that such hypothetical adverse 100 basis point movement would not have materially impacted net income or materially affected the fair value of interest rate-sensitive instruments.
Revenue Recognition
General Policy
Caliper recognizes revenue when persuasive evidence of an arrangement exists, delivery has occurred or services have been rendered, the fee is fixed or determinable, and collectibility is reasonably assured or probable, as applicable. Product revenue is recognized upon passage of title, which for the majority of sales occurs when goods are shipped under Caliper's standard terms of "FOB origin." Revenue associated with customer product purchases delivered under terms of "FOB destination" is deferred until the product is received by the customer. Revenues on shipments subject to customer acceptance provisions are recognized only upon customer acceptance provided all other revenue recognition criteria are met. In general, sales made by Caliper do not include general return rights or privileges. In the limited circumstance where a right of return exists, Caliper recognizes revenue when the right has lapsed. Based upon Caliper's prior experiences, sales returns have not been significant and therefore a general provision for sales returns or other allowances is not recorded at the
F-8
CALIPER LIFE SCIENCES, INC.
NOTES TO CONSOLIDATED FINANCIAL STATEMENTS (Continued)
2. Summary of Significant Accounting Policies (Continued)
time of sale. Revenue from services offered by Caliper is generally recognized as the services are performed (or, as applicable, ratably over the contract service term in the case of annual maintenance contracts). Provision is made at the time of sale for estimated costs related to Caliper's warranty obligations to customers.
Our revenue arrangements may include the sale of an instrument, consumables, software, service, technology licenses, installation and training. Revenue arrangements may include one of these single elements, or may incorporate one or more elements in a single transaction or combination of related transactions. Caliper applies the following guidance to its various revenue arrangements:
Emerging Issues Task Force (EITF) Issue No.00-21,Revenue Arrangements with Multiple Deliverables (EITF 00-21). When multiple contractual elements exist in an arrangement, and software is incidental, the contractual elements are divided into separate units of accounting if the deliverables in the arrangement meet certain criteria under EITF 00-21. The criteria applied to multiple element arrangements are whether (a) each delivered element has standalone value to the customer, (b) there is objective and reliable evidence of fair value of the undelivered elements, and, if applicable, (c) delivery or performance of the undelivered elements is probable and within the control of Caliper. Consideration for the arrangement is allocated among the separate units of accounting based on their relative fair values, or based upon the residual method when fair value exists only for remaining undelivered items, and the amount of revenue allocable to the delivered item(s) is recognized in accordance with the requirements of SAB 104,Revenue Recognition (a replacement of SAB 101) (SAB 104). In either case, the amount of arrangement consideration allocated to the delivered item(s) is limited to the amount that is not contingent on Caliper delivering additional products or services.
Statement of Position 97-2,Software Revenue Recognition and EITF Issue No.03-5,Applicability of AICPA Statement of Position 97-2 to Non-Software Deliverables in an Arrangement Containing More-than-Incidental Software (SOP 97-2). When Caliper's revenue arrangements include the sale of an instrument in which the software is more than incidental, revenue is recognized in accordance with SOP 97-2. Caliper allocates revenue on the arrangement between software and non-software related deliverables based on fair value as required by EITF 03-5. Revenue allocated to the software deliverable is recognized in accordance with SOP 97-2. If there is vendor-specific objective evidence of the fair value(s) of the undelivered item(s) in an arrangement, but no such evidence for the delivered item(s), Caliper uses the residual method to allocate the arrangement consideration associated with the software deliverables. Revenue allocated to non-software deliverables is further allocated based on the separation criteria established in EITF 00-21. When items included in a multiple-element arrangement represent separate units of accounting and there is objective and reliable evidence of fair value for all items included in the arrangement, Caliper allocates the arrangement consideration to the individual items based on their relative fair values. If there is objective and reliable evidence of the fair value(s) of the undelivered item(s) in an arrangement, but no such evidence for the delivered item(s), Caliper uses the residual method to allocate the arrangement consideration. In either case, the amount of arrangement consideration allocated to the delivered item(s) is limited to the amount that is not contingent on Caliper delivering additional products or services.
Cash received from customers as advance deposits for undelivered products and services including contract research and development services, is recorded within customer deposits until revenue is recognized. Revenue related to annual maintenance contracts or other remaining undelivered performance obligations is deferred and recognized upon completion of the underlying performance
F-9
CALIPER LIFE SCIENCES, INC.
NOTES TO CONSOLIDATED FINANCIAL STATEMENTS (Continued)
2. Summary of Significant Accounting Policies (Continued)
criteria. Caliper allocates revenues between product and service revenues in the income statement for each of the elements in an arrangement based on their relative fair values, or based upon the residual method when fair value exists only for remaining undelivered items.
Product Revenue
Product revenue is recognized upon the shipment and transfer of title to customers and is recorded net of discounts and allowances. Revenues on shipments subject to customer acceptance provisions are recognized only upon customer acceptance provided all other revenue recognition criteria are met. Customer product purchases are generally delivered under standardized terms of "FOB origin" with the customer assuming the risks and rewards of product ownership at the time of shipping from Caliper's warehouse. Revenue associated with customer product purchases delivered under terms of "FOB destination" is deferred until product is delivered to the customer. In accordance with EITF 00-21 or SOP 97-2, Caliper defers the fair value of any elements that remain undelivered after product shipment and/or acceptance (as applicable), such as remaining services to be performed.
Service and Annual Maintenance Agreements
Service revenue is recognized as services are performed, typically using the proportional performance method based upon defined outputs or other reasonable measures as applicable, or ratably over the contract service term in the case of annual maintenance contracts. Customers may purchase optional warranty coverage during the initial standard warranty term and annual maintenance contracts beyond the standard warranty expiration. These optional service offerings are not included in the price Caliper charges customers for the initial product purchase. Under Caliper's standard warranty, the customer is entitled to repair or replacement of defective goods. Software upgrades are not included in the standard warranty.
Licensing and Royalty
Revenue from up-front license fees is recognized when the earnings process is complete and no further obligations exist. If further obligations exist, the up-front license fee is recognized ratably over the obligation period. Royalties under licenses are recorded as earned in accordance with contract terms, when third-party results are reliably measured and collectibility is reasonably assured.
Contract Revenue
Revenue from contract research and development services is recognized as earned based on the performance requirements of the contract. Non-refundable contract fees, which are neither time and materials- nor time and expense-based, nor tied to substantive milestones, are recognized using the proportional performance method, subject to the consideration of the guidance in SAB 104.
Segment Reporting
Caliper currently operates in one business segment, the development and commercialization of life science instruments and related consumables and services for use in drug discovery and other life sciences research and development. Caliper's entire business is comprehensively managed by a single management team that reports to the Chief Executive Officer. Caliper does not operate its core lines of product and services as separate business entities, nor does it accumulate discrete financial
F-10
CALIPER LIFE SCIENCES, INC.
NOTES TO CONSOLIDATED FINANCIAL STATEMENTS (Continued)
2. Summary of Significant Accounting Policies (Continued)
information with respect to separate product and service areas. As such, Caliper does not have separately reportable segments as defined by SFAS No. 131,Disclosure about Segments of an Enterprise and Related Information. Refer to Note 17 for discussion regarding Caliper's geographical activities.
Goodwill
In accordance with SFAS No. 141,Business Combinations, and SFAS No. 142,Goodwill and Other Intangible Assets, goodwill and certain other intangibles are not amortized but are instead subject to periodic impairment assessments. Caliper performs a test for the impairment of goodwill annually following the related acquisition, or more frequently if events or circumstances indicate that goodwill may be impaired. Because Caliper has a single operating segment which is the sole reporting unit, Caliper performs this test by comparing the fair value of Caliper with its carrying value, including goodwill. If the fair value exceeds the carrying value, goodwill is not impaired. If the book value exceeds the carrying value, Caliper would calculate the potential impairment loss by comparing the implied fair value of goodwill with the book value of goodwill. If the implied fair value of goodwill is less than the book value, an impairment charge would be recorded equal to the difference. Caliper recorded an impairment charge of $43.4 million in 2008. Refer to Note 7 for further discussion.
Foreign Currency Translation
The financial statements of Caliper's foreign subsidiaries are translated in accordance with SFAS No. 52,Foreign Currency Translation. In translating the accounts of the foreign subsidiaries into U.S. dollars, stockholders' equity is translated at historical rates, while assets and liabilities are translated at the rate of exchange in effect as of the end of the period. Revenue and expense transactions are translated using the weighted-average exchange rate in effect during the period in which they arise. The resulting foreign currency translation adjustments are reflected as a separate component of stockholders' equity. Cumulative translation adjustments included in stockholders' equity as of December 31, 2008 and 2007 were $127,000 and $526,000, respectively.
Foreign currency transaction gains and losses from the settlement of account balances denominated in another currency are included in current period other income, net, as incurred. Foreign currency gains and losses on intercompany accounts are included in current period income to the extent that settlement of these accounts is anticipated in the future.
Research and Development
Caliper charges research and development costs to expense as incurred. Research and development costs consist primarily of salaries and related personnel costs, fees paid to consultants and outside service providers for development, material cost of prototypes and test units, facility and other research-related allocation expenses, and other expenses related to the design, development, testing and enhancement of Caliper's products.
In August 2006, in connection with the Xenogen acquisition, Caliper expensed $2.9 million of in-process research and development costs within research and development expenses in the accompanying Statement of Operations. Projects in process as of the date of acquisition were evaluated in the context of SFAS No. 2,Accounting for Research and Development Costs, and FASB Interpretation No. 4,Applicability of FASB Statement No. 2 to Business Combinations Accounted for by the Purchase
F-11
CALIPER LIFE SCIENCES, INC.
NOTES TO CONSOLIDATED FINANCIAL STATEMENTS (Continued)
2. Summary of Significant Accounting Policies (Continued)
Method, which require costs to purchase in-process research and development be expensed as incurred. Fair value was determined by an independent appraisal and was based on future discounted cash flows.
Warranty Obligations
Caliper provides for estimated warranty expenses as a component of cost of revenue at the time product revenue is recognized in accordance with SFAS 5,Accounting for Contingencies and FASB Interpretation No. 45 (FIN45),Guarantor's Accounting and Disclosure Requirements for Guarantees, including Indirect Guarantees of Indebtedness of Others. Caliper offers a one-year limited warranty on most products, which is included in the selling price. Caliper's standard limited warranty covers repair or replacement of defective goods, a preventative maintenance visit on certain products, and telephone-based technical support. Factors that affect Caliper's warranty liability include the number of installed units, historical and anticipated rates of warranty claims, and cost per claim. Caliper periodically assesses the adequacy of its recorded warranty liabilities and adjusts amounts as necessary.
Other Income (Expense)
Other income (expense), net consists of the following (in thousands):
| | Years Ended December 31, | |||||||||
|---|---|---|---|---|---|---|---|---|---|---|
| | 2008 | 2007 | 2006 | |||||||
Realized gain (loss) on marketable securities, net | $ | 16 | $ | (7 | ) | $ | (22 | ) | ||
Foreign currency transaction gains, net | 466 | 576 | 434 | |||||||
Other income, net | 38 | 10 | 57 | |||||||
| $ | 520 | $ | 579 | $ | 469 | |||||
Guarantees and Indemnifications
Caliper recognizes liabilities for guarantees in accordance with FIN 45 that requires upon issuance of a guarantee, the guarantor must recognize a liability for the fair value of the obligations it assumes under that guarantee.
Caliper has certain indemnification obligations related to the divestiture of the Pharmaceutical Development and Quality ("PDQ") product line and the AutoTrace product line. The divestiture agreements also contain representations, warrants and indemnities that are customary in asset sales transactions.
Caliper, as permitted under Delaware law and in accordance with its Bylaws, indemnifies its officers and directors for certain events or occurrences, subject to certain limits, while the officer or director is or was serving at Caliper's request in such capacity. The term of the indemnification period is the officer's or director's lifetime. Caliper may terminate the indemnification agreements with its officers and directors upon 90 days written notice, but termination will not affect claims for indemnification relating to events occurring prior to the effective date of termination. The maximum amount of potential future indemnification is unlimited; however, Caliper has a director and officer insurance policy that limits its exposure and may enable it to recover a portion of any future amounts
F-12
CALIPER LIFE SCIENCES, INC.
NOTES TO CONSOLIDATED FINANCIAL STATEMENTS (Continued)
2. Summary of Significant Accounting Policies (Continued)
paid. Caliper believes the fair value of these indemnification agreements is minimal. Accordingly, Caliper has not recorded any liabilities for these agreements as of December 31, 2008 and 2007.
Shipping and Handling Fees and Costs
Shipping and handling fees billed to customers for product shipments are recorded in "Product revenue" in the accompanying consolidated statements of operations. Shipping and handling costs incurred for inventory purchases and product shipments are recorded in "Cost of revenue" in the accompanying consolidated statements of operations.
Advertising Expense
Caliper expenses costs of advertising as incurred. Advertising costs were $1.8 million, $1.9 million and $1.4 million during 2008, 2007 and 2006, respectively.
Risk Management
Caliper has purchased commercial insurance to cover its estimated future legal costs and settlements related to workers' compensation, product, general, auto, general liability and directors' and officers' liability claims. Caliper's management decides the amount of insurance coverage to purchase from unaffiliated companies and the appropriate amount of risk coverage based on the cost and availability of insurance and the likelihood of a loss. Management believes that the levels of risk that Caliper has provided insurance coverage for are consistent with those of other companies in its industry. There can be no assurance that Caliper will not incur losses beyond the limits, or outside the coverage, of its insurance.
Significant Concentrations, Credit and Other Risks
Certain financial instruments, such as cash equivalents and marketable securities, investments and accounts receivable, may potentially subject Caliper to concentrations of credit risk. Caliper believes that its investments bear minimal risk. These investments are of a short-term nature and include investments in commercial paper and government and corporate debt securities. By policy, the amount of credit exposure to any one institution or issuer is limited. These investments are generally not collateralized and primarily mature within three years. Caliper has not experienced any losses due to institutional failure or bankruptcy.
Caliper's allowance for doubtful accounts at December 31, 2008 and 2007 was $0.7 million and $1.3 million, respectively. Caliper grants credit to customers based on evaluations of their financial condition, generally without requiring collateral. However, credit risk is reduced through Caliper's efforts to monitor its exposure for credit losses and maintain allowances, if necessary. In 2008 and 2007, no customer accounted for greater than 10% of total revenues or gross accounts receivable. Caliper's policy is to perform an analysis of the recoverability of its trade accounts receivable at the end of each reporting period and to establish allowances for those accounts considered uncollectible. Caliper analyzes historical bad debts, customer concentrations, customer credit-worthiness, and current economic trends when evaluating the adequacy of the allowance for doubtful accounts.
Caliper's products include certain components that are currently sourced from single vendors. Caliper believes that other vendors would be able to provide similar equipment, however the
F-13
CALIPER LIFE SCIENCES, INC.
NOTES TO CONSOLIDATED FINANCIAL STATEMENTS (Continued)
2. Summary of Significant Accounting Policies (Continued)
qualification of such vendors may require start-up time. In order to mitigate any adverse impacts from a disruption of supply, Caliper attempts to maintain an adequate supply of critical single-sourced equipment.
Comprehensive Income (Loss)
Caliper accounts for comprehensive income (loss) in accordance with SFAS No. 130,Reporting Comprehensive Income. The components of comprehensive income (loss) are unrealized gains and losses on available-for-sale securities and foreign currency translation adjustments. Comprehensive income (loss) has been disclosed in the Statement of Stockholders' Equity. As of December 31, 2008, accumulated other comprehensive income included $127,000 in foreign currency translation gains and $56,000 in unrealized gains on available-for-sale securities. As of December 31, 2007, accumulated other comprehensive income included $526,000 in foreign currency translation gains and $103,000 in unrealized gains on available-for-sale securities.
Stock-Based Compensation
On January 1, 2006, Caliper adopted Statement of Financial Accounting Standard No. 123R,Share-Based Payment (SFAS 123R), which requires all share-based payments, including grants of stock options, to be recognized in the income statement as an operating expense, based on their fair values. Caliper estimates the fair value of each option award on the date of grant using the Black-Scholes-Merton based option-pricing model.
Prior to adopting SFAS 123R, Caliper accounted for stock-based compensation under Accounting Principles Board Opinion No. 25,Accounting for Stock Issued to Employees (APB No. 25). The modified prospective method was applied in adopting SFAS 123R and, accordingly, periods prior to adoption have not been restated and therefore comparability between periods has been affected.
Net Loss Per Share
Basic earnings per share is calculated based on the weighted-average number of common shares outstanding during the period. Diluted earnings per share would give effect to the dilutive effect of common stock equivalents consisting of stock options, unvested restricted stock, unvested restricted stock units and warrants (calculated using the treasury stock method).
Common stock equivalents equal to 14.4, 14.0 and 13.5 million shares (prior to the application of the treasury stock method) were excluded from the computation of net loss per share in each of the three year periods ended December 31, 2008, 2007 and 2006, respectively, as they would have an antidilutive effect due to Caliper's net loss.
Income Taxes
Caliper accounts for income taxes in accordance with FAS 109,Accounting for Income Taxes, and accounts for uncertainty in income taxes recognized in financial statements in accordance with FIN 48,Accounting for Uncertainty in Income Taxes. FIN 48 prescribes a comprehensive model for the recognition, measurement, and financial statement disclosure of uncertain tax positions. Unrecognized tax benefits are the difference between tax positions taken, or expected to be taken, in tax returns, and the benefits recognized for accounting purposes pursuant to FIN 48. Caliper classifies uncertain tax
F-14
CALIPER LIFE SCIENCES, INC.
NOTES TO CONSOLIDATED FINANCIAL STATEMENTS (Continued)
2. Summary of Significant Accounting Policies (Continued)
positions as short-term liabilities within accrued expenses. During the fiscal years ended December 31, 2008, 2007 and 2006, Caliper's tax provisions primarily relate to foreign taxes in jurisdictions where its wholly owned subsidiaries are profitable.
Recent Accounting Pronouncements
In November 2007, the EITF issued EITF Issue No. 07-1 (EITF No. 07-1),Accounting for Collaborative Arrangements Related to the Development and Commercialization of Intellectual Property. Companies may enter into arrangements with other companies to jointly develop, manufacture, distribute, and market a product. Often the activities associated with these arrangements are conducted by the collaborators without the creation of a separate legal entity (that is, the arrangement is operated as a "virtual joint venture"). The arrangements generally provide that the collaborators will share, based on contractually defined calculations, the profits or losses from the associated activities. Periodically, the collaborators share financial information related to product revenues generated (if any) and costs incurred that may trigger a sharing payment for the combined profits or losses. The consensus requires collaborators in such an arrangement to present the result of activities for which they act as the principal on a gross basis and report any payments received from (made to) other collaborators based on other applicable GAAP or, in the absence of other applicable GAAP, based on analogy to authoritative accounting literature or a reasonable, rational, and consistently applied accounting policy election. EITF No. 07-1 is effective for collaborative arrangements in place at the beginning of the annual period beginning after December 15, 2008. As Caliper's collaborative agreements do not incorporate such revenue- and cost-sharing arrangements, Caliper does not expect the adoption of EITF No. 07-1 to have a material impact on its financial statements.
In December 2007, the FASB issued SFAS No. 141(R) (SFAS 141R),Business Combinations. This Standard will require an acquiring company to measure all assets acquired and liabilities assumed, including contingent considerations and all contractual contingencies, at fair value as of the acquisition date. In addition, an acquiring company is required to capitalize IPR&D and either amortize it over the life of the product, or write it off if the project is abandoned or impaired. The Standard is effective for transactions occurring on or after January 1, 2009.
In April 2008, the FASB issued FASB Staff Position (FSP) FAS 142-3,Determination of the Useful Life of Intangible Assets, or FSP FAS 142-3. FSP FAS 142-3 amends the factors that should be considered in developing renewal or extension assumptions used to determine the useful life of a recognized intangible asset under FASB Statement No. 142,Goodwill and Other Intangible Assets. FSP FAS 142-3 is effective for fiscal years beginning after December 15, 2008 and early adoption is prohibited. Caliper is evaluating the impact of the pending adoption of FSP FAS 142-3 on our consolidated financial statements.
F-15
CALIPER LIFE SCIENCES, INC.
NOTES TO CONSOLIDATED FINANCIAL STATEMENTS (Continued)
3. Divestitures
PDQ Product Line Divestiture
On October 29, 2008, Caliper entered into an Asset Sale and Purchase Agreement (the "Purchase Agreement") with Sotax Corporation, ("Sotax") a Virginia corporation and a privately owned subsidiary of SOTAX Holding A.G. based in Switzerland. The Purchase Agreement provides for the sale of Caliper's PDQ product line to Sotax for a purchase price of approximately $15.8 million, including $13.8 million in cash together with certain assumed liabilities upon closing which were approximately $2.0 million (the "Purchase Price"). In addition, $1.0 million of the Purchase Price was placed into an escrow account until the first anniversary of November 10, 2008, the closing date. The escrow secures Caliper's indemnification obligations to Sotax, if any, under the Purchase Agreement. The Purchase Agreement also contains representations, warranties and indemnities that are customary in asset sale transactions. Caliper realized approximately $12.6 million in net cash proceeds from the sale of its PDQ product line upon closing, after the escrow account deposit and transaction expenses. As part of this transaction, Caliper sold approximately $0.5 million in net assets, which consisted primarily of inventory net of deferred revenue and accrued expenses. Caliper recorded a gain on the sale of the PDQ product line, based upon the net proceeds in excess of total divested net assets, which included $10.5 million of goodwill, of approximately $1.4 million. Goodwill was allocated to the product line on a relative fair value basis.
AutoTrace Product Line Divestiture
On November 10, 2008, Caliper entered into an Asset Purchase Agreement (the "Asset Purchase Agreement") with Dionex Corporation ("Dionex"), a publicly traded Delaware corporation. The Asset Purchase Agreement provides for the sale of Caliper's AutoTrace product line to Dionex for a purchase price of approximately $5.0 million. As part of this transaction, Caliper sold approximately $0.3 million in net assets, which consisted primarily of inventory net of deferred revenue and accrued expenses. Caliper recorded a gain on the sale of the AutoTrace product line, based upon the net proceeds in excess of total divested net assets, which included $3.8 million of goodwill, of approximately $0.7 million. Goodwill was allocated to the product line on a relative fair value basis.
4. Cash, Cash Equivalents and Marketable Securities
Caliper's cash, cash equivalents and marketable securities are invested in a diversified portfolio of financial instruments, including money market instruments, corporate notes and bonds, government or government agency securities and other debt securities issued by financial institutions and other issuers with strong credit ratings. Marketable securities are freely tradable at any time, irrespective of their maturity dates. Caliper's marketable securities are classified within current assets as such investments are available to be sold in response to operating cash needs, or as a result of changes in the availability of and the yield on alternative investments. By policy, the amount of credit exposure to any one institution is limited. Investments are generally not collateralized and primarily mature within three years.
F-16
CALIPER LIFE SCIENCES, INC.
NOTES TO CONSOLIDATED FINANCIAL STATEMENTS (Continued)
4. Cash, Cash Equivalents and Marketable Securities (Continued)
The following is a summary of cash and available-for-sale securities as of December 31, 2008 (in thousands):
| | Amortized Cost | Gross Unrealized Losses | Gross Unrealized Gains | Estimated Fair Value | |||||||||
|---|---|---|---|---|---|---|---|---|---|---|---|---|---|
Cash and money market funds(1) | $ | 23,667 | $ | — | $ | — | $ | 23,667 | |||||
Commercial paper(2) | 1,023 | — | — | 1,023 | |||||||||
Corporate debt securities(2) | 1,513 | (30 | ) | 1 | 1,484 | ||||||||
Other(2) | 528 | (1 | ) | — | 527 | ||||||||
| $ | 26,731 | $ | (31 | ) | $ | 1 | $ | 26,701 | |||||
- (1)
- Reported as cash and cash equivalents
- (2)
- Reported as marketable securities
The following is a summary of the cost and estimated fair value of available-for-sale securities at December 31, 2008, by contractual maturity (in thousands):
| | Amortized Cost | Estimated Fair Value | ||||||
|---|---|---|---|---|---|---|---|---|
Mature within one year | $ | 2,829 | $ | 2,801 | ||||
Mature after one year through three years | 235 | 233 | ||||||
Total | $ | 3,064 | $ | 3,034 | ||||
The following is a summary of cash and available-for-sale securities as of December 31, 2007 (in thousands):
| | Amortized Cost | Gross Unrealized Losses | Gross Unrealized Gains | Estimated Fair Value | |||||||||
|---|---|---|---|---|---|---|---|---|---|---|---|---|---|
Cash and money market funds(1) | $ | 15,709 | $ | — | $ | — | $ | 15,709 | |||||
Corporate debt securities(2) | 3,245 | (1 | ) | 2 | 3,246 | ||||||||
| $ | 18,954 | $ | (1 | ) | $ | 2 | $ | 18,955 | |||||
- (1)
- Reported as cash and cash equivalents
- (2)
- Reported as marketable securities
Gross realized gains and losses on sales of available-for-sale securities have been included within other income in Caliper's statement of operations and were not material in 2008, 2007 and 2006. Caliper utilizes the specific identification basis to reclassify amounts out of accumulated other comprehensive income into earnings.
As of December 31, 2008 and 2007, Caliper held available-for-sale securities having an aggregate value of $3.0 million and $3.2 million, respectively. Unrealized gains and losses pertaining to underlying individual securities were not material in either year. Although available to be sold to meet operating
F-17
CALIPER LIFE SCIENCES, INC.
NOTES TO CONSOLIDATED FINANCIAL STATEMENTS (Continued)
4. Cash, Cash Equivalents and Marketable Securities (Continued)
needs or otherwise, securities are generally held through maturity. Therefore, such unrealized losses are deemed temporary and have been included within accumulated other comprehensive income.
In September 2006, the Financial Accounting Standards Board (FASB) issued Statement of Financial Accounting Standards (SFAS) No. 157,Fair Value Measurements ("SFAS No. 157"), effective for financial statements issued for fiscal years beginning after November 15, 2007. SFAS No. 157 replaces multiple existing definitions of fair value with a single definition, establishes a consistent framework for measuring fair value and expands financial statement disclosures regarding fair value measurements. SFAS No. 157 applies only to fair value measurements that already are required or permitted by other accounting standards and does not require any new fair value measurements. In February 2008, the FASB issued FASB Staff Position (FSP) No. 157-2 ("FSP No. 157-2"), which delayed until the first quarter of 2009 the effective date of SFAS No. 157 for nonfinancial assets and liabilities that are not recognized or disclosed at fair value in the financial statements on a recurring basis. Our nonfinancial assets and liabilities that meet the deferral criteria set forth in FSP No. 157-2 include goodwill, intangible assets and property, plant and equipment.
In October 2008, the FASB issued FSP No. FAS 157-3,Determining the Fair Value of a Financial Asset When the Market for That Asset Is Not Active, which clarifies the application of SFAS No. 157 in an inactive market and illustrates how an entity would determine fair value when the market for a financial asset is not active. The Staff Position is effective immediately and applies to prior periods for which financial statements have not been issued, including interim or annual periods ending on or before September 30, 2008. The implementation of SFAS 157-3 did not have a material impact on our consolidated financial position, results of operations and cash flows.
In accordance with the provisions of SFAS No. 157, Caliper measures fair value at the price that would be received to sell an asset or paid to transfer a liability in an orderly transaction between market participants at the measurement date. The Statement prioritizes the assumption that market participants would use in pricing the asset or liability (the "inputs") into a three-tier fair value hierarchy. This fair value hierarchy gives the highest priority (Level 1) to quoted prices in active markets for identical assets or liabilities and the lowest priority (Level 3) to unobservable inputs in which little or no market data exists, requiring companies to develop their own assumptions. Observable inputs that do not meet the criteria of Level 1, and include quoted prices for similar assets or liabilities in active markets or quoted prices for identical assets and liabilities in markets that are not active, are categorized as Level 2. Level 3 inputs are those that reflect our estimates about the assumptions market participants would use in pricing the asset or liability, based on the best information available in the circumstances. Valuation techniques for assets and liabilities measured using Level 3 inputs may include methodologies such as the market approach, the income approach or the cost approach, and may use unobservable inputs such as projections, estimates and management's interpretation of current market data. These unobservable inputs are only utilized to the extent that observable inputs are not available or cost-effective to obtain.
F-18
CALIPER LIFE SCIENCES, INC.
NOTES TO CONSOLIDATED FINANCIAL STATEMENTS (Continued)
4. Cash, Cash Equivalents and Marketable Securities (Continued)
On December 31, 2008, Caliper's investments were valued in accordance with the fair value hierarchy as follows (in thousands):
| | Total Fair Value | Quoted Prices in Active Markets (Level 1) | Observable Inputs (Level 2) | Unobservable Inputs (Level 3) | ||||||||||
|---|---|---|---|---|---|---|---|---|---|---|---|---|---|---|
Money market funds | $ | 14,867 | $ | 14,867 | $ | — | $ | — | ||||||
Commercial paper | 1,023 | — | 1,023 | — | ||||||||||
U.S. corporate notes and bonds | 1,484 | — | 1,484 | — | ||||||||||
Other | 528 | — | 528 | — | ||||||||||
Total | $ | 17,902 | $ | 14,867 | $ | 3,035 | $ | — | ||||||
Investments are generally classified Level 1 or Level 2 because they are valued using quoted market prices, broker or dealer quotations, market prices received from industry standard pricing data providers or alternative pricing sources with reasonable levels of price transparency. Investments in U.S. Treasury Securities and overnight money market mutual funds have been classified as Level 1 because these securities are value based upon quoted prices in active markets or because the investments are actively traded.
Caliper held four investments in debt securities that were in an unrealized loss position as of December 31, 2008. During the twelve months ended December 31, 2008, a total unrealized loss of $47,000 was recorded to accumulated other comprehensive income within the accompanying balance sheet, including an unrealized loss of $29,000 in one investment. Based on Caliper's evaluation of its investments, management does not believe any individual unrealized loss at December 31, 2008 represents an other-than-temporary impairment as these unrealized losses are primarily attributable to changes in the interest rates and the ongoing credit crisis which has created volatile market conditions. Caliper currently has both the intent and ability to hold the securities for a time necessary to recover the amortized cost.
5. Inventories
Inventories are stated at the lower of cost (determined on a first-in, first-out basis, or "FIFO") or market. Amounts are relieved from inventory and recognized as a component of cost of sales on a FIFO basis. Inventories consist of the following (in thousands):
| | December 31, | ||||||
|---|---|---|---|---|---|---|---|
| | 2008 | 2007 | |||||
Raw material | $ | 10,173 | $ | 11,228 | |||
Work-in-process | 907 | 561 | |||||
Finished goods | 6,499 | 7,783 | |||||
Inventories | $ | 17,579 | $ | 19,572 | |||
Caliper reserves or writes off the cost of inventory which it specifically identifies and considers to be obsolete or excess. Caliper defines obsolete inventory as inventory that will no longer be used in the manufacturing process. Excess inventory is generally defined as inventory in excess of projected usage,
F-19
CALIPER LIFE SCIENCES, INC.
NOTES TO CONSOLIDATED FINANCIAL STATEMENTS (Continued)
5. Inventories (Continued)
and is determined using management's best estimate of future demand at the time, based upon information then available to Caliper. Caliper uses a twelve-month demand forecast and, in addition to the demand forecast, Caliper also considers: (1) parts and subassemblies that can be used in alternative finished products, (2) parts and subassemblies that are unlikely to be impacted by engineering changes, and (3) known design changes which would reduce Caliper's ability to use the inventory as planned. During 2008, 2007 and 2006, respectively, Caliper recorded charges of $1.7 million, $1.3 million and $0.2 million, respectively, to cost of product revenues for excess and obsolete inventories.
6. Property and Equipment
Property and equipment consists of the following (in thousands):
| | | December 31, | |||||||
|---|---|---|---|---|---|---|---|---|---|
Asset Classification | Estimated Useful Life | 2008 | 2007 | ||||||
Machinery and equipment | 2–5 years | $ | 10,541 | $ | 17,452 | ||||
Computers and information systems | 3–5 years | 7,267 | 7,542 | ||||||
Office equipment, furniture and fixtures | 5 years | 1,775 | 2,112 | ||||||
Leasehold improvements | Shorter of estimated useful life or life of lease | 13,863 | 13,004 | ||||||
| 33,446 | 40,110 | ||||||||
Accumulated depreciation and amortization | (22,711 | ) | (28,633 | ) | |||||
Property and equipment, net | $ | 10,735 | $ | 11,477 | |||||
Depreciation expense, including amortization of assets under capital leases, was $3.6 million, $3.8 million and $3.6 million for the years ended December 31, 2008, 2007, and 2006, respectively. The amortization of assets recorded under capital leases is not material and is included within depreciation expense in the current period.
7. Goodwill and Intangible Assets
Goodwill
Caliper performs an annual impairment analysis of goodwill to determine if impairment exists, and may perform a test for the impairment of goodwill more frequently if events or circumstances indicate that goodwill may be impaired. The goodwill impairment analysis is a two-step process. The first step of the goodwill impairment test, used to identify potential impairment, compares the fair value of a reporting unit with its carrying amount, including goodwill. Caliper is comprised of a single segment which is the sole reporting unit. If the fair value of a reporting unit exceeds its carrying amount, goodwill of the reporting unit is not impaired. However, if the carrying value exceeds estimated fair value, there is an indication of potential impairment and a second step is performed to measure the amount of impairment. Fair value is determined by utilizing information about our company as well as publicly available industry information. Determining fair value involves judgments by Caliper's management and requires the use of significant estimates and assumptions, including point-in-time estimates of revenue growth rates, profit margin percentages, discount rates, perpetuity growth rates, future capital expenditures and future market conditions, among others.
F-20
CALIPER LIFE SCIENCES, INC.
NOTES TO CONSOLIDATED FINANCIAL STATEMENTS (Continued)
7. Goodwill and Other Intangible Assets (Continued)
The second step of the goodwill impairment process involves the calculation of an implied fair value of goodwill. The implied fair value of goodwill is determined in a manner that is similar to how goodwill is calculated in a business combination, by measuring the excess of the estimated fair value of the reporting unit as calculated in step one, over the estimated fair values of the individual assets, liabilities and identifiable intangibles as if the reporting unit was being acquired in a business combination. If the carrying value of goodwill assigned to a reporting unit exceeds the implied fair value of the goodwill, an impairment charge is recorded for the excess. In determining the fair value of its net assets Caliper determined the fair value of leases and certain intangible assets, including trademarks, patents, core and developed technologies and customer relationships.
Caliper's annual goodwill impairment assessment has historically been completed at the beginning of the fourth quarter. With the sales of its PDQ and AutoTrace product lines in the fourth quarter of 2008, which met the criteria for assets held for sale in October 2008, prior to the goodwill impairment test date, Caliper first determined the amount of goodwill ($14.3 million) that was to be allocated to these divestitures based upon a relative fair value basis considering their recent transaction values, and then applied its annual goodwill impairment analysis to the remaining goodwill balance ($66.3 million), which resulted in the determination that impairment had occurred. The second step of the goodwill impairment test involved Caliper calculating the implied goodwill for the entity. The carrying value of the goodwill assigned to the overall business exceeded the implied fair value of goodwill, resulting in a goodwill impairment of $43.4 million.
Goodwill is not amortized, but is reviewed for impairment at least annually. The results of this year's impairment test are as of a point in time. If the future growth and operating results of our business are not as strong as anticipated and/or Caliper's market capitalization declines, this could impact the assumptions used in calculating the fair value in subsequent years. To the extent goodwill is impaired, its carrying value will be further written down to its implied fair value and a charge will be made to Caliper's earnings. Such an impairment charge would materially and adversely affect Caliper's GAAP reported operating results. As of December 31, 2008, Caliper had recorded goodwill of $22.9 million in its consolidated balance sheet. The goodwill impairment charge is non-cash in nature and does not affect Caliper's liquidity, cash flows from operating activities, or debt covenants, or have any impact on future operations. No impairment was identified in fiscal years 2007 and 2006.
F-21
CALIPER LIFE SCIENCES, INC.
NOTES TO CONSOLIDATED FINANCIAL STATEMENTS (Continued)
7. Goodwill and Other Intangible Assets (Continued)
Intangibles
As of December 31, 2008, intangible assets consisted of the following (in thousands):
Asset Classification | Weighted Average Amortization Period | Cost | Accumulated Amortization | Net | |||||||||
|---|---|---|---|---|---|---|---|---|---|---|---|---|---|
Amortized intangible assets: | |||||||||||||
Core technologies | 8.8 years | $ | 30,113 | $ | (8,233 | ) | $ | 21,880 | |||||
Developed and contract technologies | 6.5 years | 11,320 | (5,436 | ) | 5,884 | ||||||||
Customer contracts, lists and relationships | 7.1 years | 6,470 | (2,746 | ) | 3,724 | ||||||||
Other intangibles | 1.9 years | 476 | (463 | ) | 13 | ||||||||
| 8.0 years | 48,379 | (16,878 | ) | 31,501 | |||||||||
Trade name | Indefinite life | 2,898 | — | 2,898 | |||||||||
Total intangible assets | $ | 51,277 | $ | (16,878 | ) | $ | 34,399 | ||||||
As of December 31, 2007, intangible assets consist of the following (in thousands):
Asset Classification | Weighted Average Amortization Period | Cost | Accumulated Amortization | Net | |||||||||
|---|---|---|---|---|---|---|---|---|---|---|---|---|---|
Amortized intangible assets: | |||||||||||||
Core technologies | 8.8 years | $ | 30,113 | $ | (4,790 | ) | $ | 25,323 | |||||
Developed and contract technologies | 5.7 years | 25,633 | (16,206 | ) | 9,427 | ||||||||
Customer contracts, lists and relationships | 8.3 years | 10,110 | (5,103 | ) | 5,007 | ||||||||
Other intangibles | 1.9 years | 477 | (270 | ) | 207 | ||||||||
| 7.2 years | 66,333 | (26,369 | ) | 39,964 | |||||||||
Trade name | Indefinite life | 2,898 | — | 2,898 | |||||||||
Total intangible assets | $ | 69,231 | $ | (26,369 | ) | $ | 42,862 | ||||||
Amortization expense is computed based upon the estimated timing of the undiscounted cash flows used to value each respective asset over the estimated useful life of the particular intangible asset, or using the straight-line method over the estimated useful life of the intangible asset when the pattern of cash flows is not necessarily reflective of the true consumption rate of the particular intangible asset.
F-22
CALIPER LIFE SCIENCES, INC.
NOTES TO CONSOLIDATED FINANCIAL STATEMENTS (Continued)
7. Goodwill and Other Intangible Assets (Continued)
Amortization expense was $8.5 million, $10.2 million and $7.1 million during the years ended December 31, 2008, 2007 and 2006, respectively. Scheduled amortization in future periods is as follows (in thousands):
| | | ||||
|---|---|---|---|---|---|
Years ending December 31: | |||||
2009 | $ | 6,216 | |||
2010 | 5,806 | ||||
2011 | 5,417 | ||||
2012 | 4,855 | ||||
2013 | 4,159 | ||||
Thereafter | 5,048 | ||||
| $ | 31,501 | ||||
8. Other Current and Non-current Liabilities
Other current and non-current liabilities consist of the following (in thousands):
| | December 31, | |||||||
|---|---|---|---|---|---|---|---|---|
| | 2008 | 2007 | ||||||
Accrued legal | $ | 588 | $ | 2,461 | ||||
Accrued warranty | 1,362 | 1,684 | ||||||
Accrued VAT and other taxes | 1,462 | 1,716 | ||||||
Accrued royalties | 1,501 | 1,258 | ||||||
Deferred rent | 555 | 1,310 | ||||||
Accrued other | 4,257 | 4,396 | ||||||
Total other accrued liabilities | $ | 9,725 | $ | 12,825 | ||||
Deferred rent | $ | 5,781 | $ | 3,850 | ||||
Deferred revenue | 2,290 | 2,815 | ||||||
Other | 204 | 151 | ||||||
Total other noncurrent liabilities | $ | 8,275 | $ | 6,816 | ||||
F-23
CALIPER LIFE SCIENCES, INC.
NOTES TO CONSOLIDATED FINANCIAL STATEMENTS (Continued)
8. Other Current and Non-current Liabilities (Continued)
Warranty Obligation
Changes in Caliper's warranty obligation during the years ended December 31, 2008 and 2007 are as follows (in thousands):
Balance, December 31, 2006 | $ | 2,235 | ||
Warranties issued during the period | 1,145 | |||
Settlements and adjustments made during the period | (1,696 | ) | ||
Balance, December 31, 2007 | 1,684 | |||
Warranties issued during the period | 1,767 | |||
Settlements and adjustments made during the period | (1,670 | ) | ||
Adjustment for obligations related to product line divestitures | (419 | ) | ||
Balance, December 31, 2008 | $ | 1,362 | ||
Deferred Rent
Deferred rent is principally comprised of i) deferred obligations established as a result of lease incentives, including tenant improvement financing and rent holidays (i.e., free rent), ii) deferred obligations related to lease agreements with built-in rent escalations over time which are required to be accounted for on a straight-line basis under FASB No. 13,Accounting for Leases, and established accruals for above market lease costs accounted for in connection with our acquisition of Xenogen in 2006. Under i) above, the improvements funded by the landlord(s) are treated as lease incentives under FASB Technical Bulletin No. 88-1,Issues Relating to Accounting for Leases. Accordingly, the funding received from the landlord was recorded as fixed asset additions and a deferred rent liability on the consolidated balance sheet. The deferred rent liability is being amortized as a reduction to rent expense over the life of the lease. In accordance with FASB No. 95,Statement of Cash Flows, cash flows from the landlord for the reimbursement of improvements have been reported within cash from operating activities, while cash flows remitted for the acquisition of leasehold improvements are classified within investing activity cash flows. As of December 31, 2008, deferred rent included $5.2 million in deferred lease incentives, and $1.0 million of above-market rent obligations.
9. Credit Facility (Subsequent Event)
On March 6, 2009, Caliper entered into a Second Amended and Restated Loan and Security Agreement ("Credit Facility") with a bank, which permits Caliper to borrow up to $25 million in the form of revolving loan advances, including up to $5 million in the form of letters of credit and other contingent reserves. Principal borrowings under the credit facility accrue interest at a floating annual rate equal to the prime rate plus one percent if Caliper's unrestricted cash held at the bank exceeds or is equal to $20 million, or prime plus two percent if Caliper's unrestricted cash held at the bank is below $20 million. Under the Credit Facility, Caliper is permitted to borrow up to $25 million, subject to a borrowing base limit consisting of (a) 80% of eligible accounts receivable plus (b) the lesser of 70% of Caliper's unrestricted cash at the bank or $12 million; provided, that on each of the first three (3) business days and each of the last three (3) business days of each fiscal quarter, the borrowing base is (a) 80% of eligible accounts receivable plus (b) the lesser of 90% of Caliper's unrestricted cash at the bank or $12 million. Eligible accounts receivable do not include internationally billed receivables,
F-24
CALIPER LIFE SCIENCES, INC.
NOTES TO CONSOLIDATED FINANCIAL STATEMENTS (Continued)
9. Credit Facility (Subsequent Event) (Continued)
unbilled receivables, and receivables aged over 90 days from invoice date. The Credit Facility matures on November 30, 2010. As of December 31, 2008, $14.9 million was outstanding under the previous credit facility. The Credit Facility serves as a source of capital for ongoing operations and working capital needs.
The Credit Facility includes traditional lending and reporting covenants including that certain financial covenants applicable to liquidity and earnings are to be maintained by Caliper and tested as of the last day of each quarter. As of December 31, 2008, Caliper was not in compliance with one of its covenants for which Caliper subsequently received a waiver from the bank. The Credit Facility also includes a net liquidity clause. Under this clause, if Caliper's cash, cash equivalents and marketable securities, held at the bank, net of debt outstanding under the Credit Facility, is less than $0.5 million (Net Liquidity), the bank will apply all of Caliper's accounts receivable collections, received within its lockbox arrangement with the bank, to the outstanding principal. Such amounts are eligible to be re-borrowed by Caliper subject to the borrowing base limit described above. Based on Caliper's current forecast, it expects that it will operate under the Net Liquidity clause beginning in the third quarter of 2009 and continue in effect for the remainder of 2009.
The Credit Facility also includes subjective rights for the bank to accelerate the maturity of the debt, lower the borrowing base or stop making advances, which are typical within asset based lending arrangements. Caliper does not believe the bank will exercise these rights as long as it is meeting its covenants and achieving its forecast. The Credit Facility also includes several potential events of default such as payment default, material adverse change conditions and insolvency conditions that could cause interest to be charged at the interest rate in effect as of the date of default plus two percentage points, or in the event of any uncured events of default (including non-compliance with liquidity and earnings financial covenants), could result in the bank's right to declare all outstanding obligations immediately due and payable. Should an event of default occur, including the exercise of a material adverse change condition, and based on such default the bank were to decide to declare all outstanding obligations immediately due and payable, Caliper may be required to significantly reduce its costs and expenses, sell additional equity or debt securities, or restructure portions of its business which could involve the sale of certain business assets. The sale of additional equity or convertible debt securities may result in additional dilution to Caliper's stockholders. Furthermore, additional capital may not be available on terms favorable to Caliper, if at all. In this circumstance, if Caliper could not significantly reduce its costs and expenses, obtain adequate financing on acceptable terms when such financing is required or restructure portions of its business, Caliper's business would be adversely affected. In addition, the amount of available capital that Caliper is able to access under the Credit Facility at any particular time is dependent upon the borrowing base formula, which ultimately relies on the underlying performance of the business. If economic conditions worsen and its business performance is not as strong as anticipated, then Caliper could experience an event of default or a reduction in borrowing capacity under the Credit Facility, which if not cured to the bank's satisfaction, could have a potential adverse impact on its ability to access capital under its Credit Facility fund in order to fund 2009 operations. If such events were to occur, Caliper's business would be adversely affected.
Outstanding obligations under the Credit Facility were $14.9 million and $12.9 million as of December 31, 2008 and 2007, respectively. The Credit Facility was classified as non-current as of December 31, 2007, based upon the then maturity date of June 2009. As of December 31, 2008, the Credit Facility is classified as short-term consistent with Caliper's intent to utilize the Credit Facility to fund operations and working capital needs on a revolving loan basis as a result of operating under the
F-25
CALIPER LIFE SCIENCES, INC.
NOTES TO CONSOLIDATED FINANCIAL STATEMENTS (Continued)
9. Credit Facility (Subsequent Event) (Continued)
Net Liquidity provision described above. Interest is due monthly and has ranged from 3.75% to 8.75% in 2008 and 2007, respectively. At December 31, 2008, Caliper had approximately $8.4 million of additional amounts that it could borrow under the Credit Facility.
10. Commitments and Contingencies
Leases
As of December 31, 2008, future minimum payments under operating leases (excluding idled facilities accounted for within accrued restructuring) were as follows (in thousands):
| | | ||||
|---|---|---|---|---|---|
Years ending December 31: | |||||
2009 | $ | 7,012 | |||
2010 | 6,737 | ||||
2011 | 7,289 | ||||
2012 | 6,204 | ||||
2013 | 7,972 | ||||
Thereafter | 12,613 | ||||
Total minimum lease payments | $ | 47,827 | |||
Rent expense relating to operating leases was approximately $6.0 million in 2008, $5.8 million in 2007, and $4.6 million in 2006.
Letters-of-Credit
As of December 31, 2008, Caliper had outstanding standby letters-of-credit, which restrict available borrowing under its Credit Facility, in the outstanding amount of $1.7 million securing facility operating leases.
Inventory Purchases
As of December 31, 2008 and 2007, Caliper had a non-cancelable purchase commitment in the amount of approximately $0.4 million and $0.6 million, respectively, with its foreign supplier for the purchase of glass stock used in the manufacture of certain types of its chips.
As of December 31, 2008 and 2007, Caliper had non-cancelable purchase commitments in the amount of approximately $2.9 million and $3.2 million, respectively, with its CCD camera suppliers and filter supplier for the purchase of parts used in the manufacture of in vivo imaging instrumentation.
Royalty Arrangements
On August 9, 2006, Stanford University provided Xenogen with the results of an audit performed pursuant to the exclusive license agreement between Stanford and Xenogen. The audit report, which was prepared by a third party consultant, asserted certain claims of underpayments during the period from 2002 through March 31, 2006 based upon the consultant's interpretation of the license. Upon review of the audit report, Caliper determined that additional royalties of $71,000 were owed to Stanford, and paid this obligation in 2006. Caliper is contesting the remaining payment obligation that is claimed in the Stanford audit report, and as a result, has not accrued for any additional liability. The
F-26
CALIPER LIFE SCIENCES, INC.
NOTES TO CONSOLIDATED FINANCIAL STATEMENTS (Continued)
10. Commitments and Contingencies (Continued)
amount of any remaining contingent obligation, if any, cannot currently be estimated, nor does Caliper believe that it is probable that a liability exists. At any time, either party may choose binding arbitration to resolve any dispute over the amount of back royalties owed, if any.
Caliper has entered into royalty arrangements with several third parties whereby Caliper owes royalties that range from 2% to 15% related to revenues that are derived pursuant to in-licensed technologies. Royalty obligations are expensed when incurred or over the minimum royalty periods. Some of the arrangements include minimum royalties over a defined term. The future minimum royalty payments are as follows (in thousands):
| | | ||||
|---|---|---|---|---|---|
Years ending December 31: | |||||
2009 | $ | 352 | |||
2010 | 351 | ||||
2011 | 327 | ||||
2012 | 326 | ||||
2013 | 319 | ||||
Thereafter | 1,221 | ||||
Total minimum royalty payments | $ | 2,896 | |||
11. Restructuring Activities
The following table summarizes the restructuring accrual activity (in thousands):
| | Severance and Related | Facilities | Total | |||||||
|---|---|---|---|---|---|---|---|---|---|---|
Balance, December 31, 2005 | $ | — | $ | 7,230 | $ | 7,230 | ||||
Restructuring charges | — | 124 | 124 | |||||||
Established obligations with Xenogen | 3,451 | 1,046 | 4,497 | |||||||
Assumed obligations with Xenogen | — | 981 | 981 | |||||||
Interest accretion and adjustments | — | 322 | 322 | |||||||
Payments | (410 | ) | (3,584 | ) | (3,994 | ) | ||||
Balance, December 31, 2006 | 3,041 | 6,119 | 9,160 | |||||||
Restructuring credits | (187 | ) | 612 | 425 | ||||||
Interest accretion and adjustments | — | 372 | 372 | |||||||
Payments | (2,845 | ) | (4,494 | ) | (7,339 | ) | ||||
Balance, December 31, 2007 | 9 | 2,609 | 2,618 | |||||||
Restructuring charges | — | 4,605 | 4,605 | |||||||
Interest accretion and adjustments | — | (61 | ) | (61 | ) | |||||
Payments | (9 | ) | (2,677 | ) | (2,686 | ) | ||||
Balance, December 31, 2008 | $ | — | $ | 4,476 | $ | 4,476 | ||||
The restructuring liability as of December 31, 2008 reflects the minimum future payment obligations related to base lease rentals and operating charges, net of sub lease income, over the
F-27
CALIPER LIFE SCIENCES, INC.
NOTES TO CONSOLIDATED FINANCIAL STATEMENTS (Continued)
11. Restructuring Activities (Continued)
remaining lease lives through April 2011, discounted at the borrowing rate in effect at the time of the restructuring event (5% or 8.75%). The remaining facility obligations are as follows (in thousands):
| | | ||||
|---|---|---|---|---|---|
Years ending December 31: | |||||
2009 | $ | 1,948 | |||
2010 | 1,781 | ||||
2011 | 421 | ||||
2012 | 433 | ||||
2013 | 407 | ||||
Total minimum payments | 4,990 | ||||
Less: Amount representing interest | (514 | ) | |||
Present value of future payments | 4,476 | ||||
Less: Current portion of obligations | 1,806 | ||||
Noncurrent portion of obligations | $ | 2,670 | |||
Included within the above obligations is estimated future sublease income of $0.8 million in 2009 and $1.0 million in 2010 through 2013.
The restructuring obligations reflected above resulted from the following actions:
Facility Closures
During the period from May 2003 through December 2006, Caliper consolidated certain facilities in Mountain View, California, the effects of which were originally reflected and have been subsequently adjusted through restructuring charges (credits) in the accompanying statement of operations. These facility closures were accounted for in accordance with SFAS 146,Accounting for Costs Associated with Exit or Disposal Activities, pursuant to which Caliper recorded a liability equal to the fair value of the remaining lease payments as of the cease-use date for each of the closed facilities. Fair value was determined based upon the discounted present value of remaining lease rentals (using a discount rate of 5%), for the space no longer occupied, considering sublease income at each point in time. As of June 30, 2008, there were no remaining obligations as the leases for these facilities lapsed.
During the first quarter of 2008, Caliper initiated the consolidation of its West Coast business operations to reduce overall facility costs and improve productivity and effectiveness of its research and development spending. The consolidation plan entailed vacating approximately 36,500 square feet of currently occupied space in Mountain View, California, which was completed in September 2008. This facility closure was accounted for in accordance with SFAS 146, pursuant to which Caliper recorded a liability equal to the fair value of the remaining lease payments as of the cease-use date. Fair value was determined based upon the discounted present value of remaining lease rentals (using a discount rate of 5.5%) for the space no longer occupied, considering future estimated sublease income, estimated broker fees and required tenant improvements. Caliper calculated the fair value as $4.6 million and recorded this amount within restructuring charges, within the accompanying consolidated income statement. The restructuring charge includes a $2.8 million charge recorded during the third quarter along with a revision to the sublease assumptions in the fourth quarter which resulted in an additional $1.8 million charge, based on the further deterioration of the sublease market in Mountain View, California.
F-28
CALIPER LIFE SCIENCES, INC.
NOTES TO CONSOLIDATED FINANCIAL STATEMENTS (Continued)
11. Restructuring Activities (Continued)
Xenogen Acquisition
In connection with the acquisition of Xenogen, Caliper incurred costs associated with the involuntary termination of certain employees of Xenogen as well as the closing of duplicate facilities. These costs have been accounted for in accordance with EITF No. 95-3,Recognition of Liabilities in Connection with a Purchase Business Combination, pursuant to which Caliper recorded a liability based on a defined exit plan equal to the fair value of the facility obligations and the costs related to the involuntarily terminated individuals.
- •
- Caliper identified severance and other expenses relating to the involuntary termination of former Xenogen personnel performing general and administrative and manufacturing functions and established an assumed liability of $3.5 million related to this activity. This action reduced the total Xenogen workforce by approximately 34 employees, or approximately 6%. Substantially all affected employees were terminated by December 31, 2006. Based on the actual payments, Caliper adjusted the accrual by $0.2 million in 2007 and recorded the adjustment in the purchase price allocation.
- •
- Caliper consolidated Xenogen's west coast operations in Alameda, California into a single facility, leaving one facility currently unoccupied. As of August 9, 2006, Caliper established a liability of $1.0 million related to this lease obligation. The fair value of the lease obligation was determined based upon the discounted present value of remaining lease rentals (8.75% discount rate used) for the space no longer occupied, considering the building's sublease income potential. The lease term expires April 30, 2011. During 2007, Caliper increased the accrual by $0.6 million based upon required tenant improvements, costs incurred or to be incurred, and changes to its estimated sublease income assumptions. Approximately 57% of the facility was subleased. The adjustment was recorded in the purchase price allocation. In March 2008, in connection with the 2008 consolidation actions discussed above under "Facility Closures," Caliper revised its intention to sublease the remaining 43% of the second facility, and accordingly, reversed approximately $0.2 million of the restructuring accrual with an offsetting adjustment to goodwill.
Caliper also assumed a $1.0 million obligation related to Xenogen's St. Louis, Missouri facility. The facility closure was previously accounted for by Xenogen in accordance with EITF 94-3,Liability Recognition for Certain Employee Termination Benefits and Other Costs to Exit an Activity (Including Certain Costs Incurred in a Restructuring). The fair value of the assumed obligation was determined based upon the discounted present value of remaining lease rentals (using a discount rate of 8.75%) for the space no longer occupied, net of sublease income expected to be derived from the property. The lease term expires April 30, 2011. During 2007, Caliper increased the accrual by $0.1 million based upon the level of operating expenses required to maintain the facility. The adjustment was recorded in the purchase price allocation.
F-29
CALIPER LIFE SCIENCES, INC.
NOTES TO CONSOLIDATED FINANCIAL STATEMENTS (Continued)
12. Stockholders' Equity
Preferred Share Purchase Rights Plan
In December 2001, the Board of Directors and stockholders of Caliper adopted a Preferred Share Purchase Rights Plan (Rights Plan) under which Caliper issued as a dividend to all holders of its common stock certain rights to acquire additional shares of common stock at a discount price under certain circumstances (Rights). The dividend of the Rights was made to holders of Caliper's common stock on record as of January 8, 2002. Shares of common stock that are newly issued after this date will also carry Rights. The Rights Plan is designed to provide protection to stockholders from unsolicited and abusive takeover tactics, including attempts to acquire control of Caliper at an inadequate price or to treat all stockholders equally. Under the Rights Plan, each stockholder received one Right for each share of Caliper's outstanding common stock held by the stockholder. Each Right will entitle the holder to purchase one one-hundredth of a share of newly designated Series A Junior Participating Preferred Stock of Caliper at an initial exercise price of $100. Initially, the Rights are not detachable from Caliper's common stock and are not exercisable. Subject to certain exceptions, they become immediately exercisable after any person or group (Acquiring Person) acquires beneficial ownership of 15% or more of Caliper's common stock, or 10 business days (or such date as the Board of Directors may determine) after any person or entity announces a tender or exchange offer that would result in a 15% or greater beneficial ownership level. At no time will the Rights have any voting power. If the Rights become exercisable and a buyer becomes an Acquiring Person, all Rights holders, except the Acquiring Person, will be entitled to purchase, for each Right held, $200 worth of Caliper's common stock for $100. Caliper's Board of Directors may amend or terminate the Rights Plan at any time or redeem the Rights prior to the time a person acquires more than 15% of Caliper's common stock. Issuance of the Rights will not affect the financial position of Caliper or interfere with its business plans. Issuance of the Rights will not affect reported earnings per share and will not be taxable to Caliper or Caliper's stockholders except, under certain circumstances, if the Rights become exercisable.
Warrants
In connection with Caliper's 2006 acquisition of Xenogen, Caliper granted Xenogen stockholders an aggregate of 4,701,733 warrants, and reserved an additional 411,814 warrants for potential issuance upon the exercise of Xenogen warrants (see below) which were assumed by Caliper. Each warrant granted permits the holder to acquire one Caliper common share at an exercise price of $6.79 per share through August 9, 2011. Caliper valued the issued warrants using the Black-Scholes-Merton formula at $1.16 per warrant, or approximately $5.5 million in total for all issued and outstanding warrants. This value is included in additional paid-in capital. Key assumptions used to value the warrants issued were as follows:
Fair market value at issuance | $4.25 | |
Exercise price | $6.79 | |
Expected term | 5 years | |
Volatility | 40% | |
Risk free rate of return | 4.87% |
As discussed above, Caliper also assumed certain outstanding Xenogen warrants. As of August 9, 2006, there were 1,830,581 Xenogen warrants outstanding, which were exercisable at $2.91 to $40.75 per warrant. No Xenogen warrants were exercised during 2008. Upon the potential exercise of these warrants, the holders are entitled to receive that number of Caliper shares and warrants that such
F-30
CALIPER LIFE SCIENCES, INC.
NOTES TO CONSOLIDATED FINANCIAL STATEMENTS (Continued)
12. Stockholders' Equity (Continued)
holder would have been entitled to receive as a Xenogen stockholder as of the acquisition date. The termination date of the Caliper warrants that are to be issued upon the eventual exercise of the Xenogen warrants may not be extended beyond the 5 year expiration date (August 9, 2011).
The following table summarizes information with respect to warrants assumed from Xenogen which remain outstanding and exercisable at December 31, 2008:
Expiration Date | Exercise Price | Number of Xenogen Warrants | Equivalent Caliper Warrants (.2249 exchange ratio) | Equivalent Caliper Shares (.5792 exchange ratio) | |||||||||
|---|---|---|---|---|---|---|---|---|---|---|---|---|---|
August 2, 2012 | $ | 2.91 | 111,340 | 25,041 | 64,488 | ||||||||
August 15, 2010 | $ | 3.29 | 1,412,562 | 317,685 | 818,156 | ||||||||
April 30, 2013 | $ | 3.64 | 288,044 | 64,781 | 166,835 | ||||||||
October 7, 2009 and February 28, 2010 | $ | 15.82 | 7,900 | 1,777 | 4,576 | ||||||||
October 18, 2011 | $ | 40.74 | 8,159 | 1,835 | 4,726 | ||||||||
April 28, 2010 | $ | 40.75 | 2,576 | 579 | 1,492 | ||||||||
| 1,830,581 | 411,698 | 1,060,273 | |||||||||||
Stock Plans
The following is a summary of Caliper's stock plans that are in place as of December 31, 2008:
Plan | Plan Shares Authorized | Plan Shares Available | Awards Outstanding | Common Stock Reserved for Future Issuance | |||||||||
|---|---|---|---|---|---|---|---|---|---|---|---|---|---|
Option Plans: | |||||||||||||
1999 Equity Plan | 17,034,894 | 4,474,247 | 6,926,395 | 11,400,642 | |||||||||
1999 Directors' Plan | 808,917 | 337,082 | 434,251 | 771,333 | |||||||||
2001 Non-Statutory Stock Option Plan | 500,000 | 189,516 | 307,535 | 497,051 | |||||||||
Acquisition Plan | 900,000 | 80,000 | 600,000 | 680,000 | |||||||||
| 19,243,811 | 5,080,845 | 8,268,181 | 13,349,026 | ||||||||||
1999 Purchase Plan | 2,878,338 | 568,236 | — | 568,236 | |||||||||
In October 1999, Caliper's Board of Directors and stockholders adopted the 1999 Equity Incentive Plan (1999 Equity Plan). The 1999 Equity Plan provided for an automatic annual increase in the shares reserved for issuance for a period of ten years starting in 2000, by the greater of 5% of outstanding shares on a fully-diluted basis or the number of shares that have been made subject to awards granted under the 1999 Equity Plan during the prior 12-month period. Over the 10-year period, the maximum number of shares of common stock subject to incentive stock option grants is limited to 12,820,000 shares. Stock awards under the 1999 Equity Plan may be granted in the form of stock options (incentive and nonstatutory stock options) or stock bonuses (restricted stock and restricted stock units). Each restricted stock unit represents the recipient's right to receive a stock bonus of one share of common stock, subject to vesting or other performance considerations. Stock awards cancelled under the 1999 Equity Plan are made available for future grants. Options granted under the Plan generally have a 10-year term and are subject to vesting provisions as determined by Caliper's Board of Directors. The majority of employee equity awards carry a 4-year vesting term.
F-31
CALIPER LIFE SCIENCES, INC.
NOTES TO CONSOLIDATED FINANCIAL STATEMENTS (Continued)
12. Stockholders' Equity (Continued)
In October 1999, Caliper's Board of Directors and stockholders adopted the 1999 Non-Employee Directors' Stock Option Plan (1999 Directors' Plan) which, as amended and approved by stockholders in June 2007, provides for the automatic grant of options and restricted stock units to non-employee directors. The number of shares reserved for issuance will automatically increase by the greater of 0.3% of outstanding shares on a fully-diluted basis or the number of shares subject to options granted under the 1999 Directors' Plan during the prior 12-month period.
In December 2001, Caliper's Board of Directors adopted the 2001 Non-Statutory Stock Option Plan (2001 Non-Statutory Plan). Options under the 2001 Non-Statutory Plan cannot be issued to Caliper's current officers and directors and was therefore not required to be voted on and approved by stockholders.
In June 2003, Caliper's Board of Directors adopted the Acquisition Equity Plan (Acquisition Plan), which provides for the grant of options and restricted shares as inducements to retain key employees in connection with a significant acquisition. In July 2003, Caliper granted 600,000 options and 275,000 shares of restricted common stock under this plan in connection with the Zymark acquisition.
In October 1999, Caliper's Board of Directors and stockholders adopted the 1999 Employee Stock Purchase Plan (1999 Purchase Plan). The initial number of shares reserved was 300,000 and under the 1999 Equity Plan, the number of shares reserved for issuance automatically increases annually by the greater of 0.5% of outstanding shares on a fully-diluted basis, or the number of shares issued under the 1999 Purchase Plan during the prior 12-month period. The automatic share reserve increase may not exceed 3 million shares in aggregate over the 10-year period.
The 1999 Purchase Plan permits eligible employees to acquire shares of Caliper's common stock through payroll deductions of up to 10% of their gross earnings. No employee may participate in the 1999 Purchase Plan if, immediately after the grant, the employee has voting power over 5% or more of the outstanding capital stock. The Board may specify offerings of up to 27 months under the terms of the plan; however, Caliper's Board of Directors has currently limited offering periods to six months. Unless the Board determines otherwise, common stock may be purchased at the lower of 85% of the fair market value of Caliper's common stock on the first day of the offering or 85% of the fair market value of Caliper's common stock on the purchase date. The initial offering period began on the effective date of the initial public offering. Caliper issued 313,477, 296,549 and 249,414 shares under the 1999 Purchase Plan in the years 2008, 2007 and 2006, respectively, at a weighted average price of $2.05, $3.91and $4.36, respectively.
F-32
CALIPER LIFE SCIENCES, INC.
NOTES TO CONSOLIDATED FINANCIAL STATEMENTS (Continued)
12. Stockholders' Equity (Continued)
A summary of activity under the stock plans, excluding the 1999 Purchase Plan, is as follows:
| | | Outstanding | | |||||||||||
|---|---|---|---|---|---|---|---|---|---|---|---|---|---|---|
| | | Weighted Average Exercise Price | ||||||||||||
| | Available | Number of Shares | Exercise Price | |||||||||||
Balance at December 31, 2007 | 6,254,994 | 7,806,489 | $ | 0.00–162.00 | $ | 5.71 | ||||||||
Authorized | — | — | — | — | ||||||||||
Granted | (1,944,556 | ) | 1,944,556 | 0.00–4.09 | 3.59 | |||||||||
Exercised | — | (342,238 | ) | 0.62–3.78 | 1.26 | |||||||||
Vested Restricted Stock | — | (264,091 | ) | — | — | |||||||||
Un-vested Repurchased | — | (106,128 | ) | — | — | |||||||||
Forfeited | 300,367 | (300,367 | ) | 3.27–58.44 | 6.36 | |||||||||
Canceled | 470,040 | (470,040 | ) | 2.59–7.90 | 5.13 | |||||||||
Balance at December 31, 2008 | 5,080,845 | 8,268,181 | 0.00–162.00 | 5.42 | ||||||||||
Exercisable at December 31, 2008 | 5,076,450 | 0.97–162.00 | 5.12 | |||||||||||
Exercisable at December 31, 2007 | 4,689,650 | $ | 0.62–162.00 | $ | 5.60 | |||||||||
Stock Based Compensation
On January 1, 2006, Caliper adopted SFAS 123R, which requires all share-based payments to be recognized in the income statement as an operating expense, based on their fair values. Caliper's share-based payment arrangements within the scope of SFAS 123R include options, restricted stock and other forms of stock bonuses, including restricted stock units, awarded under its option plans, and its Employee Stock Purchase Plan (ESPP) which enables participating employees to purchase Caliper's stock at a discount from fair market value. Caliper applied the modified prospective method in adopting SFAS 123R. For stock option awards and ESPP purchases, Caliper estimates the fair value of share-based payments using the Black-Scholes-Merton formula and, for all share-based payments made after the adoption of SFAS 123R, recognizes the resulting compensation expense using a straight-line recognition method over the applicable service period of each award. The fair value of restricted stock awards (including restricted stock units) is determined based upon the fair market value of Caliper's stock on the date of grant. For restricted stock and restricted stock unit awards granted prior to January 1, 2006, Caliper continues to recognize the resulting compensation expense under the accelerated expense attribution method. Upon the adoption of SFAS 123R, deferred stock-based compensation of $3.0 million was reclassified to additional paid-in capital within stockholders' equity. The majority of the incentive and non-statutory stock option grants and restricted stock awards carry a 4-year vesting term, which is generally the requisite service period. There are typically no acceleration provisions related to the stock option grants or restricted stock awards. The exercise price of stock option grants is equal to the fair market value of Caliper's stock on the date of grant. For certain restricted stock awards that cliff vest, Caliper recognizes the resulting compensation expense using a straight-line recognition method over the applicable service period of each award. Shares issued pursuant to option exercises or restricted stock unit conversion are generally made from previously authorized, but un-issued shares of common stock, or if available, outstanding treasury shares.
F-33
CALIPER LIFE SCIENCES, INC.
NOTES TO CONSOLIDATED FINANCIAL STATEMENTS (Continued)
12. Stockholders' Equity (Continued)
Under the modified prospective method, compensation cost recognized includes (a) all share-based payments granted prior to, but not yet vested as of, January 1, 2006, based on the grant date fair value estimated in accordance with the original provisions of Statement of Financial Accounting Standard No. 123 (SFAS 123),Accounting for Stock-Based Compensation, and (b) all share-based payments granted subsequent to January 1, 2006, based on the grant date fair value estimated in accordance with the provisions of SFAS 123R. Prior to the adoption of SFAS 123R, forfeitures of unvested awards were accounted for in the period in which they occurred. Effective with the adoption of SFAS 123R estimated prospective forfeitures are included in the determination of compensation cost to be recognized. Caliper applied an expected forfeiture rate of 5% to unvested stock options for which expense was recognized during the years ended December 31, 2008, 2007 and 2006.
Caliper accounts for options issued to non-employees in accordance with the provisions of SFAS 123R and EITF No. 96-18, Accounting for Equity Instruments that are issued to other than Employees for Acquiring, or in Conjunction with Selling Goods or Services. For the years ended December 31, 2008, 2007 and 2006, compensation expense related to stock-based compensation issued to non-employees was not material.
Stock-based compensation expense is included within costs and expenses as follows (in thousands):
| | Years Ended December 31, | |||||||||
|---|---|---|---|---|---|---|---|---|---|---|
| | 2008 | 2007 | 2006 | |||||||
Cost of product revenue | $ | 306 | $ | 422 | $ | 506 | ||||
Cost of service revenue | 75 | 121 | 151 | |||||||
Research and development | 398 | 835 | 975 | |||||||
Selling, general and administrative | 2,801 | 3,783 | 3,938 | |||||||
Total | $ | 3,580 | $ | 5,161 | $ | 5,570 | ||||
The fair value of each option award issued under Caliper's equity plans is estimated on the date of grant using a Black-Scholes-Merton based option pricing model that uses the assumptions noted in the following table. Expected volatilities are based on historical volatility of Caliper's stock and warrants. The expected term of the options is based on Caliper's historical option exercise data taking into consideration the exercise patterns of the option holder during the option's life. The risk-free interest rate is based on the U.S. Treasury yield curve in effect on the date of the grant.
| | 2008 | 2007 | 2006 | |||||||
|---|---|---|---|---|---|---|---|---|---|---|
Expected volatility (%) | 40–68 | 39–45 | 40–46 | |||||||
Risk-free interest rate (%) | 1.59–3.53 | 3.90–5.00 | 4.63–4.88 | |||||||
Expected term (years) | 3.39–4.24 | 3.20–4.20 | 4.16–4.30 | |||||||
Expected dividend yield (%) | — | — | — | |||||||
F-34
CALIPER LIFE SCIENCES, INC.
NOTES TO CONSOLIDATED FINANCIAL STATEMENTS (Continued)
12. Stockholders' Equity (Continued)
A summary of stock option and restricted stock unit activity under the Plans as of December 31, 2008, and changes during the year then ended as follows:
Stock Options | Shares | Weighted Average Exercise Price | Weighted Average Remaining Contractual Term | Aggregate Intrinsic Value | |||||||||
|---|---|---|---|---|---|---|---|---|---|---|---|---|---|
| | | | | (in thousands) | |||||||||
Outstanding at December 31, 2007 | 7,159,848 | $ | 5.69 | 6.50 | $ | 4,248 | |||||||
Granted | 1,619,258 | 3.59 | — | — | |||||||||
Exercised | (342,238 | ) | 1.26 | — | 694 | ||||||||
Canceled | (770,407 | ) | 5.61 | — | — | ||||||||
Outstanding at December 31, 2008 | 7,666,461 | $ | 5.45 | 6.35 | $ | 567 | |||||||
Exercisable at December 31, 2008 | 5,076,450 | $ | 5.90 | 5.12 | $ | 567 | |||||||
Vested and expected to vest at December 31, 2008 | 7,543,208 | $ | 5.46 | 6.31 | $ | 548 | |||||||
Restricted Stock Units | Shares | |||
|---|---|---|---|---|
Outstanding and non-vested at December 31, 2007 | 646,641 | |||
Granted | 325,298 | |||
Vested | (264,091 | ) | ||
Unvested repurchases | (106,128 | ) | ||
Outstanding and non-vested at December 31, 2008 | 601,720 | |||
Restricted stock units do not carry an exercise price and typically vest over a four-year period, although the vesting period of certain awards may vary. As of December 31, 2008, the weighted average remaining vesting term is 2.07 years and the aggregate intrinsic value of outstanding and non-vested restricted stock is approximately $0.6 million.
During the twelve months ended December 31, 2008, Caliper granted 1,619,258 options at a weighted average grant date fair value, using the Black-Scholes-Merton option pricing model, of $1.35 per share, and 325,298 restricted stock units at a weighted average grant date fair value of $3.94 per share. The total fair value of restricted stock that vested during the year ended December 31, 2008 was approximately $1.5 million.
As of December 31, 2008, there was $5.5 million of total unrecognized compensation cost related to unvested stock-based compensation arrangements granted under the Plans. That cost is expected to be recognized over a weighted-average remaining service period of approximately 2.33 years.
F-35
CALIPER LIFE SCIENCES, INC.
NOTES TO CONSOLIDATED FINANCIAL STATEMENTS (Continued)
13. Income Taxes
The components of the provision (benefit) for income taxes are as follows (in thousands):
| | Years Ended December 31, | |||||||||
|---|---|---|---|---|---|---|---|---|---|---|
| | 2008 | 2007 | 2006 | |||||||
Federal | $ | (76 | ) | $ | — | $ | (337 | ) | ||
State | 50 | 125 | 2 | |||||||
Foreign | 633 | 159 | 231 | |||||||
Total | $ | 607 | $ | 284 | $ | (104 | ) | |||
Total foreign pre-tax income (loss) was $1.8 million, $1.0 million and $(0.2) million in 2008, 2007 and 2006, respectively. As a result of its historic operating loss position, Caliper has recorded no provision (benefit) for U.S. federal taxes for any period except for the tax benefit of $76,000 recorded in 2008 related to election under the Housing & Recovery Act of 2008 to forego bonus depreciation and increase the business credit limitation and in 2006 a benefit was recorded related to the write off of the NovaScreen trade name. In addition, no foreign tax benefit was recognized in jurisdictions in which foreign losses were incurred during 2008, 2007 and 2006.
A reconciliation of income taxes at the statutory federal income tax rate to net income taxes included in the accompanying statements of operations is as follows (in thousands):
| | Years Ended December 31, | ||||||||||
|---|---|---|---|---|---|---|---|---|---|---|---|
| | 2008 | 2007 | 2006 | ||||||||
Income tax provision (benefit): | |||||||||||
At federal statutory rate | $ | (23,013 | ) | $ | (8,091 | ) | $ | (9,837 | ) | ||
State | 50 | 125 | 2 | ||||||||
Foreign | 633 | 159 | 231 | ||||||||
Permanent differences: | |||||||||||
Stock compensation | 121 | 1,067 | 1,401 | ||||||||
In-process research and development | — | — | 985 | ||||||||
Impairment of goodwill | 19,504 | — | — | ||||||||
Other | (713 | ) | 101 | (244 | ) | ||||||
Valuation allowance | 4,025 | 6,923 | 7,358 | ||||||||
Total | $ | 607 | $ | 284 | $ | (104 | ) | ||||
Deferred income taxes reflect the net tax effects of temporary differences between the carrying amounts of assets for financial reporting purposes and the amounts used for income tax purposes.
F-36
CALIPER LIFE SCIENCES, INC.
NOTES TO CONSOLIDATED FINANCIAL STATEMENTS (Continued)
13. Income Taxes (Continued)
Significant components of Caliper's deferred tax assets for federal and state income taxes are as follows (in thousands):
| | Years Ended December 31, | ||||||||||
|---|---|---|---|---|---|---|---|---|---|---|---|
| | 2008 | 2007 | 2006 | ||||||||
Net operating loss carryforwards | $ | 106,665 | $ | 105,863 | $ | 101,248 | |||||
Research credit carryforwards | 12,715 | 14,530 | 15,052 | ||||||||
Capitalized research and development | 361 | 482 | 616 | ||||||||
Restructuring accrual | 1,742 | 1,034 | 2,582 | ||||||||
Intangible assets | (12,374 | ) | (15,722 | ) | (19,673 | ) | |||||
Non-amortized intangibles | (1,128 | ) | (1,130 | ) | (1,130 | ) | |||||
Other, net | 9,161 | 8,058 | 6,700 | ||||||||
Net deferred tax assets | 112,148 | 113,115 | 105,395 | ||||||||
Valuation allowance | (118,270 | ) | (114,245 | ) | (106,525 | ) | |||||
Total | $ | (1,128 | ) | $ | (1,130 | ) | $ | (1,130 | ) | ||
As of December 31, 2008, Caliper had federal and state net operating loss carryforwards of approximately $299.1 million and $102.5 million, respectively. Caliper also had federal and state research and development tax credit carryforwards of approximately $7.9 million and $4.9 million, respectively. The federal net operating loss and credit carryforwards will expire at various dates through 2028 beginning in the year 2009, if not utilized. The current remaining state net operating losses have varying expiration dates through 2028.
Because of Caliper's lack of earnings history and the uncertainty of realizing these net operating losses, the deferred tax assets have been fully offset by a valuation allowance. The valuation allowance increased by $4.0 million, $7.7 million and $42.4 million during the years ended December 31, 2008, 2007 and 2006, respectively. The 2006 change in valuation allowance includes approximately $37.0 million of valuation allowance recorded in connection with the acquisition of Xenogen. Pursuant to FAS 141(R), any future reversals of such allowance, when they occur, will be recorded as an adjustment to the income statement.
Utilization of the federal and state net operating losses and credits may be subject to a substantial limitation due to the change in ownership provisions of the Internal Revenue Code of 1986 and similar state provisions. The annual limitation may result in the expiration of net operating losses and credits before utilization. The acquisition of Xenogen resulted in Xenogen stockholders owning approximately one-third of Caliper and, therefore, in all likelihood resulted in a change of ownership that will cause pre-merger losses to be subject to limitation.
We adopted the provisions of FIN 48,Accounting for Uncertainty in Income Taxes as of January 1, 2007. FIN 48 clarifies the accounting for uncertainty in income taxes recognized in financial statements under SFAS No. 109 and prescribes a comprehensive model for the recognition, measurement, and financial statement disclosure of uncertain tax positions. Unrecognized tax benefits are the differences between tax positions taken, or expected to be taken, in tax returns, and the benefits recognized for accounting purposes pursuant to FIN 48. As a result of adopting the provisions of FIN 48, we recognized no change in the amount of unrecognized tax benefits that are recorded in our financial
F-37
CALIPER LIFE SCIENCES, INC.
NOTES TO CONSOLIDATED FINANCIAL STATEMENTS (Continued)
13. Income Taxes (Continued)
statements. In connection with the adoption of FIN 48, we have classified uncertain tax positions as short-term liabilities within accrued expenses.
The following table summarizes the activity related to our gross unrecognized tax benefits from January 1, 2007 to December 31, 2008 (in thousands):
Balance as of January 1, 2007 | $ | 308 | ||
Increases related to prior year's tax provisions | 43 | |||
Balance as of December 31, 2007 | 351 | |||
Increases related to current year's tax provisions | 161 | |||
Decreases related to settlements with taxing authorities | (101 | ) | ||
Decreases related to lapsing of statute of limitations | (51 | ) | ||
Balance as of December 31, 2008 | $ | 360 | ||
If recognized the full amount of the unrecognized tax benefit of $0.4 million would impact the annual effective tax rate. In the ordinary course of Caliper's business, its income tax filings are regularly under audit by tax authorities. While Caliper believes it has appropriately provided for all uncertain tax positions, amounts asserted by taxing authorities could be greater or less than our accrued position. Accordingly, additional provisions on income tax matters, or reductions of previously accrued provisions, could be recorded in the future as we revise our estimates due to changing facts and circumstances or the underlying matters are settled or otherwise resolved. Federal and certain state taxes for the years 2004 through 2006 are subject to examination, as well as foreign jurisdiction tax returns covering these same periods. Caliper does not anticipate that the total amount of unrecognized tax benefit related to any particular tax position will change significantly within the next twelve months.
Caliper recognizes accrued interest and penalties related to unrecognized tax benefits in income tax expense. Interest and penalties accrued as of December 31, 2008 were not material.
14. 401(k) Plans
Caliper has a 401(k) plan qualified under section 401(k) of the Internal Revenue code that is available to all eligible employees as defined in the plan. Caliper has not historically matched employee contributions, and has no immediate plans to do so.
F-38
CALIPER LIFE SCIENCES, INC.
NOTES TO CONSOLIDATED FINANCIAL STATEMENTS (Continued)
15. Supplemental Disclosure of Cash and Non-Cash Activities
The following is a summary of supplemental disclosure of cash flow information related to acquisitions (in thousands):
| | Year Ended December 31, 2006 | |||
|---|---|---|---|---|
Stock issued for acquisition of Xenogen | $ | 52,149 | ||
Warrants issued for acquisition of Xenogen | 5,476 | |||
Value of Xenogen warrants assumed in acquisition | 1,655 | |||
Total non-cash consideration | 59,280 | |||
Non-cash assets and liabilities | 52,080 | |||
Xenogen cash acquired, net of $2.8 million in acquisition costs | $ | 7,200 | ||
The following table is a summary of supplemental disclosure of significant non-cash investing and financing activities (in thousands):
| | Year Ended December 31, | |||||||||
|---|---|---|---|---|---|---|---|---|---|---|
| | 2008 | 2007 | 2006 | |||||||
Purchase price adjustment for acquisitions | $ | — | $ | (61 | ) | $ | (188 | ) | ||
Non-cash purchase of property and equipment | $ | — | $ | — | $ | 400 | ||||
16. Legal Proceedings
Commencing on June 7, 2001, Caliper and three of its officers and directors (David V. Milligan, Daniel L. Kisner and James L. Knighton) were named as defendants in three securities class action lawsuits filed in the United States District Court for the Southern District of New York. The cases have been consolidated under the caption, In re Caliper Technologies Corp. Initial Public Offering Securities Litigation, 01 Civ. 5072 (SAS) (GBD). Similar complaints were filed against approximately 300 other public companies that conducted initial public offerings of their common stock during the late 1990s (the "IPO Lawsuits"). On August 8, 2001, the IPO Lawsuits were consolidated for pretrial purposes before United States Judge Shira Scheindlin of the Southern District of New York. Together, those cases are denominated In re Initial Public Offering Securities Litigation, 21 MC 92(SAS). On April 19, 2002, a Consolidated Amended Complaint was filed alleging claims against Caliper and the individual defendants under Sections 11 and 15 of the Securities Act of 1933, and under Sections 10(b) and 20(a) of the Securities Exchange Act of 1934, as well as Rule 10b-5 promulgated thereunder. The Consolidated Amended Complaint also names certain underwriters of Caliper's December 1999 initial public offering of common stock as defendants. The Complaint alleges that these underwriters charged excessive, undisclosed commissions to investors and entered into improper agreements with investors relating to aftermarket transactions. The Complaint seeks an unspecified amount of money damages. Caliper and the other issuers named as defendants in the IPO Lawsuits moved on July 15, 2002, to dismiss all claims on multiple grounds. By Stipulation and Order dated October 9, 2002, the claims against Messrs. Milligan, Kisner and Knighton were dismissed without prejudice. On February 19, 2003, the Court granted Caliper's motion to dismiss all claims against it. Plaintiffs were not given the right to replead the claims against Caliper. The time to appeal the dismissal has not yet expired. On December 5, 2006 the Court of Appeals for the Second Circuit issued an opinion reversing Judge
F-39
CALIPER LIFE SCIENCES, INC.
NOTES TO CONSOLIDATED FINANCIAL STATEMENTS (Continued)
16. Legal Proceedings (Continued)
Scheindlin's prior certification of the plaintiff classes in several "focus" cases pending before her as part of the consolidated IPO Lawsuits. As a result of this ruling, on June 25, 2007, Judge Scheindlin issued an order terminating the settlement that had previously been agreed to among the plaintiffs, the issuers and their insurers. The parties in the "focus" cases subsequently briefed plaintiffs' motion seeking certification of a new class of plaintiffs; that motion was withdrawn without prejudice on October 10, 2008. It is Caliper's understanding that the parties to this litigation are negotiating a global settlement of the claims at issue in this litigation. The final resolution of this litigation is not expected to have a material impact on Caliper.
Previously, Caliper was party to a lawsuit brought by AntiCancer, Inc. against Xenogen Corporation (now a wholly owned subsidiary of Caliper) in 2005, which initially alleged that Xenogen infringed five patents of AntiCancer. Xenogen counterclaimed against AntiCancer in 2005, alleging that AntiCancer infringed four of Xenogen's patents. The case was scheduled to proceed to a Markman hearing in May 2008. However, on February 25, 2008, Caliper and AntiCancer entered into a settlement agreement pursuant to which the parties agreed to dismiss with prejudice all claims and counterclaims brought against each other in connection with this litigation. In connection with the settlement agreement, Caliper and AntiCancer also entered into a cross-licensing agreement. Under the cross-license agreement Caliper acquired the right to sublicense AntiCancer's fluorescent protein optical imaging patents to third-parties, alongside Caliper's own portfolio of in vivo fluorescent and bioluminescent optical imaging patents, and AntiCancer acquired the right to sublicense Caliper's optical imaging patents, in the field of fluorescent protein imaging, to a specified annual number of third parties throughout the life of the cross-license agreement, alongside AntiCancer's own fluorescent protein optical imaging patents. In addition, each company received a royalty free license from the other for internal and contract research operations. Under the cross-license agreement, Caliper and AntiCancer will share in any revenues generated by the licensing of their proprietary imaging technologies in the field of fluorescent protein imaging. No other payments will be made for either the settlement or cross-licensing agreements.
Caliper had been engaged in litigation in New York State Supreme Court with Young & Partners LLC (Young), an investment banking firm that was engaged by Caliper between August 2004 and September 2005, regarding whether Caliper owed a fee to Young for Caliper's acquisition of Xenogen Corporation, which closed in August 2006. The lawsuit was filed by Young in October 2006. Young sought payment of the fee that it believed it was owed, approximately $1.1 million, plus accrued interest, and payment of attorneys' fees. A two-day bench trial regarding this dispute was held on February 7 and 8, 2008. On April 2, 2008, Caliper settled this litigation with Young. In connection with this settlement, Caliper paid approximately $1.4 million to Young in full settlement and release of all claims. This amount was accrued for in full at December 31, 2007.
On January 23, 2009, Caliper filed and served a patent infringement suit against Shimadzu Corporation and its U.S. subsidiary, Shimadzu Scientific Instruments, Inc., in the United States District Court for the Eastern District of Texas. In this suit, Caliper alleges that Shimadzu's MCE-202 MultiNA instrument system, which performs electrophoretic separations analysis of nucleic acids, infringes 11 different U.S. patents owned by Caliper. Shimadzu is not required to file an answer to this complaint until March 17, 2009.
From time to time Caliper is involved in litigation arising out of claims in the normal course of business, and when a probable loss contingency arises, records a loss provision based upon actual or
F-40
CALIPER LIFE SCIENCES, INC.
NOTES TO CONSOLIDATED FINANCIAL STATEMENTS (Continued)
16. Legal Proceedings (Continued)
possible claims and assessments. The amount of possible claim recorded is determined on the basis of the amount of the actual claim, when the amount is both probable and the amount of the claim can be reasonably estimated. If a loss is deemed probable, but the range of potential loss is wide, Caliper records a loss provision based upon the low end estimate of the probable range and may adjust that estimate in future periods as more information becomes available. Litigation loss provisions, when made, are reflected within general and administrative expenses in our statement of operations and are included within accrued legal expenses in the accompanying balance sheet. Based on the information presently available, management believes that there are no outstanding claims or actions pending or threatened against Caliper, the ultimate resolution of which will have a material adverse effect on our financial position, liquidity or results of operations, although the results of litigation are inherently uncertain, and adverse outcomes are possible.
17. Geographic Data
SFAS No. 131,Disclosures about Segments of an Enterprise and Related Information, establishes standards for reporting information regarding operating segments in annual financial statements and requires selected information of those segments to be presented in interim financial reports issued to stockholders. Operating segments are identified as components of an enterprise about which separate discrete financial information is available for evaluation by the chief operating decision-maker, or decision-making group, in making decisions of how to allocate resources and assess performance. Caliper's chief decision maker, as defined under SFAS No. 131, is the chief executive officer. Caliper views its operations and manages its business as one operating segment.
F-41
CALIPER LIFE SCIENCES, INC.
NOTES TO CONSOLIDATED FINANCIAL STATEMENTS (Continued)
17. Geographic Data (Continued)
The table below presents Caliper's activities by geographical location (in thousands). Caliper attributes revenue to geographic locations based upon customer service and business development activities.
| | 2008 | 2007 | 2006 | ||||||||
|---|---|---|---|---|---|---|---|---|---|---|---|
Revenue: | |||||||||||
United States | $ | 77,335 | $ | 88,262 | $ | 67,614 | |||||
Europe | 37,689 | 34,117 | 28,244 | ||||||||
Asia | 16,055 | 16,104 | 9,516 | ||||||||
Other | 2,975 | 2,224 | 2,497 | ||||||||
| $ | 134,054 | $ | 140,707 | $ | 107,871 | ||||||
Net loss: | |||||||||||
United States | $ | (71,415 | ) | $ | (31,806 | ) | $ | (33,484 | ) | ||
Europe | 1,007 | 1,330 | 2,263 | ||||||||
Asia | 1,832 | 6,169 | 1,971 | ||||||||
Other | 284 | 227 | 316 | ||||||||
| $ | (68,292 | ) | $ | (24,080 | ) | $ | (28,934 | ) | |||
Property and equipment, net: | |||||||||||
United States | $ | 10,576 | $ | 11,249 | $ | 12,973 | |||||
Europe | 148 | 224 | 204 | ||||||||
Asia | 11 | 4 | 5 | ||||||||
| $ | 10,735 | $ | 11,477 | $ | 13,182 | ||||||
Net Assets: | |||||||||||
United States | $ | 70,621 | $ | 138,968 | $ | 155,486 | |||||
Europe | 4,624 | 3,898 | 2,985 | ||||||||
Asia | 824 | (2,222 | ) | (1,522 | ) | ||||||
Other | 669 | 542 | 460 | ||||||||
| $ | 76,738 | $ | 141,186 | $ | 157,409 | ||||||
For all periods presented, no individual country within Europe, Asia or other exceeded 10% of the consolidated totals for revenue, net loss, property and equipment and net assets. Caliper's other long-lived assets include restricted cash, goodwill, intangible assets and other assets which are primarily located in the United States.
18. Quarterly Financial Data (Unaudited)
The following table sets forth a summary of our unaudited quarterly operating results for each of the eight quarters up through the year ended December 31, 2008. This data has been derived from our unaudited consolidated interim financial statements which, in our opinion, have been prepared in substantially the same basis as the audited consolidated financial statements contained elsewhere in this Annual Report on Form 10-K and include all normal recurring adjustments necessary for a fair presentation of the financial information for the periods presented. These unaudited quarterly results should be read in conjunction with our consolidated financial statements and notes thereto included in
F-42
CALIPER LIFE SCIENCES, INC.
NOTES TO CONSOLIDATED FINANCIAL STATEMENTS (Continued)
18. Quarterly Financial Data (Unaudited) (Continued)
this Annual Report on Form 10-K. The operating results in any quarter are not necessarily indicative of the results that may be expected for any future period.
| | First Quarter | Second Quarter | Third Quarter | Fourth Quarter | |||||||||
|---|---|---|---|---|---|---|---|---|---|---|---|---|---|
Year ended December 31, 2008 | |||||||||||||
Total revenue | $ | 29,287 | $ | 34,031 | $ | 34,041 | $ | 36,695 | |||||
Gross profit(1) | 11,800 | 14,070 | 14,880 | 14,910 | |||||||||
Operating loss | (10,160 | ) | (6,191 | ) | (4,757 | ) | (48,423 | ) | |||||
Net loss | (9,936 | ) | (6,682 | ) | (5,396 | ) | (46,278 | ) | |||||
Basic and diluted loss per share | $ | (0.21 | ) | $ | (0.14 | ) | $ | (0.11 | ) | $ | (0.96 | ) | |
Year ended December 31, 2007 | |||||||||||||
Total revenue | $ | 28,440 | $ | 35,290 | $ | 36,721 | $ | 40,256 | |||||
Gross profit(1) | 8,571 | 11,972 | 11,887 | 15,971 | |||||||||
Operating loss | (9,566 | ) | (5,996 | ) | (2,648 | ) | (5,618 | ) | |||||
Net loss | (9,597 | ) | (6,320 | ) | (2,428 | ) | (5,735 | ) | |||||
Basic and diluted loss per share | $ | (0.20 | ) | $ | (0.13 | ) | $ | (0.05 | ) | $ | (0.13 | ) | |
- (1)
- Gross profit refers to total product and service revenue, less costs associated with those revenues. Costs related to contract revenues are included within research and development expenses in the accompanying statements of operations.
The quarterly financial data presented above includes a reclassification of SFAS 123R related compensation charges from stock-based compensation, as previously reported, to the individual expense line items within the accompanying statement of operations.
F-43
Caliper Life Sciences, Inc.
Schedule II—VALUATION AND QUALIFYING ACCOUNTS
| | Balance at Beginning Period | Additions Charged to Costs and Expenses | Deductions | Balance at End of Period | |||||||||
|---|---|---|---|---|---|---|---|---|---|---|---|---|---|
| | (In thousands) | ||||||||||||
Year ended December 31, 2008: | |||||||||||||
Allowance for doubtful accounts | $ | 1,320 | $ | 139 | $ | 719 | $ | 740 | |||||
Valuation allowance for deferred tax assets | 114,245 | 4,025 | — | 118,270 | |||||||||
| $ | 115,565 | $ | 4,164 | $ | 719 | $ | 119,010 | ||||||
Year ended December 31, 2007: | |||||||||||||
Allowance for doubtful accounts | $ | 582 | $ | 793 | $ | 55 | $ | 1,320 | |||||
Valuation allowance for deferred tax assets | 106,525 | 7,720 | — | 114,245 | |||||||||
| $ | 107,107 | $ | 8,513 | $ | 55 | $ | 115,565 | ||||||
Year ended December 31, 2006: | |||||||||||||
Allowance for doubtful accounts | $ | 482 | $ | 148 | $ | 48 | $ | 582 | |||||
Valuation allowance for deferred tax assets | 64,148 | 42,377 | — | 106,525 | |||||||||
| $ | 64,630 | $ | 42,525 | $ | 48 | $ | 107,107 | ||||||
F-44
Exhibits:
| Exhibit Number | Description of Document | ||
|---|---|---|---|
| 2.1(14) | Stock Purchase Agreement, by and among Caliper, Berwind Corporation and The Berwind Company LLC, dated June 9, 2003. | ||
2.2(14) | Amendment No. 1 to the Stock Purchase Agreement, by and among Caliper, Berwind Corporation and The Berwind Company LLC, dated July 10, 2003. | ||
2.3(17) | Amendment No. 2 to the Stock Purchase Agreement, by and among Caliper, Berwind Corporation and The Berwind Company LLC, dated April 1, 2004. | ||
2.4(18) | Agreement and Plan of Merger, among Caliper Life Sciences, Inc., Caliper Services, Inc. and NovaScreen Biosciences Corporation, dated as of September 7, 2005. | ||
2.5(22) | Agreement and Plan of Merger, among Caliper Life Sciences, Inc., Caliper Holdings, Inc. and Xenogen Corporation, dated as of February 10, 2006. | ||
2.6(21) | Asset Sale and Purchase Agreement, dated as of October 29, 2008, by and between Sotax Corporation and Caliper Life Sciences, Inc. | ||
2.7(21) | Asset Purchase Agreement, dated as of November 10, 2008, by and between Dionex Corporation and Caliper Life Sciences, Inc. | ||
3.1(17) | Amended and Restated Certificate of Incorporation of Caliper. | ||
3.2(7) | Certificate of Designation of Series A Junior Participating Preferred Stock. | ||
3.3(25) | Amended and Restated Bylaws of Caliper. | ||
4.1 | Reference is made to Exhibits 3.1, 3.2, 3.3 and 3.4. | ||
4.11(26) | Registration Rights Agreement by and between Caliper and The Berwind Company LLC, dated as of December 18, 2007. | ||
4.2(19) | Specimen Stock Certificate. | ||
4.3(8) | Rights Agreement, dated as of December 18, 2001, between Caliper and Wells Fargo Bank Minnesota, N.A., as Rights Agent. | ||
10.1(1) | Lease Agreement, dated December 1, 1998, between Caliper and 605 East Fairchild Associates, L.P. | ||
10.2(1)(2) | 1996 Equity Incentive Plan. | ||
10.3(1)(2) | 1999 Equity Incentive Plan. | ||
10.4(1)(2) | 1999 Employee Stock Purchase Plan. | ||
10.5(2)(23) | 1999 Non-Employee Directors' Stock Option Plan. | ||
10.6(2)(19) | Form of Grant Agreement for 1999 Equity Incentive Plan—Option Awards. | ||
10.7(2)(19) | Form of Grant Agreement for 1999 Equity Incentive Plan—Restricted Stock Unit Awards. | ||
10.8(2)(19) | Form of Grant Agreement for 1999 Non-Employee Directors' Stock Option Plan. | ||
10.9(1)(2) | Form of Indemnification Agreement entered into between Caliper and its directors and executive officers. | ||
10.10(1)(3) | Collaboration Agreement, dated May 2, 1998, between Caliper and Hewlett-Packard Company (now Agilent Technologies, Inc.). | ||
| Exhibit Number | Description of Document | ||
|---|---|---|---|
| 10.11(2)(19) | Form of Stock Option Grant Agreement for Acquisition Equity Incentive Plan. | ||
10.12(2)(19) | Form of Stock Award Agreement for Acquisition Equity Incentive Plan (pro rata vesting). | ||
10.13(2)(19) | Form of Stock Award Agreement for Acquisition Equity Incentive Plan (5 year cliff vesting). | ||
10.14 | Lease Agreement, dated as of April 25, 2005, between Caliper and BCIA New England Holdings LLC. | ||
10.17(2)(19) | Non-Employee Directors' Cash Compensation Plan. | ||
10.18(2)(10) | Caliper Performance Bonus Plan. | ||
10.20(2)(10) | Summary Cash Compensation Sheet. | ||
10.23(1)(2) | The Corporate Plan for Retirement Select Plan Adoption Agreement and related Basic Plan Document. | ||
10.27(5) | Lease Agreement, dated June 23, 2000 and effective July 5, 2000, between Caliper and Martin CBP Associates, L.P. | ||
10.29(2) | Key Employee Change of Control and Severance Benefit Plan. | ||
10.30(4)(7) | Cross-License Agreement, dated March 12, 2001 between Aclara Biosciences, Inc. and Caliper. | ||
10.32(3)(6) | Settlement Agreement and Mutual General Release dated March 12, 2001 between Aclara Biosciences, Inc. and Caliper. | ||
10.39(2)(8) | 2001 Non-Statutory Stock Option Plan. | ||
10.46(2)(19) | Form of Grant Agreement for 2001 Non-Statutory Stock Option Plan. | ||
10.48(2)(9) | Key Employee Agreement, dated July 1, 2002, between Caliper and Dr. Daniel Kisner. | ||
10.52(3)(15) | Sole Commercial Patent License Agreement, effective September 1, 1995, between UT-Battelle, LLC, the successor to Lockheed Martin Energy Research Corporation, and Caliper, as amended on November 1, 2002. | ||
10.55(3)(11) | Collaboration Agreement, dated June 4, 2003, between Caliper and Bio-Rad Laboratories, Inc. | ||
10.56(2)(12) | Key Employee Agreement, dated July 14, 2003, between Caliper and E. Kevin Hrusovsky. | ||
10.62(2)(13) | Acquisition Equity Incentive Plan. | ||
10.63(2)(16) | Key Employee Agreement Amendment, dated December 24, 2003, between Caliper and Dr. Daniel L. Kisner. | ||
10.64(2)(16) | Consulting Agreement, dated January 1, 2004, between Caliper and Dr. David V. Milligan. | ||
10.66(3)(16) | Collaboration and Supply Agreement, dated January 9, 2004, among Caliper, Zymark Corporation and Affymetrix, Inc. | ||
10.67(2) | Offer Letter dated September 7, 2005 between Caliper Life Sciences, Inc. and David M. Manyak, Ph.D. | ||
10.68(27) | Loan and Security Agreement, dated as of August 9, 2006, by and among Caliper, Silicon Valley Bank and NovaScreen Biosciences Corporation. | ||
| Exhibit Number | Description of Document | ||
|---|---|---|---|
| 10.69(28) | Joinder Agreement, dated as of September 28, 2006, by and among Caliper, Silicon Valley Bank, Xenogen Corporation, Xenogen Biosciences Corporation, and NovaScreen Biosciences Corporation. | ||
10.70(29) | First Loan Modification Agreement dated as of February 26, 2007, by and among Caliper, Silicon Valley Bank, NovaScreen Biosciences Corporation, Xenogen Corporation, and Xenogen Biosciences Corporation. | ||
10.71(20)(3) | Agreement, dated as of May 5, 2000, between the Board of Trustees of the Leland Stanford Junior University and Xenogen Corporation. | ||
10.72(2) | Consulting Agreement, dated as of October 17, 2006, between Caliper and Pamela Contag. | ||
10.73(30) | Amended and Restated Loan and Security Agreement, dated as of February 15, 2008, by and among Caliper, Silicon Valley Bank, Xenogen Corporation, Xenogen Biosciences Corporation and NovaScreen Biosciences Corporation. | ||
10.74(31) | Amendment to Lease Agreement dated as of March 18, 2008, by and between 605 Fairchild Associates, L.P., as landlord, and Caliper Life Sciences, Inc., as tenant. | ||
10.75(32) | Consulting Agreement, dated March 10, 2008, between Caliper and Dr. Daniel Kisner. | ||
10.76(33) | Separation Agreement dated April 4, 2008, between Caliper and Mr. Thomas Higgins. | ||
10.77(34) | Consulting Agreement, dated April 5, 2008, between Caliper and Mr. Thomas Higgins. | ||
10.78(35) | Amendment to Lease Agreement dated as of June 27, 2008, by and between Cedar Brook 5 Corporate Center, L.P., as landlord and Caliper Life Sciences, Inc., as tenant. | ||
21.1(24) | Subsidiaries of the Registrant. | ||
23.1 | Consent of Ernst & Young LLP, Independent Registered Public Accounting Firm. | ||
24.1 | Power of Attorney (reference is made to the signature page of this report). | ||
31.1 | Certification of Chief Executive Officer pursuant to Rule 13a-14(a) and 15d-14(a) | ||
31.2 | Certification of Chief Financial Officer pursuant to Rule 13a-14(a) and 15d-14(a). | ||
32.1 | Certification Pursuant to 18 U.S.C. Section 1350, as adopted pursuant to Section 906 of the Sarbanes-Oxley Act of 2002. | ||
32.2 | Certification Pursuant to 18 U.S.C. Section 1350, as adopted pursuant to Section 906 of the Sarbanes-Oxley Act of 2002. | ||
- (1)
- Previously filed as the like-numbered Exhibit to our Registration Statement on Form S-1, as amended, File No. 333-88827, filed on October 12, 1999 and incorporated by reference herein.
- (2)
- Management contract or compensatory plan or arrangement.
- (3)
- Confidential treatment has been granted for certain portions of this exhibit, which portions have been omitted and filed separately with the Securities and Exchange Commission.
- (4)
- Previously filed as the like-numbered exhibit to Annual Report of Form 10-K for the year ended December 31, 1999 and incorporated by reference herein.
- (5)
- Previously filed as the like-numbered Exhibit to our Registration Statement on Form S-1, as amended, File No. 333-45942, filed on September 15, 2000, and incorporated by reference herein.
- (6)
- Previously filed as the like-numbered Exhibit to Form 10-Q for the quarterly period ended March 31, 2001 and incorporated by reference herein.
- (7)
- Previously filed as Exhibit 99.1 to Current Report on Form 8-K filed December 19, 2001 and incorporated by reference herein.
- (8)
- Previously filed as Exhibit 99.1 to our Registration Statement on Form S-8, File No. 333-76636, filed January 11, 2002 and incorporated by reference herein.
- (9)
- Previously filed as the like-numbered Exhibit to Form 10-Q for the quarterly period ended September 30, 2002 and incorporated by reference herein.
- (10)
- Previously filed as the like-numbered Exhibit to Current Report on Form 8-K filed March 16, 2005 and incorporated by reference herein.
- (11)
- Previously filed as the like-numbered Exhibit to Form 10-Q for the quarterly period ended June 30, 2003 and incorporated by reference herein.
- (12)
- Previously filed as the like-numbered Exhibit to Form 10-Q for the quarterly period ended September 30, 2003 and incorporated by reference herein.
- (13)
- Previously filed as Exhibit 99.1 to our Registration Statement on Form S-8, File No. 333-106946, filed June 10, 2003 and incorporated by reference herein.
- (14)
- Previously filed as the like-numbered Exhibit to Form 8-K filed July 25, 2003 and incorporated by reference herein.
- (15)
- Previously filed as the like-numbered Exhibit to Form 10-K for the year ended December 31, 2002 and incorporated by reference herein.
- (16)
- Previously filed as the like-numbered Exhibit to Form 10-K for the year ended December 31, 2003 and incorporated by reference herein.
- (17)
- Previously filed as the like-numbered Exhibit to Form 10-Q for the quarterly period ended March 31, 2004 and incorporated by reference herein.
- (18)
- Previously filed as Exhibit 2.1 to our Registration Statement on Form S-3, File No. 333-129192, filed October 21, 2005 and incorporated by reference herein.
- (19)
- Previously filed as the like-numbered Exhibit to Form 10-K for the year ended December 31, 2004 and incorporated by reference herein.
- (20)
- Previously filed as Exhibit 10.3 to Form 10-Q for the quarterly period ended September 30, 2006 and incorporated by reference herein.
- (21)
- Confidential treatment has been requested for certain portions of this exhibit which portions have been omitted and filed separately with the Securities and Exchange Commission.
- (22)
- Previously filed as the like numbered Exhibit to Form 10-K for the year ended December 31, 2005 and incorporated by reference herein.
- (23)
- Previously filed as Exhibit 10.2 to Form 10-Q for the quarterly period ended June 30, 2007 and incorporated by reference herein.
- (24)
- Previously filed as the like numbered Exhibit to Form 10-K for the year ended December 31, 2006 and incorporated by reference herein.
- (25)
- Previously filed as Exhibit 3.1 to Current Report on Form 8-K filed on March 2, 2007 and incorporated by reference herein.
- (26)
- Previously filed as the like-numbered Exhibit to our Registration Statement on Form S-3, as amended, File No. 333-147571, filed on November 21, 2007 and incorporated by reference herein.
- (27)
- Previously filed as Exhibit 10.1 to Form 10-Q for the quarterly period ended September 30, 2006 and incorporated by reference herein.
- (28)
- Previously filed as Exhibit 10.2 to Form 10-Q for the quarterly period ended September 30, 2006 and incorporated by reference herein.
- (29)
- Previously filed as Exhibit 10.1 to Form 8-K filed March 2, 2007 and incorporated by reference herein.
- (30)
- Previously filed as Exhibit 10.2 to Form 10-Q for the quarterly period ended June 30, 2008 and incorporated by reference herein.
- (31)
- Previously filed as Exhibit 10.1 to Form 10-Q for the quarterly period ended March 31, 2008 and incorporated by reference herein.
- (32)
- Previously filed as Exhibit 10.2 to Form 10-Q for the quarterly period ended March 31, 2008 and incorporated by reference herein.
- (33)
- Previously filed as Exhibit 10.3 to Form 10-Q for the quarterly period ended March 31, 2008 and incorporated by reference herein.
- (34)
- Previously filed as Exhibit 10.4 to Form 10-Q for the quarterly period ended March 31, 2008 and incorporated by reference herein.
- (35)
- Previously filed as Exhibit 10.1 to Form 10-Q for the quarterly period ended June 30, 2008 and incorporated by reference herein.