Exhibit 99.2

© 2025 OPTION CARE HEALTH, INC. ALL RIGHTS RESERVED EXTRAORDINARY CARE THAT CHANGES LIVES January 2025 J.P. MORGAN HEALTHCARE CONFERENCE 1

© 2025 OPTION CARE HEALTH, INC. ALL RIGHTS RESERVED Disclaimers Forward - Looking Statements This presentation may contain “forward - looking statements” within the meaning of the safe harbor provisions of the U.S. Private Securities Litigation Reform Act of 1995. Forward - looking statements can be identified by words such as: “anticipate,” “intend,” “plan,” “b elieve,” “project,” “estimate,” “expect,” “may,” “should,” “will” and similar references to future periods. Examples of forward - looking s tatements include, among others, statements we may make regarding future revenues, future earnings, other future financial results, reg ula tory developments, market developments, new products and growth strategies, and the effects of any of the foregoing on our future res ults of operations or financial conditions. Forward - looking statements are neither historical facts nor assurances of future performance. Instead, they are based only on ou r current beliefs, expectations and assumptions regarding the future of our business, future plans and strategies, projections, anticip ate d events and trends, the economy and other future conditions. Because forward - looking statements relate to the future, they are subject to in herent uncertainties, risks and changes in circumstances that are difficult to predict and many of which are outside of our control. Our actual results and financial condition may differ materially from those indicated in the forward - looking statements. Importa nt factors that could cause our actual results and financial condition to differ materially from those indicated in the forward - looking sta tements include, among others, the following: ( i ) changes in laws and regulations applicable to our business model; (ii) changes in market conditions and receptivity to our services and offerings; (iii) pending and future litigation; (iv) potential liability for claims not c ove red by insurance; and (v) loss of relationships with managed care organizations and other non - governmental third party payers. For a detailed discussi on of the risk factors that could affect our actual results, please refer to the risk factors identified in our reports as filed with t he SEC. Any forward - looking statement made by us in this presentation is based only on information currently available to us and speaks only as of the date on which it is made. We undertake no obligation to publicly update any forward - looking statement, whether written or or al, that may be made from time to time, whether as a result of new information, future developments or otherwise. 2

© 2025 OPTION CARE HEALTH, INC. ALL RIGHTS RESERVED Disclaimers Non - GAAP Measures In addition to reporting financial information in accordance with generally accepted accounting principles (“GAAP”), we are a lso reporting Adjusted net income, Adjusted EBITDA, and Adjusted earnings per share ("Adjusted EPS"), each of which are non - GAAP financial measures. These adjusted measures are not measurements of financial performance under GAAP and should not be used in isolation or as a substitute or alternative to net income, earnings per shar e, or any other performance measure derived in accordance with GAAP, or as a substitute or alternative to cash flow from operating activities or a measure of our liquidity. In addition, our definitions of Adjusted net income, Adjusted EBITDA, and Adjusted EPS may not be comparable to similarly titled non - GAAP financial measures reported by other compan ies. As defined by us: ( i ) Adjusted net income represents net income before intangible asset amortization expense, stock - based compensation expense, and restructuring, acquisition, integration and other expenses, net of tax adjustments, (ii) Adjusted EBITDA represents net income before net interest expense, income tax expense, depreciat ion and amortization, stock - based compensation expense, loss on extinguishment of debt, and restructuring, acquisition, integration and other expenses; and (iii) Adjusted E PS represents Adjusted net income divided by weighted average common shares outstanding, diluted. As part of restructuring, acquisition, integration and other expenses, w e m ay incur significant charges such as the write down of certain long - lived assets, temporary redundant expenses, professional fees, certain litigation expenses and reserves rel ated to acquired businesses, potential retention and severance costs and potential accelerated payments or termination costs for certain of its contractual obligations. Manag eme nt believes that these adjusted measures provide useful supplemental information regarding the performance of our business operations and facilitate comparisons to ou r h istorical operating results. We have not reconciled Adjusted EBITDA and Adjusted EPS guidance to net income as management believes creation of this reconciliation wou ld not be practicable due to the uncertainty regarding, and potential variability of, material reconciling items. Full reconciliations of each adjusted measure to the mos t c omparable GAAP financial measure are set forth at the end of this presentation. Preliminary Unaudited Financial Data The preliminary financial information included in this presentation is subject to completion of our year - end close procedures an d further financial review. We have provided ranges, rather than specific amounts, because these results are preliminary and subject to change. Actual results may differ fro m these estimates as a result of the completion of our year - end closing procedures, review adjustments and other developments that may arise between now and the time such financia l information for the period is finalized. As a result, these estimates are preliminary, may change and constitute forward - looking information and, as a result, are subject t o risks and uncertainties. These preliminary estimates should not be viewed as a substitute for full financial statements prepared in accordance with GAAP, and they shoul d n ot be viewed as indicative of our results for any future period. Our independent registered public accounting firm has not audited, reviewed, compiled, or performed any proced ure s with respect to these estimated financial results and, accordingly, does not express an opinion or any other form of assurance with respect to these preliminary estima tes . 3

© 2025 OPTION CARE HEALTH, INC. ALL RIGHTS RESERVED OPCH AT A GLANCE ▪ A leading independent provider of home and alternate site infusion services licensed in all 50 states ▪ Infrastructure that supports a broad set of clinical services across a variety of care sites ▪ Proven track record of integrating and leveraging high - quality, strategic M&A ▪ Consistent strong cash flow generation and attractive capital structure 4 Stand - alone AIS and/or AIC Care Management Center 1 Improving the Home and Alternate Site Infusion Experience BUILDING A RESILIENT FULL - SERVICE NETWORK AROUND INFUSION CARE SERVING 285,000+ PATIENTS ANNUALLY 3 1 Care Management Center (CMC) is defined as a location with both a pharmacy and AIS. This count includes a small number of sta nd - alone pharmacies. 2 Reflects data as of December 31, 2024 3 Reflects full - year 2024 data EXPANSIVE FOOTPRINT 2 DIVERSE PORTFOLIO 2 700+ infusion chairs 5,000+ multidisciplinary clinicians 90+ full - service pharmacies Top 10 payers in - network 170+ locations in the U.S. 50+ limited distribution therapies See Recent Highlights
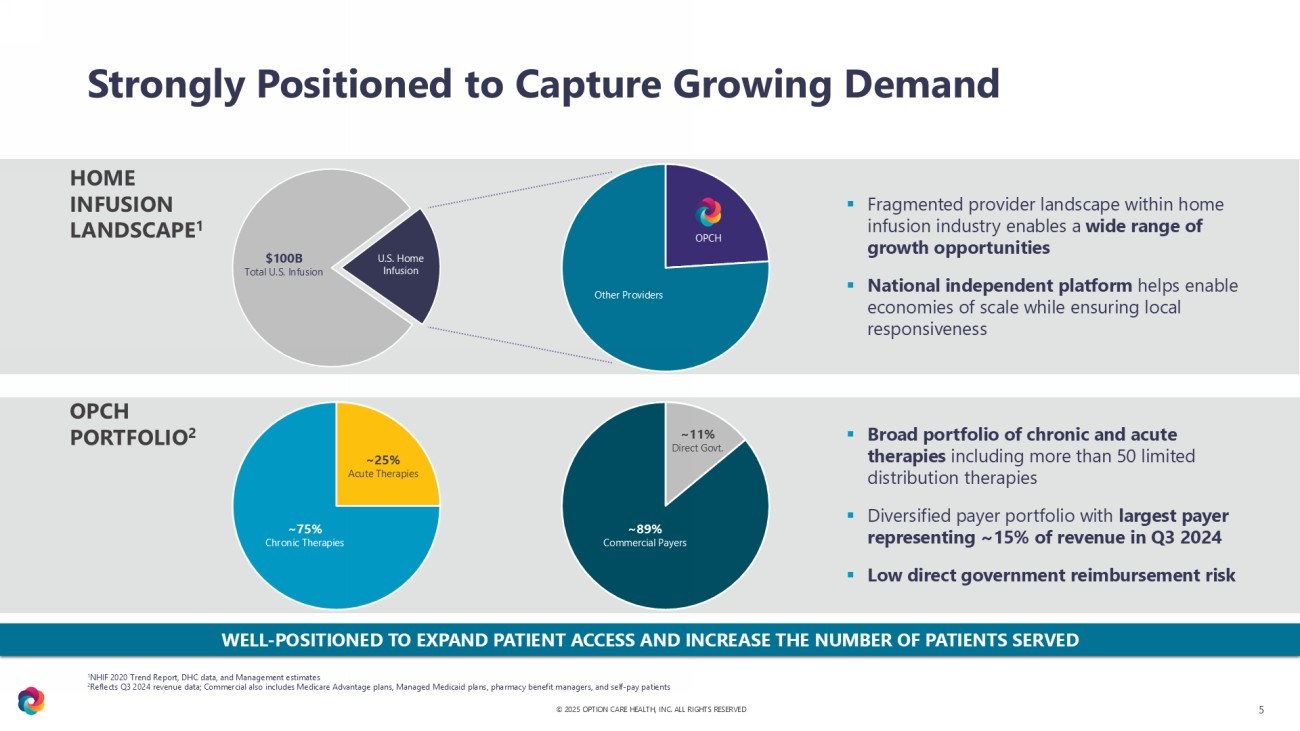
© 2025 OPTION CARE HEALTH, INC. ALL RIGHTS RESERVED Strongly Positioned to Capture Growing Demand 5 WELL - POSITIONED TO EXPAND PATIENT ACCESS AND INCREASE THE NUMBER OF PATIENTS SERVED 1 NHIF 2020 Trend Report, DHC data, and Management estimates 2 Reflects Q3 2024 revenue data; Commercial also includes Medicare Advantage plans, Managed Medicaid plans, pharmacy benefit ma nag ers, and self - pay patients ▪ Fragmented provider landscape within home infusion industry enables a wide range of growth opportunities ▪ National independent platform helps enable economies of scale while ensuring local responsiveness U.S. Home Infusion $100B Total U.S. Infusion Other Providers OPCH ▪ Broad portfolio of chronic and acute therapies including more than 50 limited distribution therapies ▪ Diversified payer portfolio with largest payer representing ~15% of revenue in Q3 2024 ▪ Low direct government reimbursement risk ~75% Chronic Therapies ~25% Acute Therapies ~89% Commercial Payers ~11% Direct Govt. HOME INFUSION LANDSCAPE 1 OPCH PORTFOLIO 2
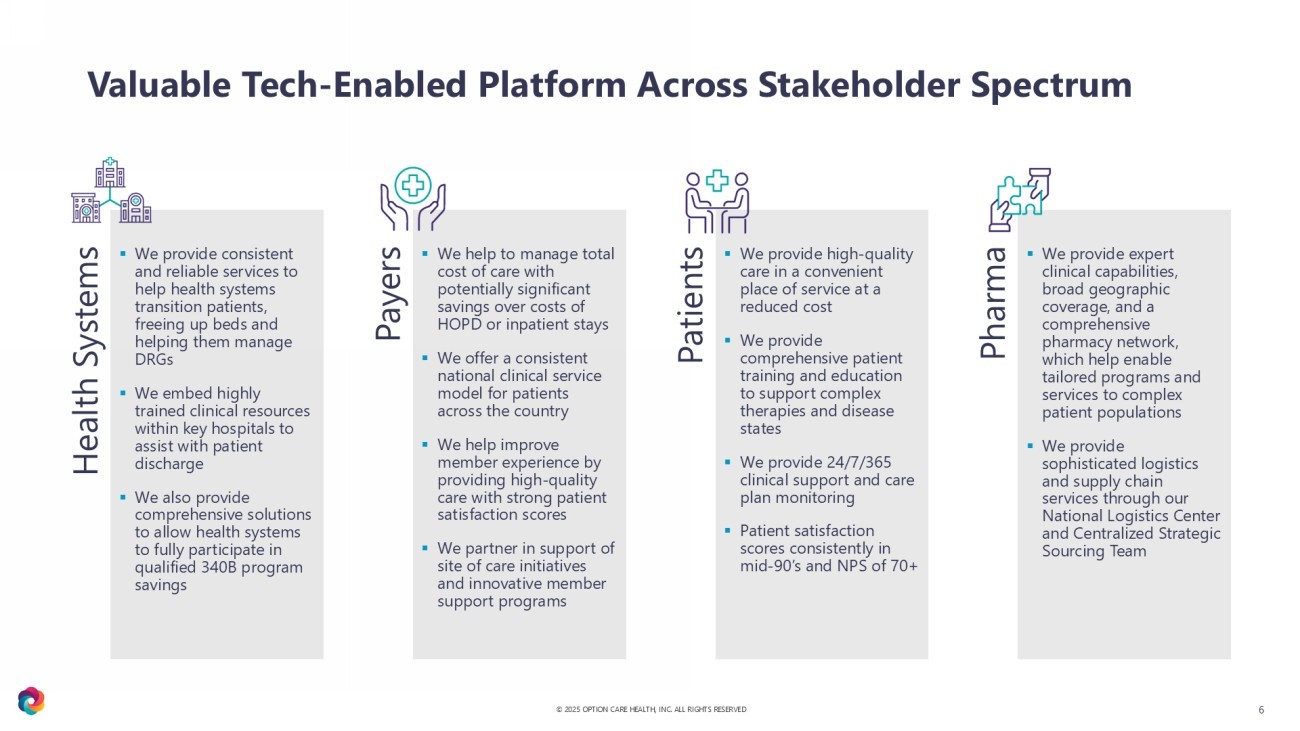
© 2025 OPTION CARE HEALTH, INC. ALL RIGHTS RESERVED Valuable Tech - Enabled Platform Across Stakeholder Spectrum 6 Health Systems ▪ We provide consistent and reliable services to help health systems transition patients, freeing up beds and helping them manage DRGs ▪ We embed highly trained clinical resources within key hospitals to assist with patient discharge ▪ We also provide comprehensive solutions to allow health systems to fully participate in qualified 340B program savings Payers ▪ We help to manage total cost of care with potentially significant savings over costs of HOPD or inpatient stays ▪ We offer a consistent national clinical service model for patients across the country ▪ We help improve member experience by providing high - quality care with strong patient satisfaction scores ▪ We partner in support of site of care initiatives and innovative member support programs Patients ▪ We provide high - quality care in a convenient place of service at a reduced cost ▪ We provide comprehensive patient training and education to support complex therapies and disease states ▪ We provide 24/7/365 clinical support and care plan monitoring ▪ Patient satisfaction scores consistently in mid - 90’s and NPS of 70+ Pharma ▪ We provide expert clinical capabilities, broad geographic coverage, and a comprehensive pharmacy network, which help enable tailored programs and services to complex patient populations ▪ We provide sophisticated logistics and supply chain services through our National Logistics Center and Centralized Strategic Sourcing Team

© 2025 OPTION CARE HEALTH, INC. ALL RIGHTS RESERVED Accelerated Financial Performance 7 CONSISTENT TRACK RECORD OF EXECUTION AND ATTRACTIVE GROWTH PROFILE 1 2024 unaudited preliminary estimated results reported January 13, 2025 2 CAGRs are based on midpoint of 2024 unaudited preliminary estimated range of results reported January 13, 2025 +13% 4 - YR CAGR 2 NET REVENUE $3.9B $3.4B $3.0B 2020 2021 2022 2023 2024 1 $4.3B $4.99B – $5.0B ACCRETIVE CAPITAL DEPLOYMENT Capex M&A Share Repurchase STRATEGIC CAPITAL DEPLOYMENT +19% 4 - YR CAGR 2 ADJUSTED EBITDA $343M $290M 8.5% 8.6% $222M 7.4% 9.8% $425M $441M – $444M 8.9% CONSISTENT CASH CONVERSION CASH FLOW FROM OPERATIONS $268M $209M $127M $371M At least $300M $27M $112M $123M $305M $285M 2020 2021 2022 2023 2024 1 2020 2021 2022 2023 2024 1 2020 2021 2022 2023 2024 1 2023 Cash Flow from Operations and Strategic Capital Deployment impacted by ~$63M net inflow from Amedisys termination fee
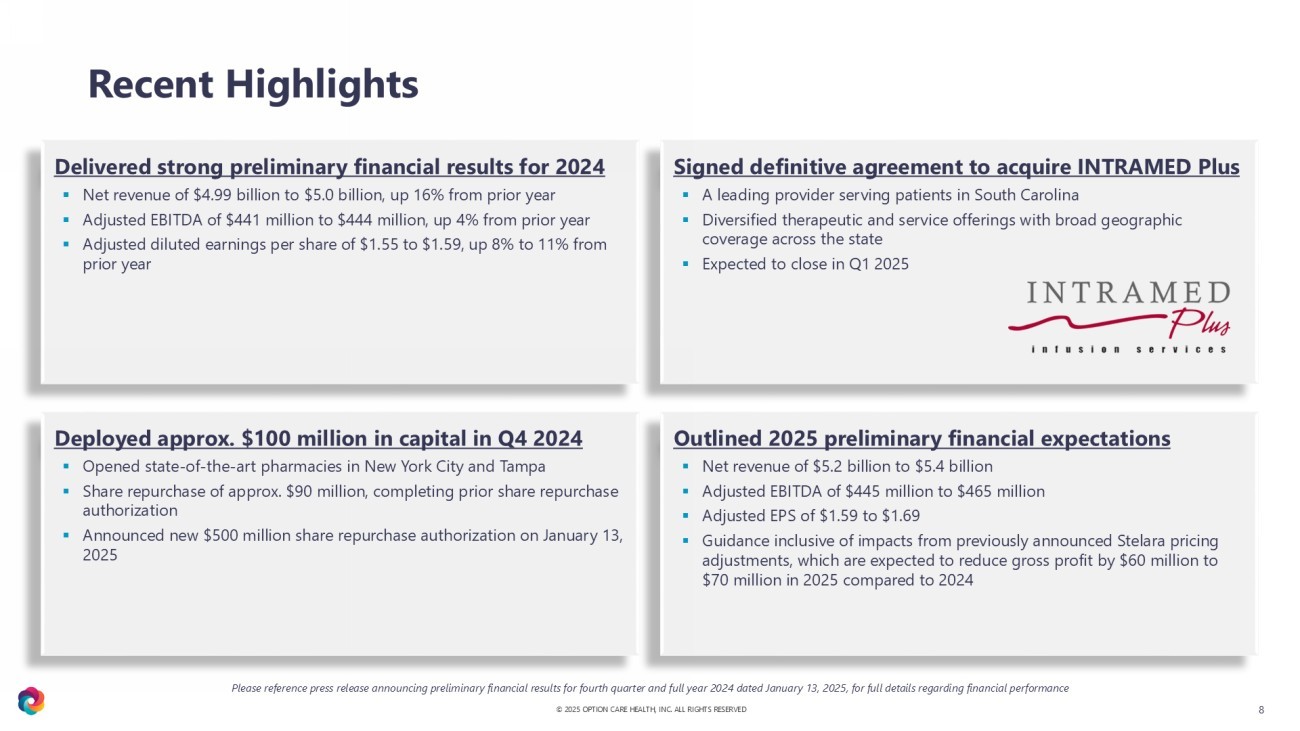
© 2025 OPTION CARE HEALTH, INC. ALL RIGHTS RESERVED Recent Highlights 8 Signed definitive agreement to acquire INTRAMED Plus ▪ A leading provider serving patients in South Carolina ▪ Diversified therapeutic and service offerings with broad geographic coverage across the state ▪ Expected to close in Q1 2025 Outlined 2025 preliminary financial expectations ▪ Net revenue of $5.2 billion to $5.4 billion ▪ Adjusted EBITDA of $445 million to $465 million ▪ Adjusted EPS of $1.59 to $1.69 ▪ Guidance inclusive of impacts from previously announced Stelara pricing adjustments, which are expected to reduce gross profit by $60 million to $70 million in 2025 compared to 2024 Delivered strong preliminary financial results for 2024 ▪ Net revenue of $4.99 billion to $5.0 billion, up 16% from prior year ▪ Adjusted EBITDA of $441 million to $444 million, up 4% from prior year ▪ Adjusted diluted earnings per share of $1.55 to $1.59, up 8% to 11% from prior year Deployed approx. $100 million in capital in Q4 2024 ▪ Opened state - of - the - art pharmacies in New York City and Tampa ▪ Share repurchase of approx. $90 million, completing prior share repurchase authorization ▪ Announced new $500 million share repurchase authorization on January 13, 2025 Please reference press release announcing preliminary financial results for fourth quarter and full year 2024 dated January 1 3, 2025, for full details regarding financial performance

© 2025 OPTION CARE HEALTH, INC. ALL RIGHTS RESERVED Diversified Revenue Base 9 Option Care Health operates one integrated network supporting a broad set of therap ies , which can be generally categorized as acute and chronic therapies REVENUE COMPOSITION 1 ▪ Primarily generic drugs ▪ Typical product margins of 50% - 70% 2 ▪ Significantly higher cost of service, supplies, and overhead than chronic therapies ▪ Average treatment cycle of 2 - 12 weeks with some longer duration patients ▪ Expected underlying therapy growth in low single digits Acute Therapies ▪ Branded and biosimilar therapies ▪ Typical product margins of 5% - 30% 2 ▪ Average treatment cycle greater than one year ▪ Overall growth expectation of low double digits with broad range of underlying growth profiles at therapy level ▪ All Other is a diverse category of branded and biosimilar therapies, none of which represents more than 3% of consolidated revenue Chronic Therapies NO THERAPY REPRESENTS MORE THAN 5% OF CONSOLIDATED REVENUE 3 1 Based on YTD September 2024 financial results 2 Product margin accounts for direct cost of goods but excludes cost of service, supplies, and overhead expenses 3 Excluding Stelara

© 2025 OPTION CARE HEALTH, INC. ALL RIGHTS RESERVED ▪ More than 75% of product margin generated by generic and biosimilar therapies that typically have more stable economics ▪ Branded therapies represent approximately half of revenue but less than 25% of product margin ▪ Branded therapy product evolutions typically have a larger effect on revenue than on product margin given lower gross margin profile of branded drugs 10 Balanced Revenue and Gross Profit 1 PRODUCT MARGIN COMPOSED PRIMARILY OF GENERIC AND BIOSIMILAR CATE GORIES REDUCES RISK OF VOLATILITY MOVING FORWARD REVENUE COMPOSITION PRODUCT MARGIN COMPOSITION 2 1 Based on YTD September 2024 financial results 2 Product margin accounts for direct cost of goods but excludes cost of service, supplies, and overhead expenses; adjusted for pro jected 2025 Stelara pricing adjustments

© 2025 OPTION CARE HEALTH, INC. ALL RIGHTS RESERVED Robust National Platform with Comprehensive Clinical Solutions Referral Source Service Model Place of Administration Key Attributes Home and Alternate Site Infusion Model ▪ Compounding and dispensing through Pharmacy ▪ RN oversight with Pharmacist and Dietician support ▪ Pharmacy and Medical benefits ▪ Enables Health System participation in 340B program ▪ Flexible site of care ▪ Nurse / Advanced Practitioner oversight of patients ▪ Broader traditional Medicare access ▪ Expanded formulary ▪ Potentially faster patient onboarding ▪ Facilitates support for new therapies (Alzheimer’s, Oncology) and medically - complex patients Infusion Clinic Model 11 Hospital Physician Office/Clinic Rx+DWO Rx+DWO Pharmacy/CMC Licensed Practitioner Home Infusion Suite Infusion Clinic Referral

© 2025 OPTION CARE HEALTH, INC. ALL RIGHTS RESERVED 12 ▪ Continue to invest in clinical and operational capabilities to leverage national platform with local responsiveness , deepening our collaboration with health systems and prescribers through unwavering dependability ▪ Deepen partnerships with national and regional payers by utilizing our national platform, which helps ensure consistent high - quality care across a broad set of therapies ▪ Continue to expand our portfolio of therapies to potentially include emerging neurological therapies, oncology and additional rare and orphan therapies ▪ Expand our Infusion Clinic footprint to broaden our ability to serve a larger patient population and facilitate support for emerging therapies ▪ Continue to invest in collaboration opportunities with pharma , leveraging our clinical expertise and robust national platform ▪ Maintain consistent track record of cash flow generation and strategic capital deployment through share repurchase and M&A Expectations for the Road Ahead

© 2025 OPTION CARE HEALTH, INC. ALL RIGHTS RESERVED Reconciliation to Non - GAAP Measures 13 For historical reconciliations of non - GAAP financial measures, please see our SEC filings and other financial reports, which are available on our website at investors.optioncarehealth.com