UNITED STATES
SECURITIES AND EXCHANGE COMMISSION
WASHINGTON, D.C. 20549
FORM N-CSR
CERTIFIED SHAREHOLDER REPORT OF REGISTERED MANAGEMENT
INVESTMENT COMPANIES
Investment Company Act file number 811-01800
U.S. GLOBAL INVESTORS FUNDS
Three Canal Plaza, Suite 600
Portland, Maine 04101
Zachary Tackett, Principal Executive Officer
Three Canal Plaza, Suite 600
Portland, Maine 04101
207-347-2000
Date of fiscal year end: December 31
Date of reporting period: January 1, 2024 – June 30, 2024
ITEM 1. REPORT TO SHAREHOLDERS.
(a) A copy of the report transmitted to stockholders pursuant to Rule 30e-1 under the Investment Company Act, as amended (“Act”), is attached hereto.
USGI Global Luxury Goods Fund
Semi-Annual Shareholder Report - June 30, 2024
This semi-annual shareholder report contains important information about the USGI Global Luxury Goods Fund for the period of January 1, 2024, to June 30, 2024. You can find additional information about the Fund at www.usfunds.com/invest-with-us/prospectus-2/. You can also request this information by contacting us at (800) 873-8637.
What were the Fund's costs for the last six months?
(based on a hypothetical $10,000 investment)
| Class Name | Costs of a $10,000 investment | Costs paid as a percentage of a $10,000 investment |
|---|
| Investor Class | $77 | 1.51% |
| Total Net Assets | $48,462,732 |
| # of Portfolio Holdings | 56 |
| Portfolio Turnover Rate | 79% |
| Management Fee (Net of fees waived) | $152,936 |
Top Ten Holdings
(% of investments)
| Cie Financiere Richemont SA | 6.57% |
| Hermes International SCA | 5.68% |
| Amazon.com, Inc. | 4.78% |
| KKR & Co., Inc. | 4.44% |
| Industria de Diseno Textil SA | 4.25% |
| UBS Group AG | 4.14% |
| LVMH Moet Hennessy Louis Vuitton SE, ADR | 4.05% |
| Constellation Brands, Inc., Class A | 3.68% |
| Apollo Global Management, Inc. | 3.65% |
| Lululemon Athletica, Inc. | 3.42% |
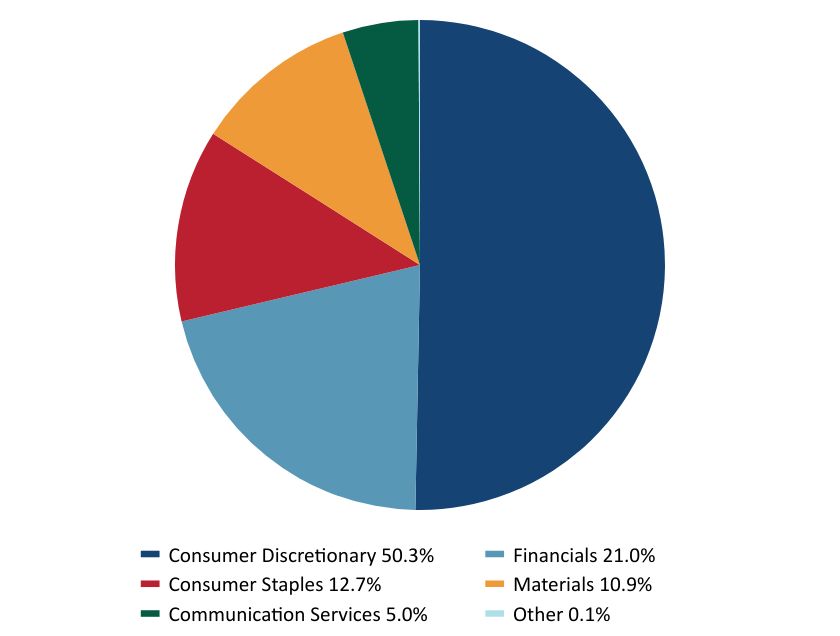
Sector Weightings
(% total investments)
| Value | Value |
|---|
| Consumer Discretionary | 50.3% |
| Financials | 21.0% |
| Consumer Staples | 12.7% |
| Materials | 10.9% |
| Communication Services | 5.0% |
| Other | 0.1% |
Where can I find additional information about the fund?
If you wish to view additional information about the Fund; including but not limited to its prospectus, holdings, financial information, and proxy information, please visit www.usfunds.com/invest-with-us/prospectus-2/. The Fund is distributed by Foreside Fund Services, LLC, a wholly owned subsidiary of Foreside Financial Group, LLC (dba ACA Group).
USGI Global Luxury Goods Fund
Semi-Annual Shareholder Report - June 30, 2024
Semi-Annual Shareholder Report - June 30, 2024
This semi-annual shareholder report contains important information about the USGI Global Resources Fund for the period of January 1, 2024, to June 30, 2024. You can find additional information about the Fund at www.usfunds.com/invest-with-us/prospectus-2/. You can also request this information by contacting us at (800) 873-8637.
What were the Fund's costs for the last six months?
(based on a hypothetical $10,000 investment)
| Class Name | Costs of a $10,000 investment | Costs paid as a percentage of a $10,000 investment |
|---|
| Investor Class | $73 | 1.48% |
| Total Net Assets | $41,729,829 |
| # of Portfolio Holdings | 139 |
| Portfolio Turnover Rate | 45% |
| Management Fee (Net of fees waived) | $88,288 |
Top Ten Holdings
(% of investments)
| Abaxx Technologies, Inc. | 7.19% |
| Ivanhoe Mines, Ltd. | 6.18% |
| Filo Corp. | 5.27% |
| Cheniere Energy, Inc. | 3.14% |
| Kimbell Royalty Partners LP | 2.16% |
| Linde PLC | 2.10% |
| OceanaGold Corp. | 1.93% |
| Viper Energy, Inc. | 1.80% |
| NG Energy International Corp. | 1.79% |
| K92 Mining, Inc. | 1.73% |
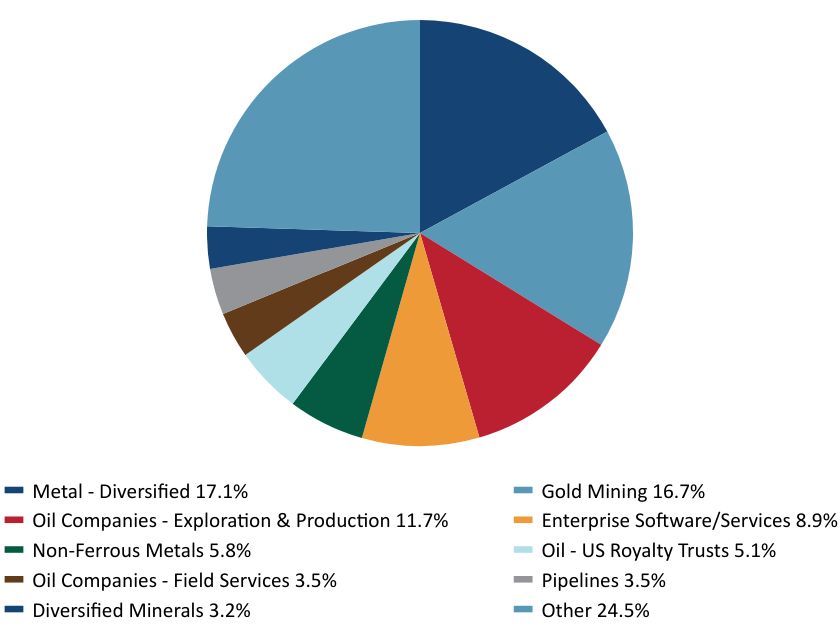
Sector Weightings
(% total investments)
| Value | Value |
|---|
| Metal - Diversified | 17.1% |
| Gold Mining | 16.7% |
| Oil Companies - Exploration & Production | 11.7% |
| Enterprise Software/Services | 8.9% |
| Non-Ferrous Metals | 5.8% |
| Oil - US Royalty Trusts | 5.1% |
| Oil Companies - Field Services | 3.5% |
| Pipelines | 3.5% |
| Diversified Minerals | 3.2% |
| Other | 24.5% |
Where can I find additional information about the fund?
If you wish to view additional information about the Fund; including but not limited to its prospectus, holdings, financial information, and proxy information, please visit www.usfunds.com/invest-with-us/prospectus-2/. The Fund is distributed by Foreside Fund Services, LLC, a wholly owned subsidiary of Foreside Financial Group, LLC (dba ACA Group).
U.S. Global Investors Funds
Semi-Annual Shareholder Report - June 30, 2024
Gold and Precious Metals Fund
Semi-Annual Shareholder Report - June 30, 2024
This semi-annual shareholder report contains important information about the USGI Gold and Precious Metals Fund for the period of January 1, 2024, to June 30, 2024. You can find additional information about the Fund at www.usfunds.com/invest-with-us/prospectus-2/. You can also request this information by contacting us at (800) 873-8637.
What were the Fund's costs for the last six months?
(based on a hypothetical $10,000 investment)
| Class Name | Costs of a $10,000 investment | Costs paid as a percentage of a $10,000 investment |
|---|
| Investor Class | $92 | 1.73% |
| Total Net Assets | $101,512,583 |
| # of Portfolio Holdings | 71 |
| Portfolio Turnover Rate | 29% |
| Management Fee Paid | $434,999 |
Top Ten Holdings
(% of investments)
| K92 Mining, Inc. | 9.62% |
| Aya Gold & Silver, Inc. | 6.84% |
| Vox Royalty Corp. | 4.09% |
| Alamos Gold, Inc. | 3.86% |
| OceanaGold Corp. | 3.39% |
| Equinox Gold Corp. | 2.83% |
| Mineros SA | 2.67% |
| Karora Resources, Inc. | 2.57% |
| Emerald Resources NL | 2.31% |
| Ivanhoe Mines, Ltd. | 2.23% |
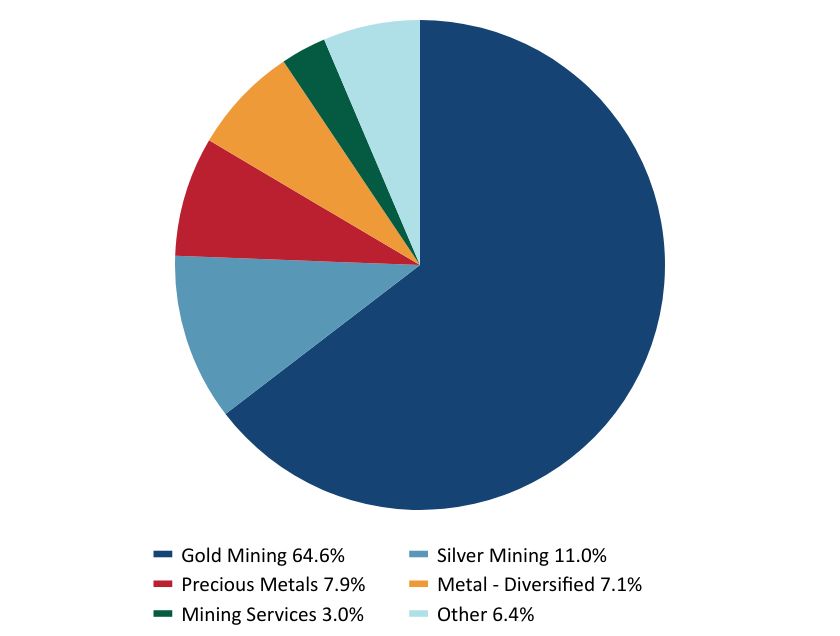
Sector Weightings
(% total investments)
| Value | Value |
|---|
| Gold Mining | 64.6% |
| Silver Mining | 11.0% |
| Precious Metals | 7.9% |
| Metal - Diversified | 7.1% |
| Mining Services | 3.0% |
| Other | 6.4% |
Where can I find additional information about the fund?
If you wish to view additional information about the Fund; including but not limited to its prospectus, holdings, financial information, and proxy information, please visit www.usfunds.com/invest-with-us/prospectus-2/. The Fund is distributed by Foreside Fund Services, LLC, a wholly owned subsidiary of Foreside Financial Group, LLC (dba ACA Group).
U.S. Global Investors Funds
Gold and Precious Metals Fund
Semi-Annual Shareholder Report - June 30, 2024
Semi-Annual Shareholder Report - June 30, 2024
This semi-annual shareholder report contains important information about the USGI Near-Term Tax Free Fund for the period of January 1, 2024, to June 30, 2024. You can find additional information about the Fund at www.usfunds.com/invest-with-us/prospectus-2/. You can also request this information by contacting us at (800) 873-8637.
What were the Fund's costs for the last six months?
(based on a hypothetical $10,000 investment)
| Class Name | Costs of a $10,000 investment | Costs paid as a percentage of a $10,000 investment |
|---|
| Investor Class | $22 | 0.45% |
| Total Net Assets | $25,030,270 |
| # of Portfolio Holdings | 67 |
| Portfolio Turnover Rate | 17% |
| Management Fee (Net of fees waived) | $(51,026) |
Top Ten Area Concentrations
(% of net assets)
| Pennsylvania | 8.83% |
| Texas | 8.38% |
| Minnesota | 6.59% |
| New Mexico | 4.64% |
| Michigan | 4.46% |
| Colorado | 3.48% |
| California | 3.41% |
| Massachusetts | 3.24% |
| Missouri | 2.89% |
| Florida | 2.84% |
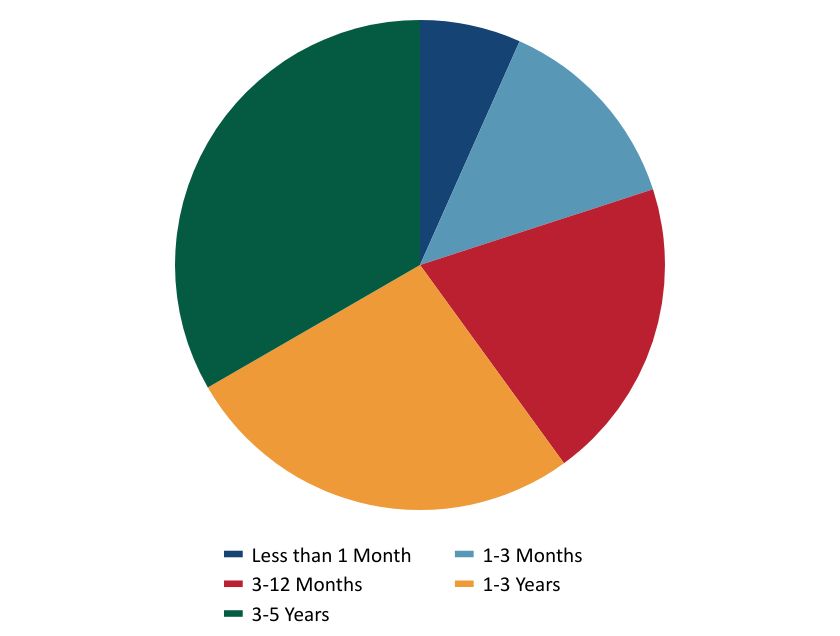
Maturity Weightings
(% total investments)
| Value | Value | Value | Value | Value | Value |
|---|
| Less than 1 Month | 1,535,651 | | 6.9% | |
| 1-3 Months | 3,053,408 | | 13.6% | |
| 3-12 Months | 6,001,611 | | 27.2% | |
| 1-3 Years | 9,434,056 | | 42.2% | |
| 3-5 Years | 2,238,524 | | 10.1% | |
Where can I find additional information about the fund?
If you wish to view additional information about the Fund; including but not limited to its prospectus, holdings, financial information, and proxy information, please visit www.usfunds.com/invest-with-us/prospectus-2/. The Fund is distributed by Foreside Fund Services, LLC, a wholly owned subsidiary of Foreside Financial Group, LLC (dba ACA Group).
U.S. Global Investors Funds
Semi-Annual Shareholder Report - June 30, 2024
U.S. Government Securities Ultra-Short Bond Fund
Semi-Annual Shareholder Report - June 30, 2024
This semi-annual shareholder report contains important information about the USGI U.S. Government Securities Ultra-Short Bond Fund for the period of January 1, 2024, to June 30, 2024. You can find additional information about the Fund at www.usfunds.com/invest-with-us/prospectus-2/. You can also request this information by contacting us at (800) 873-8637.
What were the Fund's costs for the last six months?
(based on a hypothetical $10,000 investment)
| Class Name | Costs of a $10,000 investment | Costs paid as a percentage of a $10,000 investment |
|---|
| Investor Class | $23 | 0.45% |
| Total Net Assets | $30,072,414 |
| # of Portfolio Holdings | 12 |
| Portfolio Turnover Rate | 33% |
| Management Fee (Net of fees waived) | $(39,483) |
Top Ten Holdings
(% of investments)
| U.S. Treasury Bill | 13.22% |
| Federal Home Loan Mortgage Corp. | 13.11% |
| Federal Home Loan Mortgage Corp., MTN | 12.97% |
| Federal Home Loan Bank | 8.84% |
| Federal Farm Credit Bank | 8.82% |
| U.S. Treasury Bill | 8.76% |
| Federal Farm Credit Bank | 8.66% |
| U.S. Treasury Note/Bond | 6.57% |
| Federal Home Loan Bank | 6.09% |
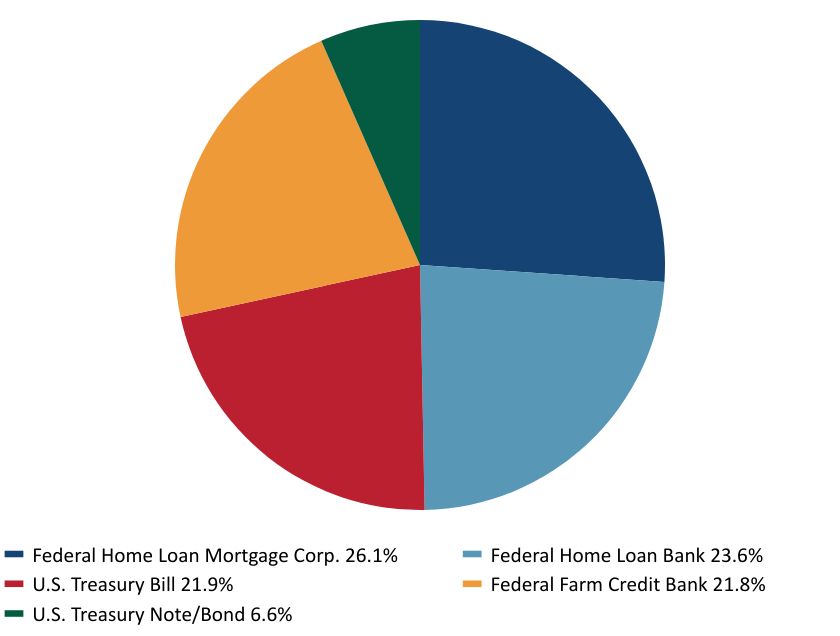
Sector Weightings
(% total investments)
| Value | Value |
|---|
| Federal Home Loan Mortgage Corp. | 26.1% |
| Federal Home Loan Bank | 23.6% |
| U.S. Treasury Bill | 21.9% |
| Federal Farm Credit Bank | 21.8% |
| U.S. Treasury Note/Bond | 6.6% |
Where can I find additional information about the fund?
If you wish to view additional information about the Fund; including but not limited to its prospectus, holdings, financial information, and proxy information, please visit www.usfunds.com/invest-with-us/prospectus-2/. The Fund is distributed by Foreside Fund Services, LLC, a wholly owned subsidiary of Foreside Financial Group, LLC (dba ACA Group).
U.S. Global Investors Funds
U.S. Government Securities Ultra-Short Bond Fund
Semi-Annual Shareholder Report - June 30, 2024
USGI World Precious Minerals Fund
Semi-Annual Shareholder Report - June 30, 2024
This semi-annual shareholder report contains important information about the USGI World Precious Minerals Fund for the period of January 1, 2024, to June 30, 2024. You can find additional information about the Fund at www.usfunds.com/invest-with-us/prospectus-2/. You can also request this information by contacting us at (800) 873-8637.
What were the Fund's costs for the last six months?
(based on a hypothetical $10,000 investment)
| Class Name | Costs of a $10,000 investment | Costs paid as a percentage of a $10,000 investment |
|---|
| Investor Class | $76 | 1.48% |
| Total Net Assets | $41,616,658 |
| # of Portfolio Holdings | 167 |
| Portfolio Turnover Rate | 14% |
| Management Fee (Net of fees waived) | $68,905 |
Top Ten Holdings
(% of investments)
| TriStar Gold, Inc. | 11.13% |
| K92 Mining, Inc. | 6.92% |
| Nano One Materials Corp. | 6.64% |
| Dolly Varden Silver Corp. | 3.75% |
| Arizona Metals Corp. | 3.48% |
| Vizsla Silver Corp. | 3.40% |
| Ivanhoe Mines, Ltd. | 3.10% |
| Radisson Mining Resources, Inc. | 2.68% |
| First Nordic Metals Corp. | 2.60% |
| Asante Gold Corp. | 2.55% |
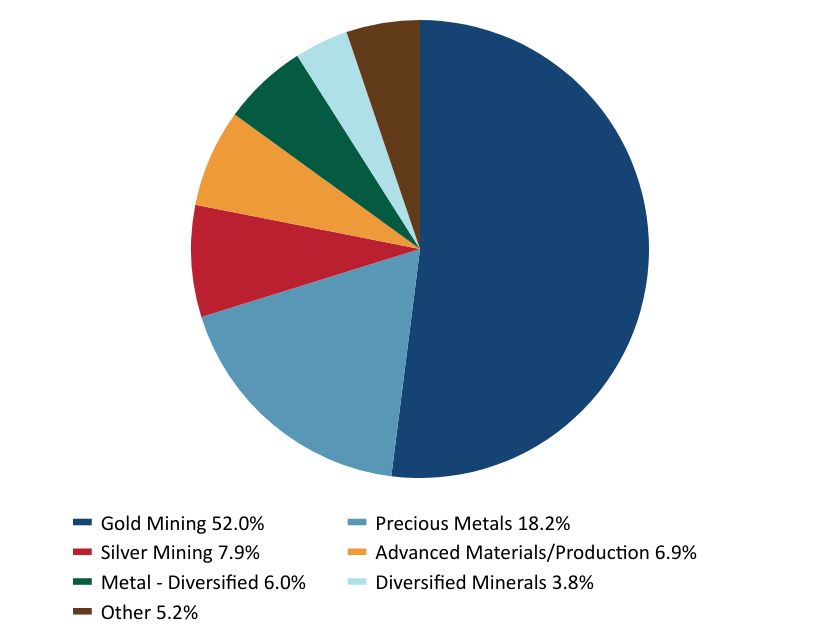
Sector Weightings
(% total investments)
| Value | Value |
|---|
| Gold Mining | 52.0% |
| Precious Metals | 18.2% |
| Silver Mining | 7.9% |
| Advanced Materials/Production | 6.9% |
| Metal - Diversified | 6.0% |
| Diversified Minerals | 3.8% |
| Other | 5.2% |
Where can I find additional information about the fund?
If you wish to view additional information about the Fund; including but not limited to its prospectus, holdings, financial information, and proxy information, please visit www.usfunds.com/invest-with-us/prospectus-2/. The Fund is distributed by Foreside Fund Services, LLC, a wholly owned subsidiary of Foreside Financial Group, LLC (dba ACA Group).
U.S. Global Investors Funds
USGI World Precious Minerals Fund
Semi-Annual Shareholder Report - June 30, 2024
(b) Not applicable.
ITEM 2. CODE OF ETHICS.
Not applicable.
ITEM 3. AUDIT COMMITTEE FINANCIAL EXPERT.
Not applicable.
ITEM 4. PRINCIPAL ACCOUNTANT FEES AND SERVICES.
Not applicable.
ITEM 5. AUDIT COMMITTEE OF LISTED REGISTRANTS.
Not applicable.
ITEM 6. INVESTMENTS.
(a) Included as part of financial statements filed under Item 7(a).
(b) Not applicable.
ITEM 7. FINANCIAL STATEMENTS AND FINANCIAL HIGHLIGHTS FOR OPEN-END MANAGEMENT INVESTMENT COMPANIES.
(a)
U.S.
Global
Investors
Funds
Semi-Annual
Financials
and
Other
Information
Semi-Annual
Financials
and
Other
Information
Portfolios
of
Investments
5
Notes
to
Portfolios
of
Investments
29
Statements
of
Assets
and
Liabilities
40
Statements
of
Operations
42
Statements
of
Changes
in
Net
Assets
44
Notes
to
Financial
Statements
48
Financial
Highlights
61
Other
Information
67
Apex
Fund
Services
3
Canal
Plaza,
Suite
600
Portland,
ME
04101
U.S.
Global
Investors
Funds
Investor
Class
U.S.
Government
Securities
Ultra-Short
Bond
Fund
UGSDX
Near-Term
Tax
Free
Fund
NEARX
Global
Luxury
Goods
Fund
USLUX
Global
Resources
Fund
PSPFX
World
Precious
Minerals
Fund
UNWPX
Gold
and
Precious
Metals
Fund
USERX
Portfolio
of
Investments
(unaudited)
See
notes
to
portfolios
of
investments
and
notes
to
financial
statements.
U.S.
Government
Securities
Ultra-Short
Bond
Fund
United
States
Government
and
Agency
Obligations
75.26%
Coupon
Rate
%
Maturity
Date
Principal
Amount
Value
Federal
Farm
Credit
Bank
16.36%
Fixed
Rates:
0.47
11/18/24
$
2,000,000
$
1,959,939
2.35
12/05/25
1,000,000
963,960
5.34
05/28/26
2,000,000
1,997,072
4,920,971
Federal
Home
Loan
Bank
17.79%
Fixed
Rates:
4.63
12/13/24
1,000,000
996,414
5.35
12/30/24
2,000,000
2,000,908
2.63
09/12/25
1,000,000
972,825
1.11
10/28/26
1,500,000
1,378,359
5,348,506
Federal
Home
Loan
Mortgage
Corp.
19.63%
Fixed
Rates:
2.40
03/28/25
3,000,000
2,935,750
4.05
08/28/25
3,000,000
2,967,690
5,903,440
U.S.
Treasury
Bill
16.54%
◊
Yield
to
Maturity:
5.13
07/18/24
3,000,000
2,992,555
5.19
09/05/24
2,000,000
1,980,909
4,973,464
U.S.
Treasury
Note/Bond
4.94%
Fixed
Rates:
4.25
12/31/25
1,500,000
1,485,850
Investments,
at
value
75.26%
22,632,231
(cost
$22,674,080
)
Other
assets
and
liabilities,
net
24.74%
7,440,183
Net
Assets
100.00%
$
30,072,414
Portfolio
of
Investments
(unaudited)
See
notes
to
portfolios
of
investments
and
notes
to
financial
statements.
Municipal
Bonds
88.95%
Coupon
Rate
%
Maturity
Date
Principal
Amount
Value
Alabama
1.94%
Alabama
Community
College
System,
Alabama,
Refunding,
RB
BAM
4.00
11/01/24
$
185,000
$
185,049
Alabaster
Board
of
Education,
Alabama,
Prefunding,
Special
Tax
Bond
AGM
5.00
09/01/44
300,000
300,604
485,653
Arizona
1.61%
City
of
Mesa
AZ,
Arizona,
Refunding,
GO
Limited
4.00
07/01/25
400,000
403,384
California
3.41%
City
of
Milpitas
CA
Wastewater
Revenue,
California,
Refunding,
RB
5.00
11/01/24
350,000
351,856
East
Side
Union
High
School
District,
California,
GO
Unlimited
AGM
5.00
08/01/24
200,000
200,213
State
of
California,
California,
Refunding,
GO
Unlimited
5.00
08/01/24
300,000
300,378
852,447
Colorado
3.48%
City
of
Glendale
CO,
Colorado,
Refunding,
COP
AGM
5.00
12/01/25
510,000
517,152
Colorado
Health
Facilities
Authority,
Colorado,
Refunding,
RB
5.00
10/01/25
350,000
355,079
872,231
Connecticut
1.62%
State
of
Connecticut,
Connecticut,
Refunding,
GO
Unlimited
5.00
05/15/27
200,000
206,028
Town
of
Simsbury
CT,
Connecticut,
Refunding,
GO
Unlimited
5.00
08/01/24
200,000
200,265
406,293
Florida
2.84%
Port
St
Lucie
Community
Redevelopment
Agency,
Florida,
Refunding,
Tax
Allocation
Bond
5.00
01/01/25
705,000
710,345
Georgia
1.22%
Grady
County
School
District,
Georgia,
GO
Unlimited
5.00
10/01/25
300,000
306,123
Hawaii
0.73%
State
of
Hawaii,
Hawaii,
Refunding,
GO
Unlimited
5.00
10/01/27
175,000
181,573
Portfolio
of
Investments
(unaudited)
See
notes
to
portfolios
of
investments
and
notes
to
financial
statements.
Municipal
Bonds (cont’d)
Coupon
Rate
%
Maturity
Date
Principal
Amount
Value
Illinois
1.21%
Cook
County
Township
High
School
District
No.
225,
Illinois,
Refunding,
GO
Unlimited
5.00
12/01/24
$
300,000
$
301,712
Indiana
1.79%
County
of
Warrick
IN
Redevelopment
District,
Indiana,
Refunding,
Tax
Allocation
Bond
4.00
08/01/25
170,000
170,932
Northwestern
School
Corp.,
Indiana,
GO
Limited
5.00
01/15/26
150,000
153,083
South
Henry
Multi
School
Building
Corp.,
Indiana,
RB
5.00
07/15/24
125,000
125,047
449,062
Iowa
1.17%
Iowa
Finance
Authority,
Iowa,
Refunding,
RB
5.00
02/15/25
290,000
291,898
Kansas
1.87%
City
of
Lawrence
KS,
Kansas,
GO
Unlimited
3.25
09/01/27
170,000
166,816
Sedgwick
County
Unified
School
District
No.
262
Valley
Center,
Kansas,
Refunding,
GO
Unlimited
4.00
09/01/25
300,000
300,355
467,171
Kentucky
2.82%
Campbellsville
Independent
School
District
Finance
Corp.,
Kentucky,
RB
4.00
08/01/25
165,000
165,712
City
of
Ashland
KY,
Kentucky,
Refunding,
GO
Unlimited
AGM
5.00
01/01/25
300,000
302,096
Kentucky
Bond
Development
Corp.,
Kentucky,
Refunding,
RB
5.00
05/01/25
235,000
237,553
705,361
Louisiana
1.17%
Louisiana
Housing
Corp.,
Louisiana,
RB
FHLMC
2.15
12/01/24
295,000
292,353
Massachusetts
3.24%
Massachusetts
Development
Finance
Agency,
Massachusetts,
Refunding,
RB
4.00
04/01/25
250,000
251,180
Massachusetts
Port
Authority,
Massachusetts,
Refunding,
RB
5.00
07/01/24
560,000
560,000
811,180
Portfolio
of
Investments
(unaudited)
See
notes
to
portfolios
of
investments
and
notes
to
financial
statements.
Municipal
Bonds (cont’d)
Coupon
Rate
%
Maturity
Date
Principal
Amount
Value
Michigan
4.46%
Great
Lakes
Water
Authority
Water
Supply
System
Revenue,
Michigan,
Refunding,
RB
5.00
07/01/26
$
365,000
$
377,134
Michigan
Finance
Authority,
Michigan,
RB
AGM
5.00
07/01/26
300,000
300,231
Wayne
State
University,
Michigan,
RB
5.00
11/15/27
430,000
438,427
1,115,792
Minnesota
6.59%
City
of
Woodbury
MN,
Minnesota,
GO
Unlimited
3.00
02/01/28
550,000
536,254
County
of
Chisago
MN,
Minnesota,
GO
Unlimited
2.00
02/01/27
1,175,000
1,113,311
1,649,565
Mississippi
0.50%
County
of
Madison
MS,
Mississippi,
GO
Unlimited
4.50
11/01/25
125,000
125,418
Missouri
2.89%
Nixa
Public
Schools,
Missouri,
Refunding,
GO
Unlimited
2.25
03/01/25
530,000
522,336
St
Louis
Land
Clearance
for
Redevelopment
Authority,
Missouri,
RB
4.00
07/15/25
200,000
201,251
723,587
Nebraska
1.21%
Nebraska
Public
Power
District,
Nebraska,
Refunding,
RB
5.00
01/01/25
300,000
302,319
Nevada
1.20%
Clark
County
Water
Reclamation
District,
Nevada,
Refunding,
GO
Limited
5.00
07/01/24
300,000
300,000
New
Jersey
1.73%
Middlesex
County
Improvement
Authority,
New
Jersey,
RB
5.00
07/01/25
425,000
432,370
New
Mexico
4.64%
City
of
Rio
Rancho
NM,
New
Mexico,
GO
Unlimited
5.00
08/01/27
600,000
632,058
Los
Alamos
Public
School
District,
New
Mexico,
GO
Unlimited
5.00
08/01/25
520,000
529,274
1,161,332
Portfolio
of
Investments
(unaudited)
See
notes
to
portfolios
of
investments
and
notes
to
financial
statements.
Municipal
Bonds (cont’d)
Coupon
Rate
%
Maturity
Date
Principal
Amount
Value
New
York
2.72%
City
of
New
York
NY,
New
York,
Refunding,
GO
Unlimited
5.00
08/01/25
$
250,000
$
254,593
City
of
New
York
NY,
New
York,
Refunding,
GO
Unlimited
5.00
08/01/26
200,000
207,391
Port
Authority
of
New
York
&
New
Jersey,
New
York,
Refunding,
RB
5.00
10/01/25
215,000
218,674
680,658
North
Carolina
2.02%
County
of
Pender
NC,
North
Carolina,
RB
5.00
04/01/25
500,000
505,247
Ohio
1.12%
Kettering
City
School
District,
Ohio,
Refunding,
GO
Unlimited
5.00
12/01/24
280,000
281,552
Oklahoma
0.90%
Grady
County
School
Finance
Authority,
Oklahoma,
RB
5.00
09/01/24
225,000
225,377
Oregon
2.60%
City
of
Ashland
OR,
Oregon,
GO
Limited
2.38
10/01/26
200,000
192,379
City
of
Lincoln
City
OR,
Oregon,
Refunding,
GO
Unlimited
2.50
06/01/28
300,000
283,396
Klamath
Falls
Intercommunity
Hospital
Authority,
Oregon,
Refunding,
RB
4.00
09/01/24
175,000
174,890
650,665
Pennsylvania
8.83%
Commonwealth
of
Pennsylvania,
Pennsylvania,
Refunding,
GO
Unlimited,
First
Series
5.00
08/15/25
310,000
315,834
Commonwealth
of
Pennsylvania,
Pennsylvania,
GO
Unlimited,
Second
Series
5.00
09/15/24
300,000
300,851
Delaware
River
Port
Authority,
Pennsylvania,
Refunding,
RB
5.00
01/01/27
500,000
521,406
Pittsburgh
Water
&
Sewer
Authority,
Pennsylvania,
RB
AGM
5.00
09/01/24
300,000
300,655
Williamsport
Sanitary
Authority,
Pennsylvania,
Refunding,
RB
BAM
5.00
01/01/27
740,000
771,499
2,210,245
South
Carolina
1.32%
City
of
Tega
Cay
SC,
South
Carolina,
Refunding,
GO
Unlimited
2.25
04/01/25
335,000
329,478
Portfolio
of
Investments
(unaudited)
See
notes
to
portfolios
of
investments
and
notes
to
financial
statements.
Municipal
Bonds (cont’d)
Coupon
Rate
%
Maturity
Date
Principal
Amount
Value
South
Dakota
0.54%
South
Dakota
Health
&
Educational
Facilities
Authority,
South
Dakota,
Refunding,
RB
5.00
09/01/24
$
135,000
$
135,178
Tennessee
1.00%
Metropolitan
Government
of
Nashville
&
Davidson
County
TN,
Tennessee,
GO
Unlimited
5.00
07/01/24
250,000
250,000
Texas
8.38%
City
of
Austin
TX,
Texas,
Refunding,
GO
Limited
5.00
09/01/24
215,000
215,509
City
of
Denton
TX,
Texas,
GO
Limited
4.00
02/15/26
265,000
268,162
City
of
Denton
TX,
Texas,
Refunding,
GO
Limited
5.00
02/15/27
400,000
417,620
Harris
County
Water
Control
&
Improvement
District
No.
21,
Texas,
GO
Unlimited
BAM
4.00
09/01/24
1,000,000
1,000,092
Lower
Colorado
River
Authority,
Texas,
Refunding,
RB
5.00
05/15/27
195,000
197,190
2,098,573
Utah
1.12%
Jordan
Valley
Water
Conservancy
District,
Utah,
Refunding,
RB
5.00
10/01/24
280,000
281,051
Vermont
1.54%
University
of
Vermont
and
State
Agricultural
College,
Vermont,
Refunding,
RB
5.00
10/01/24
385,000
386,300
Virginia
0.91%
Virginia
Commonwealth
Transportation
Board,
Virginia,
RB
5.00
05/15/25
225,000
228,361
Washington
2.61%
City
of
Seattle
WA
Municipal
Light
&
Power
Revenue,
Washington,
Refunding,
RB
5.00
10/01/24
240,000
240,925
King
County
Fire
Protection
District
No.
45,
Washington,
GO
Unlimited
4.00
12/01/25
260,000
261,765
King
County
Housing
Authority,
Washington,
Refunding,
RB
4.00
06/01/27
150,000
150,706
653,396
Investments,
at
value
88.95%
22,263,250
(cost
$22,465,097
)
Other
assets
and
liabilities,
net
11.05%
2,767,020
Net
Assets
100.00%
$
25,030,270
Portfolio
of
Investments
(unaudited)
See
notes
to
portfolios
of
investments
and
notes
to
financial
statements.
Common
Stocks
93.87%
Shares
Value
Apparel
Manufacturers
12.58%
Burberry
Group
PLC
18,800
$
208,776
Christian
Dior
SE
585
425,384
Deckers
Outdoor
Corp.
*
995
963,110
Hermes
International
SCA
1,192
2,753,074
Kering
SA,
ADR
29,200
1,059,376
PRADA
SpA
22,000
163,932
Ralph
Lauren
Corp.
3,000
525,180
6,098,832
Athletic
Footwear
0.78%
NIKE,
Inc.,
Class B
5,000
376,850
Automotive
-
Cars
&
Light
Trucks
8.93%
Bayerische
Motoren
Werke
AG
8,800
832,405
Ferrari
NV
1,850
755,485
Mercedes-Benz
Group
AG,
ADR
52,000
897,000
Porsche
Automobil
Holding
SE,
ADR
87,000
388,890
Volkswagen
AG
12,150
1,455,861
4,329,641
Beverages
-
Wine/Spirits
4.56%
Constellation
Brands,
Inc.,
Class A
6,940
1,785,523
Remy
Cointreau
SA
5,050
424,320
2,209,843
Casino
Hotels
0.96%
Wynn
Resorts,
Ltd.
5,200
465,400
Cosmetics
&
Toiletries
0.22%
The
Estee
Lauder
Cos.,
Inc.
1,000
106,400
Cruise
Lines
5.72%
Carnival
Corp.
*
63,200
1,183,104
Norwegian
Cruise
Line
Holdings,
Ltd.
*
59,000
1,108,610
Royal
Caribbean
Cruises,
Ltd.
*
3,000
478,290
2,770,004
Diversified
Banking
Institution
7.75%
JPMorgan
Chase
&
Co.
2,600
525,876
The
Goldman
Sachs
Group,
Inc.
2,700
1,221,264
UBS
Group
AG
68,000
2,008,720
3,755,860
E-Commerce/Products
4.78%
Amazon.com,
Inc.
*
11,980
2,315,135
Energy
-
Alternate
Sources
0.00%
Pacific
Green
Energy
Corp.
#*@
100,000
0
Portfolio
of
Investments
(unaudited)
See
notes
to
portfolios
of
investments
and
notes
to
financial
statements.
Common
Stocks (cont’d)
Shares
Value
Finance
-
Credit
Card
1.00%
American
Express
Co.
2,100
$
486,255
Finance
-
Mortgage
Loan/Banker
0.00%
Lendified
Holdings,
Inc.
#*@
1,116,560
0
Gold
Mining
8.23%
B2Gold
Corp.
175,000
472,500
Centerra
Gold,
Inc.
19,533
131,357
Dundee
Precious
Metals,
Inc.
72,000
563,664
Franco-Nevada
Corp.
4,600
545,192
New
Gold,
Inc.
*
35,000
68,250
Osisko
Gold
Royalties,
Ltd.
29,500
459,610
Red
5,
Ltd.
*
1,607,112
384,941
Resolute
Mining,
Ltd.
*
342,000
118,930
Royal
Gold,
Inc.
3,250
406,770
Torex
Gold
Resources,
Inc.
*
30,000
464,895
Westgold
Resources,
Ltd.
230,000
370,154
3,986,263
Hotels
&
Motels
4.28%
Accor
SA
22,200
908,402
HUGO
BOSS
AG
6,276
282,190
InterContinental
Hotels
Group
PLC
8,400
882,641
2,073,233
Investment
Management/Advisory
Services
3.65%
Apollo
Global
Management,
Inc.
15,000
1,771,050
Oil
Companies
-
Exploration
&
Production
0.08%
NG
Energy
International
Corp.,
144A
#*∆
50,000
37,279
Precious
Metals
0.49%
Wheaton
Precious
Metals
Corp.
4,500
235,890
Private
Equity
7.58%
Blackstone,
Inc.,
Class A
12,300
1,522,740
KKR
&
Co.,
Inc.
20,450
2,152,158
3,674,898
Real
Estate
Operating/Development
0.00%
Infrastructure
Ventures,
Inc.
#*@+
426,533
0
Retail
-
Apparel/Shoe
11.46%
Brunello
Cucinelli
SpA
3,950
394,234
Industria
de
Diseno
Textil
SA
41,500
2,059,371
JD
Sports
Fashion
PLC
145,000
217,737
Lululemon
Athletica,
Inc.
*
5,550
1,657,785
Portfolio
of
Investments
(unaudited)
See
notes
to
portfolios
of
investments
and
notes
to
financial
statements.
Common
Stocks (cont’d)
Shares
Value
Retail
-
Apparel/Shoe
(cont’d)
Moncler
SpA
20,000
$
1,226,879
5,556,006
Retail
-
Jewelry
6.57%
Cie
Financiere
Richemont
SA
20,380
3,185,047
Silver
Mining
0.20%
Fortuna
Silver
Mines,
Inc.
*
20,000
97,800
Textile
-
Apparel
4.05%
LVMH
Moet
Hennessy
Louis
Vuitton
SE,
ADR
12,786
1,960,733
Total
Common
Stocks
45,492,419
(cost
$42,671,885)
Corporate
Non-Convertible
Bond
1.54%
Coupon
Rate
%
Maturity
Date
Principal
Amount
Gold
Mining
1.54%
Aris
Gold
Corp.
7.50
08/26/27
$
623,067
747,680
(cost
$623,000)
Investments,
at
value
95.41%
46,240,099
(cost
$43,294,885
)
Other
assets
and
liabilities,
net
4.59%
2,222,633
Net
Assets
100.00%
$
48,462,732
Portfolio
of
Investments
(unaudited)
See
notes
to
portfolios
of
investments
and
notes
to
financial
statements.
Common
Stocks
85.64%
Shares
Value
Advanced
Materials/Production
0.80%
Nano
One
Materials
Corp.
*
325,000
$
332,590
Agricultural
Chemicals
1.47%
CF
Industries
Holdings,
Inc.
5,000
370,600
OCI
NV
10,000
244,233
614,833
Agricultural
Operations
1.15%
Bunge
Global
SA
4,500
480,465
Building
Products
-
Wood
0.93%
Atlas
Engineered
Products,
Ltd.
*
100,000
103,797
Atlas
Engineered
Products,
Ltd.
*
85,000
88,228
Stella-Jones,
Inc.
3,000
195,760
387,785
Chemicals
-
Specialty
1.30%
Daqo
New
Energy
Corp.,
ADR
*
7,500
109,500
Methanex
Corp.
9,000
434,524
544,024
Coal
0.00%
Caribbean
Resources
Corp.
#*@
2,148,176
0
Diamonds/Precious
Stones
0.48%
Barksdale
Resources
Corp.
*
1,955,000
200,066
Diversified
Minerals
2.93%
Arianne
Phosphate,
Inc.
*
600,000
124,995
Atlas
Lithium
Corp.
*
3,000
31,140
BHP
Group,
Ltd.,
ADR
3,500
199,815
Core
Assets
Corp.,
144A
#*∆
600,000
50,437
E3
Lithium,
Ltd.
*
100,000
105,990
IberAmerican
Lithium
Corp.
*@
1,000,000
116,955
Legacy
Lithium
Corp.
#*@
100,000
2,039
Leo
Lithium,
Ltd.
#*@
700,000
202,151
Lithium
Royalty
Corp.
*
821
3,961
NGEX
Minerals,
Ltd.
*
20,000
118,417
NGX,
Ltd.
*
90
8
Nio
Strategic
Metals,
Inc.
*
3,325,000
145,828
Nio
Strategic
Metals,
Inc.,
144A
#*∆
362,069
15,880
Sigma
Lithium
Corp.
*
3,000
36,090
Wolfden
Resources
Corp.
*
1,825,000
66,701
1,220,407
Electric
-
Integrated
0.91%
CPFL
Energia
SA
65,000
381,272
Portfolio
of
Investments
(unaudited)
See
notes
to
portfolios
of
investments
and
notes
to
financial
statements.
Common
Stocks (cont’d)
Shares
Value
Energy
-
Alternate
Sources
0.35%
Canadian
Solar,
Inc.
*
10,000
$
147,500
Pacific
Green
Energy
Corp.
#*@~
2,400,000
0
147,500
Enterprise
Software/Services
8.03%
Abaxx
Technologies,
Inc.
*
300,000
2,997,698
Base
Carbon,
Inc.
*
1,000,000
350,864
3,348,562
Food
-
Miscellaneous/Diversified
1.10%
Ingredion,
Inc.
4,000
458,800
Gold
Mining
12.98%
Agnico
Eagle
Mines,
Ltd.
2,500
163,500
Barrick
Gold
Corp.
25,000
417,000
Black
Cat
Syndicate,
Ltd.
*
550,475
111,801
Centerra
Gold,
Inc.
22,539
151,573
Collective
Mining,
Ltd.
*
75,000
174,336
EnviroGold
Global,
Ltd.,
144A
#*∆
75,000
2,467
Firefinch,
Ltd.
#*@
1,000,000
50,833
K92
Mining,
Inc.
*
126,000
723,000
Montage
Gold
Corp.
*
650,000
627,170
New
Gold,
Inc.
*
150,000
292,500
OceanaGold
Corp.
350,000
803,333
Osisko
Gold
Royalties,
Ltd.
10,000
155,800
Ramelius
Resources,
Ltd.
150,000
192,683
Royal
Road
Minerals,
Ltd.
*
5,500,000
402,032
Seabridge
Gold,
Inc.
*
20,000
273,800
Seasif
Exploration,
Inc.
*
2,000,000
21,929
Silver
Tiger
Metals,
Inc.
*
1,000,000
153,503
Torex
Gold
Resources,
Inc.
*
45,000
697,343
5,414,603
Industrial
Gases
2.10%
Linde
PLC
2,000
877,620
Investment
Companies
0.33%
Contango
Holdings
PLC
*
10,502,248
138,866
Metal
-
Copper
1.95%
Arizona
Sonoran
Copper
Co.,
Inc.
*
467,800
434,272
Kutcho
Copper
Corp.
*
1,223,500
147,566
Meridian
Mining
UK
Societas
*
500,000
157,158
Trigon
Metals,
Inc.
*
90,000
73,024
812,020
Portfolio
of
Investments
(unaudited)
See
notes
to
portfolios
of
investments
and
notes
to
financial
statements.
Common
Stocks (cont’d)
Shares
Value
Metal
-
Diversified
15.54%
Anglo
American
PLC
3,500
$
110,602
Blackwolf
Copper
and
Gold,
Ltd.
*
208,000
17,485
Electra
Battery
Materials
Corp.,
144A
#*∆
55,555
24,365
Filo
Corp.
*
120,000
2,199,919
Glencore
PLC
40,000
227,611
GoviEx
Uranium,
Inc.,
144A
#*∆
58,000
3,392
Ivanhoe
Electric,
Inc./US
*
16,499
154,761
Ivanhoe
Mines,
Ltd.
*
200,000
2,580,315
Juno
Corp.,
144A
#*@∆
200,000
292,387
Nubian
Resources,
Ltd.
*
250,000
11,421
Orsu
Metals
Corp.,
144A
#*@∆
14,761
0
Sovereign
Metals,
Ltd.
*
600,000
245,916
Torq
Resources,
Inc.
*
1,000,000
62,132
Vox
Royalty
Corp.
200,000
554,000
6,484,306
Metal
-
Iron
0.00%
Consolidated
Growth
Holdings,
Ltd.
#*@
19,859,173
0
Mining
Services
0.65%
Cordoba
Minerals
Corp.
*
58,823
19,779
Defense
Metals
Corp.
*
1,800,000
249,991
269,770
Natural
Resource
Technology
0.30%
I-Pulse,
Inc.,
144A
#*@+∆
15,971
126,171
Non-Ferrous
Metals
5.28%
Cameco
Corp.
10,000
492,000
Denison
Mines
Corp.
*
230,000
457,700
Encore
Energy
Corp.
*
150,000
588,794
EV
Nickel,
Inc.
*
225,000
106,904
InZinc
Mining,
Ltd.
*
2,000,000
40,203
NexGen
Energy,
Ltd.
*
25,000
174,500
Peninsula
Energy,
Ltd.
*
1,400,000
98,391
Peninsula
Energy,
Ltd.
*
500,000
35,139
Sterling
Group
Ventures,
Inc.,
144A
#*@∆
500,000
0
Ur-Energy,
Inc.
*
150,000
210,000
2,203,631
Oil
-
US
Royalty
Trusts
4.59%
Deterra
Royalties,
Ltd.
100,000
265,350
Kimbell
Royalty
Partners
LP
55,000
899,800
Viper
Energy,
Inc.
20,000
750,600
1,915,750
Portfolio
of
Investments
(unaudited)
See
notes
to
portfolios
of
investments
and
notes
to
financial
statements.
Common
Stocks (cont’d)
Shares
Value
Oil
Companies
-
Exploration
&
Production
9.38%
Canadian
Natural
Resources,
Ltd.
6,000
$
213,600
ConocoPhillips
1,500
171,570
EOG
Resources,
Inc.
2,500
314,675
LNG
Energy
Group
Corp.
*
1,100,000
201,016
Marathon
Oil
Corp.
17,500
501,725
New
Stratus
Energy,
Inc.
*
1,000,000
409,342
NG
Energy
International
Corp.
*
1,000,000
745,587
NG
Energy
International
Corp.,
144A
#*∆
200,000
149,117
Occidental
Petroleum
Corp.
10,000
630,300
Permian
Resources
Corp.
15,000
242,250
Range
Resources
Corp.
10,000
335,300
3,914,482
Oil
Companies
-
Field
Services
3.15%
Halliburton
Co.
10,000
337,800
Liberty
Energy,
Inc.
7,500
156,675
Schlumberger
NV
6,000
283,080
Select
Water
Solutions,
Inc.,
Class A
50,000
535,000
1,312,555
Oil
Companies
-
Integrated
1.50%
BP
PLC,
ADR
10,000
361,000
TotalEnergies
SE,
ADR
4,000
266,720
627,720
Oil
Refining
&
Marketing
1.25%
Marathon
Petroleum
Corp.
3,000
520,440
Paper
&
Related
Products
1.15%
Sylvamo
Corp.
7,000
480,200
Pipelines
3.14%
Cheniere
Energy,
Inc.
7,500
1,311,225
Precious
Metals
1.01%
Brixton
Metals
Corp.
*
2,000,000
138,884
Coeur
Mining,
Inc.
*
50,000
281,000
419,884
Real
Estate
Operating/Development
0.84%
Infrastructure
Ventures,
Inc.
#*@+
7,443,544
0
Revival
Gold,
Inc.
*
1,690,682
352,213
352,213
Retail
-
Jewelry
0.16%
Mene,
Inc.
*
750,000
68,528
Portfolio
of
Investments
(unaudited)
See
notes
to
portfolios
of
investments
and
notes
to
financial
statements.
Common
Stocks (cont’d)
Shares
Value
Silver
Mining
0.89%
Vizsla
Royalties
Corp.
#*@
66,666
$
16,081
Vizsla
Silver
Corp.
*
200,000
353,788
369,869
Total
Common
Stocks
35,736,157
(cost
$76,467,120)
Corporate
Convertible
Bond
1.21%
Coupon
Rate
%
Maturity
Date
Principal
Amount
Investment
Companies
1.21%
Contango
Holdings
PLC,
144A
#@∆
0.00
09/30/24
$
400,000
505,640
(cost
$508,120)
Corporate
Non-Convertible
Bonds
3.38%
Gold
Mining
2.19%
Aris
Gold
Corp.
7.50
08/26/27
763,287
915,944
Oil
Companies
-
Exploration
&
Production
1.19%
NG
Energy
International
Corp.
#
8.00
05/20/27
750,000
494,774
Total
Corporate
Non-Convertible
Bonds
1,410,718
(cost
$1,350,399)
Right
0.00%
Shares
Agricultural
Operations
0.00%
Wide
Open
Agriculture,
Ltd.
#*@
750,000
0
(cost
$231,813)
Exchange
Traded
Fund
0.10%
Direxion
Daily
S&P
Oil
&
Gas
Exp.
&
Prod.
Bear
2X
Shares
ETF
4,400
42,108
(cost
$41,182)
Warrants
0.43%
Exercise
Price
Exp.
Date
Diamonds/Precious
Stones
0.00%
Barksdale
Resources
Corp.,
144A
#*@∆
$
0.60
01/09/27
177,500
0
Diversified
Minerals
0.00%
Core
Assets
Corp.,
144A
#*@∆
0.47
02/17/25
300,000
0
Desert
Mountain
Energy
Corp.,
144A
#*@∆
2.70
03/24/25
300,000
0
Group
6
Metals,
Ltd.
#*@
0.28
01/13/25
400,000
0
Portfolio
of
Investments
(unaudited)
See
notes
to
portfolios
of
investments
and
notes
to
financial
statements.
Warrants (cont’d)
Exercise
Price
Exp.
Date
Shares
Value
Diversified
Minerals
(cont’d)
IberAmerican
Lithium
Corp.,
144A
#*∆
$
0.40
09/01/26
500,000
$
0
Lithium
Ion
Energy,
Ltd.,
144A
#*@∆
0.70
04/24/25
225,000
0
Volt
Lithium
Corp.,
144A
#*@∆
0.33
08/04/25
500,000
0
0
Gold
Mining
0.00%
Iris
Metals,
Ltd.
#*@
1.50
05/16/25
325,000
0
Investment
Companies
0.00%
Contango
Holdings
PLC,
144A
#*@∆
0.09
11/07/25
4,583,333
0
Metal
-
Copper
0.00%
Trigon
Metals,
Inc.,
144A
#*@∆
1.50
07/12/26
125,000
0
Metal
-
Diversified
0.00%
Electra
Battery
Materials
Corp.,
144A
#*@∆
1.74
08/11/25
250,000
0
Torq
Resources,
Inc.,
144A
#*@∆
0.30
01/04/27
1,000,000
0
0
Mining
Services
0.31%
Aris
Mining
Corp.
*
2.75
07/29/25
480,000
129,820
Non-Ferrous
Metals
0.00%
Peninsula
Energy,
Ltd.
#*@
0.10
03/31/25
700,000
2,335
Oil
Companies
-
Exploration
&
Production
0.07%
LNG
Energy
Group,
144A
#*@∆
0.60
05/05/26
1,000,000
0
NG
Energy
International
Corp.
*
1.40
05/20/27
300,000
29,604
29,604
Real
Estate
Operating/Development
0.00%
Revival
Gold,
Inc.,
144A
#*@∆
0.72
05/16/26
250,000
0
Revival
Gold,
Inc.,
144A
#*@∆
0.45
05/02/27
137,500
0
0
Silver
Mining
0.05%
Vizsla
Royalties
Corp.
#*@
0.05
12/31/25
66,666
0
Vizsla
Silver
Corp.,
144A
#*@∆
2.00
11/15/24
62,500
19,188
19,188
Total
Warrants
180,947
(cost
$21,535
)
Investments,
at
value
90.76%
37,875,570
(cost
$78,620,169
)
Other
assets
and
liabilities,
net
9.24%
3,854,259
Net
Assets
100.00%
$
41,729,829
Portfolio
of
Investments
(unaudited)
See
notes
to
portfolios
of
investments
and
notes
to
financial
statements.
World
Precious
Minerals
Fund
Common
Stocks
93.47%
Shares
Value
Advanced
Materials/Production
6.64%
Nano
One
Materials
Corp.
*
2,700,000
$
2,763,057
Coal
0.00%
Caribbean
Resources
Corp.
#*@
505,453
0
Diamonds/Precious
Stones
0.88%
Barksdale
Resources
Corp.
*
3,570,000
365,338
Diversified
Minerals
3.66%
Ascot
Resources,
Ltd.
*
100,000
40,934
Ascot
Resources,
Ltd.,
144A
#*∆
6,412
2,625
Erdene
Resource
Development
Corp.
*
500,000
148,021
Founders
Metals,
Inc.
*
150,000
202,843
Gossan
Resources,
Ltd.
*
1,250,000
27,411
Indochine
Mining,
Ltd.
#*@
10,000
0
Kenorland
Minerals,
Ltd.
*
225,000
146,376
Kootenay
Resources,
Inc.
*
40,000
3,509
Max
Resource
Corp.
*
2,250,000
98,681
Minaurum
Gold,
Inc.
*
1,500,000
241,219
Serra
Energy
Metals
Corp.
*
2,000,000
29,239
Waraba
Gold,
Ltd.
*~
2,155,000
63,009
Waraba
Gold,
Ltd.,
144A
#*~∆
6,045,000
176,748
Western
Exploration,
Inc.
*
350,000
225,138
Westward
Gold,
Inc.
*
2,000,000
116,955
1,522,708
Energy
-
Alternate
Sources
0.14%
Iondrive,
Ltd.
*
9,806,886
59,900
Financial
Services
0.00%
Tokens.com
Corp.,
144A
#*∆
11,123
1,382
Gold
Mining
47.93%
Abitibi
Metals
Corp.
*
300,000
78,944
Abitibi
Metals
Corp.
*
100,000
26,315
Adamera
Minerals
Corp.
*
547,000
60,975
Adamera
Minerals
Corp.,
144A
#*∆
11,954
1,333
Aero
Energy,
Ltd.
*
50,000
5,299
Allegiant
Gold,
Ltd.
*
500,000
60,305
Alpha
Exploration,
Ltd.
*
500,000
378,276
Amilot
Capital,
Inc.,
144A
#*@∆
410,000
0
Angus
Gold,
Inc.
*
350,000
113,848
Asante
Gold
Corp.
*
1,250,000
1,059,903
Awale
Resources,
Ltd.
*
925,000
338,072
Bellevue
Gold,
Ltd.
*
500,000
595,065
Black
Cat
Syndicate,
Ltd.
*
1,500,000
304,650
Black
Cat
Syndicate,
Ltd.
*
272,400
55,324
Portfolio
of
Investments
(unaudited)
See
notes
to
portfolios
of
investments
and
notes
to
financial
statements.
World
Precious
Minerals
Fund
Common
Stocks (cont’d)
Shares
Value
Gold
Mining
(cont’d)
Carolina
Rush
Corp.
*
1,000,000
$
98,681
Cassiar
Gold
Corp.
*
448,000
93,330
Collective
Mining,
Ltd.
*
50,000
116,224
Compass
Gold
Corp.
*
2,000,000
116,955
Faraday
Copper
Corp.,
144A
#*∆
43,500
25,756
Freegold
Ventures,
Ltd.
*
500,000
144,366
G2
Goldfields,
Inc.
*
652,100
676,863
Gold
Bull
Resources
Corp.
*
100,000
38,010
Goldshore
Resources,
Inc.
*
1,400,000
276,306
Heliostar
Metals,
Ltd.
*
1,250,000
251,270
K92
Mining,
Inc.
*
502,000
2,880,523
Karus
Mining,
Inc.
#*@
37,500
60,305
Kesselrun
Resources,
Ltd.
*~
5,000,000
164,468
Kinross
Gold
Corp.
15,000
124,800
Lion
One
Metals,
Ltd.
*
500,000
171,777
Loncor
Gold,
Inc.
*
2,575,000
705,840
Maple
Gold
Mines,
Ltd.
*
1,000,000
62,132
Mawson
Gold,
Ltd.
*
900,000
493,403
McFarlane
Lake
Mining,
Ltd.
*
2,500,000
63,960
Montage
Gold
Corp.
*
400,000
385,951
New
Gold,
Inc.
*
50,000
97,500
NV
Gold
Corp.
*
100,000
23,756
OceanaGold
Corp.
175,000
401,667
Omai
Gold
Mines
Corp.
*
3,000,000
241,219
Onyx
Gold
Corp.
*
200,000
36,548
Osisko
Gold
Royalties,
Ltd.
10,000
155,800
Osisko
Mining,
Inc.
*
125,000
261,321
Radisson
Mining
Resources,
Inc.
*
9,250,000
1,115,639
Radius
Gold,
Inc.,
144A
#*∆
125,000
7,081
Ramelius
Resources,
Ltd.
350,000
449,593
Renegade
Gold,
Inc.
*
650,000
180,549
Reunion
Gold
Corp.
*
500,000
248,529
Roscan
Gold
Corp.
*
1,500,000
82,234
Royal
Road
Minerals,
Ltd.
*
1,500,000
109,645
Sanu
Gold
Corp.
*
585,000
32,071
Sanu
Gold
Corp.,
144A
#*∆
700,000
38,376
Scottie
Resources
Corp.
*
3,250,000
403,859
Seabridge
Gold,
Inc.
*
15,000
205,350
Silver
Tiger
Metals,
Inc.
*
1,000,000
153,503
Skeena
Resources,
Ltd.
*
30,000
160,959
STLLR
Gold,
Inc.
*
92,000
81,371
Storm
Exploration,
Inc.
*
537,500
11,787
Strikepoint
Gold,
Inc.
*
2,750,000
70,356
Sunshine
Metals,
Ltd./Australia
*
12,000,000
102,619
Taurus
Gold,
Ltd.,
144A
#*@∆
2,448,381
0
Tolu
Minerals,
Ltd.
*
600,000
207,695
Tolu
Minerals,
Ltd.
*
317,000
109,732
Portfolio
of
Investments
(unaudited)
See
notes
to
portfolios
of
investments
and
notes
to
financial
statements.
World
Precious
Minerals
Fund
Common
Stocks (cont’d)
Shares
Value
Gold
Mining
(cont’d)
Torex
Gold
Resources,
Inc.
*
7,500
$
116,224
TriStar
Gold,
Inc.
*~
28,800,000
4,631,410
Viva
Gold
Corp.
*
500,000
51,168
Westhaven
Gold
Corp.
*
1,000,000
127,919
19,944,709
Metal
-
Copper
0.51%
C3
Metals,
Inc.
*
115,384
21,507
Meridian
Mining
UK
Societas
*
600,000
188,590
210,097
Metal
-
Diversified
5.75%
Aurion
Resources,
Ltd.
*
421,500
184,862
Cartier
Resources,
Inc.
*
750,000
38,376
De
Grey
Mining,
Ltd.
*
250,000
189,674
Ivanhoe
Electric,
Inc./US
*
6,299
59,084
Ivanhoe
Mines,
Ltd.
*
100,000
1,290,157
Juno
Corp.,
144A
#*@∆
200,000
292,387
New
Age
Metals,
Inc.,
144A
#*∆
143,518
4,196
Nubian
Resources,
Ltd.
*
500,000
22,843
Orex
Minerals,
Inc.
*
700,000
143,269
Orsu
Metals
Corp.,
144A
#*@∆
186,922
0
RTG
Mining,
Inc.
*
3,000,000
73,678
Sirios
Resources,
Inc.
*
1,000,000
51,168
Sterling
Metals
Corp.
*
1,000,000
43,858
2,393,552
Mining
Services
0.62%
Cordoba
Minerals
Corp.
*
58,823
19,779
Orexplore
Technologies,
Ltd.
#*@
267,284
3,031
Summa
Silver
Corp.
*
750,000
232,996
255,806
Non-Ferrous
Metals
0.73%
InZinc
Mining,
Ltd.
*
2,000,000
40,203
Solitario
Resources
Corp.
*
300,000
265,500
305,703
Oil
Companies
-
Exploration
&
Production
0.00%
Big
Sky
Energy
Corp.
#*@
2,000,000
0
Optical
Recognition
Equipment
0.00%
Nexoptic
Technology
Corp.,
144A
#*@∆
12,083
132
Portfolio
of
Investments
(unaudited)
See
notes
to
portfolios
of
investments
and
notes
to
financial
statements.
World
Precious
Minerals
Fund
Common
Stocks (cont’d)
Shares
Value
Precious
Metals
17.51%
Amani
Gold,
Ltd.
#*@
54,500,000
$
36,357
Arizona
Metals
Corp.
*
1,000,000
1,447,316
Brixton
Metals
Corp.
*
3,000,000
208,326
Canex
Metals,
Inc.
*
3,250,000
118,782
Capitan
Silver
Corp.
*
1,100,000
128,650
Denarius
Metals
Corp.
*
150,000
64,691
Dolly
Varden
Silver
Corp.
*
2,074,000
1,561,507
First
Nordic
Metals
Corp.
*
4,550,000
1,080,918
GFG
Resources,
Inc.
*
5,525,000
343,281
GFG
Resources,
Inc.,
144A
#*@∆
500,000
31,066
Gold
Terra
Resource
Corp.
*
3,750,000
205,585
Gold79
Mines,
Ltd.
*
850,000
136,691
GR
Silver
Mining,
Ltd.
*
1,000,000
102,335
Hercules
Metals
Corp.
*
75,000
35,635
Olive
Resource
Capital,
Inc.
*
4,000,000
80,406
Orla
Mining,
Ltd.
*
51,660
198,249
Paramount
Gold
Nevada
Corp.
*
170,000
68,000
Polarx,
Ltd.
*
30,000,000
280,442
Rua
Gold,
Inc.
*
1,500,000
208,326
Silver
Viper
Minerals
Corp.
*
2,000,000
98,681
Silver
Viper
Minerals
Corp.,
144A
#*@∆
1,000,000
49,340
Stillwater
Critical
Minerals
Corp.
*
1,000,000
109,645
Thesis
Gold,
Inc.
*
900,000
394,722
Unico
Silver,
Ltd.
*
1,000,000
100,900
Visionary
Metals
Corp.
*
1,500,000
46,599
Xali
Gold
Corp.,
144A
#*∆
4,875,000
151,447
7,287,897
Real
Estate
Operating/Development
1.13%
Fremont
Gold,
Ltd.
*
400,000
24,853
Mammoth
Resources
Corp.
*~
5,500,000
70,356
Revival
Gold,
Inc.
*
1,798,818
374,740
469,949
Retail
-
Jewelry
0.46%
Mene,
Inc.
*
2,115,000
193,250
Silver
Mining
7.51%
Aya
Gold
&
Silver,
Inc.
*
50,000
496,327
Gatos
Silver,
Inc.
*
15,000
156,600
Gatos
Silver,
Inc.
*
10,000
104,090
Kootenay
Silver,
Inc.
*
478,000
377,355
Metallic
Minerals
Corp.
*
1,000,000
211,980
Reyna
Silver
Corp.
*
360,000
35,525
Southern
Silver
Exploration
Corp.
*
1,500,000
263,148
Vizsla
Royalties
Corp.
#*@
266,666
64,325
Portfolio
of
Investments
(unaudited)
See
notes
to
portfolios
of
investments
and
notes
to
financial
statements.
World
Precious
Minerals
Fund
Common
Stocks (cont’d)
Shares
Value
Silver
Mining
(cont’d)
Vizsla
Silver
Corp.
*
800,000
$
1,415,153
3,124,503
Total
Common
Stocks
38,897,983
(cost
$69,798,028)
Corporate
Non-Convertible
Bond
2.22%
Coupon
Rate
%
Maturity
Date
Principal
Amount
Gold
Mining
2.22%
Aris
Gold
Corp.
7.50
08/26/27
$
771,080
925,296
(cost
$771,080)
Exchange
Traded
Fund
0.21%
Shares
ProShares
UltraShort
Gold
ETF
*
4,000
86,676
(cost
$107,899)
Warrants
0.46%
Exercise
Price
Exp.
Date
Diamonds/Precious
Stones
0.00%
Barksdale
Resources
Corp.,
144A
#*@∆
$
0.60
01/09/27
147,500
0
Diversified
Minerals
0.00%
Minaurum
Gold,
Inc.,
144A
#*@∆
0.34
05/02/26
250,000
0
Western
Exploration,
Inc.,
144A
#*@∆
2.15
12/31/49
50,000
0
0
Gold
Mining
0.00%
Cassiar
Gold
Corp.,
144A
#*@∆
0.70
05/04/25
125,000
0
Freegold
Ventures,
Ltd.,
144A
#*@∆
0.52
12/31/49
150,000
0
McFarlane
Lake
Mining,
Ltd.,
144A
#*@∆
0.07
05/01/25
2,500,000
0
Radisson
Mining
Resources,
Inc.,
144A
#*@∆
0.27
11/17/25
375,000
0
STLLR
Gold,
Inc.,
144A
#*@∆
2.19
12/31/27
21,000
0
0
Metal
-
Diversified
0.00%
Sterling
Metals
Corp.,
144A
#*@∆
0.25
04/17/25
1,000,000
0
Mining
Services
0.42%
Aris
Mining
Corp.
*
2.75
07/29/25
645,000
174,446
Oil
Companies
-
Exploration
&
Production
0.00%
Goliath
Resources,
Ltd.,
144A
#*@∆
0.92
05/18/25
112,500
0
Portfolio
of
Investments
(unaudited)
See
notes
to
portfolios
of
investments
and
notes
to
financial
statements.
World
Precious
Minerals
Fund
Warrants (cont’d)
Exercise
Price
Exp.
Date
Shares
Value
Precious
Metals
0.00%
Denarius
Metals
Corp.,
144A
#*@∆
$
0.60
03/02/26
75,000
$
0
GFG
Resources,
Inc.,
144A
#*@∆
0.18
03/20/26
373,077
0
0
Real
Estate
Operating/Development
0.00%
Revival
Gold,
Inc.,
144A
#*@∆
0.45
05/02/27
50,000
0
TDG
Gold
Corp.,
144A
#*@∆
0.42
07/06/26
115,000
0
0
Silver
Mining
0.04%
Kootenay
Silver,
Inc.,
144A
#*@∆
1.68
04/25/26
64,000
0
Southern
Silver
Exploration
Corp.,
144A
#*@∆
0.35
08/14/25
875,000
0
Vizsla
Royalties
Corp.
#*@
0.05
12/31/25
266,666
0
Vizsla
Silver
Corp.,
144A
#*@∆
2.00
11/15/24
62,500
19,188
19,188
Total
Warrants
193,634
(cost
$116,557
)
Investments,
at
value
96.36%
40,103,589
(cost
$70,793,564
)
Other
assets
and
liabilities,
net
3.64%
1,513,069
Net
Assets
100.00%
$
41,616,658
Portfolio
of
Investments
(unaudited)
See
notes
to
portfolios
of
investments
and
notes
to
financial
statements.
Gold
and
Precious
Metals
Fund
Common
Stocks
90.36%
Shares
Value
Distribution/Wholesale
0.48%
A-Mark
Precious
Metals,
Inc.
15,000
$
485,550
Diversified
Minerals
2.13%
Ascot
Resources,
Ltd.
*
400,000
163,737
Calibre
Mining
Corp.
*
750,000
986,806
Leo
Lithium,
Ltd.
#*@
3,500,000
1,010,756
Lithium
Royalty
Corp.
*
679
3,276
2,164,575
Enterprise
Software/Services
0.29%
Abaxx
Technologies,
Inc.
*
30,000
299,770
Gold
Mining
57.55%
Agnico
Eagle
Mines,
Ltd.
20,000
1,308,000
Alamos
Gold,
Inc.
250,000
3,920,000
Anglogold
Ashanti
PLC
65,000
1,633,450
Argonaut
Gold,
Inc.
*
1,000,000
314,316
Barrick
Gold
Corp.
15,000
250,200
Black
Cat
Syndicate,
Ltd.
*
3,400,000
690,540
Catalyst
Metals,
Ltd.
*
2,000,000
1,510,318
Centamin
PLC
425,000
649,481
Centerra
Gold,
Inc.
75,128
505,228
Dundee
Precious
Metals,
Inc.
150,000
1,174,299
Eldorado
Gold
Corp.
*
50,000
739,500
Endeavour
Mining
PLC
60,000
1,267,497
Equinox
Gold
Corp.
*
550,000
2,876,500
Firefinch,
Ltd.
#*@
5,000,000
254,165
Franco-Nevada
Corp.
8,000
948,160
Gold
Resource
Corp.
*
1,000,000
373,500
Harmony
Gold
Mining
Co.,
Ltd.,
ADR
200,000
1,834,000
IAMGOLD
Corp.
*
250,000
937,500
K92
Mining,
Inc.
*
1,702,000
9,766,237
Karora
Resources,
Inc.
*
600,000
2,613,939
Kinross
Gold
Corp.
130,000
1,081,600
Lundin
Gold,
Inc.
130,000
1,920,471
Mineros
SA
3,400,000
2,708,965
New
Gold,
Inc.
*
1,000,000
1,950,000
OceanaGold
Corp.
1,500,000
3,442,857
Osisko
Gold
Royalties,
Ltd.
120,000
1,870,107
Osisko
Gold
Royalties,
Ltd.
50,000
779,000
Osisko
Mining,
Inc.
*
112,500
235,189
Pantoro,
Ltd.
*
11,000,000
700,862
Petropavlovsk
PLC
#*@+
4,886,855
0
Ramelius
Resources,
Ltd.
1,500,000
1,926,826
Red
5,
Ltd.
*
7,199,100
1,724,354
Resolute
Mining,
Ltd.
*
5,000,000
1,738,739
Royal
Gold,
Inc.
8,000
1,001,280
Portfolio
of
Investments
(unaudited)
See
notes
to
portfolios
of
investments
and
notes
to
financial
statements.
Gold
and
Precious
Metals
Fund
Common
Stocks (cont’d)
Shares
Value
Gold
Mining
(cont’d)
Torex
Gold
Resources,
Inc.
*
90,000
$
1,394,686
Wesdome
Gold
Mines,
Ltd.
*
150,000
1,208,289
Westgold
Resources,
Ltd.
725,000
1,166,790
58,416,845
Metal
-
Diversified
6.77%
Aclara
Resources,
Inc.
*
137,400
53,230
Ivanhoe
Mines,
Ltd.
*
175,000
2,257,776
Mandalay
Resources
Corp.
*
250,000
402,032
Vox
Royalty
Corp.
1,500,000
4,155,000
6,868,038
Mining
Services
2.41%
Capital,
Ltd.
575,000
725,267
Empress
Royalty
Corp.
*
2,000,000
526,297
Foraco
International
SA
*
300,000
517,525
Orexplore
Technologies,
Ltd.
#*@
1,007,351
11,424
Star
Royalties,
Ltd.
*
3,500,000
665,180
2,445,693
Precious
Metals
7.43%
Coeur
Mining,
Inc.
*
175,000
983,500
Elemental
Altus
Royalties
Corp.
*
250,000
201,016
EMX
Royalty
Corp.
*
1,250,000
2,256,862
Hecla
Mining
Co.
200,000
970,000
Orla
Mining,
Ltd.
*
250,000
959,395
Pan
American
Silver
Corp.
30,000
596,400
Wheaton
Precious
Metals
Corp.
30,000
1,572,600
7,539,773
Real
Estate
Operating/Development
2.31%
Emerald
Resources
NL
*
1,000,000
2,349,828
Retail
-
Jewelry
0.61%
Mene,
Inc.
*
1,025,000
93,655
Mene,
Inc.,
144A
#*∆
5,714,285
522,120
615,775
Silver
Mining
10.38%
Andean
Precious
Metals
Corp.
*
1,750,000
1,189,650
Aya
Gold
&
Silver,
Inc.
*
700,000
6,948,576
Gatos
Silver,
Inc.
*
75,000
783,000
Santacruz
Silver
Mining,
Ltd.
*
3,000,000
778,480
Silvercorp
Metals,
Inc.
250,000
840,000
10,539,706
Total
Common
Stocks
(cost
$72,946,742)
91,725,553
Portfolio
of
Investments
(unaudited)
See
notes
to
portfolios
of
investments
and
notes
to
financial
statements.
Gold
and
Precious
Metals
Fund
Corporate
Non-Convertible
Bonds
3.54%
Coupon
Rate
%
Maturity
Date
Principal
Amount
Value
Coal
0.00%
Caribbean
Resources
Corp.
#@^
19.25
06/15/15
$
485,766
$
0
Gold
Mining
3.54%
Aris
Gold
Corp.
7.50
08/26/27
2,997,912
3,597,494
Total
Corporate
Non-Convertible
Bonds
3,597,494
(cost
$3,483,660)
Exchange
Traded
Fund
0.19%
Shares
ProShares
UltraShort
Gold
ETF
*
9,000
195,021
(cost
$242,772)
Warrant
0.43%
Exercise
Price
Exp.
Date
Mining
Services
0.43%
Aris
Mining
Corp.
*
$
2.75
07/29/25
1,605,000
434,085
(cost
$65,284
)
Investments,
at
value
94.52%
95,952,153
(cost
$76,738,458
)
Other
assets
and
liabilities,
net
5.48%
5,560,430
Net
Assets
100.00%
$
101,512,583
Notes
to
Portfolios
of
Investments
(
unaudited
)
Legend
General
The
yields
reflect
the
effective
yield
from
the
date
of
purchase.
Variable
and
Floating
Rate
Notes
have
periodic
reset
features,
which
effectively
shorten
the
maturity
dates
and
reset
the
interest
rates
as
tied
to
various
interest-bearing
instruments.
Rates
shown
are
current
rates
at
June
30,
2024.
Fair
Valuation
of
Securities
For
the
Funds’
policies
regarding
the
valuation
of
investments
and
other
significant
accounting
policies,
please
refer
to
the
Notes
to
Financial
Statements.
Pursuant
to
Rule
2a-5
under
the
Investment
Company
Act,
the
Trust’s
Board
of
Trustees
(the
“Board”)
has
designated
the
Adviser,
as
defined
in
Note
3
in
the
Notes
to
Financial
Statements,
◊
Zero
coupon
bond.
Interest
rate
presented
is
yield
to
maturity.
*
Non-income
producing
security.
@
Security
was
fair
valued
at
June
30,
2024,
by
U.S.
Global
Investors,
Inc.
(Adviser)
(other
than
international
securities
fair
valued
pursuant
to
systematic
fair
value
models)
in
accordance
with
valuation
procedures
approved
by
the
Board
of
Trustees.
These
securities,
as
a
percentage
of
net
assets
at
June
30,
2024,
were
0.00%
of
Global
Luxury
Goods
Fund,
3.20%
of
Global
Resources
Fund,
1.34%
of
World
Precious
Minerals
Fund
and
1.26%
of
Gold
And
Precious
Metals
Fund,
respectively.
See
the
Fair
Valuation
of
Securities
section
of
these
Notes
to
Portfolios
of
Investments
for
further
discussion
of
fair
valued
securities.
See
further
information
and
detail
on
restricted
securities
in
the
Restricted
Securities
section
of
these
Notes
to
Portfolios
of
Investments.
#
Illiquid
Security.
∆
Pursuant
to
Rule
144A
of
the
Securities
Act
of
1933,
these
securities
may
be
resold
in
transactions
exempt
from
registration,
normally
to
qualified
institutional
buyers.
The
market
value
of
these
securities
and
percentage
of
net
assets
as
of
June
30,
2024
amounted
to
$37,279,
0.08%,
of
Global
Luxury
Goods
Fund,
$1,189,044,
2.85%,
of
Global
Resources
Fund,
$801,057,
1.93%,
of
World
Precious
Minerals
Fund
and
$522,120,
0.52%,
of
Gold
And
Precious
Metals
Fund.
~
Affiliated
Company.
(see
following)
+
See
"Restricted
Securities"
in
Notes
to
Portfolios
of
Investments.
^
Security
is
currently
in
default
and
is
on
scheduled
interest
or
principal
payment.
ADR
American
Depositary
Receipt
AGM
Assured
Guaranty
Municipal
BAM
Build
American
Mutual
Assurance
Company
COP
Certificate
of
Participation
ETF
Exchange
Traded
Fund
FHLMC
Federal
Home
Loan
Mortgage
Corporation
FNMA
Federal
National
Mortgage
Association
GNMA
Government
National
Mortgage
Association
GO
General
Obligation
LP
Limited
Partnership
MTN
Medium
Term
Note
PLC
Public
Limited
Company
RB
Revenue
Bond
S&P
Standard
&
Poor’s
SPDR
Standard
&
Poor’s
Depositary
Receipt
Notes
to
Portfolios
of
Investments
(
unaudited
)
as
the
Funds’
valuation
designee
to
perform
any
fair
value
determinations
for
securities
and
other
assets
held
by
the
Funds.
The
Funds
are
required
to
disclose
information
regarding
the
fair
value
measurements
of
a
Fund’s
assets
and
liabilities.
Fair
value
is
the
price
that
would
be
received
to
sell
an
asset
or
paid
to
transfer
a
liability
in
an
orderly
transaction
between
market
participants
at
the
measurement
date.
The
measurement
requirements
established
a
three-tier
hierarchy
to
maximize
the
use
of
observable
market
data
and
minimize
the
use
of
unobservable
inputs
and
to
establish
classification
of
fair
value
measurements
for
disclosure
purposes.
Inputs
refer
broadly
to
the
assumptions
that
market
participants
would
use
in
pricing
the
asset
or
liability,
including
assumptions
about
risk,
for
example,
the
risk
inherent
in
a
particular
valuation
technique
used
to
measure
fair
value
including
such
a
pricing
model
and/or
the
risk
inherent
in
the
inputs
to
the
valuation
technique.
Inputs
may
be
observable
or
unobservable.
Observable
inputs
are
inputs
that
reflect
the
assumptions
market
participants
would
use
in
pricing
the
asset
or
liability
developed
based
on
market
data
obtained
from
sources
independent
of
the
reporting
entity.
Unobservable
inputs
are
inputs
that
reflect
the
reporting
entity’s
own
assumptions
about
the
assumptions
market
participants
would
use
in
pricing
the
asset
or
liability
developed
based
on
the
best
information
available
in
the
circumstances.
The
inputs
or
methodology
used
for
valuing
securities
are
not
necessarily
an
indication
of
the
risk
associated
with
investing
in
those
securities.
Because
of
the
inherent
uncertainties
of
valuation,
the
values
reflected
in
the
portfolios
may
materially
differ
from
the
values
received
upon
actual
sale
of
those
investments.
The
three
levels
defined
by
the
fair
value
hierarchy
are
as
follows:
Level
1
–
Quoted
prices
in
active
markets
for
identical
securities.
Level
2
–
Prices
determined
using
significant
other
observable
inputs
(including
quoted
prices
for
similar
securities,
interest
rates,
prepayment
speeds,
credit
risk,
etc.).
Short-term
securities
with
maturities
of
sixty
days
or
less
are
valued
at
amortized
cost,
which
approximates
market
value,
and
are
categorized
as
Level
2
in
the
hierarchy.
Municipal
securities,
long-
term
U.S.
government
obligations
and
corporate
debt
securities
are
valued
in
accordance
with
the
evaluated
price
supplied
by
a
pricing
service
and
generally
categorized
as
Level
2
in
the
hierarchy.
Other
securities
that
are
categorized
as
Level
2
in
the
hierarchy
include,
but
are
not
limited
to,
warrants
that
do
not
trade
on
an
exchange,
securities
valued
at
the
mean
Notes
to
Portfolios
of
Investments
(
unaudited
)
between
the
last
reported
bid
and
ask
quotation
and
international
equity
securities
valued
by
an
independent
third
party
in
order
to
adjust
for
stale
pricing.
Level
3
–
Prices
determined
using
significant
unobservable
inputs
(including
the
Fund’s
own
assumptions).
For
restricted
equity
securities
and
private
placements
where
observable
inputs
are
limited,
assumptions
about
market
activity
and
risk
are
used
in
determining
fair
value.
The
following
table
summarizes
the
valuation
of
each
Fund’s
securities
as
of
June
30,
2024,
using
the
fair
value
hierarchy:
Quoted
Prices
in
Active
Markets
for
Identical
Investments
(Level
1)
Significant
Other
Observable
Inputs
(Level
2)
Significant
Unobservable
Inputs
(Level
3)
Total
U.S.
Government
Securities
Ultra-Short
Bond
Fund
Investments
in
Securities*
United
States
Government
and
Agency
Obligations
$
–
$
22,632,231
$
–
$
22,632,231
Investments,
at
Value
$
–
$
22,632,231
$
–
$
22,632,231
Quoted
Prices
in
Active
Markets
for
Identical
Investments
(Level
1)
Significant
Other
Observable
Inputs
(Level
2)
Significant
Unobservable
Inputs
(Level
3)
Total
Near-Term
Tax
Free
Fund
Investments
in
Securities*
Municipal
Bonds
$
–
$
22,263,250
$
–
$
22,263,250
Investments,
at
Value
$
–
$
22,263,250
$
–
$
22,263,250
Quoted
Prices
in
Active
Markets
for
Identical
Investments
(Level
1)
Significant
Other
Observable
Inputs
(Level
2)
Significant
Unobservable
Inputs
(Level
3)
Total
Global
Luxury
Goods
Fund
Investments
in
Securities*
Common
Stocks
Apparel
Manufacturers
$
2,711,598
$
3,387,234
$
–
$
6,098,832
Athletic
Footwear
376,850
–
–
376,850
Automotive
-
Cars
&
Light
Trucks
2,041,375
2,288,266
–
4,329,641
Beverages
-
Wine/Spirits
1,785,523
424,320
–
2,209,843
Casino
Hotels
465,400
–
–
465,400
Cosmetics
&
Toiletries
106,400
–
–
106,400
Cruise
Lines
2,770,004
–
–
2,770,004
Notes
to
Portfolios
of
Investments
(
unaudited
)
Global
Luxury
Goods
Fund
Common
Stocks
(continued)
Diversified
Banking
Institution
$
3,755,860
$
–
$
–
$
3,755,860
E-Commerce/Products
2,315,135
–
–
2,315,135
Energy
-
Alternate
Sources
–
–
0
0
Finance
-
Credit
Card
486,255
–
–
486,255
Finance
-
Mortgage
Loan/
Banker
–
–
0
0
Gold
Mining
3,112,238
874,025
–
3,986,263
Hotels
&
Motels
–
2,073,233
–
2,073,233
Investment
Management/
Advisory
Services
1,771,050
–
–
1,771,050
Oil
Companies
-
Exploration
&
Production
37,279
–
–
37,279
Precious
Metals
235,890
–
–
235,890
Private
Equity
3,674,898
–
–
3,674,898
Real
Estate
Operating/
Development
–
–
0
0
Retail
-
Apparel/Shoe
1,657,785
3,898,221
–
5,556,006
Retail
-
Jewelry
–
3,185,047
–
3,185,047
Silver
Mining
97,800
–
–
97,800
Textile
-
Apparel
1,960,733
–
–
1,960,733
Corporate
Non-Convertible
Bond
–
747,680
–
747,680
Investments,
at
Value
29,362,073
16,878,026
0
46,240,099
Other
Financial
Instruments
†
Currency
Contract
–
1,650
–
1,650
Quoted
Prices
in
Active
Markets
for
Identical
Investments
(Level
1)
Significant
Other
Observable
Inputs
(Level
2)
Significant
Unobservable
Inputs
(Level
3)
Total
Global
Resources
Fund
Investments
in
Securities*
Common
Stocks
Advanced
Materials/
Production
$
332,590
$
–
$
–
$
332,590
Agricultural
Chemicals
370,600
244,233
–
614,833
Agricultural
Operations
480,465
–
–
480,465
Building
Products
-
Wood
387,785
–
–
387,785
Chemicals
-
Specialty
544,024
–
–
544,024
Coal
–
–
0
0
Diamonds/Precious
Stones
200,066
–
–
200,066
Diversified
Minerals
965,772
50,445
204,190
1,220,407
Electric
-
Integrated
381,272
–
–
381,272
Energy
-
Alternate
Sources
147,500
–
0
147,500
Enterprise
Software/
Services
2,997,698
350,864
–
3,348,562
Notes
to
Portfolios
of
Investments
(
unaudited
)
Global
Resources
Fund
Common
Stocks
(continued)
Food
-
Miscellaneous/
Diversified
$
458,800
$
–
$
–
$
458,800
Gold
Mining
5,056,819
306,951
50,833
5,414,603
Industrial
Gases
877,620
–
–
877,620
Investment
Companies
–
138,866
–
138,866
Metal
-
Copper
812,020
–
–
812,020
Metal
-
Diversified
5,607,790
584,129
292,387
6,484,306
Metal
-
Iron
–
–
0
0
Mining
Services
269,770
–
–
269,770
Natural
Resource
Technology
–
–
126,171
126,171
Non-Ferrous
Metals
2,070,101
133,530
0
2,203,631
Oil
-
US
Royalty
Trusts
1,650,400
265,350
–
1,915,750
Oil
Companies
-
Exploration
&
Production
3,914,482
–
–
3,914,482
Oil
Companies
-
Field
Services
1,312,555
–
–
1,312,555
Oil
Companies
-
Integrated
627,720
–
–
627,720
Oil
Refining
&
Marketing
520,440
–
–
520,440
Paper
&
Related
Products
480,200
–
–
480,200
Pipelines
1,311,225
–
–
1,311,225
Precious
Metals
419,884
–
–
419,884
Real
Estate
Operating/
Development
352,213
–
0
352,213
Retail
-
Jewelry
68,528
–
–
68,528
Silver
Mining
353,788
–
16,081
369,869
Corporate
Convertible
Bond
–
–
505,640
505,640
Corporate
Non-Convertible
Bonds
–
1,410,718
–
1,410,718
Right
–
0
–
0
Exchange
Traded
Fund
42,108
–
–
42,108
Warrants
Diamonds/Precious
Stones
–
0
–
0
Diversified
Minerals
–
0
–
0
Gold
Mining
–
0
–
0
Investment
Companies
–
0
–
0
Metal
-
Copper
–
0
–
0
Metal
-
Diversified
–
0
–
0
Mining
Services
129,820
–
–
129,820
Non-Ferrous
Metals
–
2,335
–
2,335
Oil
Companies
-
Exploration
&
Production
–
29,604
–
29,604
Real
Estate
Operating/
Development
–
0
–
0
Silver
Mining
–
19,188
0
19,188
Investments,
at
Value
33,144,055
3,536,213
1,195,302
37,875,570
Notes
to
Portfolios
of
Investments
(
unaudited
)
Quoted
Prices
in
Active
Markets
for
Identical
Investments
(Level
1)
Significant
Other
Observable
Inputs
(Level
2)
Significant
Unobservable
Inputs
(Level
3)
Total
World
Precious
Minerals
Fund
Investments
in
Securities*
Common
Stocks
Advanced
Materials/
Production
$
2,763,057
$
–
$
–
$
2,763,057
Coal
–
–
0
0
Diamonds/Precious
Stones
365,338
–
–
365,338
Diversified
Minerals
1,282,951
239,757
0
1,522,708
Energy
-
Alternate
Sources
–
59,900
–
59,900
Financial
Services
1,382
–
–
1,382
Gold
Mining
16,877,305
3,007,099
60,305
19,944,709
Metal
-
Copper
210,097
–
–
210,097
Metal
-
Diversified
1,837,813
263,352
292,387
2,393,552
Mining
Services
19,779
232,996
3,031
255,806
Non-Ferrous
Metals
305,703
–
–
305,703
Oil
Companies
-
Exploration
&
Production
–
–
0
0
Optical
Recognition
Equipment
–
–
132
132
Precious
Metals
6,820,858
430,682
36,357
7,287,897
Real
Estate
Operating/
Development
469,949
–
–
469,949
Retail
-
Jewelry
193,250
–
–
193,250
Silver
Mining
3,060,178
–
64,325
3,124,503
Corporate
Non-Convertible
Bond
–
925,296
–
925,296
Exchange
Traded
Fund
86,676
–
–
86,676
Warrants
Diamonds/Precious
Stones
–
0
–
0
Diversified
Minerals
–
0
–
0
Gold
Mining
–
0
–
0
Metal
-
Diversified
–
0
–
0
Mining
Services
174,446
–
–
174,446
Oil
Companies
-
Exploration
&
Production
–
0
–
0
Precious
Metals
–
0
–
0
Real
Estate
Operating/
Development
–
0
–
0
Silver
Mining
–
19,188
0
19,188
Investments,
at
Value
34,468,782
5,178,270
456,537
40,103,589
Notes
to
Portfolios
of
Investments
(
unaudited
)
The
following
is
a
reconciliation
of
assets
for
which
unobservable
inputs
(Level
3)
were
used
in
determining
fair
value
during
the
period
January
1,
2024
through
June
30,
2024:
Quoted
Prices
in
Active
Markets
for
Identical
Investments
(Level
1)
Significant
Other
Observable
Inputs
(Level
2)
Significant
Unobservable
Inputs
(Level
3)
Total
Gold
And
Precious
Metals
Fund
Investments
in
Securities*
Common
Stocks
Distribution/Wholesale
$
485,550
$
–
$
–
$
485,550
Diversified
Minerals
1,153,819
–
1,010,756
2,164,575
Enterprise
Software/
Services
299,770
–
–
299,770
Gold
Mining
48,054,770
10,107,910
254,165
58,416,845
Metal
-
Diversified
6,868,038
–
–
6,868,038
Mining
Services
1,709,002
725,267
11,424
2,445,693
Precious
Metals
7,539,773
–
–
7,539,773
Real
Estate
Operating/
Development
–
2,349,828
–
2,349,828
Retail
-
Jewelry
615,775
–
–
615,775
Silver
Mining
10,539,706
–
–
10,539,706
Corporate
Non-Convertible
Bonds
–
3,597,494
0
3,597,494
Exchange
Traded
Fund
195,021
–
–
195,021
Warrant
Mining
Services
434,085
–
–
434,085
Investments,
at
Value
$
77,895,309
$
16,780,499
$
1,276,345
$
95,952,153
*
Refer
to
the
Portfolio
of
Investments
for
a
detailed
list
of
the
Fund’s
investments.
†
Other
Financial
Instruments
are
derivatives
not
reflected
in
the
Portfolio
of
Investments,
such
as
Currency
Contracts,
which
are
valued
at
the
unrealized
appreciation
(depreciation)
at
period
end.
Common
Stocks
Total
Global
Luxury
Goods
Fund
Beginning
Balance
12/31/23
$
0
$
0
Net
change
in
unrealized
appreciation
(depreciation)
—
—
Ending
Balance
06/30/24
$
0
$
0
Net
change
in
unrealized
appreciation
(depreciation)
from
Investments
held
as
of
06/30/24
(1)
$
—
$
—
Common
Stocks
Corporate
Convertible
Bond
Warrants
Total
Global
Resources
Fund
Beginning
Balance
12/31/23
$
732,376
$
509,860
$
0
$
1,242,236
Net
change
in
unrealized
appreciation
(depreciation)
(58,795)
(4,220)
—
(63,015)
Ending
Balance
06/30/24
$
673,581
$
505,640
$
0
$
1,179,221
Net
change
in
unrealized
appreciation
(depreciation)
from
Investments
held
as
of
06/30/24
(1)
$
(58,795)
$
(4,220)
$
—
$
(63,015)
Notes
to
Portfolios
of
Investments
(
unaudited
)
(
Significant
unobservable
inputs
developed
by
the
Adviser
for
Level
3
investments
held
at
period
end
are
as
follows:
Common
Stock
Warrants
Total
World
Precious
Minerals
Fund
Beginning
Balance
12/31/23
$
404,295
$
0
$
404,295
Transfers
(346)
—
(346)
Net
change
in
unrealized
appreciation
(depreciation)
(11,737)
—
(11,737)
Ending
Balance
06/30/24
$
392,212
$
0
$
392,212
Net
change
in
unrealized
appreciation
(depreciation)
from
Investments
held
as
of
06/30/24
(1)
$
(11,737)
$
—
$
(11,737)
Common
Stocks
Corporate
Non-
Convertible
Bond
Total
Gold
and
Precious
Metals
Fund
Beginning
Balance
12/31/23
$
1,511,115
$
0
$
1,511,115
Transfers
11,424
—
11,424
Net
change
in
unrealized
appreciation
(depreciation)
(246,194)
—
(246,194)
Ending
Balance
06/30/24
$
1,276,345
$
0
$
1,276,345
Net
change
in
unrealized
appreciation
(depreciation)
from
Investments
held
as
of
06/30/24
(1)
$
(246,194)
$
—
$
(246,194)
(1)
The
amounts
shown
represent
the
net
change
in
unrealized
appreciation
(depreciation)
attributable
to
only
those
investments
still
held
and
classified
as
Level
3
at
June
30,
2024.
Fair
Value
at
06/30/24
Valuation
Technique(s)
Unobservable
Input
Range
(Weighted
Average)
Global
Luxury
Goods
Fund
Investments
in
Securities
Common
Stocks
$
0
Market
Transaction
(1)
Discount
100%
Global
Resources
Fund
Investments
in
Securities
0%
-
100%
discount
(98%
discount)
Common
Stocks
689,662
Market
Transaction
(1)
Discount
Corporate
Convertible
Bond
505,640
Market
Transaction
(1)
Discount
0%
Warrants
0
Market
Transaction
(1)
Discount
0%
World
Precious
Minerals
Fund
Investments
in
Securities
0%
-
100%
discount
(95%
discount)
Common
Stocks
456,537
Market
Transaction
(1)
Discount
Warrants
0
Market
Transaction
(1)
Discount
100%
Gold
and
Precious
Metals
Fund
Investments
in
Securities
0%
-
100%
discount
(5%
discount)
Common
Stocks
1,276,345
Market
Transaction
(1)
Discount
Notes
to
Portfolios
of
Investments
(
unaudited
)
The
majority
of
securities
classified
as
Level
3
are
private
companies.
The
initial
valuation
is
usually
cost,
which
is
then
adjusted
as
determined
by
the
Valuation
Committee
for
subsequent
known
market
transactions
and
evaluated
for
progress
against
anticipated
milestones
and
current
operations.
An
evaluation
that
the
holding
no
longer
meets
expectations
could
result
in
the
application
of
discounts
and
a
significantly
lower
fair
valuation.
For
certain
securities,
the
last
known
market
transaction
is
increased
or
decreased
by
changes
in
a
market
index
or
industry
peers
as
approved
by
the
Valuation
Committee.
Affiliated
Companies
The
Investment
Company
Act
of
1940
defines
affiliates
as
companies
in
which
the
Fund
owns
at
least
5%
of
the
outstanding
voting
securities.
The
following
is
a
summary
of
transactions
with
each
affiliated
company
during
the
period
ended
June
30,
2024.
At
June
30,
2024,
the
value
of
investments
in
affiliated
companies
was
$0,
representing
0%
of
net
assets,
and
the
total
cost
was
$2,400,000.
Fair
Value
at
06/30/24
Valuation
Technique(s)
Unobservable
Input
Range
(Weighted
Average)
Corporate
Non-Convertible
Bond
0
Market
Transaction
(1)
Discount
100%
(1)
Market
Transaction
refers
to
most
recent
known
market
transaction,
including
transactions
in
which
the
fund
participated,
as
adjusted
for
any
discount
or
premium
as
discussed
below.
Shares
of
Affiliated
Companies
Global
Resources
Fund
December
31,
2023
Additions
Reductions
June
30
,
2024
Pacific
Green
Energy
Corp.
2,400,000
—
—
2,400,000
Values
of
Affiliated
Companies
Global
Resources
Fund
December
31,
2023
Purchases
Cost
Sales
Proceeds
June
30
,
2024
Income
Realized
Gain
(Loss)
on
Investments
Change
in
Unrealized
Appreciation
(Depreciation)
Pacific
Green
Energy
Corp.
$
0
$
—
$
—
$
0
$
—
$
—
$
—
Shares
of
Affiliated
Companies
World
Precious
Minerals
Fund
December
31,
2023
Additions
Reductions
June
30
,
202
4
First
Nordic
Metals
Corp.
(formerly
Barsele
Minerals
Corp.)
7,550,000
—
(7,550,000)
—
(a)
Kesselrun
Resources,
Ltd.
5,000,000
—
—
5,000,000
Mammoth
Resources
Corp.
5,500,000
—
—
5,500,000
TriStar
Gold,
Inc.
28,800,000
—
—
28,800,000
Waraba
Gold
Ltd.
8,200,000
—
—
8,200,000
Waraba
Gold,
Ltd.
5,390,000
—
(
5,390,000
)
—
Notes
to
Portfolios
of
Investments
(
unaudited
)
At
June
30,
2024,
the
value
of
investments
in
affiliated
companies
was
$5,105,991,
representing
12.27%
of
net
assets,
and
the
total
cost
was
$5,670,311.
Restricted
Securities
The
following
securities
are
subject
to
contractual
and
regulatory
restrictions
on
resale
or
transfer.
These
investments
may
involve
a
high
degree
of
business
and
financial
risk.
Because
of
the
thinly
traded
markets
for
these
investments,
a
Fund
may
be
unable
to
liquidate
its
securities
in
a
timely
manner,
especially
if
there
is
negative
news
regarding
the
specific
securities
or
the
markets
overall.
These
securities
could
decline
significantly
in
value
before
the
Fund
could
liquidate
these
securities.
The
issuer
bears
the
cost
of
registration,
if
any,
involved
in
the
disposition
of
these
securities.
As
of
June
30,
2024,
the
total
cost
of
restricted
securities
was
$426,625,
and
the
total
value
was
$0,
representing
0.00%
of
net
assets.
As
of
June
30,
2024,
the
total
cost
of
restricted
securities
was
$7,473,544,
and
the
total
value
was
$126,171,
representing
0.30%
of
net
assets.
As
of
June
30,
2024,
the
total
cost
of
restricted
securities
was
$1,362,590,
and
the
total
value
was
$0,
representing
0.00%
of
net
assets.
Values
of
Affiliated
Companies
World
Precious
Minerals
Fund
December
31,
2023
Purchases
Cost
Sales
Proceeds
June
30,
2024
Income
Realized
Gain
(Loss)
on
Investments
Change
in
Unrealized
Appreciation
(Depreciation)
First
Nordic
Metals
Corp.
(formerly
Barsele
Minerals
Corp.)
$
769,216
$
—
$
(1,558,332)
$
—
(a)
$
—
$
–
$
789,116
Kesselrun
Resources,
Ltd.
169,805
—
—
164,468
—
–
(5,337)
Mammoth
Resources
Corp.
62,262
—
—
70,356
—
–
8,094
TriStar
Gold,
Inc.
1,956,153
—
—
4,631,410
—
–
2,675,257
Waraba
Gold,
Ltd.
371,307
—
—
239,757
—
–
(131,550)
$
3,328,743
$
—
$
(1,558,332)
$
5,105,991
$
—
$
–
$
1,757,348
(a)
At
June
30,
2024,
the
company
was
no
longer
defined
as
an
affiliate,
although
it
was
an
affiliate
company
during
the
period.
Global
Luxury
Goods
Fund
Acquisition
Date
Cost
per
Share/Unit
Infrastructure
Ventures,
Inc.
08/06/10-11/22/10
$
1.00
Global
Resources
Fund
Acquisition
Date
Cost
per
Share/Unit
I-Pulse,
Inc.,
144A
10/04/07
$
1.88
Infrastructure
Ventures,
Inc.
08/06/10-11/22/10
$
1.00
Gold
and
Precious
Metals
Fund
Acquisition
Date
Cost
per
Share/Unit
Petropavlovsk
PLC
09/15/21-10/07/21
$
0.28
Statements
of
Assets
and
Liabilities
(unaudited)
See
accompanying
notes
to
financial
statements.
U.S.
Government
Securities
Ultra-
Short
Bond
Fund
Investments,
at
identified
cost
$
22,674,080
Assets
Investments,
at
value:
Securities
of
unaffiliated
issuers
$
22,632,231
Securities
of
affiliated
issuers
–
Cash
6,292,167
Deposits
with
brokers
–
Unrealized
gain
on
forward
foreign
currency
contracts
–
Foreign
currencies
(Cost
$494,612,
$0,
$0,
$544,
$262,588
and
$861,294)
–
Receivables:
Dividends
and
interest
86,367
Capital
shares
sold
1,082,752
Investments
sold
–
From
adviser
6,239
Prepaid
expenses
20,780
Total
Assets
30,120,536
Liabilities
Due
to
custodian
–
Payables:
Capital
shares
redeemed
3,324
Distributions
payable
15,684
Investments
purchased
–
Accrued
expenses
and
other
payables:
Adviser
–
Administration
and
Transfer
Agent
fees
7,344
Trustees
385
Other
expenses
21,385
Total
Liabilities
48,122
Net
Assets
$
30,072,414
Net
Assets
Consist
of:
Paid-in
capital
$
30,913,570
Distributable
earnings
(841,156)
Net
assets
applicable
to
capital
shares
outstanding
$
30,072,414
By
share
class
Net
Assets
Investor
Class
$
30,072,414
Capital
shares
outstanding,
an
unlimited
number
of
no
par
shares
authorized
Investor
Class
15,471,959
Net
Asset
Value,
Public
Offering
Price
and
Redemption
Price
per
share
Investor
Class
$
1.94
Near-Term
Tax
Free
Fund
Global
Luxury
Goods
Fund
Global
Resources
Fund
World
Precious
Minerals
Fund
Gold
and
Precious
Metals
Fund
$
22,465,097
$
43,294,885
$
78,620,169
$
70,793,564
$
76,738,458
$
22,263,250
$
46,240,099
$
37,875,570
$
34,997,598
$
95,952,153
–
–
–
5,105,991
–
2,441,012
2,025,683
2,729,786
1,944,824
4,873,771
–
–
–
–
–
–
1,650
–
–
–
–
550
866,352
495,975
263,105
345,087
253,234
118,602
19,422
252,779
2,766
3,756
2,008
815
36,703
–
112,293
157,945
188,717
520,602
8,088
–
–
–
–
19,776
18,847
65,478
19,598
26,883
25,079,979
48,656,112
41,815,741
42,772,940
101,925,996
–
–
–
–
–
8,117
1,163
3,829
1,082,774
233,378
10,072
–
–
–
–
–
127,004
31,212
11,515
–
–
15,846
4,281
2,863
75,785
7,092
11,689
13,347
17,824
25,369
713
–
16
562
–
23,715
37,678
33,227
40,744
78,881
49,709
193,380
85,912
1,156,282
413,413
$
25,030,270
$
48,462,732
$
41,729,829
$
41,616,658
$
101,512,583
$
28,008,198
$
43,403,498
$
332,005,380
$
440,989,365
$
146,291,082
(2,977,928)
5,059,234
(290,275,551)
(399,372,707)
(44,778,499)
$
25,030,270
$
48,462,732
$
41,729,829
$
41,616,658
$
101,512,583
$
25,030,270
$
48,462,732
$
41,729,829
$
41,616,658
$
101,512,583
11,977,426
2,374,821
10,539,113
27,091,104
9,034,034
$
2.09
$
20.41
$
3.96
$
1.54
$
11.24
Statements
of
Operations
(unaudited)
See
accompanying
notes
to
financial
statements.
U.S.
Government
Securities
Ultra-
Short
Bond
Fund
Net
Investment
Income
Income
Dividends
from
unaffiliated
issuers
$
–
Foreign
tax
withheld
on
dividends
–
Net
dividends
–
Interest
and
other
692,595
Total
income
692,595
Expenses:
Management
fee
76,088
Administrative
services
fee
32,681
Distribution
plan
fee
–
Transfer
agent
fees
and
expenses
13,366
Professional
fees
15,812
Custodian
fees
1,787
Shareholder
reporting
expenses
8,819
Registration
fees
10,157
Trustee
fees
and
expenses
5,589
Chief
compliance
officer
fees
2,174
Miscellaneous
expenses
17,577
Total
expenses
before
reductions
184,050
Expenses
offset
-
Note
1
H
–
Expenses
reimbursed
-
Note
3
(115,571)
Net
expenses
68,479
Net
Investment Income
(Loss)
624,116
Net
Realized
and
Unrealized
Gain
(Loss)
on
Investments
Realized
gain
(loss)
from:
Securities
from
unaffiliated
issuers
(14,292)
Foreign
currency
transactions
–
Forward
currency
contract
transactions
–
Net
realized
gain
(loss)
(14,292)
Net
change
in
unrealized
appreciation
(depreciation)
of:
Investments
in
unaffiliated
issuers
(129,359)
Investments
in
affiliated
issuers
–
Other
assets
and
liabilities
denominated
in
foreign
currencies
–
Forward
currency
contracts
–
Net
change
in
unrealized
appreciation
(depreciation)
(129,359)
Net
Realized
and
Unrealized
Gain
(Loss)
on
Investments
(143,651)
Net
Increase
(Decrease)
In
Net
Assets
Resulting
From
Operations
$
480,465
Six
Months
Ended
June
30,
2024
Near-Term
Tax
Free
Fund
Global
Luxury
Goods
Fund
Global
Resources
Fund
World
Precious
Minerals
Fund
Gold
and
Precious
Metals
Fund
$
–
$
699,317
$
312,419
$
67,123
$
451,097
–
(96,611)
(17,412)
(514)
(39,424)
–
602,706
295,007
66,609
411,673
364,499
143,918
146,958
106,068
454,545
364,499
746,624
441,965
172,677
866,218
63,200
184,651
145,070
145,165
434,999
29,692
50,704
51,315
50,844
87,607
–
60,747
53,510
49,961
120,833
11,585
16,868
27,664
35,746
39,051
14,775
20,254
18,014
17,100
29,348
1,580
7,397
8,588
9,192
10,856
8,949
10,471
10,830
11,393
14,902
9,999
10,603
9,920
11,268
11,844
5,309
7,034
6,560
6,555
10,754
1,807
3,463
3,050
2,853
6,898
25,777
33,787
47,131
40,402
79,763
172,673
405,979
381,652
380,479
846,855
(1,568)
(7,373)
(8,567)
(9,172)
(10,808)
(114,226)
(31,715)
(56,782)
(76,260)
–
56,879
366,891
316,303
295,047
836,047
307,620
379,733
125,662
(122,370)
30,171
–
1,537,203
(1,271,343)
(791,674)
741,601
–
(45,496)
(5,353)
(12,759)
(28,357)
–
(42,683)
–
–
20
–
1,449,024
(1,276,696)
(804,433)
713,264
(115,034)
953,732
1,010,164
(260,897)
11,448,151
–
–
–
3,335,579
–
–
(3,372)
(30,133)
149
(542)
–
128,336
–
–
–
(115,034)
1,078,696
980,031
3,074,831
11,447,609
(115,034)
2,527,720
(296,665)
2,270,398
12,160,873
$
192,586
$
2,907,453
$
(171,003)
$
2,148,028
$
12,191,044
Statements
of
Changes
in
Net
Assets
See
accompanying
notes
to
financial
statements.
U.S.
Government
Securities
Ultra-Short
Bond
Fund
For
the
Six
Months
Ended
June
30,
2024
Year
Ended
December
31,
2023
Increase
(Decrease)
in
Net
Assets
(Unaudited)
From
operations:
Net
investment
income
$
624,116
$
1,169,340
Net
realized
gain
(loss)
(14,292)
(52,344)
Net
change
in
unrealized
appreciation
(depreciation)
(129,359)
216,642
Net
increase
in
net
assets
from
operations
480,465
1,333,638
Distributions
to
shareholders
Investor
Class
(618,586)
(1,170,048)
Total
distributions
paid
(618,586)
(1,170,048)
From
capital
share
transactions:
Proceeds
from
shares
sold
Investor
Class
4,697,895
9,074,680
Distributions
reinvested
Investor
Class
495,170
937,626
5,193,065
10,012,306
Cost
of
shares
redeemed
Investor
Class
(6,310,478)
(12,965,376)
Net
decrease
in
net
assets
from
capital
share
transactions
(1,117,413)
(2,953,070)
Net
Increase
(Decrease)
in
Net
Assets
(1,255,534)
(2,789,480)
Net
Assets
Beginning
of
period
31,327,948
34,117,428
End
of
period
$
30,072,414
$
31,327,948
Capital
Share
Activity
Investor
Class
Shares
sold
2,412,939
4,658,686
Shares
reinvested
254,547
482,720
Shares
redeemed
(3,235,821)
(6,656,999)
Net
capital
share
activity
(568,335)
(1,515,593)
Near-Term
Tax
Free
Fund
Global
Luxury
Goods
Fund
For
the
Six
Months
Ended
June
30,
2024
Year
Ended
December
31,
2023
For
the
Six
Months
Ended
June
30,
2024
Year
Ended
December
31,
2023
(Unaudited)
(Unaudited)
$
307,620
$
696,073
$
379,733
$
296,428
–
(6,489)
1,449,024
7,599,696
(115,034)
106,931
1,078,696
1,534,929
192,586
796,515
2,907,453
9,431,053
(304,160)
(696,647)
–
(1,251,610)
(304,160)
(696,647)
–
(1,251,610)
2,822,810
3,914,838
1,373,971
3,901,367
239,249
537,605
–
1,198,852
3,062,059
4,452,443
1,373,971
5,100,219
(3,313,844)
(10,036,551)
(3,063,289)
(6,356,444)
(251,785)
(5,584,108)
(1,689,318)
(1,256,225)
(363,359)
(5,484,240)
1,218,135
6,923,218
25,393,629
30,877,869
47,244,597
40,321,379
$
25,030,270
$
25,393,629
$
48,462,732
$
47,244,597
1,348,508
1,871,684
67,920
205,753
114,564
257,398
–
62,962
(1,584,361)
(4,810,797)
(151,468)
(337,630)
(121,289)
(2,681,715)
(83,548)
(68,915)
Statements
of
Changes
in
Net
Assets
See
accompanying
notes
to
financial
statements.
Global
Resources
Fund
For
the
Six
Months
Ended
June
30,
2024
Year
Ended
December
31,
2023
Increase
(Decrease)
in
Net
Assets
(Unaudited)
From
operations:
Net
investment
income
(loss)
$
125,662
$
174,945
Net
realized
gain
(loss)
(1,276,696)
(4,532,933)
Net
change
in
unrealized
appreciation
980,031
333,302
Net
increase
(decrease)
in
net
assets
from
operations
(171,003)
(4,024,686)
Distributions
to
shareholders
From
capital
share
transactions:
Proceeds
from
shares
sold
Investor
Class
694,033
1,547,349
694,033
1,547,349
Cost
of
shares
redeemed
Investor
Class
(4,132,321)
(7,236,681)
Net
decrease
in
net
assets
from
capital
share
transactions
(3,438,288)
(5,689,332)
Net
Increase
(Decrease)
in
Net
Assets
(3,609,291)
(9,714,018)
Net
Assets
Beginning
of
period
45,339,120
55,053,138
End
of
period
$
41,729,829
$
45,339,120
Capital
Share
Activity
Investor
Class
Shares
sold
177,393
374,214
Shares
redeemed
(1,055,578)
(1,748,254)
Net
capital
share
activity
(878,185)
(1,374,040)
World
Precious
Minerals
Fund
Gold
and
Precious
Metals
Fund
For
the
Six
Months
Ended
June
30,
2024
Year
Ended
December
31,
2023
For
the
Six
Months
Ended
June
30,
2024
Year
Ended
December
31,
2023
(Unaudited)
(Unaudited)
$
(122,370)
$
(443,563)
$
30,171
$
383,786
(804,433)
(8,997,096)
713,264
(498,323)
3,074,831
1,192,983
11,447,609
1,629,967
2,148,028
(8,247,676)
12,191,044
1,515,430
3,556,332
11,690,928
12,121,985
28,339,803
3,556,332
11,690,928
12,121,985
28,339,803
(6,832,040)
(15,198,788)
(20,702,606)
(42,042,560)
(3,275,708)
(3,507,860)
(8,580,621)
(13,702,757)
(1,127,680)
(11,755,536)
3,610,423
(12,187,327)
42,744,338
54,499,874
97,902,160
110,089,487
$
41,616,658
$
42,744,338
$
101,512,583
$
97,902,160
2,579,000
7,365,869
1,174,824
2,952,052
(4,872,142)
(9,409,900)
(2,033,777)
(4,345,126)
(2,293,142)
(2,044,031)
(858,953)
(1,393,074)
Notes
to
Financial
Statements
Note
1:
Organization
and
Significant
Accounting
Policies
U.S.
Global
Investors
Funds
(“Trust”),
consisting
of
the
six
separate
funds
(“Funds”)
included
in
this
report,
is
organized
as
a
Delaware
statutory
trust.
Each
Fund
is
an
open-
end
management
investment
company
registered
under
the
Investment
Company
Act
of
1940,
as
amended,
and
follows
the
specialized
accounting
and
reporting
guidance
in
FASB
Accounting
Standards
Codification
Topic
946.
All
Funds
are
diversified
with
the
exception
of
World
Precious
Minerals
and
Gold
and
Precious
Metals.
A
non-diversified
fund
may
invest
a
greater
percentage
of
its
assets
in
a
smaller
number
of
issuers
in
comparison
to
a
diversified
fund.
On
June
14,
2019,
the
Institutional
Shares
of
the
Global
Resources
Fund
and
the
World
Precious
Minerals
Fund
were
liquidated
and
terminated
pursuant
to
a
Board
approved
Plan
of
Share
Class
Termination.
On
the
Liquidation
Date,
each
Fund
made
a
liquidating
distribution
to
shareholders
of
the
Institutional
Shares
equal
to
each
Shareholder’s
proportionate
interest
in
the
Institutional
Shares.
Effective
July
1,
2020,
the
Holmes
Macro
Trends
Fund
changed
its
name
to
Global
Luxury
Goods
Fund.
The
Fund
also
changed
its
investment
strategy
on
July
1,
2020.
Prior
to
that
date,
the
Fund
invested
in
a
diversified
portfolio
of
equity
and
equity-related
securities
of
companies
in
the
S&P
Composite
1500
Index,
with
a
focus
on
companies
achieving
high
return
on
invested
capital
metrics
and
an
emphasis
on
mid-capitalization
companies.
Different
investment
strategies
may
lead
to
different
performance
results.
The
Fund’s
performance
for
periods
prior
to
July
1,
2020
reflects
the
investment
strategy
in
effect
prior
to
that
date.
The
following
is
a
summary
of
significant
accounting
policies
consistently
followed
by
the
Funds
in
the
preparation
of
their
financial
statements.
The
policies
are
in
conformity
with
U.S.
generally
accepted
accounting
principles.
A.
Security
Valuations
The
Funds
value
investments
traded
on
national
or
international
securities
exchanges
or
over-the-counter
at
the
last
sales
price
reported
by
the
security’s
primary
exchange
of
its
market
at
the
time
of
daily
valuation.
Options
and
securities
for
which
no
sale
was
reported
are
valued
at
the
mean
between
the
last
reported
bid
and
asked
quotation.
Debt
securities
having
60
days
or
less
to
maturity
that
are
expected
to
be
valued
at
par
at
maturity
may
be
priced
by
the
amortized
cost
method
if
the
Adviser
determines
it
would
approximate
market
value.
Municipal
securities,
long-term
U.S.
government
obligations
and
corporate
debt
securities
are
valued
by
an
independent
pricing
service
using
an
evaluated
quote
based
on
such
factors
as
institutional-size
trading
in
similar
groups
of
securities,
yield,
quality,
maturity,
coupon
rate,
type
of
issue,
individual
trading
characteristics
and
other
market
data.
For
more
information
please
see
Notes
to
Portfolio
of
Investments.
B.
Cash-Concentration
in
Uninsured
Account
For
cash
management
purposes
the
Funds
may
concentrate
cash
with
the
Funds’
custodian.
As
of
June
30,
2024,
The
U.S.
Government
Securities
Ultra-Short
Bond
Fund,
Near-Term
Tax
Free
Fund,
Global
Luxury
Goods
Fund,
Global
Resources
Fund,
World
Precious
Minerals
Fund
and
Gold
and
Precious
Metals
Fund
held
$6,292,167,
$2,441,012,
$2,025,683,
$2,729,786,
$1,944,824
and
$4,873,771,
respectively,
as
cash
reserves
at
Brown
Brothers
Harriman
&
Co.
(BBH).
Notes
to
Financial
Statements
C.
Fair
Valued
Securities
Pursuant
to
Rule
2a-5
under
the
Investment
Company
Act,
the
Trust’s
Board
has
designated
the
Adviser,
as
defined
in
Note
3,
as
the
Funds’
valuation
designee
to
perform
any
fair
value
determinations
for
securities
and
other
assets
held
by
the
Funds.
The
Adviser
is
subject
to
the
oversight
of
the
Board
and
certain
reporting
and
other
requirements
intended
to
provide
the
Board
the
information
needed
to
oversee
the
Adviser’s
fair
value
determinations.
The
Adviser
is
responsible
for
determining
the
fair
value
of
investments
for
which
market
quotations
are
not
readily
available
in
accordance
with
policies
and
procedures
that
have
been
approved
by
the
Board.
Under
these
procedures,
the
Adviser
convenes
on
a
regular
and
ad
hoc
basis
to
review
such
investments
and
considers
a
number
of
factors,
including
valuation
methodologies
and
significant
unobservable
inputs,
when
arriving
at
fair
value.
The
Board
has
approved
the
Adviser’s
fair
valuation
procedures
as
a
part
of
the
Funds’
compliance
program
and
will
review
any
changes
made
to
the
procedures.
The
Adviser
provides
fair
valuation
inputs.
In
determining
fair
valuations,
the
Adviser
considers
a
number
of
factors
including
nature
and
duration
of
any
trading
restrictions,
trading
volume,
market
values
of
unrestricted
shares
of
the
same
or
similar
class,
investment
management’s
judgment
regarding
the
market
experience
of
the
issuer,
financial
status
and
other
operational
and
market
factors
affecting
the
issuer,
issuer’s
management,
quality
of
the
underlying
property
based
on
review
of
independent
geological
studies
and
other
relevant
matters.
The
fair
values
may
differ
from
what
would
have
been
used
had
a
broader
market
for
these
securities
existed.
The
Adviser
regularly
reviews
inputs
and
assumptions
and
performs
transactional
back-testing
and
disposition
analysis.
The
Adviser
reports
quarterly
to
the
Trust’s
Board
of
Trustees.
For
securities
traded
on
international
exchanges,
if
events
which
may
materially
affect
the
value
of
a
Fund’s
securities
occur
after
the
close
of
the
primary
exchange
and
before
a
Fund’s
net
asset
value
is
next
determined,
then
those
securities
will
be
valued
at
their
fair
value
as
determined
in
good
faith
in
accordance
with
the
policies
approved
by
the
Board
of
Trustees.
The
Adviser
uses
a
systematic
fair
value
model
provided
by
an
independent
third
party
to
value
international
securities
primarily
traded
on
an
exchange
or
market
outside
the
Western
Hemisphere
in
order
to
adjust
for
stale
pricing,
which
may
occur
between
the
close
of
certain
foreign
exchanges
and
the
New
York
Stock
Exchange.
Fair
valuation
is
based
on
subjective
factors
and,
as
a
result,
the
fair
value
price
of
an
investment
may
differ
from
the
security’s
market
price
and
may
not
be
the
price
at
which
the
asset
may
be
sold.
Fair
valuation
could
result
in
a
different
Net
Asset
Value
(“NAV”)
than
a
NAV
determined
by
using
market
quotes.
D.
Security
Transactions
and
Investment
Income
Security
transactions
are
accounted
for
on
trade
date.
Realized
gains
and
losses
from
security
transactions
are
determined
on
an
identified
cost
basis.
Dividend
income
is
recorded
on
the
ex-dividend
date
except
that
certain
dividends
from
foreign
securities
where
the
ex-dividend
date
may
have
passed
are
recorded
as
soon
as
the
Fund
has
confirmed
the
ex-dividend
date.
Interest
income,
which
may
include
original
issue
discount,
is
recorded
on
an
accrual
basis.
Discounts
and
premiums
on
securities
purchased
are
accreted
and
amortized,
respectively,
on
a
yield-to-worst
basis
as
adjustments
to
interest
income.
Investment
income
is
recorded
net
of
foreign
taxes
withheld
where
recovery
of
such
taxes
is
uncertain.
Investment
income
and
realized
and
unrealized
gains
(losses)
are
allocated
to
each
Fund’s
share
class
based
on
their
respective
net
assets.
Notes
to
Financial
Statements
The
Funds
may
purchase
securities
on
a
when-issued
or
delayed-delivery
basis
and
segregate
collateral
on
their
books
with
a
value
at
least
equal
to
the
amount
of
the
commitment.
Losses
may
arise
due
to
the
changes
in
the
value
of
the
underlying
securities
or
if
the
counterparty
does
not
perform
under
the
contract.
E.
Foreign
Currency
Transactions
Some
Funds
may
invest
in
securities
of
foreign
issuers.
The
accounting
records
of
these
Funds
are
maintained
in
U.S.
dollars.
At
each
net
asset
value
determination
date,
the
value
of
assets
and
liabilities
denominated
in
foreign
currencies
are
translated
into
U.S.
dollars
using
the
current
prevailing
exchange
rate.
Security
transactions,
income
and
expenses
are
converted
at
the
prevailing
rate
of
exchange
on
the
respective
dates
of
the
transactions.
The
effect
of
changes
in
foreign
exchange
rates
on
foreign
denominated
securities
is
included
with
the
net
realized
and
unrealized
gain
or
loss
on
securities.
Other
foreign
currency
gains
or
losses
are
reported
separately.
F.
Federal
Income
Taxes
The
Funds
intend
to
continue
to
comply
with
the
requirements
of
Subchapter
M
of
the
Internal
Revenue
Code
applicable
to
regulated
investment
companies
and
to
distribute
substantially
all
of
their
taxable
income
to
shareholders.
Accordingly,
no
provision
for
federal
income
taxes
is
required.
Each
Fund
may
be
subject
to
foreign
taxes
on
income
and
gains
on
investments,
which
are
accrued
based
on
the
Fund’s
understanding
of
the
tax
rules
and
regulations
in
the
foreign
markets.
The
Funds
recognize
the
tax
benefits
of
uncertain
tax
positions
only
where
the
position
is
“more
likely
than
not”
to
be
sustained
assuming
examination
by
tax
authorities.
Management
has
analyzed
the
Funds’
tax
positions,
and
has
concluded
that
no
liability
for
unrecognized
tax
benefits
should
be
recorded
related
to
uncertain
tax
positions
taken
on
returns
filed
for
open
tax
years
or
expected
to
be
taken
in
2023
tax
returns.
The
Funds
file
U.S.
federal
and
excise
tax
returns
as
required.
The
Funds’
2020,
2021,
2022
and
2023
(when
filed)
tax
returns
are
open
to
examination
by
the
federal
and
applicable
state
tax
authorities.
The
Funds
have
no
examinations
in
progress.
G.
Dividends
and
Distributions
to
Shareholders
The
Funds
record
dividends
and
distributions
to
shareholders
on
the
ex-dividend
date.
Distributions
are
determined
in
accordance
with
income
tax
regulations,
which
may
differ
from
accounting
principles
generally
accepted
in
the
United
States.
Accordingly,
periodic
reclassifications
related
to
permanent
book
and
tax
basis
differences
are
made
within
the
Funds’
capital
accounts
to
reflect
income
and
gains
available
for
distribution
under
income
tax
regulations.
The
Funds,
except
as
noted
below,
generally
pay
income
dividends
and
distribute
capital
gains,
if
any,
annually.
The
U.S.
Government
Securities
Ultra-Short
Bond
Fund
and
the
Near-Term
Tax
Free
Fund
pay
dividends
monthly.
A
Fund
may
elect
to
designate
a
portion
of
the
earnings
and
profits
distributed
to
shareholders
on
the
redemption
of
Fund
shares
during
the
year
as
distributions
for
federal
income
tax
purposes.
H.
Expenses
Fund
specific
expenses
are
allocated
to
that
Fund.
Expenses
that
are
not
fund
specific
are
allocated
among
Funds.
Except
for
the
U.S.
Government
Securities
Ultra-Short
Bond
Fund,
expense
offset
arrangements
have
been
made
with
the
Funds’
custodian
so
the
custodian
fees
may
be
paid
indirectly
by
credits
earned
on
the
Funds’
cash
balances.
Such
deposit
Notes
to
Financial
Statements
arrangements
are
an
alternative
to
overnight
investments.
Custodian
fees
are
presented
in
the
Statements
of
Operations
gross
of
such
credits,
and
the
credits
are
presented
as
offsets
to
expenses.
For
the
U.S.
Government
Securities
Ultra-Short
Bond
Fund,
credits
earned
on
its
cash
balance
are
included
in
interest
and
other
income.
I.
Use
of
Estimates
in
Financial
Statement
Preparation
The
Funds
are
investment
companies
accounted
for
in
conformity
with
accounting
principles
generally
accepted
in
the
United
States
of
America
(“GAAP”).
Therefore
they
follow
the
accounting
and
reporting
guidelines
for
investment
companies.
The
preparation
of
financial
statements
in
conformity
with
GAAP
requires
management
to
make
estimates
and
assumptions
that
affect
the
reported
amounts
of
assets
and
liabilities
and
disclosure
of
contingent
assets
and
liabilities
at
the
date
of
the
financial
statements
and
the
reported
amounts
of
income
and
expenses
during
the
reporting
period.
Actual
results
could
differ
from
those
estimates.
Note
2:
Financial
Derivative
Instruments
A.
Options
Contracts
Global
Luxury
Goods
Fund,
Gold
and
Precious
Metals
Fund,
Global
Resources
Fund
and
World
Precious
Minerals
Fund
(the
“Equity
Funds”)
may
purchase
or
write
(sell)
options
on
securities
to
manage
their
exposure
to
stock
or
commodity
markets
as
well
as
fluctuations
in
interest
and
currency
conversion
rates.
The
use
of
options
carries
the
risks
of
a
change
in
value
of
the
underlying
instruments,
an
illiquid
secondary
market,
or
failure
of
the
counterparty
to
perform
its
obligations.
A
put
option
gives
the
purchaser
of
the
option,
upon
payment
of
a
premium,
the
right
to
sell,
and
the
issuer
of
the
option
the
obligation
to
buy,
the
underlying
security,
commodity,
index,
currency
or
other
instrument
at
the
exercise
price.
A
call
option,
upon
payment
of
a
premium,
gives
the
purchaser
of
the
option
the
right
to
buy,
and
the
issuer
the
obligation
to
sell,
the
underlying
instrument
at
the
exercise
price.
Purchasing
a
put
option
tends
to
decrease
a
Fund’s
exposure
to
the
underlying
instrument,
whereas
purchasing
a
call
option
tends
to
increase
a
Fund’s
exposure
to
the
underlying
instrument.
A
Fund
pays
a
premium
which
is
included
in
the
Statement
of
Assets
and
Liabilities
as
an
investment
and
subsequently
marked
to
market
to
reflect
the
current
value
of
the
option.
Premiums
paid
to
purchase
options
which
expire
are
treated
as
realized
losses.
Premiums
paid
to
purchase
options
which
are
exercised
or
closed
are
added
to
the
cost
of
securities
acquired
or
the
proceeds
from
securities
sold.
The
risk
associated
with
purchasing
put
and
call
options
is
limited
to
the
premium
paid.
The
Funds
will
realize
a
loss
equal
to
all
or
a
part
of
the
premium
paid
for
an
option
if
the
price
of
the
underlying
security
or
other
instrument
decreases
or
does
not
increase
by
more
than
the
premium
(in
the
case
of
a
call
option),
or
if
the
price
of
the
underlying
security
or
other
instrument
increases
or
does
not
decrease
by
more
than
the
premium
(in
the
case
of
a
put
option).
Writing
(selling)
a
put
option
tends
to
increase
a
Fund’s
exposure
to
the
underlying
instrument,
whereas
writing
a
call
option
tends
to
decrease
a
Fund’s
exposure
to
the
underlying
instrument.
The
premium
received
is
recorded
as
a
liability
in
the
Statement
of
Assets
and
Liabilities
and
subsequently
marked
to
market
to
reflect
the
current
value
of
the
option
written.
Premiums
received
from
writing
options
which
expire
are
treated
as
realized
gains.
Premiums
received
from
options
which
are
exercised
or
closed
are
added
to
Notes
to
Financial
Statements
the
proceeds
or
offset
against
amounts
paid
on
the
underlying
transaction
to
determine
the
realized
gain
or
loss.
Written
options
include
a
risk
of
loss
in
excess
of
the
option
premium.
A
Fund
as
a
writer
of
an
option
has
no
control
over
whether
the
underlying
instrument
may
be
sold
(call)
or
purchased
(put)
and
thus
bears
the
market
risk
of
an
unfavorable
change
in
the
price
of
the
instrument
underlying
the
written
option.
There
is
also
the
risk
a
Fund
may
not
be
able
to
enter
into
a
closing
transaction
because
of
an
illiquid
market.
A
Fund’s
ability
to
close
out
its
position
as
a
purchaser
or
seller
of
a
put
or
call
option
is
dependent,
in
part,
upon
the
liquidity
of
the
market
for
that
particular
option.
There
can
be
no
guarantee
that
a
Fund
will
be
able
to
close
out
an
option
position
when
desired.
An
inability
to
close
out
its
options
positions
may
reduce
a
Fund’s
anticipated
profits
or
increase
its
losses.
As
of
June
30,
2024,
there
were
no
securities
held
in
escrow
by
the
custodian
as
cover
for
call
options
written.
B.
Forward
Foreign
Currency
Contracts
The
Funds
enter
into
forward
foreign
currency
contracts
to
lock
in
the
U.S.
dollar
cost
of
purchase
and
sale
transactions
or
to
hedge
the
portfolio
against
currency
fluctuations.
A
forward
foreign
currency
contract
is
a
commitment
to
purchase
or
sell
a
foreign
currency
at
a
future
date
at
a
negotiated
rate.
These
contracts
are
valued
daily,
and
the
Fund’s
net
equity
therein,
representing
unrealized
gain
or
loss
on
the
contracts
as
measured
by
the
difference
between
the
forward
foreign
exchange
rates
at
the
dates
of
entry
into
the
contracts
and
the
forward
rates
at
the
reporting
date,
is
included
in
the
Statement
of
Assets
and
Liabilities.
Realized
and
unrealized
gains
and
losses
are
included
in
the
Statement
of
Operations.
Risks
may
arise
upon
entering
into
these
contracts
from
the
potential
inability
of
counterparties
to
meet
the
terms
of
the
contracts
and
from
unanticipated
movements
in
the
value
of
foreign
currencies
relative
to
the
U.S.
dollar.
Open
forward
foreign
currency
contracts
as
of
June
30,
2024,
were
as
follows:
C.
Summary
of
Derivative
Instruments
The
following
is
a
summary
of
the
valuations
of
derivative
instruments
categorized
by
location
in
the
Statements
of
Assets
and
Liabilities
as
of
June
30,
2024:
Fund
Counterparty
Currency
to
Deliver
Currency
to
Receive
Settlement
Date
Settlement
Value
at
June
30,
2024
Net
Unrealized
Appreciation
Global
Luxury
Goods
Fund
Brown
Brothers
Harriman
&
Co.
EUR
1,500,000
USD
1,609,950
7/24/2024
$
1,608,300
$
1,650
Location
Global
Luxury
Goods
Fund
Asset
derivatives
Unrealized
gain
on
forward
foreign
currency
contracts
–
Currency
contract
risk
$
1,650
Total
$
1,650
Notes
to
Financial
Statements
The
following
is
a
summary
of
the
effect
of
derivative
instruments
on
the
Statements
of
Operations
as
of
June
30,
2024:
Location
Global
Luxury
Goods
Fund
Global
Resources
Fund
World
Precious
Minerals
Fund
Realized
gain
(loss)
on
derivatives
recognized
in
income
Realized
gain
(loss)
from
securities
Purchased
options
–
Equity
risk
$
(113,672)
$
(126,006)
$
(82,557)
Net
realized
gain
(loss)
from
foreign
currency
transactions
Foreign
exchange
contracts
–
Currency
contract
risk
(42,683)
–
–
(156,355)
(126,006)
(82,557)
Change
in
unrealized
appreciation
(depreciation)
on
derivatives
recognized
in
income
Net
change
in
unrealized
appreciation
(depreciation)
of
investments
Purchased
options
–
Equity
risk
16,221
(54,746)
(48,701)
Net
change
in
unrealized
gain
(loss)
from
foreign
currency
transactions
Foreign
exchange
contracts
–
Currency
contract
risk
128,336
–
–
144,557
(54,746)
(48,701)
Total
$
(
11,798
)
$
(180,752)
$
(131,258)
Location
Gold
and
Precious
Metals
Fund
Realized
gain
(loss)
on
derivatives
recognized
in
income
Realized
gain
(loss)
from
securities
Purchased
options
–
Equity
risk
$
(194,180)
Net
realized
gain
(loss)
from
foreign
currency
transactions
Foreign
exchange
contracts
–
Currency
contract
risk
20
(194,160)
Change
in
unrealized
appreciation
(depreciation)
on
derivatives
recognized
in
income
Net
change
in
unrealized
appreciation
(depreciation)
of
investments
Purchased
options
–
Equity
risk
(103,788)
(103,788)
Total
$
(297,948)
Notes
to
Financial
Statements
The
total
value
of
transactions
in
purchased
options
and
forward
currency
contracts
outstanding
during
the
period
ended
June
30,
2024,
were
approximately
as
follows:
Asset
(Liability)
amounts
shown
in
the
table
below
represent
amounts
for
derivative
related
instruments
at
June
30,
2024.
These
amounts
may
be
collateralized
by
cash
or
financial
instruments.
Note
3:
Investment
Advisory
and
Other
Agreements
U.S.
Global
Investors,
Inc.
(the
“Adviser”)
is
the
investment
adviser
to
the
Funds.
Pursuant
to
an
investment
advisory
agreement
with
the
Trust
in
effect
through
October
1,
2024,
furnishes
management
and
investment
advisory
services
and,
subject
to
the
supervision
of
the
Trustees,
directs
the
investments
of
each
Fund
according
to
each
Fund’s
investment
objectives,
policies
and
limitations.
For
the
services
of
the
Adviser,
each
Fund
pays
a
base
management
or
advisory
fee
based
upon
its
net
assets.
Fees
are
accrued
daily
and
paid
monthly.
The
contractual
management
fee
for
each
Fund
is:
Fund
Purchased
Options
Forward
Currency
Contracts
Global
Luxury
Goods
Fund
$
56,851
$
13,126,449
Global
Resources
Fund
208,997
–
World
Precious
Minerals
Fund
101,044
–
Gold
and
Precious
Metals
Fund
244,602
8,480
Gross
Asset
(Liability)
as
Presented
in
the
Statement
of
Assets
and
Liabilities
Financial
Instruments
(Received)
Pledged*
Cash
Collateral
(Received)
Pledged*
Net
Amount
Global
Luxury
Goods
Assets:
Over-the-counter
derivatives
$
1,650
$
–
$
–
$
1,650
*
The
actual
financial
instruments
and
cash
collateral
(received)
pledged
may
be
in
excess
of
the
amounts
shown
in
the
table.
The
table
only
reflects
collateral
amounts
up
to
the
amount
of
the
financial
instrument
disclosed
on
the
Statement
of
Assets
and
Liabilities.
**
Over-the-counter
derivatives
may
consist
of
forward
currency
contracts.
The
amounts
disclosed
above
represent
the
exposure
to
one
or
more
counterparties.
For
further
detail
on
individual
derivative
contracts,
see
the
Portfolios
of
Investments.
Fund
Average
Percentage
of
Average
Daily
Net
Assets
U.S.
Government
Securities
Ultra-Short
Bond
.50%
of
the
first
$250,000,000
and
.375%
of
the
excess
Near-Term
Tax
Free
.50%
Global
Luxury
Goods
1.00%
Global
Resources
.95%
of
the
first
$500,000,000;
.90%
of
$500,000,001
to
$1,000,000,000
and
.85%
of
the
excess
World
Precious
Minerals
1.00%
of
the
first
$500,000,000;
.95%
of
$500,000,001
to
$1,000,000,000
and
.90%
of
the
excess
Notes
to
Financial
Statements
The
advisory
agreement
also
provides
that
the
base
advisory
fee
of
the
Equity
Funds
will
be
adjusted
upwards
or
downwards
by
0.25
percent
if
there
is
a
performance
difference
of
5
percent
or
more
between
a
Fund’s
performance
and
that
of
its
designated
benchmark
index
over
the
prior
12
months.
The
performance
adjustment
is
calculated
separately
for
each
share
class.
The
benchmarks
are
as
follows:
No
performance
adjustment
is
applied
unless
the
difference
between
the
class’s
investment
performance
and
the
benchmark
is
5
percent
or
greater
(positive
or
negative)
during
the
applicable
performance
measurement
period.
The
performance
fee
adjustment
is
calculated
monthly
in
arrears
and
is
accrued
ratably
during
the
month.
The
management
fee,
net
of
any
performance
fee
adjustment,
is
paid
monthly
in
arrears.
At
a
special
meeting
of
shareholders
of
the
World
Precious
Minerals
Fund
held
on
March
8,
2024,
the
shareholders
of
the
World
Precious
Minerals
Fund
approved
the
elimination
of
the
performance
adjustment,
effective
April
1,
2024.
At
a
special
meeting
of
the
shareholders
of
the
Global
Luxury
Goods
Fund
and
Gold
and
Precious
Metals
Fund
held
on
March
28,
2024,
the
shareholders
of
the
Global
Luxury
Goods
Fund
and
Gold
and
Precious
Metals
Fund
each
approved
the
elimination
of
the
performance
adjustment,
effective
April
1,
2024.
At
a
special
meeting
of
shareholders
of
the
Global
Resources
Fund
held
on
May
24,
2024,
the
shareholders
of
the
Global
Resources
Fund
approved
the
elimination
of
the
performance
adjustment,
effective
June
1,
2024.
The
Adviser
has
agreed
to
phase
in
the
removal
of
the
performance
adjustment
such
that,
until
12
months
after
the
elimination
of
the
performance
adjustment
was
approved
(such
phase
in
currently
expected
until
March
31,
2025
with
respect
to
World
Precious
Minerals
Fund,
Global
Luxury
Goods
Fund,
and
Gold
and
Precious
Metals
Fund,
and
until
May
31,
2025
with
respect
to
Global
Resources
Fund),
each
Fund
will
pay
advisory
fees
equal
to
the
lesser
of
the
base
rate
fee
or
the
fee
as
determined
with
the
performance
adjustment.
In
particular,
during
this
phase
in
period,
the
advisory
fee
rate
may
be
adjusted
downward
if
a
Fund’s
cumulative
performance
falls
below
the
performance
of
its
designated
benchmark
index
by
5%
or
more
but
would
not
be
correspondingly
adjusted
upward.
The
amounts
shown
as
Management
fee
on
the
Statements
of
Operations
reflects
the
base
fee
plus/minus
any
performance
adjustment.
During
the
period
ended
June
30,
2024,
the
Funds
recorded
performance
adjustments
as
follows:
Fund
Gold
and
Precious
Metals
.90%
of
the
first
$500,000,000
and
.85%
of
the
excess
Fund
Benchmark
Index
Global
Luxury
Goods
S&P
Composite
1500
TR
Index
Global
Resources
S&P
Global
Natural
Resources
Index
(Net
Total
Return)
World
Precious
Minerals
NYSE
Arca
Gold
Miners
Index
Gold
and
Precious
Metals
FTSE
Gold
Mines
Index
Fund
Investor
Class
Performance
Fee
Adjustment
Global
Luxury
Goods
$
(58,337)
Global
Resources
(58,268)
World
Precious
Minerals
(54,678)
Note
3:
Investment
Advisory
and
Other
Agreements
Notes
to
Financial
Statements
Atlantic
Fund
Administration,
LLC,
a
wholly
owned
subsidiary
of
Apex
US
Holdings,
LLC
(d/b/a
Apex
Fund
Services)
(“Apex”)
and
the
Adviser
act
as
co-administrators
to
the
Trust.
Apex
provides
a
Principal
Executive
Officer,
a
Principal
Financial
Officer,
a
Chief
Compliance
Officer
and
a
Anti-Money
Laundering
Officer
to
each
Fund,
as
well
as
certain
additional
compliance
and
administrative
support
functions.
Apex
also
provides
fund
accounting
services
to
each
Fund.
The
fees
related
to
these
services
are
included
in
Administration
Fees
within
the
Statement
of
Operations.
Apex
also
provides
certain
shareholder
report
production
and
EDGAR
conversion
and
filing
services.
Pursuant
to
an
Apex
services
agreement,
each
Fund
pays
Apex
customary
fees
for
its
services.
The
U.S.
Government
Securities
Ultra-Short
Bond,
Near-Term
Tax
Free,
Global
Luxury
Goods,
Global
Resources,
World
Precious
Minerals
and
Gold
and
Precious
Metals
Funds
compensate
the
Adviser
at
an
annual
rate
of
0.05%
of
the
average
daily
net
assets
of
each
Fund
for
administrative
services
provided.
The
Equity
Funds
in
the
Trust
have
adopted
a
distribution
plan
pursuant
to
Rule
12b-1
of
the
Investment
Company
Act
of
1940
in
which
the
Distributor
is
paid
a
fee
at
an
annual
rate
of
0.25%
of
the
average
daily
net
assets
of
the
Fund
for
sales
and
promotional
services
related
to
the
distribution
of
shares.
The
Adviser
has
contractually
limited
the
total
operating
expenses
of
the
Global
Luxury
Goods
Fund,
Gold
and
Precious
Metals
Fund,
World
Precious
Minerals
Fund,
and
Global
Resources
at
1.75%
on
an
annualized
basis
through
April
30,
2025.
The
Adviser
has
also
contractually
limited
the
total
operating
expenses
of
the
Near-Term
Tax
Free
Fund
at
0.45%
on
an
annual
basis
through
April
30,
2025.
The
Adviser
has
voluntarily
agreed
to
reimburse
the
U.S.
Government
Securities
Ultra-
Short
Bond
Fund
so
that
total
operating
expenses
will
not
exceed
0.45%
of
average
net
assets
through
April
30,
2025.
The
expense
limitation
will
continue
on
a
voluntary
basis
at
the
Adviser’s
discretion.
The
Adviser
may
temporarily
agree
to
additional
reimbursements
or
limitations.
Apex
is
the
transfer
agent
for
the
Funds.
Each
Fund’s
share
class
pays
an
annual
fee
based
on
the
number
of
shareholder
accounts,
certain
base
fees
and
transaction-
and
activity-based
fees
for
transfer
agency
services.
Certain
account
fees
are
paid
directly
by
shareholders
to
the
transfer
agent,
which,
in
turn,
reduces
its
charge
to
the
Funds.
Brown
Brothers
Harriman
&
Co.
(BBH)
serves
as
the
custodian.
Foreside
Fund
Services,
LLC
(the
“Distributor”),
a
wholly
owned
subsidiary
of
Foreside
Financial
Group,
LLC
(d/b/a
ACA
Group),
acts
as
the
agent
of
the
Trust
in
connection
with
the
continuous
offering
of
shares
of
the
Funds.
The
Distributor
continually
distributes
shares
of
the
Funds
on
a
best
efforts
basis.
Note
3:
Investment
Advisory
and
Other
Agreements
Notes
to
Financial
Statements
Note
4:
Investments
Cost
of
purchases
and
proceeds
from
sales
of
long-term
securities
for
the
period
ended
June
30,
2024,
are
summarized
as
follows:
Note
5:
Tax
Information
The
following
table
presents
the
income
tax
basis
of
securities
owned
at
June
30,
2024,
and
the
tax
basis
components
of
net
unrealized
appreciation
(depreciation):
As
of
December
31,
2023,
the
components
of
distributable
earnings
on
a
tax
basis
were
as
follows:
Fund
Purchases
Sales
U.S.
Government
Securities
Ultra-Short
Bond
$
6,429,005
$
11,410,216
Near-Term
Tax
Free
4,456,019
3,750,000
Global
Luxury
Goods
37,452,444
35,805,165
Global
Resources
17,929,727
22,736,814
World
Precious
Minerals
5,422,112
9,181,019
Gold
and
Precious
Metals
26,434,800
39,329,067
Fund
Aggregate
Tax
Cost
Gross
Unrealized
Appreciation
Gross
Unrealized
Depreciation
Net
Unrealized
Appreciation
(Depreciation)
U.S.
Government
Securities
Ultra-Short
Bond
$
22,674,080
$
966
$
(42,815)
$
(41,849)
Near-Term
Tax
Free
22,465,09
7
2,21
0
(204,057)
(201,84
7
)
Global
Luxury
Goods
43,294,885
6,193,016
(3,247,802)
2,945,214
Global
Resources
78,620,169
12,070,576
(52,815,175)
(40,744,599)
World
Precious
Minerals
70,793,564
10,705,73
8
(41,395,713)
(30,689,97
5
)
Gold
and
Precious
Metals
76,738,458
30,663,536
(11,449,841)
19,213,695
Fund
Undistributed
Tax-Exempt
Income
Undistributed
Ordinary
Income
Undistributed
Long-Term
Capital
Gains
Capital
and
Other
Losses
U.S.
Government
Securities
Ultra-Short
Bond
$
–
$
–
$
–
$
(790,545)
Near-Term
Tax
Free
–
–
–
(2,779,541)
Global
Luxury
Goods
–
748,296
1,276,472
(1,316,649)
Global
Resources
–
1,367,492
–
(241,843,934)
World
Precious
Minerals
–
–
–
(351,715,654)
Gold
and
Precious
Metals
–
107,335
–
(64,254,824)
Fund
(continued)
Net
Unrealized
Appreciation
(Depreciation)
Other
Temporary
Differences
Total
U.S.
Government
Securities
Ultra-Short
Bond
$
87,510
$
–
$
(703,035)
Near-Term
Tax
Free
(86,813)
–
(2,866,354)
Global
Luxury
Goods
1,441,562
2,100
2,151,781
Global
Resources
(49,
673,569
)
45,463
(290,104,548)
World
Precious
Minerals
(49,
806,424
)
1,343
(401,520,735)
Gold
and
Precious
Metals
7,
182,456
(4,510)
(56,969,543)
Notes
to
Financial
Statements
The
differences
between
book-basis
and
tax-basis
unrealized
appreciation
(depreciation)
for
Global
Luxury
Goods,
Global
Resources,
World
Precious
Minerals
and
Gold
and
Precious
Metals
Funds
are
attributable
primarily
to
the
tax
deferral
of
losses
on
wash
sales,
investment
in
passive
foreign
investment
companies
(PFIC),
section
988
forward
currency
contracts,
equity
return
of
capital,
investments
in
grantor
trusts
and
investments
in
partnerships.
Reclassifications
are
made
to
the
Funds’
capital
accounts
to
reflect
income
and
gains
available
for
distribution
(or
available
capital
loss
carryovers)
under
income
tax
regulations.
For
the
year
ended
December
31,
2023,
the
Funds
recorded
the
following
reclassifications
to
increase
(decrease)
the
accounts
listed
below:
The
tax
character
of
distributions
paid
during
the
fiscal
year
ended
December
31,
2023,
were
as
follows:
The
tax
character
of
distributions
paid
during
the
fiscal
year
ended
December
31,
2022,
were
as
follows:
Capital
loss
carryforwards
may
be
used
to
offset
current
or
future
taxable
capital
gains.
The
loss
carryforwards
for
each
Fund,
as
of
December
31,
2023,
are
as
follows:
Fund
Distributable
Earnings
Paid
in
Capital
U.S.
Government
Securities
Ultra-Short
Bond
$
708
$
(708)
Near-Term
Tax
Free
574
(574)
Global
Luxury
Goods
–
–
Global
Resources
78,336
(78,336)
World
Precious
Minerals
574,322
(574,322)
Gold
and
Precious
Metals
(684)
684
Fund
Tax-Exempt
Income
Ordinary
Income
Long-Term
Capital
Gains
Return
of
Capital
Total
U.S.
Government
Securities
Ultra-Short
Bond
$
–
$
1,170,048
$
–
$
–
$
1,170,048
Near-Term
Tax
Free
550,450
146,197
–
–
696,647
Global
Luxury
Goods
–
397,483
854,127
–
1,251,610
Global
Resources
–
–
–
–
–
World
Precious
Minerals
–
–
–
–
–
Gold
and
Precious
Metals
–
–
–
–
–
Fund
Tax-Exempt
Income
Ordinary
Income
Long-Term
Capital
Gains
Return
of
Capital
Total
U.S.
Government
Securities
Ultra-Short
Bond
$
–
$
289,109
$
7,427
$
–
$
296,536
Near-Term
Tax
Free
318,228
39,685
–
–
357,913
Global
Luxury
Goods
–
1,914,604
539,320
–
2,453,924
Global
Resources
–
7,566,498
–
–
7,566,498
World
Precious
Minerals
–
–
–
–
–
Gold
and
Precious
Metals
–
–
–
–
–
Notes
to
Financial
Statements
The
Global
Luxury
Goods
Fund
has
a
Section
382
loss
limitation.
The
remaining
loss
limit
at
December
31,
2023
is
$1,316,649
and
the
yearly
amount
of
loss
that
can
be
drawn
down
or
utilized
from
this
amount
is
$117,889.
During
the
year
ended
December
31,
2023,
the
following
Funds
utilized
capital
loss
carryforwards
to
offset
capital
gains
amounting
to:
Note
6:
Risks
of
Concentrations
and
Foreign
Investments
The
Near-Term
Tax
Free
Fund
may
be
exposed
to
risks
related
to
concentration
of
investments
in
a
particular
state
or
geographic
area.
These
investments
present
risks
resulting
from
changes
in
economic
conditions
of
the
region
or
the
issuer.
The
Global
Resources
Fund
concentrates
its
investments
in
the
natural
resources
industries
and
may
be
subject
to
greater
risks
and
fluctuations
than
a
portfolio
representing
a
broader
range
of
industries.
The
World
Precious
Minerals
and
Gold
and
Precious
Metals
Funds
concentrate
their
investments
in
gold
and
other
precious
metals
and
minerals
and,
therefore,
may
be
subject
to
greater
risks
and
market
fluctuations
than
a
portfolio
representing
a
broader
range
of
industries.
The
funds
invest
in
securities
that
typically
respond
to
changes
in
the
price
of
gold
and
other
precious
metals
and
minerals,
which
can
be
influenced
by
a
variety
of
global
economic,
financial
and
political
factors;
increased
environmental
and
labor
costs
in
mining;
and
changes
in
laws
relating
to
mining
or
gold
production
or
sales.
Fluctuations
in
the
prices
of
gold
and
other
precious
metals
and
minerals
will
affect
the
market
values
of
the
securities
held
by
these
funds.
Note
7:
Credit
Arrangements
Each
of
the
Funds
has
an
uncommitted
credit
facility
with
BBH,
which
will
remain
in
effect
through
at
least
April
19,
2025.
The
continuance
of
the
credit
facility
with
BBH
is
subject
to
annual
renewal
by
the
Board.
On
April
24,
2019,
the
Adviser
opted
to
convert
the
committed
line
of
credit
into
an
uncommitted
line
of
credit.
As
a
result,
the
Adviser
is
no
longer
obligated
to
pay
commitment
fees
to
BBH.
Borrowings
of
each
Fund
are
collateralized
by
any
or
all
of
the
securities
held
by
BBH
as
the
Funds’
custodian
up
to
the
amount
of
the
borrowing.
Interest
on
borrowings
is
charged
at
the
current
overnight
No
Expiration
Fund
Short-Term
Long-Term
Total
U.S.
Government
Securities
Ultra-Short
Bond
$
404,308
$
386,237
$
790,545
Near-Term
Tax
Free
1,040,620
1,738,921
2,779,541
Global
Luxury
Goods
1,316,649
–
1,316,649
Global
Resources
166,015,162
75,828,772
241,843,934
World
Precious
Minerals
88,162,186
263,553,468
351,715,654
Gold
and
Precious
Metals
44,928,092
19,326,732
64,254,824
Fund
Global
Luxury
Goods
$
4,155,414
Notes
to
Financial
Statements
Federal
Funds
Rate
plus
2
percent.
Each
Fund
has
a
maximum
borrowing
limit
of
10
percent
of
qualified
assets.
The
aggregate
of
borrowings
by
all
Funds
under
the
agreement
cannot
exceed
$10,000,000
at
any
one
time.
There
were
no
borrowings
under
the
credit
facility
during
the
period
ended
June
30,
2024.
Note
8:
Commitments
and
Contingencies
In
the
normal
course
of
business,
each
Fund
enters
into
contracts
that
provide
general
indemnifications
by
each
Fund
to
the
counterparty
to
the
contract.
Each
Fund’s
maximum
exposure
under
these
arrangements
is
dependent
on
future
claims
that
may
be
made
against
each
Fund
and,
therefore,
cannot
be
estimated;
however,
based
on
experience,
the
risk
of
loss
from
such
claims
is
considered
remote.
Each
Fund
has
determined
that
none
of
these
arrangements
requires
disclosure
on
each
Fund’s
balance
sheet.
Note
9:
Subsequent
Events
Subsequent
events
occurring
after
the
date
of
this
report
through
the
date
these
financial
statements
were
issued
have
been
evaluated
for
potential
impact,
and
the
Funds
have
had
not
such
events.
Management
has
evaluated
the
need
for
additional
disclosures
and/
or
adjustments
resulting
from
subsequent
events.
Based
on
this
evaluation,
no
additional
disclosures
or
adjustments
were
required
to
the
financial
statements
as
of
the
date
the
financial
statements
were
issued.
U.S.
Government
Securities
Ultra-Short
Bond
Fund
For
a
capital
share
outstanding
during
the
See
accompanying
notes
to
financial
statements.
Six
Months
Ended
June
30,
2024
(unaudited)
Ratios
to
Average
Net
Assets:
Six
Months
Ended
June
30,
2024
Year
Ended
December
31,
2023
2022
2021
2020
2019
Net
asset
value,
beginning
of
period
$
1.95
$
1.94
$
1.99
$
2.00
$
2.00
$
2.00
Investment
Activities
Net
investment
income
(loss)
*
0.04
0.07
0.02
(0.01
)
0.00
(a)
0.03
Net
realized
and
unrealized
gain
(loss)
(0.01
)
0.01
(0.05
)
(0.00
)
(a)
0.01
0.00
(a)
Total
from
investment
activities
0.03
0.08
(0.03
)
(0.01
)
0.01
0.03
Distributions
From
net
investment
income
(0.04
)
(0.07
)
(0.02
)
–
(0.01
)
(0.03
)
From
net
realized
gains
–
–
(0.00
)
(a)
(0.00
)
(a)
–
(0.00
)
(a)
Net
asset
value,
end
of
period
$
1.94
$
1.95
$
1.94
$
1.99
$
2.00
$
2.00
Total
Return
(b)
1.53
%
4.17
%
(1.66
)%
(0.44
)%
0.32
%
1.50
%
Ratios
to
Average
Net
Assets:
Net
investment
income
(loss)
4.10
%
3.56
%
0.82
%
(0.32
)%
0.24
%
1.47
%
Total
expenses
1.21
%
1.17
%
1.13
%
1.06
%
1.05
%
1.00
%
Expenses
waived
or
reimbursed
(c)
(0.76
)%
(0.72
)%
(0.68
)%
(0.61
)%
(0.60
)%
(0.55
)%
Net
expenses
(d)
0.45
%
0.45
%
0.45
%
0.45
%
0.45
%
0.45
%
Portfolio
turnover
rate
33
%
143
%
46
%
78
%
127
%
97
%
Net
assets,
end
of
period
(in
thousands)
$30,072
$31,328
$34,117
$38,004
$40,262
$42,681
*
Based
on
average
shares
outstanding.
(a)
The
per
share
amount
does
not
round
to
a
full
penny.
(b)
Assumes
investment
at
the
net
asset
value
at
the
beginning
of
the
period,
reinvestment
of
all
distributions
and
a
complete
redemption
of
the
investment
at
the
net
asset
value
at
the
end
of
the
period.
(c)
Expenses
waived
or
reimbursed
reflect
reductions
to
total
expenses,
as
discussed
in
the
notes
to
the
financial
statements.
These
amounts
would
increase
the
net
investment
loss
ratio
or
decrease
the
net
investment
income
ratio,
as
applicable,
and
decrease
the
total
returns
had
such
reductions
not
occurred.
(d)
The
net
expense
ratios
shown
above
reflect
expenses
after
waivers
and
reimbursements
and
include
the
effect
of
reductions
to
total
expenses
for
any
expenses
offset.
Expense
offset
arrangements
reduce
total
expenses,
as
discussed
in
the
notes
to
the
financial
statements.
These
amounts
would
decrease
the
net
investment
income
(loss)
ratio
had
such
reductions
not
occurred.
The
effect
of
expenses
offset
are
as
follows:
Near-Term
Tax
Free
Fund
For
a
capital
share
outstanding
during
the
See
accompanying
notes
to
financial
statements.
Six
Months
Ended
June
30,
2024
(unaudited)
Ratios
to
Average
Net
Assets:
Six
Months
Ended
June
30,
2024
Year
Ended
December
31,
2023
2022
2021
2020
2019
Net
asset
value,
beginning
of
period
$
2.10
$
2.09
$
2.23
$
2.26
$
2.22
$
2.20
Investment
Activities
Net
investment
income
*
0.03
0.05
0.02
0.02
0.02
0.03
Net
realized
and
unrealized
gain
(loss)
(0.01
)
0.01
(0.14
)
(0.03
)
0.04
0.02
Total
from
investment
activities
0.02
0.06
(0.12
)
(0.01
)
0.06
0.05
Distributions
From
net
investment
income
(0.03
)
(0.05
)
(0.02
)
(0.02
)
(0.02
)
(0.03
)
Net
asset
value,
end
of
period
$
2.09
$
2.10
$
2.09
$
2.23
$
2.26
$
2.22
Total
Return
(a)
0.72
%
3.04
%
(5.23
)%
(0.46
)%
2.93
%
2.18
%
Ratios
to
Average
Net
Assets:
Net
investment
income
2.43
%
2.42
%
1.08
%
0.86
%
1.11
%
1.25
%
Total
expenses
1.37
%
1.29
%
1.20
%
1.13
%
1.09
%
1.05
%
Expenses
waived
or
reimbursed
(b)
(0.92
)%
(0.84
)%
(0.75
)%
(0.68
)%
(0.64
)%
(0.60
)%
Net
expenses
(c)
0.45
%
0.45
%
0.45
%
0.45
%
0.45
%
0.45
%
Portfolio
turnover
rate
17
%
14
%
57
%
20
%
20
%
35
%
Net
assets,
end
of
period
(in
thousands)
$25,030
$25,394
$30,878
$35,389
$41,762
$43,061
*
Based
on
average
shares
outstanding.
(a)
Assumes
investment
at
the
net
asset
value
at
the
beginning
of
the
period,
reinvestment
of
all
distributions
and
a
complete
redemption
of
the
investment
at
the
net
asset
value
at
the
end
of
the
period.
(b)
Expenses
waived
or
reimbursed
reflect
reductions
to
total
expenses,
as
discussed
in
the
notes
to
the
financial
statements.
These
amounts
would
increase
the
net
investment
loss
ratio
or
decrease
the
net
investment
income
ratio,
as
applicable,
and
decrease
the
total
returns
had
such
reductions
not
occurred.
(c)
The
net
expense
ratios
shown
above
reflect
expenses
after
waivers
and
reimbursements
and
include
the
effect
of
reductions
to
total
expenses
for
any
expenses
offset.
Expense
offset
arrangements
reduce
total
expenses,
as
discussed
in
the
notes
to
the
financial
statements.
These
amounts
would
decrease
the
net
investment
income
(loss)
ratio
had
such
reductions
not
occurred.
The
effect
of
expenses
offset
are
as
follows:
(d)
Effect
on
the
expense
ratio
was
not
greater
than
0.005%.
Global
Luxury
Goods
Fund
For
a
capital
share
outstanding
during
the
See
accompanying
notes
to
financial
statements.
Six
Months
Ended
June
30,
2024
(unaudited)
Ratios
to
Average
Net
Assets:
Six
Months
Ended
June
30,
2024
Year
Ended
December
31,
2023
2022
2021
2020
2019
Net
asset
value,
beginning
of
period
$
19.22
$
15.95
$
22.30
$
20.59
$
17.09
$
15.36
Investment
Activities
Net
investment
income
(loss)
*
0.16
0.12
0.36
(0.14
)
(0.04
)
(0.02
)
Net
realized
and
unrealized
gain
(loss)
1.03
3.67
(5.69
)
5.28
3.56
2.14
Total
from
investment
activities
1.19
3.79
(5.33
)
5.14
3.52
2.12
Distributions
From
net
investment
income
–
(0.01
)
(0.57
)
(0.21
)
(0.02
)
–
From
net
realized
gains
–
(0.51
)
(0.45
)
(3.22
)
–
(0.39
)
Net
asset
value,
end
of
period
$
20.41
$
19.22
$
15.95
$
22.30
$
20.59
$
17.09
Total
Return
(a)
6.19
%
23.75
%
(23.85
)%
25.02
%
20.62
%
13.84
%
Ratios
to
Average
Net
Assets:
Net
investment
income
(loss)
1.56
%
0.64
%
2.03
%
(0.60
)%
(0.25
)%
(0.14
)%
Total
expenses
1.67
%
2.05
%
1.75
%
1.99
%
1.76
%
1.69
%
Expenses
waived
or
reimbursed
(b)
(0.16
)%
(0.18
)%
(0.20
)%
(0.06
)%
(0.01
)%
(0.15
)%
Net
expenses
(c)
1.51
%
1.87
%
1.55
%
1.93
%
1.75
%
1.54
%
Portfolio
turnover
rate
79
%
195
%
248
%
177
%
308
%
292
%
(d)
Net
assets,
end
of
period
(in
thousands)
$48,463
$47,245
$40,321
$57,667
$49,567
$35,076
*
Based
on
average
shares
outstanding.
(a)
Assumes
investment
at
the
net
asset
value
at
the
beginning
of
the
period,
reinvestment
of
all
distributions
and
a
complete
redemption
of
the
investment
at
the
net
asset
value
at
the
end
of
the
period.
(b)
Expenses
waived
or
reimbursed
reflect
reductions
to
total
expenses,
as
discussed
in
the
notes
to
the
financial
statements.
These
amounts
would
increase
the
net
investment
loss
ratio
or
decrease
the
net
investment
income
ratio,
as
applicable,
and
decrease
the
total
returns
had
such
reductions
not
occurred.
(c)
The
net
expense
ratios
shown
above
reflect
expenses
after
waivers
and
reimbursements
and
include
the
effect
of
reductions
to
total
expenses
for
any
expenses
offset.
Expense
offset
arrangements
reduce
total
expenses,
as
discussed
in
the
notes
to
the
financial
statements.
These
amounts
would
decrease
the
net
investment
income
(loss)
ratio
had
such
reductions
not
occurred.
The
effect
of
expenses
offset
are
as
follows:
(d)
Excludes
option
transactions.
(e)
Effect
on
the
expense
ratio
was
not
greater
than
0.005%.
Global
Resources
Fund
For
a
capital
share
outstanding
during
the
See
accompanying
notes
to
financial
statements.
Six
Months
Ended
June
30,
2024
(unaudited)
Ratios
to
Average
Net
Assets:
Six
Months
Ended
June
30,
2024
Year
Ended
December
31,
2023
2022
2021
2020
2019
Net
asset
value,
beginning
of
period
$
3.97
$
4.30
$
5.67
$
5.97
$
4.61
$
4.33
Investment
Activities
Net
investment
income
(loss)
*
0.01
0.01
0.01
(0.01
)
0.01
0.10
Net
realized
and
unrealized
gain
(loss)
(0.02
)
(0.34
)
(0.71
)
0.78
1.68
0.27
Total
from
investment
activities
(0.01
)
(0.33
)
(0.70
)
0.77
1.69
0.37
Distributions
From
net
investment
income
–
–
(0.67
)
(1.07
)
(0.33
)
(0.09
)
Net
asset
value,
end
of
period
$
3.96
$
3.97
$
4.30
$
5.67
$
5.97
$
4.61
Total
Return
(a)
(0.25
)%
(7.67
)%
(12.10
)%
13.43
%
37.17
%
8.55
%
Ratios
to
Average
Net
Assets:
Net
investment
income
(loss)
0.59
%
0.35
%
0.25
%
(0.22
)%
0.22
%
2.15
%
Total
expenses
1.78
%
1.69
%
1.60
%
1.90
%
2.09
%
1.61
%
Expenses
waived
or
reimbursed
(b)
(0.30
)%
(0.22
)%
(0.06
)%
–
(0.06
)%
(0.08
)%
Net
expenses
(c)
1.48
%
1.47
%
1.54
%
1.90
%
2.03
%
1.53
%
Portfolio
turnover
rate
45
%
84
%
46
%
135
%
105
%
129
%
(d)
Net
assets,
end
of
period
(in
thousands)
$41,730
$45,339
$55,053
$67,821
$63,891
$55,739
*
Based
on
average
shares
outstanding.
(a)
Assumes
investment
at
the
net
asset
value
at
the
beginning
of
the
period,
reinvestment
of
all
distributions
and
a
complete
redemption
of
the
investment
at
the
net
asset
value
at
the
end
of
the
period.
(b)
Expenses
waived
or
reimbursed
reflect
reductions
to
total
expenses,
as
discussed
in
the
notes
to
the
financial
statements.
These
amounts
would
increase
the
net
investment
loss
ratio
or
decrease
the
net
investment
income
ratio,
as
applicable,
and
decrease
the
total
returns
had
such
reductions
not
occurred.
(c)
The
net
expense
ratios
shown
above
reflect
expenses
after
waivers
and
reimbursements
and
include
the
effect
of
reductions
to
total
expenses
for
any
expenses
offset.
Expense
offset
arrangements
reduce
total
expenses,
as
discussed
in
the
notes
to
the
financial
statements.
These
amounts
would
decrease
the
net
investment
income
(loss)
ratio
had
such
reductions
not
occurred.
The
effect
of
expenses
offset
are
as
follows:
(d)
Excludes
option
transactions.
(e)
Effect
on
the
expense
ratio
was
not
greater
than
0.005%.
World
Precious
Minerals
Fund
For
a
capital
share
outstanding
during
the
See
accompanying
notes
to
financial
statements.
Six
Months
Ended
June
30,
2024
(unaudited)
Ratios
to
Average
Net
Assets:
Six
Months
Ended
June
30,
2024
Year
Ended
December
31,
2023
2022
2021
2020
2019
Net
asset
value,
beginning
of
period
$
1.45
$
1.73
$
2.58
$
5.26
$
3.31
$
2.70
Investment
Activities
Net
investment
loss
*
(0.00
)
(a)
(0.01
)
(0.03
)
(0.09
)
(0.07
)
(0.04
)
Net
realized
and
unrealized
gain
(loss)
0.09
(0.27
)
(0.82
)
(0.74
)
2.38
0.65
Total
from
investment
activities
0.09
(0.28
)
(0.85
)
(0.83
)
2.31
0.61
Distributions
From
net
investment
income
–
–
–
(1.85
)
(0.36
)
–
Net
asset
value,
end
of
period
$
1.54
$
1.45
$
1.73
$
2.58
$
5.26
$
3.31
Total
Return
(b)
6.21
%
(16.18
)%
(32.95
)%
(14.19
)%
70.60
%
22.59
%
Ratios
to
Average
Net
Assets:
Net
investment
loss
(0.61
)%
(0.90
)%
(1.31
)%
(1.77
)%
(1.77
)%
(1.31
)%
Total
expenses
1.90
%
1.74
%
1.62
%
1.93
%
1.81
%
1.55
%
Expenses
waived
or
reimbursed
(c)
(0.42
)%
(0.27
)%
(0.09
)%
–
–
(0.04
)%
Net
expenses
(d)
1.48
%
1.47
%
1.53
%
1.93
%
1.81
%
1.51
%
Portfolio
turnover
rate
14
%
21
%
25
%
41
%
34
%
20
%
(e)
Net
assets,
end
of
period
(in
thousands)
$41,617
$42,744
$54,500
$89,313
$116,247
$75,818
*
Based
on
average
shares
outstanding.
(a)
The
per
share
amount
does
not
round
to
a
full
penny.
(b)
Assumes
investment
at
the
net
asset
value
at
the
beginning
of
the
period,
reinvestment
of
all
distributions
and
a
complete
redemption
of
the
investment
at
the
net
asset
value
at
the
end
of
the
period.
(c)
Expenses
waived
or
reimbursed
reflect
reductions
to
total
expenses,
as
discussed
in
the
notes
to
the
financial
statements.
These
amounts
would
increase
the
net
investment
loss
ratio
or
decrease
the
net
investment
income
ratio,
as
applicable,
and
decrease
the
total
returns
had
such
reductions
not
occurred.
(d)
The
net
expense
ratios
shown
above
reflect
expenses
after
waivers
and
reimbursements
and
include
the
effect
of
reductions
to
total
expenses
for
any
expenses
offset.
Expense
offset
arrangements
reduce
total
expenses,
as
discussed
in
the
notes
to
the
financial
statements.
These
amounts
would
decrease
the
net
investment
income
(loss)
ratio
had
such
reductions
not
occurred.
The
effect
of
expenses
offset
are
as
follows:
(e)
Excludes
option
transactions.
(f)
Effect
on
the
expense
ratio
was
not
greater
than
0.005%.
Gold
and
Precious
Metals
Fund
For
a
capital
share
outstanding
during
the
See
accompanying
notes
to
financial
statements.
Six
Months
Ended
June
30,
2024
(unaudited)
Ratios
to
Average
Net
Assets:
Six
Months
Ended
June
30,
2024
Year
Ended
December
31,
2023
2022
2021
2020
2019
Net
asset
value,
beginning
of
period
$
9.90
$
9.75
$
11.81
$
13.53
$
10.14
$
6.70
Investment
Activities
Net
investment
income
(loss)
*
0.00
(a)
0.04
(0.01
)
(0.01
)
(0.09
)
(0.07
)
Net
realized
and
unrealized
gain
(loss)
1.34
0.11
(2.05
)
(1.46
)
3.84
3.51
Total
from
investment
activities
1.34
0.15
(2.06
)
(1.47
)
3.75
3.44
Distributions
From
net
investment
income
–
–
–
(0.25
)
(0.36
)
–
Net
asset
value,
end
of
period
$
11.24
$
9.90
$
9.75
$
11.81
$
13.53
$
10.14
Total
Return
(b)
13.54
%
1.44
%
(17.44
)%
(10.82
)%
37.06
%
51.34
%
Ratios
to
Average
Net
Assets:
Net
investment
income
(loss)
0.06
%
0.38
%
(0.11
)%
(0.07
)%
(0.82
)%
(0.90
)%
Total
expenses
1.75
%
1.48
%
1.55
%
1.82
%
1.60
%
1.59
%
Expenses
waived
or
reimbursed
(c)
(0.02
)%
(0.02
)%
(0.03
)%
–
(0.01
)%
(0.08
)%
Net
expenses
(d)
1.73
%
1.46
%
1.52
%
1.82
%
1.59
%
1.51
%
Portfolio
turnover
rate
29
%
50
%
55
%
56
%
37
%
36
%
(e)
Net
assets,
end
of
period
(in
thousands)
$101,513
$97,902
$110,089
$141,228
$160,318
$123,577
*
Based
on
average
shares
outstanding.
(a)
The
per
share
amount
does
not
round
to
a
full
penny.
(b)
Assumes
investment
at
the
net
asset
value
at
the
beginning
of
the
period,
reinvestment
of
all
distributions
and
a
complete
redemption
of
the
investment
at
the
net
asset
value
at
the
end
of
the
period.
(c)
Expenses
waived
or
reimbursed
reflect
reductions
to
total
expenses,
as
discussed
in
the
notes
to
the
financial
statements.
These
amounts
would
increase
the
net
investment
loss
ratio
or
decrease
the
net
investment
income
ratio,
as
applicable,
and
decrease
the
total
returns
had
such
reductions
not
occurred.
(d)
The
net
expense
ratios
shown
above
reflect
expenses
after
waivers
and
reimbursements
and
include
the
effect
of
reductions
to
total
expenses
for
any
expenses
offset.
Expense
offset
arrangements
reduce
total
expenses,
as
discussed
in
the
notes
to
the
financial
statements.
These
amounts
would
decrease
the
net
investment
income
(loss)
ratio
had
such
reductions
not
occurred.
The
effect
of
expenses
offset
are
as
follows:
(e)
Excludes
option
transactions.
(f)
Effect
on
the
expense
ratio
was
not
greater
than
0.005%.
Changes
in
and
Disagreements
with
Accountants
(Item
8
of
Form
N-CSR)
N/A
Proxy
Disclosure
(Item
9
of
Form
N-CSR)
The
Special
Meeting
of
Shareholders
(the
“Meeting”)
of
the
shareholders
of
World
Precious
Minerals
Fund,
held
on
Friday,
March
8,
2024
at
10:00
a.m.
Eastern
Time,
conducted
the
balloting
by
the
holders
of
shares
of
the
World
Precious
Minerals
for
purpose
of
voting
on
the
items
set
forth
below;
that
a
preliminary
count
of
15,438,014.136
shares
were
represented
in
person
or
by
proxy,
or
52.538%
of
the
29,384,245.902
total
outstanding
shares
of
the
World
Precious
Minerals
Fund
entitled
to
vote
at
said
meeting,
and
that
the
shares
were
voted
as
follows:
The
Special
Meeting
of
Shareholders
(the
“Meeting”)
of
the
shareholders
of
Global
Luxury
Goods
Fund,
held
on
Thursday,
March
28,
2024
at
11:00
a.m.
Eastern
Time,
conducted
the
balloting
by
the
holders
of
shares
of
the
Global
Luxury
Goods
Fund
for
purpose
of
voting
on
the
items
set
forth
below;
that
a
preliminary
count
of
1,274,087.022
shares
were
represented
in
person
or
by
proxy,
or
51.826%
of
the
2,458,369.474
total
outstanding
shares
of
the
Global
Luxury
Goods
Fund
entitled
to
vote
at
said
meeting,
and
that
the
shares
were
voted
as
follows:
The
Special
Meeting
of
Shareholders
(the
“Meeting”)
of
the
shareholders
of
Gold
and
Precious
Metals
Fund,
held
on
Thursday,
March
28,
2024
at
11:00
a.m.
Eastern
Time,
conducted
the
balloting
by
the
holders
of
shares
of
the
Gold
and
Precious
Metals
Fund
for
purpose
of
voting
on
the
items
set
forth
below;
that
a
preliminary
count
of
5,148,185.745
shares
were
represented
in
person
or
by
proxy,
or
52.038%
of
the
9,892,986.559
total
outstanding
shares
of
the
Gold
and
Precious
Metals
Fund
entitled
to
vote
at
said
meeting,
and
that
the
shares
were
voted
as
follows:
Proposal
For
Against
Abstain
To
approve
an
amendment
to
the
Investment
Advisory
Agreement
between
U.S.
Global
Investors,
Inc.
and
the
Trust,
on
behalf
of
the
World
Precious
Minerals
Fund,
that
eliminates
the
performance-
based
adjustment
applicable
to
the
World
Precious
Minerals
Fund’s
advisory
fee
structure.
11,878,748.811
shares
representing
76.945%
of
the
total
shares
voted.
2,603,484.691
shares
representing
16.864%
of
the
total
shares
voted.
955,780.634
shares
representing
6.191%
of
the
total
shares
voted.
Proposal
For
Against
Abstain
To
approve
an
amendment
to
the
Investment
Advisory
Agreement
between
U.S.
Global
Investors,
Inc.
and
the
Trust,
on
behalf
of
the
Global
Luxury
Goods
Fund,
that
eliminates
the
performance-
based
adjustment
applicable
to
the
Global
Luxury
Goods
Fund’s
advisory
fee
structure.
1,051,536.773
shares
representing
82.533%
of
the
total
shares
voted.
120,799.795
shares
representing
9.481%
of
the
total
shares
voted.
101,750.454
shares
representing
7.986%
of
the
total
shares
voted.
The
Special
Meeting
of
Shareholders
(the
“Meeting”)
of
the
shareholders
of
Global
Resources
Fund,
held
on
Thursday,
May
24,
2024
at
10:00
a.m.
Eastern
Time,
conducted
the
balloting
by
the
holders
of
shares
of
the
Global
Resources
Fund
for
purpose
of
voting
on
the
items
set
forth
below;
that
a
preliminary
count
of
5,744,707.658
shares
were
represented
in
person
or
by
proxy,
or
50.315%
of
the
11,417,298.454
total
outstanding
shares
of
the
Global
Resources
Fund
entitled
to
vote
at
said
meeting,
and
that
the
shares
were
voted
as
follows:
Remuneration
Paid
to
Directors,
Officers,
and
Others
(Item
10
of
Form
N-CSR)
Please
see
financial
statements
in
Item
7.
Statement
Regarding
the
Basis
for
the
Board’s
Approval
of
Investment
Advisory
Contract
(Item
11
of
Form
N-CSR)
N/A
Proposal
For
Against
Abstain
To
approve
an
amendment
to
the
Investment
Advisory
Agreement
between
U.S.
Global
Investors,
Inc.
and
the
Trust,
on
behalf
of
the
Gold
and
Precious
Metals
Fund,
that
eliminates
the
performance-
based
adjustment
applicable
to
the
Fund’s
advisory
fee
structure.
3,923,031.047
shares
representing
76.203%
of
the
total
shares
voted.
1,022,137.086
shares
representing
19.854%
of
the
total
shares
voted.
203,017.612
shares
representing
3.943%
of
the
total
shares
voted.
Proposal
For
Against
Abstain
To
approve
an
amendment
to
the
Investment
Advisory
Agreement
between
U.S.
Global
Investors,
Inc.
and
the
Trust,
on
behalf
of
the
Global
Resources
Fund,
that
eliminates
the
performance-based
adjustment
applicable
to
the
Global
Resources
Fund’s
advisory
fee
structure.
4,374,247.968
shares
representing
76.144%
of
the
total
shares
voted.
976,787.042
shares
representing
17.004%
of
the
total
shares
voted.
393,672.648
shares
representing
6.852%
of
the
total
shares
voted.
Apex
Fund
Services
3
Canal
Plaza,
Suite
600
Portland,
ME
04101
Want
to
reduce
paper
waste?
You
can
receive
this
report
and
other
important
documents
electronically.
Please
visit
www.usfunds.com
and
sign
up
at
Access
My
Account.
If
you
need
further
assistance,
please
call
us
at
800-873-8637.
.
(b) Included as part of financial statements filed under Item 7(a).
ITEM 8. CHANGES IN AND DISAGREEMENTS WITH ACCOUNTANTS FOR OPEN-END MANAGEMENT INVESTMENT COMPANIES.
Not applicable.
ITEM 9. PROXY DISCLOSURES FOR OPEN-END MANAGEMENT INVESTMENT COMPANIES.
Included as part of financial statements filed under Item 7(a).
ITEM 10. REMUNERATION PAID TO DIRECTORS, OFFICERS, AND OTHERS OF OPEN-END MANAGEMENT INVESTMENT COMPANIES.
Included as part of financial statements filed under Item 7(a).
ITEM 11. STATEMENT REGARDING BASIS FOR APPROVAL OF INVESTMENT ADVISORY CONTRACT.
Not applicable.
ITEM 12. DISCLOSURE OF PROXY VOTING POLICIES AND PROCEDURES FOR CLOSED-END MANAGEMENT INVESTMENT COMPANIES.
Not applicable.
ITEM 13. PORTFOLIO MANAGERS OF CLOSED-END MANAGEMENT INVESTMENT COMPANIES.
Not applicable.
ITEM 14. PURCHASES OF EQUITY SECURITIES BY CLOSED-END MANAGEMENT INVESTMENT COMPANY AND AFFILIATED PURCHASERS.
Not applicable.
ITEM 15. SUBMISSION OF MATTERS TO A VOTE OF SECURITY HOLDERS
The Registrant does not accept nominees to the Board of Trustees from shareholders.
ITEM 16. CONTROLS AND PROCEDURES
(a) The Registrant’s Principal Executive Officer and Principal Financial Officer have concluded that the Registrant’s disclosure controls and procedures (as defined in Rule 30a-3(c) under the Act are effective, based on their evaluation of the controls and procedures required by Rule 30a-3(b) under the Act and Rules 13a-15(b) or 15d-15(b) under the Securities Exchange Act of 1934, as of a date within 90 days of the filing date of this report.
(b) There were no changes in the Registrant’s internal control over financial reporting (as defined in Rule 30a-3(d) under the Act) that occurred during the Reporting Period that have materially affected, or are reasonably likely to materially affect, the Registrant’s internal control over financial reporting.
ITEM 17. DISCLOSURE OF SECURITIES LENDING ACTIVITIES FOR CLOSED-END MANAGEMENT INVESTMENT COMPANIES.
Not applicable.
ITEM 18. RECOVERY OF ERRONEOUSLY AWARDED COMPENSATION.
Not applicable.
ITEM 19. EXHIBITS.
(a)(1) Not applicable.
(a)(2) Not applicable.
(a)(4) Not applicable.
(a)(5) Not applicable.
SIGNATURES
Pursuant to the requirements of the Securities Exchange Act of 1934 and the Investment Company Act of 1940, the Registrant has duly caused this report to be signed on its behalf by the undersigned, thereunto duly authorized.
Registrant U.S. Global Investors Funds
| By: | /s/ Zachary Tackett | |
| | Zachary Tackett, Principal Executive Officer | |
| | | |
| Date: | August 26, 2024 | |
Pursuant to the requirements of the Securities Exchange Act of 1934 and the Investment Company Act of 1940, this report has been signed below by the following persons on behalf of the Registrant and in the capacities and on the dates indicated.
| By: | /s/ Zachary Tackett | |
| | Zachary Tackett, Principal Executive Officer | |
| | | |
| Date: | August 26, 2024 | |
| By: | /s/ Karen Shaw | |
| | Karen Shaw, Principal Financial Officer | |
| | | |
| Date: | August 26, 2024 | |