UNITED STATES
SECURITIES AND EXCHANGE COMMISSION
WASHINGTON, D.C. 20549
FORM N-CSR
CERTIFIED SHAREHOLDER REPORT OF REGISTERED MANAGEMENT
INVESTMENT COMPANIES
Investment Company Act file number 811-01800
U.S. GLOBAL INVESTORS FUNDS
Three Canal Plaza, Suite 600
Portland, Maine 04101
Zachary Tackett, Principal Executive Officer
Three Canal Plaza, Suite 600
Portland, Maine 04101
207-347-2000
Date of fiscal year end: December 31
Date of reporting period: January 1, 2024 – December 31, 2024
ITEM 1. REPORT TO SHAREHOLDERS.
(a) A copy of the report transmitted to stockholders pursuant to Rule 30e-1 under the Investment Company Act, as amended (“Act”), is attached hereto.
Annual Shareholder Report - December 31, 2024
This annual shareholder report contains important information about the USGI Global Luxury Goods Fund for the period of January 1, 2024, to December 31, 2024. You can find additional information about the Fund at www.usfunds.com/invest-with-us/prospectus-2/. You can also request this information by contacting us at (800) 873-8637.
What were the Fund's costs for the last year?
(based on a hypothetical $10,000 investment)
| Class Name | Costs of a $10,000 investment | Costs paid as a percentage of a $10,000 investment |
|---|
| Investor Class | $162 | 1.51% |
|---|
How did the Fund perform in the last year?
Under normal market conditions, the U.S. Global Investors Global Luxury Goods Fund (USLUX) invests the majority of its net assets in securities of companies involved in the production, processing, distribution, and manufacturing of luxury and high-end products, services, or equipment. The global luxury sector saw strong growth post-pandemic, but last year, growth was flat as the sector underwent a period of normalization. Consumer spending has remained robust in the U.S., with modest growth in Europe, while China has lagged behind. Generally, companies with exposure to American, European, and Asia (excluding China) consumers have recorded gains, while those primarily exposed to China have experienced losses. The luxury travel industry continues to grow and remains a key contributor to the sector.
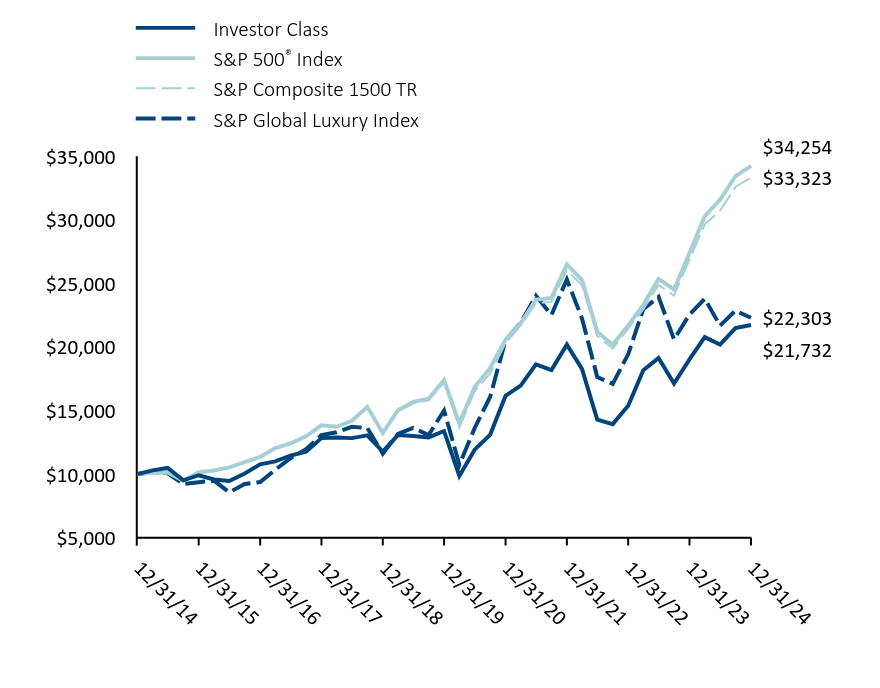
Total Return Based on a $10,000 Investment
| Date | Investor Class | S&P 500® Index | S&P Composite 1500 TR | S&P Global Luxury Index |
|---|
| 12/31/14 | $10,000 | $10,000 | $10,000 | $10,000 |
|---|
| 03/31/15 | $10,291 | $10,095 | $10,139 | $10,164 |
|---|
| 06/30/15 | $10,479 | $10,123 | $10,156 | $10,061 |
|---|
| 09/30/15 | $9,511 | $9,471 | $9,477 | $9,224 |
|---|
| 12/31/15 | $9,906 | $10,138 | $10,101 | $9,360 |
|---|
| 03/31/16 | $9,570 | $10,275 | $10,260 | $9,479 |
|---|
| 06/30/16 | $9,453 | $10,527 | $10,526 | $8,563 |
|---|
| 09/30/16 | $10,050 | $10,933 | $10,945 | $9,221 |
|---|
| 12/31/16 | $10,764 | $11,351 | $11,417 | $9,368 |
|---|
| 03/31/17 | $10,995 | $12,039 | $12,073 | $10,341 |
|---|
| 06/30/17 | $11,445 | $12,411 | $12,430 | $11,249 |
|---|
| 09/30/17 | $11,768 | $12,967 | $12,982 | $11,949 |
|---|
| 12/31/17 | $12,827 | $13,829 | $13,830 | $13,075 |
|---|
| 03/31/18 | $12,880 | $13,724 | $13,730 | $13,293 |
|---|
| 06/30/18 | $12,827 | $14,195 | $14,232 | $13,718 |
|---|
| 09/30/18 | $13,044 | $15,290 | $15,278 | $13,619 |
|---|
| 12/31/18 | $11,773 | $13,223 | $13,144 | $11,601 |
|---|
| 03/31/19 | $13,067 | $15,027 | $14,937 | $13,162 |
|---|
| 06/30/19 | $12,998 | $15,674 | $15,558 | $13,629 |
|---|
| 09/30/19 | $12,883 | $15,940 | $15,797 | $13,079 |
|---|
| 12/31/19 | $13,386 | $17,386 | $17,206 | $15,003 |
|---|
| 03/31/20 | $9,851 | $13,979 | $13,666 | $10,727 |
|---|
| 06/30/20 | $11,920 | $16,850 | $16,504 | $13,610 |
|---|
| 09/30/20 | $13,088 | $18,355 | $17,917 | $16,069 |
|---|
| 12/31/20 | $16,164 | $20,585 | $20,289 | $20,542 |
|---|
| 03/31/21 | $16,956 | $21,856 | $21,691 | $21,899 |
|---|
| 06/30/21 | $18,627 | $23,724 | $23,456 | $24,025 |
|---|
| 09/30/21 | $18,180 | $23,862 | $23,539 | $22,523 |
|---|
| 12/31/21 | $20,189 | $26,494 | $26,060 | $25,320 |
|---|
| 03/31/22 | $18,278 | $25,276 | $24,852 | $22,257 |
|---|
| 06/30/22 | $14,284 | $21,206 | $20,872 | $17,635 |
|---|
| 09/30/22 | $13,930 | $20,170 | $19,879 | $17,101 |
|---|
| 12/31/22 | $15,374 | $21,696 | $21,427 | $19,424 |
|---|
| 03/31/23 | $18,179 | $23,322 | $22,961 | $22,976 |
|---|
| 06/30/23 | $19,143 | $25,361 | $24,887 | $23,949 |
|---|
| 09/30/23 | $17,119 | $24,531 | $24,050 | $20,601 |
|---|
| 12/31/23 | $19,026 | $27,399 | $26,883 | $22,550 |
|---|
| 03/31/24 | $20,778 | $30,291 | $29,655 | $23,804 |
|---|
| 06/30/24 | $20,194 | $31,589 | $30,741 | $21,679 |
|---|
| 09/30/24 | $21,491 | $33,448 | $32,599 | $22,863 |
|---|
| 12/31/24 | $21,732 | $34,254 | $33,323 | $22,303 |
|---|
The above chart represents historical performance of a hypothetical $10,000 investment over the past 10 years. Effective May 1, 2024, the Fund changed its primary benchmark from the S&P Composite 1500 Index to the S&P 500 Index due to regulatory requirements. The Fund retained the S&P Global Luxury Index as a secondary benchmark because the S&P Global Luxury Index more closely aligns with the Fund's investment strategies and investment restrictions. The Fund retained the S&P 500 Composite 1500 Index as a secondary benchmark because it serves as a basis for the Fund's performance adjustment, which will phase out on April 1, 2025.
Average Annual Total Returns
| | One Year | Five Year | Ten Year |
|---|
| Investor Class | 14.22% | 10.18% | 8.07% |
|---|
S&P 500® Index | 25.02% | 14.53% | 13.10% |
|---|
| S&P Composite 1500 TR | 23.95% | 14.13% | 12.79% |
|---|
| S&P Global Luxury Index | -1.10% | 8.25% | 8.35% |
|---|
The Fund’s past performance is not a good predictor of how the Fund will perform in the future. The graph and table do not reflect the deduction of taxes that a shareholder would pay on Fund distributions or redemption of Fund shares.
| Total Net Assets | $49,609,930 |
|---|
| # of Portfolio Holdings | 54 |
|---|
| Portfolio Turnover Rate | 195% |
|---|
| Management Fee (Net of fees waived) | $282,690 |
|---|
Top Ten Holdings
(% net assets)
| Hermes International SCA | 9.18% |
| Ferrari NV | 5.82% |
| Cie Financiere Richemont SA | 5.69% |
| LVMH Moet Hennessy Louis Vuitton SE, ADR | 4.07% |
| Tesla, Inc. | 3.94% |
| Mercedes-Benz Group AG, ADR | 3.87% |
| Royal Caribbean Cruises, Ltd. | 3.61% |
| Hilton Worldwide Holdings, Inc. | 3.21% |
| Industria de Diseno Textil SA | 3.21% |
| The Goldman Sachs Group, Inc. | 2.99% |
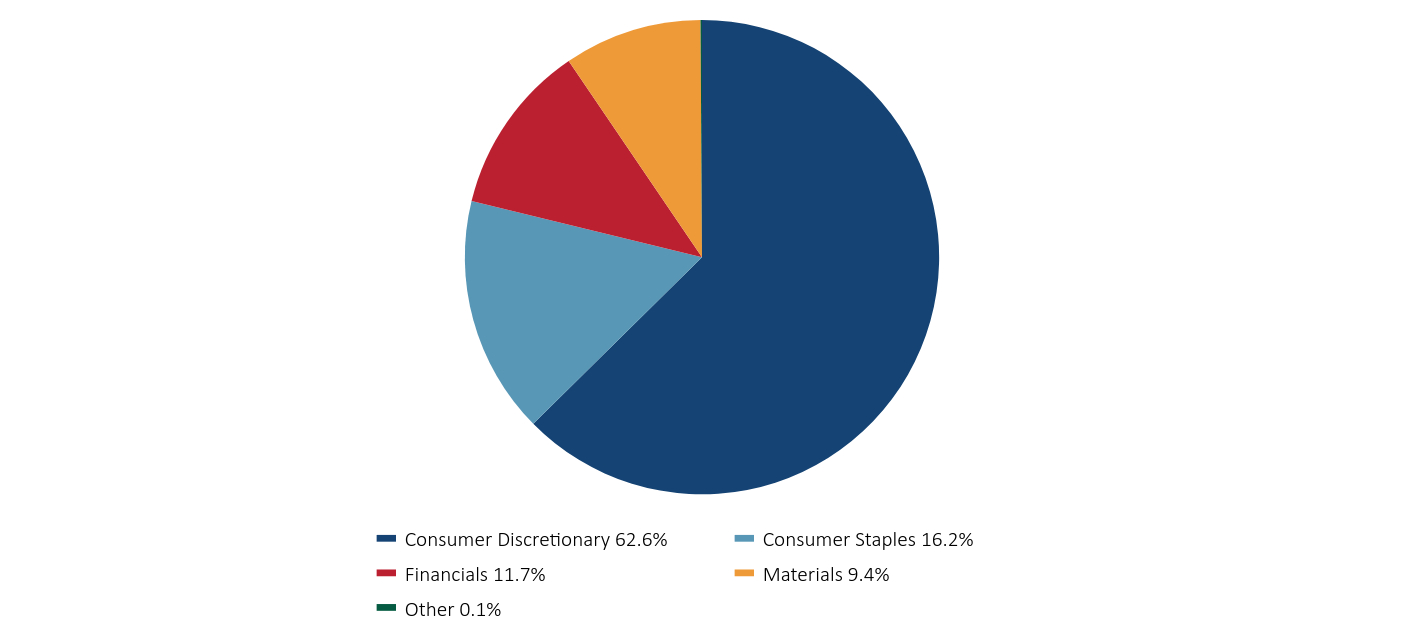
Sector Weightings
(% total investments)
| Value | Value |
|---|
| Consumer Discretionary | 62.6% |
| Consumer Staples | 16.2% |
| Financials | 11.7% |
| Materials | 9.4% |
| Other | 0.1% |
Where can I find additional information about the fund?
If you wish to view additional information about the Fund; including but not limited to its prospectus, holdings, financial information, and proxy information, please visit www.usfunds.com/invest-with-us/prospectus-2/. The Fund is distributed by Foreside Fund Services, LLC, a wholly owned subsidiary of Foreside Financial Group, LLC (dba ACA Group).
U.S. Global Investors Funds
Annual Shareholder Report - December 31, 2024
Annual Shareholder Report - December 31, 2024
This annual shareholder report contains important information about the USGI Global Resources Fund for the period of January 1, 2024, to December 31, 2024. You can find additional information about the Fund at www.usfunds.com/invest-with-us/prospectus-2/. You can also request this information by contacting us at (800) 873-8637.
What were the Fund's costs for the last year?
(based on a hypothetical $10,000 investment)
| Class Name | Costs of a $10,000 investment | Costs paid as a percentage of a $10,000 investment |
|---|
| Investor Class | $154 | 1.57% |
|---|
How did the Fund perform in the last year?
Under normal market conditions, the U.S. Global Resources Fund (PSPFX) invests most of its assets in companies that provide exposure to the natural resources industry, which can include the materials, energy and industrials sectors. Gold prices rose to record highs, breaking new all-time highs twice in the second half of 2024. Goldman Sachs forecasts this trend will continue in 2025, with prices reaching $2,700. Additionally, global spending on energy exceeded $3 trillion. The fund’s performance has also been affected by strong points of contention and political power, which drive volatility in key energy commodities, as well as heightened global lending rates, which increase infrastructure project costs.
Total Return Based on a $10,000 Investment
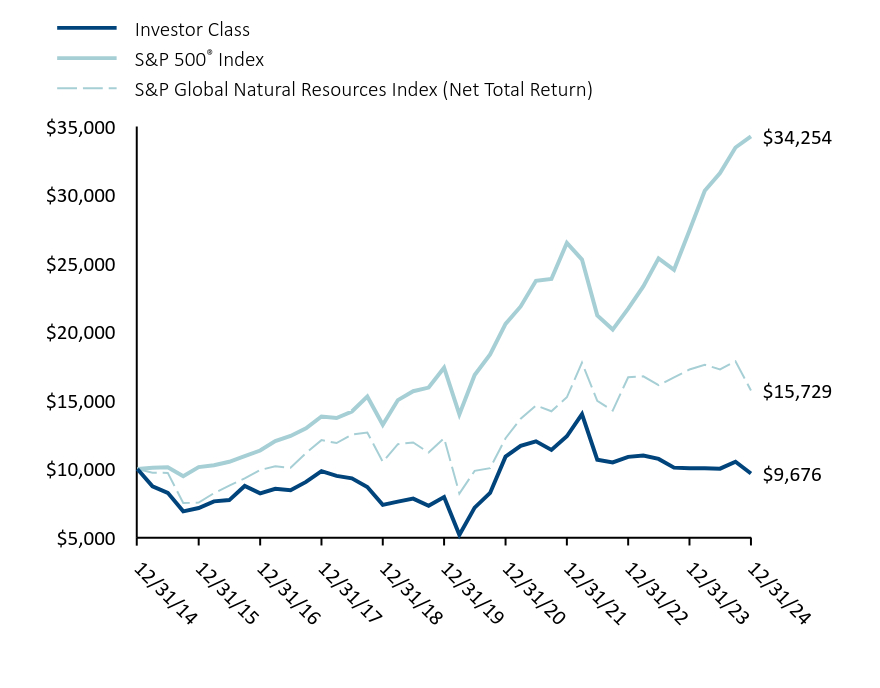
| Date | Investor Class | S&P 500® Index | S&P Global Natural Resources Index (Net Total Return) |
|---|
| 12/31/14 | $10,000 | $10,000 | $10,000 |
|---|
| 03/31/15 | $8,741 | $10,095 | $9,726 |
|---|
| 06/30/15 | $8,261 | $10,123 | $9,716 |
|---|
| 09/30/15 | $6,912 | $9,471 | $7,517 |
|---|
| 12/31/15 | $7,157 | $10,138 | $7,550 |
|---|
| 03/31/16 | $7,642 | $10,275 | $8,238 |
|---|
| 06/30/16 | $7,733 | $10,527 | $8,796 |
|---|
| 09/30/16 | $8,764 | $10,933 | $9,312 |
|---|
| 12/31/16 | $8,230 | $11,351 | $9,925 |
|---|
| 03/31/17 | $8,559 | $12,039 | $10,200 |
|---|
| 06/30/17 | $8,449 | $12,411 | $10,089 |
|---|
| 09/30/17 | $9,061 | $12,967 | $11,161 |
|---|
| 12/31/17 | $9,840 | $13,829 | $12,107 |
|---|
| 03/31/18 | $9,501 | $13,724 | $11,891 |
|---|
| 06/30/18 | $9,323 | $14,195 | $12,517 |
|---|
| 09/30/18 | $8,693 | $15,290 | $12,663 |
|---|
| 12/31/18 | $7,384 | $13,223 | $10,523 |
|---|
| 03/31/19 | $7,621 | $15,027 | $11,809 |
|---|
| 06/30/19 | $7,841 | $15,674 | $11,938 |
|---|
| 09/30/19 | $7,316 | $15,940 | $11,200 |
|---|
| 12/31/19 | $7,960 | $17,386 | $12,250 |
|---|
| 03/31/20 | $5,198 | $13,979 | $8,209 |
|---|
| 06/30/20 | $7,183 | $16,850 | $9,865 |
|---|
| 09/30/20 | $8,254 | $18,355 | $10,058 |
|---|
| 12/31/20 | $10,901 | $20,585 | $12,244 |
|---|
| 03/31/21 | $11,687 | $21,856 | $13,664 |
|---|
| 06/30/21 | $12,016 | $23,724 | $14,636 |
|---|
| 09/30/21 | $11,394 | $23,862 | $14,212 |
|---|
| 12/31/21 | $12,386 | $26,494 | $15,232 |
|---|
| 03/31/22 | $14,002 | $25,276 | $17,758 |
|---|
| 06/30/22 | $10,682 | $21,206 | $14,968 |
|---|
| 09/30/22 | $10,485 | $20,170 | $14,259 |
|---|
| 12/31/22 | $10,887 | $21,696 | $16,693 |
|---|
| 03/31/23 | $10,988 | $23,322 | $16,760 |
|---|
| 06/30/23 | $10,735 | $25,361 | $16,111 |
|---|
| 09/30/23 | $10,102 | $24,531 | $16,683 |
|---|
| 12/31/23 | $10,051 | $27,399 | $17,257 |
|---|
| 03/31/24 | $10,051 | $30,291 | $17,602 |
|---|
| 06/30/24 | $10,026 | $31,589 | $17,263 |
|---|
| 09/30/24 | $10,532 | $33,448 | $17,852 |
|---|
| 12/31/24 | $9,676 | $34,254 | $15,729 |
|---|
The above chart represents historical performance of a hypothetical $10,000 investment over the past 10 years. Effective May 1, 2024, the Fund changed its primary benchmark from the S&P Global Natural Resources Index to the S&P 500 Index due to regulatory requirements. The Fund retained the S&P Global Natural Resources Index as a secondary benchmark because the S&P Global Natural Resources Index more closely aligns with the Fund's investment strategies and investment restrictions.
Average Annual Total Returns
| | One Year | Five Year | Ten Year |
|---|
| Investor Class | -3.73% | 3.98% | -0.33% |
|---|
S&P 500® Index | 25.02% | 14.53% | 13.10% |
|---|
| S&P Global Natural Resources Index (Net Total Return) | -8.86% | 5.13% | 4.63% |
|---|
The Fund’s past performance is not a good predictor of how the Fund will perform in the future. The graph and table do not reflect the deduction of taxes that a shareholder would pay on Fund distributions or redemption of Fund shares.
| Total Net Assets | $36,537,413 |
|---|
| # of Portfolio Holdings | 144 |
|---|
| Portfolio Turnover Rate | 85% |
|---|
| Management Fee (Net of fees waived) | $134,709 |
|---|
Top Ten Holdings
(% net assets)
| Abaxx Technologies, Inc. | 6.34% |
| Ivanhoe Mines, Ltd. | 4.85% |
| Cheniere Energy, Inc. | 4.41% |
| Aris Gold Corp. | 2.73% |
| Filo Corp. | 2.58% |
| Montage Gold Corp. | 2.38% |
| Linde PLC | 2.29% |
| NG Energy International Corp. | 2.09% |
| Viper Energy, Inc. | 2.02% |
| K92 Mining, Inc. | 1.90% |
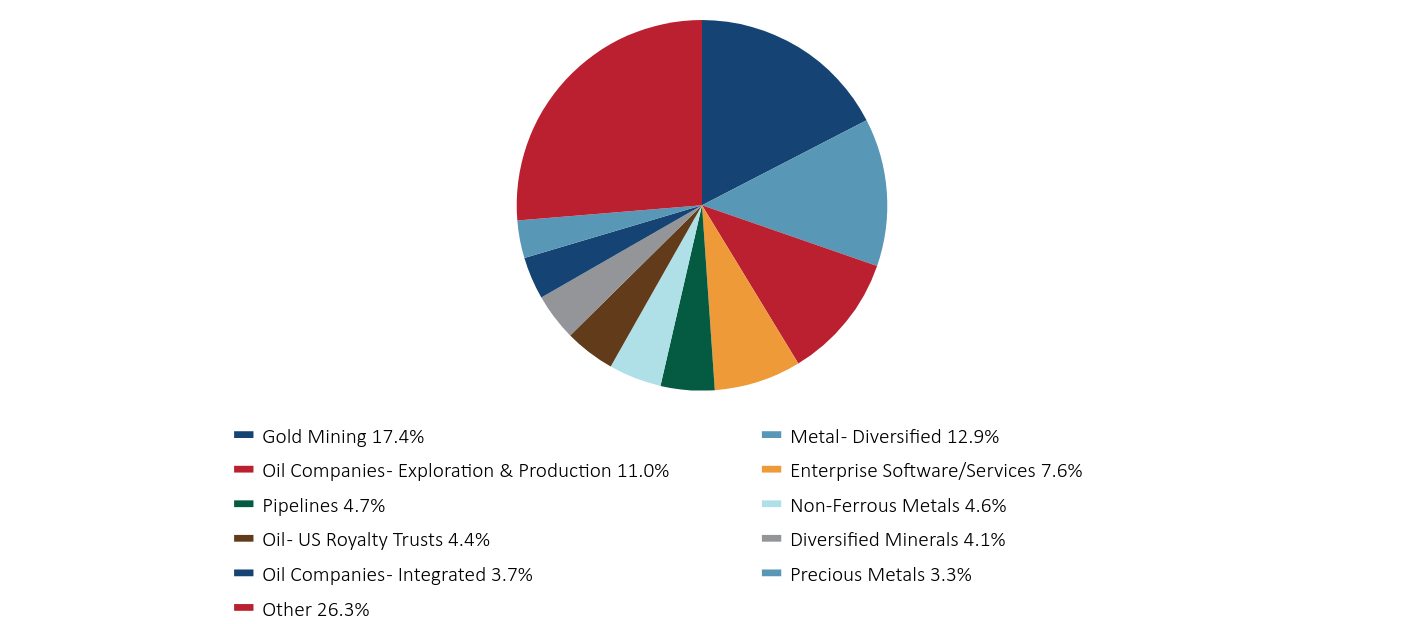
Sector Weightings
(% total investments)
| Value | Value |
|---|
| Gold Mining | 17.4% |
| Metal - Diversified | 12.9% |
| Oil Companies - Exploration & Production | 11.0% |
| Enterprise Software/Services | 7.6% |
| Pipelines | 4.7% |
| Non-Ferrous Metals | 4.6% |
| Oil - US Royalty Trusts | 4.4% |
| Diversified Minerals | 4.1% |
| Oil Companies - Integrated | 3.7% |
| Precious Metals | 3.3% |
| Other | 26.3% |
Where can I find additional information about the fund?
If you wish to view additional information about the Fund; including but not limited to its prospectus, holdings, financial information, and proxy information, please visit www.usfunds.com/invest-with-us/prospectus-2/. The Fund is distributed by Foreside Fund Services, LLC, a wholly owned subsidiary of Foreside Financial Group, LLC (dba ACA Group).
U.S. Global Investors Funds
Annual Shareholder Report - December 31, 2024
Gold and Precious Metals Fund
Annual Shareholder Report - December 31, 2024
This annual shareholder report contains important information about the USGI Gold and Precious Metals Fund for the period of January 1, 2024, to December 31, 2024. You can find additional information about the Fund at www.usfunds.com/invest-with-us/prospectus-2/. You can also request this information by contacting us at (800) 873-8637.
What were the Fund's costs for the last year?
(based on a hypothetical $10,000 investment)
| Class Name | Costs of a $10,000 investment | Costs paid as a percentage of a $10,000 investment |
|---|
| Investor Class | $184 | 1.69% |
|---|
How did the Fund perform in the last year?
Under normal market conditions, the Gold and Precious Metals Fund (USERX) invests most of its assets in precious metals, particularly in producing precious metals assets. USERX experienced notable performance in the second half of 2024 due to rising gold prices, which broke all-time highs twice during the period. In addition, bullish sentiment from both China and India contributed to strong demand for gold, driven by central bank purchases and consumer interest. The gold narrative remained strong as investors sought safety from risk assets while key central banks around the globe grappled with lending rates and monetary policy. Silver also performed well during the second half of 2024, primarily due to its correlation with gold as an alternative safe-haven asset and a hedge against a weakening dollar, which persisted until mid-December.
Total Return Based on a $10,000 Investment
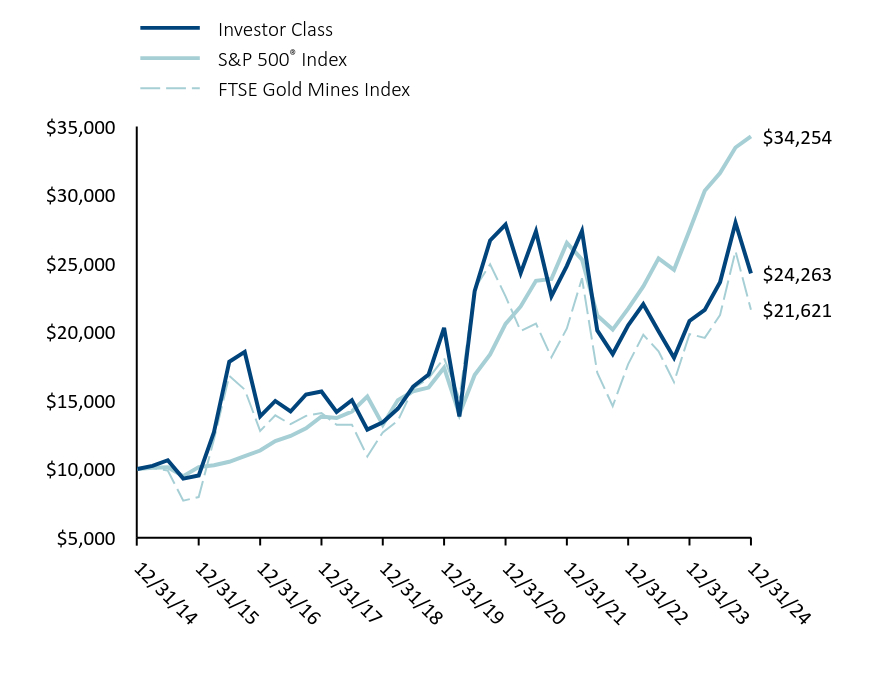
| Date | Investor Class | S&P 500® Index | FTSE Gold Mines Index |
|---|
| 12/31/14 | $10,000 | $10,000 | $10,000 |
|---|
| 03/31/15 | $10,233 | $10,095 | $10,085 |
|---|
| 06/30/15 | $10,640 | $10,123 | $9,889 |
|---|
| 09/30/15 | $9,302 | $9,471 | $7,692 |
|---|
| 12/31/15 | $9,522 | $10,138 | $7,953 |
|---|
| 03/31/16 | $12,696 | $10,275 | $12,167 |
|---|
| 06/30/16 | $17,817 | $10,527 | $16,801 |
|---|
| 09/30/16 | $18,537 | $10,933 | $15,792 |
|---|
| 12/31/16 | $13,841 | $11,351 | $12,782 |
|---|
| 03/31/17 | $14,962 | $12,039 | $13,913 |
|---|
| 06/30/17 | $14,195 | $12,411 | $13,266 |
|---|
| 09/30/17 | $15,434 | $12,967 | $13,876 |
|---|
| 12/31/17 | $15,650 | $13,829 | $14,090 |
|---|
| 03/31/18 | $14,156 | $13,724 | $13,226 |
|---|
| 06/30/18 | $15,021 | $14,195 | $13,237 |
|---|
| 09/30/18 | $12,878 | $15,290 | $10,917 |
|---|
| 12/31/18 | $13,413 | $13,223 | $12,674 |
|---|
| 03/31/19 | $14,394 | $15,027 | $13,528 |
|---|
| 06/30/19 | $16,016 | $15,674 | $15,877 |
|---|
| 09/30/19 | $16,897 | $15,940 | $16,622 |
|---|
| 12/31/19 | $20,300 | $17,386 | $18,084 |
|---|
| 03/31/20 | $13,834 | $13,979 | $15,159 |
|---|
| 06/30/20 | $22,963 | $16,850 | $23,161 |
|---|
| 09/30/20 | $26,667 | $18,355 | $24,932 |
|---|
| 12/31/20 | $27,824 | $20,585 | $22,595 |
|---|
| 03/31/21 | $24,287 | $21,856 | $20,068 |
|---|
| 06/30/21 | $27,331 | $23,724 | $20,603 |
|---|
| 09/30/21 | $22,601 | $23,862 | $18,148 |
|---|
| 12/31/21 | $24,814 | $26,494 | $20,250 |
|---|
| 03/31/22 | $27,356 | $25,276 | $23,913 |
|---|
| 06/30/22 | $20,107 | $21,206 | $17,020 |
|---|
| 09/30/22 | $18,384 | $20,170 | $14,592 |
|---|
| 12/31/22 | $20,486 | $21,696 | $17,650 |
|---|
| 03/31/23 | $22,019 | $23,322 | $19,790 |
|---|
| 06/30/23 | $20,044 | $25,361 | $18,583 |
|---|
| 09/30/23 | $18,111 | $24,531 | $16,339 |
|---|
| 12/31/23 | $20,801 | $27,399 | $19,841 |
|---|
| 03/31/24 | $21,599 | $30,291 | $19,564 |
|---|
| 06/30/24 | $23,616 | $31,589 | $21,231 |
|---|
| 09/30/24 | $27,965 | $33,448 | $25,895 |
|---|
| 12/31/24 | $24,263 | $34,254 | $21,621 |
|---|
The above chart represents historical performance of a hypothetical $10,000 investment over the past 10 years. Effective May 1, 2024, the Fund changed its primary benchmark from the FTSE Gold Mines Index to the S&P 500 Index due to regulatory requirements. The Fund retained the FTSE Gold Mines Index as a secondary benchmark because the FTSE Gold Mines Index more closely aligns with the Fund's investment strategies and investment restrictions.
Average Annual Total Returns
| | One Year | Five Year | Ten Year |
|---|
| Investor Class | 16.65% | 3.63% | 9.27% |
|---|
S&P 500® Index | 25.02% | 14.53% | 13.10% |
|---|
| FTSE Gold Mines Index | 8.97% | 3.64% | 8.02% |
|---|
The Fund’s past performance is not a good predictor of how the Fund will perform in the future. The graph and table do not reflect the deduction of taxes that a shareholder would pay on Fund distributions or redemption of Fund shares.
| Total Net Assets | $103,640,417 |
|---|
| # of Portfolio Holdings | 75 |
|---|
| Portfolio Turnover Rate | 58% |
|---|
| Management Fee Paid | $930,488 |
|---|
Top Ten Holdings
(% net assets)
| K92 Mining, Inc. | 8.74% |
| Alamos Gold, Inc. | 5.34% |
| Aya Gold & Silver, Inc. | 4.69% |
| Aris Gold Corp. | 3.77% |
| Mineros SA | 3.40% |
| Westgold Resources, Ltd. | 3.36% |
| Vox Royalty Corp. | 3.19% |
| Catalyst Metals, Ltd. | 3.07% |
| Lundin Gold, Inc. | 2.68% |
| New Gold, Inc. | 2.39% |
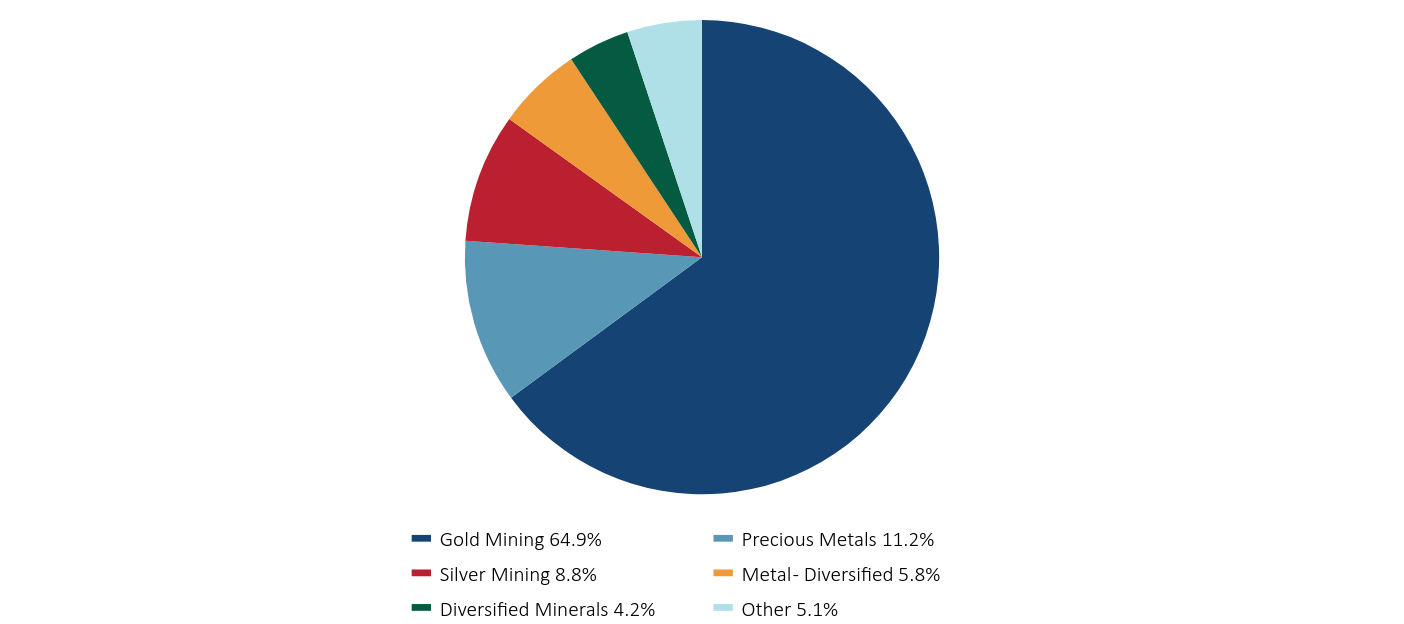
Sector Weightings
(% total investments)
| Value | Value |
|---|
| Gold Mining | 64.9% |
| Precious Metals | 11.2% |
| Silver Mining | 8.8% |
| Metal - Diversified | 5.8% |
| Diversified Minerals | 4.2% |
| Other | 5.1% |
Where can I find additional information about the fund?
If you wish to view additional information about the Fund; including but not limited to its prospectus, holdings, financial information, and proxy information, please visit www.usfunds.com/invest-with-us/prospectus-2/. The Fund is distributed by Foreside Fund Services, LLC, a wholly owned subsidiary of Foreside Financial Group, LLC (dba ACA Group).
U.S. Global Investors Funds
Gold and Precious Metals Fund
Annual Shareholder Report - December 31, 2024
Annual Shareholder Report - December 31, 2024
This annual shareholder report contains important information about the USGI Near-Term Tax Free Fund for the period of January 1, 2024, to December 31, 2024. You can find additional information about the Fund at www.usfunds.com/invest-with-us/prospectus-2/. You can also request this information by contacting us at (800) 873-8637.
What were the Fund's costs for the last year?
(based on a hypothetical $10,000 investment)
| Class Name | Costs of a $10,000 investment | Costs paid as a percentage of a $10,000 investment |
|---|
| Investor Class | $46 | 0.45% |
|---|
How did the Fund perform in the last year?
The U.S. Near-Term Tax Free Fund (NEARX) primarily invests in U.S. government securities and navigated a complex rate environment in the second half of 2024. While the Federal Reserve cut rates three times during the semiannual period between July 1 and the end of the year, bond investors continued to experience volatility in key rates. Shorter durations did not suffer as much as longer-term maturities. The woes of longer-term maturities were signaled by the demand for higher yields, driven by increased risk as a result of selling out of longer maturities. The Fed’s three consecutive rate cuts came later than expected, as at the beginning of the year there was a 90% probability priced in for the Fed to cut in the first half of 2024. Employment and inflation, the two components of the Fed’s dual mandate, will continue to be closely monitored as indicators of future rate movements.
Total Return Based on a $10,000 Investment
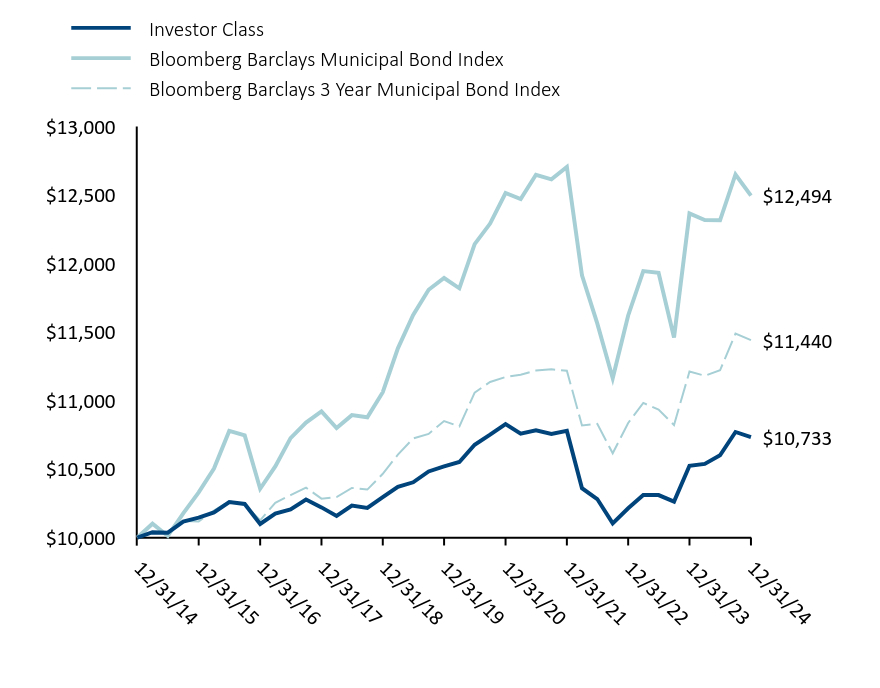
| Date | Investor Class | Bloomberg Barclays Municipal Bond Index | Bloomberg Barclays 3 Year Municipal Bond Index |
|---|
| 12/31/14 | $10,000 | $10,000 | $10,000 |
|---|
| 03/31/15 | $10,039 | $10,101 | $10,041 |
|---|
| 06/30/15 | $10,036 | $10,012 | $10,039 |
|---|
| 09/30/15 | $10,117 | $10,177 | $10,120 |
|---|
| 12/31/15 | $10,145 | $10,330 | $10,118 |
|---|
| 03/31/16 | $10,183 | $10,503 | $10,196 |
|---|
| 06/30/16 | $10,259 | $10,778 | $10,266 |
|---|
| 09/30/16 | $10,245 | $10,745 | $10,239 |
|---|
| 12/31/16 | $10,099 | $10,356 | $10,126 |
|---|
| 03/31/17 | $10,175 | $10,519 | $10,254 |
|---|
| 06/30/17 | $10,205 | $10,725 | $10,309 |
|---|
| 09/30/17 | $10,277 | $10,839 | $10,364 |
|---|
| 12/31/17 | $10,220 | $10,920 | $10,284 |
|---|
| 03/31/18 | $10,158 | $10,799 | $10,296 |
|---|
| 06/30/18 | $10,233 | $10,893 | $10,362 |
|---|
| 09/30/18 | $10,216 | $10,877 | $10,350 |
|---|
| 12/31/18 | $10,295 | $11,060 | $10,465 |
|---|
| 03/31/19 | $10,370 | $11,380 | $10,605 |
|---|
| 06/30/19 | $10,403 | $11,623 | $10,723 |
|---|
| 09/30/19 | $10,482 | $11,807 | $10,756 |
|---|
| 12/31/19 | $10,519 | $11,893 | $10,850 |
|---|
| 03/31/20 | $10,551 | $11,818 | $10,810 |
|---|
| 06/30/20 | $10,677 | $12,140 | $11,057 |
|---|
| 09/30/20 | $10,750 | $12,290 | $11,135 |
|---|
| 12/31/20 | $10,828 | $12,513 | $11,171 |
|---|
| 03/31/21 | $10,758 | $12,469 | $11,188 |
|---|
| 06/30/21 | $10,782 | $12,646 | $11,218 |
|---|
| 09/30/21 | $10,756 | $12,613 | $11,227 |
|---|
| 12/31/21 | $10,778 | $12,703 | $11,217 |
|---|
| 03/31/22 | $10,360 | $11,912 | $10,818 |
|---|
| 06/30/22 | $10,281 | $11,562 | $10,829 |
|---|
| 09/30/22 | $10,104 | $11,162 | $10,615 |
|---|
| 12/31/22 | $10,214 | $11,620 | $10,836 |
|---|
| 03/31/23 | $10,311 | $11,943 | $10,982 |
|---|
| 06/30/23 | $10,310 | $11,931 | $10,933 |
|---|
| 09/30/23 | $10,262 | $11,459 | $10,821 |
|---|
| 12/31/23 | $10,524 | $12,364 | $11,211 |
|---|
| 03/31/24 | $10,537 | $12,316 | $11,180 |
|---|
| 06/30/24 | $10,600 | $12,314 | $11,220 |
|---|
| 09/30/24 | $10,770 | $12,648 | $11,488 |
|---|
| 12/31/24 | $10,733 | $12,494 | $11,440 |
|---|
The above chart represents historical performance of a hypothetical $10,000 investment over the past 10 years. Effective May 1, 2024, the Fund changed its primary benchmark from the Bloomberg 3-Year Municipal Bond Index to the Bloomberg Municipal Bond Index due to regulatory requirements. The Fund retained the Bloomberg 3-Year Municipal Bond Index as a secondary benchmark as the Bloomberg 3-Year Municipal Bond Index more closely aligns with the Fund's investment strategies and investment restrictions.
Average Annual Total Returns
| | One Year | Five Year | Ten Year |
|---|
| Investor Class | 1.99% | 0.40% | 0.71% |
|---|
| Bloomberg Barclays Municipal Bond Index | 1.05% | 0.99% | 2.25% |
|---|
| Bloomberg Barclays 3 Year Municipal Bond Index | 2.04% | 1.07% | 1.35% |
|---|
The Fund’s past performance is not a good predictor of how the Fund will perform in the future. The graph and table do not reflect the deduction of taxes that a shareholder would pay on Fund distributions or redemption of Fund shares.
| Total Net Assets | $23,458,266 |
|---|
| # of Portfolio Holdings | 56 |
|---|
| Portfolio Turnover Rate | 53% |
|---|
| Management Fee (Net of fees waived) | $(114,220) |
|---|
Top Ten Area Concentrations
(% of net assets)
| Texas | 17.48% |
| Minnesota | 7.14% |
| Pennsylvania | 6.83% |
| New Mexico | 4.93% |
| Illinois | 4.45% |
| Wisconsin | 4.14% |
| North Carolina | 3.80% |
| Michigan | 3.46% |
| Georgia | 3.39% |
| Massachusetts | 3.32% |
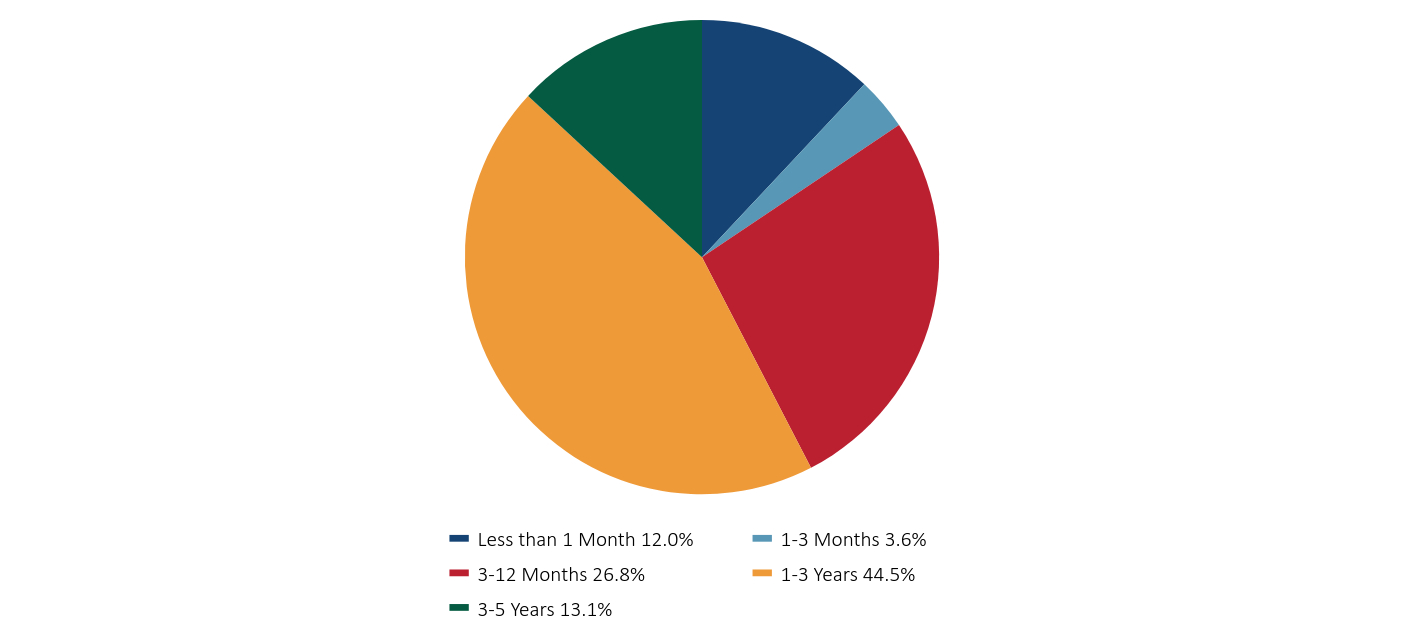
Maturity Weightings
(% total investments)
| Value | Value |
|---|
| Less than 1 Month | 12.0% |
| 1-3 Months | 3.6% |
| 3-12 Months | 26.8% |
| 1-3 Years | 44.5% |
| 3-5 Years | 13.1% |
Where can I find additional information about the fund?
If you wish to view additional information about the Fund; including but not limited to its prospectus, holdings, financial information, and proxy information, please visit www.usfunds.com/invest-with-us/prospectus-2/. The Fund is distributed by Foreside Fund Services, LLC, a wholly owned subsidiary of Foreside Financial Group, LLC (dba ACA Group).
U.S. Global Investors Funds
Annual Shareholder Report - December 31, 2024
U.S. Government Securities Ultra-Short Bond Fund
Annual Shareholder Report - December 31, 2024
This annual shareholder report contains important information about the USGI U.S. Government Securities Ultra-Short Bond Fund for the period of January 1, 2024, to December 31, 2024. You can find additional information about the Fund at www.usfunds.com/invest-with-us/prospectus-2/. You can also request this information by contacting us at (800) 873-8637.
What were the Fund's costs for the last year?
(based on a hypothetical $10,000 investment)
| Class Name | Costs of a $10,000 investment | Costs paid as a percentage of a $10,000 investment |
|---|
| Investor Class | $46 | 0.45% |
|---|
How did the Fund perform in the last year?
The U.S. Government Securities Ultra-Short Bond Fund (UGSDX) primarily invests in U.S. government securities and navigated a complex rate environment in the second half of 2024. While the Federal Reserve cut rates three times during the semiannual period between July 1 and the end of the year, bond investors continued to experience volatility in key rates. Shorter durations did not suffer as much as longer-term maturities. The woes of longer-term maturities were signaled by the demand for higher yields, driven by increased risk as a result of selling out of longer maturities. The Fed’s three consecutive rate cuts came later than expected, as at the beginning of the year there was a 90% probability priced in for the Fed to cut in the first half of 2024. Employment and inflation, the two components of the Fed’s dual mandate, will continue to be closely watched as indicators of future rate movements.
Total Return Based on a $10,000 Investment
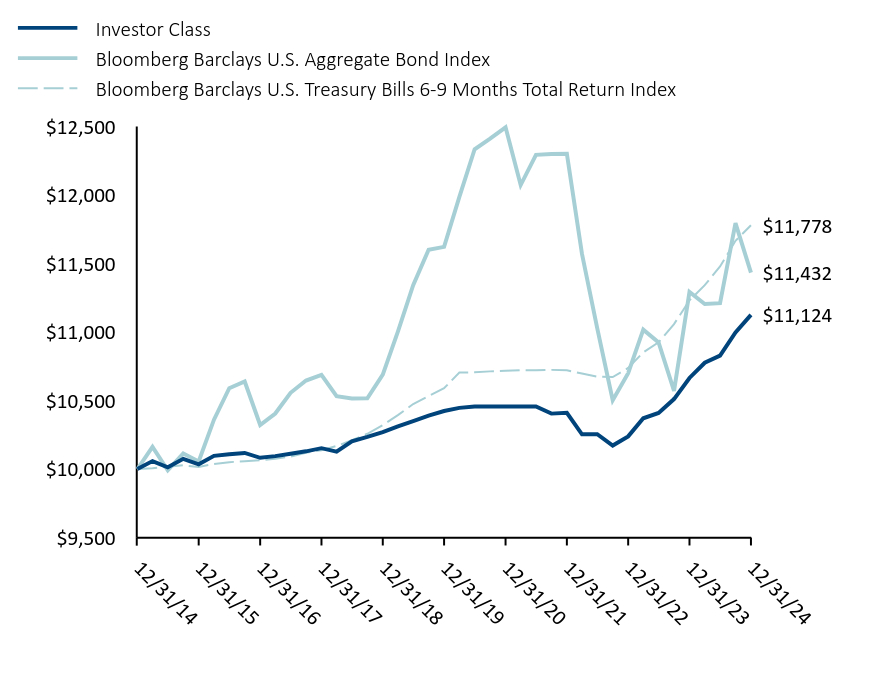
| Date | Investor Class | Bloomberg Barclays U.S. Aggregate Bond Index | Bloomberg Barclays U.S. Treasury Bills 6-9 Months Total Return Index |
|---|
| 12/31/14 | $10,000 | $10,000 | $10,000 |
|---|
| 03/31/15 | $10,058 | $10,161 | $10,006 |
|---|
| 06/30/15 | $10,013 | $9,990 | $10,017 |
|---|
| 09/30/15 | $10,074 | $10,113 | $10,027 |
|---|
| 12/31/15 | $10,034 | $10,055 | $10,015 |
|---|
| 03/31/16 | $10,096 | $10,360 | $10,037 |
|---|
| 06/30/16 | $10,107 | $10,589 | $10,050 |
|---|
| 09/30/16 | $10,117 | $10,638 | $10,057 |
|---|
| 12/31/16 | $10,082 | $10,321 | $10,064 |
|---|
| 03/31/17 | $10,094 | $10,405 | $10,075 |
|---|
| 06/30/17 | $10,111 | $10,556 | $10,091 |
|---|
| 09/30/17 | $10,129 | $10,645 | $10,118 |
|---|
| 12/31/17 | $10,152 | $10,687 | $10,137 |
|---|
| 03/31/18 | $10,126 | $10,531 | $10,168 |
|---|
| 06/30/18 | $10,202 | $10,514 | $10,210 |
|---|
| 09/30/18 | $10,234 | $10,516 | $10,257 |
|---|
| 12/31/18 | $10,269 | $10,688 | $10,320 |
|---|
| 03/31/19 | $10,311 | $11,002 | $10,393 |
|---|
| 06/30/19 | $10,350 | $11,341 | $10,474 |
|---|
| 09/30/19 | $10,390 | $11,599 | $10,532 |
|---|
| 12/31/19 | $10,423 | $11,620 | $10,589 |
|---|
| 03/31/20 | $10,446 | $11,985 | $10,704 |
|---|
| 06/30/20 | $10,456 | $12,332 | $10,705 |
|---|
| 09/30/20 | $10,456 | $12,409 | $10,712 |
|---|
| 12/31/20 | $10,456 | $12,492 | $10,716 |
|---|
| 03/31/21 | $10,456 | $12,071 | $10,721 |
|---|
| 06/30/21 | $10,456 | $12,291 | $10,721 |
|---|
| 09/30/21 | $10,404 | $12,298 | $10,723 |
|---|
| 12/31/21 | $10,410 | $12,299 | $10,720 |
|---|
| 03/31/22 | $10,253 | $11,569 | $10,696 |
|---|
| 06/30/22 | $10,254 | $11,026 | $10,673 |
|---|
| 09/30/22 | $10,171 | $10,502 | $10,671 |
|---|
| 12/31/22 | $10,238 | $10,699 | $10,737 |
|---|
| 03/31/23 | $10,370 | $11,016 | $10,851 |
|---|
| 06/30/23 | $10,409 | $10,923 | $10,924 |
|---|
| 09/30/23 | $10,510 | $10,570 | $11,057 |
|---|
| 12/31/23 | $10,664 | $11,291 | $11,230 |
|---|
| 03/31/24 | $10,775 | $11,203 | $11,341 |
|---|
| 06/30/24 | $10,827 | $11,210 | $11,477 |
|---|
| 09/30/24 | $10,996 | $11,793 | $11,664 |
|---|
| 12/31/24 | $11,124 | $11,432 | $11,778 |
|---|
The above chart represents historical performance of a hypothetical $10,000 investment over the past 10 years. Effective May 1, 2024, the Fund changed its primary benchmark from the Bloomberg U.S. Treasury Bills 6-9 Months Total Return Index to the Bloomberg U.S. Aggregate Bond Index due to regulatory requirements. The Fund retained the Bloomberg U.S. Treasury Bills 6-9 Months Total Return Index as a secondary benchmark as the Bloomberg U.S. Treasury Bills 6-9 Months Total Return Index more closely aligns with the Fund's investment strategies and investment restrictions.
Average Annual Total Returns
| | One Year | Five Year | Ten Year |
|---|
| Investor Class | 4.31% | 1.31% | 1.07% |
|---|
| Bloomberg Barclays U.S. Aggregate Bond Index | 1.25% | -0.33% | 1.35% |
|---|
| Bloomberg Barclays U.S. Treasury Bills 6-9 Months Total Return Index | 4.88% | 2.15% | 1.65% |
|---|
The Fund’s past performance is not a good predictor of how the Fund will perform in the future. The graph and table do not reflect the deduction of taxes that a shareholder would pay on Fund distributions or redemption of Fund shares.
| Total Net Assets | $29,921,010 |
|---|
| # of Portfolio Holdings | 17 |
|---|
| Portfolio Turnover Rate | 38% |
|---|
| Management Fee (Net of fees waived) | $(101,683) |
|---|
Top Ten Holdings
(% net assets)
| U.S. Treasury Bill | 16.70% |
| Federal Home Loan Mortgage Corp. | 10.01% |
| U.S. Treasury Bill | 9.99% |
| Federal Home Loan Mortgage Corp., MTN | 9.98% |
| U.S. Treasury Bill | 6.59% |
| U.S. Treasury Bill | 6.56% |
| U.S. Treasury Bill | 6.44% |
| U.S. Treasury Note/Bond | 5.02% |
| Federal Home Loan Bank | 4.73% |
| U.S. Treasury Bill | 3.32% |
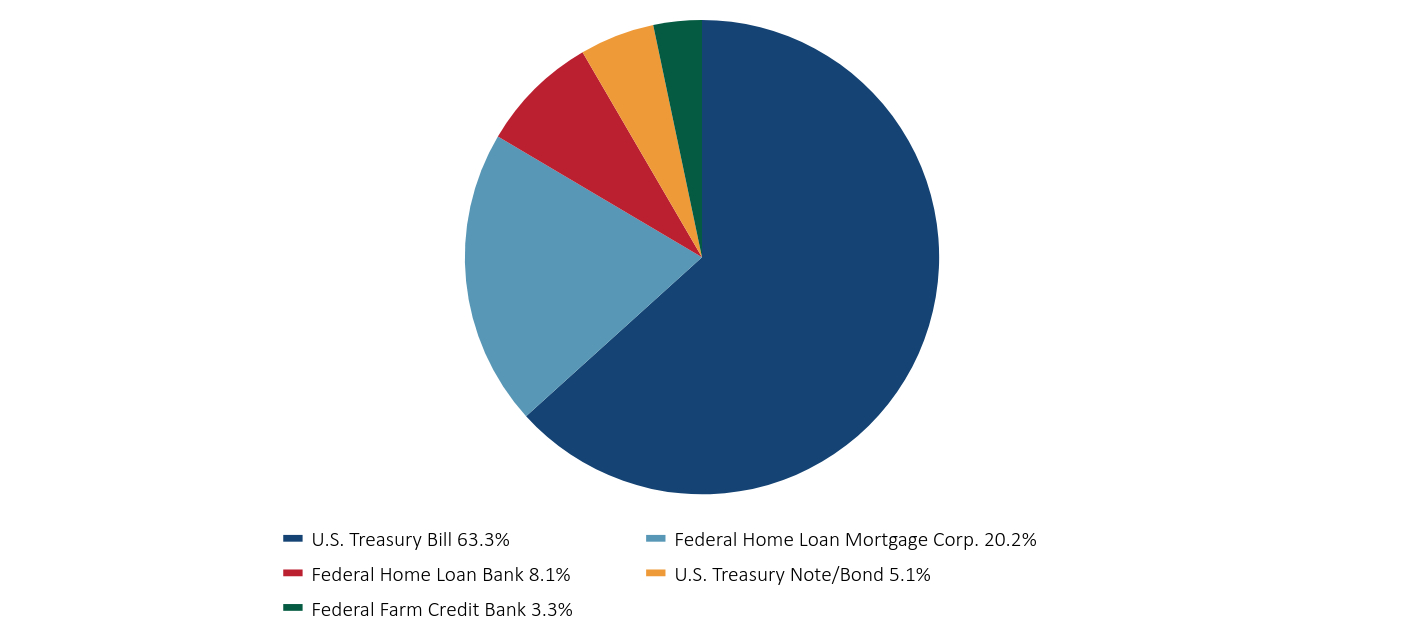
Sector Weightings
(% total investments)
| Value | Value |
|---|
| U.S. Treasury Bill | 63.3% |
| Federal Home Loan Mortgage Corp. | 20.2% |
| Federal Home Loan Bank | 8.1% |
| U.S. Treasury Note/Bond | 5.1% |
| Federal Farm Credit Bank | 3.3% |
Where can I find additional information about the fund?
If you wish to view additional information about the Fund; including but not limited to its prospectus, holdings, financial information, and proxy information, please visit www.usfunds.com/invest-with-us/prospectus-2/. The Fund is distributed by Foreside Fund Services, LLC, a wholly owned subsidiary of Foreside Financial Group, LLC (dba ACA Group).
U.S. Global Investors Funds
U.S. Government Securities Ultra-Short Bond Fund
Annual Shareholder Report - December 31, 2024
World Precious Minerals Fund
Annual Shareholder Report - December 31, 2024
This annual shareholder report contains important information about the USGI World Precious Minerals Fund for the period of January 1, 2024, to December 31, 2024. You can find additional information about the Fund at www.usfunds.com/invest-with-us/prospectus-2/. You can also request this information by contacting us at (800) 873-8637.
What were the Fund's costs for the last year?
(based on a hypothetical $10,000 investment)
| Class Name | Costs of a $10,000 investment | Costs paid as a percentage of a $10,000 investment |
|---|
| Investor Class | $151 | 1.49% |
|---|
How did the Fund perform in the last year?
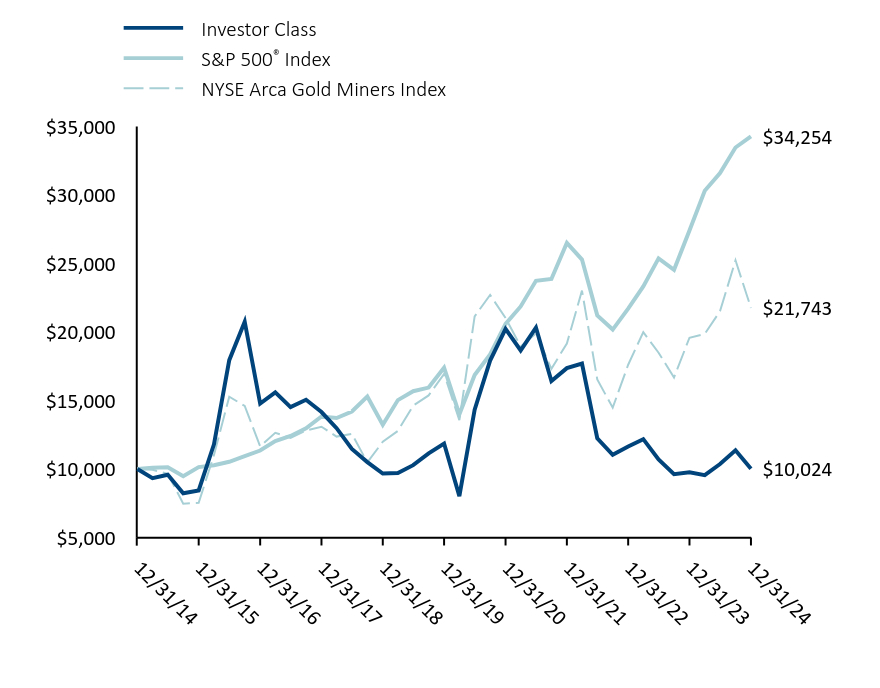
Under normal market conditions, the World Precious Minerals Fund (UNWPX) invests most of its assets in precious metals, particularly in producing precious metals assets. UNWPX experienced notable performance in the second half of 2024 due to rising gold prices, which broke all-time highs twice during the period. Additionally, bullish sentiment from both China and India fueled strong demand for gold, driven by central bank purchases and consumer interest. The gold narrative remained strong as investors sought safety from risk assets while key central banks globally grappled with lending rates and monetary policy. Silver also performed well during the second half of 2024, primarily due to its correlation with gold as an alternative haven asset and a hedge against a weakening dollar, which persisted until mid-December.
Total Return Based on a $10,000 Investment
| Date | Investor Class | S&P 500® Index | NYSE Arca Gold Miners Index |
|---|
| 12/31/14 | $10,000 | $10,000 | $10,000 |
|---|
| 03/31/15 | $9,326 | $10,095 | $9,944 |
|---|
| 06/30/15 | $9,579 | $10,123 | $9,656 |
|---|
| 09/30/15 | $8,232 | $9,471 | $7,472 |
|---|
| 12/31/15 | $8,436 | $10,138 | $7,536 |
|---|
| 03/31/16 | $11,796 | $10,275 | $11,028 |
|---|
| 06/30/16 | $17,938 | $10,527 | $15,270 |
|---|
| 09/30/16 | $20,742 | $10,933 | $14,602 |
|---|
| 12/31/16 | $14,770 | $11,351 | $11,646 |
|---|
| 03/31/17 | $15,584 | $12,039 | $12,643 |
|---|
| 06/30/17 | $14,514 | $12,411 | $12,271 |
|---|
| 09/30/17 | $15,049 | $12,967 | $12,809 |
|---|
| 12/31/17 | $14,154 | $13,829 | $13,086 |
|---|
| 03/31/18 | $12,977 | $13,724 | $12,365 |
|---|
| 06/30/18 | $11,468 | $14,195 | $12,564 |
|---|
| 09/30/18 | $10,503 | $15,290 | $10,482 |
|---|
| 12/31/18 | $9,672 | $13,223 | $11,987 |
|---|
| 03/31/19 | $9,708 | $15,027 | $12,781 |
|---|
| 06/30/19 | $10,281 | $15,674 | $14,622 |
|---|
| 09/30/19 | $11,141 | $15,940 | $15,367 |
|---|
| 12/31/19 | $11,857 | $17,386 | $16,934 |
|---|
| 03/31/20 | $8,024 | $13,979 | $13,559 |
|---|
| 06/30/20 | $14,329 | $16,850 | $21,134 |
|---|
| 09/30/20 | $17,911 | $18,355 | $22,698 |
|---|
| 12/31/20 | $20,228 | $20,585 | $21,013 |
|---|
| 03/31/21 | $18,652 | $21,856 | $18,937 |
|---|
| 06/30/21 | $20,305 | $23,724 | $19,894 |
|---|
| 09/30/21 | $16,421 | $23,862 | $17,308 |
|---|
| 12/31/21 | $17,357 | $26,494 | $19,154 |
|---|
| 03/31/22 | $17,694 | $25,276 | $23,012 |
|---|
| 06/30/22 | $12,244 | $21,206 | $16,529 |
|---|
| 09/30/22 | $11,033 | $20,170 | $14,475 |
|---|
| 12/31/22 | $11,639 | $21,696 | $17,605 |
|---|
| 03/31/23 | $12,177 | $23,322 | $19,981 |
|---|
| 06/30/23 | $10,697 | $25,361 | $18,484 |
|---|
| 09/30/23 | $9,621 | $24,531 | $16,672 |
|---|
| 12/31/23 | $9,755 | $27,399 | $19,574 |
|---|
| 03/31/24 | $9,553 | $30,291 | $19,848 |
|---|
| 06/30/24 | $10,361 | $31,589 | $21,514 |
|---|
| 09/30/24 | $11,370 | $33,448 | $25,224 |
|---|
| 12/31/24 | $10,024 | $34,254 | $21,743 |
|---|
The above chart represents historical performance of a hypothetical $10,000 investment over the past 10 years. Effective May 1, 2024, the Fund changed its primary benchmark from the NYSE Arca Gold Miners Index to the S&P 500 Index due to regulatory requirements. The Fund retained the NYSE Arca Gold Miners Index as a secondary benchmark because the NYSE Arca Gold Miners Index more closely aligns with the Fund's investment strategies and investment restrictions.
Average Annual Total Returns
| | One Year | Five Year | Ten Year |
|---|
| Investor Class | 2.76% | -3.30% | 0.02% |
|---|
S&P 500® Index | 25.02% | 14.53% | 13.10% |
|---|
| NYSE Arca Gold Miners Index | 11.09% | 5.13% | 8.08% |
|---|
The Fund’s past performance is not a good predictor of how the Fund will perform in the future. The graph and table do not reflect the deduction of taxes that a shareholder would pay on Fund distributions or redemption of Fund shares.
| Total Net Assets | $37,115,795 |
|---|
| # of Portfolio Holdings | 160 |
|---|
| Portfolio Turnover Rate | 31% |
|---|
| Management Fee (Net of fees waived) | $140,408 |
|---|
Top Ten Holdings
(% net assets)
| K92 Mining, Inc. | 7.48% |
| TriStar Gold, Inc. | 7.02% |
| Radisson Mining Resources, Inc. | 5.89% |
| Nano One Materials Corp. | 4.10% |
| Vizsla Silver Corp. | 3.93% |
| First Nordic Metals Corp. | 3.56% |
| Dolly Varden Silver Corp. | 3.15% |
| Founders Metals, Inc. | 3.05% |
| G2 Goldfields, Inc. | 2.91% |
| Tolu Minerals, Ltd. | 2.79% |
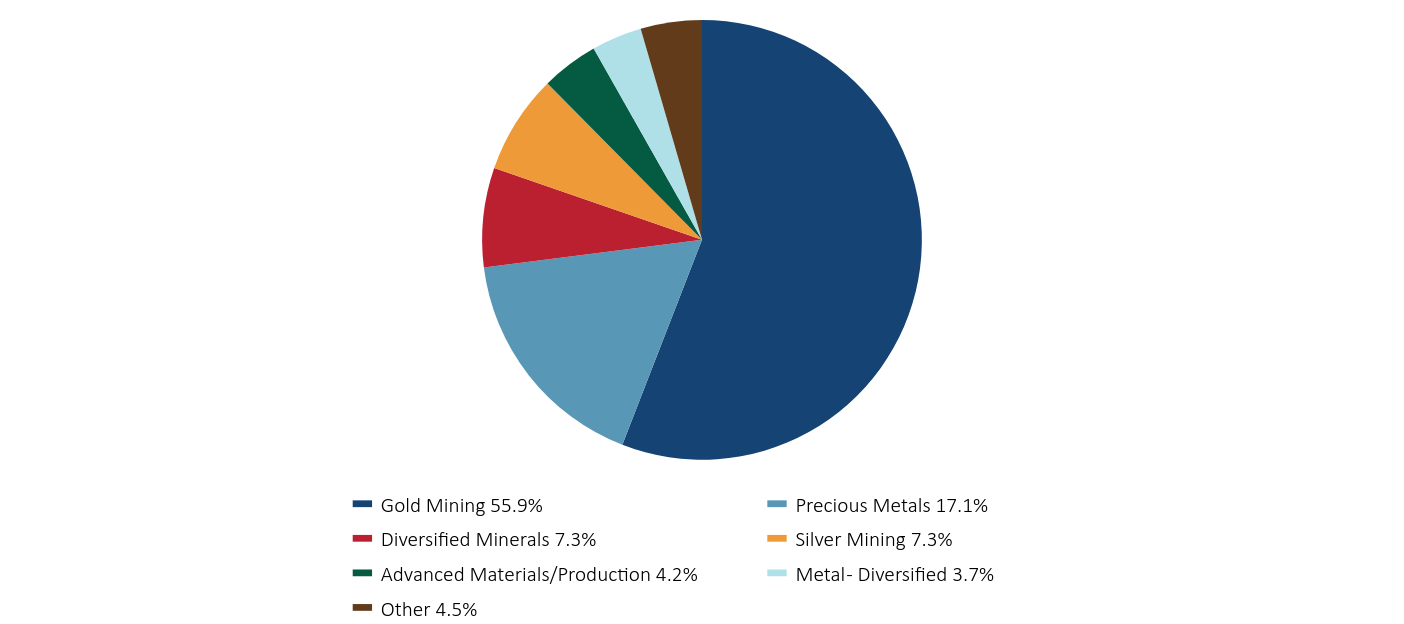
Sector Weightings
(% total investments)
| Value | Value |
|---|
| Gold Mining | 55.9% |
| Precious Metals | 17.1% |
| Diversified Minerals | 7.3% |
| Silver Mining | 7.3% |
| Advanced Materials/Production | 4.2% |
| Metal - Diversified | 3.7% |
| Other | 4.5% |
Where can I find additional information about the fund?
If you wish to view additional information about the Fund; including but not limited to its prospectus, holdings, financial information, and proxy information, please visit www.usfunds.com/invest-with-us/prospectus-2/. The Fund is distributed by Foreside Fund Services, LLC, a wholly owned subsidiary of Foreside Financial Group, LLC (dba ACA Group).
U.S. Global Investors Funds
World Precious Minerals Fund
Annual Shareholder Report - December 31, 2024
(b) Not applicable.
ITEM 2. CODE OF ETHICS.
(a) As of the end of the period covered by this report, U.S. Global Investors Funds (the “Registrant”) has adopted a code of ethics, which applies to its Principal Executive Officer and Principal Financial Officer (the “Code of Ethics”).
(c) There have been no amendments to the Registrant’s Code of Ethics during the period covered by this report.
(d) There have been no waivers to the Registrant’s Code of Ethics during the period covered by this report.
(e) Not applicable.
(f) (1) A copy of the Code of Ethics is being filed under Item 13(a) hereto.
ITEM 3. AUDIT COMMITTEE FINANCIAL EXPERT.
The Board of Trustees has determined that Mr. Mark Moyer is an "audit committee financial expert" as that term is defined under applicable regulatory guidelines. Mr. Moyer is a non- “interested” Trustee (as defined in Section 2(a)(19) under the Investment Company Act of 1940, as amended (the “Act”)), and serves as Chairman of the Audit Committee.
ITEM 4. PRINCIPAL ACCOUNTANT FEES AND SERVICES.
(a) Audit Fees - The aggregate fees billed for each of the last two fiscal years (the “Reporting Periods”) for professional services rendered by the Registrant’s principal accountant for the audit of the Registrant’s annual financial statements, or services that are normally provided by the principal accountant in connection with the statutory and regulatory filings or engagements for the Reporting Periods, were $112,000 in 2023 and $118,600 in 2024.
(b) Audit-Related Fees – The aggregate fees billed in the Reporting Periods for assurance and related services rendered by the principal accountant that were reasonably related to the performance of the audit of the Registrant’s financial statements and are not reported under paragraph (a) of this Item 4 were $0 in 2023 and $0 in 2024.
(c) Tax Fees - The aggregate fees billed in the Reporting Periods for professional services rendered by the principal accountant to the Registrant for tax compliance, tax advice and tax planning were $32,000 in 2023 and $26,000 in 2024. These services consisted of review or preparation of U.S. federal, state, local and excise tax returns.
(d) All Other Fees - The aggregate fees billed in the Reporting Periods for products and services provided by the principal accountant to the Registrant, other than the services reported in paragraphs (a) through (c) of this Item, were $0 in 2023 and $0 in 2024.
(e) (1) The Audit Committee reviews and approves in advance all audit and “permissible non-audit services” (as that term is defined by the rules and regulations of the Securities and Exchange Commission) to be rendered to a series of the Registrant (each, a “Series”). In addition, the Audit Committee reviews and approves in advance all “permissible non-audit services” to be provided to an investment adviser (not including any sub-adviser) of a Series, or an affiliate of such investment adviser, that is controlling, controlled by or under common control with the investment adviser and provides on-going services to the Registrant (“Affiliate”), by the Series’ principal accountant if the engagement relates directly to the operations and financial reporting of the Series. The Audit Committee considers whether fees paid by a Series’ investment adviser or an Affiliate to the Series’ principal accountant for audit and permissible non-audit services are consistent with the principal accountant’s independence.
(e) (2) No services included in (b) - (d) above were approved pursuant to paragraph (c)(7)(i)(C) of Rule 2-01 of Regulation S-X.
(f) Less than 50 percent of the hours expended on the principal accountant’s engagement to audit the Registrant’s financial statements for the most recent fiscal year were attributed to work performed by persons other than the principal accountant’s full-time, permanent employees.
(g) The aggregate fees billed by the Registrant’s principal accountant for non-audit services rendered to the Registrant, its investment adviser, and any entity controlling, controlled by, or under common control with the investment adviser that provides ongoing services to the registrant were $32,000 in 2023 and $26,000 in 2024. These fees related to tax services rendered to the Registrant.
(h) All non-audit services rendered in (g) above were considered by the registrant’s audit committee in maintaining the principal accountant’s independence.
ITEM 5. AUDIT COMMITTEE OF LISTED REGISTRANTS.
Not applicable.
ITEM 6. INVESTMENTS.
(a) Included as part of financial statements filed under Item 7(a).
(b) Not applicable.
ITEM 7. FINANCIAL STATEMENTS AND FINANCIAL HIGHLIGHTS FOR OPEN-END MANAGEMENT INVESTMENT COMPANIES.
(a)
U.S.
Global
Investors
Funds
Annual
Financials
and
Other
Information
Annual
Financials
and
Other
Information
Portfolios
of
Investments
5
Notes
to
Portfolios
of
Investments
29
Statements
of
Assets
and
Liabilities
40
Statements
of
Operations
42
Statements
of
Changes
in
Net
Assets
44
Notes
to
Financial
Statements
48
Financial
Highlights
61
Report
of
Independent
Registered
Public
Accounting
Firm
67
Important
Tax
Information
(unaudited)
68
Other
Information
69
Apex
Fund
Services
3
Canal
Plaza,
Suite
600
Portland,
ME
04101
U.S.
Global
Investors
Funds
Investor
Class
U.S.
Government
Securities
Ultra-Short
Bond
Fund
UGSDX
Near-Term
Tax
Free
Fund
NEARX
Global
Luxury
Goods
Fund
USLUX
Global
Resources
Fund
PSPFX
World
Precious
Minerals
Fund
UNWPX
Gold
and
Precious
Metals
Fund
USERX
See
notes
to
portfolios
of
investments.
U.S.
Government
Securities
Ultra-Short
Bond
Fund
United
States
Government
and
Agency
Obligations
99.10%
Coupon
Rate
%
Maturity
Date
Principal
Amount
Value
Federal
Farm
Credit
Bank
3.28%
Fixed
Rates:
2.35
12/05/25
$
1,000,000
$
982,268
Federal
Home
Loan
Bank
8.04%
Fixed
Rates:
2.63
09/12/25
1,000,000
988,901
1.11
10/28/26
1,500,000
1,416,296
2,405,197
Federal
Home
Loan
Mortgage
Corp.
19.99%
Fixed
Rates:
2.40
03/28/25
3,000,000
2,985,582
4.05
08/28/25
3,000,000
2,995,392
5,980,974
U.S.
Treasury
Bill
62.77%
◊
Yield
to
Maturity:
5.17
01/09/25
5,000,000
4,995,913
4.99
01/30/25
3,000,000
2,990,141
4.38
03/04/25
1,000,000
992,948
4.28
03/13/25
1,000,000
991,883
4.32
03/27/25
1,000,000
990,236
4.37
04/10/25
500,000
494,351
4.35
05/01/25
2,000,000
1,972,624
4.25
06/12/25
2,000,000
1,963,030
4.83
07/10/25
1,000,000
978,552
4.16
10/02/25
500,000
484,758
4.17
-
4.23
11/28/25
2,000,000
1,927,539
18,781,975
U.S.
Treasury
Note/Bond
5.02%
Fixed
Rates:
4.25
12/31/25
1,500,000
1,500,525
Investments,
at
value
99.10%
29,650,939
(cost
$29,603,524
)
Other
assets
and
liabilities,
net
0.90%
270,071
Net
Assets
100.00%
$
29,921,010
See
notes
to
portfolios
of
investments.
Municipal
Bonds
93.65%
Coupon
Rate
%
Maturity
Date
Principal
Amount
Value
Arizona
1.71%
City
of
Mesa
AZ,
Arizona,
Refunding,
GO
Limited
4.00
07/01/25
$
400,000
$
402,102
Colorado
2.66%
City
of
Glendale
CO,
Colorado,
Refunding,
COP
AGM
5.00
12/01/25
265,000
269,218
Colorado
Health
Facilities
Authority,
Colorado,
Refunding,
RB
5.00
10/01/25
350,000
354,238
623,456
Connecticut
0.87%
State
of
Connecticut,
Connecticut,
Refunding,
GO
Unlimited
5.00
05/15/27
200,000
205,265
Delaware
0.54%
The
Delaware
Municipal
Electric
Corp.,
Delaware,
Refunding,
RB
5.00
07/01/25
125,000
126,164
District
of
Columbia
1.01%
District
of
Columbia,
District
of
Columbia,
Refunding,
GO
Unlimited
5.00
06/01/25
235,000
236,917
Florida
3.00%
Port
St
Lucie
Community
Redevelopment
Agency,
Florida,
Refunding,
Tax
Allocation
Bond
5.00
01/01/25
705,000
705,000
Georgia
3.39%
Barrow
County
School
District,
Georgia,
GO
Unlimited
2.13
02/01/26
500,000
491,473
Grady
County
School
District,
Georgia,
GO
Unlimited
5.00
10/01/25
300,000
304,190
795,663
Hawaii
0.77%
State
of
Hawaii,
Hawaii,
Refunding,
GO
Unlimited
5.00
10/01/27
175,000
181,087
Illinois
4.45%
State
of
Illinois,
Illinois,
GO
Unlimited
5.00
11/01/28
1,000,000
1,043,228
See
notes
to
portfolios
of
investments.
Municipal
Bonds (cont’d)
Coupon
Rate
%
Maturity
Date
Principal
Amount
Value
Indiana
1.38%
County
of
Warrick
IN
Redevelopment
District,
Indiana,
Refunding,
Tax
Allocation
Bond
4.00
08/01/25
$
170,000
$
170,710
Northwestern
School
Corp.,
Indiana,
GO
Limited
5.00
01/15/26
150,000
152,465
323,175
Iowa
1.24%
Iowa
Finance
Authority,
Iowa,
Refunding,
RB
5.00
02/15/25
290,000
290,444
Kansas
2.00%
City
of
Lawrence
KS,
Kansas,
GO
Unlimited
3.25
09/01/27
170,000
169,211
Sedgwick
County
Unified
School
District
No.
262
Valley
Center,
Kansas,
Refunding,
GO
Unlimited
4.00
09/01/25
300,000
300,118
469,329
Kentucky
2.99%
Campbellsville
Independent
School
District
Finance
Corp.,
Kentucky,
RB
4.00
08/01/25
165,000
165,585
City
of
Ashland
KY,
Kentucky,
Refunding,
GO
Unlimited
AGM
5.00
01/01/25
300,000
300,000
Kentucky
Bond
Development
Corp.,
Kentucky,
Refunding,
RB
5.00
05/01/25
235,000
236,203
701,788
Massachusetts
3.32%
Massachusetts
Development
Finance
Agency,
Massachusetts,
Refunding,
RB
4.00
04/01/25
250,000
250,582
New
Bedford
Housing
Authority,
Massachusetts,
RB
2.45
10/01/27
550,000
528,726
779,308
Michigan
3.46%
Great
Lakes
Water
Authority
Water
Supply
System
Revenue,
Michigan,
Refunding,
RB
5.00
07/01/26
365,000
376,332
Wayne
State
University,
Michigan,
RB
5.00
11/15/27
430,000
436,550
812,882
Minnesota
7.14%
City
of
Woodbury
MN,
Minnesota,
GO
Unlimited
3.00
02/01/28
550,000
542,253
County
of
Chisago
MN,
Minnesota,
GO
Unlimited
2.00
02/01/27
1,175,000
1,132,221
1,674,474
See
notes
to
portfolios
of
investments.
Municipal
Bonds (cont’d)
Coupon
Rate
%
Maturity
Date
Principal
Amount
Value
Mississippi
0.53%
County
of
Madison
MS,
Mississippi,
GO
Unlimited
4.50
11/01/25
$
125,000
$
125,122
Missouri
3.11%
Nixa
Public
Schools,
Missouri,
Refunding,
GO
Unlimited
2.25
03/01/25
530,000
528,398
St
Louis
Land
Clearance
for
Redevelopment
Authority,
Missouri,
RB
4.00
07/15/25
200,000
200,872
729,270
Nebraska
1.28%
Nebraska
Public
Power
District,
Nebraska,
Refunding,
RB
5.00
01/01/25
300,000
300,000
New
Jersey
1.83%
Middlesex
County
Improvement
Authority,
New
Jersey,
RB
5.00
07/01/25
425,000
429,211
New
Mexico
4.93%
City
of
Rio
Rancho
NM,
New
Mexico,
GO
Unlimited
5.00
08/01/27
600,000
630,218
Los
Alamos
Public
School
District,
New
Mexico,
GO
Unlimited
5.00
08/01/25
520,000
525,646
1,155,864
New
York
2.88%
City
of
New
York
NY,
New
York,
Refunding,
GO
Unlimited
5.00
08/01/25
250,000
252,758
City
of
New
York
NY,
New
York,
Refunding,
GO
Unlimited
5.00
08/01/26
200,000
206,406
Port
Authority
of
New
York
&
New
Jersey,
New
York,
Refunding,
RB
5.00
10/01/25
215,000
217,126
676,290
North
Carolina
3.80%
City
of
Cherryville
NC,
North
Carolina,
GO
Unlimited
2.00
11/01/31
440,000
388,974
County
of
Pender
NC,
North
Carolina,
RB
5.00
04/01/25
500,000
502,394
891,368
Oregon
2.06%
City
of
Ashland
OR,
Oregon,
GO
Limited
2.38
10/01/26
200,000
195,151
City
of
Lincoln
City
OR,
Oregon,
Refunding,
GO
Unlimited
2.50
06/01/28
300,000
287,534
482,685
See
notes
to
portfolios
of
investments.
Municipal
Bonds (cont’d)
Coupon
Rate
%
Maturity
Date
Principal
Amount
Value
Pennsylvania
6.83%
Commonwealth
of
Pennsylvania,
Pennsylvania,
Refunding,
GO
Unlimited,
First
Series
5.00
08/15/25
$
310,000
$
313,695
Delaware
River
Port
Authority,
Pennsylvania,
Refunding,
RB
5.00
01/01/27
500,000
519,650
Williamsport
Sanitary
Authority,
Pennsylvania,
Refunding,
RB
BAM
5.00
01/01/27
740,000
768,790
1,602,135
South
Carolina
1.42%
City
of
Tega
Cay
SC,
South
Carolina,
Refunding,
GO
Unlimited
2.25
04/01/25
335,000
333,443
Tennessee
0.70%
Paris
Utility
Authority
Electric
System
Revenue,
Tennessee,
RB
5.00
06/01/28
155,000
163,709
Texas
17.48%
Board
of
Regents
of
the
University
of
Texas
System,
Texas,
RB
5.00
08/15/26
1,000,000
1,032,196
City
of
Dallas
TX
Waterworks
&
Sewer
System
Revenue,
Texas,
Refunding,
RB
5.00
10/01/26
750,000
777,291
City
of
Denton
TX,
Texas,
GO
Limited
4.00
02/15/26
265,000
268,196
City
of
Denton
TX,
Texas,
Refunding,
GO
Limited
5.00
02/15/27
400,000
416,577
Lower
Colorado
River
Authority,
Texas,
Refunding,
RB
5.00
05/15/27
195,000
196,206
Texas
Department
of
Transportation
State
Highway
Fund,
Texas,
RB
5.00
10/01/26
695,000
718,484
Westwood
Independent
School
District,
Texas,
GO
Unlimited
PSF-GTD
5.00
02/15/27
665,000
691,169
4,100,119
Virginia
0.97%
Virginia
Commonwealth
Transportation
Board,
Virginia,
RB
5.00
05/15/25
225,000
226,546
Washington
1.76%
King
County
Fire
Protection
District
No.
45,
Washington,
GO
Unlimited
4.00
12/01/25
260,000
261,700
King
County
Housing
Authority,
Washington,
Refunding,
RB
4.00
06/01/27
150,000
151,300
413,000
See
notes
to
portfolios
of
investments.
Municipal
Bonds (cont’d)
Coupon
Rate
%
Maturity
Date
Principal
Amount
Value
Wisconsin
4.14%
Elmbrook
School
District,
Wisconsin,
Refunding,
GO
Unlimited
2.75
04/01/28
$
1,000,000
$
970,488
Total
Municipal
Bonds
21,969,532
(cost
$22,118,963)
Exchange
Traded
Fund
4.50%
Shares
iShares
Short-Term
National
Muni
Bond
ETF
10,000
1,054,800
(cost
$1,055,350)
Investments,
at
value
98.15%
23,024,332
(cost
$23,174,313
)
Other
assets
and
liabilities,
net
1.85%
433,934
Net
Assets
100.00%
$
23,458,266
See
notes
to
portfolios
of
investments.
Common
Stocks
90.25%
Shares
Value
Apparel
Manufacturers
12.18%
Christian
Dior
SE
585
$
366,759
Hermes
International
SCA
1,898
4,554,007
Kering
SA,
ADR
29,200
719,196
PRADA
SpA
22,000
169,308
VF
Corp.
11,000
236,060
6,045,330
Athletic
Footwear
2.90%
adidas
AG,
ADR
8,000
974,160
On
Holding
AG,
Class A
*
8,450
462,807
1,436,967
Automotive
-
Cars
&
Light
Trucks
16.38%
Ferrari
NV
6,800
2,888,912
Mercedes-Benz
Group
AG,
ADR
139,000
1,920,980
Tesla,
Inc.
*æ
4,840
1,954,585
Volkswagen
AG
14,300
1,361,723
8,126,200
Beverages
-
Wine/Spirits
3.73%
Constellation
Brands,
Inc.,
Class A
6,300
1,392,300
Pernod
Ricard
SA
1,000
112,987
Remy
Cointreau
SA
5,700
345,212
1,850,499
Casino
Hotels
2.73%
Las
Vegas
Sands
Corp.
8,600
441,696
Wynn
Resorts,
Ltd.
10,600
913,296
1,354,992
Cosmetics
&
Toiletries
2.68%
L'Oreal
SA,
ADR
7,200
506,952
The
Estee
Lauder
Cos.,
Inc.
11,000
824,780
1,331,732
Cruise
Lines
8.49%
Carnival
Corp.
*
57,000
1,420,440
Norwegian
Cruise
Line
Holdings,
Ltd.
*
5,000
128,650
Royal
Caribbean
Cruises,
Ltd.
7,755
1,789,001
Viking
Holdings,
Ltd.
*
19,800
872,388
4,210,479
Diversified
Banking
Institution
2.99%
The
Goldman
Sachs
Group,
Inc.
2,590
1,483,086
Energy
-
Alternate
Sources
0.00%
Pacific
Green
Energy
Corp.
#*@
100,000
0
See
notes
to
portfolios
of
investments.
Common
Stocks (cont’d)
Shares
Value
Fiduciary
Banks
1.47%
Northern
Trust
Corp.
7,100
$
727,750
Finance
-
Credit
Card
2.69%
American
Express
Co.
4,500
1,335,555
Finance
-
Mortgage
Loan/Banker
0.00%
Lendified
Holdings,
Inc.
#*@
1,116,560
0
Gold
Mining
5.90%
Allied
Gold
Corp.
*
51,000
120,985
Catalyst
Metals,
Ltd.
*
150,000
238,366
Centerra
Gold,
Inc.
21,400
121,766
Franco-Nevada
Corp.
4,400
517,396
Osisko
Gold
Royalties,
Ltd.
25,700
465,170
Ramelius
Resources,
Ltd.
260,000
331,611
Regis
Resources,
Ltd.
*
78,000
122,513
Resolute
Mining,
Ltd.
*
342,000
83,020
Royal
Gold,
Inc.
3,450
454,883
Westgold
Resources,
Ltd.
270,000
470,299
2,926,009
Hotels
&
Motels
6.12%
Hilton
Worldwide
Holdings,
Inc.
6,450
1,594,182
HUGO
BOSS
AG
12,276
564,108
Marriott
International,
Inc.,
Class A
3,150
878,661
3,036,951
Investment
Management/Advisory
Services
2.44%
Apollo
Global
Management,
Inc.
7,345
1,213,100
Oil
Companies
-
Exploration
&
Production
0.08%
NG
Energy
International
Corp.,
144A
#*∆
50,000
38,262
Precious
Metals
0.65%
Wheaton
Precious
Metals
Corp.
5,700
320,568
Private
Equity
1.18%
KKR
&
Co.,
Inc.
3,950
584,245
Real
Estate
Operating/Development
0.00%
Infrastructure
Ventures,
Inc.
#*@+
426,533
0
Retail
-
Apparel/Shoe
7.50%
Brunello
Cucinelli
SpA
8,950
977,692
Industria
de
Diseno
Textil
SA
31,100
1,593,065
Moncler
SpA
13,500
712,672
Zalando
SE
*
13,100
438,238
3,721,667
See
notes
to
portfolios
of
investments.
Common
Stocks (cont’d)
Shares
Value
Retail
-
Jewelry
5.69%
Cie
Financiere
Richemont
SA
18,680
$
2,825,802
Silver
Mining
0.38%
Aya
Gold
&
Silver,
Inc.
*
25,000
186,789
Textile
-
Apparel
4.07%
LVMH
Moet
Hennessy
Louis
Vuitton
SE,
ADR
15,441
2,017,984
Total
Common
Stocks
44,773,967
(cost
$41,533,107)
Corporate
Non-Convertible
Bond
1.64%
Coupon
Rate
%
Maturity
Date
Principal
Amount
Gold
Mining
1.64%
Aris
Gold
Corp.
7.50
08/26/27
$
533,201
813,132
(cost
$533,144)
Call
Option
Purchased
0.00%
Strike
Price
Exp.
Date
Notional
Contract
Value
Contracts
Automotive
-
Cars
&
Light
Trucks
0.00%
Ferrari
NV
$
500.00
01/25
$
2,750,000
55
55
(premiums
paid
$97,620
)
Investments,
at
value
91.89%
45,587,154
(cost
$42,163,871
)
Total
Written
Option
(0.05)%
(23,750)
(premiums
received
$(47,643))
Other
assets
and
liabilities,
net
8.16%
4,046,526
Net
Assets
100.00%
$
49,609,930
Call
Option
Written
-
(0.05)%
Strike
Price
Exp.
Date
Notional
Contract
Value
Contracts
Value
Automotive
-
Cars
&
Light
Trucks
-
(0.05)%
Tesla,
Inc.
(premiums
received
$(47,643))
$
430.00
01/25
$
807,680
(20)
$
(23,750)
See
notes
to
portfolios
of
investments.
Common
Stocks
88.56%
Shares
Value
Advanced
Materials/Production
0.50%
Nano
One
Materials
Corp.
*
325,000
$
183,137
Agricultural
Chemicals
0.31%
OCI
NV
*
10,000
112,005
Agricultural
Operations
0.96%
Bunge
Global
SA
4,500
349,920
Building
Products
-
Wood
0.41%
Stella-Jones,
Inc.
3,000
148,576
Chemicals
-
Diversified
0.87%
FMC
Corp.
6,500
315,965
Chemicals
-
Specialty
1.47%
Albemarle
Corp.
1,000
86,080
Methanex
Corp.
9,000
449,734
535,814
Coal
0.94%
Caribbean
Resources
Corp.
#*@
2,148,176
0
Teck
Resources,
Ltd.,
Class B
8,500
344,505
344,505
Diamonds/Precious
Stones
0.63%
Barksdale
Resources
Corp.
*
1,955,000
231,208
Diversified
Minerals
3.91%
Arianne
Phosphate,
Inc.
*
600,000
56,350
BHP
Group,
Ltd.,
ADR
3,500
170,905
Core
Assets
Corp.,
144A
#*∆
600,000
16,696
E3
Lithium,
Ltd.
*
100,000
64,698
IberAmerican
Lithium
Corp.
*
1,000,000
31,306
Legacy
Lithium
Corp.
#*@
20,000
3,189
Leo
Lithium,
Ltd.
#*@
700,000
163,341
Lithium
Royalty
Corp.
*
821
3,364
NGEX
Minerals,
Ltd.
*
20,000
186,580
NGX,
Ltd.
*
90
10
Nio
Strategic
Metals,
Inc.
*
3,325,000
92,525
Nio
Strategic
Metals,
Inc.,
144A
#*∆
362,069
10,075
Nuclear
Fuels,
Inc.
*
500,000
149,570
Sigma
Lithium
Corp.
*
10,000
112,200
Standard
Lithium,
Ltd.
*
75,000
109,500
Volt
Lithium
Corp.
*
975,000
189,920
Wolfden
Resources
Corp.
*
1,825,000
69,829
1,430,058
See
notes
to
portfolios
of
investments.
Common
Stocks (cont’d)
Shares
Value
Energy
-
Alternate
Sources
0.48%
First
Solar,
Inc.
*
1,000
$
176,240
Pacific
Green
Energy
Corp.
#*@~
2,400,000
0
176,240
Enterprise
Software/Services
7.18%
Abaxx
Technologies,
Inc.
*
300,000
2,316,602
Base
Carbon,
Inc.
*
1,000,000
306,098
2,622,700
Finance-Other
Services
0.57%
CME
Group,
Inc.
461
107,058
TMX
Group,
Ltd.
3,300
101,655
208,713
Food
-
Miscellaneous/Diversified
1.51%
Ingredion,
Inc.
4,000
550,240
Gold
Mining
13.67%
Agnico
Eagle
Mines,
Ltd.
5,000
391,050
Atex
Resources,
Inc.
*
85,000
84,264
Black
Cat
Syndicate,
Ltd.
*
986,900
344,977
Black
Cat
Syndicate,
Ltd.
*
87,700
30,656
Collective
Mining,
Ltd.
*
75,000
311,489
EnviroGold
Global,
Ltd.,
144A
#*∆
75,000
2,609
Firefinch,
Ltd.
#*@
1,000,000
41,655
K92
Mining,
Inc.
*
115,000
694,424
Montage
Gold
Corp.
*
600,000
868,204
New
Gold,
Inc.
*
250,000
620,000
NeXGold
Mining
Corp.
*
245,875
118,024
Osisko
Gold
Royalties,
Ltd.
10,000
181,000
Perpetua
Resources
Corp.
*
30,000
320,100
Royal
Road
Minerals,
Ltd.
*
5,500,000
420,884
Seabridge
Gold,
Inc.
*
20,000
228,200
Seasif
Exploration,
Inc.
*
2,000,000
41,741
Torex
Gold
Resources,
Inc.
*
15,000
295,523
4,994,800
Industrial
Gases
2.29%
Linde
PLC
2,000
837,340
Investment
Companies
0.45%
Contango
Holdings
PLC
*
10,502,248
164,768
Metal
-
Aluminum
0.52%
Alcoa
Corp.
5,000
188,900
See
notes
to
portfolios
of
investments.
Common
Stocks (cont’d)
Shares
Value
Metal
-
Copper
2.25%
Hudbay
Minerals,
Inc.
75,000
$
607,500
Kutcho
Copper
Corp.
*
1,223,500
80,860
Meridian
Mining
UK
Societas
*
500,000
133,918
822,278
Metal
-
Diversified
12.22%
Anglo
American
PLC
3,500
103,485
Electra
Battery
Materials
Corp.,
144A
#*∆
55,555
25,121
Filo
Corp.
*
42,500
941,094
Glencore
PLC
20,000
88,084
GoviEx
Uranium,
Inc.,
144A
#*∆
58,000
2,018
Ivanhoe
Electric,
Inc./US
*
40,000
302,000
Ivanhoe
Mines,
Ltd.
*
149,300
1,771,928
Juno
Corp.,
144A
#*@∆
200,000
347,838
Magna
Mining,
Inc.
*
154,600
146,270
Orsu
Metals
Corp.,
144A
#*@∆
14,761
0
Sovereign
Metals,
Ltd.
*
600,000
274,049
Torq
Resources,
Inc.
*
900,000
31,305
Vox
Royalty
Corp.
185,000
432,900
4,466,092
Metal
-
Iron
0.49%
Champion
Iron,
Ltd.
50,000
180,180
Consolidated
Growth
Holdings,
Ltd.
#*@
19,859,173
0
180,180
Mining
Services
0.47%
Cordoba
Minerals
Corp.
*
58,823
16,573
Defense
Metals
Corp.
*
1,000,000
156,527
173,100
Natural
Resource
Technology
0.40%
I-Pulse,
Inc.,
144A
#*@+∆
15,971
145,017
Non-Ferrous
Metals
4.38%
Atha
Energy
Corp.
*
150,000
58,437
Bannerman
Energy,
Ltd.
*
80,109
142,819
Bannerman
Energy,
Ltd.
*
9,891
17,634
Cameco
Corp.
5,000
256,950
CanAlaska
Uranium,
Ltd.
*
90,000
42,576
Denison
Mines
Corp.
*
115,000
207,000
Encore
Energy
Corp.
*
100,000
337,403
InZinc
Mining,
Ltd.
*
2,000,000
27,827
Lotus
Resources,
Ltd.
*
800,000
98,305
NexGen
Energy,
Ltd.
*
25,000
165,000
Peninsula
Energy,
Ltd.
*
95,000
73,534
Sterling
Group
Ventures,
Inc.,
144A
#*@∆
500,000
0
See
notes
to
portfolios
of
investments.
Common
Stocks (cont’d)
Shares
Value
Non-Ferrous
Metals
(cont’d)
Ur-Energy,
Inc.
*
150,000
$
172,500
1,599,985
Oil
-
US
Royalty
Trusts
4.15%
Kimbell
Royalty
Partners
LP
30,000
486,900
PrairieSky
Royalty,
Ltd.
15,000
292,497
Viper
Energy,
Inc.
15,000
736,050
1,515,447
Oil
Companies
-
Exploration
&
Production
8.74%
Antero
Resources
Corp.
*
15,000
525,750
Canadian
Natural
Resources,
Ltd.
6,000
185,220
ConocoPhillips
5,962
591,251
EOG
Resources,
Inc.
2,500
306,450
LNG
Energy
Group
Corp.
*
1,100,000
45,915
New
Stratus
Energy,
Inc.
*
500,000
153,049
NG
Energy
International
Corp.
*
1,000,000
765,244
NG
Energy
International
Corp.,
144A
#*∆
200,000
153,049
Permian
Resources
Corp.
15,000
215,700
Range
Resources
Corp.
7,000
251,860
3,193,488
Oil
Companies
-
Field
Services
2.74%
Baker
Hughes
Co.
10,000
410,200
Schlumberger
NV
5,000
191,700
Select
Water
Solutions,
Inc.,
Class A
30,000
397,200
999,100
Oil
Companies
-
Integrated
3.45%
BP
PLC,
ADR
10,000
295,600
Exxon
Mobil
Corp.
3,500
376,495
Imperial
Oil,
Ltd.
6,000
369,600
TotalEnergies
SE,
ADR
4,000
218,000
1,259,695
Paper
&
Related
Products
1.51%
Sylvamo
Corp.
7,000
553,140
Pipelines
4.41%
Cheniere
Energy,
Inc.
7,500
1,611,525
Platinum
0.11%
Impala
Platinum
Holdings,
Ltd.,
ADR
*
8,840
41,548
Precious
Metals
3.10%
Arizona
Metals
Corp.
*
100,000
111,308
Brixton
Metals
Corp.
*
2,000,000
83,481
Coeur
Mining,
Inc.
*
111,000
634,920
See
notes
to
portfolios
of
investments.
Common
Stocks (cont’d)
Shares
Value
Precious
Metals
(cont’d)
Unico
Silver,
Ltd.
*
750,000
$
89,617
Vizsla
Royalties
Corp.
*
191,715
213,395
1,132,721
Real
Estate
Operating/Development
0.90%
Infrastructure
Ventures,
Inc.
#*@+
7,443,544
0
Revival
Gold,
Inc.
*
1,690,682
329,327
329,327
Retail
-
Jewelry
0.17%
Mene,
Inc.
*
750,000
60,002
Silver
Mining
2.40%
Aya
Gold
&
Silver,
Inc.
*
10,000
74,715
Endeavour
Silver
Corp.
*
75,000
274,966
Vizsla
Silver
Corp.
*
312,500
528,279
877,960
Total
Common
Stocks
32,355,494
(cost
$76,767,993)
Corporate
Convertible
Bond
1.37%
Coupon
Rate
%
Maturity
Date
Principal
Amount
Investment
Companies
1.37%
Contango
Holdings
PLC,
144A
#@∆
0.00
03/31/25
$
400,000
500,760
(cost
$508,120)
Corporate
Non-Convertible
Bonds
4.21%
Gold
Mining
2.73%
Aris
Gold
Corp.
7.50
08/26/27
653,197
996,125
Oil
Companies
-
Exploration
&
Production
1.48%
NG
Energy
International
Corp.
#
8.00
05/20/27
750,000
542,628
Total
Corporate
Non-Convertible
Bonds
1,538,753
(cost
$1,240,316)
Warrants
0.29%
Exercise
Price
Exp.
Date
Shares
Diamonds/Precious
Stones
0.00%
Barksdale
Resources
Corp.,
144A
#*@∆
$
0.60
01/09/27
177,500
0
See
notes
to
portfolios
of
investments.
Warrants (cont’d)
Exercise
Price
Exp.
Date
Shares
Value
Diversified
Minerals
0.00%
Core
Assets
Corp.,
144A
#*@∆
$
0.47
02/17/25
300,000
$
0
Desert
Mountain
Energy
Corp.,
144A
#*@∆
2.70
03/24/25
300,000
0
Group
6
Metals,
Ltd.
#*@
0.28
01/13/25
400,000
0
IberAmerican
Lithium
Corp.,
144A
#*@∆
0.40
09/01/26
500,000
1,739
Lithium
Ion
Energy,
Ltd.,
144A
#*@∆
0.70
04/12/25
225,000
0
Volt
Lithium
Corp.,
144A
#*@∆
0.33
08/04/25
500,000
0
Volt
Lithium
Corp.,
144A
#*@∆
0.44
11/19/26
250,000
0
1,739
Gold
Mining
0.00%
Iris
Metals,
Ltd.
#*@
1.50
05/16/25
325,000
0
Investment
Companies
0.00%
Contango
Holdings
PLC,
144A
#*@∆
0.09
11/07/25
4,583,333
0
Metal
-
Copper
0.00%
Trigon
Metals,
Inc.,
144A
#*@∆
1.50
07/12/26
125,000
0
Metal
-
Diversified
0.00%
Electra
Battery
Materials
Corp.,
144A
#*@∆
1.74
08/11/25
250,000
0
Torq
Resources,
Inc.,
144A
#*@∆
0.30
01/04/27
1,000,000
0
0
Mining
Services
0.20%
Aris
Mining
Corp.
*
2.75
07/29/25
480,000
73,463
Non-Ferrous
Metals
0.00%
Peninsula
Energy,
Ltd.
#*@
2.00
03/31/25
35,000
0
Oil
Companies
-
Exploration
&
Production
0.09%
LNG
Energy
Group,
144A
#*@∆
0.60
05/05/26
1,000,000
0
NG
Energy
International
Corp.
#*
1.40
05/20/27
300,000
31,306
31,306
Real
Estate
Operating/Development
0.00%
Revival
Gold,
Inc.,
144A
#*@∆
0.72
05/16/26
250,000
0
Revival
Gold,
Inc.,
144A
#*@∆
0.45
05/02/27
137,500
0
0
Total
Warrants
106,508
(cost
$21,535
)
Investments,
at
value
94.43%
34,501,515
(cost
$78,537,964
)
Other
assets
and
liabilities,
net
5.57%
2,035,898
Net
Assets
100.00%
$
36,537,413
See
notes
to
portfolios
of
investments.
World
Precious
Minerals
Fund
Common
Stocks
95.84%
Shares
Value
Advanced
Materials/Production
4.10%
Nano
One
Materials
Corp.
*
2,700,000
$
1,521,444
Coal
0.00%
Caribbean
Resources
Corp.
#*@
505,453
0
Diamonds/Precious
Stones
1.14%
Barksdale
Resources
Corp.
*
3,570,000
422,206
Diversified
Minerals
7.25%
Ascot
Resources,
Ltd.,
144A
#*∆
6,412
825
AuMega
Metals,
Ltd.
*
1,000,000
24,349
Erdene
Resource
Development
Corp.
*
500,000
194,789
Founders
Metals,
Inc.
*
350,000
1,132,213
Genesis
Minerals,
Ltd.
*
125,000
189,981
Gossan
Resources,
Ltd.
*
1,250,000
13,044
Kenorland
Minerals,
Ltd.
*
225,000
200,355
Kootenay
Resources,
Inc.
*
40,000
1,391
Max
Resource
Corp.
*
2,000,000
69,568
Meeka
Metals,
Ltd.
*
2,000,000
95,146
Miata
Metals
Corp.
*
300,000
125,222
Minaurum
Gold,
Inc.
*
1,500,000
177,397
Serra
Energy
Metals
Corp.
*
2,000,000
27,827
Summit
Gold,
Ltd.
#*@
10,000
0
Waraba
Gold,
Ltd.
*~
2,155,000
14,992
Waraba
Gold,
Ltd.,
144A
#*~∆
6,045,000
42,054
Western
Exploration,
Inc.
*
350,000
224,008
Westward
Gold,
Inc.
*
3,000,000
156,527
2,689,688
Gold
Mining
52.56%
Abitibi
Metals
Corp.
*
300,000
61,567
Abitibi
Metals
Corp.
*
100,000
20,523
Adamera
Minerals
Corp.
*
1,047,000
134,749
Adamera
Minerals
Corp.,
144A
#*∆
11,954
1,539
Agnico
Eagle
Mines,
Ltd.
2,500
195,525
Allegiant
Gold,
Ltd.
*
500,000
46,958
Alpha
Exploration,
Ltd.
*
500,000
240,008
Angus
Gold,
Inc.
*
350,000
126,613
Asante
Gold
Corp.
*
1,000,000
730,460
Atex
Resources,
Inc.
*
100,000
99,134
Awale
Resources,
Ltd.
*
925,000
263,835
Black
Cat
Syndicate,
Ltd.
*
2,203,300
770,176
Black
Cat
Syndicate,
Ltd.
*
322,600
112,767
Carolina
Rush
Corp.
*
1,000,000
48,697
Cassiar
Gold
Corp.
*
448,000
59,216
Collective
Mining,
Ltd.
*
50,000
207,659
Compass
Gold
Corp.
*
2,000,000
243,487
See
notes
to
portfolios
of
investments.
World
Precious
Minerals
Fund
Common
Stocks (cont’d)
Shares
Value
Gold
Mining
(cont’d)
Dryden
Gold
Corp.
*
1,000,000
$
100,873
Faraday
Copper
Corp.,
144A
#*∆
43,500
22,545
Freegold
Ventures,
Ltd.
*
200,000
100,178
G2
Goldfields,
Inc.
*
800,000
1,079,690
Gold
Bull
Resources
Corp.
*
100,000
32,697
Goldshore
Resources,
Inc.
*
2,000,000
347,838
Hayasa
Metals,
Inc.
*
400,000
20,870
Heliostar
Metals,
Ltd.
*
1,000,000
424,363
K92
Mining,
Inc.
*
460,000
2,777,697
Karus
Mining,
Inc.
#*@
37,500
13,117
Kesselrun
Resources,
Ltd.
*~
5,000,000
121,743
Kinross
Gold
Corp.
15,000
139,050
Lahontan
Gold
Corp.
*
3,000,000
52,176
Lion
One
Metals,
Ltd.
*
250,000
45,219
Loncor
Gold,
Inc.
*
2,575,000
967,338
Maple
Gold
Mines,
Ltd.
*
1,000,000
34,784
Mawson
Gold,
Ltd.
*
500,000
354,795
McFarlane
Lake
Mining,
Ltd.
*
2,500,000
43,480
Montage
Gold
Corp.
*
400,000
578,803
Newcore
Gold,
Ltd.,
144A
#*@∆
400,000
86,264
NV
Gold
Corp.
*
100,000
16,522
Omai
Gold
Mines
Corp.
*
4,000,000
667,849
Osisko
Gold
Royalties,
Ltd.
10,000
181,000
Probe
Gold,
Inc.
*
325,000
384,361
Provenance
Gold
Corp.
*
192,500
37,497
Radisson
Mining
Resources,
Inc.
*
9,250,000
2,187,902
Radius
Gold,
Inc.,
144A
#*∆
125,000
7,392
Renegade
Gold,
Inc.
*
650,000
74,611
Roscan
Gold
Corp.
*
1,500,000
73,046
Royal
Road
Minerals,
Ltd.
*
1,500,000
114,787
Sanu
Gold
Corp.
*
1,585,000
192,963
Sanu
Gold
Corp.,
144A
#*∆
700,000
85,220
Scottie
Resources
Corp.
*
541,666
391,897
Seabridge
Gold,
Inc.
*
15,000
171,150
Spartan
Resources,
Ltd./Australia
*
175,000
152,084
Spartan
Resources,
Ltd./Australia
*
87,500
76,042
STLLR
Gold,
Inc.
*
92,000
53,122
Storm
Exploration,
Inc.
*
537,500
14,022
Sunshine
Metals,
Ltd./Australia
*
12,000,000
59,858
Taurus
Gold,
Ltd.,
144A
#*@∆
2,448,381
0
Tolu
Minerals,
Ltd.
*
2,042,000
1,034,710
TriStar
Gold,
Inc.
*~
28,800,000
2,604,612
Valkea
Resources
Corp.
*
500,000
100,873
Viva
Gold
Corp.
*
500,000
48,697
Westhaven
Gold
Corp.
*
1,000,000
71,307
19,507,957
See
notes
to
portfolios
of
investments.
World
Precious
Minerals
Fund
Common
Stocks (cont’d)
Shares
Value
Metal
-
Copper
0.49%
C3
Metals,
Inc.
*
115,384
$
19,666
Meridian
Mining
UK
Societas
*
600,000
160,702
180,368
Metal
-
Diversified
3.65%
Aurion
Resources,
Ltd.
*
400,000
175,311
Callinex
Mines,
Inc.
*
100,000
62,611
Cartier
Resources,
Inc.
*
750,000
41,741
Ivanhoe
Mines,
Ltd.
*
50,000
593,412
Juno
Corp.,
144A
#*@∆
200,000
347,838
Orex
Minerals,
Inc.
*
700,000
68,176
Orsu
Metals
Corp.,
144A
#*@∆
186,922
0
RTG
Mining,
Inc.
*
3,000,000
46,115
Sterling
Metals
Corp.
*
1,000,000
20,870
1,356,074
Mining
Services
0.42%
Cordoba
Minerals
Corp.
*
58,823
16,574
Great
Pacific
Gold
Corp.
*
400,000
139,135
Orexplore
Technologies,
Ltd.
#*@
267,284
0
155,709
Non-Ferrous
Metals
0.55%
InZinc
Mining,
Ltd.
*
2,000,000
27,827
Solitario
Resources
Corp.
*
300,000
178,350
206,177
Oil
Companies
-
Exploration
&
Production
0.00%
Big
Sky
Energy
Corp.
#*@
2,000,000
0
Optical
Recognition
Equipment
0.00%
Nexoptic
Technology
Corp.,
144A
#*∆
12,083
168
Platinum
0.00%
New
Age
Metals,
Inc.,
144A
#*∆
35,880
1,872
Precious
Metals
16.94%
Arizona
Metals
Corp.
*
750,000
834,812
Brixton
Metals
Corp.
*
3,000,000
125,222
Canex
Metals,
Inc.
*
3,250,000
90,438
Capitan
Silver
Corp.
*
1,000,000
219,138
Coeur
Mining,
Inc.
*
20,000
114,400
Denarius
Metals
Corp.
*
150,000
70,959
Dolly
Varden
Silver
Corp.
*
1,750,000
1,168,736
First
Nordic
Metals
Corp.
*
5,000,000
1,321,785
GFG
Resources,
Inc.
*
5,000,000
643,501
Gold
Terra
Resource
Corp.
*
3,500,000
146,092
See
notes
to
portfolios
of
investments.
World
Precious
Minerals
Fund
Common
Stocks (cont’d)
Shares
Value
Precious
Metals
(cont’d)
GR
Silver
Mining,
Ltd.
*
1,000,000
$
114,787
Olive
Resource
Capital,
Inc.
*
4,000,000
76,524
Paramount
Gold
Nevada
Corp.
*
170,000
58,140
Polarx,
Ltd.
*
19,432,756
72,216
Rua
Gold,
Inc.
*
250,000
104,351
Silver
Viper
Minerals
Corp.
*
3,000,000
83,481
Stillwater
Critical
Minerals
Corp.
*
500,000
41,741
Thesis
Gold,
Inc.
*
650,000
257,748
Unico
Silver,
Ltd.
*
500,000
59,744
Unico
Silver,
Ltd.
*
352,941
42,173
Visionary
Metals
Corp.
*
1,500,000
54,784
Vizsla
Royalties
Corp.
*
229,115
255,024
West
Point
Gold
Corp.
*
850,000
189,224
Xali
Gold
Corp.,
144A
#*∆
4,875,000
144,135
6,289,155
Real
Estate
Operating/Development
1.10%
Mammoth
Resources
Corp.
*~
5,500,000
57,393
Revival
Gold,
Inc.
*
1,798,818
350,391
407,784
Retail
-
Jewelry
0.46%
Mene,
Inc.
*
2,115,000
169,206
Silver
Mining
7.18%
Aya
Gold
&
Silver,
Inc.
*
70,000
523,009
Endeavour
Silver
Corp.
*
50,000
183,311
Kootenay
Silver,
Inc.
*
478,000
305,930
Metallic
Minerals
Corp.
*
1,000,000
97,395
Southern
Silver
Exploration
Corp.
*
750,000
96,525
Vizsla
Silver
Corp.
*
862,500
1,458,051
2,664,221
Total
Common
Stocks
35,572,029
(cost
$60,318,797)
Corporate
Non-Convertible
Bond
2.71%
Coupon
Rate
%
Maturity
Date
Principal
Amount
Gold
Mining
2.71%
Aris
Gold
Corp.
7.50
08/26/27
$
659,866
1,006,296
(cost
$659,866)
See
notes
to
portfolios
of
investments.
World
Precious
Minerals
Fund
Warrants
0.41%
Exercise
Price
Exp.
Date
Shares
Value
Diamonds/Precious
Stones
0.00%
Barksdale
Resources
Corp.,
144A
#*@∆
$
0.60
01/09/27
147,500
$
0
Diversified
Minerals
0.00%
Minaurum
Gold,
Inc.,
144A
#*@∆
0.34
05/02/26
250,000
0
Western
Exploration,
Inc.,
144A
#*@∆
2.15
12/31/49
50,000
0
0
Gold
Mining
0.11%
Cassiar
Gold
Corp.,
144A
#*@∆
0.70
05/04/25
125,000
0
Dryden
Gold
Corp.,
144A
#*@∆
0.18
10/02/26
500,000
0
Freegold
Ventures,
Ltd.,
144A
#*@∆
0.52
12/31/49
150,000
21,914
McFarlane
Lake
Mining,
Ltd.,
144A
#*@∆
0.07
05/01/25
2,500,000
0
Newcore
Gold,
Ltd.,
144A
#*@∆
0.40
09/26/25
200,000
0
Radisson
Mining
Resources,
Inc.,
144A
#*@∆
0.27
11/17/25
375,000
18,261
Silver
Viper
Minerals
Corp.,
144A
#*@∆
0.15
04/12/27
500,000
0
STLLR
Gold,
Inc.,
144A
#*@∆
2.19
12/31/27
21,000
0
Westhaven
Gold
Corp.,
144A
#*@∆
0.22
10/17/26
350,000
0
40,175
Metal
-
Diversified
0.00%
Callinex
Mines,
Inc.,
144A
#*@∆
2.00
07/24/26
50,000
0
Sterling
Metals
Corp.,
144A
#*@∆
0.25
04/17/25
1,000,000
0
0
Mining
Services
0.27%
Aris
Mining
Corp.
*
2.75
07/29/25
645,000
98,716
Oil
Companies
-
Exploration
&
Production
0.02%
Goliath
Resources,
Ltd.,
144A
#*@∆
0.92
05/18/25
112,500
9,392
Precious
Metals
0.01%
Denarius
Metals
Corp.,
144A
#*@∆
0.60
03/02/26
75,000
4,174
Real
Estate
Operating/Development
0.00%
Revival
Gold,
Inc.,
144A
#*@∆
0.45
05/30/27
50,000
0
TDG
Gold
Corp.,
144A
#*@∆
0.42
07/06/26
115,000
0
0
See
notes
to
portfolios
of
investments.
World
Precious
Minerals
Fund
Warrants (cont’d)
Exercise
Price
Exp.
Date
Shares
Value
Silver
Mining
0.00%
Kootenay
Silver,
Inc.,
144A
#*@∆
$
1.68
04/25/26
64,000
$
0
Kootenay
Silver,
Inc.,
144A
#*@∆
1.40
05/24/26
1,250,000
0
Southern
Silver
Exploration
Corp.,
144A
#*@∆
0.35
08/14/25
875,000
0
0
Total
Warrants
152,457
(cost
$116,557
)
Call
Options
Purchased
0.00%
Strike
Price
Exp.
Date
Notional
Contract
Value
Contracts
Value
Gold
Mining
0.00%
Barrick
Gold
Corp.
$
20.00
01/25
$
500,000
250
250
Newmont
Corp.
55.00
01/25
550,000
100
100
350
Total
Purchased
Call
Options
350
(premiums
paid
$89,029
)
Investments,
at
value
98.96%
36,731,132
(cost
$61,184,249
)
Other
assets
and
liabilities,
net
1.04%
384,663
Net
Assets
100.00%
$
37,115,795
See
notes
to
portfolios
of
investments.
Gold
and
Precious
Metals
Fund
Common
Stocks
90.00%
Shares
Value
Diversified
Minerals
3.94%
Calibre
Mining
Corp.
*
1,000,000
$
1,495,704
Culico
Metals,
Inc.
*
180,000
15,026
Genesis
Minerals,
Ltd.
*
1,150,000
1,747,825
Leo
Lithium,
Ltd.
#*@
3,500,000
816,705
Lithium
Royalty
Corp.
*
679
2,782
4,078,042
Enterprise
Software/Services
0.22%
Abaxx
Technologies,
Inc.
*
30,000
231,660
Gold
Mining
57.25%
Agnico
Eagle
Mines,
Ltd.
30,000
2,346,300
Alamos
Gold,
Inc.
300,000
5,532,000
Alamos
Gold,
Inc.
18,500
341,313
Anglogold
Ashanti
PLC
60,000
1,384,800
Black
Cat
Syndicate,
Ltd.
*
3,398,844
1,188,086
Black
Cat
Syndicate,
Ltd.
*
175,656
61,402
Catalyst
Metals,
Ltd.
*
2,000,000
3,178,217
Dundee
Precious
Metals,
Inc.
150,000
1,360,743
Eldorado
Gold
Corp.
*
100,000
1,487,000
Endeavour
Mining
PLC
60,000
1,087,342
Firefinch,
Ltd.
#*@
5,000,000
208,277
Franco-Nevada
Corp.
8,000
940,720
G
Mining
Ventures
Corp.
*
100,000
751,330
Gold
Fields,
Ltd.,
ADR
75,000
990,000
Harmony
Gold
Mining
Co.,
Ltd.,
ADR
200,000
1,642,000
IAMGOLD
Corp.
*
250,000
1,290,000
K92
Mining,
Inc.
*
1,500,000
9,057,706
Kinross
Gold
Corp.
200,000
1,854,000
Lundin
Gold,
Inc.
130,000
2,772,827
Mineros
SA
3,400,000
3,524,296
New
Gold,
Inc.
*
1,000,000
2,480,000
OceanaGold
Corp.
500,000
1,384,396
Osisko
Gold
Royalties,
Ltd.
120,000
2,173,015
Osisko
Gold
Royalties,
Ltd.
50,000
905,000
Pantoro,
Ltd.
*
11,000,000
609,819
Petropavlovsk
PLC
#*@+
4,886,855
0
Ramelius
Resources,
Ltd.
1,200,000
1,530,513
Resolute
Mining,
Ltd.
*
5,000,000
1,213,736
Royal
Gold,
Inc.
8,000
1,054,800
Sandstorm
Gold,
Ltd.
250,000
1,395,000
St
Barbara,
Ltd.
*
3,831,691
529,707
St
Barbara,
Ltd.
*
668,309
92,390
Torex
Gold
Resources,
Inc.
*
75,000
1,477,617
Westgold
Resources,
Ltd.
2,000,000
3,483,697
59,328,049
See
notes
to
portfolios
of
investments.
Gold
and
Precious
Metals
Fund
Common
Stocks (cont’d)
Shares
Value
Metal
-
Diversified
5.48%
Aclara
Resources,
Inc.
*
137,400
$
43,014
Ivanhoe
Mines,
Ltd.
*
150,000
1,780,236
Mandalay
Resources
Corp.
*
200,000
548,193
Vox
Royalty
Corp.
1,415,000
3,311,100
5,682,543
Mining
Services
1.66%
Capital,
Ltd.
575,000
582,656
Empress
Royalty
Corp.
*
2,000,000
480,017
Orexplore
Technologies,
Ltd.
#*@
1,007,351
0
Star
Royalties,
Ltd.
*
3,500,000
657,414
1,720,087
Platinum
1.13%
Impala
Platinum
Holdings,
Ltd.,
ADR
*
250,000
1,175,000
Precious
Metals
10.51%
Americas
Gold
&
Silver
Corp.
*
1,000,000
386,100
Coeur
Mining,
Inc.
*
350,000
2,002,000
Elemental
Altus
Royalties
Corp.
*
250,000
200,007
EMX
Royalty
Corp.
*
1,000,000
1,739,191
Hecla
Mining
Co.
500,000
2,455,000
Luca
Mining
Corp.
*
1,000,000
375,665
Orla
Mining,
Ltd.
*
192,125
1,063,908
Pan
African
Resources
PLC
1,250,000
538,153
Pan
American
Silver
Corp.
50,000
1,011,000
Wheaton
Precious
Metals
Corp.
20,000
1,124,800
10,895,824
Real
Estate
Operating/Development
0.97%
Emerald
Resources
NL
*
500,000
1,000,537
Retail
-
Jewelry
0.52%
Mene,
Inc.
*
1,025,000
82,003
Mene,
Inc.,
144A
#*∆
5,714,285
457,159
539,162
Silver
Mining
8.32%
Andean
Precious
Metals
Corp.
*
1,500,000
1,168,736
Aya
Gold
&
Silver,
Inc.
*
650,000
4,856,517
Endeavour
Silver
Corp.
*
300,000
1,099,864
Santacruz
Silver
Mining,
Ltd.
*
3,000,000
573,933
Silver
Crown
Royalties,
Inc.
*
35,000
172,024
Silvercorp
Metals,
Inc.
250,000
750,000
8,621,074
Total
Common
Stocks
(cost
$75,467,825)
93,271,978
See
notes
to
portfolios
of
investments.
Gold
and
Precious
Metals
Fund
Corporate
Non-Convertible
Bonds
3.77%
Coupon
Rate
%
Maturity
Date
Principal
Amount
Value
Coal
0.00%
Caribbean
Resources
Corp.
#@^
19.25
06/15/15
$
485,766
$
0
Gold
Mining
3.77%
Aris
Gold
Corp.
7.50
08/26/27
2,565,521
3,912,420
Total
Corporate
Non-Convertible
Bonds
3,912,420
(cost
$3,051,272)
Warrants
0.26%
Exercise
Price
Exp.
Date
Shares
Mining
Services
0.24%
Aris
Mining
Corp.
*
$
2.75
07/29/25
1,605,000
245,643
Precious
Metals
0.00%
Luca
Mining
Corp.,
144A
#*@∆
0.60
03/26/26
750,000
0
Silver
Mining
0.02%
Silver
Crown
Royalties,
Inc.
#*
16.00
07/25/27
35,000
25,566
Total
Warrants
271,209
(cost
$65,284
)
Call
Options
Purchased
0.00%
Strike
Price
Exp.
Date
Notional
Contract
Value
Contracts
Value
Gold
Mining
0.00%
Barrick
Gold
Corp.
$
20.00
01/25
$
2,900,000
1,450
$
1,450
Newmont
Corp.
55.00
01/25
3,025,000
550
550
2,000
Total
Purchased
Call
Options
2,000
(premiums
paid
$503,530
)
Investments,
at
value
94.03%
97,457,607
(cost
$79,087,911
)
Other
assets
and
liabilities,
net
5.97%
6,182,810
Net
Assets
100.00%
$
103,640,417
Notes
to
Portfolios
of
Investments
Legend
General
The
yields
reflect
the
effective
yield
from
the
date
of
purchase.
Variable
and
Floating
Rate
Notes
have
periodic
reset
features,
which
effectively
shorten
the
maturity
dates
and
reset
the
interest
rates
as
tied
to
various
interest-bearing
instruments.
Rates
shown
are
current
rates
at
December
31,
2024.
Fair
Valuation
of
Securities
For
the
Funds’
policies
regarding
the
valuation
of
investments
and
other
significant
accounting
policies,
please
refer
to
the
Notes
to
Financial
Statements.
Pursuant
to
Rule
2a-5
under
the
Investment
Company
Act,
the
Trust’s
Board
of
Trustees
(the
“Board”)
has
designated
the
Adviser,
as
defined
in
Note
3
in
the
Notes
to
Financial
Statements,
as
the
Funds’
valuation
designee
to
perform
any
fair
value
determinations
for
securities
and
other
assets
held
by
the
Funds.
The
Funds
are
required
to
disclose
information
regarding
the
fair
value
measurements
of
a
Fund’s
assets
and
liabilities.
Fair
value
is
the
price
that
would
be
received
to
sell
an
asset
or
paid
to
transfer
a
liability
in
an
orderly
transaction
between
market
participants
at
the
◊
Zero
coupon
bond.
Interest
rate
presented
is
yield
to
maturity.
*
Non-income
producing
security.
@
Security
was
fair
valued
at
December
31,
2024,
by
U.S.
Global
Investors,
Inc.
(Adviser)
(other
than
international
securities
fair
valued
pursuant
to
systematic
fair
value
models)
in
accordance
with
valuation
procedures
approved
by
the
Board
of
Trustees.
These
securities,
as
a
percentage
of
net
assets
at
December
31,
2024,
were
0.00%
of
Global
Luxury
Goods
Fund,
3.30%
of
Global
Resources
Fund,
1.35%
of
World
Precious
Minerals
Fund
and
0.99%
of
Gold
And
Precious
Metals
Fund,
respectively.
See
the
Fair
Valuation
of
Securities
section
of
these
Notes
to
Portfolios
of
Investments
for
further
discussion
of
fair
valued
securities.
See
further
information
and
detail
on
restricted
securities
in
the
Restricted
Securities
section
of
these
Notes
to
Portfolios
of
Investments.
#
Illiquid
Security.
∆
Pursuant
to
Rule
144A
of
the
Securities
Act
of
1933,
these
securities
may
be
resold
in
transactions
exempt
from
registration,
normally
to
qualified
institutional
buyers.
The
market
value
of
these
securities
and
percentage
of
net
assets
as
of
December
31,
2024
amounted
to
$38,262,
0.08%,
of
Global
Luxury
Goods
Fund,
$1,204,922,
3.30%,
of
Global
Resources
Fund,
$793,593,
2.14%,
of
World
Precious
Minerals
Fund
and
$457,159,
0.44%,
of
Gold
And
Precious
Metals
Fund.
~
Affiliated
Company.
(see
following)
+
See
"Restricted
Securities"
in
Notes
to
Portfolios
of
Investments.
^
Security
is
currently
in
default
and
is
on
scheduled
interest
or
principal
payment.
æ
Subject
to
call
option
written
by
the
Fund.
ADR
American
Depositary
Receipt
AGM
Assured
Guaranty
Municipal
BAM
Build
American
Mutual
Assurance
Company
COP
Certificate
of
Participation
ETF
Exchange
Traded
Fund
GO
General
Obligation
LP
Limited
Partnership
MTN
Medium
Term
Note
PLC
Public
Limited
Company
PSF-GTD
Public
School
Fund
Guarantee
RB
Revenue
Bond
Notes
to
Portfolios
of
Investments
measurement
date.
The
measurement
requirements
established
a
three-tier
hierarchy
to
maximize
the
use
of
observable
market
data
and
minimize
the
use
of
unobservable
inputs
and
to
establish
classification
of
fair
value
measurements
for
disclosure
purposes.
Inputs
refer
broadly
to
the
assumptions
that
market
participants
would
use
in
pricing
the
asset
or
liability,
including
assumptions
about
risk,
for
example,
the
risk
inherent
in
a
particular
valuation
technique
used
to
measure
fair
value
including
such
a
pricing
model
and/or
the
risk
inherent
in
the
inputs
to
the
valuation
technique.
Inputs
may
be
observable
or
unobservable.
Observable
inputs
are
inputs
that
reflect
the
assumptions
market
participants
would
use
in
pricing
the
asset
or
liability
developed
based
on
market
data
obtained
from
sources
independent
of
the
reporting
entity.
Unobservable
inputs
are
inputs
that
reflect
the
reporting
entity’s
own
assumptions
about
the
assumptions
market
participants
would
use
in
pricing
the
asset
or
liability
developed
based
on
the
best
information
available
in
the
circumstances.
The
inputs
or
methodology
used
for
valuing
securities
are
not
necessarily
an
indication
of
the
risk
associated
with
investing
in
those
securities.
Because
of
the
inherent
uncertainties
of
valuation,
the
values
reflected
in
the
portfolios
may
materially
differ
from
the
values
received
upon
actual
sale
of
those
investments.
The
three
levels
defined
by
the
fair
value
hierarchy
are
as
follows:
Level
1
–
Quoted
prices
in
active
markets
for
identical
securities.
Level
2
–
Prices
determined
using
significant
other
observable
inputs
(including
quoted
prices
for
similar
securities,
interest
rates,
prepayment
speeds,
credit
risk,
etc.).
Short-term
securities
with
maturities
of
sixty
days
or
less
are
valued
at
amortized
cost,
which
approximates
market
value,
and
are
categorized
as
Level
2
in
the
hierarchy.
Municipal
securities,
long-
term
U.S.
government
obligations
and
corporate
debt
securities
are
valued
in
accordance
with
the
evaluated
price
supplied
by
a
pricing
service
and
generally
categorized
as
Level
2
in
the
hierarchy.
Other
securities
that
are
categorized
as
Level
2
in
the
hierarchy
include,
but
are
not
limited
to,
warrants
that
do
not
trade
on
an
exchange,
securities
valued
at
the
mean
between
the
last
reported
bid
and
ask
quotation
and
international
equity
securities
valued
by
an
independent
third
party
in
order
to
adjust
for
stale
pricing.
Level
3
–
Prices
determined
using
significant
unobservable
inputs
(including
the
Fund’s
own
assumptions).
For
restricted
equity
securities
and
private
placements
where
observable
inputs
are
limited,
assumptions
about
market
activity
and
risk
are
used
in
determining
fair
value.
Notes
to
Portfolios
of
Investments
The
following
table
summarizes
the
valuation
of
each
Fund’s
securities
as
of
December
31,
2024,
using
the
fair
value
hierarchy:
Quoted
Prices
in
Active
Markets
for
Identical
Investments
(Level
1)
Significant
Other
Observable
Inputs
(Level
2)
Significant
Unobservable
Inputs
(Level
3)
Total
U.S.
Government
Securities
Ultra-Short
Bond
Fund
Investments
in
Securities*
United
States
Government
and
Agency
Obligations
$
–
$
29,650,939
$
–
$
29,650,939
Investments,
at
Value
$
–
$
29,650,939
$
–
$
29,650,939
Quoted
Prices
in
Active
Markets
for
Identical
Investments
(Level
1)
Significant
Other
Observable
Inputs
(Level
2)
Significant
Unobservable
Inputs
(Level
3)
Total
Near-Term
Tax
Free
Fund
Investments
in
Securities*
Municipal
Bonds
$
–
$
21,969,532
$
–
$
21,969,532
Exchange
Traded
Fund
1,054,800
–
–
1,054,800
Investments,
at
Value
$
1,054,800
$
21,969,532
$
–
$
23,024,332
Quoted
Prices
in
Active
Markets
for
Identical
Investments
(Level
1)
Significant
Other
Observable
Inputs
(Level
2)
Significant
Unobservable
Inputs
(Level
3)
Total
Global
Luxury
Goods
Fund
Assets
Investments
in
Securities*
Common
Stocks
Apparel
Manufacturers
$
955,256
$
5,090,074
$
–
$
6,045,330
Athletic
Footwear
1,436,967
–
–
1,436,967
Automotive
-
Cars
&
Light
Trucks
3,875,565
4,250,635
–
8,126,200
Beverages
-
Wine/Spirits
1,392,300
458,199
–
1,850,499
Casino
Hotels
1,354,992
–
–
1,354,992
Cosmetics
&
Toiletries
1,331,732
–
–
1,331,732
Cruise
Lines
4,210,479
–
–
4,210,479
Diversified
Banking
Institution
1,483,086
–
–
1,483,086
Energy
-
Alternate
Sources
–
–
0
0
Fiduciary
Banks
727,750
–
–
727,750
Finance
-
Credit
Card
1,335,555
–
–
1,335,555
Notes
to
Portfolios
of
Investments
Global
Luxury
Goods
Fund
Assets
(continued)
Common
Stocks
(continued)
Finance
-
Mortgage
Loan/
Banker
$
–
$
–
$
0
$
0
Gold
Mining
1,680,200
1,245,809
–
2,926,009
Hotels
&
Motels
2,472,843
564,108
–
3,036,951
Investment
Management/
Advisory
Services
1,213,100
–
–
1,213,100
Oil
Companies
-
Exploration
&
Production
38,262
–
–
38,262
Precious
Metals
320,568
–
–
320,568
Private
Equity
584,245
–
–
584,245
Real
Estate
Operating/
Development
–
–
0
0
Retail
-
Apparel/Shoe
–
3,721,667
–
3,721,667
Retail
-
Jewelry
–
2,825,802
–
2,825,802
Silver
Mining
186,789
–
–
186,789
Textile
-
Apparel
2,017,984
–
–
2,017,984
Corporate
Non-Convertible
Bond
–
813,132
–
813,132
Call
Option
–
55
–
55
Investments,
at
Value
26,617,673
18,969,481
0
45,587,154
Total
Assets
$
26,617,673
$
18,969,481
$
0
$
45,587,154
Liabilities
Call
Option
–
(23,750)
–
(23,750)
Total
Liabilities
$
–
$
(23,750)
$
–
$
(23,750)
Quoted
Prices
in
Active
Markets
for
Identical
Investments
(Level
1)
Significant
Other
Observable
Inputs
(Level
2)
Significant
Unobservable
Inputs
(Level
3)
Total
Global
Resources
Fund
Investments
in
Securities*
Common
Stocks
Advanced
Materials/
Production
$
183,137
$
–
$
–
$
183,137
Agricultural
Chemicals
–
112,005
–
112,005
Agricultural
Operations
349,920
–
–
349,920
Building
Products
-
Wood
148,576
–
–
148,576
Chemicals
-
Diversified
315,965
–
–
315,965
Chemicals
-
Specialty
535,814
–
–
535,814
Coal
344,505
–
0
344,505
Diamonds/Precious
Stones
231,208
–
–
231,208
Diversified
Minerals
1,263,518
10
166,530
1,430,058
Energy
-
Alternate
Sources
176,240
–
0
176,240
Enterprise
Software/
Services
2,316,602
306,098
–
2,622,700
Notes
to
Portfolios
of
Investments
Global
Resources
Fund
Common
Stocks
(continued)
Finance-Other
Services
$
208,713
$
–
$
–
$
208,713
Food
-
Miscellaneous/
Diversified
550,240
–
–
550,240
Gold
Mining
4,535,771
417,374
41,655
4,994,800
Industrial
Gases
837,340
–
–
837,340
Investment
Companies
–
164,768
–
164,768
Metal
-
Aluminum
188,900
–
–
188,900
Metal
-
Copper
822,278
–
–
822,278
Metal
-
Diversified
3,652,636
465,618
347,838
4,466,092
Metal
-
Iron
180,180
–
0
180,180
Mining
Services
173,100
–
–
173,100
Natural
Resource
Technology
–
–
145,017
145,017
Non-Ferrous
Metals
1,267,693
332,292
0
1,599,985
Oil
-
US
Royalty
Trusts
1,515,447
–
–
1,515,447
Oil
Companies
-
Exploration
&
Production
3,193,488
–
–
3,193,488
Oil
Companies
-
Field
Services
999,100
–
–
999,100
Oil
Companies
-
Integrated
1,259,695
–
–
1,259,695
Paper
&
Related
Products
553,140
–
–
553,140
Pipelines
1,611,525
–
–
1,611,525
Platinum
41,548
–
–
41,548
Precious
Metals
1,043,104
89,617
–
1,132,721
Real
Estate
Operating/
Development
329,327
–
0
329,327
Retail
-
Jewelry
60,002
–
–
60,002
Silver
Mining
877,960
–
–
877,960
Corporate
Convertible
Bond
–
–
500,760
500,760
Corporate
Non-Convertible
Bonds
–
1,538,753
–
1,538,753
Warrants
Diamonds/Precious
Stones
–
0
–
0
Diversified
Minerals
–
1,739
–
1,739
Gold
Mining
–
0
–
0
Investment
Companies
–
0
–
0
Metal
-
Copper
–
0
–
0
Metal
-
Diversified
–
0
–
0
Mining
Services
73,463
–
–
73,463
Non-Ferrous
Metals
–
0
–
0
Oil
Companies
-
Exploration
&
Production
–
31,306
–
31,306
Real
Estate
Operating/
Development
–
0
–
0
Investments,
at
Value
$
29,840,135
$
3,459,580
$
1,201,800
$
34,501,515
Notes
to
Portfolios
of
Investments
Quoted
Prices
in
Active
Markets
for
Identical
Investments
(Level
1)
Significant
Other
Observable
Inputs
(Level
2)
Significant
Unobservable
Inputs
(Level
3)
Total
World
Precious
Minerals
Fund
Investments
in
Securities*
Common
Stocks
Advanced
Materials/
Production
$
1,521,444
$
–
$
–
$
1,521,444
Coal
–
–
0
0
Diamonds/Precious
Stones
422,206
–
–
422,206
Diversified
Minerals
2,279,339
410,349
0
2,689,688
Gold
Mining
17,030,541
2,464,299
13,117
19,507,957
Metal
-
Copper
160,702
19,666
–
180,368
Metal
-
Diversified
962,121
46,115
347,838
1,356,074
Mining
Services
139,135
16,574
0
155,709
Non-Ferrous
Metals
206,177
–
–
206,177
Oil
Companies
-
Exploration
&
Production
–
–
0
0
Optical
Recognition
Equipment
168
–
–
168
Platinum
1,872
–
–
1,872
Precious
Metals
5,839,579
449,576
–
6,289,155
Real
Estate
Operating/
Development
350,391
57,393
–
407,784
Retail
-
Jewelry
169,206
–
–
169,206
Silver
Mining
2,664,221
–
–
2,664,221
Corporate
Non-Convertible
Bond
–
1,006,296
–
1,006,296
Warrants
Diamonds/Precious
Stones
–
0
–
0
Diversified
Minerals
–
0
–
0
Gold
Mining
–
40,175
0
40,175
Metal
-
Diversified
–
0
–
0
Mining
Services
98,716
–
–
98,716
Oil
Companies
-
Exploration
&
Production
–
9,392
–
9,392
Precious
Metals
–
4,174
–
4,174
Real
Estate
Operating/
Development
–
0
–
0
Silver
Mining
–
0
–
0
Purchased
Call
Options
350
–
–
350
Investments,
at
Value
$
31,846,168
$
4,524,009
$
360,955
$
36,731,132
Notes
to
Portfolios
of
Investments
The
following
is
a
reconciliation
of
assets
for
which
unobservable
inputs
(Level
3)
were
used
in
determining
fair
value
during
the
period
January
1,
2024
through
December
31,
2024:
Quoted
Prices
in
Active
Markets
for
Identical
Investments
(Level
1)
Significant
Other
Observable
Inputs
(Level
2)
Significant
Unobservable
Inputs
(Level
3)
Total
Gold
And
Precious
Metals
Fund
Investments
in
Securities*
Common
Stocks
Diversified
Minerals
$
1,513,512
$
1,747,825
$
816,705
$
4,078,042
Enterprise
Software/
Services
231,660
–
–
231,660
Gold
Mining
47,232,205
11,887,567
208,277
59,328,049
Metal
-
Diversified
5,682,543
–
–
5,682,543
Mining
Services
1,137,431
582,656
0
1,720,087
Platinum
1,175,000
–
–
1,175,000
Precious
Metals
10,357,671
538,153
–
10,895,824
Real
Estate
Operating/
Development
–
1,000,537
–
1,000,537
Retail
-
Jewelry
539,162
–
–
539,162
Silver
Mining
8,621,074
–
–
8,621,074
Corporate
Non-Convertible
Bonds
–
3,912,420
0
3,912,420
Warrants
Mining
Services
–
245,643
–
245,643
Precious
Metals
–
0
–
0
Silver
Mining
–
25,566
–
25,566
Purchased
Call
Options
2,000
–
–
2,000
Investments,
at
Value
$
76,492,258
$
19,940,367
$
1,024,982
$
97,457,607
*
Refer
to
the
Portfolio
of
Investments
for
a
detailed
list
of
the
Fund’s
investments.
Common
Stocks
Total
Global
Luxury
Goods
Fund
Beginning
Balance
12/31/23
$
0
$
0
Net
change
in
unrealized
appreciation
(depreciation)
—
—
Ending
Balance
12/31/24
$
0
$
0
Net
change
in
unrealized
appreciation
(depreciation)
from
Investments
held
as
of
12/31/24
(1)
$
—
$
—
Notes
to
Portfolios
of
Investments
(
Significant
unobservable
inputs
developed
by
the
Adviser
for
Level
3
investments
held
at
year
end
are
as
follows:
Common
Stocks
Corporate
Convertible
Bond
Total
Global
Resources
Fund
Beginning
Balance
12/31/23
$
732,376
$
509,860
$
1,242,236
Net
change
in
unrealized
appreciation
(depreciation)
(31,336)
(9,100)
(40,436)
Ending
Balance
12/31/24
$
701,040
$
500,760
$
1,201,800
Net
change
in
unrealized
appreciation
(depreciation)
from
Investments
held
as
of
12/31/24
(1)
$
(31,336)
$
(9,100)
$
(40,436)
Common
Stock
Total
World
Precious
Minerals
Fund
Beginning
Balance
12/31/23
$
404,295
$
404,295
Corporate
Action
(12,160)
(12,160)
Transfers
Out
(1,391)
(1,391)
Realized
Loss
(2,488,870)
(2,488,870)
Net
change
in
unrealized
appreciation
(depreciation)
2,459,081
2,459,081
Ending
Balance
12/31/24
$
360,955
$
360,955
Net
change
in
unrealized
appreciation
(depreciation)
from
Investments
held
as
of
12/31/24
(1)
$
(29,789)
$
(29,789)
Common
Stocks
Corporate
Non-
Convertible
Bond
Total
Gold
and
Precious
Metals
Fund
Beginning
Balance
12/31/23
$
1,511,115
$
0
$
1,511,115
Net
change
in
unrealized
appreciation
(depreciation)
(486,133)
—
(486,133)
Ending
Balance
12/31/24
$
1,024,982
$
0
$
1,024,982
Net
change
in
unrealized
appreciation
(depreciation)
from
Investments
held
as
of
12/31/24
(1)
$
(486,133)
$
—
$
(486,133)
(1)
The
amounts
shown
represent
the
net
change
in
unrealized
appreciation
(depreciation)
attributable
to
only
those
investments
still
held
and
classified
as
Level
3
at
December
31,
2024.
Fair
Value
at
12/31/24
Valuation
Technique(s)
Unobservable
Input
Range
(Weighted
Average)
Global
Luxury
Goods
Fund
Investments
in
Securities
Common
Stocks
$
0
Market
Transaction
(1)
Discount
100%
Global
Resources
Fund
Investments
in
Securities
0%
-
100%
discount
(98%
discount)
Common
Stocks
701,040
Market
Transaction
(1)
Discount
Corporate
Convertible
Bond
500,760
Market
Transaction
(1)
Discount
0%
Notes
to
Portfolios
of
Investments
The
majority
of
securities
classified
as
Level
3
are
private
companies.
The
initial
valuation
is
usually
cost,
which
is
then
adjusted
as
determined
by
the
Valuation
Committee
for
subsequent
known
market
transactions
and
evaluated
for
progress
against
anticipated
milestones
and
current
operations.
An
evaluation
that
the
holding
no
longer
meets
expectations
could
result
in
the
application
of
discounts
and
a
significantly
lower
fair
valuation.
For
certain
securities,
the
last
known
market
transaction
is
increased
or
decreased
by
changes
in
a
market
index
or
industry
peers
as
approved
by
the
Valuation
Committee.
Affiliated
Companies
The
Investment
Company
Act
of
1940
defines
affiliates
as
companies
in
which
the
Fund
owns
at
least
5%
of
the
outstanding
voting
securities.
The
following
is
a
summary
of
transactions
with
each
affiliated
company
during
the
year
ended
December
31,
2024.
At
December
31,
2024,
the
value
of
investments
in
affiliated
companies
was
$0,
representing
0%
of
net
assets,
and
the
total
cost
was
$2,400,000.
Fair
Value
at
12/31/24
Valuation
Technique(s)
Unobservable
Input
Range
(Weighted
Average)
World
Precious
Minerals
Fund
Investments
in
Securities
0%
-
100%
discount
(96%
discount)
Common
Stocks
360,955
Market
Transaction
(1)
Discount
Gold
and
Precious
Metals
Fund
Investments
in
Securities
0%
-
100%
discount
(7%
discount)
Common
Stocks
1,024,982
Market
Transaction
(1)
Discount
Corporate
Non-Convertible
Bond
0
Market
Transaction
(1)
Discount
100%
(1)
Market
Transaction
refers
to
most
recent
known
market
transaction,
including
transactions
in
which
the
Fund
participated,
as
adjusted
for
any
discount
or
premium
as
discussed
below.
Shares
of
Affiliated
Companies
Global
Resources
Fund
December
31,
2023
Additions
Reductions
December
31
,
2024
Pacific
Green
Energy
Corp.
2,400,000
—
—
2,400,000
Values
of
Affiliated
Companies
Global
Resources
Fund
December
31,
2023
Purchases
Cost
Sales
Proceeds
December
31
,
2024
Income
Realized
Gain
(Loss)
on
Investments
Change
in
Unrealized
Appreciation
(Depreciation)
Pacific
Green
Energy
Corp.
$
0
$
—
$
—
$
0
$
—
$
—
$
—
Notes
to
Portfolios
of
Investments
At
December
31,
2024,
the
value
of
investments
in
affiliated
companies
was
$2,840,794,
representing
7.65%
of
net
assets,
and
the
total
cost
was
$5,670,311.
Restricted
Securities
The
following
securities
are
subject
to
contractual
and
regulatory
restrictions
on
resale
or
transfer.
These
investments
may
involve
a
high
degree
of
business
and
financial
risk.
Because
of
the
thinly
traded
markets
for
these
investments,
a
Fund
may
be
unable
to
liquidate
its
securities
in
a
timely
manner,
especially
if
there
is
negative
news
regarding
the
specific
securities
or
the
markets
overall.
These
securities
could
decline
significantly
in
value
before
the
Fund
could
liquidate
these
securities.
The
issuer
bears
the
cost
of
registration,
if
any,
involved
in
the
disposition
of
these
securities.
As
of
December
31,
2024,
the
total
cost
of
restricted
securities
was
$426,625,
and
the
total
value
was
$0,
representing
0.00%
of
net
assets.
Shares
of
Affiliated
Companies
World
Precious
Minerals
Fund
December
31,
2023
Additions
Reductions
December
31
,
202
4
First
Nordic
Metals
Corp.
(formerly
Barsele
Minerals
Corp.)
7,550,000
—
(7,550,000)
—
(a)
Kesselrun
Resources,
Ltd.
5,000,000
—
—
5,000,000
Mammoth
Resources
Corp.
5,500,000
—
—
5,500,000
TriStar
Gold,
Inc.
28,800,000
—
—
28,800,000
Waraba
Gold
Ltd.
8,200,000
—
—
8,200,000
Waraba
Gold,
Ltd.
-
warrants
5,390,000
—
(
5,390,000
)
—
Values
of
Affiliated
Companies
World
Precious
Minerals
Fund
December
31,
2023
Purchases
Cost
Sales
Proceeds
December
31,
2024
Income
Realized
Gain
(Loss)
on
Investments
Change
in
Unrealized
Appreciation
(Depreciation)
First
Nordic
Metals
Corp.
(formerly
Barsele
Minerals
Corp.)
$
769,216
$
—
$
(1,558,33
1
)
$
—
(a)
$
—
$
–
$
789,11
5
Kesselrun
Resources,
Ltd.
169,805
—
—
121,743
—
–
(48,062)
Mammoth
Resources
Corp.
62,262
—
—
57,393
—
–
(4,869)
TriStar
Gold,
Inc.
1,956,153
—
—
2,604,612
—
–
648,459
Waraba
Gold,
Ltd.
371,307
—
—
57,046
—
–
(
314,261
)
$
3,328,743
$
—
$
(1,558,33
1
)
$
2,840,794
$
—
$
–
$
1,070,38
2
(a)
At
December
31,
2024,
the
company
was
no
longer
defined
as
an
affiliate,
although
it
was
an
affiliate
company
during
the
year.
Global
Luxury
Goods
Fund
Acquisition
Date
Cost
per
Share/Unit
Infrastructure
Ventures,
Inc.
08/06/10-11/22/10
$
1.00
Notes
to
Portfolios
of
Investments
As
of
December
31,
2024,
the
total
cost
of
restricted
securities
was
$7,473,544,
and
the
total
value
was
$145,017,
representing
0.40%
of
net
assets.
As
of
December
31,
2024,
the
total
cost
of
restricted
securities
was
$1,362,590,
and
the
total
value
was
$0,
representing
0.00%
of
net
assets.
Global
Resources
Fund
Acquisition
Date
Cost
per
Share/Unit
I-Pulse,
Inc.,
144A
10/04/07
$
1.88
Infrastructure
Ventures,
Inc.
08/06/10-11/22/10
$
1.00
Gold
and
Precious
Metals
Fund
Acquisition
Date
Cost
per
Share/Unit
Petropavlovsk
PLC
09/15/21-10/07/21
$
0.28
Statements
of
Assets
and
Liabilities
See
accompanying
notes
to
financial
statements.
U.S.
Government
Securities
Ultra-
Short
Bond
Fund
Investments,
at
identified
cost
$
29,603,524
Assets
Investments,
at
value:
Securities
of
unaffiliated
issuers
$
29,650,939
Securities
of
affiliated
issuers
–
Cash
230,822
Deposits
with
brokers
for
options
–
Foreign
currencies
(Cost
$0,
$0,
$516,
$826,669,
$239,189
and
$6,916)
–
Receivables:
Dividends
and
interest
76,909
Capital
shares
sold
601
Investments
sold
–
From
adviser
12,751
Prepaid
expenses
11,274
Total
Assets
29,983,296
Liabilities
Call
options
written,
at
value
(Premiums
received
$0,
$0,
$47,643,
$0,
$0
and
$0)
–
Payables:
Capital
shares
redeemed
3
Distributions
payable
21,805
Investments
purchased
–
Accrued
expenses
and
other
payables:
Adviser
–
Administration
and
Transfer
Agent
fees
8,005
Other
expenses
32,473
Total
Liabilities
62,286
Net
Assets
$
29,921,010
Net
Assets
Consist
of:
Paid-in
capital
$
30,680,389
Distributable
earnings
(accumulated
losses)
(759,379)
Net
assets
applicable
to
capital
shares
outstanding
$
29,921,010
By
share
class
Net
Assets
Investor
Class
$
29,921,010
Capital
shares
outstanding,
an
unlimited
number
of
no
par
shares
authorized
Investor
Class
15,354,624
Net
Asset
Value,
Public
Offering
Price
and
Redemption
Price
per
share
Investor
Class
$
1.95
Near-Term
Tax
Free
Fund
Global
Luxury
Goods
Fund
Global
Resources
Fund
World
Precious
Minerals
Fund
Gold
and
Precious
Metals
Fund
$
23,174,313
$
42,163,871
$
78,537,964
$
61,184,249
$
79,087,911
$
23,024,332
$
45,587,154
$
34,501,515
$
33,890,338
$
97,457,607
–
–
0
2,840,794
–
1,220,643
2,299,271
929,389
188,271
5,887,425
–
160
9,895
–
–
–
527
821,050
238,916
6,916
308,190
255,770
66,453
16,194
306,838
49
6,200
3,206
8,097
192,115
–
3,086,692
298,176
–
–
12,210
–
–
1,789
–
9,465
13,678
12,120
11,523
14,210
24,574,889
51,249,452
36,641,804
37,195,922
103,865,111
–
23,750
–
–
–
10,226
23,029
25,843
12,594
24,402
11,070
–
–
–
–
1,055,350
1,508,846
–
–
–
–
16,770
11,288
–
83,929
7,091
12,098
12,948
13,910
23,346
32,886
55,029
54,312
53,623
93,017
1,116,623
1,639,522
104,391
80,127
224,694
$
23,458,266
$
49,609,930
$
36,537,413
$
37,115,795
$
103,640,417
$
26,395,815
$
45,486,872
$
329,610,320
$
437,896,482
$
147,378,857
(2,937,549)
4,123,058
(293,072,907)
(400,780,687)
(43,738,440)
$
23,458,266
$
49,609,930
$
36,537,413
$
37,115,795
$
103,640,417
$
23,458,266
$
49,609,930
$
36,537,413
$
37,115,795
$
103,640,417
11,209,638
2,484,062
9,988,174
24,990,853
9,106,271
$
2.09
$
19.97
$
3.66
$
1.49
$
11.38
See
accompanying
notes
to
financial
statements.
U.S.
Government
Securities
Ultra-
Short
Bond
Fund
Net
Investment
Income
Income
Dividends
from
unaffiliated
issuers
$
–
Foreign
tax
withheld
on
dividends
–
Net
dividends
–
Interest
and
other
1,408,655
Total
income
1,408,655
Expenses:
Management
fee
151,481
Administrative
services
fee
65,885
Distribution
plan
fee
–
Transfer
agent
fees
and
expenses
26,627
Professional
fees
41,419
Custodian
fees
3,528
Shareholder
reporting
expenses
23,886
Registration
fees
20,574
Trustee
fees
and
expenses
10,820
Chief
compliance
officer
fees
4,157
Miscellaneous
expenses
44,421
Total
expenses
before
reductions
392,798
Expenses
offset
-
Note
1
H
(3,301)
Expenses
reimbursed
-
Note
3
(253,164)
Net
expenses
136,333
Net
Investment Income
(Loss)
1,272,322
Net
Realized
and
Unrealized
Gain
(Loss)
on
Investments
Realized
gain
(loss)
from:
Securities
from
unaffiliated
issuers
(16,249)
Foreign
currency
transactions
–
Forward
currency
contract
transactions
–
Net
realized
gain
(loss)
(16,249)
Net
change
in
unrealized
appreciation
(depreciation)
of:
Investments
in
unaffiliated
issuers
(40,095)
Investments
in
affiliated
issuers
–
Other
assets
and
liabilities
denominated
in
foreign
currencies
–
Forward
currency
contracts
–
Written
options
–
Net
change
in
unrealized
appreciation
(depreciation)
(40,095)
Net
Realized
and
Unrealized
Gain
(Loss)
on
Investments
(56,344)
Net
Increase
(Decrease)
In
Net
Assets
Resulting
From
Operations
$
1,215,978
Near-Term
Tax
Free
Fund
Global
Luxury
Goods
Fund
Global
Resources
Fund
World
Precious
Minerals
Fund
Gold
and
Precious
Metals
Fund
$
–
$
900,945
$
529,603
$
83,929
$
1,016,937
–
(129,946)
(97,795)
(6,702)
(99,478)
–
770,999
431,808
77,227
917,459
724,085
299,026
312,391
237,095
1,040,246
724,085
1,070,025
744,199
314,322
1,957,705
125,364
370,532
320,216
300,378
930,488
59,255
102,092
101,786
100,334
184,769
–
122,296
104,404
101,612
264,016
23,235
33,155
54,063
66,193
73,245
30,612
43,549
88,426
34,288
64,397
3,953
10,480
13,046
13,851
15,113
23,180
30,721
27,505
26,772
37,227
19,417
20,146
19,694
20,680
23,121
9,824
14,134
12,901
12,345
23,769
3,439
6,705
5,727
5,558
14,414
58,086
81,932
105,095
97,023
171,502
356,365
835,742
852,863
779,034
1,802,061
(3,953)
(10,480)
(13,046)
(13,851)
(15,113)
(239,584)
(87,842)
(185,507)
(159,970)
–
112,828
737,420
654,310
605,213
1,786,948
611,257
332,605
89,889
(290,891)
170,757
(8,027)
4,767,029
836,934
(8,250,156)
4,037,870
–
(74,195)
(46,878)
(28,803)
(53,792)
–
(90,824)
–
–
20
(8,027)
4,602,010
790,056
(8,278,959)
3,984,098
(63,168)
1,431,801
(2,281,686)
8,241,158
10,604,152
–
–
–
1,070,382
–
–
(7,507)
(37,915)
(1,642)
(4,188)
–
126,687
–
–
–
–
23,893
–
–
–
(63,168)
1,574,874
(2,319,601)
9,309,898
10,599,964
(71,195)
6,176,884
(1,529,545)
1,030,939
14,584,062
$
540,062
$
6,509,489
$
(1,439,656)
$
740,048
$
14,754,819
Statements
of
Changes
in
Net
Assets
See
accompanying
notes
to
financial
statements.
U.S.
Government
Securities
Ultra-Short
Bond
Fund
Year
Ended
December
31,
2024
Year
Ended
December
31,
2023
Increase
(Decrease)
in
Net
Assets
From
operations:
Net
investment
income
$
1,272,322
$
1,169,340
Net
realized
gain
(loss)
(16,249)
(52,344)
Net
change
in
unrealized
appreciation
(depreciation)
(40,095)
216,642
Net
increase
in
net
assets
from
operations
1,215,978
1,333,638
Distributions
to
shareholders
Investor
Class
(1,272,327)
(1,170,048)
Total
distributions
paid
(1,272,327)
(1,170,048)
From
capital
share
transactions:
Proceeds
from
shares
sold
Investor
Class
10,366,457
9,074,680
Distributions
reinvested
Investor
Class
1,019,499
937,626
11,385,956
10,012,306
Cost
of
shares
redeemed
Investor
Class
(12,736,545)
(12,965,376)
Net
increase
(decrease)
in
net
assets
from
capital
share
transactions
(1,350,589)
(2,953,070)
Net
Increase
(Decrease)
in
Net
Assets
(1,406,938)
(2,789,480)
Net
Assets
Beginning
of
year
31,327,948
34,117,428
End
of
year
$
29,921,010
$
31,327,948
Capital
Share
Activity
Investor
Class
Shares
sold
5,318,937
4,658,686
Shares
reinvested
523,433
482,720
Shares
redeemed
(6,528,040)
(6,656,999)
Net
capital
share
activity
(685,670)
(1,515,593)
Near-Term
Tax
Free
Fund
Global
Luxury
Goods
Fund
Year
Ended
December
31,
2024
Year
Ended
December
31,
2023
Year
Ended
December
31,
2024
Year
Ended
December
31,
2023
$
611,257
$
696,073
$
332,605
$
296,428
(8,027)
(6,489)
4,602,010
7,599,696
(63,168)
106,931
1,574,874
1,534,929
540,062
796,515
6,509,489
9,431,053
(611,265)
(696,647)
(4,538,212)
(1,251,610)
(611,265)
(696,647)
(4,538,212)
(1,251,610)
4,424,691
3,914,838
2,905,844
3,901,367
479,678
537,605
4,342,302
1,198,852
4,904,369
4,452,443
7,248,146
5,100,219
(6,768,529)
(10,036,551)
(6,854,090)
(6,356,444)
(1,864,160)
(5,584,108)
394,056
(1,256,225)
(1,935,363)
(5,484,240)
2,365,333
6,923,218
25,393,629
30,877,869
47,244,597
40,321,379
$
23,458,266
$
25,393,629
$
49,609,930
$
47,244,597
2,110,113
1,871,684
140,431
205,753
229,053
257,398
217,332
62,962
(3,228,243)
(4,810,797)
(332,070)
(337,630)
(889,077)
(2,681,715)
25,693
(68,915)
Statements
of
Changes
in
Net
Assets
See
accompanying
notes
to
financial
statements.
Global
Resources
Fund
Year
Ended
December
31,
2024
Year
Ended
December
31,
2023
Increase
(Decrease)
in
Net
Assets
From
operations:
Net
investment
income
(loss)
$
89,889
$
174,945
Net
realized
gain
(loss)
790,056
(4,532,933)
Net
change
in
unrealized
appreciation
(depreciation)
(2,319,601)
333,302
Net
increase
(decrease)
in
net
assets
from
operations
(1,439,656)
(4,024,686)
Distributions
to
shareholders
Investor
Class
(1,528,790)
–
Total
distributions
paid
(1,528,790)
–
From
capital
share
transactions:
Proceeds
from
shares
sold
Investor
Class
1,349,796
1,547,349
Distributions
reinvested
Investor
Class
1,479,732
–
2,829,528
1,547,349
Cost
of
shares
redeemed
Investor
Class
(8,662,789)
(7,236,681)
Net
decrease
in
net
assets
from
capital
share
transactions
(5,833,261)
(5,689,332)
Net
Increase
(Decrease)
in
Net
Assets
(8,801,707)
(9,714,018)
Net
Assets
Beginning
of
year
45,339,120
55,053,138
End
of
year
$
36,537,413
$
45,339,120
Capital
Share
Activity
Investor
Class
Shares
sold
339,728
374,214
Shares
reinvested
412,182
–
Shares
redeemed
(2,181,034)
(1,748,254)
Net
capital
share
activity
(1,429,124)
(1,374,040)
World
Precious
Minerals
Fund
Gold
and
Precious
Metals
Fund
Year
Ended
December
31,
2024
Year
Ended
December
31,
2023
Year
Ended
December
31,
2024
Year
Ended
December
31,
2023
$
(290,891)
$
(443,563)
$
170,757
$
383,786
(8,278,959)
(8,997,096)
3,984,098
(498,323)
9,309,898
1,192,983
10,599,964
1,629,967
740,048
(8,247,676)
14,754,819
1,515,430
–
–
(1,523,716)
–
–
–
(1,523,716)
–
10,344,809
11,690,928
28,642,133
28,339,803
–
–
1,393,229
–
10,344,809
11,690,928
30,035,362
28,339,803
(16,713,400)
(15,198,788)
(37,528,208)
(42,042,560)
(6,368,591)
(3,507,860)
(7,492,846)
(13,702,757)
(5,628,543)
(11,755,536)
5,738,257
(12,187,327)
42,744,338
54,499,874
97,902,160
110,089,487
$
37,115,795
$
42,744,338
$
103,640,417
$
97,902,160
6,841,781
7,365,869
2,452,328
2,952,052
–
–
121,892
–
(11,235,174)
(9,409,900)
(3,360,936)
(4,345,126)
(4,393,393)
(2,044,031)
(786,716)
(1,393,074)
Notes
to
Financial
Statements
Note
1:
Organization
and
Significant
Accounting
Policies
U.S.
Global
Investors
Funds
(“Trust”),
consisting
of
the
six
separate
funds
(“Funds”)
included
in
this
report,
is
organized
as
a
Delaware
statutory
trust.
Each
Fund
is
an
open-
end
management
investment
company
registered
under
the
Investment
Company
Act
of
1940,
as
amended,
and
follows
the
specialized
accounting
and
reporting
guidance
in
FASB
Accounting
Standards
Codification
Topic
946.
All
Funds
are
diversified
with
the
exception
of
World
Precious
Minerals
and
Gold
and
Precious
Metals.
A
non-diversified
fund
may
invest
a
greater
percentage
of
its
assets
in
a
smaller
number
of
issuers
in
comparison
to
a
diversified
fund.
On
June
14,
2019,
the
Institutional
Shares
of
the
Global
Resources
Fund
and
the
World
Precious
Minerals
Fund
were
liquidated
and
terminated
pursuant
to
a
Board
approved
Plan
of
Share
Class
Termination.
On
the
Liquidation
Date,
each
Fund
made
a
liquidating
distribution
to
shareholders
of
the
Institutional
Shares
equal
to
each
Shareholder’s
proportionate
interest
in
the
Institutional
Shares.
Effective
July
1,
2020,
the
Holmes
Macro
Trends
Fund
changed
its
name
to
Global
Luxury
Goods
Fund.
The
Fund
also
changed
its
investment
strategy
on
July
1,
2020.
Prior
to
that
date,
the
Fund
invested
in
a
diversified
portfolio
of
equity
and
equity-related
securities
of
companies
in
the
S&P
Composite
1500
Index,
with
a
focus
on
companies
achieving
high
return
on
invested
capital
metrics
and
an
emphasis
on
mid-capitalization
companies.
Different
investment
strategies
may
lead
to
different
performance
results.
The
Fund’s
performance
for
periods
prior
to
July
1,
2020
reflects
the
investment
strategy
in
effect
prior
to
that
date.
Each
Fund
included
herein
is
deemed
to
be
an
individual
reporting
segment
and
is
not
part
of
a
consolidated
reporting
entity.
The
objective
and
strategy
of
each
Fund
is
used
by
the
Adviser,
as
defined
in
Note
3,
to
make
investment
decisions,
and
the
results
of
the
operations,
as
shown
on
the
Statements
of
Operations
and
the
Financial
Highlights
for
each
Fund
is
the
information
utilized
for
the
day-to-day
management
of
the
Funds.
Each
Fund
is
party
to
the
expense
agreements
as
disclosed
in
the
Notes
to
the
Financial
Statements
and
there
are
no
resources
allocated
to
the
Funds
based
on
performance
measurements.
Due
to
the
significance
of
oversight
and
its
role,
the
Adviser
is
deemed
to
be
the
Chief
Operating
Decision
Maker.
The
following
is
a
summary
of
significant
accounting
policies
consistently
followed
by
the
Funds
in
the
preparation
of
their
financial
statements.
The
policies
are
in
conformity
with
U.S.
generally
accepted
accounting
principles.
A.
Security
Valuations
The
Funds
value
investments
traded
on
national
or
international
securities
exchanges
or
over-the-counter
at
the
last
sales
price
reported
by
the
security’s
primary
exchange
of
its
market
at
the
time
of
daily
valuation.
Options
and
securities
for
which
no
sale
was
reported
are
valued
at
the
mean
between
the
last
reported
bid
and
asked
quotation.
Debt
securities
having
60
days
or
less
to
maturity
that
are
expected
to
be
valued
at
par
at
maturity
may
be
priced
by
the
amortized
cost
method
if
the
Adviser
determines
it
would
approximate
market
value.
Municipal
securities,
long-term
U.S.
government
obligations
and
corporate
debt
securities
are
valued
by
an
independent
pricing
service
using
an
evaluated
quote
based
on
such
factors
as
institutional-size
trading
in
similar
groups
of
securities,
yield,
quality,
maturity,
coupon
rate,
type
of
issue,
individual
trading
characteristics
and
other
market
data.
For
more
information
please
see
Notes
to
Portfolio
of
Investments.
Notes
to
Financial
Statements
B.
Cash-Concentration
in
Uninsured
Account
For
cash
management
purposes
the
Funds
may
concentrate
cash
with
the
Funds’
custodian.
As
of
December
31,
2024,
The
U.S.
Government
Securities
Ultra-Short
Bond
Fund,
Near-Term
Tax
Free
Fund,
Global
Luxury
Goods
Fund,
Global
Resources
Fund,
World
Precious
Minerals
Fund
and
Gold
and
Precious
Metals
Fund
held
$230,822,
$1,220,643,
$2,299,431,
$939,284,
$188,271
and
$5,887,425,
respectively,
as
cash
reserves
at
Brown
Brothers
Harriman
&
Co.
(BBH).
C.
Fair
Valued
Securities
Pursuant
to
Rule
2a-5
under
the
Investment
Company
Act,
the
Trust’s
Board
has
designated
the
Adviser
as
the
Funds’
valuation
designee
to
perform
any
fair
value
determinations
for
securities
and
other
assets
held
by
the
Funds.
The
Adviser
is
subject
to
the
oversight
of
the
Board
and
certain
reporting
and
other
requirements
intended
to
provide
the
Board
the
information
needed
to
oversee
the
Adviser’s
fair
value
determinations.
The
Adviser
is
responsible
for
determining
the
fair
value
of
investments
for
which
market
quotations
are
not
readily
available
in
accordance
with
policies
and
procedures
that
have
been
approved
by
the
Board.
Under
these
procedures,
the
Adviser
convenes
on
a
regular
and
ad
hoc
basis
to
review
such
investments
and
considers
a
number
of
factors,
including
valuation
methodologies
and
significant
unobservable
inputs,
when
arriving
at
fair
value.
The
Board
has
approved
the
Adviser’s
fair
valuation
procedures
as
a
part
of
the
Funds’
compliance
program
and
will
review
any
changes
made
to
the
procedures.
The
Adviser
provides
fair
valuation
inputs.
In
determining
fair
valuations,
the
Adviser
considers
a
number
of
factors
including
nature
and
duration
of
any
trading
restrictions,
trading
volume,
market
values
of
unrestricted
shares
of
the
same
or
similar
class,
investment
management’s
judgment
regarding
the
market
experience
of
the
issuer,
financial
status
and
other
operational
and
market
factors
affecting
the
issuer,
issuer’s
management,
quality
of
the
underlying
property
based
on
review
of
independent
geological
studies
and
other
relevant
matters.
The
fair
values
may
differ
from
what
would
have
been
used
had
a
broader
market
for
these
securities
existed.
The
Adviser
regularly
reviews
inputs
and
assumptions
and
performs
transactional
back-testing
and
disposition
analysis.
The
Adviser
reports
quarterly
to
the
Trust’s
Board
of
Trustees.
For
securities
traded
on
international
exchanges,
if
events
which
may
materially
affect
the
value
of
a
Fund’s
securities
occur
after
the
close
of
the
primary
exchange
and
before
a
Fund’s
net
asset
value
is
next
determined,
then
those
securities
will
be
valued
at
their
fair
value
as
determined
in
good
faith
in
accordance
with
the
policies
approved
by
the
Board
of
Trustees.
The
Adviser
uses
a
systematic
fair
value
model
provided
by
an
independent
third
party
to
value
international
securities
primarily
traded
on
an
exchange
or
market
outside
the
Western
Hemisphere
in
order
to
adjust
for
stale
pricing,
which
may
occur
between
the
close
of
certain
foreign
exchanges
and
the
New
York
Stock
Exchange.
Fair
valuation
is
based
on
subjective
factors
and,
as
a
result,
the
fair
value
price
of
an
investment
may
differ
from
the
security’s
market
price
and
may
not
be
the
price
at
which
the
asset
may
be
sold.
Fair
valuation
could
result
in
a
different
Net
Asset
Value
(“NAV”)
than
a
NAV
determined
by
using
market
quotes.
D.
Security
Transactions
and
Investment
Income
Security
transactions
are
accounted
for
on
trade
date.
Realized
gains
and
losses
from
security
transactions
are
determined
on
an
identified
cost
basis.
Dividend
income
is
recorded
on
the
ex-dividend
date
except
that
certain
dividends
from
foreign
securities
where
the
ex-dividend
Notes
to
Financial
Statements
date
may
have
passed
are
recorded
as
soon
as
the
Fund
has
confirmed
the
ex-dividend
date.
Interest
income,
which
may
include
original
issue
discount,
is
recorded
on
an
accrual
basis.
Discounts
and
premiums
on
securities
purchased
are
accreted
and
amortized,
respectively,
on
a
yield-to-worst
basis
as
adjustments
to
interest
income.
Investment
income
is
recorded
net
of
foreign
taxes
withheld
where
recovery
of
such
taxes
is
uncertain.
The
Funds
may
purchase
securities
on
a
when-issued
or
delayed-delivery
basis
and
segregate
collateral
on
their
books
with
a
value
at
least
equal
to
the
amount
of
the
commitment.
Losses
may
arise
due
to
the
changes
in
the
value
of
the
underlying
securities
or
if
the
counterparty
does
not
perform
under
the
contract.
E.
Foreign
Currency
Transactions
Some
Funds
may
invest
in
securities
of
foreign
issuers.
The
accounting
records
of
these
Funds
are
maintained
in
U.S.
dollars.
At
each
net
asset
value
determination
date,
the
value
of
assets
and
liabilities
denominated
in
foreign
currencies
are
translated
into
U.S.
dollars
using
the
current
prevailing
exchange
rate.
Security
transactions,
income
and
expenses
are
converted
at
the
prevailing
rate
of
exchange
on
the
respective
dates
of
the
transactions.
The
effect
of
changes
in
foreign
exchange
rates
on
foreign
denominated
securities
is
included
with
the
net
realized
and
unrealized
gain
or
loss
on
securities.
Other
foreign
currency
gains
or
losses
are
reported
separately.
F.
Federal
Income
Taxes
The
Funds
intend
to
continue
to
comply
with
the
requirements
of
Subchapter
M
of
the
Internal
Revenue
Code
applicable
to
regulated
investment
companies
and
to
distribute
substantially
all
of
their
taxable
income
to
shareholders.
Accordingly,
no
provision
for
federal
income
taxes
is
required.
Each
Fund
may
be
subject
to
foreign
taxes
on
income
and
gains
on
investments,
which
are
accrued
based
on
the
Fund’s
understanding
of
the
tax
rules
and
regulations
in
the
foreign
markets.
The
Funds
recognize
the
tax
benefits
of
uncertain
tax
positions
only
where
the
position
is
“more
likely
than
not”
to
be
sustained
assuming
examination
by
tax
authorities.
Management
has
analyzed
the
Funds’
tax
positions,
and
has
concluded
that
no
liability
for
unrecognized
tax
benefits
should
be
recorded
related
to
uncertain
tax
positions
taken
on
returns
filed
for
open
tax
years
or
expected
to
be
taken
in
2024
tax
returns.
The
Funds
file
U.S.
federal
and
excise
tax
returns
as
required.
The
Funds’
2021,
2022,
2023
and
2024
(when
filed)
tax
returns
are
open
to
examination
by
the
federal
and
applicable
state
tax
authorities.
The
Funds
have
no
examinations
in
progress.
G.
Dividends
and
Distributions
to
Shareholders
The
Funds
record
dividends
and
distributions
to
shareholders
on
the
ex-dividend
date.
Distributions
are
determined
in
accordance
with
income
tax
regulations,
which
may
differ
from
accounting
principles
generally
accepted
in
the
United
States.
Accordingly,
periodic
reclassifications
related
to
permanent
book
and
tax
basis
differences
are
made
within
the
Funds’
capital
accounts
to
reflect
income
and
gains
available
for
distribution
under
income
tax
regulations.
The
Funds,
except
as
noted
below,
generally
pay
income
dividends
and
distribute
capital
gains,
if
any,
annually.
The
U.S.
Government
Securities
Ultra-Short
Bond
Fund
and
the
Near-Term
Tax
Free
Fund
pay
dividends
monthly.
A
Fund
may
elect
to
designate
a
portion
of
the
earnings
and
profits
distributed
to
shareholders
on
the
redemption
of
Fund
shares
during
the
year
as
distributions
for
federal
income
tax
purposes.
Notes
to
Financial
Statements
H.
Expenses
Fund
specific
expenses
are
allocated
to
that
Fund.
Expenses
that
are
not
fund
specific
are
allocated
among
Funds.
Expense
offset
arrangements
have
been
made
with
the
Funds’
custodian
so
the
custodian
fees
may
be
paid
indirectly
by
credits
earned
on
the
Funds’
cash
balances.
Such
deposit
arrangements
are
an
alternative
to
overnight
investments.
Custodian
fees
are
presented
in
the
Statements
of
Operations
gross
of
such
credits,
and
the
credits
are
presented
as
offsets
to
expenses.
For
the
U.S.
Government
Securities
Ultra-Short
Bond
Fund,
credits
earned
on
its
cash
balance
are
included
in
interest
and
other
income.
I.
Use
of
Estimates
in
Financial
Statement
Preparation
The
Funds
are
investment
companies
accounted
for
in
conformity
with
accounting
principles
generally
accepted
in
the
United
States
of
America
(“GAAP”).
Therefore
they
follow
the
accounting
and
reporting
guidelines
for
investment
companies.
The
preparation
of
financial
statements
in
conformity
with
GAAP
requires
management
to
make
estimates
and
assumptions
that
affect
the
reported
amounts
of
assets
and
liabilities
and
disclosure
of
contingent
assets
and
liabilities
at
the
date
of
the
financial
statements
and
the
reported
amounts
of
income
and
expenses
during
the
reporting
period.
Actual
results
could
differ
from
those
estimates.
Note
2:
Financial
Derivative
Instruments
A.
Options
Contracts
Global
Luxury
Goods
Fund,
Gold
and
Precious
Metals
Fund,
Global
Resources
Fund
and
World
Precious
Minerals
Fund
(the
“Equity
Funds”)
may
purchase
or
write
(sell)
options
on
securities
to
manage
their
exposure
to
stock
or
commodity
markets
as
well
as
fluctuations
in
interest
and
currency
conversion
rates.
The
use
of
options
carries
the
risks
of
a
change
in
value
of
the
underlying
instruments,
an
illiquid
secondary
market,
or
failure
of
the
counterparty
to
perform
its
obligations.
A
put
option
gives
the
purchaser
of
the
option,
upon
payment
of
a
premium,
the
right
to
sell,
and
the
issuer
of
the
option
the
obligation
to
buy,
the
underlying
security,
commodity,
index,
currency
or
other
instrument
at
the
exercise
price.
A
call
option,
upon
payment
of
a
premium,
gives
the
purchaser
of
the
option
the
right
to
buy,
and
the
issuer
the
obligation
to
sell,
the
underlying
instrument
at
the
exercise
price.
Purchasing
a
put
option
tends
to
decrease
a
Fund’s
exposure
to
the
underlying
instrument,
whereas
purchasing
a
call
option
tends
to
increase
a
Fund’s
exposure
to
the
underlying
instrument.
A
Fund
pays
a
premium
which
is
included
in
the
Statement
of
Assets
and
Liabilities
as
an
investment
and
subsequently
marked
to
market
to
reflect
the
current
value
of
the
option.
Premiums
paid
to
purchase
options
which
expire
are
treated
as
realized
losses.
Premiums
paid
to
purchase
options
which
are
exercised
or
closed
are
added
to
the
cost
of
securities
acquired
or
the
proceeds
from
securities
sold.
The
risk
associated
with
purchasing
put
and
call
options
is
limited
to
the
premium
paid.
The
Funds
will
realize
a
loss
equal
to
all
or
a
part
of
the
premium
paid
for
an
option
if
the
price
of
the
underlying
security
or
other
instrument
decreases
or
does
not
increase
by
more
than
the
premium
(in
the
case
of
a
call
option),
or
if
the
price
of
the
underlying
security
or
other
instrument
increases
or
does
not
decrease
by
more
than
the
premium
(in
the
case
of
a
put
option).
Writing
(selling)
a
put
option
tends
to
increase
a
Fund’s
exposure
to
the
underlying
instrument,
whereas
writing
a
call
option
tends
to
decrease
a
Fund’s
exposure
to
the
Notes
to
Financial
Statements
underlying
instrument.
The
premium
received
is
recorded
as
a
liability
in
the
Statement
of
Assets
and
Liabilities
and
subsequently
marked
to
market
to
reflect
the
current
value
of
the
option
written.
Premiums
received
from
writing
options
which
expire
are
treated
as
realized
gains.
Premiums
received
from
options
which
are
exercised
or
closed
are
added
to
the
proceeds
or
offset
against
amounts
paid
on
the
underlying
transaction
to
determine
the
realized
gain
or
loss.
Written
options
include
a
risk
of
loss
in
excess
of
the
option
premium.
A
Fund
as
a
writer
of
an
option
has
no
control
over
whether
the
underlying
instrument
may
be
sold
(call)
or
purchased
(put)
and
thus
bears
the
market
risk
of
an
unfavorable
change
in
the
price
of
the
instrument
underlying
the
written
option.
There
is
also
the
risk
a
Fund
may
not
be
able
to
enter
into
a
closing
transaction
because
of
an
illiquid
market.
A
Fund’s
ability
to
close
out
its
position
as
a
purchaser
or
seller
of
a
put
or
call
option
is
dependent,
in
part,
upon
the
liquidity
of
the
market
for
that
particular
option.
There
can
be
no
guarantee
that
a
Fund
will
be
able
to
close
out
an
option
position
when
desired.
An
inability
to
close
out
its
options
positions
may
reduce
a
Fund’s
anticipated
profits
or
increase
its
losses.
As
of
December
31,
2024,
there
were
no
securities
held
in
escrow
by
the
custodian
as
cover
for
call
options
written.
B.
Forward
Foreign
Currency
Contracts
The
Funds
enter
into
forward
foreign
currency
contracts
to
lock
in
the
U.S.
dollar
cost
of
purchase
and
sale
transactions
or
to
hedge
the
portfolio
against
currency
fluctuations.
A
forward
foreign
currency
contract
is
a
commitment
to
purchase
or
sell
a
foreign
currency
at
a
future
date
at
a
negotiated
rate.
These
contracts
are
valued
daily,
and
the
Fund’s
net
equity
therein,
representing
unrealized
gain
or
loss
on
the
contracts
as
measured
by
the
difference
between
the
forward
foreign
exchange
rates
at
the
dates
of
entry
into
the
contracts
and
the
forward
rates
at
the
reporting
date,
is
included
in
the
Statement
of
Assets
and
Liabilities.
Realized
and
unrealized
gains
and
losses
are
included
in
the
Statement
of
Operations.
Risks
may
arise
upon
entering
into
these
contracts
from
the
potential
inability
of
counterparties
to
meet
the
terms
of
the
contracts
and
from
unanticipated
movements
in
the
value
of
foreign
currencies
relative
to
the
U.S.
dollar.
As
of
December
31,
2024,
there
were
no
open
forward
foreign
currency
contracts.
C.
Summary
of
Derivative
Instruments
The
following
is
a
summary
of
the
valuations
of
derivative
instruments
categorized
by
location
in
the
Statements
of
Assets
and
Liabilities
as
of
December
31,
2024:
Location
Global
Luxury
Goods
Fund
World
Precious
Minerals
Fund
Asset
derivatives
Investments,
at
value
Purchased
options
–
Equity
risk
$
55
$
350
Liability
derivatives
Written
options
–
Equity
risk
$
(23,750)
$
–
Total
$
(23,695)
$
350
Notes
to
Financial
Statements
The
following
is
a
summary
of
the
effect
of
derivative
instruments
on
the
Statements
of
Operations
as
of
December
31,
2024:
Location
Gold
and
Precious
Metals
Fund
Asset
derivatives
Investments,
at
value
Purchased
options
–
Equity
risk
$
2,000
Total
$
2,000
Location
Global
Luxury
Goods
Fund
Global
Resources
Fund
World
Precious
Minerals
Fund
Realized
gain
(loss)
on
derivatives
recognized
in
income
Realized
gain
(loss)
from
securities
Purchased
options
–
Equity
risk
$
(229,936)
$
(126,006)
$
(82,557)
Net
realized
gain
(loss)
from
Forward
currency
contracts
-
Currency
contract
risk
(90,824)
–
–
(320,760)
(126,006)
(82,557)
Change
in
unrealized
appreciation
(depreciation)
on
derivatives
recognized
in
income
Net
change
in
unrealized
appreciation
(depreciation)
of
investments
Purchased
options
-
Equity
risk
(81,344)
(54,746)
(137,380)
Net
change
in
unrealized
appreciation
(depreciation)
from
Forward
currency
contracts
–
Currency
contract
risk
126,687
–
–
Net
change
in
unrealized
appreciation
(depreciation)
from
Written
options
–
Equity
risk
23,893
–
–
69,236
(54,746)
(137,380)
Total
$
(251,524)
$
(180,752)
$
(219,937)
Location
Gold
and
Precious
Metals
Fund
Realized
gain
(loss)
on
derivatives
recognized
in
income
Realized
gain
(loss)
from
securities
Purchased
options
–
Equity
risk
$
(194,180)
Net
realized
gain
(loss)
from
Forward
currency
contracts
–
Currency
contract
risk
20
(194,160)
Change
in
unrealized
appreciation
(depreciation)
on
derivatives
recognized
in
income
Net
change
in
unrealized
appreciation
(depreciation)
of
investments
Purchased
options
–
Equity
risk
(605,318)
(605,318)
Total
$
(799,478)
Notes
to
Financial
Statements
The
total
value
of
transactions
in
purchased
options
and
forward
currency
contracts
outstanding
during
the
year
ended
December
31,
2024,
were
approximately
as
follows:
Asset
(Liability)
amounts
shown
in
the
table
below
represent
amounts
for
derivative
related
instruments
at
December
31,
2024.
These
amounts
may
be
collateralized
by
cash
or
financial
instruments.
Note
3:
Investment
Advisory
and
Other
Agreements
U.S.
Global
Investors,
Inc.
(the
“Adviser”)
is
the
investment
adviser
to
the
Funds.
Pursuant
to
an
investment
advisory
agreement
with
the
Trust
in
effect
through
October
1,
2025,
furnishes
management
and
investment
advisory
services
and,
subject
to
the
supervision
of
the
Trustees,
directs
the
investments
of
each
Fund
according
to
each
Fund’s
investment
objectives,
policies
and
limitations.
Fund
Purchased
Options
Written
Options
Forward
Currency
Contracts
Global
Luxury
Goods
Fund
$
270,897
$
(47,643)
$
20,348,899
Global
Resources
Fund
208,997
–
–
World
Precious
Minerals
Fund
190,073
–
–
Gold
and
Precious
Metals
Fund
748,132
–
8,480
Gross
Asset
(Liability)
as
Presented
in
the
Statement
of
Assets
and
Liabilities
Financial
Instruments
(Received)
Pledged*
Cash
Collateral
(Received)
Pledged*
Net
Amount
Global
Luxury
Goods
Assets:
Over-the-counter
derivatives
$
55
$
–
$
–
$
55
Liabilities:
Over-the-counter
derivatives
(23,750)
55
160
(23,535)
World
Precious
Minerals
Assets:
Over-the-counter
derivatives
350
–
–
350
Gold
and
Precious
Metals
Assets:
Over-the-counter
derivatives
2,000
–
–
2,000
*
The
actual
financial
instruments
and
cash
collateral
(received)
pledged
may
be
in
excess
of
the
amounts
shown
in
the
table.
The
table
only
reflects
collateral
amounts
up
to
the
amount
of
the
financial
instrument
disclosed
on
the
Statements
of
Assets
and
Liabilities.
**
Over-the-counter
derivatives
may
consist
of
forward
currency
contracts.
The
amounts
disclosed
above
represent
the
exposure
to
one
or
more
counterparties.
For
further
detail
on
individual
derivative
contracts,
see
the
Portfolios
of
Investments.
Notes
to
Financial
Statements
For
the
services
of
the
Adviser,
each
Fund
pays
a
base
management
or
advisory
fee
based
upon
its
net
assets.
Fees
are
accrued
daily
and
paid
monthly.
The
contractual
management
fee
for
each
Fund
is:
The
advisory
agreement
also
provides
that
the
base
advisory
fee
of
the
Equity
Funds
will
be
adjusted
upwards
or
downwards
by
0.25
percent
if
there
is
a
performance
difference
of
5
percent
or
more
between
a
Fund’s
performance
and
that
of
its
designated
benchmark
index
over
the
prior
12
months.
The
performance
adjustment
is
calculated
separately
for
each
share
class.
The
benchmarks
are
as
follows:
No
performance
adjustment
is
applied
unless
the
difference
between
the
class’s
investment
performance
and
the
benchmark
is
5
percent
or
greater
(positive
or
negative)
during
the
applicable
performance
measurement
period.
The
performance
fee
adjustment
is
calculated
monthly
in
arrears
and
is
accrued
ratably
during
the
month.
The
management
fee,
net
of
any
performance
fee
adjustment,
is
paid
monthly
in
arrears.
At
a
special
meeting
of
shareholders
of
the
World
Precious
Minerals
Fund
held
on
March
8,
2024,
the
shareholders
of
the
World
Precious
Minerals
Fund
approved
the
elimination
of
the
performance
adjustment,
effective
April
1,
2024.
At
a
special
meeting
of
the
shareholders
of
the
Global
Luxury
Goods
Fund
and
Gold
and
Precious
Metals
Fund
held
on
March
28,
2024,
the
shareholders
of
the
Global
Luxury
Goods
Fund
and
Gold
and
Precious
Metals
Fund
each
approved
the
elimination
of
the
performance
adjustment,
effective
April
1,
2024.
At
a
special
meeting
of
shareholders
of
the
Global
Resources
Fund
held
on
May
24,
2024,
the
shareholders
of
the
Global
Resources
Fund
approved
the
elimination
of
the
performance
adjustment,
effective
June
1,
2024.
The
Adviser
has
agreed
to
phase
in
the
removal
of
the
performance
adjustment
such
that,
until
12
months
after
the
elimination
of
the
performance
adjustment
was
approved
(such
phase
in
currently
expected
until
March
31,
2025
with
respect
to
World
Precious
Minerals
Fund,
Global
Luxury
Goods
Fund,
and
Gold
and
Precious
Metals
Fund,
and
until
May
31,
2025
with
respect
to
Global
Resources
Fund),
each
Fund
will
pay
advisory
fees
equal
to
the
lesser
of
the
base
rate
fee
or
the
fee
as
determined
with
the
performance
adjustment.
In
particular,
during
this
phase
in
period,
the
advisory
fee
rate
may
be
adjusted
downward
if
a
Fund’s
cumulative
performance
falls
below
the
performance
of
its
designated
benchmark
index
by
5%
or
more
but
would
not
be
correspondingly
adjusted
upward.
Fund
Average
Percentage
of
Average
Daily
Net
Assets
U.S.
Government
Securities
Ultra-Short
Bond
.50%
of
the
first
$250,000,000
and
.375%
of
the
excess
Near-Term
Tax
Free
.50%
Global
Luxury
Goods
1.00%
Global
Resources
.95%
of
the
first
$500,000,000;
.90%
of
$500,000,001
to
$1,000,000,000
and
.85%
of
the
excess
World
Precious
Minerals
1.00%
of
the
first
$500,000,000;
.95%
of
$500,000,001
to
$1,000,000,000
and
.90%
of
the
excess
Gold
and
Precious
Metals
.90%
of
the
first
$500,000,000
and
.85%
of
the
excess
Fund
Benchmark
Index
Global
Luxury
Goods
S&P
Composite
1500
TR
Index
Global
Resources
S&P
Global
Natural
Resources
Index
(Net
Total
Return)
World
Precious
Minerals
NYSE
Arca
Gold
Miners
Index
Gold
and
Precious
Metals
FTSE
Gold
Mines
Index
Note
3:
Investment
Advisory
and
Other
Agreements
Notes
to
Financial
Statements
The
amounts
shown
as
Management
fee
on
the
Statements
of
Operations
reflects
the
base
fee
plus/minus
any
performance
adjustment.
During
the
year
ended
December
31,
2024,
the
Funds
recorded
performance
adjustments
as
follows:
Atlantic
Fund
Administration,
LLC,
a
wholly
owned
subsidiary
of
Apex
US
Holdings,
LLC
(d/b/a
Apex
Fund
Services)
(“Apex”)
and
the
Adviser
act
as
co-administrators
to
the
Trust.
Apex
provides
a
Principal
Executive
Officer,
a
Principal
Financial
Officer,
a
Chief
Compliance
Officer
and
a
Anti-Money
Laundering
Officer
to
each
Fund,
as
well
as
certain
additional
compliance
and
administrative
support
functions.
Apex
also
provides
fund
accounting
services
to
each
Fund.
The
fees
related
to
these
services
are
included
in
Administration
Fees
within
the
Statement
of
Operations.
Apex
also
provides
certain
shareholder
report
production
and
EDGAR
conversion
and
filing
services.
Pursuant
to
an
Apex
services
agreement,
each
Fund
pays
Apex
customary
fees
for
its
services.
The
U.S.
Government
Securities
Ultra-Short
Bond,
Near-Term
Tax
Free,
Global
Luxury
Goods,
Global
Resources,
World
Precious
Minerals
and
Gold
and
Precious
Metals
Funds
compensate
the
Adviser
at
an
annual
rate
of
0.05%
of
the
average
daily
net
assets
of
each
Fund
for
administrative
services
provided.
The
Equity
Funds
in
the
Trust
have
adopted
a
distribution
plan
pursuant
to
Rule
12b-1
of
the
Investment
Company
Act
of
1940
in
which
the
Distributor
is
paid
a
fee
at
an
annual
rate
of
0.25%
of
the
average
daily
net
assets
of
the
Fund
for
sales
and
promotional
services
related
to
the
distribution
of
shares.
The
Adviser
has
contractually
limited
the
total
operating
expenses
of
the
Global
Luxury
Goods
Fund,
Gold
and
Precious
Metals
Fund,
World
Precious
Minerals
Fund,
and
Global
Resources
at
1.75%
on
an
annualized
basis
through
April
30,
2025.
The
Adviser
has
also
contractually
limited
the
total
operating
expenses
of
the
Near-Term
Tax
Free
Fund
at
0.45%
on
an
annual
basis
through
April
30,
2025.
The
Adviser
has
voluntarily
agreed
to
reimburse
the
U.S.
Government
Securities
Ultra-
Short
Bond
Fund
so
that
total
operating
expenses
will
not
exceed
0.45%
of
average
net
assets
through
April
30,
2025.
The
expense
limitation
will
continue
on
a
voluntary
basis
at
the
Adviser’s
discretion.
The
Adviser
may
temporarily
agree
to
additional
reimbursements
or
limitations.
Apex
is
the
transfer
agent
for
the
Funds.
Each
Fund’s
share
class
pays
an
annual
fee
based
on
the
number
of
shareholder
accounts,
certain
base
fees
and
transaction-
and
activity-based
fees
for
transfer
agency
services.
Certain
account
fees
are
paid
directly
by
shareholders
to
the
transfer
agent,
which,
in
turn,
reduces
its
charge
to
the
Funds.
Brown
Brothers
Harriman
&
Co.
(BBH)
serves
as
the
custodian.
Foreside
Fund
Services,
LLC
(the
“Distributor”),
a
wholly
owned
subsidiary
of
Foreside
Financial
Group,
LLC
(d/b/a
ACA
Group),
acts
as
the
agent
of
the
Trust
in
connection
Fund
Investor
Class
Performance
Fee
Adjustment
Global
Luxury
Goods
$
(118,654)
Global
Resources
(76,520)
World
Precious
Minerals
(106,069)
Gold
and
Precious
Metals
(19,971)
Note
3:
Investment
Advisory
and
Other
Agreements
Notes
to
Financial
Statements
with
the
continuous
offering
of
shares
of
the
Funds.
The
Distributor
continually
distributes
shares
of
the
Funds
on
a
best
efforts
basis.
Note
4:
Investments
Cost
of
purchases
and
proceeds
from
sales
of
long-term
securities
for
the
year
ended
December
31,
2024,
are
summarized
as
follows:
Note
5:
Tax
Information
The
following
table
presents
the
income
tax
basis
of
securities
owned
at
December
31,
2024,
and
the
tax
basis
components
of
net
unrealized
appreciation
(depreciation):
As
of
December
31,
2024,
the
components
of
distributable
earnings
on
a
tax
basis
were
as
follows:
Fund
Purchases
Sales
U.S.
Government
Securities
Ultra-Short
Bond
$
6,429,005
$
18,410,216
Near-Term
Tax
Free
14,278,017
11,824,224
Global
Luxury
Goods
88,840,220
91,757,373
Global
Resources
32,994,562
40,080,685
World
Precious
Minerals
12,043,786
18,198,786
Gold
and
Precious
Metals
57,792,864
71,686,051
Fund
Aggregate
Tax
Cost
Gross
Unrealized
Appreciation
Gross
Unrealized
Depreciation
Net
Unrealized
Appreciation
(Depreciation)
U.S.
Government
Securities
Ultra-Short
Bond
$
29,603,524
$
47,415
$
–
$
47,415
Near-Term
Tax
Free
23,174,313
8,754
(158,735)
(149,981)
Global
Luxury
Goods
42,635,432
6,221,142
(3,293,170)
2,927,972
Global
Resources
83,706,445
6,072,272
(55,277,202)
(49,204,930)
World
Precious
Minerals
79,267,197
4,944,696
(47,480,761)
(42,536,065)
Gold
and
Precious
Metals
80,244,883
28,647,081
(11,434,357)
17,212,724
Fund
Undistributed
Tax-Exempt
Income
Undistributed
Ordinary
Income
Undistributed
Long-Term
Capital
Gains
Capital
and
Other
Losses
U.S.
Government
Securities
Ultra-Short
Bond
$
–
$
–
$
–
$
(806,794)
Near-Term
Tax
Free
–
–
–
(2,787,568)
Global
Luxury
Goods
–
1,575,346
823,907
(1,198,760)
Global
Resources
–
430,064
–
(244,305,589)
World
Precious
Minerals
–
4,341,083
–
(362,585,406)
Gold
and
Precious
Metals
–
–
–
(60,942,466)
Note
3:
Investment
Advisory
and
Other
Agreements
Notes
to
Financial
Statements
The
differences
between
book-basis
and
tax-basis
unrealized
appreciation
(depreciation)
for
Global
Luxury
Goods,
Global
Resources,
World
Precious
Minerals
and
Gold
and
Precious
Metals
Funds
are
attributable
primarily
to
the
tax
deferral
of
losses
on
wash
sales,
investment
in
passive
foreign
investment
companies
(PFIC),
and
equity
return
of
capital.
Reclassifications
are
made
to
the
Funds’
capital
accounts
to
reflect
income
and
gains
available
for
distribution
(or
available
capital
loss
carryovers)
under
income
tax
regulations.
For
the
year
ended
December
31,
2024,
the
Funds
recorded
the
following
reclassifications
to
increase
(decrease)
the
accounts
listed
below:
The
tax
character
of
distributions
paid
during
the
fiscal
year
ended
December
31,
2024,
were
as
follows:
Fund
(continued)
Net
Unrealized
Appreciation
(Depreciation)
Other
Temporary
Differences
Total
U.S.
Government
Securities
Ultra-Short
Bond
$
47,415
$
–
$
(759,379)
Near-Term
Tax
Free
(149,981)
–
(2,937,549)
Global
Luxury
Goods
2,927,972
(5,407)
4,123,058
Global
Resources
(49,204,930)
7,548
(293,072,907)
World
Precious
Minerals
(42,536,065)
(299)
(400,780,687)
Gold
and
Precious
Metals
17,212,724
(8,698)
(43,738,440)
Fund
Distributable
Earnings
Paid
in
Capital
U.S.
Government
Securities
Ultra-Short
Bond
$
5
$
(5)
Near-Term
Tax
Free
8
(8)
Global
Luxury
Goods
–
–
Global
Resources
87
(87)
World
Precious
Minerals
–
–
Gold
and
Precious
Metals
–
–
Fund
Tax-Exempt
Income
Ordinary
Income
Long-Term
Capital
Gains
Return
of
Capital
Total
U.S.
Government
Securities
Ultra-Short
Bond
$
–
$
1,272,327
$
–
$
–
$
1,272,327
Near-Term
Tax
Free
516,001
95,264
–
–
611,265
Global
Luxury
Goods
–
2,721,384
1,816,828
–
4,538,212
Global
Resources
–
1,528,790
–
–
1,528,790
World
Precious
Minerals
–
–
–
–
–
Gold
and
Precious
Metals
–
1,523,716
–
–
1,523,716
Notes
to
Financial
Statements
The
tax
character
of
distributions
paid
during
the
fiscal
year
ended
December
31,
2023,
were
as
follows:
Capital
loss
carryforwards
may
be
used
to
offset
current
or
future
taxable
capital
gains.
The
loss
carryforwards
for
each
Fund,
as
of
December
31,
2024,
are
as
follows:
For
tax
purposes,
the
Funds
have
current
year
deferred
post
October
losses
as
follows:
These
losses
will
be
recognized
for
tax
purposes
on
the
first
day
of
the
following
tax
year.
The
Global
Luxury
Goods
Fund
has
a
Section
382
loss
limitation.
The
remaining
loss
limit
at
December
31,
2024
is
$1,198,760
and
the
yearly
amount
of
loss
that
can
be
drawn
down
or
utilized
from
this
amount
is
$117,889.
During
the
year
ended
December
31,
2024,
the
following
Funds
utilized
capital
loss
carryforwards
to
offset
capital
gains
amounting
to:
Fund
Tax-Exempt
Income
Ordinary
Income
Long-Term
Capital
Gains
Return
of
Capital
Total
U.S.
Government
Securities
Ultra-Short
Bond
$
–
$
1,170,048
$
–
$
–
$
1,170,048
Near-Term
Tax
Free
550,450
146,197
–
–
696,647
Global
Luxury
Goods
–
397,483
854,127
–
1,251,610
Global
Resources
–
–
–
–
–
World
Precious
Minerals
–
–
–
–
–
Gold
and
Precious
Metals
–
–
–
–
–
No
Expiration
Fund
Short-Term
Long-Term
Total
U.S.
Government
Securities
Ultra-Short
Bond
$
419,432
$
387,362
$
806,794
Near-Term
Tax
Free
1,041,721
1,745,847
2,787,568
Global
Luxury
Goods
1,198,760
–
1,198,760
Global
Resources
167,352,287
76,953,302
244,305,589
World
Precious
Minerals
88,150,877
274,434,529
362,585,406
Gold
and
Precious
Metals
43,112,523
17,186,045
60,298,568
Fund
Post
October
31,
2024
Capital
Loss
Deferral
Post
October
31,
2024
Ordinary
Loss
Deferral
Gold
and
Precious
Metals
$
–
$
643,898
Fund
Gold
and
Precious
Metals
$
3,958,067
Global
Luxury
Goods
117,889
Notes
to
Financial
Statements
Note
6:
Risks
of
Concentrations
and
Foreign
Investments
The
Near-Term
Tax
Free
Fund
may
be
exposed
to
risks
related
to
concentration
of
investments
in
a
particular
state
or
geographic
area.
These
investments
present
risks
resulting
from
changes
in
economic
conditions
of
the
region
or
the
issuer.
The
Global
Resources
Fund
concentrates
its
investments
in
the
natural
resources
industries
and
may
be
subject
to
greater
risks
and
fluctuations
than
a
portfolio
representing
a
broader
range
of
industries.
The
World
Precious
Minerals
and
Gold
and
Precious
Metals
Funds
concentrate
their
investments
in
gold
and
other
precious
metals
and
minerals
and,
therefore,
may
be
subject
to
greater
risks
and
market
fluctuations
than
a
portfolio
representing
a
broader
range
of
industries.
The
funds
invest
in
securities
that
typically
respond
to
changes
in
the
price
of
gold
and
other
precious
metals
and
minerals,
which
can
be
influenced
by
a
variety
of
global
economic,
financial
and
political
factors;
increased
environmental
and
labor
costs
in
mining;
and
changes
in
laws
relating
to
mining
or
gold
production
or
sales.
Fluctuations
in
the
prices
of
gold
and
other
precious
metals
and
minerals
will
affect
the
market
values
of
the
securities
held
by
these
funds.
Note
7:
Credit
Arrangements
Each
of
the
Funds
has
an
uncommitted
credit
facility
with
BBH,
which
will
remain
in
effect
through
at
least
April
19,
2025.
The
continuance
of
the
credit
facility
with
BBH
is
subject
to
annual
renewal
by
the
Board.
On
April
24,
2019,
the
Adviser
opted
to
convert
the
committed
line
of
credit
into
an
uncommitted
line
of
credit.
As
a
result,
the
Adviser
is
no
longer
obligated
to
pay
commitment
fees
to
BBH.
Borrowings
of
each
Fund
are
collateralized
by
any
or
all
of
the
securities
held
by
BBH
as
the
Funds’
custodian
up
to
the
amount
of
the
borrowing.
Interest
on
borrowings
is
charged
at
the
current
overnight
Federal
Funds
Rate
plus
2
percent.
Each
Fund
has
a
maximum
borrowing
limit
of
10
percent
of
qualified
assets.
The
aggregate
of
borrowings
by
all
Funds
under
the
agreement
cannot
exceed
$10,000,000
at
any
one
time.
There
were
no
borrowings
under
the
credit
facility
during
the
year
ended
December
31,
2024.
Note
8:
Commitments
and
Contingencies
In
the
normal
course
of
business,
each
Fund
enters
into
contracts
that
provide
general
indemnifications
by
each
Fund
to
the
counterparty
to
the
contract.
Each
Fund’s
maximum
exposure
under
these
arrangements
is
dependent
on
future
claims
that
may
be
made
against
each
Fund
and,
therefore,
cannot
be
estimated;
however,
based
on
experience,
the
risk
of
loss
from
such
claims
is
considered
remote.
Each
Fund
has
determined
that
none
of
these
arrangements
requires
disclosure
on
each
Fund’s
Statement
of
Assets
and
Liabilities.
Note
9:
Subsequent
Events
Subsequent
events
occurring
after
the
date
of
this
report
through
the
date
these
financial
statements
were
issued
have
been
evaluated
for
potential
impact,
and
the
Funds
have
had
not
such
events.
Management
has
evaluated
the
need
for
additional
disclosures
and/
or
adjustments
resulting
from
subsequent
events.
Based
on
this
evaluation,
no
additional
disclosures
or
adjustments
were
required
to
the
financial
statements
as
of
the
date
the
financial
statements
were
issued.
U.S.
Government
Securities
Ultra-Short
Bond
Fund
For
a
capital
share
outstanding
during
the
See
accompanying
notes
to
financial
statements.
Ratios
to
Average
Net
Assets:
Year
Ended
December
31,
2024
2023
2022
2021
2020
Net
asset
value,
beginning
of
year
$
1.95
$
1.94
$
1.99
$
2.00
$
2.00
Investment
Activities
Net
investment
income
(loss)
*
0.08
0.07
0.02
(0.01
)
0.00
(a)
Net
realized
and
unrealized
gain
(loss)
(0.00
)
(a)
0.01
(0.05
)
(0.00
)
(a)
0.01
Total
from
investment
activities
0.08
0.08
(0.03
)
(0.01
)
0.01
Distributions
From
net
investment
income
(0.08
)
(0.07
)
(0.02
)
–
(0.01
)
From
net
realized
gains
–
–
(0.00
)
(a)
(0.00
)
(a)
–
Net
asset
value,
end
of
year
$
1.95
$
1.95
$
1.94
$
1.99
$
2.00
Total
Return
(b)
4.31
%
4.17
%
(1.66
)%
(0.44
)%
0.32
%
Ratios
to
Average
Net
Assets:
Net
investment
income
(loss)
4.20
%
3.56
%
0.82
%
(0.32
)%
0.24
%
Total
expenses
1.30
%
1.17
%
1.13
%
1.06
%
1.05
%
Expenses
waived
or
reimbursed
(c)
(0.85
)%
(0.72
)%
(0.68
)%
(0.61
)%
(0.60
)%
Net
expenses
(d)
0.45
%
0.45
%
0.45
%
0.45
%
0.45
%
Portfolio
turnover
rate
38
%
143
%
46
%
78
%
127
%
Net
assets,
end
of
year
(in
thousands)
$29,921
$31,328
$34,117
$38,004
$40,262
*
Based
on
average
shares
outstanding.
(a)
The
per
share
amount
does
not
round
to
a
full
penny.
(b)
Assumes
investment
at
the
net
asset
value
at
the
beginning
of
the
period,
reinvestment
of
all
distributions
and
a
complete
redemption
of
the
investment
at
the
net
asset
value
at
the
end
of
the
period.
(c)
Expenses
waived
or
reimbursed
reflect
reductions
to
total
expenses,
as
discussed
in
the
notes
to
the
financial
statements.
These
amounts
would
increase
the
net
investment
loss
ratio
or
decrease
the
net
investment
income
ratio,
as
applicable,
and
decrease
the
total
returns
had
such
reductions
not
occurred.
(d)
The
net
expense
ratios
shown
above
reflect
expenses
after
waivers
and
reimbursements
and
include
the
effect
of
reductions
to
total
expenses
for
any
expenses
offset.
Expense
offset
arrangements
reduce
total
expenses,
as
discussed
in
the
notes
to
the
financial
statements.
These
amounts
would
decrease
the
net
investment
income
(loss)
ratio
had
such
reductions
not
occurred.
The
effect
of
expenses
offset
are
as
follows:
Near-Term
Tax
Free
Fund
For
a
capital
share
outstanding
during
the
See
accompanying
notes
to
financial
statements.
Ratios
to
Average
Net
Assets:
Year
Ended
December
31,
2024
2023
2022
2021
2020
Net
asset
value,
beginning
of
year
$
2.10
$
2.09
$
2.23
$
2.26
$
2.22
Investment
Activities
Net
investment
income
*
0.05
0.05
0.02
0.02
0.02
Net
realized
and
unrealized
gain
(loss)
(0.01
)
0.01
(0.14
)
(0.03
)
0.04
Total
from
investment
activities
0.04
0.06
(0.12
)
(0.01
)
0.06
Distributions
From
net
investment
income
(0.05
)
(0.05
)
(0.02
)
(0.02
)
(0.02
)
Net
asset
value,
end
of
year
$
2.09
$
2.10
$
2.09
$
2.23
$
2.26
Total
Return
(a)
1.99
%
3.04
%
(5.23
)%
(0.46
)%
2.93
%
Ratios
to
Average
Net
Assets:
Net
investment
income
2.44
%
2.42
%
1.08
%
0.86
%
1.11
%
Total
expenses
1.42
%
1.29
%
1.20
%
1.13
%
1.09
%
Expenses
waived
or
reimbursed
(b)
(0.97
)%
(0.84
)%
(0.75
)%
(0.68
)%
(0.64
)%
Net
expenses
(c)
0.45
%
0.45
%
0.45
%
0.45
%
0.45
%
Portfolio
turnover
rate
53
%
14
%
57
%
20
%
20
%
Net
assets,
end
of
year
(in
thousands)
$23,458
$25,394
$30,878
$35,389
$41,762
*
Based
on
average
shares
outstanding.
(a)
Assumes
investment
at
the
net
asset
value
at
the
beginning
of
the
period,
reinvestment
of
all
distributions
and
a
complete
redemption
of
the
investment
at
the
net
asset
value
at
the
end
of
the
period.
(b)
Expenses
waived
or
reimbursed
reflect
reductions
to
total
expenses,
as
discussed
in
the
notes
to
the
financial
statements.
These
amounts
would
increase
the
net
investment
loss
ratio
or
decrease
the
net
investment
income
ratio,
as
applicable,
and
decrease
the
total
returns
had
such
reductions
not
occurred.
(c)
The
net
expense
ratios
shown
above
reflect
expenses
after
waivers
and
reimbursements
and
include
the
effect
of
reductions
to
total
expenses
for
any
expenses
offset.
Expense
offset
arrangements
reduce
total
expenses,
as
discussed
in
the
notes
to
the
financial
statements.
These
amounts
would
decrease
the
net
investment
income
(loss)
ratio
had
such
reductions
not
occurred.
The
effect
of
expenses
offset
are
as
follows:
(d)
Effect
on
the
expense
ratio
was
not
greater
than
0.005%.
Global
Luxury
Goods
Fund
For
a
capital
share
outstanding
during
the
See
accompanying
notes
to
financial
statements.
Ratios
to
Average
Net
Assets:
Year
Ended
December
31,
2024
2023
2022
2021
2020
Net
asset
value,
beginning
of
year
$
19.22
$
15.95
$
22.30
$
20.59
$
17.09
Investment
Activities
Net
investment
income
(loss)
*
0.14
0.12
0.36
(0.14
)
(0.04
)
Net
realized
and
unrealized
gain
(loss)
2.60
3.67
(5.69
)
5.28
3.56
Total
from
investment
activities
2.74
3.79
(5.33
)
5.14
3.52
Distributions
From
net
investment
income
(0.13
)
(0.01
)
(0.57
)
(0.21
)
(0.02
)
From
net
realized
gains
(1.86
)
(0.51
)
(0.45
)
(3.22
)
–
Net
asset
value,
end
of
year
$
19.97
$
19.22
$
15.95
$
22.30
$
20.59
Total
Return
(a)
14.22
%
23.75
%
(23.88
)%
25.02
%
20.62
%
Ratios
to
Average
Net
Assets:
Net
investment
income
(loss)
0.68
%
0.64
%
2.03
%
(0.60
)%
(0.25
)%
Total
expenses
1.71
%
2.05
%
1.75
%
1.99
%
1.76
%
Expenses
waived
or
reimbursed
(b)
(0.20
)%
(0.18
)%
(0.20
)%
(0.06
)%
(0.01
)%
Net
expenses
(c)
1.51
%
1.87
%
1.55
%
1.93
%
1.75
%
Portfolio
turnover
rate
195
%
195
%
248
%
177
%
308
%
Net
assets,
end
of
year
(in
thousands)
$49,610
$47,245
$40,321
$57,667
$49,567
*
Based
on
average
shares
outstanding.
(a)
Assumes
investment
at
the
net
asset
value
at
the
beginning
of
the
period,
reinvestment
of
all
distributions
and
a
complete
redemption
of
the
investment
at
the
net
asset
value
at
the
end
of
the
period.
(b)
Expenses
waived
or
reimbursed
reflect
reductions
to
total
expenses,
as
discussed
in
the
notes
to
the
financial
statements.
These
amounts
would
increase
the
net
investment
loss
ratio
or
decrease
the
net
investment
income
ratio,
as
applicable,
and
decrease
the
total
returns
had
such
reductions
not
occurred.
(c)
The
net
expense
ratios
shown
above
reflect
expenses
after
waivers
and
reimbursements
and
include
the
effect
of
reductions
to
total
expenses
for
any
expenses
offset.
Expense
offset
arrangements
reduce
total
expenses,
as
discussed
in
the
notes
to
the
financial
statements.
These
amounts
would
decrease
the
net
investment
income
(loss)
ratio
had
such
reductions
not
occurred.
The
effect
of
expenses
offset
are
as
follows:
(d)
Effect
on
the
expense
ratio
was
not
greater
than
0.005%.
Global
Resources
Fund
For
a
capital
share
outstanding
during
the
See
accompanying
notes
to
financial
statements.
Ratios
to
Average
Net
Assets:
Year
Ended
December
31,
2024
2023
2022
2021
2020
Net
asset
value,
beginning
of
year
$
3.97
$
4.30
$
5.67
$
5.97
$
4.61
Investment
Activities
Net
investment
income
(loss)
*
0.01
0.01
0.01
(0.01
)
0.01
Net
realized
and
unrealized
gain
(loss)
(0.16
)
(0.34
)
(0.71
)
0.78
1.68
Total
from
investment
activities
(0.15
)
(0.33
)
(0.70
)
0.77
1.69
Distributions
From
net
investment
income
(0.16
)
–
(0.67
)
(1.07
)
(0.33
)
Net
asset
value,
end
of
year
$
3.66
$
3.97
$
4.30
$
5.67
$
5.97
Total
Return
(a)
(3.73
)%
(7.67
)%
(12.10
)%
13.43
%
37.17
%
Ratios
to
Average
Net
Assets:
Net
investment
income
(loss)
0.22
%
0.35
%
0.25
%
(0.22
)%
0.22
%
Total
expenses
2.04
%
1.69
%
1.60
%
1.90
%
2.09
%
Expenses
waived
or
reimbursed
(b)
(0.47
)%
(0.22
)%
(0.06
)%
–
(0.06
)%
Net
expenses
(c)
1.57
%
1.47
%
1.54
%
1.90
%
2.03
%
Portfolio
turnover
rate
85
%
84
%
46
%
135
%
105
%
Net
assets,
end
of
year
(in
thousands)
$36,537
$45,339
$55,053
$67,821
$63,891
*
Based
on
average
shares
outstanding.
(a)
Assumes
investment
at
the
net
asset
value
at
the
beginning
of
the
period,
reinvestment
of
all
distributions
and
a
complete
redemption
of
the
investment
at
the
net
asset
value
at
the
end
of
the
period.
(b)
Expenses
waived
or
reimbursed
reflect
reductions
to
total
expenses,
as
discussed
in
the
notes
to
the
financial
statements.
These
amounts
would
increase
the
net
investment
loss
ratio
or
decrease
the
net
investment
income
ratio,
as
applicable,
and
decrease
the
total
returns
had
such
reductions
not
occurred.
(c)
The
net
expense
ratios
shown
above
reflect
expenses
after
waivers
and
reimbursements
and
include
the
effect
of
reductions
to
total
expenses
for
any
expenses
offset.
Expense
offset
arrangements
reduce
total
expenses,
as
discussed
in
the
notes
to
the
financial
statements.
These
amounts
would
decrease
the
net
investment
income
(loss)
ratio
had
such
reductions
not
occurred.
The
effect
of
expenses
offset
are
as
follows:
(d)
Effect
on
the
expense
ratio
was
not
greater
than
0.005%.
World
Precious
Minerals
Fund
For
a
capital
share
outstanding
during
the
See
accompanying
notes
to
financial
statements.
Ratios
to
Average
Net
Assets:
Year
Ended
December
31,
2024
2023
2022
2021
2020
Net
asset
value,
beginning
of
year
$
1.45
$
1.73
$
2.58
$
5.26
$
3.31
Investment
Activities
Net
investment
loss
*
(0.01
)
(0.01
)
(0.03
)
(0.09
)
(0.07
)
Net
realized
and
unrealized
gain
(loss)
0.05
(0.27
)
(0.82
)
(0.74
)
2.38
Total
from
investment
activities
0.04
(0.28
)
(0.85
)
(0.83
)
2.31
Distributions
From
net
investment
income
–
–
–
(1.85
)
(0.36
)
Net
asset
value,
end
of
year
$
1.49
$
1.45
$
1.73
$
2.58
$
5.26
Total
Return
(a)
2.76
%
(16.18
)%
(32.95
)%
(14.19
)%
70.60
%
Ratios
to
Average
Net
Assets:
Net
investment
loss
(0.72
)%
(0.90
)%
(1.31
)%
(1.77
)%
(1.77
)%
Total
expenses
1.92
%
1.74
%
1.62
%
1.93
%
1.81
%
Expenses
waived
or
reimbursed
(b)
(0.43
)%
(0.27
)%
(0.09
)%
–
–
Net
expenses
(c)
1.49
%
1.47
%
1.53
%
1.93
%
1.81
%
Portfolio
turnover
rate
31
%
21
%
25
%
41
%
34
%
Net
assets,
end
of
year
(in
thousands)
$37,116
$42,744
$54,500
$89,313
$116,247
*
Based
on
average
shares
outstanding.
(a)
Assumes
investment
at
the
net
asset
value
at
the
beginning
of
the
period,
reinvestment
of
all
distributions
and
a
complete
redemption
of
the
investment
at
the
net
asset
value
at
the
end
of
the
period.
(b)
Expenses
waived
or
reimbursed
reflect
reductions
to
total
expenses,
as
discussed
in
the
notes
to
the
financial
statements.
These
amounts
would
increase
the
net
investment
loss
ratio
or
decrease
the
net
investment
income
ratio,
as
applicable,
and
decrease
the
total
returns
had
such
reductions
not
occurred.
(c)
The
net
expense
ratios
shown
above
reflect
expenses
after
waivers
and
reimbursements
and
include
the
effect
of
reductions
to
total
expenses
for
any
expenses
offset.
Expense
offset
arrangements
reduce
total
expenses,
as
discussed
in
the
notes
to
the
financial
statements.
These
amounts
would
decrease
the
net
investment
income
(loss)
ratio
had
such
reductions
not
occurred.
The
effect
of
expenses
offset
are
as
follows:
(d)
Effect
on
the
expense
ratio
was
not
greater
than
0.005%.
Gold
and
Precious
Metals
Fund
For
a
capital
share
outstanding
during
the
See
accompanying
notes
to
financial
statements.
Ratios
to
Average
Net
Assets:
Year
Ended
December
31,
2024
2023
2022
2021
2020
Net
asset
value,
beginning
of
year
$
9.90
$
9.75
$
11.81
$
13.53
$
10.14
Investment
Activities
Net
investment
income
(loss)
*
0.02
0.04
(0.01
)
(0.01
)
(0.09
)
Net
realized
and
unrealized
gain
(loss)
1.63
0.11
(2.05
)
(1.46
)
3.84
Total
from
investment
activities
1.65
0.15
(2.06
)
(1.47
)
3.75
Distributions
From
net
investment
income
(0.17
)
–
–
(0.25
)
(0.36
)
Net
asset
value,
end
of
year
$
11.38
$
9.90
$
9.75
$
11.81
$
13.53
Total
Return
(a)
16.65
%
1.54
%
(17.44
)%
(10.82
)%
37.06
%
Ratios
to
Average
Net
Assets:
Net
investment
income
(loss)
0.16
%
0.38
%
(0.11
)%
(0.07
)%
(0.82
)%
Total
expenses
1.71
%
1.48
%
1.55
%
1.82
%
1.60
%
Expenses
waived
or
reimbursed
(b)
(0.02
)%
(0.02
)%
(0.03
)%
–
(0.01
)%
Net
expenses
(c)
1.69
%
1.46
%
1.52
%
1.82
%
1.59
%
Portfolio
turnover
rate
58
%
50
%
55
%
56
%
37
%
Net
assets,
end
of
year
(in
thousands)
$103,640
$97,902
$110,089
$141,228
$160,318
*
Based
on
average
shares
outstanding.
(a)
Assumes
investment
at
the
net
asset
value
at
the
beginning
of
the
period,
reinvestment
of
all
distributions
and
a
complete
redemption
of
the
investment
at
the
net
asset
value
at
the
end
of
the
period.
(b)
Expenses
waived
or
reimbursed
reflect
reductions
to
total
expenses,
as
discussed
in
the
notes
to
the
financial
statements.
These
amounts
would
increase
the
net
investment
loss
ratio
or
decrease
the
net
investment
income
ratio,
as
applicable,
and
decrease
the
total
returns
had
such
reductions
not
occurred.
(c)
The
net
expense
ratios
shown
above
reflect
expenses
after
waivers
and
reimbursements
and
include
the
effect
of
reductions
to
total
expenses
for
any
expenses
offset.
Expense
offset
arrangements
reduce
total
expenses,
as
discussed
in
the
notes
to
the
financial
statements.
These
amounts
would
decrease
the
net
investment
income
(loss)
ratio
had
such
reductions
not
occurred.
The
effect
of
expenses
offset
are
as
follows:
(d)
Effect
on
the
expense
ratio
was
not
greater
than
0.005%.
Report
of
Independent
Registered
Public
Accounting
Firm
To
the
Board
of
Trustees
and
Shareholders
of
U.S.
Global
Investors
Funds
Opinion
on
the
Financial
Statements
We
have
audited
the
accompanying
statements
of
assets
and
liabilities,
including
the
portfolios
of
investments,
of
U.S.
Government
Securities
Ultra-Short
Bond
Fund,
Near-Term
Tax
Free
Fund,
Global
Luxury
Goods
Fund,
Global
Resources
Fund,
World
Precious
Minerals
Fund,
and
Gold
and
Precious
Metals
Fund,
each
a
series
of
shares
of
beneficial
interest
in
U.S.
Global
Investors
Funds
(the
“Funds”)
as
of
December
31,
2024,
the
related
statements
of
operations
for
the
year
then
ended,
the
statements
of
changes
in
net
assets
and
financial
highlights
for
each
of
the
two
years
in
the
period
then
ended,
and
the
related
notes
(collectively
referred
to
as
the
“financial
statements”).
In
our
opinion,
the
financial
statements
present
fairly,
in
all
material
respects,
the
financial
position
of
each
of
the
Funds
as
of
December
31,
2024,
the
results
of
their
operations
for
the
year
then
ended,
and
the
changes
in
net
assets
and
financial
highlights
for
each
of
the
two
years
in
the
period
then
ended,
in
conformity
with
accounting
principles
generally
accepted
in
the
United
States
of
America.
The
Funds’
financial
highlights
for
the
years
ended
December
31,
2022,
and
prior,
were
audited
by
other
auditors
whose
report
dated
February
28,
2023,
expressed
an
unqualified
opinion
on
those
financial
statements
and
financial
highlights.
Basis
for
Opinion
These
financial
statements
are
the
responsibility
of
the
Funds’
management.
Our
responsibility
is
to
express
an
opinion
on
the
Funds’
financial
statements
based
on
our
audits.
We
are
a
public
accounting
firm
registered
with
the
Public
Company
Accounting
Oversight
Board
(United
States)
(“PCAOB”)
and
are
required
to
be
independent
with
respect
to
the
Funds
in
accordance
with
the
U.S.
federal
securities
laws
and
the
applicable
rules
and
regulations
of
the
Securities
and
Exchange
Commission
and
the
PCAOB.
We
conducted
our
audits
in
accordance
with
the
standards
of
the
PCAOB.
Those
standards
require
that
we
plan
and
perform
the
audit
to
obtain
reasonable
assurance
about
whether
the
financial
statements
are
free
of
material
misstatement
whether
due
to
error
or
fraud.
Our
audits
included
performing
procedures
to
assess
the
risks
of
material
misstatement
of
the
financial
statements,
whether
due
to
error
or
fraud,
and
performing
procedures
that
respond
to
those
risks.
Such
procedures
included
examining,
on
a
test
basis,
evidence
regarding
the
amounts
and
disclosures
in
the
financial
statements.
Our
procedures
included
confirmation
of
securities
owned
as
of
December
31,
2024,
by
correspondence
with
the
custodian,
issuer
and
brokers;
when
replies
were
not
received
from
brokers,
we
performed
other
auditing
procedures.
Our
audits
also
included
evaluating
the
accounting
principles
used
and
significant
estimates
made
by
management,
as
well
as
evaluating
the
overall
presentation
of
the
financial
statements.
We
believe
that
our
audits
provide
a
reasonable
basis
for
our
opinion.
We
have
served
as
the
Funds’
auditor
since
2023.
COHEN
&
COMPANY,
LTD.
Philadelphia,
Pennsylvania
February
27,
2025
Important
Tax
Information
(
unaudited
)
The
percentage
of
tax-exempt
dividends
paid
by
the
Near-Term
Tax
Free
Fund
for
the
year
ended
December
31,
2024,
was
84.42%.
The
percentage
of
ordinary
income
dividends
paid
by
the
Funds
during
the
year
ended
December
31,
2024,
which
qualify
as
Qualified
Dividends
Income
(QDI)
and
the
Dividends
Received
Deduction
(DRD)
available
to
corporate
shareholders
was:
The
amounts
which
represent
foreign
source
income
and
foreign
taxes
paid
during
the
year
ended
December
31,
2024,
are
as
follows:
Qualified
Dividend
Income
Dividend
Received
Deduction
Qualified
Investment
Income
Qualified
Short
Term
Gain
Dividends
U.S.
Government
Securities
Ultra-Short
Bond
–%
–%
93.38%
–%
Near-Term
Tax
Free
–%
–%
9.84%
–%
Global
Luxury
Goods
35.78%
5.79%
3.98%
89.46%
Global
Resources
19.10%
10.69%
4.29%
–%
Gold
and
Precious
Metals
43.35%
3.53%
11.14%
–%
Foreign
Source
Income
Foreign
Tax
Credit
Global
Luxury
Goods
$
925,713
$
129,800
Global
Resources
496,276
94,504
Gold
and
Precious
Metals
1,790,030
97,215
Other
Information
(
unaudited
)
Changes
in
and
Disagreements
with
Accountants
(Item
8
of
Form
N-CSR)
N/A
Proxy
Disclosure
(Item
9
of
Form
N-CSR)
N/A
Remuneration
Paid
to
Directors,
Officers,
and
Others
(Item
10
of
Form
N-CSR)
Please
see
financial
statements
in
Item
7.
Statement
Regarding
the
Basis
for
the
Board’s
Approval
of
Investment
Advisory
Contract
(Item
11
of
Form
N-CSR)
At
the
September
19,
2024
Board
meeting
(“September
meeting”),
the
Board
of
Trustees
(the
“Board”)
of
U.S.
Global
Investors
Funds
(the
“Trust”),
including
all
the
trustees
who
are
not
“interested
persons”
of
the
Trust
(the
“Independent
Trustees”),
met
and
considered
the
approval
of
the
continuance
of
the
investment
advisory
agreement
between
U.S.
Global
Investors,
Inc.
(the
“Adviser”)
and
the
Trust
(the
“Advisory
Agreement”),
on
behalf
of
each
series
of
the
Trust
(each,
a
“Fund”
and
together,
the
“Funds”)
for
an
additional
one-year
term.
In
preparation
for
its
deliberations,
the
Board
requested
and
reviewed
written
responses
from
the
Adviser
to
a
due
diligence
questionnaire
circulated
on
the
Board's
behalf
concerning
the
Adviser’s
personnel,
operations,
financial
condition,
projected
performance,
and
the
services
to
be
provided
by
the
Adviser
to
each
Fund.
During
its
deliberations,
the
Board
received
an
presentation
from
senior
representatives
of
the
Adviser
and
discussed
the
materials
with
the
Adviser,
independent
legal
counsel
to
the
Independent
Trustees
(“Independent
Legal
Counsel”)
and,
as
necessary,
with
the
Trust’s
administrator.
The
Independent
Trustees
also
met
in
executive
session
with
Independent
Legal
Counsel
while
deliberating.
At
the
September
meeting,
the
Board
reviewed,
among
other
matters,
the
topics
discussed
below:
Nature,
Extent
and
Quality
of
Services
Based
on
written
materials
received
from
the
Adviser,
a
presentation
from
senior
representatives
of
the
Adviser,
and
a
discussion
with
the
Adviser
about
the
Adviser’s
personnel,
operations
and
financial
condition,
the
Board
considered
the
quality
of
services
provided
by
the
Adviser
under
the
Advisory
Agreement.
In
this
regard,
the
Board
considered
information
regarding,
among
other
things,
the
experience,
qualifications
and
professional
background
of
the
portfolio
managers
and
other
personnel
at
the
Adviser
with
principal
responsibility
for
the
Funds’
investments;
the
investment
philosophy
and
decision-making
process
of
those
professionals;
the
capability
and
integrity
of
the
Adviser’s
senior
management
and
staff;
and
the
quality
of
the
Adviser’s
services
with
respect
to
regulatory
compliance.
The
Board
also
considered
the
adequacy
of
the
Adviser’s
resources.
The
Board
noted
the
Adviser’s
representation
that
the
firm
is
financially
stable
and
has
the
operational
capability
needed
to
provide
high-quality
investment
advisory
services
to
the
Funds.
Based
on
the
presentation
and
the
materials
provided
by
the
Adviser,
the
Board
concluded
that,
overall,
it
was
satisfied
with
the
nature,
extent
and
quality
of
services
provided
to
the
Funds
by
the
Adviser
under
the
Advisory
Agreement.
Other
Information
(
unaudited
)
Performance
In
connection
with
a
presentation
by
the
Adviser
regarding
its
approach
to
managing
the
Funds,
including
the
investment
objective
and
strategy
of
each
Fund,
the
Board
reviewed
the
performance
of
each
Fund
compared
to
their
respective
benchmarks
and
compared
to
independent
peer
groups
of
funds
identified
by
Strategic
Insight,
Inc.
(“Strategic
Insight”)
as
having
characteristics
similar
to
those
of
the
Funds.
With
respect
to
performance,
the
Board
noted
the
Adviser’s
overall
representation
that
the
Funds’
relatively
small
asset
size
meant
that
fund
expenses
also
served
as
a
disproportionate
drag
on
performance
relative
to
the
larger
peers
in
each
Fund’s
respective
Strategic
Insight
peer
group.
Global
Luxury
Goods
Fund
For
the
Global
Luxury
Goods
Fund,
the
information
presented
showed
that
the
Fund
outperformed
the
S&P
Global
Luxury
Index
for
each
of
the
one-
and
three-year
periods
ended
June
30,
2024,
and
underperformed
the
S&P
Global
Luxury
Index
for
the
five-
and
10-year
periods
ended
June
30,
2024.
The
information
presented
also
showed
that
the
Global
Luxury
Goods
Fund
underperformed
each
of
the
S&P
500
Index
and
the
S&P
Composite
1500
Total
Return
Index
for
each
of
the
one-,
three-,
five-,
and
10-year
periods
ended
June
30,
2024.
The
information
presented
further
showed
that
the
Global
Luxury
Goods
Fund
underperformed
the
average
of
its
Strategic
Insight
peer
group
for
the
one-,
five-,
and
10-year
periods
ended
June
30,
2024,
and
outperformed
the
average
of
its
Strategic
Insight
peer
group
for
the
three-
year
period
ended
June
30,
2024.
With
respect
to
the
Global
Luxury
Goods
Fund’s
performance
relative
to
the
benchmark
indices,
the
Board
noted
the
Adviser’s
representation
that
the
Global
Luxury
Goods
Fund
had
only
been
operating
under
its
new
luxury
goods-oriented
investment
strategy
since
July
2020
and
that
earlier
periods
of
performance
reflected
the
performance
of
the
predecessor
investment
strategy.
The
Board
also
noted
the
Adviser’s
representation
that
the
Fund’s
performance
more
closely
approximated
that
of
the
S&P
Global
Luxury
Index,
which
the
Adviser
believed
to
align
more
closely
with
the
Fund’s
investment
strategies
than
the
S&P
500
Index
or
the
S&P
Composite
1500
Index,
given
the
similarities
between
the
Global
Luxury
Goods
Fund’s
portfolio
and
the
constituents
of
the
S&P
Global
Luxury
Index.
The
Board
noted
the
Adviser’s
representation
that
the
Global
Luxury
Goods
Fund’s
underperformance
over
the
longer-term
relative
to
the
Strategic
Insight
peers
could
be
attributed,
at
least
in
part,
to
differences
in
the
Global
Luxury
Goods
Fund’s
investment
strategy
compared
to
those
of
the
peers.
Specifically,
the
Board
noted
the
Adviser’s
representation
that
the
funds
in
the
Strategic
Insight
peer
group
employed
broad,
large
capitalization
growth
strategies
and,
although
some
of
the
peer
funds
appeared
to
have
above-average
allocations
to
the
consumer
discretionary
sector,
the
peer
funds
did
not
appear
to
be
subject
to
the
same
investment
constraints
as
the
Global
Luxury
Goods
Fund
with
respect
to
luxury
goods
investments
and
did
not
approach
the
levels
of
consumer
discretionary
investment
exposure
in
the
Global
Luxury
Goods
Fund
portfolio.
Global
Resources
Fund
For
the
Global
Resources
Fund,
the
information
presented
showed
that
the
Fund
underperformed
each
of
the
S&P
500
Index
and
Global
Natural
Resources
Index
for
the
one-,
Other
Information
(
unaudited
)
three-,
five-,
and
10-year
periods
ended
June
30,
2024.
The
information
presented
also
showed
that
the
Fund
underperformed
the
average
of
its
Strategic
Insight
peer
group
for
the
one-,
three-,
five-,
and
10-year
periods
ended
June
30,
2024.
The
Board
noted
the
Adviser’s
representation
that
the
Fund’s
underperformance
relative
to
the
peers
and
benchmark
the
one-
and
three-year
periods
was
attributable,
at
least
in
part,
to
the
Fund’s
underweight
exposure
to
conventional
energy
in
favor
of
clean
and
renewable
energy
companies,
and
that,
in
the
past
year,
particularly
from
June
30,
2023
to
mid-November
2023,
the
Global
Resources
Fund
underperformed
when
the
copper
market
was
in
decline.
The
Board
also
noted
the
Adviser’s
representation
that,
although
the
Fund’s
holdings
in
small-
and
micro-capitalized
junior
mining
companies
were
a
drag
on
relative
performance
and
disproportionately
impacted
longer
term
performance,
the
Fund
had
increased
its
exposure
to
higher-capitalization
natural
resources
companies
during
the
preceding
six
months
and
that
the
Fund
was
performing
in
line
with
the
S&P
Global
Natural
Resources
Index
for
the
six-
month
period
ended
June
30,
2024.
Gold
and
Precious
Metals
Fund
For
the
Gold
and
Precious
Metals
Fund,
the
information
presented
showed
that
the
Fund
underperformed
the
S&P
500
Index
for
the
one-,
three-,
and
five-,
and
10-year
periods
ended
June
30,
2024.
The
information
presented
also
showed
that
the
Fund
outperformed
the
FTSE
Gold
Mines
Index
for
one-,
five-,
and
10-year
periods
ended
June
30,
2024
and
underperformed
the
FTSE
Gold
Mines
Index
for
the
three-year
period
ended
June
30,
2024.
The
information
presented
showed
that
the
Fund
outperformed
the
average
of
its
Strategic
Insight
peers
for
the
one-,
five-,
and
10-year
periods
ended
June
30,
2024
and
underperformed
the
average
of
its
Strategic
Insight
peers
for
the
three--year
period
ended
June
30,
2024.
The
Board
observed
that
the
Gold
and
Precious
Metals
Fund
changed
its
primary
benchmark
index
from
the
FTSE
Gold
Mines
Index
to
the
S&P
500
Index,
effective
May
1,
2024,
due
to
regulatory
requirements
and
that
the
Fund
retained
FTSE
Gold
Mines
Index
as
a
secondary
benchmark
index
because
the
FTSE
Gold
Mines
Index
more
closely
aligns
with
the
Fund’s
investment
strategies
and
investment
restrictions.
The
Board
noted
the
Adviser’s
representation
that
Fund’s
relative
performance
over
the
one-year
period
could
be
attributed,
at
least
in
part,
to
securities
selection
and
underweight
exposure
to
higher
capitalization
mining
companies,
which
outperformed
the
types
of
junior
gold
exploration
and
development
companies
in
which
the
Fund
typically
invests
during
the
period.
World
Precious
Minerals
Fund
For
the
World
Precious
Minerals
Fund,
the
information
presented
showed
that
the
Fund
underperformed
its
benchmark
indices,
the
S&P
500
Index
and
NYSE
Arca
Gold
Miners
Index,
and
the
average
of
its
Strategic
Insight
peers
for
each
of
the
one-,
three-,
five-,
and
10-
year
periods
ended
June
30,
2024.
The
Board
noted
that
the
Fund’s
underperformance
relative
to
the
index
and
peers
during
the
periods
under
review
could
be
attributed,
at
least
in
part,
to
the
underperformance
of
the
junior
gold
exploration
and
development
companies
in
which
the
Fund
invested
relative
to
larger
capitalization
gold
companies.
At
the
Adviser’s
request,
the
Board
also
considered
the
performance
of
the
Fund
compared
to
that
of
the
S&P
TSX
Venture
Precious
Metals
&
Minerals
Index
(the
“Comparable
Index”),
which
was
believed
to
be
a
more
appropriate
Other
Information
(
unaudited
)
measure
of
comparison.
The
Board
noted
that
the
information
presented
showed
that
the
World
Precious
Minerals
Fund
outperformed
the
Comparable
Index
during
the
periods
shown
and
that
the
Fund’s
performance
was
expected
to
more
closely
approximate
that
of
the
Comparable
Index
in
the
future.
The
Board
noted
the
Adviser’s
conviction
in
the
Fund’s
portfolio,
and
the
Adviser’s
representation
that
it
would
remain
patient
for
investment
opportunities
in
the
junior
mining
space
with
an
expectation
that
junior
mining
companies
would
return
to
favor
as
liquidity
and
capital
formation
returned
to
the
sector.
Near-Term
Tax-Free
Fund
For
the
Near-Term
Tax-Free
Fund,
the
information
presented
showed
that
the
Fund
underperformed
the
average
of
its
Strategic
Insight
peer
group
for
the
one-,
three-,
five-,
and
10-year
periods
ended
June
30,
2024.
The
Board
observed
that
the
Near-Term
Tax-Free
Fund
changed
its
primary
benchmark
index
from
the
Bloomberg
3-year
Municipal
Bond
Index
to
the
Bloomberg
Municipal
Bond
Index,
effective
May
1,
2024,
due
to
regulatory
requirements
and
that
the
Fund
retained
Bloomberg
3-year
Municipal
Bond
Index
as
a
secondary
benchmark
index
because
the
Bloomberg
3-year
Municipal
Bond
Index
more
closely
aligns
with
the
Fund’s
investment
strategies
and
investment
restrictions.
The
Board
observed
that
the
Fund
underperformed
its
regulatory
benchmark
index,
the
Bloomberg
Municipal
Bond
Index,
for
the
one-,
five-,
and
10-year
periods
ended
June
30,
2024
and
outperformed
the
Bloomberg
Municipal
Bond
Index
for
the
three-year
period
ended
June
30,
2024.
At
the
Adviser’s
request,
the
Board
also
considered
the
performance
of
the
Near-Term
Tax-Free
Fund
compared
to
the
Fund’s
secondary
benchmark
index,
the
Bloomberg
3-year
Municipal
Bond
Index,
and
observed
that
the
Fund
outperformed
the
Bloomberg
3-year
Municipal
Bond
Index
for
the
one-year
period
ended
June
30,
2024
and
underperformed
the
Bloomberg
3-year
Municipal
Bond
Index
for
the
three-,
five-,
and
10-year
periods
ended
June
30,
2024.
The
Board
noted
the
Adviser’s
representation
that
the
Fund’s
relative
underperformance
was
a
result
of
the
Fund’s
exposure
to
investments
with
relatively
longer
duration
than
the
constituents
of
the
benchmark
and
peer
fund
portfolios
during
a
period
in
which
interest
rate
hikes
by
the
U.S.
Federal
Reserve
drove
negative
returns
for
most
fixed
income
products
but
ultimately
benefitted
shorter
duration
investments
most.
U.S.
Government
Securities
Ultra-Short
Bond
Fund
For
the
U.S.
Government
Securities
Ultra-Short
Bond
Fund,
the
information
presented
showed
that
the
Fund
underperformed
the
average
of
its
Strategic
Insight
peer
group
for
the
one-,
three-,
and
five-year
periods
ended
June
30,
2024.
The
Board
observed
that
the
U.S.
Government
Securities
Ultra-Short
Bond
Fund
changed
its
primary
benchmark
index
from
the
Bloomberg
U.S.
Treasury
Bills
6-9
Months
Total
Return
Index
to
the
Bloomberg
U.S.
Aggregate
Bond
Index,
effective
May
1,
2024,
due
to
regulatory
requirements
and
that
the
Fund
retained
Bloomberg
U.S.
Treasury
Bills
6-9
Months
Total
Return
Index
as
a
secondary
benchmark
index
because
the
Bloomberg
U.S.
Treasury
Bills
6-9
Months
Total
Return
Index
more
closely
aligns
with
the
Fund’s
investment
strategies
and
investment
restrictions.
The
Board
observed
that
the
Fund
outperformed
its
regulatory
benchmark
index,
the
Bloomberg
U.S.
Aggregate
Bond
Index,
for
the
one-,
three-,
and
five-
year
periods
ended
June
30,
2024
and
underperformed
the
Bloomberg
Municipal
Bond
Index
for
the
10-year
period
ended
June
30,
2024.
At
the
Adviser’s
request,
the
Board
also
considered
the
performance
of
the
U.S.
Government
Securities
Ultra-Short
Bond
Fund
compared
to
the
Other
Information
(
unaudited
)
Fund’s
secondary
benchmark
index,
the
Bloomberg
U.S.
Treasury
Bills
6-9
Months
Total
Return
Index,
and
observed
that
the
Fund
underperformed
the
Bloomberg
U.S.
Treasury
Bills
6-9
Months
Total
Return
Index
for
the
one-,
three-,
five-,
and
10-year
periods
ended
June
30,
2024.
The
Board
noted
the
Adviser’s
representation
that
the
Fund’s
relative
underperformance
was
a
result
of
the
Fund’s
exposure
to
investments
with
relatively
longer
duration
than
the
constituents
of
the
benchmark
and
peer
fund
portfolios
during
a
period
in
which
interest
rate
hikes
by
the
U.S.
Federal
Reserve
drove
negative
returns
for
most
fixed
income
products
but
ultimately
benefitted
shorter
duration
investments
most.
In
consideration
of
the
Funds’
investment
strategies,
the
unique
nature
of
the
markets
in
which
the
Funds
invested,
and
the
foregoing
performance
information,
including
the
Adviser’s
representations
regarding
each
Funds’
recent
performance
relative
to
peers
and
benchmarks,
among
other
relevant
considerations,
the
Board
determined
that
the
Funds
and
their
shareholders
could
benefit
from
the
Adviser’s
continued
management
of
each
Fund.
Compensation
The
Board
evaluated
the
Adviser’s
compensation
for
providing
advisory
services
to
the
Funds
and
analyzed
comparative
information
on
actual
advisory
fee
rates
and
actual
total
expense
ratios
of
the
Funds’
respective
Strategic
Insight
peer
groups.
For
the
Global
Luxury
Goods
Fund,
the
information
showed
that,
as
of
June
30,
2024,
the
Fund’s
net
advisory
fee
rate
and
net
total
expense
ratio
were
higher
than
the
median
of
their
Strategic
Insight
peer
group.
For
the
Global
Resources
Fund,
Gold
and
Precious
Metals
Fund,
and
World
Precious
Minerals
Fund,
the
information
showed
that,
as
of
June
30,
2024,
each
Fund’s
net
advisory
fee
rate
was
less
than
the
median
of
their
respective
Strategic
Insight
peers
and
each
Fund’s
net
total
expense
ratio
was
higher
than
the
median
of
their
respective
Strategic
Insight
peer
group.
For
the
Near-Term
Tax-Free
Fund
and
U.S.
Government
Securities
Ultra-Short
Bond
Fund,
the
information
showed
that,
as
of
June
30,
2024,
each
Fund’s
net
advisory
fee
rate
and
net
total
expense
ratio
were
lower
than
the
median
of
their
respective
Strategic
Insight
peer
group.
The
Board
considered
the
Adviser’s
representation
that
higher
expenses
are
inherent
in
small
fund
complexes,
such
as
the
Trust,
noting
the
difficulty
that
small
complexes
face
in
spreading
increasing
overhead
over
a
small
asset
base.
The
Board
also
noted
the
Adviser’s
representation
that
the
nature
of
the
Funds’
shareholder
composition,
which
generally
comprised
a
significant
number
of
small,
retail
accounts,
resulted
in
significantly
more
operational
and
administrative
expense
than
the
expense
borne
by
the
larger
fund
complexes
against
which
the
Funds
were
compared.
The
Board
noted
further
the
Adviser’s
representation
that
the
Adviser
continues
to
evaluate
opportunities
to
reduce
expenses
that
negatively
affect
the
Funds’
investment
results.
The
Board
noted
that,
with
respect
to
each
of
the
Global
Luxury
Goods
Fund,
Global
Resources
Fund,
Gold
and
Precious
Metals
Fund,
and
World
Precious
Minerals
Fund,
the
shareholders
of
each
Fund
had
recently
approved
the
elimination
of
the
performance-based
adjustment
to
the
management
fee
arrangements
earlier
in
2024
and
that
the
Adviser
had
agreed
to
phase
in
the
removal
of
the
performance
adjustment
such
that,
until
12
months
after
the
elimination
of
the
performance
adjustment
was
approved
(such
phase
in
currently
expected
to
last
until
March
31,
2025),
each
Fund
will
pay
advisory
fees
equal
to
the
lesser
of
the
base
fee
rate
or
the
fee
as
determined
with
the
downward
performance
adjustment.
Other
Information
(
unaudited
)
In
addition,
the
Board
noted
that
the
Adviser
is
contractually
limiting
expenses
(exclusive
of
acquired
fund
fees
and
expenses,
extraordinary
expenses,
taxes,
brokerage
commissions
and
interest)
for
certain
of
the
Funds
to
ensure
that
Fund
expenses
do
not
exceed
the
following
levels
through
at
least
April
30,
2025:
The
Board
also
noted
that
the
Adviser
is
currently
voluntarily
limiting
expenses
for
the
U.S.
Government
Bond
Fund
(all
voluntary
expense
limitations
may
be
modified
or
removed
by
the
Adviser
at
any
time
and
are
exclusive
of
acquired
fund
fees
and
expenses,
extraordinary
expenses,
taxes,
brokerage
commissions,
interest,
and
advisory
fee
performance
adjustments,
if
any)
to
ensure
that
Fund
expenses
do
not
exceed
0.45%
of
average
net
assets
for
the
U.S.
Government
Bond
Fund
through
at
least
April
30,
2025.
Based
on
the
foregoing
and
other
applicable
considerations,
the
Board
concluded
that
the
advisory
fee
rates
to
be
charged
to
the
Funds
under
the
Advisory
Agreement
appeared
to
be
reasonable
under
all
of
the
facts
and
circumstances.
Cost
of
Services
and
Profitability
The
Board
considered
information
provided
by
the
Adviser
regarding
the
costs
of
services
and
its
profitability
with
respect
to
the
Funds.
In
this
regard,
the
Board
considered
the
Adviser’s
resources
devoted
to
the
Funds,
as
well
as
the
Adviser’s
discussion
of
the
costs
and
profitability
of
its
mutual
fund
activities.
The
Board
noted
the
Adviser’s
representation
that
it
continued
to
waive
its
advisory
fee
as
necessary
to
ensure
each
Fund’s
expenses
did
not
exceed
the
voluntary
or
contractual
expense
cap,
as
applicable.
The
Board
also
noted
the
Adviser’s
representation
that
the
nature
of
the
Funds’
shareholder
composition,
which
generally
comprised
a
significant
number
of
small,
retail
accounts,
resulted
in
significantly
more
operational
and
administrative
expense
than
the
expense
borne
by
the
larger
fund
complexes
against
which
the
Funds
were
compared.
Based
on
these
and
other
applicable
considerations,
the
Board
concluded
that
the
Adviser’s
profits
attributable
to
management
of
the
Funds
appeared
to
be
reasonable
in
light
of
the
nature,
extent
and
quality
of
the
services
provided
by
the
Adviser.
Economies
of
Scale
As
part
of
its
review
of
the
Advisory
Agreement,
the
Board
considered
whether
the
Funds
would
benefit
from
any
economies
of
scale.
In
this
respect,
the
Board
considered
the
Funds’
fee
structures,
asset
sizes,
and
net
expense
ratios,
recognizing
that
an
analysis
of
economies
of
scale
is
generally
most
relevant
when
a
fund
has
achieved
a
substantial
size
and
has
growing
assets
and
that,
if
a
fund’s
assets
are
stable
or
decreasing,
the
significance
of
economies
of
scale
may
be
reduced.
The
Board
reviewed
relevant
materials,
including
information
and
representations
from
the
Adviser,
in
considering
whether
the
use
of
breakpoints
would
be
appropriate
at
this
time,
and
the
Board
noted
the
existence
of
the
Adviser’s
ongoing
expense
limitation
agreement
obligations
for
each
Fund.
The
Board
noted,
in
particular,
the
relatively
low
and
declining
asset
levels
for
the
majority
of
the
Funds.
The
Board
noted
the
Adviser’s
representation
that
economies
of
scale
could
be
experienced
by
shareholders
of
the
Funds
upon
reaching
significantly
higher
asset
levels
but
that,
in
light
of
the
Funds’
current
asset
Funds
Expense
Cap
Global
Luxury
Goods
Fund
1.75%
Global
Resources
Fund
1.75%
Gold
and
Precious
Metals
Fund
1.75%
World
Precious
Minerals
Fund
1.75%
U.S.
Government
Securities
Ultra-Short
Bond
Fund
0.45%
Other
Information
(
unaudited
)
levels,
breakpoints
in
the
advisory
fee
were
not
believed
by
the
Adviser
to
be
appropriate
at
this
time.
Based
on
the
foregoing
information
and
other
applicable
considerations,
the
Board
concluded
that
the
information
presented
generally
supported
the
renewal
of
the
Advisory
Agreement.
Other
Benefits
The
Board
noted
the
Adviser’s
representation
that,
aside
from
its
contractual
advisory
fees,
it
does
not
benefit
in
a
material
way
from
its
relationship
with
the
Funds.
Based
on
the
foregoing
representation
and
other
applicable
considerations,
the
Board
concluded
that
other
benefits
received
by
the
Adviser
from
its
relationship
with
the
Funds
were
not
a
material
factor
in
approving
the
continuation
of
the
Advisory
Agreement.
Conclusion
The
Board
did
not
identify
any
single
factor
as
being
of
paramount
importance,
and
different
Trustees
may
have
given
different
weight
to
different
factors.
The
Board
reviewed
a
memorandum
from
Independent
Trustee
Counsel
discussing
the
legal
standards
applicable
to
its
consideration
of
the
Advisory
Agreement.
Based
on
its
review,
including
consideration
of
each
of
the
factors
referenced
above,
the
Board
determined,
in
the
exercise
of
its
reasonable
business
judgment,
that
the
advisory
arrangement,
as
outlined
in
the
Advisory
Agreement,
was
fair
and
reasonable
in
light
of
the
services
performed
or
to
be
performed,
expenses
incurred
or
to
be
incurred
and
such
other
matters
as
the
Board
considered
relevant.
Apex
Fund
Services
3
Canal
Plaza,
Suite
600
Portland,
ME
04101
Want
to
reduce
paper
waste?
You
can
receive
this
report
and
other
important
documents
electronically.
Please
visit
www.usfunds.com
and
sign
up
at
Access
My
Account.
If
you
need
further
assistance,
please
call
us
at
800-873-8637.
.
(b) Included as part of financial statements filed under Item 7(a).
ITEM 8. CHANGES IN AND DISAGREEMENTS WITH ACCOUNTANTS FOR OPEN-END MANAGEMENT INVESTMENT COMPANIES.
Not applicable.
ITEM 9. PROXY DISCLOSURES FOR OPEN-END MANAGEMENT INVESTMENT COMPANIES.
Not applicable.
ITEM 10. REMUNERATION PAID TO DIRECTORS, OFFICERS, AND OTHERS OF OPEN-END MANAGEMENT INVESTMENT COMPANIES.
Included as part of financial statements filed under Item 7(a).
ITEM 11. STATEMENT REGARDING BASIS FOR APPROVAL OF INVESTMENT ADVISORY CONTRACT.
Included as part of financial statements filed under Item 7(a).
ITEM 12. DISCLOSURE OF PROXY VOTING POLICIES AND PROCEDURES FOR CLOSED-END MANAGEMENT INVESTMENT COMPANIES.
Not applicable.
ITEM 13. PORTFOLIO MANAGERS OF CLOSED-END MANAGEMENT INVESTMENT COMPANIES.
Not applicable.
ITEM 14. PURCHASES OF EQUITY SECURITIES BY CLOSED-END MANAGEMENT INVESTMENT COMPANY AND AFFILIATED PURCHASERS.
Not applicable.
ITEM 15. SUBMISSION OF MATTERS TO A VOTE OF SECURITY HOLDERS
The Registrant does not accept nominees to the Board of Trustees from shareholders.
ITEM 16. CONTROLS AND PROCEDURES
(a) The Registrant’s Principal Executive Officer and Principal Financial Officer have concluded that the Registrant’s disclosure controls and procedures (as defined in Rule 30a-3(c) under the Act are effective, based on their evaluation of the controls and procedures required by Rule 30a-3(b) under the Act and Rules 13a-15(b) or 15d-15(b) under the Securities Exchange Act of 1934, as of a date within 90 days of the filing date of this report.
(b) There were no changes in the Registrant’s internal control over financial reporting (as defined in Rule 30a-3(d) under the Act) that occurred during the Reporting Period that have materially affected, or are reasonably likely to materially affect, the Registrant’s internal control over financial reporting.
ITEM 17. DISCLOSURE OF SECURITIES LENDING ACTIVITIES FOR CLOSED-END MANAGEMENT INVESTMENT COMPANIES.
Not applicable.
ITEM 18. RECOVERY OF ERRONEOUSLY AWARDED COMPENSATION.
Not applicable.
ITEM 19. EXHIBITS.
(a)(2) Not applicable.
(a)(4) Not applicable.
(a)(5) Not applicable.
SIGNATURES
Pursuant to the requirements of the Securities Exchange Act of 1934 and the Investment Company Act of 1940, the Registrant has duly caused this report to be signed on its behalf by the undersigned, thereunto duly authorized.
Registrant U.S. Global Investors Funds
| By: | /s/ Zachary Tackett | |
| | Zachary Tackett, Principal Executive Officer | |
| | | |
| Date: | March 4, 2025 | |
Pursuant to the requirements of the Securities Exchange Act of 1934 and the Investment Company Act of 1940, this report has been signed below by the following persons on behalf of the Registrant and in the capacities and on the dates indicated.
| By: | /s/ Zachary Tackett | |
| | Zachary Tackett, Principal Executive Officer | |
| | | |
| Date: | March 4, 2025 | |
| By: | /s/ Karen Shaw | |
| | Karen Shaw, Principal Financial Officer | |
| | | |
| Date: | March 4, 2025 | |