Exhibit 99.1
Wintrust Financial Corporation
9700 W. Higgins Road, Suite 800, Rosemont, Illinois 60018
News Release
|
| | |
| | | |
| FOR IMMEDIATE RELEASE | | October 16, 2014 |
FOR MORE INFORMATION CONTACT:
Edward J. Wehmer, President & Chief Executive Officer
David A. Dykstra, Senior Executive Vice President & Chief Operating Officer
(847) 939-9000
Web site address: www.wintrust.com
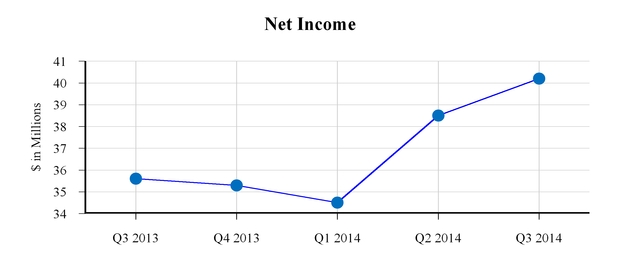
Wintrust Financial Corporation Reports Record Third Quarter 2014 Net Income of $40.2 million and Record Year-to-Date 2014 Net Income of $113.3 million
ROSEMONT, ILLINOIS – Wintrust Financial Corporation (“Wintrust” or “the Company”) (Nasdaq: WTFC) announced net income of $40.2 million or $0.79 per diluted common share for the third quarter of 2014 compared to net income of $38.5 million or $0.76 per diluted common share for the second quarter of 2014 and $35.6 million or $0.71 per diluted common share for the third quarter of 2013. The Company recorded net income of $113.3 million or $2.23 per diluted common share for the first nine months of 2014 compared to net income of $101.9 million or $2.05 per diluted common share for the first nine months of 2013.
Highlights compared with the Second Quarter of 2014*:
| |
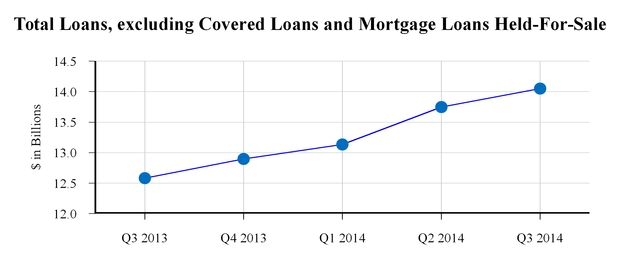
| • | Total loans, excluding covered loans and mortgage loans held-for-sale, increased by $302 million, or 9% on annualized basis, to $14.1 billion |
| |
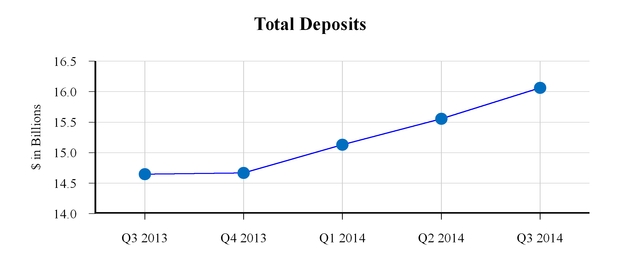
| • | Total deposits increased by $509 million, or 13% on an annualized basis, to $16.1 billion |
| |
| • | Net interest income increased by $2.5 million to $151.7 million, however, net interest margin, on a fully-taxable equivalent basis, decreased by 16 basis points to 3.46% |
| |
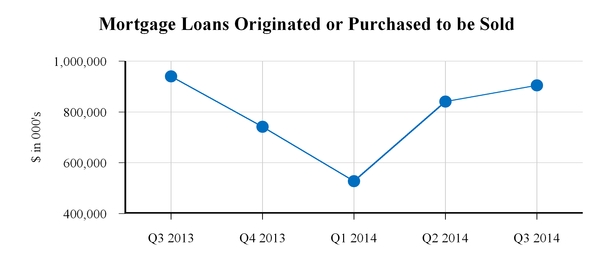
| • | Mortgage banking revenue increased by $2.9 million to $26.7 million |
| |
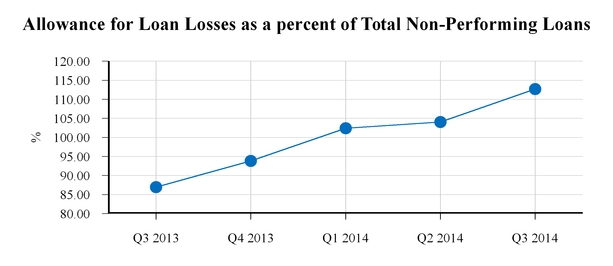
| • | The allowance for loan losses as a percentage of total non-performing loans increased to 112% from 104% |
| |
| • | Non-performing loans as a percent of total loans, excluding covered loans, decreased to 0.58% from 0.64% |
| |
| • | Capital ratios remain strong with a tangible common equity ratio, assuming full conversion of preferred stock, of 8.6% |
| |
| • | Completed acquisition of 12 bank branches in Wisconsin through two separate branch transactions. |
* See "Supplemental Financial Measures/Ratios" on page 15/16 for more information on non-GAAP measures.
Edward J. Wehmer, President and Chief Executive Officer, commented, “Wintrust reported record net income for the third quarter of 2014. The current quarter was characterized by strong loan and deposit growth, increased net interest income, improved credit quality metrics and increased mortgage banking revenue."
Mr. Wehmer continued, “The Company grew total loans, excluding covered loans and mortgage loans held-for-sale, by $302 million in the third quarter, including $120 million of loans acquired in relation to the two separate Wisconsin branch transactions. This increase in loan volume drove higher net interest income in the current quarter despite a decline in net interest margin. The loan pipeline, an indicator of future loan balance growth, remains consistently strong."
Mr. Wehmer added, "Net interest margin declined primarily as a result of increased interest expense related to the subordinated debt issued in June, a reduction in commercial and commercial real estate loan yields, excess liquidity resulting from acquisitions during the period, and run-off of the covered loan portfolio. The $140 million subordinated debt issuance completed in June 2014 strengthened our capital ratios and cash position but reduced the net interest margin in the third quarter by six basis points. The acquisitions in the third quarter added approximately $300 million of liquidity, which resulted in a three basis point reduction to the net interest margin. Competitive pricing in the commercial and commercial real estate markets negatively impacted the net interest margin by four basis points while the run-off of covered loans reduced the net interest margin by an additional three basis points in the third quarter."
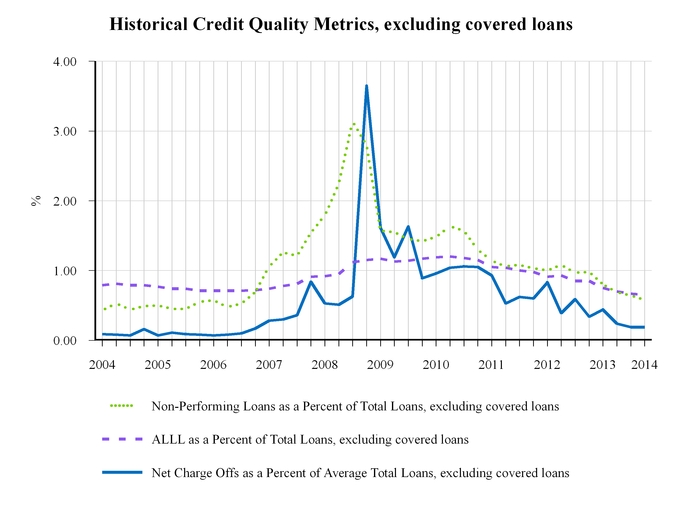
Commenting on credit quality, Mr. Wehmer noted, “The Company has continued its practice of timely addressing and resolving non-performing credits. Credit quality metrics improved in the current quarter including a reduction in the level of non-performing assets, increased allowance for loan losses coverage of non-performing loans and decreased net charge-offs. Our current credit quality metrics rival the pre-credit crisis levels reported between 2005 and 2008. However, we are able to carry a slightly lower ratio of allowance for loan losses to total loans than during the pre-credit crisis period as the result of the fact that the mix of the Company's loan portfolio is now more heavily weighted toward niche and purchased loans which historically require lower reserves. The niche and purchased components of our total loan portfolio now comprise 39% as compared to 23% of the total loan portfolio at December 31, 2005. Our current loan portfolio is comprised of a core portion totaling $8.5 billion with a 94 basis point allowance for loan losses and a niche and purchased component totaling $5.5 billion that only requires 20 basis points of allowance for loan losses. We believe that the Company's reserves remain appropriate."
Mr. Wehmer further commented, “Our mortgage banking business continued its positive momentum in the third quarter resulting in an increase in mortgage banking revenue of $2.9 million as compared to the second quarter of 2014. The increase in mortgage banking revenue was primarily a result of higher origination volumes in the current quarter as purchase originations were supplemented by increased refinancing activity. We believe that our mortgage banking business remains well positioned to grow both organically and through acquisitions. The wealth management business units continue their successful expansion, increasing revenue on a year-to-date basis by 13% over last year. Focus on expense control remains a priority, as most of the increase in non-interest expense compared to the previous quarter was in variable compensation components and acquisition related."
Turning to the future, Mr. Wehmer stated, “We expanded our franchise in the third quarter through the acquisition of a bank branch in Pewaukee, Wisconsin and the acquisition of 11 other Wisconsin bank branches from Talmer Bank & Trust. Additionally, we recently signed an agreement to acquire Delavan Bancshares which will continue to expand our footprint in southern Wisconsin, adding four bank branches. Evaluating strategic acquisitions of this nature and organic branch growth will continue to be a part of our overall growth strategy. Our pipelines for both internal growth and external growth remain consistently strong. Growing franchise value, increasing profitability, leveraging our expense infrastructure and increasing shareholder value continue to be our main objectives."
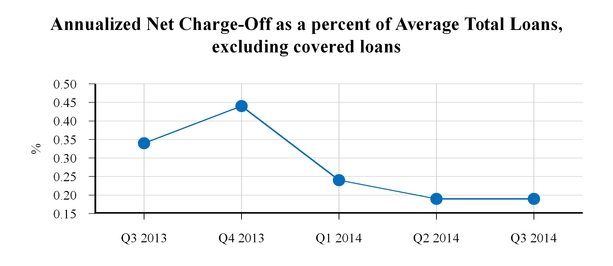
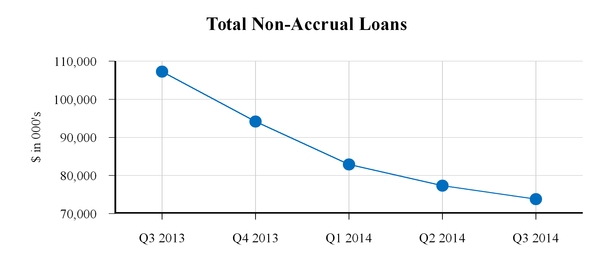
The graphs below illustrate certain highlights of the third quarter of 2014.
The graph below illustrates certain historical credit quality metrics, excluding covered loans, from 2004 to the third quarter of 2014.
Wintrust’s key operating measures and growth rates for the third quarter of 2014, as compared to the sequential and linked quarters, are shown in the table below:
|
| | | | | | | | | | | | | | | | | | | | |
| | | | | | | | | % or(5) basis point (bp)change from 2nd Quarter 2014 | | % or basis point (bp) change from 3rd Quarter 2013 |
| | Three Months Ended | | |
| (Dollars in thousands) | | September 30, 2014 | | June 30, 2014 | | September 30, 2013 | | |
| Net income | | $ | 40,224 |
| | $ | 38,541 |
| | $ | 35,563 |
| | 4 |
| % | | 13 |
| % |
| Net income per common share – diluted | | $ | 0.79 |
| | $ | 0.76 |
| | $ | 0.71 |
| | 4 |
| % | | 11 |
| % |
Net revenue (1) | | $ | 209,622 |
| | $ | 203,282 |
| | $ | 196,444 |
| | 3 |
| % | | 7 |
| % |
| Net interest income | | $ | 151,670 |
| | $ | 149,180 |
| | $ | 141,782 |
| | 2 |
| % | | 7 |
| % |
Net interest margin (2) | | 3.46 | % | | 3.62 | % | | 3.57 | % | | (16 | ) | bp | | (11 | ) | bp |
Net overhead ratio (2) (3) | | 1.67 | % | | 1.74 | % | | 1.65 | % | | (7 | ) | bp | | 2 |
| bp |
Efficiency ratio (2) (4) | | 65.76 | % | | 65.36 | % | | 64.60 | % | | 40 |
| bp | | 116 |
| bp |
| Return on average assets | | 0.83 | % | | 0.84 | % | | 0.81 | % | | (1 | ) | bp | | 2 |
| bp |
| Return on average common equity | | 8.09 | % | | 8.03 | % | | 7.85 | % | | 6 |
| bp | | 24 |
| bp |
| Return on average tangible common equity | | 10.59 | % | | 10.43 | % | | 10.27 | % | | 16 |
| bp | | 32 |
| bp |
| At end of period | | | | | | | | | | | | |
| Total assets | | $ | 19,169,345 |
| | $ | 18,895,681 |
| | $ | 17,682,548 |
| | 6 |
| % | | 8 |
| % |
| Total loans, excluding loans held-for-sale, excluding covered loans | | $ | 14,052,059 |
| | $ | 13,749,996 |
| | $ | 12,581,039 |
| | 9 |
| % | | 12 |
| % |
| Total loans, including loans held-for-sale, excluding covered loans | | $ | 14,415,362 |
| | $ | 14,113,623 |
| | $ | 12,915,384 |
| | 8 |
| % | | 12 |
| % |
| Total deposits | | $ | 16,065,246 |
| | $ | 15,556,376 |
| | $ | 14,647,446 |
| | 13 |
| % | | 10 |
| % |
| Total shareholders’ equity | | $ | 2,028,508 |
| | $ | 1,998,235 |
| | $ | 1,873,566 |
| | 6 |
| % | | 8 |
| % |
| |
| (1) | Net revenue is net interest income plus non-interest income. |
| |
| (2) | See “Supplemental Financial Measures/Ratios” for additional information on this performance measure/ratio. |
| |
| (3) | The net overhead ratio is calculated by netting total non-interest expense and total non-interest income, annualizing this amount, and dividing by that period's average total assets. A lower ratio indicates a higher degree of efficiency. |
| |
| (4) | The efficiency ratio is calculated by dividing total non-interest expense by tax-equivalent net revenue (less securities gains or losses). A lower ratio indicates more efficient revenue generation. |
| |
| (5) | Period-end balance sheet percentage changes are annualized. |
Certain returns, yields, performance ratios, or quarterly growth rates are “annualized” in this presentation to represent an annual time period. This is done for analytical purposes to better discern for decision-making purposes underlying performance trends when compared to full-year or year-over-year amounts. For example, a 5% growth rate for a quarter would represent an annualized 20% growth rate. Additional supplemental financial information showing quarterly trends can be found on the Company’s web site at www.wintrust.com by choosing “Financial Reports” under the “Investor Relations” heading, and then choosing “Financial Highlights.”
Financial Performance Overview – Third Quarter 2014
For the third quarter of 2014, net interest income totaled $151.7 million, an increase of $2.5 million as compared to the second quarter of 2014 and an increase of $9.9 million as compared to the third quarter of 2013. The changes in net interest income on both a sequential and linked quarter basis are the result of the following:
| |
| • | Net interest income increased $2.5 million in the third quarter of 2014 compared to the second quarter of 2014, due to: |
| |
| ◦ | An increase in total interest income of $4.1 million in the third quarter of 2014 compared to the second quarter of 2014 resulting primarily from loan growth and one additional day in the quarter, partially offset by a decline in the yield on loans. |
| |
| ◦ | Interest expense in the third quarter of 2014 compared to the second quarter of 2014 increased $1.6 million primarily as a result of the issuance of subordinated notes at the end of the second quarter of 2014 and one additional day in the quarter, partially offset by improvement in funding mix shown by a higher proportion of non-interest bearing deposits in the current quarter. |
| |
| • | Net interest income increased $9.9 million in the third quarter of 2014 compared to the third quarter of 2013, due to: |
| |
| ◦ | Average loans, excluding covered loans, for the third quarter of 2014 increased by $1.2 billion compared to the third quarter of 2013. The growth in average loans, excluding covered loans, was partially offset by a 15 basis point decline in the yield on earning assets, resulting in an increase in total interest income of $9.5 million in the third quarter of 2014 compared to the prior year quarter. |
| |
| ◦ | Funding mix improved as average demand deposits increased $681.8 million, average interest bearing deposits increased $878.1 million and average wholesale borrowings decreased by $146.1 million in the third quarter of 2014 compared to the third quarter of 2013. The change in funding mix, partially offset by the issuance of subordinated notes at the end of the second quarter of 2014, resulted in a four basis point decrease in the yield on average interest bearing liabilities which created a $380,000 decrease in interest expense. |
| |
| ◦ | Combined, the increase in interest income of $9.5 million and the reduction of interest expense by $380,000 created the $9.9 million increase in net interest income in the third quarter of 2014 compared to the third quarter of 2013. |
The net interest margin, on a fully taxable equivalent basis, for the third quarter of 2014 was 3.46% compared to 3.62% for the second quarter of 2014 and 3.57% for the third quarter of 2013 (see "Net Interest Income" section later in this release for further detail).
Non-interest income totaled $58.0 million in the third quarter of 2014, increasing $3.9 million, or 7%, compared to the second quarter of 2014 and increasing $3.3 million, or 6%, compared to the third quarter of 2013. The increase in non-interest income in the third quarter of 2014 compared to the second quarter of 2014 is primarily attributable to an increase in mortgage banking revenue, partially offset by slightly lower wealth management revenues. The increase in non-interest income in the third quarter of 2014 compared to the third quarter of 2013 was primarily attributable to an increase in wealth management and mortgage banking revenues, fees from covered call options and trading gains, partially offset by lower interest rate swap fees (see "Non-Interest Income" section later in this release for further detail).
Non-interest expense totaled $138.5 million in the third quarter of 2014, increasing $4.9 million, or 4%, compared to the second quarter of 2014 and increasing $11.3 million, or 9%, compared to the third quarter of 2013. The increase in the current quarter compared to the second quarter of 2014 can be primarily attributed to higher salary and employee benefit costs from higher expenses on variable pay based arrangements and increased salaries caused by the addition of employees from the various acquisitions and larger staffing as the Company grows, as well as increased equipment and occupancy expenses, partially offset by a decrease in OREO expenses. The increase in the third quarter of 2014 compared to the third quarter of 2013 was primarily attributable to higher salary and employee benefit costs and increased occupancy, equipment and marketing expenses, partially offset by a decrease in OREO expenses (see "Non-Interest Expense" section later in this release for further detail).
Financial Performance Overview – First Nine Months of 2014
For the first nine months of 2014, net interest income totaled $444.9 million, an increase of $36.5 million as compared to the first nine months of 2013. The changes in net interest income on a linked quarter basis are the result of the following:
| |
| • | Net interest income increased $36.5 million in the first nine months of 2014 compared to the first nine months of 2013, due to: |
| |
| ◦ | Average earning assets for the first nine months of 2014 increased by $1.1 billion compared to the first nine months of 2013. This was primarily comprised of average loan growth, excluding covered loans, of $1.1 billion and an increase of $152.3 million in the average balance of liquidity management assets, partially offset by a decrease of $194.2 million in the average balance of covered loans. The growth in average total loans, excluding covered loans, included an increase of $541.2 million in commercial loans, $293.9 million in commercial real estate loans, $236.6 million in commercial premium finance receivables, $204.6 million in life insurance premium finance receivables and $4.7 million in home equity and other loans, partially offset by a decrease of $134.9 million in mortgage loans held-for-sale. |
| |
| ◦ | The average earning asset growth of $1.1 billion in the first nine months of 2014, partially offset by a three basis point decrease in yield on earning assets, resulted in an increase in total interest income of $28.4 million in the first nine months of 2014 compared to the first nine months of 2013. |
| |
| ◦ | Funding mix improved as average interest bearing deposits increased $555.6 million, average demand deposits increased $540.6 million and average wholesale borrowings decreased $112.5 million in the first nine months of 2014 compared to the first nine months of 2013. The change in the funding mix resulted in a 10 basis point decrease in the yield on average interest bearing liabilities which created a $8.1 million decrease in interest expense. |
| |
| ◦ | Combined, the increase in interest income of $28.4 million and the reduction of interest expense by $8.1 million created the $36.5 million increase in net interest income in the first nine months of 2014 compared to the first nine months of 2013. |
The net interest margin, on a fully taxable equivalent basis, for the first nine months of 2014 was 3.56%, compared to 3.49% for the first nine months of 2013 (see "Net Interest Income" section later in this release for further detail).
Non-interest income totaled $157.6 million in the first nine months of 2014, decreasing $18.5 million, or 10%, compared to the first nine months of 2013. The decrease in non-interest income in the first nine months of 2014 compared to the first nine months of 2013 was primarily attributable to a decrease in mortgage banking revenues, fees on interest rate swap transactions and higher trading losses, partially offset by higher wealth management revenues (see "Non-Interest Income" section later in this release for further detail).
Non-interest expense totaled $403.4 million in the first nine months of 2014, increasing $27.9 million, or 7%, compared to the first nine months of 2013. The increase compared to the first nine months of 2013 was primarily attributable to increases in salary, occupancy, equipment and OREO expenses (see "Non-Interest Expense" section later in this release for further detail).
Financial Performance Overview – Credit Quality
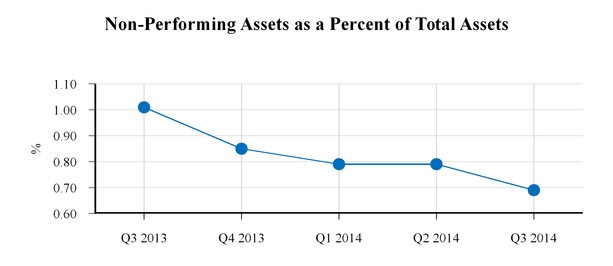
The ratio of non-performing assets to total assets was 0.69% as of September 30, 2014, compared to 0.79% at June 30, 2014, and 1.01% at September 30, 2013. Non-performing assets, excluding covered assets, totaled $131.7 million at September 30, 2014, compared to $148.5 million at June 30, 2014 and $179.0 million at September 30, 2013.
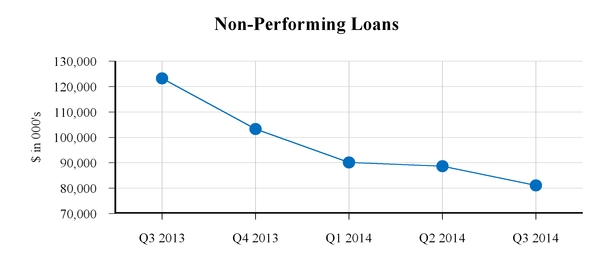
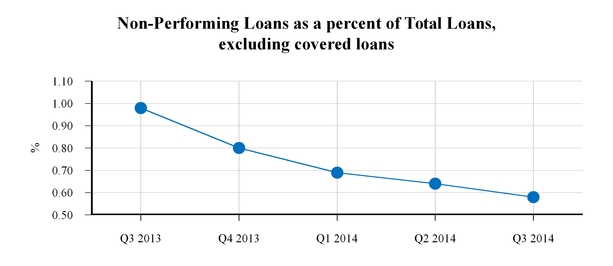
Non-performing loans, excluding covered loans, totaled $81.1 million, or 0.58% of total loans, at September 30, 2014, compared to $88.7 million, or 0.64% of total loans, at June 30, 2014 and $123.3 million, or 0.98% of total loans, at September 30, 2013. Compared to June 30, 2014, non-performing loans, excluding covered loans, decreased primarily as a result of a $9.3 million decrease in non-performing loans within the commercial real-estate loan portfolio, partially offset by a $3.9 million increase in non-performing loans within the commercial loan portfolio. The decrease in non-performing loans, excluding covered loans, compared to September 30, 2013 is primarily the result of a $28.7 million decrease in the commercial real-estate loan portfolio, a $7.4 million decrease in the commercial loan portfolio and a $5.2 million decrease in the home equity loan portfolio. OREO, excluding covered OREO, of $50.4 million at September 30, 2014 decreased $9.2 million compared to $59.6 million at June 30, 2014 and decreased $4.9 million compared to $55.3 million at September 30, 2013. The decrease in OREO during the third quarter of 2014 compared to the second quarter of 2014 is primarily attributable to the resolution of OREO during the period totaling $12.2 million, partially offset by the transfer to OREO of certain properties totaling $3.2 million.
The provision for credit losses, excluding the provision for covered loan losses, totaled $6.0 million for the third quarter of 2014 compared to $6.8 million for the second quarter of 2014 and $11.6 million for the third quarter of 2013. The decrease in the third quarter of 2014 compared to the second quarter of 2014 and the third quarter of 2013 is primarily attributable to improved credit quality metrics during the period.
Net charge-offs as a percentage of loans, excluding covered loans, for the third and second quarter of 2014 totaled 19 basis points on an annualized basis compared to 34 basis points on an annualized basis in the third quarter of 2013. Net charge-offs totaled $7.0 million in the third quarter of 2014, a slight increase compared to $6.6 million in the second quarter of 2014. Compared to the third quarter of 2013, net charge-offs decreased $4.3 million from $11.3 million primarily as a result of a $2.5 million and $2.0 million decrease in net charge-offs within the commercial real-estate and commercial loan portfolios, respectively.
Excluding the allowance for covered loan losses, the allowance for credit losses decreased $1.3 million in the third quarter of 2014, totaling $91.8 million, or 0.65% of total loans, at September 30, 2014 compared to $93.1 million, or 0.68% of total loans at June 30, 2014. At September 30, 2013, the allowance for credit losses, excluding the allowance for covered loan losses, totaled $108.5 million, or 0.86% of total loans. The allowance for unfunded lending-related commitments totaled $822,000 as of September 30, 2014 compared to $884,000 as of June 30, 2014 and $1.3 million as of September 30, 2013. The decrease from the third quarter of 2013 is primarily attributable to the expiration of one letter of credit during the fourth quarter of 2013.
Financial Performance Overview – Earnings Per Share
The following table shows the computation of basic and diluted earnings per share for the periods indicated:
|
| | | | | | | | | | | | | | | | | | | | | |
| | | | Three Months Ended | | Nine Months Ended |
| (In thousands, except per share data) | | | September 30, 2014 | | June 30, 2014 | | September 30, 2013 | | September 30, 2014 | | September 30, 2013 |
| Net income | | | $ | 40,224 |
| | $ | 38,541 |
| | $ | 35,563 |
| | $ | 113,265 |
| | $ | 101,922 |
|
| Less: Preferred stock dividends and discount accretion | | | 1,581 |
| | 1,581 |
| | 1,581 |
| | 4,743 |
| | 6,814 |
|
| Net income applicable to common shares—Basic | (A) | | 38,643 |
| | 36,960 |
| | 33,982 |
| | 108,522 |
| | 95,108 |
|
| Add: Dividends on convertible preferred stock, if dilutive | | | 1,581 |
| | 1,581 |
| | 1,581 |
| | 4,743 |
| | 6,744 |
|
| Net income applicable to common shares—Diluted | (B) | | 40,224 |
| | 38,541 |
| | 35,563 |
| | 113,265 |
| | 101,852 |
|
| Weighted average common shares outstanding | (C) | | 46,639 |
| | 46,520 |
| | 39,331 |
| | 46,453 |
| | 37,939 |
|
| Effect of dilutive potential common shares: | | | | | | | | | | | |
| Common stock equivalents | | | 1,166 |
| | 1,327 |
| | 7,346 |
| | 1,274 |
| | 7,263 |
|
| Convertible preferred stock, if dilutive | | | 3,075 |
| | 3,075 |
| | 3,477 |
| | 3,075 |
| | 4,500 |
|
| Weighted average common shares and effect of dilutive potential common shares | (D) | | 50,880 |
| | 50,922 |
| | 50,154 |
| | 50,802 |
| | 49,702 |
|
| Net income per common share: | | | | | | | | | | | |
| Basic | (A/C) | | $ | 0.83 |
| | $ | 0.79 |
| | $ | 0.86 |
| | $ | 2.34 |
| | $ | 2.51 |
|
| Diluted | (B/D) | | $ | 0.79 |
| | $ | 0.76 |
| | $ | 0.71 |
| | $ | 2.23 |
| | $ | 2.05 |
|
Potentially dilutive common shares can result from stock options, restricted stock unit awards, stock warrants, the Company’s convertible preferred stock, tangible equity unit shares and shares to be issued under the Employee Stock Purchase Plan and the Directors Deferred Fee and Stock Plan, being treated as if they had been either exercised or issued, computed by application of the treasury stock method. While potentially dilutive common shares are typically included in the computation of diluted earnings per share, potentially dilutive common shares are excluded from this computation in periods in which the effect would reduce the loss per share or increase the income per share. For diluted earnings per share, net income applicable to common shares can be affected by the conversion of the Company’s convertible preferred stock. Where the effect of this conversion would reduce the loss per share or increase the income per share, net income applicable to common shares is not adjusted by the associated preferred dividends.
WINTRUST FINANCIAL CORPORATION
Selected Financial Highlights |
| | | | | | | | | | | | | | | | | | | | |
| | | Three Months Ended | | Nine Months Ended |
| (Dollars in thousands, except per share data) | | September 30, 2014 | | June 30, 2014 | | September 30, 2013 | | September 30, 2014 | | September 30, 2013 |
| Selected Financial Condition Data (at end of period): | | | | | | | | | | |
| Total assets | | $ | 19,169,345 |
| | $ | 18,895,681 |
| | $ | 17,682,548 |
| | | | |
| Total loans, excluding loans held-for-sale and covered loans | | 14,052,059 |
| | 13,749,996 |
| | 12,581,039 |
| | | | |
| Total deposits | | 16,065,246 |
| | 15,556,376 |
| | 14,647,446 |
| | | | |
| Junior subordinated debentures | | 249,493 |
| | 249,493 |
| | 249,493 |
| | | | |
| Total shareholders’ equity | | 2,028,508 |
| | 1,998,235 |
| | 1,873,566 |
| | | | |
| Selected Statements of Income Data: | | | | | | | | | | |
| Net interest income | | $ | 151,670 |
| | $ | 149,180 |
| | $ | 141,782 |
| | $ | 444,856 |
| | 408,319 |
|
Net revenue (1) | | 209,622 |
| | 203,282 |
| | 196,444 |
| | 602,439 |
| | 584,355 |
|
| Net income | | 40,224 |
| | 38,541 |
| | 35,563 |
| | 113,265 |
| | 101,922 |
|
| Net income per common share – Basic | | $ | 0.83 |
| | $ | 0.79 |
| | $ | 0.86 |
| | $ | 2.34 |
| | $ | 2.51 |
|
| Net income per common share – Diluted | | $ | 0.79 |
| | $ | 0.76 |
| | $ | 0.71 |
| | $ | 2.23 |
| | $ | 2.05 |
|
| Selected Financial Ratios and Other Data: | | | | | | | | | | |
| Performance Ratios: | | | | | | | | | | |
Net interest margin (2) | | 3.46 | % | | 3.62 | % | | 3.57 | % | | 3.56 | % | | 3.49 | % |
| Non-interest income to average assets | | 1.20 | % | | 1.19 | % | | 1.24 | % | | 1.14 | % | | 1.36 | % |
| Non-interest expense to average assets | | 2.87 | % | | 2.93 | % | | 2.89 | % | | 2.92 | % | | 2.89 | % |
Net overhead ratio (2) (3) | | 1.67 | % | | 1.74 | % | | 1.65 | % | | 1.78 | % | | 1.54 | % |
Efficiency ratio (2) (4) | | 65.76 | % | | 65.36 | % | | 64.60 | % | | 66.65 | % | | 64.12 | % |
| Return on average assets | | 0.83 | % | | 0.84 | % | | 0.81 | % | | 0.82 | % | | 0.79 | % |
| Return on average common equity | | 8.09 | % | | 8.03 | % | | 7.85 | % | | 7.86 | % | | 7.57 | % |
Return on average tangible common equity (2) | | 10.59 | % | | 10.43 | % | | 10.27 | % | | 10.25 | % | | 9.93 | % |
| Average total assets | | $ | 19,127,346 |
| | $ | 18,302,942 |
| | $ | 17,489,571 |
| | $ | 18,474,609 |
| | $ | 17,344,319 |
|
| Average total shareholders’ equity | | 2,020,903 |
| | 1,971,656 |
| | 1,853,122 |
| | 1,972,425 |
| | 1,843,633 |
|
| Average loans to average deposits ratio (excluding covered loans) | | 90.1 | % | | 90.4 | % | | 91.3 | % | | 90.0 | % | | 88.9 | % |
| Average loans to average deposits ratio (including covered loans) | | 91.8 | % | | 92.3 | % | | 94.3 | % | | 91.9 | % | | 92.3 | % |
| Common Share Data at end of period: | | | | | | | | | | |
| Market price per common share | | $ | 44.67 |
| | $ | 46.00 |
| | $ | 41.07 |
| | | | |
Book value per common share (2) | | $ | 40.74 |
| | $ | 40.21 |
| | $ | 38.09 |
| | | | |
Tangible common book value per share (2) | | $ | 31.60 |
| | $ | 31.64 |
| | $ | 29.89 |
| | | | |
| Common shares outstanding | | 46,691,047 |
| | 46,552,905 |
| | 39,731,043 |
| | | | |
Other Data at end of period:(8) | | | | | | | | | | |
Leverage Ratio (5) | | 10.0 | % | | 10.5 | % | | 10.5 | % | | | | |
Tier 1 capital to risk-weighted assets (5) | | 11.5 | % | | 11.7 | % | | 12.3 | % | | | | |
Total capital to risk-weighted assets (5) | | 12.9 | % | | 13.2 | % | | 13.1 | % | | | | |
Tangible common equity ratio (TCE) (2)(7) | | 7.9 | % | | 8.0 | % | | 7.9 | % | | | | |
Tangible common equity ratio, assuming full conversion of preferred stock (2) (7) | | 8.6 | % | | 8.7 | % | | 8.7 | % | | | | |
Allowance for credit losses (6) | | $ | 91,841 |
| | $ | 93,137 |
| | $ | 108,455 |
| | | | |
| Non-performing loans | | $ | 81,070 |
| | $ | 88,650 |
| | $ | 123,261 |
| | | | |
Allowance for credit losses to total loans (6) | | 0.65 | % | | 0.68 | % | | 0.86 | % | | | | |
| Non-performing loans to total loans | | 0.58 | % | | 0.64 | % | | 0.98 | % | | | | |
| Number of: | | | | | | | | | | |
| Bank subsidiaries | | 15 |
| | 15 |
| | 15 |
| | | | |
| Banking offices | | 139 |
| | 127 |
| | 119 |
| | | | |
| |
| (1) | Net revenue includes net interest income and non-interest income |
| |
| (2) | See “Supplemental Financial Measures/Ratios” for additional information on this performance measure/ratio. |
| |
| (3) | The net overhead ratio is calculated by netting total non-interest expense and total non-interest income, annualizing this amount, and dividing by that period’s total average assets. A lower ratio indicates a higher degree of efficiency. |
| |
| (4) | The efficiency ratio is calculated by dividing total non-interest expense by tax-equivalent net revenue (less securities gains or losses). A lower ratio indicates more efficient revenue generation. |
| |
| (5) | Capital ratios for current quarter-end are estimated. |
| |
| (6) | The allowance for credit losses includes both the allowance for loan losses and the allowance for unfunded lending-related commitments, but excludes the allowance for covered loan losses. |
| |
| (7) | Total shareholders’ equity minus preferred stock and total intangible assets divided by total assets minus total intangible assets. |
| |
| (8) | Asset quality ratios exclude covered loans. |
WINTRUST FINANCIAL CORPORATION AND SUBSIDIARIES
CONSOLIDATED STATEMENTS OF CONDITION
|
| | | | | | | | | | | | |
| (In thousands) | | (Unaudited) September 30, 2014 | | December 31, 2013 | | (Unaudited) September 30, 2013 |
| Assets | | | | | | |
| Cash and due from banks | | $ | 260,694 |
| | $ | 253,408 |
| | $ | 322,866 |
|
| Federal funds sold and securities purchased under resale agreements | | 26,722 |
| | 10,456 |
| | 7,771 |
|
| Interest bearing deposits with banks | | 620,370 |
| | 495,574 |
| | 681,834 |
|
| Available-for-sale securities, at fair value | | 1,782,648 |
| | 2,176,290 |
| | 1,781,883 |
|
| Trading account securities | | 6,015 |
| | 497 |
| | 259 |
|
| Federal Home Loan Bank and Federal Reserve Bank stock | | 80,951 |
| | 79,261 |
| | 76,755 |
|
| Brokerage customer receivables | | 26,624 |
| | 30,953 |
| | 29,253 |
|
| Mortgage loans held-for-sale | | 363,303 |
| | 334,327 |
| | 334,345 |
|
| Loans, net of unearned income, excluding covered loans | | 14,052,059 |
| | 12,896,602 |
| | 12,581,039 |
|
| Covered loans | | 254,605 |
| | 346,431 |
| | 415,988 |
|
| Total loans | | 14,306,664 |
| | 13,243,033 |
| | 12,997,027 |
|
| Less: Allowance for loan losses | | 91,019 |
| | 96,922 |
| | 107,188 |
|
| Less: Allowance for covered loan losses | | 2,655 |
| | 10,092 |
| | 12,924 |
|
| Net loans | | 14,212,990 |
| | 13,136,019 |
| | 12,876,915 |
|
| Premises and equipment, net | | 555,241 |
| | 531,947 |
| | 517,942 |
|
| FDIC indemnification asset | | 27,359 |
| | 85,672 |
| | 100,313 |
|
| Accrued interest receivable and other assets | | 494,213 |
| | 569,619 |
| | 576,121 |
|
| Trade date securities receivable | | 285,627 |
| | — |
| | — |
|
| Goodwill | | 406,604 |
| | 374,547 |
| | 357,309 |
|
| Other intangible assets | | 19,984 |
| | 19,213 |
| | 18,982 |
|
| Total assets | | $ | 19,169,345 |
| | $ | 18,097,783 |
| | $ | 17,682,548 |
|
| Liabilities and Shareholders’ Equity | | | | | | |
| Deposits: | | | | | | |
| Non-interest bearing | | $ | 3,253,477 |
| | $ | 2,721,771 |
| | $ | 2,622,518 |
|
| Interest bearing | | 12,811,769 |
| | 11,947,018 |
| | 12,024,928 |
|
| Total deposits | | 16,065,246 |
| | 14,668,789 |
| | 14,647,446 |
|
| Federal Home Loan Bank advances | | 347,500 |
| | 417,762 |
| | 387,852 |
|
| Other borrowings | | 51,483 |
| | 255,104 |
| | 248,416 |
|
| Subordinated notes | | 140,000 |
| | — |
| | 10,000 |
|
| Junior subordinated debentures | | 249,493 |
| | 249,493 |
| | 249,493 |
|
| Trade date securities payable | | — |
| | 303,088 |
| | — |
|
| Accrued interest payable and other liabilities | | 287,115 |
| | 302,958 |
| | 265,775 |
|
| Total liabilities | | 17,140,837 |
| | 16,197,194 |
| | 15,808,982 |
|
| Shareholders’ Equity: | | | | | | |
| Preferred stock | | 126,467 |
| | 126,477 |
| | 126,500 |
|
| Common stock | | 46,766 |
| | 46,181 |
| | 39,992 |
|
| Surplus | | 1,129,975 |
| | 1,117,032 |
| | 1,118,550 |
|
| Treasury stock | | (3,519 | ) | | (3,000 | ) | | (8,290 | ) |
| Retained earnings | | 771,519 |
| | 676,935 |
| | 643,228 |
|
| Accumulated other comprehensive loss | | (42,700 | ) | | (63,036 | ) | | (46,414 | ) |
| Total shareholders’ equity | | 2,028,508 |
| | 1,900,589 |
| | 1,873,566 |
|
| Total liabilities and shareholders’ equity | | $ | 19,169,345 |
| | $ | 18,097,783 |
| | $ | 17,682,548 |
|
WINTRUST FINANCIAL CORPORATION AND SUBSIDIARIES
CONSOLIDATED STATEMENTS OF INCOME (UNAUDITED)
|
| | | | | | | | | | | | | | | | | | | |
| Three Months Ended | | Nine Months Ended |
| (In thousands, except per share data) | September 30, 2014 | | June 30, 2014 | | September 30, 2013 | | September 30, 2014 | | September 30, 2013 |
| Interest income | | | | | | | | | |
| Interest and fees on loans | $ | 156,534 |
| | $ | 151,984 |
| | $ | 150,810 |
| | $ | 455,548 |
| | $ | 438,907 |
|
| Interest bearing deposits with banks | 409 |
| | 319 |
| | 229 |
| | 977 |
| | 1,209 |
|
| Federal funds sold and securities purchased under resale agreements | 12 |
| | 6 |
| | 4 |
| | 22 |
| | 23 |
|
| Available-for-sale securities | 12,767 |
| | 13,309 |
| | 9,224 |
| | 39,190 |
| | 27,335 |
|
| Trading account securities | 20 |
| | 5 |
| | 14 |
| | 34 |
| | 27 |
|
| Federal Home Loan Bank and Federal Reserve Bank stock | 733 |
| | 727 |
| | 687 |
| | 2,171 |
| | 2,064 |
|
| Brokerage customer receivables | 201 |
| | 200 |
| | 200 |
| | 610 |
| | 562 |
|
| Total interest income | 170,676 |
| | 166,550 |
| | 161,168 |
| | 498,552 |
| | 470,127 |
|
| Interest expense | | | | | | | | | |
| Interest on deposits | 12,298 |
| | 11,759 |
| | 12,524 |
| | 35,980 |
| | 40,703 |
|
| Interest on Federal Home Loan Bank advances | 2,641 |
| | 2,705 |
| | 2,729 |
| | 7,989 |
| | 8,314 |
|
| Interest on other borrowings | 200 |
| | 510 |
| | 910 |
| | 1,460 |
| | 3,196 |
|
| Interest on subordinated notes | 1,776 |
| | 354 |
| | 40 |
| | 2,130 |
| | 151 |
|
| Interest on junior subordinated debentures | 2,091 |
| | 2,042 |
| | 3,183 |
| | 6,137 |
| | 9,444 |
|
| Total interest expense | 19,006 |
| | 17,370 |
| | 19,386 |
| | 53,696 |
| | 61,808 |
|
| Net interest income | 151,670 |
| | 149,180 |
| | 141,782 |
| | 444,856 |
| | 408,319 |
|
| Provision for credit losses | 5,864 |
| | 6,660 |
| | 11,114 |
| | 14,404 |
| | 42,183 |
|
| Net interest income after provision for credit losses | 145,806 |
| | 142,520 |
| | 130,668 |
| | 430,452 |
| | 366,136 |
|
| Non-interest income | | | | | | | | | |
| Wealth management | 17,659 |
| | 18,222 |
| | 16,057 |
| | 52,694 |
| | 46,777 |
|
| Mortgage banking | 26,691 |
| | 23,804 |
| | 25,682 |
| | 66,923 |
| | 87,561 |
|
| Service charges on deposit accounts | 6,084 |
| | 5,688 |
| | 5,308 |
| | 17,118 |
| | 15,136 |
|
| (Losses) gains on available-for-sale securities, net | (153 | ) | | (336 | ) | | 75 |
| | (522 | ) | | 328 |
|
| Fees from covered call options | 2,107 |
| | 1,244 |
| | 285 |
| | 4,893 |
| | 2,917 |
|
| Trading gains (losses), net | 293 |
| | (743 | ) | | (1,655 | ) | | (1,102 | ) | | 1,170 |
|
| Other | 5,271 |
| | 6,223 |
| | 8,910 |
| | 17,579 |
| | 22,147 |
|
| Total non-interest income | 57,952 |
| | 54,102 |
| | 54,662 |
| | 157,583 |
| | 176,036 |
|
| Non-interest expense | | | | | | | | | |
| Salaries and employee benefits | 85,976 |
| | 81,963 |
| | 78,007 |
| | 247,873 |
| | 234,745 |
|
| Equipment | 7,570 |
| | 7,223 |
| | 6,593 |
| | 22,196 |
| | 19,190 |
|
| Occupancy, net | 10,446 |
| | 9,850 |
| | 9,079 |
| | 31,289 |
| | 26,639 |
|
| Data processing | 4,765 |
| | 4,543 |
| | 4,884 |
| | 14,023 |
| | 13,841 |
|
| Advertising and marketing | 3,528 |
| | 3,558 |
| | 2,772 |
| | 9,902 |
| | 7,534 |
|
| Professional fees | 4,035 |
| | 4,046 |
| | 3,378 |
| | 11,535 |
| | 10,790 |
|
| Amortization of other intangible assets | 1,202 |
| | 1,156 |
| | 1,154 |
| | 3,521 |
| | 3,438 |
|
| FDIC insurance | 3,211 |
| | 3,196 |
| | 3,245 |
| | 9,358 |
| | 9,692 |
|
| OREO expense, net | 581 |
| | 2,490 |
| | 2,499 |
| | 7,047 |
| | 3,163 |
|
| Other | 17,186 |
| | 15,566 |
| | 15,637 |
| | 46,662 |
| | 46,522 |
|
| Total non-interest expense | 138,500 |
| | 133,591 |
| | 127,248 |
| | 403,406 |
| | 375,554 |
|
| Income before taxes | 65,258 |
| | 63,031 |
| | 58,082 |
| | 184,629 |
| | 166,618 |
|
| Income tax expense | 25,034 |
| | 24,490 |
| | 22,519 |
| | 71,364 |
| | 64,696 |
|
| Net income | $ | 40,224 |
| | $ | 38,541 |
| | $ | 35,563 |
| | $ | 113,265 |
| | $ | 101,922 |
|
| Preferred stock dividends and discount accretion | 1,581 |
| | 1,581 |
| | 1,581 |
| | 4,743 |
| | 6,814 |
|
| Net income applicable to common shares | $ | 38,643 |
| | $ | 36,960 |
| | $ | 33,982 |
| | $ | 108,522 |
| | $ | 95,108 |
|
| Net income per common share - Basic | $ | 0.83 |
| | $ | 0.79 |
| | $ | 0.86 |
| | $ | 2.34 |
| | $ | 2.51 |
|
| Net income per common share - Diluted | $ | 0.79 |
| | $ | 0.76 |
| | $ | 0.71 |
| | $ | 2.23 |
| | $ | 2.05 |
|
| Cash dividends declared per common share | $ | 0.10 |
| | $ | 0.10 |
| | $ | 0.09 |
| | $ | 0.30 |
| | $ | 0.18 |
|
| Weighted average common shares outstanding | 46,639 |
| | 46,520 |
| | 39,331 |
| | 46,453 |
| | 37,939 |
|
| Dilutive potential common shares | 4,241 |
| | 4,402 |
| | 10,823 |
| | 4,349 |
| | 11,763 |
|
| Average common shares and dilutive common shares | 50,880 |
| | 50,922 |
| | 50,154 |
| | 50,802 |
| | 49,702 |
|
SUPPLEMENTAL FINANCIAL MEASURES/RATIOS
The accounting and reporting policies of Wintrust conform to generally accepted accounting principles (“GAAP”) in the United States and prevailing practices in the banking industry. However, certain non-GAAP performance measures and ratios are used by management to evaluate and measure the Company’s performance. These include taxable-equivalent net interest income (including its individual components), net interest margin (including its individual components), the efficiency ratio, tangible common equity ratio, tangible common book value per share and return on average tangible common equity. Management believes that these measures and ratios provide users of the Company’s financial information a more meaningful view of the performance of the interest-earning assets and interest-bearing liabilities and of the Company’s operating efficiency. Other financial holding companies may define or calculate these measures and ratios differently.
Management reviews yields on certain asset categories and the net interest margin of the Company and its banking subsidiaries on a fully taxable-equivalent (“FTE”) basis. In this non-GAAP presentation, net interest income is adjusted to reflect tax-exempt interest income on an equivalent before-tax basis. This measure ensures comparability of net interest income arising from both taxable and tax-exempt sources. Net interest income on a FTE basis is also used in the calculation of the Company’s efficiency ratio. The efficiency ratio, which is calculated by dividing non-interest expense by total taxable-equivalent net revenue (less securities gains or losses), measures how much it costs to produce one dollar of revenue. Securities gains or losses are excluded from this calculation to better match revenue from daily operations to operational expenses. Management considers the tangible common equity ratio and tangible book value per common share as useful measurements of the Company’s equity. The Company references the return on average tangible common equity as a measurement of profitability.
The following table presents a reconciliation of certain non-GAAP performance measures and ratios used by the Company to evaluate and measure the Company’s performance to the most directly comparable GAAP financial measures for the last five quarters. |
| | | | | | | | | | | | | | | | | | | | | | | | | | | |
| | Three Months Ended | | Nine Months Ended |
| | September 30, | | June 30, | | March 31, | | December 31, | | September 30, | | September 30, | | September 30, |
| (Dollars and shares in thousands) | 2014 | | 2014 | | 2014 | | 2013 | | 2013 | | 2014 | | 2013 |
| Calculation of Net Interest Margin and Efficiency Ratio | | | | | | | | | | | | | |
| (A) Interest Income (GAAP) | $ | 170,676 |
| | $ | 166,550 |
| | $ | 161,326 |
| | $ | 160,582 |
| | $ | 161,168 |
| | $ | 498,552 |
| | $ | 470,127 |
|
| Taxable-equivalent adjustment: | | | | | | | | | | | | | |
| - Loans | 315 |
| | 281 |
| | 231 |
| | 226 |
| | 241 |
| | 827 |
| | 616 |
|
| - Liquidity Management Assets | 502 |
| | 489 |
| | 455 |
| | 347 |
| | 361 |
| | 1,445 |
| | 1,060 |
|
| - Other Earning Assets | 11 |
| | 2 |
| | 4 |
| | (1 | ) | | 7 |
| | 17 |
| | 12 |
|
| Interest Income - FTE | $ | 171,504 |
| | $ | 167,322 |
| | $ | 162,016 |
| | $ | 161,154 |
| | $ | 161,777 |
| | $ | 500,841 |
| | $ | 471,815 |
|
| (B) Interest Expense (GAAP) | 19,006 |
| | 17,370 |
| | 17,320 |
| | 18,274 |
| | 19,386 |
| | 53,696 |
| | 61,808 |
|
| Net interest income - FTE | $ | 152,498 |
| | $ | 149,952 |
| | $ | 144,696 |
| | $ | 142,880 |
| | $ | 142,391 |
| | $ | 447,145 |
| | $ | 410,007 |
|
| (C) Net Interest Income (GAAP) (A minus B) | $ | 151,670 |
| | $ | 149,180 |
| | $ | 144,006 |
| | $ | 142,308 |
| | $ | 141,782 |
| | $ | 444,856 |
| | $ | 408,319 |
|
| (D) Net interest margin (GAAP) | 3.45 | % | | 3.60 | % | | 3.59 | % | | 3.51 | % | | 3.55 | % | | 3.54 | % | | 3.48 | % |
| Net interest margin - FTE | 3.46 | % | | 3.62 | % | | 3.61 | % | | 3.53 | % | | 3.57 | % | | 3.56 | % | | 3.49 | % |
| (E) Efficiency ratio (GAAP) | 66.02 | % | | 65.61 | % | | 69.27 | % | | 66.15 | % | | 64.80 | % | | 66.90 | % | | 64.30 | % |
| Efficiency ratio - FTE | 65.76 | % | | 65.36 | % | | 69.02 | % | | 65.95 | % | | 64.60 | % | | 66.65 | % | | 64.12 | % |
| (F) Net Overhead Ratio (GAAP) | 1.67 | % | | 1.74 | % | | 1.93 | % | | 1.79 | % | | 1.65 | % | | 1.78 | % | | 1.54 | % |
| Calculation of Tangible Common Equity ratio (at period end) | | | | | | | | | | | | | |
| Total shareholders’ equity | $ | 2,028,508 |
| | $ | 1,998,235 |
| | $ | 1,940,143 |
| | $ | 1,900,589 |
| | $ | 1,873,566 |
| | | | |
| (G) Less: Preferred stock | (126,467 | ) | | (126,467 | ) | | (126,477 | ) | | (126,477 | ) | | (126,500 | ) | | | | |
| Less: Intangible assets | (426,588 | ) | | (398,615 | ) | | (391,775 | ) | | (393,760 | ) | | (376,291 | ) | | | | |
| (H) Total tangible common shareholders’ equity | $ | 1,475,453 |
| | $ | 1,473,153 |
| | $ | 1,421,891 |
| | $ | 1,380,352 |
| | $ | 1,370,755 |
| | | | |
| Total assets | $ | 19,169,345 |
| | $ | 18,895,681 |
| | $ | 18,221,163 |
| | $ | 18,097,783 |
| | $ | 17,682,548 |
| | | | |
| Less: Intangible assets | (426,588 | ) | | (398,615 | ) | | (391,775 | ) | | (393,760 | ) | | (376,291 | ) | | | | |
| (I) Total tangible assets | $ | 18,742,757 |
| | $ | 18,497,066 |
| | $ | 17,829,388 |
| | $ | 17,704,023 |
| | $ | 17,306,257 |
| | | | |
| Tangible common equity ratio (H/I) | 7.9 | % | | 8.0 | % | | 8.0 | % | | 7.8 | % | | 7.9 | % | | | | |
| Tangible common equity ratio, assuming full conversion of preferred stock ((H-G)/I) | 8.6 | % | | 8.7 | % | | 8.7 | % | | 8.5 | % | | 8.7 | % | | | | |
| Calculation of book value per share | | | | | | | | | | | | | |
| Total shareholders’ equity | $ | 2,028,508 |
| | $ | 1,998,235 |
| | $ | 1,940,143 |
| | $ | 1,900,589 |
| | $ | 1,873,566 |
| | | | |
| Less: Preferred stock | (126,467 | ) | | (126,467 | ) | | (126,477 | ) | | (126,477 | ) | | (126,500 | ) | | | | |
| (J) Total common equity | $ | 1,902,041 |
| | $ | 1,871,768 |
| | $ | 1,813,666 |
| | $ | 1,774,112 |
| | $ | 1,747,066 |
| | | | |
| Actual common shares outstanding | 46,691 |
| | 46,553 |
| | 46,259 |
| | 46,117 |
| | 39,731 |
| | | | |
| Add: TEU conversion shares | — |
| | — |
| | — |
| | — |
| | 6,133 |
| | | | |
| (K) Common shares used for book value calculation | 46,691 |
| | 46,553 |
| | 46,259 |
| | 46,117 |
| | 45,864 |
| | | | |
| Book value per share (J/K) | $ | 40.74 |
| | $ | 40.21 |
| | $ | 39.21 |
| | $ | 38.47 |
| | $ | 38.09 |
| | | | |
| Tangible common book value per share (H/K) | $ | 31.60 |
| | $ | 31.64 |
| | $ | 30.74 |
| | $ | 29.93 |
| | $ | 29.89 |
| | | | |
| Calculation of return on average common equity | | | | | | | | | | | | | |
| (L) Net income applicable to common shares | 38,643 |
| | 36,960 |
| | 32,919 |
| | 33,707 |
| | 33,982 |
| | 108,522 |
| | 95,108 |
|
| Add: After-tax intangible asset amortization | 739 |
| | 708 |
| | 712 |
| | 726 |
| | 705 |
| | 2,159 |
| | 2,102 |
|
| (M) Tangible net income applicable to common shares | 39,382 |
| | 37,668 |
| | 33,631 |
| | 34,433 |
| | 34,687 |
| | 110,681 |
| | 97,210 |
|
| Total average shareholders' equity | 2,020,903 |
| | 1,971,656 |
| | 1,923,649 |
| | 1,895,498 |
| | 1,853,122 |
| | 1,972,425 |
| | 1,843,633 |
|
| Less: Average preferred stock | (126,467 | ) | | (126,473 | ) | | (126,477 | ) | | (126,484 | ) | | (136,278 | ) | | (126,472 | ) | | (162,904 | ) |
| (N) Total average common shareholders' equity | 1,894,436 |
| | 1,845,183 |
| | 1,797,172 |
| | 1,769,014 |
| | 1,716,844 |
| | 1,845,953 |
| | 1,680,729 |
|
| Less: Average intangible assets | (419,125 | ) | | (396,425 | ) | | (392,703 | ) | | (391,791 | ) | | (376,667 | ) | | (402,848 | ) | | (371,697 | ) |
| (O) Total average tangible common shareholders’ equity | 1,475,311 |
| | 1,448,758 |
| | 1,404,469 |
| | 1,377,223 |
| | 1,340,177 |
| | 1,443,105 |
| | 1,309,032 |
|
| Return on average common equity, annualized (L/N) | 8.09 | % | | 8.03 | % | | 7.43 | % | | 7.56 | % | | 7.85 | % | | 7.86 | % | | 7.57 | % |
| Return on average tangible common equity, annualized (M/O) | 10.59 | % | | 10.43 | % | | 9.71 | % | | 9.92 | % | | 10.27 | % | | 10.25 | % | | 9.93 | % |
LOANS
Loan Portfolio Mix and Growth Rates
|
| | | | | | | | | | | | | | | | | | |
| | | | | | | | | % Growth |
| (Dollars in thousands) | | September 30, 2014 | | December 31, 2013 | | September 30, 2013 | | From (1) December 31, 2013 | | From September 30, 2013 |
| Balance: | | | | | | | | | | |
| Commercial | | $ | 3,689,671 |
| | $ | 3,253,687 |
| | $ | 3,109,121 |
| | 18 | % | | 19 | % |
| Commercial real-estate | | 4,510,375 |
| | 4,230,035 |
| | 4,146,110 |
| | 9 |
| | 9 |
|
| Home equity | | 720,058 |
| | 719,137 |
| | 736,620 |
| | — |
| | (2 | ) |
| Residential real-estate | | 470,319 |
| | 434,992 |
| | 397,707 |
| | 11 |
| | 18 |
|
| Premium finance receivables - commercial | | 2,377,892 |
| | 2,167,565 |
| | 2,150,481 |
| | 13 |
| | 11 |
|
| Premium finance receivables - life insurance | | 2,134,405 |
| | 1,923,698 |
| | 1,869,739 |
| | 15 |
| | 14 |
|
Consumer and other(2) | | 149,339 |
| | 167,488 |
| | 171,261 |
| | (14 | ) | | (13 | ) |
| Total loans, net of unearned income, excluding covered loans | | $ | 14,052,059 |
| | $ | 12,896,602 |
| | $ | 12,581,039 |
| | 12 | % | | 12 | % |
| Covered loans | | 254,605 |
| | 346,431 |
| | 415,988 |
| | (35 | ) | | (39 | ) |
| Total loans, net of unearned income | | $ | 14,306,664 |
| | $ | 13,243,033 |
| | $ | 12,997,027 |
| | 11 | % | | 10 | % |
| Mix: | | | | | | | | | | |
| Commercial | | 26 | % | | 25 | % | | 24 | % | | | | |
| Commercial real-estate | | 31 |
| | 32 |
| | 32 |
| | | | |
| Home equity | | 5 |
| | 5 |
| | 6 |
| | | | |
| Residential real-estate | | 3 |
| | 3 |
| | 3 |
| | | | |
| Premium finance receivables - commercial | | 17 |
| | 16 |
| | 16 |
| | | | |
| Premium finance receivables - life insurance | | 15 |
| | 15 |
| | 14 |
| | | | |
Consumer and other(2) | | 1 |
| | 1 |
| | 2 |
| | | | |
| Total loans, net of unearned income, excluding covered loans | | 98 | % | | 97 | % | | 97 | % | | | | |
| Covered loans | | 2 |
| | 3 |
| | 3 |
| | | | |
| Total loans, net of unearned income | | 100 | % | | 100 | % | | 100 | % | | | | |
| |
| (2) | Includes autos, boats, snowmobiles and other indirect consumer loans. |
|
| | | | | | | | | | | | | | | | | | | |
| | | | | | | | | | | |
| As of September 30, 2014 | | | | % of Total Balance | | Nonaccrual | | > 90 Days Past Due and Still Accruing | | Allowance For Loan Losses Allocation |
| | | |
| (Dollars in thousands) | | Balance | |
| Commercial: | | | | | | | | | | |
| Commercial and industrial | | $ | 2,070,827 |
| | 25.3 | % | | $ | 10,430 |
| | $ | — |
| | $ | 17,651 |
|
| Franchise | | 238,300 |
| | 2.9 |
| | — |
| | — |
| | 1,989 |
|
| Mortgage warehouse lines of credit | | 121,585 |
| | 1.5 |
| | — |
| | — |
| | 1,042 |
|
| Community Advantage - homeowner associations | | 99,595 |
| | 1.2 |
| | — |
| | — |
| | 4 |
|
| Aircraft | | 6,146 |
| | 0.1 |
| | — |
| | — |
| | 7 |
|
| Asset-based lending | | 781,927 |
| | 9.5 |
| | 25 |
| | — |
| | 5,815 |
|
| Tax exempt | | 205,150 |
| | 2.5 |
| | — |
| | — |
| | 1,107 |
|
| Leases | | 145,439 |
| | 1.8 |
| | — |
| | — |
| | 13 |
|
| Other | | 11,403 |
| | 0.1 |
| | — |
| | — |
| | 95 |
|
PCI - commercial loans (1) | | 9,299 |
| | 0.1 |
| | — |
| | 863 |
| | 189 |
|
| Total commercial | | $ | 3,689,671 |
| | 45.0 | % | | $ | 10,455 |
| | $ | 863 |
| | $ | 27,912 |
|
| Commercial Real-Estate: | | | | | | | | | | |
| Residential construction | | $ | 30,237 |
| | 0.4 | % | | $ | — |
| | $ | — |
| | $ | 522 |
|
| Commercial construction | | 159,808 |
| | 1.9 |
| | 425 |
| | — |
| | 2,406 |
|
| Land | | 101,239 |
| | 1.2 |
| | 2,556 |
| | — |
| | 2,782 |
|
| Office | | 699,340 |
| | 8.5 |
| | 7,366 |
| | — |
| | 5,267 |
|
| Industrial | | 627,886 |
| | 7.7 |
| | 2,626 |
| | — |
| | 4,535 |
|
| Retail | | 725,890 |
| | 8.9 |
| | 6,205 |
| | — |
| | 5,990 |
|
| Multi-family | | 677,971 |
| | 8.3 |
| | 249 |
| | — |
| | 5,038 |
|
| Mixed use and other | | 1,427,386 |
| | 17.4 |
| | 7,936 |
| | — |
| | 12,112 |
|
PCI - commercial real-estate (1) | | 60,618 |
| | 0.7 |
| | — |
| | 14,294 |
| | 7 |
|
| Total commercial real-estate | | $ | 4,510,375 |
| | 55.0 | % | | $ | 27,363 |
| | $ | 14,294 |
| | $ | 38,659 |
|
| Total commercial and commercial real-estate | | $ | 8,200,046 |
| | 100.0 | % | | $ | 37,818 |
| | $ | 15,157 |
| | $ | 66,571 |
|
| | | | | | | | | | | |
| Commercial real-estate - collateral location by state: | | | | | | | | | | |
| Illinois | | $ | 3,742,411 |
| | 83.0 | % | | | | | | |
| Wisconsin | | 440,046 |
| | 9.8 |
| | | | | | |
| Total primary markets | | $ | 4,182,457 |
| | 92.8 | % | | | | | | |
| Florida | | 82,577 |
| | 1.8 |
| | | | | | |
| Arizona | | 10,414 |
| | 0.2 |
| | | | | | |
| Indiana | | 89,254 |
| | 2.0 |
| | | | | | |
| Other (no individual state greater than 0.5%) | | 145,673 |
| | 3.2 |
| | | | | | |
| Total | | $ | 4,510,375 |
| | 100.0 | % | | | | | | |
| |
| (1) | Purchased credit impaired ("PCI") loans represent loans acquired with evidence of credit quality deterioration since origination, in accordance with ASC 310-30. Loan agings are based upon contractually required payments. |
DEPOSITS
Deposit Portfolio Mix and Growth Rates
|
| | | | | | | | | | | | | | | | | | |
| | | | | | | | % Growth |
| (Dollars in thousands) | | September 30, 2014 | | December 31, 2013 | | September 30, 2013 | | From (1) December 31, 2013 | | From September 30, 2013 |
| Balance: | | | | | | | | | | |
| Non-interest bearing | | $ | 3,253,477 |
| | $ | 2,721,771 |
| | $ | 2,622,518 |
| | 26 | % | | 24 | % |
| NOW and interest bearing demand deposits | | 2,086,099 |
| | 1,953,882 |
| | 1,922,906 |
| | 9 |
| | 8 |
|
Wealth Management deposits (2) | | 1,212,317 |
| | 1,013,850 |
| | 1,099,509 |
| | 26 |
| | 10 |
|
| Money Market | | 3,744,682 |
| | 3,359,999 |
| | 3,423,413 |
| | 15 |
| | 9 |
|
| Savings | | 1,465,250 |
| | 1,392,575 |
| | 1,318,147 |
| | 7 |
| | 11 |
|
| Time certificates of deposit | | 4,303,421 |
| | 4,226,712 |
| | 4,260,953 |
| | 2 |
| | 1 |
|
| Total deposits | | $ | 16,065,246 |
| | $ | 14,668,789 |
| | $ | 14,647,446 |
| | 13 | % | | 10 | % |
| Mix: | | | | | | | | | | |
| Non-interest bearing | | 20 | % | | 19 | % | | 18 | % | | | | |
| NOW and interest bearing demand deposits | | 13 |
| | 13 |
| | 13 |
| | | | |
Wealth Management deposits (2) | | 8 |
| | 7 |
| | 8 |
| | | | |
| Money Market | | 23 |
| | 23 |
| | 23 |
| | | | |
| Savings | | 9 |
| | 9 |
| | 9 |
| | | | |
| Time certificates of deposit | | 27 |
| | 29 |
| | 29 |
| | | | |
| Total deposits | | 100 | % | | 100 | % | | 100 | % | | | | |
| |
| (2) | Represents deposit balances of the Company’s subsidiary banks from brokerage customers of Wayne Hummer Investments, trust and asset management customers of The Chicago Trust Company and brokerage customers from unaffiliated companies which have been placed into deposit accounts of the Banks. |
Time Certificates of Deposit
Maturity/Re-pricing Analysis
As of September 30, 2014
|
| | | | | | | | | | | | | | | | | | | | | | | |
| (Dollars in thousands) | | CDARs & Brokered Certificates of Deposit (1) | | MaxSafe Certificates of Deposit (1) | | Variable Rate Certificates of Deposit (2) | | Other Fixed Rate Certificates of Deposit (1) | | Total Time Certificates of Deposit | | Weighted-Average Rate of Maturing Time Certificates of Deposit (3) |
| 1-3 months | | $ | 80,052 |
| | $ | 77,966 |
| | $ | 156,916 |
| | $ | 578,561 |
| | $ | 893,495 |
| | 0.45 | % |
| 4-6 months | | 95,586 |
| | 55,503 |
| | — |
| | 543,488 |
| | 694,577 |
| | 0.85 | % |
| 7-9 months | | 69,396 |
| | 32,297 |
| | — |
| | 516,980 |
| | 618,673 |
| | 0.75 | % |
| 10-12 months | | 36,459 |
| | 39,888 |
| | — |
| | 515,125 |
| | 591,472 |
| | 0.81 | % |
| 13-18 months | | 2,168 |
| | 30,946 |
| | — |
| | 527,831 |
| | 560,945 |
| | 0.91 | % |
| 19-24 months | | 201,652 |
| | 8,460 |
| | — |
| | 228,897 |
| | 439,009 |
| | 0.97 | % |
| 24+ months | | 41,000 |
| | 19,535 |
| | — |
| | 444,715 |
| | 505,250 |
| | 1.19 | % |
| Total | | $ | 526,313 |
| | $ | 264,595 |
| | $ | 156,916 |
| | $ | 3,355,597 |
| | $ | 4,303,421 |
| | 0.81 | % |
| |
| (1) | This category of certificates of deposit is shown by contractual maturity date. |
| |
| (2) | This category includes variable rate certificates of deposit and savings certificates with the majority repricing on at least a monthly basis. |
| |
| (3) | Weighted-average rate excludes the impact of purchase accounting fair value adjustments. |
NET INTEREST INCOME
The following table presents a summary of Wintrust’s average balances, net interest income and related net interest margins, calculated on a fully tax-equivalent basis, for the third quarter of 2014 compared to the second quarter of 2014 (sequential quarters) and third quarter of 2013 (linked quarters), respectively:
|
| | | | | | | | | | | | | | | | | | | | | | | | | | | | | | | | |
| | Average Balance for three months ended, |
| Interest for three months ended, |
| Yield/Rate for three months ended, |
| (Dollars in thousands) | September 30, 2014 | | June 30, 2014 |
| September 30, 2013 |
| September 30, 2014 |
| June 30, 2014 |
| September 30, 2013 |
| September 30, 2014 |
| June 30, 2014 |
| September 30, 2013 |
Liquidity management assets(1)(2)(7) | $ | 2,814,720 |
|
| $ | 2,607,980 |
|
| $ | 2,262,839 |
|
| $ | 14,423 |
|
| $ | 14,850 |
|
| $ | 10,504 |
|
| 2.03 | % |
| 2.28 | % |
| 1.84 | % |
Other earning assets(2)(3)(7) | 28,702 |
|
| 27,463 |
|
| 27,426 |
|
| 232 |
|
| 207 |
|
| 221 |
|
| 3.21 |
|
| 3.02 |
|
| 3.19 |
|
Loans, net of unearned income(2)(4)(7) | 14,359,467 |
|
| 13,710,535 |
|
| 13,113,138 |
|
| 151,540 |
|
| 145,169 |
|
| 142,085 |
|
| 4.19 |
|
| 4.25 |
|
| 4.30 |
|
| Covered loans | 262,310 |
|
| 292,553 |
|
| 435,961 |
|
| 5,309 |
|
| 7,096 |
|
| 8,967 |
|
| 8.03 |
|
| 9.73 |
|
| 8.16 |
|
Total earning assets(7) | $ | 17,465,199 |
|
| $ | 16,638,531 |
|
| $ | 15,839,364 |
|
| $ | 171,504 |
|
| $ | 167,322 |
|
| $ | 161,777 |
|
| 3.90 | % |
| 4.03 | % |
| 4.05 | % |
| Allowance for loan and covered loan losses | (96,463 | ) |
| (98,255 | ) |
| (126,164 | ) |
|
|
|
|
|
|
|
|
|
|
|
|
|
|
|
|
|
|
| Cash and due from banks | 237,402 |
|
| 232,716 |
|
| 209,539 |
|
|
|
|
|
|
|
|
|
|
|
|
|
|
|
|
|
|
|
| Other assets | 1,521,208 |
|
| 1,529,950 |
|
| 1,566,832 |
|
|
|
|
|
|
|
|
|
|
|
|
|
|
|
|
|
|
|
| Total assets | $ | 19,127,346 |
|
| $ | 18,302,942 |
|
| $ | 17,489,571 |
|
|
|
|
|
|
|
|
|
|
|
|
|
|
|
|
|
|
|
|
|
|
|
|
|
|
|
|
|
|
|
|
|
|
|
|
|
|
|
|
|
|
|
|
|
|
| Interest-bearing deposits | $ | 12,695,780 |
|
| $ | 12,284,444 |
|
| $ | 11,817,636 |
|
| $ | 12,298 |
|
| $ | 11,759 |
|
| $ | 12,524 |
|
| 0.38 | % |
| 0.38 | % |
| 0.42 | % |
| Federal Home Loan Bank advances | 380,083 |
|
| 446,778 |
|
| 454,563 |
|
| 2,641 |
|
| 2,705 |
|
| 2,729 |
|
| 2.76 |
|
| 2.43 |
|
| 2.38 |
|
| Other borrowings | 54,653 |
|
| 148,135 |
|
| 256,318 |
|
| 200 |
|
| 510 |
|
| 910 |
|
| 1.45 |
|
| 1.38 |
|
| 1.41 |
|
| Subordinated notes | 140,000 |
|
| 27,692 |
|
| 10,000 |
|
| 1,776 |
|
| 354 |
|
| 40 |
|
| 5.07 |
|
| 5.06 |
|
| 1.57 |
|
| Junior subordinated notes | 249,493 |
|
| 249,493 |
|
| 249,493 |
|
| 2,091 |
|
| 2,042 |
|
| 3,183 |
|
| 3.28 |
|
| 3.24 |
|
| 4.99 |
|
| Total interest-bearing liabilities | $ | 13,520,009 |
|
| $ | 13,156,542 |
|
| $ | 12,788,010 |
|
| $ | 19,006 |
|
| $ | 17,370 |
|
| $ | 19,386 |
|
| 0.56 | % |
| 0.53 | % |
| 0.60 | % |
| Non-interest bearing deposits | 3,233,937 |
|
| 2,880,501 |
|
| 2,552,182 |
|
|
|
|
|
|
|
|
|
|
|
|
|
|
|
|
|
|
|
| Other liabilities | 352,497 |
|
| 294,243 |
|
| 296,257 |
|
|
|
|
|
|
|
|
|
|
|
|
|
|
|
|
|
|
|
| Equity | 2,020,903 |
|
| 1,971,656 |
|
| 1,853,122 |
|
|
|
|
|
|
|
|
|
|
|
|
|
|
|
|
|
|
|
| Total liabilities and shareholders’ equity | $ | 19,127,346 |
|
| $ | 18,302,942 |
|
| $ | 17,489,571 |
|
|
|
|
|
|
|
|
|
|
|
|
|
|
|
|
|
|
|
Interest rate spread(5)(7) |
|
|
| |
| |
|
|
|
|
|
|
|
|
|
| 3.34 | % |
| 3.50 | % |
| 3.45 | % |
Net free funds/contribution(6) | $ | 3,945,190 |
|
| $ | 3,481,989 |
|
| $ | 3,051,354 |
|
|
|
|
|
|
|
|
|
|
| 0.12 | % |
| 0.12 | % |
| 0.12 | % |
Net interest income/ margin(7) |
|
|
|
|
|
|
|
|
| $ | 152,498 |
|
| $ | 149,952 |
|
| $ | 142,391 |
|
| 3.46 | % |
| 3.62 | % |
| 3.57 | % |
| |
| (1) | Liquidity management assets include available-for-sale securities, interest earning deposits with banks, federal funds sold and securities purchased under resale agreements. |
| |
| (2) | Interest income on tax-advantaged loans, trading securities and securities reflects a tax-equivalent adjustment based on a marginal federal corporate tax rate of 35%. The total adjustments for the three months ended September 30, 2014, June 30, 2014 and September 30, 2013 were $828,000, $772,000 and $609,000, respectively. |
| |
| (3) | Other earning assets include brokerage customer receivables and trading account securities. |
| |
| (4) | Loans, net of unearned income, include loans held-for-sale and non-accrual loans. |
| |
| (5) | Interest rate spread is the difference between the yield earned on earning assets and the rate paid on interest-bearing liabilities. |
| |
| (6) | Net free funds are the difference between total average earning assets and total average interest-bearing liabilities. The estimated contribution to net interest margin from net free funds is calculated using the rate paid for total interest-bearing liabilities. |
| |
| (7) | See “Supplemental Financial Measures/Ratios” for additional information on this performance ratio. |
Net interest margin declined 16 basis points from 3.62% in the second quarter of 2014 to 3.46% in the third quarter of 2014 primarily as a result of increased interest expense related to the subordinated debt issued in June 2014, a reduction in commercial and commercial real estate loan yields, excess liquidity resulting from acquisitions during the period, and run-off of the covered loan portfolio. The $140 million subordinated debt issuance completed in June 2014 strengthened our capital ratios and cash position but reduced the net interest margin in the third quarter by six basis points. The acquisitions in the third quarter added approximately $300 million of liquidity, which resulted in a three basis point reduction to the net interest margin. Competitive pricing in the commercial and commercial real estate markets negatively impacted the net interest margin by four basis points while the run-off of covered loans reduced the net interest margin by an additional three basis points in the third quarter.
The following table presents a summary of Wintrust's average balances, net interest income and related net interest margins, calculated on a fully tax-equivalent basis, for the nine months ended September 30, 2014 compared to the nine months ended September 30, 2013:
|
| | | | | | | | | | | | | | | | | | | | | |
| | Average Balance for nine months ended, | | Interest for nine months ended, | | Yield/Rate for nine months ended, |
| (Dollars in thousands) | September 30, 2014 | | September 30, 2013 | | September 30, 2014 | | September 30, 2013 | | September 30, 2014 | | September 30, 2013 |
Liquidity management assets(1)(2)(7) | $ | 2,690,422 |
| | $ | 2,538,131 |
| | $ | 43,805 |
| | $ | 31,690 |
| | 2.18 | % | | 1.67 | % |
Other earning assets(2)(3)(7) | 28,363 |
| | 25,815 |
| | 661 |
| | 602 |
| | 3.12 |
| | 3.12 |
|
Loans, net of unearned income(2)(4)(7) | 13,786,669 |
| | 12,640,610 |
| | 437,030 |
| | 410,964 |
| | 4.24 |
| | 4.35 |
|
| Covered loans | 293,349 |
| | 487,581 |
| | 19,345 |
| | 28,559 |
| | 8.82 |
| | 7.83 |
|
Total earning assets(7) | $ | 16,798,803 |
| | $ | 15,692,137 |
| | $ | 500,841 |
| | $ | 471,815 |
| | 3.99 | % | | 4.02 | % |
| Allowance for loan and covered loan losses | (101,624 | ) | | (125,950 | ) | | | | | | | | |
| Cash and due from banks | 231,199 |
| | 217,503 |
| | | | | | | | |
| Other assets | 1,546,231 |
| | 1,560,629 |
| | | | | | | | |
| Total assets | $ | 18,474,609 |
| | $ | 17,344,319 |
| | | | | | | | |
| | | | | | | | | | | | |
| Interest-bearing deposits | $ | 12,369,241 |
| | $ | 11,813,674 |
| | $ | 35,980 |
| | $ | 40,703 |
| | 0.39 | % | | 0.46 | % |
| Federal Home Loan Bank advances | 405,246 |
| | 434,557 |
| | 7,989 |
| | 8,314 |
| | 2.64 |
| | 2.56 |
|
| Other borrowings | 148,549 |
| | 275,425 |
| | 1,460 |
| | 3,196 |
| | 1.31 |
| | 1.55 |
|
| Subordinated notes | 56,410 |
| | 12,711 |
| | 2,130 |
| | 151 |
| | 5.03 |
| | 1.57 |
|
| Junior subordinated notes | 249,493 |
| | 249,493 |
| | 6,137 |
| | 9,444 |
| | 3.24 |
| | 4.99 |
|
| Total interest-bearing liabilities | $ | 13,228,939 |
| | $ | 12,785,860 |
| | $ | 53,696 |
| | $ | 61,808 |
| | 0.54 | % | | 0.64 | % |
| Non-interest bearing deposits | 2,948,961 |
| | 2,408,365 |
| | | | | | | | |
| Other liabilities | 324,284 |
| | 306,461 |
| | | | | | | | |
| Equity | 1,972,425 |
| | 1,843,633 |
| | | | | | | | |
| Total liabilities and shareholders’ equity | $ | 18,474,609 |
| | $ | 17,344,319 |
| | | | | | | | |
Interest rate spread(5)(7) | | | | | | | | | 3.45 | % | | 3.38 | % |
Net free funds/contribution(6) | $ | 3,569,864 |
| | $ | 2,906,277 |
| | | | | | 0.11 | % | | 0.11 | % |
Net interest income/ margin(7) | | | | | $ | 447,145 |
| | $ | 410,007 |
| | 3.56 | % | | 3.49 | % |
| |
| (1) | Liquidity management assets include available-for-sale securities, interest earning deposits with banks, federal funds sold and securities purchased under resale agreements. |
| |
| (2) | Interest income on tax-advantaged loans, trading securities and securities reflects a tax-equivalent adjustment based on a marginal federal corporate tax rate of 35%. The total adjustments for the nine months ended September 30, 2014, and September 30, 2013 were $2.3 million and $1.7 million, respectively. |
| |
| (3) | Other earning assets include brokerage customer receivables and trading account securities. |
| |
| (4) | Loans, net of unearned income, include loans held-for-sale and non-accrual loans. |
| |
| (5) | Interest rate spread is the difference between the yield earned on earning assets and the rate paid on interest-bearing liabilities. |
| |
| (6) | Net free funds are the difference between total average earning assets and total average interest-bearing liabilities. The estimated contribution to net interest margin from net free funds is calculated using the rate paid for total interest-bearing liabilities. |
| |
| (7) | See “Supplemental Financial Measures/Ratios” for additional information on this performance ratio. |
Interest Rate Sensitivity
As an ongoing part of its financial strategy, the Company attempts to manage the impact of fluctuations in market interest rates on net interest income. Management measures its exposure to changes in interest rates using many different interest rate scenarios.
The following interest rate scenarios display the percentage change in net interest income over a one-year time horizon assuming increases of 100 and 200 basis points and a decrease of 100 basis points. The Static Shock Scenario results incorporate actual cash flows and repricing characteristics for balance sheet instruments following an instantaneous, parallel change in market rates based upon a static (i.e. no growth or constant) balance sheet. Conversely, the Ramp Scenario results incorporate management’s projections of future volume and pricing of each of the product lines following a gradual, parallel change in market rates over twelve months. Actual results may differ from these simulated results due to timing, magnitude, and frequency of interest rate changes as well as changes in market conditions and management strategies. The interest rate sensitivity for both the Static Shock and Ramp Scenarios at September 30, 2014, December 31, 2013 and September 30, 2013 is as follows:
|
| | | | | | | | | |
| | | | | | |
| Static Shock Scenarios | | +200
Basis
Points | | +100
Basis
Points | | -100
Basis
Points |
| September 30, 2014 | | 13.7 | % | | 6.2 | % | | (11.1 | )% |
| December 31, 2013 | | 13.0 | % | | 5.7 | % | | (12.9 | )% |
| September 30, 2013 | | 13.6 | % | | 6.2 | % | | (11.4 | )% |
|
| | | | | | | | |
| Ramp Scenarios | +200
Basis
Points | | +100
Basis
Points | | -100
Basis
Points |
| September 30, 2014 | 5.0 | % | | 2.6 | % | | (5.0 | )% |
| December 31, 2013 | 5.0 | % | | 2.4 | % | | (5.0 | )% |
| September 30, 2013 | 5.8 | % | | 3.0 | % | | (5.1 | )% |
These results indicate that the Company has positioned its balance sheet to benefit from a rise in interest rates. This analysis also indicates that the Company would benefit to a greater magnitude should a rise in interest rates be significant (i.e. 200 basis points) and immediate (Static Shock Scenario).
NON-INTEREST INCOME
The following table presents non-interest income by category for the periods presented:
|
| | | | | | | | | | | | | | | | | | | | | | | | | | |
| | | Three Months Ended | | | | | | | | |
| | | September 30, |
| June 30, |
| September 30, |
| Q3 2014 compared to Q2 2014 |
| Q3 2014 compared to Q3 2013 |
| (Dollars in thousands) | | 2014 | | 2014 | | 2013 | | $ Change | | % Change | | $ Change | | % Change |
| Brokerage | | $ | 7,185 |
| | $ | 8,270 |
| | $ | 7,388 |
| | $ | (1,085 | ) | | (13 | )% | | $ | (203 | ) | | (3 | )% |
| Trust and asset management | | 10,474 |
| | 9,952 |
| | 8,669 |
| | 522 |
| | 5 |
| | 1,805 |
| | 21 |
|
| Total wealth management | | 17,659 |
| | 18,222 |
| | 16,057 |
| | (563 | ) | | (3 | ) | | 1,602 |
| | 10 |
|
| Mortgage banking | | 26,691 |
| | 23,804 |
| | 25,682 |
| | 2,887 |
| | 12 |
| | 1,009 |
| | 4 |
|
| Service charges on deposit accounts | | 6,084 |
| | 5,688 |
| | 5,308 |
| | 396 |
| | 7 |
| | 776 |
| | 15 |
|
| (Losses) gains on available-for-sale securities, net | | (153 | ) | | (336 | ) | | 75 |
| | 183 |
| | 54 |
| | (228 | ) | | NM |
|
| Fees from covered call options | | 2,107 |
| | 1,244 |
| | 285 |
| | 863 |
| | 69 |
| | 1,822 |
| | NM |
|
| Trading gains (losses), net | | 293 |
| | (743 | ) | | (1,655 | ) | | 1,036 |
| | NM |
| | 1,948 |
| | NM |
|
| Other: | | | | | | | | | | | | | | |
| Interest rate swap fees | | 1,207 |
| | 1,192 |
| | 2,183 |
| | 15 |
| | 1 |
| | (976 | ) | | (45 | ) |
| Bank Owned Life Insurance | | 652 |
| | 675 |
| | 625 |
| | (23 | ) | | (3 | ) | | 27 |
| | 4 |
|
| Administrative services | | 990 |
| | 938 |
| | 943 |
| | 52 |
| | 6 |
| | 47 |
| | 5 |
|
| Miscellaneous | | 2,422 |
| | 3,418 |
| | 5,159 |
| | (996 | ) | | (29 | ) | | (2,737 | ) | | (53 | ) |
| Total Other | | 5,271 |
| | 6,223 |
| | 8,910 |
| | (952 | ) | | (15 | ) | | (3,639 | ) | | (41 | ) |
| Total Non-Interest Income | | $ | 57,952 |
| | $ | 54,102 |
| | $ | 54,662 |
| | $ | 3,850 |
| | 7 | % | | $ | 3,290 |
| | 6 | % |
NM - Not Meaningful
|
| | | | | | | | | | | | | | | |
| | | Nine months ended | | $ Change | | % Change |
| (Dollars in thousands) | | September 30, 2014 | | September 30, 2013 | | |
| Brokerage | | $ | 22,546 |
| | $ | 22,080 |
| | $ | 466 |
| | 2 |
|
| Trust and asset management | | 30,148 |
| | 24,697 |
| | 5,451 |
| | 22 |
|
| Total wealth management | | 52,694 |
| | 46,777 |
| | 5,917 |
| | 13 |
|
| Mortgage banking | | 66,923 |
| | 87,561 |
| | (20,638 | ) | | (24 | ) |
| Service charges on deposit accounts | | 17,118 |
| | 15,136 |
| | 1,982 |
| | 13 |
|
| (Losses) gains on available-for-sale securities, net | | (522 | ) | | 328 |
| | (850 | ) | | NM |
|
| Fees from covered call options | | 4,893 |
| | 2,917 |
| | 1,976 |
| | 68 |
|
| Trading (losses) gains, net | | (1,102 | ) | | 1,170 |
| | (2,272 | ) | | NM |
|
| Other: | | | | | | | | |
| Interest rate swap fees | | 3,350 |
| | 6,092 |
| | (2,742 | ) | | (45 | ) |
| Bank Owned Life Insurance | | 2,039 |
| | 2,372 |
| | (333 | ) | | (14 | ) |
| Administrative services | | 2,786 |
| | 2,512 |
| | 274 |
| | 11 |
|
| Miscellaneous | | 9,404 |
| | 11,171 |
| | (1,767 | ) | | (16 | ) |
| Total Other | | 17,579 |
| | 22,147 |
| | (4,568 | ) | | (21 | ) |
| Total Non-Interest Income | | $ | 157,583 |
| | $ | 176,036 |
| | $ | (18,453 | ) | | (10 | ) |
NM - Not Meaningful
The significant changes in non-interest income for the quarter ended September 30, 2014 compared to the quarters ended June 30, 2014 and September 30, 2013 are discussed below.
Wealth management revenue totaled $17.7 million in the third quarter of 2014 compared to $18.2 million in the second quarter of 2014, a decrease of 3%, and $16.1 million in the third quarter of 2013, an increase of 10%. The decrease during the current quarter as compared to the second quarter of 2014 is primarily due to higher brokerage commissions earned in the second quarter partially offset by higher trust and asset management revenues due to growth in assets under management from new customers and market appreciation in the current quarter. The increase in the current quarter as compared to the prior year quarter is primarily a result of growth in assets under management from new customers and market appreciation. Wealth management revenue is comprised of the trust and asset management revenue of The Chicago Trust Company and Great Lakes Advisors and the brokerage commissions, money managed fees and insurance product commissions at Wayne Hummer Investments.
For the quarter ended September 30, 2014, mortgage banking revenue totaled $26.7 million, an increase of $2.9 million, or 12%, when compared to the second quarter of 2014, and an increase of $1.0 million, or 4%, when compared to the third quarter of 2013. The increase in mortgage banking revenue in the third quarter of 2014 as compared to the second quarter of 2014 and prior year period resulted primarily from a favorable mortgage banking environment in the current quarter. Mortgage loans originated or purchased for sale were $904.8 million in the current quarter as compared to $840.9 million in the second quarter of 2014 and $940.8 million in the third quarter of 2013. Mortgage banking revenue includes revenue from activities related to originating, selling and servicing residential real estate loans for the secondary market.
A summary of mortgage banking components is shown below:
|
| | | | | | | | |
| | Three Months Ended |
| (Dollars in thousands) | September 30, 2014 | | June 30, 2014 | | September 30, 2013 |
| Mortgage loans serviced for others | 898,960 |
| | 926,679 |
| | 981,415 |
|
| Fair value of mortgage servicing rights (MSRs) | 8,137 |
| | 8,227 |
| | 8,608 |
|
| MSRs as a percentage of loans serviced | 0.91 | % | | 0.89 | % | | 0.88 | % |
Service charges on deposit accounts totaled $6.1 million in the third quarter of 2014, an increase of $396,000 and $776,000 compared to the quarters ended June 30, 2014 and September 30, 2013, respectively. The increase in the current quarter compared to the second quarter of 2014 is mostly a result of higher overdraft fees on deposit accounts. The increase in the current quarter compared to the prior year period resulted primarily from higher account analysis fees on deposit accounts which have increased as a result of the Company's commercial banking initiative.
The Company recognized $293,000 of trading gains in the third quarter of 2014 compared to trading losses of $743,000 in the second quarter of 2014 and trading losses of $1.7 million in the third quarter of 2013. Trading gains and losses recorded by the Company primarily result from fair value adjustments related to interest rate derivatives not designated as hedges, primarily interest rate cap instruments that the Company uses to manage interest rate risk, specifically in the event of future increases in short-term interest rates. The change in value of the cap derivatives reflects the present value of expected cash flows over the remaining life of the caps. These expected cash flows are derived from the expected path for and a measure of volatility for short-term interest rates.
Other non-interest income totaled $5.3 million in the third quarter of 2014 compared to $6.2 million in the second quarter of 2014 and $8.9 million in the third quarter of 2013. Other non-interest income decreased in the third quarter of 2014 as compared to the second quarter of 2014 primarily as a result of a a decline in investment in partnership income, partially offset by an increase in accretion related to the FDIC indemnification asset. The decrease in the third quarter of 2014 compared to the prior year period was primarily due to an decrease in accretion related to the FDIC indemnification asset and fewer interest rate swap fees.
NON-INTEREST EXPENSE
The following table presents non-interest expense by category for the periods presented: |
| | | | | | | | | | | | | | | | | | | | | | | | | | |
| | | Three Months Ended | | | | | | | | |
| | | September 30, | | June 30, | | September 30, | | Q3 2014 compared to
Q2 2014 | | Q3 2014 compared to
Q3 2013 |
| (Dollars in thousands) | | 2014 | | 2014 | | 2013 | | $ Change | | % Change | | $ Change | | % Change |
| Salaries and employee benefits: | | | | | | | | | | | | | | |
| Salaries | | $ | 45,471 |
| | $ | 43,349 |
| | $ | 42,789 |
| | $ | 2,122 |
| | 5 | % | | $ | 2,682 |
| | 6 | % |
| Commissions and incentive compensation | | 27,885 |
| | 25,398 |
| | 23,409 |
| | 2,487 |
| | 10 |
| | 4,476 |
| | 19 |
|
| Benefits | | 12,620 |
| | 13,216 |
| | 11,809 |
| | (596 | ) | | (5 | ) | | 811 |
| | 7 |
|
| Total salaries and employee benefits | | 85,976 |
| | 81,963 |
| | 78,007 |
| | 4,013 |
| | 5 |
| | 7,969 |
| | 10 |
|
| Equipment | | 7,570 |
| | 7,223 |
| | 6,593 |
| | 347 |
| | 5 |
| | 977 |
| | 15 |
|
| Occupancy, net | | 10,446 |
| | 9,850 |
| | 9,079 |
| | 596 |
| | 6 |
| | 1,367 |
| | 15 |
|
| Data processing | | 4,765 |
| | 4,543 |
| | 4,884 |
| | 222 |
| | 5 |
| | (119 | ) | | (2 | ) |
| Advertising and marketing | | 3,528 |
| | 3,558 |
| | 2,772 |
| | (30 | ) | | (1 | ) | | 756 |
| | 27 |
|
| Professional fees | | 4,035 |
| | 4,046 |
| | 3,378 |
| | (11 | ) | | — |
| | 657 |
| | 19 |
|
| Amortization of other intangible assets | | 1,202 |
| | 1,156 |
| | 1,154 |
| | 46 |
| | 4 |
| | 48 |
| | 4 |
|
| FDIC insurance | | 3,211 |
| | 3,196 |
| | 3,245 |
| | 15 |
| | — |
| | (34 | ) | | (1 | ) |
| OREO expense, net | | 581 |
| | 2,490 |
| | 2,499 |
| | (1,909 | ) | | (77 | ) | | (1,918 | ) | | (77 | ) |
| Other: | | | | | | | | | | | | | | |
| Commissions - 3rd party brokers | | 1,621 |
| | 1,633 |
| | 1,277 |
| | (12 | ) | | (1 | ) | | 344 |
| | 27 |
|
| Postage | | 1,427 |
| | 1,465 |
| | 1,255 |
| | (38 | ) | | (3 | ) | | 172 |
| | 14 |
|
| Stationery and supplies | | 899 |
| | 894 |
| | 1,009 |
| | 5 |
| | 1 |
| | (110 | ) | | (11 | ) |
| Miscellaneous | | 13,239 |
| | 11,574 |
| | 12,096 |
| | 1,665 |
| | 14 |
| | 1,143 |
| | 9 |
|
| Total other | | 17,186 |
| | 15,566 |
| | 15,637 |
| | 1,620 |
| | 10 |
| | 1,549 |
| | 10 |
|
| Total Non-Interest Expense | | $ | 138,500 |
| | $ | 133,591 |
| | $ | 127,248 |
| | $ | 4,909 |
| | 4 | % | | $ | 11,252 |
| | 9 | % |
|
| | | | | | | | | | | | | | | |
| | | Nine Months Ended | | $ Change | | % Change |
| (Dollars in thousands) | | September 30, 2014 | | September 30, 2013 | | |
| Salaries and employee benefits: | | | | | | | | |
| Salaries | | $ | 132,556 |
| | $ | 126,291 |
| | $ | 6,265 |
| | 5 | % |
| Commissions and incentive compensation | | 74,816 |
| | 69,828 |
| | 4,988 |
| | 7 |
|
| Benefits | | 40,501 |
| | 38,626 |
| | 1,875 |
| | 5 |
|
| Total salaries and employee benefits | | 247,873 |
| | 234,745 |
| | 13,128 |
| | 6 |
|
| Equipment | | 22,196 |
| | 19,190 |
| | 3,006 |
| | 16 |
|
| Occupancy, net | | 31,289 |
| | 26,639 |
| | 4,650 |
| | 17 |
|
| Data processing | | 14,023 |
| | 13,841 |
| | 182 |
| | 1 |
|
| Advertising and marketing | | 9,902 |
| | 7,534 |
| | 2,368 |
| | 31 |
|
| Professional fees | | 11,535 |
| | 10,790 |
| | 745 |
| | 7 |
|
| Amortization of other intangible assets | | 3,521 |
| | 3,438 |
| | 83 |
| | 2 |
|
| FDIC insurance | | 9,358 |
| | 9,692 |
| | (334 | ) | | (3 | ) |
| OREO expense, net | | 7,047 |
| | 3,163 |
| | 3,884 |
| | NM |
|
| Other: | | | | | | | | |
| Commissions - 3rd party brokers | | 4,911 |
| | 3,639 |
| | 1,272 |
| | 35 |
|
| Postage | | 4,321 |
| | 3,968 |
| | 353 |
| | 9 |
|
| Stationery and supplies | | 2,685 |
| | 2,830 |
| | (145 | ) | | (5 | ) |
| Miscellaneous | | 34,745 |
| | 36,085 |
| | (1,340 | ) | | (4 | ) |
| Total other | | 46,662 |
| | 46,522 |
| | 140 |
| | — |
|
| Total Non-Interest Expense | | $ | 403,406 |
| | $ | 375,554 |
| | $ | 27,852 |
| | 7 | % |
NM - Not Meaningful
The significant changes in non-interest expense for the quarter ended September 30, 2014 compared to the quarters ended June 30, 2014 and September 30, 2013 are discussed below.
Salaries and employee benefits expense increased $4.0 million, or 5%, in the third quarter of 2014 compared to the second quarter of 2014 primarily as a result of a $2.5 million increase in commissions and incentive compensation related to higher expenses on variable pay based arrangements and an increase of $2.1 million in salaries caused by the addition of employees from various acquisitions and larger staffing as the Company grows, partially offset by a $596,000 decrease in employee benefits resulting from lower payroll taxes. Salaries and employee benefits expense increased $8.0 million, or 10%, compared to the third quarter of 2013 primarily as a result of a $4.5 million increase in commissions and incentive compensation primarily attributable to higher expenses on variable pay based arrangements and a $2.7 million increase in salaries caused by the addition of employees from the various acquisitions and larger staffing as the Company grows.
Equipment expense totaled $7.6 million for the third quarter of 2014, an increase of $347,000 compared to the second quarter of 2014 and an increase of $977,000 compared to the third quarter of 2013. The increase in the current quarter compared to the prior year quarter is primarily related to additional depreciation, and maintenance and repairs of equipment as a result of acquisitions as well as increased software license fees. Equipment expense includes depreciation on equipment, maintenance and repairs, equipment rental and software license fees.
Occupancy expense for the third quarter of 2014 was $10.4 million, an increase of $596,000, or 6%, compared to the second quarter of 2014 and an increase of $1.4 million, or 15%, compared to the same period in 2013. The increase in the third quarter as compared to the second quarter is primarily the result of increased property taxes on owned locations including those obtained in the Company's acquisitions as well as additional depreciation, and maintenance and repairs. The increase in the current quarter as compared to the prior year quarter is primarily due to expenses incurred related to properties acquired in the last year. Occupancy expense includes depreciation on premises, real estate taxes, utilities and maintenance of premises, as well as net rent expense for leased premises.
Advertising and marketing expenses totaled $3.5 million in the third quarter of 2014, a decrease of $30,000 compared to the second quarter of 2014 and an increase of $756,000 compared to the third quarter of 2013. The increase in the current quarter compared to the prior year quarter relates primarily to expenses for community-related advertisements and sponsorships.
Professional fees for the third quarter of 2014 and second quarter of 2014 were $4.0 million, compared to $3.4 million in the third quarter of 2013. The $657,000 increase in the current quarter as compared to the third quarter of 2013 is due to an increase in legal expenses, including legal fees incurred in connection with recent acquisitions and the resolution of OREO properties. Professional fees include legal, audit and tax fees, external loan review costs and normal regulatory exam assessments.
OREO expense totaled $581,000 in the third quarter of 2014 compared to OREO expense of $2.5 million recorded in the second quarter of 2014 and third quarter of 2013. OREO expense was lower in the current quarter compared to the quarter ended June 30, 2014 and September 30, 2013 primarily due to fewer negative valuation adjustments of certain OREO properties. OREO costs include all costs related to obtaining, maintaining and selling other real estate owned properties.
Miscellaneous expense in the third quarter of 2014 increased $1.7 million, or 14%, compared to the quarter ended June 30, 2014 and increased $1.1 million, or 9%, compared to the quarter ended September 30, 2013. Miscellaneous expense includes ATM expenses, correspondent bank charges, directors' fees, telephone, travel and entertainment, corporate insurance, dues and subscriptions, problem loan expenses and lending origination costs that are not deferred.
ASSET QUALITY
Allowance for Credit Losses, excluding covered loans
|
| | | | | | | | | | | | | | | | | | | | |
| | | Three Months Ended | | Nine Months Ended |
| | | September 30, | | June 30, | | September 30, | | September 30, | | September 30, |
| (Dollars in thousands) | | 2014 | | 2014 | | 2013 | | 2014 | | 2013 |
| Allowance for loan losses at beginning of period | | $ | 92,253 |
| | $ | 92,275 |
| | $ | 106,842 |
| | $ | 96,922 |
| | $ | 107,351 |
|
| Provision for credit losses | | 6,028 |
| | 6,813 |
| | 11,580 |
| | 16,145 |
| | 42,080 |
|
| Other adjustments | | (335 | ) | | (105 | ) | | (205 | ) | | (588 | ) | | (743 | ) |
| Reclassification from (to) allowance for unfunded lending-related commitments | | 62 |
| | (146 | ) | | 284 |
| | (102 | ) | | 136 |
|
| Charge-offs: | | | | | | | | | |
|
| Commercial | | 832 |
| | 2,384 |
| | 3,281 |
| | 3,864 |
| | 8,914 |
|
| Commercial real estate | | 4,510 |
| | 2,351 |
| | 6,982 |
| | 11,354 |
| | 25,228 |
|
| Home equity | | 748 |
| | 730 |
| | 711 |
| | 3,745 |
| | 4,893 |
|
| Residential real estate | | 205 |
| | 689 |
| | 328 |
| | 1,120 |
| | 2,573 |
|
| Premium finance receivables - commercial | | 1,557 |
| | 1,492 |
| | 1,294 |
| | 4,259 |
| | 3,668 |
|
| Premium finance receivables - life insurance | | — |
| | — |
| | 3 |
| | — |
| | 3 |
|
| Consumer and other | | 250 |
| | 213 |
| | 216 |
| | 636 |
| | 473 |
|
| Total charge-offs | | 8,102 |
| | 7,859 |
| | 12,815 |
| | 24,978 |
| | 45,752 |
|
| Recoveries: | | | | | | | | | | |
| Commercial | | 296 |
| | 270 |
| | 756 |
| | 883 |
| | 1,319 |
|
| Commercial real estate | | 275 |
| | 342 |
| | 272 |
| | 762 |
| | 1,224 |
|
| Home equity | | 99 |
| | 122 |
| | 43 |
| | 478 |
| | 376 |
|
| Residential real estate | | 111 |
| | 74 |
| | 64 |
| | 316 |
| | 87 |
|
| Premium finance receivables - commercial | | 289 |
| | 312 |
| | 314 |
| | 920 |
| | 878 |
|
| Premium finance receivables - life insurance | | 1 |
| | 2 |
| | 2 |
| | 5 |
| | 11 |
|
| Consumer and other | | 42 |
| | 153 |
| | 51 |
| | 256 |
| | 221 |
|
| Total recoveries | | 1,113 |
| | 1,275 |
| | 1,502 |
| | 3,620 |
| | 4,116 |
|
| Net charge-offs | | (6,989 | ) | | (6,584 | ) | | (11,313 | ) | | (21,358 | ) | | (41,636 | ) |
| Allowance for loan losses at period end | | $ | 91,019 |
| | $ | 92,253 |
| | $ | 107,188 |
| | $ | 91,019 |
| | $ | 107,188 |
|
| Allowance for unfunded lending-related commitments at period end | | 822 |
| | 884 |
| | 1,267 |
| | 822 |
| | 1,267 |
|
| Allowance for credit losses at period end | | $ | 91,841 |
| | $ | 93,137 |
| | $ | 108,455 |
| | $ | 91,841 |
| | $ | 108,455 |
|
| Annualized net charge-offs by category as a percentage of its own respective category’s average: | | | | | | | | | | |
| Commercial | | 0.06 | % | | 0.24 | % | | 0.32 | % | | 0.11 | % | | 0.34 | % |
| Commercial real estate | | 0.38 |
| | 0.19 |
| | 0.65 |
| | 0.33 |
| | 0.80 |
|
| Home equity | | 0.36 |
| | 0.34 |
| | 0.36 |
| | 0.61 |
| | 0.79 |
|
| Residential real estate | | 0.05 |
| | 0.35 |
| | 0.12 |
| | 0.15 |
| | 0.42 |
|
| Premium finance receivables - commercial | | 0.20 |
| | 0.20 |
| | 0.17 |
| | 0.19 |
| | 0.18 |
|
| Premium finance receivables - life insurance | | — |
| | — |
| | — |
| | — |
| | — |
|
| Consumer and other | | 0.49 |
| | 0.14 |
| | 0.35 |
| | 0.30 |
| | 0.18 |
|
| Total loans, net of unearned income, excluding covered loans | | 0.19 | % | | 0.19 | % | | 0.34 | % | | 0.21 | % | | 0.44 | % |
| Net charge-offs as a percentage of the provision for credit losses | | 115.95 | % | | 96.62 | % | | 97.69 | % | | 132.29 | % | | 98.95 | % |
| Loans at period-end, excluding covered loans | | $ | 14,052,059 |
| | $ | 13,749,996 |
| | $ | 12,581,039 |
| | | | |
| Allowance for loan losses as a percentage of loans at period end | | 0.65 | % | | 0.67 | % | | 0.85 | % | | | | |
| Allowance for credit losses as a percentage of loans at period end | | 0.65 | % | | 0.68 | % | | 0.86 | % | | | | |
The allowance for credit losses, excluding the allowance for covered loan losses, is comprised of the allowance for loan losses and the allowance for unfunded lending-related commitments. The allowance for loan losses is a reserve against loan amounts that are actually funded and outstanding while the allowance for unfunded lending-related commitments (separate liability account) relates to certain amounts that Wintrust is committed to lend but for which funds have not yet been disbursed. The provision for credit losses, excluding the provision for covered loan losses, may contain both a component related to funded loans (provision
for loan losses) and a component related to lending-related commitments (provision for unfunded loan commitments and letters of credit).
The provision for credit losses, excluding the provision for covered loan losses, totaled $6.0 million for the third quarter of 2014, as compared to $6.8 million for the second quarter of 2014 and $11.6 million for the third quarter of 2013. For the quarter ended September 30, 2014, net charge-offs, excluding covered loans, totaled $7.0 million, a slight increase from $6.6 million in the second quarter of 2014. Compared to the third quarter of 2013, net charge-offs decreased $4.3 million from $11.3 million. Net charge-offs decreased in the third quarter of 2014 compared to the third quarter of 2013 primarily as a result of a $2.5 million and $2.0 million decrease in net charge-offs within the commercial real-estate and commercial loan portfolios, respectively. Annualized net charge-offs as a percentage of average loans, excluding covered loans, were 0.19% in the third and second quarter of 2014, and 0.34% in the third quarter of 2013.
The allowance for unfunded lending-related commitments totaled $822,000 as of September 30, 2014 compared to $884,000 as of June 30, 2014 and $1.3 million as of September 30, 2013. The decrease from the third quarter of 2013 is primarily attributable to the expiration of one letter of credit during the fourth quarter of 2013.
The lower level of the allowance for credit losses in 2014 reflects the improvements in credit quality metrics compared to 2013. Management believes the allowance for credit losses is appropriate to provide for inherent losses in the portfolio. There can be no assurances however, that future losses will not exceed the amounts provided for, thereby affecting future results of operations. The amount of future additions to the allowance for credit losses will be dependent upon management’s assessment of the appropriateness of the allowance based on its evaluation of economic conditions, changes in real estate values, interest rates, the regulatory environment, the level of past-due and non-performing loans, and other factors.
The Company also provides a provision for covered loan losses on covered loans and maintains an allowance for covered loan losses on covered loans. Please see “Covered Assets” later in this document for more detail.
The following table presents the provision for credit losses and allowance for credit losses by component for the periods presented: |
| | | | | | | | | | | | | | | | | | | | |
| | | Three months ended | | Nine months ended |
| | | September 30, | | June 30, | | September 30, | | September 30, | | September 30, |
| (Dollars in thousands) | | 2014 | | 2014 | | 2013 | | 2014 | | 2013 |
| Provision for loan losses | | $ | 6,090 |
| | $ | 6,667 |
| | $ | 11,864 |
| | $ | 16,043 |
| | $ | 42,216 |
|
| Provision for unfunded lending-related commitments | | (62 | ) | | 146 |
| | (284 | ) | | 102 |
| | (136 | ) |
| Provision for covered loan losses | | (164 | ) | | (153 | ) | | (466 | ) | | (1,741 | ) | | 103 |
|
| Provision for credit losses | | $ | 5,864 |
| | $ | 6,660 |
| | $ | 11,114 |
| | $ | 14,404 |
| | $ | 42,183 |
|
| | | | | | | | | | | |
| | | | | | | Period End |
| | | | | | | September 30, | | June 30, | | September 30, |
| | | | | | | 2014 | | 2014 | | 2013 |
| Allowance for loan losses | | | | | | $ | 91,019 |
| | $ | 92,253 |
| | $ | 107,188 |
|
| Allowance for unfunded lending-related commitments | | | | | | 822 |
| | 884 |
| | 1,267 |
|
| Allowance for covered loan losses | | | | | | 2,655 |
| | 1,667 |
| | 12,924 |
|
| Allowance for credit losses | | | | | | $ | 94,496 |
| | $ | 94,804 |
| | $ | 121,379 |
|
The tables below summarize the calculation of allowance for loan losses for the Company’s core loan portfolio and consumer, niche and purchased loan portfolio as of September 30, 2014 and June 30, 2014.
|
| | | | | | | | | | | |
| | | As of September 30, 2014 |
| | | Recorded | | Calculated | | As a percentage of its own respective |
| (Dollars in thousands) | | Investment | | Allowance | | category’s balance |
Commercial:(1) | | | | | | |
| Commercial and industrial | | $ | 2,022,939 |
| | $ | 17,629 |
| | 0.87 | % |
| Asset-based lending | | 779,363 |
| | 5,815 |
| | 0.75 |
|
| Tax exempt | | 204,963 |
| | 1,107 |
| | 0.54 |
|
| Leases | | 145,361 |
| | 13 |
| | 0.01 |
|
| Other | | 11,403 |
| | 95 |
| | 0.83 |
|
Commercial real-estate:(1) | | | | | | |
| Residential construction | | 29,725 |
| | 522 |
| | 1.76 |
|
| Commercial construction | | 155,687 |
| | 2,406 |
| | 1.55 |
|
| Land | | 95,094 |
| | 2,782 |
| | 2.93 |
|
| Office | | 671,914 |
| | 5,235 |
| | 0.78 |
|
| Industrial | | 604,404 |
| | 4,531 |
| | 0.75 |
|
| Retail | | 694,127 |
| | 5,989 |
| | 0.86 |
|
| Multi-family | | 645,825 |
| | 5,038 |
| | 0.78 |
|
| Mixed use and other | | 1,341,709 |
| | 12,096 |
| | 0.90 |
|
Home equity(1) | | 699,455 |
| | 12,917 |
| | 1.85 |
|
Residential real-estate(1) | | 441,940 |
| | 4,028 |
| | 0.91 |
|
| Total core loan portfolio | | $ | 8,543,909 |
| | $ | 80,203 |
| | 0.94 | % |
| Commercial: | | | | | | |
| Franchise | | $ | 230,567 |
| | $ | 1,989 |
| | 0.86 | % |
| Mortgage warehouse lines of credit | | 121,585 |
| | 1,042 |
| | 0.86 |
|
| Community Advantage - homeowner associations | | 99,595 |
| | 4 |
| | — |
|
| Aircraft | | 5,196 |
| | 7 |
| | 0.13 |
|
Purchased non-covered commercial loans (2) | | 68,699 |
| | 211 |
| | 0.31 |
|
| Commercial real-estate: | | | | | | |
Purchased non-covered commercial real-estate (2) | | 271,890 |
| | 60 |
| | 0.02 |
|
Purchased non-covered home equity (2) | | 20,603 |
| | 43 |
| | 0.21 |
|
Purchased non-covered residential real-estate (2) | | 28,379 |
| | 14 |
| | 0.05 |
|
| Premium finance receivables | | | | | | |
| U.S. commercial insurance loans | | 2,071,396 |
| | 5,091 |
| | 0.25 |
|
Canada commercial insurance loans (2) | | 306,496 |
| | 530 |
| | 0.17 |
|
Life insurance loans (1) | | 1,726,803 |
| | 646 |
| | 0.04 |
|
Purchased life insurance loans (2) | | 407,602 |
| | — |
| | — |
|
Consumer and other (1) | | 144,745 |
| | 1,143 |
| | 0.79 |
|
Purchased non-covered consumer and other (2) | | 4,594 |
| | 36 |
| | 0.78 |
|
| Total consumer, niche and purchased loan portfolio | | $ | 5,508,150 |
| | $ | 10,816 |
| | 0.20 | % |
| Total loans, net of unearned income, excluding covered loans | | $ | 14,052,059 |
| | $ | 91,019 |
| | 0.65 | % |
| | | | | | | |
| |
| (1) | Excludes purchased loans reported in accordance with ASC 310-20 and ASC 310-30. |
| |
| (2) | Purchased loans represent loans reported in accordance with ASC 310-20 and ASC 310-30. |
|
| | | | | | | | | | | |
| | | As of June 30, 2014 |
| | | Recorded | | Calculated | | As a percentage
of its own respective |
| (Dollars in thousands) | | Investment | | Allowance | | category’s balance |
Commercial:(1) | | | | | | |
| Commercial and industrial | | $ | 1,988,656 |
| | $ | 16,208 |
| | 0.82 | % |
| Asset-based lending | | 775,756 |
| | 5,562 |
| | 0.72 |
|
| Tax exempt | | 208,787 |
| | 1,017 |
| | 0.49 |
|
| Leases | | 144,310 |
| | 6 |
| | — |
|
| Other | | 9,792 |
| | 78 |
| | 0.80 |
|
Commercial real-estate:(1) | | | | | | |
| Residential construction | | 29,605 |
| | 500 |
| | 1.69 |
|
| Commercial construction | | 154,266 |
| | 2,184 |
| | 1.42 |
|
| Land | | 99,517 |
| | 3,084 |
| | 3.10 |
|
| Office | | 654,424 |
| | 7,406 |
| | 1.13 |
|
| Industrial | | 602,224 |
| | 4,568 |
| | 0.76 |
|
| Retail | | 676,629 |
| | 6,459 |
| | 0.95 |
|
| Multi-family | | 599,261 |
| | 4,301 |
| | 0.72 |
|
| Mixed use and other | | 1,323,802 |
| | 12,126 |
| | 0.92 |
|
Home equity(1) | | 693,345 |
| | 13,852 |
| | 2.00 |
|
Residential real-estate(1) | | 425,918 |
| | 3,667 |
| | 0.86 |
|
| Total core loan portfolio | | $ | 8,386,292 |
| | $ | 81,018 |
| | 0.97 | % |
| Commercial: | | | | | | |
| Franchise | | $ | 223,456 |
| | $ | 1,888 |
| | 0.84 | % |
| Mortgage warehouse lines of credit | | 148,211 |
| | 1,229 |
| | 0.83 |
|
| Community Advantage - homeowner associations | | 94,009 |
| | — |
| | — |
|
| Aircraft | | 6,881 |
| �� | 10 |
| | 0.15 |
|
Purchased non-covered commercial loans (2) | | 40,572 |
| | 40 |
| | 0.10 |
|
| Commercial real-estate: | | | | | | |
Purchased non-covered commercial real-estate (2) | | 213,744 |
| | 74 |
| | 0.03 |
|
Purchased non-covered home equity (2) | | 20,297 |
| | 66 |
| | 0.33 |
|
Purchased non-covered residential real-estate (2) | | 25,987 |
| | 66 |
| | 0.25 |
|
| Premium finance receivables | | | | | | |
| U.S. commercial insurance loans | | 2,085,483 |
| | 5,129 |
| | 0.25 |
|
Canada commercial insurance loans (2) | | 293,046 |
| | 514 |
| | 0.18 |
|
Life insurance loans (1) | | 1,641,885 |
| | 666 |
| | 0.04 |
|
Purchased life insurance loans (2) | | 409,760 |
| | — |
| | — |
|
Consumer and other (1) | | 157,268 |
| | 1,539 |
| | 0.98 |
|
Purchased non-covered consumer and other (2) | | 3,105 |
| | 14 |
| | 0.45 |
|
| Total consumer, niche and purchased loan portfolio | | $ | 5,363,704 |
| | $ | 11,235 |
| | 0.21 | % |
| Total loans, net of unearned income, excluding covered loans | | $ | 13,749,996 |
| | $ | 92,253 |
| | 0.67 | % |
| |
| (1) | Excludes purchased loans reported in accordance with ASC 310-20 and ASC 310-30. |
| |
| (2) | Purchased loans represent loans reported in accordance with ASC 310-20 and ASC 310-30. |
As part of a quarterly review performed by Management to determine if the Company’s allowance for loan losses is appropriate, an analysis is prepared on the loan portfolio based upon a breakout of core loans and consumer, niche and purchased loans. A summary of the allowance for loan losses calculated for the loan components in both the core loan portfolio and the consumer, niche and purchased loan portfolio was shown on the previous pages as of September 30, 2014 and June 30, 2014. The allowance for loan losses to the core loans was 0.94% compared to 0.20% for consumer, niche and purchased loans and 0.65% for the entire loan portfolio as of September 30, 2014. As of June 30, 2014, the allowance for loan losses to core loans was 0.97% compared to 0.21% for consumer, niche and purchased loans and 0.67% for the entire loan portfolio.
The decrease in the allowance for loan losses to core loans in the third quarter of 2014 compared to the second quarter of 2014 was attributable to a shift in the mix of core loans requiring ASC 450 reserves (general reserves) in the current quarter and a smaller population of core loans requiring ASC 310 reserves (specific reserves). Loans requiring ASC 450 reserves typically have lower reserve factors as compared to core loans requiring ASC 310 reserves. ASC 310 reserves are maintained on impaired loans.
As discussed within this section, credit quality metrics improved in the current quarter including a reduction in the level of non-performing assets, increased allowance for loan losses coverage of non-performing loans and decreased net charge-offs. These current credit quality metrics are comparable to the pre-credit crisis levels reported between 2005 and 2008. However, we are able to carry a slightly lower ratio of allowance for loan losses to total loans than during the pre-credit crisis period as the result of the fact that the mix of the Company's loan portfolio is now more heavily weighted toward niche and purchased loans which historically require lower reserves. The niche and purchased components of our total loan portfolio now comprise 39% as compared to 23% of the total loan portfolio at December 31, 2005. Our current loan portfolio is comprised of a core portion totaling $8.5 billion with a 94 basis point allowance for loan losses and a niche and purchased component totaling $5.5 billion that only requires 20 basis points of allowance for loan losses.
The table below shows the aging of the Company’s loan portfolio at September 30, 2014 and June 30, 2014:
|
| | | | | | | | | | | | | | | | | | | | | | | | |
| | | | | 90+ days | | 60-89 | | 30-59 | | | | |
| As of September 30, 2014 | | | | and still | | days past | | days past | | | | |
| (Dollars in thousands) | | Nonaccrual | | accruing | | due | | due | | Current | | Total Loans |
| Loan Balances: | | | | | | | | | | | | |
| Commercial | | | | | | | | | | | | |
| Commercial and industrial | | $ | 10,430 |
| | $ | — |
| | $ | 7,333 |
| | $ | 8,559 |
| | $ | 2,044,505 |
| | $ | 2,070,827 |
|
| Franchise | | — |
| | — |
| | — |
| | 1,221 |
| | 237,079 |
| | 238,300 |
|
| Mortgage warehouse lines of credit | | — |
| | — |
| | — |
| | — |
| | 121,585 |
| | 121,585 |
|
| Community Advantage - homeowners association | | — |
| | — |
| | — |
| | — |
| | 99,595 |
| | 99,595 |
|
| Aircraft | | — |
| | — |
| | — |
| | — |
| | 6,146 |
| | 6,146 |
|
| Asset-based lending | | 25 |
| | — |
| | 2,959 |
| | 1,220 |
| | 777,723 |
| | 781,927 |
|
| Tax exempt | | — |
| | — |
| | — |
| | — |
| | 205,150 |
| | 205,150 |
|
| Leases | | — |
| | — |
| | — |
| | — |
| | 145,439 |
| | 145,439 |
|
| Other | | — |
| | — |
| | — |
| | — |
| | 11,403 |
| | 11,403 |
|
PCI - commercial (1) | | — |
| | 863 |
| | 64 |
| | 137 |
| | 8,235 |
| | 9,299 |
|
| Total commercial | | 10,455 |
| | 863 |
| | 10,356 |
| | 11,137 |
| | 3,656,860 |
| | 3,689,671 |
|
| Commercial real-estate | | | | | | | | | | | | |
| Residential construction | | — |
| | — |
| | — |
| | — |
| | 30,237 |
| | 30,237 |
|
| Commercial construction | | 425 |
| | — |
| | — |
| | — |
| | 159,383 |
| | 159,808 |
|
| Land | | 2,556 |
| | — |
| | 1,316 |
| | 2,918 |
| | 94,449 |
| | 101,239 |
|
| Office | | 7,366 |
| | — |
| | 1,696 |
| | 1,888 |
| | 688,390 |
| | 699,340 |
|
| Industrial | | 2,626 |
| | — |
| | 224 |
| | 367 |
| | 624,669 |
| | 627,886 |
|
| Retail | | 6,205 |
| | — |
| | — |
| | 4,117 |
| | 715,568 |
| | 725,890 |
|
| Multi-family | | 249 |
| | — |
| | 793 |
| | 2,319 |
| | 674,610 |
| | 677,971 |
|
| Mixed use and other | | 7,936 |
| | — |
| | 1,468 |
| | 10,323 |
| | 1,407,659 |
| | 1,427,386 |
|
PCI - commercial real-estate (1) | | — |
| | 14,294 |
| | — |
| | 5,807 |
| | 40,517 |
| | 60,618 |
|
| Total commercial real-estate | | 27,363 |
| | 14,294 |
| | 5,497 |
| | 27,739 |
| | 4,435,482 |
| | 4,510,375 |
|
| Home equity | | 5,696 |
| | — |
| | 1,181 |
| | 2,597 |
| | 710,584 |
| | 720,058 |
|
| Residential real estate | | 15,730 |
| | — |
| | 670 |
| | 2,696 |
| | 448,528 |
| | 467,624 |
|
PCI - residential real estate (1) | | — |
| | 930 |
| | 30 |
| | — |
| | 1,735 |
| | 2,695 |
|
| Premium finance receivables | | | | | | | | | | | | |
| Commercial insurance loans | | 14,110 |
| | 7,115 |
| | 6,279 |
| | 14,157 |
| | 2,336,231 |
| | 2,377,892 |
|
| Life insurance loans | | — |
| | — |
| | 7,533 |
| | 6,942 |
| | 1,712,328 |
| | 1,726,803 |
|
PCI - life insurance loans (1) | | — |
| | — |
| | — |
| | — |
| | 407,602 |
| | 407,602 |
|
| Consumer and other | | 426 |
| | 175 |
| | 123 |
| | 1,133 |
| | 147,482 |
| | 149,339 |
|
| Total loans, net of unearned income, excluding covered loans | | $ | 73,780 |
| | $ | 23,377 |
| | $ | 31,669 |
| | $ | 66,401 |
| | $ | 13,856,832 |
| | $ | 14,052,059 |
|
| Covered loans | | 6,042 |
| | 26,170 |
| | 4,289 |
| | 5,655 |
| | 212,449 |
| | 254,605 |
|
| Total loans, net of unearned income | | $ | 79,822 |
| | $ | 49,547 |
| | $ | 35,958 |
| | $ | 72,056 |
| | $ | 14,069,281 |
| | $ | 14,306,664 |
|
| | | | | | | | | | | | | |
| |
| (1) | Purchased credit impaired ("PCI") loans represent loans acquired with evidence of credit quality deterioration since origination, in accordance with ASC 310-30. Loan agings are based upon contractually required payments. |
|
| | | | | | | | | | | | | | | | | | |
| Aging as a % of Loan Balance: | | Nonaccrual | | 90+ days and still accruing | | 60-89 days past due | | 30-59 days past due | | Current | | Total Loans |
| Commercial | | | | | | | | | | | | |
| Commercial and industrial | | 0.5 | % | | — | % | | 0.4 | % | | 0.4 | % | | 98.7 | % | | 100.0 | % |
| Franchise | | — |
| | — |
| | — |
| | 0.5 |
| | 99.5 |
| | 100.0 |
|
| Mortgage warehouse lines of credit | | — |
| | — |
| | — |
| | — |
| | 100.0 |
| | 100.0 |
|
| Community Advantage - homeowners association | | — |
| | — |
| | — |
| | — |
| | 100.0 |
| | 100.0 |
|
| Aircraft | | — |
| | — |
| | — |
| | — |
| | 100.0 |
| | 100.0 |
|
| Asset-based lending | | — |
| | — |
| | 0.4 |
| | 0.2 |
| | 99.4 |
| | 100.0 |
|
| Tax exempt | | — |
| | — |
| | — |
| | — |
| | 100.0 |
| | 100.0 |
|
| Leases | | — |
| | — |
| | — |
| | — |
| | 100.0 |
| | 100.0 |
|
| Other | | — |
| | — |
| | — |
| | — |
| | 100.0 |
| | 100.0 |
|
PCI - commercial(1) | | — |
| | 9.3 |
| | 0.7 |
| | 1.5 |
| | 88.5 |
| | 100.0 |
|
| Total commercial | | 0.3 |
| | — |
| | 0.3 |
| | 0.3 |
| | 99.1 |
| | 100.0 |
|
| Commercial real-estate | | | | | | | | | | | | |
| Residential construction | | — |
| | — |
| | — |
| | — |
| | 100.0 |
| | 100.0 |
|
| Commercial construction | | 0.3 |
| | — |
| | — |
| | — |
| | 99.7 |
| | 100.0 |
|
| Land | | 2.5 |
| | — |
| | 1.3 |
| | 2.9 |
| | 93.3 |
| | 100.0 |
|
| Office | | 1.1 |
| | — |
| | 0.2 |
| | 0.3 |
| | 98.4 |
| | 100.0 |
|
| Industrial | | 0.4 |
| | — |
| | — |
| | 0.1 |
| | 99.5 |
| | 100.0 |
|
| Retail | | 0.9 |
| | — |
| | — |
| | 0.6 |
| | 98.5 |
| | 100.0 |
|
| Multi-family | | — |
| | — |
| | 0.1 |
| | 0.3 |
| | 99.6 |
| | 100.0 |
|
| Mixed use and other | | 0.6 |
| | — |
| | 0.1 |
| | 0.7 |
| | 98.6 |
| | 100.0 |
|
PCI - commercial real-estate (1) | | — |
| | 23.6 |
| | — |
| | 9.6 |
| | 66.8 |
| | 100.0 |
|
| Total commercial real-estate | | 0.6 |
| | 0.3 |
| | 0.1 |
| | 0.6 |
| | 98.4 |
| | 100.0 |
|
| Home equity | | 0.8 |
| | — |
| | 0.2 |
| | 0.4 |
| | 98.6 |
| | 100.0 |
|
| Residential real estate | | 3.4 |
| | — |
| | 0.1 |
| | 0.6 |
| | 95.9 |
| | 100.0 |
|
PCI - residential real estate(1) | | — |
| | 34.5 |
| | 1.1 |
| | — |
| | 64.4 |
| | 100.0 |
|
| Premium finance receivables | | | | | | | | | | | | |
| Commercial insurance loans | | 0.6 |
| | 0.3 |
| | 0.3 |
| | 0.6 |
| | 98.2 |
| | 100.0 |
|
| Life insurance loans | | — |
| | — |
| | 0.4 |
| | 0.4 |
| | 99.2 |
| | 100.0 |
|
PCI - life insurance loans (1) | | — |
| | — |
| | — |
| | — |
| | 100.0 |
| | 100.0 |
|
| Consumer and other | | 0.3 |
| | 0.1 |
| | 0.1 |
| | 0.8 |
| | 98.7 |
| | 100.0 |
|
| Total loans, net of unearned income, excluding covered loans | | 0.5 | % | | 0.2 | % | | 0.2 | % | | 0.5 | % | | 98.6 | % | | 100.0 | % |
| Covered loans | | 2.4 |
| | 10.3 |
| | 1.7 |
| | 2.2 |
| | 83.4 |
| | 100.0 |
|
| Total loans, net of unearned income | | 0.6 | % | | 0.3 | % | | 0.3 | % | | 0.5 | % | | 98.3 | % | | 100.0 | % |
As of September 30, 2014, $31.7 million of all loans, excluding covered loans, or 0.2%, were 60 to 89 days past due and $66.4 million, or 0.5%, were 30 to 59 days (or one payment) past due. As of June 30, 2014, $30.6 million of all loans, excluding covered loans, or 0.2%, were 60 to 89 days past due and $85.8 million, or 0.6%, were 30 to 59 days (or one payment) past due. The majority of the commercial and commercial real estate loans shown as 60 to 89 days and 30 to 59 days past due are included on the Company’s internal problem loan reporting system. Loans on this system are closely monitored by management on a monthly basis.
The Company’s home equity and residential loan portfolios continue to exhibit low delinquency ratios. Home equity loans at September 30, 2014 that are current with regard to the contractual terms of the loan agreement represent 98.6% of the total home equity portfolio. Residential real estate loans at September 30, 2014 that are current with regards to the contractual terms of the loan agreements comprise 95.7% of total residential real estate loans outstanding, which includes purchased non-covered residential real-estate.
The table below shows the aging of the Company’s loan portfolio at June 30, 2014:
|
| | | | | | | | | | | | | | | | | | | | | | | | |
| | | | | 90+ days | | 60-89 | | 30-59 | | | | |
| As of June 30, 2014 | | | | and still | | days past | | days past | | | | |
| (Dollars in thousands) | | Nonaccrual | | accruing | | due | | due | | Current | | Total Loans |
| Loan Balances: | | | | | | | | | | | | |
| Commercial | | | | | | | | | | | | |
| Commercial and industrial | | $ | 6,216 |
| | $ | — |
| | $ | 4,165 |
| | $ | 21,610 |
| | $ | 1,980,489 |
| | $ | 2,012,480 |
|
| Franchise | | — |
| | — |
| | — |
| | 549 |
| | 222,907 |
| | 223,456 |
|
| Mortgage warehouse lines of credit | | — |
| | — |
| | — |
| | 1,680 |
| | 146,531 |
| | 148,211 |
|
| Community Advantage - homeowners association | | — |
| | — |
| | — |
| | — |
| | 94,009 |
| | 94,009 |
|
| Aircraft | | — |
| | — |
| | — |
| | — |
| | 7,847 |
| | 7,847 |
|
| Asset-based lending | | 295 |
| | — |
| | — |
| | 6,047 |
| | 772,002 |
| | 778,344 |
|
| Tax exempt | | — |
| | — |
| | — |
| | — |
| | 208,913 |
| | 208,913 |
|
| Leases | | — |
| | — |
| | — |
| | 36 |
| | 144,399 |
| | 144,435 |
|
| Other | | — |
| | — |
| | — |
| | — |
| | 9,792 |
| | 9,792 |
|
PCI - commercial(1) | | — |
| | 1,452 |
| | — |
| | 224 |
| | 11,267 |
| | 12,943 |
|
| Total commercial | | 6,511 |
| | 1,452 |
| | 4,165 |
| | 30,146 |
| | 3,598,156 |
| | 3,640,430 |
|
| Commercial real-estate | | | | | | | | | | | | |
| Residential construction | | — |
| | — |
| | — |
| | 18 |
| | 29,941 |
| | 29,959 |
|
| Commercial construction | | 839 |
| | — |
| | — |
| | — |
| | 154,220 |
| | 155,059 |
|
| Land | | 2,367 |
| | — |
| | 614 |
| | 4,502 |
| | 98,444 |
| | 105,927 |
|
| Office | | 10,950 |
| | — |
| | 999 |
| | 3,911 |
| | 652,057 |
| | 667,917 |
|
| Industrial | | 5,097 |
| | — |
| | 899 |
| | 690 |
| | 610,954 |
| | 617,640 |
|
| Retail | | 6,909 |
| | — |
| | 1,334 |
| | 2,560 |
| | 686,292 |
| | 697,095 |
|
| Multi-family | | 689 |
| | — |
| | 244 |
| | 4,717 |
| | 630,519 |
| | 636,169 |
|
| Mixed use and other | | 9,470 |
| | 309 |
| | 5,384 |
| | 12,300 |
| | 1,350,976 |
| | 1,378,439 |
|
PCI - commercial real-estate (1) | | — |
| | 15,682 |
| | 155 |
| | 1,595 |
| | 47,835 |
| | 65,267 |
|
| Total commercial real-estate | | 36,321 |
| | 15,991 |
| | 9,629 |
| | 30,293 |
| | 4,261,238 |
| | 4,353,472 |
|
| Home equity | | 5,804 |
| | — |
| | 1,392 |
| | 3,324 |
| | 703,122 |
| | 713,642 |
|
| Residential real estate | | 15,294 |
| | — |
| | 1,487 |
| | 1,978 |
| | 430,364 |
| | 449,123 |
|
PCI - residential real estate (1) | | — |
| | 988 |
| | 111 |
| | — |
| | 1,683 |
| | 2,782 |
|
| Premium finance receivables | | | | | | | | | | | | |
| Commercial insurance loans | | 12,298 |
| | 10,275 |
| | 12,335 |
| | 14,672 |
| | 2,328,949 |
| | 2,378,529 |
|
| Life insurance loans | | — |
| | 649 |
| | 896 |
| | 4,783 |
| | 1,635,557 |
| | 1,641,885 |
|
Purchased life insurance loans (1) | | — |
| | — |
| | — |
| | — |
| | 409,760 |
| | 409,760 |
|
| Consumer and other | | 1,116 |
| | 73 |
| | 562 |
| | 600 |
| | 158,022 |
| | 160,373 |
|
| Total loans, net of unearned income, excluding covered loans | | $ | 77,344 |
| | $ | 29,428 |
| | $ | 30,577 |
| | $ | 85,796 |
| | $ | 13,526,851 |
| | $ | 13,749,996 |
|
| Covered loans | | 6,690 |
| | 34,486 |
| | 4,003 |
| | 1,482 |
| | 228,493 |
| | 275,154 |
|
| Total loans, net of unearned income | | $ | 84,034 |
| | $ | 63,914 |
| | $ | 34,580 |
| | $ | 87,278 |
| | $ | 13,755,344 |
| | $ | 14,025,150 |
|
| |
| (1) | Purchased credit impaired ("PCI") loans represent loans acquired with evidence of credit quality deterioration since origination, in accordance with ASC 310-30. Loan agings are based upon contractually required payments. |
|
| | | | | | | | | | | | | | | | | | |
| Aging as a % of Loan Balance: | | Nonaccrual | | 90+ days and still accruing | | 60-89 days past due | | 30-59 days past due | | Current | | Total Loans |
| Commercial | | | | | | | | | | | | |
| Commercial and industrial | | 0.3 | % | | — | % | | 0.2 | % | | 1.1 | % | | 98.4 | % | | 100.0 | % |
| Franchise | | — |
| | — |
| | — |
| | 0.2 |
| | 99.8 |
| | 100.0 |
|
| Mortgage warehouse lines of credit | | — |
| | — |
| | — |
| | 1.1 |
| | 98.9 |
| | 100.0 |
|
| Community Advantage - homeowners association | | — |
| | — |
| | — |
| | — |
| | 100.0 |
| | 100.0 |
|
| Aircraft | | — |
| | — |
| | — |
| | — |
| | 100.0 |
| | 100.0 |
|
| Asset-based lending | | — |
| | — |
| | — |
| | 0.8 |
| | 99.2 |
| | 100.0 |
|
| Tax exempt | | — |
| | — |
| | — |
| | — |
| | 100.0 |
| | 100.0 |
|
| Leases | | — |
| | — |
| | — |
| | — |
| | 100.0 |
| | 100.0 |
|
| Other | | — |
| | — |
| | — |
| | — |
| | 100.0 |
| | 100.0 |
|
PCI - commercial(1) | | — |
| | 11.2 |
| | — |
| | 1.7 |
| | 87.1 |
| | 100.0 |
|
| Total commercial | | 0.2 |
| | — |
| | 0.1 |
| | 0.8 |
| | 98.9 |
| | 100.0 |
|
| Commercial real-estate | | | | | | | | | | | | |
| Residential construction | | — |
| | — |
| | — |
| | 0.1 |
| | 99.9 |
| | 100.0 |
|
| Commercial construction | | 0.5 |
| | — |
| | — |
| | — |
| | 99.5 |
| | 100.0 |
|
| Land | | 2.2 |
| | — |
| | 0.6 |
| | 4.3 |
| | 92.9 |
| | 100.0 |
|
| Office | | 1.6 |
| | — |
| | 0.1 |
| | 0.6 |
| | 97.7 |
| | 100.0 |
|
| Industrial | | 0.8 |
| | — |
| | 0.1 |
| | 0.1 |
| | 99.0 |
| | 100.0 |
|
| Retail | | 1.0 |
| | — |
| | 0.2 |
| | 0.4 |
| | 98.4 |
| | 100.0 |
|
| Multi-family | | 0.1 |
| | — |
| | — |
| | 0.7 |
| | 99.2 |
| | 100.0 |
|
| Mixed use and other | | 0.7 |
| | — |
| | 0.4 |
| | 0.9 |
| | 98.0 |
| | 100.0 |
|
PCI - commercial real-estate (1) | | — |
| | 24.0 |
| | 0.2 |
| | 2.4 |
| | 73.4 |
| | 100.0 |
|
| Total commercial real-estate | | 0.8 |
| | 0.4 |
| | 0.2 |
| | 0.7 |
| | 97.9 |
| | 100.0 |
|
| Home equity | | 0.8 |
| | — |
| | 0.2 |
| | 0.5 |
| | 98.5 |
| | 100.0 |
|
| Residential real estate | | 3.4 |
| | — |
| | 0.3 |
| | 0.4 |
| | 95.9 |
| | 100.0 |
|
PCI - residential real estate (1) | | — |
| | 35.5 |
| | 4.0 |
| | — |
| | 60.5 |
| | 100.0 |
|
| Premium finance receivables | | | | | | | | | | | | |
| Commercial insurance loans | | 0.5 |
| | 0.4 |
| | 0.5 |
| | 0.6 |
| | 98.0 |
| | 100.0 |
|
| Life insurance loans | | — |
| | — |
| | 0.1 |
| | 0.3 |
| | 99.6 |
| | 100.0 |
|
Purchased life insurance loans (1) | | — |
| | — |
| | — |
| | — |
| | 100.0 |
| | 100.0 |
|
| Consumer and other | | 0.7 |
| | — |
| | 0.4 |
| | 0.4 |
| | 98.5 |
| | 100.0 |
|
| Total loans, net of unearned income, excluding covered loans | | 0.6 | % | | 0.2 | % | | 0.2 | % | | 0.6 | % | | 98.4 | % | | 100.0 | % |
| Covered loans | | 2.4 |
| | 12.5 |
| | 1.5 |
| | 0.5 |
| | 83.1 |
| | 100.0 |
|
| Total loans, net of unearned income | | 0.6 | % | | 0.5 | % | | 0.2 | % | | 0.6 | % | | 98.1 | % | | 100.0 | % |
Non-performing Assets, excluding covered assets
The following table sets forth Wintrust’s non-performing assets and troubled debt restructurings ("TDRs") performing under the contractual terms of the loan agreement, excluding covered assets and non-covered PCI loans, at the dates indicated.
|
| | | | | | | | | | | | |
| | | September 30, | | June 30, | | September 30, |
| (Dollars in thousands) | | 2014 | | 2014 | | 2013 |
Loans past due greater than 90 days and still accruing(1): | | | | | | |
| Commercial | | $ | — |
| | $ | — |
| | $ | 190 |
|
| Commercial real-estate | | — |
| | 309 |
| | 3,389 |
|
| Home equity | | — |
| | — |
| | — |
|
| Residential real-estate | | — |
| | — |
| | — |
|
| Premium finance receivables - commercial | | 7,115 |
| | 10,275 |
| | 11,751 |
|
| Premium finance receivables - life insurance | | — |
| | 649 |
| | 592 |
|
| Consumer and other | | 175 |
| | 73 |
| | 100 |
|
| Total loans past due greater than 90 days and still accruing | | 7,290 |
| | 11,306 |
| | 16,022 |
|
Non-accrual loans(2): | | | | | | |
| Commercial | | 10,455 |
| | 6,511 |
| | 17,647 |
|
| Commercial real-estate | | 27,363 |
| | 36,321 |
| | 52,723 |
|
| Home equity | | 5,696 |
| | 5,804 |
| | 10,926 |
|
| Residential real-estate | | 15,730 |
| | 15,294 |
| | 14,126 |
|
| Premium finance receivables - commercial | | 14,110 |
| | 12,298 |
| | 10,132 |
|
| Premium finance receivables - life insurance | | — |
| | — |
| | 14 |
|
| Consumer and other | | 426 |
| | 1,116 |
| | 1,671 |
|
| Total non-accrual loans | | 73,780 |
| | 77,344 |
| | 107,239 |
|
| Total non-performing loans: | | | | | | |
| Commercial | | 10,455 |
| | 6,511 |
| | 17,837 |
|
| Commercial real-estate | | 27,363 |
| | 36,630 |
| | 56,112 |
|
| Home equity | | 5,696 |
| | 5,804 |
| | 10,926 |
|
| Residential real-estate | | 15,730 |
| | 15,294 |
| | 14,126 |
|
| Premium finance receivables - commercial | | 21,225 |
| | 22,573 |
| | 21,883 |
|
| Premium finance receivables - life insurance | | — |
| | 649 |
| | 606 |
|
| Consumer and other | | 601 |
| | 1,189 |
| | 1,771 |
|
| Total non-performing loans | | $ | 81,070 |
| | $ | 88,650 |
| | $ | 123,261 |
|
| Other real estate owned | | 41,506 |
| | 51,673 |
| | 45,947 |
|
| Other real estate owned - from acquisitions | | 8,871 |
| | 7,915 |
| | 9,303 |
|
| Other repossessed assets | | 292 |
| | 311 |
| | 446 |
|
| Total non-performing assets | | $ | 131,739 |
| | $ | 148,549 |
| | $ | 178,957 |
|
| TDRs performing under the contractual terms of the loan agreement | | $ | 69,868 |
| | $ | 72,199 |
| | $ | 79,205 |
|
| Total non-performing loans by category as a percent of its own respective category’s period-end balance: | | | | | | |
| Commercial | | 0.28 | % | | 0.18 | % | | 0.57 | % |
| Commercial real-estate | | 0.61 |
| | 0.84 |
| | 1.35 |
|
| Home equity | | 0.79 |
| | 0.81 |
| | 1.48 |
|
| Residential real-estate | | 3.34 |
| | 3.38 |
| | 3.55 |
|
| Premium finance receivables - commercial | | 0.89 |
| | 0.95 |
| | 1.02 |
|
| Premium finance receivables - life insurance | | — |
| | 0.03 |
| | 0.03 |
|
| Consumer and other | | 0.40 |
| | 0.74 |
| | 1.03 |
|
| Total loans, net of unearned income | | 0.58 | % | | 0.64 | % | | 0.98 | % |
| Total non-performing assets as a percentage of total assets | | 0.69 | % | | 0.79 | % | | 1.01 | % |
| Allowance for loan losses as a percentage of total non-performing loans | | 112.27 | % | | 104.06 | % | | 86.96 | % |
(1) As of the dates shown, no TDRs were past due greater than 90 days and still accruing interest.
(2) Non-accrual loans included TDRs totaling $13.5 million, $15.9 million, and $35.8 million as of September 30, 2014, June 30, 2014, and September 30, 2013, respectively.
Non-performing Commercial and Commercial Real Estate
Commercial non-performing loans totaled $10.5 million as of September 30, 2014 compared to $6.5 million as of June 30, 2014 and $17.8 million as of September 30, 2013. Commercial real estate non-performing loans totaled $27.4 million as of September 30, 2014 compared to $36.6 million as of June 30, 2014 and $56.1 million as of September 30, 2013.
Management is pursuing the resolution of all credits in this category. At this time, management believes reserves are appropriate to absorb inherent losses that are expected upon the ultimate resolution of these credits.
Non-performing Residential Real Estate and Home Equity
Non-performing home equity and residential real estate loans totaled $21.4 million as of September 30, 2014. The balance remained relatively unchanged from June 30, 2014 and decreased $3.6 million from September 30, 2013. The September 30, 2014 non-performing balance is comprised of $15.7 million of residential real estate (75 individual credits) and $5.7 million of home equity loans (36 individual credits). On average, this is approximately 7 non-performing residential real estate loans and home equity loans per chartered bank within the Company. The Company believes control and collection of these loans is very manageable. At this time, management believes reserves are adequate to absorb inherent losses that are expected upon the ultimate resolution of these credits.
Non-performing Commercial Insurance Premium Finance Receivables
The table below presents the level of non-performing property and casualty premium finance receivables as of September 30, 2014, June 30, 2014 and September 30, 2013 and the amount of net charge-offs for the quarters then ended.
|
| | | | | | | | | | | | |
| | | September 30, | | June 30, | | September 30, |
| (Dollars in thousands) | | 2014 | | 2014 | | 2013 |
| Non-performing premium finance receivables - commercial | | $ | 21,225 |
| | $ | 22,573 |
| | $ | 21,883 |
|
| - as a percent of premium finance receivables - commercial outstanding | | 0.89 | % | | 0.95 | % | | 1.02 | % |
| Net charge-offs of premium finance receivables - commercial | | $ | 1,268 |
| | $ | 1,180 |
| | $ | 980 |
|
| - annualized as a percent of average premium finance receivables - commercial | | 0.20 | % | | 0.20 | % | | 0.17 | % |
Fluctuations in this category may occur due to timing and nature of account collections from insurance carriers. The Company’s underwriting standards, regardless of the condition of the economy, have remained consistent. We anticipate that net charge-offs and non-performing asset levels in the near term will continue to be at levels that are within acceptable operating ranges for this category of loans. Management is comfortable with administering the collections at this level of non-performing property and casualty premium finance receivables and believes reserves are adequate to absorb inherent losses that are expected upon the ultimate resolution of these credits.
Due to the nature of collateral for commercial premium finance receivables, it customarily takes 60-150 days to convert the collateral into cash. Accordingly, the level of non-performing commercial premium finance receivables is not necessarily indicative of the loss inherent in the portfolio. In the event of default, Wintrust has the power to cancel the insurance policy and collect the unearned portion of the premium from the insurance carrier. In the event of cancellation, the cash returned in payment of the unearned premium by the insurer should generally be sufficient to cover the receivable balance, the interest and other charges due. Due to notification requirements and processing time by most insurance carriers, many receivables will become delinquent beyond 90 days while the insurer is processing the return of the unearned premium. Management continues to accrue interest until maturity as the unearned premium is ordinarily sufficient to pay-off the outstanding balance and contractual interest due.
Nonperforming Loans Rollforward
The table below presents a summary of the changes in the balance of non-performing loans, excluding covered loans, for the periods presented:
|
| | | | | | | | | | | | | | | | | | | | |
| | | Three Months Ended | | Nine Months Ended |
| | | September 30, | | June 30, | | September 30, | | September 30, | | September 30, |
| (Dollars in thousands) | | 2014 | | 2014 | | 2013 | | 2014 | | 2013 |
| Balance at beginning of period | | $ | 88,650 |
| | $ | 90,124 |
| | $ | 121,485 |
| | $ | 103,334 |
| | $ | 118,083 |
|
| Additions, net | | 10,389 |
| | 15,143 |
| | 26,413 |
| | 31,187 |
| | 75,791 |
|
| Return to performing status | | (3,745 | ) | | (1,094 | ) | | (805 | ) | | (6,812 | ) | | (1,622 | ) |
| Payments received | | (4,792 | ) | | (3,083 | ) | | (8,251 | ) | | (11,605 | ) | | (22,924 | ) |
| Transfer to OREO and other repossessed assets | | (2,782 | ) | | (9,741 | ) | | (7,854 | ) | | (22,536 | ) | | (20,015 | ) |
| Charge-offs | | (4,751 | ) | | (4,602 | ) | | (7,753 | ) | | (14,127 | ) | | (28,226 | ) |
Net change for niche loans (1) | | (1,899 | ) | | 1,903 |
| | 26 |
| | 1,629 |
| | 2,174 |
|
| Balance at end of period | | $ | 81,070 |
| | $ | 88,650 |
| | $ | 123,261 |
| | $ | 81,070 |
| | $ | 123,261 |
|
| |
| (1) | This includes activity for premium finance receivables and indirect consumer loans. |
TDRs
The table below presents a summary of TDRs as of the respective date, presented by loan category and accrual status:
|
| | | | | | | | | | | | |
| | | September 30, | | June 30, | | September 30, |
| (Dollars in thousands) | | 2014 | | 2014 | | 2013 |
| Accruing TDRs: | | | | | | |
| Commercial | | $ | 5,517 |
| | $ | 5,225 |
| | $ | 6,174 |
|
| Commercial real estate | | 61,288 |
| | 63,178 |
| | 70,346 |
|
| Residential real estate and other | | 3,063 |
| | 3,796 |
| | 2,685 |
|
| Total accrual | | $ | 69,868 |
| | $ | 72,199 |
| | $ | 79,205 |
|
Non-accrual TDRs: (1) | | | | | | |
| Commercial | | $ | 927 |
| | $ | 1,192 |
| | $ | 2,199 |
|
| Commercial real estate | | 9,153 |
| | 12,656 |
| | 30,442 |
|
| Residential real estate and other | | 3,437 |
| | 2,060 |
| | 3,157 |
|
| Total non-accrual | | $ | 13,517 |
| | $ | 15,908 |
| | $ | 35,798 |
|
| Total TDRs: | | | | | | |
| Commercial | | $ | 6,444 |
| | $ | 6,417 |
| | $ | 8,373 |
|
| Commercial real estate | | 70,441 |
| | 75,834 |
| | 100,788 |
|
| Residential real estate and other | | 6,500 |
| | 5,856 |
| | 5,842 |
|
| Total TDRs | | $ | 83,385 |
| | $ | 88,107 |
| | $ | 115,003 |
|
| Weighted-average contractual interest rate of TDRs | | 4.05 | % | | 4.04 | % | | 4.12 | % |
| |
| (1) | Included in total non-performing loans. |
At September 30, 2014, the Company had $83.4 million in loans modified in TDRs. The $83.4 million in TDRs represents 145 credits in which economic concessions were granted to certain borrowers to better align the terms of their loans with their current ability to pay. The balance decreased from $88.1 million representing 143 credits at June 30, 2014 and decreased from $115.0 million representing 161 credits at September 30, 2013.
The table below presents a summary of TDRs as of September 30, 2014 and September 30, 2013, and shows the changes in the balance during the periods presented:
Three Months Ended September 30, 2014
|
| | | | | | | | | | | | | | | | |
| (Dollars in thousands) | | Commercial | | Commercial Real Estate | | Residential Real Estate and Other | | Total |
| Balance at beginning of period | | $ | 6,417 |
| | $ | 75,834 |
| | $ | 5,856 |
| | $ | 88,107 |
|
| Additions during the period | | — |
| | — |
| | 667 |
| | 667 |
|
| Reductions: | | | | | | | | — |
|
| Charge-offs | | (28 | ) | | (2,584 | ) | | — |
| | (2,612 | ) |
| Transferred to OREO and other repossessed assets | | — |
| | — |
| | — |
| | — |
|
Removal of TDR loan status (1) | | — |
| | — |
| | — |
| | — |
|
| Payments received, net | | 55 |
| | (2,809 | ) | | (23 | ) | | (2,777 | ) |
| Balance at period end | | $ | 6,444 |
| | $ | 70,441 |
| | $ | 6,500 |
| | $ | 83,385 |
|
Three Months Ended September 30, 2013
|
| | | | | | | | | | | | | | | | |
| (Dollars in thousands) |
| Commercial |
| Commercial Real Estate |
| Residential Real Estate and Other |
| Total |
| Balance at beginning of period |
| $ | 9,220 |
| | $ | 110,624 |
| | $ | 6,352 |
| | $ | 126,196 |
|
| Additions during the period |
| — |
| | 3,003 |
| | 1,000 |
| | 4,003 |
|
| Reductions: |
| | | | | | | |
| Charge-offs |
| (584 | ) | | (4,923 | ) | | (3 | ) | | (5,510 | ) |
| Transferred to OREO and other repossessed assets |
| — |
| | — |
| | — |
| | — |
|
Removal of TDR loan status (1) |
| (92 | ) | | — |
| | — |
| | (92 | ) |
| Payments received, net |
| (171 | ) | | (7,916 | ) | | (1,507 | ) | | (9,594 | ) |
| Balance at period end |
| $ | 8,373 |
| | $ | 100,788 |
| | $ | 5,842 |
| | $ | 115,003 |
|
Nine Months Ended September 30, 2014
|
| | | | | | | | | | | | | | | | |
| (Dollars in thousands) |
| Commercial |
| Commercial
Real Estate |
| Residential
Real Estate
and Other |
| Total |
| Balance at beginning of period |
| $ | 7,388 |
| | $ | 93,535 |
| | $ | 6,180 |
| | $ | 107,103 |
|
| Additions during the period |
| 88 |
| | 7,177 |
| | 887 |
| | 8,152 |
|
| Reductions: |
| | | | | | | — |
|
| Charge-offs |
| (51 | ) | | (6,316 | ) | | (479 | ) | | (6,846 | ) |
| Transferred to OREO and other repossessed assets |
| (252 | ) | | (16,057 | ) | | — |
| | (16,309 | ) |
Removal of TDR loan status (1) |
| (383 | ) | | — |
| | — |
| | (383 | ) |
| Payments received, net |
| (346 | ) | | (7,898 | ) | | (88 | ) | | (8,332 | ) |
| Balance at period end |
| $ | 6,444 |
| | $ | 70,441 |
| | $ | 6,500 |
| | $ | 83,385 |
|
| |
| (1) | Loan was previously classified as a troubled debt restructuring and subsequently performed in compliance with the loan’s modified terms for a period of six months (including over a calendar year-end) at a modified interest rate which represented a market rate at the time of restructuring. Per our TDR policy, the TDR classification is removed. |
Nine Months Ended September 30, 2013
|
| | | | | | | | | | | | | | | | |
| (Dollars in thousands) | | Commercial | | Commercial
Real Estate | | Residential
Real Estate
and Other | | Total |
| Balance at beginning of period | | $ | 17,995 |
| | $ | 102,415 |
| | $ | 6,063 |
| | $ | 126,473 |
|
| Additions during the period | | 708 |
| | 18,262 |
| | 1,778 |
| | 20,748 |
|
| Reductions: | | | | | | | | |
| Charge-offs | | (2,753 | ) | | (6,666 | ) | | (260 | ) | | (9,679 | ) |
| Transferred to OREO and other repossessed assets | | (3,800 | ) | | (837 | ) | | (103 | ) | | (4,740 | ) |
Removal of TDR loan status (1) | | (2,932 | ) | | — |
| | — |
| | (2,932 | ) |
| Payments received, net | | (845 | ) | | (12,386 | ) | | (1,636 | ) | | (14,867 | ) |
| Balance at period end | | $ | 8,373 |
| | $ | 100,788 |
| | $ | 5,842 |
| | $ | 115,003 |
|
| |
| (1) | Loan was previously classified as a troubled debt restructuring and subsequently performed in compliance with the loan’s modified terms for a period of six months (including over a calendar year-end) at a modified interest rate which represented a market rate at the time of restructuring. Per our TDR policy, the TDR classification is removed. |
The Company’s approach to restructuring loans, excluding those acquired with evidence of credit quality deterioration since origination, is built on its credit risk rating system which requires credit management personnel to assign a credit risk rating to each loan at the time of each modification. In each case, the loan officer is responsible for recommending a credit risk rating for each loan and ensuring the credit risk ratings are appropriate. These credit risk ratings are then reviewed and approved by the bank’s chief credit officer and/or concurrence credit officer. Credit risk ratings are determined by evaluating a number of factors including a borrower’s financial strength, cash flow coverage, collateral protection and guarantees. The Company’s credit risk rating scale is one through ten with higher scores indicating higher risk. In the case of loans rated six or worse following modification, the Company’s Managed Assets Division evaluates the loan and the credit risk rating and determines that the loan has been restructured to be reasonably assured of repayment and of performance according to the modified terms and is supported by a current, well-documented credit assessment of the borrower’s financial condition and prospects for repayment under the revised terms.
A modification of a loan, excluding those acquired with evidence of credit quality deterioration since origination, with an existing credit risk rating of six or worse or a modification of any other credit, which will result in a restructured credit risk rating of six or worse must be reviewed for TDR classification. In that event, our Managed Assets Division conducts an overall credit and collateral review. A modification of a loan is considered to be a TDR if both (1) the borrower is experiencing financial difficulty and (2) for economic or legal reasons, the bank grants a concession to a borrower that it would not otherwise consider. The modification of a loan, excluding those acquired with evidence of credit quality deterioration since origination, where the credit risk rating is five or better both before and after such modification is not considered to be a TDR. Based on the Company’s credit risk rating system, it considers that borrowers whose credit risk rating is five or better are not experiencing financial difficulties and therefore, are not considered TDRs.
All credits determined to be a TDR will continue to be classified as a TDR in all subsequent periods, unless the borrower has been in compliance with the loan’s modified terms for a period of six months (including over a calendar year-end) and the modified interest rate represented a market rate at the time of a restructuring. The Managed Assets Division, in consultation with the respective loan officer, determines whether the modified interest rate represented a current market rate at the time of restructuring. Using knowledge of current market conditions and rates, competitive pricing on recent loan originations, and an assessment of various characteristics of the modified loan (including collateral position and payment history), an appropriate market rate for a new borrower with similar risk is determined. If the modified interest rate meets or exceeds this market rate for a new borrower with similar risk, the modified interest rate represents a market rate at the time of restructuring. Additionally, before removing a loan from TDR classification, a review of the current or previously measured impairment on the loan and any concerns related to future performance by the borrower is conducted. If concerns exist about the future ability of the borrower to meet its obligations under the loans based on a credit review by the Managed Assets Division, the TDR classification is not removed from the loan. Loans classified as TDRs that are re-modified subsequent to the initial determination will continue to be classified as TDRs following the re-modification, unless the requirements for removal from TDR classification discussed above are satisfied at the time of the re-modification.
TDRs are reviewed at the time of modification and on a quarterly basis to determine if a specific reserve is needed. The carrying amount of the loan is compared to the expected payments to be received, discounted at the loan’s original rate, or for collateral dependent loans, to the fair value of the collateral. Any shortfall is recorded as a specific reserve. The Company, in accordance with ASC 310-10, continues to individually measure impairment of these loans after the TDR classification is removed.
Each TDR was reviewed for impairment at September 30, 2014 and approximately $2.0 million of impairment was present and appropriately reserved for through the Company’s normal reserving methodology in the Company’s allowance for loan losses. For TDRs in which impairment is calculated by the present value of future cash flows, the Company records interest income representing the decrease in impairment resulting from the passage of time during the respective period, which differs from interest income from contractually required interest on these specific loans. For the three months ended September 30, 2014 and 2013, the Company recorded $294,000 and $205,000, respectively, in interest income representing this decrease in impairment. For the nine months ended September 30, 2014 and 2013, the Company recorded $529,000 and $727,000, respectively, in interest income.
Other Real Estate Owned
The table below presents a summary of other real estate owned, excluding covered other real estate owned, as of September 30, 2014, June 30, 2014 and September 30, 2013, and shows the activity for the respective period and the balance for each property type:
|
| | | | | | | | | | | | |
| | | Three Months Ended |
| | | September 30, | | June 30, | | September 30, |
| (Dollars in thousands) | | 2014 | | 2014 | | 2013 |
| Balance at beginning of period | | $ | 59,588 |
| | $ | 54,131 |
| | $ | 57,025 |
|
| Disposals/resolved | | (12,196 | ) | | (6,155 | ) | | (10,194 | ) |
| Transfers in at fair value, less costs to sell | | 3,150 |
| | 12,801 |
| | 9,619 |
|
| Additions from acquisition | | — |
| | — |
| | — |
|
| Fair value adjustments | | (165 | ) | | (1,189 | ) | | (1,200 | ) |
| Balance at end of period | | $ | 50,377 |
| | $ | 59,588 |
| | $ | 55,250 |
|
| | | | | | | |
| | | Period End |
| | | September 30, | | June 30, | | September 30, |
| Balance by Property Type | | 2014 | | 2014 | | 2013 |
| Residential real estate | | $ | 8,754 |
| | $ | 9,007 |
| | $ | 6,421 |
|
| Residential real estate development | | 3,135 |
| | 3,216 |
| | 4,551 |
|
| Commercial real estate | | 38,488 |
| | 47,365 |
| | 44,278 |
|
| Total | | $ | 50,377 |
| | $ | 59,588 |
| | $ | 55,250 |
|
Covered Assets
In conjunction with FDIC-assisted transactions, the Company entered into loss share agreements with the FDIC. These agreements cover realized losses on loans, foreclosed real estate and certain other assets. These loss share assets are measured separately from the loan portfolios because they are not contractually embedded in the loans and are not transferable with the loans should the Company choose to dispose of them. Fair values at the acquisition dates were estimated based on projected cash flows available for loss-share based on the credit adjustments estimated for each loan pool and the loss share percentages. The loss share assets are also separately measured from the related loans and foreclosed real estate and recorded separately on the Consolidated Statements of Condition. Subsequent to the acquisition date, reimbursements received from the FDIC for actual incurred losses will reduce the loss share assets. Additional expected losses, to the extent such expected losses result in the recognition of an allowance for loan losses, will increase the loss share assets. The loss share agreements with the FDIC require the Company to reimburse the FDIC in the event that actual losses on covered assets are lower than the original loss estimates agreed upon with the FDIC with respect of such assets in the loss share agreements. The allowance for loan losses for loans acquired in FDIC-assisted transactions is determined without giving consideration to the amounts recoverable through loss share agreements (since the loss share agreements are separately accounted for and thus presented “gross” on the balance sheet). On the Consolidated Statements of Income, the provision for credit losses is reported net of changes in the amount recoverable under the loss share agreements. Reductions to expected losses, to the extent such reductions to expected losses are the result of an improvement to the actual or expected cash flows from the covered assets, will reduce the loss share assets. The increases in cash flows for the purchased loans are recognized as interest income prospectively.
The following table provides a comparative analysis for the period end balances of the covered asset components and any changes in the allowance for covered loan losses.
|
| | | | | | | | | | | | |
| | | September 30, | | June 30, | | September 30, |
| (Dollars in thousands) | | 2014 | | 2014 | | 2013 |
| Period End Balances: | | | | | | |
| Loans | | $ | 254,605 |
| | $ | 275,154 |
| | $ | 415,988 |
|
| Other real estate owned | | 48,568 |
| | 55,996 |
| | 87,037 |
|
| Other assets | | 2,242 |
| | 2,242 |
| | 2,272 |
|
| FDIC Indemnification asset | | 27,359 |
| | 46,115 |
| | 100,313 |
|
| Total covered assets | | $ | 332,774 |
| | $ | 379,507 |
| | $ | 605,610 |
|
| Allowance for Covered Loan Losses Rollforward: | | | | | | |
| Balance at beginning of quarter: | | $ | 1,667 |
|
| $ | 3,447 |
|
| $ | 14,429 |
|
| Provision for covered loan losses before benefit attributable to FDIC loss share agreements | | (818 | ) |
| (764 | ) |
| (2,331 | ) |
| Benefit attributable to FDIC loss share agreements | | 654 |
|
| 611 |
|
| 1,865 |
|
| Net provision for covered loan losses | | (164 | ) |
| (153 | ) |
| (466 | ) |
| Decrease in FDIC indemnification asset | | (654 | ) |
| (611 | ) |
| (1,865 | ) |
| Loans charged-off | | (293 | ) |
| (2,189 | ) |
| (3,237 | ) |
| Recoveries of loans charged-off | | 2,099 |
|
| 1,173 |
|
| 4,063 |
|
| Net recoveries (charge-offs) | | 1,806 |
|
| (1,016 | ) |
| 826 |
|
| Balance at end of quarter | | $ | 2,655 |
|
| $ | 1,667 |
|
| $ | 12,924 |
|
Changes in Accretable Yield
The excess of cash flows expected to be collected over the carrying value of loans accounted for under ASC 310-30 is referred to as the accretable yield and is recognized in interest income using an effective yield method over the remaining life of the pool of loans. The accretable yield is affected by:
| |
| • | Changes in interest rate indices for variable rate loans accounted for under ASC 310-30 – Expected future cash flows are based on the variable rates in effect at the time of the regular evaluations of cash flows expected to be collected; |
| |
| • | Changes in prepayment assumptions – Prepayments affect the estimated life of loans accounted for under ASC 310-30 which may change the amount of interest income, and possibly principal, expected to be collected; and |
| |
| • | Changes in the expected principal and interest payments over the estimated life – Updates to expected cash flows are driven by the credit outlook and actions taken with borrowers. Changes in expected future cash flows from loan modifications are included in the regular evaluations of cash flows expected to be collected. |
The following table provides activity for the accretable yield of loans accounted for under ASC 310-30.
|
| | | | | | | | | | | | | | | | |
|
| Three Months Ended September 30, 2014 |
| Three Months Ended September 30, 2013 |
|
| Bank |
| Life Insurance Premium |
| Bank |
| Life Insurance Premium |
| (Dollars in thousands) |
| Acquisitions |
| Finance Loans |
| Acquisitions |
| Finance Loans |
| Accretable yield, beginning balance |
| $ | 92,102 |
|
| $ | 5,179 |
|
| $ | 130,856 |
|
| $ | 10,287 |
|
| Acquisitions |
| — |
|
| — |
|
| — |
|
| — |
|
| Accretable yield amortized to interest income |
| (6,722 | ) |
| (1,125 | ) |
| (9,056 | ) |
| (1,943 | ) |
Accretable yield amortized to indemnification asset(1) |
| (8,784 | ) |
| — |
|
| (8,279 | ) |
| — |
|
Reclassification from non-accretable difference(2) |
| 2,584 |
|
| — |
|
| 8,703 |
|
| 234 |
|
| Increases (decreases) in interest cash flows due to payments and changes in interest rates |
| 4,564 |
|
| 111 |
|
| (5,194 | ) |
| 235 |
|
Accretable yield, ending balance (3) |
| $ | 83,744 |
|
| $ | 4,165 |
|
| $ | 117,030 |
|
| $ | 8,813 |
|
|
| | | | | | | | | | | | | | | | |
| | | Nine Months Ended
September, 2014 | | Nine Months Ended
September 30, 2013 |
| | | Bank | | Life Insurance
Premium | | Bank | | Life Insurance
Premium |
| (Dollars in thousands) | | Acquisitions | | Finance Loans | | Acquisitions | | Finance Loans |
| Accretable yield, beginning balance | | $ | 107,655 |
| | $ | 8,254 |
| | $ | 143,224 |
| | $ | 13,055 |
|
| Acquisitions | | — |
| | — |
| | 1,977 |
| | — |
|
| Accretable yield amortized to interest income | | (24,109 | ) | | (4,329 | ) | | (27,980 | ) | | (6,216 | ) |
Accretable yield amortized to indemnification asset(1) | | (25,593 | ) | | — |
| | (28,891 | ) | | — |
|
Reclassification from non-accretable difference(2) | | 29,092 |
| | — |
| | 44,907 |
| | 1,241 |
|
| (Decreases) increases in interest cash flows due to payments and changes in interest rates | | (3,301 | ) | | 240 |
| | (16,207 | ) | | 733 |
|
Accretable yield, ending balance (3) | | $ | 83,744 |
| | $ | 4,165 |
| | $ | 117,030 |
| | $ | 8,813 |
|
| |
| (1) | Represents the portion of the current period accreted yield, resulting from lower expected losses, applied to reduce the loss share indemnification asset. |
| |
| (2) | Reclassification is the result of subsequent increases in expected principal cash flows. |
| |
| (3) | As of September 30, 2014, the Company estimates that the remaining accretable yield balance to be amortized to the indemnification asset for the bank acquisitions is $21.0 million. The remainder of the accretable yield related to bank acquisitions is expected to be amortized to interest income. |
Accretion to interest income from loans acquired in bank acquisitions totaled $6.7 million and $9.1 million in the third quarter of 2014 and 2013, respectively. For the nine months ended September 30, 2014 and 2013, the Company recorded accretion to interest income of $24.1 million and $28.0 million, respectively. These amounts include accretion from both covered and non-covered loans, and are included together within interest and fees on loans in the Consolidated Statements of Income.
Items Impacting Comparative Financial Results:
Acquisitions
On August 8, 2014, the Company, through its subsidiary Town Bank, completed its acquisition of certain branch offices and deposits of Talmer Bank & Trust. Through this transaction, Town Bank acquired 11 branch offices and approximately $360 million in deposits, prior to purchase accounting adjustments.
On July 11, 2014, the Company, through its subsidiary Town Bank, completed its acquisition of the Pewaukee, Wisconsin branch of THE National Bank. In addition to the banking facility, Town Bank acquired approximately $81 million in loans and approximately $36 million in deposits, prior to purchase accounting adjustments.
On May 16, 2014, the Company, through its subsidiary Hinsdale Bank and Trust Company ("Hinsdale Bank"), completed its acquisition of the Stone Park branch office and certain related deposits of Urban Partnership Bank.
On April 28, 2014, the Company, through its subsidiary First Insurance Funding of Canada, Inc., completed its acquisition of 100% of the shares of each of Policy Billing Services Inc. and Equity Premium Finance Inc., two affiliated Canadian insurance premium funding and payment services companies.
On February 28, 2014, the Company, through its subsidiary Lake Forest Bank and Trust Company ("Lake Forest Bank"), completed its acquisition of a bank branch from Baytree National Bank & Trust Company. In addition to the banking facility, Lake Forest Bank acquired certain assets and approximately $15 million of deposits.
On October 18, 2013, the Company completed its acquisition of Diamond Bancorp, Inc. ("Diamond"). Diamond was the parent company of Diamond Bank, FSB ("Diamond Bank"), which operated four banking locations in Chicago, Schaumburg, Elmhurst, and Northbrook, Illinois. As part of the transaction, Diamond Bank was merged into the Company's wholly-owned subsidiary bank, North Shore Community Bank and Trust Company. Diamond Bank had approximately $169 million in assets and $140 million in deposits as of the acquisition date, prior to purchase accounting adjustments. The Company recorded goodwill of $8.4 million on the acquisition.
On October 1, 2013, the Company, through its subsidiary, Barrington Bank and Trust Company, N.A. through its division Wintrust Mortgage, acquired certain assets and assumed certain liabilities of the mortgage banking business of Surety Financial Services ("Surety") of Sherman Oaks, California. Surety had five offices located in southern California which originated approximately $1.0 billion in the twelve months prior to the acquisition date.
On May 1, 2013, the Company completed its acquisition of First Lansing Bancorp, Inc. ("FLB"). FLB was the parent company of First National Bank of Illinois ("FNBI"). FNBI was headquartered in Lansing, Illinois and operated seven banking locations in the south and southwest suburbs of Chicago, as well as one location in northwest Indiana. As part of the transaction, FNBI merged into the Company's wholly-owned subsidiary bank, Old Plank Trail Community Bank, N.A. (“Old Plank Trail Bank”), and the seven banking locations acquired are operating as branches of Old Plank Trail Bank. FNBI had approximately $372 million in assets and approximately $330 million in deposits as of the acquisition date, prior to purchase accounting adjustments. The Company recorded goodwill of $14.0 million on the acquisition.
Divestiture of Previous FDIC-Assisted Acquisition
On February 1, 2013, Hinsdale Bank completed its divestiture of the deposits and current banking operations of Second Federal, which were acquired in an FDIC-assisted transaction on July 20, 2012, to an unaffiliated credit union. Through this transaction, the Company divested approximately $149 million of related deposits.
Announced Acquisition
On October 14, 2014, the Company announced the signing of a definitive agreement to acquire Delavan Bancshares, Inc. ("Delavan"). Delavan is the parent company of Community Bank CBD which operated four banking locations in southeastern Wisconsin. As of June 30, 2014, Community Bank CBD had approximately $142 million in loans and approximately $167 million in deposits.
WINTRUST SUBSIDIARIES AND LOCATIONS
Wintrust is a financial holding company whose common stock is traded on the Nasdaq Global Select Market (Nasdaq: WTFC). Its 15 community bank subsidiaries are: Lake Forest Bank & Trust Company, Hinsdale Bank & Trust Company, Wintrust Bank in Chicago, Libertyville Bank & Trust Company, Barrington Bank & Trust Company, N.A., Crystal Lake Bank & Trust Company, N.A., Northbrook Bank & Trust Company, Schaumburg Bank & Trust Company, N.A., Village Bank & Trust in Arlington Heights, Beverly Bank & Trust Company, N.A. in Chicago, Wheaton Bank & Trust Company, State Bank of The Lakes in Antioch, Old Plank Trail Community Bank, N.A. in New Lenox, St. Charles Bank & Trust Company and Town Bank in Hartland, Wisconsin. The banks also operate facilities in Illinois in Algonquin, Bloomingdale, Buffalo Grove, Cary, Chicago, Clarendon Hills, Crete, Deerfield, Downers Grove, Elgin, Evergreen Park, Frankfort, Geneva, Glencoe, Glen Ellyn, Gurnee, Grayslake, Hanover Park, Highland Park, Highwood, Hoffman Estates, Island Lake, Itasca, Joliet, Lake Bluff, Lake Villa, Lansing, Lindenhurst, Lynwood, McHenry, Mokena, Mount Prospect, Mundelein, Naperville, North Chicago, Northfield, Norridge, Orland Park, Palatine, Park Ridge, Plainfield, Prospect Heights, Ravinia, Riverside, Rogers Park, Roselle, Shorewood, Skokie, South Holland, Spring Grove, Steger, Stone Park, Vernon Hills, Wauconda, Western Springs, Willowbrook, Wilmette, Winnetka and Wood Dale and in Albany, Burlington, Darlington, Delafield, Elm Grove, Genoa City, Kenosha, Lake Geneva, Madison, Menomenee Falls, Monroe, Pewaukee, Wales, Walworth and Wind Lake, Wisconsin and Dyer, Indiana.
Additionally, the Company operates various non-bank business units:
| |
| • | First Insurance Funding Corporation, one of the largest insurance premium finance companies operating in the United States, serves commercial and life insurance loan customers throughout the country. |
| |
| • | First Insurance Funding of Canada serves commercial insurance loan customers throughout Canada |
| |
| • | Tricom, Inc. of Milwaukee provides high-yielding, short-term accounts receivable financing and value-added out-sourced administrative services, such as data processing of payrolls, billing and cash management services, to temporary staffing service clients located throughout the United States. |
| |
| • | Wintrust Mortgage, a division of Barrington Bank & Trust Company, engages primarily in the origination and purchase of residential mortgages for sale into the secondary market through origination offices located throughout the United States. Loans are also originated nationwide through relationships with wholesale and correspondent offices. |
| |
| • | Wayne Hummer Investments, LLC is a broker-dealer providing a full range of private client and brokerage services to clients and correspondent banks located primarily in the Midwest. |
| |
| • | Great Lakes Advisors LLC provides money management services and advisory services to individual accounts. |
| |
| • | The Chicago Trust Company, a trust subsidiary, allows Wintrust to service customers’ trust and investment needs at each banking location. |
FORWARD-LOOKING STATEMENTS
This document contains forward-looking statements within the meaning of federal securities laws. Forward-looking information can be identified through the use of words such as “intend,” “plan,” “project,” “expect,” “anticipate,” “believe,” “estimate,” “contemplate,” “possible,” “point,” “will,” “may,” “should,” “would” and “could.” Forward-looking statements and information are not historical facts, are premised on many factors and assumptions, and represent only management’s expectations, estimates and projections regarding future events. Similarly, these statements are not guarantees of future performance and involve certain risks and uncertainties that are difficult to predict, which may include, but are not limited to, those listed below and the Risk Factors discussed under Item 1A of the Company’s 2013 Annual Report on Form 10-K and in any of the Company’s subsequent SEC filings. The Company intends such forward-looking statements to be covered by the safe harbor provisions for forward-looking statements contained in the Private Securities Litigation Reform Act of 1995, and is including this statement for purposes of invoking these safe harbor provisions. Such forward-looking statements may be deemed to include, among other things, statements relating to the Company’s future financial performance, the performance of its loan portfolio, the expected amount of future credit reserves and charge-offs, delinquency trends, growth plans, regulatory developments, securities that the Company may offer from time to time, and management’s long-term performance goals, as well as statements relating to the anticipated effects on financial condition and results of operations from expected developments or events, the Company’s business and growth strategies, including future acquisitions of banks, specialty finance or wealth management businesses, internal growth and plans to form additional de novo banks or branch offices. Actual results could differ materially from those addressed in the forward-looking statements as a result of numerous factors, including the following:
| |
| • | negative economic conditions that adversely affect the economy, housing prices, the job market and other factors that may affect the Company’s liquidity and the performance of its loan portfolios, particularly in the markets in which it operates; |
| |
| • | the extent of defaults and losses on the Company’s loan portfolio, which may require further increases in its allowance for credit losses; |
| |
| • | estimates of fair value of certain of the Company’s assets and liabilities, which could change in value significantly from period to period; |
| |
| • | the financial success and economic viability of the borrowers of our commercial loans; |
| |
| • | market conditions in the commercial real estate market in the Chicago metropolitan area; |
| |
| • | the extent of commercial and consumer delinquencies and declines in real estate values, which may require further increases in the Company’s allowance for loan and lease losses; |
| |
| • | inaccurate assumptions in our analytical and forecasting models used to manage our loan portfolio; |
| |
| • | changes in the level and volatility of interest rates, the capital markets and other market indices that may affect, among other things, the Company’s liquidity and the value of its assets and liabilities; |
| |
| • | competitive pressures in the financial services business which may affect the pricing of the Company’s loan and deposit products as well as its services (including wealth management services); |
| |
| • | failure to identify and complete favorable acquisitions in the future or unexpected difficulties or developments related to the integration of the Company’s recent or future acquisitions; |
| |
| • | unexpected difficulties and losses related to FDIC-assisted acquisitions, including those resulting from our loss-sharing arrangements with the FDIC; |
| |
| • | any negative perception of the Company’s reputation or financial strength; |
| |
| • | ability to raise additional capital on acceptable terms when needed; |
| |
| • | disruption in capital markets, which may lower fair values for the Company’s investment portfolio; |
| |
| • | ability to use technology to provide products and services that will satisfy customer demands and create efficiencies in operations; |
| |
| • | adverse effects on our information technology systems resulting from failures, human error or tampering; |
| |
| • | adverse effects of failures by our vendors to provide agreed upon services in the manner and at the cost agreed, particularly our information technology vendors; |
| |
| • | increased costs as a result of protecting our customers from the impact of stolen debit card information; |
| |
| • | accuracy and completeness of information the Company receives about customers and counterparties to make credit decisions; |
| |
| • | ability of the Company to attract and retain senior management experienced in the banking and financial services industries; |
| |
| • | environmental liability risk associated with lending activities; |
| |
| • | the impact of any claims or legal actions, including any effect on our reputation; |
| |
| • | losses incurred in connection with repurchases and indemnification payments related to mortgages; |
| |
| • | the loss of customers as a result of technological changes allowing consumers to complete their financial transactions without the use of a bank; |
| |
| • | the soundness of other financial institutions; |
| |
| • | the expenses and delayed returns inherent in opening new branches and de novo banks; |
| |
| • | examinations and challenges by tax authorities; |
| |
| • | changes in accounting standards, rules and interpretations and the impact on the Company’s financial statements; |
| |
| • | the ability of the Company to receive dividends from its subsidiaries; |
| |
| • | a decrease in the Company’s regulatory capital ratios, including as a result of further declines in the value of its loan portfolios, or otherwise; |
| |
| • | legislative or regulatory changes, particularly changes in regulation of financial services companies and/or the products and services offered by financial services companies, including those resulting from the Dodd-Frank Act; |
| |
| • | a lowering of our credit rating; |
| |
| • | restrictions upon our ability to market our products to consumers and limitations on our ability to profitably operate our mortgage business resulting from the Dodd-Frank Act; |
| |
| • | increased costs of compliance, heightened regulatory capital requirements and other risks associated with changes in regulation and the current regulatory environment, including the Dodd-Frank Act; |
| |
| • | the impact of heightened capital requirements; |
| |
| • | increases in the Company’s FDIC insurance premiums, or the collection of special assessments by the FDIC; |
| |
| • | delinquencies or fraud with respect to the Company’s premium finance business; |
| |
| • | credit downgrades among commercial and life insurance providers that could negatively affect the value of collateral securing the Company’s premium finance loans; |
| |
| • | the Company’s ability to comply with covenants under its credit facility; and |
| |
| • | fluctuations in the stock market, which may have an adverse impact on the Company’s wealth management business and brokerage operation. |
Therefore, there can be no assurances that future actual results will correspond to these forward-looking statements. The reader is cautioned not to place undue reliance on any forward-looking statement made by the Company. Any such statement speaks only as of the date the statement was made or as of such date that may be referenced within the statement. The Company undertakes no obligation to update any forward-looking statement to reflect the impact of circumstances after the date of the press release. Persons are advised, however, to consult further disclosures management makes on related subjects in its reports filed with the Securities and Exchange Commission and in its press releases.
CONFERENCE CALL, WEB CAST AND REPLAY
The Company will hold a conference call at 10:00 a.m. (CT) Friday, October 17, 2014 regarding third quarter 2014 results. Individuals interested in listening should call (877) 363-5049 and enter Conference ID #17789004. A simultaneous audio-only web cast and replay of the conference call may be accessed via the Company’s web site at (http://www.wintrust.com), Investor Relations, Investor News and Events, Presentations & Conference Calls. The text of the third quarter 2014 earnings press release will be available on the home page of the Company’s website at (http://www.wintrust.com) and at the Investor Relations, Investor News and Events, Press Releases link on its website.
WINTRUST FINANCIAL CORPORATION
Supplemental Financial Information
5 Quarter Trends
WINTRUST FINANCIAL CORPORATION - Supplemental Financial Information
Selected Financial Highlights - 5 Quarter Trends
(Dollars in thousands, except per share data)
|
| | | | | | | | | | | | | | | | | | | | |
| | | Three Months Ended |
| | | September 30, | | June 30, | | March 31, | | December 31, | | September 30, |
| | | 2014 | | 2014 | | 2014 | | 2013 | | 2013 |
| Selected Financial Condition Data (at end of period): | | | | | | | | | | |
| Total assets | | $ | 19,169,345 |
| | $ | 18,895,681 |
| | $ | 18,221,163 |
| | $ | 18,097,783 |
| | $ | 17,682,548 |
|
| Total loans, excluding loans held-for-sale and covered loans | | 14,052,059 |
| | 13,749,996 |
| | 13,133,160 |
| | 12,896,602 |
| | 12,581,039 |
|
| Total deposits | | 16,065,246 |
| | 15,556,376 |
| | 15,129,045 |
| | 14,668,789 |
| | 14,647,446 |
|
| Junior subordinated debentures | | 249,493 |
| | 249,493 |
| | 249,493 |
| | 249,493 |
| | 249,493 |
|
| Total shareholders’ equity | | 2,028,508 |
| | 1,998,235 |
| | 1,940,143 |
| | 1,900,589 |
| | 1,873,566 |
|
| Selected Statements of Income Data: | | | | | | | | | | |
| Net interest income | | 151,670 |
| | 149,180 |
| | 144,006 |
| | 142,308 |
| | 141,782 |
|
Net revenue (1) | | 209,622 |
| | 203,282 |
| | 189,535 |
| | 188,669 |
| | 196,444 |
|
| Net income | | 40,224 |
| | 38,541 |
| | 34,500 |
| | 35,288 |
| | 35,563 |
|
| Net income per common share – Basic | | $ | 0.83 |
| | $ | 0.79 |
| | $ | 0.71 |
| | $ | 0.82 |
| | $ | 0.86 |
|
| Net income per common share – Diluted | | $ | 0.79 |
| | $ | 0.76 |
| | $ | 0.68 |
| | $ | 0.70 |
| | $ | 0.71 |
|
| Selected Financial Ratios and Other Data: | | | | | | | | | | |
| Performance Ratios: | | | | | | | | | | |
Net interest margin (2) | | 3.46 | % | | 3.62 | % | | 3.61 | % | | 3.53 | % | | 3.57 | % |
| Non-interest income to average assets | | 1.20 | % | | 1.19 | % | | 1.03 | % | | 1.03 | % | | 1.24 | % |
| Non-interest expense to average assets | | 2.87 | % | | 2.93 | % | | 2.96 | % | | 2.82 | % | | 2.89 | % |
Net overhead ratio (2) (3) | | 1.67 | % | | 1.74 | % | | 1.93 | % | | 1.79 | % | | 1.65 | % |
Efficiency ratio - FTE (2) (4) | | 65.76 | % | | 65.36 | % | | 69.02 | % | | 65.95 | % | | 64.60 | % |
| Return on average assets | | 0.83 | % | | 0.84 | % | | 0.78 | % | | 0.78 | % | | 0.81 | % |
| Return on average common equity | | 8.09 | % | | 8.03 | % | | 7.43 | % | | 7.56 | % | | 7.85 | % |
| Return on average tangible common equity | | 10.59 | % | | 10.43 | % | | 9.71 | % | | 9.92 | % | | 10.27 | % |
| Average total assets | | $ | 19,127,346 |
| | $ | 18,302,942 |
| | $ | 17,980,943 |
| | $ | 17,835,999 |
| | $ | 17,489,571 |
|
| Average total shareholders’ equity | | 2,020,903 |
| | 1,971,656 |
| | 1,923,649 |
| | 1,895,498 |
| | 1,853,122 |
|
| Average loans to average deposits ratio | | 90.1 | % | | 90.4 | % | | 89.4 | % | | 88.9 | % | | 91.3 | % |
| Average loans to average deposits ratio (including covered loans) | | 91.8 |
| | 92.3 |
| | 91.6 |
| | 91.6 |
| | 94.3 |
|
| Common Share Data at end of period: | | | | | | | | | | |
| Market price per common share | | $ | 44.67 |
| | $ | 46.00 |
| | $ | 48.66 |
| | $ | 46.12 |
| | $ | 41.07 |
|
Book value per common share (2) | | $ | 40.74 |
| | $ | 40.21 |
| | $ | 39.21 |
| | $ | 38.47 |
| | $ | 38.09 |
|
Tangible common book value per share (2) | | $ | 31.60 |
| | $ | 31.64 |
| | $ | 30.74 |
| | $ | 29.93 |
| | $ | 29.89 |
|
| Common shares outstanding | | 46,691,047 |
| | 46,552,905 |
| | 46,258,960 |
| | 46,116,583 |
| | 39,731,043 |
|
Other Data at end of period:(8) | | | | | | | | | | |
Leverage Ratio(5) | | 10.0 | % | | 10.5 | % | | 10.4 | % | | 10.5 | % | | 10.5 | % |
Tier 1 Capital to risk-weighted assets (5) | | 11.5 | % | | 11.7 | % | | 12.0 | % | | 12.2 | % | | 12.3 | % |
Total capital to risk-weighted assets (5) | | 12.9 | % | | 13.2 | % | | 12.6 | % | | 12.9 | % | | 13.1 | % |
Tangible common equity ratio (TCE) (2) (7) | | 7.9 | % | | 8.0 | % | | 8.0 | % | | 7.8 | % | | 7.9 | % |
Tangible common equity ratio, assuming full conversion of preferred stock (2) (7) | | 8.6 | % | | 8.7 | % | | 8.7 | % | | 8.5 | % | | 8.7 | % |
Allowance for credit losses (6) | | $ | 91,841 |
| | $ | 93,137 |
| | $ | 93,012 |
| | $ | 97,641 |
| | $ | 108,455 |
|
| Non-performing loans | | 81,070 |
| | 88,650 |
| | 90,124 |
| | 103,334 |
| | 123,261 |
|
Allowance for credit losses to total loans (6) | | 0.65 | % | | 0.68 | % | | 0.71 | % | | 0.76 | % | | 0.86 | % |
| Non-performing loans to total loans | | 0.58 | % | | 0.64 | % | | 0.69 | % | | 0.80 | % | | 0.98 | % |
| Number of: | | | | | | | | | | |
| Bank subsidiaries | | 15 |
| | 15 |
| | 15 |
| | 15 |
| | 15 |
|
| Banking offices | | 139 |
| | 127 |
| | 126 |
| | 124 |
| | 119 |
|
| |
| (1) | Net revenue includes net interest income and non-interest income |
| |
| (2) | See “Supplemental Financial Measures/Ratios” for additional information on this performance measure/ratio. |
| |
| (3) | The net overhead ratio is calculated by netting total non-interest expense and total non-interest income, annualizing this amount, and dividing by that period’s total average assets. A lower ratio indicates a higher degree of efficiency. |
| |
| (4) | The efficiency ratio is calculated by dividing total non-interest expense by tax-equivalent net revenue (less securities gains or losses). A lower ratio indicates more efficient revenue generation. |
| |
| (5) | Capital ratios for current quarter-end are estimated. |
| |
| (6) | The allowance for credit losses includes both the allowance for loan losses and the allowance for unfunded lending-related commitments, but excluding the allowance for covered loan losses. |
| |
| (7) | Total shareholders’ equity minus preferred stock and total intangible assets divided by total assets minus total intangible assets |
| |
| (8) | Asset quality ratios exclude covered loans. |
WINTRUST FINANCIAL CORPORATION - SUPPLEMENTAL FINANCIAL INFORMATION
Consolidated Statements of Condition - 5 Quarter Trends
|
| | | | | | | | | | | | | | | | | | | | |
| | | (Unaudited) | | (Unaudited) | | (Unaudited) | |
| | (Unaudited) |
| | | September 30, | | June 30, | | March 31, | | December 31, | | September 30, |
| (In thousands) | | 2014 | | 2014 | | 2014 | | 2013 | | 2013 |
| Assets | | | | | | | | | | |
| Cash and due from banks | | $ | 260,694 |
| | $ | 349,013 |
| | $ | 330,262 |
| | $ | 253,408 |
| | $ | 322,866 |
|
| Federal funds sold and securities purchased under resale agreements | | 26,722 |
| | 7,965 |
| | 12,476 |
| | 10,456 |
| | 7,771 |
|
| Interest bearing deposits with banks | | 620,370 |
| | 506,871 |
| | 540,964 |
| | 495,574 |
| | 681,834 |
|
| Available-for-sale securities, at fair value | | 1,782,648 |
| | 1,824,240 |
| | 1,949,697 |
| | 2,176,290 |
| | 1,781,883 |
|
| Trading account securities | | 6,015 |
| | 2,234 |
| | 1,068 |
| | 497 |
| | 259 |
|
| Federal Home Loan Bank and Federal Reserve Bank stock | | 80,951 |
| | 84,531 |
| | 78,524 |
| | 79,261 |
| | 76,755 |
|
| Brokerage customer receivables | | 26,624 |
| | 28,199 |
| | 26,884 |
| | 30,953 |
| | 29,253 |
|
| Mortgage loans held-for-sale | | 363,303 |
| | 363,627 |
| | 215,231 |
| | 334,327 |
| | 334,345 |
|
| Loans, net of unearned income, excluding covered loans | | 14,052,059 |
| | 13,749,996 |
| | 13,133,160 |
| | 12,896,602 |
| | 12,581,039 |
|
| Covered loans | | 254,605 |
| | 275,154 |
| | 312,478 |
| | 346,431 |
| | 415,988 |
|
| Total loans | | 14,306,664 |
| | 14,025,150 |
| | 13,445,638 |
| | 13,243,033 |
| | 12,997,027 |
|
| Less: Allowance for loan losses | | 91,019 |
| | 92,253 |
| | 92,275 |
| | 96,922 |
| | 107,188 |
|
| Less: Allowance for covered loan losses | | 2,655 |
| | 1,667 |
| | 3,447 |
| | 10,092 |
| | 12,924 |
|
| Net loans | | 14,212,990 |
| | 13,931,230 |
| | 13,349,916 |
| | 13,136,019 |
| | 12,876,915 |
|
| Premises and equipment, net | | 555,241 |
| | 535,281 |
| | 531,763 |
| | 531,947 |
| | 517,942 |
|
| FDIC indemnification asset | | 27,359 |
| | 46,115 |
| | 60,298 |
| | 85,672 |
| | 100,313 |
|
| Accrued interest receivable and other assets | | 494,213 |
| | 525,394 |
| | 549,705 |
| | 569,619 |
| | 576,121 |
|
| Trade date securities receivable | | 285,627 |
| | 292,366 |
| | 182,600 |
| | — |
| | — |
|
| Goodwill | | 406,604 |
| | 381,721 |
| | 373,725 |
| | 374,547 |
| | 357,309 |
|
| Other intangible assets | | 19,984 |
| | 16,894 |
| | 18,050 |
| | 19,213 |
| | 18,982 |
|
| Total assets | | $ | 19,169,345 |
| | $ | 18,895,681 |
| | $ | 18,221,163 |
| | $ | 18,097,783 |
| | $ | 17,682,548 |
|
| Liabilities and Shareholders’ Equity | | | | | | | | | | |
| Deposits: | | | | | | | | | | |
| Non-interest bearing | | $ | 3,253,477 |
| | $ | 3,072,430 |
| | $ | 2,773,922 |
| | $ | 2,721,771 |
| | $ | 2,622,518 |
|
| Interest bearing | | 12,811,769 |
| | 12,483,946 |
| | 12,355,123 |
| | 11,947,018 |
| | 12,024,928 |
|
| Total deposits | | 16,065,246 |
| | 15,556,376 |
| | 15,129,045 |
| | 14,668,789 |
| | 14,647,446 |
|
| Federal Home Loan Bank advances | | 347,500 |
| | 580,582 |
| | 387,672 |
| | 417,762 |
| | 387,852 |
|
| Other borrowings | | 51,483 |
| | 43,716 |
| | 231,086 |
| | 255,104 |
| | 248,416 |
|
| Subordinated notes | | 140,000 |
| | 140,000 |
| | — |
| | — |
| | 10,000 |
|
| Junior subordinated debentures | | 249,493 |
| | 249,493 |
| | 249,493 |
| | 249,493 |
| | 249,493 |
|
| Trade date securities payable | | — |
| | — |
| | — |
| | 303,088 |
| | — |
|
| Accrued interest payable and other liabilities | | 287,115 |
| | 327,279 |
| | 283,724 |
| | 302,958 |
| | 265,775 |
|
| Total liabilities | | 17,140,837 |
| | 16,897,446 |
| | 16,281,020 |
| | 16,197,194 |
| | 15,808,982 |
|
| Shareholders’ Equity: | | | | | | | | | | |
| Preferred stock | | 126,467 |
| | 126,467 |
| | 126,477 |
| | 126,477 |
| | 126,500 |
|
| Common stock | | 46,766 |
| | 46,627 |
| | 46,332 |
| | 46,181 |
| | 39,992 |
|
| Surplus | | 1,129,975 |
| | 1,125,551 |
| | 1,122,233 |
| | 1,117,032 |
| | 1,118,550 |
|
| Treasury stock | | (3,519 | ) | | (3,449 | ) | | (3,380 | ) | | (3,000 | ) | | (8,290 | ) |
| Retained earnings | | 771,519 |
| | 737,542 |
| | 705,234 |
| | 676,935 |
| | 643,228 |
|
| Accumulated other comprehensive loss | | (42,700 | ) | | (34,503 | ) | | (56,753 | ) | | (63,036 | ) | | (46,414 | ) |
| Total shareholders’ equity | | 2,028,508 |
| | 1,998,235 |
| | 1,940,143 |
| | 1,900,589 |
| | 1,873,566 |
|
| Total liabilities and shareholders’ equity | | $ | 19,169,345 |
| | $ | 18,895,681 |
| | $ | 18,221,163 |
| | $ | 18,097,783 |
| | $ | 17,682,548 |
|
WINTRUST FINANCIAL CORPORATION - SUPPLEMENTAL FINANCIAL INFORMATION
Consolidated Statements of Income (Unaudited) - 5 Quarter Trends
|
| | | | | | | | | | | | | | | | | | | | |
| | | Three Months Ended |
| | | September 30, | | June 30, | | March 31, | | December 31, | | September 30, |
| (In thousands, except per share data) | | 2014 | | 2014 | | 2014 | | 2013 | | 2013 |
| Interest income | | | | | | | | | | |
| Interest and fees on loans | | $ | 156,534 |
| | $ | 151,984 |
| | $ | 147,030 |
| | $ | 149,528 |
| | $ | 150,810 |
|
| Interest bearing deposits with banks | | 409 |
| | 319 |
| | 249 |
| | 435 |
| | 229 |
|
| Federal funds sold and securities purchased under resale agreements | | 12 |
| | 6 |
| | 4 |
| | 4 |
| | 4 |
|
| Available-for-sale securities | | 12,767 |
| | 13,309 |
| | 13,114 |
| | 9,690 |
| | 9,224 |
|
| Trading account securities | | 20 |
| | 5 |
| | 9 |
| | (2 | ) | | 14 |
|
| Federal Home Loan Bank and Federal Reserve Bank stock | | 733 |
| | 727 |
| | 711 |
| | 709 |
| | 687 |
|
| Brokerage customer receivables | | 201 |
| | 200 |
| | 209 |
| | 218 |
| | 200 |
|
| Total interest income | | 170,676 |
| | 166,550 |
| | 161,326 |
| | 160,582 |
| | 161,168 |
|
| Interest expense | | | | | | | | | | |
| Interest on deposits | | 12,298 |
| | 11,759 |
| | 11,923 |
| | 12,488 |
| | 12,524 |
|
| Interest on Federal Home Loan Bank advances | | 2,641 |
| | 2,705 |
| | 2,643 |
| | 2,700 |
| | 2,729 |
|
| Interest on other borrowings | | 200 |
| | 510 |
| | 750 |
| | 1,145 |
| | 910 |
|
| Interest on subordinated notes | | 1,776 |
| | 354 |
| | — |
| | 16 |
| | 40 |
|
| Interest on junior subordinated debentures | | 2,091 |
| | 2,042 |
| | 2,004 |
| | 1,925 |
| | 3,183 |
|
| Total interest expense | | 19,006 |
| | 17,370 |
| | 17,320 |
| | 18,274 |
| | 19,386 |
|
| Net interest income | | 151,670 |
| | 149,180 |
| | 144,006 |
| | 142,308 |
| | 141,782 |
|
| Provision for credit losses | | 5,864 |
| | 6,660 |
| | 1,880 |
| | 3,850 |
| | 11,114 |
|
| Net interest income after provision for credit losses | | 145,806 |
| | 142,520 |
| | 142,126 |
| | 138,458 |
| | 130,668 |
|
| Non-interest income | | | | | | | | | | |
| Wealth management | | 17,659 |
| | 18,222 |
| | 16,813 |
| | 16,265 |
| | 16,057 |
|
| Mortgage banking | | 26,691 |
| | 23,804 |
| | 16,428 |
| | 19,296 |
| | 25,682 |
|
| Service charges on deposit accounts | | 6,084 |
| | 5,688 |
| | 5,346 |
| | 5,230 |
| | 5,308 |
|
| (Losses) gains on available-for-sale securities, net | | (153 | ) | | (336 | ) | | (33 | ) | | (3,328 | ) | | 75 |
|
| Fees from covered call options | | 2,107 |
| | 1,244 |
| | 1,542 |
| | 1,856 |
| | 285 |
|
| Trading gains (losses), net | | 293 |
| | (743 | ) | | (652 | ) | | (278 | ) | | (1,655 | ) |
| Other | | 5,271 |
| | 6,223 |
| | 6,085 |
| | 7,320 |
| | 8,910 |
|
| Total non-interest income | | 57,952 |
| | 54,102 |
| | 45,529 |
| | 46,361 |
| | 54,662 |
|
| Non-interest expense | | | | | | | | | | |
| Salaries and employee benefits | | 85,976 |
| | 81,963 |
| | 79,934 |
| | 74,049 |
| | 78,007 |
|
| Equipment | | 7,570 |
| | 7,223 |
| | 7,403 |
| | 7,260 |
| | 6,593 |
|
| Occupancy, net | | 10,446 |
| | 9,850 |
| | 10,993 |
| | 9,994 |
| | 9,079 |
|
| Data processing | | 4,765 |
| | 4,543 |
| | 4,715 |
| | 4,831 |
| | 4,884 |
|
| Advertising and marketing | | 3,528 |
| | 3,558 |
| | 2,816 |
| | 3,517 |
| | 2,772 |
|
| Professional fees | | 4,035 |
| | 4,046 |
| | 3,454 |
| | 4,132 |
| | 3,378 |
|
| Amortization of other intangible assets | | 1,202 |
| | 1,156 |
| | 1,163 |
| | 1,189 |
| | 1,154 |
|
| FDIC insurance | | 3,211 |
| | 3,196 |
| | 2,951 |
| | 3,036 |
| | 3,245 |
|
| OREO expense, net | | 581 |
| | 2,490 |
| | 3,976 |
| | 2,671 |
| | 2,499 |
|
| Other | | 17,186 |
| | 15,566 |
| | 13,910 |
| | 16,318 |
| | 15,637 |
|
| Total non-interest expense | | 138,500 |
| | 133,591 |
| | 131,315 |
| | 126,997 |
| | 127,248 |
|
| Income before taxes | | 65,258 |
| | 63,031 |
| | 56,340 |
| | 57,822 |
| | 58,082 |
|
| Income tax expense | | 25,034 |
| | 24,490 |
| | 21,840 |
| | 22,534 |
| | 22,519 |
|
| Net income | | $ | 40,224 |
| | $ | 38,541 |
| | $ | 34,500 |
| | $ | 35,288 |
| | $ | 35,563 |
|
| Preferred stock dividends and discount accretion | | 1,581 |
| | 1,581 |
| | 1,581 |
| | 1,581 |
| | 1,581 |
|
| Net income applicable to common shares | | $ | 38,643 |
| | $ | 36,960 |
| | $ | 32,919 |
| | $ | 33,707 |
| | $ | 33,982 |
|
| Net income per common share - Basic | | $ | 0.83 |
| | $ | 0.79 |
| | $ | 0.71 |
| | $ | 0.82 |
| | $ | 0.86 |
|
| Net income per common share - Diluted | | $ | 0.79 |
| | $ | 0.76 |
| | $ | 0.68 |
| | $ | 0.70 |
| | $ | 0.71 |
|
| Cash dividends declared per common share | | $ | 0.10 |
| | $ | 0.10 |
| | $ | 0.10 |
| | $ | — |
| | $ | 0.09 |
|
| Weighted average common shares outstanding | | 46,639 |
| | 46,520 |
| | 46,195 |
| | 40,954 |
| | 39,331 |
|
| Dilutive potential common shares | | 4,241 |
| | 4,402 |
| | 4,509 |
| | 9,598 |
| | 10,823 |
|
| Average common shares and dilutive common shares | | 50,880 |
| | 50,922 |
| | 50,704 |
| | 50,552 |
| | 50,154 |
|
| | | | | | | | | | | |
| | | | | | | | | | | |
WINTRUST FINANCIAL CORPORATION - SUPPLEMENTAL FINANCIAL INFORMATION
Period End Loan Balances - 5 Quarter Trends
|
| | | | | | | | | | | | | | | | | | | | |
| | | September 30, | | June 30, | | March 31, | | December 31, | | September 30, |
| (Dollars in thousands) | | 2014 | | 2014 | | 2014 | | 2013 | | 2013 |
| Balance: | | | | | | | | | | |
| Commercial | | $ | 3,689,671 |
| | $ | 3,640,430 |
| | $ | 3,439,197 |
| | $ | 3,253,687 |
| | $ | 3,109,121 |
|
| Commercial real estate | | 4,510,375 |
| | 4,353,472 |
| | 4,262,255 |
| | 4,230,035 |
| | 4,146,110 |
|
| Home equity | | 720,058 |
| | 713,642 |
| | 707,748 |
| | 719,137 |
| | 736,620 |
|
| Residential real-estate | | 470,319 |
| | 451,905 |
| | 426,769 |
| | 434,992 |
| | 397,707 |
|
| Premium finance receivables - commercial | | 2,377,892 |
| | 2,378,529 |
| | 2,208,361 |
| | 2,167,565 |
| | 2,150,481 |
|
| Premium finance receivables - life insurance | | 2,134,405 |
| | 2,051,645 |
| | 1,929,334 |
| | 1,923,698 |
| | 1,869,739 |
|
Consumer and other (1) | | 149,339 |
| | 160,373 |
| | 159,496 |
| | 167,488 |
| | 171,261 |
|
| Total loans, net of unearned income, excluding covered loans | | $ | 14,052,059 |
| | $ | 13,749,996 |
| | $ | 13,133,160 |
| | $ | 12,896,602 |
| | $ | 12,581,039 |
|
| Covered loans | | 254,605 |
| | 275,154 |
| | 312,478 |
| | 346,431 |
| | 415,988 |
|
| Total loans, net of unearned income | | $ | 14,306,664 |
| | $ | 14,025,150 |
| | $ | 13,445,638 |
| | $ | 13,243,033 |
| | $ | 12,997,027 |
|
| Mix: | | | | | | | | | | |
| Commercial | | 26 | % | | 26 | % | | 26 | % | | 25 | % | | 24 | % |
| Commercial real estate | | 31 |
| | 31 |
| | 32 |
| | 32 |
| | 32 |
|
| Home equity | | 5 |
| | 5 |
| | 5 |
| | 5 |
| | 6 |
|
| Residential real-estate | | 3 |
| | 3 |
| | 3 |
| | 3 |
| | 3 |
|
| Premium finance receivables - commercial | | 17 |
| | 17 |
| | 17 |
| | 16 |
| | 16 |
|
| Premium finance receivables - life insurance | | 15 |
| | 15 |
| | 14 |
| | 15 |
| | 14 |
|
Consumer and other (1) | | 1 |
| | 1 |
| | 1 |
| | 1 |
| | 2 |
|
| Total loans, net of unearned income, excluding covered loans | | 98 | % | | 98 | % | | 98 | % | | 97 | % | | 97 | % |
| Covered loans | | 2 |
| | 2 |
| | 2 |
| | 3 |
| | 3 |
|
| Total loans, net of unearned income | | 100 | % | | 100 | % | | 100 | % | | 100 | % | | 100 | % |
| |
| (1) | Includes autos, boats, snowmobiles and other indirect consumer loans. |
WINTRUST FINANCIAL CORPORATION - SUPPLEMENTAL FINANCIAL INFORMATION
Period End Deposits Balances - 5 Quarter Trends
|
| | | | | | | | | | | | | | | | | | | | |
| | | September 30, | | June 30, | | March 31, | | December 31, | | September 30, |
| (Dollars in thousands) | | 2014 | | 2014 | | 2014 | | 2013 | | 2013 |
| Balance: | | | | | | | | | | |
| Non-interest bearing | | $ | 3,253,477 |
| | $ | 3,072,430 |
| | $ | 2,773,922 |
| | $ | 2,721,771 |
| | $ | 2,622,518 |
|
| NOW and interest bearing demand deposits | | 2,086,099 |
| | 2,002,868 |
| | 1,983,251 |
| | 1,953,882 |
| | 1,922,906 |
|
Wealth Management deposits (1) | | 1,212,317 |
| | 1,220,102 |
| | 1,289,134 |
| | 1,013,850 |
| | 1,099,509 |
|
| Money Market | | 3,744,682 |
| | 3,591,540 |
| | 3,454,271 |
| | 3,359,999 |
| | 3,423,413 |
|
| Savings | | 1,465,250 |
| | 1,427,222 |
| | 1,443,943 |
| | 1,392,575 |
| | 1,318,147 |
|
| Time certificates of deposit | | 4,303,421 |
| | 4,242,214 |
| | 4,184,524 |
| | 4,226,712 |
| | 4,260,953 |
|
| Total deposits | | $ | 16,065,246 |
| | $ | 15,556,376 |
| | $ | 15,129,045 |
| | $ | 14,668,789 |
| | $ | 14,647,446 |
|
| Mix: | | | | | | | | | | |
| Non-interest bearing | | 20 | % | | 20 | % | | 18 | % | | 19 | % | | 18 | % |
| NOW and interest bearing demand deposits | | 13 |
| | 13 |
| | 13 |
| | 13 |
| | 13 |
|
Wealth Management deposits (1) | | 8 |
| | 8 |
| | 8 |
| | 7 |
| | 8 |
|
| Money Market | | 23 |
| | 23 |
| | 23 |
| | 23 |
| | 23 |
|
| Savings | | 9 |
| | 9 |
| | 10 |
| | 9 |
| | 9 |
|
| Time certificates of deposit | | 27 |
| | 27 |
| | 28 |
| | 29 |
| | 29 |
|
| Total deposits | | 100 | % | | 100 | % | | 100 | % | | 100 | % | | 100 | % |
| |
| (1) | Represents deposit balances of the Company’s subsidiary banks from brokerage customers of Wayne Hummer Investments, trust and asset management customers of The Chicago Trust Company and brokerage customers from unaffiliated companies which have been placed into deposit accounts of the Banks. |
WINTRUST FINANCIAL CORPORATION - SUPPLEMENTAL FINANCIAL INFORMATION
Net Interest Margin (Including Call Option Income) - 5 Quarter Trends
|
| | | | | | | | | | | | | | | | | | | | |
| | | Three Months Ended |
| | | September 30, | | June 30, | | March 31, | | December 31, | | September 30, |
| (Dollars in thousands) | | 2014 | | 2014 | | 2014 | | 2013 | | 2013 |
| Net interest income | | $ | 152,498 |
| | $ | 149,952 |
| | $ | 144,696 |
| | $ | 142,880 |
| | $ | 142,391 |
|
| Call option income | | 2,107 |
| | 1,244 |
| | 1,542 |
| | 1,856 |
| | 285 |
|
| Net interest income including call option income | | $ | 154,605 |
| | $ | 151,196 |
| | $ | 146,238 |
| | $ | 144,736 |
| | $ | 142,676 |
|
| Yield on earning assets | | 3.90 | % | | 4.03 | % | | 4.04 | % | | 3.98 | % | | 4.05 | % |
| Rate on interest-bearing liabilities | | 0.56 |
| | 0.53 |
| | 0.54 |
| | 0.56 |
| | 0.60 |
|
| Rate spread | | 3.34 | % | | 3.50 | % | | 3.50 | % | | 3.42 | % | | 3.45 | % |
| Net free funds contribution | | 0.12 |
| | 0.12 |
| | 0.11 |
| | 0.11 |
| | 0.12 |
|
| Net interest margin | | 3.46 |
| | 3.62 |
| | 3.61 |
| | 3.53 |
| | 3.57 |
|
| Call option income | | 0.05 |
| | 0.03 |
| | 0.04 |
| | 0.05 |
| | 0.01 |
|
| Net interest margin including call option income | | 3.51 | % | | 3.65 | % | | 3.65 | % | | 3.58 | % | | 3.58 | % |
WINTRUST FINANCIAL CORPORATION - SUPPLEMENTAL FINANCIAL INFORMATION
Net Interest Margin (Including Call Option Income - YTD Trends)
|
| | | | | | | | | | | | | | | | | | | | |
| | | Nine Months Ended, September 30, | | Years Ended December 31, |
| (Dollars in thousands) | | 2014 | | 2013 | | 2012 | | 2011 | | 2010 |
| Net interest income | | $ | 447,145 |
| | $ | 552,887 |
| | $ | 521,463 |
| | $ | 463,071 |
| | $ | 417,564 |
|
| Call option income | | 4,893 |
| | 4,773 |
| | 10,476 |
| | 13,570 |
| | 2,235 |
|
| Net interest income including call option income | | $ | 452,038 |
| | $ | 557,660 |
| | $ | 531,939 |
| | $ | 476,641 |
| | $ | 419,799 |
|
| Yield on earning assets | | 3.99 | % | | 4.01 | % | | 4.21 | % | | 4.49 | % | | 4.80 | % |
| Rate on interest-bearing liabilities | | 0.54 |
| | 0.62 |
| | 0.86 |
| | 1.23 |
| | 1.61 |
|
| Rate spread | | 3.45 | % | | 3.39 | % | | 3.35 | % | | 3.26 | % | | 3.19 | % |
| Net free funds contribution | | 0.11 |
| | 0.11 |
| | 0.14 |
| | 0.16 |
| | 0.18 |
|
| Net interest margin | | 3.56 |
| | 3.50 |
| | 3.49 |
| | 3.42 |
| | 3.37 |
|
| Call option income | | 0.04 |
| | 0.03 |
| | 0.07 |
| | 0.10 |
| | 0.02 |
|
| Net interest margin including call option income | | 3.60 | % | | 3.53 | % | | 3.56 | % | | 3.52 | % | | 3.39 | % |
WINTRUST FINANCIAL CORPORATION - SUPPLEMENTAL FINANCIAL INFORMATION
Quarterly Average Balances - 5 Quarter Trends
|
| | | | | | | | | | | | | | | | | | | | |
| | | Three Months Ended |
| | | September 30, | | June 30, | | March 31, | | December 31, | | September 30, |
| (In thousands) | | 2014 | | 2014 | | 2014 | | 2013 | | 2013 |
| Liquidity management assets | | $ | 2,814,720 |
| | $ | 2,607,980 |
| | $ | 2,646,720 |
| | $ | 2,613,876 |
| | $ | 2,262,839 |
|
| Other earning assets | | 28,702 |
| | 27,463 |
| | 28,925 |
| | 28,746 |
| | 27,426 |
|
| Loans, net of unearned income | | 14,359,467 |
| | 13,710,535 |
| | 13,278,122 |
| | 13,043,666 |
| | 13,113,138 |
|
| Covered loans | | 262,310 |
| | 292,553 |
| | 325,885 |
| | 388,148 |
| | 435,961 |
|
| Total earning assets | | $ | 17,465,199 |
| | $ | 16,638,531 |
| | $ | 16,279,652 |
| | $ | 16,074,436 |
| | $ | 15,839,364 |
|
| Allowance for loan and covered loan losses | | (96,463 | ) | | (98,255 | ) | | (110,304 | ) | | (122,060 | ) | | (126,164 | ) |
| Cash and due from banks | | 237,402 |
| | 232,716 |
| | 223,324 |
| | 237,138 |
| | 209,539 |
|
| Other assets | | 1,521,208 |
| | 1,529,950 |
| | 1,588,271 |
| | 1,646,485 |
| | 1,566,832 |
|
| Total assets | | $ | 19,127,346 |
| | $ | 18,302,942 |
| | $ | 17,980,943 |
| | $ | 17,835,999 |
| | $ | 17,489,571 |
|
| Interest-bearing deposits | | $ | 12,695,780 |
| | $ | 12,284,444 |
| | $ | 12,121,185 |
| | $ | 11,945,314 |
| | $ | 11,817,636 |
|
| Federal Home Loan Bank advances | | 380,083 |
| | 446,778 |
| | 388,975 |
| | 389,583 |
| | 454,563 |
|
| Other borrowings | | 54,653 |
| | 148,135 |
| | 244,950 |
| | 251,168 |
| | 256,318 |
|
| Subordinated notes | | 140,000 |
| | 27,692 |
| | — |
| | 4,022 |
| | 10,000 |
|
| Junior subordinated notes | | 249,493 |
| | 249,493 |
| | 249,493 |
| | 249,493 |
| | 249,493 |
|
| Total interest-bearing liabilities | | $ | 13,520,009 |
| | $ | 13,156,542 |
| | $ | 13,004,603 |
| | $ | 12,839,580 |
| | $ | 12,788,010 |
|
| Non-interest bearing deposits | | 3,233,937 |
| | 2,880,501 |
| | 2,726,872 |
| | 2,723,360 |
| | 2,552,182 |
|
| Other liabilities | | 352,497 |
| | 294,243 |
| | 325,819 |
| | 377,561 |
| | 296,257 |
|
| Equity | | 2,020,903 |
| | 1,971,656 |
| | 1,923,649 |
| | 1,895,498 |
| | 1,853,122 |
|
| Total liabilities and shareholders’ equity | | $ | 19,127,346 |
| | $ | 18,302,942 |
| | $ | 17,980,943 |
| | $ | 17,835,999 |
| | $ | 17,489,571 |
|
WINTRUST FINANCIAL CORPORATION - SUPPLEMENTAL FINANCIAL INFORMATION
Net Interest Margin - 5 Quarter Trends
|
| | | | | | | | | | | | | | | |
| | | Three Months Ended |
| | | September 30, 2014 | | June 30, 2014 | | March 31, 2014 | | December 31, 2013 | | September 30, 2013 |
| Yield earned on: | | | | | | | | | | |
| Liquidity management assets | | 2.03 | % | | 2.28 | % | | 2.23 | % | | 1.70 | % | | 1.84 | % |
| Other earning assets | | 3.21 |
| | 3.02 |
| | 3.12 |
| | 2.95 |
| | 3.19 |
|
| Loans, net of unearned income | | 4.19 |
| | 4.25 |
| | 4.29 |
| | 4.32 |
| | 4.30 |
|
| Covered loans | | 8.03 |
| | 9.73 |
| | 8.64 |
| | 7.85 |
| | 8.16 |
|
| Total earning assets | | 3.90 | % | | 4.03 | % | | 4.04 | % | | 3.98 | % | | 4.05 | % |
| Rate paid on: | |
| | | | | | | | |
| Interest-bearing deposits | | 0.38 | % | | 0.38 | % | | 0.40 | % | | 0.41 | % | | 0.42 | % |
| Federal Home Loan Bank advances | | 2.76 |
| | 2.43 |
| | 2.76 |
| | 2.75 |
| | 2.38 |
|
| Other borrowings | | 1.45 |
| | 1.38 |
| | 1.24 |
| | 1.81 |
| | 1.41 |
|
| Subordinated notes | | 5.07 |
| | 5.06 |
| | — |
| | 1.56 |
| | 1.57 |
|
| Junior subordinated notes | | 3.28 |
| | 3.24 |
| | 3.21 |
| | 3.02 |
| | 4.99 |
|
| Total interest-bearing liabilities | | 0.56 | % | | 0.53 | % | | 0.54 | % | | 0.56 | % | | 0.60 | % |
| Interest rate spread | | 3.34 | % | | 3.50 | % | | 3.50 | % | | 3.42 | % | | 3.45 | % |
| Net free funds/contribution | | 0.12 |
| | 0.12 |
| | 0.11 |
| | 0.11 |
| | 0.12 |
|
| Net interest income/Net interest margin | | 3.46 | % | | 3.62 | % | | 3.61 | % | | 3.53 | % | | 3.57 | % |
WINTRUST FINANCIAL CORPORATION - SUPPLEMENTAL FINANCIAL INFORMATION
Non-Interest Income - 5 Quarter Trends
|
| | | | | | | | | | | | | | | | | | | | |
| | | Three Months Ended |
| | | September 30, | | June 30, | | March 31, | | December 31, | | September 30, |
| (In thousands) | | 2014 | | 2014 | | 2014 | | 2013 | | 2013 |
| Brokerage | | $ | 7,185 |
| | $ | 8,270 |
| | $ | 7,091 |
| | $ | 7,200 |
| | $ | 7,388 |
|
| Trust and asset management | | 10,474 |
| | 9,952 |
| | 9,722 |
| | 9,065 |
| | 8,669 |
|
| Total wealth management | | 17,659 |
| | 18,222 |
| | 16,813 |
| | 16,265 |
| | 16,057 |
|
| Mortgage banking | | 26,691 |
| | 23,804 |
| | 16,428 |
| | 19,296 |
| | 25,682 |
|
| Service charges on deposit accounts | | 6,084 |
| | 5,688 |
| | 5,346 |
| | 5,230 |
| | 5,308 |
|
| (Losses) gains on available-for-sale securities, net | | (153 | ) | | (336 | ) | | (33 | ) | | (3,328 | ) | | 75 |
|
| Fees from covered call options | | 2,107 |
| | 1,244 |
| | 1,542 |
| | 1,856 |
| | 285 |
|
| Trading gains (losses), net | | 293 |
| | (743 | ) | | (652 | ) | | (278 | ) | | (1,655 | ) |
| Other: | |
| | | | | | | | |
| Interest rate swap fees | | 1,207 |
| | 1,192 |
| | 951 |
| | 1,537 |
| | 2,183 |
|
| Bank Owned Life Insurance | | 652 |
| | 675 |
| | 712 |
| | 1,074 |
| | 625 |
|
| Administrative services | | 990 |
| | 938 |
| | 859 |
| | 878 |
| | 943 |
|
| Miscellaneous | | 2,422 |
| | 3,418 |
| | 3,563 |
| | 3,831 |
| | 5,159 |
|
| Total other income | | 5,271 |
| | 6,223 |
| | 6,085 |
| | 7,320 |
| | 8,910 |
|
| Total Non-Interest Income | | $ | 57,952 |
| | $ | 54,102 |
| | $ | 45,529 |
| | $ | 46,361 |
| | $ | 54,662 |
|
WINTRUST FINANCIAL CORPORATION - SUPPLEMENTAL FINANCIAL INFORMATION
Non-Interest Expense - 5 Quarter Trends
|
| | | | | | | | | | | | | | | | | | | | |
| | | Three Months Ended |
| | | September 30, | | June 30, | | March 31, | | December 31, | | September 30, |
| (In thousands) | | 2014 | | 2014 | | 2014 | | 2013 | | 2013 |
| Salaries and employee benefits: | | | | | | | | | | |
| Salaries | | $ | 45,471 |
| | $ | 43,349 |
| | $ | 43,736 |
| | $ | 43,832 |
| | $ | 42,789 |
|
| Commissions and incentive compensation | | 27,885 |
| | 25,398 |
| | 21,534 |
| | 18,009 |
| | 23,409 |
|
| Benefits | | 12,620 |
| | 13,216 |
| | 14,664 |
| | 12,208 |
| | 11,809 |
|
| Total salaries and employee benefits | | 85,976 |
| | 81,963 |
| | 79,934 |
| | 74,049 |
| | 78,007 |
|
| Equipment | | 7,570 |
| | 7,223 |
| | 7,403 |
| | 7,260 |
| | 6,593 |
|
| Occupancy, net | | 10,446 |
| | 9,850 |
| | 10,993 |
| | 9,994 |
| | 9,079 |
|
| Data processing | | 4,765 |
| | 4,543 |
| | 4,715 |
| | 4,831 |
| | 4,884 |
|
| Advertising and marketing | | 3,528 |
| | 3,558 |
| | 2,816 |
| | 3,517 |
| | 2,772 |
|
| Professional fees | | 4,035 |
| | 4,046 |
| | 3,454 |
| | 4,132 |
| | 3,378 |
|
| Amortization of other intangible assets | | 1,202 |
| | 1,156 |
| | 1,163 |
| | 1,189 |
| | 1,154 |
|
| FDIC insurance | | 3,211 |
| | 3,196 |
| | 2,951 |
| | 3,036 |
| | 3,245 |
|
| OREO expense, net | | 581 |
| | 2,490 |
| | 3,976 |
| | 2,671 |
| | 2,499 |
|
| Other: | | | | | | | | | | |
| Commissions - 3rd party brokers | | 1,621 |
| | 1,633 |
| | 1,657 |
| | 1,439 |
| | 1,277 |
|
| Postage | | 1,427 |
| | 1,465 |
| | 1,429 |
| | 1,622 |
| | 1,255 |
|
| Stationery and supplies | | 899 |
| | 894 |
| | 892 |
| | 1,157 |
| | 1,009 |
|
| Miscellaneous | | 13,239 |
| | 11,574 |
| | 9,932 |
| | 12,100 |
| | 12,096 |
|
| Total other expense | | 17,186 |
| | 15,566 |
| | 13,910 |
| | 16,318 |
| | 15,637 |
|
| Total Non-Interest Expense | | $ | 138,500 |
| | $ | 133,591 |
| | $ | 131,315 |
| | $ | 126,997 |
| | $ | 127,248 |
|
WINTRUST FINANCIAL CORPORATION - SUPPLEMENTAL FINANCIAL INFORMATION
Allowance for Credit Losses, excluding covered loans - 5 Quarter Trends
|
| | | | | | | | | | | | | | | | | | | | |
| | | Three Months Ended |
| | | September 30, | | June 30, | | March 31, | | December 31, | | September 30, |
| (Dollars in thousands) | | 2014 | | 2014 | | 2014 | | 2013 | | 2013 |
| Allowance for loan losses at beginning of period | | $ | 92,253 |
| | $ | 92,275 |
| | $ | 96,922 |
| | $ | 107,188 |
| | $ | 106,842 |
|
| Provision for credit losses | | 6,028 |
| | 6,813 |
| | 3,304 |
| | 3,904 |
| | 11,580 |
|
| Other adjustments | | (335 | ) | | (105 | ) | | (148 | ) | | (195 | ) | | (205 | ) |
| Reclassification (to) from allowance for unfunded lending-related commitments | | 62 |
| | (146 | ) | | (18 | ) | | 504 |
| | 284 |
|
| Charge-offs: | | | | | | | | | | |
| Commercial | | 832 |
| | 2,384 |
| | 648 |
| | 5,209 |
| | 3,281 |
|
| Commercial real estate | | 4,510 |
| | 2,351 |
| | 4,493 |
| | 7,517 |
| | 6,982 |
|
| Home equity | | 748 |
| | 730 |
| | 2,267 |
| | 1,468 |
| | 711 |
|
| Residential real estate | | 205 |
| | 689 |
| | 226 |
| | 385 |
| | 328 |
|
| Premium finance receivables - commercial | | 1,557 |
| | 1,492 |
| | 1,210 |
| | 1,395 |
| | 1,294 |
|
| Premium finance receivables - life insurance | | — |
| | — |
| | — |
| | 14 |
| | 3 |
|
| Consumer and other | | 250 |
| | 213 |
| | 173 |
| | 637 |
| | 216 |
|
| Total charge-offs | | 8,102 |
| | 7,859 |
| | 9,017 |
| | 16,625 |
| | 12,815 |
|
| Recoveries: | | | | | | | | | | |
| Commercial | | 296 |
| | 270 |
| | 317 |
| | 336 |
| | 756 |
|
| Commercial real estate | | 275 |
| | 342 |
| | 145 |
| | 1,302 |
| | 272 |
|
| Home equity | | 99 |
| | 122 |
| | 257 |
| | 56 |
| | 43 |
|
| Residential real estate | | 111 |
| | 74 |
| | 131 |
| | 202 |
| | 64 |
|
| Premium finance receivables - commercial | | 289 |
| | 312 |
| | 319 |
| | 230 |
| | 314 |
|
| Premium finance receivables - life insurance | | 1 |
| | 2 |
| | 2 |
| | 2 |
| | 2 |
|
| Consumer and other | | 42 |
| | 153 |
| | 61 |
| | 18 |
| | 51 |
|
| Total recoveries | | 1,113 |
| | 1,275 |
| | 1,232 |
| | 2,146 |
| | 1,502 |
|
| Net charge-offs | | (6,989 | ) | | (6,584 | ) | | (7,785 | ) | | (14,479 | ) | | (11,313 | ) |
| Allowance for loan losses at period end | | $ | 91,019 |
| | $ | 92,253 |
| | $ | 92,275 |
| | $ | 96,922 |
| | $ | 107,188 |
|
| Allowance for unfunded lending-related commitments at period end | | 822 |
| | 884 |
| | 737 |
| | 719 |
| | 1,267 |
|
| Allowance for credit losses at period end | | $ | 91,841 |
| | $ | 93,137 |
| | $ | 93,012 |
| | $ | 97,641 |
| | $ | 108,455 |
|
| Annualized net charge-offs by category as a percentage of its own respective category’s average: | | | | | | | | | | |
| Commercial | | 0.06 | % | | 0.24 | % | | 0.04 | % | | 0.61 | % | | 0.32 | % |
| Commercial real estate | | 0.38 |
| | 0.19 |
| | 0.41 |
| | 0.59 |
| | 0.65 |
|
| Home equity | | 0.36 |
| | 0.34 |
| | 1.14 |
| | 0.77 |
| | 0.36 |
|
| Residential real estate | | 0.05 |
| | 0.35 |
| | 0.06 |
| | 0.10 |
| | 0.12 |
|
| Premium finance receivables - commercial | | 0.20 |
| | 0.20 |
| | 0.16 |
| | 0.21 |
| | 0.17 |
|
| Premium finance receivables - life insurance | | — |
| | — |
| | — |
| | — |
| | — |
|
| Consumer and other | | 0.49 |
| | 0.14 |
| | 0.26 |
| | 1.33 |
| | 0.35 |
|
| Total loans, net of unearned income, excluding covered loans | | 0.19 | % | | 0.19 | % | | 0.24 | % | | 0.44 | % | | 0.34 | % |
| Net charge-offs as a percentage of the provision for credit losses | | 115.95 | % | | 96.62 | % | | 235.65 | % | | 370.90 | % | | 97.69 | % |
| Loans at period-end | | $ | 14,052,059 |
| | $ | 13,749,996 |
| | $ | 13,133,160 |
| | $ | 12,896,602 |
| | $ | 12,581,039 |
|
| Allowance for loan losses as a percentage of loans at period end | | 0.65 | % | | 0.67 | % | | 0.70 | % | | 0.75 | % | | 0.85 | % |
| Allowance for credit losses as a percentage of loans at period end | | 0.65 | % | | 0.68 | % | | 0.71 | % | | 0.76 | % | | 0.86 | % |
WINTRUST FINANCIAL CORPORATION - SUPPLEMENTAL FINANCIAL INFORMATION
Non-Performing Assets, excluding covered assets - 5 Quarter Trends
|
| | | | | | | | | | | | | | | | | | | | |
| | | September 30, | | June 30, | | March 31, | | December 31, | | September 30, |
| (Dollars in thousands) | | 2014 | | 2014 | | 2014 | | 2013 | | 2013 |
Loans past due greater than 90 days and still accruing(1): | | | | | | | | | | |
| Commercial | | $ | — |
| | $ | — |
| | $ | 387 |
| | $ | — |
| | $ | 190 |
|
| Commercial real-estate | | — |
| | 309 |
| | — |
| | 230 |
| | 3,389 |
|
| Home equity | | — |
| | — |
| | — |
| | — |
| | — |
|
| Residential real-estate | | — |
| | — |
| | — |
| | — |
| | — |
|
| Premium finance receivables - commercial | | 7,115 |
| | 10,275 |
| | 6,808 |
| | 8,842 |
| | 11,751 |
|
| Premium finance receivables - life insurance | | — |
| | 649 |
| | — |
| | — |
| | 592 |
|
| Consumer and other | | 175 |
| | 73 |
| | 57 |
| | 105 |
| | 100 |
|
| Total loans past due greater than 90 days and still accruing | | 7,290 |
| | 11,306 |
| | 7,252 |
| | 9,177 |
| | 16,022 |
|
Non-accrual loans(2): | | | | | | | | | | |
| Commercial | | 10,455 |
| | 6,511 |
| | 11,782 |
| | 10,780 |
| | 17,647 |
|
| Commercial real-estate | | 27,363 |
| | 36,321 |
| | 33,733 |
| | 46,658 |
| | 52,723 |
|
| Home equity | | 5,696 |
| | 5,804 |
| | 7,311 |
| | 10,071 |
| | 10,926 |
|
| Residential real-estate | | 15,730 |
| | 15,294 |
| | 14,385 |
| | 14,974 |
| | 14,126 |
|
| Premium finance receivables - commercial | | 14,110 |
| | 12,298 |
| | 14,517 |
| | 10,537 |
| | 10,132 |
|
| Premium finance receivables - life insurance | | — |
| | — |
| | — |
| | — |
| | 14 |
|
| Consumer and other | | 426 |
| | 1,116 |
| | 1,144 |
| | 1,137 |
| | 1,671 |
|
| Total non-accrual loans | | 73,780 |
| | 77,344 |
| | 82,872 |
| | 94,157 |
| | 107,239 |
|
| Total non-performing loans: | | | | | | | | | | |
| Commercial | | 10,455 |
| | 6,511 |
| | 12,169 |
| | 10,780 |
| | 17,837 |
|
| Commercial real-estate | | 27,363 |
| | 36,630 |
| | 33,733 |
| | 46,888 |
| | 56,112 |
|
| Home equity | | 5,696 |
| | 5,804 |
| | 7,311 |
| | 10,071 |
| | 10,926 |
|
| Residential real-estate | | 15,730 |
| | 15,294 |
| | 14,385 |
| | 14,974 |
| | 14,126 |
|
| Premium finance receivables - commercial | | 21,225 |
| | 22,573 |
| | 21,325 |
| | 19,379 |
| | 21,883 |
|
| Premium finance receivables - life insurance | | — |
| | 649 |
| | — |
| | — |
| | 606 |
|
| Consumer and other | | 601 |
| | 1,189 |
| | 1,201 |
| | 1,242 |
| | 1,771 |
|
| Total non-performing loans | | $ | 81,070 |
| | $ | 88,650 |
| | $ | 90,124 |
| | $ | 103,334 |
| | $ | 123,261 |
|
| Other real estate owned | | 41,506 |
| | 51,673 |
| | 47,656 |
| | 43,398 |
| | 45,947 |
|
| Other real estate owned - from acquisitions | | 8,871 |
| | 7,915 |
| | 6,475 |
| | 7,056 |
| | 9,303 |
|
| Other repossessed assets | | 292 |
| | 311 |
| | 426 |
| | 542 |
| | 446 |
|
| Total non-performing assets | | $ | 131,739 |
| | $ | 148,549 |
| | $ | 144,681 |
| | $ | 154,330 |
| | $ | 178,957 |
|
| TDRs performing under the contractual terms of the loan agreement | | 69,868 |
| | 72,199 |
| | 74,622 |
| | 78,610 |
| | 79,205 |
|
| Total non-performing loans by category as a percent of its own respective category’s period-end balance: | | | | | | | | | | |
| Commercial | | 0.28 | % | | 0.18 | % | | 0.35 | % | | 0.33 | % | | 0.57 | % |
| Commercial real-estate | | 0.61 |
| | 0.84 |
| | 0.79 |
| | 1.11 |
| | 1.35 |
|
| Home equity | | 0.79 |
| | 0.81 |
| | 1.03 |
| | 1.40 |
| | 1.48 |
|
| Residential real-estate | | 3.34 |
| | 3.38 |
| | 3.37 |
| | 3.44 |
| | 3.55 |
|
| Premium finance receivables - commercial | | 0.89 |
| | 0.95 |
| | 0.97 |
| | 0.89 |
| | 1.02 |
|
| Premium finance receivables - life insurance | | — |
| | 0.03 |
| | — |
| | — |
| | 0.03 |
|
| Consumer and other | | 0.40 |
| | 0.74 |
| | 0.75 |
| | 0.74 |
| | 1.03 |
|
| Total loans, net of unearned income | | 0.58 | % | | 0.64 | % | | 0.69 | % | | 0.80 | % | | 0.98 | % |
| Total non-performing assets as a percentage of total assets | | 0.69 | % | | 0.79 | % | | 0.79 | % | | 0.85 | % | | 1.01 | % |
| Allowance for loan losses as a percentage of total non-performing loans | | 112.27 | % | | 104.06 | % | | 102.39 | % | | 93.80 | % | | 86.96 | % |
(1) As of the dates shown, no TDRs were past due greater than 90 days and still accruing interest.
(2) Non-accrual loans included TDRs totaling $13.5 million, $15.9 million, $17.9 million, $28.5 million and $35.8 million as of September 30, 2014, June 30, 2014, March 31, 2014, December 31, 2013 and September 30, 2013, respectively.