Exhibit 99.2
Exhibit 99.2
Sandler O’Neill + Partners, L.P. 2011 East Coast Financial Services Conference
November 10, 2011
1
FORWARD-LOOKING INFORMATION
During the course of our remarks today, we will make certain predictive statements regarding our plans and strategies and anticipated financial effects to assist you better in understanding our company.
These forward looking statements about future results are subject to risks and uncertainties.
Refer to our periodic reports on file with the SEC and the slides at the end of this presentation regarding forward-looking statements for further detail in this regard.
2

Today’s Presentation
Who we are
Where we have been-how we got here
Where we are going
Summary financial results Questions
3

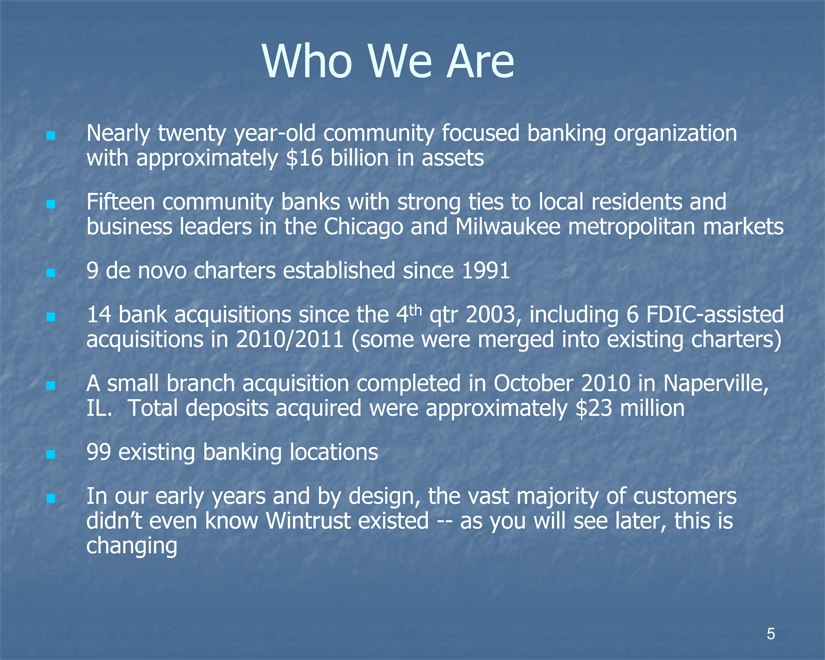
Who We Are
Nearly twenty year-old community focused banking organization with approximately $16 billion in assets Fifteen community banks with strong ties to local residents and business leaders in the Chicago and Milwaukee metropolitan markets 9 de novo charters established since 1991
14 bank acquisitions since the 4th qtr 2003, including 6 FDIC-assisted acquisitions in 2010/2011 (some were merged into existing charters) A small branch acquisition completed in October 2010 in Naperville, IL. Total deposits acquired were approximately $23 million
99 existing banking locations
In our early years and by design, the vast majority of customers didn’t even know Wintrust existed -- as you will see later, this is changing
5
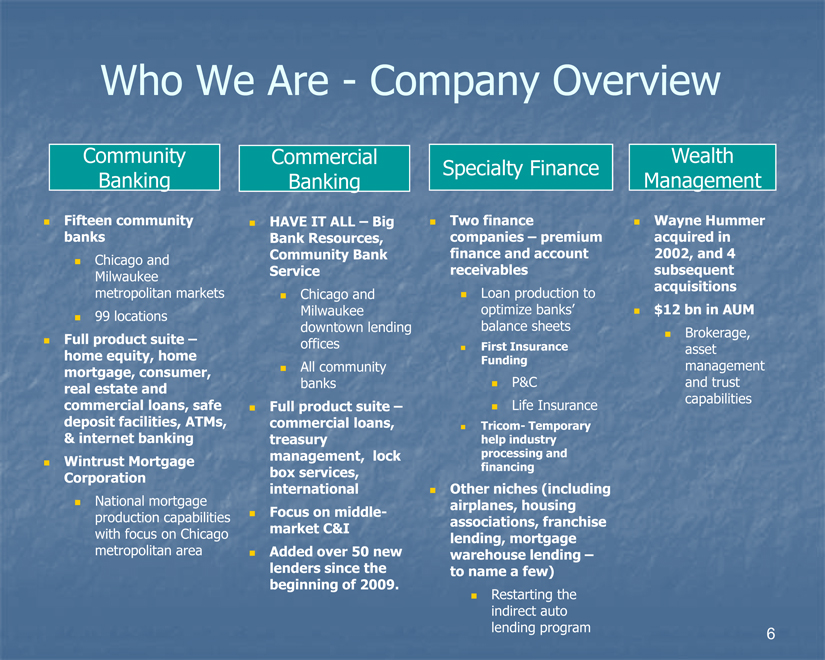
Who We Are - Company Overview
Community Banking
Fifteen community banks
Chicago and Milwaukee metropolitan markets
99 locations
Full product suite –home equity, home mortgage, consumer, real estate and commercial loans, safe deposit facilities, ATMs, & internet banking Wintrust Mortgage Corporation
National mortgage production capabilities with focus on Chicago metropolitan area
Commercial Banking
HAVE IT ALL – Big Bank Resources, Community Bank Service
Chicago and Milwaukee downtown lending offices
All community banks
Full product suite –commercial loans, treasury management, lock box services, international Focus on middle-market C&I Added over 50 new lenders since the beginning of 2009.
Specialty Finance
Two finance companies – premium finance and account receivables
Loan production to optimize banks’ balance sheets
First Insurance Funding
P&C
Life Insurance
Tricom- Temporary help industry processing and financing Other niches (includin airplanes, housing associations, franchise lending, mortgage warehouse lending –to name a few)
Restarting the indirect auto lending program
Wealth Management
Wayne Hummer acquired in 2002, and 4 subsequent acquisitions $12 bn in AUM
Brokerage, asset management and trust capabilities
6
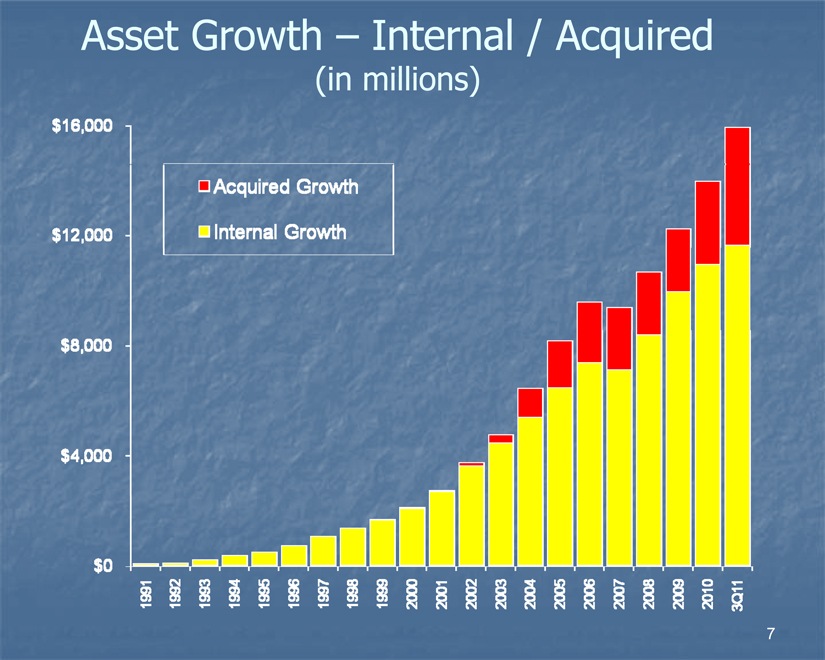
Asset Growth – Internal / Acquired
(in millions)
$16,000
$12,000
$8,000
$4,000
$0
Acquired Growth
Internal Growth
1991
1992
1993
1994
1995
1996
1997
1998
1999
2000
2001
2002
2003
2004
2005
2006
2007
2008
2009
2010
3Q11
7
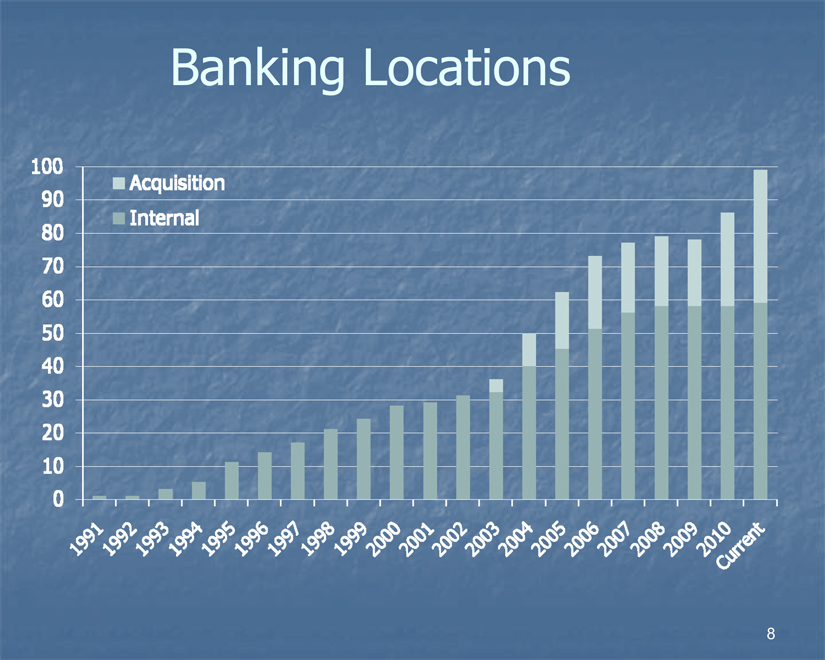
Banking Locations
100
90
80
70
60
50
40
30
20
10
Acquisition
Internal
1991
1992
1993
1994
1995
1996
1997
1998
1999
2000
2001
2002
2003
2004
2005
2006
2007
2008
2009
2010
Current
8
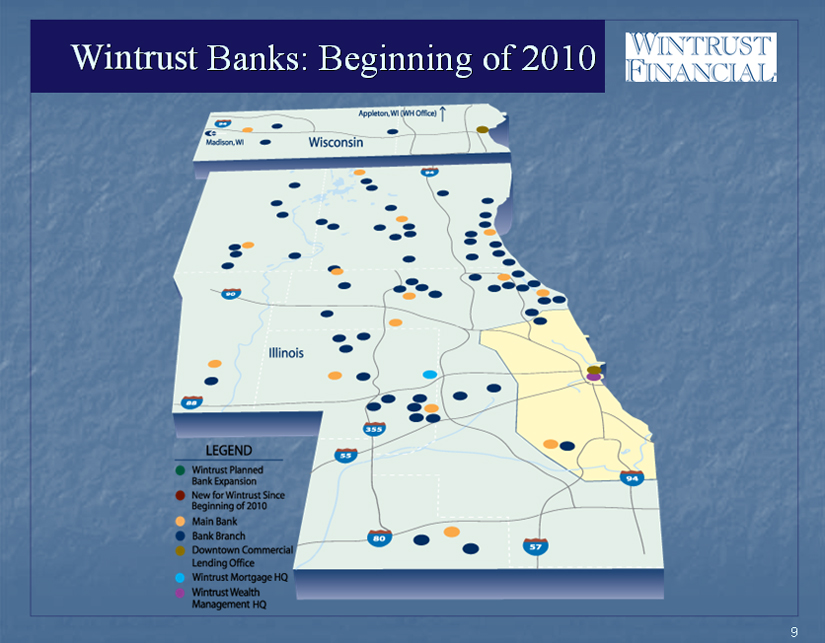
Wintrust Banks: Beginning of 2010
9
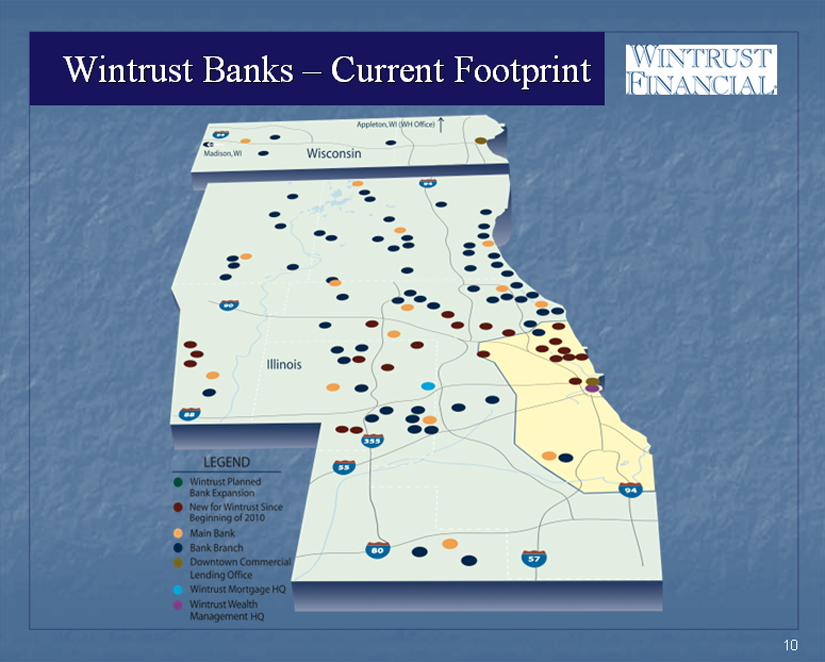
Wintrust Banks – Current Footprint
10
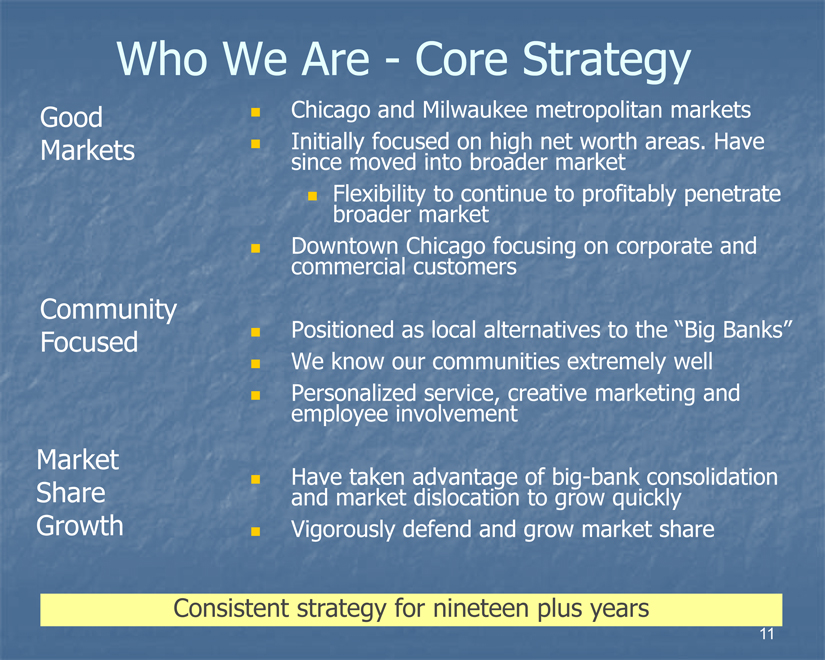
Who We Are - Core Strategy
Good Markets
Community Focused
Market Share Growth
Chicago and Milwaukee metropolitan markets
Initially focused on high net worth areas. Have since moved into broader market
Flexibility to continue to profitably penetrate broader market Downtown Chicago focusing on corporate and commercial customers
Positioned as local alternatives to the “Big Banks” We know our communities extremely well Personalized service, creative marketing and employee involvement
Have taken advantage of big-bank consolidation and market dislocation to grow quickly
Vigorously defend and grow market share
Consistent strategy for nineteen plus years
11
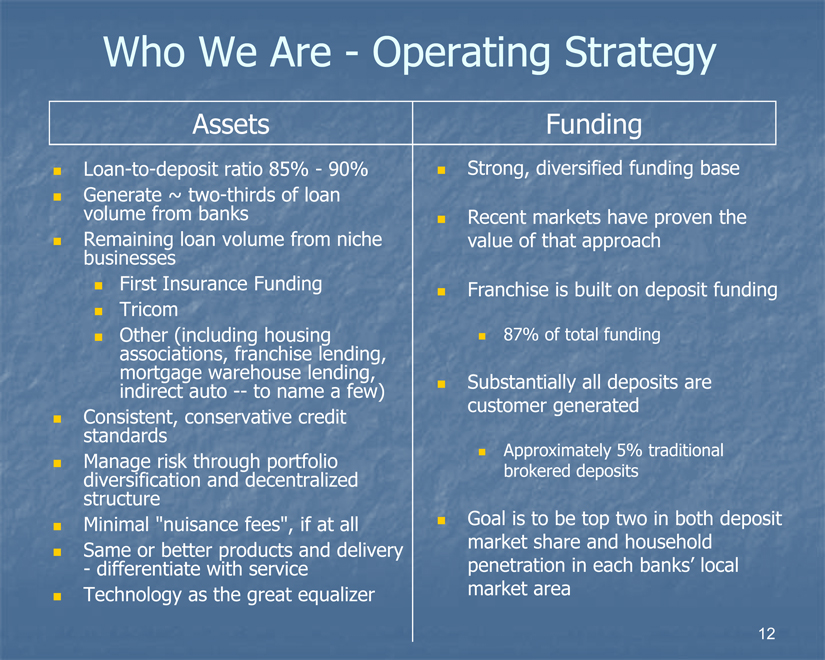
Who We Are - Operating Strategy
Assets
Loan-to-deposit ratio 85% - 90%
Generate ~ two-thirds of loan volume from banks Remaining loan volume from niche businesses
First Insurance Funding
Tricom
Other (including housing associations, franchise lending, mortgage warehouse lending, indirect auto - to name a few)
Consistent, conservative credit standards
Manage risk through portfolio diversification and decentralized structure
Minimal “nuisance fees”, if at all Same or better products and delivery - differentiate with service
Technology as the great equalizer
Funding
Strong, diversified funding base
Recent markets have proven the value of that approach
Franchise is built on deposit funding
87% of total funding
Substantially all deposits are customer generated
Approximately 5% traditional brokered deposits
Goal is to be top two in both deposit market share and household penetration in each banks’ local market area
12
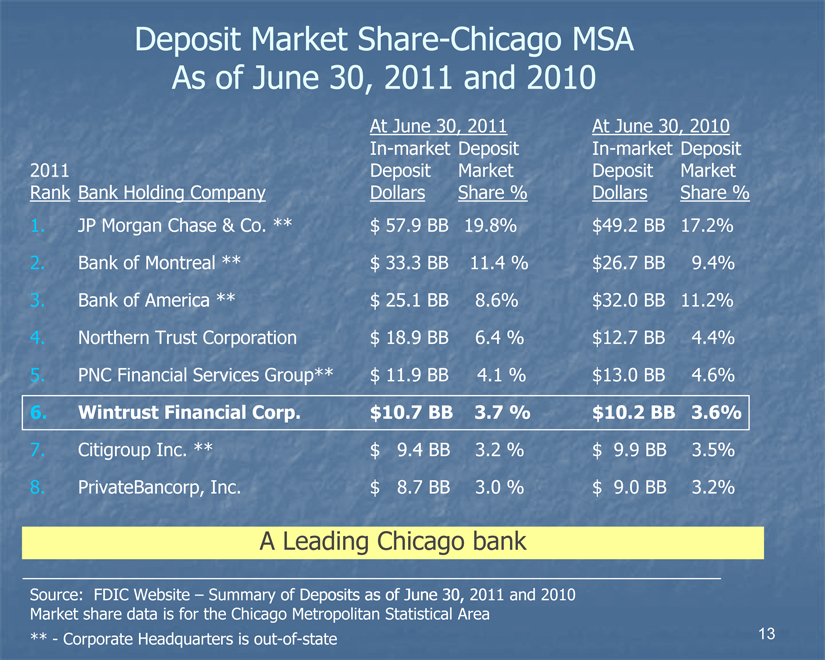
Deposit Market Share-Chicago MSA
As of June 30, 2011 and 2010
At June 30, 2011 At June 30, 2010
In-market Deposit In-market Deposit
2011 Deposit Market Deposit Market
Rank Bank Holding Company Dollars Share % Dollars Share %
1. JP Morgan Chase & Co. ** $ 57.9 BB 19.8% $49.2 BB 17.2%
2. Bank of Montreal ** $ 33.3 BB 11.4 % $26.7 BB 9.4%
3. Bank of America ** $ 25.1 BB 8.6% $32.0 BB 11.2%
4. Northern Trust Corporation $ 18.9 BB 6.4 % $12.7 BB 4.4%
5. PNC Financial Services Group** $ 11.9 BB 4.1 % $13.0 BB 4.6%
6. Wintrust Financial Corp. $10.7 BB 3.7 % $10.2 BB 3.6%
7. Citigroup Inc. ** $ 9.4 BB 3.2 % $ 9.9 BB 3.5%
8. PrivateBancorp, Inc. $ 8.7 BB 3.0 % $ 9.0 BB 3.2%
A Leading Chicago bank
Source: FDIC Website – Summary of Deposits as of June 30, 2011 and 2010
Market share data is for the Chicago Metropolitan Statistical Area
** - Corporate Headquarters is out-of-state
13

How We Got Here
14

Consistent Strategy – Changing Tactics
CREDIT CYCLE
Healthy Storm Clouds The Perfect Restrained Gather Storm Stabilization Recovery (1991-2005) (2006-07) (2008) (2009) (2010-11)
WINTRUST TACTICS
Organic &
Acquisition Growth
7 traditional bank acquisitions since 2003
9 de novo charters since 1991
“Rope - A – Dope”
Slowed growth
Maintained extremely conservative underwriting
Reduced relative cost of funds
Controlled expenses
“Off the Ropes”
Life insurance premium finance acquisition
PMP acquisition (in late Dec ‘08)
Over 50 new lenders hired since Jan ‘09
Loans $800 mm in 2009
Deposits $1.5 bn in 2009
Warning signs 1Q’06
Disadvantageous yield curve
Loosened credit standards
Credit spreads moved to unacceptable levels
Capital & TARP-CPP
Focused on minimizing dilution to shareholders
Q3’08 – raised $50 mm of convertible preferred
Dec. ‘08 - $250 mm TARP-CPP
Organic & Acquisition Growth
Take advantage of “dislocation”
Consistent loan growth – approx. $1.8 billion since 2009 (excl. covered loans)
6 FDIC-assisted transactions
Acquired 1 branch in Naperville,
Acquired asset management firm with approx. $2.4 bn in AUM
Acquired Elgin State Bank (unassisted)
Raised capital-RETIRED TARP
Compound Annual Growth Rates
1991-2005
2006-2007
2007-2008
2008-2009
2005-2010
Asset Growth
434%
-2.1%
13.8%
14.6%
14.4%
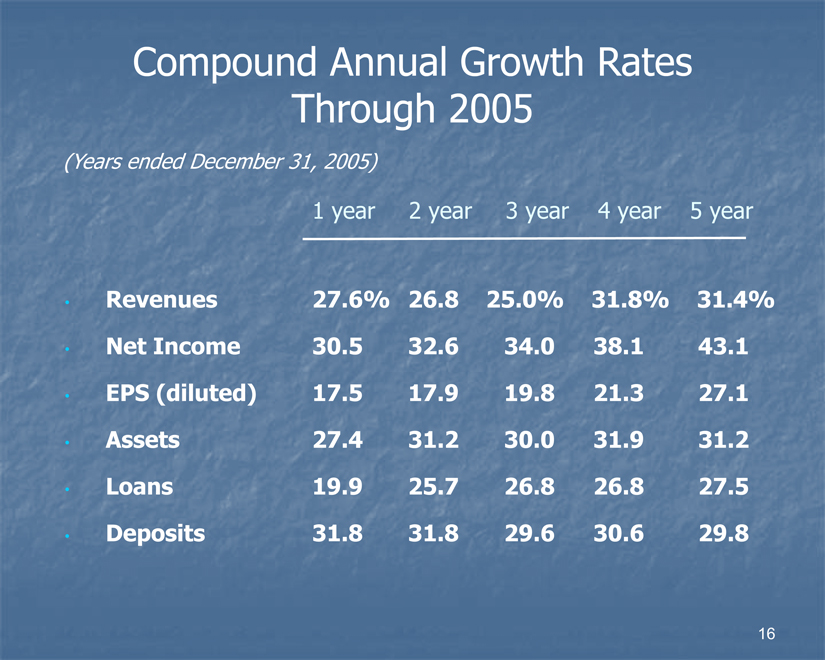
Compound Annual Growth Rates Through 2005
(Years ended December 31, 2005)
1 year 2 year 3 year 4 year 5 year
Revenues 27.6% 26.8 25.0% 31.8% 31.4%
Net Income 30.5 32.6 34.0 38.1 43.1
EPS (diluted) 17.5 17.9 19.8 21.3 27.1
Assets 27.4 31.2 30.0 31.9 31.2
Loans 19.9 25.7 26.8 26.8 27.5
Deposits 31.8 31.8 29.6 30.6 29.8
16
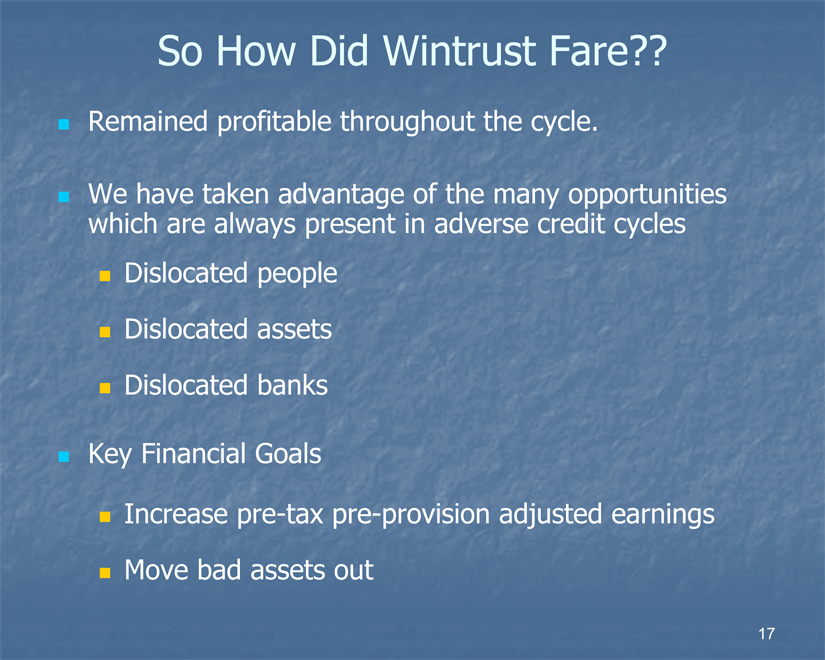
So How Did Wintrust Fare??
Remained profitable throughout the cycle.
We have taken advantage of the many opportunities which are always present in adverse credit cycles
Dislocated people
Dislocated assets
Dislocated banks
Key Financial Goals
Increase pre-tax pre-provision adjusted earnings
Move bad assets out
17
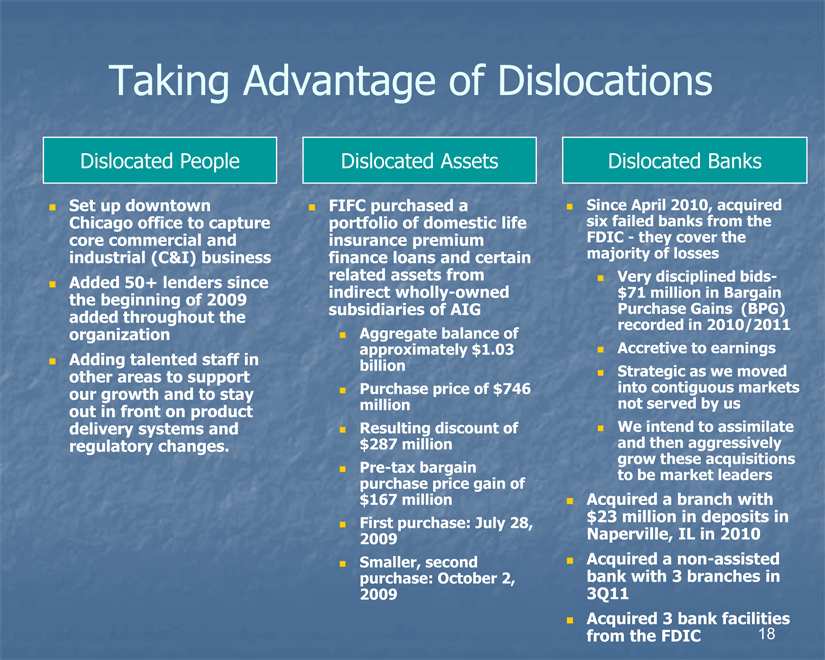
Taking Advantage of Dislocations
Dislocated People
Set up downtown Chicago office to capture core commercial and industrial (C&I) business Added 50+ lenders since the beginning of 2009 added throughout the organization Adding talented staff in other areas to support our growth and to stay out in front on product delivery systems and regulatory changes.
Dislocated Assets
FIFC purchased a portfolio of domestic life insurance premium finance loans and certain related assets from indirect wholly-owned subsidiaries of AIG
Aggregate balance of approximately $1.03 billion
Purchase price of $746 million
Resulting discount of $287 million
Pre-tax bargain purchase price gain of $167 million
First purchase: July 28, 2009
Smaller, second purchase: October 2, 2009
Dislocated Banks
Since April 2010, acquired six failed banks from the FDIC - they cover the majority of losses
Very disciplined bids-$71 million in Bargain Purchase Gains (BPG) recorded in 2010/2011
Accretive to earnings
Strategic as we moved into contiguous markets not served by us
We intend to assimilate and then aggressively grow these acquisitions to be market leaders Acquired a branch with $23 million in deposits in Naperville, IL in 2010 Acquired a non-assisted bank with 3 branches in 3Q11 Acquired 3 bank facilities from the FDIC
18
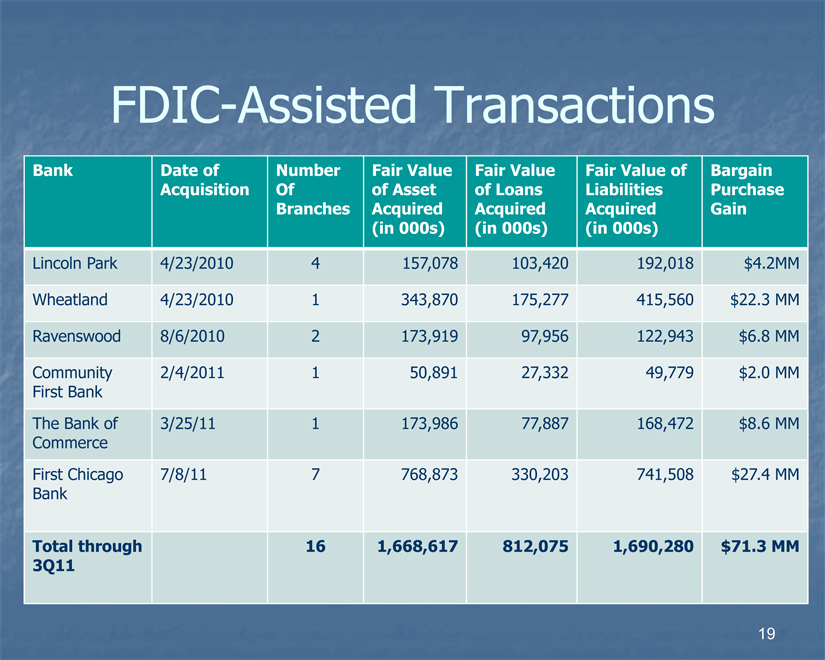
FDIC-Assisted Transactions
Bank Date of Number Fair Value Fair Value Fair Value of Bargain
Acquisition Of of Asset of Loans Liabilities Purchase
Branches Acquired Acquired Acquired Gain
(in 000s) (in 000s) (in 000s)
Lincoln Park 4/23/2010 4 157,078 103,420 192,018 $4.2MM
Wheatland 4/23/2010 1 343,870 175,277 415,560 $22.3 MM
Ravenswood 8/6/2010 2 173,919 97,956 122,943 $6.8 MM
Community 2/4/2011 1 50,891 27,332 49,779 $2.0 MM
First Bank
The Bank of 3/25/11 1 173,986 77,887 168,472 $8.6 MM
Commerce
First Chicago 7/8/11 7 768,873 330,203 741,508 $27.4 MM
Bank
Total through 16 1,668,617 812,075 1,690,280 $71.3 MM
3Q11
19
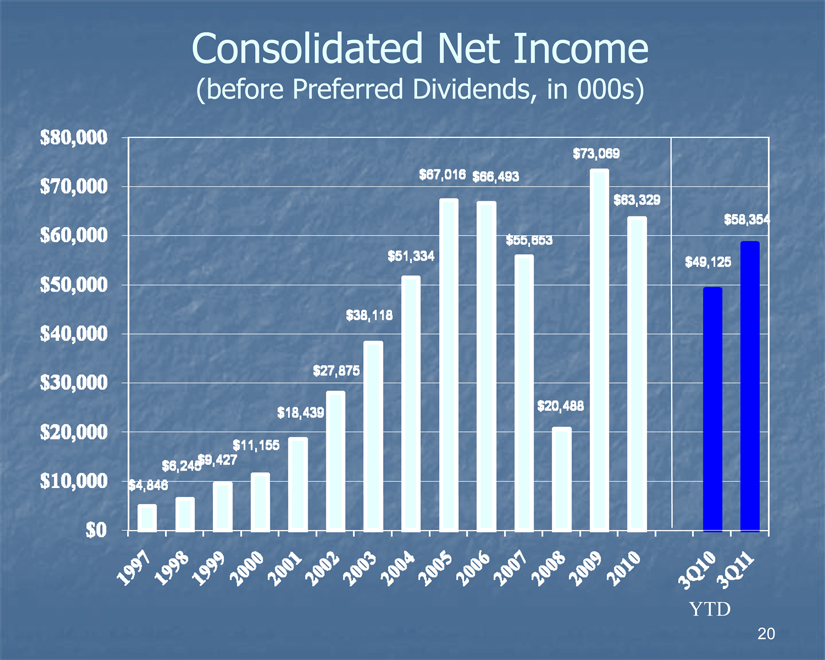
Consolidated Net Income
(before Preferred Dividends, in 000s)
$80,000
$70,000
$60,000
$50,000
$40,000
$30,000
$20,000
$10,000
$0
$4,846
$6,245
$9,427
$11,155
$18,439
$27,875
$38,118
$51,334
$67,016
$66,493
$55,653
$20,488
$73,069
$63,329
$49,125
$58,354
1997
1998
1999
2000
2001
2002
2003
2004
2005
2006
2007
2008
2009
2010
3Q10
3Q11
YTD
20
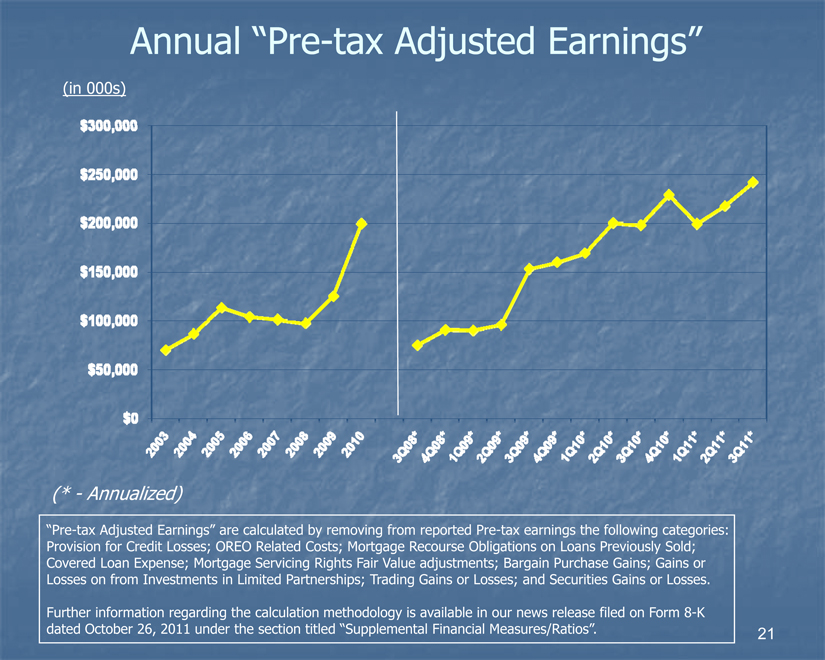
Annual “Pre-tax Adjusted Earnings”
(in 000s)
$300,000
$250,000
$200,000
$150,000
$100,000
$50,000
$0
2003
2004
2005
2006
2007
2008
2009
2010
3Q08*
4Q08*
1Q09*
2Q09*
3Q09*
4Q09*
1Q10*
2Q10*
3Q10*
4Q10*
1Q11*
2Q11*
3Q11*
(* - Annualized)
“Pre-tax Adjusted Earnings” are calculated by removing from reported Pre-tax earnings the following categories: Provision for Credit Losses; OREO Related Costs; Mortgage Recourse Obligations on Loans Previously Sold; Covered Loan Expense; Mortgage Servicing Rights Fair Value adjustments; Bargain Purchase Gains; Gains or
Losses on from Investments in Limited Partnerships; Trading Gains or Losses; and Securities Gains or Losses.
Further information regarding the calculation methodology is available in our news release filed on Form 8-K dated October 26, 2011 under the section titled “Supplemental Financial Measures/Ratios”.
21
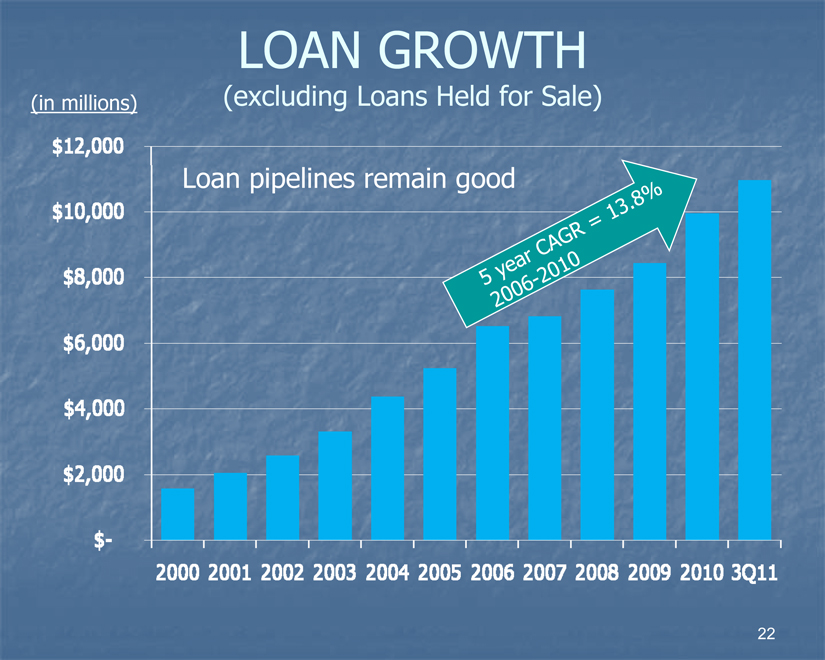
LOAN GROWTH
(excluding Loans Held for Sale)
(in millions)
$12,000
$10,000
$8,000
$6,000
$4,000
$2,000
$-
5 year CAGR = 13.8% 2009-2010
Loan pipelines remain good
2000
2001
2002
2003
2004
2005
2006
2007
2008
2009
2010
3Q11
22
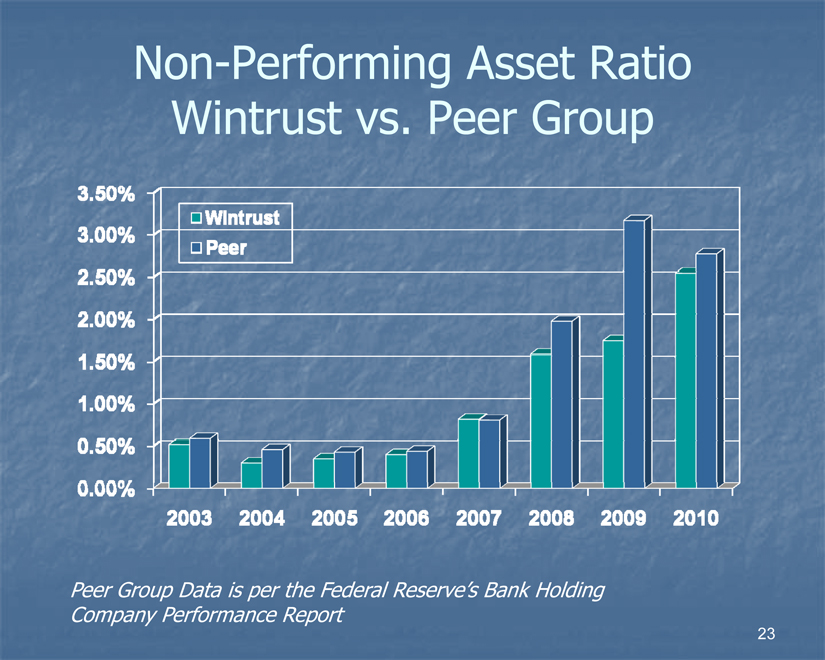
Non-Performing Asset Ratio Wintrust vs. Peer Group
3.50%
3.00%
2.50%
2.00%
1.50%
1.00%
0.50%
0.00%
Wintrust
Peer
2003
2004
2005
2006
2007
2008
2009
2010
Peer Group Data is per the Federal Reserve’s Bank Holding Company Performance Report
23
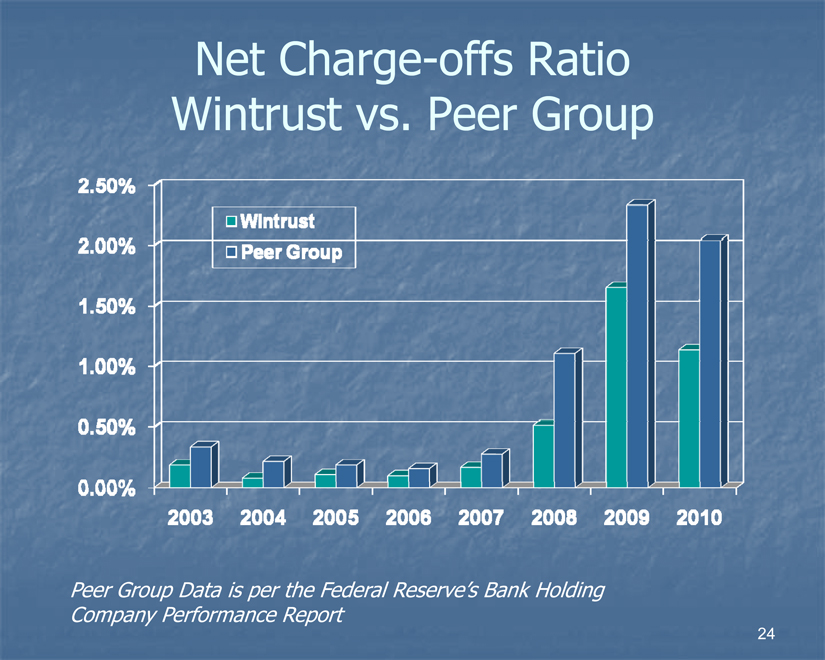
Net Charge-offs Ratio
Wintrust vs. Peer Group
2.50%
2.00%
1.50%
1.00%
0.50%
0.00%
Wintrust
Peer Group
2003
2004
2005
2006
2007
2008
2009
2010
Peer Group Data is per the Federal Reserve’s Bank Holding Company Performance Report
24
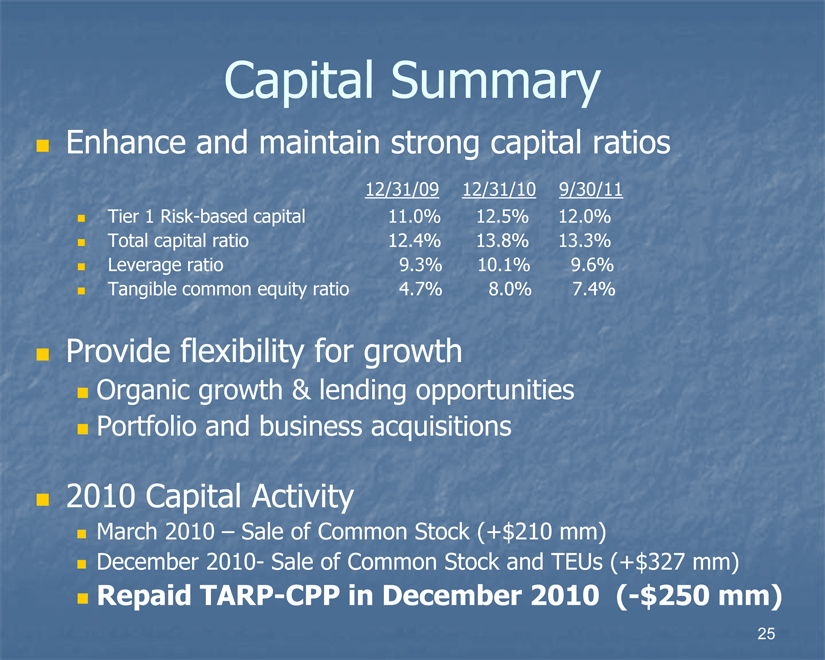
Capital Summary
Enhance and maintain strong capital ratios
12/31/09 12/31/10 9/30/11
Tier 1 Risk-based capital 11.0% 12.5% 12.0%
Total capital ratio 12.4% 13.8% 13.3%
Leverage ratio 9.3% 10.1% 9.6%
Tangible common equity ratio 4.7% 8.0% 7.4%
Provide flexibility for growth
Organic growth & lending opportunities
Portfolio and business acquisitions
2010 Capital Activity
March 2010 – Sale of Common Stock (+$210 mm)
December 2010- Sale of Common Stock and TEUs (+$327 mm)
Repaid TARP-CPP in December 2010 (-$250 mm)
25
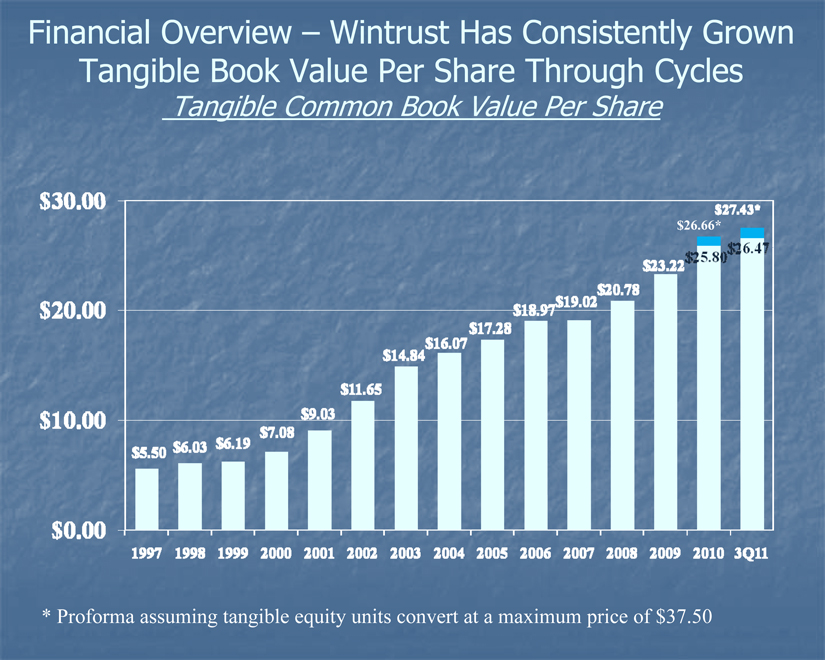
Financial Overview – Wintrust Has Consistently Grown
Tangible Book Value Per Share Through Cycles
Tangible Common Book Value Per Share
$30.00
$20.00
$10.00
$0.00
$5.50
$6.03
$6.19
$7.08
$9.03
$11.65
$14.84
$16.07
$17.28
$18.97
$19.02
$20.78
$23.22
$25.80
$26.47
$26.66*
$27.43*
1997
1998
1999
2000
2001
2002
2003
2004
2005
2006
2007
2008
2009
2010
3Q11
* Proforma assuming tangible equity units convert at a maximum price of $37.50
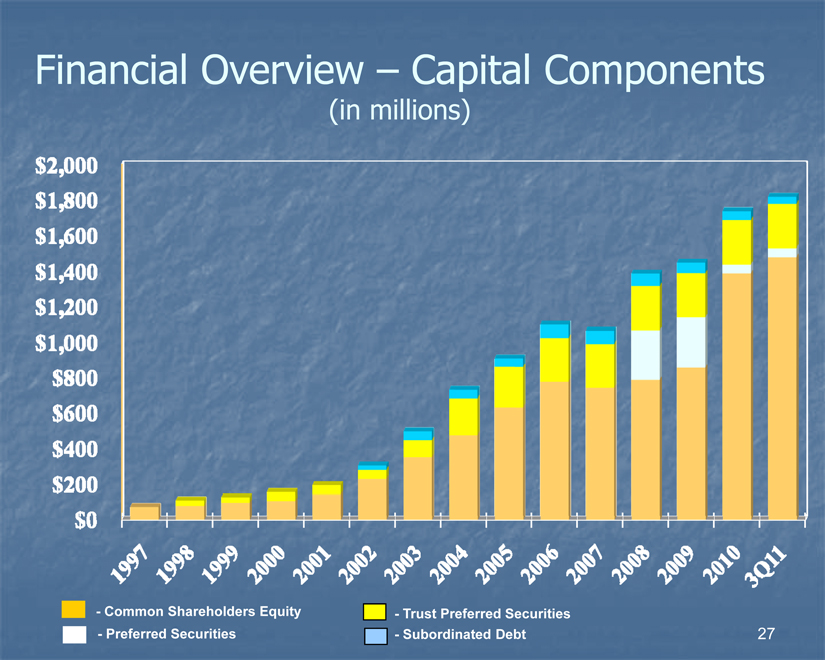
Financial Overview – Capital Components
(in millions)
$2,000
$1,800
$1,600
$1,400
$1,200
$1,000
$800
$600
$400
$200
$0
1997
1998
1999
2000
2001
2002
2003
2004
2005
2006
2007
2008
2009
2010
3Q11
- Common Shareholders Equity
- Preferred Securities
- Trust Preferred Securities
- Subordinated Debt
27
Wintrust Strategy for 2011 and Beyond
Back to the Future
28
Back to the Future Strategy for 2011 and Beyond
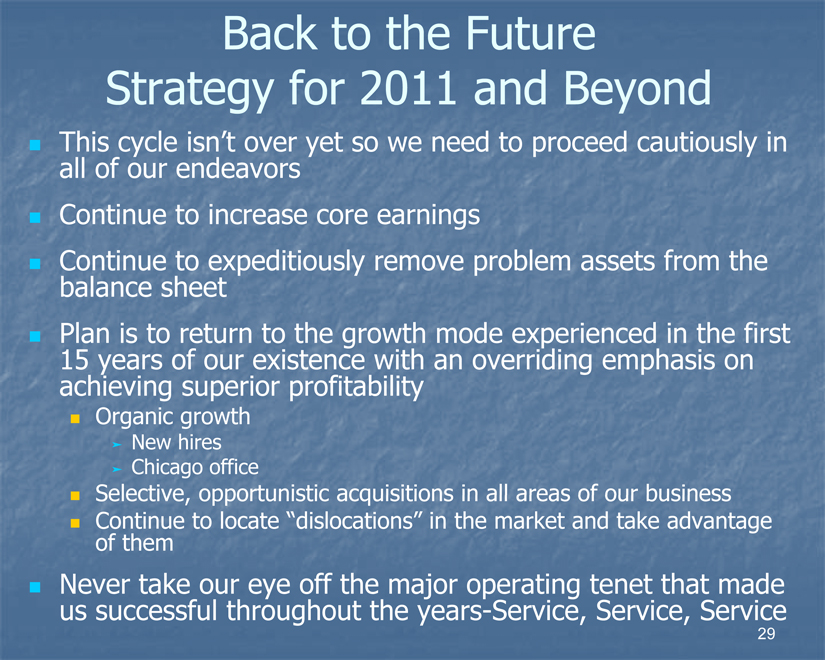
This cycle isn’t over yet so we need to proceed cautiously in all of our endeavors Continue to increase core earnings Continue to expeditiously remove problem assets from the balance sheet
Plan is to return to the growth mode experienced in the first 15 years of our existence with an overriding emphasis on achieving superior profitability
Organic growth
New hires
Chicago office
Selective, opportunistic acquisitions in all areas of our business
Continue to locate “dislocations” in the market and take advantage of them
Never take our eye off the major operating tenet that made us successful throughout the years-Service, Service, Service
29
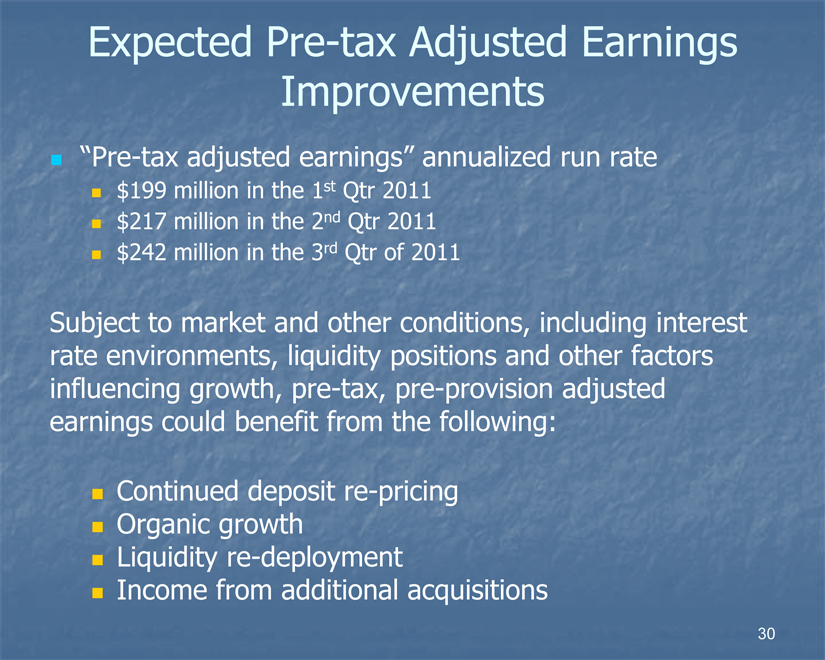
Expected Pre-tax Adjusted Earnings Improvements
“Pre-tax adjusted earnings” annualized run rate
$199 million in the 1st Qtr 2011
$ 217 million in the 2nd Qtr 2011
$242 million in the 3rd Qtr of 2011
Subject to market and other conditions, including interest rate environments, liquidity positions and other factors influencing growth, pre-tax, pre-provision adjusted earnings could benefit from the following:
Continued deposit re-pricing
Organic growth
Liquidity re-deployment
Income from additional acquisitions
30
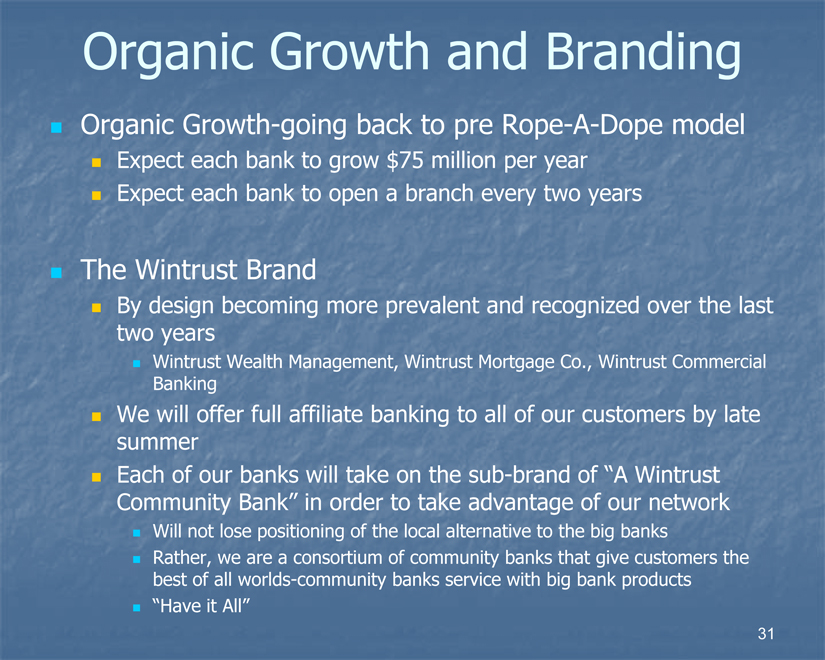
Organic Growth and Branding
Organic Growth-going back to pre Rope-A-Dope model
Expect each bank to grow $75 million per year
Expect each bank to open a branch every two years
The Wintrust Brand
By design becoming more prevalent and recognized over the last two years
Wintrust Wealth Management, Wintrust Mortgage Co., Wintrust Commercial
Banking
We will offer full affiliate banking to all of our customers by late summer
Each of our banks will take on the sub-brand of “A Wintrust Community Bank” in order to take advantage of our network
Will not lose positioning of the local alternative to the big banks
Rather, we are a consortium of community banks that give customers the best of all worlds-community banks service with big bank products
“Have it All”
31
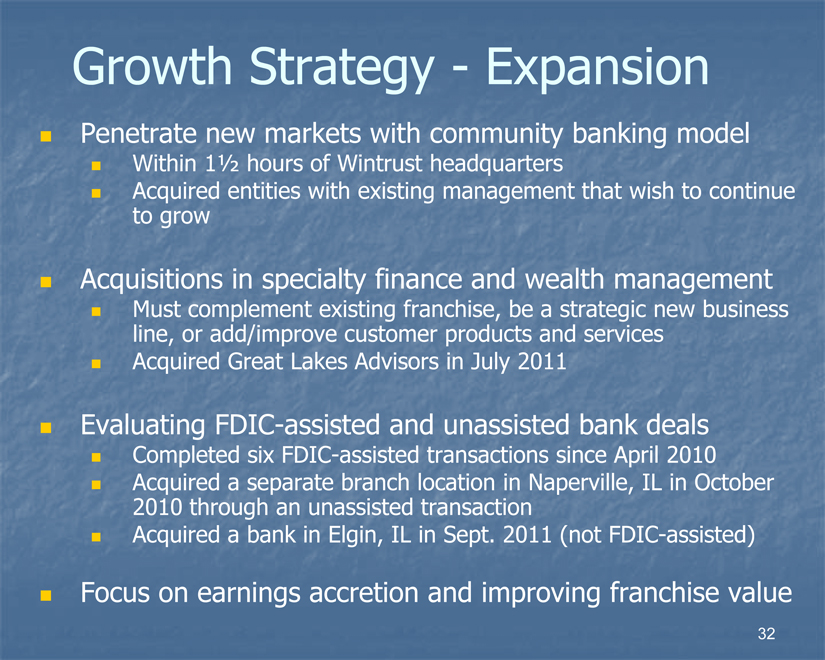
Growth Strategy - Expansion
Penetrate new markets with community banking model
Within 1 1/2 hours of Wintrust headquarters
Acquired entities with existing management that wish to continue to grow
Acquisitions in specialty finance and wealth management
Must complement existing franchise, be a strategic new business line, or add/improve customer products and services
Acquired Great Lakes Advisors in July 2011
Evaluating FDIC-assisted and unassisted bank deals
Completed six FDIC-assisted transactions since April 2010
Acquired a separate branch location in Naperville, IL in October 2010 through an unassisted transaction
Acquired a bank in Elgin, IL in Sept. 2011 (not FDIC-assisted)
Focus on earnings accretion and improving franchise value
32
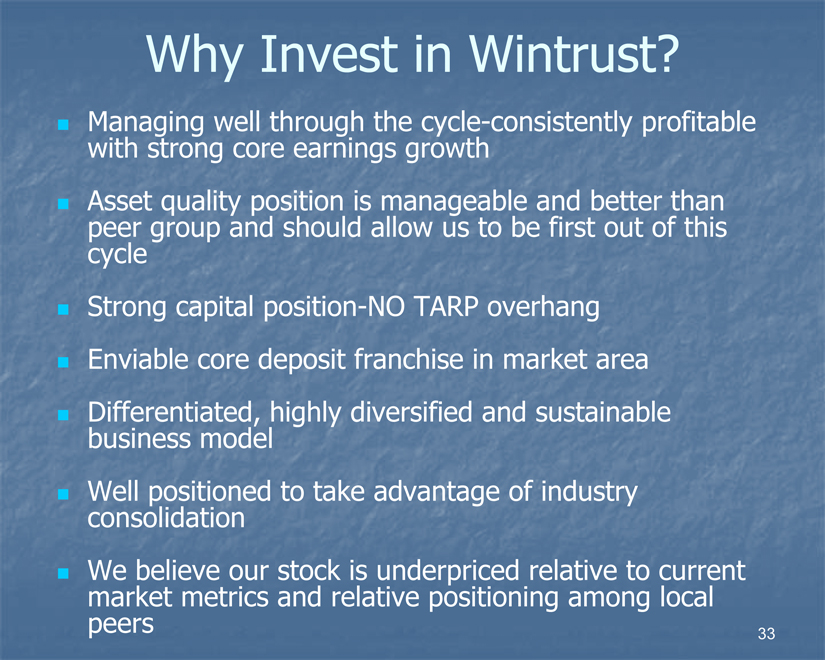
Why Invest in Wintrust?
Managing well through the cycle-consistently profitable with strong core earnings growth Asset quality position is manageable and better than peer group and should allow us to be first out of this cycle
Strong capital position-NO TARP overhang
Enviable core deposit franchise in market area Differentiated, highly diversified and sustainable business model Well positioned to take advantage of industry consolidation We believe our stock is underpriced relative to current market metrics and relative positioning among local peers
33


Supplemental Financial Data
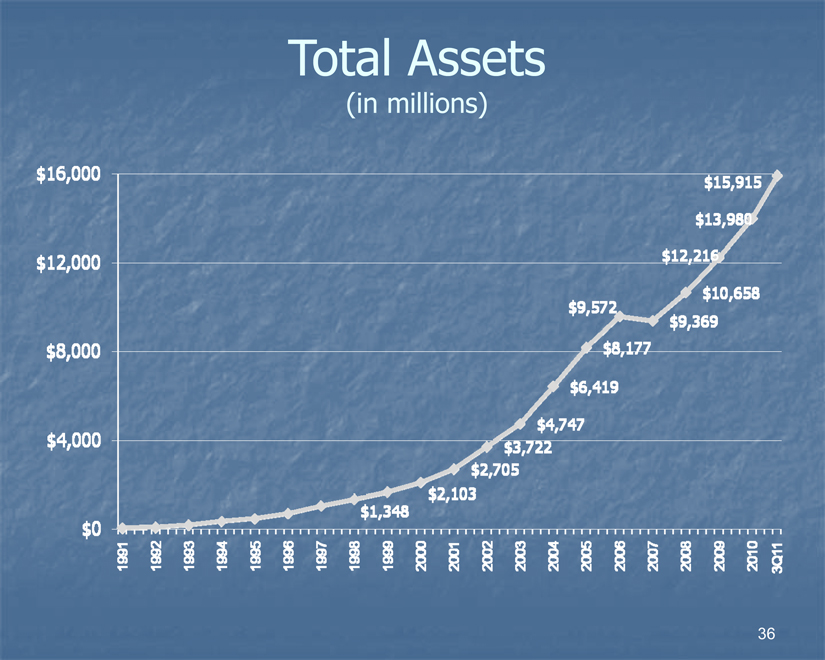
Total Assets
(in millions)
$16,000
$12,000
$8,000
$4,000
$0
$1,348
$2,103
$2,705
$3,722
$4,747
$6,419
$8,177
$9,572
$9,369
$10,658
$12,216
$13,980
$15,915
1991
1992
1993
1994
1995
1996
1997
1998
1999
2000
2001
2002
2003
2004
2005
2006
2007
2008
2009
2010
3Q11
36
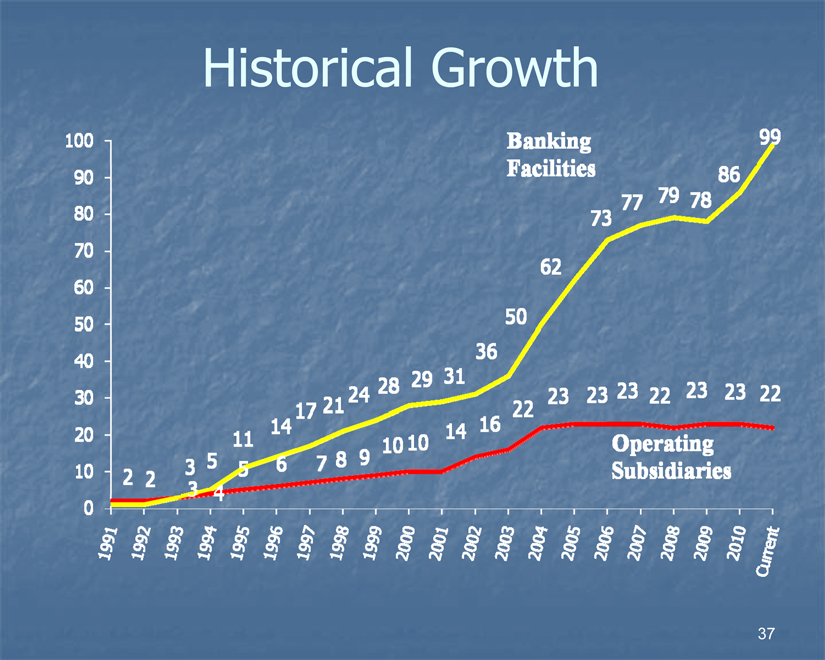
Historical Growth
100
90
80
70
60
50
40
30
20
10
0
2 |
|
2 |
|
3 |
|
5 |
|
11
14
17
21
24
28
29
31
36
50
62
73
77
79
78
86
99
3 |
|
4 |
|
5 |
|
6 |
|
7 |
|
8 |
|
9
10
10
14
16
22
23
23
23
23
22
23
22
Banking Facilities
Operating Subsidiaries
1991
1992
1993
1994
1995
1996
1997
1998
1999
2000
2001
2002
2003
2004
2005
2006
2007
2008
2009
2010
Current
37
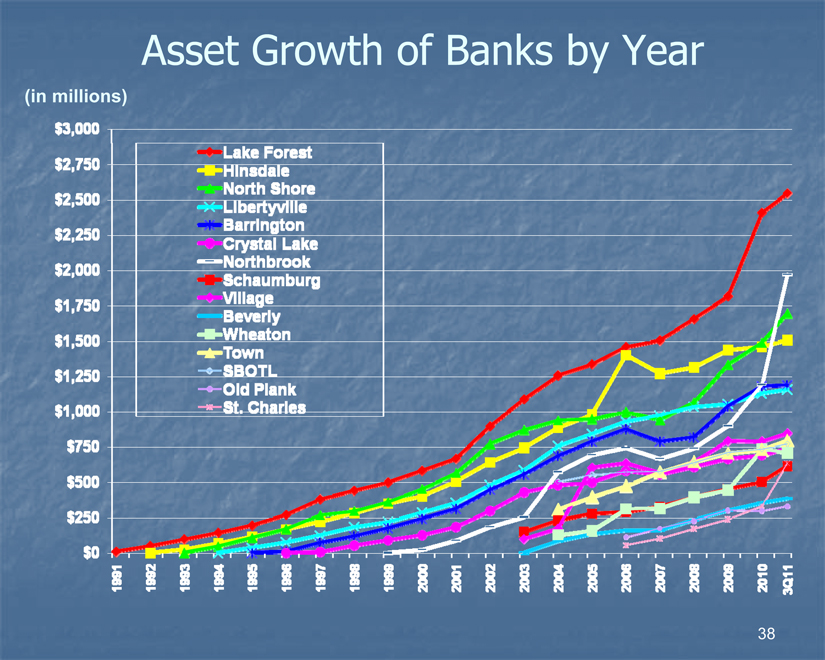
Asset Growth of Banks by Year
(in millions)
$3,000
$2,750
$2,500
$2,250
$2,000
$1,750
$1,500
$1,250
$1,000
$750
$500
$250
$0
1991
1992
1993
1994
1995
1996
1997
1998
1999
2000
2001
2002
2003
2004
2005
2006
2007
2008
2009
2010
3Q11
Lake Forest
Hinsdale
North Shore
Libertyville Barrington
Crystal Lake
Northbrook Schaumburg
Village
Beverly
Wheaton
Town
SBOTL
Old Plank
St. Charles
38
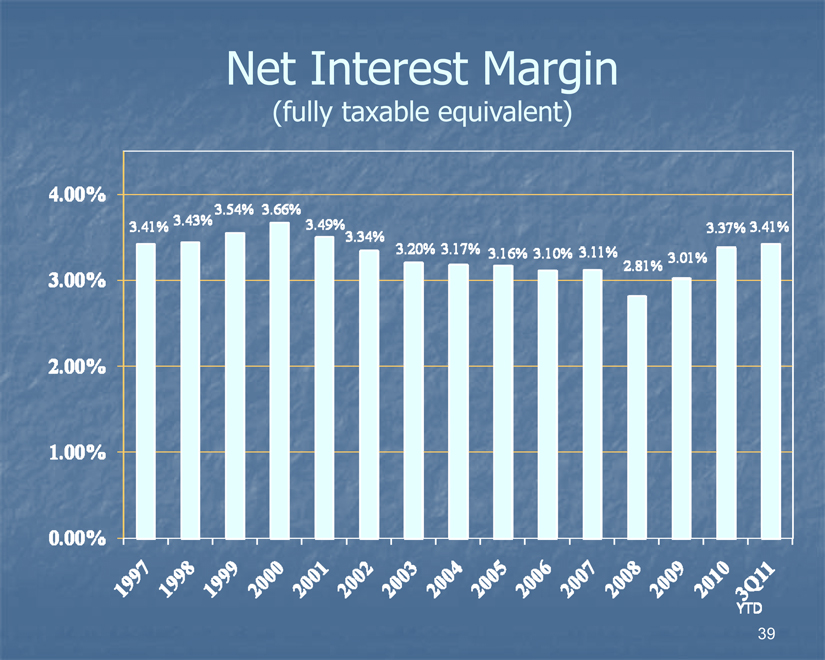
Net Interest Margin
(fully taxable equivalent)
4.00%
3.00%
2.00%
1.00%
0.00%
3.41%
3.43%
3.54%
3.66%
3.49%
3.34%
3.20%
3.17%
3.16%
3.10%
3.11%
2.81%
3.01%
3.37%
3.41%
1997
1998
1999
2000
2001
2002
2003
2004
2005
2006
2007
2008
2009
2010
3Q11
YTD
39
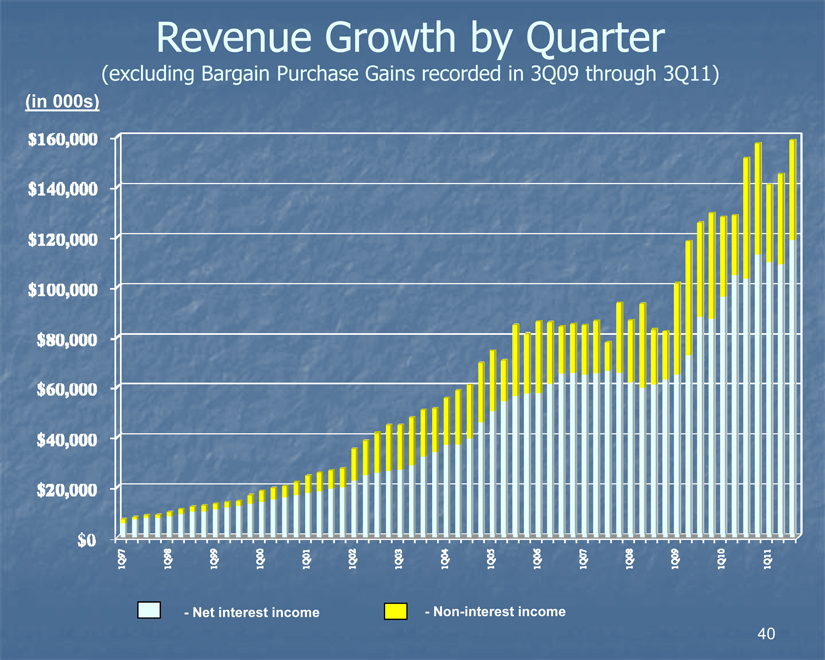
Revenue Growth by Quarter
(excluding Bargain Purchase Gains recorded in 3Q09 through 3Q11)
(in 000s)
$160,000
$140,000
$120,000
$100,000
$80,000
$60,000
$40,000
$20,000
$0
1Q97
1Q98
1Q99
1Q00
1Q01
1Q02
1Q03
1Q04
1Q05
1Q06
1Q07
1Q08
1Q09
1Q10
1Q11
- Net interest income
- Non-interest income
40
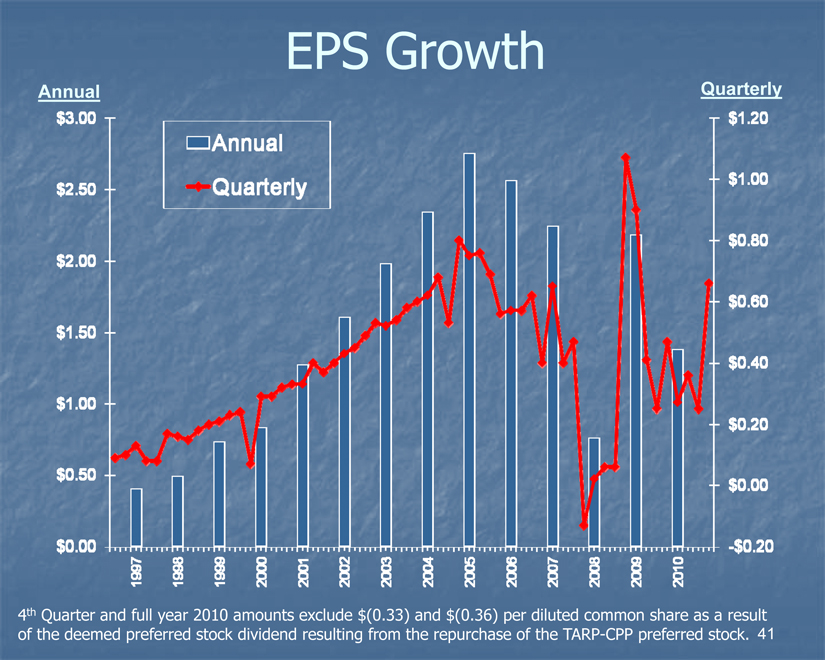
EPS Annual Quarterly Growth
Annual
$3.00
$2.50
$2.00
$1.50
$1.00
$0.50
$0.00
Quarterly
$1.20
$1.00
$0.80
$0.60
$0.40
$0.20
$0.00
$0.20
1997
1998
1999
2000
2001
2002
2003
2004
2005
2006
2007
2008
2009
2010
4th Quarter and full year 2010 amounts exclude $(0.33) and $(0.36) per diluted common share as a result of the deemed preferred stock dividend resulting from the repurchase of the TARP-CPP preferred stock. 41
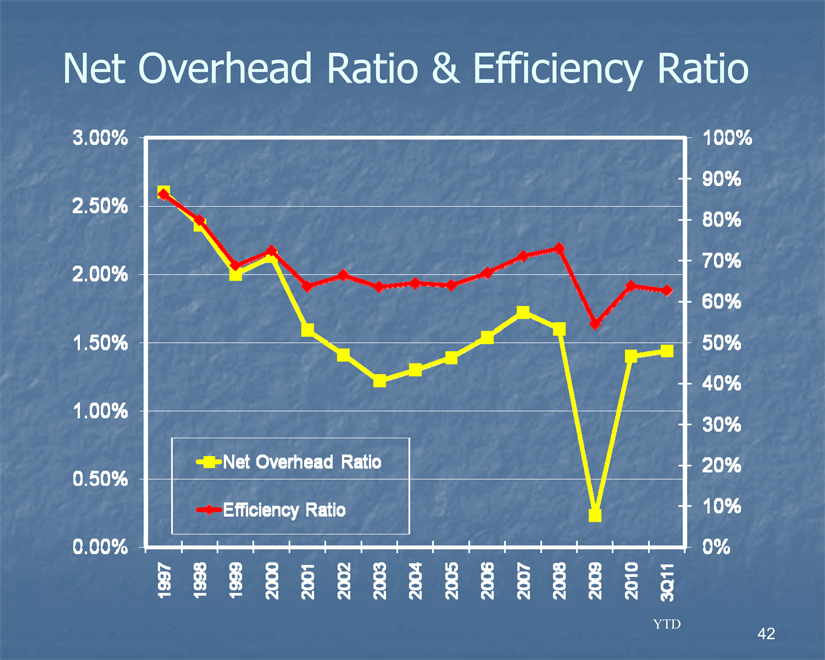
Net Overhead Ratio & Efficiency Ratio
3.00%
2.50%
2.00%
1.50%
1.00%
0.50%
0.00%
YTD
100%
90%
80%
70%
60%
50%
40%
30%
20%
10%
0%
1997
1998
1999
2000
2001
2002
2003
2004
2005
2006
2007
2008
2009
2010
3Q11
Net Overhead Ratio Efficiency Ratio
42
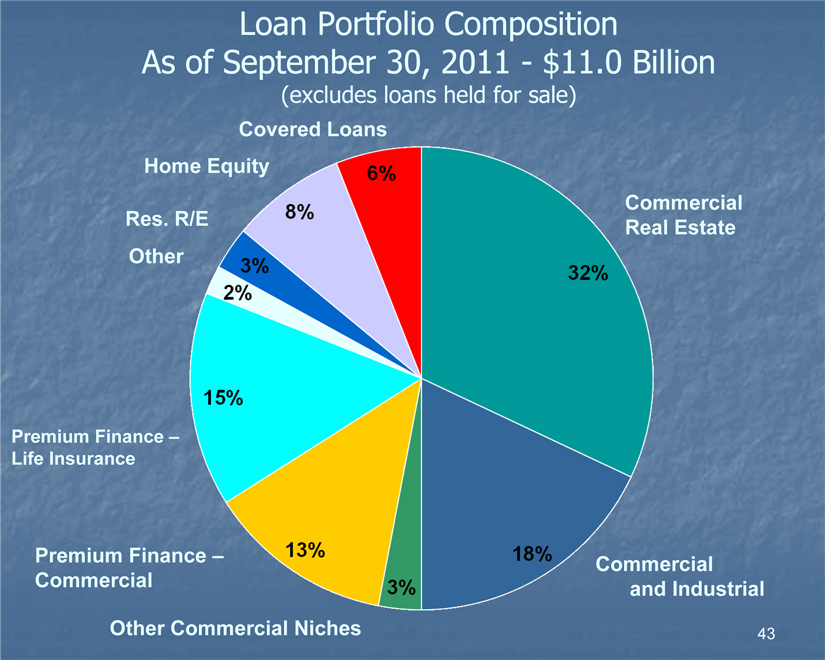
Loan Portfolio Composition
As of September 30, 2011 - $11.0 Billion
(excludes loans held for sale)
Covered Loans
Home Equity
Res. R/E Other
Commercial Real Estate
Premium Finance – Life Insurance
Premium Finance – Commercial
Other Commercial Niches
Commercial and Industrial
6%
8%
3%
2%
15%
13%
3%
18%
32%
43
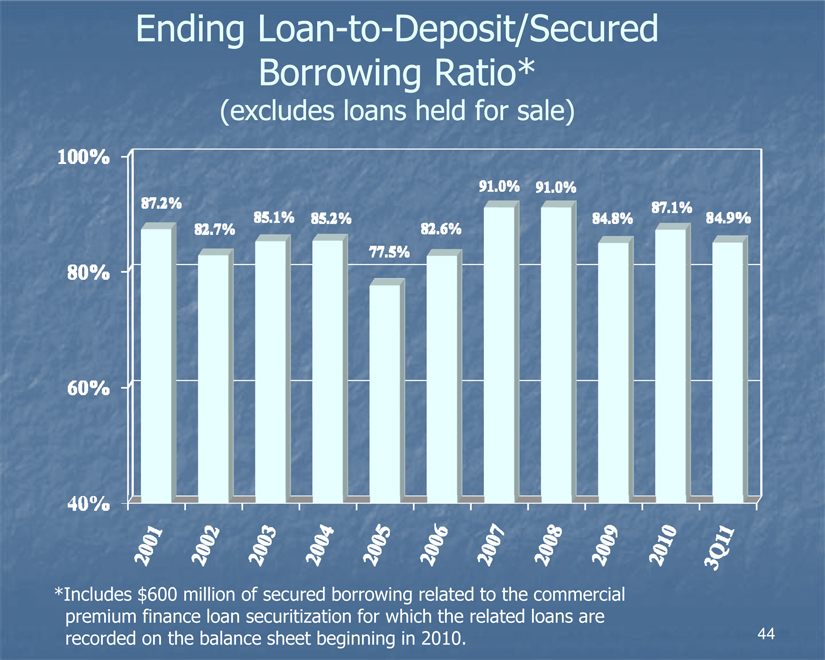
Ending Loan-to-Deposit/Secured Borrowing Ratio*
(excludes loans held for sale)
100%
80%
60%
40%
87.2%
82.7%
85.1%
85.2%
77.5%
82.6%
91.0%
91.0%
84.8%
87.1%
84.9%
2001
2002
2003
2004
2005
2006
2007
2008
2009
2010
3Q11
*Includes $600 million of secured borrowing related to the commercial premium finance loan securitization for which the related loans are recorded on the balance sheet beginning in 2010.
44
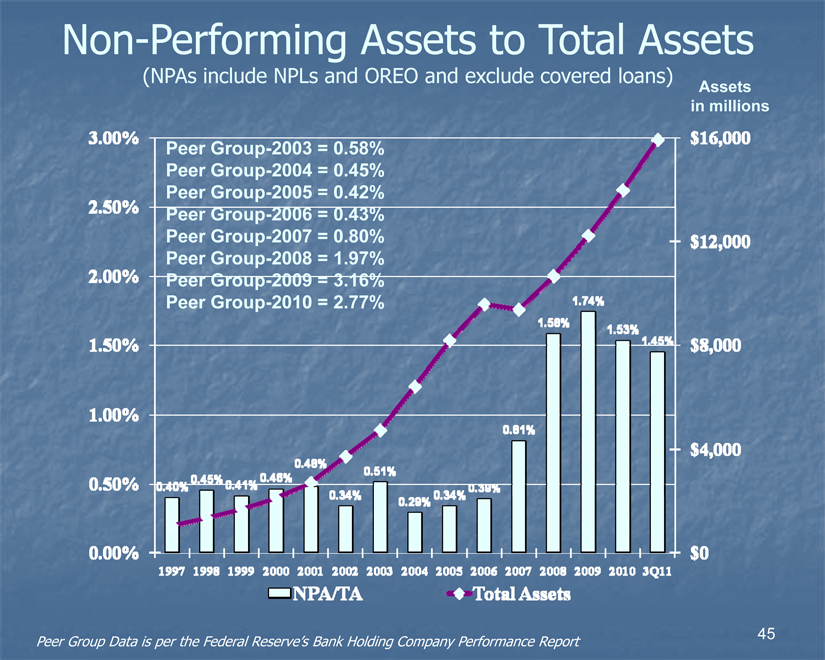
Non-Performing Assets to Total Assets
(NPAs include NPLs and OREO and exclude covered loans)
Assets in millions
3.00%
2.50%
2.00%
1.50%
1.00%
0.50%
0.00%
$16,000
$12,000
$8,000
$4,000
$0
0.40%
0.45%
0.41%
0.46%
0.48%
0.34%
0.51%
0.29%
0.34%
0.39%
0.81%
1.58%
1.74%
1.53%
1.45%
1997
1998
1999
2000
2001
2002
2003
2004
2005
2006
2007
2008
2009
2010
3Q11
Peer Group-2003 = 0.58% Peer Group-2004 = 0.45% Peer Group-2005 = 0.42% Peer Group-2006 = 0.43% Peer Group-2007 = 0.80% Peer Group-2008 = 1.97% Peer Group-2009 = 3.16% Peer Group-2010 = 2.77%
Peer Group Data is per the Federal Reserve’s Bank Holding Company Performance Report
NPA/TA Total Assets
45
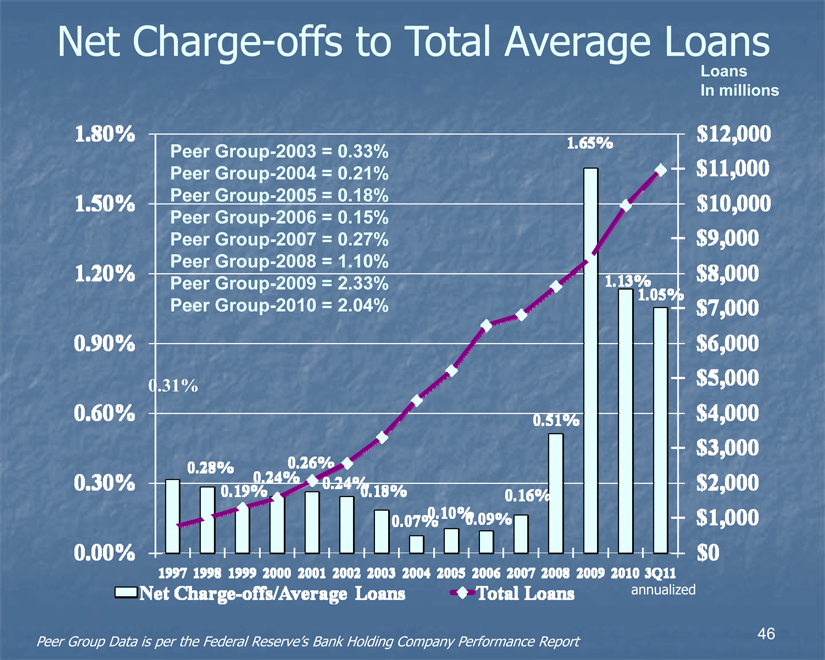
Net Charge-offs to Total Average Loans
Loans In millions
1.80%
1.50%
1.20%
0.90%
0.60%
0.30%
0.00%
$12,000
$11,000
$10,000
$9,000
$8,000
$7,000
$6,000
$5,000
$4,000
$3,000
$2,000
$1,000
$0
0.31%
0.28%
0.19%
0.24%
0.18%
0.07%
0.10%
0.09%
0.16%
0.51%
1.65%
1.13%
1.05%
1997
1998
1999
2000
2001
2002
2003
2004
2005
2006
2007
2008
2009
2010
3Q11
Net Charge-offs/Average loans
Total Loans
annualized
Peer Group-2003 = 0.33% Peer Group-2004 = 0.21% Peer Group-2005 = 0.18% Peer Group-2006 = 0.15% Peer Group-2007 = 0.27% Peer Group-2008 = 1.10% Peer Group-2009 = 2.33% Peer Group-2010 = 2.04%
Peer Group Data is per the Federal Reserve’s Bank Holding Company Performance Report
46
FORWARD-LOOKING STATEMENTS
This document contains forward-looking statements within the meaning of federal securities laws. Forward-looking information can be identified through the use of words such as “intend,” “plan,” “project,” “expect,” “anticipate,” “believe,” “estimate,” “contemplate,” “possible,” “point,” “will,” “may,” “should,” “would” and “could.” Forward-looking statements and information are not historical facts, are premised on many factors and assumptions, and represent only management’s expectations, estimates and projections regarding future events. Similarly, these statements are not guarantees of future performance and involve certain risks and uncertainties that are difficult to predict, which may include, but are not limited to, those listed below and the Risk Factors discussed under Item 1A of the Company’s 2010 Annual Report on Form 10-K and in any of the Company’s subsequent SEC filings. The Company intends such forward-looking statements to be covered by the safe harbor provisions for forward-looking statements contained in the Private Securities Litigation
Reform Act of 1995, and is including this statement for purposes of invoking these safe harbor provisions. Such forward-looking statements may be deemed to include, among other things, statements relating to the Company’s future financial performance, the performance of its loan portfolio, the expected amount of future credit reserves and charge-offs, delinquency trends, growth plans, regulatory developments, securities that the Company may offer from time to time, and management’s long-term performance goals, as well as statements relating to the anticipated effects on financial condition and results of operations from expected developments or events, the
Company’s business and growth strategies, including future acquisitions of banks, specialty finance or wealth management businesses, internal growth and plans to form additional de novo banks or branch offices. Actual results could differ materially from those addressed in the forward-looking statements as a result of numerous factors, including the following:
47
FORWARD-LOOKING STATEMENTS (cont.)
• negative economic conditions that adversely affect the economy, housing prices, the job market and other factors that may affect the Company’s liquidity and the performance of its loan portfolios, particularly in the markets in which it operates; • the extent of defaults and losses on the Company’s loan portfolio, which may require further increases in its allowance for credit losses; • effects of the potential delay or failure of the U.S. federal government to pay its debts as they become due or make payments in the ordinary course;
• estimates of fair value of certain of the Company’s assets and liabilities, which could change in value significantly from period to period;
• changes in the level and volatility of interest rates, the capital markets and other market indices that may affect, among other things, the Company’s liquidity and the value of its assets and liabilities; • a decrease in the Company’s regulatory capital ratios, including as a result of further declines in the value of its loan portfolios, or otherwise;
• legislative or regulatory changes, particularly changes in regulation of financial services companies and/or the products and services offered by financial services companies, including those resulting from the Dodd-Frank Act;
• restrictions upon our ability to market our products to consumers and limitations on our ability to profitably operate our mortgage business resulting from the Dodd-Frank Act; • increased costs of compliance, heightened regulatory capital requirements and other risks associated with changes in regulation and the current regulatory environment, including the Dodd-Frank Act;
• changes in capital requirements resulting from Basel II and III initiatives;
• increases in the Company’s FDIC insurance premiums, or the collection of special assessments by the FDIC; • losses incurred in connection with repurchases and indemnification payments related to mortgages;
48
FORWARD-LOOKING STATEMENTS (cont.)
• competitive pressures in the financial services business which may affect the pricing of the Company’s loan and deposit products as well as its services (including wealth management services); • delinquencies or fraud with respect to the Company’s premium finance business;
• failure to identify and complete favorable acquisitions in the future or unexpected difficulties or developments related to the integration of recent or future acquisitions; • unexpected difficulties and losses related to FDIC-assisted acquisitions, including those resulting from our loss-sharing arrangements with the FDIC; • credit downgrades among commercial and life insurance providers that could negatively affect the value of collateral securing the Company’s premium finance loans; • any negative perception of the Company’s reputation or financial strength; • the loss of customers as a result of technological changes allowing consumers to complete their financial transactions without the use of a bank; • the ability of the Company to attract and retain senior management experienced in the banking and financial services industries; • the Company’s ability to comply with covenants under its securitization facility and credit facility; • unexpected difficulties or unanticipated developments related to the Company’s strategy of de novo bank formations and openings, which typically require over 13 months of operations before becoming profitable due to the impact of organizational and overhead expenses, the startup phase of generating deposits and the time lag typically involved in redeploying deposits into attractively priced loans and other higher yielding earning assets; • changes in accounting standards, rules and interpretations and the impact on the Company’s financial statements; • adverse effects on our operational systems resulting from failures, human error or tampering; • significant litigation involving the Company; and • the ability of the Company to receive dividends from its subsidiaries.
49
FORWARD-LOOKING STATEMENTS (cont.)
Therefore, there can be no assurances that future actual results will correspond to these forward-looking statements. The reader is cautioned not to place undue reliance on any forward-looking statement made by or on behalf of Wintrust. Any such statement speaks only as of the date the statement was made or as of such date that may be referenced within the statement. The Company undertakes no obligation to release revisions to these forward-looking statements or reflect events or circumstances after the date of this press release. Persons are advised, however, to consult further disclosures management makes on related subjects in its reports filed with the Securities and Exchange Commission and in its press releases.
50

Questions
51