 ® ® © 2007 E*TRADE FINANCIAL Corp. All rights reserved. This presentation contains confidential information and may not be disclosed without E*TRADE FINANCIAL Corporation’s written permission. August 16, 2007 (All data as of 6/30/07) Supplemental Portfolio Disclosure Exhibit 99.1 |
 2 © 2007 E*TRADE FINANCIAL Corp. All rights reserved. This presentation contains confidential information and may not be disclosed without E*TRADE FINANCIAL Corporation’s written permission. © E*TRADE FINANCIAL Corp. All rights reserved. This presentation contains certain projections or other forward- looking statements regarding future events or the future performance of the company. Various factors, including risks and uncertainties referred to in the 10Ks, 10Qs and other reports E*TRADE FINANCIAL Corporation periodically files with the SEC, could cause our actual results to differ materially from those indicated by our projections or other forward-looking statements. No statement is a guarantee of out future performance and we disclaim any duty to update any data contained herein or any forward-looking statements. Data contained herein are unaudited. This presentation also contains disclosure of non-GAAP financial measures. A reconciliation of these financial measures to the most directly comparable GAAP financial measure can be found on the investor relations site at www.etrade.com |
 3 © 2007 E*TRADE FINANCIAL Corp. All rights reserved. This presentation contains confidential information and may not be disclosed without E*TRADE FINANCIAL Corporation’s written permission. Given the recent volatility in the US residential real estate market, we have received requests for additional information on the mortgage loans and investment securities on our balance sheet as of June 30, 2007 Specifically, we have been asked to disclose FICO and LTV distributions on our first and second lien portfolios. Inquiries have also been made relating to the distribution of asset classes and bond ratings of our investment securities portfolio, and the funding sources for our balance sheet Introduction |
 4 © 2007 E*TRADE FINANCIAL Corp. All rights reserved. This presentation contains confidential information and may not be disclosed without E*TRADE FINANCIAL Corporation’s written permission. Executive Summary Our conservative approach to credit and funds management is demonstrated by the following key points First Lien Portfolio As of June 30, 2007, the portfolio had an unpaid principal balance of $15.7B and $270MM, or 1.72% in total delinquent loans $15.7B portfolio is supported by high FICO, low LTV and private mortgage insurance All loans with an 80% or higher LTV are protected by private mortgage insurance Home Equity Portfolio As of June 30, 2007, the portfolio had an unpaid principal balance of $12.4B and $279MM, or 2.25% in total delinquent loans $9.2B, or 74%, of portfolio is to borrowers with FICO of 700 and higher $6.0B, or 48%, of portfolio has CLTV of 80% or lower Investment Securities $12.7B, or 99% of mortgage-backed securities are rated AAA $1.8B, or nearly 100% of municipal, stocks, or corporate portfolio are rated AA or better $2.5B, or 81%, of the Asset-backed portfolio is rated A or higher Non-rated and below investment grade securities are $89MM, or 2.9% of portfolio |
 5 © 2007 E*TRADE FINANCIAL Corp. All rights reserved. This presentation contains confidential information and may not be disclosed without E*TRADE FINANCIAL Corporation’s written permission. Balance Sheet Funding Sources Consistent and growing base of retail customer cash Thrift charter provides access to FHLB - $10B of additional borrowing capacity $250MM of available senior secured revolving credit facility $432MM of Free Cash(1) No material changes to date with respect to wholesale funding availability, pricing or margin, including repurchase agreements Executive Summary continued |
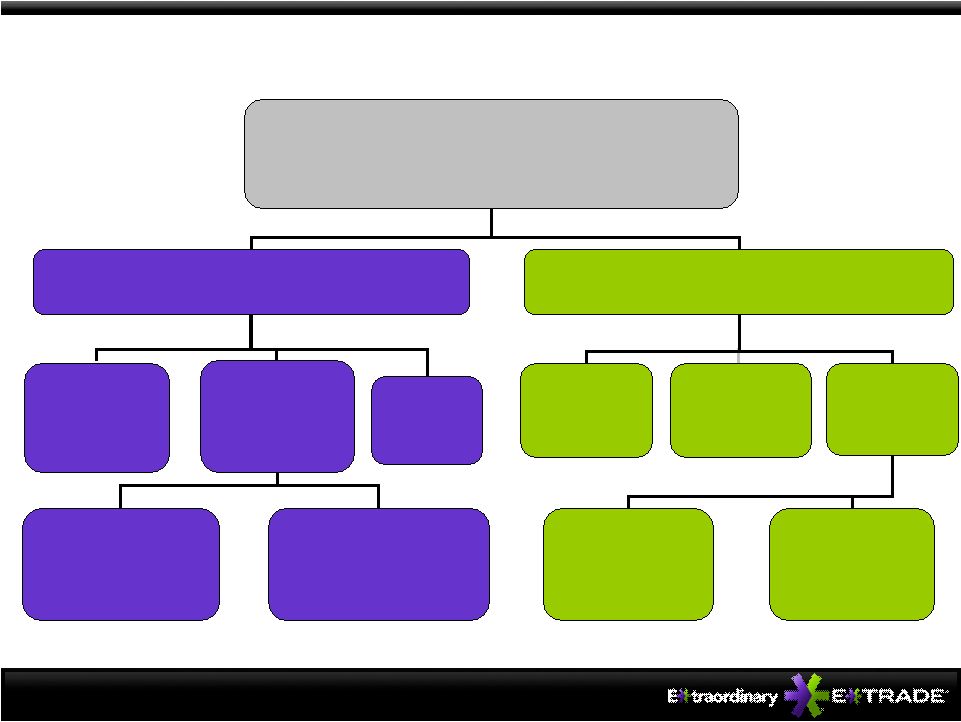 6 © 2007 E*TRADE FINANCIAL Corp. All rights reserved. This presentation contains confidential information and may not be disclosed without E*TRADE FINANCIAL Corporation’s written permission. Q2 2007 Ending Period Interest-earning Assets $58.7B Average Net Interest Spread: 271 bps Loans $38. 6B Securities $17.6B Avg. Rating: AA (92% AA-AAA) Consumer: $2.8B (Includes marine, RV) Avg. FICO: 733 Annualized Charge-offs: 85 bps Mortgage: $28.1B Avg. FICO: 735 DTI: 35 CLTV: 73 Annualized Charge-offs: 22 bps Margin: $7.4B MBS: $12.7B (Agency: Freddie, Fannie, Ginnie) 99% AAA Avg. Rating: AAA ABS: $3.0B 52% AA-AAA 97% BBB or better Avg. Rating A 1st Lien (1-4 family): $15.7B Avg. FICO: 738 DTI: 35 CLTV: 68 Annualized Charge-offs: 1bp 2nd Lien (HEIL & HELOC): $12.4B Avg. FICO: 731 DTI: 36 CLTV: 80 Annualized Charge-offs: 48bps CDO: $0.6B 50% AA-AAA Avg. Rating: A Residential Mortgage 1st & 2nd Lien: $2.3B Avg. Rating: A Corp/Muni/Pfd: $1.8B Avg. Rating: AA Interest-Earning Assets Composition NOTE: Loan balances are shown based on UPB, and securities are shown at amortized cost basis. Numbers may not add due to rounding. |
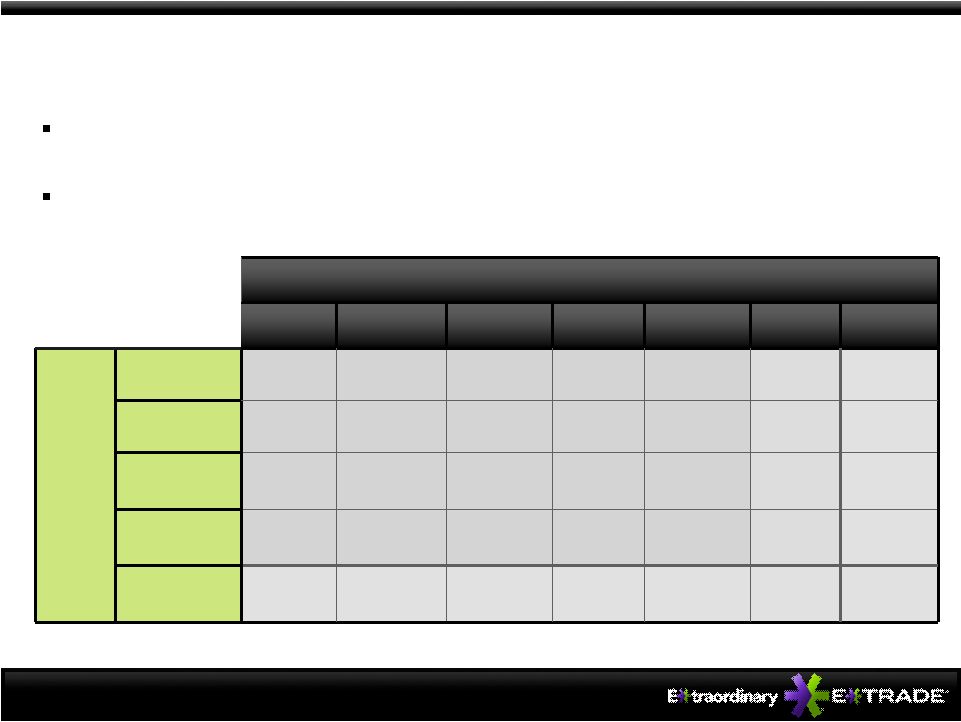 7 © 2007 E*TRADE FINANCIAL Corp. All rights reserved. This presentation contains confidential information and may not be disclosed without E*TRADE FINANCIAL Corporation’s written permission. First Lien Mortgage Loan Distribution by FICO and LTV FICO 13 0.1% 1 0.0% 0 0.0% 8 0.1% 4 0.0% <620 522 3.3% 33 0.2% 18 0.1% 281 1.8% 190 1.2% 659-620 968 6.2% 29 0.2% 30 0.2% 565 3.6% 344 2.2% 679-660 10,447 66.7% 115 0.7% 105 0.7% 5,938 37.9% 4,289 27.4% >=720 261 1.7% 41 0.3% 42 0.3% >90% 1,593 10.2% 30 0.2% 986 6.3% 536 3.4% 699-680 LTV 719-700 Total <70% 770 4.9% 6,133 39.1 70% - 80% 1,275 8.1% 9,053 57.8% 80% - 90% 37 0.2% 220 1.4% Total 2,124 13.5% 15,667 100.0% * Averages based upon 2006 engagement trends (Unpaid principal balances, $ in MM ) $15.7B portfolio is supported by high FICO, low LTV and private mortgage insurance $481MM of loans with an 80% or higher LTV are protected by private mortgage insurance |
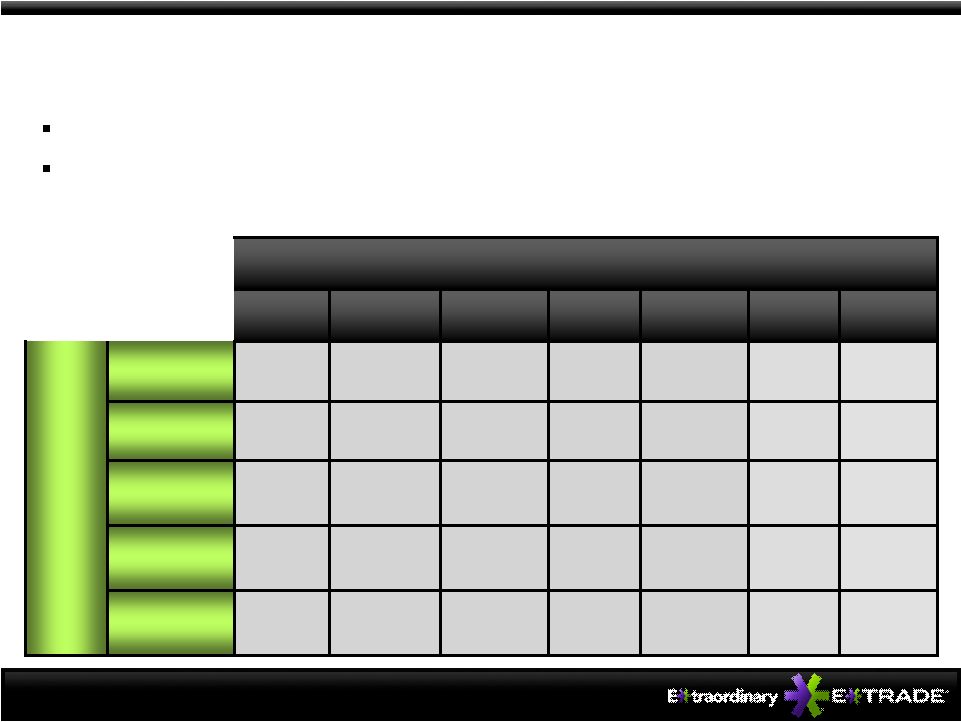 8 © 2007 E*TRADE FINANCIAL Corp. All rights reserved. This presentation contains confidential information and may not be disclosed without E*TRADE FINANCIAL Corporation’s written permission. Home Equity Loan Distribution by FICO and LTV (Unpaid principal balances, $ in MM ) $9.2B, or 74%, of portfolio to borrowers with FICO of 700 and higher $6.0B, or 48%, of portfolio with CLTV of 80% or lower FICO 20 0.1% 0 0.0% 2 0.0% 4 0.0% 14 0.1% <620 646 5.2% 137 1.1% 248 2.0% 125 1.0% 136 1.1% 659-620 834 6.8% 224 1.8% 313 2.6% 131 1.1% 166 1.3% 679-660 7,281 58.6% 1,316 10.6% 1,976 15.9% 1,258 10.1% 2,731 22.0% >=720 2,550 20.5% 399 3.2% 474 3.8% >90% 1,682 13.6% 627 5.2% 303 2.4% 353 2.8% 699-680 CLTV 719-700 Total <70% 446 3.6% 3,846 30.9% 70% - 80% 353 2.8% 2,174 17.4% 80% - 90% 677 5.5% 3,843 31.2% Total 1,950 15.7% 12,413 100.0% |
 9 © 2007 E*TRADE FINANCIAL Corp. All rights reserved. This presentation contains confidential information and may not be disclosed without E*TRADE FINANCIAL Corporation’s written permission. We look first to the credit quality of a borrower, as indicated by FICO and similar measures, for repayment of a loan. Should a loan become delinquent, realized future losses will be dependent on a number of factors including, but not limited to, cure rates (2) , local real estate dynamics and resulting current loan to value (LTV) The traditional method, as shown on previous pages, categorizes the entire loan balance at the highest dollar loan-to-value The Principal at Risk (PAR) method is an internal approach that we believe more appropriately depicts the unpaid principal balance by tranching it against the supporting collateral value at time of origination The following example demonstrates how a $45,000 home equity loan classified under the traditional method at a 95% CLTV can be tranched to several PAR LTV thresholds under the PAR method Principal at Risk (PAR) Method vs. Traditional Method |
 10 © 2007 E*TRADE FINANCIAL Corp. All rights reserved. This presentation contains confidential information and may not be disclosed without E*TRADE FINANCIAL Corporation’s written permission. Loan Distribution Principal at Risk (PAR) Method Example >90% LTV 80%-90% LTV 70%-80% LTV <70% LTV FICO ($ in thousands) $45 $0 $0 $0 720 Traditional Method $5 $10 $10 $20 720 PAR Method $50K First Lien $45K Second Lien $100K Borrower Equity 50K 60K 70K 80K 90K 95K Value of Property at Origination |
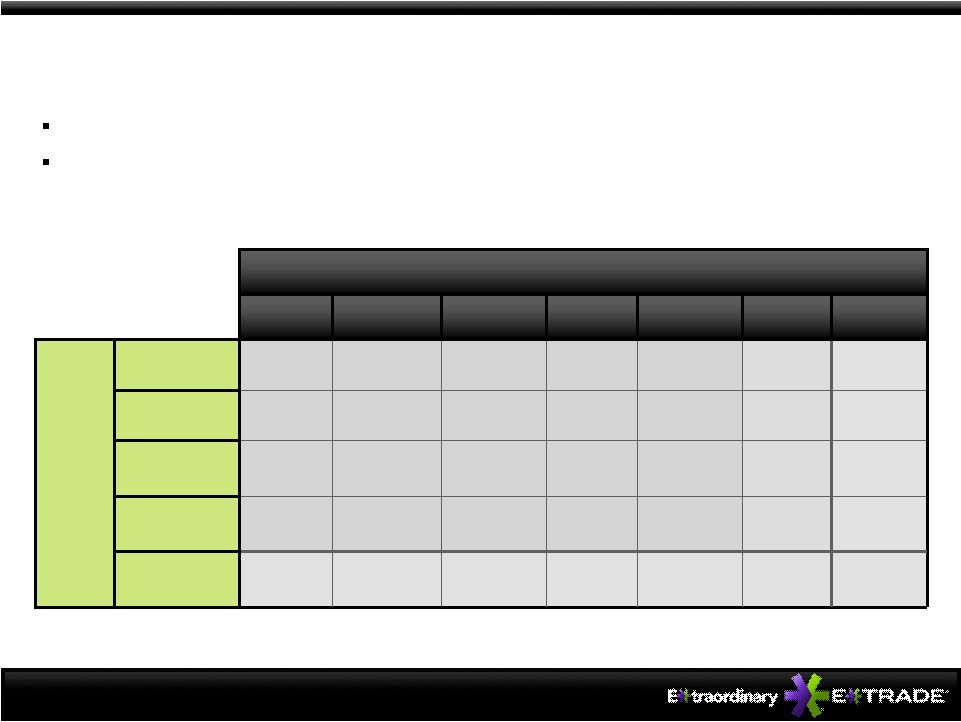 11 © 2007 E*TRADE FINANCIAL Corp. All rights reserved. This presentation contains confidential information and may not be disclosed without E*TRADE FINANCIAL Corporation’s written permission. First Lien Loan Distribution – PAR Method FICO 13 0.1% 0 0.0% 1 0.0% 1 0.0% 11 0.1% <620 522 3.3% 3 0.0% 5 0.0% 34 0.2% 480 3.1% 659-620 968 6.2% 2 0.0% 5 0.0% 65 0.4% 896 5.7% 679-660 10,447 66.7% 9 0.1% 21 0.1% 632 4.0% 9,785 62.5% >=720 22 0.1% 4 0.0% 4 0.0% >90% 1,593 10.2% 7 0.0% 109 0.7% 1,473 9.4% 699-680 PAR LTV 719-700 Total <70% 1,973 12.6% 14,618 93.3% 70% - 80% 140 0.9% 981 6.3% 80% - 90% 7 0.0% 46 0.3% Total 2,124 13.5% 15,667 100.0% (Unpaid principal balances, $ in MM ) $15.7B portfolio is well supported by high FICO, low LTV, and private mortgage insurance $68MM of exposure greater than 80% of property value is protected by private mortgage insurance (Note that a total of $481MM of loans with an 80% or higher LTV under the traditional method are protected by private mortgage insurance) |
 12 © 2007 E*TRADE FINANCIAL Corp. All rights reserved. This presentation contains confidential information and may not be disclosed without E*TRADE FINANCIAL Corporation’s written permission. Home Equity Loan Distribution – PAR Method * Averages based upon 2006 engagement trends (Unpaid principal balances, $ in MM ) • $8.5B, or 68%, of portfolio has a CLTV of 80% or below • Of the $3.9B in loans with CLTV above 80%, $2.7B is to borrowers with FICO of 700 or higher FICO 20 0.1% 0 0.0% 1 0.0% 1 0.0% 18 0.1% <620 646 5.2% 52 0.4% 203 1.6% 133 1.1% 258 2.1% 659-620 834 6.8% 86 0.7% 272 2.2% 158 1.3% 318 2.6% 679-660 7,281 58.6% 474 3.8% 1,530 12.3% 1,180 9.5% 4,097 33.0% >=720 930 7.5% 145 1.2% 173 1.4% >90% 1,682 13.6% 483 3.9% 359 2.9% 695 5.6% 699-680 PAR CLTV 719-700 Total <70% 854 6.8% 6,240 50.2% 70% - 80% 407 3.3% 2,238 18.1% 80% - 90% 516 4.2% 3,005 24.2% Total 1,950 15.7% 12,413 100.0% |
 13 © 2007 E*TRADE FINANCIAL Corp. All rights reserved. This presentation contains confidential information and may not be disclosed without E*TRADE FINANCIAL Corporation’s written permission. First Lien Delinquent Loan Distribution – PAR Method (Includes non-performing loans and special mention loans) FICO 1 0.4% 0* 0.0% 0* 0.0% 0 0.0% 1 0.4% <620 34 12.6% 1* 0.4% 0* 0.0% 3 1.1% 30 11.2% 659-620 46 17.0% 0* 0.0% 1* 0.4% 3 1.1% 42 15.5% 679-660 104 38.5% 0* 0.0% 1* 0.4% 8 3.0% 95 35.1% >=720 1* 0.4% 0* 0.0% 0* 0.0% >90% 48 17.8% 0* 0.0% 4 1.5% 44 16.3% 699-680 PAR LTV 719-700 Total <70% 33 12.2% 245 90.7% 70% - 80% 3 1.1% 21 7.8% 80% - 90% 1* 0.4% 3* 1.1% Total 37 13.7% 270 100.0% * Averages based upon 2006 engagement trends (Unpaid principal balances, $ in MM ) * Balances in excess of 80% LTV are covered by Private Mortgage Insurance 98.5% of delinquent balances are mitigated by PAR LTV of 80% or lower |
 14 © 2007 E*TRADE FINANCIAL Corp. All rights reserved. This presentation contains confidential information and may not be disclosed without E*TRADE FINANCIAL Corporation’s written permission. Home Equity Delinquent Loan Distribution – PAR Method (Includes non-performing loans and special mention loans) * Averages based upon 2006 engagement trends (Unpaid principal balances, $ in MM ) $160MM, or 57%, of delinquent balances have a PAR CLTV of over 80% $135MM, or 48%, of delinquent balances have a FICO of 700 or greater FICO 1 0.4% 0 0.0% 0 0.0% 0 0.0% 1 0.4% <620 47 16.9% 5 1.8% 18 6.5% 11 3.9% 13 4.7% 659-620 43 15.4% 7 2.5% 19 6.8% 8 2.9% 9 3.2% 679-660 83 29.6% 16 5.7% 33 11.7% 14 5.0% 20 7.2% >=720 47 16.8% 9 3.2% 10 3.6% >90% 53 19.0% 21 7.5% 10 3.6% 13 4.7% 699-680 PAR CLTV 719-700 Total <70% 10 3.6% 66 23.8% 70% - 80% 10 3.6% 53 19.0% 80% - 90% 22 7.9% 113 40.4% Total 52 18.7% 279 100.0% |
 15 © 2007 E*TRADE FINANCIAL Corp. All rights reserved. This presentation contains confidential information and may not be disclosed without E*TRADE FINANCIAL Corporation’s written permission. Loan Risk Mitigation Discipline Geographic diversification with no single MSA greater than 10% of mortgage loan portfolio Low leveraged borrowers with average debt-to-income ratio of 35 across mortgage portfolio No option or negative amortization ARMs Top Sellers/Originators of mortgage loan portfolio with 74% of $28.1B in unpaid principal balance from: Bank of America JPMorgan Countrywide Morgan Stanley E-Loan National City E*TRADE (3) UBS GMAC Wells Fargo |
 16 © 2007 E*TRADE FINANCIAL Corp. All rights reserved. This presentation contains confidential information and may not be disclosed without E*TRADE FINANCIAL Corporation’s written permission. Risk Mitigation Strategy Growth sources – Portfolio growth, if any, will be driven by prime and super-prime first lien mortgage loans Mix shift - Allow home equity and consumer loan portfolios to decline with pay-offs/prepayments Credit line management – Evaluate revolving credit borrowers, reducing available lines based on leading indicators Loan modifications – Provide rate and term modifications to qualified borrowers |
 17 © 2007 E*TRADE FINANCIAL Corp. All rights reserved. This presentation contains confidential information and may not be disclosed without E*TRADE FINANCIAL Corporation’s written permission. Mortgage-Backed Securities Breakdown - - - Below Inv. Grade 1,585 12.0% 0 0.0% - 1 0.0% 1,584 12.0% Private Label CMO 12,749 100.0% 0 0.0% - 1 0.0% 12,748 100.0% Grand Total 11,164 88.0% Grand Total - Non- Rated 11,164 88.0% AA or Higher - BBB A Agency MBS/CMO - ($ in thousands, based on book value ) $12.7B or 99%, of portfolio is rated AAA. |
 18 © 2007 E*TRADE FINANCIAL Corp. All rights reserved. This presentation contains confidential information and may not be disclosed without E*TRADE FINANCIAL Corporation’s written permission. Municipals, Stock and Corporate Breakdown 126 7.1% - - - 15 0.8% 111 6.2% Corporate Bonds ($78mm FNMA Note) 1,784 100.0% - - - 15 0.8% 1,769 99.2% Grand Total 348 19.5% 473 26.5% 837 46.9% Grand Total - - - Non- Rated - - - Below Inv. Grade 348 19.5% 473 26.5% 837 46.9% AA or Higher - - - BBB A Municipal Bonds - Agency Preferred Stock (FNM, FRE) - FHLB Stock - ($ in millions, based on book value ) 60.7% of portfolio is rated AAA 99.2% of portfolio is rated AA or higher |
 19 © 2007 E*TRADE FINANCIAL Corp. All rights reserved. This presentation contains confidential information and may not be disclosed without E*TRADE FINANCIAL Corporation’s written permission. Asset-backed Securities Breakdown 51 1.6% 12 0.4% 4 0.1% 12 0.4% 16 0.5% 7 0.2% Other 100 3.2% - 9 0.3% 55 1.8% 33 1.1% 2 0.1% Sub-prime Residential First Lien Mortgage 3,103 100.0% 182 5.8% 214 6.9% 453 14.6% 2,105 67.8% Grand Total 65 2.1% - 23 0.8% 30 1.0% - Non- Rated 24 0.8% 9 0.3% - 1 0.0% - Below Inv. Grade 1,634 52.6% 74 2.4% 82 2.6% 225 7.2% 1,243 40.1% AA or Higher 51 1.6% 47 1.5% Second Liens 499 16.1% 41 1.3% 47 1.5% 293 9.4% BBB A Prime Residential First Lien Mortgage 568 18.3% ABS CDO 150 4.8% Commercial Real Estate & Trust Pfd CDO 67 2.2% Grand Total 881 28.4% ($ in thousands, based on book value ) $2.5B, or 81%, of portfolio is rated A or higher Non-rated and below investment grade securities are $89MM, or 2.9% of portfolio Note: Includes $82MM of securities classified as Trading Securities |
 20 © 2007 E*TRADE FINANCIAL Corp. All rights reserved. This presentation contains confidential information and may not be disclosed without E*TRADE FINANCIAL Corporation’s written permission. Balance Sheet Funding Sources Retail Deposits and Customer Payables 61% of interest-bearing liabilities $34B – 84% from customers who also hold an investing account Average Quarterly Growth in Total Customer Cash and Deposits = $1.6B (4) Wholesale Borrowings 39% of interest-bearing liabilities Thrift charter provides access to FHLB Currently $7B of Advances – additional $10B of excess borrowing capacity $12B in repurchase agreements Primarily AAA FNMA and GNMA backed transactions Diversified maturities with a strong group of over 20 counterparties Not dependent on warehouse lines Access to the Federal Reserve Discount Window No material changes to date with respect to wholesale funding availability, pricing or margin, including repurchase agreements Corporate Liquidity $250MM undrawn committed senior secured revolving credit facility $432MM in free cash |
 21 © 2007 E*TRADE FINANCIAL Corp. All rights reserved. This presentation contains confidential information and may not be disclosed without E*TRADE FINANCIAL Corporation’s written permission. Endnotes and Glossary of Terms Endnotes: (1) Free cash represents cash held at the Company and its non-Bank and non-Brokerage subsidiaries, less discretionary reserves, plus excess capital at Bank and Brokerage after application of regulatory capital requirements and the Company’s own regulatory capital guidelines (2) Cure rates represent the rate of currently delinquent balances that return to performing status and/or fully pay off (3) Includes direct and wholesale originated loans (4) Average organic quarterly total cash and deposit growth since 12/31/2005 Terms: ARM – Adjustable Rate Mortgage CDO – Collateralized Debt Obligation CLTV – Combined Loan-to-Value DTI – Debt-to-income FHLB – Federal Home Loan Bank HELOC – Home Equity Line of Credit HEIL – Home Equity Installment Loan LTV – Loan-to-Value PMI – Private Mortgage Insurance |
 © 2007 E*TRADE FINANCIAL Corp. All rights reserved. This presentation contains confidential information and may not be disclosed without E*TRADE FINANCIAL Corporation’s written permission. ® % |