UNITED STATES
SECURITIES AND EXCHANGE COMMISSION
Washington, D.C. 20549
FORM 10-Q
(Mark One)
| x | | QUARTERLY REPORT PURSUANT TO SECTION 13 OR 15(d) OF THE SECURITIES EXCHANGE ACT OF 1934 |
For the Quarterly Period Ended September 30, 2007
or
| ¨ | | TRANSITION REPORT PURSUANT TO SECTION 13 OR 15(d) OF THE SECURITIES EXCHANGE ACT OF 1934 |
Commission File Number 1-11921
E*TRADE Financial Corporation
(Exact Name of Registrant as Specified in its Charter)
| | |
| Delaware | | 94-2844166 |
(State or Other Jurisdiction of Incorporation or Organization) | | (I.R.S. Employer Identification Number) |
135 East 57th Street, New York, New York 10022
(Address of Principal Executive Offices and Zip Code)
(646) 521-4300
(Registrant’s Telephone Number, including Area Code)
Indicate by check mark whether the registrant (1) has filed all reports required to be filed by Section 13 or 15(d) of the Securities Exchange Act of 1934 during the preceding 12 months (or for such shorter period that the registrant was required to file such reports) and (2) has been subject to such filing requirements for the past 90 days. Yes x No ¨
Indicate by check mark whether the registrant is a large accelerated filer, an accelerated filer, or a non-accelerated filer. See definition of “accelerated filer and large accelerated filer” in Rule 12b-2 of the Exchange Act.
Large accelerated filer xAccelerated filer ¨Non-accelerated filer ¨
Indicate by check mark whether the registrant is a shell company (as defined in Rule 12b-2 of the Exchange Act). Yes ¨ No x
Indicate the number of shares outstanding of each of the issuer’s classes of common stock, as of the latest practicable date:
As of November 5, 2007, there were 423,754,324 shares of common stock outstanding.
E*TRADE FINANCIAL CORPORATION
FORM 10-Q QUARTERLY REPORT
For the Quarter Ended September 30, 2007
TABLE OF CONTENTS
Unless otherwise indicated, references to “the Company,” “We,” “Us,” “Our” and “E*TRADE” mean E*TRADE Financial Corporation or its subsidiaries.
E*TRADE, E*TRADE Financial, E*TRADE Bank (“Bank”), ClearStation, Equity Edge, Equity Resource, OptionsLink and the Converging Arrows logo are registered trademarks of E*TRADE Financial Corporation in the United States and in other countries.
2
ITEM 1. CONSOLIDATED FINANCIAL STATEMENTS (UNAUDITED)
This information is set forth immediately following Item 3, “Quantitative and Qualitative Disclosures about Market Risk.”
ITEM 2. MANAGEMENT’S DISCUSSION AND ANALYSIS OF FINANCIAL CONDITION AND RESULTS OF OPERATIONS
The following discussion should be read in conjunction with the consolidated financial statements and the related notes that appear elsewhere in this document.
FORWARD-LOOKING STATEMENTS
This report contains forward-looking statements involving risks and uncertainties. These statements relate to our future plans, objectives, expectations and intentions. These statements may be identified by the use of words such as “expect,” “may,” “anticipate,” “intend,” “plan” and similar expressions. Our actual results could differ materially from those discussed in these forward-looking statements, and we caution that we do not undertake to update these statements. Factors that could contribute to our actual results differing from any forward-looking statements include those discussed under “Risk Factors,” “Management’s Discussion and Analysis of Financial Condition and Results of Operations” and elsewhere in this report. The cautionary statements made in this report should be read as being applicable to all forward-looking statements wherever they appear in this report. Important factors that may cause actual results to differ materially from any forward-looking statements are set forth in our 2006 Form 10-K filed with the Securities and Exchange Commission (“SEC”) under the heading “Risk Factors.”
We further caution that there may be risks associated with owning our securities other than those discussed in such filings.
GLOSSARY OF TERMS
In analyzing and discussing our business, we utilize certain metrics, ratios and other terms that are defined in the “Glossary of Terms,” which is located at the end of Item 2, “Management’s Discussion and Analysis of Financial Condition and Results of Operations.”
OVERVIEW
Strategy
Our strategy centers on strengthening and growing our retail business and leveraging that growth in our institutional business. We strive to further develop our retail business by acquiring, retaining and expanding our relationships with global retail customers. We offer our retail and institutional customers a suite of trading, investing, banking and lending products. We plan to grow these relationships organically by using technology to deliver an attractive combination of product, service and price to the value-driven mass affluent customer. We also intend to grow, where appropriate, through targeted acquisitions which leverage our existing business platform and through further expansion into certain international markets.
On September 17, 2007, we announced a plan to further align our balance sheet and business operations with our retail growth opportunity. This strategy includes accelerating plans to shift the composition of the balance sheet toward retail assets and liabilities, largely one- to four-family originated mortgage loans and customer cash, and away from institutional assets and liabilities, mainly securities, purchased mortgage loans and wholesale borrowings. In addition, we announced plans to simplify and streamline the business by exiting and/or restructuring certain non-core operations. In lending, we are exiting our wholesale mortgage origination channel, and repositioning the lending business to focus on direct retail originations. In institutional, we are taking steps to restructure the institutional equity business to allow us to focus on areas that complement order flow generated by our retail customers. We believe these changes in strategy better align our business with our core asset, the retail customer.
3
Key Factors Affecting Financial Performance
Our financial performance is affected by a number of factors outside of our control, including:
| | • | | customer demand for financial products and services; |
| | • | | competitors’ pricing on financial products and services; |
| | • | | the weakness or strength of the residential real estate and credit markets; |
| | • | | market demand and liquidity in the mortgage- and asset-backed securities markets; |
| | • | | the impact of rating agency actions on asset-backed securities; |
| | • | | interest rates and the shape of the interest rate yield curve; and |
| | • | | the performance, volume and volatility of the equity and capital markets. |
In addition to the items noted above, our success in the future will depend upon, among other things:
| | • | | continuing our success in the acquisition, growth and retention of customers; |
| | • | | deepening customer acceptance of our trading, investing, banking and lending products; |
| | • | | our ability to assess and manage credit risk; |
| | • | | disciplined expense control and improved operational efficiency; and |
| | • | | transition of the balance sheet toward retail-driven assets and liabilities. |
Management monitors a number of metrics in evaluating the Company’s performance. The most significant of these are shown in the table and discussed in the text below:
| | | | | | | | | | | | | | | | | | | | | | |
| | | As of or For the Three Months Ended September 30, | | | | | | As of or For the Nine Months Ended September 30, | | | | |
| | | Variance | | | | Variance | |
| | | 2007 | | | 2006 | | | 2007 vs.
2006 | | | 2007 | | | 2006 | | | 2007 vs.
2006 | |
Customer Activity Metrics: | | | | | | | | | | | | | | | | | | | | | | |
Retail client assets (dollars in billions) | | $ | 218.0 | | | $ | 184.8 | | | 18 | % | | $ | 218.0 | | | $ | 184.8 | | | 18 | % |
Customer cash and deposits (dollars in billions) | | $ | 39.6 | | | $ | 31.6 | | | 25 | % | | $ | 39.6 | | | $ | 31.6 | | | 25 | % |
U.S. daily average revenue trades | | | 161,459 | | | | 116,459 | | | 39 | % | | | 148,139 | | | | 139,382 | | | 6 | % |
International daily average revenue trades | | | 32,926 | | | | 18,671 | | | 76 | % | | | 29,748 | | | | 21,207 | | | 40 | % |
| | | | | | | | | | | | | | | | | | | | | | |
Total daily average revenue trades | | | 194,385 | | | | 135,130 | | | 44 | % | | | 177,887 | | | | 160,589 | | | 11 | % |
Average commission per trade | | $ | 11.71 | | | $ | 11.95 | | | (2) | % | | $ | 11.87 | | | $ | 12.10 | | | (2) | % |
| | | | | | |
Company Financial Metrics: | | | | | | | | | | | | | | | | | | | | | | |
Net revenue growth(1) | | | (45) | % | | | 39 | % | | (84) | % | | | (9) | % | | | 46 | % | | (55) | % |
Enterprise net interest spread (basis points) | | | 265 | | | | 286 | | | (7) | % | | | 269 | | | | 288 | | | (7) | % |
Enterprise interest-earning assets (average in billions) | | $ | 60.0 | | | $ | 46.4 | | | 29 | % | | $ | 56.9 | | | $ | 44.0 | | | 29 | % |
Non-performing loans as a % of gross loans receivable | | | 0.84 | % | | | 0.24 | % | | 0.60 | % | | | 0.84 | % | | | 0.24 | % | | 0.60 | % |
Operating margin (%) | | | (18) | % | | | 38 | % | | (56) | % | | | 29 | % | | | 41 | % | | (12) | % |
Compensation and benefits as a % of revenue | | | 37 | % | | | 19 | % | | 18 | % | | | 22 | % | | | 20 | % | | 2 | % |
(1) | | Net revenue growth is the difference between the current and prior comparable period total net revenue divided by the prior comparable period total net revenue. |
4
Customer Activity Metrics
| | • | | Retail client assets are an indicator of the value of our relationship with the customer. An increase in retail client assets generally indicates that the use of our products and services by existing and new customers is expanding. Changes in this metric are also driven by changes in the valuations of our customers’ underlying securities. |
| | • | | Customer cash and deposits are an indicator of a deepening engagement with our customers and are a key driver of net operating interest income. |
| | • | | Daily average revenue trades (“DARTs”) are the predominant driver of commission revenue from our retail customers. |
| | • | | Average commission per trade is an indicator of changes in our customer mix, product mix and/or product pricing. As a result, this metric is impacted by both the mix between our retail domestic and international businesses and the mix between active traders, mass affluent and main street customers. |
Company Financial Metrics
| | • | | Net revenue growth is an indicator of our overall financial well-being and our ability to execute on our strategy. When coupled with operating margin, the two provide information about the general success of our business. The negative revenue growth during the period was due to lower revenue in our institutional segment, due to increased provision for loan losses and write downs in our asset-backed securities portfolio. The revenue growth in our retail segment, which we believe is the primary indicator of the success of our strategy, was 21% and 9% for the three and nine months ended September 30, 2007, respectively. |
| | • | | Enterprise net interest spread is a broad indicator of our ability to generate net operating interest income. |
| | • | | Enterprise interest-earning assets, in conjunction with our enterprise net interest spread, are indicators of our ability to generate net operating interest income. |
| | • | | Total nonperforming loans receivable as a percentage of gross loans receivable is an indicator of the performance of our total loan portfolio. |
| | • | | Operating margin is an indicator of the profitability of our operations. The negative operating margin during the period was due to a significant loss in our institutional segment, which was driven by an increase in our provision for loan losses and write downs in our asset-backed securities portfolio. The operating margin in our retail segment was 47% and 44% for the three and nine months ended September 30, 2007, respectively. |
| | • | | Compensation and benefits as a percentage of revenue is an indicator of our productivity. This ratio coupled with operating margin is an indicator of our efficiency. The increase in this metric during the period was driven primarily by the reduction in institutional revenue noted above, not by a reduction in our overall productivity. |
Significant Events in the Third Quarter of 2007
Announced a Plan to Better Align Balance Sheet and Operations with Retail Growth Opportunity
We announced a plan to further align our balance sheet and business operations with our retail growth opportunity. The new strategy will shift the balance sheet toward retail assets and liabilities and includes exiting certain non-core operations. We believe these changes in strategy better align our business with our core asset, the retail customer.
5
Ranked #1 Premium Broker bySmartMoney Magazine
SmartMoney Magazine recognized the Company as the #1 “premium broker” in its 2007 broker survey.SmartMoney noted the Company for its improved service, new global trading capabilities, intuitive trade tools and easy search capabilities and numerous banking products.
International Expansion
We continued our expansion into international markets with the launch of operations in Singapore. Singapore offers investors direct access to the U.S. stock markets through the E*TRADE retail trading platform.
Summary Financial Results
Income Statement Highlights for the Three and Nine Months Ended September 30, 2007 (dollars in millions, except per share amounts)
| | | | | | | | | | | | | | | | | | | | | | |
| | | Three Months
Ended September 30, | | | | | | Nine Months Ended September 30, | | | | |
| | | Variance | | | | Variance | |
| | | 2007 | | | 2006 | | | 2007 vs. 2006 | | | 2007 | | | 2006 | | | 2007 vs. 2006 | |
Total net revenue | | $ | 321.2 | | | $ | 581.8 | | | (45 | )% | | $ | 1,629.8 | | | $ | 1,791.5 | | | (9 | )% |
Net operating interest income | | $ | 418.0 | | | $ | 355.1 | | | 18 | % | | $ | 1,222.8 | | | $ | 1,024.5 | | | 19 | % |
Provision for loan losses | | $ | (186.5 | ) | | $ | (12.5 | ) | | 1387 | % | | $ | (237.8 | ) | | $ | (33.0 | ) | | 620 | % |
Net operating interest income after provision for loan losses | | $ | 231.5 | | | $ | 342.6 | | | (32 | )% | | $ | 985.0 | | | $ | 991.5 | | | (1 | )% |
Commission revenue | | $ | 188.4 | | | $ | 133.6 | | | 41 | % | | $ | 517.2 | | | $ | 476.8 | | | 8 | % |
Fees and service charges revenue | | $ | 64.8 | | | $ | 58.3 | | | 11 | % | | $ | 189.7 | | | $ | 174.0 | | | 9 | % |
Operating margin | | $ | (59.4 | ) | | $ | 223.2 | | | (127 | )% | | $ | 472.6 | | | $ | 727.7 | | | (35 | )% |
Net income (loss) | | $ | (58.4 | ) | | $ | 153.2 | | | (138 | )% | | $ | 270.1 | | | $ | 452.2 | | | (40 | )% |
Diluted net earnings (loss) per share | | $ | (0.14 | ) | | $ | 0.35 | | | (140 | )% | | $ | 0.62 | | | $ | 1.03 | | | (40 | )% |
Operating margin (%) | | | (18 | )% | | | 38 | % | | (56 | )% | | | 29 | % | | | 41 | % | | (12 | )% |
The operating environment during the third quarter of 2007 was extremely challenging. Losses caused by instability in the residential real estate and credit markets more than offset the considerable growth in our retail segment. Total net revenue for the three months ended September 30, 2007 decreased 45% compared to the same period in the prior year due primarily to an increase to our provision for loan losses of $174.0 million and write downs in our asset-backed securities portfolio of $197.6 million. Net income (loss) declined by 138% from the same quarter in the prior year to a loss of $58.4 million for the third quarter of 2007.
The retail segment delivered strong organic growth and overall results during third quarter of 2007. Total retail segment income increased 55% to $224.2 million for the three months ended September 30, 2007 compared to the same period in the prior year. This growth was primarily driven by an increase in DARTs and customer cash and deposits, which both increased significantly compared to the same periods in the prior year. DARTs increased 44% to 194,385 and customer cash and deposits ended the period at $39.6 billion, up 25% from the prior year.
6
Balance Sheet Highlights (dollars in billions)
| | | | | | | | | | | |
| | | September 30, 2007 | | | December 31, 2006 | | | Variance | |
| | | | | 2007 vs. 2006 | |
Total assets | | $ | 64.2 | | | $ | 53.7 | | | 19 | % |
Total enterprise interest-earning assets | | $ | 59.9 | | | $ | 49.5 | | | 21 | % |
Loans, net and margin receivables as a percentage of enterprise interest-earning assets(1) | | | 67 | % | | | 68 | % | | (1 | )% |
Retail deposits and customer payables as a percentage of enterprise interest-bearing liabilities(1) | | | 62 | % | | | 64 | % | | (2 | )% |
(1) | | Loans, net and margin receivables as a percentage of enterprise interest-earning assets and retail deposits and customer payables as a percentage of enterprise interest-bearing liabilities include balances not recorded on the balance sheet, such as margin and customer cash and deposits held by third parties. |
The increase in total assets was attributable primarily to an increase of $6.0 billion in loans receivable, net. The increase in loans receivable, net was due principally to growth in our one- to four-family loan portfolio during the first and second quarters of 2007. We plan to hold total assets at current levels or slightly lower, for the foreseeable future. Our eventual goal is to increase the asset and liability ratios in the table above to approximately 80% to 85%. On the asset side, we plan to increase our one- to four-family real estate loans and margin loans, while allowing our home equity loan and securities portfolios to decline. On the liability side, we plan to increase customer cash and deposits, while allowing wholesale borrowings to decline. We believe this transition to a more retail focused balance sheet will better align our business with our core asset, the retail customer.
EARNINGS OVERVIEW
Net income (loss) decreased 138% to a loss of $58.4 million and 40% to income of $270.1 million for the three and nine months ended September 30, 2007, respectively, compared to the same periods in 2006. The loss for the three months ended September 30, 2007 was due principally to an increase in our provision for loan losses to $186.5 million and write downs of $197.6 million in our asset-backed securities portfolio. These losses in our institutional segment more than offset the increase in net income in our retail segment of $79.2 million to $224.2 million and $87.9 million to $599.8 million for the three and nine months ended September 30, 2007, respectively.
We report corporate interest income and corporate interest expense separately from operating interest income and operating interest expense. We believe reporting these two items separately provides a clearer picture of the financial performance of our operations than would a presentation that combined these two items. Our operating interest income and operating interest expense is generated from the operations of the Company and is a broad indicator of our success in our banking, lending and balance sheet management businesses. Our corporate debt, which is the primary source of our corporate interest expense, has been used primarily to finance acquisitions, such as Harrisdirect and BrownCo, and generally has not been downstreamed to any of our operating subsidiaries.
Similarly, we report gain (loss) on sales of investments, net separately from gain (loss) on loans and securities, net. We believe reporting these two items separately provides a clearer picture of the financial performance of our operations than would a presentation that combined these two items. Gain (loss) on loans and securities, net are the result of activities in our operations, namely our lending and balance sheet management businesses, including impairment on our available-for sale mortgage-backed and investment securities portfolio. Gain (loss) on sales of investments, net relates to historical equity investments of the Company at the corporate level and are not related to the ongoing business of our operating subsidiaries.
7
The following sections describe in detail the changes in key operating factors and other changes and events that have affected our consolidated net revenue, expense excluding interest, other income (expense) and income tax expense (benefit).
Revenue
The components of net revenue and the resulting variances are as follows (dollars in thousands):
| | | | | | | | | | | | | | | | | | | | | | | | | | | | | | |
| | | Three Months Ended September 30, | | | Variance | | | Nine Months Ended September 30, | | | Variance | |
| | | 2007 vs. 2006 | | | | 2007 vs. 2006 | |
| | | 2007 | | | 2006 | | | Amount | | | % | | | 2007 | | | 2006 | | | Amount | | | % | |
Revenue: | | | | | | | | | | | | | | | | | | | | | | | | | | | | | | |
Operating interest income | | $ | 951,836 | | | $ | 731,429 | | | $ | 220,407 | | | 30 | % | | $ | 2,687,403 | | | $ | 1,986,096 | | | $ | 701,307 | | | 35 | % |
Operating interest expense | | | (533,804 | ) | | | (376,293 | ) | | | (157,511 | ) | | 42 | % | | | (1,464,621 | ) | | | (961,569 | ) | | | (503,052 | ) | | 52 | % |
| | | | | | | | | | | | | | | | | | | | | | | | | | | | | | |
Net operating interest income | | | 418,032 | | | | 355,136 | | | | 62,896 | | | 18 | % | | | 1,222,782 | | | | 1,024,527 | | | | 198,255 | | | 19 | % |
Provision for loan losses | | | (186,536 | ) | | | (12,547 | ) | | | (173,989 | ) | | 1387 | % | | | (237,767 | ) | | | (33,014 | ) | | | (204,753 | ) | | 620 | % |
| | | | | | | | | | | | | | | | | | | | | | | | | | | | | | |
Net operating interest income after provision for loan losses | | | 231,496 | | | | 342,589 | | | | (111,093 | ) | | (32 | )% | | | 985,015 | | | | 991,513 | | | | (6,498 | ) | | (1 | )% |
| | | | | | | | | | | | | | | | | | | | | | | | | | | | | | |
Commission | | | 188,403 | | | | 133,606 | | | | 54,797 | | | 41 | % | | | 517,164 | | | | 476,771 | | | | 40,393 | | | 8 | % |
Fees and service charges | | | 64,802 | | | | 58,330 | | | | 6,472 | | | 11 | % | | | 189,746 | | | | 174,001 | | | | 15,745 | | | 9 | % |
Principal transactions | | | 20,889 | | | | 22,697 | | | | (1,808 | ) | | (8 | )% | | | 78,739 | | | | 84,979 | | | | (6,240 | ) | | (7 | )% |
Gain (loss) on loans and securities, net | | | (197,057 | ) | | | 16,003 | | | | (213,060 | ) | | * | | | | (174,354 | ) | | | 38,738 | | | | (213,092 | ) | | * | |
Other revenue | | | 12,699 | | | | 8,541 | | | | 4,158 | | | 49 | % | | | 33,469 | | | | 25,471 | | | | 7,998 | | | 31 | % |
| | | | | | | | | | | | | | | | | | | | | | | | | | | | | | |
Total non-interest income | | | 89,736 | | | | 239,177 | | | | (149,441 | ) | | (62 | )% | | | 644,764 | | | | 799,960 | | | | (155,196 | ) | | (19 | )% |
| | | | | | | | | | | | | | | | | | | | | | | | | | | | | | |
Total net revenue | | $ | 321,232 | | | $ | 581,766 | | | $ | (260,534 | ) | | (45 | )% | | $ | 1,629,779 | | | $ | 1,791,473 | | | $ | (161,694 | ) | | (9 | )% |
| | | | | | | | | | | | | | | | | | | | | | | | | | | | | | |
| * | | Percentage not meaningful |
Total net revenue declined by 45% and 9% to $321.2 million and $1.6 billion for the three and nine months ended September 30, 2007, respectively when compared to the same periods in 2006. This decline was driven by an increase in the provision for loan losses of $174.0 million and $204.8 million for the three and nine months ended September 30, 2007, respectively, as well as write downs in our asset-backed securities portfolio of $197.6 million and $185.5 million for the three and nine months ended September 30, 2007, respectively.
Net Operating Interest Income
Net operating interest income increased 18% to $418.0 million and 19% to $1.2 billion for the three and nine months ended September 30, 2007, respectively, compared to the same periods in 2006. Net operating interest income is earned primarily through holding credit balances, which includes margin, real estate and consumer loans, and by holding customer cash and deposits, which are a low cost source of funding. The increase in net operating interest income was due primarily to the increase in enterprise interest-earning assets. Average loans, net as a percentage of average enterprise interest-earning assets increased 5% to 54% and 6% to 54% for the three and nine months ended September 30, 2007, respectively, compared to the same periods in 2006.
8
The following table presents enterprise average balance sheet data and enterprise income and expense data for our operations, as well as the related net interest spread, yields and rates and has been prepared on the basis required by the SEC’s Industry Guide 3, “Statistical Disclosure by Bank Holding Companies” (dollars in thousands):
| | | | | | | | | | | | | | | | | | | | |
| | | Three Months Ended September 30, | |
| | | 2007 | | | 2006 | |
| | | Average
Balance | | | Operating
Interest
Inc./Exp. | | | Average
Yield/
Cost | | | Average
Balance | | Operating Interest
Inc./Exp. | | Average
Yield/
Cost | |
Enterprise interest-earning assets: | | | | | | | | | | | | | | | | | | | | |
Loans, net(1) | | $ | 32,445,828 | | | $ | 528,193 | | | 6.51 | % | | $ | 22,955,022 | | $ | 364,744 | | 6.36 | % |
Margin receivables | | | 7,605,184 | | | | 138,290 | | | 7.21 | % | | | 6,645,017 | | | 123,855 | | 7.39 | % |
Mortgage-backed and related available-for-sale securities | | | 12,811,113 | | | | 169,603 | | | 5.30 | % | | | 12,068,052 | | | 159,199 | | 5.28 | % |
Available-for-sale investment securities | | | 5,097,480 | | | | 83,595 | | | 6.56 | % | | | 3,220,054 | | | 51,885 | | 6.44 | % |
Trading securities | | | 118,195 | | | | 3,052 | | | 10.33 | % | | | 114,806 | | | 2,600 | | 9.06 | % |
Cash and cash equivalents(2) | | | 1,266,614 | | | | 13,102 | | | 4.10 | % | | | 974,738 | | | 11,272 | | 4.59 | % |
Stock borrow and other | | | 698,251 | | | | 14,528 | | | 8.25 | % | | | 422,010 | | | 8,690 | | 8.17 | % |
| | | | | | | | | | | | | | | | | | | | |
Total enterprise interest-earning assets | | | 60,042,665 | | | | 950,363 | | | 6.33 | % | | | 46,399,699 | | | 722,245 | | 6.22 | % |
| | | | | | | | | | | | | | | | | | | | |
Non-operating interest-earning assets(3) | | | 4,436,069 | | | | | | | | | | | 4,250,365 | | | | | | |
| | | | | | | | | | | | | | | | | | | | |
Total assets | | $ | 64,478,734 | | | | | | | | | | $ | 50,650,064 | | | | | | |
| | | | | | | | | | | | | | | | | | | | |
Enterprise interest-bearing liabilities: | | | | | | | | | | | | | | | | | | | | |
Retail deposits | | $ | 27,764,658 | | | | 216,426 | | | 3.09 | % | | $ | 20,992,962 | | | 141,035 | | 2.67 | % |
Brokered certificates of deposit | | | 418,123 | | | | 5,154 | | | 4.89 | % | | | 618,681 | | | 7,453 | | 4.78 | % |
Customer payables | | | 6,678,370 | | | | 23,614 | | | 1.40 | % | | | 5,794,586 | | | 18,326 | | 1.25 | % |
Repurchase agreements and other borrowings | | | 12,582,907 | | | | 165,925 | | | 5.16 | % | | | 11,586,260 | | | 150,837 | | 5.09 | % |
Federal Home Loan Bank (“FHLB”) advances | | | 8,650,546 | | | | 115,531 | | | 5.23 | % | | | 3,583,663 | | | 43,950 | | 4.80 | % |
Stock loan and other | | | 1,048,037 | | | | 6,539 | | | 2.48 | % | | | 1,283,026 | | | 11,617 | | 3.59 | % |
| | | | | | | | | | | | | | | | | | | | |
Total enterprise interest-bearing liabilities | | | 57,142,641 | | | | 533,189 | | | 3.68 | % | | | 43,859,178 | | | 373,218 | | 3.36 | % |
| | | | | | | | | | | | | | | | | | | | |
Non-operating interest-bearing liabilities(4) | | | 3,015,641 | | | | | | | | | | | 2,872,657 | | | | | | |
| | | | | | | | | | | | | | | | | | | | |
Total liabilities | | | 60,158,282 | | | | | | | | | | | 46,731,835 | | | | | | |
Total shareholders’ equity | | | 4,320,452 | | | | | | | | | | | 3,918,229 | | | | | | |
| | | | | | | | | | | | | | | | | | | | |
| | $ | 64,478,734 | | | | | | | | | | $ | 50,650,064 | | | | | | |
| | | | | | | | | | | | | | | | | | | | |
Excess of enterprise interest-earning assets over enterprise interest-bearing liabilities/Enterprise net interest income/Spread | | $ | 2,900,024 | | | $ | 417,174 | | | 2.65 | % | | $ | 2,540,521 | | $ | 349,027 | | 2.86 | % |
| | | | | | | | | | | | | | | | | | | | |
Enterprise net interest margin (net yield on enterprise interest-earning assets) | | | | | | | | | | 2.78 | % | | | | | | | | 3.01 | % |
Ratio of enterprise interest-earning assets to enterprise interest-bearing liabilities | | | | | | | | | | 105.08 | % | | | | | | | | 105.79 | % |
Return on average: | | | | | | | | | | | | | | | | | | | | |
Total assets | | | | | | | | | | (0.36 | )% | | | | | | | | 1.21 | % |
Total shareholders’ equity | | | | | | | | | | (5.41 | )% | | | | | | | | 15.65 | % |
Average equity to average total assets | | | | | | | | | | 6.70 | % | | | | | | | | 7.74 | % |
| | | | | | | | | | | | | | | | | | | | |
|
| Reconciliation from enterprise net interest income to net operating interest income (dollars in thousands): | |
| | | | | |
| | | Three Months Ended September 30, | | | | | | | | | | | |
| | | 2007 | | | 2006 | | | | | | | | | | | |
Enterprise net interest income(5) | | $ | 417,174 | | | $ | 349,027 | | | | | | | | | | | | | |
Taxable equivalent interest adjustment | | | (8,523 | ) | | | (5,246 | ) | | | | | | | | | | | | |
Customer cash held by third parties and other(6) | | | 9,381 | | | | 11,355 | | | | | | | | | | | | | |
| | | | | | | | | | | | | | | | | | | | |
Net operating interest income | | $ | 418,032 | | | $ | 355,136 | | | | | | | | | | | | | |
| | | | | | | | | | | | | | | | | | | | |
(1) | | Nonaccrual loans are included in the respective average loan balances. Income on such nonaccrual loans is recognized on a cash basis. |
(2) | | Includes segregated cash balances. |
(3) | | Non-operating interest-earning assets consist of property and equipment, net, goodwill, other intangibles, net and other assets that do not generate operating interest income. Some of these assets generate corporate interest income. |
(4) | | Non-operating interest-bearing liabilities consist of corporate debt, accounts payable, accrued and other liabilities that do not generate operating interest expense. Some of these liabilities generate corporate interest expense. |
(5) | | Enterprise net interest income is taxable equivalent basis net operating interest income excluding corporate interest income and corporate interest expense, stock conduit interest income and expense and interest earned on customer cash held by third parties. Management believes this non-GAAP measure is useful to analysts and investors as it is a measure of the net operating interest income generated by our operations. |
(6) | | Includes interest earned on average customer assets of $4.1 billion and $3.6 billion for the three months ended September 30, 2007 and 2006, respectively, held by parties outside E*TRADE Financial, including third party money market funds and sweep deposit accounts at unaffiliated financial institutions. Other consists of net operating interest income earned on average stock conduit assets of $26.5 million for the three months ended September 30, 2006. There were no stock conduit assets for the three months ended September 30, 2007. |
9
| | | | | | | | | | | | | | | | | | | | |
| | | Nine Months Ended September 30, | |
| | | 2007 | | | 2006 | |
| | | Average
Balance | | | Operating
Interest
Inc./Exp. | | | Average
Yield/
Cost | | | Average
Balance | | Operating Interest
Inc./Exp. | | Average
Yield/
Cost | |
Enterprise interest-earning assets: | | | | | | | | | | | | | | | | | | | | |
Loans, net(1) | | $ | 30,541,679 | | | $ | 1,477,109 | | | 6.45 | % | | $ | 20,994,403 | | $ | 949,513 | | 6.03 | % |
Margin receivables | | | 7,135,135 | | | | 389,611 | | | 7.30 | % | | | 6,702,436 | | | 352,149 | | 7.02 | % |
Mortgage-backed and related available-for-sale securities | | | 12,629,026 | | | | 500,071 | | | 5.28 | % | | | 11,451,932 | | | 432,077 | | 5.03 | % |
Available-for-sale investment securities | | | 4,504,831 | | | | 220,224 | | | 6.52 | % | | | 2,931,914 | | | 136,561 | | 6.21 | % |
Trading securities | | | 117,364 | | | | 9,495 | | | 10.79 | % | | | 131,885 | | | 8,194 | | 8.28 | % |
Cash and cash equivalents(2) | | | 1,289,564 | | | | 44,040 | | | 4.57 | % | | | 1,259,239 | | | 40,592 | | 4.31 | % |
Stock borrow and other | | | 674,245 | | | | 39,267 | | | 7.79 | % | | | 481,809 | | | 25,215 | | 7.00 | % |
| | | | | | | | | | | | | | | | | | | | |
Total enterprise interest-earning assets | | | 56,891,844 | | | | 2,679,817 | | | 6.28 | % | | | 43,953,618 | | | 1,944,301 | | 5.90 | % |
| | | | | | | | | | | | | | | | | | | | |
Non-operating interest-earning assets(3) | | | 4,489,061 | | | | | | | | | | | 4,615,662 | | | | | | |
| | | | | | | | | | | | | | | | | | | | |
Total assets | | $ | 61,380,905 | | | | | | | | | | $ | 48,569,280 | | | | | | |
| | | | | | | | | | | | | | | | | | | | |
Enterprise interest-bearing liabilities: | | | | | | | | | | | | | | | | | | | | |
Retail deposits | | $ | 26,424,575 | | | | 593,836 | | | 3.00 | % | | $ | 19,664,315 | | | 346,602 | | 2.36 | % |
Brokered certificates of deposit | | | 436,265 | | | | 16,033 | | | 4.91 | % | | | 539,508 | | | 18,262 | | 4.53 | % |
Customer payables | | | 6,632,786 | | | | 66,872 | | | 1.35 | % | | | 6,319,950 | | | 51,656 | | 1.09 | % |
Repurchase agreements and other borrowings | | | 12,761,556 | | | | 500,293 | | | 5.17 | % | | | 10,680,195 | | | 391,460 | | 4.83 | % |
Federal Home Loan Bank (“FHLB”) advances | | | 6,612,725 | | | | 257,183 | | | 5.13 | % | | | 3,161,930 | | | 108,696 | | 4.53 | % |
Stock loan and other | | | 1,196,013 | | | | 27,435 | | | 3.07 | % | | | 1,031,071 | | | 24,301 | | 3.15 | % |
| | | | | | | | | | | | | | | | | | | | |
Total enterprise interest-bearing liabilities | | | 54,063,920 | | | | 1,461,652 | | | 3.59 | % | | | 41,396,969 | | | 940,977 | | 3.02 | % |
| | | | | | | | | | | | | | | | | | | | |
Non-operating interest-bearing liabilities(4) | | | 3,001,160 | | | | | | | | | | | 3,464,003 | | | | | | |
| | | | | | | | | | | | | | | | | | | | |
Total liabilities | | | 57,065,080 | | | | | | | | | | | 44,860,972 | | | | | | |
Total shareholders’ equity | | | 4,315,825 | | | | | | | | | | | 3,708,308 | | | | | | |
| | | | | | | | | | | | | | | | | | | | |
| | $ | 61,380,905 | | | | | | | | | | $ | 48,569,280 | | | | | | |
| | | | | | | | | | | | | | | | | | | | |
Excess of enterprise interest-earning assets over enterprise interest-bearing liabilities/Enterprise net interest income/Spread | | $ | 2,827,924 | | | $ | 1,218,165 | | | 2.69 | % | | $ | 2,556,649 | | $ | 1,003,324 | | 2.88 | % |
| | | | | | | | | | | | | | | | | | | | |
Enterprise net interest margin (net yield on enterprise interest-earning assets) | | | | | | | | | | 2.85 | % | | | | | | | | 3.04 | % |
Ratio of enterprise interest-earning assets to enterprise interest-bearing liabilities | | | | | | | | | | 105.23 | % | | | | | | | | 106.18 | % |
Return on average: | | | | | | | | | | | | | | | | | | | | |
Total assets | | | | | | | | | | 0.59 | % | | | | | | | | 1.24 | % |
Total shareholders’ equity | | | | | | | | | | 8.34 | % | | | | | | | | 16.26 | % |
Average equity to average total assets | | | | | | | | | | 7.03 | % | | | | | | | | 7.64 | % |
|
Reconciliation from enterprise net interest income to net operating interest income (dollars in thousands): | |
| | | | | |
| | | Nine Months Ended September 30, | | | | | | | | | | | |
| | | 2007 | | | 2006 | | | | | | | | | | | |
Enterprise net interest income(5) | | $ | 1,218,165 | | | $ | 1,003,324 | | | | | | | | | | | | | |
Taxable equivalent interest adjustment | | | (23,330 | ) | | | (12,944 | ) | | | | | | | | | | | | |
Customer cash held by third parties and other(6) | | | 27,947 | | | | 34,147 | | | | | | | | | | | | | |
| | | | | | | | | | | | | | | | | | | | |
Net operating interest income | | $ | 1,222,782 | | | $ | 1,024,527 | | | | | | | | | | | | | |
| | | | | | | | | | | | | | | | | | | | |
(1) | | Nonaccrual loans are included in the respective average loan balances. Income on such nonaccrual loans is recognized on a cash basis. |
(2) | | Includes segregated cash balances. |
(3) | | Non-operating interest-earning assets consist of property and equipment, net, goodwill, other intangibles, net and other assets that do not generate operating interest income. Some of these assets generate corporate interest income. |
(4) | | Non-operating interest-bearing liabilities consist of corporate debt, accounts payable, accrued and other liabilities that do not generate operating interest expense. Some of these liabilities generate corporate interest expense. |
(5) | | Enterprise net interest income is taxable equivalent basis net operating interest income excluding corporate interest income and corporate interest expense, stock conduit interest income and expense and interest earned on customer cash held by third parties. Management believes this non-GAAP measure is useful to analysts and investors as it is a measure of the net operating interest income generated by our operations. |
(6) | | Includes interest earned on average customer assets of $4.0 billion and $3.5 billion for the nine months ended September 30, 2007 and 2006, respectively, held by parties outside E*TRADE Financial, including third party money market funds and sweep deposit accounts at unaffiliated financial institutions. Other consists of net operating interest income earned on average stock conduit assets of $1.6 million and $401.4 million for the nine months ended September 30, 2007 and 2006, respectively. |
10
Average enterprise interest-earning assets increased 29% to $60.0 billion and $56.9 billion for the three and nine months ended September 30, 2007, respectively, compared to the same periods in 2006. Average loans, net grew 41% to $32.4 billion and 45% to $30.5 billion for the three and nine months ended September 30, 2007, respectively, compared to the same periods in 2006. Average loans, net grew as a result of our focus on growing real estate loan products in the first and second quarters of 2007. We plan to increase our one-to four-family real estate loans and margin loans, while allowing our home equity loan and securities portfolios to decline. We expect this will keep total average enterprise interest-earnings assets approximately at or below current levels.
Average enterprise interest-bearing liabilities increased 30% to $57.1 billion and 31% to $54.1 billion for the three and nine months ended September 30, 2007, respectively, compared to the same periods in 2006. The increase in average enterprise interest-bearing liabilities was primarily in retail deposits. Average retail deposits increased 32% to $27.8 billion and 34% to $26.4 billion for the three and nine months ended September 30, 2007, respectively, compared to the same period in 2006. Increases in average retail deposits were driven by growth in the Complete Savings Account. We expect average retail deposits to continue to grow and replace repurchase agreements and FHLB advances as they mature.
Enterprise net interest spread decreased by 21 basis points to 2.65% and 19 basis points to 2.69% for the three and nine months ended September 30, 2007, respectively, compared to the same periods in 2006. This decrease was primarily the result of a challenging interest rate environment throughout the past 12 months as well as growth in our Complete Savings Account. We expect this decline to subside, as we focus on reducing our wholesale borrowings, which have a higher cost of borrowing when compared to deposits.
Provision for Loan Losses
Provision for loan losses increased to $186.5 million and to $237.8 million for the three and nine months ended September 30, 2007, respectively, compared to the same periods in 2006. The increase in the provision for loan losses in the third quarter of 2007 was related primarily to deterioration in the performance of our home equity loan portfolio. We believe this deterioration was caused by several factors, which are described below. First, the combined impact of rising mortgage rates and home price depreciation in key markets contributed to the declining performance of our home equity loan portfolio. Second, concerns that began in the sub-prime mortgage loan market spread to the broader credit markets in the third quarter of 2007 resulting in a significant deterioration in the overall credit markets. This deterioration led to a dramatic tightening of lending standards across the industry, and general liquidity pressure for many mortgage lenders, some of whom ultimately ceased operations as a result. The factors described above dramatically reduced the ability of borrowers to refinance their mortgage loans, specifically their home equity loans, therefore drastically increasing the risk of loss once a loan becomes delinquent. During the third quarter of 2007, we also observed a decline in the percentage of delinquent loans that cure prior to charge-off or foreclosure once they have become delinquent. We attribute this change in behavior to the factors described above, which have significantly limited borrowers’ alternatives to avoid defaulting on their loans. In addition, because of the decline in value of the homes collateralizing our home equity loans, our ability to recover our investment by foreclosing on the underlying properties has diminished as well.
We believe the provision for loan losses will continue at historically high levels in future periods as the instability in the residential real estate and credit markets continues to impact the performance of our portfolio.
Commission
Retail and institutional commission revenue increased 41% to $188.4 million and 8% to $517.2 million for the three and nine months ended September 30, 2007, compared to the same periods in 2006. The primary factors that affect our retail commission revenue are DARTs and average commission per trade, which is impacted by both trade types and the mix between our domestic and international businesses. Each business has a different pricing structure, unique to its customer base and local market practices, and as a result, a change in the relative
11
number of executed trades in these businesses impacts average commission per trade. Each business also has different trade types (e.g. equities, options, fixed income, exchange-traded funds, contract for difference and mutual funds) that can have different commission rates. As a result, changes in the mix of trade types within either of these businesses may impact average commission per trade. Institutional commission revenue is also impacted by negotiated rates, which differ by customer. Our institutional customers are provided with global execution and settlement services as well as worldwide access to research provided by third parties in exchange for commissions based on negotiated rates.
DARTs increased 44% and 11% to 194,385 and 177,887 for the three and nine months ended September 30, 2007, compared to the same periods in 2006. Our U.S. DART volume increased 39% and 6% for the three and nine months ended September 30, 2007, respectively, compared to the same periods in 2006. Our international DARTs grew by 76% and 40% for the three and nine months ended September 30, 2007, respectively, compared to the same periods in 2006, driven entirely by organic growth. Our international operations continue to be a strong growth contributor within our retail trading business, and we believe that over time they will become a significant component of our entire business. In addition, option-related DARTs further increased as a percentage of our total U.S. DARTs and now represent 17% of U.S. trading volume versus 13% a year ago.
Average commission per trade decreased 2% to $11.71 and $11.87 for the three and nine months ended September 30, 2007, respectively, compared to the same periods in 2006. The decrease was primarily a function of the mix of customers. Main Street Investors, who generally have a higher commission per trade, traded less during the period compared to Active Traders and Mass Affluent, who generally have a lower commission per trade.
Fees and Service Charges
During the first quarter of 2007, the Company re-defined the line item “Service charges and fees” by reclassifying certain fee-like revenue items formerly reported in “Other revenue” into the “Service charges and fees” line item, now called “Fees and service charges.” The fee-like revenue streams moved include payment for order flow, foreign currency margin revenue, 12b-1 fees after rebates, fixed income product revenue and management fee revenue.
Fees and service charges increased 11% to $64.8 million and 9% to $189.7 million for the three and nine months ended September 30, 2007, respectively, compared to the same periods in 2006. This increase was due to an increase in our advisor management fees, mutual fund fees, order flow payment and CDO management fees, partially offset by a decrease in account maintenance fees and mortgage servicing fees. We expect our account maintenance fee income to continue to decline over time as we have fewer customers who are subject to the fee; however, we expect our advisory management fee income, which is not currently a significant portion of fees and service charges, to increase over time as we focus on growing this product.
Principal Transactions
Principal transactions decreased 8% to $20.9 million and 7% to $78.7 million for the three and nine months ended September 30, 2007, respectively, compared to the same periods in 2006. The decrease in principal transactions resulted from lower trading volumes as well as a decrease in the average revenue earned per trade. Our principal transactions revenue is influenced by overall trading volumes, the number of stocks for which we act as a market maker, the trading volumes of those specific stocks and the performance of our proprietary trading activities.
12
Gain (Loss) on Loans and Securities, Net
Gain (loss) on loans and securities, net decreased to a loss of $197.1 million and to a loss of $174.4 million for the three and nine months ended September 30, 2007 compared to the same periods in 2006, as shown in the following table (dollars in thousands):
| | | | | | | | | | | | | | | | | | | | | | | | | | | | | | |
| | | Three Months
Ended September 30, | | | Variance | | | Nine Months Ended September 30, | | | Variance | |
| | | 2007 vs. 2006 | | | | 2007 vs. 2006 | |
| | | 2007 | | | 2006 | | | Amount | | | % | | | 2007 | | | 2006 | | | Amount | | | % | |
Gain on sales of originated loans | | $ | 830 | | | $ | 3,213 | | | $ | (2,383 | ) | | (74) | % | | $ | 4,788 | | | $ | 9,212 | | | $ | (4,424 | ) | | (48) | % |
Loss on sales of loans held-for-sale, net | | | (1,991 | ) | | | (235 | ) | | | (1,756 | ) | | 747 | % | | | (3,678 | ) | | | (1,333 | ) | | | (2,345 | ) | | 176 | % |
| | | | | | | | | | | | | | | | | | | | | | | | | | | | | | |
Gain (loss) on sales of loans, net | | | (1,161 | ) | | | 2,978 | | | | (4,139 | ) | | (139) | % | | | 1,110 | | | | 7,879 | | | | (6,769 | ) | | (86) | % |
Gain on securities and other investments | | | 1,701 | | | | 33,006 | | | | (31,305 | ) | | (95) | % | | | 10,072 | | | | 42,365 | | | | (32,293 | ) | | (76) | % |
Loss on impairment | | | (159,752 | ) | | | (1,504 | ) | | | (158,248 | ) | | * | | | | (162,713 | ) | | | (1,504 | ) | | | (161,209 | ) | | * | |
Loss on trading securities | | | (37,845 | ) | | | (18,477 | ) | | | (19,368 | ) | | 105 | % | | | (22,823 | ) | | | (10,002 | ) | | | (12,821 | ) | | 128 | % |
| | | | | | | | | | | | | | | | | | | | | | | | | | | | | | |
Gain (loss) on securities, net | | | (195,896 | ) | | | 13,025 | | | | (208,921 | ) | | * | | | | (175,464 | ) | | | 30,859 | | | | (206,323 | ) | | * | |
| | | | | | | | | | | | | | | | | | | | | | | | | | | | | | |
Gain (loss) on loans and securities, net | | $ | (197,057 | ) | | $ | 16,003 | | | $ | (213,060 | ) | | * | | | $ | (174,354 | ) | | $ | 38,738 | | | $ | (213,092 | ) | | * | |
| | | | | | | | | | | | | | | | | | | | | | | | | | | | | | |
| * | | Percentage not meaningful |
The decrease in the total gain (loss) on loans and securities, net during the three months ended September 30, 2007 was due primarily to write downs in our asset-backed securities portfolio totaling $197.6 million. These write downs were primarily confined to securities rated below “AA” in what we believe are the two highest risk categories within our asset-backed portfolio: CDOs and securities collateralized by second lien mortgages. We did not sell any of these securities during the period ended September 30, 2007; however, it is our intent to sell them in future periods in order to reduce our exposure to further deterioration in these asset classes. The write downs were due to both an anticipated deterioration in cash flows and our decision to sell these securities. In either case, the securities were required to be written down to fair market value as of September 30, 2007.
We expect conditions in the residential real estate and credit markets to remain uncertain for the foreseeable future. Due to the inherent leverage within our asset-backed securities, even a slight deterioration in the performance of the underlying loans could result in a significant deterioration in the performance of our asset-backed securities. Therefore, continued deterioration in market conditions would likely cause additional write downs in our securities portfolio, primarily in our asset-backed portfolio.
Subsequent to September 30, 2007, we observed a significant decline in the fair value of our asset-backed securities portfolio, specifically our asset-backed CDO and second-lien securities. Our total exposure to asset-backed CDO and second-lien securities at September 30, 2007 was approximately $450 million in amortized cost.
The declines in fair value followed a series of rating agency downgrades of securities in this sector and occurred after the end of the third quarter. We believe there will likely be additional downgrades by the rating agencies of securities in this sector. Overall, approximately $208 million of our asset-backed securities were downgraded during the month of October and through November 7, 2007, including approximately $50 million of “AAA” rated asset-backed CDOs that were downgraded to below investment grade.
We expect these declines will result in significant write downs to these securities during the fourth quarter; however, we cannot predict the amount for the fourth quarter as the write downs will depend on future market developments, including potential additional downgrades, and the estimated fair values of these securities on December 31, 2007.
In addition to our asset-backed CDO and second lien portfolio, we hold approximately $2.6 billion in amortized cost in other asset-backed securities, mainly securities backed by prime residential first-lien mortgages. These securities have also declined in fair value subsequent to September 30, 2007; however, the decline has not been as significant.
13
Other Revenue
Other revenue increased 49% to $12.7 million and 31% to $33.5 million for the three and nine months ended September 30, 2007, respectively, compared to the same periods in 2006. The increase in other revenue was due to an increase in fees earned in connection with distribution of shares during initial public offerings and software consulting fees from our Corporate Services business.
Expense Excluding Interest
The components of expense excluding interest and the resulting variances are as follows (dollars in thousands):
| | | | | | | | | | | | | | | | | | | | | | | | | | |
| | | Three Months Ended September 30, | | Variance | | | Nine Months Ended September 30, | | Variance | |
| | | 2007 vs. 2006 | | | | 2007 vs. 2006 | |
| | | 2007 | | 2006 | | Amount | | | % | | | 2007 | | 2006 | | Amount | | | % | |
Compensation and benefits | | $ | 117,538 | | $ | 110,705 | | $ | 6,833 | | | 6 | % | | $ | 360,399 | | $ | 352,334 | | $ | 8,065 | | | 2 | % |
Clearing and servicing | | | 78,784 | | | 62,500 | | | 16,284 | | | 26 | % | | | 220,213 | | | 189,926 | | | 30,287 | | | 16 | % |
Advertising and market development | | | 26,508 | | | 23,914 | | | 2,594 | | | 11 | % | | | 108,038 | | | 89,115 | | | 18,923 | | | 21 | % |
Communications | | | 27,525 | | | 25,576 | | | 1,949 | | | 8 | % | | | 79,502 | | | 84,818 | | | (5,316 | ) | | (6) | % |
Professional services | | | 21,014 | | | 20,741 | | | 273 | | | 1 | % | | | 71,161 | | | 71,715 | | | (554 | ) | | (1) | % |
Depreciation and amortization | | | 22,205 | | | 18,565 | | | 3,640 | | | 20 | % | | | 61,663 | | | 56,181 | | | 5,482 | | | 10 | % |
Occupancy and equipment | | | 22,848 | | | 22,150 | | | 698 | | | 3 | % | | | 69,247 | | | 63,082 | | | 6,165 | | | 10 | % |
Amortization of other intangibles | | | 10,485 | | | 12,087 | | | (1,602 | ) | | (13) | % | | | 30,940 | | | 35,391 | | | (4,451 | ) | | (13) | % |
Facility restructuring and other exit activities | | | 5,871 | | | 16,684 | | | (10,813 | ) | | (65) | % | | | 5,104 | | | 19,315 | | | (14,211 | ) | | (74) | % |
Other | | | 47,824 | | | 45,675 | | | 2,149 | | | 5 | % | | | 150,925 | | | 101,888 | | | 49,037 | | | 48 | % |
| | | | | | | | | | | | | | | | | | | | | | | | | | |
Total expense excluding interest | | $ | 380,602 | | $ | 358,597 | | $ | 22,005 | | | 6 | % | | $ | 1,157,192 | | $ | 1,063,765 | | $ | 93,427 | | | 9 | % |
| | | | | | | | | | | | | | | | | | | | | | | | | | |
Expense excluding interest increased 6% to $380.6 million and 9% to $1.2 billion for the three and nine months ended September 30, 2007, respectively, compared to the same periods in 2006. The increase in expense excluding interest was driven primarily by an increase in clearing and servicing expense for the three months ended September 30, 2007 and an increase in other expense for the nine months ended September 30, 2007.
Compensation and Benefits
Compensation and benefits increased 6% to $117.5 million and 2% to $360.4 million for the three and nine months ended September 30, 2007, respectively, compared to the same periods in 2006. The slight increase for the three months ended September 30, 2007 compared to the same period in 2006 resulted primarily from lower incentive based compensation in the prior year.
Clearing and Servicing
Clearing and servicing expense increased 26% to $78.8 million and 16% to $220.2 million for the three and nine months ended September 30, 2007, respectively, compared to the same periods in 2006. This increase is due primarily to higher loan balances during the period, which resulted in higher servicing costs and increased trading activity, which resulted in higher clearing expenses.
Advertising and Market Development
Advertising and market development expense increased 11% to $26.5 million and 21% to $108.0 million for the three and nine months ended September 30, 2007, respectively, compared to the same periods in 2006. This planned increase is a result of expanded efforts to promote our products and services to the value-driven mass affluent customer.
14
Facility Restructuring and Other Exit Activities
Facility restructuring and other exit activities expense decreased 65% to $5.9 million and 74% to $5.1 million for the three and nine months ended September 30, 2007, respectively, compared to the same periods in 2006. In the third quarter of 2006, we relocated several functions out of the state of California and our facility restructuring and other exit activities expense in that period consisted of severance and facilities costs that resulted from the relocation. In the third quarter of 2007, we began to exit the wholesale mortgage lending business as well as restructure the international institutional brokerage business.
Other
Other expense increased 5% to $47.8 million and 48% to $150.9 million for the three and nine months ended September 30, 2007, respectively, compared to the same periods in 2006. The increase for the nine months ended September 30, 2007 is due primarily to higher expense for certain legal and regulatory matters.
Other Income (Expense)
Other income (expense) decreased to an expense of $37.1 million and to an expense of $65.8 million for the three and nine months ended September 30, 2007, compared to the same periods in 2006, as shown in the following table (dollars in thousands):
| | | | | | | | | | | | | | | | | | | | | | | | | | | | | | |
| | | Three Months Ended September 30, | | | Variance | | | Nine Months Ended September 30, | | | Variance | |
| | | 2007 vs. 2006 | | | | 2007 vs. 2006 | |
| | | 2007 | | | 2006 | | | Amount | | | % | | | 2007 | | | 2006 | | | Amount | | | % | |
Other income (expense): | | | | | | | | | | | | | | | | | | | | | | | | | | | | | | |
Corporate interest income | | $ | 1,018 | | | $ | 1,942 | | | $ | (924 | ) | | (48 | )% | | $ | 3,724 | | | $ | 6,091 | | | $ | (2,367 | ) | | (39 | )% |
Corporate interest expense | | | (37,365 | ) | | | (37,964 | ) | | | 599 | | | (2 | )% | | | (113,022 | ) | | | (114,586 | ) | | | 1,564 | | | (1 | )% |
Gain (loss) on sales of investments, net | | | (18 | ) | | | 26,991 | | | | (27,009 | ) | | * | | | | 37,005 | | | | 59,897 | | | | (22,892 | ) | | (38 | )% |
Loss on early extinguishment of debt | | | (37 | ) | | | — | | | | (37 | ) | | * | | | | (6 | ) | | | (703 | ) | | | 697 | | | * | |
Equity in income (loss) of investments and venture funds | | | (741 | ) | | | 2,519 | | | | (3,260 | ) | | * | | | | 6,514 | | | | 1,701 | | | | 4,813 | | | * | |
| | | | | | | | | | | | | | | | | | | | | | | | | | | | | | |
Total other income (expense) | | $ | (37,143 | ) | | $ | (6,512 | ) | | $ | (30,631 | ) | | * | | | $ | (65,785 | ) | | $ | (47,600 | ) | | $ | (18,185 | ) | | * | |
| | | | | | | | | | | | | | | | | | | | | | | | | | | | | | |
| * | | Percentage not meaningful |
Total other income (expense) for the three and nine months ended September 30, 2007 primarily consisted of corporate interest expense resulting from the senior notes and mandatory convertible notes issued by the Company. During the nine months ended September 30, 2007, we sold our investments in E*TRADE Australia and E*TRADE Korea, which resulted in $37.0 million in gain on sales of investments, net. There was no significant investment activity for the three months ended September 30, 2007.
Income Tax Expense (Benefit)
Income tax expense (benefit) from continuing operations was a benefit of $38.1 million for the three months ended September 30, 2007, compared to an expense of $66.4 million for the same period in 2006. Income tax expense from continuing operations decreased 40.6% to $136.7 million during the nine months ended September 30, 2007, compared to the same period in 2006. The decrease in income tax expense for the nine months ended September 30, 2007 compared to the same period in prior year was related to the decrease in pre-tax income over the comparable period. Our effective tax rates for the nine months ended September 30, 2007 and 2006 were 33.6% and 33.8%, respectively.
15
SEGMENT RESULTS REVIEW
Retail
Retail segment income increased 55% to $224.2 million and 17% to $599.8 million for the three and nine months ended September 30, 2007, respectively, compared to the same periods in 2006, as shown in the following table (dollars in thousands, except for key metrics):
| | | | | | | | | | | | | | | | | | | | | | | | | | |
| | | Three Months Ended September 30, | | Variance | | | Nine Months Ended September 30, | | Variance | |
| | | 2007 vs. 2006 | | | | 2007 vs. 2006 | |
| | | 2007 | | 2006 | | Amount | | | % | | | 2007 | | 2006 | | Amount | | | % | |
Retail segment income: | | | | | | | | | | | | | | | | | | | | | | | | | | |
Net operating interest income | | $ | 258,846 | | $ | 221,059 | | $ | 37,787 | | | 17 | % | | $ | 736,831 | | $ | 655,685 | | $ | 81,146 | | | 12 | % |
Commission | | | 142,291 | | | 100,902 | | | 41,389 | | | 41 | % | | | 393,779 | | | 364,333 | | | 29,446 | | | 8 | % |
Fees and service charges | | | 62,019 | | | 51,244 | | | 10,775 | | | 21 | % | | | 174,201 | | | 156,640 | | | 17,561 | | | 11 | % |
Gain on loans and securities, net | | | 1,148 | | | 10,608 | | | (9,460 | ) | | (89) | % | | | 13,410 | | | 28,293 | | | (14,883 | ) | | (53) | % |
Other revenue | | | 9,824 | | | 8,488 | | | 1,336 | | | 16 | % | | | 30,748 | | | 28,690 | | | 2,058 | | | 7 | % |
Net segment revenue | | | 474,128 | | | 392,301 | | | 81,827 | | | 21 | % | | | 1,348,969 | | | 1,233,641 | | | 115,328 | | | 9 | % |
Total segment expense | | | 249,901 | | | 247,227 | | | 2,674 | | | 1 | % | | | 749,121 | | | 721,742 | | | 27,379 | | | 4 | % |
| | | | | | | | | | | | | | | | | | | | | | | | | | |
Total retail segment income | | $ | 224,227 | | $ | 145,074 | | $ | 79,153 | | | 55 | % | | $ | 599,848 | | $ | 511,899 | | $ | 87,949 | | | 17 | % |
| | | | | | | | | | | | | | | | | | | | | | | | | | |
Key Metrics: | | | | | | | | | | | | | | | | | | | | | | | | | | |
Retail client assets (dollars in billions) | | $ | 218.0 | | $ | 184.8 | | $ | 33.2 | | | 18 | % | | $ | 218.0 | | $ | 184.8 | | $ | 33.2 | | | 18 | % |
Customer cash and deposits (dollars in billions) | | $ | 39.6 | | $ | 31.6 | | $ | 8.0 | | | 25 | % | | $ | 39.6 | | $ | 31.6 | | $ | 8.0 | | | 25 | % |
U.S. DARTs | | | 161,459 | | | 116,459 | | | 45,000 | | | 39 | % | | | 148,139 | | | 139,382 | | | 8,757 | | | 6 | % |
International DARTs | | | 32,926 | | | 18,671 | | | 14,255 | | | 76 | % | | | 29,748 | | | 21,207 | | | 8,541 | | | 40 | % |
| | | | | | | | | | | | | | | | | | | | | | | | | | |
DARTs | | | 194,385 | | | 135,130 | | | 59,255 | | | 44 | % | | | 177,887 | | | 160,589 | | | 17,298 | | | 11 | % |
Average commission per trade | | $ | 11.71 | | $ | 11.95 | | $ | (0.24 | ) | | (2) | % | | $ | 11.87 | | $ | 12.10 | | $ | (0.23 | ) | | (2) | % |
Average margin debt (dollars in billions) | | $ | 7.71 | | $ | 6.66 | | $ | 1.05 | | | 16 | % | | $ | 7.25 | | $ | 6.76 | | $ | 0.49 | | | 7 | % |
Our retail segment generates revenue from trading, investing, banking and lending relationships with retail customers. These relationships essentially drive five sources of revenue: net operating interest income; commission; fees and service charges; gain on loans and securities, net; and other revenue. Other revenue includes results from our stock plan administration products and services, as we ultimately service retail customers through these corporate relationships. Our geographically dispersed retail accounts grew 6% from September 30, 2006 to September 30, 2007. We believe this growth is a result of the investments we have made in marketing, operations and service. As of September 30, 2007, we had approximately 3.7 million active investing and trading accounts and 1.0 million active deposit and lending accounts. Our retail trading and investing products contributed 62% and our deposit products contributed 21% of total net revenue for the nine months ended September 30, 2007. All other products contributed less than 10% of total net revenue for the nine months ended September 30, 2007.
The increase in retail segment income for the three and nine months ended September 30, 2007 compared to the same periods in 2006 was due to an increase in commission revenue, fees and service charges revenue and net operating income, slightly offset by a decrease in gains on sales of loans and securities, net.
16
Retail net operating interest income increased 17% to $258.8 million and 12% to $736.8 million for the three and nine months ended September 30, 2007, respectively, compared to the same periods in 2006. This increase was driven by growth in customer cash and deposits, which generally translate into a lower cost of funds. The growth in customer cash and deposits was largely the result of the growth in the Complete Savings Account.
Retail commission revenue increased 41% and 8% to $142.3 million and $393.8 million for the three and nine months ended September 30, 2007, respectively, compared to the same periods in 2006. The increase in commission revenue was primarily the result of increased trading volumes in the overall domestic equity market and in our international commissions where DARTs increased 40% from 21,207 to 29,748 for the nine months ended September 30, 2007 compared to the same period in 2006. Retail commission revenue represented 76% of total commission revenue for the three and nine months ended September 30, 2007 and 2006, respectively.
Retail segment expense increased 1% to $249.9 million and 4% to $749.1 million for the three and nine months ended September 30, 2007, respectively, compared to the same periods in 2006. This slight increase related to our targeted growth in marketing spend as we expanded efforts to promote our products and services to the value-driven mass affluent customer.
Institutional
Institutional segment income (loss) was a loss of $283.6 million and $127.3 million for the three and nine months ended September 30, 2007, respectively, as shown in the following table (dollars in thousands, except for key metrics):
| | | | | | | | | | | | | | | | | | | | | | | | | | | | | | |
| | | Three Months Ended September 30, | | | Variance | | | Nine Months Ended September 30, | | | Variance | |
| | | 2007 vs. 2006 | | | | 2007 vs. 2006 | |
| | | 2007 | | | 2006 | | | Amount | | | % | | | 2007 | | | 2006 | | | Amount | | | % | |
Institutional segment income: | | | | | | | | | | | | | | | | | | | | | | | | | | | | | | |
Net operating interest income | | $ | 159,186 | | | $ | 134,077 | | | $ | 25,109 | | | 19 | % | | $ | 485,951 | | | $ | 368,842 | | | $ | 117,109 | | | 32 | % |
Provision for loan losses | | | (186,536 | ) | | | (12,547 | ) | | | (173,989 | ) | | 1387 | % | | | (237,767 | ) | | | (33,014 | ) | | | (204,753 | ) | | 620 | % |
| | | | | | | | | | | | | | | | | | | | | | | | | | | | | | |
Net operating interest income (loss) after provision for loan losses | | | (27,350 | ) | | | 121,530 | | | | (148,880 | ) | | (123) | % | | | 248,184 | | | | 335,828 | | | | (87,644 | ) | | (26) | % |
Commission | | | 46,112 | | | | 32,704 | | | | 13,408 | | | 41 | % | | | 123,385 | | | | 112,438 | | | | 10,947 | | | 10 | % |
Fees and service charges | | | 5,370 | | | | 7,708 | | | | (2,338 | ) | | (30) | % | | | 22,768 | | | | 22,035 | | | | 733 | | | 3 | % |
Principal transactions | | | 20,889 | | | | 22,697 | | | | (1,808 | ) | | (8) | % | | | 78,739 | | | | 84,979 | | | | (6,240 | ) | | (7) | % |
Gain (loss) on loans and securities, net | | | (198,205 | ) | | | 5,395 | | | | (203,600 | ) | | * | | | | (187,764 | ) | | | 10,445 | | | | (198,209 | ) | | * | |
Other revenue | | | 3,019 | | | | 183 | | | | 2,836 | | | 1550 | % | | | 3,151 | | | | 346 | | | | 2,805 | | | 811 | % |
| | | | | | | | | | | | | | | | | | | | | | | | | | | | | | |
Net segment revenue | | | (150,165 | ) | | | 190,217 | | | | (340,382 | ) | | (179) | % | | | 288,463 | | | | 566,071 | | | | (277,608 | ) | | (49) | % |
Total segment expense | | | 133,432 | | | | 112,122 | | | | 21,310 | | | 19 | % | | | 415,724 | | | | 350,262 | | | | 65,462 | | | 19 | % |
| | | | | | | | | | | | | | | | | | | | | | | | | | | | | | |
Total institutional segment income (loss) | | $ | (283,597 | ) | | $ | 78,095 | | | $ | (361,692 | ) | | (463) | % | | $ | (127,261 | ) | | $ | 215,809 | | | $ | (343,070 | ) | | (159) | % |
| | | | | | | | | | | | | | | | | | | | | | | | | | | | | | |
Key Metrics: | | | | | | | | | | | | | | | | | | | | | | | | | | | | | | |
Nonperforming loans as a % of total gross loans receivable | | | 0.84 | % | | | 0.24 | % | | | * | | | 0.60 | % | | | 0.84 | % | | | 0.24 | % | | | * | | | 0.60 | % |
Average revenue capture per 1,000 equity shares | | $ | 0.415 | | | $ | 0.382 | | | $ | 0.033 | | | 9 | % | | $ | 0.472 | | | $ | 0.339 | | | $ | 0.133 | | | 39 | % |
| * | | Percentage not meaningful |
17
Our institutional segment generates net income (loss) from balance sheet management activities, market-making and global execution and settlement services. Balance sheet management activities include purchasing loan receivables from the retail segment as well as third parties, and leveraging these loans and retail customer cash and deposit relationships to generate additional net operating interest income. Retail trading order flow is leveraged by the institutional segment to generate additional revenue for the Company.
Net operating interest income increased 19% to $159.2 million and 32% to $486.0 million for the three and nine months ended September 30, 2007 compared to the same periods in 2006. The increase in net operating interest income was due primarily to the increase in enterprise interest-earning assets, specifically average loans, net. Average loans, net as a percentage of average enterprise interest-earning assets increased 5% to 54% and 6% to 54% for the three and nine months ended September 30, 2007, respectively, compared to the same periods in 2006.
Provision for loan losses increased to $186.5 million and to $237.8 million for the three and nine months ended September 30, 2007, respectively, compared to the same periods in 2006. The increase in the provision for loan losses was related primarily to deterioration in the performance of our home equity loan portfolio.
Fee and service charges revenue decreased 30% to $5.4 million and increased 3% to $22.8 million for the three and nine months ended September 30, 2007, respectively, compared to the same periods in 2006. The decrease for the three months ended September 30, 2007 is related to a $2.9 million decline in service fee income as a result of lower rates and lower home equity, credit card and CDO management fees.
Institutional commission revenue increased 41% to $46.1 million and 10% to $123.4 million for the three and nine months ended September 30, 2007, respectively, compared to the same periods in 2006. The increase was due to higher trading volumes as a result of volatility in global equity markets. Institutional commission revenue represented 24% of total commission revenue for the three and nine months ended September 30, 2007 and 2006, respectively.
Gain (loss) on loans and securities, net decreased to a loss of $198.2 million and $187.8 million for the three and nine months ended September 30, 2007. This decline was due primarily to write downs in the asset-backed securities portfolio totaling $197.6 million for the three months ended September 30, 2007. These write downs were primarily confined to securities rated below “AA” in what we believe are the two highest risk categories within our asset-backed portfolio: CDOs and securities collateralized by second lien mortgages. The write downs were due to both an anticipated deterioration in cash flows and our decision to sell these securities in future periods. In either case, the securities were required to be written down to estimated fair market value as of September 30, 2007.
Total institutional segment expense increased 19% to $133.4 million and 19% to $415.7 million for the three and nine months ended September 30, 2007, respectively, compared to the same periods in 2006 and was due primarily to additional expense recorded for certain legal and regulatory matters.
18
BALANCE SHEET OVERVIEW
The following table sets forth the significant components of our consolidated balance sheet (dollars in thousands):
| | | | | | | | | |
| | | September 30, 2007 | | December 31, 2006 | | Variance | |
| | | | | 2007 vs. 2006 | |
Assets: | | | | | | | | | |
Cash and equivalents(1) | | $ | 1,768,027 | | $ | 1,493,856 | | 18 | % |
Trading securities | | | 120,501 | | | 178,600 | | (33) | % |
Available-for-sale mortgage-backed and investment securities | | | 16,581,257 | | | 13,921,983 | | 19 | % |
Loans held-for-sale | | | 119,357 | | | 283,496 | | (58) | % |
Margin receivables | | | 7,529,971 | | | 6,828,448 | | 10 | % |
Loans receivable, net | | | 32,389,894 | | | 26,372,697 | | 23 | % |
Other assets(2) | | | 5,677,758 | | | 4,660,223 | | 22 | % |
| | | | | | | | | |
Total assets | | $ | 64,186,765 | | $ | 53,739,303 | | 19 | % |
| | | | | | | | | |
Liabilities and shareholders’ equity: | | | | | | | | | |
Deposits | | $ | 29,197,344 | | $ | 24,071,012 | | 21 | % |
Securities sold under agreements to repurchase | | | 10,826,523 | | | 9,792,422 | | 11 | % |
Customer payables | | | 7,002,986 | | | 6,182,672 | | 13 | % |
Other borrowings | | | 9,067,529 | | | 5,323,962 | | 70 | % |
Corporate debt(3) | | | 1,881,112 | | | 1,842,169 | | 2 | % |
Accounts payable, accrued and other liabilities | | | 2,107,288 | | | 2,330,696 | | (10) | % |
| | | | | | | | | |
Total liabilities | | | 60,082,782 | | | 49,542,933 | | 21 | % |
Shareholders’ equity | | | 4,103,983 | | | 4,196,370 | | (2) | % |
| | | | | | | | | |
Total liabilities and shareholders’ equity | | $ | 64,186,765 | | $ | 53,739,303 | | 19 | % |
| | | | | | | | | |
(1) | | Includes balance sheet line items cash and equivalents and cash and investments required to be segregated under Federal or other regulations. |
(2) | | Includes balance sheet line items property and equipment, net, goodwill, other intangibles, net and other assets. |
(3) | | Includes balance sheet line items senior notes and mandatory convertible notes. |
During the first quarter of 2007, we re-presented our balance sheet to report margin receivables and customer payables directly on the face of the balance sheet. The remaining components of brokerage receivables and brokerage payables are now reported in the “Other assets” and “Accounts payable, accrued and other liabilities” line items, respectively.
The margin receivables balance is a component of the margin debt balance, which is reported as a key retail metric of $7.6 billion and $7.0 billion at September 30, 2007 and December 31, 2006, respectively. The total margin debt balance is summarized as follows (dollars in thousands):
| | | | | | |
| | | September 30, 2007 | | December 31, 2006 |
Margin receivables | | $ | 7,529,971 | | $ | 6,828,448 |
Margin held by third parties and other | | | 100,319 | | | 174,652 |
| | | | | | |
Margin debt | | $ | 7,630,290 | | $ | 7,003,100 |
| | | | | | |
The increase in total assets was primarily the result of growth in loans receivable, net and available-for-sale mortgage-backed and investment securities. The growth in available-for-sale mortgage-backed and investment securities was driven primarily by growth in mortgage-backed securities. The growth in loans receivable, net was driven primarily by growth in one- to four-family real estate loans. In the future, we plan to hold total assets
19
approximately at current levels or slightly lower. We plan to increase our one- to four-family real estate loans and margin loans, while allowing our home equity loan and securities portfolios to decline.
The increase in total liabilities primarily was attributable to the increase in deposits and securities sold under agreements to repurchase and other borrowings. The $5.1 billion increase in deposits was due primarily to the growth in the Complete Savings Account. The increase in securities sold under agreements to repurchase and other borrowings contributed to the growth of the loans receivable, net. We plan to continue to increase deposits, while allowing securities sold under agreements to repurchase and other borrowings to decline.
Loans Receivable, Net
Loans receivable, net are summarized as follows (dollars in thousands):
| | | | | | | | | | | |
| | | September 30, 2007 | | | December 31, 2006 | | | Variance | |
| | | | | 2007 vs. 2006 | |
One- to four-family | | $ | 16,857,241 | | | $ | 10,870,214 | | | 55 | % |
Home equity | | | 12,422,966 | | | | 11,809,008 | | | 5 | % |
Consumer and other loans: | | | | | | | | | | | |
Recreational vehicle | | | 2,000,818 | | | | 2,292,356 | | | (13) | % |
Marine | | | 552,485 | | | | 651,764 | | | (15) | % |
Commercial | | | 288,841 | | | | 219,008 | | | 32 | % |
Credit card | | | 93,878 | | | | 128,583 | | | (27) | % |
Other | | | 32,906 | | | | 81,239 | | | (59) | % |
Unamortized premiums, net | | | 349,797 | | | | 388,153 | | | (10) | % |
Allowance for loan losses | | | (209,038 | ) | | | (67,628 | ) | | 209 | % |
| | | | | | | | | | | |
Total loans receivable, net | | $ | 32,389,894 | | | $ | 26,372,697 | | | 23 | % |
| | | | | | | | | | | |
Loans receivable, net increased 23% to $32.4 billion at September 30, 2007 from $26.4 billion at December 31, 2006. We continued to focus on our growth in one- to four-family loans during the first and second quarters and allowed our consumer loans to decline. We expect to continue to grow one- to four-family real estate loans and to begin to allow home equity loans to decline. In addition, we expect consumer loans to continue to decline as we no longer originate recreational vehicle, marine and auto loans.
As a general matter, we do not originate or purchase sub-prime(1) loans to hold on our balance sheet; however, in the normal course of purchasing large pools of real estate loans, we invariably end up acquiring a de minimis amount of these loans. As of September 30, 2007, sub-prime real estate loans represented less than one-fifth of one percent of our total real estate loan portfolio.
During the first quarter of 2007, we entered into a credit default swap (“CDS”) on $4.0 billion of our first-lien residential real estate loan portfolio. A CDS provides, for a fee, an assumption by a third party of a portion of the credit risk related to the underlying loans. The CDS we entered into provides protection for losses in excess of 10 basis points, but not to exceed approximately 75 basis points. In addition, our regulatory risk-weighted assets were reduced as a result of this transaction because we transferred a portion of our credit risk to an unaffiliated third party.
| (1) | | Defined as borrowers with FICO scores less than 620. |
20
Available-for-Sale Mortgage-Backed and Investment Securities
Available-for-sale securities are summarized as follows (dollars in thousands):
| | | | | | | | | |
| | | September 30, 2007 | | December 31, 2006 | | Variance | |
| | | | | 2007 vs. 2006 | |
Mortgage-backed securities: | | | | | | | | | |
Backed by U.S. government sponsored and Federal agencies | | $ | 10,651,352 | | $ | 9,109,307 | | 17 | % |
Collateralized mortgage obligations and other | | | 1,216,398 | | | 1,108,385 | | 10 | % |
| | | | | | | | | |
Total mortgage-backed securities | | | 11,867,750 | | | 10,217,692 | | 16 | % |
| | | | | | | | | |
Investment securities: | | | | | | | | | |
Asset-backed securities | | | 2,755,315 | | | 2,161,728 | | 27 | % |
Publicly traded equity securities: | | | | | | | | | |
Preferred stock | | | 470,482 | | | 458,674 | | 3 | % |
Corporate investments | | | 9,761 | | | 24,139 | | (60 | )% |
FHLB stock | | | 409,460 | | | 244,212 | | 68 | % |
Other | | | 1,068,489 | | | 815,538 | | 31 | % |
| | | | | | | | | |
Total investment securities | | | 4,713,507 | | | 3,704,291 | | 27 | % |
| | | | | | | | | |
Total available-for-sale securities | | $ | 16,581,257 | | $ | 13,921,983 | | 19 | % |
| | | | | | | | | |
Available-for-sale securities represented 26% of total assets at both September 30, 2007 and December 31, 2006. Available-for-sale securities increased 19% to $16.6 billion at September 30, 2007 compared to December 31, 2006, due primarily to the growth in our mortgage-backed securities portfolio. Substantially all mortgage-backed securities backed by U.S. Government sponsored and Federal agencies are “AAA” rated and the majority of the asset-backed securities portfolio consisted of “AA” or higher rated securities.
Within our securities portfolio, the asset-backed securities portfolio has the greatest exposure to the current instability in the residential real estate and credit markets. As previously discussed, we incurred write downs totaling $197.6 million(1) during the three months ended September 30, 2007. These write downs were primarily confined to securities rated below “AA” in what we believe are the two highest risk categories within our asset-backed portfolio: CDOs and securities collateralized by second lien mortgages. We intend to sell these securities in an orderly fashion in future periods to reduce our exposure to further deterioration in these asset classes. Due to the inherent leverage within our asset-backed securities, even a slight deterioration in the performance of the underlying loans could result in a significant deterioration in the performance of our asset-backed securities. Therefore, continued deterioration in market conditions would likely cause additional write downs in our asset-backed securities portfolio.
Subsequent to September 30, 2007, we observed a significant decline in the fair value of our asset-backed securities portfolio, specifically our asset-backed CDO and second-lien securities. Our total exposure to asset-backed CDO and second-lien securities at September 30, 2007 was approximately $450 million in amortized cost.
The declines in fair value followed a series of rating agency downgrades of securities in this sector and occurred after the end of the third quarter. We believe there will likely be additional downgrades by the rating agencies of securities in this sector. Overall, approximately $208 million of our asset-backed securities were downgraded during the month of October and through November 7, 2007, including approximately $50 million of “AAA” rated asset-backed CDOs that were downgraded to below investment grade.
| (1) | | The $197.6 million of write downs on our asset-backed securities consisted of $159.8 million in losses on impairment of available-for-sale securities and $37.8 million in trading securities losses. |
21
We expect these declines will result in significant write downs to these securities during the fourth quarter; however, we cannot predict the amount for the fourth quarter as the write downs will depend on future market developments, including potential additional downgrades, and the estimated fair values of these securities on December 31, 2007.
In addition to our asset-backed CDO and second lien portfolio, we hold approximately $2.6 billion in amortized cost in other asset-backed securities, mainly securities backed by prime residential first-lien mortgages. These securities have also declined in fair value subsequent to September 30, 2007; however, the decline has not been as significant.
Deposits
Deposits are summarized as follows (dollars in thousands):
| | | | | | | | | |
| | | September 30, 2007 | | December 31, 2006 | | Variance | |
| | | | | 2007 vs. 2006 | |
Sweep deposit accounts | | $ | 11,465,265 | | $ | 10,837,124 | | 6 | % |
Money market and savings accounts | | | 12,332,228 | | | 7,634,241 | | 62 | % |
Certificates of deposit(1) | | | 4,336,325 | | | 4,737,253 | | (8 | )% |
Brokered certificates of deposit(2) | | | 631,869 | | | 483,777 | | 31 | % |
Checking accounts | | | 431,657 | | | 378,617 | | 14 | % |
| | | | | | | | | |
Total deposits | | $ | 29,197,344 | | $ | 24,071,012 | | 21 | % |
| | | | | | | | | |
(1) | | Represents retail certificates of deposit including retail brokered certificates of deposit. |
(2) | | Represents institutional certificates of deposit. |
Deposits represented 49% of total liabilities at both September 30, 2007 and December 31, 2006. Deposits increased $5.1 billion to $29.2 billion at September 30, 2007 compared to December 31, 2006, driven by a $4.7 billion increase in money market and savings accounts.
The increase in deposits is primarily the result of the growth in our Complete Savings Account. This product has driven measurable growth in cash from new and existing customers. Deposits generally provide us the benefit of lower interest costs, compared with wholesale funding alternatives.
The deposits balance is a component of the total customer cash and deposits balance reported as a customer activity metric of $39.6 billion for the nine months ended September 30, 2007. The total customer cash and deposits balance is summarized as follows (dollars in thousands):
| | | | | | | | | | | |
| | | September 30, 2007 | | | December 31, 2006 | | | Variance | |
| | | | | 2007 vs. 2006 | |
Deposits | | $ | 29,197,344 | | | $ | 24,071,012 | | | 21 | % |
Less: brokered certificates of deposit | | | (631,869 | ) | | | (483,777 | ) | | 31 | % |
| | | | | | | | | | | |
Deposits excluding brokered certificates of deposit | | | 28,565,475 | | | | 23,587,235 | | | 21 | % |
Customer payables | | | 7,002,986 | | | | 6,182,672 | | | 13 | % |
Customer cash balances held by third parties and other | | | 3,996,631 | | | | 3,819,860 | | | 5 | % |
| | | | | | | | | | | |
Total customer cash and deposits | | $ | 39,565,092 | | | $ | 33,589,767 | | | 18 | % |
| | | | | | | | | | | |
22
Securities Sold Under Agreements to Repurchase and Other Borrowings
Securities sold under agreements to repurchase and other borrowings are summarized as follows (dollars in thousands):
| | | | | | | | | |
| | | September 30, 2007 | | December 31, 2006 | | Variance | |
| | | | | 2007 vs. 2006 | |
Securities sold under agreements to repurchase | | $ | 10,826,523 | | $ | 9,792,422 | | 11 | % |
| | | | | | | | | |
FHLB advances | | $ | 8,540,822 | | $ | 4,865,466 | | 76 | % |
Subordinated debentures | | | 435,830 | | | 385,502 | | 13 | % |
Other | | | 90,877 | | | 72,994 | | 24 | % |
| | | | | | | | | |
Total other borrowings | | $ | 9,067,529 | | $ | 5,323,962 | | 70 | % |
| | | | | | | | | |
Securities sold under agreements to repurchase increased by 11% at September 30, 2007 compared to December 31, 2006. Securities sold under agreements to repurchase coupled with FHLB advances are the primary wholesale funding sources of the Bank. The Bank used these wholesale sources along with deposit growth to fund the increase in loans receivable. Other borrowings represented 15% and 11% of total liabilities at September 30, 2007 and December 31, 2006, respectively. The increase of $3.7 billion during the nine months ended September 30, 2007 was due primarily to an increase in FHLB advances. We expect total other borrowings to decline in future periods as we focus on replacing this funding with growth in retail deposits.
LIQUIDITY AND CAPITAL RESOURCES
Our liquidity and capital resources enable us to fund our operating activities, finance acquisitions and grow our assets. Cash flows are derived from our operations in the retail and institutional segments and our capital market activities. The segment cash flows provide capital to fund growth in our regulated subsidiaries. The Company’s cash and equivalents balance decreased to $1.4 billion for the period ended September 30, 2007.
Corporate Debt
Our current senior debt ratings are Ba2 (positive outlook) by Moody’s Investor Service(1), BB- (stable) by Standard & Poor’s and BB (high) by Dominion Bond Rating Service (“DBRS”). The Company’s long-term deposit ratings are Baa3 (positive outlook) by Moody’s Investor Service(1), BB+ (stable) by Standard & Poor’s and BBB (low) by DBRS. A significant change in these ratings may impact the rate and availability of future borrowings.
Liquidity Available from Subsidiaries
Liquidity available to the Company from its subsidiaries, other than Converging Arrows, Inc. (“Converging Arrows”), is limited by regulatory requirements. Converging Arrows is a subsidiary of the parent company. At September 30, 2007, Converging Arrows had $59.4 million of cash and investment securities available as a source of liquidity for the parent company. Converging Arrows is not restricted in its dealings with the parent company and may transfer funds to the parent company without regulatory approval. In addition to Converging Arrows, brokerage and banking subsidiaries may provide liquidity to the parent; however, they are restricted by regulatory guidelines.
E*TRADE Bank is prohibited by regulations from lending to the parent company. At September 30, 2007, E*TRADE Bank had approximately $192.6 million of capital available for dividend declaration without regulatory approval while still maintaining “well capitalized” status. E*TRADE Bank is also required by Office of Thrift Supervision (“OTS”) regulations to maintain tangible capital of at least 1.50% of tangible assets. E*TRADE Bank satisfied this requirement at September 30, 2007 and December 31, 2006. However, events
23
beyond management’s control, such as a significant deterioration in residential real estate and credit markets, could adversely affect future earnings and E*TRADE Bank’s ability to meet its future capital requirements.
Brokerage subsidiaries are required to maintain net capital equal to the greater of $250,000 or 2% of aggregate debit balances arising from customer transactions. At September 30, 2007 and December 31, 2006, all of our brokerage subsidiaries met their minimum net capital requirements. The Company’s broker-dealer subsidiaries had excess net capital of $745.2 million at September 30, 2007, of which $489.8 million is available for dividend while still maintaining a capital level above regulatory “early warning” guidelines.
Other Sources of Liquidity
In addition to the liquidity available from subsidiaries, the parent company held $103.4 million in cash available as a resource. We maintain committed financing facilities with banks totaling $250.0 million to meet corporate liquidity needs and $576.0 million in uncommitted financing to meet margin lending needs. There were no outstanding balances, and the full $826.0 million was available under these lines at September 30, 2007 and December 31, 2006.
We rely on borrowed funds, such as FHLB advances and securities sold under agreements to repurchase, to provide liquidity for the Bank. At September 30, 2007, the Bank had approximately $14.4 billion in additional borrowing capacity.
Other Liquidity Matters
We currently anticipate that our available cash resources and credit will be sufficient to meet our anticipated working capital and capital expenditure requirements for at least the next 12 months. We may need to raise additional funds in order to support more rapid expansion, develop new or enhanced products and services, respond to competitive pressures, acquire businesses or technologies or take advantage of unanticipated opportunities.
Credit Risk Management
Credit risk is the risk of loss resulting from adverse changes in a borrower’s or counterparty’s ability to meet its financial obligations under agreed upon terms. Our primary sources of credit risk are our loan and securities portfolios, where it results from extending credit to customers and purchasing securities, respectively. The degree of credit risk associated with our loans and securities varies based on many factors including the size of the transaction, the credit characteristics of the borrower, features of the loan product or security, the contractual terms of the related documents and the availability and quality of collateral. Credit risk is one of the most common risks in financial services and is one of our most significant risks.
Credit risk is monitored by our Credit Risk Committee. The Credit Risk Committee’s duties include monitoring asset quality trends, evaluating market conditions including those in residential real estate markets, determining the adequacy of our allowance for loan losses, establishing underwriting standards, approving large credit exposures, approving large portfolio purchases and delegating credit approval authority. The Credit Risk Committee uses detailed tracking and analysis to measure credit performance and routinely reviews and modifies credit policies as appropriate. The section below includes some of the information reviewed by the committee in determining asset quality and the level of adequacy of the allowance.
Lending Products and Underwriting Standards
We originate loans that generally fall into two categories:
| | • | | Mortgage Loans—Prime credit quality first-lien mortgage loans secured by single-family residences. |
| | • | | Home Equity Loans—Prime credit quality second-lien mortgage loans, including home equity lines of credit, secured by single-family residences. |
24
We originate loans primarily through our mortgage lending sales force. The loans are almost entirely secured by a primary residence for the purpose of purchase money, refinance, debt consolidation, or home equity loans. We originate both amortizing and interest-only mortgage loans; however, we do not originate negative amortization or option ARMs.
We price our loans based on the competitive environment as well as the risk elements inherent in the loan. We evaluate criteria such as, but not limited to: borrower credit score, loan-to-value ratio (“LTV”), documentation type, occupancy type and other risk elements.
Our underwriting guidelines were established with a focus on both the credit quality of the borrower as well as the adequacy of the collateral securing the loan. We have designed our underwriting guidelines so that our loans are salable in the secondary market. These guidelines include limitations on loan amount, loan-to-value ratio, debt-to-income ratio, documentation type and occupancy type. We also require borrowers to obtain mortgage insurance on higher loan-to-value first lien mortgage loans.
We supplement our loan underwriting process with a post-closing quality control process. Our quality control process consists of a re-verification of loan documentation, an underwriting and appraisal review, and other underwriting guideline reviews. This combination of an underwriting process and a quality control process allows us to evaluate and measure adherence to the prescribed underwriting guidelines.
Loan Portfolio
We track and review many factors to predict and monitor credit risk in our loan portfolios, which are primarily made up of loans secured by residential real estate. These factors include, but are not limited to: borrowers’ debt-to income ratio when loans are made, borrowers’ credit scores when loans are made, loan-to-value ratios, housing prices, documentation type, occupancy type, and loan type. We believe that loan type, loan-to-value ratios and credit scores are the key factors in determining future loan performance.
We believe certain categories of loans inherently have a higher level of credit risk due to characteristics of the borrower and/or features of the loan. Two of these categories are sub-prime and option ARM loans. As a general matter, we do not originate or purchase these loans to hold on our balance sheet; however, in the normal course of purchasing large pools of real estate loans, we invariably end up acquiring a de minimis amount of sub-prime loans. As of September 30, 2007, sub-prime real estate loans represented less than one-fifth of one percent of our total real estate loan portfolio and we held no option ARM loans.
As noted above, loan type, loan-to-value ratios and borrowers’ credit scores are key determinates of future loan performance. Our home equity loan portfolio is primarily second lien loans(1) on residential real estate properties, which have a higher level of credit risk than first lien mortgage loans. We believe home equity loans with a combined loan-to-value ratio (“CLTV”) of 90% or higher or a FICO score below 700 are the loans with the highest levels of credit risk in our portfolios.
25
(1) | | Approximately 13% of the home equity portfolio is in the first lien position. For home equity loans that are in a second lien position, we also hold the first lien position on the same residential real estate property for less than 1% of the loans in this portfolio. |
The breakdowns by LTV/CLTV and FICO score of our two main loan portfolios, one- to four-family and home equity, are as follows (dollars in thousands):
| | | | | | | | | | | | | | |
LTV/CLTV | | One- to
Four-Family | | Home Equity | | FICO | | One- to
Four-Family | | Home Equity |
<=70% | | $ | 7,134,469 | | $ | 3,823,262 | | >=720 | | $ | 11,104,189 | | $ | 7,284,273 |
70% - 80% | | | 9,212,228 | | | 2,177,195 | | 719 - 700 | | | 2,293,358 | | | 1,975,416 |
80% - 90% | | | 246,323 | | | 3,985,354 | | 699 - 680 | | | 1,788,304 | | | 1,736,651 |
>90% | | | 264,221 | | | 2,437,155 | | 679 - 660 | | | 1,072,209 | | | 803,750 |
| | | | | | | | | | | | | | |
Total | | $ | 16,857,241 | | $ | 12,422,966 | | 659 - 620 | | | 583,250 | | | 604,985 |
| | | | | | | | <620 | | | 15,931 | | | 17,891 |
| | | | | | | | | | | | | | |
| | | | | | | | Total | | $ | 16,857,241 | | $ | 12,422,966 |
| | | | | | | | | | | | | | |
In addition to the factors described above, we monitor credit trends in loans by acquisition channel and vintage, which are summarized below (dollars in thousands):
| | | | | | | | | |
Acquisition Channel | | One- to
Four-Family | | Home Equity | | Total |
Purchased from a third party | | $ | 14,436,776 | | $ | 11,127,678 | | $ | 25,564,454 |
Originated by the Company | | | 2,420,465 | | | 1,295,288 | | | 3,715,753 |
| | | | | | | | | |
Total real estate loans | | $ | 16,857,241 | | $ | 12,422,966 | | $ | 29,280,207 |
| | | | | | | | | |
| | | | | | | | | |
Vintage Year | | One- to
Four-Family | | Home Equity | | Total |
2003 and prior | | $ | 1,792,964 | | $ | 954,464 | | $ | 2,747,428 |
2004 | | | 1,695,886 | | | 1,237,537 | | | 2,933,423 |
2005 | | | 3,082,319 | | | 2,920,112 | | | 6,002,431 |
2006 | | | 5,878,965 | | | 5,760,373 | | | 11,639,338 |
2007 | | | 4,407,107 | | | 1,550,480 | | | 5,957,587 |
| | | | | | | | | |
Total real estate loans | | $ | 16,857,241 | | $ | 12,422,966 | | $ | 29,280,207 |
| | | | | | | | | |
Allowance for Loan Losses
The allowance for loan losses is management’s estimate of credit losses inherent in our loan portfolio as of the balance sheet date. The estimate of the allowance for loan losses is based on a variety of factors, including the composition and quality of the portfolio; delinquency levels and trends; probable expected losses for the next twelve months; current and historical charge-off and loss experience; current industry charge-off and loss experience; the condition of the real estate market and geographic concentrations within the loan portfolio; the interest rate climate as it affects adjustable-rate loans; the conditions of the residential real estate and credit markets; and general economic conditions. Determining the adequacy of the allowance is complex and requires judgment by management about the effect of matters that are inherently uncertain. Subsequent evaluations of the loan portfolio, in light of the factors then prevailing, may result in significant changes in the allowance for loan losses in future periods. We believe our allowance for loan losses at September 30, 2007 is representative of probable losses inherent in the loan portfolio at the balance sheet date.
In determining the allowance for loan losses, we allocate a portion of the allowance to various loan products based on an analysis of individual loans and pools of loans. However, the entire allowance is available to absorb credit losses inherent in the total loan portfolio as of the balance sheet date.
26
The following table presents the allowance for loan losses by major loan category (dollars in thousands):
| | | | | | | | | | | | | | | | | | | | | | | | |
| | | One- to Four-Family | | | Home Equity | | | Consumer and Other | | | Total | |
| | | Allowance | | Allowance
as a % of Loans
Receivable(1) | | | Allowance | | Allowance
as a % of Loans
Receivable(1) | | | Allowance | | Allowance
as a % of Loans
Receivable(1) | | | Allowance | | Allowance
as a % of Loans
Receivable(1) | |
September 30, 2007 | | $ | 9,363 | | 0.06 | % | | $ | 175,088 | | 1.38 | % | | $ | 24,587 | | 0.82 | % | | $ | 209,038 | | 0.64 | % |
December 31, 2006 | | $ | 7,760 | | 0.07 | % | | $ | 31,671 | | 0.26 | % | | $ | 28,197 | | 0.82 | % | | $ | 67,628 | | 0.26 | % |
(1) | | Allowance as a percentage of loans receivable is calculated based on each respective categories gross loans receivable. |
During the nine months ended September 30, 2007, the allowance for loan losses increased by $141.4 million from the level at December 31, 2006. This increase was driven primarily by the increase in the allowance allocated to the home equity loan portfolio, which deteriorated significantly during the three months ended September 30, 2007. We believe this deterioration was caused by several factors, which are described below. First, the combined impact of rising mortgage rates and home price depreciation in key markets contributed to the declining performance of our home equity loan portfolio. Second, concerns that began in the sub-prime mortgage loan market spread to the broader credit markets in the third quarter of 2007 resulting in a significant deterioration in the overall credit markets. This deterioration led to a dramatic tightening of lending standards across the industry, and general liquidity pressure for many mortgage lenders, some of whom ultimately ceased operations as a result. The factors described above dramatically reduced the ability of borrowers to refinance their mortgage loans, specifically their home equity loans, therefore drastically increasing the risk of loss once a loan becomes delinquent. During the third quarter of 2007, we also observed a decline in the percentage of delinquent loans that cure prior to charge-off or foreclosure once they have become delinquent. We attribute this change in behavior to the factors described above, which have significantly limited borrowers’ alternatives to avoid defaulting on their loans. In addition, because of the likely decline in value of the homes collateralizing our home equity loans, our ability to recover our investment by foreclosing on the underlying properties has diminished as well.
27
The following table provides an analysis of the net charge-offs for the three and nine months ended September 30, 2007 and 2006 (dollars in thousands):
| | | | | | | | | | | | | | |
| | | Charge-offs | | | Recoveries | | Net
Charge-
offs | | | % of
Average
Loans
(Annualized) | |
Three months ended September 30, 2007: | | | | | | | | | | | |
One- to four-family | | $ | (760 | ) | | $ | 308 | | $ | (452 | ) | | 0.01 | % |
Home equity | | | (46,328 | ) | | | 687 | | | (45,641 | ) | | 1.46 | % |
Recreational vehicle | | | (8,731 | ) | | | 4,029 | | | (4,702 | ) | | 0.90 | % |
Marine | | | (1,878 | ) | | | 876 | | | (1,002 | ) | | 0.70 | % |
Credit card | | | (1,891 | ) | | | 248 | | | (1,643 | ) | | 6.74 | % |
Other | | | (246 | ) | | | 484 | | | 238 | | | (0.29 | )% |
| | | | | | | | | | | | | | |
Total | | $ | (59,834 | ) | | $ | 6,632 | | $ | (53,202 | ) | | 0.66 | % |
| | | | | | | | | | | | | | |
Three months ended September 30, 2006: | | | | | | | | | | | | | | |
One- to four-family | | $ | (57 | ) | | $ | 107 | | $ | 50 | | | (0.00 | )% |
Home equity | | | (3,562 | ) | | | 222 | | | (3,340 | ) | | 0.13 | % |
Recreational vehicle | | | (5,131 | ) | | | 1,777 | | | (3,354 | ) | | 0.53 | % |
Marine | | | (1,779 | ) | | | 772 | | | (1,007 | ) | | 0.57 | % |
Credit card | | | (3,016 | ) | | | 224 | | | (2,792 | ) | | 5.54 | % |
Other | | | (405 | ) | | | 1,088 | | | 683 | | | (0.94 | )% |
| | | | | | | | | | | | | | |
Total | | $ | (13,950 | ) | | $ | 4,190 | | $ | (9,760 | ) | | 0.17 | % |
| | | | | | | | | | | | | | |
Nine months ended September 30, 2007: | | | | | | | | | | | | | | |
One- to four-family | | $ | (1,595 | ) | | $ | 415 | | $ | (1,180 | ) | | 0.01 | % |
Home equity | | | (75,219 | ) | | | 2,477 | | | (72,742 | ) | | 0.77 | % |
Recreational vehicle | | | (24,255 | ) | | | 12,050 | | | (12,205 | ) | | 0.74 | % |
Marine | | | (6,246 | ) | | | 3,522 | | | (2,724 | ) | | 0.60 | % |
Credit card | | | (8,957 | ) | | | 695 | | | (8,262 | ) | | 10.24 | % |
Other | | | (809 | ) | | | 1,565 | | | 756 | | | (0.32 | )% |
| | | | | | | | | | | | | | |
Total | | $ | (117,081 | ) | | $ | 20,724 | | $ | (96,357 | ) | | 0.42 | % |
| | | | | | | | | | | | | | |
Nine months ended September 30, 2006: | | | | | | | | | | | | | | |
One- to four-family | | $ | (321 | ) | | $ | 154 | | $ | (167 | ) | | 0.00 | % |
Home equity | | | (9,017 | ) | | | 406 | | | (8,611 | ) | | 0.13 | % |
Recreational vehicle | | | (18,080 | ) | | | 8,396 | | | (9,684 | ) | | 0.49 | % |
Marine | | | (4,133 | ) | | | 3,230 | | | (903 | ) | | 0.16 | % |
Credit card | | | (8,128 | ) | | | 600 | | | (7,528 | ) | | 5.09 | % |
Other | | | (2,243 | ) | | | 2,744 | | | 501 | | | (0.23 | )% |
| | | | | | | | | | | | | | |
Total | | $ | (41,922 | ) | | $ | 15,530 | | $ | (26,392 | ) | | 0.17 | % |
| | | | | | | | | | | | | | |
Loan losses are recognized when it is probable that a loss will be incurred. Our policy is to charge-off closed-end consumer loans when the loan is 120 days delinquent or when we determine that collection is not probable. For first-lien real estate loans, a charge-off is recognized when we foreclose on the property. For home equity loans and credit cards, our policy is to charge-off loans when collection is not probable or the loan has been delinquent for 180 days.
28
Net charge-offs for the three and nine months ended September 30, 2007 compared to the same periods in 2006 increased by $43.4 million and $70.0 million, respectively. The overall increase was primarily due to higher net charge-offs on home equity loans, which was driven mainly by the same factors as described above. The continued pressure in the residential real estate market including home price depreciation, rising mortgage interest rates and tighter mortgage lending guidelines across the industry will likely lead to a higher level of charge-offs in the future. The following graph illustrates the net charge-offs by quarter:
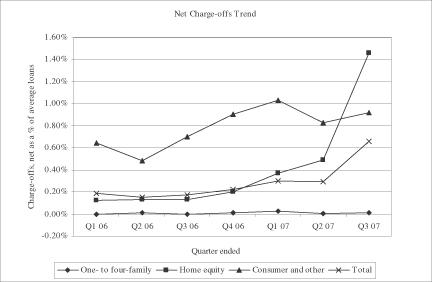
Nonperforming Assets
We classify loans as nonperforming when full and timely collection of interest or principal becomes uncertain or when they are 90 days past due. The following table shows the comparative data for nonperforming loans and assets (dollars in thousands):
| | | | | | | | |
| | | September 30, 2007 | | | December 31, 2006 | |
One- to four-family(1) | | $ | 115,446 | | | $ | 33,588 | |
Home equity | | | 151,336 | | | | 32,216 | |
Consumer and other loans | | | 7,399 | | | | 8,906 | |
| | | | | | | | |
Total nonperforming loans | | | 274,181 | | | | 74,710 | |
Real estate owned (“REO”) and other repossessed assets, net | | | 22,852 | | | | 12,904 | |
| | | | | | | | |
Total nonperforming assets, net | | $ | 297,033 | | | $ | 87,614 | |
| | | | | | | | |
Total nonperforming loans receivable as a percentage of total gross loans receivable | | | 0.84 | % | | | 0.28 | % |
| | | | | | | | |
One- to four-family allowance for loan losses as a percentage of one- to four-family nonperforming loans receivable | | | 8.11 | % | | | 23.10 | % |
| | | | | | | | |
Home equity allowance for loan losses as a percentage of home equity nonperforming loans receivable | | | 115.69 | % | | | 98.31 | % |
| | | | | | | | |
Consumer and other allowance for loan losses as a percentage of consumer and other nonperforming loans receivable | | | 332.30 | % | | | 316.61 | % |
| | | | | | | | |
Total allowance for loan losses as a percentage of total nonperforming loans receivable | | | 76.24 | % | | | 90.52 | % |
| | | | | | | | |
(1) | | One- to four-family excludes held-for-sale loans of $0.7 million and $0.6 million at September 30, 2007 and December 31, 2006, respectively. Loans held-for-sale are accounted for at lower of cost or market value with adjustments recorded in the gain (loss) on loans and securities, net line item and are not considered in the allowance for loan losses. |
29
We expect nonperforming loan levels to increase over time due to the deteriorating conditions in the residential real estate and credit markets. The performance of any loan can be affected by external factors, such as economic conditions or factors particular to the borrower.
During the nine months ended September 30, 2007, our nonperforming assets, net increased $209.4 million from $87.6 million at December 31, 2006. The increase was attributed primarily to an increase in nonperforming one- to four-family loans of $81.9 million and home equity loans of $119.1 million for the period ended September 30, 2007 when compared to December 31, 2006.
The allowance as a percentage of total nonperforming loans receivable, net decreased from 91% at December 31, 2006 to 76% at September 30, 2007. Our total loan portfolio has shifted towards a larger concentration of one- to four-family real estate loans, where the risk of loss is generally less than the risk of loss on home equity real estate and consumer loans. As such, the total allowance as a percentage of nonperforming assets decreased.
In addition to nonperforming assets in the table above, we monitor loans where a borrower’s past credit history casts doubt on their ability to repay a loan (“Special Mention” loans). Special Mention loans represented $520.3 million, or 2%, and $259.0 million, or 1%, of the total loan portfolio at September 30, 2007 and December 31, 2006, respectively, and are generally secured by real estate assets, reducing the potential loss should they become nonperforming. These loans are actively monitored, continue to accrue interest and remain a component of the loans receivable balance. The increase in Special Mention loans was due primarily to an increase in the 30-day delinquency category of real estate loans. We expect migration from this category to more serious delinquency classifications to increase over time consistent with the current instability in the residential real estate and credit markets.
Securities
We focus primarily on security type and credit rating to monitor credit risk in our securities portfolios. We believe asset-backed securities represent our highest concentration of credit risk. The table below details the average credit ratings by type of asset as of September 30, 2007 (dollars in thousands):
| | | | | | | | | | | | | | | | | | |
| | | AA or
Higher | | A | | BBB | | Below
Investment
Grade | | Non-Rated | | Total |
Mortgage-backed securities | | $ | 12,372,763 | | $ | 498 | | $ | — | | $ | — | | $ | 106 | | $ | 12,373,367 |
Asset-backed securities | | | 1,767,037 | | | 814,324 | | | 431,529 | | | 16,528 | | | 28,950 | | | 3,058,368 |
Corporate bonds, municipal bonds and preferred stock | | | 1,965,985 | | | 15,524 | | | — | | | — | | | — | | | 1,981,509 |
| | | | | | | | | | | | | | | | | | |
Total | | $ | 16,105,785 | | $ | 830,346 | | $ | 431,529 | | $ | 16,528 | | $ | 29,056 | | $ | 17,413,244 |
| | | | | | | | | | | | | | | | | | |
SUMMARY OF CRITICAL ACCOUNTING POLICIES AND ESTIMATES
The preparation of our financial condition and results of operations requires us to make judgments and estimates that may have a significant impact upon the financial results of the Company. We believe that of our significant accounting policies, the following require estimates and assumptions that require complex, subjective judgments by management, which can materially impact reported results: allowance for loan losses and uncollectible margin loans; classification and valuation of certain investments; valuation and accounting for financial derivatives; estimates of effective tax rate; deferred taxes and valuation allowances; valuation of goodwill and other intangibles; and valuation and expensing of share-based payments. These are more fully described in “Management’s Discussion and Analysis of Financial Condition and Results of Operations” in our Annual Report on Form 10-K for the year ended December 31, 2006.
30
GLOSSARY OF TERMS
Active Trader—The customer segment that includes those who execute 30 or more trades per quarter.
Adjusted total assets—Bank-only assets composed of total assets plus/(less) unrealized losses (gains) on available-for-sale securities, less deferred tax assets, goodwill and certain other intangible assets.
Average commission per trade—Total retail segment commission revenue divided by total number of retail trades.
Average equity to average total assets—Average total shareholders’ equity divided by average total assets.
Bank—ETB Holdings, Inc. (“ETBH”), the entity that is our bank holding company and parent to E*TRADE Bank and E*TRADE Global Asset Management, Inc. (“ETGAM”).
Basis point—One one-hundredth of a percentage point.
Cash flow hedge—A financial derivative instrument designated in a hedging relationship that mitigates exposure to variability in expected future cash flows attributable to a particular risk.
Charge-off—The result of removing a loan or portion of a loan from an entity’s balance sheet because the loan is considered to be uncollectible.
Compensation and benefits as a percentage of revenue—Total compensation and benefits expense divided by total net revenue.
Contract for difference (“CFDs”)—A derivative based on an underlying stock or index that covers the difference between the nominal value at the opening of a trade and at the close of a trade. A CFD is researched and traded in the same manner as a stock.
Corporate investments—Primarily equity investments held at the parent company level that are not related to the ongoing business of the Company’s operating subsidiaries.
Customer cash and deposits—Customer cash, deposits, customer payables and money market balances, including those held by third parties.
Daily average revenue trades (“DARTs”)—Total revenue trades in a period divided by the number of trading days during that period.
Derivative—A financial instrument or other contract, the price of which is directly dependent upon the value of one or more underlying securities, interest rates or any agreed upon pricing index. Derivatives cover a wide assortment of financial contracts, including forward contracts, options and swaps.
E*TRADE Complete—An integrated trading, investing, banking and lending product that allows customers to manage their relationships with the Company through one account. E*TRADE Complete helps customers optimize cash and credit by utilizing tools designed to inform them of whether or not they are receiving the most appropriate rates for their cash and paying the most appropriate rates for credit.
Enterprise interest-bearing liabilities—Liabilities such as customer deposits, repurchase agreements, other borrowings and advances from the FHLB, certain customer credit balances and stock loan programs on which the Company pays interest; excludes customer money market balances held by third parties.
31
Enterprise interest-earning assets—Consists of the primary interest-earning assets of the Company and includes: loans receivable, mortgage-backed and available-for-sale securities, margin receivables, stock borrow balances, and cash required to be segregated under regulatory guidelines that earn interest for the Company.
Enterprise net interest income—The taxable equivalent basis net operating interest income excluding corporate interest income and corporate interest expense, stock conduit interest income and expense and interest earned on customer cash held by third parties.
Enterprise net interest spread—The taxable equivalent rate earned on average enterprise interest-earning assets less the rate paid on average enterprise interest-bearing liabilities, excluding corporate interest-earning assets and liabilities, stock conduit and cash held by third parties.
Exchange-traded funds—A fund that invests in a group of securities and trades like an individual stock on an exchange.
Fair value hedge—A financial derivative instrument designated in a hedging relationship that mitigates exposure to changes in the fair value of a recognized asset or liability or a firm commitment.
Generally Accepted Accounting Principles (“GAAP”)—Accounting principles generally accepted in the United States of America.
Interest rate cap—An options contract that puts an upper limit on a floating exchange rate. The writer of the cap has to pay the holder of the cap the difference between the floating rate and the upper limit when that upper limit is breached. There is usually a premium paid by the buyer of such a contract.
Interest rate floor—An options contract that puts a lower limit on a floating exchange rate. The writer of the floor has to pay the holder of the floor the difference between the floating rate and the lower limit when that lower limit is breached. There is usually a premium paid by the buyer of such a contract.
Interest rate swaps—Contracts that are entered into primarily as an asset/liability management strategy to reduce interest rate risk. Interest rate swap contracts are exchanges of interest rate payments, such as fixed-rate payments for floating-rate payments, based on notional principal amounts.
Main Street Investor—The customer segment that includes those who execute less than 30 trades per quarter and hold less than $50,000 in assets in combined retail accounts.
Margin debt—The extension of credit to brokerage customers of the Company, on and off balance sheet, where the loan is secured with securities owned by the customer.
Mass Affluent—The customer segment that includes those who hold $50,000 or more in assets in combined retail accounts.
Net Present Value of Equity (“NPVE”)—The present value of expected cash inflows from existing assets, minus the present value of expected cash outflows from existing liabilities, plus the expected cash inflows and outflows from existing derivatives and forward commitments. This calculation is performed for E*TRADE Bank.
Nonperforming assets—Assets that do not earn income, including those originally acquired to earn income (delinquent loans) and those not intended to earn income (REO). Loans are classified as nonperforming when full and timely collection of interest and principal becomes uncertain or when the loans are 90 days past due.
Notional amount—The specified dollar amount underlying a derivative on which the calculated payments are based.
32
Operating expenses—Total expense excluding interest, as shown on the Company’s consolidated statement of income (loss).
Operating margin—Income before other income (expense), income taxes and discontinued operations.
Operating margin (%)—Percentage of net revenue that goes to income before other income (expense), income taxes and discontinued operations. It is calculated by dividing our income before other income (expense), income taxes and discontinued operations by our total net revenue.
Option adjustable-rate mortgage (“ARM”) loan—An adjustable-rate mortgage loan that provides the borrower with the option to make a fully-amortizing, interest-only, or minimum payment each month. The minimum payment on an Option ARM loan is usually based on the interest rate charged during the introductory period. This introductory rate is usually significantly below the fully-indexed rate for loans with short duration introductory periods.
Options—Contracts that grant the purchaser, for a premium payment, the right, but not the obligation, to either purchase or sell the associated financial instrument at a set price during a period or at a specified date in the future.
Organic—Business related to new and existing customers as opposed to acquisitions.
Principal transactions—Transactions that primarily consist of revenue from market-making activities.
Real-estate owned repossessed assets (“REO”)—Ownership of real property by the Company, generally acquired as a result of foreclosure.
Repurchase agreement—An agreement giving the seller of an asset the right or obligation to buy back the same or similar securities at a specified price on a given date. These agreements are generally collateralized by mortgage-backed or investment-grade securities.
Retail client assets—Market value of all client assets held by the Company including security holdings, customer cash and deposits and vested unexercised options.
Retail deposits—Balances of retail customer cash held at the Bank; excludes brokered certificates of deposit.
Return on average total assets—Annualized net income from continuing operations divided by average assets.
Return on average total shareholders’ equity—Annualized net income from continuing operations divided by average shareholders’ equity.
Revenue growth—The difference between the current and prior comparable period total net revenue divided by the prior comparable period total net revenue.
Risk-weighted assets—Primarily computed by the assignment of specific risk-weightings assigned by the OTS to assets and off-balance sheet instruments for capital adequacy calculations. This calculation is for E*TRADE Bank only.
Stock conduit—The borrowing of shares from a Broker-Dealer and subsequently lending the same shares to another Broker-Dealer netting a fee.
Sweep deposit accounts—Accounts with the functionality to transfer brokerage cash balances to and from an FDIC-insured money market account at the Bank.
33
Taxable equivalent interest adjustment—The operating interest income earned on certain assets is completely or partially exempt from federal and/or state income tax. As such, these tax-exempt instruments typically yield lower returns than a taxable investment. To provide more meaningful comparison of yields and margins for all interest-earning assets, the interest income earned on tax exempt assets is increased to make it fully equivalent to interest income on other taxable investments. This adjustment is done for the analytic purposes in the net enterprise interest income/spread calculation and is not made on the consolidated statement of income (loss), as that is not permitted under GAAP.
Tier 1 Capital—Adjusted equity capital used in the calculation of capital adequacy ratios at E*TRADE Bank as required by the OTS. Tier 1 capital equals: total shareholder’s equity at E*TRADE Bank, plus/(less) unrealized losses (gains) on available-for-sale securities and cash flow hedges, less deferred tax assets, goodwill and certain other intangible assets.
34
ITEM 3. QUANTITATIVE AND QUALITATIVE DISCLOSURES ABOUT MARKET RISK
The following discussion about our market risk disclosure includes forward-looking statements. Actual results could differ materially from those projected in the forward-looking statements as a result of certain factors, including, but not limited to, those set forth in Item 1A. “Risk Factors” in our Annual Report on Form 10-K for the year ended December 31, 2006 and as updated in this report. Market risk is our exposure to changes in interest rates, foreign exchange rates and equity and commodity prices. Our exposure to interest rate risk is related primarily to interest-earning assets and interest-bearing liabilities.
Interest Rate Risk
The management of interest rate risk is essential to profitability. Interest rate risk is our exposure to changes in interest rates. In general, we manage our interest rate risk by balancing variable-rate and fixed-rate assets and liabilities and we utilize derivatives in a way that reduces our overall exposure to changes in interest rates. In recent years, we have managed our interest rate risk to achieve a minimum to moderate risk profile with limited exposure to earnings volatility resulting from interest rate fluctuations. Exposure to interest rate risk requires management to make complex assumptions regarding maturities, market interest rates and customer behavior. Changes in interest rates, including the following, could impact interest income and expense:
| | • | | Interest-earning assets and interest-bearing liabilities may re-price at different times or by different amounts creating a mismatch. |
| | • | | The yield curve may flatten or change shape affecting the spread between short- and long-term rates. Widening or narrowing spreads could impact net interest income. |
| | • | | Market interest rates may influence prepayments resulting in maturity mismatches. In addition, prepayments could impact yields as premium and discounts amortize. |
Exposure to market risk is dependent upon the distribution and composition of interest-earning assets, interest-bearing liabilities and derivatives. The differing risk characteristics of each product are managed to mitigate our exposure to interest rate fluctuations. At September 30, 2007, 93% of our total assets were enterprise interest-earning assets.
At September 30, 2007, approximately 70% of our total assets were residential real estate loans and available-for-sale mortgage-backed and asset-backed securities. The values of these assets are sensitive to changes in interest rates, as well as expected prepayment levels. As interest rates increase, fixed rate residential real estate loans and mortgage-backed securities tend to exhibit lower prepayments. The inverse is true in a falling rate environment.
When real estate loans prepay, unamortized premiums are written off. Depending on the timing of the prepayment, the write-offs of unamortized premiums may result in lower than anticipated yields. E*TRADE Bank’s Asset Liability Committee (“ALCO”) reviews estimates of the impact of changing market rates on loan production volumes and prepayments. This information is incorporated into our interest rate risk management strategy.
Our liability structure consists of transactional deposit relationships, such as savings and money market accounts; certificates of deposit; securities sold under agreements to repurchase; customer payables; wholesale collateralized borrowings from the FHLB and other entities; and long term notes. Our transactional deposit accounts and customer payables tend to be less rate-sensitive than wholesale borrowings. Agreements to repurchase securities and money market accounts re-price as interest rates change. Certificates of deposit re-price over time depending on maturities. FHLB advances and long-term notes generally have fixed rates.
35
Derivative Financial Instruments
We use derivative financial instruments to help manage our interest rate risk. Interest rate swaps involve the exchange of fixed-rate and variable-rate interest payments between two parties based on a contractual underlying notional amount, but do not involve the exchange of the underlying notional amounts. Option products are utilized primarily to decrease the market value changes resulting from the prepayment dynamics of the mortgage portfolio, as well as to protect against increases in funding costs. The types of options employed include Cap Options (“Caps”) and Floor Options (“Floors”), “Payor Swaptions” and “Receiver Swaptions.” Caps mitigate the market risk associated with increases in interest rates while Floors mitigate the risk associated with decreases in market interest rates. Similarly, Payor and Receiver Swaptions mitigate the market risk associated with the respective increases and decreases in interest rates. See derivative financial instruments discussion at Note 7—Accounting for Derivative Financial Instruments and Hedging Activities in Item 1. Consolidated Financial Statements.
For mortgage loans intended to be sold, Interest Rate Lock Commitments (“IRLCs”) are considered derivatives with changes in fair value recorded in earnings. IRLCs are commitments issued to borrowers that lock in an interest rate now for a loan closing in one to three months. These locks, initially recorded with a fair value of zero, will fluctuate in value during the lock period as market interest rates change. See mortgage banking activities discussion at Note 7—Accounting for Derivative Financial Instruments and Hedging Activities in Item 1. Consolidated Financial Statements.
Scenario Analysis
Scenario analysis is an advanced approach to estimating interest rate risk exposure. Under the Net Present Value of Equity (“NPVE”) approach, the present value of all existing assets, liabilities, derivatives and forward commitments are estimated and then combined to produce a NPVE figure. The sensitivity of this value to changes in interest rates is then determined by applying alternative interest rate scenarios, which include, but are not limited to, instantaneous parallel shifts up 100, 200 and 300 basis points and down 100 and 200 basis points. The NPVE method is used at the E*TRADE Bank level and not for the Company. During the first quarter of 2007, E*TRADE Clearing LLC (“ETC”) became a wholly-owned operating subsidiary of E*TRADE Bank.
E*TRADE Bank has 95% and 81% of our enterprise interest-earning assets at September 30, 2007 and December 31, 2006, respectively, and holds 96% and 79% of our enterprise interest-bearing liabilities at September 30, 2007 and December 31, 2006, respectively. The sensitivity of NPVE at September 30, 2007 and December 31, 2006 and the limits established by E*TRADE Bank’s Board of Directors are listed below (dollars in thousands):
| | | | | | | | | | |
| | | Change in NPVE | | Board Limit |
| | | September 30, 2007(1) | | December 31, 2006 | |
Parallel Change in
Interest Rates (bps) | | Amount | | Percentage | | Amount | | Percentage | |
+300 | | $(590,449) | | (20)% | | $ (52,325) | | (2)% | | (55)% |
+200 | | $(409,152) | | (14)% | | $ (32,680) | | (1)% | | (30)% |
+100 | | $(210,120) | | (7)% | | $ (15,303) | | (1)% | | (20)% |
-100 | | $ 133,901 | | 5% | | $(159,618) | | (6)% | | (20)% |
-200 | | $ 1,060 | | 0% | | $(560,142) | | (20)% | | (30)% |
(1) | | Amounts and percentages include ETC. |
Under criteria published by the OTS, E*TRADE Bank’s overall interest rate risk exposure at September 30, 2007 was characterized as “minimum.” We actively manage our interest rate risk positions. As interest rates change, we will re-adjust our strategy and mix of assets, liabilities and derivatives to optimize our position. For example, a 100 basis points increase in rates may not result in a change in value as indicated above. The ALCO monitors E*TRADE Bank’s interest rate risk position.
36
Other Market Risk
Equity Security Risk
Equity securities risk is the risk of potential loss from investing in public and private equity securities including foreign currency exchange risk. We hold equity securities for corporate investment purposes and in trading securities for market-making purposes. The foreign currency exchange risk associated with these investments is not material to the Company. For corporate investment purposes, we currently hold publicly traded equity securities, in which we had an estimated fair value of $9.8 million as of September 30, 2007. See the corporate investments line item in the publicly traded equity securities section in Note 5—Available-for-Sale Mortgage-Backed and Investment Securities in Item 1. Consolidated Financial Statements.
37
PART I—FINANCIAL INFORMATION
| ITEM 1. | CONSOLIDATED FINANCIAL STATEMENTS (UNAUDITED) |
E*TRADE FINANCIAL CORPORATION AND SUBSIDIARIES
CONSOLIDATED STATEMENT OF INCOME (LOSS)
(In thousands, except per share amounts)
(Unaudited)
| | | | | | | | | | | | | | | | |
| | | Three Months Ended September 30, | | | Nine Months Ended September 30 | |
| | | 2007 | | | 2006 | | | 2007 | | | 2006 | |
Revenue: | | | | | | | | | | | | | | | | |
Operating interest income | | $ | 951,836 | | | $ | 731,429 | | | $ | 2,687,403 | | | $ | 1,986,096 | |
Operating interest expense | | | (533,804 | ) | | | (376,293 | ) | | | (1,464,621 | ) | | | (961,569 | ) |
| | | | | | | | | | | | | | | | |
Net operating interest income | | | 418,032 | | | | 355,136 | | | | 1,222,782 | | | | 1,024,527 | |
Provision for loan losses | | | (186,536 | ) | | | (12,547 | ) | | | (237,767 | ) | | | (33,014 | ) |
| | | | | | | | | | | | | | | | |
Net operating interest income after provision for loan losses | | | 231,496 | | | | 342,589 | | | | 985,015 | | | | 991,513 | |
| | | | | | | | | | | | | | | | |
Commission | | | 188,403 | | | | 133,606 | | | | 517,164 | | | | 476,771 | |
Fees and service charges | | | 64,802 | | | | 58,330 | | | | 189,746 | | | | 174,001 | |
Principal transactions | | | 20,889 | | | | 22,697 | | | | 78,739 | | | | 84,979 | |
Gain (loss) on loans and securities, net | | | (197,057 | ) | | | 16,003 | | | | (174,354 | ) | | | 38,738 | |
Other revenue | | | 12,699 | | | | 8,541 | | | | 33,469 | | | | 25,471 | |
| | | | | | | | | | | | | | | | |
Total non-interest income | | | 89,736 | | | | 239,177 | | | | 644,764 | | | | 799,960 | |
| | | | | | | | | | | | | | | | |
Total net revenue | | | 321,232 | | | | 581,766 | | | | 1,629,779 | | | | 1,791,473 | |
| | | | | | | | | | | | | | | | |
Expense excluding interest: | | | | | | | | | | | | | | | | |
Compensation and benefits | | | 117,538 | | | | 110,705 | | | | 360,399 | | | | 352,334 | |
Clearing and servicing | | | 78,784 | | | | 62,500 | | | | 220,213 | | | | 189,926 | |
Advertising and market development | | | 26,508 | | | | 23,914 | | | | 108,038 | | | | 89,115 | |
Communications | | | 27,525 | | | | 25,576 | | | | 79,502 | | | | 84,818 | |
Professional services | | | 21,014 | | | | 20,741 | | | | 71,161 | | | | 71,715 | |
Depreciation and amortization | | | 22,205 | | | | 18,565 | | | | 61,663 | | | | 56,181 | |
Occupancy and equipment | | | 22,848 | | | | 22,150 | | | | 69,247 | | | | 63,082 | |
Amortization of other intangibles | | | 10,485 | | | | 12,087 | | | | 30,940 | | | | 35,391 | |
Facility restructuring and other exit activities | | | 5,871 | | | | 16,684 | | | | 5,104 | | | | 19,315 | |
Other | | | 47,824 | | | | 45,675 | | | | 150,925 | | | | 101,888 | |
| | | | | | | | | | | | | | | | |
Total expense excluding interest | | | 380,602 | | | | 358,597 | | | | 1,157,192 | | | | 1,063,765 | |
| | | | | | | | | | | | | | | | |
Income (loss) before other income (expense), income taxes and discontinued operations | | | (59,370 | ) | | | 223,169 | | | | 472,587 | | | | 727,708 | |
Other income (expense): | | | | | | | | | | | | | | | | |
Corporate interest income | | | 1,018 | | | | 1,942 | | | | 3,724 | | | | 6,091 | |
Corporate interest expense | | | (37,365 | ) | | | (37,964 | ) | | | (113,022 | ) | | | (114,586 | ) |
Gain (loss) on sales of investments, net | | | (18 | ) | | | 26,991 | | | | 37,005 | | | | 59,897 | |
Loss on early extinguishment of debt | | | (37 | ) | | | — | | | | (6 | ) | | | (703 | ) |
Equity in income (loss) of investments and venture funds | | | (741 | ) | | | 2,519 | | | | 6,514 | | | | 1,701 | |
| | | | | | | | | | | | | | | | |
Total other income (expense) | | | (37,143 | ) | | | (6,512 | ) | | | (65,785 | ) | | | (47,600 | ) |
| | | | | | | | | | | | | | | | |
Income (loss) before income taxes and discontinued operations | | | (96,513 | ) | | | 216,657 | | | | 406,802 | | | | 680,108 | |
Income tax expense (benefit) | | | (38,065 | ) | | | 66,429 | | | | 136,711 | | | | 230,204 | |
| | | | | | | | | | | | | | | | |
Net income (loss) from continuing operations | | | (58,448 | ) | | | 150,228 | | | | 270,091 | | | | 449,904 | |
Discontinued operations, net of tax: | | | | | | | | | | | | | | | | |
Loss from discontinued operations | | | — | | | | — | | | | — | | | | (721 | ) |
Gain on disposal of discontinued operations | | | — | | | | 3,021 | | | | — | | | | 3,021 | |
| | | | | | | | | | | | | | | | |
Gain from discontinued operations, net of tax | | | — | | | | 3,021 | | | | — | | | | 2,300 | |
| | | | | | | | | | | | | | | | |
Net income (loss) | | $ | (58,448 | ) | | $ | 153,249 | | | $ | 270,091 | | | $ | 452,204 | |
| | | | | | | | | | | | | | | | |
Basic earnings (loss) per share from continuing operations | | $ | (0.14 | ) | | $ | 0.35 | | | $ | 0.64 | | | $ | 1.07 | |
Basic earnings per share from discontinued operations | | | — | | | | 0.01 | | | | — | | | | 0.01 | |
| | | | | | | | | | | | | | | | |
Basic net earnings (loss) per share | | $ | (0.14 | ) | | $ | 0.36 | | | $ | 0.64 | | | $ | 1.08 | |
| | | | | | | | | | | | | | | | |
Diluted earnings (loss) per share from continuing operations | | $ | (0.14 | ) | | $ | 0.34 | | | $ | 0.62 | | | $ | 1.03 | |
Diluted earnings per share from discontinued operations | | | — | | | | 0.01 | | | | — | | | | 0.00 | |
| | | | | | | | | | | | | | | | |
Diluted net earnings (loss) per share | | $ | (0.14 | ) | | $ | 0.35 | | | $ | 0.62 | | | $ | 1.03 | |
| | | | | | | | | | | | | | | | |
Shares used in computation of per share data: | | | | | | | | | | | | | | | | |
Basic | | | 420,964 | | | | 423,736 | | | | 422,676 | | | | 420,148 | |
Diluted | | | 420,964 | | | | 438,883 | | | | 433,776 | | | | 436,959 | |
See accompanying notes to consolidated financial statements
38
E*TRADE FINANCIAL CORPORATION AND SUBSIDIARIES
CONSOLIDATED BALANCE SHEET
(In thousands, except share amounts)
(Unaudited)
| | | | | | | | |
| | | September 30, 2007 | | | December 31, 2006 | |
ASSETS | | | | | | | | |
Cash and equivalents | | $ | 1,410,180 | | | $ | 1,212,234 | |
Cash and investments required to be segregated under Federal or other regulations | | | 357,847 | | | | 281,622 | |
Trading securities | | | 120,501 | | | | 178,600 | |
Available-for-sale mortgage-backed and investment securities (includes securities pledged to creditors with the right to sell or repledge of $12,274,337 at September 30, 2007 and $11,087,961 at December 31, 2006) | | | 16,581,257 | | | | 13,921,983 | |
Loans held-for-sale | | | 119,357 | | | | 283,496 | |
Margin receivables | | | 7,529,971 | | | | 6,828,448 | |
Loans receivable, net (net of allowance for loan losses of $209,038 at September 30, 2007 and $67,628 at December 31, 2006) | | | 32,389,894 | | | | 26,372,697 | |
Property and equipment, net | | | 360,366 | | | | 318,389 | |
Goodwill | | | 2,034,726 | | | | 2,072,920 | |
Other intangibles, net | | | 441,125 | | | | 471,933 | |
Other assets | | | 2,841,541 | | | | 1,796,981 | |
| | | | | | | | |
Total assets | | $ | 64,186,765 | | | $ | 53,739,303 | |
| | | | | | | | |
| | |
LIABILITIES AND SHAREHOLDERS’ EQUITY | | | | | | | | |
| | |
Liabilities: | | | | | | | | |
Deposits | | $ | 29,197,344 | | | $ | 24,071,012 | |
Securities sold under agreements to repurchase | | | 10,826,523 | | | | 9,792,422 | |
Customer payables | | | 7,002,986 | | | | 6,182,672 | |
Other borrowings | | | 9,067,529 | | | | 5,323,962 | |
Senior notes | | | 1,436,794 | | | | 1,401,592 | |
Mandatory convertible notes | | | 444,318 | | | | 440,577 | |
Accounts payable, accrued and other liabilities | | | 2,107,288 | | | | 2,330,696 | |
| | | | | | | | |
Total liabilities | | | 60,082,782 | | | | 49,542,933 | |
| | | | | | | | |
| | |
Shareholders’ equity: | | | | | | | | |
Common stock, $0.01 par value, shares authorized: 600,000,000; shares issued and outstanding: 423,650,257 at September 30, 2007 and 426,304,136 at December 31, 2006 | | | 4,237 | | | | 4,263 | |
Additional paid-in capital (“APIC”) | | | 3,118,944 | | | | 3,184,290 | |
Retained earnings | | | 1,464,477 | | | | 1,209,289 | |
Accumulated other comprehensive loss | | | (483,675 | ) | | | (201,472 | ) |
| | | | | | | | |
Total shareholders’ equity | | | 4,103,983 | | | | 4,196,370 | |
| | | | | | | | |
Total liabilities and shareholders’ equity | | $ | 64,186,765 | | | $ | 53,739,303 | |
| | | | | | | | |
See accompanying notes to consolidated financial statements
39
E*TRADE FINANCIAL CORPORATION AND SUBSIDIARIES
CONSOLIDATED STATEMENT OF COMPREHENSIVE INCOME (LOSS)
(In thousands)
(Unaudited)
| | | | | | | | | | | | | | | | |
| | | Three Months Ended September 30, | | | Nine Months Ended September 30, | |
| | | 2007 | | | 2006 | | | 2007 | | | 2006 | |
Net income (loss) | | $ | (58,448 | ) | | $ | 153,249 | | | $ | 270,091 | | | $ | 452,204 | |
Other comprehensive income (loss) | | | | | | | | | | | | | | | | |
Available-for-sale securities, net of tax: | | | | | | | | | | | | | | | | |
Unrealized gains (losses), net | | | (182,574 | ) | | | 156,018 | | | | (375,321 | ) | | | (25,873 | ) |
Reclassification into earnings, net | | | 98,697 | | | | (38,291 | ) | | | 77,876 | | | | (65,814 | ) |
| | | | | | | | | | | | | | | | |
Net change from available-for-sale securities | | | (83,877 | ) | | | 117,727 | | | | (297,445 | ) | | | (91,687 | ) |
| | | | | | | | | | | | | | | | |
Cash flow hedging instruments: | | | | | | | | | | | | | | | | |
Unrealized gains (losses), net | | | (74,286 | ) | | | (107,665 | ) | | | (11,916 | ) | | | 43,078 | |
Reclassifications into earnings, net | | | 766 | | | | 827 | | | | 1,124 | | | | 5,907 | |
| | | | | | | | | | | | | | | | |
Net change from cash flow hedging instruments | | | (73,520 | ) | | | (106,838 | ) | | | (10,792 | ) | | | 48,985 | |
| | | | | | | | | | | | | | | | |
Foreign currency translation gains | | | 13,506 | | | | 2,740 | | | | 26,034 | | | | 8,317 | |
| | | | | | | | | | | | | | | | |
Other comprehensive income (loss) | | | (143,891 | ) | | | 13,629 | | | | (282,203 | ) | | | (34,385 | ) |
| | | | | | | | | | | | | | | | |
Comprehensive income (loss) | | $ | (202,339 | ) | | $ | 166,878 | | | $ | (12,112 | ) | | $ | 417,819 | |
| | | | | | | | | | | | | | | | |
See accompanying notes to consolidated financial statements
40
E*TRADE FINANCIAL CORPORATION AND SUBSIDIARIES
CONSOLIDATED STATEMENT OF SHAREHOLDERS’ EQUITY
(In thousands)
(Unaudited)
| | | | | | | | | | | | | | | | | | | | | | | |
| | | Common Stock | | | Additional
Paid-in
Capital | | | Retained
Earnings | | | Accumulated
Other
Comprehensive
Loss | | | Total
Shareholders’
Equity | |
| | | Shares | | | Amount | | | | | |
Balance, December 31, 2006 | | 426,304 | | | $ | 4,263 | | | $ | 3,184,290 | | | $ | 1,209,289 | | | $ | (201,472 | ) | | $ | 4,196,370 | |
Cumulative effect of adoption of FIN 48 | | — | | | | — | | | | — | | | | (14,903 | ) | | | — | | | | (14,903 | ) |
| | | | | | | | | | | | | | | | | | | | | | | |
Adjusted balance | | 426,304 | | | | 4,263 | | | | 3,184,290 | | | | 1,194,386 | | | | (201,472 | ) | | | 4,181,467 | |
Net income | | — | | | | — | | | | — | | | | 270,091 | | | | — | | | | 270,091 | |
Other comprehensive loss | | — | | | | — | | | | — | | | | — | | | | (282,203 | ) | | | (282,203 | ) |
Exercise of stock options and purchase plans, including tax benefit | | 4,137 | | | | 41 | | | | 53,575 | | | | — | | | | — | | | | 53,616 | |
Repurchases of common stock | | (7,228 | ) | | | (72 | ) | | | (148,559 | ) | | | — | | | | — | | | | (148,631 | ) |
Issuance of restricted stock | | 674 | | | | 7 | | | | (7 | ) | | | — | | | | — | | | | — | |
Cancellation of restricted stock | | (159 | ) | | | (2 | ) | | | 2 | | | | — | | | | — | | | | — | |
Retirement of restricted stock to pay taxes | | (175 | ) | | | (2 | ) | | | (4,010 | ) | | | — | | | | — | | | | (4,012 | ) |
Amortization of deferred stock compensation to APIC under SFAS No. 123(R) | | — | | | | — | | | | 31,441 | | | | — | | | | — | | | | 31,441 | |
Other | | 97 | | | | 2 | | | | 2,212 | | | | — | | | | — | | | | 2,214 | |
| | | | | | | | | | | | | | | | | | | | | | | |
Balance, September 30, 2007 | | 423,650 | | | $ | 4,237 | | | $ | 3,118,944 | | | $ | 1,464,477 | | | $ | (483,675 | ) | | $ | 4,103,983 | |
| | | | | | | | | | | | | | | | | | | | | | | |
| | | | | | | | | | | | | | | | | | | | | | |
| | | Common Stock | | | Additional
Paid-in
Capital | | | Retained
Earnings | | Accumulated
Other
Comprehensive
Loss | | | Total Shareholders’ Equity | |
| | | Shares | | | Amount | | | | | |
Balance, December 31, 2005 | | 416,582 | | | $ | 4,166 | | | $ | 2,990,676 | | | $ | 580,430 | | $ | (175,712 | ) | | $ | 3,399,560 | |
Net income | | — | | | | — | | | | — | | | | 452,204 | | | — | | | | 452,204 | |
Other comprehensive loss | | — | | | | — | | | | — | | | | — | | | (34,385 | ) | | | (34,385 | ) |
Exercise of stock options and warrants, including tax benefit | | 4,911 | | | | 49 | | | | 66,897 | | | | — | | | — | | | | 66,946 | |
Issuance of common stock upon conversion of 6% convertible debt | | 7,772 | | | | 78 | | | | 183,333 | | | | — | | | — | | | | 183,411 | |
Issuance of common stock upon acquisition | | 847 | | | | 8 | | | | 19,742 | | | | — | | | — | | | | 19,750 | |
Repurchases of common stock | | (3,543 | ) | | | (35 | ) | | | (82,739 | ) | | | — | | | — | | | | (82,774 | ) |
Issuance of restricted stock | | 620 | | | | 6 | | | | (6 | ) | | | — | | | — | | | | — | |
Cancellation of restricted stock | | (98 | ) | | | (1 | ) | | | 1 | | | | — | | | — | | | | — | |
Retirement of restricted stock to pay taxes | | (84 | ) | | | (1 | ) | | | (2,001 | ) | | | — | | | — | | | | (2,002 | ) |
Amortization of deferred stock compensation to APIC under SFAS No. 123(R) | | — | | | | — | | | | 27,618 | | | | — | | | — | | | | 27,618 | |
Other | | — | | | | — | | | | (71 | ) | | | — | | | — | | | | (71 | ) |
| | | | | | | | | | | | | | | | | | | | | | |
Balance, September 30, 2006 | | 427,007 | | | $ | 4,270 | | | $ | 3,203,450 | | | $ | 1,032,634 | | $ | (210,097 | ) | | $ | 4,030,257 | |
| | | | | | | | | | | | | | | | | | | | | | |
See accompanying notes to consolidated financial statements
41
E*TRADE FINANCIAL CORPORATION AND SUBSIDIARIES
CONSOLIDATED STATEMENT OF CASH FLOWS
(In thousands)
(Unaudited)
| | | | | | | | |
| | | Nine Months Ended
September 30, | |
| | | 2007 | | | 2006 | |
Cash flows from operating activities: | | | | | | | | |
Net income | | $ | 270,091 | | | $ | 452,204 | |
Adjustments to reconcile net income to net cash provided by operating activities: | | | | | | | | |
Provision for loan losses | | | 237,767 | | | | 33,014 | |
Depreciation and amortization (including discount amortization and accretion) | | | 214,153 | | | | 215,171 | |
Gain (loss) on loans and securities, net and gain (loss) on sales of investments, net | | | 137,349 | | | | (54,539 | ) |
Equity in income of investments and venture funds | | | (6,514 | ) | | | (1,701 | ) |
Non-cash facility restructuring costs and other exit activities | | | 2,556 | | | | 11,489 | |
Stock-based compensation | | | 31,436 | | | | 27,618 | |
Tax benefit from tax deductions in excess of compensation expense | | | (18,204 | ) | | | (23,121 | ) |
Other | | | 4,466 | | | | 2,319 | |
Net effect of changes in assets and liabilities: | | | | | | | | |
(Increase) decrease in cash and investments required to be segregated under Federal or other regulations | | | (44,736 | ) | | | 360,288 | |
Increase in margin receivables | | | (646,734 | ) | | | (691,883 | ) |
Increase in customer payables | | | 448,359 | | | | 286,493 | |
Proceeds from sales, repayments and maturities of loans held-for-sale | | | 1,257,831 | | | | 1,095,150 | |
Purchases and originations of loans held-for-sale | | | (1,093,794 | ) | | | (1,409,547 | ) |
Proceeds from sales, repayments and maturities of trading securities | | | 1,517,398 | | | | 1,463,808 | |
Purchases of trading securities | | | (1,484,346 | ) | | | (1,480,518 | ) |
Other assets | | | (866,813 | ) | | | 439,060 | |
Accounts payable, accrued and other liabilities | | | 152,416 | | | | (92,913 | ) |
Facility restructuring liabilities | | | (7,462 | ) | | | (13,568 | ) |
| | | | | | | | |
Net cash provided by operating activities | | | 105,219 | | | | 618,824 | |
| | | | | | | | |
Cash flows from investing activities: | | | | | | | | |
Purchases of available-for-sale mortgage-backed and investment securities | | | (11,156,104 | ) | | | (8,166,130 | ) |
Proceeds from sales, maturities of and principal payments on available-for-sale mortgage-backed and investment securities | | | 7,945,345 | | | | 5,389,695 | |
Net increase in loans receivable | | | (6,373,120 | ) | | | (3,694,479 | ) |
Purchases of property and equipment | | | (103,893 | ) | | | (68,241 | ) |
Cash used in business acquisitions, net | | | (6,244 | ) | | | (15,135 | ) |
Net cash flow from derivatives hedging assets | | | 2,255 | | | | (50,257 | ) |
Other | | | (49,198 | ) | | | 20,459 | |
| | | | | | | | |
Net cash used in investing activities | | $ | (9,740,959 | ) | | $ | (6,584,088 | ) |
| | | | | | | | |
See accompanying notes to consolidated financial statements
42
E*TRADE FINANCIAL CORPORATION AND SUBSIDIARIES
CONSOLIDATED STATEMENT OF CASH FLOWS—(Continued)
(In thousands)
(Unaudited)
| | | | | | | | |
| | | Nine Months Ended
September 30, | |
| | | 2007 | | | 2006 | |
Cash flows from financing activities: | | | | | | | | |
Net increase in deposits | | $ | 5,122,734 | | | $ | 6,367,905 | |
Advances from other long-term borrowings | | | 15,065,000 | | | | 2,449,414 | |
Payments on advances from other long-term borrowings | | | (11,393,811 | ) | | | (2,561,616 | ) |
Net increase (decrease) in securities sold under agreements to repurchase | | | 1,035,487 | | | | (116,877 | ) |
Net increase in other borrowed funds | | | 28,718 | | | | 66,492 | |
Payments for redemption of 6% convertible notes | | | — | | | | (1,754 | ) |
Proceeds from issuance of common stock from employee stock transactions | | | 35,412 | | | | 43,825 | |
Tax benefit from tax deductions in excess of compensation expense recognition | | | 18,204 | | | | 23,121 | |
Repurchases of common stock | | | (148,631 | ) | | | (82,774 | ) |
Proceeds from issuance of subordinated debentures and trust preferred securities | | | 41,000 | | | | 44,900 | |
Net cash flow from derivatives hedging liabilities | | | (34,125 | ) | | | 68,014 | |
| | | | | | | | |
Net cash provided by financing activities | | | 9,769,988 | | | | 6,300,650 | |
| | | | | | | | |
Effect of exchange rate on cash | | | 63,698 | | | | 20,064 | |
| | | | | | | | |
Increase in cash and equivalents | | | 197,946 | | | | 355,450 | |
Cash and equivalents, beginning of period | | | 1,212,234 | | | | 844,188 | |
| | | | | | | | |
Cash and equivalents, end of period | | $ | 1,410,180 | | | $ | 1,199,638 | |
| | | | | | | | |
Supplemental disclosures: | | | | | | | | |
Cash paid for interest | | $ | 1,666,769 | | | $ | 1,012,858 | |
Cash paid for income taxes | | $ | 136,298 | | | $ | 112,778 | |
Non-cash investing and financing activities: | | | | | | | | |
Transfers from loans to other real estate owned and repossessed assets | | $ | 63,324 | | | $ | 39,509 | |
Reclassification of loans held-for-sale to loans held-for-investment | | $ | 2,952 | | | $ | 124,817 | |
Issuance of common stock to retire debentures | | $ | — | | | $ | 183,411 | |
See accompanying notes to consolidated financial statements
43
E*TRADE FINANCIAL CORPORATION AND SUBSIDIARIES
NOTES TO CONSOLIDATED FINANCIAL STATEMENTS (UNAUDITED)
NOTE 1—ORGANIZATION, BASIS OF PRESENTATION AND SUMMARY OF SIGNIFICANT ACCOUNTING POLICIES
Organization—E*TRADE Financial Corporation (together with its subsidiaries, “E*TRADE” or the “Company”) is a global company offering a wide range of financial services to consumers under the brand “E*TRADE Financial.” The Company offers trading, investing, banking and lending products and services to its retail and institutional customers.
Basis of Presentation—The consolidated financial statements include the accounts of the Company and its majority-owned subsidiaries. Entities in which the Company holds at least a 20% ownership or in which there are other indicators of significant influence are generally accounted for by the equity method. Entities in which the Company holds less than 20% ownership and does not have the ability to exercise significant influence are generally carried at cost. Intercompany accounts and transactions are eliminated in consolidation. The Company evaluates investments including joint ventures, low income housing tax credit partnerships and other limited partnerships to determine if the Company is required to consolidate the entities under the guidance of FASB Interpretation No. 46 (Revised 2003),Consolidation of Variable Interest Entities-an interpretation of ARB No. 51 (“FIN 46R”).
Certain prior period items in these consolidated financial statements have been reclassified to conform to the current period presentation. As discussed in Note 2—Discontinued Operations, the operations of certain businesses have been accounted for as discontinued operations in accordance with the Statement of Financial Accounting Standard (“SFAS”) No. 144,Accounting for the Impairment or Disposal of Long-Lived Assets. Accordingly, results of operations from prior periods have been reclassified to discontinued operations. Unless noted, discussions herein pertain to the Company’s continuing operations.
These consolidated financial statements reflect all adjustments, which are all normal and recurring in nature, necessary to present fairly the financial position, results of operations and cash flows for the periods presented, and should be read in conjunction with the consolidated financial statements of E*TRADE Financial Corporation included in the Company’s Annual Report on Form 10-K for the year ended December 31, 2006.
The Company reports corporate interest income and expense separately from operating interest income and expense. The Company believes reporting these two items separately provides a clearer picture of the financial performance of the Company’s operations than would a presentation that combined these two items. Operating interest income and expense is generated from the operations of the Company and is a broad indicator of the Company’s success in its banking, lending and balance sheet management businesses. Corporate debt, which is the primary source of the corporate interest expense has been used primarily to finance acquisitions, such as Harrisdirect and BrownCo and generally has not been downstreamed to any of the Company’s operating subsidiaries.
Similarly, the Company reports gain (loss) on sales of investments, net separately from gain (loss) on loans and securities, net. The Company believes reporting these two items separately provides a clearer picture of the financial performance of its operations than would a presentation that combined these two items. Gain (loss) on loans and securities, net are the result of activities in the Company’s operations, namely its lending and balance sheet management businesses, including impairment on our available-for sale mortgage-backed and investment securities portfolio. Gain (loss) on sales of investments, net relates to historical equity investments of the Company at the corporate level and are not related to the ongoing business of the Company’s operating subsidiaries.
44
New Income Statement Reporting Format—During the first quarter of 2007, the Company re-defined the line item “Service charges and fees” by reclassifying certain fee-like revenue items formerly reported in “Other revenue” into the “Service charges and fees” line item, now called “Fees and service charges.” The fee-like revenue streams moved include payment for order flow, foreign exchange margin revenue, 12b-1 fees after rebates, fixed income product revenues and management fee revenue.
New Balance Sheet Reporting Format—During the first quarter of 2007, the Company re-presented its balance sheet to report margin receivables and customer payables directly on the face of the balance sheet. The remaining components of brokerage receivables and brokerage payables are now reported in the “Other assets” and “Accounts payable, accrued and other liabilities” line items, respectively.
Use of Estimates—The financial statements were prepared in accordance with GAAP, which require management to make estimates and assumptions that affect the amounts reported in the financial statements and related notes for the periods presented. Actual results could differ from management’s estimates. Material estimates in which management believes near-term changes could reasonably occur include allowance for loan losses and uncollectible margin receivables; classification and valuation of certain investments; valuation and accounting for financial derivatives; estimates of effective tax rates; deferred taxes and valuation allowances; valuation of goodwill and other intangibles; and valuation and expensing of share-based payments.
Financial Statement Descriptions and Related Accounting Policies—Below are descriptions and accounting policies for the Company’s new financial statement categories from those reported in the Company’s Annual Report on Form 10-K for the year ended December 31, 2006.
Margin Receivables—Margin receivables represent credit extended to customers and non-customers to finance their purchases of securities by borrowing against securities they currently own. Receivables from non-customers represent credit extended to principal officers and directors of the Company to finance their purchase of securities by borrowing against securities owned by them. Securities owned by customers and non-customers are held as collateral for amounts due on the margin receivables, the value of which is not reflected in the consolidated balance sheet. In many cases, the Company is permitted to sell or re-pledge these securities held as collateral and use the securities to enter into securities lending transactions, to collateralize borrowings or for delivery to counterparties to cover customer short positions. At September 30, 2007, the fair value of securities that the Company received as collateral in connection with margin receivables and stock borrowing activities, where the Company is permitted to sell or re-pledge the securities, was approximately $10.2 billion. Of this amount, $2.4 billion had been pledged or sold at September 30, 2007 in connection with securities loans, bank borrowings and deposits with clearing organizations.
Customer Payables—Customer payables to customers and non-customers represent credit balances in customer accounts arising from deposits of funds and sales of securities and other funds pending completion of securities transactions. The Company pays interest on certain customer payables balances.
Fees and Service Charges—Fees and service charges consist of account maintenance fees, servicing fee income, payments for order flow, foreign exchange margin revenue, 12b-1 fees after rebates, fixed income product revenue and management fee revenue. Account maintenance fees are charges to the customer either quarterly or annually and are accrued as earned. Payments for order flow are accrued in the same period in which the related securities transactions are completed or related services are rendered.
Other Revenue—Other revenue primarily consists of stock plan administration services and other revenue ancillary to the Company’s retail customer transactions. Stock plan administration services are recognized in accordance with applicable accounting guidance, including Statement of Position 97-2,Software Revenue Recognition.
New Accounting Standards—Below are the new accounting pronouncements that relate to activities in which the Company is engaged.
45
FIN 48—Accounting for Uncertainty in Income Taxes—an interpretation of FASB Statement 109
In July 2006, the FASB issued Interpretation No. 48,Accounting for Uncertainty in Income Taxes (“FIN 48”), which became effective for the Company on January 1, 2007. The interpretation prescribes a recognition threshold and a measurement attribute for the financial statement recognition and measurement of tax positions taken or expected to be taken in a tax return. For those benefits to be recognized, a tax position must be more-likely-than-not to be sustained upon examination by taxing authorities. The amount recognized is measured as the largest amount of benefit that is greater than 50% likely of being realized upon ultimate settlement. The Company’s reassessment of its tax positions in accordance with FIN 48 did not have a material impact on the results of operations, financial condition or liquidity. The impact of adoption was a $14.9 million reduction to beginning retained earnings. For additional information regarding the adoption of FIN 48, see Note 13—Income Taxes.
SFAS No. 156—Accounting for Servicing of Financial Assets
In March 2006, the FASB issued SFAS No. 156, Accounting for Servicing of Financial Assets, an amendment of SFAS No. 140,Accounting for Transfers and Servicing of Financial Assets and Extinguishments of Liabilities. This statement establishes, among other things, the accounting for all separately recognized servicing assets and liabilities. This statement amends SFAS No. 140 to require that all separately recognized servicing assets and liabilities be initially measured at fair value. The Company adopted this statement on January 1, 2007 and the impact of adoption was not material to the Company’s financial condition, results of operations or cash flows.
SFAS No. 157—Fair Value Measurements
In September 2006, the FASB issued SFAS No. 157, Fair Value Measurements. This statement establishes, among other things, a framework for measuring fair value and expands disclosure requirements as they relate to fair value measurements. The statement is effective at the beginning of an entity’s first fiscal year that begins after November 15, 2007 or January 1, 2008 for the Company. The Company is currently evaluating the impact this guidance will have on its financial condition, results of operations or cash flows.
SFAS No. 159—The Fair Value Option for Financial Assets and Financial Liabilities
In February 2007, the FASB issued SFAS No. 159,The Fair Value Option for Financial Assets and Financial Liabilities. This Statement provides an option under which a company may irrevocably elect fair value as the initial and subsequent measurement attribute for certain financial assets and liabilities. This fair value option will be available on a contract-by-contract basis with changes in fair value recognized in earnings as those changes occur. The statement is effective at the beginning of an entity’s first fiscal year that begins after November 15, 2007 or January 1, 2008 for the Company. The Company is currently evaluating the impact this guidance will have on its financial condition, results of operations or cash flows.
46
NOTE 2—DISCONTINUED OPERATIONS
E*TRADE Professional Trading, LLC
In December 2005, the Company decided to sell its professional agency business, E*TRADE Professional Trading, LLC. The Company recorded approximately $2.8 million in gain, net of tax, on the sale of this business during the three months ended September 30, 2006.
The following table summarizes the results of discontinued operations for the agency trading business (dollars in thousands):
| | | | | | | | | | | | | |
| | | Three Months
Ended September 30, | | Nine Months
Ended September 30, | |
| | | 2007 | | 2006 | | 2007 | | 2006 | |
Net revenue | | $ | — | | $ | — | | $ | — | | $ | 5,526 | |
| | | | | | | | | | | | | |
Loss from discontinued operations | | $ | — | | $ | — | | $ | — | | $ | (1,181 | ) |
Income tax benefit | | | — | | | — | | | — | | | (460 | ) |
| | | | | | | | | | | | | |
Loss from discontinued operations, net of tax | | $ | — | | $ | — | | $ | — | | $ | (721 | ) |
| | | | | | | | | | | | | |
NOTE 3—FACILITY RESTRUCTURING AND OTHER EXIT ACTIVITIES
The Company periodically evaluates and adjusts its estimated costs associated with its restructuring plans and other exit activities. Restructuring liabilities are included in accounts payable, accrued and other liabilities in the consolidated balance sheet. The following table summarizes the amount recognized by the Company as facility restructuring and other exit activities for the periods presented (dollars in thousands):
| | | | | | | | | | | | | | | |
| | | Three Months Ended September 30, | | | Nine Months Ended September 30, | |
| | | 2007 | | 2006 | | | 2007 | | | 2006 | |
2003 Restructuring Plan | | $ | 66 | | $ | (48 | ) | | $ | (263 | ) | | $ | (368 | ) |
2001 Restructuring Plan | | | 666 | | | 26 | | | | (188 | ) | | | (321 | ) |
Other exit activities | | | 5,139 | | | 16,706 | | | | 5,555 | | | | 20,004 | |
| | | | | | | | | | | | | | | |
Total facility restructuring and other exit activities | | $ | 5,871 | | $ | 16,684 | | | $ | 5,104 | | | $ | 19,315 | |
| | | | | | | | | | | | | | | |
2003 Restructuring Plan
In April 2003, the Company announced a restructuring plan (“2003 Restructuring Plan”) exiting and consolidating leased facilities and exiting and disposing of certain unprofitable product offerings and initiatives. Facility consolidation costs are expected to be paid over contractual periods ending in fiscal year 2010. The roll forward of the 2003 Restructuring Plan reserve is presented below (dollars in thousands):
| | | | | | | | | | | | |
| | | Facility Consolidation | | | Other | | | Total | |
Total 2003 restructuring reserve, originally recorded in 2003: | | | | | | | | | | | | |
Facility restructuring and other exit activities recorded | | $ | 58,547 | | | $ | 57,319 | | | $ | 115,866 | |
Cash payments | | | (26,371 | ) | | | (18,949 | ) | | | (45,320 | ) |
Non-cash charges | | | (19,254 | ) | | | (38,370 | ) | | | (57,624 | ) |
| | | | | | | | | | | | |
Restructuring liabilities at December 31, 2006 | | | 12,922 | | | | — | | | | 12,922 | |
Activity for the nine months ended September 30, 2007: | | | | | | | | | | | | |
Adjustments and additional charges | | | (263 | ) | | | — | | | | (263 | ) |
Cash payments | | | (3,546 | ) | | | — | | | | (3,546 | ) |
| | | | | | | | | | | | |
Total facility restructuring liabilities at September 30, 2007 | | $ | 9,113 | | | $ | — | | | $ | 9,113 | |
| | | | | | | | | | | | |
47
2001 Restructuring Plan
In August 2001, the Company announced a restructuring plan (“2001 Restructuring Plan”) aimed at streamlining operations primarily by consolidating facilities in the United States and Europe. Facility consolidation costs are expected to be paid over contractual periods ending in fiscal year 2010. The roll forward of the 2001 Restructuring Plan reserve is presented below (dollars in thousands):
| | | | | | | | | | | | | | | | |
| | | Facility Consolidation | | | Asset Write-Off | | | Other | | | Total | |
Total 2001 restructuring reserve, originally recorded in 2001: | | | | | | | | | | | | | | | | |
Facility restructuring and other exit activities recorded | | $ | 149,684 | | | $ | 54,384 | | | $ | 26,401 | | | $ | 230,469 | |
Cash payments | | | (103,728 | ) | | | (507 | ) | | | (20,507 | ) | | | (124,742 | ) |
Non-cash charges | | | (41,263 | ) | | | (53,877 | ) | | | (5,810 | ) | | | (100,950 | ) |
| | | | | | | | | | | | | | | | |
Restructuring liabilities at December 31, 2006 | | | 4,693 | | | | — | | | | 84 | | | | 4,777 | |
Activity for the nine months ended September 30, 2007: | | | | | | | | | | | | | | | | |
Adjustments and additional charges | | | (104 | ) | | | — | | | | (84 | ) | | | (188 | ) |
Cash payments | | | (1,024 | ) | | | — | | | | — | | | | (1,024 | ) |
| | | | | | | | | | | | | | | | |
Total facility restructuring liabilities at September 30, 2007 | | $ | 3,565 | | | $ | — | | | $ | — | | | $ | 3,565 | |
| | | | | | | | | | | | | | | | |
Other Exit Activities
Toward the end of the third quarter of 2007, the Company announced plans to simplify and streamline the business by exiting and/or restructuring certain non-core operations. In lending, the Company is exiting its wholesale mortgage origination channel, and repositioning the lending business to focus on direct retail originations. In institutional, the Company is taking steps to restructure the institutional equity business to focus on areas that complement order flow generated by retail customers. As a result, the Company expects to incur costs related to terminating certain employees and exiting certain facilities. The total charge for the wholesale mortgage exit activity is expected to be approximately $4.5 million, the majority of which will be recorded to the retail segment. The total charge for the institutional brokerage business is still being assessed and will be recorded to the institutional segment. For the three months ended September 30, 2007, the Company incurred costs of $0.9 million and $3.7 million for the wholesale mortgage and institutional equity business exits, respectively.
In 2006, the Company decided to relocate certain functions out of the state of California as well as outsource certain clearing operations and costs related to the relocation of certain accounting functions. The Company incurred charges of $0.7 million for the nine months ended September 30, 2007, related to costs for exiting those facilities. The total charge for this exit activity was $29.9 million, all of which has been recorded in the retail segment. The Company expects to incur charges in future periods as it periodically evaluates the estimates made in connection with this activity; however, the Company does not expect those costs to be significant.
48
NOTE 4—OPERATING INTEREST INCOME AND OPERATING INTEREST EXPENSE
The following table shows the components of operating interest income and operating interest expense (dollars in thousands):
| | | | | | | | | | | | | | | | |
| | | Three Months Ended September 30, | | | Nine Months Ended September 30, | |
| | | 2007 | | | 2006 | | | 2007 | | | 2006 | |
Operating interest income: | | | | | | | | | | | | | | | | |
Loans, net | | $ | 528,193 | | | $ | 364,744 | | | $ | 1,477,109 | | | $ | 949,513 | |
Mortgage-backed and investment securities | | | 244,675 | | | | 205,838 | | | | 696,965 | | | | 555,693 | |
Margin receivables | | | 138,290 | | | | 123,855 | | | | 389,611 | | | | 352,149 | |
Other | | | 40,678 | | | | 36,992 | | | | 123,718 | | | | 128,741 | |
| | | | | | | | | | | | | | | | |
Total operating interest income | | | 951,836 | | | | 731,429 | | | | 2,687,403 | | | | 1,986,096 | |
| | | | | | | | | | | | | | | | |
Operating interest expense: | | | | | | | | | | | | | | | | |
Deposits | | | (221,580 | ) | | | (148,488 | ) | | | (609,869 | ) | | | (364,864 | ) |
Repurchase agreements and other borrowings | | | (165,925 | ) | | | (150,837 | ) | | | (500,293 | ) | | | (391,460 | ) |
FHLB advances | | | (115,531 | ) | | | (43,950 | ) | | | (257,183 | ) | | | (108,696 | ) |
Other | | | (30,768 | ) | | | (33,018 | ) | | | (97,276 | ) | | | (96,549 | ) |
| | | | | | | | | | | | | | | | |
Total operating interest expense | | | (533,804 | ) | | | (376,293 | ) | | | (1,464,621 | ) | | | (961,569 | ) |
| | | | | | | | | | | | | | | | |
Net operating interest income | | $ | 418,032 | | | $ | 355,136 | | | $ | 1,222,782 | | | $ | 1,024,527 | |
| | | | | | | | | | | | | | | | |
49
NOTE 5—AVAILABLE-FOR-SALE MORTGAGE-BACKED AND INVESTMENT SECURITIES
The amortized cost basis and estimated fair values of available-for-sale mortgage-backed and investment securities are shown in the following tables (dollars in thousands):
| | | | | | | | | | | | | |
| | | Amortized
Cost | | Gross
Unrealized Gains | | Gross
Unrealized Losses | | | Estimated
Fair Values |
September 30, 2007: | | | | | | | | | | | | | |
Mortgage-backed securities: | | | | | | | | | | | | | |
Backed by U.S. Government sponsored and Federal agencies | | $ | 11,091,368 | | $ | 4 | | $ | (440,020 | ) | | $ | 10,651,352 |
Collateralized mortgage obligations and other | | | 1,251,971 | | | 21 | | | (35,594 | ) | | | 1,216,398 |
| | | | | | | | | | | | | |
Total mortgage-backed securities | | | 12,343,339 | | | 25 | | | (475,614 | ) | | | 11,867,750 |
| | | | | | | | | | | | | |
Investment securities: | | | | | | | | | | | | | |
Debt securities: | | | | | | | | | | | | | |
Asset-backed securities | | | 3,023,274 | | | 412 | | | (268,371 | ) | | | 2,755,315 |
Municipal bonds | | | 934,639 | | | 12,175 | | | (3,312 | ) | | | 943,502 |
Corporate bonds | | | 46,806 | | | 3,764 | | | (2,375 | ) | | | 48,195 |
Other debt securities | | | 79,265 | | | — | | | (4,356 | ) | | | 74,909 |
| | | | | | | | | | | | | |
Total debt securities | | | 4,083,984 | | | 16,351 | | | (278,414 | ) | | | 3,821,921 |
Publicly traded equity securities: | | | | | | | | | | | | | |
Preferred stock | | | 511,524 | | | 300 | | | (41,342 | ) | | | 470,482 |
Corporate investments | | | 11,048 | | | 174 | | | (1,461 | ) | | | 9,761 |
FHLB stock | | | 409,460 | | | — | | | — | | | | 409,460 |
Retained interests from securitizations | | | 1,000 | | | 883 | | | — | | | | 1,883 |
| | | | | | | | | | | | | |
Total investment securities | | | 5,017,016 | | | 17,708 | | | (321,217 | ) | | | 4,713,507 |
| | | | | | | | | | | | | |
Total available-for-sale securities | | $ | 17,360,355 | | $ | 17,733 | | $ | (796,831 | ) | | $ | 16,581,257 |
| | | | | | | | | | | | | |
December 31, 2006: | | | | | | | | | | | | | |
Mortgage-backed securities: | | | | | | | | | | | | | |
Backed by U.S. Government sponsored and Federal agencies | | $ | 9,375,444 | | $ | 688 | | $ | (266,825 | ) | | $ | 9,109,307 |
Collateralized mortgage obligations and other | | | 1,127,650 | | | 296 | | | (19,561 | ) | | | 1,108,385 |
| | | | | | | | | | | | | |
Total mortgage-backed securities | | | 10,503,094 | | | 984 | | | (286,386 | ) | | | 10,217,692 |
| | | | | | | | | | | | | |
Investment securities: | | | | | | | | | | | | | |
Debt securities: | | | | | | | | | | | | | |
Asset-backed securities | | | 2,163,538 | | | 9,929 | | | (11,739 | ) | | | 2,161,728 |
Municipal bonds | | | 620,261 | | | 13,316 | | | (830 | ) | | | 632,747 |
Corporate bonds | | | 105,692 | | | 481 | | | (1,655 | ) | | | 104,518 |
Other debt securities | | | 80,623 | | | — | | | (5,743 | ) | | | 74,880 |
| | | | | | | | | | | | | |
Total debt securities | | | 2,970,114 | | | 23,726 | | | (19,967 | ) | | | 2,973,873 |
Publicly traded equity securities: | | | | | | | | | | | | | |
Preferred stock | | | 455,801 | | | 4,905 | | | (2,032 | ) | | | 458,674 |
Corporate investments | | | 12,040 | | | 13,691 | | | (1,592 | ) | | | 24,139 |
FHLB stock | | | 244,212 | | | — | | | — | | | | 244,212 |
Retained interests from securitizations | | | 2,930 | | | 463 | | | — | | | | 3,393 |
| | | | | | | | | | | | | |
Total investment securities | | | 3,685,097 | | | 42,785 | | | (23,591 | ) | | | 3,704,291 |
| | | | | | | | | | | | | |
Total available-for-sale securities | | $ | 14,188,191 | | $ | 43,769 | | $ | (309,977 | ) | | $ | 13,921,983 |
| | | | | | | | | | | | | |
50
Other-Than-Temporary Impairment of Investments
The following tables show the individual securities from the available-for-sale, mortgage-backed and investment securities portfolio that have been in a continuous unrealized loss position, aggregated by investment category and length of time (dollars in thousands):
| | | | | | | | | | | | | | | | | | | | | |
| | | Less than 12 Months | | | 12 Months or More | | | Total | |
| | | Fair Values | | Unrealized Losses | | | Fair Values | | Unrealized Losses | | | Fair Values | | Unrealized Losses | |
September 30, 2007: | | | | | | | | | | | | | | | | | | | | | |
Mortgage-backed securities: | | | | | | | | | | | | | | | | | | | | | |
Backed by U.S. Government sponsored and Federal agencies | | $ | 2,613,914 | | $ | (61,125 | ) | | $ | 8,036,512 | | $ | (378,895 | ) | | $ | 10,650,426 | | $ | (440,020 | ) |
Collateralized mortgage obligations and other | | | 601,835 | | | (17,271 | ) | | | 607,114 | | | (18,323 | ) | | | 1,208,949 | | | (35,594 | ) |
Debt securities: | | | | | | | | | | | | | | | | | | | | | |
Asset-backed securities | | | 1,929,711 | | | (231,190 | ) | | | 619,471 | | | (37,181 | ) | | | 2,549,182 | | | (268,371 | ) |
Municipal bonds | | | 302,442 | | | (2,865 | ) | | | 26,600 | | | (447 | ) | | | 329,042 | | | (3,312 | ) |
Corporate bonds | | | — | | | — | | | | 22,971 | | | (2,375 | ) | | | 22,971 | | | (2,375 | ) |
Other debt securities | | | 605 | | | (3 | ) | | | 73,755 | | | (4,353 | ) | | | 74,360 | | | (4,356 | ) |
Publicly traded equity securities: | | | | | | | | | | | | | | | | | | | | | |
Preferred stock | | | 390,836 | | | (39,200 | ) | | | 19,346 | | | (2,142 | ) | | | 410,182 | | | (41,342 | ) |
Corporate investments | | | 7,352 | | | (1,271 | ) | | | 172 | | | (190 | ) | | | 7,524 | | | (1,461 | ) |
| | | | | | | | | | | | | | | | | | | | | |
Total temporarily impaired securities | | $ | 5,846,695 | | $ | (352,925 | ) | | $ | 9,405,941 | | $ | (443,906 | ) | | $ | 15,252,636 | | $ | (796,831 | ) |
| | | | | | | | | | | | | | | | | | | | | |
December 31, 2006: | | | | | | | | | | | | | | | | | | | | | |
Mortgage-backed securities: | | | | | | | | | | | | | | | | | | | | | |
Backed by U.S. Government sponsored and Federal agencies | | $ | 1,482,684 | | $ | (38,671 | ) | | $ | 7,551,572 | | $ | (228,154 | ) | | $ | 9,034,256 | | $ | (266,825 | ) |
Collateralized mortgage obligations and other | | | 399,779 | | | (2,258 | ) | | | 640,811 | | | (17,303 | ) | | | 1,040,590 | | | (19,561 | ) |
Debt securities: | | | | | | | | | | | | | | | | | | | | | |
Asset-backed securities | | | 358,628 | | | (2,520 | ) | | | 629,889 | | | (9,219 | ) | | | 988,517 | | | (11,739 | ) |
Municipal bonds | | | 58,548 | | | (467 | ) | | | 28,326 | | | (363 | ) | | | 86,874 | | | (830 | ) |
Corporate bonds | | | 765 | | | (23 | ) | | | 72,661 | | | (1,632 | ) | | | 73,426 | | | (1,655 | ) |
Other debt securities | | | — | | | — | | | | 72,750 | | | (5,743 | ) | | | 72,750 | | | (5,743 | ) |
Publicly traded equity securities: | | | | | | | | | | | | | | | | | | | | | |
Preferred stock | | | 37,663 | | | (420 | ) | | | 25,971 | | | (1,612 | ) | | | 63,634 | | | (2,032 | ) |
Corporate investments | | | 8,486 | | | (1,386 | ) | | | 156 | | | (206 | ) | | | 8,642 | | | (1,592 | ) |
| | | | | | | | | | | | | | | | | | | | | |
Total temporarily impaired securities | | $ | 2,346,553 | | $ | (45,745 | ) | | $ | 9,022,136 | | $ | (264,232 | ) | | $ | 11,368,689 | | $ | (309,977 | ) |
| | | | | | | | | | | | | | | | | | | | | |
51
The Company does not believe that any individual unrealized loss as of September 30, 2007 represents an other-than-temporary impairment. The majority of the unrealized losses on mortgage-backed securities are attributable to both changes in interest rates and a re-pricing of risk in the market. Substantially all mortgage-backed securities backed by U.S. Government sponsored and Federal agencies are “AAA” rated. The Company has the intent and ability to hold the securities in an unrealized loss position at September 30, 2007 until the market value recovers or the securities mature. Municipal bonds, corporate bonds and other debt securities are evaluated by reviewing the credit-worthiness of the issuer and general market conditions.
Within our securities portfolio, the asset-backed securities portfolio has the greatest exposure to the current instability in the residential real estate and credit markets. Based on its evaluation, the Company recorded other-than-temporary impairment charges for its asset-backed securities of $159.8 million(1) and $162.7 million for the three and nine months ended September 30, 2007. The Company recorded $1.9 million and $2.3 million of impairment for its asset- and mortgage-backed securities and on retained interests from securitizations for the three months and nine months ended September 30, 2006, respectively. These charges were primarily confined to securities rated below “AA” in what the Company believes are the two highest risk categories within the asset-backed portfolio: CDOs and securities collateralized by second lien mortgages. The Company did not sell any of these securities during the period ended September 30, 2007; however, it is the Company’s intent to sell them in future periods as expeditiously as the market will bear. The securities underlying the impairments were written down by an average of 53% of the current face value to an amortized cost of $201.6 million as of September 30, 2007.
We expect conditions in the overall residential real estate and credit markets to remain uncertain for the foreseeable future. Due to the inherent leverage within our asset-backed securities, even a slight deterioration in the performance of the underlying loans could result in a significant deterioration in the performance of our asset-backed securities. Therefore, continued deterioration in market conditions would likely cause additional write downs in our securities portfolio, primarily in our asset-backed portfolio.
Subsequent to September 30, 2007, we observed a significant decline in the fair value of our asset-backed securities portfolio, specifically our asset-backed CDO and second-lien securities. Our total exposure to asset-backed CDO and second-lien securities at September 30, 2007 was approximately $450 million in amortized cost.
The declines in fair value followed a series of rating agency downgrades of securities in this sector and occurred after the end of the third quarter. We believe there will likely be additional downgrades by the rating agencies of securities in this sector. Overall, approximately $208 million of our asset-backed securities were downgraded during the month of October and through November 7, 2007, including approximately $50 million of “AAA” rated asset-backed CDOs that were downgraded to below investment grade.
We expect these declines will result in significant write downs to these securities during the fourth quarter; however, we cannot predict the amount for the fourth quarter as the write downs will depend on future market developments, including potential additional downgrades, and the estimated fair values of these securities on December 31, 2007.
In addition to our asset-backed CDO and second lien portfolio, we hold approximately $2.6 billion in amortized cost in other asset-backed securities, mainly securities backed by prime residential first-lien mortgages. These securities have also declined in fair value subsequent to September 30, 2007; however, the decline has not been as significant.
| (1) | | The $159.8 million in losses on impairment of available-for-sale securities combined with the $37.8 million in trading asset-backed securities losses equals the total write downs on asset-backed securities of $197.6 million for the three months ended September 30, 2007. |
52
Gain (Loss) on Loans and Securities, Net
Gain (loss) on loans and securities, net are as follows (dollars in thousands):
| | | | | | | | | | | | | | | | |
| | | Three Months Ended September 30, | | | Nine Months Ended September 30, | |
| | | 2007 | | | 2006 | | | 2007 | | | 2006 | |
Gain on sale of originated loans | | $ | 830 | | | $ | 3,213 | | | $ | 4,788 | | | $ | 9,212 | |
Loss on sales of loans held-for-sale, net | | | (1,991 | ) | | | (235 | ) | | | (3,678 | ) | | | (1,333 | ) |
Gain (loss) on securities, net: | | | | | | | | | | | | | | | | |
Gain on securities and other investments | | | 1,701 | | | | 33,006 | | | | 10,072 | | | | 42,365 | |
Loss on impairment | | | (159,752 | ) | | | (1,504 | ) | | | (162,713 | ) | | | (1,504 | ) |
Loss on trading securities | | | (37,845 | ) | | | (18,477 | ) | | | (22,823 | ) | | | (10,002 | ) |
| | | | | | | | | | | | | | | | |
Gain (loss) on securities, net | | | (195,896 | ) | | | 13,025 | | | | (175,464 | ) | | | 30,859 | |
| | | | | | | | | | | | | | | | |
Gain (loss) on loans and securities, net | | $ | (197,057 | ) | | $ | 16,003 | | | $ | (174,354 | ) | | $ | 38,738 | |
| | | | | | | | | | | | | | | | |
Gain (Loss) on Sales of Investments, Net
Gain (loss) on sales of investments, net are as follows (dollars in thousands):
| | | | | | | | | | | | | | | |
| | | Three Months Ended September 30, | | Nine Months Ended September 30, | |
| | | 2007 | | | 2006 | | 2007 | | | 2006 | |
Gain on sales of publicly traded equity securities | | $ | — | | | $ | 26,489 | | $ | 37,027 | | | $ | 60,046 | |
Loss on sales of investments | | | — | | | | — | | | — | | | | (455 | ) |
Gain (loss) on sales of other equity securities, net(1) | | | (18 | ) | | | 502 | | | (22 | ) | | | 306 | |
| | | | | | | | | | | | | | | |
Gain (loss) on sales of investments, net | | $ | (18 | ) | | $ | 26,991 | | $ | 37,005 | | | $ | 59,897 | |
| | | | | | | | | | | | | | | |
(1) | | There was a $0.4 million and a $0.8 million charge for the three and nine months ended September 30, 2006, respectively, on retained interests from securitizations. |
53
NOTE 6—LOANS, NET
Loans, net are summarized as follows (dollars in thousands):
| | | | | | | | |
| | | September 30,
2007 | | | December 31,
2006 | |
Loans held-for-sale | | $ | 119,357 | | | $ | 283,496 | |
| | | | | | | | |
Loans receivable, net: | | | | | | | | |
Real estate loans: | | | | | | | | |
One- to four-family | | | 16,857,241 | | | | 10,870,214 | |
Home equity | | | 12,422,966 | | | | 11,809,008 | |
| | | | | | | | |
Total real estate loans | | | 29,280,207 | | | | 22,679,222 | |
| | | | | | | | |
Consumer and other loans: | | | | | | | | |
Recreational vehicle | | | 2,000,818 | | | | 2,292,356 | |
Marine | | | 552,485 | | | | 651,764 | |
Commercial | | | 288,841 | | | | 219,008 | |
Credit card | | | 93,878 | | | | 128,583 | |
Other | | | 32,906 | | | | 81,239 | |
| | | | | | | | |
Total consumer and other loans | | | 2,968,928 | | | | 3,372,950 | |
| | | | | | | | |
Total loans receivable | | | 32,249,135 | | | | 26,052,172 | |
Unamortized premiums, net | | | 349,797 | | | | 388,153 | |
Allowance for loan losses | | | (209,038 | ) | | | (67,628 | ) |
| | | | | | | | |
Total loans receivable, net | | | 32,389,894 | | | | 26,372,697 | |
| | | | | | | | |
Total loans, net | | $ | 32,509,251 | | | $ | 26,656,193 | |
| | | | | | | | |
The following table provides an analysis of the allowance for loan losses for the three and nine months ended September 30, 2007 and 2006 (dollars in thousands):
| | | | | | | | | | | | | | | | |
| | | Three Months Ended September 30, | | | Nine Months Ended September 30, | |
| | | 2007 | | | 2006 | | | 2007 | | | 2006 | |
Allowance for loan losses, beginning of period | | $ | 75,704 | | | $ | 67,121 | | | $ | 67,628 | | | $ | 63,286 | |
Provision for loan losses | | | 186,536 | | | | 12,547 | | | | 237,767 | | | | 33,014 | |
Charge-offs | | | (59,834 | ) | | | (13,950 | ) | | | (117,081 | ) | | | (41,922 | ) |
Recoveries | | | 6,632 | | | | 4,190 | | | | 20,724 | | | | 15,530 | |
| | | | | | | | | | | | | | | | |
Net charge-offs | | | (53,202 | ) | | | (9,760 | ) | | | (96,357 | ) | | | (26,392 | ) |
| | | | | | | | | | | | | | | | |
Allowance for loan losses, end of period | | $ | 209,038 | | | $ | 69,908 | | | $ | 209,038 | | | $ | 69,908 | |
| | | | | | | | | | | | | | | | |
During the first quarter of 2007, the Company entered into a credit default swap (“CDS”) on $4.0 billion of its first-lien residential real estate loan portfolio. A CDS provides, for a fee, an assumption by a third party of a portion of the credit risk related to the underlying loans. The CDS the Company entered into provides protection for losses in excess of 10 basis points, but not to exceed approximately 75 basis points. In addition, the Company’s regulatory risk-weighted assets were reduced as a result of this transaction because it transferred a portion of the Company’s credit risk to an unaffiliated third party.
54
NOTE 7—ACCOUNTING FOR DERIVATIVE FINANCIAL INSTRUMENTS AND HEDGING ACTIVITIES
The Company enters into derivative transactions to protect against the risk of market price or interest rate movements on the value of certain assets, liabilities and future cash flows. The Company is also required to recognize certain contracts and commitments as derivatives when the characteristics of those contracts and commitments meet the definition of a derivative as promulgated by SFAS No. 133, as amended.
Fair Value Hedges
Overview of Fair Value Hedges
The Company uses a combination of interest rate swaps, forward-starting swaps and purchased options on swaps, interest rate caps and interest rate floors to offset its exposure to changes in value of certain fixed-rate assets and liabilities. Changes in the fair value of the derivatives and the related hedged items are recognized currently in earnings. To the extent that the hedge is ineffective, the changes in the fair values will not offset and the difference, or hedge ineffectiveness, is reflected in other expense excluding interest in the consolidated statement of income (loss).
The following table summarizes information related to financial derivatives in fair value hedge relationships (dollars in thousands):
| | | | | | | | | | | | | | | | | | | | | | | | | |
| | | Notional
Amount of
Derivatives | | Fair Value of Derivatives | | | Weighted-Average |
| | | | Asset | | Liability | | | Net | | | Pay
Rate | | | Receive
Rate | | | Strike Rate | | | Remaining
Life (Years) |
September 30, 2007: | | | | | | | | | | | | | | | | | | | | | | | | | |
Pay-fixed interest rate swaps: | | | | | | | | | | | | | | | | | | | | | | | | | |
Mortgage-backed securities | | $ | 3,744,000 | | $ | 2,872 | | $ | (40,694 | ) | | $ | (37,822 | ) | | 5.12 | % | | 5.37 | % | | N/A | | | 5.58 |
Receive-fixed interest rate swaps: | | | | | | | | | | | | | | | | | | | | | | | | | |
Corporate debt | | | 1,400,000 | | | 35,831 | | | — | | | | 35,831 | | | 7.69 | % | | 7.71 | % | | N/A | | | 5.63 |
Brokered certificates of deposit | | | 111,738 | | | — | | | (3,167 | ) | | | (3,167 | ) | | 5.37 | % | | 5.33 | % | | N/A | | | 11.70 |
FHLB advances | | | 100,000 | | | — | | | (1,778 | ) | | | (1,778 | ) | | 5.75 | % | | 3.64 | % | | N/A | | | 2.04 |
Purchased interest rate forward-starting swaps: | | | | | | | | | | | | | | | | | | | | | | | | | |
Mortgage-backed securities | | | 322,000 | | | 1,156 | | | — | | | | 1,156 | | | 4.99 | % | | N/A | | | N/A | | | 7.62 |
Purchased interest rate options(1): | | | | | | | | | | | | | | | | | | | | | | | | | |
Swaptions(2) | | | 3,654,000 | | | 82,451 | | | — | | | | 82,451 | | | N/A | | | N/A | | | 5.43 | % | | 10.88 |
Caps | | | 1,755,000 | | | 20,601 | | | — | | | | 20,601 | | | N/A | | | N/A | | | 5.32 | % | | 3.52 |
Floors | | | 1,190,000 | | | 14,013 | | | — | | | | 14,013 | | | N/A | | | N/A | | | 4.83 | % | | 3.29 |
| | | | | | | | | | | | | | | | | | | | | | | | | |
Total fair value hedges | | $ | 12,276,738 | | $ | 156,924 | | $ | (45,639 | ) | | $ | 111,285 | | | 5.76 | % | | 5.95 | % | | 5.29 | % | | 6.73 |
| | | | | | | | | | | | | | | | | | | | | | | | | |
December 31, 2006: | | | | | | | | | | | | | | | | | | | | | | | | | |
Pay-fixed interest rate swaps: | | | | | | | | | | | | | | | | | | | | | | | | | |
Mortgage-backed securities | | $ | 4,774,000 | | $ | 22,399 | | $ | (25,894 | ) | | $ | (3,495 | ) | | 5.12 | % | | 5.36 | % | | N/A | | | 4.20 |
Recreational vehicle loans | | | 2,030,000 | | | — | | | (8,046 | ) | | | (8,046 | ) | | 5.46 | % | | 5.35 | % | | N/A | | | 1.62 |
Home equity loans | | | 490,000 | | | — | | | (2,625 | ) | | | (2,625 | ) | | 5.40 | % | | 5.35 | % | | N/A | | | 2.16 |
Investment securities | | | 335,162 | | | 1,128 | | | (2,887 | ) | | | (1,759 | ) | | 5.07 | % | | 5.37 | % | | N/A | | | 6.69 |
Asset backed securities | | | 232,000 | | | 1,013 | | | — | | | | 1,013 | | | 5.08 | % | | 5.37 | % | | N/A | | | 6.52 |
Receive-fixed interest rate swaps: | | | | | | | | | | | | | | | | | | | | | | | | | |
Brokered certificates of deposit | | | 127,138 | | | — | | | (3,392 | ) | | | (3,392 | ) | | 5.31 | % | | 5.21 | % | | N/A | | | 11.41 |
FHLB advances | | | 100,000 | | | — | | | (3,534 | ) | | | (3,534 | ) | | 5.35 | % | | 3.64 | % | | N/A | | | 2.79 |
Purchased interest rate options(1): | | | | | | | | | | | | | | | | | | | | | | | | | |
Swaptions(2) | | | 3,338,000 | | | 50,218 | | | — | | | | 50,218 | | | N/A | | | N/A | | | 5.37 | % | | 10.69 |
Caps | | | 6,720,000 | | | 38,237 | | | — | | | | 38,237 | | | N/A | | | N/A | | | 5.36 | % | | 2.18 |
Floors | | | 1,200,000 | | | 19,786 | | | — | | | | 19,786 | | | N/A | | | N/A | | | 4.74 | % | | 4.81 |
| | | | | | | | | | | | | | | | | | | | | | | | | |
Total fair value hedges | | $ | 19,346,300 | | $ | 132,781 | | $ | (46,378 | ) | | $ | 86,403 | | | 5.22 | % | | 5.34 | % | | 5.30 | % | | 4.44 |
| | | | | | | | | | | | | | | | | | | | | | | | | |
(1) | Purchased interest rate options were used to hedge mortgage loans and mortgage-backed securities. |
(2) | Swaptions are options to enter swaps starting on a given day. |
55
De-designated Fair Value Hedges
During the three and nine months ended September 30, 2007 and 2006, certain fair value hedges were de-designated; therefore, hedge accounting was discontinued during those periods. The net gain or loss on the underlying transactions being hedged is amortized to operating interest expense or operating interest income over the original forecasted period at the time of de-designation. Changes in the fair value of these derivative instruments after de-designation of fair value hedge accounting were recorded in the gain (loss) on loans and securities, net line item in the consolidated statement of income (loss).
Cash Flow Hedges
Overview of Cash Flow Hedges
The Company uses a combination of interest rate swaps, forward-starting swaps and purchased options on caps and floors to hedge the variability of future cash flows associated with existing variable-rate liabilities and assets and forecasted issuances of liabilities. These cash flow hedge relationships are treated as effective hedges as long as the future issuances of liabilities remain probable and the hedges continue to meet the requirements of SFAS No. 133, as amended. The Company also enters into interest rate swaps to hedge changes in the future variability of cash flows of certain investment securities resulting from changes in a benchmark interest rate. Additionally, the Company enters into forward purchase and sale agreements, which are considered cash flow hedges, when the terms of the commitments exactly match the terms of the securities purchased or sold.
Changes in the fair value of derivatives that hedge cash flows associated with repurchase agreements, FHLB advances and home equity lines of credit are reported in accumulated other comprehensive loss as unrealized gains or losses. The amounts in accumulated other comprehensive loss are then included in operating interest expense or operating interest income as a yield adjustment during the same periods in which the related interest on the funding affects earnings. During the upcoming twelve months, the Company expects to include a pre-tax amount of approximately $62.4 million of net unrealized gains that are currently reflected in accumulated other comprehensive loss in operating interest expense as a yield adjustment in the same periods in which the related items affect earnings.
56
The following table summarizes information related to the Company’s financial derivatives in cash flow hedge relationships, hedging variable-rate assets and liabilities and the forecasted issuances of liabilities (dollars in thousands):
| | | | | | | | | | | | | | | | | | | | | | | | | |
| | | Notional Amount of Derivatives | | Fair Value of Derivatives | | | Weighted-Average |
| | | | Asset | | Liability | | | Net | | | Pay
Rate | | | Receive
Rate | | | Strike Rate | | | Remaining
Life (Years) |
September 30, 2007: | | | | | | | | | | | | | | | | | | | | | | | | | |
Pay-fixed interest rate swaps: | | | | | | | | | | | | | | | | | | | | | | | | | |
Repurchase agreements | | $ | 2,400,000 | | $ | 3,476 | | $ | (33,578 | ) | | $ | (30,102 | ) | | 5.37 | % | | 5.54 | % | | N/A | | | 8.86 |
FHLB advances | | | 580,000 | | | 289 | | | (3,987 | ) | | | (3,698 | ) | | 5.27 | % | | 5.54 | % | | N/A | | | 9.58 |
Purchase interest rate forward-starting swaps: | | | | | | | | | | | | | | | | | | | | | | | | | |
Repurchase agreements | | | 965,000 | | | — | | | (12,843 | ) | | | (12,843 | ) | | 5.40 | % | | N/A | | | N/A | | | 11.35 |
FHLB advances | | | 370,000 | | | — | | | (1,879 | ) | | | (1,879 | ) | | 5.26 | % | | N/A | | | N/A | | | 10.04 |
Purchased interest rate options(1): | | | | | | | | | | | | | | | | | | | | | | | | | |
Caps | | | 4,410,000 | | | 47,833 | | | — | | | | 47,833 | | | N/A | | | N/A | | | 5.06 | % | | 2.87 |
Floors | | | 1,900,000 | | | 43,945 | | | — | | | | 43,945 | | | N/A | | | N/A | | | 5.84 | % | | 3.05 |
| | | | | | | | | | | | | | | | | | | | | | | | | |
Total cash flow hedges | | $ | 10,625,000 | | $ | 95,543 | | $ | (52,287 | ) | | $ | 43,256 | | | 5.35 | % | | 5.54 | % | | 5.30 | % | | 5.64 |
| | | | | | | | | | | | | | | | | | | | | | | | | |
December 31, 2006: | | | | | | | | | | | | | | | | | | | | | | | | | |
Pay-fixed interest rate swaps: | | | | | | | | | | | | | | | | | | | | | | | | | |
Repurchase agreements | | $ | 3,435,000 | | $ | 7,683 | | $ | (21,823 | ) | | $ | (14,140 | ) | | 5.36 | % | | 5.36 | % | | N/A | | | 5.90 |
FHLB advances | | | 730,000 | | | 3,671 | | | (3,301 | ) | | | 370 | | | 5.16 | % | | 5.37 | % | | N/A | | | 8.56 |
Purchased interest rate options(1): | | | | | | | | | | | | | | | | | | | | | | | | | |
Caps | | | 4,690,000 | | | 62,710 | | | — | | | | 62,710 | | | N/A | | | N/A | | | 5.05 | % | | 3.36 |
Floors | | | 1,900,000 | | | 643 | | | — | | | | 643 | | | N/A | | | N/A | | | 4.05 | % | | 2.09 |
| | | | | | | | | | | | | | | | | | | | | | | | | |
Total cash flow hedges | | $ | 10,755,000 | | $ | 74,707 | | $ | (25,124 | ) | | $ | 49,583 | | | 5.33 | % | | 5.36 | % | | 4.76 | % | | 4.30 |
| | | | | | | | | | | | | | | | | | | | | | | | | |
(1) | Caps are used to hedge repurchase agreements and FHLB advances. Floors are used to hedge home equity lines of credit. |
Under SFAS No. 133, as amended, the Company is required to record the fair value of gains and losses on derivatives designated as cash flow hedges in accumulated other comprehensive loss in the consolidated balance sheet. In addition, during the normal course of business, the Company terminates certain interest rate swaps and options.
57
The following tables show: 1) amounts recorded in accumulated other comprehensive loss related to derivative instruments accounted for as cash flow hedges; 2) the notional amounts and fair values of derivatives terminated for the periods presented; and 3) the amortization of terminated interest rate swaps included in operating interest expense and operating interest income (dollars in thousands):
| | | | | | | | | | | | | | | | |
| | | Three Months Ended September 30, | | | Nine Months Ended September 30, | |
| | | 2007 | | | 2006 | | | 2007 | | | 2006 | |
Impact on accumulated other comprehensive loss (net of taxes): | | | | | | | | | | | | | | | | |
Beginning balance | | $ | 34,884 | | | $ | 84,992 | | | $ | (27,844 | ) | | $ | (70,831 | ) |
Unrealized gains (losses), net | | | (74,286 | ) | | | (107,665 | ) | | | (11,916 | ) | | | 43,078 | |
Reclassifications into earnings, net | | | 766 | | | | 827 | | | | 1,124 | | | | 5,907 | |
| | | | | | | | | | | | | | | | |
Ending balance | | $ | (38,636 | ) | | $ | (21,846 | ) | | $ | (38,636 | ) | | $ | (21,846 | ) |
| | | | | | | | | | | | | | | | |
Derivatives terminated during the period: | | | | | | | | | | | | | | | | |
Notional | | $ | 4,070,000 | | | $ | 1,265,000 | | | $ | 7,775,000 | | | $ | 9,375,000 | |
Fair value of net gains (losses) recognized in accumulated other comprehensive loss | | $ | (20,028 | ) | | $ | (20,649 | ) | | $ | (14,556 | ) | | $ | 93,245 | |
Amortization of terminated interest rate swaps and options included in operating interest expense and operating interest income | | $ | 932 | | | $ | 1,197 | | | $ | 1,187 | | | $ | 8,887 | |
The gains accumulated in other comprehensive loss on the derivative instruments terminated shown in the preceding table will be included in operating interest expense and operating interest income over the periods the variable rate liabilities and hedged forecasted issuance of liabilities will affect earnings, ranging from 5 days to almost 15 years.
The following table shows the balance in accumulated other comprehensive loss attributable to open cash flow hedges and discontinued cash flow hedges (dollars in thousands):
| | | | | | | | |
| | | Nine Months Ended
September 30, | |
| | | 2007 | | | 2006 | |
Accumulated other comprehensive loss balance (net of taxes) related to: | | | | | | | | |
Open cash flow hedges | | $ | (52,644 | ) | | $ | (51,598 | ) |
Discontinued cash flow hedges | | | 14,008 | | | | 29,752 | |
| | | | | | | | |
Total cash flow hedges | | $ | (38,636 | ) | | $ | (21,846 | ) |
| | | | | | | | |
Hedge Ineffectiveness
In accordance with SFAS No. 133, as amended, the Company recognizes hedge ineffectiveness on both fair value and cash flow hedge relationships. The amount of ineffectiveness recorded in earnings for cash flow hedges is equal to the excess of the cumulative change in the fair value of the actual derivative over the cumulative change in the fair value of a hypothetical derivative which is created to match the exact terms of the underlying instruments being hedged. These amounts are reflected in the other expense excluding interest line item in the consolidated statement of income (loss). Cash flow and fair value ineffectiveness is re-measured on a quarterly basis. The following table summarizes income (expense) recognized by the Company as fair value and cash flow hedge ineffectiveness (dollars in thousands):
| | | | | | | | | | | | | | | | |
| | | Three Months Ended September 30, | | | Nine Months Ended September 30, | |
| | | 2007 | | | 2006 | | | 2007 | | | 2006 | |
Fair value hedges | | $ | (2,571 | ) | | $ | (1,652 | ) | | $ | (805 | ) | | $ | 2,029 | |
Cash flow hedges | | | (255 | ) | | | 190 | | | | (506 | ) | | | (163 | ) |
| | | | | | | | | | | | | | | | |
Total hedge ineffectiveness | | $ | (2,826 | ) | | $ | (1,462 | ) | | $ | (1,311 | ) | | $ | 1,866 | |
| | | | | | | | | | | | | | | | |
58
Mortgage Banking Activities
The Company enters into commitments to originate loans whereby the interest rate on the loan is determined prior to funding. These commitments are referred to as Interest Rate Lock Commitments (“IRLCs”). IRLCs on loans that the Company intends to sell are considered to be derivatives and are, therefore, recorded at fair value with changes in fair value recorded in earnings. For purposes of determining fair value, the Company performs a net present value analysis of the anticipated cash flows associated with these IRLCs. The net present value analysis performed excludes the market value associated with the anticipated sale of servicing rights related to each loan commitment. The fair value of these IRLCs was a $0.2 million asset and a $0.02 million liability at September 30, 2007 and December 31, 2006, respectively.
The Company also designates fair value relationships of closed loans held-for-sale against a combination of mortgage forwards and short treasury positions. Short treasury relationships are economic hedges, rather than fair value or cash flow hedges. Short treasury positions are marked-to-market, but do not receive hedge accounting treatment under SFAS No. 133, as amended. The mark-to-market of the mortgage forwards is included in the net change of the IRLCs and the related hedging instruments. The fair value of the mark-to-market on closed loans was a $0.6 million liability and a $1.7 million asset at September 30, 2007 and December 31, 2006, respectively.
IRLCs, as well as closed loans held-for-sale, expose the Company to interest rate risk. The Company manages this risk by selling mortgages or mortgage-backed securities on a forward basis referred to as forward sale agreements. Changes in the fair value of these derivatives are included as gain (loss) on loans and securities, net in the consolidated statement of income (loss). The net change in IRLCs, closed loans, mortgage forwards and the short treasury positions generated net losses of $0.6 million and $2.8 million for the three and nine months ended September 30, 2007, respectively. The net change in IRLCs, closed loans, mortgage forwards and the short treasury positions generated net gains of $1.7 million and $0.8 million for the three and nine months ended September 30, 2006, respectively.
NOTE 8—OTHER ASSETS
Other assets consist of the following (dollars in thousands):
| | | | | | |
| | | September 30,
2007 | | December 31,
2006 |
Deposit paid for securities borrowed | | $ | 684,215 | | $ | 448,047 |
Accrued interest receivable | | | 338,596 | | | 182,265 |
Net settlements and deposits with clearing organizations | | | 322,434 | | | 137,571 |
Derivative assets | | | 255,469 | | | 208,136 |
Bank owned life insurance policy(1) | | | 243,082 | | | — |
Other investments | | | 227,114 | | | 138,006 |
Income tax receivable | | | 139,872 | | | — |
Fails to deliver | | | 119,091 | | | 86,517 |
Third party loan servicing receivable | | | 112,905 | | | 241,511 |
Other receivables from brokers, dealers and clearing organizations | | | 109,942 | | | 72,596 |
Prepaids | | | 33,783 | | | 41,216 |
Real estate owned and repossessed assets | | | 22,852 | | | 12,904 |
Deferred compensation plan | | | 21,272 | | | 20,584 |
Unamortized debt issue costs | | | 21,111 | | | 26,498 |
Servicing rights | | | 7,057 | | | 8,487 |
Other | | | 182,746 | | | 172,643 |
| | | | | | |
Total other assets | | $ | 2,841,541 | | $ | 1,796,981 |
| | | | | | |
(1) | | Amount represents the cash surrender value as of September 30, 2007. |
59
NOTE 9—ASSET SECURITIZATION
Collateralized Debt Obligations (“CDO”)
On April 12, 2007, an unrelated financial advisor (“Advisor”) transferred $388.9 million in asset-backed securities to E*TRADE ABS CDO VI, Ltd. (“CDO VI”). The Company had previously transferred $46.9 million in asset-backed securities to the Advisor for transfer to CDO VI. Additionally, the Company utilized a warehouse line with the Advisor to purchase $342.0 million of asset-backed securities that were also transferred to CDO VI. Concurrent with these transfers, CDO VI sold total beneficial interests of $420.0 million to investors in the form of senior notes, subordinated notes and preference shares collateralized by the asset-backed securities. Additional purchases of asset-backed securities were made in open market transactions and transferred to CDO VI within 60 days following the closing date. As of September 30, 2007, 100% of the pool of underlying securities had been transferred into CDO VI.
The CDO VI transaction is a managed deal whereby the portfolio manager, ETGAM, is appointed to actively manage the collateral of the CDO. Because CDO VI is a managed deal, it is a special purpose entity and not a qualified special purpose entity. The CDO VI transaction was accounted for as a sale in accordance with SFAS No. 140.
The Company purchased $3.6 million of preference shares in CDO VI. Retained interests are subordinate to the notes sold by CDO VI and on an equal standing with the preference shares purchased by other preference share investors in CDO VI. Neither CDO VI itself nor the investors in the beneficial interests sold by CDO VI have recourse to the Company.
The Company reviewed CDO VI to determine if consolidation was necessary under the requirements of FIN 46R. The calculation of CDO VI’s beneficial interests indicated that the Company was not the recipient of the majority of the potential benefits or losses of the deal. Therefore, the Company is not the primary beneficiary of the transaction and is not required to consolidate the CDO.
The following table summarizes the asset-backed securities transferred to CDO VI at closing, the amount of the cash proceeds and the preference shares purchased by the Company (dollars in millions):
| | | | | | | | | | | | | | | | | |
CDO | | Transaction Date | | Asset-Backed Securities Transferred to CDO at closing | | Preference Shares Purchased by
E*TRADE |
| | | E*TRADE | | Independent
Investment Advisor | | Total | | Proceeds | | Amount |
CDO VI | | April 2007 | | $ | 46.9 | | $ | 342.0 | | $ | 388.9 | | $ | 420.0 | | $ | 3.6 |
NOTE 10—DEPOSITS
Deposits are summarized as follows (dollars in thousands):
| | | | | | | | | | | | | | | | | | |
| | | Weighted-Average
Rate | | | Amount | | Percentage
to Total | |
| | | September 30, 2007 | | | December 31, 2006 | | | September 30, 2007 | | December 31, 2006 | | September 30, 2007 | | | December 31,
2006 | |
Sweep deposit accounts | | 0.98 | % | | 0.94 | % | | $ | 11,465,265 | | $ | 10,837,124 | | 39.3 | % | | 45.0 | % |
Money market and savings accounts | | 4.52 | % | | 4.33 | % | | | 12,332,228 | | | 7,634,241 | | 42.2 | | | 31.7 | |
Certificates of deposit(1) | | 4.96 | % | | 5.02 | % | | | 4,336,325 | | | 4,737,253 | | 14.8 | | | 19.7 | |
Brokered certificates of deposit(2) | | 4.29 | % | | 3.95 | % | | | 631,869 | | | 483,777 | | 2.2 | | | 2.0 | |
Checking accounts | | 1.67 | % | | 1.06 | % | | | 431,657 | | | 378,617 | | 1.5 | | | 1.6 | |
| | | | | | | | | | | | | | | | | | |
Total deposits | | 3.15 | % | | 2.88 | % | | $ | 29,197,344 | | $ | 24,071,012 | | 100.0 | % | | 100.0 | % |
| | | | | | | | | | | | | | | | | | |
(1) | | Represents retail certificates of deposit, including retail brokered certificates of deposit. |
(2) | | Represents institutional certificates of deposit. |
60
NOTE 11—OTHER BORROWINGS
ETBH raises capital through the formation of trusts which sell trust preferred stock in the capital markets. The capital securities must be redeemed in whole at the due date, which is generally 30 years after issuance. Each trust issued Floating Rate Cumulative Preferred Securities, at par with a liquidation amount of $1,000 per capital security. The trusts use the proceeds from the sale of issuances to purchase Floating Rate Junior Subordinated Debentures issued by ETBH, which guarantees the trust obligations and contributes proceeds from the sale of its subordinated debentures to E*TRADE Bank in the form of a capital contribution.
During January, March and May 2007, ETBH formed three trusts, ETBH Capital Trust XXVIII, ETBH Capital Trust XXIX and ETBH Capital Trust XXX, respectively. Information related to these trusts is shown below (dollars in thousands):
| | | | | | | |
Trusts | | Face
Value | | Maturity Date | | Annual Interest Rate |
ETBH Capital Trust XXVIII | | $ | 25,000 | | 2037 | | 2.00% above 3-month LIBOR |
ETBH Capital Trust XXIX | | $ | 15,000 | | 2037 | | 1.95% above 3-month LIBOR |
ETBH Capital Trust XXX | | $ | 20,000 | | 2037 | | 1.90% above 3-month LIBOR |
NOTE 12—ACCOUNTS PAYABLE, ACCRUED AND OTHER LIABILITIES
Accounts payable, accrued and other liabilities consist of the following (dollars in thousands):
| | | | | | |
| | | September 30, 2007 | | December 31, 2006 |
Deposits received for securities loaned | | $ | 917,785 | | $ | 1,012,831 |
Other payables to brokers, dealers and clearing organizations | | | 353,946 | | | 350,221 |
Accounts payable and accrued expenses | | | 273,885 | | | 335,117 |
Fails to receive | | | 137,647 | | | 84,864 |
Derivative liabilities | | | 97,926 | | | 78,710 |
Subserviced loan advances | | | 71,927 | | | 44,780 |
Senior and convertible debt accrued interest | | | 25,077 | | | 20,125 |
Facility restructuring and other exit activities liability | | | 18,246 | | | 26,892 |
Other | | | 210,849 | | | 377,156 |
| | | | | | |
Total accounts payable, accrued and other liabilities | | $ | 2,107,288 | | $ | 2,330,696 |
| | | | | | |
NOTE 13—INCOME TAXES
Effective January 1, 2007, the Company adopted FIN 48. As a result of the implementation, the Company recognized a $14.9 million increase to its liability for unrecognized tax benefits, which was accounted for as a reduction to the beginning balance of retained earnings. The total amount of gross unrecognized tax benefits as of January 1, 2007 was $150.4 million. Of this total amount, $51.6 million (net of the federal benefit on state issues) represents the amount of unrecognized tax benefits that, if recognized, would favorably affect the effective income tax rate in future periods. This amount increased to $54.8 million for the period ended September 30, 2007. The gross unrecognized tax benefit was reduced to $78.8 million at September 30, 2007 principally due to tax accounting method change requests filed with the Internal Revenue Service (“IRS”).
61
The following table summarizes the tax years that are either currently under audit or remain open under the statute of limitations and subject to examination by the major tax jurisdictions in which the Company operates:
| | |
Jurisdiction | | Open Tax Year |
Canada | | 2001 – 2006 |
United Kingdom | | 2005 – 2006 |
United States | | 2003 – 2006 |
Various States(1) | | 1996 – 2006 |
(1) | | Includes California, Georgia, New York and Virginia. |
It is likely that certain examinations may be settled or the statute of limitations could expire with regards to other tax filings, in the next twelve months. In addition, proposed legislation could favorably impact certain of the Company’s unrecognized tax benefits. Such events would generally reduce the Company’s unrecognized tax benefits, either because the tax positions are sustained or because the Company agrees to the disallowance, by as much as $21.1 million, of which $19.5 million could affect the Company’s total tax provision or the effective tax rate. In October of 2007, the Company settled the majority of issues regarding a multiyear state tax examination that covered tax periods 1996 through 2004. As a result of this settlement, the Company expects to reduce its unrecognized tax benefits in the fourth quarter of 2007, by as much as $3.9 million, or $2.5 million net of federal tax, which will affect the Company’s total tax provision and the effective tax rate.
The Company’s continuing practice is to recognize interest and penalties, if any, related to income tax matters in income tax expense. After the adoption of FIN 48, the Company has total gross reserves of $15.1 million for the payment of interest as of January 1, 2007. The total gross reserves were reduced to $9.1 million as of September 30, 2007 due to the filing of tax accounting method change requests with the IRS.
62
NOTE 14—EARNINGS (LOSS) PER SHARE
The following table is a reconciliation of basic and diluted earnings (loss) per share (in thousands, except per share amounts):
| | | | | | | | | | | | | |
| | | Three Months Ended September 30, | | Nine Months Ended September 30, |
| | | 2007 | | | 2006 | | 2007 | | 2006 |
Basic: | | | | | | | | | | | | | |
Numerator: | | | | | | | | | | | | | |
Net income (loss) from continuing operations | | $ | (58,448 | ) | | $ | 150,228 | | $ | 270,091 | | $ | 449,904 |
Gain from discontinued operations, net of tax | | | — | | | | 3,021 | | | — | | | 2,300 |
| | | | | | | | | | | | | |
Net income (loss) | | $ | (58,448 | ) | | $ | 153,249 | | $ | 270,091 | | $ | 452,204 |
| | | | | | | | | | | | | |
Denominator: | | | | | | | | | | | | | |
Basic weighted-average shares outstanding | | | 420,964 | | | | 423,736 | | | 422,676 | | | 420,148 |
| | | | | | | | | | | | | |
Diluted: | | | | | | | | | | | | | |
Numerator: | | | | | | | | | | | | | |
Net income (loss) | | $ | (58,448 | ) | | $ | 153,249 | | $ | 270,091 | | $ | 452,204 |
| | | | | | | | | | | | | |
Denominator: | | | | | | | | | | | | | |
Basic weighted-average shares outstanding | | | 420,964 | | | | 423,736 | | | 422,676 | | | 420,148 |
Effect of dilutive securities: | | | | | | | | | | | | | |
Weighted-average options and restricted stock issued to employees | | | — | | | | 13,796 | | | 10,852 | | | 14,864 |
Weighted-average warrants and contingent shares outstanding | | | — | | | | 248 | | | 248 | | | 248 |
Weighted-average mandatory convertible notes | | | — | | | | 1,103 | | | — | | | 1,699 |
| | | | | | | | | | | | | |
Diluted weighted-average shares outstanding | | | 420,964 | | | | 438,883 | | | 433,776 | | | 436,959 |
| | | | | | | | | | | | | |
Per share: | | | | | | | | | | | | | |
Basic earnings (loss) per share: | | | | | | | | | | | | | |
Earnings (loss) per share from continuing operations | | $ | (0.14 | ) | | $ | 0.35 | | $ | 0.64 | | $ | 1.07 |
Earnings per share from discontinued operations | | | — | | | | 0.01 | | | — | | | 0.01 |
| | | | | | | | | | | | | |
Net earnings (loss) per share | | $ | (0.14 | ) | | $ | 0.36 | | $ | 0.64 | | $ | 1.08 |
| | | | | | | | | | | | | |
Diluted earnings (loss) per share: | | | | | | | | | | | | | |
Earnings (loss) per share from continuing operations | | $ | (0.14 | ) | | $ | 0.34 | | $ | 0.62 | | $ | 1.03 |
Earnings per share from discontinued operations | | | — | | | | 0.01 | | | — | | | 0.00 |
| | | | | | | | | | | | | |
Net earnings (loss) per share | | $ | (0.14 | ) | | $ | 0.35 | | $ | 0.62 | | $ | 1.03 |
| | | | | | | | | | | | | |
For the three months ended September 30, 2007, the Company excluded from the calculations of diluted earnings per share 21.5 million shares of stock options and restricted stock awards that would have been anti-dilutive, including 8.9 million shares that were anti-dilutive because of the Company’s net loss for the period. For the nine months ended September 30, 2007, the Company excluded from the calculations of diluted earnings per share 10.1 million shares of stock options that would have been anti-dilutive and 6.7 million and 4.8 million shares of stock options that would have been anti-dilutive for the three and nine months ended September 30, 2006, respectively.
The Company also excluded from the calculations of diluted earnings per share 3.0 million shares of common stock for the nine months ended September 30, 2006, issuable under convertible subordinated notes as the effect of applying the treasury stock method on an if-converted basis would be anti-dilutive. There were no
63
shares issuable under convertible subordinated notes excluded from the calculation of diluted earnings per share for the three months ended September 30, 2006, and the three and nine months ended September 30, 2007, as all convertible subordinated notes outstanding had been redeemed by the end of the second quarter of 2006.
NOTE 15—SHARE REPURCHASES
On April 18, 2007, the Company announced that its Board of Directors authorized an additional $250.0 million common stock repurchase program (the “April 2007 Plan”). The April 2007 Plan is open-ended and allows for the repurchase of common stock on the open market, in private transactions or a combination of both.
During 2007, the Company repurchased common stock under the April 2007 Plan and a $200.0 million repurchase program approved by the Board in December 2004 (the “December 2004 Plan”). During the second quarter of 2007, the Company completed the December 2004 Plan. The table below shows the timing and impact of the repurchases during the nine months ended September 30, 2007 (dollars in thousands, except per share amounts):
| | | | | | | | |
Three Months Ended | | Total Number of Shares Purchased | | Aggregate Price | | Average Price Paid per Share | | Maximum Dollar
Value of Shares
That May Yet be
Purchased Under
the April 2007 and
December 2004
Plans |
March 31, 2007 | | 1,030,000 | | $23,022 | | $22.35 | | $34,142 |
June 30, 2007 | | 3,128,625 | | $72,883 | | $23.30 | | $211,259 |
September 30, 2007 | | 3,069,185 | | $52,727 | | $17.18 | | $158,532 |
NOTE 16—REGULATORY REQUIREMENTS
Registered Broker-Dealers
The Company’s U.S. broker-dealer subsidiaries are subject to the Uniform Net Capital Rule (the “Rule”) under the Securities Exchange Act of 1934 administered by the SEC and FINRA, which requires the maintenance of minimum net capital. The minimum net capital requirements can be met under either the Aggregate Indebtedness method or the Alternative method. Under the Aggregate Indebtedness method, a broker-dealer is required to maintain minimum net capital of the greater of 6 2/3% of its aggregate indebtedness, as defined, or a minimum dollar amount. Under the Alternative method, a broker-dealer is required to maintain net capital equal to the greater of $250,000 or 2% of aggregate debit balances arising from customer transactions.
The Company uses both the Aggregate Indebtedness and the Alternative methods to compute net capital. The method used depends on the individual U.S. broker-dealer subsidiary. The Company’s international broker-dealer subsidiaries, located in Canada, Europe and Asia, are subject to capital requirements determined by their respective regulators.
As of September 30, 2007, all of the Company’s broker-dealer subsidiaries met minimum net capital requirements. Total required net capital was $212.8 million at September 30, 2007. In addition, the Company’s broker-dealer subsidiaries had excess net capital of $745.2 million at September 30, 2007.
Banking
During the first quarter of 2007, ETC became a wholly-owned operating subsidiary of E*TRADE Bank. ETC continues to be an SEC-registered broker-dealer and is included in the minimum net capital requirements under the Rule. E*TRADE Bank is subject to various regulatory capital requirements administered by Federal banking agencies. Failure to meet minimum capital requirements can trigger certain mandatory and possibly
64
additional discretionary actions by regulators that, if undertaken, could have a direct material effect on E*TRADE Bank’s financial statements. Under capital adequacy guidelines and the regulatory framework for prompt corrective action, E*TRADE Bank must meet specific capital guidelines that involve quantitative measures of E*TRADE Bank’s assets, liabilities and certain off-balance sheet items as calculated under regulatory accounting practices. E*TRADE Bank’s capital amounts and classification are also subject to qualitative judgments by the regulators about components, risk weightings and other factors.
Quantitative measures established by regulation to ensure capital adequacy require E*TRADE Bank to maintain minimum amounts and ratios of Total and Tier I Capital to risk-weighted assets and Tier I Capital to adjusted total assets. As shown in the table below, at September 30, 2007, the OTS categorized E*TRADE Bank as “well capitalized” under the regulatory framework for prompt corrective action. E*TRADE Bank is also required by OTS regulations to maintain tangible capital of at least 1.50% of tangible assets. E*TRADE Bank satisfied this requirement at September 30, 2007 and December 31, 2006. However, events beyond management’s control, such as a significant deterioration in residential real estate and credit markets, could adversely affect future earnings and E*TRADE Bank’s ability to meet its future capital requirements.
E*TRADE Bank’s required actual capital amounts and ratios are presented in the table below (dollars in thousands):
| | | | | | | | | | | | | | | | |
| | | Actual | | | Minimum Required to
Qualify as Adequately
Capitalized | | | Minimum Required to
be Well Capitalized
Under Prompt
Corrective Action Provisions | |
| | | Amount | | Ratio | | | Amount | | Ratio | | | Amount | | Ratio | |
September 30, 2007(1): | | | | | | | | | | | | | | | | |
Total Capital to risk-weighted assets | | $ | 3,677,128 | | 10.55 | % | | >$2,787,599 | | >8.0 | % | | >$3,484,499 | | >10.0 | % |
Tier I Capital to risk-weighted assets | | $ | 3,468,090 | | 9.95 | % | | >$1,393,800 | | >4.0 | % | | >$2,090,699 | | > 6.0 | % |
Tier I Capital to adjusted total assets | | $ | 3,468,090 | | 5.88 | % | | >$2,358,006 | | >4.0 | % | | >$2,947,508 | | > 5.0 | % |
December 31, 2006: | | | | | | | | | | | | | | | | |
Total Capital to risk-weighted assets | | $ | 2,593,081 | | 10.55 | % | | >$1,967,129 | | >8.0 | % | | >$2,458,911 | | >10.0 | % |
Tier I Capital to risk-weighted assets | | $ | 2,525,453 | | 10.27 | % | | >$ 983,565 | | >4.0 | % | | >$1,475,347 | | > 6.0 | % |
Tier I Capital to adjusted total assets | | $ | 2,525,453 | | 6.07 | % | | >$1,665,062 | | >4.0 | % | | >$2,081,328 | | > 5.0 | % |
(1) | | Capital amounts and ratios include ETC. |
NOTE 17—COMMITMENTS, CONTINGENCIES AND OTHER REGULATORY MATTERS
Legal Matters
Litigation Matters
In June 2002, the Company acquired from MarketXT Holdings, Inc. (formerly known as “Tradescape Corporation”) the following entities: Tradescape Securities, LLC; Tradescape Technologies, LLC; and Momentum Securities, LLC. Disputes subsequently arose between the parties regarding the responsibility for liabilities that first became known to the Company after the sale. On April 8, 2004, MarketXT filed a complaint in the United States District Court for the Southern District of New York against the Company, certain of its officers and directors, and other third parties, including SBI and Softbank Corporation, alleging that defendants were preventing plaintiffs from obtaining certain contingent payments allegedly due, and as a result, claiming damages of $1.5 billion. On April 9, 2004, the Company filed a complaint in the United States District Court for the Southern District of New York against certain directors and officers of MarketXT seeking declaratory relief and unspecified monetary damages for defendants’ fraud in connection with the 2002 sale, including, but not limited to, having presented the Company with fraudulent financial statements regarding the condition of Momentum Securities, LLC during the due diligence process. Subsequently, MarketXT was placed into
65
bankruptcy, and the Company filed an adversary proceeding against MarketXT and others in January 2005, seeking declaratory relief, compensatory and punitive damages, in those Chapter 11 bankruptcy proceedings in the United States Bankruptcy Court for the Southern District of New York entitled, “In re MarketXT Holdings Corp., Debtor.” In that same court, the Company filed a separate adversary proceeding against Omar Amanat in those Chapter 7 bankruptcy proceedings entitled, “In re Amanat, Omar Shariff.” In October 2005, MarketXT answered the Company’s adversary proceeding and asserted its counterclaims, subsequently amending its claims in 2006 to add a $326.0 million claim for “promissory estoppel” in which MarketXT alleged, for the first time, that the Company breached a prior promise to purchase the acquired entities in 1999-2000. In April 2006, Omar Amanat answered the Company’s separate adversary proceeding against him and asserted his counterclaims. In separate motions before the Bankruptcy Court, the Company has moved to dismiss certain counterclaims brought by MarketXT including those described above, as well as certain counterclaims brought by Mr. Amanat. In a ruling dated September 29, 2006, the Bankruptcy Court in the MarketXT case granted the Company’s motion to dismiss four of the six bases upon which MarketXT asserts its fraud claims against the Company; its conversion claim; and its demand for punitive damages. In the same ruling, the Bankruptcy Court denied in its entirety MarketXT’s competing motion to dismiss the Company’s claims against it. On October 26, 2006, the Bankruptcy Court subsequently dismissed MarketXT’s “promissory estoppel” claim. The Company continues to believe that the respective claims brought against it by MarketXT and Omar Amanat are without merit, and the Company will continue both to vigorously defend itself against all such claims and to fully pursue its own claims and damages as described above.
On October 27, 2000, a complaint was filed in the Superior Court for the State of California, County of Santa Clara, entitled, “Ajaxo, Inc., a Delaware corporation, Plaintiff, versus E*TRADE GROUP, INC., a Delaware corporation; and Everypath, Inc., a California corporation; and Does 1 through 50, inclusively, Defendants.” Through this complaint, Ajaxo sought damages and certain non-monetary relief for the Company’s alleged breach of a non-disclosure agreement with Ajaxo pertaining to certain wireless technology offered to the company by Ajaxo as well as damages and other relief against both the Company and defendant Everypath, Inc., for their alleged misappropriation of Ajaxo’s trade secrets. Following a jury trial, a judgment was entered in 2003 in favor of Ajaxo against the Company for $1.3 million dollars for breach of the Ajaxo non-disclosure agreement. Although the jury also found in favor of Ajaxo on its misappropriation of trade secrets claim against the Company and defendant Everypath, the trial court subsequently denied Ajaxo’s requests for additional damages and relief on these claims. Thereafter, all parties appealed, and on December 21, 2005, the California Court of Appeal affirmed the above-described award against the Company for breach of the nondisclosure agreement but remanded the case to the trial court for the limited purpose of determining what, if any, additional damages Ajaxo may be entitled to as a result of the jury’s previous finding in favor of Ajaxo on its misappropriation of trade secrets claim against the Company and defendant Everypath. Following the foregoing ruling by the Court of Appeal, defendant Everypath ceased operations and made an assignment for the benefit of its creditors in January, 2006. As a result, defendant Everypath is no longer defending the case. Although the Company paid Ajaxo the full amount due on the judgment against it above, the case, consistent with the rulings issued by the Court of Appeal, has now been remanded back to the trial court, and the parties are awaiting the setting of a new trial date solely on the issue of what, if any, additional damages Ajaxo may be entitled to receive on its misappropriation of trade secrets claim. In specific, Ajaxo continues to seek unstated monetary damages and injunctive relief, lost profits in the amount of $500,000 per month since November, 1999, and punitive damages. The Company denies that Ajaxo is entitled to any further damages or relief of any kind and will vigorously defend itself against Ajaxo’s renewed damage claims.
On October 2, 2007, a class action complaint alleging violations of federal securities laws was filed in the United States District Court for the Southern District of New York against the Company, its Chief Executive Officer and Chief Financial Officer entitled, “Larry Freudenberg, Individually and on Behalf of All Others Similarly Situated, Plaintiff, versus E*TRADE Financial Corporation, Mitchell H. Caplan and Robert J. Simmons, Defendants.” Plaintiff contends, among other things, that between December 14, 2006, and September 25, 2007 (the “class period”) defendants issued materially false and misleading statements and failed to disclose that the Company was experiencing a rise in delinquency rates in its mortgage and home equity
66
portfolios; failed to timely record an impairment on its mortgage and home equity portfolios; materially overvalued its securities portfolio, which includes assets backed by mortgages; and based on the foregoing, lacked a reasonable basis for the positive statements it made about the Company’s earnings and prospects. Plaintiffs further allege that the named executive officers engaged in insider trading during the class period. Plaintiff seeks to recover damages in an amount to be proven at trial, including interest and attorney’s fees and costs. Subsequently, two additional class action complaints alleging similar violations of federal security laws were filed in the same court on October 12, 2007 and October 30, 2007, respectively, entitled, “William Boston, Individually and On Behalf of All Others Similarly Situated, Plaintiff, versus E*TRADE Financial Corporation, Mitchell H. Caplan, and Robert J. Simmons, Defendants” and “Robert D. Thulman, Individually and On Behalf of All Others Similarly Situated, Plaintiff, versus E*TRADE Financial Corporation, Mitchell H. Caplan and Robert J. Simmons, Defendants.” The Company believes that the allegations asserted in these class action complaints are without merit and intends to vigorously defend itself against the claims raised therein.
Based upon the same facts and circumstances alleged in the Freudenberg class action complaint above, a verified shareholder derivative complaint was filed in United States District Court for the Southern District of New York on October 4, 2007, against the Company’s Chief Executive Officer, President/Chief Operating Officer, Chief Financial Officer and individual members of its board of directors entitled, “Catherine Rubery, Derivatively on behalf of E*TRADE FINANCIAL Corporation, Plaintiff, versus Mitchell H. Caplan, R. Jarrett Lilien, Robert J. Simmons, George A. Hayter, Daryl Brewster, Ronald D. Fisher, Michael K. Parks, C. Catherine Raffaeli, Lewis E. Randall, Donna L. Weaver, and Stephen H. Willard, Defendants, -and- E*TRADE Financial Corporation, a Delaware corporation, Nominal Defendant.” Plaintiff alleges, among other things, causes of action for breach of fiduciary duty, waste of corporate assets, unjust enrichment, and violation of the Security Exchange Act of 1934 and Rule 10B-5. Plaintiff, on behalf of the Company, seeks monetary and non-monetary damages from defendants according to proof at trial, including but not limited to a judgment directing the Company to take all necessary actions to improve its corporate governance and related internal procedures regarding the selection of its directors. Subsequently, two additional shareholder derivative complaints alleging similar violations were filed in the same court, on October 4, 2007 and October 30, 2007, respectively, against the same named defendants entitled, “Marilyn Clark, Derivatively On Behalf of E*TRADE FINANCIAL CORPORATION, Plaintiff, versus Mitchell H. Caplan, et al., Defendants” and “Brian Kallinen, Derivatively on Behalf of E*TRADE FINANCIAL CORPORATION, Plaintiff, versus Mitchell H. Caplan, et al., Defendants.”
In addition to the matters described above, the Company is subject to various legal proceedings and claims that arise in the normal course of business which could have a material adverse effect on its financial position, results of operations or cash flows. In each pending matter, the Company contests liability or the amount of claimed damages. In view of the inherent difficulty of predicting the outcome of such matters, particularly in cases where claimants seek substantial or indeterminate damages, or where investigation or discovery have yet to be completed, the Company cannot predict with certainty the loss or range of loss related to such matters, how such matters will be resolved, when they will ultimately be resolved, or what any eventual settlement, fine, penalty or other relief might be. Subject to the foregoing, the Company believes that the outcome of any such pending matter will not have a material adverse effect on the consolidated financial condition of the Company, although the outcome could be material to the Company’s or a business segment’s operating results in the future, depending, among other things, upon the Company’s or business segment’s income for such period.
An unfavorable outcome in any matter that is not covered by insurance could have a material adverse effect on the Company’s business, financial condition, results of operations or cash flows. In addition, even if the ultimate outcomes are resolved in the Company’s favor, the defense of such litigation could entail considerable cost or the diversion of the efforts of management, either of which could have a material adverse effect on the Company’s results of operation.
Regulatory Matters
The securities and banking industries are subject to extensive regulation under Federal, state and applicable international laws. As a result, the Company is required to comply with many complex laws and rules, and its
67
ability to comply is dependent in part on the establishment and maintenance of a qualified compliance system. From time to time, the Company has been threatened with or named as a defendant in, lawsuits, arbitrations and administrative claims involving securities, banking and other matters. The Company is also subject to periodic regulatory audits and inspections. Compliance and trading problems that are reported to regulators, such as the SEC, FINRA or OTS by dissatisfied customers or others are investigated by such regulators, and may, if pursued, result in formal claims being filed against the Company by customers or disciplinary action being taken against the Company or its employees by regulators. Any such claims or disciplinary actions that are decided against the Company could have a material impact on the financial results of the Company or any of its subsidiaries.
The SEC, in conjunction with various regional securities exchanges, is conducting an inquiry into the trading activities of certain specialist firms, including the Company’s subsidiary E*TRADE Capital Markets, LLC (“ETCM”), on various regional exchanges in order to determine whether such firms executed proprietary orders in a given security prior to a customer order in the same security (a practice commonly known as “trading ahead”) during the period 1999 - 2005. The SEC has indicated that it will seek disgorgement, prejudgment interest, and penalties from any firm found to have engaged in trading ahead activity to the detriment of its customers during that time period. It is possible that such sanctions, if imposed against ETCM, could have a material impact on the financial results of the Company during the period in which such sanctions are imposed. The Company and ETCM are cooperating with the investigation.
On October 17, 2007, the SEC initiated an informal inquiry into matters related to the Company’s loan and securities portfolios. The Company is cooperating fully with the SEC in this matter.
Insurance
The Company maintains insurance coverage that management believes is reasonable and prudent. The principal insurance coverage it maintains covers commercial general liability; property damage; hardware/software damage; cyber liability; directors and officers; employment practices liability; certain criminal acts against the Company; and errors and omissions. The Company believes that such insurance coverage is adequate for the purpose of its business. The Company’s ability to maintain this level of insurance coverage in the future, however, is subject to the availability of affordable insurance in the marketplace.
Reserves
For all legal and regulatory matters, reserves are established in accordance with SFAS No. 5. Once established, reserves are adjusted when an event occurs requiring an adjustment.
Commitments
In the normal course of business, the Company makes various commitments to extend credit and incur contingent liabilities that are not reflected in the consolidated balance sheet. Significant changes in the economy or interest rates influence the impact that these commitments and contingencies have on the Company in the future.
Loans
The Company had the following mortgage loan commitments (dollars in thousands):
| | | | | | | | | |
| | | September 30, 2007 |
| | | Fixed Rate | | Variable Rate | | Total |
Purchase loans | | $ | — | | $ | — | | $ | — |
Originate loans | | $ | 557,236 | | $ | 261,117 | | $ | 818,353 |
Sell loans | | $ | 42,582 | | $ | 35,876 | | $ | 78,458 |
Securities, Unused Lines of Credit and Certificates of Deposit
At September 30, 2007, the Company had commitments to purchase $1.2 billion and sell $1.3 billion in securities. In addition, the Company had approximately $4.1 billion of certificates of deposit scheduled to mature in less than one year and $7.9 billion of unfunded commitments to extend credit.
68
Guarantees
The Company provides guarantees to investors purchasing mortgage loans, which are considered standard representations and warranties within the mortgage industry. The primary guarantees are as follows:
| | • | | The mortgage and the mortgage note have been duly executed and each is the legal, valid and binding obligation of the Company, enforceable in accordance with its terms. The mortgage has been duly acknowledged and recorded and is valid. The mortgage and the mortgage note are not subject to any right of rescission, set-off, counterclaim or defense, including, without limitation, the defense of usury, and no such right of rescission, set-off, counterclaim or defense has been asserted with respect thereto. If these claims prove to be untrue, the investor can require the Company to repurchase the loan and return all loan purchase and servicing release premiums. |
| | • | | Should any eligible mortgage loan delivered pay off prior to the receipt of the first payment, the loan purchase and servicing release premiums shall be fully refunded. |
| | • | | Should any eligible mortgage loan delivered to an investor pay off between the receipt of the first payment and a contractually designated period of time (typically 60-120 days from the date of purchase), the servicing release premiums shall be fully refunded. |
Management has determined that quantifying the potential liability exposure is not meaningful due to the nature of the standard representations and warranties, which rarely result in loan repurchases. The current carrying amount of the liability recorded at September 30, 2007 is $0.2 million, which the Company considers adequate based upon analysis of historical trends and current economic conditions for these guarantees.
ETBH raises capital through the formation of trusts, which sell trust preferred stock in the capital markets. The capital securities must be redeemed in whole at the due date, which is generally 30 years after issuance. Each trust issues Floating Rate Cumulative Preferred Securities at par, with a liquidation amount of $1,000 per capital security. The proceeds from the sale of issuances are invested in ETBH’s Floating Rate Junior Subordinated Debentures.
During the 30-year period prior to the redemption of the Floating Rate Cumulative Preferred Securities, ETBH guarantees the accrued and unpaid distributions on these securities, as well as the redemption price of the securities and certain costs that may be incurred in liquidating, terminating or dissolving the trusts (all of which would otherwise be payable by the trusts). At September 30, 2007, management estimated that the maximum potential liability under this arrangement is equal to approximately $442.1 million or the total face value of these securities plus dividends, which may be unpaid at the termination of the trust arrangement.
NOTE 18—SEGMENT INFORMATION
The segments presented below reflect the manner in which the Company’s chief operating decision maker assesses the Company’s performance. The Company has two segments: retail and institutional.
Retail includes:
| | • | | trading, investing, banking and lending products and services to individuals; and |
| | • | | stock plan administration products and services. |
Institutional includes:
| | • | | balance sheet management activities including generation of institutional net interest spread, gain (loss) on loans and securities, net and management income; |
| | • | | global equity execution and settlement services. |
69
The Company evaluates the performance of its segments based on segment contribution (net revenue less expense excluding operating interest). All corporate overhead, administrative and technology charges are allocated to segments either in proportion to their respective direct costs or based upon specific operating criteria.
Financial information for the Company’s reportable segments is presented in the following tables (dollars in thousands):
| | | | | | | | | | | | | | | | |
| | | Three Months Ended September 30, 2007 | |
| | | Retail | | | Institutional | | | Eliminations(1) | | | Total | |
Revenue: | | | | | | | | | | | | | | | | |
Operating interest income | | $ | 540,675 | | | $ | 787,912 | | | $ | (376,751 | ) | | $ | 951,836 | |
Operating interest expense | | | (281,829 | ) | | | (628,726 | ) | | | 376,751 | | | | (533,804 | ) |
| | | | | | | | | | | | | | | | |
Net operating interest income | | | 258,846 | | | | 159,186 | | | | — | | | | 418,032 | |
Provision for loan losses | | | — | | | | (186,536 | ) | | | — | | | | (186,536 | ) |
| | | | | | | | | | | | | | | | |
Net operating interest income (expense) after provision for loan losses | | | 258,846 | | | | (27,350 | ) | | | — | | | | 231,496 | |
| | | | | | | | | | | | | | | | |
Commission | | | 142,291 | | | | 46,112 | | | | — | | | | 188,403 | |
Fees and service charges | | | 62,019 | | | | 5,370 | | | | (2,587 | ) | | | 64,802 | |
Principal transactions | | | — | | | | 20,889 | | | | — | | | | 20,889 | |
Gain (loss) on loans and securities, net | | | 1,148 | | | | (198,205 | ) | | | — | | | | (197,057 | ) |
Other revenue | | | 9,824 | | | | 3,019 | | | | (144 | ) | | | 12,699 | |
| | | | | | | | | | | | | | | | |
Total non-interest income (expense) | | | 215,282 | | | | (122,815 | ) | | | (2,731 | ) | | | 89,736 | |
| | | | | | | | | | | | | | | | |
Total net revenue | | | 474,128 | | | | (150,165 | ) | | | (2,731 | ) | | | 321,232 | |
| | | | | | | | | | | | | | | | |
Expense excluding interest: | | | | | | | | | | | | | | | | |
Compensation and benefits | | | 81,319 | | | | 36,219 | | | | — | | | | 117,538 | |
Clearing and servicing | | | 23,950 | | | | 57,565 | | | | (2,731 | ) | | | 78,784 | |
Advertising and market development | | | 26,428 | | | | 80 | | | | — | | | | 26,508 | |
Communications | | | 24,142 | | | | 3,383 | | | | — | | | | 27,525 | |
Professional services | | | 14,501 | | | | 6,513 | | | | — | | | | 21,014 | |
Depreciation and amortization | | | 16,164 | | | | 6,041 | | | | — | | | | 22,205 | |
Occupancy and equipment | | | 19,796 | | | | 3,052 | | | | — | | | | 22,848 | |
Amortization of other intangibles | | | 9,370 | | | | 1,115 | | | | — | | | | 10,485 | |
Facility restructuring and other exit activities | | | 1,261 | | | | 4,610 | | | | — | | | | 5,871 | |
Other | | | 32,970 | | | | 14,854 | | | | — | | | | 47,824 | |
| | | | | | | | | | | | | | | | |
Total expense excluding interest | | | 249,901 | | | | 133,432 | | | | (2,731 | ) | | | 380,602 | |
| | | | | | | | | | | | | | | | |
Segment income (loss) | | $ | 224,227 | | | $ | (283,597 | ) | | $ | — | | | $ | (59,370 | ) |
| | | | | | | | | | | | | | | | |
(1) | | Reflects elimination of transactions between retail and institutional segments, which includes deposit and customer payable transfer pricing and order flow rebates. |
70
| | | | | | | | | | | | | | | | |
| | | Three Months Ended September 30, 2006 | |
| | | Retail | | | Institutional | | | Eliminations(1) | | | Total | |
Revenue: | | | | | | | | | | | | | | | | |
Operating interest income | | $ | 397,998 | | | $ | 576,258 | | | $ | (242,827 | ) | | $ | 731,429 | |
Operating interest expense | | | (176,939 | ) | | | (442,181 | ) | | | 242,827 | | | | (376,293 | ) |
| | | | | | | | | | | | | | | | |
Net operating interest income | | | 221,059 | | | | 134,077 | | | | — | | | | 355,136 | |
Provision for loan losses | | | — | | | | (12,547 | ) | | | — | | | | (12,547 | ) |
| | | | | | | | | | | | | | | | |
Net operating interest income after provision for loan losses | | | 221,059 | | | | 121,530 | | | | — | | | | 342,589 | |
| | | | | | | | | | | | | | | | |
Commission | | | 100,902 | | | | 32,704 | | | | — | | | | 133,606 | |
Fees and service charges | | | 51,244 | | | | 7,708 | | | | (622 | ) | | | 58,330 | |
Principal transactions | | | — | | | | 22,697 | | | | — | | | | 22,697 | |
Gain on loans and securities, net | | | 10,608 | | | | 5,395 | | | | — | | | | 16,003 | |
Other revenue | | | 8,488 | | | | 183 | | | | (130 | ) | | | 8,541 | |
| | | | | | | | | | | | | | | | |
Total non-interest income | | | 171,242 | | | | 68,687 | | | | (752 | ) | | | 239,177 | |
| | | | | | | | | | | | | | | | |
Total net revenue | | | 392,301 | | | | 190,217 | | | | (752 | ) | | | 581,766 | |
| | | | | | �� | | | | | | | | | | |
Expense excluding interest: | | | | | | | | | | | | | | | | |
Compensation and benefits | | | 77,002 | | | | 33,703 | | | | — | | | | 110,705 | |
Clearing and servicing | | | 18,307 | | | | 44,945 | | | | (752 | ) | | | 62,500 | |
Advertising and market development | | | 22,517 | | | | 1,397 | | | | — | | | | 23,914 | |
Communications | | | 22,248 | | | | 3,328 | | | | — | | | | 25,576 | |
Professional services | | | 12,140 | | | | 8,601 | | | | — | | | | 20,741 | |
Depreciation and amortization | | | 14,175 | | | | 4,390 | | | | — | | | | 18,565 | |
Occupancy and equipment | | | 20,434 | | | | 1,716 | | | | — | | | | 22,150 | |
Amortization of other intangibles | | | 9,913 | | | | 2,174 | | | | — | | | | 12,087 | |
Facility restructuring and other exit activities | | | 16,716 | | | | (32 | ) | | | — | | | | 16,684 | |
Other | | | 33,775 | | | | 11,900 | | | | — | | | | 45,675 | |
| | | | | | | | | | | | | | | | |
Total expense excluding interest | | | 247,227 | | | | 112,122 | | | | (752 | ) | | | 358,597 | |
| | | | | | | | | | | | | | | | |
Segment income | | $ | 145,074 | | | $ | 78,095 | | | $ | — | | | $ | 223,169 | |
| | | | | | | | | | | | | | | | |
(1) | | Reflects elimination of transactions between retail and institutional segments, which includes deposit and customer payable transfer pricing, servicing and order flow rebates. |
71
| | | | | | | | | | | | | | | | |
| | | Nine Months Ended September 30, 2007 | |
| | | Retail | | | Institutional | | | Eliminations(1) | | | Total | |
Revenue: | | | | | | | | | | | | | | | | |
Operating interest income | | $ | 1,500,775 | | | $ | 2,200,925 | | | $ | (1,014,297 | ) | | $ | 2,687,403 | |
Operating interest expense | | | (763,944 | ) | | | (1,714,974 | ) | | | 1,014,297 | | | | (1,464,621 | ) |
| | | | | | | | | | | | | | | | |
Net operating interest income | | | 736,831 | | | | 485,951 | | | | — | | | | 1,222,782 | |
Provision for loan losses | | | — | | | | (237,767 | ) | | | — | | | | (237,767 | ) |
| | | | | | | | | | | | | | | | |
Net operating interest income after provision for loan losses | | | 736,831 | | | | 248,184 | | | | — | | | | 985,015 | |
| | | | | | | | | | | | | | | | |
Commission | | | 393,779 | | | | 123,385 | | | | — | | | | 517,164 | |
Fees and service charges | | | 174,201 | | | | 22,768 | | | | (7,223 | ) | | | 189,746 | |
Principal transactions | | | — | | | | 78,739 | | | | — | | | | 78,739 | |
Gain (loss) on loans and securities, net | | | 13,410 | | | | (187,764 | ) | | | — | | | | (174,354 | ) |
Other revenue | | | 30,748 | | | | 3,151 | | | | (430 | ) | | | 33,469 | |
| | | | | | | | | | | | | | | | |
Total non-interest income | | | 612,138 | | | | 40,279 | | | | (7,653 | ) | | | 644,764 | |
| | | | | | | | | | | | | | | | |
Total net revenue | | | 1,348,969 | | | | 288,463 | | | | (7,653 | ) | | | 1,629,779 | |
| | | | | | | | | | | | | | | | |
Expense excluding interest: | | | | | | | | | | | | |
Compensation and benefits | | | 241,340 | | | | 119,059 | | | | — | | | | 360,399 | |
Clearing and servicing | | | 67,369 | | | | 160,497 | | | | (7,653 | ) | | | 220,213 | |
Advertising and market development | | | 104,734 | | | | 3,304 | | | | — | | | | 108,038 | |
Communications | | | 69,507 | | | | 9,995 | | | | — | | | | 79,502 | |
Professional services | | | 46,674 | | | | 24,487 | | | | — | | | | 71,161 | |
Depreciation and amortization | | | 46,219 | | | | 15,444 | | | | — | | | | 61,663 | |
Occupancy and equipment | | | 60,127 | | | | 9,120 | | | | — | | | | 69,247 | |
Amortization of other intangibles | | | 28,525 | | | | 2,415 | | | | — | | | | 30,940 | |
Facility restructuring and other exit activities | | | 1,436 | | | | 3,668 | | | | — | | | | 5,104 | |
Other | | | 83,190 | | | | 67,735 | | | | — | | | | 150,925 | |
| | | | | | | | | | | | | | | | |
Total expense excluding interest | | | 749,121 | | | | 415,724 | | | | (7,653 | ) | | | 1,157,192 | |
| | | | | | | | | | | | | | | | |
Segment income (loss) | | $ | 599,848 | | | $ | (127,261 | ) | | $ | — | | | $ | 472,587 | |
| | | | | | | | | | | | | | | | |
(1) | | Reflects elimination of transactions between retail and institutional segments, which includes deposit and customer payable transfer pricing and order flow rebates. |
72
| | | | | | | | | | | | | | | | |
| | | Nine Months Ended September 30, 2006 | |
| | | Retail | | | Institutional | | | Eliminations(1) | | | Total | |
Revenue: | | | | | | | | | | | | | | | | |
Operating interest income | | $ | 1,088,932 | | | $ | 1,532,902 | | | $ | (635,738 | ) | | $ | 1,986,096 | |
Operating interest expense | | | (433,247 | ) | | | (1,164,060 | ) | | | 635,738 | | | | (961,569 | ) |
| | | | | | | | | | | | | | | | |
Net operating interest income | | | 655,685 | | | | 368,842 | | | | — | | | | 1,024,527 | |
Provision for loan losses | | | — | | | | (33,014 | ) | | | — | | | | (33,014 | ) |
| | | | | | | | | | | | | | | | |
Net operating interest income after provision for loan losses | | | 655,685 | | | | 335,828 | | | | — | | | | 991,513 | |
| | | | | | | | | | | | | | | | |
Commission | | | 364,333 | | | | 112,438 | | | | — | | | | 476,771 | |
Fees and service charges | | | 156,640 | | | | 22,035 | | | | (4,674 | ) | | | 174,001 | |
Principal transactions | | | — | | | | 84,979 | | | | — | | | | 84,979 | |
Gain on loans and securities, net | | | 28,293 | | | | 10,445 | | | | — | | | | 38,738 | |
Other revenue | | | 28,690 | | | | 346 | | | | (3,565 | ) | | | 25,471 | |
| | | | | | | | | | | | | | | | |
Total non-interest income | | | 577,956 | | | | 230,243 | | | | (8,239 | ) | | | 799,960 | |
| | | | | | | | | | | | | | | | |
Total net revenue | | | 1,233,641 | | | | 566,071 | | | | (8,239 | ) | | | 1,791,473 | |
| | | | | | | | | | | | | | | | |
Expense excluding interest: | | | | | | | | | | | | | | | | |
Compensation and benefits | | | 228,561 | | | | 123,773 | | | | — | | | | 352,334 | |
Clearing and servicing | | | 55,796 | | | | 142,369 | | | | (8,239 | ) | | | 189,926 | |
Advertising and market development | | | 83,960 | | | | 5,155 | | | | — | | | | 89,115 | |
Communications | | | 75,251 | | | | 9,567 | | | | — | | | | 84,818 | |
Professional services | | | 52,626 | | | | 19,089 | | | | — | | | | 71,715 | |
Depreciation and amortization | | | 43,313 | | | | 12,868 | | | | — | | | | 56,181 | |
Occupancy and equipment | | | 57,904 | | | | 5,178 | | | | — | | | | 63,082 | |
Amortization of other intangibles | | | 29,600 | | | | 5,791 | | | | — | | | | 35,391 | |
Facility restructuring and other exit activities | | | 19,915 | | | | (600 | ) | | | — | | | | 19,315 | |
Other | | | 74,816 | | | | 27,072 | | | | — | | | | 101,888 | |
| | | | | | | | | | | | | | | | |
Total expense excluding interest | | | 721,742 | | | | 350,262 | | | | (8,239 | ) | | | 1,063,765 | |
| | | | | | | | | | | | | | | | |
Segment income | | $ | 511,899 | | | $ | 215,809 | | | $ | — | | | $ | 727,708 | |
| | | | | | | | | | | | | | | | |
(1) | | Reflects elimination of transactions between retail and institutional segments, which includes deposit and customer payable transfer pricing, servicing and order flow rebates. |
Segment Assets
| | | | | | | | | | | | |
| | | Retail | | Institutional | | Eliminations | | Total |
As of September 30, 2007 | | $ | 15,263,963 | | $ | 48,922,802 | | $ | — | | $ | 64,186,765 |
As of December 31, 2006 | | $ | 13,864,334 | | $ | 39,874,969 | | $ | — | | $ | 53,739,303 |
No single customer accounted for more than 10% of total net revenue for the three and nine months ended September 30, 2007 and 2006.
NOTE 19—SUBSEQUENT EVENT
Subsequent to September 30, 2007, we observed a significant decline in the fair value of our asset-backed securities portfolio, specifically our asset-backed CDO and second-lien securities. Our total exposure to asset-backed CDO and second-lien securities at September 30, 2007 was approximately $450 million in amortized cost.
73
The declines in fair value followed a series of rating agency downgrades of securities in this sector and occurred after the end of the third quarter. We believe there will likely be additional downgrades by the rating agencies of securities in this sector. Overall, approximately $208 million of our asset-backed securities were downgraded during the month of October and through November 7, 2007, including approximately $50 million of “AAA” rated asset-backed CDOs that were downgraded to below investment grade.
We expect these declines will result in significant write downs to these securities during the fourth quarter; however, we cannot predict the amount for the fourth quarter as the write downs will depend on future market developments, including potential additional downgrades, and the estimated fair values of these securities on December 31, 2007.
In addition to our asset-backed CDO and second lien portfolio, we hold approximately $2.6 billion in amortized cost in other asset-backed securities, mainly securities backed by prime residential first-lien mortgages. These securities have also declined in fair value subsequent to September 30, 2007; however, the decline has not been as significant.
ITEM 4. CONTROLS AND PROCEDURES
| | (a) | | Our Chief Executive Officer and our Chief Financial Officer, after evaluating the effectiveness of the Company’s “disclosure controls and procedures” (as defined in the Securities Exchange Act of 1934 (“Exchange Act”) Rules 13a-15(e) and 15d-15(e)) as of the end of the period covered by this quarterly report, have concluded that our disclosure controls and procedures are effective based on their evaluation of these controls and procedures required by paragraph (b) of Exchange Act Rules 13a-15 or 15d-15. |
| | (b) | | Our Chief Executive Officer and our Chief Financial Officer have evaluated the changes to the Company’s internal control over financial reporting that occurred during our last fiscal quarter ended September 30, 2007, as required by paragraph (d) of Exchange Act Rules 13a-15 and 15d-15, and have concluded that there were no such changes that materially affected, or are reasonably likely to materially affect, the Company’s internal control over financial reporting. |
74
PART II—OTHER INFORMATION
ITEM 1. LEGAL PROCEEDINGS
In June 2002, the Company acquired from MarketXT Holdings, Inc. (formerly known as “Tradescape Corporation”) the following entities: Tradescape Securities, LLC; Tradescape Technologies, LLC; and Momentum Securities, LLC. Disputes subsequently arose between the parties regarding the responsibility for liabilities that first became known to the Company after the sale. On April 8, 2004, MarketXT filed a complaint in the United States District Court for the Southern District of New York against the Company, certain of its officers and directors, and other third parties, including Softbank Investment Corporation (“SBI”) and Softbank Corporation, alleging that defendants were preventing plaintiffs from obtaining certain contingent payments allegedly due, and as a result, claiming damages of $1.5 billion. On April 9, 2004, the Company filed a complaint in the United States District Court for the Southern District of New York against certain directors and officers of MarketXT seeking declaratory relief and unspecified monetary damages for defendants’ fraud in connection with the 2002 sale, including, but not limited to, having presented the Company with fraudulent financial statements regarding the condition of Momentum Securities, LLC during the due diligence process. Subsequently, MarketXT was placed into bankruptcy, and the Company filed an adversary proceeding against MarketXT and others in January 2005, seeking declaratory relief, compensatory and punitive damages, in those Chapter 11 bankruptcy proceedings in the United States Bankruptcy Court for the Southern District of New York entitled, “In re MarketXT Holdings Corp., Debtor.” In that same court, the Company filed a separate adversary proceeding against Omar Amanat in those Chapter 7 bankruptcy proceedings entitled, “In re Amanat, Omar Shariff.” In October 2005, MarketXT answered the Company’s adversary proceeding and asserted its counterclaims, subsequently amending its claims in 2006 to add a $326.0 million claim for “promissory estoppel” in which Market XT alleged, for the first time, that the Company breached a prior promise to purchase the acquired entities in 1999-2000. In April 2006, Omar Amanat answered the Company’s separate adversary proceeding against him and asserted his counterclaims. In separate motions before the Bankruptcy Court, the Company has moved to dismiss certain counterclaims brought by MarketXT including those described above, as well as certain counterclaims brought by Mr. Amanat. In a ruling dated September 29, 2006, the Bankruptcy Court in the MarketXT case granted the Company’s motion to dismiss four of the six bases upon which MarketXT asserts its fraud claims against the Company; its conversion claim; and its demand for punitive damages. In the same ruling, the Bankruptcy Court denied in its entirety MarketXT’s competing motion to dismiss the Company’s claims against it. On October 26, 2006, the Bankruptcy Court subsequently dismissed MarketXT’s “promissory estoppel” claim. The Company continues to believe that the respective claims brought against it by MarketXT and Omar Amanat are without merit, and the Company will continue both to vigorously defend itself against all such claims and to fully pursue its own claims and damages as described above.
On October 27, 2000, a complaint was filed in the Superior Court for the State of California, County of Santa Clara, entitled, “Ajaxo, Inc., a Delaware corporation, Plaintiff, versus E*TRADE GROUP, INC., a Delaware corporation; and Everypath, Inc., a California corporation; and Does 1 through 50, inclusively, Defendants.” Through this complaint, Ajaxo sought damages and certain non-monetary relief for the Company’s alleged breach of a non-disclosure agreement with Ajaxo pertaining to certain wireless technology offered to the company by Ajaxo as well as damages and other relief against both the Company and defendant Everypath, Inc., for their alleged misappropriation of Ajaxo’s trade secrets. Following a jury trial, a judgment was entered in 2003 in favor of Ajaxo against the Company for $1.3 million dollars for breach of the Ajaxo non-disclosure agreement. Although the jury also found in favor of Ajaxo on its misappropriation of trade secrets claim against the Company and defendant Everypath, the trial court subsequently denied Ajaxo’s requests for additional damages and relief on these claims. Thereafter, all parties appealed, and on December 21, 2005, the California Court of Appeal affirmed the above-described award against the Company for breach of the nondisclosure agreement but remanded the case to the trial court for the limited purpose of determining what, if any, additional damages Ajaxo may be entitled to as a result of the jury’s previous finding in favor of Ajaxo on its misappropriation of trade secrets claim against the Company and defendant Everypath. Following the foregoing ruling by the Court of Appeal, defendant Everypath ceased operations and made an assignment for the benefit of its creditors in January, 2006. As a result, defendant Everypath is no longer defending the case. Although the Company paid
75
Ajaxo the full amount due on the judgment against it above, the case, consistent with the rulings issued by the Court of Appeal, has now been remanded back to the trial court, and the parties are awaiting the setting of a new trial date solely on the issue of what, if any, additional damages Ajaxo may be entitled to receive on its misappropriation of trade secrets claim. In specific, Ajaxo continues to seek unstated monetary damages and injunctive relief, lost profits in the amount of $500,000 per month since November, 1999, and punitive damages. The Company denies that Ajaxo is entitled to any further damages or relief of any kind and will vigorously defend itself against Ajaxo’s renewed damage claims.
On October 2, 2007, a class action complaint alleging violations of federal securities laws was filed in the United States District Court for the Southern District of New York against the Company, its Chief Executive Officer and Chief Financial Officer entitled, “Larry Freudenberg, Individually and on Behalf of All Others Similarly Situated, Plaintiff, versus E*TRADE Financial Corporation, Mitchell H. Caplan and Robert J. Simmons, Defendants.” Plaintiff contends, among other things, that between December 14, 2006, and September 25, 2007 (the “class period”) defendants issued materially false and misleading statements and failed to disclose that the Company was experiencing a rise in delinquency rates in its mortgage and home equity portfolios; failed to timely record an impairment on its mortgage and home equity portfolios; materially overvalued its securities portfolio, which includes assets backed by mortgages; and based on the foregoing, lacked a reasonable basis for the positive statements it made about the Company’s earnings and prospects. Plaintiffs further allege that the named executive officers engaged in insider trading during the class period. Plaintiff seeks to recover damages in an amount to be proven at trial, including interest and attorney’s fees and costs. Subsequently, two additional class action complaints alleging similar violations of federal security laws were filed in the same court on October 12, 2007 and October 30, 2007, respectively, entitled, “William Boston, Individually and On Behalf of All Others Similarly Situated, Plaintiff, versus E*TRADE Financial Corporation, Mitchell H. Caplan, and Robert J. Simmons, Defendants” and “Robert D. Thulman, Individually and On Behalf of All Others Similarly Situated, Plaintiff, versus E*TRADE Financial Corporation, Mitchell H. Caplan and Robert J. Simmons, Defendants.” The Company believes that the allegations asserted in these class action complaints are without merit and intends to vigorously defend itself against the claims raised therein.
Based upon the same facts and circumstances alleged in the Freudenberg class action complaint above, a verified shareholder derivative complaint was filed in United States District Court for the Southern District of New York on October 4, 2007, against the Company’s Chief Executive Officer, President/Chief Operating Officer, Chief Financial Officer and individual members of its board of directors entitled, “Catherine Rubery, Derivatively on behalf of E*TRADE FINANCIAL Corporation, Plaintiff, versus Mitchell H. Caplan, R. Jarrett Lilien, Robert J. Simmons, George A. Hayter, Daryl Brewster, Ronald D. Fisher, Michael K. Parks, C. Catherine Raffaeli, Lewis E. Randall, Donna L. Weaver, and Stephen H. Willard, Defendants, -and- E*TRADE Financial Corporation, a Delaware corporation, Nominal Defendant.” Plaintiff alleges, among other things, causes of action for breach of fiduciary duty, waste of corporate assets, unjust enrichment, and violation of the Security Exchange Act of 1934 and Rule 10B-5. Plaintiff, on behalf of the Company, seeks monetary and non-monetary damages from defendants according to proof at trial, including but not limited to a judgment directing the Company to take all necessary actions to improve its corporate governance and related internal procedures regarding the selection of its directors. Subsequently, two additional shareholder derivative complaints alleging similar violations were filed in the same court, on October 4, 2007 and October 30, 2007, respectively, against the same named defendants entitled, “Marilyn Clark, Derivatively On Behalf of E*TRADE FINANCIAL CORPORATION, Plaintiff, versus Mitchell H. Caplan, et al., Defendants” and “Brian Kallinen, Derivatively on Behalf of E*TRADE FINANCIAL CORPORATION, Plaintiff, versus Mitchell H. Caplan, et al., Defendants.”
The SEC, in conjunction with various regional securities exchanges, is conducting an inquiry into the trading activities of certain specialist firms, including the Company’s subsidiary E*TRADE Capital Markets, LLC (“ETCM”), on various regional exchanges in order to determine whether such firms executed proprietary orders in a given security prior to a customer order in the same security (a practice commonly known as “trading ahead”) during the period 1999—2005. The SEC has indicated that it will seek disgorgement, prejudgment interest, and penalties from any firm found to have engaged in trading ahead activity to the detriment of its
76
customers during that time period. It is possible that such sanctions, if imposed against ETCM, could have a material impact on the financial results of the Company during the period in which such sanctions are imposed. The Company and ETCM are cooperating with the investigation.
On October 17, 2007, the SEC initiated an informal inquiry into matters related to the Company’s loan and securities portfolios. The Company is cooperating fully with the SEC in this matter.
An unfavorable outcome in any matter that is not covered by insurance could have a material adverse effect on our business, financial condition, results of operations or cash flows. In addition, even if the ultimate outcomes are resolved in our favor, the defense of such litigation could entail considerable cost or the diversion of the efforts of management, either of which could have a material adverse effect on our results of operations. In addition to the matters described above, the Company is subject to various legal proceedings and claims that arise in the normal course of business which could have a material adverse effect on our financial position, results of operations or cash flows.
We maintain insurance coverage that we believe is reasonable and prudent. The principal insurance coverage we maintain covers commercial general liability; property damage; hardware/software damage; cyber liability; directors and officers; employment practices liability; certain criminal acts against the Company; and errors and omissions. We believe that such insurance coverage is adequate for the purpose of our business. Our ability to maintain this level of insurance coverage in the future, however, is subject to the availability of affordable insurance in the marketplace.
The additional risk factors presented below should be considered in addition to the risk factors previously disclosed in our 2006 Annual Report on Form 10-K.
The level of provision for loan losses in our mortgage loan portfolio may increase as a result of trends in the macro-economic environment
A substantial portion of our asset portfolio is composed of loans secured by first lien residential mortgages and second lien mortgages (home equity loans and home equity lines of credit). The overall performance of these assets can be affected by the macro trends of the economy in general and the residential real estate market, such as home price depreciation or slowing appreciation, rising mortgage rates and tighter mortgage lending guidelines across the industry. Such performance can also be impacted by our mix of first lien and second lien mortgages and factors particular to a given borrower. We expect nonperforming loan levels to increase over time due to the deteriorating conditions in the residential real estate and credit markets. We increased the provision for loan losses for our first and second lien mortgages in recent periods based on the seasoning of our portfolio and higher delinquencies and charge-offs compared to 2006. Instability in the consumer credit markets and credit trends may require additional increases in our provision for loan losses, which would have an adverse effect on our results of operations in future periods.
We may experience additional write downs in our securities portfolio
In the third quarter of 2007, we incurred losses in our securities portfolio of $197.6 million, pretax. These losses were confined to our asset back securities portfolio, primarily CDO and second lien securities. We believe that continued deterioration in the residential real estate and credit markets may result in additional write downs of these and other securities in our portfolio. In addition, recent market volatility has made it extremely difficult to value certain of our securities, particularly our CDO and second lien mortgage backed assets. The methodologies that we use in valuing individual securities are based on observable market data, to the extent such data is readily available. In the absence of observable market data, our valuations are based on internal models that require judgments by management for a variety of estimates and assumptions which are inherently uncertain. Subsequent valuations, in light of factors then prevailing, may result in significant changes in the values of these securities in future periods. In addition, at the time of any sale of these securities, the price we ultimately realize will depend on the demand and liquidity in the market at that time and may be materially lower
77
than their current fair market values. Finally, many of these investments are subject to rapid changes in value caused by sudden developments, such as rating agency downgrades, which could adversely affect their fair market value. Any of these factors could require us to take additional write downs in the value of our securities portfolio, which would have an adverse effect on our results of operations in future periods.
ITEM 2. UNREGISTERED SALES OF EQUITY SECURITIES AND USE OF PROCEEDS
On April 18, 2007, the Company announced that its Board of Directors authorized a $250.0 million common stock repurchase program (the “April 2007 Plan”). The April 2007 Plan is open-ended and allows for the repurchase of common stock on the open market, in private transactions or a combination of both.
The table below shows the timing and impact of the repurchases under the April 2007 Plan during the three months ended September 30, 2007 (dollars in thousands, except per share amounts):
| | | | | | | | | | |
Month | | Total Number of
Shares Purchased | | Average Price
Paid per Share | | Total Number of Shares Purchased as Part of the April 2007 Plan | | Maximum Dollar
Value of Shares That
May Yet be
Purchased Under the
April 2007 Plan |
July 2007 | | 700,000 | | $ | 18.93 | | 700,000 | | $ | 198,008 |
August 2007 | | 2,369,185 | | $ | 16.66 | | 2,369,185 | | $ | 158,532 |
September 2007 | | — | | $ | — | | — | | $ | 158,532 |
| | | | | | | | | | |
Total | | 3,069,185 | | $ | 17.18 | | 3,069,185 | | $ | 158,532 |
| | | | | | | | | | |
ITEM 3. DEFAULTS UPON SENIOR SECURITIES
None.
ITEM 4. SUBMISSION OF MATTERS TO A VOTE OF SECURITY HOLDERS
None
ITEM 5. OTHER INFORMATION
None.
ITEM 6. EXHIBITS
| | |
| |
| *10.1 | | Amendment No. 1 dated July 24, 2007, to the Credit Agreement dated September 19, 2005 between the Company and JPMorgan Chase Bank N.A., as Administrative Agent |
| |
| *31.1 | | Certification—Section 302 of the Sarbanes-Oxley Act of 2002 |
| |
| *31.2 | | Certification—Section 302 of the Sarbanes-Oxley Act of 2002 |
| |
| *32.1 | | Certification—Section 906 of the Sarbanes-Oxley Act of 2002 |
78
SIGNATURES
Pursuant to the requirements of Section 13 or 15(d) of the Securities Exchange Act of 1934, the Registrant has duly caused this report to be signed on its behalf by the undersigned, thereunto duly authorized.
Dated: November 9, 2007
| | |
E*TRADE Financial Corporation (Registrant) |
By | | /S/ MITCHELL H. CAPLAN |
| | Mitchell H. Caplan Chief Executive Officer |
| |
By | | /S/ ROBERT J. SIMMONS |
| | |
| | Robert J. Simmons Chief Financial Officer (Principal Financial and Accounting Officer) |