UNITED STATES
SECURITIES AND EXCHANGE COMMISSION
Washington, D.C. 20549
FORM 10-Q
(Mark One)
| x | | QUARTERLY REPORT PURSUANT TO SECTION 13 OR 15(d) OF THE SECURITIES EXCHANGE ACT OF 1934 |
For the Quarterly Period Ended March 31, 2009
or
| ¨ | | TRANSITION REPORT PURSUANT TO SECTION 13 OR 15(d) OF THE SECURITIES EXCHANGE ACT OF 1934 |
Commission File Number 1-11921
E*TRADE Financial Corporation
(Exact Name of Registrant as Specified in its Charter)
| | |
| Delaware | | 94-2844166 |
(State or Other Jurisdiction of Incorporation or Organization) | | (I.R.S. Employer Identification Number) |
135 East 57th Street, New York, New York 10022
(Address of Principal Executive Offices and Zip Code)
(646) 521-4300
(Registrant’s Telephone Number, including Area Code)
Indicate by check mark whether the registrant (1) has filed all reports required to be filed by Section 13 or 15(d) of the Securities Exchange Act of 1934 during the preceding 12 months (or for such shorter period that the registrant was required to file such reports) and (2) has been subject to such filing requirements for the past 90 days. Yes x No ¨
Indicate by check mark whether the registrant has submitted electronically and posted on its corporate Web site, if any, every Interactive Data File required to be submitted and posted pursuant to Rule 405 of Regulation S-T during the preceding 12 months (or for such shorter period that the registrant was required to submit and post such files) Yes ¨ No ¨
Indicate by check mark whether the registrant is a large accelerated filer, an accelerated filer, a non-accelerated filer or a smaller reporting company. See definitions of “large accelerated filer,” “accelerated filer” and “smaller reporting company” in Rule 12b-2 of the Exchange Act.
| | | | |
Large accelerated filer x | | | | Accelerated filer ¨ |
Non-accelerated filer ¨ (Do not check if a smaller reporting company) | | Smaller reporting company ¨ |
Indicate by check mark whether the registrant is a shell company (as defined in Rule 12b-2 of the Exchange Act). Yes ¨ No x
Indicate the number of shares outstanding of each of the issuer’s classes of common stock, as of the latest practicable date:
As of May 1, 2009, there were 572,193,965 shares of common stock outstanding.
E*TRADE FINANCIAL CORPORATION
FORM 10-Q QUARTERLY REPORT
For the Quarter Ended March 31, 2009
TABLE OF CONTENTS
Unless otherwise indicated, references to “the Company,” “We,” “Us,” “Our” and “E*TRADE” mean E*TRADE Financial Corporation or its subsidiaries.
E*TRADE, E*TRADE Financial, E*TRADE Bank, ClearStation, Equity Edge, OptionsLink and the Converging Arrows logo are registered trademarks of E*TRADE Financial Corporation in the United States and in other countries.
2
ITEM 1. CONSOLIDATED FINANCIAL STATEMENTS (UNAUDITED)
This information is set forth immediately following Item 3, “Quantitative and Qualitative Disclosures about Market Risk.”
ITEM 2. MANAGEMENT’S DISCUSSION AND ANALYSIS OF FINANCIAL CONDITION AND RESULTS OF OPERATIONS
The following discussion should be read in conjunction with the consolidated financial statements and the related notes that appear elsewhere in this document.
FORWARD-LOOKING STATEMENTS
This report contains forward-looking statements involving risks and uncertainties. These statements relate to our future plans, objectives, expectations and intentions. These statements may be identified by the use of words such as “expect,” “may,” “anticipate,” “intend,” “plan” and similar expressions. Our actual results could differ materially from those discussed in these forward-looking statements, and we caution that we do not undertake to update these statements. Factors that could contribute to our actual results differing from any forward-looking statements include those discussed under “Risk Factors,” “Management’s Discussion and Analysis of Financial Condition and Results of Operations” and elsewhere in this report. The cautionary statements made in this report should be read as being applicable to all forward-looking statements wherever they appear in this report. Important factors that may cause actual results to differ materially from any forward-looking statements are set forth in our 2008 Form 10-K filed with the Securities and Exchange Commission (“SEC”) under the heading “Risk Factors.”
We further caution that there may be risks associated with owning our securities other than those discussed in such filings.
GLOSSARY OF TERMS
In analyzing and discussing our business, we utilize certain metrics, ratios and other terms that are defined in the “Glossary of Terms,” which is located at the end of Item 2, “Management’s Discussion and Analysis of Financial Condition and Results of Operations.”
OVERVIEW
Strategy
Our core strength is our trading and investing customer franchise. Our strategy centers on eliminating business activities unrelated to this core strength and focusing on the key factors that we believe will best serve our customers, where we are most competitive and where we can earn a return for our shareholders. These key factors include a significant focus on: innovation in trading and investing products and services, growth in new brokerage accounts and continued improvement in customer service. We believe our focus on these key factors combined with our long-term dedication to innovation will lead to continued growth in our core business.
In addition to focusing on our customer franchise, our strategy includes an intense focus on mitigating the risks in our balance sheet caused by the mortgage crisis. We plan to mitigate these risks by minimizing the losses in our loan portfolio while working to generate sufficient levels of capital to offset those losses. We believe that our success or failure in this regard will be the key determinant of our financial health in the near term.
We are also focused on simplifying our organizational structure to improve productivity and reduce our operating expenses. We have streamlined the organizational structure by eliminating overlaps, inefficiencies and outdated functions. We believe these streamlining efforts have reduced our overhead expenses and improved our ability to execute.
3
Key Factors Affecting Financial Performance
Our financial performance is affected by a number of factors outside of our control, including:
| | • | | customer demand for financial products and services; |
| | • | | the weakness or strength of the residential real estate and credit markets; |
| | • | | the performance, volume and volatility of the equity and capital markets; |
| | • | | customer perception of the financial strength of our franchise; |
| | • | | market demand and liquidity in the secondary market for mortgage loans and securities; and |
| | • | | market demand and liquidity in the wholesale borrowings market, including securities sold under agreements to repurchase. |
In addition to the items noted above, our success in the future will depend upon, among other things:
| | • | | continuing our success in the acquisition, growth and retention of customers; |
| | • | | our ability to assess and manage credit risk; |
| | • | | our ability to generate capital sufficient to meet our operating needs, particularly a level sufficient to offset loan losses; |
| | • | | our ability to assess and manage interest rate risk; and |
| | • | | disciplined expense control and improved operational efficiency. |
Management monitors a number of metrics in evaluating the Company’s performance. The most significant of these are shown in the table and discussed in the text below:
| | | | | | | | | | | |
| | | As of or For the
Three Months Ended
March 31, | | | Variance | |
| | | 2009 | | | 2008 | | | 2009 vs. 2008 | |
Customer Activity Metrics: | | | | | | | | | | | |
Customer assets (dollars in billions) | | $ | 110.4 | | | $ | 163.8 | | | (33 | )% |
Net new customer assets (dollars in billions) | | $ | 3.5 | | | $ | 0.3 | | | 1067 | % |
Customer cash and deposits (dollars in billions) | | $ | 34.4 | | | $ | 33.9 | | | 1 | % |
Daily average revenue trades | | | 194,482 | | | | 180,555 | | | 8 | % |
Average commission per trade | | $ | 10.59 | | | $ | 11.05 | | | (4 | )% |
End of period brokerage accounts | | | 2,660,584 | | | | 2,477,892 | | | 7 | % |
| | | |
Company Financial Metrics: | | | | | | | | | | | |
Corporate cash (dollars in millions) | | $ | 406.2 | | | $ | 296.4 | | | 37 | % |
E*TRADE Bank excess risk-based capital (dollars in millions) | | $ | 444.2 | | | $ | 695.3 | | | (36 | )% |
Allowance for loan losses (dollars in millions) | | $ | 1,200.8 | | | $ | 565.9 | | | 112 | % |
Allowance for loan losses as a % of nonperforming loans | | | 91.60 | % | | | 96.84 | % | | (5.24 | )% |
Nonperforming loans receivable as a % of gross loans receivable | | | 5.36 | % | | | 2.02 | % | | 3.34 | % |
Enterprise net interest spread (basis points) | | | 234 | | | | 250 | | | (6 | )% |
Enterprise interest-earning assets (average in billions) | | $ | 44.7 | | | $ | 48.9 | | | (9 | )% |
Customer Activity Metrics
| | • | | Changes in customer assets are an indicator of the value of our relationship with the customer. An increase in customer assets generally indicates that the use of our products and services by existing and new customers is expanding. Changes in this metric are also driven by changes in the valuations of our customers’ underlying securities, which declined substantially during 2008 and the first quarter of 2009. |
4
| | • | | Net new customer assets are total inflows to all new and existing customer accounts less total outflows from all closed and existing customer accounts and are a general indicator of the use of our products and services by existing and new customers. |
| | • | | Customer cash and deposits are an indicator of a deepening engagement with our customers and are a key driver of net operating interest income. |
| | • | | Daily average revenue trades (“DARTs”) are the predominant driver of commission revenue from our customers. |
| | • | | Average commission per trade is an indicator of changes in our customer mix, product mix and/or product pricing. As a result, this metric is impacted by both the mix between our domestic and international businesses and the mix between active traders, mass affluent and main street customers. |
| | • | | End of period brokerage accounts is an indicator of the Company’s ability to attract and retain brokerage customers. |
Company Financial Metrics
| | • | | Corporate cash is an indicator of the liquidity at the parent company. It is the primary source of capital above and beyond the capital deployed in our regulated subsidiaries. |
| | • | | E*TRADE Bank excess risk-based capital is the excess capital that E*TRADE Bank has compared to the regulatory minimum well-capitalized threshold and is an indicator of E*TRADE Bank’s ability to absorb future loan losses. |
| | • | | Allowance for loan losses is an estimate of the losses inherent in our loan portfolio as of the balance sheet date and is typically equal to the expected charge-offs in our loan portfolio over the next twelve months. |
| | • | | Allowance for loan losses as a percentage of nonperforming loans is a general indicator of the adequacy of our allowance for loan losses. Changes in this ratio are also driven by changes in the mix of our loan portfolio. |
| | • | | Nonperforming loans receivable as a percentage of gross loans receivable is an indicator of the performance of our total loan portfolio. |
| | • | | Enterprise net interest spread is a broad indicator of our ability to generate net operating interest income. |
| | • | | Enterprise interest-earning assets, in conjunction with our enterprise net interest spread, are indicators of our ability to generate net operating interest income. |
Significant Events in the First Quarter of 2009
Strengthening Our Trading and Investing Customer Franchise
A key element of our strategy is to grow our trading and investing customer franchise. We believe we made significant progress in this area in the first quarter of 2009. Highlights from our progress are as follows:
| | • | | Opened 239,000 gross new accounts and produced 56,000 net new accounts; |
| | • | | Ended the quarter with a record 2.7 million brokerage accounts, with net new brokerage accounts during the quarter of 63,000; |
| | • | | Net new customer asset inflows of $3.5 billion; and |
| | • | | Total DARTs of 194,000, an 8% year-over-year increase, although a 10% decrease from the record levels of the prior quarter. |
5
Execution of Our Capital Plan
| | • | | E*TRADE Bank had excess risk-based capital (excess to the regulatory minimum well-capitalized threshold) of $444.2 million, a decrease of $270.5 million compared to December 31, 2008; and |
| | • | | We had corporate cash of $406.2 million, a decrease of $28.6 million compared to December 31, 2008. |
Enhancements to Our Trading and Investing Products and Services
| | • | | We introduced new tools that are designed to simplify the bond and fixed income mutual fund selection and investment process in order to help customers make more informed fixed income decisions; |
| | • | | We launched online chat services providing prospective customers with the opportunity to receive live online help when opening an account; and |
| | • | | We increased customer service phone support to 24 hours per day, seven days a week. |
Summary Financial Results
Income Statement Highlights for the Three Months Ended March 31, 2009 (dollars in millions, except per share amounts)
| | | | | | | | | | | |
| | | Three Months Ended
March 31, | | | Variance | |
| | | 2009 | | | 2008 | | | 2009 vs. 2008 | |
Net operating interest income | | $ | 278.7 | | | $ | 326.4 | | | (15 | )% |
Total net revenue | | $ | 497.3 | | | $ | 529.1 | | | (6 | )% |
Provision for loan losses | | $ | 454.0 | | | $ | 233.9 | | | 94 | % |
Commission revenue | | $ | 125.6 | | | $ | 122.3 | | | 3 | % |
Fees and service charges revenue | | $ | 46.7 | | | $ | 54.9 | | | (15 | )% |
Operating margin | | $ | (250.6 | ) | | $ | (59.1 | ) | | 324 | % |
Net loss | | $ | (232.7 | ) | | $ | (91.2 | ) | | 155 | % |
Diluted net loss per share | | $ | (0.41 | ) | | $ | (0.20 | ) | | 105 | % |
The continued deterioration in the residential real estate and credit markets, as well as the continued turmoil in the global financial markets, had a significant impact on our financial performance during the first quarter of 2009. The losses in our balance sheet management segment caused by this deterioration more than offset the continued strong underlying performance of our trading and investing segment, resulting in a net loss of $232.7 million for the three months ended March 31, 2009. We believe our trading and investing segment demonstrated its growth and earnings potential during the first quarter of 2009 as our customers fully participated in the highly volatile equity markets. Trading activity was strong during the quarter with DARTs increasing 8% when compared to the first quarter of 2008. In addition we opened 56,000 net new accounts and attracted $3.5 billion in net new customer assets. We believe these are indications that our trading and investing segment has not only stabilized, but is showing signs of robust and sustained growth.
Balance Sheet Highlights (dollars in billions)
| | | | | | | | | | | |
| | | March 31,
2009 | | | December 31,
2008 | | | Variance | |
| | | | 2009 vs. 2008 | |
Total assets | | $ | 49.4 | | | $ | 48.5 | | | 2 | % |
Total enterprise interest-earning assets | | $ | 46.0 | | | $ | 45.0 | | | 2 | % |
Loans, net and margin receivables as a percentage of enterprise
interest-earning assets | | | 58 | % | | | 63 | % | | (5 | )% |
Retail deposits and customer payables as a percentage of enterprise interest-bearing liabilities | | | 73 | % | | | 70 | % | | 3 | % |
6
The increase in total assets was attributable primarily to an increase of $1.4 billion in cash in connection with an increase in deposits. The decrease of $1.2 billion in loans, net was offset by the purchase of agency mortgage-backed securities, which led to an increase of $1.0 billion in available-for-sale mortgage-backed and investment securities. For the foreseeable future, we plan to allow our home equity loans to pay down, resulting in an overall decline in the balance of the loan portfolio. For the remainder of 2009, we also plan to allow total assets to decline in order to release additional regulatory capital which we are required to hold against these assets. As of March 31, 2009, our excess risk-based capital at E*TRADE Bank was $444.2 million
EARNINGS OVERVIEW
We incurred a net loss of $232.7 million for the three months ended March 31, 2009 compared to a net loss of $91.2 million in the same period in 2008. The net loss for the three months ended March 31, 2009 was due principally to our provision for loan losses of $454.0 million. The losses in our balance sheet management segment, which includes the provision for loan losses, more than offset the strong performance of our trading and investing segment, which generated net income of $122.2 million for the three months ended March 31, 2009.
We report corporate interest income and corporate interest expense separately from operating interest income and operating interest expense. We believe reporting these two items separately provides a clearer picture of the financial performance of our operations than would a presentation that combined these two items. Our operating interest income and operating interest expense is generated from the operations of the Company. Our corporate debt, which is the primary source of our corporate interest expense, has been issued primarily in connection with the Citadel Investment and past acquisitions, such as Harrisdirect and BrownCo.
Similarly, we report gain (loss) on sales of investments, net separately from gain (loss) on loans and securities, net. We believe reporting these two items separately provides a clearer picture of the financial performance of our operations than would a presentation that combined these two items. Gain (loss) on loans and securities, net is the result of activities in our operations, namely our balance sheet management segment, including impairment on our available-for sale mortgage-backed and investment securities portfolio. Gain (loss) on sales of investments, net relates to historical equity investments of the Company at the corporate level and are not related to the ongoing business of our operating subsidiaries.
7
The following sections describe in detail the changes in key operating factors and other changes and events that have affected our consolidated net revenue, operating expense, other income (expense) and income tax benefit.
Revenue
The components of net revenue and the resulting variances are as follows (dollars in thousands):
| | | | | | | | | | | | | | | |
| | | Three Months Ended
March 31, | | | Variance | |
| | | 2009 vs. 2008 | |
| | | 2009 | | | 2008 | | | Amount | | | % | |
Revenue: | | | | | | | | | | | | | | | |
Operating interest income | | $ | 486,637 | | | $ | 699,591 | | | $ | (212,954 | ) | | (30 | )% |
Operating interest expense | | | (207,975 | ) | | | (373,220 | ) | | | 165,245 | | | (44 | )% |
| | | | | | | | | | | | | | | |
Net operating interest income | | | 278,662 | | | | 326,371 | | | | (47,709 | ) | | (15 | )% |
| | | | | | | | | | | | | | | |
Commission | | | 125,626 | | | | 122,255 | | | | 3,371 | | | 3 | % |
Fees and service charges | | | 46,715 | | | | 54,941 | | | | (8,226 | ) | | (15 | )% |
Principal transactions | | | 17,642 | | | | 20,490 | | | | (2,848 | ) | | (14 | )% |
Gain (loss) on sales of loans and securities, net | | | 16,507 | | | | (8,567 | ) | | | 25,074 | | | * | |
Other revenue | | | 12,191 | | | | 13,604 | | | | (1,413 | ) | | (10 | )% |
| | | | | | | | | | | | | | | |
Total non-interest income | | | 218,681 | | | | 202,723 | | | | 15,958 | | | 8 | % |
| | | | | | | | | | | | | | | |
Total net revenue | | $ | 497,343 | | | $ | 529,094 | | | $ | (31,751 | ) | | (6 | )% |
| | | | | | | | | | | | | | | |
| * | | Percentage not meaningful |
Total net revenue declined by 6% to $497.3 million for the three months ended March 31, 2009 compared to the same period in 2008. This decline was driven by a decrease in our net operating interest income, which decreased 15% to $278.7 million for the three months ended March 31, 2009 compared to the same period in 2008.
Net Operating Interest Income
Net operating interest income decreased 15% to $278.7 million for the three months ended March 31, 2009 compared to the same period in 2008. Net operating interest income is earned primarily through holding credit balances, which include margin, real estate and consumer loans, and by holding customer cash and deposits, which are a low cost source of funding. The decrease in net operating interest income was due primarily to the decrease in higher yielding enterprise interest-earning assets, specifically loans, net and margin receivables, partially offset by a decrease in the yields paid on our deposits.
8
The following table presents enterprise average balance sheet data and enterprise income and expense data for our operations, as well as the related net interest spread, yields and rates and has been prepared on the basis required by the SEC’s Industry Guide 3, “Statistical Disclosure by Bank Holding Companies” (dollars in thousands):
| | | | | | | | | | | | | | | | | | |
| | | Three Months Ended March 31, | |
| | | 2009 | | | 2008 | |
| | | Average
Balance | | Operating
Interest
Inc./Exp. | | Average
Yield/
Cost | | | Average
Balance | | Operating
Interest
Inc./Exp. | | Average
Yield/
Cost | |
Enterprise interest-earning assets: | | | | | | | | | | | | | | | | | | |
Loans, net(1) | | $ | 25,083,318 | | $ | 313,328 | | 5.00 | % | | $ | 29,925,013 | | $ | 451,574 | | 6.04 | % |
Margin receivables | | | 2,751,510 | | | 26,937 | | 3.97 | % | | | 6,683,969 | | | 90,937 | | 5.47 | % |
Available-for-sale mortgage-backed securities | | | 11,173,259 | | | 125,749 | | 4.50 | % | | | 9,281,381 | | | 110,072 | | 4.74 | % |
Available-for-sale investment securities | | | 126,307 | | | 2,034 | | 6.44 | % | | | 169,848 | | | 2,835 | | 6.67 | % |
Trading securities | | | 35,528 | | | 671 | | 7.56 | % | | | 572,817 | | | 10,708 | | 7.48 | % |
Cash and cash equivalents(2) | | | 4,937,608 | | | 5,736 | | 0.47 | % | | | 1,468,776 | | | 13,833 | | 3.79 | % |
Stock borrow and other | | | 588,748 | | | 8,101 | | 5.58 | % | | | 793,450 | | | 15,640 | | 7.93 | % |
| | | | | | | | | | | | | | | | | | |
Total enterprise interest-earning assets(3) | | | 44,696,278 | | | 482,556 | | 4.32 | % | | | 48,895,254 | | | 695,599 | | 5.70 | % |
| | | | | | | | | | | | | | | | | | |
Non-operating interest-earning assets(4) | | | 3,895,521 | | | | | | | | | 5,812,480 | | | | | | |
| | | | | | | | | | | | | | | | | | |
Total assets | | $ | 48,591,799 | | | | | | | | $ | 54,707,734 | | | | | | |
| | | | | | | | | | | | | | | | | | |
Enterprise interest-bearing liabilities: | | | | | | | | | | | | | | | | | | |
Retail deposits | | $ | 26,375,688 | | | 93,433 | | 1.44 | % | | $ | 25,383,594 | | | 171,535 | | 2.72 | % |
Brokered certificates of deposit | | | 293,714 | | | 3,581 | | 4.94 | % | | | 1,229,811 | | | 15,169 | | 4.96 | % |
Customer payables | | | 3,771,868 | | | 2,802 | | 0.30 | % | | | 4,348,906 | | | 9,910 | | 0.92 | % |
Repurchase agreements and other borrowings | | | 7,589,825 | | | 66,075 | | 3.48 | % | | | 7,980,130 | | | 94,934 | | 4.71 | % |
Federal Home Loan Bank (“FHLB”) advances | | | 3,683,600 | | | 41,204 | | 4.47 | % | | | 5,974,084 | | | 70,802 | | 4.69 | % |
Stock loan and other | | | 422,639 | | | 868 | | 0.83 | % | | | 1,679,887 | | | 10,640 | | 2.55 | % |
| | | | | | | | | | | | | | | | | | |
Total enterprise interest-bearing liabilities | | | 42,137,334 | | | 207,963 | | 1.98 | % | | | 46,596,412 | | | 372,990 | | 3.20 | % |
| | | | | | | | | | | | | | | | | | |
Non-operating interest-bearing liabilities(5) | | | 3,873,709 | | | | | | | | | 5,270,240 | | | | | | |
| | | | | | | | | | | | | | | | | | |
Total liabilities | | | 46,011,043 | | | | | | | | | 51,866,652 | | | | | | |
Total shareholders’ equity | | | 2,580,756 | | | | | | | | | 2,841,082 | | | | | | |
| | | | | | | | | | | | | | | | | | |
Total liabilities and shareholders’ equity | | $ | 48,591,799 | | | | | | | | $ | 54,707,734 | | | | | | |
| | | | | | | | | | | | | | | | | | |
Excess of enterprise interest-earning assets over enterprise interest-bearing liabilities/Enterprise net interest income/Spread | | $ | 2,558,944 | | $ | 274,593 | | 2.34 | % | | $ | 2,298,842 | | $ | 322,609 | | 2.50 | % |
| | | | | | | | | | | | | | | | | | |
Enterprise net interest margin (net yield on enterprise interest-earning assets) | | | | | | | | 2.46 | % | | | | | | | | 2.64 | % |
Ratio of enterprise interest-earning assets to enterprise interest-bearing liabilities | | | | | | | | 106.07 | % | | | | | | | | 104.93 | % |
Return on average: | | | | | | | | | | | | | | | | | | |
Total assets | | | | | | | | (1.92 | )% | | | | | | | | (0.67 | )% |
Total shareholders’ equity | | | | | | | | (36.06 | )% | | | | | | | | (12.84 | )% |
Average equity to average total assets | | | | | | | | 5.31 | % | | | | | | | | 5.19 | % |
Reconciliation from enterprise net interest income to net operating interest income (dollars in thousands):
| | | | | | | | |
| | | Three Months Ended
March 31, | |
| | | 2009 | | | 2008 | |
Enterprise net interest income(6) | | $ | 274,593 | | | $ | 322,609 | |
Taxable equivalent interest adjustment | | | (714 | ) | | | (3,698 | ) |
Customer cash held by third parties and other(7) | | | 4,783 | | | | 7,460 | |
| | | | | | | | |
Net operating interest income | | $ | 278,662 | | | $ | 326,371 | |
| | | | | | | | |
(1) | | Nonaccrual loans are included in the respective average loan balances. Income on such nonaccrual loans is recognized on a cash basis. |
(2) | | Includes segregated cash balances. |
(3) | | Amount includes a taxable equivalent increase in operating interest income of $0.7 million and $3.7 million for the three months ended March 31, 2009 and 2008, respectively. |
(4) | | Non-operating interest-earning assets consist of property and equipment, net, goodwill, other intangibles, net and other assets that do not generate operating interest income. Some of these assets generate corporate interest income. |
(5) | | Non-operating interest-bearing liabilities consist of corporate debt, accounts payable, accrued and other liabilities that do not generate operating interest expense. Some of these liabilities generate corporate interest expense. |
(6) | | Enterprise net interest income is taxable equivalent basis net operating interest income excluding corporate interest income and corporate interest expense and interest earned on customer cash held by third parties. Management believes this non-GAAP measure is useful to analysts and investors as it is a measure of the net operating interest income generated by our operations. |
(7) | | Includes interest earned on average customer assets of $2.8 billion and $3.3 billion for the three months ended March 31, 2009 and 2008, respectively, held by parties outside E*TRADE Financial, including third party money market funds and sweep deposit accounts at unaffiliated financial institutions. |
9
Average enterprise interest-earning assets decreased 9% to $44.7 billion for the three months ended March 31, 2009 compared to the same period in 2008, primarily the result of a decrease in our loans, net portfolio and our margin receivables, slightly offset by an increase in cash and equivalents and available-for-sale mortgage-backed securities. Average loans, net decreased 16% to $25.1 billion for the three months ended March 31, 2009 compared to the same period in 2008. For the foreseeable future, we plan to allow our home equity loans to pay down, resulting in an overall decline in the balance of the loan portfolio. For the remainder of 2009, we also plan to allow total assets to decline. Average margin receivables decreased 59% to $2.8 billion for the three months ended March 31, 2009 compared to the same period in 2008. We believe this decrease was due to customers deleveraging and reducing their risk exposure given the substantial volatility in the financial markets. These decreases were slightly offset by an increase in average cash and cash equivalents. Average cash and cash equivalents increased 236% to $4.9 billion for the three months ended March 31, 2009 compared to the same period in 2008. Average available-for-sale mortgage-backed securities increased 20% to $11.2 billion as a result of purchases of agency mortgage-backed securities during the three months ended March 31, 2009.
Average enterprise interest-bearing liabilities decreased 10% to $42.1 billion for the three months ended March 31, 2009 compared to the same period in 2008. The decrease in average enterprise interest-bearing liabilities was primarily due to a decrease in FHLB advances and stock loan and other. Average FHLB advances decreased 38% to $3.7 billion for the three months ended March 31, 2009 compared to the same period in 2008. Average stock loan and other decreased 75% to $0.4 billion for the three months ended March 31, 2009 compared to the same period in 2008. While our average deposits increased by $992.1 million during the quarter, we expect these balances to decrease over the remainder of 2009 as we focus on decreasing total assets.
Enterprise net interest spread decreased by 16 basis points to 2.34% for the three months ended March 31, 2009 compared to the same period in 2008. This decrease was driven in part by the decrease in loans, net and our margin receivables, both of which are among our higher yielding asset classes. During the three months ended March 31, 2009, we reduced the annual percentage yield paid on our Complete Savings Account by approximately 150 basis points. We believe the reduction in these yields will result in a modest increase to our net interest spread in future periods.
Commission
Commission revenue increased 3% to $125.6 million for the three months ended March 31, 2009, compared to the same period in 2008. The primary factors that affect our commission revenue are DARTs, average commission per trade and the number of trading days during the period. Average commission per trade is impacted by both trade types and the mix between our domestic and international businesses. Each business has a different pricing structure, unique to its customer base and local market practices and, as a result, a change in the relative number of executed trades in these businesses impacts average commission per trade. Each business also has different trade types (e.g. equities, options, fixed income, exchange-traded funds, contract for difference and mutual funds) that can have different commission rates. Accordingly, changes in the mix of trade types within either of these businesses may impact average commission per trade.
DARTs increased 8% to 194,482 for the three months ended March 31, 2009 compared to the same period in 2008. Our U.S. DART volume increased 10% for the three months ended March 31, 2009 compared to the same period in 2008, driven entirely by organic growth. Option-related DARTs as a percentage of our total U.S. DARTs represented 12% and 17% of U.S. trading volume for the periods ending March 31, 2009 and 2008, respectively.
Average commission per trade decreased 4% to $10.59 for the three months ended March 31, 2009 compared to the same period in 2008. The decrease was primarily a function of negative foreign currency exchange impact as a result of the strengthening U.S. dollar. The mix of customers was also a contributing factor.
10
Fees and Service Charges
Fees and service charges decreased 15% to $46.7 million for the three months ended March 31, 2009 compared to the same period in 2008. The decline was driven by a decrease in advisory management fees and collateralized debt obligation (“CDO”) management fee revenue. The decrease in advisory management fees was primarily due to our sale of RAA in the second quarter of 2008 and the decrease in CDO management fees was due to the sale of our collateral management agreements in the first quarter of 2008. A decline in foreign currency margin revenue, fixed income product revenue and mutual fund fees also contributed to the decrease in fees and service charges.
Principal Transactions
Principal transactions decreased 14% to $17.6 million for the three months ended March 31, 2009 compared to the same period in 2008. Our principal transactions revenue is influenced by overall trading volumes, the number of stocks for which we act as a market-maker, the trading volumes of those specific stocks and the performance of our proprietary trading activities. The decline in principal transactions revenue was driven by a 40% decrease in our average revenue capture per 1,000 equity shares traded to $0.339 for the three months ended March 31, 2009. This decrease was partially offset by an increase of 49% in the volume of our equity shares traded. Although overall equity shares traded increased 49%, the increased volume was primarily due to bulletin board trades, which earn lower revenue per trade than other market-making trades.
Gain (Loss) on Loans and Securities, Net
Gain (loss) on loans and securities, net was a gain of $16.5 million for the three months ended March 31, 2009, as shown in the following table (dollars in thousands):
| | | | | | | | | | | | | | | |
| | | Three Months Ended
March 31, | | | Variance | |
| | | | 2009 vs. 2008 | |
| | 2009 | | | 2008 | | | Amount | | | % | |
Loss on sales of loans, net | | $ | — | | | $ | (498 | ) | | $ | 498 | | | * | |
Gain on securities and other investments | | | 37,826 | | | | 13,263 | | | | 24,563 | | | 185 | % |
Loss on impairment | | | (18,801 | ) | | | (26,602 | ) | | | 7,801 | | | (29 | )% |
Gain (loss) on trading securities | | | (2,468 | ) | | | 3,621 | | | | (6,089 | ) | | * | |
Hedge ineffectiveness | | | (50 | ) | | | 1,649 | | | | (1,699 | ) | | * | |
| | | | | | | | | | | | | | | |
Gain (loss) on securities, net | | | 16,507 | | | | (8,069 | ) | | | 24,576 | | | * | |
| | | | | | | | | | | | | | | |
Gain (loss) on loans and securities, net | | $ | 16,507 | | | $ | (8,567 | ) | | $ | 25,074 | | | * | |
| | | | | | | | | | | | | | | |
| * | | Percentage not meaningful |
The increase in the total gain (loss) on loans and securities, net during the three months ended March 31, 2009 compared to the same period in 2008 was due primarily to the $37.8 million gain on securities and other investments, which was related to the sale of certain agency mortgage-backed securities. Offsetting this gain was $18.8 million of impairment recognized on certain securities in our collateralized mortgage obligation (“CMO”) portfolio during the three months ended March 31, 2009, which was a result of the deterioration in the expected credit performance of the underlying loans in the securities. Further declines in the performance of our CMO portfolio could result in additional impairment in future periods(1).
Other Revenue
Other revenue decreased 10% to $12.2 million for the three months ended March 31, 2009 compared to the same period in 2008. The decrease in other revenue was due to a decline in the income from the cash surrender
| (1) | | In the second quarter of 2009, we will adopt Financial Accounting Standards Board (“FASB”) Staff Position (“FSP”) No. FAS 115-2 and FAS 124-2,Recognition and Presentation of Other-Than-Temporary Impairments(“FSP No. FAS 115-2 and FAS 124-2”), which amends the other-than-temporary impairment guidance in GAAP for debt securities. We expect the adoption of this standard to decrease the impact of impairments on our results of operations in future periods when compared to the impact we believe would have occurred without this new accounting standard. We are currently evaluating the impact of the adoption of FSP No. FAS 115-2 and FAS 124-2 to our financial condition, results of operations and cash flows. |
11
value of bank-owned life insurance, decreased fees earned in connection with distribution of shares during initial public offerings and lower software consulting fees from our Corporate Services business.
Provision for Loan Losses
Provision for loan losses increased $220.1 million to $454.0 million for the three months ended March 31, 2009 compared to the same period in 2008. The increase in the provision for loan losses was related primarily to deterioration in the performance of our one- to four-family and home equity loan portfolios. We believe the deterioration in both of these portfolios was caused by several factors, including: home price depreciation in key markets; growing inventories of unsold homes; rising foreclosure rates; significant contraction in the availability of credit; and a general decline in economic growth. In addition, the combined impact of home price depreciation and the reduction of available credit made it increasingly difficult for borrowers to refinance existing loans. We believe these factors will cause the provision for loan losses to continue at historically high levels in future periods.
Operating Expense
The components of operating expense and the resulting variances are as follows (dollars in thousands):
| | | | | | | | | | | | | | |
| | | Three Months Ended
March 31, | | Variance | |
| | | | 2009 vs. 2008 | |
| | 2009 | | | 2008 | | Amount | | | % | |
Operating expense: | | | | | | | | | | | | | | |
Compensation and benefits | | $ | 84,172 | | | $ | 123,128 | | $ | (38,956 | ) | | (32 | )% |
Clearing and servicing | | | 42,671 | | | | 44,885 | | | (2,214 | ) | | (5 | )% |
Advertising and marketing development | | | 43,591 | | | | 57,448 | | | (13,857 | ) | | (24 | )% |
Communications | | | 21,561 | | | | 25,094 | | | (3,533 | ) | | (14 | )% |
Professional services | | | 19,630 | | | | 23,645 | | | (4,015 | ) | | (17 | )% |
Occupancy and equipment | | | 19,541 | | | | 20,498 | | | (957 | ) | | (5 | )% |
Depreciation and amortization | | | 20,274 | | | | 21,653 | | | (1,379 | ) | | (6 | )% |
Amortization of other intangibles | | | 7,436 | | | | 10,910 | | | (3,474 | ) | | (32 | )% |
Facility restructuring and other exit activities | | | (112 | ) | | | 10,566 | | | (10,678 | ) | | * | |
Other | | | 35,220 | | | | 16,506 | | | 18,714 | | | 113 | % |
| | | | | | | | | | | | | | |
Total operating expense | | $ | 293,984 | | | $ | 354,333 | | $ | (60,349 | ) | | (17 | )% |
| | | | | | | | | | | | | | |
| * | | Percentage not meaningful |
Operating expense decreased 17% to $294.0 million for the three months ended March 31, 2009 compared to the same period in 2008 and was driven primarily by decreases in compensation and benefits.
Compensation and Benefits
Compensation and benefits decreased 32% to $84.2 million for the three months ended March 31, 2009 compared to the same period in 2008. This decrease resulted primarily from lower salary expense due to a reduction in our employee base. The decrease was also due to increased severance compensation of $12.0 million during the first quarter of 2008.
Advertising and Market Development
Advertising and market development expense decreased 24% to $43.6 million for the three months ended March 31, 2009 compared to the same period in 2008. This decrease was due to higher expense in the first quarter of 2008 that was aimed at restoring customer confidence as well as an overall market decline in advertising rates in the first quarter of 2009.
12
Other
Other expense increased 113% to $35.2 million for the three months ended March 31, 2009 compared to the same period in 2008. The increase was due primarily to the $23.7 million gain on the sale of our corporate aircraft related assets which reduced operating expense during the three months ended March 31, 2008.
Other Income (Expense)
Other income (expense) increased from an expense of $90.5 million to an expense of $93.5 million for the three months ended March 31, 2009 compared to the same period in 2008, as shown in the following table (dollars in thousands):
| | | | | | | | | | | | | | | |
| | | Three Months Ended
March 31, | | | Variance | |
| | | | 2009 vs. 2008 | |
| | 2009 | | | 2008 | | | Amount | | | % | |
Other income (expense): | | | | | | | | | | | | | | | |
Corporate interest income | | $ | 424 | | | $ | 2,426 | | | $ | (2,002 | ) | | (83 | )% |
Corporate interest expense | | | (87,315 | ) | | | (95,241 | ) | | | 7,926 | | | (8 | )% |
Gain (loss) on sales of investments, net | | | (433 | ) | | | 502 | | | | (935 | ) | | * | |
Loss on early extinguishment of debt | | | (2,999 | ) | | | (2,851 | ) | | | (148 | ) | | 5 | % |
Equity in income (loss) of investments and venture funds | | | (3,129 | ) | | | 4,699 | | | | (7,828 | ) | | * | |
| | | | | | | | | | | | | | | |
Total other income (expense) | | $ | (93,452 | ) | | $ | (90,465 | ) | | $ | (2,987 | ) | | 3 | % |
| | | | | | | | | | | | | | | |
| * | | Percentage not meaningful |
Total other income (expense) for the three months ended March 31, 2009 primarily consisted of corporate interest expense resulting from our corporate debt, which includes the springing lien notes and senior notes. Corporate interest expense decreased 8% to $87.3 million for the three months ended March 31, 2009, which was primarily due to the retirement of the $450 million in mandatory convertible notes during the fourth quarter of 2008.
The loss on early extinguishment of debt of $3.0 million for the three months ended March 31, 2009 was due to the early extinguishment of FHLB advances. The loss on early extinguishment of debt of $2.9 million for the three months ended March 31, 2008 was due to a loss of $10.8 million related to the early extinguishment of FHLB advances and a loss of $0.6 million on the prepayment of debt related to the sale of the corporate aircraft. These losses were partially offset by an $8.5 million gain recognized on the exchange of $25.0 million of our senior notes for 4.5 million shares of our common stock.
Income Tax Benefit
Income tax benefit was $111.4 million during the three months ended March 31, 2009 compared to $56.6 million for the same period in 2008. Our effective tax rates for the three months ended March 31, 2009 and 2008 were (32.4)% and (37.9)%, respectively.
13
We expect our 2009 tax expense to be based on a pro-forma tax rate in the range of 36% to 38% before taking into account $33.0 million of projected 2009 incremental tax expense, which is summarized in the following table (dollars in millions):
| | | |
| | | Projected
Year Ended
December 31, 2009
Tax Expense |
Incremental tax benefits | | | |
Tax exempt income | | $ | 3.8 |
Low income housing tax credits | | | 2.5 |
| | | |
Total tax benefits | | | 6.3 |
| | | |
Incremental tax expenses | | | |
Non-deductible officer’s compensation | | | 2.1 |
Tax rate differential of international operations | | | 4.1 |
Foreign valuation allowance | | | 4.3 |
Non-deductible portion of interest expense on springing lien notes | | | 28.8 |
| | | |
Total tax expense | | | 39.3 |
| | | |
Incremental tax items | | $ | 33.0 |
| | | |
A proportionate amount of these incremental tax items were included in the $111.4 million income tax benefit for the three months ended March 31, 2009.
During the three months ended March 31, 2009 we did not provide for a valuation allowance against our federal deferred tax assets. We are required to establish a valuation allowance for deferred tax assets and record a charge to income if we determine, based on available evidence at the time the determination is made, that it is more likely than not that some portion or all of the deferred tax assets will not be realized. If we did conclude that a valuation allowance was required, the resulting loss would have a material adverse effect on our results of operations, financial condition and our regulatory capital position at E*TRADE Bank.
We did not establish a valuation allowance against our federal deferred tax assets as of March 31, 2009 as we believe that it is more likely than not that all of these assets will be realized. Our evaluation focused on identifying significant, objective evidence that we will be able to realize our deferred tax assets in the future. We reviewed the estimated future taxable income for our trading and investing and balance sheet management segments separately and determined that our net operating losses in 2007 and 2008 were due solely to the credit losses in our balance sheet management segment. We believe these losses were caused by the crisis in the residential real estate and credit markets which significantly impacted our asset-backed securities and home equity loan portfolios in 2007 and continued to generate credit losses in 2008. We estimate that these credit losses will continue in future periods; however, we ceased the business activities which we believe are the root cause of these losses. Therefore, while we do expect credit losses to continue in future periods, we do expect these amounts to decline when compared to our credit losses in 2007 and 2008. Our trading and investing segment generated substantial book taxable income for each of the last six years and we estimate that it will continue to generate taxable income in future periods at a level sufficient to generate taxable income for the Company as a whole. We consider this to be significant, objective evidence that we will be able to realize our deferred tax assets in the future.
Our analysis of the need for a valuation allowance recognizes that we are in a cumulative book taxable loss position as of the three-year period ended December 31, 2008 and the three months ended March 31, 2009, which is considered significant, objective evidence that we may not be able to realize some portion of our deferred tax assets in the future. However, we believe we are able to rely on our forecasts of future taxable income and overcome the uncertainty created by the cumulative loss position.
14
The crisis in the residential real estate and credit markets has created significant volatility in our results of operations. This volatility is isolated almost entirely to our balance sheet management segment. Our forecasts for this segment include assumptions regarding our estimate of future expected credit losses, which we believe to be the most variable component of our forecasts of future taxable income. We believe this variability could create a book loss in our overall results for an individual reporting period while not significantly impacting our overall estimate of taxable income over the period in which we expect to realize our deferred tax assets. Conversely, we believe our trading and investing segment will continue to produce a stable stream of income which we believe we can reliably estimate in both individual reporting periods as well as over the period in which we estimate we will realize our deferred tax assets.
In evaluating the need for a valuation allowance, we estimated future taxable income based on management approved forecasts. This process required significant judgment by management about matters that are by nature uncertain. If future events differ significantly from our current forecasts, a valuation allowance may need to be established, which would have a material adverse effect on our results of operations, financial condition and our regulatory capital position at E*TRADE Bank. In addition, a significant portion of the net deferred tax asset relates to a $2.3 billion federal tax loss carryforward, the utilization of which may be further limited in the event of certain material changes in the ownership of the Company. We will continue to monitor and update our assumptions and forecasts of future taxable income and assess the need for a valuation allowance.
15
SEGMENT RESULTS REVIEW
Beginning in the first quarter of 2009, we revised our segment financial reporting to reflect the manner in which our chief operating decision maker had begun assessing the Company’s performance and making resource allocation decisions. As a result, we now report our operating results in two segments: 1) “Trading and Investing”, which includes the businesses that were formerly in the “Retail” segment and now includes our market-making business, and 2) “Balance Sheet Management”, which includes the businesses from the former “Institutional” segment, other than the market-making business. The Company’s segment financial information from prior periods has been reclassified in accordance with the new segment financial reporting.
Trading and Investing
The following table summarizes trading and investing financial and key metrics for the periods ended March 31, 2009 and 2008 (dollars in thousands, except for key metrics):
| | | | | | | | | | | | | | | |
| | | Three Months Ended
March 31, | | | Variance | |
| | | 2009 vs. 2008 | |
| | | 2009 | | | 2008 | | | Amount | | | % | |
Trading and investing segment income: | | | | | | | | | | | | | | | |
Net operating interest income | | $ | 161,675 | | | $ | 207,306 | | | $ | (45,631 | ) | | (22 | )% |
Commission | | | 125,626 | | | | 121,669 | | | | 3,957 | | | 3 | % |
Fees and service charges | | | 45,055 | | | | 50,877 | | | | (5,822 | ) | | (11 | )% |
Principal transactions | | | 17,642 | | | | 20,376 | | | | (2,734 | ) | | (13 | )% |
Loss on loans and securities, net | | | (22 | ) | | | (2 | ) | | | (20 | ) | | * | |
Other revenue | | | 8,894 | | | | 9,753 | | | | (859 | ) | | (9 | )% |
| | | | | | | | | | | | | | | |
Net segment revenue | | | 358,870 | | | | 409,979 | | | | (51,109 | ) | | (12 | )% |
Total segment expense | | | 236,720 | | | | 285,956 | | | | (49,236 | ) | | (17 | )% |
| | | | | | | | | | | | | | | |
Total trading and investing segment income | | $ | 122,150 | | | $ | 124,023 | | | $ | (1,873 | ) | | (2 | )% |
| | | | | | | | | | | | | | | |
Key Metrics: | | | | | | | | | | | | | | | |
Customer assets (dollars in billions) | | $ | 110.4 | | | $ | 163.8 | | | $ | (53.4 | ) | | (33 | )% |
Net new customer assets (dollars in billions) | | $ | 3.5 | | | $ | 0.3 | | | $ | 3.2 | | | 1067 | % |
Customer cash and deposits (dollars in billions) | | $ | 34.4 | | | $ | 33.9 | | | $ | 0.5 | | | 1 | % |
DARTs | | | 194,482 | | | | 180,555 | | | | 13,927 | | | 8 | % |
Average commission per trade | | $ | 10.59 | | | $ | 11.05 | | | $ | (0.46 | ) | | (4 | )% |
End of period margin debt (dollars in billions) | | $ | 2.5 | | | $ | 6.5 | | | $ | (4.0 | ) | | (62 | )% |
End of period brokerage accounts | | | 2,660,584 | | | | 2,477,892 | | | | 182,692 | | | 7 | % |
| * | | Percentage not meaningful |
Our trading and investing segment generates revenue from brokerage and banking relationships with investors and from market-making activities. This segment generates six primary sources of revenue: net operating interest income; commission; fees and service charges; principal transactions; loss on loans and securities, net; and other revenue. Other revenue includes results from our stock plan administration products and services, as we ultimately service customers through these corporate relationships.
During the fourth quarter of 2007, we experienced a disruption in our customer base which caused a decline in the core drivers of our trading and investing segment, including: net new accounts, customer cash and deposits, DARTs, margin debt and customer assets. We believe this disruption was due to the uncertainty surrounding the Company in connection with the credit related losses in our balance sheet management segment. While we anticipate credit related losses will be at historically high levels in future periods, we believe our customer base stabilized and returned to modest growth during 2008. During the first quarter of 2009, our customer base continued to show positive growth trends, including adding approximately 56,000 net new
16
accounts and growth in net new customer assets of approximately $3.5 billion. We believe these are indications that our trading and investing segment has not only stabilized, but is showing signs of robust and sustained growth.
Trading and investing segment income decreased 2% to $122.2 million for the three months ended March 31, 2009 compared to the same period in 2008. This was due primarily to a decrease in net operating interest income and fees and service charges. These were partially offset by a decrease in total segment expense.
Trading and investing net operating interest income decreased 22% to $161.7 million for the three months ended March 31, 2009 compared to the same period in 2008. This decrease was driven primarily by the decline in margin debt between the comparable periods.
Trading and investing commission revenue increased 3% to $125.6 million for the three months ended March 31, 2009 compared to the same period in 2008. The increase in commission revenue was primarily the result of an increase in DARTs of 8%, which was slightly offset by a decrease of 4% in the average commission per trade.
Trading and investing fees and service charges decreased 11% to $45.1 million for the three months ended March 31, 2009 compared to the same period in 2008. This decrease was primarily due to a decrease in advisory management fees due to the sale of Retirement Advisors of America in the second quarter of 2008.
Trading and investing principal transactions decreased 13% to $17.6 million for the three months ended March 31, 2009 compared to the same period in 2008. The decline in principal transactions revenue was driven by a 40% decrease in our average revenue capture per 1,000 equity shares traded to $0.339 for the three months ended March 31, 2009. This decrease was partially offset by an increase of 49% in our equity shares traded. Although overall equity shares traded increased 49%, the increased volume was primarily due to bulletin board trades, which earn lower revenue per trade than other market-making trades.
Trading and investing segment expense decreased 17% to $236.7 million for three months ended March 31, 2009 compared to the same period in 2008. This decrease related primarily to a decrease in compensation due to lower salary expense as a result of a reduction in our employee base.
As of March 31, 2009, we had approximately 2.7 million active brokerage accounts, 1.0 million stock plan accounts and 0.8 million active banking accounts. For the three months ended March 31, 2009 and 2008, our brokerage products contributed 65% and 64%, respectively, and our banking products, which includes sweep products, contributed 25% for both periods, of total trading and investing net revenue. All other products contributed less than 10% of total trading and investing net revenue for the three months ended March 31, 2009 and 2008.
17
Balance Sheet Management
The following table summarizes balance sheet management financial and key metrics for the periods ended March 31, 2009 and 2008 (dollars in thousands, except for key metrics):
| | | | | | | | | | | | | | | |
| | | Three Months Ended
March 31, | | | Variance | |
| | | 2009 vs. 2008 | |
| | | 2009 | | | 2008 | | | Amount | | | % | |
Balance sheet management segment loss: | | | | | | | | | | | | | | | |
Net operating interest income | | $ | 116,987 | | | $ | 119,065 | | | $ | (2,078 | ) | | (2 | )% |
Commission | | | — | | | | 586 | | | | (586 | ) | | * | |
Fees and service charges | | | 1,660 | | | | 4,064 | | | | (2,404 | ) | | (59 | )% |
Principal transactions | | | — | | | | 114 | | | | (114 | ) | | * | |
Gain (loss) on loans and securities, net | | | 16,529 | | | | (8,565 | ) | | | 25,094 | | | * | |
Other revenue | | | 3,297 | | | | 3,867 | | | | (570 | ) | | (15 | )% |
| | | | | | | | | | | | | | | |
Net segment revenue | | | 138,473 | | | | 119,131 | | | | 19,342 | | | 16 | % |
Provision for loan losses | | | 453,963 | | | | 233,871 | | | | 220,092 | | | 94 | % |
Total segment expense | | | 57,264 | | | | 68,393 | | | | (11,129 | ) | | (16 | )% |
| | | | | | | | | | | | | | | |
Total balance sheet management segment loss | | $ | (372,754 | ) | | $ | (183,133 | ) | | $ | (189,621 | ) | | 104 | % |
| | | | | | | | | | | | | | | |
Key Metrics: | | | | | | | | | | | | | | | |
Nonperforming loans as a % of gross loans receivable | | | 5.36 | % | | | 2.02 | % | | | * | | | 3.34 | % |
Allowance for loan losses (dollars in millions) | | $ | 1,200.8 | | | $ | 565.9 | | | $ | 634.9 | | | 112 | % |
Allowance for loan losses as a % of nonperforming loans | | | 91.60 | % | | | 96.84 | % | | | * | | | (5.24 | )% |
| * | | Percentage not meaningful |
Our balance sheet management segment generates revenue from managing loans previously originated or purchased from third parties, and leveraging these loans and customer cash and deposit relationships to generate additional net operating interest income.
As a result of our exposure to the credit crisis in the residential real estate and credit markets, our balance sheet management segment incurred a loss of $372.8 million for the three months ended March 31, 2009. The loss was driven primarily by our provision for loan losses which was $454.0 million for the three months ended March 31, 2009.
Net operating interest income remained relatively flat at $117.0 million for the three months ended March 31, 2009 compared to the same period in 2008.
Gain (loss) on loans and securities, net increased to a gain of $16.5 million for the three months ended March 31, 2009 from a loss of $8.6 million for the same period in 2008. The increase was due primarily to a $37.8 million gain on securities and other investments, which was related to the sale of certain agency mortgage-backed securities in the first quarter of 2009. This gain was offset by $18.8 million of impairment recognized on certain securities in our CMO portfolio during the three months ended March 31, 2009, which was a result of the deterioration in the expected credit performance of the underlying loans in the securities. Further declines in the performance of our CMO portfolio could result in additional impairment in future periods(1).
Provision for loan losses increased $220.1 million to $454.0 million for the three months ended March 31, 2009 compared to the same period in 2008. The increase in the provision for loan losses was related primarily to
| (1) | | In the second quarter of 2009, we will adopt FSP No. FAS 115-2 and FAS 124-2 which amends the other-than-temporary impairment guidance in GAAP for debt securities. We expect the adoption of this standard to decrease the impact of impairments on our results of operations in future periods when compared to the impact we believe would have occurred without this new accounting standard. We are currently evaluating the impact of the adoption of FSP No. FAS 115-2 and FAS 124-2 to our financial condition, results of operations and cash flows. |
18
deterioration in the performance of our one- to four-family and home equity loan portfolios. We believe the deterioration in both of these portfolios was caused by several factors, including: home price depreciation in virtually all key markets; growing inventories of unsold homes; rising foreclosure rates; sustained contraction in the availability of credit; and a severe downturn in the economy. While we do believe the provision for loan losses will be at historically high levels in future periods, we do not expect those levels to be in excess of those incurred in 2008.
Total balance sheet management segment expense decreased 16% to $57.3 million for the three months ended March 31, 2009 compared to the same period in 2008 and was due primarily to lower salary expense due to a reduction in our employee base and a reduction in corporate overhead expenses, the majority of which are allocated to the balance sheet management segment.
BALANCE SHEET OVERVIEW
The following table sets forth the significant components of our consolidated balance sheet (dollars in thousands):
| | | | | | | | | | | | | |
| | | March 31,
2009 | | December 31,
2008 | | Variance | |
| | | | 2009 vs. 2008 | |
| | | | | Amount | | | % | |
Assets: | | | | | | | | | | | | | |
Cash(1) | | $ | 6,392,541 | | $ | 4,995,447 | | $ | 1,397,094 | | | 28 | % |
Trading securities | | | 46,309 | | | 55,481 | | | (9,172 | ) | | (17 | )% |
Available-for-sale mortgage-backed and investment securities | | | 11,823,392 | | | 10,806,094 | | | 1,017,298 | | | 9 | % |
Margin receivables | | | 2,436,611 | | | 2,791,168 | | | (354,557 | ) | | (13 | )% |
Loans, net | | | 23,271,969 | | | 24,451,852 | | | (1,179,883 | ) | | (5 | )% |
Investment in FHLB stock | | | 183,863 | | | 200,892 | | | (17,029 | ) | | (8 | )% |
Other assets(2) | | | 5,292,191 | | | 5,237,281 | | | 54,910 | | | 1 | % |
| | | | | | | | | | | | | |
Total assets | | $ | 49,446,876 | | $ | 48,538,215 | | $ | 908,661 | | | 2 | % |
| | | | | | | | | | | | | |
Liabilities and shareholders’ equity: | | | | | | | | | | | | | |
Deposits | | $ | 27,641,485 | | $ | 26,136,246 | | $ | 1,505,239 | | | 6 | % |
Wholesale borrowings(3) | | | 11,029,193 | | | 11,735,056 | | | (705,863 | ) | | (6 | )% |
Customer payables | | | 4,181,332 | | | 3,753,332 | | | 428,000 | | | 11 | % |
Corporate debt | | | 2,752,673 | | | 2,750,532 | | | 2,141 | | | 0 | % |
Accounts payable, accrued and other liabilities | | | 1,384,042 | | | 1,571,553 | | | (187,511 | ) | | (12 | )% |
| | | | | | | | | | | | | |
Total liabilities | | | 46,988,725 | | | 45,946,719 | | | 1,042,006 | | | 2 | % |
Shareholders’ equity | | | 2,458,151 | | | 2,591,496 | | | (133,345 | ) | | (5 | )% |
| | | | | | | | | | | | | |
Total liabilities and shareholders’ equity | | $ | 49,446,876 | | $ | 48,538,215 | | $ | 908,661 | | | 2 | % |
| | | | | | | | | | | | | |
(1) | | Includes balance sheet line items cash and equivalents and cash and investments required to be segregated under federal or other regulations. |
(2) | | Includes balance sheet line items property and equipment, net, goodwill, other intangibles, net and other assets. |
(3) | | Includes balance sheet line items securities sold under agreements to repurchase and other borrowings. |
The increase in total assets was attributable primarily to an increase of $1.4 billion in cash and $1.0 billion in available-for-sale mortgage-backed and investment securities, offset by a decrease of $1.2 billion in loans, net. The increase in available-for-sale mortgage-backed and investment securities was primarily due to a $1.0 billion increase in our mortgage-backed securities. The decrease in loans, net was due to our strategy of reducing balance sheet risk and halting our previous focus on growing the balance sheet. For the foreseeable future, we
19
plan to allow our home equity loans to pay down, resulting in an overall decline in the balance of the loan portfolio. For the remainder of 2009, we also plan to allow total assets to decline in order to release additional regulatory capital which we are required to hold against these assets.
The increase in total liabilities was attributable primarily to the increase in deposits which was partially offset by a decrease in wholesale borrowings. While our deposits increased by $1.5 billion during the quarter, we expect these balances to decrease over the remainder of 2009 as we focus on decreasing total assets. The decrease in wholesale borrowings was a result of paying down our FHLB advances and securities sold under agreements to repurchase in the first quarter of 2009.
Available-for-Sale Mortgage-Backed and Investment Securities
Available-for-sale securities are summarized as follows (dollars in thousands):
| | | | | | | | | | | | | |
| | | March 31,
2009 | | December 31,
2008 | | Variance | |
| | | | 2009 vs. 2008 | |
| | | | Amount | | | % | |
Mortgage-backed securities: | | | | | | | | | | | | | |
Backed by U.S. Government sponsored and federal agencies | | $ | 11,163,736 | | $ | 10,110,813 | | $ | 1,052,923 | | | 10 | % |
CMOs and other | | | 561,822 | | | 602,376 | | | (40,554 | ) | | (7 | )% |
| | | | | | | | | | | | | |
Total mortgage-backed securities | | | 11,725,558 | | | 10,713,189 | | | 1,012,369 | | | 9 | % |
Investment securities | | | 97,834 | | | 92,905 | | | 4,929 | | | 5 | % |
| | | | | | | | | | | | | |
Total available-for-sale securities | | $ | 11,823,392 | | $ | 10,806,094 | | $ | 1,017,298 | | | 9 | % |
| | | | | | | | | | | | | |
Available-for-sale securities represented 24% and 22% of total assets at March 31, 2009 and December 31, 2008, respectively. Available-for-sale securities increased 9% to $11.8 billion at March 31, 2009 compared to December 31, 2008, due primarily to the purchase of agency mortgage-backed securities in the first quarter of 2009. All mortgage-backed securities backed by U.S. Government sponsored and federal agencies are AAA-rated.
Margin Receivables
The margin receivables balance is a component of the margin debt balance, which is reported as a key trading and investing metric of $2.5 billion and $2.8 billion at March 31, 2009 and December 31, 2008, respectively. The total margin debt balance is summarized as follows (dollars in thousands):
| | | | | | | | | | | | | |
| | | March 31,
2009 | | December 31,
2008 | | Variance | |
| | | | 2009 vs. 2008 | |
| | | | Amount | | | % | |
Margin receivables | | $ | 2,436,611 | | $ | 2,791,168 | | $ | (354,557 | ) | | (13 | )% |
Margin held by third parties and other | | | 24,109 | | | 20,676 | | | 3,433 | | | 17 | % |
| | | | | | | | | | | | | |
Margin debt | | $ | 2,460,720 | | $ | 2,811,844 | | $ | (351,124 | ) | | (12 | )% |
| | | | | | | | | | | | | |
20
Loans, Net
Loans, net are summarized as follows (dollars in thousands):
| | | | | | | | | | | | | | | |
| | | March 31,
2009 | | | December 31,
2008 | | | Variance | |
| | | | 2009 vs. 2008 | |
| | | | Amount | | | % | |
One- to four-family | | $ | 12,539,663 | | | $ | 12,979,844 | | | $ | (440,181 | ) | | (3 | )% |
Home equity | | | 9,533,008 | | | | 10,017,183 | | | | (484,175 | ) | | (5 | )% |
Consumer and other loans: | | | | | | | | | | | | | | | |
Recreational vehicle | | | 1,496,754 | | | | 1,570,116 | | | | (73,362 | ) | | (5 | )% |
Marine | | | 406,331 | | | | 424,595 | | | | (18,264 | ) | | (4 | )% |
Commercial | | | 188,934 | | | | 214,084 | | | | (25,150 | ) | | (12 | )% |
Other | | | 85,565 | | | | 89,875 | | | | (4,310 | ) | | (5 | )% |
Unamortized premiums, net | | | 222,522 | | | | 236,766 | | | | (14,244 | ) | | (6 | )% |
Allowance for loan losses | | | (1,200,808 | ) | | | (1,080,611 | ) | | | (120,197 | ) | | 11 | % |
| | | | | | | | | | | | | | | |
Total loans, net | | $ | 23,271,969 | | | $ | 24,451,852 | | | $ | (1,179,883 | ) | | (5 | )% |
| | | | | | | | | | | | | | | |
Loans, net decreased 5% to $23.3 billion at March 31, 2009 from $24.5 billion at December 31, 2008. This decline was due primarily to our strategy of reducing balance sheet risk and halting our previous focus on growing the balance sheet. We do not expect to grow our loan portfolio for the foreseeable future. In addition, we plan to allow our home equity loans to pay down, resulting in an overall decline in the balance of the loan portfolio.
We have a credit default swap (“CDS”) on $4.0 billion of our first-lien residential real estate loan portfolio through a synthetic securitization structure. As of March 31, 2009, the balance of the loans covered by the CDS was $2.7 billion. A CDS provides, for a fee, an assumption by a third party of a portion of the credit risk related to the underlying loans. The CDS provides protection for losses in excess of $4.0 million, but not to exceed approximately $30.3 million. In addition, our regulatory risk-weighted assets were reduced as a result of this transaction because we transferred a portion of our credit risk to an unaffiliated third party. We recognized $1.4 million in losses on the portion of the loans covered under the CDS during the three months ended March 31, 2009 and $3.0 million in losses since we entered the CDS. We have not yet realized any recoveries from the CDS as losses on the covered loans have not yet exceeded $4.0 million; however, the estimated recoveries from the CDS for the next twelve months were $27.3 million at March 31, 2009, which is reflected in the allowance for loan losses.
Deposits
Deposits are summarized as follows (dollars in thousands):
| | | | | | | | | | | | | |
| | | March 31,
2009 | | December 31,
2008 | | Variance | |
| | | | 2009 vs. 2008 | |
| | | | Amount | | | % | |
Money market and savings accounts | | $ | 14,257,747 | | $ | 12,692,729 | | $ | 1,565,018 | | | 12 | % |
Sweep deposit accounts | | | 10,243,981 | | | 9,650,431 | | | 593,550 | | | 6 | % |
Certificates of deposit | | | 2,033,182 | | | 2,363,385 | | | (330,203 | ) | | (14 | )% |
Checking accounts | | | 862,177 | | | 991,477 | | | (129,300 | ) | | (13 | )% |
Brokered certificates of deposit | | | 244,398 | | | 438,224 | | | (193,826 | ) | | (44 | )% |
| | | | | | | | | | | | | |
Total deposits | | $ | 27,641,485 | | $ | 26,136,246 | | $ | 1,505,239 | | | 6 | % |
| | | | | | | | | | | | | |
21
Deposits represented 59% and 57% of total liabilities at March 31, 2009 and December 31, 2008, respectively. Deposits generally provide us the benefit of lower interest costs, compared with wholesale funding alternatives. While our deposits increased by $1.5 billion during the quarter, we expect these balances to decrease over the remainder of 2009 as we focus on decreasing total assets. At March 31, 2009, 95% of our customer deposits were covered by FDIC insurance.
The deposits balance is a component of the total customer cash and deposits balance reported as a customer activity metric of $34.4 billion and $32.3 billion at March 31, 2009 and December 31, 2008, respectively. The total customer cash and deposits balance is summarized as follows (dollars in thousands):
| | | | | | | | | | | | | | | |
| | | March 31,
2009 | | | December 31,
2008 | | | Variance | |
| | | | 2009 vs. 2008 | |
| | | | Amount | | | % | |
Deposits | | $ | 27,641,485 | | | $ | 26,136,246 | | | $ | 1,505,239 | | | 6 | % |
Less: brokered certificates of deposit | | | (244,398 | ) | | | (438,224 | ) | | | 193,826 | | | 44 | % |
| | | | | | | | | | | | | | | |
Retail deposits | | | 27,397,087 | | | | 25,698,022 | | | | 1,699,065 | | | 7 | % |
Customer payables | | | 4,181,332 | | | | 3,753,332 | | | | 428,000 | | | 11 | % |
Customer cash balances held by third parties and other | | | 2,775,407 | | | | 2,805,101 | | | | (29,694 | ) | | (1 | )% |
| | | | | | | | | | | | | | | |
Total customer cash and deposits | | $ | 34,353,826 | | | $ | 32,256,455 | | | $ | 2,097,371 | | | 7 | % |
| | | | | | | | | | | | | | | |
Wholesale Borrowings
Wholesale borrowings, which consist of securities sold under agreements to repurchase and other borrowings are summarized as follows (dollars in thousands):
| | | | | | | | | | | | | |
| | | March 31,
2009 | | December 31,
2008 | | Variance | |
| | | | 2009 vs. 2008 | |
| | | | Amount | | | % | |
Securities sold under agreements to repurchase | | $ | 6,946,160 | | $ | 7,381,279 | | $ | (435,119 | ) | | (6 | )% |
| | | | | | | | | | | | | |
FHLB advances | | $ | 3,503,600 | | $ | 3,903,600 | | $ | (400,000 | ) | | (10 | )% |
Subordinated debentures | | | 427,349 | | | 427,328 | | | 21 | | | 0 | % |
Other(1) | | | 152,084 | | | 22,849 | | | 129,235 | | | 566 | % |
| | | | | | | | | | | | | |
Total other borrowings | | $ | 4,083,033 | | $ | 4,353,777 | | $ | (270,744 | ) | | (6 | )% |
| | | | | | | | | | | | | |
Total wholesale borrowings | | $ | 11,029,193 | | $ | 11,735,056 | | $ | (705,863 | ) | | (6 | )% |
| | | | | | | | | | | | | |
(1) | | Includes approximately $101 million payable to Lehman Brothers related to terminated derivatives transactions. Refer to Note 6—Accounting for Derivative Financial Instruments and Hedging Activities in Item 1. Consolidated Financial Statements for more information. |
Wholesale borrowings represented 23% and 26% of total liabilities at March 31, 2009 and December 31, 2008, respectively. The decrease in wholesale borrowings of $0.7 billion during for the three months ended March 31, 2009 was due primarily to a decrease in securities sold under agreements to repurchase and FHLB advances. Securities sold under agreements to repurchase coupled with FHLB advances are the primary wholesale funding sources of the Bank. As a result, we expect these balances to fluctuate over time as our deposits and our interest-earning assets fluctuate.
22
Corporate Debt
Corporate debt by type is shown as follows (dollars in thousands):
| | | | | | | | | | | | | |
| | | Face Value | | Discount | | | Fair Value
Adjustment | | Net |
March 31, 2009 | | | | | | | | | | | | | |
Senior notes: | | | | | | | | | | | | | |
8% Notes, due 2011 | | $ | 435,515 | | $ | (1,601 | ) | | $ | 12,484 | | $ | 446,398 |
7 3/8% Notes, due 2013 | | | 414,665 | | | (4,118 | ) | | | 30,834 | | | 441,381 |
7 7/8% Notes, due 2015 | | | 243,177 | | | (1,997 | ) | | | 12,693 | | | 253,873 |
| | | | | | | | | | | | | |
Total senior notes | | | 1,093,357 | | | (7,716 | ) | | | 56,011 | | | 1,141,652 |
Springing lien notes 12 1/2%, due 2017 | | | 2,057,000 | | | (455,101 | ) | | | 9,122 | | | 1,611,021 |
| | | | | | | | | | | | | |
Total corporate debt | | $ | 3,150,357 | | $ | (462,817 | ) | | $ | 65,133 | | $ | 2,752,673 |
| | | | | | | | | | | | | |
| | | | |
| | | Face Value | | Discount | | | Fair Value
Adjustment | | Net |
December 31, 2008 | | | | | | | | | | | | | |
Senior notes: | | | | | | | | | | | | | |
8% Notes, due 2011 | | $ | 435,515 | | $ | (1,763 | ) | | $ | 13,855 | | $ | 447,607 |
7 3/8% Notes, due 2013 | | | 414,665 | | | (4,334 | ) | | | 32,435 | | | 442,766 |
7 7/8% Notes, due 2015 | | | 243,177 | | | (2,071 | ) | | | 13,183 | | | 254,289 |
| | | | | | | | | | | | | |
Total senior notes | | | 1,093,357 | | | (8,168 | ) | | | 59,473 | | | 1,144,662 |
Springing lien notes 12 1/2%, due 2017 | | | 2,057,000 | | | (460,515 | ) | | | 9,385 | | | 1,605,870 |
| | | | | | | | | | | | | |
Total corporate debt | | $ | 3,150,357 | | $ | (468,683 | ) | | $ | 68,858 | | $ | 2,750,532 |
| | | | | | | | | | | | | |
LIQUIDITY AND CAPITAL RESOURCES
We have established liquidity and capital policies. The objectives of these policies are to support the successful execution of our business strategies while ensuring ongoing and sufficient liquidity through the business cycle. These policies are especially important during periods of stress in the financial markets, which have been ongoing since the fourth quarter of 2007 and will likely continue for some time. During the fourth quarter of 2007, we experienced a disruption in our customer base, which caused a significant decline in customer deposits. We believe this disruption was due to the uncertainty in connection with the credit related losses in our balance sheet management segment. Deposits are the primary source of liquidity for E*TRADE Bank, so this sudden and rapid decline created a substantial amount of liquidity risk. We followed our existing liquidity policies and contingency plans and successfully met our liquidity needs during this extraordinary period. We believe that our ability to meet liquidity needs during that time validates the effectiveness of our liquidity policies and contingency plans. While the liquidity risk associated with our customer deposits remains at increased levels, we believe the current level of risk is substantially lower than it was during the fourth quarter of 2007.
Capital is generated primarily through our business operations and our capital market activities. During the second half of 2007, our balance sheet management segment incurred a significant amount of losses as a result of its exposure to the crisis in the residential real estate and related credit markets. Consequently, this segment required a significant capital infusion during the fourth quarter of 2007. The Company raised $2.5 billion in cash from Citadel, the majority of which was used to provide capital to the balance sheet management segment. While this segment continues to have exposure to the crisis in the residential real estate and credit markets, our trading and investing segment remains profitable and continues to generate capital through retained earnings.
We maintain capital in excess of regulatory minimums at our regulated subsidiaries, the most significant of which is E*TRADE Bank. As of March 31, 2009, we held $444.2 million of risk-based capital at E*TRADE Bank in excess of the regulatory minimum level required to be considered “well capitalized.”
23
We currently anticipate that our available cash and credit resources will be sufficient to meet our anticipated working capital and capital expenditure requirements for at least the next twelve months. The combination of the capital generated in the transactions detailed above, the capital held at E*TRADE Bank and the Company, and the capital that continues to be generated in our trading and investing segment are the key sources of capital we utilize to maintain our regulatory capital above the minimum level required to be considered well capitalized. However, given the uncertainties in the current operating environment, we believe that it is necessary to strengthen our capital position. Therefore we are focused on a variety of capital planning efforts with the following goals in mind: reduce the size and risk of assets at E*TRADE Bank which will in turn reduce its required level of regulatory capital; generate cash capital to inject into E*TRADE Bank; and reduce our level of corporate debt and interest expense.
In addition, our primary banking regulator, the Office of Thrift Supervision (“OTS”), has advised us to raise new capital for E*TRADE Bank and to reduce our level of corporate debt. The capital planning and generation efforts discussed above include our efforts to obtain cash capital from the U.S. Treasury. During the fourth quarter of 2008, we applied to the U.S. Treasury for funding under the Troubled Asset Relief Program (“TARP”) Capital Purchase Program. We cannot predict when or if our application will be acted upon. We estimate this program could provide approximately $600 million to $750 million in new preferred equity, at rates substantially discounted to current market rates. If our application is approved, it would likely be conditional upon significant reduction in corporate debt and interest expense, including possible transactions with existing security holders. Our ability to issue preferred equity under the TARP program would be dependent upon receiving approval from certain of our bond holders and likely our shareholders.
Corporate Cash
Corporate cash is the primary source of liquidity at the parent company and is available to invest in our regulated subsidiaries. We define corporate cash as cash held at the parent company as well as cash held in certain subsidiaries that can distribute cash to the parent company without any regulatory approval. The components of corporate cash as of March 31, 2009 and December 31, 2008 are as follows (dollars in thousands):
| | | | | | | | | | |
| | | March 31,
2009 | | December 31,
2008 | | Variance | |
| | | | 2009 vs. 2008 | |
Parent company cash | | $ | 186,486 | | $ | 216,535 | | $ | (30,049 | ) |
Converging Arrows, Inc. and other cash(1) | | | 219,730 | | | 218,318 | | | 1,412 | |
| | | | | | | | | | |
Total corporate cash(2) | | $ | 406,216 | | $ | 434,853 | | $ | (28,637 | ) |
| | | | | | | | | | |
(1) | | Converging Arrows, Inc. and other consists of corporate subsidiaries that can distribute cash to the parent company without any regulatory approval and includes E*TRADE Mauritius. |
(2) | | Total corporate cash at March 31, 2009 and December 31, 2008 includes $30.0 million and $45.3 million, respectively, that we invested in The Reserve Funds’ Primary Fund and is included as a receivable in the other assets line item, as The Reserve Fund has not indicated when the funds will be distributed back to investors. |
24
Cash and Equivalents
The consolidated cash and equivalents balance increased by $0.6 billion to $4.5 billion for the three months ended March 31, 2009. The majority of this balance is cash held in regulated subsidiaries, primarily our Bank and Brokerage, outlined as follows:
| | | | | | | | | | | | |
| | | March 31,
2009 | | | December 31,
2008 | | | Variance | |
| | | | 2009 vs. 2008 | |
Corporate cash | | $ | 406,216 | | | $ | 434,853 | | | $ | (28,637 | ) |
Banking subsidiaries | | | 3,852,250 | | | | 3,220,232 | | | | 632,018 | |
Brokerage subsidiaries | | | 327,467 | | | | 339,716 | | | | (12,249 | ) |
Other corporate cash | | | 3,301 | | | | 5,356 | | | | (2,055 | ) |
Less: | | | | | | | | | | | | |
Cash reported in other assets(1) | | | (96,928 | ) | | | (146,308 | ) | | | 49,380 | |
| | | | | | | | | | | | |
Total consolidated cash | | $ | 4,492,306 | | | $ | 3,853,849 | | | $ | 638,457 | |
| | | | | | | | | | | | |
(1) | | Cash reported in other assets consists of cash that we invested in The Reserve Funds’ Primary Fund and is included as a receivable in the other assets line item, as The Reserve Fund has not indicated when the funds will be distributed back to investors. |
The cash held in our regulated subsidiaries serves as a source of liquidity for those subsidiaries and is not a primary source of capital for the parent company.
Cash and Equivalents Held in the Reserve Fund
At March 31, 2009, we held cash in The Reserve Funds’ Primary Fund (“the Fund”) of $96.9 million, which is included as a receivable in the other assets line item on the balance sheet. On September 16, 2008, the Fund reported that its shares had fallen below the standard of $1 per share, which is commonly referred to as “breaking the buck.” The following table details our cash held in the Fund at the date the Fund was reported as “breaking the buck” and at March 31, 2009 (dollars in thousands):
| | | | | | | | | | |
| | | March 31,
2009 | | September 15,
2008 | | Variance | |
| | | | March 31, 2009 vs.
September 15, 2008 | |
Corporate cash | | $ | 29,993 | | $ | 230,326 | | $ | (200,333 | ) |
Bank subsidiaries | | | 54,752 | | | 420,456 | | | (365,704 | ) |
Brokerage subsidiaries | | | 12,183 | | | 93,559 | | | (81,376 | ) |
| | | | | | | | | | |
Total cash held in the Fund | | $ | 96,928 | | $ | 744,341 | | $ | (647,413 | ) |
| | | | | | | | | | |
On February 26, 2009, The Reserve announced that it had adopted a Plan of Liquidation for the orderly liquidation of the assets of the Fund. Under the terms of the plan, which is subject to the supervision of the SEC, the Reserve will continue to make interim distributions up to $0.9172 per share. The Reserve indicated in this announcement that it was taking this approach in order to provide liquidity to investors without prejudicing the legal right and remedies of any shareholder’s claims. We continue to believe that we will receive substantially all of our remaining investment; however, we cannot state with certainty that we will not ultimately incur additional loss on our remaining position. In addition, we believe it will take a significant amount of time to eventually receive these funds.
Liquidity Available from Subsidiaries
Liquidity available to the Company from its subsidiaries, other than Converging Arrows, Inc. (“Converging Arrows”) and E*TRADE Mauritius, a wholly-owned subsidiary of Converging Arrows, is limited by regulatory requirements.
25
Any loans by E*TRADE Bank to the parent company and its other non-bank subsidiaries are subject to various quantitative, arm’s length, collateralization and other requirements. At March 31, 2009, E*TRADE Bank had approximately $444.2 million of risk-based capital above the “well capitalized” level(1). In the current credit environment, we plan to maintain excess risk-based capital at E*TRADE Bank in order to enhance our ability to absorb credit losses while still maintaining “well capitalized” status. However, events beyond management’s control, such as a continued deterioration in residential real estate and credit markets, could adversely affect future earnings and E*TRADE Bank’s ability to meet its future capital requirements.
The Company’s broker-dealer subsidiaries are subject to capital requirements determined by their respective regulators. At March 31, 2009 and December 31, 2008, all of our significant brokerage subsidiaries met their minimum net capital requirements. Our broker-dealer subsidiaries had excess net capital of $499.7 million(2) at March 31, 2009, a decline of $218.0 million from December 31, 2008. This decline was due to a $250 million dividend paid by E*TRADE Clearing to E*TRADE Bank during the first quarter of 2009(3). While we cannot assure that we would obtain regulatory approval again in the future to withdraw any of this excess net capital, $412.9 million is available for dividend while still maintaining a capital level above regulatory “early warning” guidelines.
Other Sources of Liquidity
We also maintain $325.0 million in uncommitted financing to meet margin lending needs. At March 31, 2009, there were no outstanding balances and the full $325.0 million was available.
We rely on borrowed funds, such as FHLB advances and securities sold under agreements to repurchase, to provide liquidity for the Bank. Our ability to borrow these funds is dependent upon the continued availability of funding in the wholesale borrowings market. At March 31, 2009, the Bank had approximately $10.0 billion in additional borrowing capacity with the FHLB.
We have the option to make the interest payments on our springing lien notes in the form of either cash or additional springing lien notes through May 2010. During the second quarter of 2008, we elected to make our first interest payment of approximately $121 million in cash. During the fourth quarter of 2008, we elected to make our second interest payment of $121 million in the form of additional springing lien notes. We expect to make our next three interest payments, which equates to all interest payments on the springing lien notes through May 2010, in the form of additional springing lien notes. The November 2010 payment is the first interest payment we are required to pay in cash.
Corporate Debt
Our current senior debt ratings are B2 by Moody’s Investor Service, B (developing) by Standard & Poor’s and B (high) by Dominion Bond Rating Service (“DBRS”). The Company’s long-term deposit ratings are Ba3 by Moody’s Investor Service, BB- (developing) by Standard & Poor’s and BB by DBRS. A significant change in these ratings may impact the rate and availability of future borrowings.
Off-Balance Sheet Arrangements
We enter into various off-balance-sheet arrangements in the ordinary course of business, primarily to meet the needs of our customers and to reduce our own exposure to interest rate risk. These arrangements include firm commitments to extend credit and letters of credit. Additionally, we enter into guarantees and other similar arrangements as part of transactions in the ordinary course of business. For additional information on each of these arrangements, see Item 1. Consolidated Financial Statements.
| (1) | | In April 2009, the parent company made a $150 million capital infusion to E*TRADE Bank. |
| (2) | | The excess net capital of the broker-dealer subsidiaries included $399.2 million of excess net capital at E*TRADE Clearing, which is a subsidiary of E*TRADE Bank and is also included in the excess risk-based capital of E*TRADE Bank. |
| (3) | | The dividend of $250 million did not impact E*TRADE Bank’s regulatory capital as E*TRADE Clearing is a subsidiary of E*TRADE Bank and is already included in its consolidated capital base. |
26
RISK MANAGEMENT
As a financial services company, we are exposed to risks in every component of our business. The identification and management of existing and potential risks are the keys to effective risk management. Our risk management framework, principles and practices support decision-making, improve the success rate for new initiatives and strengthen the organization. Our goal is to balance risks and rewards through effective risk management. Risks cannot be completely eliminated; however, we do believe risks can be identified and managed within the Company’s risk tolerance.
Our businesses expose us to the following four major categories of risk that often overlap:
| | • | | Credit Risk—Credit risk is the risk of loss resulting from adverse changes in the ability or willingness of a borrower or counterparty to meet the agreed-upon terms of their financial obligations. |
| | • | | Liquidity Risk—Liquidity risk is the risk of loss resulting from the inability to meet current and future cash flow and collateral needs. |
| | • | | Interest Rate Risk—Interest rate risk is the risk of loss from adverse changes in interest rates, which could cause fluctuations in our long-term earnings or in the value of the Company’s net assets. |
| | • | | Operational Risk—Operational risk is the risk of loss resulting from fraud, inadequate controls or the failure of the internal controls process, third party vendor issues, processing issues and external events. |
Liquidity, interest rate and operational risks and the management of risk are more fully described in “Management’s Discussion and Analysis of Financial Condition and Results of Operations” in our Annual Report on Form 10-K for the year ended December 31, 2008. We are also subject to other risks that could impact our business, financial condition, results of operations or cash flows in future periods. See Part II-Item 1A. Risk Factors.
Credit Risk Management
Our primary sources of credit risk are our loan and securities portfolios, where risk results from extending credit to customers and purchasing securities, respectively. The degree of credit risk associated with our loans and securities varies based on many factors including the size of the transaction, the credit characteristics of the borrower, features of the loan product or security, the contractual terms of the related documents and the availability and quality of collateral. Credit risk is one of the most common risks in financial services and is one of our most significant risks.
Credit risk is monitored by our Credit Risk Committee. The Credit Risk Committee uses detailed tracking and analysis to measure credit performance and reviews and modifies credit policies as appropriate.
Housing Market Conditions
Conditions in the residential real estate and credit markets, which deteriorated sharply during 2007, continued to be extremely challenging in 2008 and into the first quarter of 2009. The significant and abrupt evaporation of secondary market liquidity for various types of mortgage loans, particularly home equity loans, has decreased the overall availability of housing credit. As a result, many borrowers, particularly those in markets with declining housing prices, have been unable to refinance existing loans. This combination of a decline in the availability of credit and a decline in housing prices creates significant credit risk in our loan portfolio, particularly in our home equity loan portfolio.
Loss Mitigation
Given the deterioration in the performance of our loan portfolio, particularly in our home equity loan portfolio, we formed a special credit management team to focus on the mitigation of potential losses in the home equity loan portfolio.
27
This team’s primary focus is reducing our exposure to open home equity lines. Through a variety of strategies, including voluntary line closures, automatically freezing lines on all delinquent accounts, and freezing lines on loans with materially reduced home equity, we have reduced this amount from a high of over $7 billion in 2007 to $2.0 billion as of March 31, 2009.
The team has several other initiatives either in progress or in development which are focused on mitigating losses in our home equity loan portfolio. Those initiatives include improving collection efforts and practices of our servicers as well as increasing our loss recovery efforts to minimize the level of loss on a loan that goes to charge-off.
We also initiated a loan modification program that resulted in an insignificant number of minor modifications in 2008. This loan modification program became more active during the first quarter of 2009. We consider modifications in which we made a significant economic concession to a borrower experiencing financial difficulty a troubled debt restructuring (“TDR”). As of March 31, 2009, we had modified $115.7 million of loans in which the modification was considered a TDR. We also modified a small number of loans through traditional collections actions taken in the normal course of servicing delinquent accounts. These actions did not include a significant economic concession to the borrower. On February 18, 2009, the U.S. Department of the Treasury announced the Homeowner Affordability and Stability Plan. The primary focus of this plan is to create requirements and provide incentives to modify mortgages with the goal of avoiding foreclosure. We believe our loan modification program goals are in line with the Homeowner Affordability and Stability Plan and we expect to participate in this program. Our loan modification programs target borrowers who demonstrate a willingness and capacity to meet their loan obligations and stay in their homes. To date our programs have focused on modifications to the rate and term of loans often resulting in a lower monthly payment for the borrower. Our current programs are not focused on reducing the overall balance of the loan; however, we plan to test a program of this kind in the second quarter of 2009.
In addition, we continue to review our mortgage loan portfolio in order to identify loans to be repurchased by the originator. Our review is primarily focused on identifying loans with early payment defaults, violations of transaction representations and warranties, or material misrepresentation on the part of the seller. Any loans identified with these deficiencies are submitted to the original seller for repurchase. For the three months ended March 31, 2009, approximately $14.3 million of loans, and the year ended December 31, 2008, approximately $105.6 million of loans were repurchased by the original sellers.
Underwriting Standards – Originated Loans
During the second quarter of 2008, we exited our retail mortgage origination business, which represented our last remaining loan origination channel. During the three months ended March 31, 2008, we originated approximately $116 million in one- to four-family loans through our retail mortgage origination business. These loans were predominantly prime credit quality first-lien mortgage loans secured by a single-family residence. In March 2009, we partnered with a third party company to provide access to real estate loans for our customers. This product is being offered as a convenience to our customers and is not one of our primary product offerings. We structured this arrangement to minimize our taking on any of the typical risks commonly associated with mortgage lending. The third party company providing this product performs all processing and underwriting of these loans. Shortly after closing, the third party company purchases the loans from us and is responsible for the credit risk associated with these loans. We did not originate any loans during the three months ended March 31, 2009; however, we had commitments to originate mortgage loans of $16.3 million at March 31, 2009.
CONCENTRATIONS OF CREDIT RISK
Loans
We track and review many factors to predict and monitor credit risk in our loan portfolios, which are primarily made up of loans secured by residential real estate. These factors, which are documented at the time of origination, include: borrowers’ debt-to-income ratio, borrowers’ credit scores, housing prices, documentation
28
type, occupancy type, and loan type. We also review estimated current loan-to-value (“LTV”) ratios when monitoring credit risk in our loan portfolios. In economic conditions in which housing prices generally appreciate, we believe that loan type, LTV ratios and credit scores are the key factors in determining future loan performance. In the current housing market with declining home prices and less credit available for refinance, we believe the LTV ratio becomes a more important factor in predicting and monitoring credit risk.
We believe certain categories of loans inherently have a higher level of credit risk due to characteristics of the borrower and/or features of the loan. Two of these categories are sub-prime and option ARM loans. As a general matter, we did not originate or purchase these loans to hold on our balance sheet; however, in the normal course of purchasing large pools of real estate loans, we invariably ended up acquiring a de minimis amount of sub-prime loans. As of March 31, 2009, sub-prime(1) real estate loans represented less than one-fifth of one percent of our total real estate loan portfolio and we held no option ARM loans.
As noted above, we believe loan type, LTV ratios and borrowers’ credit scores are key determinants of future loan performance. Our home equity loan portfolio is primarily second lien loans(2) on residential real estate properties, which have a higher level of credit risk than first lien mortgage loans. We believe home equity loans with a combined loan-to-value (“CLTV”) of 90% or higher or a Fair Isaac Credit Organization (“FICO”) score below 700 are the loans with the highest levels of credit risk in our portfolios.
The breakdowns by LTV/CLTV and FICO score of our two main loan portfolios, one-to four-family and home equity, are as follows (dollars in thousands):
| | | | | | | | | | | | | | | | |
| | | One- to Four-Family | | | Home Equity | |
LTV/CLTV at Origination(3) | | March 31,
2009 | | | December 31,
2008 | | | March 31,
2009 | | | December 31,
2008 | |
<=70% | | $ | 5,464,533 | | | $ | 5,647,650 | | | $ | 3,009,911 | | | $ | 3,126,274 | |
70% - 80% | | | 6,747,255 | | | | 7,008,860 | | | | 1,743,760 | | | | 1,822,797 | |
80% - 90% | | | 181,526 | | | | 162,966 | | | | 3,147,716 | | | | 3,312,332 | |
>90% | | | 146,349 | | | | 160,368 | | | | 1,631,621 | | | | 1,755,780 | |
| | | | | | | | | | | | | | | | |
Total | | $ | 12,539,663 | | | $ | 12,979,844 | | | $ | 9,533,008 | | | $ | 10,017,183 | |
| | | | | | | | | | | | | | | | |
Average LTV/CLTV at loan origination(4) | | | 70.2 | % | | | 68.8 | % | | | 78.9 | % | | | 79.1 | % |
Average estimated current LTV/CLTV(5) | | | 93.4 | % | | | 90.1 | % | | | 102.4 | % | | | 99.7 | % |
| | |
| | | One- to Four-Family | | | Home Equity | |
FICO at Origination | | March 31,
2009 | | | December 31,
2008 | | | March 31,
2009 | | | December 31,
2008 | |
>=720 | | $ | 8,356,594 | | | $ | 8,680,892 | | | $ | 5,733,580 | | | $ | 6,005,837 | |
719 - 700 | | | 1,705,307 | | | | 1,750,294 | | | | 1,513,409 | | | | 1,591,380 | |
699 - 680 | | | 1,308,697 | | | | 1,342,967 | | | | 1,306,243 | | | | 1,379,218 | |
679 - 660 | | | 760,988 | | | | 784,449 | | | | 561,924 | | | | 595,776 | |
659 - 620 | | | 399,382 | | | | 412,514 | | | | 406,108 | | | | 432,862 | |
<620 | | | 8,695 | | | | 8,728 | | | | 11,744 | | | | 12,110 | |
| | | | | | | | | | | | | | | | |
Total | | $ | 12,539,663 | | | $ | 12,979,844 | | | $ | 9,533,008 | | | $ | 10,017,183 | |
| | | | | | | | | | | | | | | | |
| (1) | | Defined as borrowers with FICO scores less than 620 at the time of origination. |
| (2) | | Approximately 14% of the home equity portfolio is in the first lien position. For home equity loans that are in a second lien position, we also hold the first lien position on the same residential real estate property for less than 1% of the loans in this portfolio. |
| (3) | | CLTV at origination calculations for home equity are based on drawn balances. |
| (4) | | Average LTV/CLTV at loan origination calculations are based on LTV/CLTV at time of purchase for one- to four-family purchased loans and undrawn balances for home equity loans. |
| (5) | | The average estimated current LTV ratio reflects the outstanding balance at the balance sheet date, divided by the estimated current property value. Current property values are estimated using the most recent property value data available to us. For properties in which we did not have an updated valuation, we utilized home price indices to estimate the current property value. |
29
In addition to the factors described above, we monitor credit trends in loans by acquisition channel and vintage, which are summarized below as of March 31, 2009 and December 31, 2008 (dollars in thousands):
| | | | | | | | | | | | |
| | | One- to Four-Family | | Home Equity |
Acquisition Channel | | March 31,
2009 | | December 31,
2008 | | March 31,
2009 | | December 31,
2008 |
Purchased from a third party | | $ | 10,268,338 | | $ | 10,646,324 | | $ | 8,424,783 | | $ | 8,873,156 |
Originated by the Company | | | 2,271,325 | | | 2,333,520 | | | 1,108,225 | | | 1,144,027 |
| | | | | | | | | | | | |
Total real estate loans | | $ | 12,539,663 | | $ | 12,979,844 | | $ | 9,533,008 | | $ | 10,017,183 |
| | | | | | | | | | | | |
| | |
| | | One- to Four-Family | | Home Equity |
Vintage Year | | March 31,
2009 | | December 31,
2008 | | March 31,
2009 | | December 31,
2008 |
2003 and prior | | $ | 545,634 | | $ | 577,408 | | $ | 721,065 | | $ | 754,054 |
2004 | | | 1,243,682 | | | 1,309,985 | | | 953,248 | | | 990,138 |
2005 | | | 2,610,376 | | | 2,695,718 | | | 2,323,470 | | | 2,426,000 |
2006 | | | 4,724,336 | | | 4,890,407 | | | 4,404,515 | | | 4,668,721 |
2007 | | | 3,385,666 | | | 3,475,661 | | | 1,113,972 | | | 1,161,667 |
2008(1) | | | 29,969 | | | 30,665 | | | 16,738 | | | 16,603 |
| | | | | | | | | | | | |
Total real estate loans | | $ | 12,539,663 | | $ | 12,979,844 | | $ | 9,533,008 | | $ | 10,017,183 |
| | | | | | | | | | | | |
(1) | | The increase in the 2008 home equity vintage loans for the three months ended March 31, 2009 was due to net draws on home equity lines of credit. |
Allowance for Loan Losses
The allowance for loan losses is management’s estimate of credit losses inherent in our loan portfolio as of the balance sheet date. The estimate of the allowance for loan losses is based on a variety of factors, including the composition and quality of the portfolio; delinquency levels and trends; current and historical charge-off and loss experience; current industry charge-off and loss experience; the condition of the real estate market and geographic concentrations within the loan portfolio; the interest rate climate; the overall availability of housing credit; and general economic conditions. The allowance for loan losses is typically equal to management’s estimate of loan charge-offs in the twelve months following the balance sheet date. Determining the adequacy of the allowance is complex and requires judgment by management about the effect of matters that are inherently uncertain. Subsequent evaluations of the loan portfolio, in light of the factors then prevailing, may result in significant changes in the allowance for loan losses in future periods. We believe our allowance for loan losses at March 31, 2009 is representative of probable losses inherent in the loan portfolio at the balance sheet date.
In determining the allowance for loan losses, we allocate a portion of the allowance to various loan products based on an analysis of individual loans and pools of loans. However, the entire allowance is available to absorb credit losses inherent in the total loan portfolio as of the balance sheet date.
The following table presents the allowance for loan losses by major loan category (dollars in thousands):
| | | | | | | | | | | | | | | | | | | | | | | | |
| | | One- to Four-Family | | | Home Equity | | | Consumer and Other | | | Total | |
| | | Allowance | | Allowance
as a % of
Loans
Receivable(1) | | | Allowance | | Allowance
as a % of
Loans
Receivable(1) | | | Allowance | | Allowance
as a % of
Loans
Receivable(1) | | | Allowance | | Allowance
as a % of
Loans
Receivable(1) | |
March 31, 2009 | | $ | 308,806 | | 2.45 | % | | $ | 818,646 | | 8.45 | % | | $ | 73,356 | | 3.32 | % | | $ | 1,200,808 | | 4.91 | % |
December 31, 2008 | | $ | 185,163 | | 1.42 | % | | $ | 833,835 | | 8.19 | % | | $ | 61,613 | | 2.65 | % | | $ | 1,080,611 | | 4.23 | % |
(1) | | Allowance as a percentage of loans receivable is calculated based on the gross loans receivable for each respective category. |
30
During the three months ended March 31, 2009, the allowance for loan losses increased by $120.2 million from the level at December 31, 2008. This increase was driven primarily by the increase in the allowance allocated to the one- to four-family loan portfolio, which began to deteriorate during 2008. However, the majority of the allowance as of March 31, 2009 related to the home equity portfolio, which began to deteriorate during the second half of 2007. We believe the deterioration in both of these portfolios was caused by several factors, including: home price depreciation in virtually all key markets; growing inventories of unsold homes; rising foreclosure rates; sustained contraction in the availability of credit; and a severe downturn in the economy. While we do believe the provision for loan losses will be at historically high levels in future periods, we do not expect those levels to be in excess of those incurred in the third and fourth quarters of 2008.
Included in our allowance for loan losses at March 31, 2009 was a specific allowance of $62.5 million that was established for modified loans in which a significant economic concession was granted to a borrower experiencing financial difficulty (TDRs). The specific allowance for these individually impaired loans represents the expected loss over the remaining life of the loan. The following table shows the TDRs and specific valuation allowance by loan portfolio (dollars in thousands):
| | | | | | | | | |
| | | Recorded
Investment
in TDRs | | Specific
Valuation
Allowance | | Specific Valuation
Allowance as a % of
TDR Loans | |
March 31, 2009 | | | | | | | |
One- to four-family | | $ | 45,241 | | $ | 10,498 | | 23 | % |
Home equity | | | 70,456 | | | 52,049 | | 74 | % |
| | | | | | | | | |
Total | | $ | 115,697 | | $ | 62,547 | | 54 | % |
| | | | | | | | | |
The following table provides an analysis of the net charge-offs for the three months ended March 31, 2009 and 2008 (dollars in thousands):
| | | | | | | | | | | | | | |
| | | Charge-offs | | | Recoveries | | Net
Charge-offs | | | % of
Average
Loans
(Annualized) | |
Three months ended March 31, 2009 | | | | | | | | | | | |
One- to four-family | | $ | (67,044 | ) | | $ | — | | $ | (67,044 | ) | | 2.10 | % |
Home equity | | | (247,773 | ) | | | 2,482 | | | (245,291 | ) | | 9.79 | % |
Recreational vehicle | | | (20,106 | ) | | | 5,480 | | | (14,626 | ) | | 3.73 | % |
Marine | | | (4,846 | ) | | | 967 | | | (3,879 | ) | | 3.70 | % |
Other | | | (3,209 | ) | | | 283 | | | (2,926 | ) | | 4.06 | % |
| | | | | | | | | | | | | | |
Total | | $ | (342,978 | ) | | $ | 9,212 | | $ | (333,766 | ) | | 5.32 | % |
| | | | | | | | | | | | | | |
| | | | |
Three months ended March 31, 2008 | | | | | | | | | | | |
One- to four-family | | $ | (15,058 | ) | | $ | 455 | | $ | (14,603 | ) | | 0.38 | % |
Home equity | | | (150,128 | ) | | | 762 | | | (149,366 | ) | | 5.02 | % |
Recreational vehicle | | | (11,470 | ) | | | 3,266 | | | (8,204 | ) | | 1.73 | % |
Marine | | | (3,085 | ) | | | 1,335 | | | (1,750 | ) | | 1.35 | % |
Other | | | (2,671 | ) | | | 467 | | | (2,204 | ) | | 2.36 | % |
| | | | | | | | | | | | | | |
Total | | $ | (182,412 | ) | | $ | 6,285 | | $ | (176,127 | ) | | 2.36 | % |
| | | | | | | | | | | | | | |
Loan losses are recognized when it is probable that a loss will be incurred. Our policy is to charge-off closed-end consumer loans when the loan is 120 days delinquent or when we determine that collection is not probable. For credit cards, our policy is to charge-off loans when collection is not probable or the loan has been delinquent for 180 days. Our policy for both one- to four-family and home equity loans is to assess the value of the property when the loan has been delinquent for 180 days or is in bankruptcy, regardless of whether or not the
31
property is in foreclosure, and charge-off the amount of the loan balance in excess of the estimated current property value.
Net charge-offs for the three months ended March 31, 2009 compared to the same period in 2008 increased by $157.6 million. The overall increase was primarily due to higher net charge-offs on our one- to four-family loans and home equity loans, which were driven mainly by the same factors as described above. The continued pressure in the residential real estate market, specifically home price depreciation combined with tighter mortgage lending guidelines, could lead to a higher level of charge-offs in future periods. The following graph illustrates the net charge-offs by quarter:
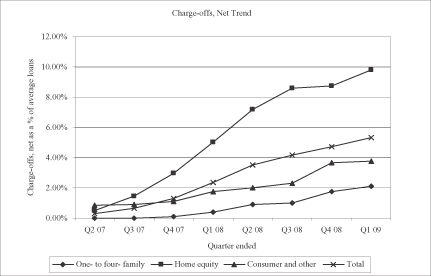
32
Nonperforming Assets
We classify loans as nonperforming when they are 90 days past due. The following table shows the comparative data for nonperforming loans and assets (dollars in thousands):
| | | | | | | | |
| | | March 31,
2009 | | | December 31,
2008 | |
One- to four-family | | $ | 882,077 | | | $ | 593,075 | |
Home equity | | | 419,670 | | | | 341,255 | |
Consumer and other loans | | | 9,113 | | | | 7,792 | |
| | | | | | | | |
Total nonperforming loans | | | 1,310,860 | | | | 942,122 | |
Real estate owned (“REO”) and other repossessed assets, net | | | 86,962 | | | | 108,105 | |
| | | | | | | | |
Total nonperforming assets, net | | $ | 1,397,822 | | | $ | 1,050,227 | |
| | | | | | | | |
Nonperforming loans receivable as a percentage of gross loans receivable | | | 5.36 | % | | | 3.69 | % |
One- to four-family allowance for loan losses as a percentage of one- to four-family nonperforming loans | | | 35.01 | % | | | 31.22 | % |
Home equity allowance for loan losses as a percentage of home equity nonperforming loans | | | 195.07 | % | | | 244.34 | % |
Consumer and other allowance for loan losses as a percentage of consumer and other nonperforming loans | | | 804.96 | % | | | 790.72 | % |
Total allowance for loan losses as a percentage of total nonperforming loans | | | 91.60 | % | | | 114.70 | % |
During the three months ended March 31, 2009, our nonperforming assets, net increased $347.6 million to $1.4 billion compared to December 31, 2008. The increase was attributed primarily to an increase in nonperforming one- to four-family loans of $289.0 million and home equity loans of $78.4 million for the three months ended March 31, 2009 when compared to December 31, 2008. We expect nonperforming loan levels to continue to increase over time due to the weak conditions in the residential real estate and credit markets.
The following graph illustrates the nonperforming loans by quarter:
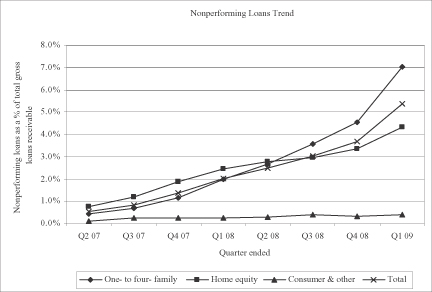
33
The allowance as a percentage of total nonperforming loans receivable, net decreased from 115% at December 31, 2008 to 92% at March 31, 2009. This decrease was driven primarily by an increase in home equity nonperforming loans, which have a higher level of expected loss when compared to one- to four-family loans. The balance of nonperforming loans includes loans delinquent 90 to 179 days as well as loans delinquent 180 days and greater. We believe the distinction between these two periods is important as loans delinquent 180 days and greater have been written down to their expected recovery value, whereas loans delinquent 90 to 179 days have not. We believe the allowance for loan losses expressed as a percentage of loans delinquent 90 to 179 days is an important measure of the adequacy of the allowance as these loans are expected to drive the vast majority of future charge-offs. Additional charge-offs on loans delinquent 180 days are possible if home prices decline beyond our current expectations, but we do not anticipate these charge-offs to be significant, particularly when compared to the expected charge-offs on loans delinquent 90 to 179 days. We consider this ratio especially important for one- to four-family loans as we expect the balances of loans delinquent 180 days and greater to increase in the future due to the extensive amount of time it takes to foreclose on a property in the current real estate market.
The following table shows the allowance for loan losses as a percentage of loans delinquent 90 to 179 days for each of our major loan categories (dollars in thousands):
| | | | | | |
| | | March 31,
2009 | | Allowance as a % of Loans
Delinquent 90 to 179 days | |
One- to four-family loans | | $ | 452,990 | | 68.17 | % |
Home equity loans | | | 347,016 | | 235.91 | % |
Consumer and other loans | | | 7,988 | | 918.33 | % |
| | | | �� | | |
Total loans delinquent 90 to 179 days | | $ | 807,994 | | 148.62 | % |
| | | | | | |
In addition to nonperforming assets, we monitor loans where a borrower’s past credit history casts doubt on their ability to repay a loan (“special mention” loans). We classify loans as special mention when they are between 30 and 89 days past due. The following table shows the comparative data for special mention loans (dollars in thousands):
| | | | | | | | |
| | | March 31,
2009 | | | December 31,
2008 | |
One- to four-family | | $ | 587,020 | | | $ | 594,379 | |
Home equity | | | 304,823 | | | | 407,386 | |
Consumer and other loans | | | 40,770 | | | | 33,298 | |
| | | | | | | | |
Total special mention loans | | $ | 932,613 | | | $ | 1,035,063 | |
| | | | | | | | |
Special mention loans receivable as a percentage of gross loans receivable | | | 3.81 | % | | | 4.05 | % |
The trend in special mention loan balances are generally indicative of the expected trend for charge-offs in future periods, as these loans have a greater propensity to migrate into nonaccrual status and ultimately charge-off. One- to four-family loans are generally secured, in a first lien position, by real estate assets, reducing the potential loss when compared to an unsecured loan. Our home equity loans are generally secured by real estate assets; however, the majority of these loans are secured in a second lien position, which substantially increases the potential loss when compared to a first lien position.
During the three months ended March 31, 2009, special mention loans decreased by $102.5 million to approximately $932.6 million. This decrease was almost entirely due to a decrease in home equity special mention loans. Approximately 30% of the decrease in home equity special mention loans was a result of our loan modification programs in which borrowers who were 30 to 89 days past due were made current(1) as part of a
| (1) | | TDRs are accounted for as nonaccrual loans at the time of modification and return to accrual status after six consecutive payments are made. |
34
loan modification that was considered a TDR. We believe that our loan modification programs will improve the overall credit performance of the modified loans over time; however, our current forecast of future loan losses does not assume that the modified loans will perform better than loans with the same characteristics and delinquency pattern. While our level of special mention loans can fluctuate significantly in any given period, we believe the decrease we observed in the first quarter of 2009 is an encouraging sign regarding the future credit performance of this portfolio.
The following graph illustrates the special mention loans by quarter:
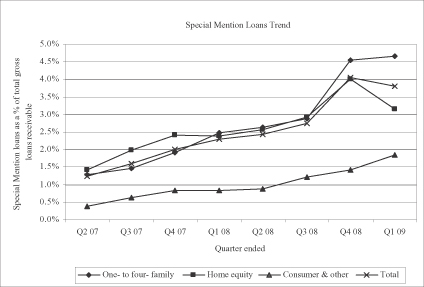
Securities
We focus primarily on security type and credit rating to monitor credit risk in our securities portfolios. We believe our asset-backed securities portfolio, which we sold in the fourth quarter of 2007, represented our highest concentration of credit risk within the securities portfolio. Subsequent to the sale of that portfolio, we believe our highest concentration of remaining credit risk, while dramatically lower than the credit risk inherent in asset-backed securities, is our CMO portfolio. The table below details the amortized cost by average credit ratings and type of asset as of March 31, 2009 and December 31, 2008 (dollars in thousands):
| | | | | | | | | | | | | | | | | | |
March 31, 2009 | | AAA | | AA | | A | | BBB | | Below
Investment
Grade and
Non-Rated | | Total |
Mortgage-backed securities backed by U.S. Government sponsored and federal agencies | | $ | 11,117,652 | | $ | — | | $ | — | | $ | — | | $ | — | | $ | 11,117,652 |
CMOs and other | | | 576,892 | | | 63,938 | | | 9,069 | | | 32,970 | | | 214,789 | | | 897,658 |
Municipal bonds, corporate bonds and FHLB stock | | | 214,463 | | | 11,936 | | | 63,637 | | | — | | | 19,880 | | | 309,916 |
| | | | | | | | | | | | | | | | | | |
Total | | $ | 11,909,007 | | $ | 75,874 | | $ | 72,706 | | $ | 32,970 | | $ | 234,669 | | $ | 12,325,226 |
| | | | | | | | | | | | | | | | | | |
35
| | | | | | | | | | | | | | | | | | |
December 31, 2008 | | AAA | | AA | | A | | BBB | | Below
Investment
Grade and
Non-Rated | | Total |
Mortgage-backed securities backed by U.S. Government sponsored and federal agencies | | $ | 10,118,792 | | $ | — | | $ | — | | $ | — | | $ | — | | $ | 10,118,792 |
CMOs and other | | | 625,066 | | | 67,988 | | | 64,795 | | | 18,493 | | | 173,051 | | | 949,393 |
Municipal bonds, corporate bonds and FHLB stock | | | 231,492 | | | 11,932 | | | 83,515 | | | — | | | — | | | 326,939 |
| | | | | | | | | | | | | | | | | | |
Total | | $ | 10,975,350 | | $ | 79,920 | | $ | 148,310 | | $ | 18,493 | | $ | 173,051 | | $ | 11,395,124 |
| | | | | | | | | | | | | | | | | | |
While the vast majority of this portfolio is AAA-rated, we concluded during the three months ended March 31, 2009 that approximately $37.3 million of the securities in this portfolio had a probable risk of future loss. As a result of the deterioration in the expected credit performance of the underlying loans in the securities, they were written down to their estimated fair market value by recording a $18.8 million impairment during the first quarter of 2009. Further declines in the performance of our CMO portfolio could result in additional impairments in future periods(1).
SUMMARY OF CRITICAL ACCOUNTING POLICIES AND ESTIMATES
The preparation of our financial condition and results of operations requires us to make judgments and estimates that may have a significant impact upon the financial results of the Company. We believe that of our significant accounting policies, the following require estimates and assumptions that require complex, subjective judgments by management, which can materially impact reported results: allowance for loan losses; fair value measurements; classification and valuation of certain investments; accounting for financial derivatives; estimates of effective tax rates, deferred taxes and valuation allowances; valuation of goodwill and other intangibles; and, valuation and expensing of share-based payments. These are more fully described in “Management’s Discussion and Analysis of Financial Condition and Results of Operations” in our Annual Report on Form 10-K for the year ended December 31, 2008.
During the first quarter of 2009, our loan modification program became more active resulting in $115.7 million of TDRs. As a result, we updated our allowance for loan losses accounting policy to include our policy for TDRs.
Allowance for Loan Losses
Description
The allowance for loan losses is management’s estimate of credit losses inherent in our loan portfolio as of the balance sheet date. In determining the adequacy of the allowance, we perform periodic evaluations of the loan portfolio and loss forecasting assumptions. At March 31, 2009, our allowance for loan losses was $1.2 billion on $24.3 billion of loans designated as held-for-investment.
Judgments
The estimate of the allowance is based on a variety of factors, including the composition and quality of the portfolio; delinquency levels and trends; current and historical charge-off and loss experience; current industry charge-off and loss experience; the condition of the real estate market and geographic concentrations within the
| (1) | | In the second quarter of 2009, we will adopt FSP No. FAS 115-2 and FAS 124-2 which amends the other-than-temporary impairment guidance in GAAP for debt securities. We expect the adoption of this standard to decrease the impact of impairments on our results of operations in future periods when compared to the impact we believe would have occurred without this new accounting standard. We are currently evaluating the impact of the adoption of FSP No. FAS 115-2 and FAS 124-2 to our financial condition, results of operations and cash flows. |
36
loan portfolio; the interest rate climate; the overall availability of housing credit; and general economic conditions. The allowance for loan losses is typically equal to management’s estimate of loan charge-offs in the twelve months following the balance sheet date. Determining the adequacy of the allowance is complex and requires judgment by management about the effect of matters that are inherently uncertain. We evaluate the adequacy of the allowance for loan losses by loan type: one- to four-family, home equity and consumer and other loan portfolios.
For loans that are not specifically identified for impairment under Statement of Financial Accounting Standards (“SFAS”) No. 114,Accounting by Creditors for Impairment of a Loan-an amendment of FASB Statements No. 5 and 15 (“SFAS No. 114”), which includes TDRs, our allowance is assessed in accordance with SFAS No. 5,Accounting for Contingencies (“SFAS No. 5”). Our one- to four-family and home equity loan portfolios are separated into risk segments based on key risk factors, which include but are not limited to channel of loan origination, documentation type, loan product type and LTV ratio. Based upon the segmentation, probable losses are determined with expected loss rates in each segment. The additional protection provided by mortgage insurance and the credit default swap has been factored into the expected loss on defaulted mortgage loans. The expected recovery from the liquidation of foreclosed real estate and expected recoveries from loan sellers related to contractual guarantees are also factored into the expected loss on defaulted mortgage loans. Our one- to four-family and home equity loan portfolios represented 52% and 39%, respectively, of the total gross loan portfolio as of March 31, 2009.
For the consumer and other loan portfolio, management establishes loss estimates for each consumer portfolio based on credit characteristics and observation of the existing markets. The expected recoveries from the sale of repossessed collateral are factored into the expected loss on defaulted consumer loans based on current liquidation experience. Our consumer and other loan portfolio represented 9% of the total gross loan portfolio as of March 31, 2009.
In addition to the SFAS No. 5 allowance, we also establish a specific allowance for any modified loans that are involved in a TDR in accordance with SFAS No. 114. Under SFAS No. 114, we measure the impairment of a loan using a discounted cash flow analysis and a specific allowance is established to the extent that the investment recorded exceeds the discounted cash flows of a TDR.
Subsequent evaluations of the loan portfolio, in light of the factors then prevailing, may result in significant changes in the allowance for loan losses in future periods.
Effects if Actual Results Differ
The crisis in the residential real estate and credit markets has substantially increased the complexity and uncertainty involved in estimating the losses inherent in our loan portfolio. If our underlying assumptions and judgments prove to be inaccurate, the allowance for loan losses could be insufficient to cover actual losses. These losses would result in a decrease in our net income as well as a decrease in the level of regulatory capital at E*TRADE Bank.
37
GLOSSARY OF TERMS
Active Trader—The customer segment that includes those who execute 30 or more trades per quarter.
Adjusted total assets—Bank-only assets composed of total assets plus/(less) unrealized losses (gains) on available-for-sale securities, less deferred tax assets, goodwill and certain other intangible assets.
Average commission per trade—Total trading and investing segment commission revenue divided by total number of trades.
Average equity to average total assets—Average total shareholders’ equity divided by average total assets.
Bank—ETB Holdings, Inc. (“ETBH”), the entity that is our bank holding company and parent to E*TRADE Bank.
Basis point—One one-hundredth of a percentage point.
Cash flow hedge—A financial derivative instrument designated in a hedging relationship that mitigates exposure to variability in expected future cash flows attributable to a particular risk.
Charge-off—The result of removing a loan or portion of a loan from an entity’s balance sheet because the loan is considered to be uncollectible.
Citadel Investment—On November 29, 2007, we entered into an agreement to receive a $2.5 billion cash infusion from Citadel. In consideration for the cash infusion, Citadel received three primary items: substantially all of our asset-backed securities portfolio, 84.7 million shares of common stock in the Company and approximately $1.8 billion 12 1/2% springing lien notes.
Contract for difference—A derivative based on an underlying stock or index that covers the difference between the nominal value at the opening of a trade and at the close of a trade. A contract for difference is researched and traded in the same manner as a stock.
Corporate cash—Cash held at the parent company as well as cash held in certain subsidiaries that can distribute cash to the parent company without any regulatory approval.
Corporate investments—Primarily equity investments held at the parent company level that are not related to the ongoing business of the Company’s operating subsidiaries.
Customer assets—Market value of all customer assets held by the Company including security holdings, customer cash and deposits and vested unexercised options.
Customer cash and deposits—Customer cash, deposits, customer payables and money market balances, including those held by third parties.
Daily average revenue trades (“DARTs”)—Total revenue trades in a period divided by the number of trading days during that period.
Derivative—A financial instrument or other contract, the price of which is directly dependent upon the value of one or more underlying securities, interest rates or any agreed upon pricing index. Derivatives cover a wide assortment of financial contracts, including forward contracts, options and swaps.
Enterprise interest-bearing liabilities—Liabilities such as customer deposits, repurchase agreements, other borrowings and advances from the FHLB, certain customer credit balances and stock loan programs on which the Company pays interest; excludes customer money market balances held by third parties.
38
Enterprise interest-earning assets—Consists of the primary interest-earning assets of the Company and includes: loans, net, margin receivables, available-for-sale mortgage-backed and investment securities, trading securities, stock borrow balances and cash required to be segregated under regulatory guidelines that earn interest for the Company.
Enterprise net interest income—The taxable equivalent basis net operating interest income excluding corporate interest income and corporate interest expense and interest earned on customer cash held by third parties.
Enterprise net interest spread—The taxable equivalent rate earned on average enterprise interest-earning assets less the rate paid on average enterprise interest-bearing liabilities, excluding corporate interest-earning assets and liabilities and cash held by third parties.
Exchange-traded funds—A fund that invests in a group of securities and trades like an individual stock on an exchange.
Fair value—The price that would be received to sell an asset or paid to transfer a liability in an orderly transaction between market participants at the measurement date.
Fair value hedge—A financial derivative instrument designated in a hedging relationship that mitigates exposure to changes in the fair value of a recognized asset or liability or a firm commitment.
Generally Accepted Accounting Principles (“GAAP”)—Accounting principles generally accepted in the United States of America.
Interest rate cap—An options contract that puts an upper limit on a floating exchange rate. The writer of the cap has to pay the holder of the cap the difference between the floating rate and the upper limit when that upper limit is breached. There is usually a premium paid by the buyer of such a contract.
Interest rate floor—An options contract that puts a lower limit on a floating exchange rate. The writer of the floor has to pay the holder of the floor the difference between the floating rate and the lower limit when that lower limit is breached. There is usually a premium paid by the buyer of such a contract.
Interest rate swaps—Contracts that are entered into primarily as an asset/liability management strategy to reduce interest rate risk. Interest rate swap contracts are exchanges of interest rate payments, such as fixed-rate payments for floating-rate payments, based on notional principal amounts.
Main Street Investor—The customer segment that includes those who execute less than 30 trades per quarter and hold less than $50,000 in assets in combined accounts.
Margin debt—The extension of credit to brokerage customers of the Company, on and off balance sheet, where the loan is secured with securities owned by the customer.
Mass Affluent—The customer segment that includes those who hold $50,000 or more in assets in combined accounts.
Net New Customer Asset Flows—The total inflows to all new and existing customer accounts less total outflows from all closed and existing customer accounts, excluding the effects of market movements in the value of customer assets.
Net Present Value of Equity (“NPVE”)—The present value of expected cash inflows from existing assets, minus the present value of expected cash outflows from existing liabilities, plus the expected cash inflows and outflows from existing derivatives and forward commitments. This calculation is performed for E*TRADE Bank.
39
Nonperforming assets—Assets that do not earn income, including those originally acquired to earn income (delinquent loans) and those not intended to earn income (REO). Loans are classified as nonperforming when full and timely collection of interest and principal becomes uncertain or when the loans are 90 days past due.
Notional amount—The specified dollar amount underlying a derivative on which the calculated payments are based.
Operating margin—Loss before other income (expense), income tax benefit and discontinued operations.
Operating margin (%)—Percentage of net revenue that goes to loss before other income (expense), income tax benefit and discontinued operations. It is calculated by dividing our loss before other income (expense), income tax benefit and discontinued operations by our total net revenue.
Option adjustable-rate mortgage (“ARM”) loan—An adjustable-rate mortgage loan that provides the borrower with the option to make a fully-amortizing, interest-only, or minimum payment each month. The minimum payment on an Option ARM loan is usually based on the interest rate charged during the introductory period. This introductory rate is usually significantly below the fully-indexed rate for loans with short duration introductory periods.
Options—Contracts that grant the purchaser, for a premium payment, the right, but not the obligation, to either purchase or sell the associated financial instrument at a set price during a period or at a specified date in the future.
Organic—Business related to new and existing customers as opposed to acquisitions.
Principal transactions—Transactions that primarily consist of revenue from market-making activities.
Real estate owned (“REO”) and other repossessed assets—Ownership of real property by the Company, generally acquired as a result of foreclosure or repossession.
Repurchase agreement—An agreement giving the seller of an asset the right or obligation to buy back the same or similar securities at a specified price on a given date. These agreements are generally collateralized by mortgage-backed or investment-grade securities.
Retail deposits—Balances of customer cash held at the Bank; excludes brokered certificates of deposit.
Return on average total assets—Annualized net income divided by average assets.
Return on average total shareholders’ equity—Annualized net income divided by average shareholders’ equity.
Risk-weighted assets—Primarily computed by the assignment of specific risk-weightings assigned by the OTS to assets and off-balance sheet instruments for capital adequacy calculations. This calculation is for E*TRADE Bank only.
Swaptions—Options to enter swaps starting on a given day.
Sweep deposit accounts—Accounts with the functionality to transfer brokerage cash balances to and from a Federal Deposit Insurance Corporation (“FDIC”)-insured money market account at the Bank.
40
Taxable equivalent interest adjustment—The operating interest income earned on certain assets is completely or partially exempt from federal and/or state income tax. As such, these tax-exempt instruments typically yield lower returns than a taxable investment. To provide more meaningful comparison of yields and margins for all interest-earning assets, the interest income earned on tax exempt assets is increased to make it fully equivalent to interest income on other taxable investments. This adjustment is done for the analytic purposes in the net enterprise interest income/spread calculation and is not made on the consolidated statement loss, as that is not permitted under GAAP.
Tier 1 Capital—Adjusted equity capital used in the calculation of capital adequacy ratios at E*TRADE Bank as required by the OTS. Tier 1 capital equals: total shareholder’s equity at E*TRADE Bank, plus/(less) unrealized losses (gains) on available-for-sale securities and cash flow hedges, less deferred tax assets, goodwill and certain other intangible assets.
Troubled Debt Restructuring (“TDR”)—A loan modification that involves granting a significant economic concession to a borrower who is experiencing financial difficulty.
41
| ITEM 3. | QUANTITATIVE AND QUALITATIVE DISCLOSURES ABOUT MARKET RISK |
The following discussion about our market risk disclosure includes forward-looking statements. Actual results could differ materially from those projected in the forward-looking statements as a result of certain factors, including, but not limited to, those set forth in Item 1A. “Risk Factors” in our Annual Report on Form 10-K for the year ended December 31, 2008 and as updated in this report. Market risk is our exposure to changes in interest rates, foreign exchange rates and equity and commodity prices. Our exposure to interest rate risk is related primarily to interest-earning assets and interest-bearing liabilities.
Interest Rate Risk
The management of interest rate risk is essential to profitability. Interest rate risk is our exposure to changes in interest rates. In general, we manage our interest rate risk by balancing variable-rate and fixed-rate assets and liabilities and we utilize derivatives in a way that reduces our overall exposure to changes in interest rates. In recent years, we have managed our interest rate risk to achieve a minimum to moderate risk profile with limited exposure to earnings volatility resulting from interest rate fluctuations. Exposure to interest rate risk requires management to make complex assumptions regarding maturities, market interest rates and customer behavior. Changes in interest rates, including the following, could impact interest income and expense:
| | • | | Interest-earning assets and interest-bearing liabilities may re-price at different times or by different amounts creating a mismatch. |
| | • | | The yield curve may flatten or change shape affecting the spread between short- and long-term rates. Widening or narrowing spreads could impact net interest income. |
| | • | | Market interest rates may influence prepayments resulting in maturity mismatches. In addition, prepayments could impact yields as premium and discounts amortize. |
Exposure to market risk is dependent upon the distribution and composition of interest-earning assets, interest-bearing liabilities and derivatives. The differing risk characteristics of each product are managed to mitigate our exposure to interest rate fluctuations. At March 31, 2009, 93% of our total assets were enterprise interest-earning assets.
At March 31, 2009, approximately 69% of our total assets were residential real estate loans and available-for-sale mortgage-backed securities. The values of these assets are sensitive to changes in interest rates, as well as expected prepayment levels. As interest rates increase, fixed rate residential mortgages and mortgage-backed securities tend to exhibit lower prepayments. The inverse is true in a falling rate environment.
When real estate loans prepay, unamortized premiums are written off. Depending on the timing of the prepayment, the write-offs of unamortized premiums may result in lower than anticipated yields. E*TRADE Bank’s Asset Liability Committee (“ALCO”) reviews estimates of the impact of changing market rates on prepayments. This information is incorporated into our interest rate risk management strategy.
Our liability structure consists of two central sources of funding: deposits and wholesale borrowings. Cash provided to us through deposits is the primary source of our funding. Our key deposit products include sweep accounts, money market and savings accounts and certificates of deposit. Our wholesale borrowings include securities sold under agreements to repurchase and other borrowings. Customer payables, which represents customer cash contained within our broker-dealers, is an additional source of funding. In addition, the parent company has issued a significant amount of corporate debt.
Our deposit accounts and customer payables tend to be less rate-sensitive than wholesale borrowings. Agreements to repurchase securities re-price as interest rates change. Sweep, money market and savings accounts re-price at management’s discretion. Certificates of deposit re-price over time depending on maturities. FHLB advances and corporate debt generally have fixed rates.
42
Derivative Financial Instruments
We use derivative financial instruments to help manage our interest rate risk. Interest rate swaps involve the exchange of fixed-rate and variable-rate interest payments between two parties based on a contractual underlying notional amount, but do not involve the exchange of the underlying notional amounts. Option products are utilized primarily to decrease the market value changes resulting from the prepayment dynamics of the mortgage portfolio, as well as to protect against increases in funding costs. The types of options employed include Cap Options (“Caps”) and Floor Options (“Floors”), “Payor Swaptions” and “Receiver Swaptions.” Caps mitigate the market risk associated with increases in interest rates while Floors mitigate the risk associated with decreases in market interest rates. Similarly, Payor and Receiver Swaptions mitigate the market risk associated with the respective increases and decreases in interest rates. See derivative financial instruments discussion at Note 6—Accounting for Derivative Financial Instruments and Hedging Activities in Item 1. Consolidated Financial Statements.
Scenario Analysis
Scenario analysis is an advanced approach to estimating interest rate risk exposure. Under the NPVE approach, the present value of all existing assets, liabilities, derivatives and forward commitments are estimated and then combined to produce a NPVE figure. The sensitivity of this value to changes in interest rates is then determined by applying alternative interest rate scenarios, which include, but are not limited to, instantaneous parallel shifts up 100, 200 and 300 basis points and down 100 and 200 basis points. The NPVE method is used at the E*TRADE Bank level and not for the Company.
E*TRADE Bank has 98% of our enterprise interest-earning assets at both March 31, 2009 and December 31, 2008, and holds 98% of our enterprise interest-bearing liabilities at both March 31, 2009 and December 31, 2008. The sensitivity of NPVE at March 31, 2009 and December 31, 2008 and the limits established by E*TRADE Bank’s Board of Directors are listed below (dollars in thousands):
| | | | | | | | | | | | | | | | | |
| | | Change in NPVE | | | Board Limit | |
Parallel Change in Interest Rates (basis points) | | March 31, 2009 | | | December 31, 2008 | | |
| | Amount | | | Percentage | | | Amount | | | Percentage | | |
| +300 | | $ | (336,542 | ) | | (15 | )% | | $ | (65,600 | ) | | (3 | )% | | (55 | )% |
| +200 | | $ | (67,816 | ) | | (3 | )% | | $ | 68,853 | | | 3 | % | | (30 | )% |
| +100 | | $ | 63,968 | | | 3 | % | | $ | 119,407 | | | 5 | % | | (20 | )% |
| -100 | | $ | (277,789 | ) | | (12 | )% | | $ | (334,132 | ) | | (14 | )% | | (20 | )% |
| -200(1) | | $ | — | | | — | % | | $ | — | | | — | % | | (30 | )% |
(1) | | On March 31, 2009, the yield on the three-month Treasury bill was 0.21%. As a result, the OTS temporarily modified the requirements of the NPV Model, resulting in removal of the minus 200 basis points scenario for the periods ended March 31, 2009 and December 31, 2008. |
Under criteria published by the OTS, E*TRADE Bank’s overall interest rate risk exposure at March 31, 2009 was characterized as “minimum.” We actively manage our interest rate risk positions. As interest rates change, we will re-adjust our strategy and mix of assets, liabilities and derivatives to optimize our position. For example, a 100 basis points increase in rates may not result in a change in value as indicated above. The ALCO monitors E*TRADE Bank’s interest rate risk position.
43
Other Market Risk
Equity Security Risk
Equity securities risk is the risk of potential loss from investing in public and private equity securities including foreign currency exchange risk. We hold equity securities for corporate investment purposes and in trading securities for market-making purposes. The foreign currency exchange risk associated with these investments is not material to the Company. For corporate investment purposes, we currently hold publicly traded equity securities, in which we had an estimated fair value of $0.5 million as of March 31, 2009. See the corporate investments line item in the publicly traded equity securities discussion at Note 4—Available-for-Sale Mortgage-Backed and Investment Securities in Item 1. Consolidated Financial Statements.
44
PART I—FINANCIAL INFORMATION
| ITEM 1. | CONSOLIDATED FINANCIAL STATEMENTS (UNAUDITED) |
E*TRADE FINANCIAL CORPORATION AND SUBSIDIARIES
CONSOLIDATED STATEMENT OF LOSS
(In thousands, except per share amounts)
(Unaudited)
| | | | | | | | |
| | | Three Months Ended
March 31, | |
| | | 2009 | | | 2008 | |
Revenue: | | | | | | | | |
Operating interest income | | $ | 486,637 | | | $ | 699,591 | |
Operating interest expense | | | (207,975 | ) | | | (373,220 | ) |
| | | | | | | | |
Net operating interest income | | | 278,662 | | | | 326,371 | |
| | | | | | | | |
Commission | | | 125,626 | | | | 122,255 | |
Fees and service charges | | | 46,715 | | | | 54,941 | |
Principal transactions | | | 17,642 | | | | 20,490 | |
Gain (loss) on loans and securities, net | | | 16,507 | | | | (8,567 | ) |
Other revenue | | | 12,191 | | | | 13,604 | |
| | | | | | | | |
Total non-interest income | | | 218,681 | | | | 202,723 | |
| | | | | | | | |
Total net revenue | | | 497,343 | | | | 529,094 | |
| | | | | | | | |
Provision for loan losses | | | 453,963 | | | | 233,871 | |
| | |
Operating expense: | | | | | | | | |
Compensation and benefits | | | 84,172 | | | | 123,128 | |
Clearing and servicing | | | 42,671 | | | | 44,885 | |
Advertising and market development | | | 43,591 | | | | 57,448 | |
Communications | | | 21,561 | | | | 25,094 | |
Professional services | | | 19,630 | | | | 23,645 | |
Occupancy and equipment | | | 19,541 | | | | 20,498 | |
Depreciation and amortization | | | 20,274 | | | | 21,653 | |
Amortization of other intangibles | | | 7,436 | | | | 10,910 | |
Facility restructuring and other exit activities | | | (112 | ) | | | 10,566 | |
Other | | | 35,220 | | | | 16,506 | |
| | | | | | | | |
Total operating expense | | | 293,984 | | | | 354,333 | |
| | | | | | | | |
Loss before other income (expense), income tax benefit and discontinued operations | | | (250,604 | ) | | | (59,110 | ) |
Other income (expense): | | | | | | | | |
Corporate interest income | | | 424 | | | | 2,426 | |
Corporate interest expense | | | (87,315 | ) | | | (95,241 | ) |
Gain (loss) on sales of investments, net | | | (433 | ) | | | 502 | |
Loss on early extinguishment of debt | | | (2,999 | ) | | | (2,851 | ) |
Equity in income (loss) of investments and venture funds | | | (3,129 | ) | | | 4,699 | |
| | | | | | | | |
Total other income (expense) | | | (93,452 | ) | | | (90,465 | ) |
| | | | | | | | |
Loss before income tax benefit and discontinued operations | | | (344,056 | ) | | | (149,575 | ) |
Income tax benefit | | | (111,371 | ) | | | (56,648 | ) |
| | | | | | | | |
Loss from continuing operations | | | (232,685 | ) | | | (92,927 | ) |
Income from discontinued operations, net of tax | | | — | | | | 1,734 | |
| | | | | | | | |
Net loss | | $ | (232,685 | ) | | $ | (91,193 | ) |
| | | | | | | | |
Basic loss per share from continuing operations | | $ | (0.41 | ) | | $ | (0.20 | ) |
Basic earnings per share from discontinued operations | | | — | | | | 0.00 | |
| | | | | | | | |
Basic net loss per share | | $ | (0.41 | ) | | $ | (0.20 | ) |
| | | | | | | | |
Diluted loss per share from continuing operations | | $ | (0.41 | ) | | $ | (0.20 | ) |
Diluted earnings per share from discontinued operations | | | — | | | | 0.00 | |
| | | | | | | | |
Diluted net loss per share | | $ | (0.41 | ) | | $ | (0.20 | ) |
| | | | | | | | |
Shares used in computation of per share data: | | | | | | | | |
Basic | | | 567,833 | | | | 460,857 | |
Diluted | | | 567,833 | | | | 460,857 | |
See accompanying notes to consolidated financial statements
45
E*TRADE FINANCIAL CORPORATION AND SUBSIDIARIES
CONSOLIDATED BALANCE SHEET
(In thousands, except share amounts)
(Unaudited)
| | | | | | | | |
| | | March 31,
2009 | | | December 31,
2008 | |
| ASSETS | | | | | | | | |
Cash and equivalents | | $ | 4,492,306 | | | $ | 3,853,849 | |
Cash and investments required to be segregated under federal or other regulations | | | 1,900,235 | | | | 1,141,598 | |
Trading securities | | | 46,309 | | | | 55,481 | |
Available-for-sale mortgage-backed and investment securities (includes securities pledged to creditors with the right to sell or repledge of $7,973,459 at March 31, 2009 and $8,398,346 at December 31, 2008) | | | 11,823,392 | | | | 10,806,094 | |
Margin receivables | | | 2,436,611 | | | | 2,791,168 | |
Loans, net (net of allowance for loan losses of $1,200,808 at March 31, 2009 and $1,080,611 at December 31, 2008) | | | 23,271,969 | | | | 24,451,852 | |
Investment in FHLB stock | | | 183,863 | | | | 200,892 | |
Property and equipment, net | | | 321,934 | | | | 319,222 | |
Goodwill | | | 1,952,326 | | | | 1,938,325 | |
Other intangibles, net | | | 378,699 | | | | 386,130 | |
Other assets | | | 2,639,232 | | | | 2,593,604 | |
| | | | | | | | |
Total assets | | $ | 49,446,876 | | | $ | 48,538,215 | |
| | | | | | | | |
| LIABILITIES AND SHAREHOLDERS’ EQUITY | | | | | | | | |
| | |
Liabilities: | | | | | | | | |
Deposits | | $ | 27,641,485 | | | $ | 26,136,246 | |
Securities sold under agreements to repurchase | | | 6,946,160 | | | | 7,381,279 | |
Customer payables | | | 4,181,332 | | | | 3,753,332 | |
Other borrowings | | | 4,083,033 | | | | 4,353,777 | |
Corporate debt | | | 2,752,673 | | | | 2,750,532 | |
Accounts payable, accrued and other liabilities | | | 1,384,042 | | | | 1,571,553 | |
| | | | | | | | |
Total liabilities | | | 46,988,725 | | | | 45,946,719 | |
| | | | | | | | |
Commitments and contingencies (see Note 12) | | | | | | | | |
| | |
Shareholders’ equity: | | | | | | | | |
Common stock, $0.01 par value, shares authorized: 1,200,000,000; shares issued and outstanding: 572,051,743 at March 31, 2009 and 563,523,086 at December 31, 2008 | | | 5,721 | | | | 5,635 | |
Additional paid-in capital (“APIC”) | | | 4,084,643 | | | | 4,064,282 | |
Accumulated deficit | | | (1,078,452 | ) | | | (845,767 | ) |
Accumulated other comprehensive loss | | | (553,761 | ) | | | (632,654 | ) |
| | | | | | | | |
Total shareholders’ equity | | | 2,458,151 | | | | 2,591,496 | |
| | | | | | | | |
Total liabilities and shareholders’ equity | | $ | 49,446,876 | | | $ | 48,538,215 | |
| | | | | | | | |
See accompanying notes to consolidated financial statements
46
E*TRADE FINANCIAL CORPORATION AND SUBSIDIARIES
CONSOLIDATED STATEMENT OF COMPREHENSIVE LOSS
(In thousands)
(Unaudited)
| | | | | | | | |
| | | Three Months Ended
March 31, | |
| | | 2009 | | | 2008 | |
Net loss | | $ | (232,685 | ) | | $ | (91,193 | ) |
Other comprehensive loss | | | | | | | | |
Available-for-sale securities: | | | | | | | | |
Unrealized gains, net(1) | | | 51,834 | | | | 1,761 | |
Reclassification into earnings, net(2) | | | (11,627 | ) | | | 8,058 | |
| | | | | | | | |
Net change from available-for-sale securities | | | 40,207 | | | | 9,819 | |
| | | | | | | | |
Cash flow hedging instruments: | | | | | | | | |
Unrealized gains (losses), net(3) | | | 35,382 | | | | (78,157 | ) |
Reclassification into earnings, net(4) | | | 6,817 | | | | 2,393 | |
| | | | | | | | |
Net change from cash flow hedging instruments | | | 42,199 | | | | (75,764 | ) |
| | | | | | | | |
Foreign currency translation losses | | | (3,513 | ) | | | (950 | ) |
| | | | | | | | |
Other comprehensive income (loss) | | | 78,893 | | | | (66,895 | ) |
| | | | | | | | |
Comprehensive loss | | $ | (153,792 | ) | | $ | (158,088 | ) |
| | | | | | | | |
(1) | | Amounts are net of provision for income taxes of $33.5 million and $4.9 million for the three months ended March 31, 2009 and 2008, respectively. |
(2) | | Amounts are net of provision for income taxes of $7.1 million for the three months ended March 31, 2009 and benefit from income taxes of $4.8 million for the three months ended March 31, 2008. |
(3) | | Amounts are net of provision for income taxes of $21.3 million for the three months ended March 31, 2009 and benefit from income taxes of $46.4 million for the three months ended March 31, 2008. |
(4) | | Amounts are net of benefit from income taxes of $4.0 million and $1.4 million for the three months ended March 31, 2009 and 2008, respectively. |
See accompanying notes to consolidated financial statements
47
E*TRADE FINANCIAL CORPORATION AND SUBSIDIARIES
CONSOLIDATED STATEMENT OF SHAREHOLDERS’ EQUITY
(In thousands)
(Unaudited)
| | | | | | | | | | | | | | | | | | | | | | | |
| | | Common Stock | | | Additional
Paid-in
Capital | | | Accumulated
Deficit | | | Accumulated
Other
Comprehensive
Loss | | | Total
Shareholders’
Equity | |
| | | Shares | | | Amount | | | | | |
Balance, December 31, 2008 | | 563,523 | | | $ | 5,635 | | | $ | 4,064,282 | | | $ | (845,767 | ) | | $ | (632,654 | ) | | $ | 2,591,496 | |
Net loss | | — | | | | — | | | | — | | | | (232,685 | ) | | | — | | | | (232,685 | ) |
Other comprehensive income | | — | | | | — | | | | — | | | | — | | | | 78,893 | | | | 78,893 | |
SFAS No. 123(R) related tax effects | | — | | | | — | | | | (2,456 | ) | | | — | | | | — | | | | (2,456 | ) |
Issuance of restricted stock | | 935 | | | | 9 | | | | (9 | ) | | | — | | | | — | | | | — | |
Cancellation of restricted stock | | (7 | ) | | | — | | | | — | | | | — | | | | — | | | | — | |
Retirement of restricted stock to pay taxes | | (259 | ) | | | (3 | ) | | | (285 | ) | | | — | | | | — | | | | (288 | ) |
Amortization of deferred share-based compensation to APIC under SFAS No. 123(R) | | — | | | | — | | | | 10,839 | | | | — | | | | — | | | | 10,839 | |
Additional purchase consideration(1) | | 7,860 | | | | 79 | | | | 8,921 | | | | — | | | | — | | | | 9,000 | |
Other | | — | | | | 1 | | | | 3,351 | | | | — | | | | — | | | | 3,352 | |
| | | | | | | | | | | | | | | | | | | | | | | |
Balance, March 31, 2009 | | 572,052 | | | $ | 5,721 | | | $ | 4,084,643 | | | $ | (1,078,452 | ) | | $ | (553,761 | ) | | $ | 2,458,151 | |
| | | | | | | | | | | | | | | | | | | | | | | |
| | | | | |
| | | Common Stock | | | Additional
Paid-in
Capital | | | Accumulated
Deficit | | | Accumulated
Other
Comprehensive
Loss | | | Total
Shareholders’
Equity | |
| | | Shares | | | Amount | | | | | |
Balance, December 31, 2007 | | 460,898 | | | $ | 4,609 | | | $ | 3,463,220 | | | $ | (247,368 | ) | | $ | (391,396 | ) | | $ | 2,829,065 | |
Cumulative effect of adoption of SFAS No. 156 | | — | | | | — | | | | — | | | | 285 | | | | — | | | | 285 | |
Cumulative effect of adoption of SFAS No. 159 | | — | | | | — | | | | — | | | | (86,894 | ) | | | 86,894 | | | | — | |
| | | | | | | | | | | | | | | | | | | | | | | |
Adjusted balance | | 460,898 | | | | 4,609 | | | | 3,463,220 | | | | (333,977 | ) | | | (304,502 | ) | | | 2,829,350 | |
Net loss | | — | | | | — | | | | — | | | | (91,193 | ) | | | — | | | | (91,193 | ) |
Other comprehensive loss | | — | | | | — | | | | — | | | | — | | | | (66,895 | ) | | | (66,895 | ) |
Exchange of debt for common stock | | 4,500 | | | | 45 | | | | 17,640 | | | | — | | | | — | | | | 17,685 | |
Exercise of stock options and purchase plans and related tax effects | | 272 | | | | 3 | | | | (1,306 | ) | | | — | | | | — | | | | (1,303 | ) |
Issuance of restricted stock | | 8 | | | | — | | | | — | | | | — | | | | — | | | | — | |
Cancellation of restricted stock | | (14 | ) | | | — | | | | — | | | | — | | | | — | | | | — | |
Retirement of restricted stock to pay taxes | | (77 | ) | | | (1 | ) | | | (415 | ) | | | — | | | | — | | | | (416 | ) |
Amortization of deferred share-based compensation to APIC under SFAS No. 123(R) | | — | | | | — | | | | 13,989 | | | | — | | | | — | | | | 13,989 | |
Additional purchase consideration(1) | | 2,749 | | | | 27 | | | | 9,405 | | | | — | | | | — | | | | 9,432 | |
Other | | — | | | | — | | | | 4,690 | | | | — | | | | — | | | | 4,690 | |
| | | | | | | | | | | | | | | | | | | | | | | |
Balance, March 31, 2008 | | 468,336 | | | $ | 4,683 | | | $ | 3,507,223 | | | $ | (425,170 | ) | | $ | (371,397 | ) | | $ | 2,715,339 | |
| | | | | | | | | | | | | | | | | | | | | | | |
(1) | | Amounts represent additional contingent consideration paid in connection with prior acquisitions. |
See accompanying notes to consolidated financial statements
48
E*TRADE FINANCIAL CORPORATION AND SUBSIDIARIES
CONSOLIDATED STATEMENT OF CASH FLOWS
(In thousands)
(Unaudited)
| | | | | | | | |
| | | Three Months Ended
March 31, | |
| | | 2009 | | | 2008 | |
Cash flows from operating activities: | | | | | | | | |
Net loss | | $ | (232,685 | ) | | $ | (91,193 | ) |
Adjustments to reconcile net loss to net cash provided by (used in) operating activities: | | | | | | | | |
Provision for loan losses | | | 453,963 | | | | 233,871 | |
Depreciation and amortization (including discount amortization and accretion) | | | 82,827 | | | | 77,649 | |
(Gain) loss on loans and securities, net and (gain) loss on sales of investments, net | | | (16,074 | ) | | | 8,643 | |
Equity in (income) loss of investments and venture funds | | | 3,129 | | | | (4,699 | ) |
Gain on sale of corporate aircraft related assets | | | — | | | | (23,715 | ) |
Loss on early extinguishment of debt | | | 2,999 | | | | 2,851 | |
Non-cash facility restructuring costs and other exit activities | | | (86 | ) | | | 3,041 | |
Share-based compensation | | | 10,839 | | | | 13,989 | |
Deferred taxes | | | (112,100 | ) | | | (55,985 | ) |
Other | | | (3,374 | ) | | | (4,349 | ) |
Net effect of changes in assets and liabilities: | | | | | | | | |
Increase in cash and investments required to be segregated under federal or other regulations | | | (759,782 | ) | | | (101,419 | ) |
Decrease in margin receivables | | | 345,652 | | | | 534,831 | |
Increase (decrease) in customer payables | | | 428,609 | | | | (68,725 | ) |
Proceeds from sales, repayments and maturities of loans held-for-sale | | | — | | | | 165,529 | |
Purchases and originations of loans held-for-sale | | | — | | | | (85,754 | ) |
Proceeds from sales, repayments and maturities of trading securities | | | 678,649 | | | | 695,676 | |
Purchases of trading securities | | | (671,397 | ) | | | (621,058 | ) |
(Increase) decrease in other assets | | | (13,082 | ) | | | 255,511 | |
Increase (decrease) in accounts payable, accrued and other liabilities | | | 79,389 | | | | (1,234,456 | ) |
Decrease in facility restructuring liabilities | | | (3,270 | ) | | | (3,894 | ) |
| | | | | | | | |
Net cash provided by (used in) operating activities | | | 274,206 | | | | (303,656 | ) |
| | | | | | | | |
Cash flows from investing activities: | | | | | | | | |
Purchases of available-for-sale mortgage-backed and investment securities | | | (5,281,856 | ) | | | (1,070,770 | ) |
Proceeds from sales, maturities of and principal payments on available-for-sale mortgage-backed and investment securities | | | 4,341,212 | | | | 3,994,007 | |
Net decrease in loans receivable | | | 697,066 | | | | 1,002,421 | |
Purchases of property and equipment | | | (23,168 | ) | | | (25,226 | ) |
Proceeds from sale of corporate aircraft related assets | | | — | | | | 69,250 | |
Cash used in business acquisitions, net(1) | | | (5,000 | ) | | | (7,883 | ) |
Net cash flow from derivatives hedging assets | | | 9 | | | | (37,116 | ) |
Proceeds from sale of REO and repossessed assets | | | 36,127 | | | | 12,519 | |
Other | | | — | | | | 609 | |
| | | | | | | | |
Net cash (used in) provided by investing activities | | $ | (235,610 | ) | | $ | 3,937,811 | |
| | | | | | | | |
(1) | | Amounts represent additional contingent consideration paid in connection with prior acquisitions. |
See accompanying notes to consolidated financial statements
49
E*TRADE FINANCIAL CORPORATION AND SUBSIDIARIES
CONSOLIDATED STATEMENT OF CASH FLOWS—(Continued)
(In thousands)
(Unaudited)
| | | | | | | | |
| | | Three Months Ended
March 31, | |
| | | 2009 | | | 2008 | |
Cash flows from financing activities: | | | | | | | | |
Net increase in deposits | | $ | 1,504,836 | | | $ | 1,579,545 | |
Net decrease in securities sold under agreements to repurchase | | | (422,242 | ) | | | (1,803,041 | ) |
Net increase (decrease) in other borrowed funds | | | 27,812 | | | | (4,400 | ) |
Advances from other long-term borrowings | | | 850,000 | | | | 600,000 | |
Payments on advances from other long-term borrowings | | | (1,250,000 | ) | | | (2,810,694 | ) |
Proceeds from issuance of springing lien notes | | | — | | | | 150,000 | |
Proceeds from issuance of common stock from employee stock transactions | | | — | | | | 1,279 | |
Net cash flow from derivatives hedging liabilities | | | (95,522 | ) | | | (57,834 | ) |
Other | | | (2,999 | ) | | | 4,458 | |
| | | | | | | | |
Net cash provided by (used in) financing activities | | | 611,885 | | | | (2,340,687 | ) |
| | | | | | | | |
Effect of exchange rates on cash | | | (12,024 | ) | | | (9,725 | ) |
| | | | | | | | |
Increase in cash and equivalents | | | 638,457 | | | | 1,283,743 | |
Cash and equivalents, beginning of period | | | 3,853,849 | | | | 1,778,244 | |
| | | | | | | | |
Cash and equivalents, end of period | | $ | 4,492,306 | | | $ | 3,061,987 | |
| | | | | | | | |
| | |
Supplemental disclosures: | | | | | | | | |
Cash paid for interest | | $ | 220,448 | | | $ | 432,698 | |
Cash paid (refund received) for income taxes | | $ | 2,662 | | | $ | (105,674 | ) |
Non-cash investing and financing activities: | | | | | | | | |
Transfers from loans to other real estate owned and repossessed assets | | $ | 43,095 | | | $ | 58,735 | |
Issuance of common stock upon acquisition(1) | | $ | 9,000 | | | $ | 9,432 | |
Issuance of common stock to retire debentures | | $ | — | | | $ | 17,685 | |
Reclassification of loans held-for-sale to loans held-for-investment | | $ | — | | | $ | 1,630 | |
(1) | | Amounts represent additional contingent consideration paid in connection with prior acquisitions. |
See accompanying notes to consolidated financial statements
50
E*TRADE FINANCIAL CORPORATION AND SUBSIDIARIES
NOTES TO CONSOLIDATED FINANCIAL STATEMENTS (UNAUDITED)
NOTE 1—ORGANIZATION, BASIS OF PRESENTATION AND SUMMARY OF SIGNIFICANT ACCOUNTING POLICIES
Organization—E*TRADE Financial Corporation is a financial services company that provides online brokerage and related products and services primarily to individual investors under the brand “E*TRADE Financial.” Our products and services include investor-focused banking, primarily sweep deposits and savings products and asset gathering.
Basis of Presentation—The consolidated financial statements include the accounts of the Company and its majority-owned subsidiaries. Entities in which the Company holds at least a 20% ownership or in which there are other indicators of significant influence are generally accounted for by the equity method. Entities in which the Company holds less than 20% ownership and does not have the ability to exercise significant influence are generally carried at cost. Intercompany accounts and transactions are eliminated in consolidation. The Company evaluates investments including joint ventures, low income housing tax credit partnerships and other limited partnerships to determine if the Company is required to consolidate the entities under the guidance of FASB Interpretation No. 46 revised,Consolidation of Variable Interest Entities-an interpretation of ARB No. 51.
Certain prior period items in these consolidated financial statements have been reclassified to conform to the current period presentation. The operations of certain businesses have been accounted for as discontinued operations in accordance with SFAS No. 144,Accounting for the Impairment or Disposal of Long-Lived Assets. Accordingly, results of operations from prior periods have been reclassified to discontinued operations. Unless noted, discussions herein pertain to the Company’s continuing operations. These consolidated financial statements reflect all adjustments, which are all normal and recurring in nature, necessary to present fairly the financial position, results of operations and cash flows for the periods presented, and should be read in conjunction with the consolidated financial statements of E*TRADE Financial Corporation included in the Company’s Annual Report on Form 10-K for the year ended December 31, 2008.
The Company reports corporate interest income and corporate interest expense separately from operating interest income and operating interest expense. The Company believes reporting these two items separately provides a clearer picture of the financial performance of the Company’s operations than would a presentation that combined these two items. Operating interest income and operating interest expense is generated from the operations of the Company. Corporate debt, which is the primary source of the corporate interest expense, has been issued primarily in connection with the Citadel Investment and past acquisitions, such as Harrisdirect and BrownCo.
Similarly, the Company reports gain (loss) on sales of investments, net separately from gain (loss) on loans and securities, net. The Company believes reporting these two items separately provides a clearer picture of the financial performance of its operations than would a presentation that combined these two items. Gain (loss) on loans and securities, net is the result of activities in the Company’s operations, namely its balance sheet management segment, including impairment on its available-for-sale mortgage-backed and investment securities portfolio. Gain (loss) on sales of investments, net relates to historical equity investments of the Company at the corporate level and are not related to the ongoing business of the Company’s operating subsidiaries.
Use of Estimates—The consolidated financial statements were prepared in accordance with GAAP, which require management to make estimates and assumptions that affect the amounts reported in the consolidated financial statements and related notes for the periods presented. Actual results could differ from management’s estimates. Material estimates in which management believes near-term changes could reasonably occur include allowance for loan losses; fair value measurements; classification and valuation of certain investments; accounting for financial derivatives; estimates of effective tax rates, deferred taxes and valuation allowances; valuation of goodwill and other intangibles; and valuation and expensing of share-based payments.
51
Financial Statement Descriptions and Related Accounting Policies—Financial statement descriptions and related accounting policies are more fully described in Item 8. Financial Statements and Supplementary Data in the Company’s Annual Report on Form 10-K for the year ended December 31, 2008. Below are descriptions and accounting policies for certain of the Company’s financial statement categories as updated in this report.
Margin Receivables—At March 31, 2009, the fair value of securities that the Company received as collateral in connection with margin receivables and stock borrowing activities, where the Company is permitted to sell or re-pledge the securities, was approximately $3.4 billion. Of this amount, $1.0 billion had been pledged or sold at March 31, 2009 in connection with securities loans, bank borrowings and deposits with clearing organizations.
Loans, Net—Loans, net consists of real estate and consumer loans that management has the intent and ability to hold for the foreseeable future or until maturity, also known as loans held for investment. Loans that are held for investment are carried at amortized cost adjusted for charge-offs, net, allowance for loan losses, deferred fees or costs on originated loans and unamortized premiums or discounts on purchased loans. Loan fees and certain direct loan origination costs are deferred and the net fee or cost is recognized in operating interest income using the interest method over the contractual life of the loans. Premiums and discounts on purchased loans are amortized or accreted into income using the interest method over the remaining period to contractual maturity and adjusted for actual prepayments. Modified loans in which a significant economic concession was granted to a borrower experiencing financial difficulty are considered TDRs in accordance with SFAS No. 15,Accounting by Debtors and Creditors for Troubled Debt Restructurings.
The Company classifies loans as nonperforming when full and timely collection of interest or principal becomes uncertain or when they are 90 days past due. TDRs are accounted for as nonaccrual loans at the time of modification and return to accrual status after six consecutive payments are made. Interest previously accrued, but not collected, is reversed against current income when a loan is placed on nonaccrual status and is considered nonperforming. Accretion of deferred fees is discontinued for nonperforming loans. Payments received on nonperforming loans are recognized as interest income when the loan is considered collectible and applied to principal when it is doubtful that full payment will be collected.
The Company’s charge-off policy for both one- to four-family and home equity loans is to assess the value of the property when the loans has been delinquent for 180 days or it is in bankruptcy, regardless of whether or not the property is in foreclosure, and charge-off the amount of the loan balance in excess of the estimated current property value. Credit cards are charged-off when collection is not probable or the loan has been delinquent for 180 days. Consumer loans are charged-off when the loan has been delinquent for 120 days or when it is determined that collection is not probable.
Allowance for Loan Losses—The allowance for loan losses is management’s estimate of credit losses inherent in the Company’s loan portfolio as of the balance sheet date.
For loans that are not specifically identified for impairment under SFAS No. 114, the allowance is assessed in accordance with SFAS No. 5. The estimate of the allowance for loan losses is based on a variety of factors, including the composition and quality of the portfolio; delinquency levels and trends; current and historical charge-off and loss experience; current industry charge-off and loss experience; the condition of the real estate market and geographic concentrations within the loan portfolio; the interest rate climate; the overall availability of housing credit; and general economic conditions. The Company’s one- to four-family and home equity loan portfolios are separated into risk segments based on key risk factors, which include but are not limited to channel of loan origination, documentation type, loan product type and LTV ratio. Based upon the segmentation, probable losses are determined with expected loss rates in each segment. The additional protection provided by mortgage insurance and the credit default swap has been factored into the expected loss on defaulted mortgage loans. The expected recovery from the liquidation of foreclosed real estate and expected recoveries from loan sellers related to contractual guarantees are also factored into the expected loss on defaulted mortgage loans. For
52
the consumer and other loan portfolio, management establishes loss estimates for each consumer portfolio based on credit characteristics and observation of the existing markets. The expected recoveries from the sale of repossessed collateral are factored into the expected loss on defaulted consumer loans based on current liquidation experience. Loan losses are charged and recoveries are credited to the allowance for loan losses. The allowance for loan losses is typically equal to management’s estimate of loan charge-offs in the twelve months following the balance sheet date. Management believes this level is representative of probable losses inherent in the loan portfolio at the balance sheet date.
For modified loans accounted for as TDRs, the Company establishes a specific allowance in accordance with SFAS No. 114. Under SFAS No. 114, the impairment of a loan is measured using a discounted cash flow analysis. A specific allowance is established to the extent that the recorded investment exceeds the discounted cash flows of a TDR with a corresponding charge to the provision for loan losses. The specific allowance for these individually impaired loans represents the expected loss over the remaining life of the loan, including the economic concession to the borrower.
Determining the adequacy of the allowance is complex and requires judgment by management about the effect of matters that are inherently uncertain. Subsequent evaluations of the loan portfolio, in light of the factors then prevailing, may result in significant changes in the allowance for loan losses in future periods.
New Accounting Standards—Below are the new accounting pronouncements that relate to activities in which the Company is engaged.
SFAS No. 161—Disclosures About Derivative Instruments and Hedging Activities
In March 2008, the FASB issued SFAS No. 161,Disclosures About Derivative Instruments and Hedging Activities (“SFAS No. 161”). This statement establishes, among other things, the disclosure requirements for derivative instruments and hedging activities. This statement is effective at the beginning of an entity’s first interim period beginning after November 15, 2008, or January 1, 2009 for the Company. The Company’s disclosures about derivative instruments and hedging activities in the first quarter of 2009 reflect the adoption of this statement. For additional information regarding the adoption of this statement, see Note 6—Accounting for Derivative Financial Instruments and Hedging Activities.
FSP No. FAS 141R-1—Accounting for Assets Acquired and Liabilities Assumed in a Business Combination That Arise from Contingencies
In April 2009, the FASB issued FSP No. 141R-1,Accounting for Assets Acquired and Liabilities Assumed in a Business Combination That Arise from Contingencies (“FSP No. 141R-1”). FSP No. 141R-1 amends and clarifies SFAS No. 141R,Business Combinations, to address application issues raised by preparers, auditors, and members of the legal profession on initial recognition and measurement, subsequent measurement and accounting, and disclosure of assets and liabilities arising from contingencies in a business combination. FSP No. 141R-1 is effective for assets or liabilities arising from contingencies in business combinations for which the acquisition date is on or after the first annual reporting period beginning on or after December 15, 2008, or January 1, 2009 for the Company and had no impact on its financial condition, results of operations or cash flows.
FSP No. FAS 107-1 and APB 28-1—Interim Disclosures about Fair Value of Financial Instruments
In April 2009, the FASB issued FSP No. FAS 107-1 and APB 28-1, Interim Disclosures about Fair Value of Financial Instruments(“FSP No. FAS 107-1 and APB 28-1”). FSP No. FAS 107-1 and APB 28-1 amends FASB Statement No. 107,Disclosures about Fair Value of Financial Instruments, to require disclosures about fair value of financial instruments for interim reporting periods of publicly traded companies as well as in annual financial statements. FSP No. FAS 107-1 and APB 28-1 is effective for interim reporting periods ending after
53
June 15, 2009, or June 30, 2009 for the Company, with early adoption permitted. The Company did not early adopt this FSP. The Company’s disclosures about fair value of financial instruments will reflect the adoption of this FSP in the second quarter of 2009.
FSP No. FAS 115-2 and FAS 124-2—Recognition and Presentation of Other-Than-Temporary Impairments
In April 2009, the FASB issued FSP No. FAS 115-2 and FAS 124-2. FSP No. FAS 115-2 and FAS 124-2 amends the other-than-temporary impairment guidance in GAAP for debt securities and the presentation and disclosure requirements of other-than-temporary impairments on debt and equity securities in the financial statements. This FSP does not amend existing recognition and measurement guidance related to other-than-temporary impairments of equity securities. FSP No. FAS 115-2 and FAS 124-2 is effective for interim reporting periods ending after June 15, 2009, or June 30, 2009 for the Company, with early adoption permitted. The Company did not early adopt this FSP. The Company expects the adoption of this standard to decrease the impact of impairments on its results of operations in future periods when compared to the impact the Company believes would have occurred without this new accounting standard. The Company is currently evaluating the impact of the adoption of FSP No. FAS 115-2 and FAS 124-2 to its financial condition, results of operations and cash flows.
FSP No. FAS 157-4—Determining Fair Value When the Volume and Level of Activity for the Asset or Liability Have Significantly Decreased and Identifying Transactions That Are Not Orderly
In April 2009, the FASB issued FSP No. FAS 157-4,Determining Fair Value When the Volume and Level of Activity for the Asset or Liability Have Significantly Decreased and Identifying Transactions That Are Not Orderly (“FSP No. FAS 157-4”). FSP No. FAS 157-4 provides additional guidance for estimating fair value in accordance with SFAS No. 157,Fair Value Measurements(“SFAS No. 157”), when the volume and level of activity for the asset or liability have significantly decreased. FSP No. FAS 157-4 also includes guidance on identifying circumstances that indicate a transaction is not orderly. FSP No. FAS 157-4 is effective for interim reporting periods ending after June 15, 2009, or June 30, 2009 for the Company, with early adoption permitted. The Company did not early adopt this FSP. The Company does not expect the adoption of FSP No. FAS 157-4 to have a material impact on its financial condition, results of operations or cash flows.
NOTE 2—OPERATING INTEREST INCOME AND OPERATING INTEREST EXPENSE
The following table shows the components of operating interest income and operating interest expense from continuing operations (dollars in thousands):
| | | | | | | | |
| | | Three Months Ended
March 31, | |
| | | 2009 | | | 2008 | |
Operating interest income: | | | | | | | | |
Loans, net | | $ | 313,328 | | | $ | 451,574 | |
Mortgage-backed and investment securities | | | 127,069 | | | | 109,209 | |
Margin receivables | | | 26,937 | | | | 90,937 | |
Other | | | 19,303 | | | | 47,871 | |
| | | | | | | | |
Total operating interest income | | | 486,637 | | | | 699,591 | |
| | | | | | | | |
Operating interest expense: | | | | | | | | |
Deposits | | | (97,014 | ) | | | (186,704 | ) |
Repurchase agreements and other borrowings | | | (66,075 | ) | | | (94,934 | ) |
FHLB advances | | | (41,204 | ) | | | (70,802 | ) |
Other | | | (3,682 | ) | | | (20,780 | ) |
| | | | | | | | |
Total operating interest expense | | | (207,975 | ) | | | (373,220 | ) |
| | | | | | | | |
Net operating interest income | | $ | 278,662 | | | $ | 326,371 | |
| | | | | | | | |
54
NOTE 3—FAIR VALUE DISCLOSURES
SFAS No. 157 defines fair value as the price that would be received to sell an asset or paid to transfer a liability in an orderly transaction between market participants at the measurement date. In determining fair value, the Company may use various valuation approaches, including market, income and/or cost approaches. The fair value hierarchy established in SFAS No. 157 requires an entity to maximize the use of observable inputs and minimize the use of unobservable inputs when measuring fair value. Fair value is a market-based measure considered from the perspective of a market participant. As such, even when market assumptions are not readily available, the Company’s own assumptions reflect those that market participants would use in pricing the asset or liability at the measurement date. The standard describes the following three levels used to classify fair value measurements:
| | • | | Level 1—Quoted prices in active markets for identical assets or liabilities. |
| | • | | Level 2—Quoted prices in markets that are not active or for which all significant inputs are observable, either directly or indirectly. |
| | • | | Level 3—Unobservable inputs that are significant to the fair value of the assets or liabilities. |
The availability of observable inputs can vary and in certain cases, the inputs used to measure fair value may fall into different levels of the fair value hierarchy. In such cases, the level within the fair value hierarchy is based on the lowest level of input that is significant to the fair value measurement. The Company’s assessment of the significance of a particular input to a fair value measurement requires judgment and consideration of factors specific to the asset or liability.
Recurring Fair Value Measurement Valuation Techniques
Mortgage-backed Securities Backed by U.S. Government Sponsored and Federal Agencies
Mortgage-backed securities backed by U.S. Government sponsored and federal agencies include TBA securities and mortgage pass-through certificates. The fair value of mortgage-backed securities backed by U.S. Government sponsored and federal agencies is determined using quoted market prices, recent market transactions and spread data for similar instruments. Mortgage-backed securities backed by U.S. Government sponsored and federal agencies are generally categorized in Level 2 of the fair value hierarchy.
Collateralized Mortgage Obligations
CMOs, generally non-agency mortgage-backed securities, are typically valued using market observable data, when available, including recent external market transactions for similar instruments. The Company also utilized a pricing service to corroborate the market observability of the Company’s inputs used in the fair value measurements. The valuations of CMOs reflect the Company’s best estimate of what market participants would consider in pricing the financial instruments. The Company considers the price transparency for these financial instruments to be a key determinant of the degree of judgment involved in determining the fair value. As of March 31, 2009, the majority of the Company’s CMOs were categorized in Level 3 of the fair value hierarchy.
Investment Securities
As of March 31, 2009, investment securities included municipal bonds and corporate bonds. For municipal bonds, the Company utilized recent market transactions for identical or similar bonds to corroborate pricing service fair value measurements. Municipal bonds are generally categorized in Level 2 of the fair value hierarchy. The fair value of corporate bonds is estimated using market price quotes corroborated by recently executed transactions observable in the market. Corporate bonds are generally categorized in Level 2 of the fair value hierarchy.
55
Derivative Financial Instruments
The majority of the Company’s derivative financial instruments, interest rate swap and option contracts, are valued with pricing models commonly used by the financial services industry using market observable pricing inputs. The Company does not consider these models to involve significant judgment on the part of management and corroborated the fair value measurements with counterparty valuations. The majority of the Company’s derivative financial instruments are categorized in Level 2 of the fair value hierarchy. The consideration of credit risk, the Company’s or the counterparty’s, did not result in an adjustment to the valuation of its derivative financial instruments in the periods presented.
U.S. Treasuries
The fair value of U.S. Treasuries is based on quoted market prices in active markets. U.S. Treasuries are classified as Level 1 of the fair value hierarchy.
Securities Owned and Securities Sold, Not Yet Purchased
Securities transactions entered into by certain broker-dealer subsidiaries are included in trading securities and securities sold, not yet purchased in the Company’s SFAS No. 157 disclosures. For equity securities, the Company’s definition of actively traded is based on average daily volume and other market trading statistics. The fair value of securities owned and securities sold, not yet purchased is determined using listed or quoted market prices and are generally categorized in Level 1 or Level 2 of the fair value hierarchy.
Servicing Rights
The Company accounts for servicing rights under the fair value measurement method. The fair value of the servicing rights is determined using models that include observable inputs, if available. To the extent observable inputs are not available, the Company estimates fair value based on the present value of expected future cash flows using its best estimate of the key assumptions, including anticipated loan prepayments and discount rates. Servicing rights are categorized as Level 3 in the fair value hierarchy when unobservable inputs are significant to the fair value measurements.
56
Recurring Fair Value Measurements
Assets and liabilities measured at fair value on a recurring basis are summarized below (dollars in thousands):
| | | | | | | | | | | | |
| | | Level 1 | | Level 2 | | Level 3 | | Fair Value |
March 31, 2009: | | | | | | | | | | | | |
Assets | | | | | | | | | | | | |
Trading securities | | $ | 2,410 | | $ | 13,256 | | $ | 30,643 | | $ | 46,309 |
| | | | | | | | | | | | |
Available-for-sale securities: | | | | | | | | | | | | |
Mortgage-backed securities | | | — | | | 11,201,313 | | | 524,245 | | | 11,725,558 |
Investment securities | | | — | | | 97,671 | | | 163 | | | 97,834 |
| | | | | | | | | | | | |
Total available-for-sale securities | | | — | | | 11,298,984 | | | 524,408 | | | 11,823,392 |
| | | | | | | | | | | | |
Other assets: | | | | | | | | | | | | |
Derivative assets | | | — | | | 127,818 | | | — | | | 127,818 |
Deposits with clearing organizations(1) | | | 25,000 | | | — | | | — | | | 25,000 |
Servicing rights | | | — | | | — | | | 6,048 | | | 6,048 |
| | | | | | | | | | | | |
Total other assets measured at fair value on a recurring basis | | | 25,000 | | | 127,818 | | | 6,048 | | | 158,866 |
| | | | | | | | | | | | |
Total assets measured at fair value on a recurring basis(2) | | $ | 27,410 | | $ | 11,440,058 | | $ | 561,099 | | $ | 12,028,567 |
| | | | | | | | | | | | |
Liabilities | | | | | | | | | | | | |
Derivative liabilities | | $ | — | | $ | 326,462 | | $ | 500 | | $ | 326,962 |
Securities sold, not yet purchased | | | 2,140 | | | 5,820 | | | — | | | 7,960 |
| | | | | | | | | | | | |
Total liabilities measured at fair value on a recurring basis(2) | | $ | 2,140 | | $ | 332,282 | | $ | 500 | | $ | 334,922 |
| | | | | | | | | | | | |
| | | | |
| | | Level 1 | | Level 2 | | Level 3 | | Fair Value |
December 31, 2008: | | | | | | | | | | | | |
Assets | | | | | | | | | | | | |
Trading securities | | $ | 2,363 | | $ | 19,712 | | $ | 33,406 | | $ | 55,481 |
| | | | | | | | | | | | |
Available-for-sale securities: | | | | | | | | | | | | |
Mortgage-backed securities | | | — | | | 10,408,528 | | | 304,661 | | | 10,713,189 |
Investment securities | | | — | | | 92,735 | | | 170 | | | 92,905 |
| | | | | | | | | | | | |
Total available-for-sale securities | | | — | | | 10,501,263 | | | 304,831 | | | 10,806,094 |
| | | | | | | | | | | | |
Other assets: | | | | | | | | | | | | |
Derivative assets | | | — | | | 137,308 | | | 8 | | | 137,316 |
Deposits with clearing organizations(3) | | | 28,000 | | | 11,659 | | | — | | | 39,659 |
Servicing rights | | | — | | | — | | | 6,478 | | | 6,478 |
| | | | | | | | | | | | |
Total other assets measured at fair value on a recurring basis | | | 28,000 | | | 148,967 | | | 6,486 | | | 183,453 |
| | | | | | | | | | | | |
Total assets measured at fair value on a recurring basis(4) | | $ | 30,363 | | $ | 10,669,942 | | $ | 344,723 | | $ | 11,045,028 |
| | | | | | | | | | | | |
Liabilities | | | | | | | | | | | | |
Derivative liabilities | | $ | — | | $ | 484,681 | | $ | 500 | | $ | 485,181 |
Securities sold, not yet purchased | | | 1,844 | | | 4,926 | | | — | | | 6,770 |
| | | | | | | | | | | | |
Total liabilities measured at fair value on a recurring basis(4) | | $ | 1,844 | | $ | 489,607 | | $ | 500 | | $ | 491,951 |
| | | | | | | | | | | | |
(1) | | As of March 31, 2009, deposits with clearing organizations includes U.S. Treasuries deposited with clearing organizations by broker-dealer subsidiaries. |
(2) | | As of March 31, 2009, assets and liabilities measured at fair value on a recurring basis represented 24% and less than 1% of the Company’s total assets and total liabilities, respectively. |
(3) | | As of December 31, 2008, deposits with clearing organizations includes U.S. Treasuries and investment securities deposited with clearing organizations by broker-dealer subsidiaries. |
(4) | | As of December 31, 2008, assets and liabilities measured at fair value on a recurring basis represented 23% and 1% of the Company’s total assets and total liabilities, respectively. |
57
Both observable and unobservable inputs may be used to determine the fair value of positions that the Company has classified within the Level 3 category. As a result, the realized and unrealized gains and losses for assets and liabilities within the Level 3 category presented in the tables below may include changes in fair value that were attributable to both observable and unobservable inputs. The following tables present additional information about Level 3 assets and liabilities measured at fair value on a recurring basis for the three months ended March 31, 2009 and 2008, respectively (dollars in thousands):
| | | | | | | | | | | | | | | | | | | | | | | | | | | |
| | | | | | Realized and Unrealized Gains (Losses) | | | | | | | | | |
| | | December 31,
2008 | | | Included in
Earnings(1) | | | Included in
Other
Comprehensive
Income | | | Total(2) | | | Purchases,
Sales, Other
Settlements and
Issuances Net | | | Net Transfers
In and/or
(Out) of
Level 3(3) | | March 31,
2009 | |
Trading securities | | $ | 33,406 | | | $ | (2,082 | ) | | $ | — | | | $ | (2,082 | ) | | $ | (681 | ) | | $ | — | | $ | 30,643 | |
Available-for-sale securities: | | | | | | | | | | | | | | | | | | | | | | | | | | | |
Mortgage-backed securities | | $ | 304,661 | | | $ | (18,783 | ) | | $ | 15,433 | | | $ | (3,350 | ) | | $ | (31,610 | ) | | $ | 254,544 | | $ | 524,245 | |
Investment securities | | $ | 170 | | | $ | — | | | $ | (7 | ) | | $ | (7 | ) | | $ | — | | | $ | — | | $ | 163 | |
Servicing rights | | $ | 6,478 | | | $ | (430 | ) | | $ | — | | | $ | (430 | ) | | $ | — | | | $ | — | | $ | 6,048 | |
Derivative instruments, net(4) | | $ | (492 | ) | | $ | (8 | ) | | $ | — | | | $ | (8 | ) | | $ | — | | | $ | — | | $ | (500 | ) |
(1) | | The majority of realized and unrealized gains (losses) included in earnings are reported in the gain (loss) on loans and securities, net line item. |
(2) | | The majority of total realized and unrealized gains (losses) were related to Level 3 instruments held at March 31, 2009. |
(3) | | The level classification transfers of certain CMOs were driven by changes in price transparency for the securities. |
(4) | | Represents derivative assets net of derivative liabilities for presentation purposes only. |
| | | | | | | | | | | | | | | | | | | | | | | | |
| | | | | | Realized and Unrealized Gains (Losses) | | | | | | | |
| | | January 1,
2008 | | | Included in
Earnings(1) | | | Included in
Other
Comprehensive
Loss | | | Total(2) | | | Purchases,
Sales, Other
Settlements and
Issuances Net | | | March 31,
2008 | |
Trading securities | | $ | 37,795 | | | $ | (1,134 | ) | | $ | — | | | $ | (1,134 | ) | | $ | (7,947 | ) | | $ | 28,714 | |
Available-for-sale securities: | | | | | | | | | | | | | | | | | | | | | | | | |
Mortgage-backed securities | | $ | 768,815 | | | $ | (26,602 | ) | | $ | (81,068 | ) | | $ | (107,670 | ) | | $ | (23,283 | ) | | $ | 637,862 | |
Investment securities | | $ | 2,117 | | | $ | — | | | $ | 796 | | | $ | 796 | | | $ | (977 | ) | | $ | 1,936 | |
Servicing rights | | $ | 8,282 | | | $ | (36 | ) | | $ | — | | | $ | (36 | ) | | $ | 330 | | | $ | 8,576 | |
Derivative instruments, net(3) | | $ | (3,644 | ) | | $ | 3,513 | | | $ | — | | | $ | 3,513 | | | $ | — | | | $ | (131 | ) |
(1) | | The majority of realized and unrealized gains (losses) included in earnings are reported in the gain (loss) on loans and securities, net line item. |
(2) | | The majority of total realized and unrealized gains (losses) were related to Level 3 instruments held at March 31, 2008. |
(3) | | Represents derivative assets net of derivative liabilities for presentation purposes only. |
Level 3 Assets and Liabilities
Level 3 assets and liabilities included instruments whose value is determined using pricing models, discounted cash flow methodologies, or similar techniques, as well as instruments for which the determination of fair value requires significant management judgment or estimation. As of March 31, 2009, 1% of the Company’s total assets and less than 1% of total liabilities represented instruments measured at fair value on a recurring basis categorized as Level 3.
In general, level classification transfers in and out of Level 3 during the three months ended March 31, 2009 were driven by changes in price transparency in the CMO market during the period. The Company’s transfers in
58
and out of Level 3 are as of the beginning of the reporting period on a quarterly basis. While the Company’s fair value estimates of Level 3 instruments as of March 31, 2009 utilized observable inputs where available, the valuation included significant management judgment in determining the relevance and reliability of market information considered and the financial instruments were therefore classified as Level 3.
Level 3 assets as of March 31, 2009 included $276.5 million of CMOs classified as Level 2 on December 31, 2008. The $18.8 million CMO impairment recorded for the three months ended March 31, 2009 related to CMOs classified as Level 3 as of March 31, 2009. Of the $18.8 million CMO impairment recorded during the three months ended March 31, 2009, $14.3 million related to CMOs transferred into Level 3 in the first quarter of 2009. The $26.6 million CMO impairment recorded for the three months ended March 31, 2008 related to CMOs classified as Level 3 as of March 31, 2008.
Nonrecurring Fair Value Measurements
Financial Instruments
The Company also measures certain other financial instruments at fair value on a nonrecurring basis in accordance with GAAP. The Company’s charge-off policy for both one- to four-family and home equity loans is to assess the value of the property when the loan has been delinquent for 180 days or it is in bankruptcy, regardless of whether or not the property is in foreclosure, and charge-off the amount of the loan balance in excess of the estimated current property value. The Company classified these fair value measurements, approximately $327 million and $61 million for the three months ended March 31, 2009 and 2008, respectively, as Level 3 of the fair value hierarchy as the valuations included Level 3 inputs that were significant to the estimate of fair value. These fair value measurements resulted in $107.6 million and $30.0 million of charge-offs for the three months ended March 31, 2009 and 2008, respectively.
Nonfinancial Instruments
The Company measures certain nonfinancial instruments at fair value on a nonrecurring basis in accordance with GAAP. The Company adopted certain provisions of SFAS No. 157 on January 1, 2009 as they relate to nonfinancial assets and nonfinancial liabilities that are not recognized or disclosed at fair value in the financial statements on a recurring basis. Included in the other assets line item in the consolidated balance sheet is real estate acquired through foreclosure which is recorded at the lower of carrying value or fair value, less estimated selling costs. The Company classified these fair value measurements, approximately $73 million for the three months ended March 31, 2009, as Level 3 of the fair value hierarchy as the majority of the valuations included Level 3 inputs that were significant to the estimate of fair value. These fair value measurements resulted in $15.9 million in write-downs for the three months ended March 31, 2009.
59
NOTE 4—AVAILABLE-FOR-SALE MORTGAGE-BACKED AND INVESTMENT SECURITIES
The amortized cost basis and estimated fair values of available-for-sale mortgage-backed and investment securities are shown in the following tables (dollars in thousands):
| | | | | | | | | | | | | |
| | | Amortized
Cost | | Gross
Unrealized Gains | | Gross
Unrealized Losses | | | Estimated
Fair Values |
March 31, 2009: | | | | | | | | | | | | | |
Mortgage-backed securities: | | | | | | | | | | | | | |
Backed by U.S. Government sponsored and federal agencies | | $ | 11,114,704 | | $ | 99,195 | | $ | (50,163 | ) | | $ | 11,163,736 |
CMOs and other | | | 869,315 | | | 2,875 | | | (310,368 | ) | | | 561,822 |
| | | | | | | | | | | | | |
Total mortgage-backed securities | | | 11,984,019 | | | 102,070 | | | (360,531 | ) | | | 11,725,558 |
| | | | | | | | | | | | | |
Investment securities: | | | | | | | | | | | | | |
Debt securities: | | | | | | | | | | | | | |
Municipal bonds | | | 100,712 | | | — | | | (12,380 | ) | | | 88,332 |
Corporate bonds | | | 25,420 | | | 1 | | | (16,441 | ) | | | 8,980 |
| | | | | | | | | | | | | |
Total debt securities | | | 126,132 | | | 1 | | | (28,821 | ) | | | 97,312 |
Publicly traded equity securities: | | | | | | | | | | | | | |
Corporate investments | | | 163 | | | 359 | | | — | | | | 522 |
| | | | | | | | | | | | | |
Total investment securities | | | 126,295 | | | 360 | | | (28,821 | ) | | | 97,834 |
| | | | | | | | | | | | | |
Total available-for-sale securities | | $ | 12,110,314 | | $ | 102,430 | | $ | (389,352 | ) | | $ | 11,823,392 |
| | | | | | | | | | | | | |
December 31, 2008: | | | | | | | | | | | | | |
Mortgage-backed securities: | | | | | | | | | | | | | |
Backed by U.S. Government sponsored and federal agencies | | $ | 10,115,865 | | $ | 82,663 | | $ | (87,715 | ) | | $ | 10,110,813 |
CMOs and other | | | 920,474 | | | 14 | | | (318,112 | ) | | | 602,376 |
| | | | | | | | | | | | | |
Total mortgage-backed securities | | | 11,036,339 | | | 82,677 | | | (405,827 | ) | | | 10,713,189 |
| | | | | | | | | | | | | |
Investment securities: | | | | | | | | | | | | | |
Debt securities: | | | | | | | | | | | | | |
Municipal bonds | | | 100,706 | | | 1 | | | (21,101 | ) | | | 79,606 |
Corporate bonds | | | 25,454 | | | 14 | | | (12,667 | ) | | | 12,801 |
| | | | | | | | | | | | | |
Total debt securities | | | 126,160 | | | 15 | | | (33,768 | ) | | | 92,407 |
Publicly traded equity securities: | | | | | | | | | | | | | |
Corporate investments | | | 532 | | | 285 | | | (319 | ) | | | 498 |
| | | | | | | | | | | | | |
Total investment securities | | | 126,692 | | | 300 | | | (34,087 | ) | | | 92,905 |
| | | | | | | | | | | | | |
Total available-for-sale securities | | $ | 11,163,031 | | $ | 82,977 | | $ | (439,914 | ) | | $ | 10,806,094 |
| | | | | | | | | | | | | |
60
Other-Than-Temporary Impairment of Investments
The following tables show the fair values and unrealized losses on investments, aggregated by investment category, and the length of time that individual securities have been in a continuous unrealized loss position (dollars in thousands):
| | | | | | | | | | | | | | | | | | | | | |
| | | Less than 12 Months | | | 12 Months or More | | | Total | |
| | | Fair
Values | | Unrealized
Losses | | | Fair
Values | | Unrealized
Losses | | | Fair
Values | | Unrealized
Losses | |
March 31, 2009: | | | | | | | | | | | | | | | | | | | | | |
Mortgage-backed securities: | | | | | | | | | | | | | | | | | | | | | |
Backed by U.S. Government sponsored and federal agencies | | $ | 399,633 | | $ | (1,094 | ) | | $ | 2,894,677 | | $ | (49,069 | ) | | $ | 3,294,310 | | $ | (50,163 | ) |
CMOs and other | | | 62,217 | | | (41,166 | ) | | | 442,127 | | | (269,202 | ) | | | 504,344 | | | (310,368 | ) |
Debt securities: | | | | | | | | | | | | | | | | | | | | | |
Municipal bonds | | | — | | | — | | | | 88,321 | | | (12,380 | ) | | | 88,321 | | | (12,380 | ) |
Corporate bonds | | | 24 | | | (2 | ) | | | 8,928 | | | (16,439 | ) | | | 8,952 | | | (16,441 | ) |
| | | | | | | | | | | | | | | | | | | | | |
Total temporarily impaired securities | | $ | 461,874 | | $ | (42,262 | ) | | $ | 3,434,053 | | $ | (347,090 | ) | | $ | 3,895,927 | | $ | (389,352 | ) |
| | | | | | | | | | | | | | | | | | | | | |
December 31, 2008: | | | | | | | | | | | | | | | | | | | | | |
Mortgage-backed securities: | | | | | | | | | | | | | | | | | | | | | |
Backed by U.S. Government sponsored and federal agencies | | $ | 1,050,268 | | $ | (9,255 | ) | | $ | 3,157,773 | | $ | (78,460 | ) | | $ | 4,208,041 | | $ | (87,715 | ) |
CMOs and other | | | 53,836 | | | (40,668 | ) | | | 522,313 | | | (277,444 | ) | | | 576,149 | | | (318,112 | ) |
Debt securities: | | | | | | | | | | | | | | | | | | | | | |
Municipal bonds | | | — | | | — | | | | 79,595 | | | (21,101 | ) | | | 79,595 | | | (21,101 | ) |
Corporate bonds | | | 39 | | | (4 | ) | | | 12,719 | | | (12,663 | ) | | | 12,758 | | | (12,667 | ) |
Publicly traded equity securities: | | | | | | | | | | | | | | | | | | | | | |
Corporate investments | | | — | | | — | | | | 43 | | | (319 | ) | | | 43 | | | (319 | ) |
| | | | | | | | | | | | | | | | | | | | | |
Total temporarily impaired securities | | $ | 1,104,143 | | $ | (49,927 | ) | | $ | 3,772,443 | | $ | (389,987 | ) | | $ | 4,876,586 | | $ | (439,914 | ) |
| | | | | | | | | | | | | | | | | | | | | |
The Company does not believe that any individual unrealized loss in the available-for-sale portfolio as of March 31, 2009 represents an other-than-temporary impairment. The majority of the unrealized losses on mortgage-backed securities are attributable to changes in interest rates and a re-pricing of risk in the market. Substantially all mortgage-backed securities backed by U.S. Government sponsored and federal agencies are AAA-rated. Municipal bonds and corporate bonds are evaluated by reviewing the credit-worthiness of the issuer and general market conditions. The Company has the intent and ability to hold the securities in an unrealized loss position at March 31, 2009 until the market value recovers or the securities mature(1).
Within the securities portfolio, the highest concentration of credit risk is the CMO portfolio. As of March 31, 2009, the Company concluded that approximately $37.3 million of these securities had a probable risk of future loss as a result of deterioration in the expected credit performance of the underlying loans in the securities. These securities were written down to their estimated fair market value by recording $18.8 million
(1) | | In the second quarter of 2009, the Company will adopt FSP No. FAS 115-2 and FAS 124-2 which amends the other-than-temporary impairment guidance in GAAP for debt securities. The Company expects the adoption of this standard to decrease the impact of impairments on its results of operations in future periods when compared to the impact the Company believes would have occurred without this new accounting standard. The Company is currently evaluating the impact of the adoption of FSP No. FAS 115-2 and FAS 124-2 to its financial condition, results of operations and cash flows. |
61
impairment during the three months ended March 31, 2009. The Company recorded other-than-temporary impairment charges of $26.6 million for CMO securities for the three months ended March 31, 2008.
Our intent to hold securities in an unrealized loss position at March 31, 2009 until the market value recovers or the securities mature was based on the facts and circumstances that existed as of that date. The Emergency Economic Stabilization Act of 2008 (the “Act”) was signed into law on October 3, 2008. This Act grants the Treasury authority to purchase troubled assets from financial institutions under the TARP. A new administration came into office and a new Treasury Secretary was named. On March 23, 2009, the new administration announced a new “Public-Private Investment Program” to address the problem of troubled real estate-related assets on banks’ balance sheets. Under the program, the Treasury will work with private investors to establish funds that purchase both loans and securities from financial institutions allowing them to cleanse their balance sheets of what are often referred to as “legacy” assets. The Company does not yet know enough about how this program will be implemented and most importantly the Company does not yet know enough about the prices at which banks’ troubled assets would be sold to these funds to determine if it would be of interest to the Company. Therefore the Company cannot make an assessment of whether the Treasury’s plans under the Act will impact the Company’s intent with respect to these securities and its loans in future periods. The Company’s ability and intent to hold securities in an unrealized loss position at March 31, 2009 until the market value recovers or the securities mature was based on these facts.
The detailed components of the gain (loss) on loans and securities, net and gain (loss) on sales of investments, net line items on the consolidated statement of loss are shown below.
Gain (Loss) on Loans and Securities, Net
Gain (loss) on loans and securities, net are as follows (dollars in thousands):
| | | | | | | | |
| | | Three Months Ended
March 31, | |
| | | 2009 | | | 2008 | |
Loss on sales of loans, net | | $ | — | | | $ | (498 | ) |
Gain (loss) on securities, net | | | | | | | | |
Gain on securities and other investments | | | 37,826 | | | | 13,263 | |
Loss on impairment | | | (18,801 | ) | | | (26,602 | ) |
Gain (loss) on trading securities | | | (2,468 | ) | | | 3,621 | |
Hedge ineffectiveness | | | (50 | ) | | | 1,649 | |
| | | | | | | | |
Gain (loss) on securities, net | | | 16,507 | | | | (8,069 | ) |
| | | | | | | | |
Gain (loss) on loans and securities, net | | $ | 16,507 | | | $ | (8,567 | ) |
| | | | | | | | |
Gain (loss) on Sales of Investments, Net
Gain (loss) on sales of investments, net are as follows (dollars in thousands):
| | | | | | | |
| | | Three Months Ended
March 31, |
| | | 2009 | | | 2008 |
Realized gain (loss) on sales of publicly traded equity securities | | $ | (317 | ) | | $ | 254 |
Other | | | (116 | ) | | | 248 |
| | | | | | | |
Gain (loss) on sales of investments, net | | $ | (433 | ) | | $ | 502 |
| | | | | | | |
62
NOTE 5—LOANS, NET
Loans, net are summarized as follows (dollars in thousands):
| | | | | | | | |
| | | March 31,
2009 | | | December 31,
2008 | |
One- to four-family | | $ | 12,539,663 | | | $ | 12,979,844 | |
Home equity | | | 9,533,008 | | | | 10,017,183 | |
Consumer and other loans: | | | | | | | | |
Recreational vehicle | | | 1,496,754 | | | | 1,570,116 | |
Marine | | | 406,331 | | | | 424,595 | |
Commercial | | | 188,934 | | | | 214,084 | |
Other | | | 85,565 | | | | 89,875 | |
| | | | | | | | |
Total consumer and other loans | | | 2,177,584 | | | | 2,298,670 | |
| | | | | | | | |
Total loans receivable | | | 24,250,255 | | | | 25,295,697 | |
Unamortized premiums, net | | | 222,522 | | | | 236,766 | |
Allowance for loan losses | | | (1,200,808 | ) | | | (1,080,611 | ) |
| | | | | | | | |
Total loans, net | | $ | 23,271,969 | | | $ | 24,451,852 | |
| | | | | | | | |
The following table provides an analysis of the allowance for loan losses for the three months ended March 31, 2009 and 2008 (dollars in thousands):
| | | | | | | | |
| | | Three Months Ended
March 31, | |
| | | 2009 | | | 2008 | |
Allowance for loan losses, beginning of period | | $ | 1,080,611 | | | $ | 508,164 | |
Provision for loan losses | | | 453,963 | | | | 233,871 | |
Charge-offs | | | (342,978 | ) | | | (182,412 | ) |
Recoveries | | | 9,212 | | | | 6,285 | |
| | | | | | | | |
Net charge-offs | | | (333,766 | ) | | | (176,127 | ) |
| | | | | | | | |
Allowance for loan losses, end of period | | $ | 1,200,808 | | | $ | 565,908 | |
| | | | | | | | |
The Company has a CDS on $4.0 billion of its first-lien residential real estate loan portfolio through a synthetic securitization structure. As of March 31, 2009, the balance of the loans covered by the CDS was $2.7 billion. A CDS provides, for a fee, an assumption by a third party of a portion of the credit risk related to the underlying loans. The CDS provides protection for losses in excess of $4.0 million, but not to exceed approximately $30.3 million. In addition, the Company’s regulatory risk-weighted assets were reduced as a result of this transaction because the Company transferred a portion of its credit risk to an unaffiliated third party. The Company recognized $1.4 million in losses on the portion of the loans covered under the CDS during the three months ended March 31, 2009 and $3.0 million in losses since we entered the CDS. The Company has not yet realized any recoveries from the CDS as losses on the covered loans have not yet exceeded $4.0 million; however, the estimated recoveries from the CDS for the next twelve months were $27.3 million at March 31, 2009, which is reflected in the allowance for loan losses.
In 2008 and continuing into the beginning of 2009, the Company initiated a loan modification program with a goal of avoiding foreclosure, primarily for loans that are nonperforming. As part of the program, the Company considers modifications in which it made a significant economic concession to a borrower experiencing financial difficulty a TDR. The Company has also modified a small number of loans in which it did not make a significant economic concession to the borrower.
63
Included in our allowance for loan losses at March 31, 2009 was a specific allowance of $62.5 million that was established for TDRs. The specific allowance for these individually impaired loans represents the expected loss over the remaining life of the loan, including the economic concession to the borrower. The following table shows detailed information related to the Company’s modified loans accounted for as TDRs as of and for the three months March 31, 2009 (dollars in thousands):
| | | | | | | | | |
| | | Recorded
Investment
in TDRs(1) | | Specific
Valuation
Allowance | | Specific Valuation
Allowance as a % of
TDR Loans | |
March 31, 2009 | | | | | | | |
One- to four-family | | $ | 45,241 | | $ | 10,498 | | 23 | % |
Home equity | | | 70,456 | | | 52,049 | | 74 | % |
| | | | | | | | | |
Total(2) | | $ | 115,697 | | $ | 62,547 | | 54 | % |
| | | | | | | | | |
(1) | | For the three months ended March 31, 2009, the average recorded investment in TDR loans was $115.5 million and the interest income recognized on these loans was $0.6 million. |
(2) | | At March 31, 2009, $109.6 million TDRs had an associated specific valuation allowance and $6.1 million did not have an associated valuation allowance. |
64
NOTE 6—ACCOUNTING FOR DERIVATIVE FINANCIAL INSTRUMENTS AND HEDGING ACTIVITIES
The Company enters into derivative transactions primarily to protect against interest rate risk on the value of certain assets, liabilities and future cash flows. Financial derivative instruments designated in hedging relationships that mitigate the exposure to the variability in expected future cash flows or other forecasted transactions are considered cash flow hedges. Financial derivative instruments in hedging relationships that mitigate exposure to changes in the fair value of assets or liabilities are considered fair value hedges under SFAS No. 133, as amended. The Company is also required to recognize certain contracts and commitments as derivatives when the characteristics of those contracts and commitments meet the definition of a derivative as promulgated by SFAS No. 133, as amended. Each derivative is recorded on the balance sheet at fair value as a freestanding asset or liability. Cash flow and fair value ineffectiveness is re-measured on a quarterly basis. The following table summarizes the location and fair value amounts of derivative instruments reported in the consolidated balance sheet in accordance with the Company’s adoption of SFAS No. 161 on January 1, 2009 (dollars in thousands):
| | | | | | | | | | | |
| | | Fair Value | |
| | | Asset(1) | | Liability(2) | | | Net | |
March 31, 2009 | | | | | | | | |
Derivatives designated as hedging instruments under SFAS No. 133, as amended: | | | | | | | | | | | |
Interest rate contracts | | | | | | | | | | | |
Cash flow hedges | | $ | 93,343 | | $ | (315,661 | ) | | $ | (222,318 | ) |
Fair value hedges | | | 19,747 | | | — | | | | 19,747 | |
Other derivatives | | | 2,773 | | | — | | | | 2,773 | |
| | | | | | | | | | | |
Total derivatives designated as hedging instruments under SFAS No. 133, as amended | | | 115,863 | | | (315,661 | ) | | | (199,798 | ) |
| | | | | | | | | | | |
Derivatives not designated as hedging instruments under SFAS No. 133, as amended: | | | | | | | | | | | |
Interest rate contracts | | | 11,808 | | | (10,801 | ) | | | 1,007 | |
Other derivatives | | | 147 | | | (500 | ) | | | (353 | ) |
| | | | | | | | | | | |
Total derivatives not designated as hedging instruments under SFAS No. 133, as amended | | | 11,955 | | | (11,301 | ) | | | 654 | |
| | | | | | | | | | | |
Total derivative instruments | | $ | 127,818 | | $ | (326,962 | ) | | $ | (199,144 | ) |
| | | | | | | | | | | |
(1) | | Reflected in the other assets line item on the consolidated balance sheet. |
(2) | | Reflected in the accounts payable, accrued and other liabilities line item on the consolidated balance sheet. |
Cash Flow Hedges
The majority of the Company’s derivative instruments as of March 31, 2009 and December 31, 2008 were designated as cash flow hedges. These hedges, which include a combination of interest rate swaps, forward-starting swaps and purchased options on caps and floors, are used primarily to reduce the variability of future cash flows associated with existing variable-rate liabilities and assets and forecasted issuances of liabilities.
The effective portion of changes in fair value of the financial derivative instruments that hedge cash flows is reported as a component of accumulated other comprehensive loss, net of tax in the consolidated balance sheet, for both active and terminated hedges. Amounts are then included in net operating interest income as a yield adjustment in the same period the hedged forecasted transaction affects earnings. The ineffective portion of the change in fair value of the financial derivative is reported as fair value adjustments of financial derivatives in the gain (loss) on loans and securities, net line item in the consolidated statement of loss.
65
If it becomes probable that a hedged forecasted transaction will not occur, amounts included in accumulated other comprehensive loss related to the specific hedging instruments would be reclassified into the gain (loss) on loans and securities, net line item in the consolidated statement of loss. If hedge accounting is discontinued because a financial derivative instrument ceases to be a highly effective hedge; or is sold, terminated or de-designated, amounts included in accumulated other comprehensive loss related to the specific hedging instrument continue to be reported in other comprehensive income or loss until the forecasted transaction affects earnings. Financial derivative instruments no longer in hedging relationships continue to be recorded at fair value with changes in fair value being reported in the gain (loss) on loans and securities, net line item in the consolidated statement of loss.
The future issuances of liabilities, including repurchase agreements, are largely dependent on the market demand and liquidity in the wholesale borrowings market. As of March 31, 2009, the Company believes the forecasted issuance of all debt in cash flow hedge relationships is probable. However, unexpected changes in market conditions in future periods could impact the ability to issue this debt. The Company believes the forecasted issuance of debt in the form of repurchase agreements is most susceptible to an unexpected change in market conditions.
The following table summarizes information related to the Company’s interest rate contracts in cash flow hedge relationships, hedging variable-rate assets and liabilities and the forecasted issuances of liabilities (dollars in thousands):
| | | | | | | | | | | | | | | | | | | | | | | | | |
| | | Notional
Amount | | Fair Value | | | Weighted-Average |
| | | Asset | | Liability | | | Net | | | Pay
Rate | | | Receive
Rate | | | Strike
Rate | | | Remaining
Life (Years) |
March 31, 2009: | | | | | | | | | | | | | | | | | | | | | | | | | |
Pay-fixed interest rate swaps: | | | | | | | | | | | | | | | | | | | | | | | | | |
Repurchase agreements | | $ | 1,640,000 | | $ | — | | $ | (287,474 | ) | | $ | (287,474 | ) | | 4.90 | % | | 1.07 | % | | N/A | | | 9.82 |
FHLB advances | | | 280,000 | | | — | | | (28,187 | ) | | | (28,187 | ) | | 4.33 | % | | 1.30 | % | | N/A | | | 7.65 |
Purchased interest rate options(1): | | | | | | | | | | | | | | | | | | | | | | | | | |
Caps | | | 1,435,000 | | | 2,438 | | | — | | | | 2,438 | | | N/A | | | N/A | | | 5.22 | % | | 3.31 |
Floors | | | 1,900,000 | | | 90,905 | | | — | | | | 90,905 | | | N/A | | | N/A | | | 6.43 | % | | 2.21 |
| | | | | | | | | | | | | | | | | | | | | | | | | |
Total cash flow hedges | | $ | 5,255,000 | | $ | 93,343 | | $ | (315,661 | ) | | $ | (222,318 | ) | | 4.82 | % | | 1.11 | % | | 5.91 | % | | 5.18 |
| | | | | | | | | | | | | | | | | | | | | | | | | |
December 31, 2008: | | | | | | | | | | | | | | | | | | | | | | | | | |
Pay-fixed interest rate swaps: | | | | | | | | | | | | | | | | | | | | | | | | | |
Repurchase agreements | | $ | 2,080,000 | | $ | — | | $ | (415,410 | ) | | $ | (415,410 | ) | | 4.88 | % | | 2.61 | % | | N/A | | | 9.89 |
FHLB advances | | | 330,000 | | | — | | | (44,135 | ) | | | (44,135 | ) | | 4.50 | % | | 1.91 | % | | N/A | | | 7.85 |
Purchased interest rate forward-starting swaps: | | | | | | | | | | | | | | | | | | | | | | | | | |
Repurchase agreements | | | 100,000 | | | — | | | (11,254 | ) | | | (11,254 | ) | | 3.90 | % | | N/A | | | N/A | | | 10.15 |
Purchased interest rate options(1): | | | | | | | | | | | | | | | | | | | | | | | | | |
Caps | | | 1,635,000 | | | 2,620 | | | — | | | | 2,620 | | | N/A | | | N/A | | | 5.19 | % | | 3.13 |
Floors | | | 1,900,000 | | | 99,473 | | | — | | | | 99,473 | | | N/A | | | N/A | | | 6.43 | % | | 2.46 |
| | | | | | | | | | | | | | | | | | | | | | | | | |
Total cash flow hedges | | $ | 6,045,000 | | $ | 102,093 | | $ | (470,799 | ) | | $ | (368,706 | ) | | 4.79 | % | | 2.52 | % | | 5.86 | % | | 5.62 |
| | | | | | | | | | | | | | | | | | | | | | | | | |
(1) | | Caps are used to hedge repurchase agreements. Floors are used to hedge home equity lines of credit. |
66
Additionally, the Company enters into forward purchase and sale agreements, which are considered cash flow hedges, when the terms of the commitments exactly match the terms of the securities purchased or sold. As of March 31, 2009, the fair value of forward contracts accounted for as cash flow hedges included in the derivative assets line item was $2.8 million.
The following table shows: 1) amounts recorded in accumulated other comprehensive loss related to derivative instruments accounted for as cash flow hedges; 2) amount of ineffectiveness recorded in earnings related to derivative instruments accounted for as cash flow hedges; 3) the notional amounts and fair values of derivatives terminated for the periods presented; and 4) the amortization of terminated interest rate swaps and options included in net operating interest income (dollars in thousands):
| | | | | | | | |
| | | Three Months Ended
March 31, | |
| | | 2009 | | | 2008 | |
Impact on accumulated other comprehensive loss (net of tax): | | | | | | | | |
Beginning balance | | $ | (417,489 | ) | | $ | (132,223 | ) |
Unrealized gain (loss), net | | | 35,382 | | | | (78,157 | ) |
Reclassifications into earnings, net | | | 6,817 | | | | 2,393 | |
| | | | | | | | |
Ending balance | | $ | (375,290 | ) | | $ | (207,987 | ) |
| | | | | | | | |
Cash flow hedge ineffectiveness(1)(2) | | $ | (50 | ) | | $ | (84 | ) |
| | |
Derivatives terminated during the period: | | | | | | | | |
Notional | | $ | 790,000 | | | $ | 1,590,000 | |
Fair value of net losses recognized in accumulated other comprehensive loss | | $ | (95,522 | ) | | $ | (76,034 | ) |
Amortization of terminated interest rate swaps and options included in net operating interest income | | $ | (8,824 | ) | | $ | (688 | ) |
(1) | | The amount of ineffectiveness recorded in earnings for cash flow hedges is equal to the excess of the cumulative change in the fair value of the actual derivative over the cumulative change in the fair value of a hypothetical derivative which is created to match the exact terms of the underlying instruments being hedged. |
(2) | | The cash flow hedge ineffectiveness is reflected in the gain (loss) on loans and securities, net line item. |
During the upcoming twelve months, the Company expects to include a pre-tax amount of approximately $13.6 million of net unrealized losses that are currently reflected in accumulated other comprehensive loss in net operating interest income as a yield adjustment in the same periods in which the related items affect earnings. The losses accumulated in other comprehensive loss on the derivative instruments terminated shown in the preceding table will be included in net operating interest income over the periods the related items will affect earnings, ranging from 98 days to approximately 14 years.
The following table shows the balance in accumulated other comprehensive loss attributable to open cash flow hedges and discontinued cash flow hedges (dollars in thousands):
| | | | | | | | |
| | | Three Months Ended
March 31, | |
| | | 2009 | | | 2008 | |
Accumulated other comprehensive loss balance (net of tax) related to: | | | | | | | | |
Open cash flow hedges | | $ | (170,695 | ) | | $ | (171,979 | ) |
Discontinued cash flow hedges | | | (204,595 | ) | | | (36,008 | ) |
| | | | | | | | |
Total cash flow hedges | | $ | (375,290 | ) | | $ | (207,987 | ) |
| | | | | | | | |
67
The following table shows the balance in accumulated other comprehensive loss attributable to cash flow hedges by type of hedged item (dollars in thousands):
| | | | | | | | |
| | | Three Months Ended
March 31, | |
| | | 2009 | | | 2008 | |
Accumulated other comprehensive income (loss) related to: | | | | | | | | |
FHLB advances | | $ | (121,531 | ) | | $ | (95,963 | ) |
Repurchase agreements | | | (576,406 | ) | | | (298,273 | ) |
Home equity lines of credit | | | 92,452 | | | | 64,632 | |
Other | | | 1,759 | | | | (1,112 | ) |
| | | | | | | | |
Total other comprehensive loss before tax | | | (603,726 | ) | | | (330,716 | ) |
Tax benefit | | | 228,436 | | | | 122,729 | |
| | | | | | | | |
Total cash flow hedges, net of tax | | $ | (375,290 | ) | | $ | (207,987 | ) |
| | | | | | | | |
Fair Value Hedges
The Company uses interest rate swaps to offset its exposure to changes in value of certain fixed-rate liabilities. Changes in the fair value of the derivatives are recognized currently in the gain (loss) on loans and securities, net line item.
Fair value hedges are accounted for by recording the fair value of the financial derivative instrument and the change in fair value of the asset or liability being hedged on the consolidated balance sheet. To the extent that the hedge is ineffective, the changes in the fair values will not offset and the difference, or hedge ineffectiveness, is reflected in the gain (loss) on loans and securities, net line item in the consolidated statement of loss. Cash payments or receipts and related accruals during the reporting period on derivatives included in fair value hedge relationships are recorded as an adjustment to interest income or expense on the hedged item.
Hedge accounting is discontinued for fair value hedges if a financial derivative instrument ceases to be a highly effective as a hedge or if the derivative is sold, terminated or de-designated. If fair value hedge accounting is discontinued, the net gain or loss on the underlying transactions being hedged is amortized to interest expense or interest income over the original forecasted period at the time of de-designation. Changes in the fair value of the derivative instruments after de-designation of fair value hedge accounting are recorded in the gain (loss) on loans and securities, net line item in the consolidated statement of loss. For a discontinued fair value hedge, the previously hedged item is no longer adjusted for changes in fair value.
The following table summarizes information related to interest rate contracts in fair value hedge relationships (dollars in thousands):
| | | | | | | | | | | | | | | | | | | | | | |
| | | Notional
Amount | | Fair Value | | Weighted-Average |
| | | Asset | | Liability | | Net | | Pay
Rate | | | Receive
Rate | | | Strike
Rate | | Remaining
Life (Years) |
March 31, 2009: | | | | | | | | | | | | | | | | | | | | | | |
Receive-fixed interest rate swaps: | | | | | | | | | | | | | | | | | | | | | | |
Corporate debt | | $ | 414,500 | | $ | 19,747 | | $ | — | | $ | 19,747 | | 4.02 | % | | 7.38 | % | | N/A | | 4.46 |
| | | | | | | | | | | | | | | | | | | | | | |
Total fair value hedges | | $ | 414,500 | | $ | 19,747 | | $ | — | | $ | 19,747 | | 4.02 | % | | 7.38 | % | | N/A | | 4.46 |
| | | | | | | | | | | | | | | | | | | | | | |
December 31, 2008: | | | | | | | | | | | | | | | | | | | | | | |
Receive-fixed interest rate swaps: | | | | | | | | | | | | | | | | | | | | | | |
Corporate debt | | $ | 414,500 | | $ | 20,726 | | $ | — | | $ | 20,726 | | 4.70 | % | | 7.38 | % | | N/A | | 4.71 |
Brokered certificates of deposit | | | 4,210 | | | 8 | | | — | | | 8 | | 1.85 | % | | 5.38 | % | | N/A | | 11.21 |
| | | | | | | | | | | | | | | | | | | | | | |
Total fair value hedges | | $ | 418,710 | | $ | 20,734 | | $ | — | | $ | 20,734 | | 4.67 | % | | 7.35 | % | | N/A | | 4.77 |
| | | | | | | | | | | | | | | | | | | | | | |
68
The following table summarizes the effect of interest rate contracts designated and qualifying as hedging instruments in fair value hedges and related hedged items on the consolidated statement of loss in accordance with the Company’s adoption of SFAS No. 161 on January 1, 2009 (dollars in thousands):
| | | | | | | |
| | | Three Months Ended
March 31, 2009 |
| | | Hedging
Instrument | | | Hedged
Item |
Gain (loss) included in earnings: | | | | | | | |
Interest rate contracts | | | | | | | |
Corporate debt | | $ | (979 | ) | | $ | 979 |
Brokered certificates of deposit | | | (8 | ) | | | 8 |
| | | | | | | |
Total fair value hedges | | $ | (987 | ) | | $ | 987 |
| | | | | | | |
There was no fair value hedge ineffectiveness for the three months ended March 31, 2009 and $1.7 million of fair value hedge ineffectiveness for the three months ended March 31, 2008. The fair value hedge ineffectiveness is reflected in the gain (loss) on loans and securities, net line item.
Derivatives Not Designated as Hedging Instruments
The Company also enters into derivative transactions not designated as hedging instruments. These derivative instruments primarily consist of interest rate contracts as of March 31, 2009.
Interest Rate Contracts
The Company also enters into interest rate contracts based on market movements. These derivatives are recorded at fair value on the Company’s consolidated balance sheet with the change in fair value and interest income or expense recognized in gain (loss) on loans and securities, net. The change in fair value of these derivative instruments resulted in a $0.2 million loss for the three months ended March 31, 2009.
Liability to Lehman Brothers
Prior to Lehman Brothers’ declaration of bankruptcy in September 2008, the Bank was a counterparty to interest rate derivative contracts with a subsidiary of Lehman Brothers. Lehman Brothers’ declaration of bankruptcy triggered an event of default and early termination under the Bank’s International Swap Dealers Association Master Agreement. As of the date of the event of default, the Bank’s net amount due to the Lehman Brothers subsidiary was approximately $101 million, the majority of which was collateralized by securities held by or on behalf of the Lehman Brothers subsidiary. The Bank is currently pursuing a settlement of the obligation, including a return of the collateral and payment of cash for the net amount owed to Lehman Brothers.
Credit Risk
Impact on Fair Value Measurements
Credit risk is an element of the recurring fair value measurements for certain assets and liabilities, including derivative instruments. Credit risk is managed by limiting activity to approved counterparties and setting aggregate exposure limits for each approved counterparty. The Company also monitors collateral requirements on derivative instruments through credit support agreements, which reduce risk by permitting the netting of transactions with the same counterparty upon occurrence of certain events.
The Company considered the impact of credit risk on the fair value measurement for derivative instruments, particularly those in net liability positions to counterparties, to be mitigated by the enforcement of credit support
69
agreements, and the collateral requirements therein. The Company pledged approximately $284.9 million of its mortgage-backed securities as collateral related to its derivative contracts as of March 31, 2009.
The Company’s credit risk analysis for derivative instruments also considered whether the cost to mitigate the credit loss exposure on derivative instruments in net asset positions would have resulted in material adjustments to the valuations. During the three months ended March 31, 2009, the consideration of counterparty credit risk did not result in an adjustment to the valuation of its derivative financial instruments.
Impact on Liquidity
In the normal course of business, collateral requirements contained in the Company’s derivative instruments are enforced by the Company and its counterparties. Upon enforcement of the collateral requirements, the amount of collateral requested is typically based on the net fair value of all derivative instruments with the counterparty; that is derivative assets net of derivative liabilities at the counterparty level. If the Company were to be in violation of certain provisions of the derivative instruments, the counterparties to the derivative instruments could request payment or collateralization on derivative instruments. The Company expects such requests would be based on the fair value of derivative assets net of derivative liabilities at the counterparty level. Derivative instruments in net liability positions at the counterparty level was $248.4 million as of March 31, 2009. The fair value of the Company’s mortgage-backed securities pledged as collateral, $284.9 million as of March 31, 2009, exceeded derivative instruments in net liability positions at the counterparty level by $36.5 million.
NOTE 7—DEPOSITS
Deposits are summarized as follows (dollars in thousands):
| | | | | | | | | | | | | | | | | | |
| | | Weighted-Average
Rate | | | Amount | | Percentage
to Total | |
| | | March 31,
2009 | | | December 31,
2008 | | | March 31,
2009 | | December 31,
2008 | | March 31,
2009 | | | December 31,
2008 | |
Money market and savings accounts | | 1.37 | % | | 2.73 | % | | $ | 14,257,747 | | $ | 12,692,729 | | 51.5 | % | | 48.6 | % |
Sweep deposit accounts(1) | | 0.07 | % | | 0.07 | % | | | 10,243,981 | | | 9,650,431 | | 37.1 | | | 36.9 | |
Certificates of deposit | | 2.94 | % | | 3.37 | % | | | 2,033,182 | | | 2,363,385 | | 7.4 | | | 9.0 | |
Checking accounts | | 0.51 | % | | 1.06 | % | | | 862,177 | | | 991,477 | | 3.1 | | | 3.8 | |
Brokered certificates of deposit | | 4.59 | % | | 4.48 | % | | | 244,398 | | | 438,224 | | 0.9 | | | 1.7 | |
| | | | | | | | | | | | | | | | | | |
Total deposits | | 1.01 | % | | 1.77 | % | | $ | 27,641,485 | | $ | 26,136,246 | | 100.0 | % | | 100.0 | % |
| | | | | | | | | | | | | | | | | | |
(1) | | A sweep product transfers brokerage customer balances to the Bank, which holds these funds as customer deposits in FDIC-insured demand deposits and money market deposit accounts. |
70
NOTE 8—SECURITIES SOLD UNDER AGREEMENTS TO REPURCHASE AND OTHER BORROWINGS
The maturities of borrowings at March 31, 2009 and total borrowings at March 31, 2009 and December 31, 2008 are shown below (dollars in thousands):
| | | | | | | | | | | | | | | |
| | | Repurchase
Agreements | | Other Borrowings | | Total | | Weighted
Average
Interest Rate | |
| | | FHLB
Advances | | Other | | |
Years Ending December 31, | | | | | | | | | | | | | | | |
2009 | | $ | 4,109,072 | | $ | 1,450,000 | | $ | 150,464 | | $ | 5,709,536 | | 1.54 | % |
2010 | | | 1,537,088 | | | 150,000 | | | 1,356 | | | 1,688,444 | | 1.84 | % |
2011 | | | — | | | — | | | 111 | | | 111 | | 4.69 | % |
2012 | | | 100,000 | | | 350,000 | | | — | | | 450,000 | | 4.39 | % |
2013 | | | 100,000 | | | 100,000 | | | — | | | 200,000 | | 4.03 | % |
Thereafter | | | 1,100,000 | | | 1,453,600 | | | 427,502 | | | 2,981,102 | | 3.86 | % |
| | | | | | | | | | | | | | | |
Total borrowings at
March 31, 2009 | | $ | 6,946,160 | | $ | 3,503,600 | | $ | 579,433 | | $ | 11,029,193 | | 2.38 | % |
| | | | | | | | | | | | | | | |
Total borrowings at
December 31, 2008 | | $ | 7,381,279 | | $ | 3,903,600 | | $ | 450,177 | | $ | 11,735,056 | | 3.42 | % |
| | | | | | | | | | | | | | | |
NOTE 9—CORPORATE DEBT
The Company’s corporate debt by type is shown below (dollars in thousands):
| | | | | | | | | | | | | |
March 31, 2009 | | Face Value | | Discount | | | Fair Value
Adjustment(1) | | Net |
Senior notes: | | | | | | | | | | | | | |
8% Notes, due 2011 | | $ | 435,515 | | $ | (1,601 | ) | | $ | 12,484 | | $ | 446,398 |
7 3/8% Notes, due 2013 | | | 414,665 | | | (4,118 | ) | | | 30,834 | | | 441,381 |
7 7/8% Notes, due 2015 | | | 243,177 | | | (1,997 | ) | | | 12,693 | | | 253,873 |
| | | | | | | | | | | | | |
Total senior notes | | | 1,093,357 | | | (7,716 | ) | | | 56,011 | | | 1,141,652 |
Springing lien notes 12 1/2%, due 2017 | | | 2,057,000 | | | (455,101 | ) | | | 9,122 | | | 1,611,021 |
| | | | | | | | | | | | | |
Total corporate debt | | $ | 3,150,357 | | $ | (462,817 | ) | | $ | 65,133 | | $ | 2,752,673 |
| | | | | | | | | | | | | |
| | | | |
December 31, 2008 | | Face Value | | Discount | | | Fair Value
Adjustment(1) | | Net |
Senior notes: | | | | | | | | | | | | | |
8% Notes, due 2011 | | $ | 435,515 | | $ | (1,763 | ) | | $ | 13,855 | | $ | 447,607 |
7 3/8% Notes, due 2013 | | | 414,665 | | | (4,334 | ) | | | 32,435 | | | 442,766 |
7 7/8% Notes, due 2015 | | | 243,177 | | | (2,071 | ) | | | 13,183 | | | 254,289 |
| | | | | | | | | | | | | |
Total senior notes | | | 1,093,357 | | | (8,168 | ) | | | 59,473 | | | 1,144,662 |
Springing lien notes 12 1/2%, due 2017 | | | 2,057,000 | | | (460,515 | ) | | | 9,385 | | | 1,605,870 |
| | | | | | | | | | | | | |
Total corporate debt | | $ | 3,150,357 | | $ | (468,683 | ) | | $ | 68,858 | | $ | 2,750,532 |
| | | | | | | | | | | | | |
(1) | | The fair value adjustment is related to changes in fair value of the debt while in a fair value hedge relationship in accordance with SFAS No. 133, as amended. |
71
Senior Notes
All of the Company’s senior notes are unsecured and will rank equal in right of payment with all of the Company’s existing and future unsubordinated indebtedness and will rank senior in right of payment to all its existing and future subordinated indebtedness.
Springing Lien Notes
In November 2007, the Company issued an aggregate principal amount of $1.8 billion in springing lien notes due November 2017 (“12 1/2% Notes”). Interest is payable semi-annually and the notes are non-callable for five years and may then be called by the Company at a premium, which declines over time. The Company has the option to make interest payments on its 12 1/2% Notes in the form of either cash or additional 12 1/2% Notes through May 2010.
The indenture for the Company’s 12 1/2% Notes requires the Company to secure the 12 1/2% Notes with the property and assets of the Company and any future subsidiary guarantors (subject to certain exceptions). The requirement to secure the 12 1/2% Notes will occur on the earlier of: (1) the date on which the 8% Notes are redeemed or (2) the first date on which the Company is allowed to grant liens in excess of $300 million under the 8% Notes. The requirement to secure the 12 1/2% Notes is limited to the amount of debt under the 12 1/2% Notes that would not trigger a requirement for the Company to equally and ratably secure the existing 8% Notes, 7 3/8% Notes and the 7 7/8% Notes.
NOTE 10—LOSS PER SHARE
The following table is a reconciliation of basic and diluted loss per share (in thousands, except per share amounts):
| | | | | | | | |
| | | Three Months Ended
March 31, | |
| | | 2009 | | | 2008 | |
Basic: | | | | | | | | |
Numerator: | | | | | | | | |
Loss from continuing operations, net of tax | | $ | (232,685 | ) | | $ | (92,927 | ) |
Income from discontinued operations, net of tax | | | — | | | | 1,734 | |
| | | | | | | | |
Net loss | | $ | (232,685 | ) | | $ | (91,193 | ) |
| | | | | | | | |
Denominator: | | | | | | | | |
Basic weighted-average shares outstanding | | | 567,833 | | | | 460,857 | |
| | | | | | | | |
Diluted: | | | | | | | | |
Numerator: | | | | | | | | |
Net loss | | $ | (232,685 | ) | | $ | (91,193 | ) |
| | | | | | | | |
Denominator: | | | | | | | | |
Diluted weighted-average shares outstanding | | | 567,833 | | | | 460,857 | |
| | | | | | | | |
Per share: | | | | | | | | |
Basic loss per share: | | | | | | | | |
Loss per share from continuing operations | | $ | (0.41 | ) | | $ | (0.20 | ) |
Earnings per share from discontinued operations | | | — | | | | 0.00 | |
| | | | | | | | |
Net loss per share | | $ | (0.41 | ) | | $ | (0.20 | ) |
| | | | | | | | |
Diluted loss per share: | | | | | | | | |
Loss per share from continuing operations | | $ | (0.41 | ) | | $ | (0.20 | ) |
Earnings per share from discontinued operations | | | — | | | | 0.00 | |
| | | | | | | | |
Net loss per share | | $ | (0.41 | ) | | $ | (0.20 | ) |
| | | | | | | | |
72
For the three months ended March 31, 2009 and 2008, the Company excluded from the calculations of diluted loss per share 35.3 million shares and 85.0 million shares, respectively, of stock options and restricted stock awards and units that would have been anti-dilutive. Of the excluded shares, 3.0 million shares and 48.1 million shares for the three months ended March 31, 2009 and 2008, respectively, were anti-dilutive because of the Company’s net loss for the periods. Included in the 48.1 million shares for the three months ended March 31, 2008, were 46.7 million shares that had not been issued in connection with the Citadel Investment.
NOTE 11—REGULATORY REQUIREMENTS
Registered Broker-Dealers
The Company’s U.S. broker-dealer subsidiaries are subject to the Uniform Net Capital Rule (the “Rule”) under the Securities Exchange Act of 1934 administered by the SEC and Financial Industry Regulatory Authority (“FINRA”), which requires the maintenance of minimum net capital. The minimum net capital requirements can be met under either the Aggregate Indebtedness method or the Alternative method. Under the Aggregate Indebtedness method, a broker-dealer is required to maintain minimum net capital of the greater of 6 2/3% of its aggregate indebtedness, as defined, or a minimum dollar amount. Under the Alternative method, a broker-dealer is required to maintain net capital equal to the greater of $250,000 or 2% of aggregate debit balances arising from customer transactions. The method used depends on the individual U.S. broker-dealer subsidiary. The Company’s international broker-dealer subsidiaries, located in Europe and Asia, are subject to capital requirements determined by their respective regulators.
As of March 31, 2009, all of the Company’s significant broker-dealer subsidiaries met minimum net capital requirements. Total required net capital was $0.1 billion at March 31, 2009. In addition, the Company’s broker-dealer subsidiaries had excess net capital of $0.5 billion at March 31, 2009.
Banking
E*TRADE Bank is subject to various regulatory capital requirements administered by federal banking agencies. Failure to meet minimum capital requirements can trigger certain mandatory and possibly additional discretionary actions by regulators that, if undertaken, could have a direct material effect on E*TRADE Bank’s financial statements. Under capital adequacy guidelines and the regulatory framework for prompt corrective action, E*TRADE Bank must meet specific capital guidelines that involve quantitative measures of E*TRADE Bank’s assets, liabilities and certain off-balance sheet items as calculated under regulatory accounting practices. E*TRADE Bank’s capital amounts and classification are also subject to qualitative judgments by the regulators about components, risk weightings and other factors.
Quantitative measures established by regulation to ensure capital adequacy require E*TRADE Bank to maintain minimum amounts and ratios of Total and Tier I Capital to risk-weighted assets and Tier I Capital to adjusted total assets. As shown in the table below, at March 31, 2009 and December 31, 2008, the OTS categorized E*TRADE Bank as “well capitalized” under the regulatory framework for prompt corrective action. However, events beyond management’s control, such as a continued deterioration in residential real estate and credit markets, could adversely affect future earnings and E*TRADE Bank’s ability to meet its future capital requirements.
73
E*TRADE Bank’s required actual capital amounts and ratios are presented in the table below (dollars in thousands):
| | | | | | | | | | | | | | | | | | |
| | | Actual | | | Minimum Required
to Qualify as
Adequately
Capitalized | | | Minimum Required to be
Well Capitalized Under
Prompt Corrective
Action Provisions | |
| | | Amount | | Ratio | | | Amount | | Ratio | | | Amount | | Ratio | |
March 31, 2009: | | | | | | | | | | | | | | | | | | |
Total Capital to risk-weighted assets | | $ | 2,883,333 | | 11.82 | % | | >$ | 1,951,326 | | >8.0 | % | | >$ | 2,439,158 | | >10.0 | % |
Tier I Capital to risk-weighted assets | | $ | 2,568,150 | | 10.53 | % | | >$ | 975,663 | | >4.0 | % | | >$ | 1,463,495 | | > 6.0 | % |
Tier I Capital to adjusted total assets | | $ | 2,568,150 | | 5.63 | % | | >$ | 1,824,067 | | >4.0 | % | | >$ | 2,280,084 | | > 5.0 | % |
December 31, 2008: | | | | | | | | | | | | | | | | | | |
Total Capital to risk-weighted assets | | $ | 3,136,650 | | 12.95 | % | | >$ | 1,937,583 | | >8.0 | % | | >$ | 2,421,979 | | >10.0 | % |
Tier I Capital to risk-weighted assets | | $ | 2,824,299 | | 11.66 | % | | >$ | 968,792 | | >4.0 | % | | >$ | 1,453,187 | | > 6.0 | % |
Tier I Capital to adjusted total assets | | $ | 2,824,299 | | 6.29 | % | | >$ | 1,796,601 | | >4.0 | % | | >$ | 2,245,751 | | > 5.0 | % |
NOTE 12—COMMITMENTS, CONTINGENCIES AND OTHER REGULATORY MATTERS
Legal Matters
Litigation Matters
On October 27, 2000, a complaint was filed in the Superior Court for the State of California, County of Santa Clara, entitled, “Ajaxo, Inc., a Delaware corporation, Plaintiff, versus E*TRADE GROUP, INC., a Delaware corporation; and Everypath, Inc., a California corporation; and Does 1 through 50, inclusively, Defendants.” Through this complaint, Ajaxo sought damages and certain non-monetary relief for the Company’s alleged breach of a non-disclosure agreement with Ajaxo pertaining to certain wireless technology offered to the Company by Ajaxo as well as damages and other relief against both the Company and defendant Everypath, Inc., for their alleged misappropriation of Ajaxo’s trade secrets. Following a jury trial, a judgment was entered in 2003 in favor of Ajaxo against the Company for $1.3 million dollars for breach of the Ajaxo non-disclosure agreement. Although the jury also found in favor of Ajaxo on its misappropriation of trade secrets claim against the Company and defendant Everypath, the trial court subsequently denied Ajaxo’s requests for additional damages and relief on these claims. Thereafter, all parties appealed, and on December 21, 2005, the California Court of Appeal affirmed the above-described award against the Company for breach of the nondisclosure agreement but remanded the case to the trial court for the limited purpose of determining what, if any, additional damages Ajaxo may be entitled to as a result of the jury’s previous finding in favor of Ajaxo on its misappropriation of trade secrets claim against the Company and defendant Everypath. Following the foregoing ruling by the Court of Appeal, defendant Everypath ceased operations and made an assignment for the benefit of its creditors in January, 2006. As a result, defendant Everypath is no longer defending the case. Although the Company paid Ajaxo the full amount due on the judgment against it above, the case, consistent with the rulings issued by the Court of Appeal, was remanded back to the trial court, and on May 30, 2008, a jury returned a verdict in favor of E*TRADE denying all claims raised and demands for damages against the Company by Ajaxo. Following the trial court’s filing on September 5, 2008, of entry of judgment in favor of E*TRADE, Ajaxo filed post trial motions asking the trial court to grant a new trial and to vacate its September 5, 2008, entry of judgment in favor of the Company. By order dated November 4, 2008, the court denied these motions. On December 2, 2008, Ajaxo filed its notice of appeal, and the due date for Ajaxo to file its opening appellate brief is now June 8, 2009. The Company will continue to vigorously defend itself and oppose Ajaxo’s appeal.
On October 2, 2007, a class action complaint alleging violations of the federal securities laws was filed in the United States District Court for the Southern District of New York against the Company and its then Chief Executive Officer and Chief Financial Officer entitled, “Larry Freudenberg, Individually and on Behalf of All
74
Others Similarly Situated, Plaintiff, versus E*TRADE Financial Corporation, Mitchell H. Caplan and Robert J. Simmons, Defendants.” By order dated July 17, 2008, the trial court consolidated the Freudenberg action with four other purported class actions, all of which were filed in the United States District Court for the Southern District of New York and which were based on the same facts and circumstances as the Freudenberg action. By the same July 17, 2008 order, the trial court appointed the “Kristen-Straxton Group” and Ira Newman co-lead plaintiffs and Brower Piven and Levi & Korsinski, respectively, as lead and co-lead plaintiffs’ counsel. Thereafter, on January 16, 2009, plaintiffs served their “Consolidated Amended Class Action Complaint for Violations of the Federal Securities Laws.” In their amended complaint, plaintiffs again name the Company’s former chief executive and financial officers as defendants as well as Dennis Webb, the Company’s former Capital Markets Division President. In their amended complaint, Plaintiffs allege causes of action for violations of Section 10(b) of the Securities Exchange Act of 1934 (the “Exchange Act”) and Rule 10b-5 against all defendants and violations of Section 20(a) of the Exchange Act against the individual defendants. In specific, plaintiffs contend, among other things, that the value of E*TRADE’s stock between April 19, 2006 and November 9, 2007 (the “class period”) was artificially inflated because defendants, among other things, issued materially false and misleading statements and failed to disclose that the Company was experiencing a rise in delinquency rates in its mortgage and home equity portfolios; failed to timely record an impairment on its mortgage and home equity portfolios; materially overvalued its securities portfolio, which included assets backed by mortgages; and based on the foregoing, lacked a reasonable basis for the positive statements it made about the Company’s earnings and prospects. Plaintiffs seek to recover damages in an amount to be proven at trial, including interest and attorneys’ fees and costs. By prior order of the court, defendants filed their motion to dismiss on April 2, 2009, and all parties are to complete briefing on defendants’ motion to dismiss by August 17, 2009. The Company intends to vigorously defend itself against these claims.
On August 15, 2008, an action entitled, “Ronald M. Tate, Trustee of the Ronald M. Tate Trust Dtd 4/13/88, and George Avakian, an Individual, Plaintiffs, versus E*TRADE Financial Corporation, Mitchell H. Caplan, an Individual, and Robert J. Simmons, an Individual, Defendants” was filed in the United States District Court for the Southern District of New York. The Tate action is based on the same facts and circumstances, and contains the same claims, as the Freudenberg consolidated actions discussed above. By agreement of the parties and approval of the court, the Tate action has been consolidated with the Freudenberg consolidated actions for the purpose of pre-trial discovery. The Company intends to vigorously defend itself against these claims.
Based upon the same facts and circumstances alleged in the Freudenberg consolidated actions above, a verified shareholder derivative complaint was filed in the United States District Court for the Southern District of New York on October 4, 2007, against the Company’s then Chief Executive Officer, President/Chief Operating Officer, Chief Financial Officer and individual members of its board of directors entitled, “Catherine Rubery, Derivatively on behalf of E*TRADE Financial Corporation, Plaintiff, versus Mitchell H. Caplan, R. Jarrett Lilien, Robert J. Simmons, George A. Hayter, Daryl Brewster, Ronald D. Fisher, Michael K. Parks, C. Catherine Raffaeli, Lewis E. Randall, Donna L. Weaver, and Stephen H. Willard, Defendants, -and- E*TRADE Financial Corporation, a Delaware corporation, Nominal Defendant.” Plaintiff alleges, among other things, causes of action for breach of fiduciary duty, waste of corporate assets, unjust enrichment, and violation of the Securities Exchange Act of 1934 and Rule 10b-5 promulgated thereunder. The above federal shareholder derivative complaint has been consolidated with another shareholder derivative complaint brought in the same court and against the same named defendants entitled, “Marilyn Clark, Derivatively On Behalf of E*TRADE Financial Corporation, Plaintiff, versus Mitchell H. Caplan, et al., Defendants” (collectively, with the Rubery case, the “federal derivative actions”). Three similar derivative actions, based on the same facts and circumstances as the federal derivative actions, but alleging exclusively state causes of action, have been filed in the Supreme Court of the State of New York, New York County. These three state cases have been ordered consolidated in that court under the caption “In re: E*Trade Financial Corporation Derivative Litigation, Lead Index No. 07-603736” (the “state derivative actions”). In these state derivative actions, plaintiffs filed a consolidated amended complaint on March 23, 2009. By agreement of the parties and approval of the respective courts, further proceedings in both these federal and state derivative actions will continue to trail those in the federal securities class actions discussed above.
75
On April 2, 2008, a class action complaint alleging violations of the federal securities laws was filed in the United States District Court for the Southern District of New York against the Company entitled, “John W. Oughtred, Individually, and on Behalf of all Others Similarly Situated, Plaintiff, v. E*TRADE Financial Corporation and E*TRADE Securities, LLC, Defendants.” Plaintiff contends, among other things, that the E*TRADE defendants committed various sales practice violations in the sale of certain auction rate securities to investors between April 2, 2003, and February 13, 2008 (the “class period”) by allegedly misrepresenting that these securities were highly liquid and safe investments for short term investing. On April 17, 2008, the trial court entered an order relieving the defendants of their obligation to move, answer or otherwise respond to the complaint until such time as the court may deem appropriate. Thereafter, plaintiff Oughtred joined plaintiffs in twelve other actions involving auction rate securities (in which the Company isnot named as defendant) in filing a motion seeking to centralize all 13 actions in the Southern District of New York or in the alternative, the Northern District of California. By order filed October 9, 2008, a United States Judicial Panel on Multi-District Litigation denied plaintiffs’ motion to transfer. On December 18, 2008, plaintiffs filed their first amended class action complaint, and defendants filed their pending motion to dismiss plaintiffs’ amended complaint on February 5, 2009. Subsequently, plaintiff John Oughtred voluntarily dismissed his class action claims against defendants on March 12, 2009; as a result, Mr. Oughtred no longer is a party to this class action. The Company intends to vigorously defend itself against the claims raised in this action.
On October 11, 2006, a state class action entitled, “Nikki Greenberg, and all those similarly situated, plaintiffs, versus E*TRADE FINANCIAL Corporation, defendant” was filed in the Superior Court for the State of California, County of Los Angeles on behalf of all customers or consumers who allegedly made or received telephone calls from E*TRADE that were recorded without their knowledge or consent following a telephone call from plaintiff Greenberg to the Company’s Beverly Hills financial center on August 8, 2006, that was recorded during a brief period when the Company’s automated notice system was out of order. On February 7, 2008, class certification was granted and the class defined to consist of (1) all persons in California who received telephone calls from E*TRADE and whose calls were recorded without their consent within three years of October 11, 2006, and (2) all persons who made calls from California to the Beverly Hills financial center of the Company on August 8, 2006. In the interim, the Company has filed motions seeking to de-certify or further limit the defined class, and plaintiffs have filed competing motions seeking to expand it. On February 6, 2009, the parties to this dispute reached an agreement in principle to settle this matter, and the trial court will hold a hearing on May 11, 2009, on plaintiffs’ motion seeking preliminary approval of the parties’ proposed settlement. As a result, the hearing of the parties’ pending motions, formerly scheduled for March 6, 2009, has been taken off the calendar.
In addition to the matters described above, the Company is subject to various legal proceedings and claims that arise in the normal course of business which could have a material adverse effect on its financial position, results of operations or cash flows. In each pending matter, the Company contests liability or the amount of claimed damages. In view of the inherent difficulty of predicting the outcome of such matters, particularly in cases where claimants seek substantial or indeterminate damages, or where investigation or discovery have yet to be completed, the Company cannot predict with certainty the loss or range of loss related to such matters, how such matters will be resolved, when they will ultimately be resolved, or what any eventual settlement, fine, penalty or other relief might be. Subject to the foregoing, the Company believes that the outcome of any such pending matter will not have a material adverse effect on the consolidated financial condition of the Company, although the outcome could be material to the Company’s or a business segment’s operating results in the future, depending, among other things, upon the Company’s or business segment’s income for such period.
An unfavorable outcome in any matter that is not covered by insurance could have a material adverse effect on the Company’s business, financial condition, results of operations or cash flows. In addition, even if the ultimate outcomes are resolved in the Company’s favor, the defense of such litigation could entail considerable cost or the diversion of the efforts of management, either of which could have a material adverse effect on the Company’s business, financial condition, results of operations or cash flows.
76
Regulatory Matters
The securities and banking industries are subject to extensive regulation under federal, state and applicable international laws. From time to time, the Company has been threatened with or named as a defendant in, lawsuits, arbitrations and administrative claims involving securities, banking and other matters. The Company is also subject to periodic regulatory audits and inspections. Compliance and trading problems that are reported to regulators, such as the SEC, FINRA, OTS or FDIC by dissatisfied customers or others are investigated by such regulators, and may, if pursued, result in formal claims being filed against the Company by customers or disciplinary action being taken against the Company or its employees by regulators. Any such claims or disciplinary actions that are decided against the Company could have a material impact on the financial results of the Company or any of its subsidiaries.
In March 2009, the Company’s subsidiary ETCM and 13 other current or former specialist firms on various regional exchanges finalized a settlement of SEC charges alleging that such firms executed proprietary orders in a given security prior to a customer order in the same security (a practice commonly known as “trading ahead”) during the period 1999-2005. ETCM was a specialist on the Chicago Stock Exchange during the period under review although it exited the specialist business in 2007. According to the SEC complaint, the majority of the alleged violations occurred between 1999 and 2002. As part of the settlement, ETCM consented to the entry of an injunction from future violations of Chicago Stock Exchange Article 9 Rule 17 and the payment of $28.3 million in disgorgement and a $5.7 million penalty, both of which had been reserved for in prior periods. ETCM also consented to findings that it violated section 17(a) of the Securities Exchange Act of 1934 and Rule 17a-3(a)(1) thereunder by failing to make or keep current an itemized record of all purchases and sales in its proprietary account. ETCM settled the SEC charges without admitting or denying the allegations of the complaint.
On October 17, 2007, the SEC initiated an informal inquiry into matters related to the Company’s mortgage loan and mortgage-related securities investment portfolios. That inquiry is continuing. The Company is cooperating fully with the SEC in this matter.
Beginning in approximately August 2008, representatives of various states attorneys general and FINRA initiated informal inquiries regarding the purchase of auction rate securities by the Company’s customers. The Company is cooperating with these inquiries.
Insurance
The Company maintains insurance coverage that management believes is reasonable and prudent. The principal insurance coverage it maintains covers commercial general liability; property damage; hardware/software damage; cyber liability; directors and officers; employment practices liability; certain criminal acts against the Company; and errors and omissions. The Company believes that such insurance coverage is adequate for the purpose of its business. The Company’s ability to maintain this level of insurance coverage in the future, however, is subject to the availability of affordable insurance in the marketplace.
Reserves
For all legal matters, reserves are established in accordance with SFAS No. 5. Once established, reserves are adjusted based on available information when an event occurs requiring an adjustment.
Commitments
In the normal course of business, the Company makes various commitments to extend credit and incur contingent liabilities that are not reflected in the consolidated balance sheet. Significant changes in the economy or interest rates influence the impact that these commitments and contingencies have on the Company in the future.
77
Loans
In 2008, the Company exited its direct retail lending business, which was the last remaining loan origination channel of the Company. In March 2009, the Company partnered with a third party company to provide access to real estate loans for our customers. This product is being offered as a convenience to the Company’s customers and is not one of its primary product offerings. The Company structured this arrangement to minimize the typical risks commonly associated with mortgage lending. The third party company providing this product performs all processing and underwriting of these loans. Shortly after closing, the third party company purchases the loans from the Company and is responsible for the credit risk associated with these loans. As a result, the Company had $16.3 million in commitments to originate loans at March 31, 2009. The Company had no commitments to sell or purchase loans at March 31, 2009.
Securities, Unused Lines of Credit and Certificates of Deposit
At March 31, 2009, the Company had commitments to purchase $1.0 billion and sell $0.9 billion in securities. In addition, the Company had approximately $1.8 billion of certificates of deposit scheduled to mature in less than one year and $2.5 billion of unfunded commitments to extend credit.
Guarantees
In prior periods when the Company sold loans, the Company provided guarantees to investors purchasing mortgage loans, which are considered standard representations and warranties within the mortgage industry. The primary guarantees are that: the mortgage and the mortgage note have been duly executed and each is the legal, valid and binding obligation of the Company, enforceable in accordance with its terms; the mortgage has been duly acknowledged and recorded and is valid; and the mortgage and the mortgage note are not subject to any right of rescission, set-off, counterclaim or defense, including, without limitation, the defense of usury, and no such right of rescission, set-off, counterclaim or defense has been asserted with respect thereto. While the Company no longer sells loans, it is still responsible for the guarantees on loans sold in prior years. If these claims prove to be untrue, the investor can require the Company to repurchase the loan and return all loan purchase and servicing release premiums.
Management has determined that quantifying the potential liability exposure is not meaningful due to the nature of the standard representations and warranties, which rarely result in loan repurchases.
ETBH raised capital through the formation of trusts, which sold trust preferred stock in the capital markets. The capital securities are mandatorily redeemable in whole at the due date, which is generally 30 years after issuance. Each trust issues Floating Rate Cumulative Preferred Securities at par, with a liquidation amount of $1,000 per capital security. The proceeds from the sale of issuances are invested in ETBH’s Floating Rate Junior Subordinated Debentures.
During the 30-year period prior to the redemption of the Floating Rate Cumulative Preferred Securities, ETBH guarantees the accrued and unpaid distributions on these securities, as well as the redemption price of the securities and certain costs that may be incurred in liquidating, terminating or dissolving the trusts (all of which would otherwise be payable by the trusts). At March 31, 2009, management estimated that the maximum potential liability under this arrangement is equal to approximately $437.6 million or the total face value of these securities plus dividends, which may be unpaid at the termination of the trust arrangement.
NOTE 13—SEGMENT INFORMATION
Beginning in the first quarter of 2009, the Company revised its segment financial reporting to reflect the manner in which its chief operating decision maker had begun assessing the Company’s performance and making resource allocation decisions. As a result, the Company now reports its operating results in two segments: 1) “Trading and Investing”, which includes the businesses that were formerly in the “Retail” segment and now
78
includes the Company’s market making business, and 2) “Balance Sheet Management”, which includes the businesses from the former “Institutional” segment, other than the market-making business. The Company’s segment financial information from prior periods has been reclassified in accordance with the new segment financial reporting.
Trading and investing includes:
| | • | | brokerage and related asset gathering products and services; |
| | • | | investor-focused banking products and services; |
| | • | | stock plan administration products and services. |
Balance sheet management includes:
| | • | | managing loans previously originated or purchased from third parties; and |
| | • | | leveraging these loans and customer cash and deposit relationships. |
The Company evaluates the performance of its segments based on segment contribution (net revenue less provision for loan losses and operating expense). All corporate overhead, administrative and technology charges are allocated to segments either in proportion to their respective direct costs or based upon specific operating criteria.
79
Financial information for the Company’s reportable segments is presented in the following tables (dollars in thousands):
| | | | | | | | | | | | | | | | |
| | | Three Months Ended March 31, 2009 | |
| | | Trading and
Investing | | | Balance Sheet
Management | | | Eliminations(1) | | | Total | |
Revenue: | | | | | | | | | | | | | | | | |
Operating interest income | | $ | 259,626 | | | $ | 444,292 | | | $ | (217,281 | ) | | $ | 486,637 | |
Operating interest expense | | | (97,951 | ) | | | (327,305 | ) | | | 217,281 | | | | (207,975 | ) |
| | | | | | | | | | | | | | | | |
Net operating interest income | | | 161,675 | | | | 116,987 | | | | — | | | | 278,662 | |
| | | | | | | | | | | | | | | | |
Commission | | | 125,626 | | | | — | | | | — | | | | 125,626 | |
Fees and service charges | | | 45,055 | | | | 1,660 | | | | — | | | | 46,715 | |
Principal transactions | | | 17,642 | | | | — | | | | — | | | | 17,642 | |
Gain (loss) on loans and securities, net | | | (22 | ) | | | 16,529 | | | | — | | | | 16,507 | |
Other revenue | | | 8,894 | | | | 3,297 | | | | — | | | | 12,191 | |
| | | | | | | | | | | | | | | | |
Total non-interest income | | | 197,195 | | | | 21,486 | | | | — | | | | 218,681 | |
| | | | | | | | | | | | | | | | |
Total net revenue | | | 358,870 | | | | 138,473 | | | | — | | | | 497,343 | |
| | | | | | | | | | | | | | | | |
Provision for loan losses | | | — | | | | 453,963 | | | | — | | | | 453,963 | |
Operating expense: | | | | | | | | | | | | | | | | |
Compensation and benefits | | | 69,643 | | | | 14,529 | | | | — | | | | 84,172 | |
Clearing and servicing | | | 20,776 | | | | 21,895 | | | | — | | | | 42,671 | |
Advertising and market development | | | 43,586 | | | | 5 | | | | — | | | | 43,591 | |
Communications | | | 21,462 | | | | 99 | | | | — | | | | 21,561 | |
Professional services | | | 12,908 | | | | 6,722 | | | | — | | | | 19,630 | |
Occupancy and equipment | | | 19,673 | | | | (132 | ) | | | — | | | | 19,541 | |
Depreciation and amortization | | | 17,705 | | | | 2,569 | | | | — | | | | 20,274 | |
Amortization of other intangibles | | | 7,436 | | | | — | | | | — | | | | 7,436 | |
Facility restructuring and other exit activities | | | (87 | ) | | | (25 | ) | | | — | | | | (112 | ) |
Other | | | 23,618 | | | | 11,602 | | | | — | | | | 35,220 | |
| | | | | | | | | | | | | | | | |
Total operating expense | | | 236,720 | | | | 57,264 | | | | — | | | | 293,984 | |
| | | | | | | | | | | | | | | | |
Segment income (loss) | | $ | 122,150 | | | $ | (372,754 | ) | | $ | — | | | $ | (250,604 | ) |
| | | | | | | | | | | | | | | | |
(1) | | Reflects elimination of transactions between trading and investing and balance sheet management segments, which includes deposits and intercompany transfer pricing arrangements. |
80
| | | | | | | | | | | | | | | | |
| | | Three Months Ended March 31, 2008 | |
| | | Trading and
Investing | | | Balance Sheet
Management | | | Eliminations(1) | | | Total | |
Revenue: | | | | | | | | | | | | | | | | |
Operating interest income | | $ | 416,684 | | | $ | 590,121 | | | $ | (307,214 | ) | | $ | 699,591 | |
Operating interest expense | | | (209,378 | ) | | | (471,056 | ) | | | 307,214 | | | | (373,220 | ) |
| | | | | | | | | | | | | | | | |
Net operating interest income | | | 207,306 | | | | 119,065 | | | | — | | | | 326,371 | |
| | | | | | | | | | | | | | | | |
Commission | | | 121,669 | | | | 586 | | | | — | | | | 122,255 | |
Fees and service charges | | | 50,877 | | | | 4,064 | | | | — | | | | 54,941 | |
Principal transactions | | | 20,376 | | | | 114 | | | | — | | | | 20,490 | |
Loss on loans and securities, net | | | (2 | ) | | | (8,565 | ) | | | — | | | | (8,567 | ) |
Other revenue | | | 9,753 | | | | 3,867 | | | | (16 | ) | | | 13,604 | |
| | | | | | | | | | | | | | | | |
Total non-interest income | | | 202,673 | | | | 66 | | | | (16 | ) | | | 202,723 | |
| | | | | | | | | | | | | | | | |
Total net revenue | | | 409,979 | | | | 119,131 | | | | (16 | ) | | | 529,094 | |
| | | | | | | | | | | | | | | | |
Provision for loan losses | | | — | | | | 233,871 | | | | — | | | | 233,871 | |
Operating expense: | | | | | | | | | | | | | | | | |
Compensation and benefits | | | 90,932 | | | | 32,196 | | | | — | | | | 123,128 | |
Clearing and servicing | | | 20,347 | | | | 24,554 | | | | (16 | ) | | | 44,885 | |
Advertising and market development | | | 57,444 | | | | 4 | | | | — | | | | 57,448 | |
Communications | | | 24,102 | | | | 992 | | | | — | | | | 25,094 | |
Professional services | | | 14,852 | | | | 8,793 | | | | — | | | | 23,645 | |
Occupancy and equipment | | | 19,640 | | | | 858 | | | | — | | | | 20,498 | |
Depreciation and amortization | | | 16,910 | | | | 4,743 | | | | — | | | | 21,653 | |
Amortization of other intangibles | | | 10,910 | | | | — | | | | — | | | | 10,910 | |
Facility restructuring and other exit activities | | | 182 | | | | 10,384 | | | | — | | | | 10,566 | |
Other | | | 30,637 | | | | (14,131 | ) | | | — | | | | 16,506 | |
| | | | | | | | | | | | | | | | |
Total operating expense | | | 285,956 | | | | 68,393 | | | | (16 | ) | | | 354,333 | |
| | | | | | | | | | | | | | | | |
Segment income (loss) | | $ | 124,023 | | | $ | (183,133 | ) | | $ | — | | | $ | (59,110 | ) |
| | | | | | | | | | | | | | | | |
(1) | | Reflects elimination of transactions between trading and investing and balance sheet management segments, which includes deposits and intercompany transfer pricing arrangements. |
Segment Assets
| | | | | | | | | | | | |
| | | Trading and
Investing | | Balance Sheet
Management | | Eliminations | | Total |
As of March 31, 2009 | | $ | 7,863,539 | | $ | 41,583,337 | | $ | — | | $ | 49,446,876 |
As of December 31, 2008 | | $ | 7,612,154 | | $ | 40,926,061 | | $ | — | | $ | 48,538,215 |
No single customer accounted for more than 10% of total net revenue for the three months ended March 31, 2009 and 2008.
| ITEM 4. | CONTROLS AND PROCEDURES |
| | (a) | | Our Chief Executive Officer and our Chief Financial Officer, after evaluating the effectiveness of the Company’s “disclosure controls and procedures” (as defined in the Securities Exchange Act of 1934 (“Exchange Act”) Rules 13a-15(e) and 15d-15(e)) as of the end of the period covered by this quarterly report, have concluded that our disclosure controls and procedures are effective based on their evaluation of these controls and procedures required by paragraph (b) of Exchange Act Rules 13a-15 or 15d-15. |
81
| | (b) | | Our Chief Executive Officer and our Chief Financial Officer have evaluated the changes to the Company’s internal control over financial reporting that occurred during our last fiscal quarter ended March 31, 2009, as required by paragraph (d) of Exchange Act Rules 13a-15 and 15d-15, and have concluded that there were no such changes that materially affected, or are reasonably likely to materially affect, the Company’s internal control over financial reporting. |
PART II—OTHER INFORMATION
On October 27, 2000, a complaint was filed in the Superior Court for the State of California, County of Santa Clara, entitled, “Ajaxo, Inc., a Delaware corporation, Plaintiff, versus E*TRADE GROUP, INC., a Delaware corporation; and Everypath, Inc., a California corporation; and Does 1 through 50, inclusively, Defendants.” Through this complaint, Ajaxo sought damages and certain non-monetary relief for the Company’s alleged breach of a non-disclosure agreement with Ajaxo pertaining to certain wireless technology offered to the Company by Ajaxo as well as damages and other relief against both the Company and defendant Everypath, Inc., for their alleged misappropriation of Ajaxo’s trade secrets. Following a jury trial, a judgment was entered in 2003 in favor of Ajaxo against the Company for $1.3 million dollars for breach of the Ajaxo non-disclosure agreement. Although the jury also found in favor of Ajaxo on its misappropriation of trade secrets claim against the Company and defendant Everypath, the trial court subsequently denied Ajaxo’s requests for additional damages and relief on these claims. Thereafter, all parties appealed, and on December 21, 2005, the California Court of Appeal affirmed the above-described award against the Company for breach of the nondisclosure agreement but remanded the case to the trial court for the limited purpose of determining what, if any, additional damages Ajaxo may be entitled to as a result of the jury’s previous finding in favor of Ajaxo on its misappropriation of trade secrets claim against the Company and defendant Everypath. Following the foregoing ruling by the Court of Appeal, defendant Everypath ceased operations and made an assignment for the benefit of its creditors in January, 2006. As a result, defendant Everypath is no longer defending the case. Although the Company paid Ajaxo the full amount due on the judgment against it above, the case, consistent with the rulings issued by the Court of Appeal, was remanded back to the trial court, and on May 30, 2008, a jury returned a verdict in favor of E*TRADE denying all claims raised and demands for damages against the Company by Ajaxo. Following the trial court’s filing on September 5, 2008, of entry of judgment in favor of E*TRADE, Ajaxo filed post trial motions asking the trial court to grant a new trial and to vacate its September 5, 2008, entry of judgment in favor of the Company. By order dated November 4, 2008, the court denied these motions. On December 2, 2008, Ajaxo filed its notice of appeal, and the due date for Ajaxo to file its opening appellate brief is now June 8, 2009. The Company will continue to vigorously defend itself and oppose Ajaxo’s appeal.
On October 2, 2007, a class action complaint alleging violations of the federal securities laws was filed in the United States District Court for the Southern District of New York against the Company and its then Chief Executive Officer and Chief Financial Officer entitled, “Larry Freudenberg, Individually and on Behalf of All Others Similarly Situated, Plaintiff, versus E*TRADE Financial Corporation, Mitchell H. Caplan and Robert J. Simmons, Defendants.” By order dated July 17, 2008, the trial court consolidated the Freudenberg action with four other purported class actions, all of which were filed in the United States District Court for the Southern District of New York and which were based on the same facts and circumstances as the Freudenberg action. By the same July 17, 2008 order, the trial court appointed the “Kristen-Straxton Group” and Ira Newman co-lead plaintiffs and Brower Piven and Levi & Korsinski, respectively, as lead and co-lead plaintiffs’ counsel. Thereafter, on January 16, 2009, plaintiffs served their “Consolidated Amended Class Action Complaint for Violations of the Federal Securities Laws.” In their amended complaint, plaintiffs again name the Company’s former chief executive and financial officers as defendants as well as Dennis Webb, the Company’s former Capital Markets Division President. In their amended complaint, Plaintiffs allege causes of action for violations of Section 10(b) of the Securities Exchange Act of 1934 (the “Exchange Act”) and Rule 10b-5 against all defendants and violations of Section 20(a) of the Exchange Act against the individual defendants. In specific, plaintiffs contend, among other things, that the value of E*TRADE’s stock between April 19, 2006 and
82
November 9, 2007 (the “class period”) was artificially inflated because defendants, among other things, issued materially false and misleading statements and failed to disclose that the Company was experiencing a rise in delinquency rates in its mortgage and home equity portfolios; failed to timely record an impairment on its mortgage and home equity portfolios; materially overvalued its securities portfolio, which included assets backed by mortgages; and based on the foregoing, lacked a reasonable basis for the positive statements it made about the Company’s earnings and prospects. Plaintiffs seek to recover damages in an amount to be proven at trial, including interest and attorneys’ fees and costs. By prior order of the court, defendants filed their motion to dismiss on April 2, 2009, and all parties are to complete briefing on defendants’ motion to dismiss by August 17, 2009. The Company intends to vigorously defend itself against these claims.
On August 15, 2008, an action entitled, “Ronald M. Tate, Trustee of the Ronald M. Tate Trust Dtd 4/13/88, and George Avakian, an Individual, Plaintiffs, versus E*TRADE Financial Corporation, Mitchell H. Caplan, an Individual, and Robert J. Simmons, an Individual, Defendants” was filed in the United States District Court for the Southern District of New York. The Tate action is based on the same facts and circumstances, and contains the same claims, as the Freudenberg consolidated actions discussed above. By agreement of the parties and approval of the court, the Tate action has been consolidated with the Freudenberg consolidated actions for the purpose of pre-trial discovery. The Company intends to vigorously defend itself against these claims.
Based upon the same facts and circumstances alleged in the Freudenberg consolidated actions above, a verified shareholder derivative complaint was filed in the United States District Court for the Southern District of New York on October 4, 2007, against the Company’s then Chief Executive Officer, President/Chief Operating Officer, Chief Financial Officer and individual members of its board of directors entitled, “Catherine Rubery, Derivatively on behalf of E*TRADE Financial Corporation, Plaintiff, versus Mitchell H. Caplan, R. Jarrett Lilien, Robert J. Simmons, George A. Hayter, Daryl Brewster, Ronald D. Fisher, Michael K. Parks, C. Catherine Raffaeli, Lewis E. Randall, Donna L. Weaver, and Stephen H. Willard, Defendants, -and- E*TRADE Financial Corporation, a Delaware corporation, Nominal Defendant.” Plaintiff alleges, among other things, causes of action for breach of fiduciary duty, waste of corporate assets, unjust enrichment, and violation of the Securities Exchange Act of 1934 and Rule 10b-5 promulgated thereunder. The above federal shareholder derivative complaint has been consolidated with another shareholder derivative complaint brought in the same court and against the same named defendants entitled, “Marilyn Clark, Derivatively On Behalf of E*TRADE Financial Corporation, Plaintiff, versus Mitchell H. Caplan, et al., Defendants” (collectively, with the Rubery case, the “federal derivative actions”). Three similar derivative actions, based on the same facts and circumstances as the federal derivative actions, but alleging exclusively state causes of action, have been filed in the Supreme Court of the State of New York, New York County. These three state cases have been ordered consolidated in that court under the caption “In re: E*Trade Financial Corporation Derivative Litigation, Lead Index No. 07-603736” (the “state derivative actions”). In these state derivative actions, plaintiffs filed a consolidated amended complaint on March 23, 2009. By agreement of the parties and approval of the respective courts, further proceedings in both these federal and state derivative actions will continue to trail those in the federal securities class actions discussed above.
On April 2, 2008, a class action complaint alleging violations of the federal securities laws was filed in the United States District Court for the Southern District of New York against the Company entitled, “John W. Oughtred, Individually, and on Behalf of all Others Similarly Situated, Plaintiff, v. E*TRADE Financial Corporation and E*TRADE Securities, LLC, Defendants.” Plaintiff contends, among other things, that the E*TRADE defendants committed various sales practice violations in the sale of certain auction rate securities to investors between April 2, 2003, and February 13, 2008 (the “class period”) by allegedly misrepresenting that these securities were highly liquid and safe investments for short term investing. On April 17, 2008, the trial court entered an order relieving the defendants of their obligation to move, answer or otherwise respond to the complaint until such time as the court may deem appropriate. Thereafter, plaintiff Oughtred joined plaintiffs in twelve other actions involving auction rate securities (in which the Company isnot named as defendant) in filing a motion seeking to centralize all 13 actions in the Southern District of New York or in the alternative, the Northern District of California. By order filed October 9, 2008, a United States Judicial Panel on Multi-District
83
Litigation denied plaintiffs’ motion to transfer. On December 18, 2008, plaintiffs filed their first amended class action complaint, and defendants filed their pending motion to dismiss plaintiffs’ amended complaint on February 5, 2009. Subsequently, plaintiff John Oughtred voluntarily dismissed his class action claims against defendants on March 12, 2009; as a result, Mr. Oughtred no longer is a party to this class action. The Company intends to vigorously defend itself against the claims raised in this action.
On October 11, 2006, a state class action entitled, “Nikki Greenberg, and all those similarly situated, plaintiffs, versus E*TRADE FINANCIAL Corporation, defendant” was filed in the Superior Court for the State of California, County of Los Angeles on behalf of all customers or consumers who allegedly made or received telephone calls from E*TRADE that were recorded without their knowledge or consent following a telephone call from plaintiff Greenberg to the Company’s Beverly Hills financial center on August 8, 2006, that was recorded during a brief period when the Company’s automated notice system was out of order. On February 7, 2008, class certification was granted and the class defined to consist of (1) all persons in California who received telephone calls from E*TRADE and whose calls were recorded without their consent within three years of October 11, 2006, and (2) all persons who made calls from California to the Beverly Hills financial center of the Company on August 8, 2006. In the interim, the Company has filed motions seeking to de-certify or further limit the defined class, and plaintiffs have filed competing motions seeking to expand it. On February 6, 2009, the parties to this dispute reached an agreement in principle to settle this matter, and the trial court will hold a hearing on May 11, 2009, on plaintiffs’ motion seeking preliminary approval of the parties’ proposed settlement. As a result, the hearing of the parties’ pending motions, formerly scheduled for March 6, 2009, has been taken off the calendar.
In addition to the matters described above, the Company is subject to various legal proceedings and claims that arise in the normal course of business which could have a material adverse effect on its financial position, results of operations or cash flows. In each pending matter, the Company contests liability or the amount of claimed damages. In view of the inherent difficulty of predicting the outcome of such matters, particularly in cases where claimants seek substantial or indeterminate damages, or where investigation or discovery have yet to be completed, the Company cannot predict with certainty the loss or range of loss related to such matters, how such matters will be resolved, when they will ultimately be resolved, or what any eventual settlement, fine, penalty or other relief might be. Subject to the foregoing, the Company believes that the outcome of any such pending matter will not have a material adverse effect on the consolidated financial condition of the Company, although the outcome could be material to the Company’s or a business segment’s operating results in the future, depending, among other things, upon the Company’s or business segment’s income for such period.
In March 2009, the Company’s subsidiary ETCM and 13 other current or former specialist firms on various regional exchanges finalized a settlement of SEC charges alleging that such firms executed proprietary orders in a given security prior to a customer order in the same security (a practice commonly known as “trading ahead”) during the period 1999-2005. ETCM was a specialist on the Chicago Stock Exchange during the period under review although it exited the specialist business in 2007. According to the SEC complaint, the majority of the alleged violations occurred between 1999 and 2002. As part of the settlement, ETCM consented to the entry of an injunction from future violations of Chicago Stock Exchange Article 9 Rule 17 and the payment of $28.3 million in disgorgement and a $5.7 million penalty, both of which had been reserved for in prior periods. ETCM also consented to findings that it violated section 17(a) of the Securities Exchange Act of 1934 and Rule 17a-3(a)(1) thereunder by failing to make or keep current an itemized record of all purchases and sales in its proprietary account. ETCM settled the SEC charges without admitting or denying the allegations of the complaint.
On October 17, 2007, the SEC initiated an informal inquiry into matters related to the Company’s mortgage loan and mortgage-related securities investment portfolios. That inquiry is continuing. The Company is cooperating fully with the SEC in this matter.
84
Beginning in approximately August 2008, representatives of various states attorneys general and FINRA initiated informal inquiries regarding the purchase of auction rate securities by the Company’s customers. The Company is cooperating with these inquiries.
An unfavorable outcome in any matter that is not covered by insurance could have a material adverse effect on the Company’s business, financial condition, results of operations or cash flows. In addition, even if the ultimate outcomes are resolved in the Company’s favor, the defense of such litigation could entail considerable cost or the diversion of the efforts of management, either of which could have a material adverse effect on the Company’s business, financial condition, results of operations or cash flows.
The Company maintains insurance coverage that management believes is reasonable and prudent. The principal insurance coverage it maintains covers commercial general liability; property damage; hardware/software damage; cyber liability; directors and officers; employment practices liability; certain criminal acts against the Company; and errors and omissions. The Company believes that such insurance coverage is adequate for the purpose of its business. The Company’s ability to maintain this level of insurance coverage in the future, however, is subject to the availability of affordable insurance in the marketplace.
The risk factor presented below is a new risk factor for the Company and should be considered in addition to all of the risk factors previously disclosed in our 2008 Annual Report on Form 10-K.
Our primary banking regulator has advised us to raise new capital for E*TRADE Bank and to reduce our own leverage, which will create significant dilution to our stockholders.
Our primary banking regulator, the Office of Thrift Supervision, has advised us in the near term to raise new capital for E*TRADE Bank and reduce the leverage of the parent holding company. Such efforts will involve the issuance of securities either in the public markets or to private investors, which will create significant dilution to current shareholders. One alternative that the Company continues to pursue is the U.S. Treasury’s TARP Capital Purchase Program which, if it is made available, would likely have conditions that would also produce significant dilution. The Company cannot predict when or if its application will be acted on.
| ITEM 2. | UNREGISTERED SALES OF EQUITY SECURITIES AND USE OF PROCEEDS |
None.
| ITEM 3. | DEFAULTS UPON SENIOR SECURITIES |
None.
| ITEM 4. | SUBMISSION OF MATTERS TO A VOTE OF SECURITY HOLDERS |
None.
None.
| | |
| |
| *31.1 | | Certification—Section 302 of the Sarbanes-Oxley Act of 2002 |
| |
| *31.2 | | Certification—Section 302 of the Sarbanes-Oxley Act of 2002 |
| |
| *32.1 | | Certification—Section 906 of the Sarbanes-Oxley Act of 2002 |
85
SIGNATURES
Pursuant to the requirements of Section 13 or 15(d) of the Securities Exchange Act of 1934, the Registrant has duly caused this report to be signed on its behalf by the undersigned, thereunto duly authorized.
Dated: May 5, 2009
| | |
E*TRADE Financial Corporation (Registrant) |
By | | /s/ DONALD H. LAYTON |
| | Donald H. Layton |
| | Chairman & Chief Executive Officer |
| |
By | | /s/ BRUCE P. NOLOP |
| | Bruce P. Nolop |
| | Chief Financial Officer (Principal Financial and Accounting Officer) |
86