 E*TRADE Common Stock Offering Investor Presentation June 2009 Donald H. Layton, Chairman & CEO Robert V. Burton, EVP & Bank President Bruce P. Nolop, EVP & CFO © 2009 E*TRADE FINANCIAL Corp. All rights reserved. This presentation contains confidential information and may not be disclosed without E*TRADE FINANCIAL Corporation’s written permission. Exhibit 99.1 |
© 2009 E*TRADE FINANCIAL Corp. All rights reserved. 2 Notice to Investors Forward-Looking Statements The statements contained in this presentation that are forward looking are based on current expectations that are subject to a number of uncertainties and risks, and actual results may differ materially. Such statements include those relating to the ability of the Company to complete the offering, complete the proposed debt exchange and thereby reduce interest expense and debt burden, strengthen its capital structure and ensure long-term success of its core trading and investing business. The uncertainties and risks include, but are not limited to, potential negative regulatory consequences resulting from actions by the Office of Thrift Supervision or other regulators, underparticipation in this offering or the proposed debt exchange, given that there are no binding agreements with any holder of the Company’s debt securities other than Citadel, and potential failure to obtain regulatory and shareholder approval for the proposed debt exchange and related matters. Additional uncertainties and risks affecting the business, financial condition, results of operations and prospects of the Company include, but are not limited to, potential changes in market activity, anticipated changes in the rate of new customer acquisition, the conversion of new visitors to the site to customers, the activity of customers and assets held at the institution, seasonality, macro trends of the economy in general and the residential real estate market, instability in the consumer credit markets and credit trends, rising mortgage interest rates, tighter mortgage lending guidelines across the industry, increased mortgage loan delinquency and default rates, portfolio growth, portfolio seasoning and resolution through collections, sales or charge-offs, the development and enhancement of products and services, competitive pressures (including price competition), system failures, economic and political conditions, including changes to the U.S. Treasury’s Troubled Asset Relief Program, changes in consumer behavior and the introduction of competing products having technological and/or other advantages. We encourage all investors to read and consider the risks discussed in the “Risk Factors” section of our preliminary prospectus supplement dated June 17, 2009 for a more complete understanding of the risks associated with an investment in the Company. Further information about these risks and uncertainties can be found in the information included or incorporated in the annual, quarterly and current reports on Form 10-K, Form 10-Q and Form 8-K previously filed by E*TRADE FINANCIAL Corporation with the Securities and Exchange Commission (“SEC”) (including information under the caption “Risk Factors”). Any forward-looking statement included in this release speaks only as of the date of this communication; the Company disclaims any obligation to update any information. |
© 2009 E*TRADE FINANCIAL Corp. All rights reserved. 3 Notice to Investors Proxy Statement In connection with the Special Meeting of Stockholders, E*TRADE FINANCIAL Corporation is filing a preliminary proxy statement with the SEC and expects to file a definitive proxy statement as soon as practicable and to mail a definitive proxy statement to stockholders as soon as practicable. STOCKHOLDERS ARE ADVISED TO READ THE DEFINITIVE PROXY STATEMENT BECAUSE IT WILL CONTAIN IMPORTANT INFORMATION ABOUT THE PROPOSALS TO BE PRESENTED AND VOTED UPON. Stockholders may also obtain a copy of the definitive proxy statement and any other relevant documents filed by E*TRADE FINANCIAL Corporation for free at the SEC web site at www.sec.gov. The definitive proxy statement and other documents also may be obtained for free from E*TRADE FINANCIAL Corporation, Attn: Corporate Secretary, 135 East 57th Street, New York, New York 10022. E*TRADE FINANCIAL Corporation and its directors, executive officers and other members of management and employees may be deemed participants in the solicitation of proxies and voting instructions for the 2009 Special Meeting of Stockholders. Information concerning the interests of these persons, if any, in the matters to be voted upon is set forth in the proxy statement. Registration Statement The issuer has filed a registration statement (including a prospectus) and a prospectus supplement with the SEC for the offering to which this communication relates. Before you invest, you should read the prospectus in that registration statement, the prospectus supplement and other documents the issuer has filed with the SEC for more complete information about the issuer and this offering. You may get these documents for free by visiting IDEA on the SEC Web site at www.sec.gov. Alternatively, the issuer, any underwriter or any dealer participating in the offering will arrange to send you the prospectus and prospectus supplement if you request it by calling J.P. Morgan Securities Inc. toll-free at 866.430.0686 or Sandler O’Neill & Partners, L.P. toll-free at 866.805.4128. |
 © 2009 E*TRADE FINANCIAL Corp. All rights reserved. 4 Offering Summary Thursday, June 18 Expected pricing: 90 days for Company, Management, Directors and Citadel Lock-up provisions: $400 million Transaction Size: E*TRADE Securities LLC Co-Manager: J.P. Morgan Securities Inc. and Sandler O'Neill + Partners, L.P. Lead Book-Running Managers: $50 – 100 million participation at the offering price Citadel Commitment: Debt Exchange: Minimum $800MM exchange of Notes due 2011 and 2017 for zero-coupon convertible debt due 2019 Other Capital Action: Primarily to contribute equity capital to E*TRADE Bank General corporate purposes Use of Proceeds: Follow-on Public Common Stock Offering Type of Offering: E*TRADE FINANCIAL Corporation (NASDAQ: ETFC) Issuer: $1.2 Billion Capital Strengthening Plan |
 © 2009 E*TRADE FINANCIAL Corp. All rights reserved. 5 Overview Thriving online brokerage business Demonstrating leadership in industry with strong secular growth trends Continuing to exceed expectations and remaining competitive among largest online brokers Strategically investing for long term growth Improving loan performance trends Showing meaningful signs of improvement Proactively strengthening capital structure Reducing balance sheet risk Bolstering Bank capital ratios Reducing Parent debt burden |
 © 2009 E*TRADE FINANCIAL Corp. All rights reserved. 6 Thriving Online Brokerage Business |
 © 2009 E*TRADE FINANCIAL Corp. All rights reserved. 7 Excellent growth through market downturn Trading and account growth match leading competitors Market recognition of industry leadership Profit and growth through discipline and focus Emphasis on core customer franchise Disciplined management: expense, profit, service quality Full investment pipeline Marketing to drive account acquisition Thriving Online Brokerage Business |
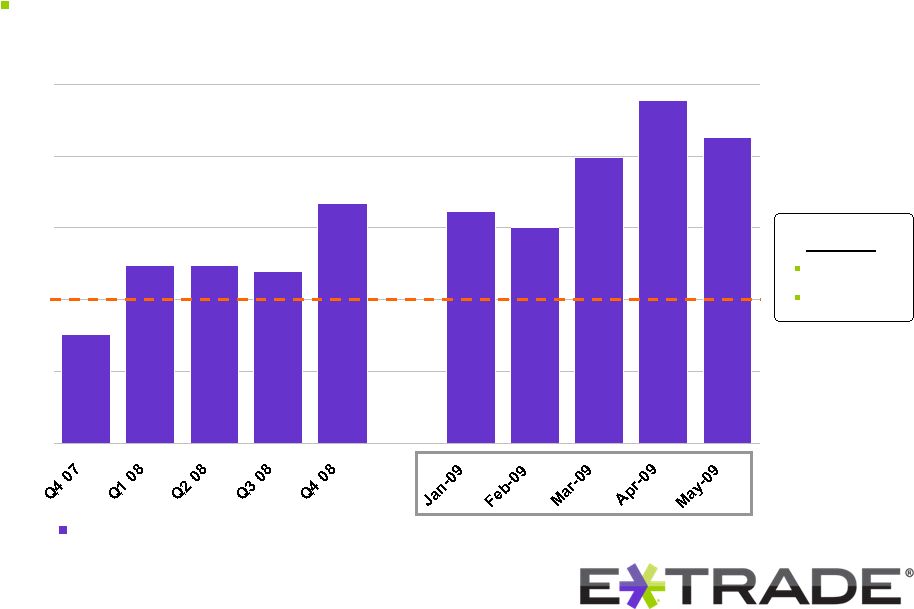
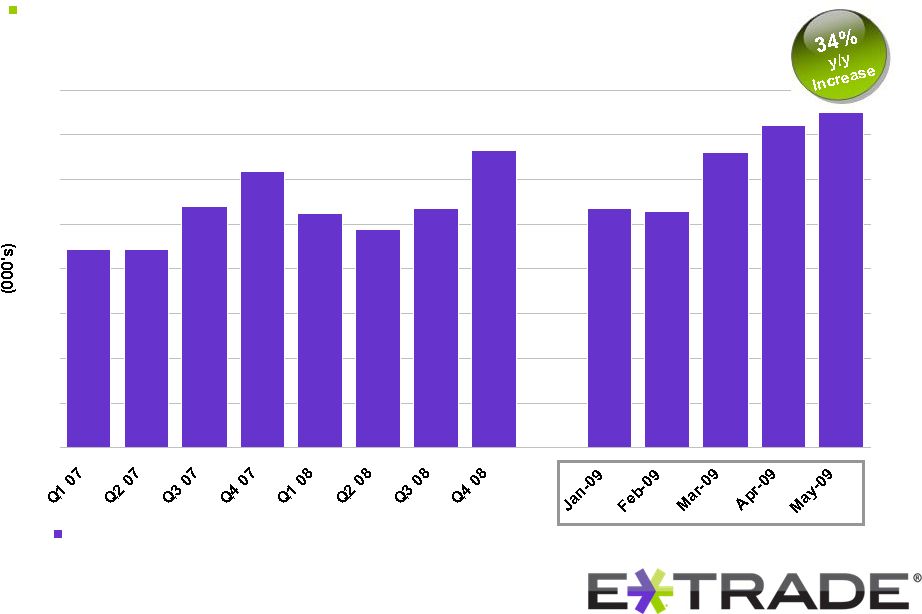 © 2009 E*TRADE FINANCIAL Corp. All rights reserved. 161 161 185 204 181 172 184 216 184 182 215 230 239 50 75 100 125 150 175 200 225 250 Daily Average Revenue Trades 8 Online Brokerage Business: Customer DART growth exceeding expectations… |
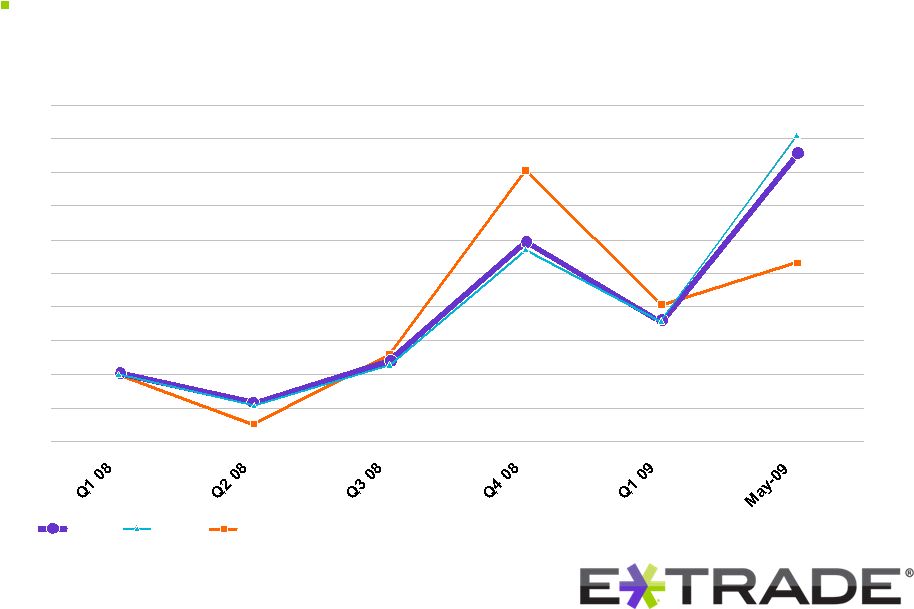 © 2009 E*TRADE FINANCIAL Corp. All rights reserved. DARTs Indexed to Q1 2008 90 95 100 105 110 115 120 125 130 135 140 ETFC AMTD SCHW 9 Online Brokerage Business : …and at levels competitive within largest online brokers |
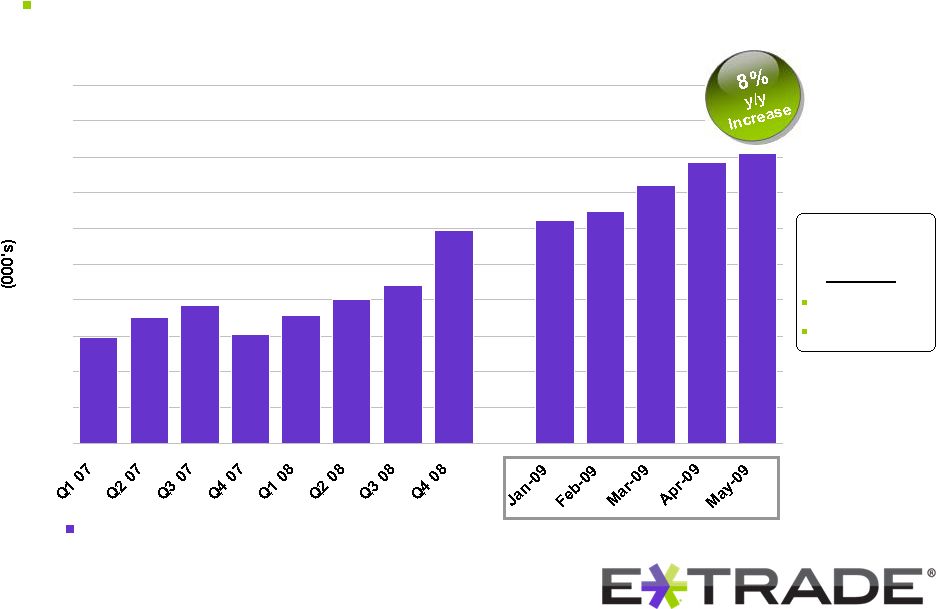 © 2009 E*TRADE FINANCIAL Corp. All rights reserved. 2,716 2,449 2,475 2,492 2,453 2,478 2,501 2,520 2,597 2,623 2,661 2,693 2,611 2,300 2,350 2,400 2,450 2,500 2,550 2,600 2,650 2,700 2,750 2,800 Brokerage Accounts 10 Online Brokerage Business: Total Customer Accounts May-09: 4,541 5% y/y increase Continued record brokerage and total customer accounts |
 © 2009 E*TRADE FINANCIAL Corp. All rights reserved. 76% 124% 124% 120% 167% 0% 161% 150% 199% 239% 213% 0% 50% 100% 150% 200% 250% Gross New Brokerage Accounts / Attriting Brokerage Accounts 11 Online Brokerage Business: Improved brokerage account replacement rate Attrition Rate (1) Q1 08: 17% Q1 09: 13% (1)(a) |
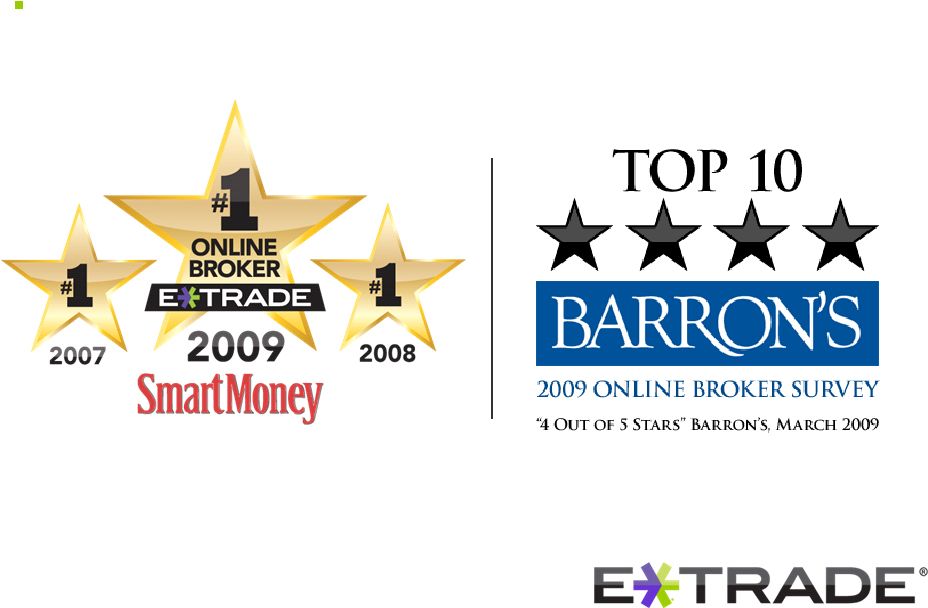 © 2009 E*TRADE FINANCIAL Corp. All rights reserved. 12 Online Brokerage Business: Continued third-party recognition as best in class |
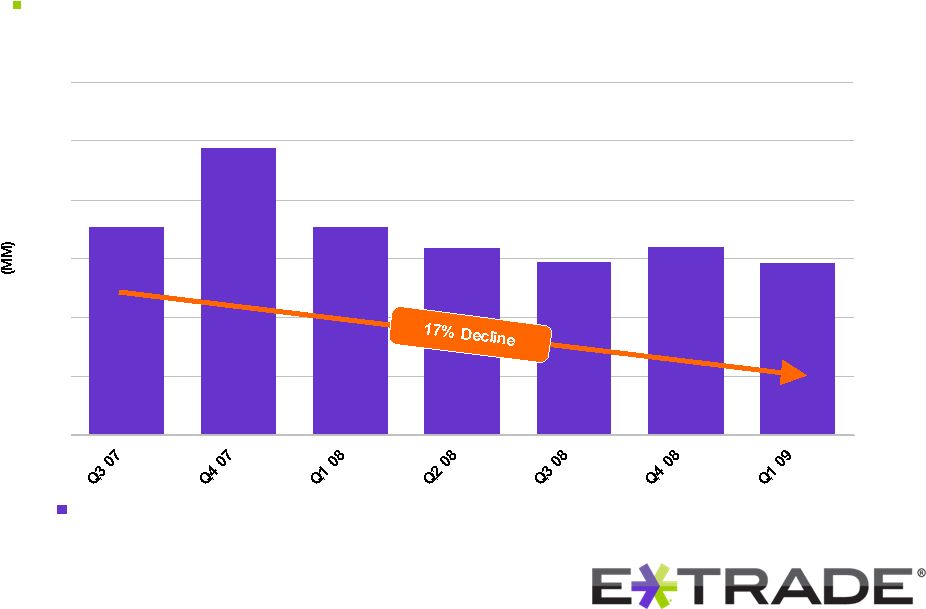 © 2009 E*TRADE FINANCIAL Corp. All rights reserved. $294 $355 $490 $354 $319 $296 $321 $0 $100 $200 $300 $400 $500 $600 Total Corporate Operating Expenses Online Brokerage Business: 13 Disciplined expense management |
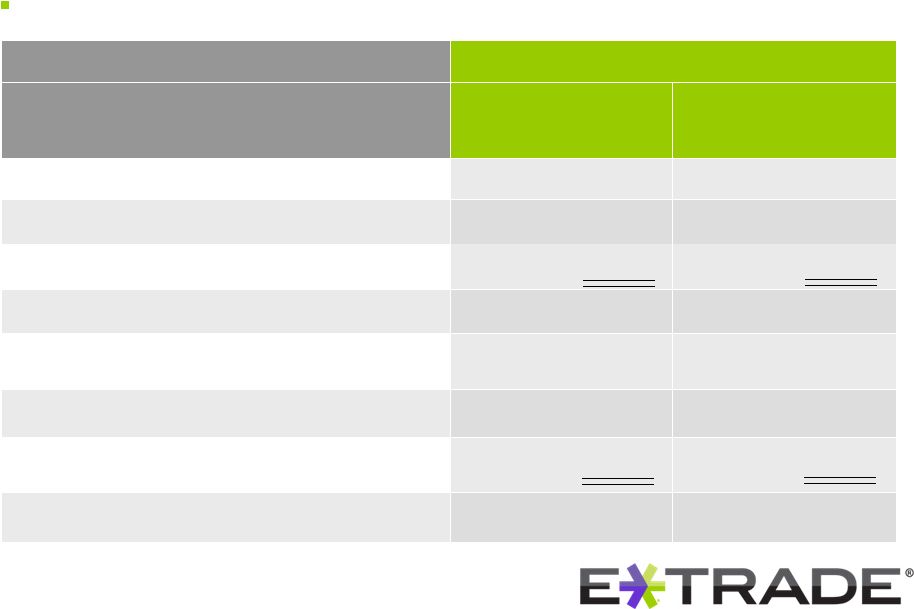 © 2009 E*TRADE FINANCIAL Corp. All rights reserved. Trailing Four Quarters (Q2 08 – Q1 09) 40% $834 1,230 886 344 2,064 844 $1,220 All Segments 824 Commission, fees and other revenue (2) 1,609 Total net revenue (pre-credit costs) (2) 39% $621 988 701 287 $785 Trading and Investing segment Operating margin (pre-credit cost) (4) Segment income (pre-credit cost) (3) Total operating expenses Non-compensation expenses Compensation and benefits Net operating interest income ($ in millions) Online Brokerage Business: 14 Strong Company results (pre-credit cost) Footnoted items are non-GAAP financial measures. See the Appendix for a reconciliation to the most directly comparable GAAP financial measures. |
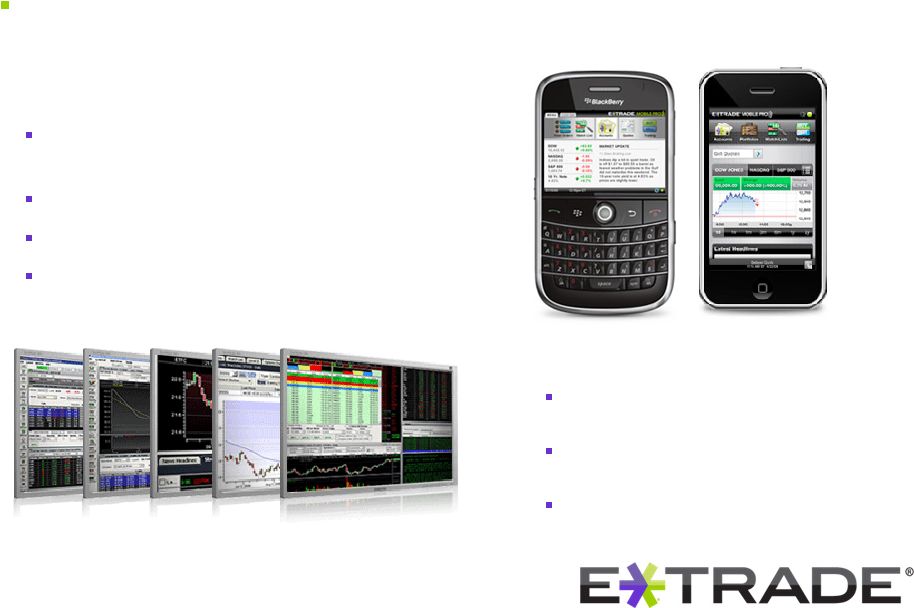 © 2009 E*TRADE FINANCIAL Corp. All rights reserved. 15 Enhancements Back-testing and advanced screeners Fixed Income, Mutual fund, ETF tools for long term investors; Portfolio Margining New Products E*TRADE Mobile Pro for BlackBerry ® and iPhone ™ Investor Resource Center Pro Sectors & Industry Tracker Excel Manager on Power E*TRADE Pro Online Brokerage Business: Full development pipeline of tools for active traders and long-term investors iPhone™ is a trademark of Apple Inc. BlackBerry® is a registered trademark of RIM |
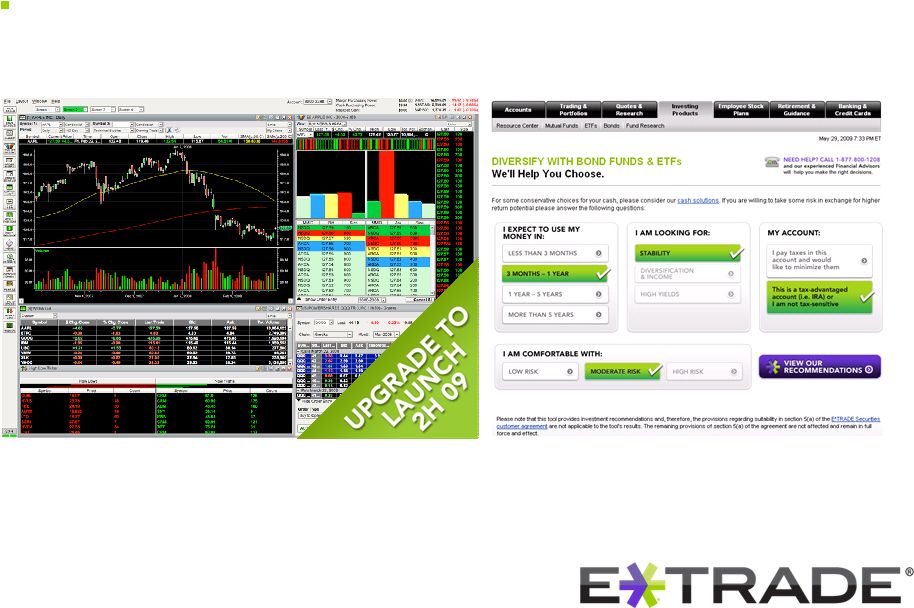 © 2009 E*TRADE FINANCIAL Corp. All rights reserved. 16 Tools focused on long-term investors Tools focused on active traders Online Brokerage Business: Full development pipeline of tools for active traders and long-term investors |
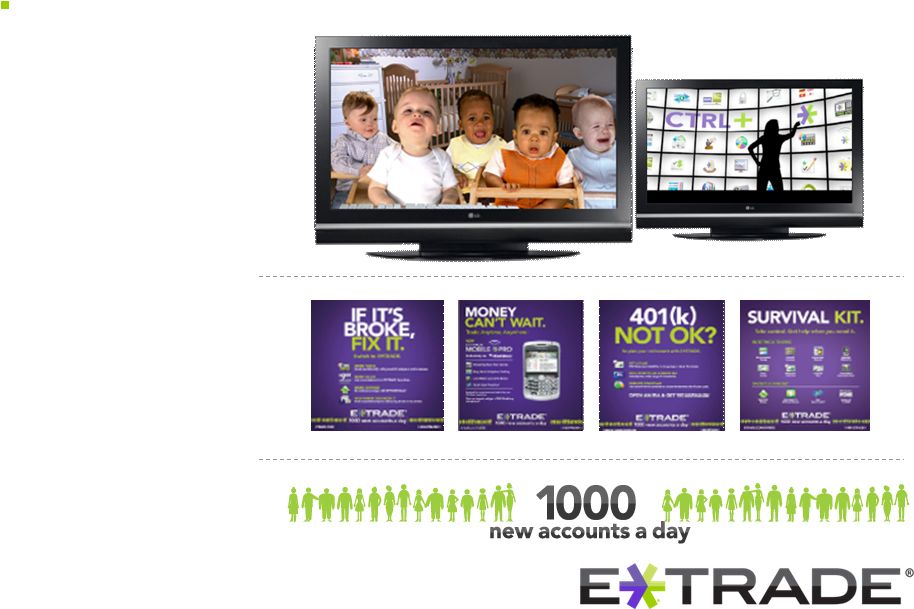 © 2009 E*TRADE FINANCIAL Corp. All rights reserved. Brand identification / Features and function Market & Event driven Validation tagline Online Brokerage Business: 17 Highly effective advertising driving account acquisition |
 © 2009 E*TRADE FINANCIAL Corp. All rights reserved. 18 Improving Loan Performance Trends |
 © 2009 E*TRADE FINANCIAL Corp. All rights reserved. 19 Portfolio in full run-off mode Proactively managing to reduce charge-offs Eliminated significant risk from open lines Comprehensive loan modification program proving successful Portfolio showing meaningful 2009 improvements Home equity delinquency trends show improvement 1-4 family delinquency levels stable Building reserves ahead of charge-offs Well-developed stress test regimen for loan portfolio Improving Loan Performance Trends |
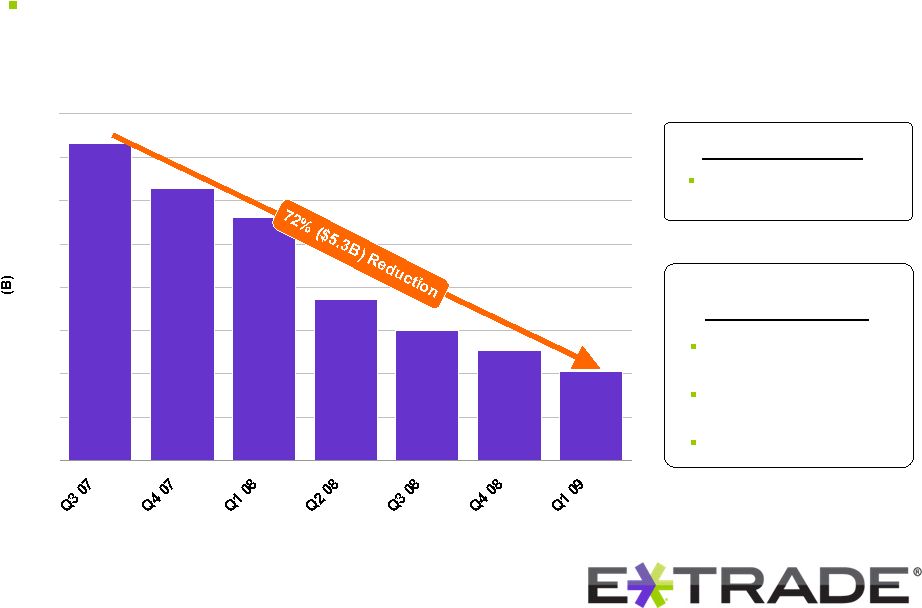
 © 2009 E*TRADE FINANCIAL Corp. All rights reserved. 20 Loan Performance: $2.2 ($0.1) ($0.7) $3.0 Consumer $9.5 ($1.2) ($1.7) $12.4 Home equity ($1.5) ($0.2) Net Charge-Offs Loan Balance (5) 3/31/09 TOTAL 1-4 family Loans ($ in billions) ($6.5) ($4.1) Net Paydowns (6) $32.3 $16.9 Loan Balance (5) 9/30/07 $24.3 $12.6 Loan portfolio in full run-off mode 25% Decline |
 © 2009 E*TRADE FINANCIAL Corp. All rights reserved. 0% $0.0B 2009 0% $0.0B 2008 7% $0.7B 2003 and older $9.5B $1.0B $2.3B $4.4B $1.1B 11% 2004 24% 2005 100% Total 46% 2006 12% 2007 Home Equity Unpaid Balances by Origination Vintage Loan Performance: 21 Home equity delinquency trends show improvement partly due to low 2007 vintage and overall seasoning 2007 2003 and older 2004 2005 2006 |
 © 2009 E*TRADE FINANCIAL Corp. All rights reserved. $2.0 $2.5 $3.0 $3.7 $5.6 $6.3 $7.3 $0.0 $1.0 $2.0 $3.0 $4.0 $5.0 $6.0 $7.0 $8.0 Undrawn Home Equity Lines Loan Performance: 22 Proactively managing to reduce future charge-offs Total Loan Put-Backs $175MM since Q3 07 Comprehensive Loan Modification Program Nearly $200MM in loans modified Majority are permanent interest rate reductions Conservative reserving |
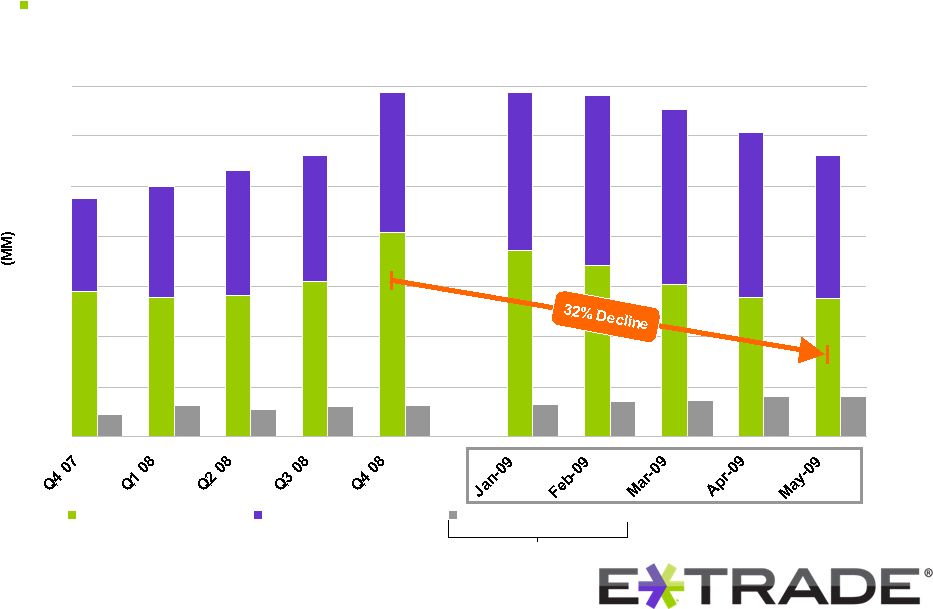 © 2009 E*TRADE FINANCIAL Corp. All rights reserved. $0 $100 $200 $300 $400 $500 $600 $700 30-89 Days Delinquent 90-179 Days Delinquent 180 + Days Delinquent 23 Loan Performance: Expected recovery value Home equity delinquency trend improvement in 2009 |
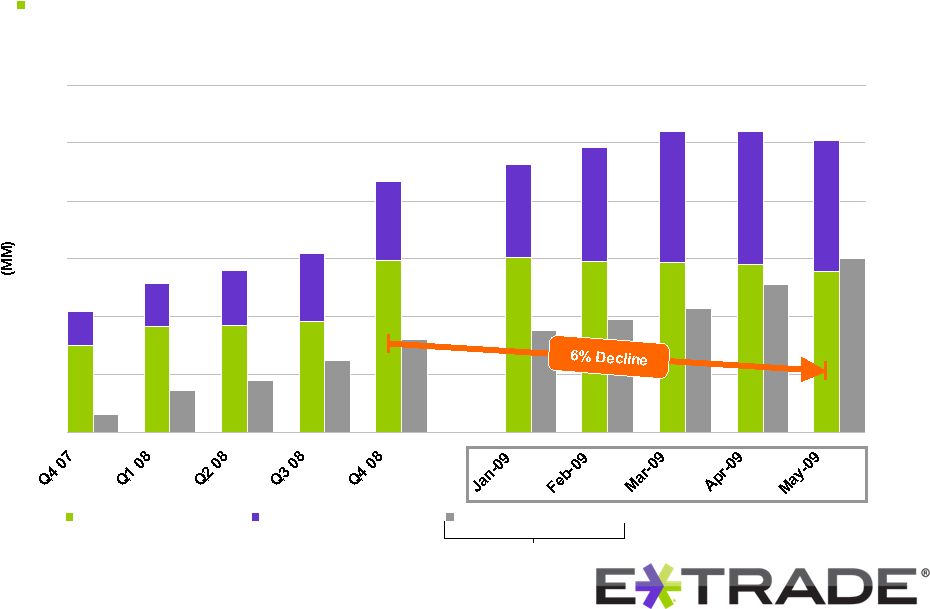 © 2009 E*TRADE FINANCIAL Corp. All rights reserved. $0 $200 $400 $600 $800 $1,000 $1,200 30-89 Days Delinquent 90-179 Days Delinquent 180 + Days Delinquent 24 Loan Performance: 1-4 Family delinquency levels stabilizing in 2009 Expected recovery value |
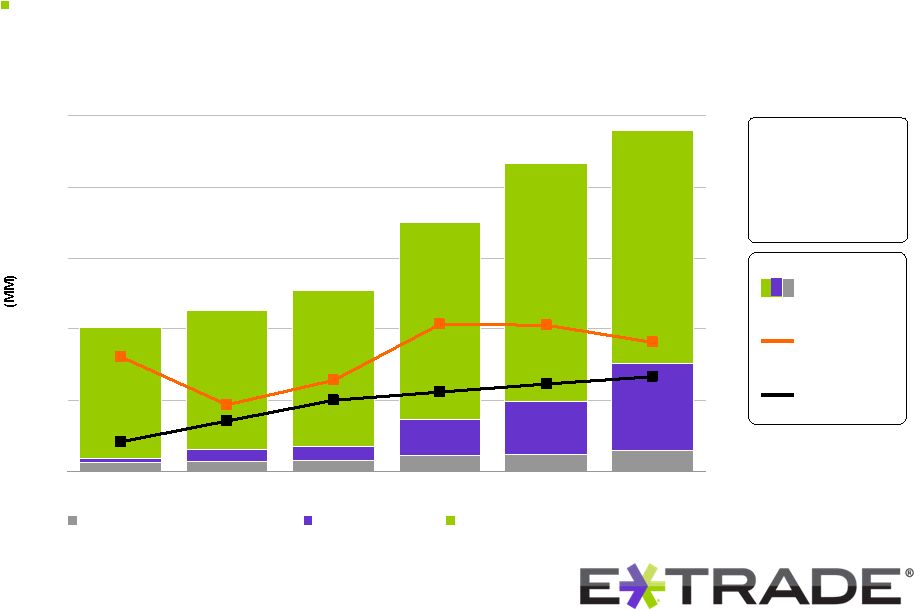 © 2009 E*TRADE FINANCIAL Corp. All rights reserved. 25 Loan Performance: $0 $250 $500 $750 $1,000 $1,250 Q4 07 Q1 08 Q2 08 Q3 08 Q4 08 Q1 09 Consumer and other 1-4 family Home equity $1,201 $1,081 $874 $636 $566 $508 Building reserves ahead of charge-offs; provision recently declining Over Past 6 Quarters Provision for loan losses 1.7x net charge-offs Allowance for loan losses Provision for loan losses Net charge -offs |
 © 2009 E*TRADE FINANCIAL Corp. All rights reserved. 26 Loan Performance: $1,011 $62 $812 $137 2008 Charge-offs $2,791 $2,131 Implied charge-offs $257 $175 Consumer and other 2009 & 2010 Charge-offs at SCAP Ratios Treasury Department’s “More Adverse” scenario applied to 12/31/08 loan balances $1,183 $773 Low $1,484 $1,050 High Home equity 1-4 family ($ in millions) Well-developed stress test regimen for credit portfolio $1,201 Allowance (Reserve for Q2 09 – Q1 10) $334 Net charge-offs Q1 09 |
 © 2009 E*TRADE FINANCIAL Corp. All rights reserved. 27 Proactively Strengthening Capital Structure |
 © 2009 E*TRADE FINANCIAL Corp. All rights reserved. 28 Proactively Strengthening Capital Structure Aggressive and Early Capital Actions Successful divestitures of non-core assets Reducing loan portfolio and balance sheet risk Maintaining Bank capital in excess of regulatory well-capitalized thresholds Objectives of $1.2 Billion Capital Plan Increasing Bank Capital Reducing Parent debt burden |
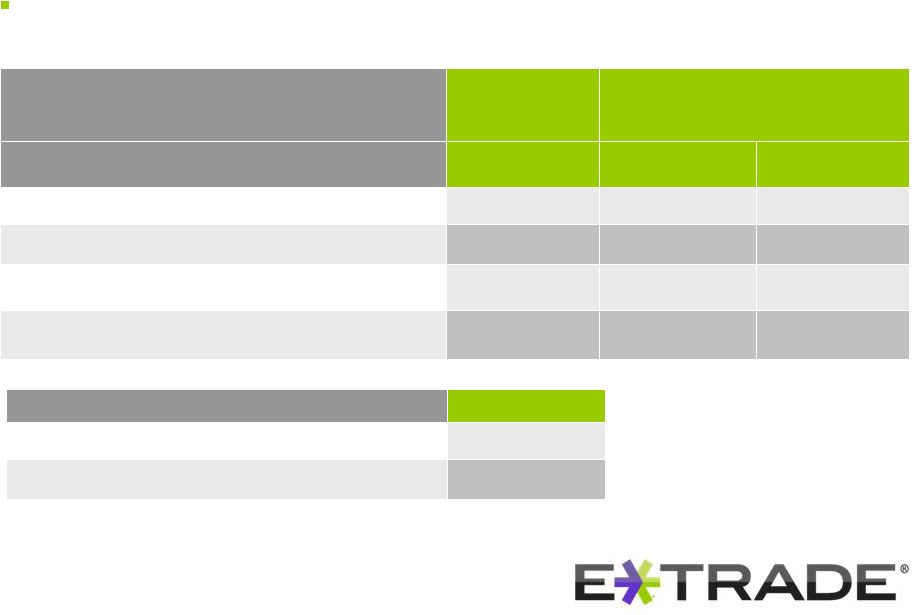
 © 2009 E*TRADE FINANCIAL Corp. All rights reserved. 29 Capital Structure Actions: $24 $69 Aircraft related assets $3 $25 RAA Wealth Management $754 $145 $515 Net Proceeds $478 $22 $429 Pre-Tax Gain Total IL&FS Investsmart E*TRADE Canada 2008 Transactions ($ in millions) Raised significant capital through divestitures of non-core assets in 2008 |
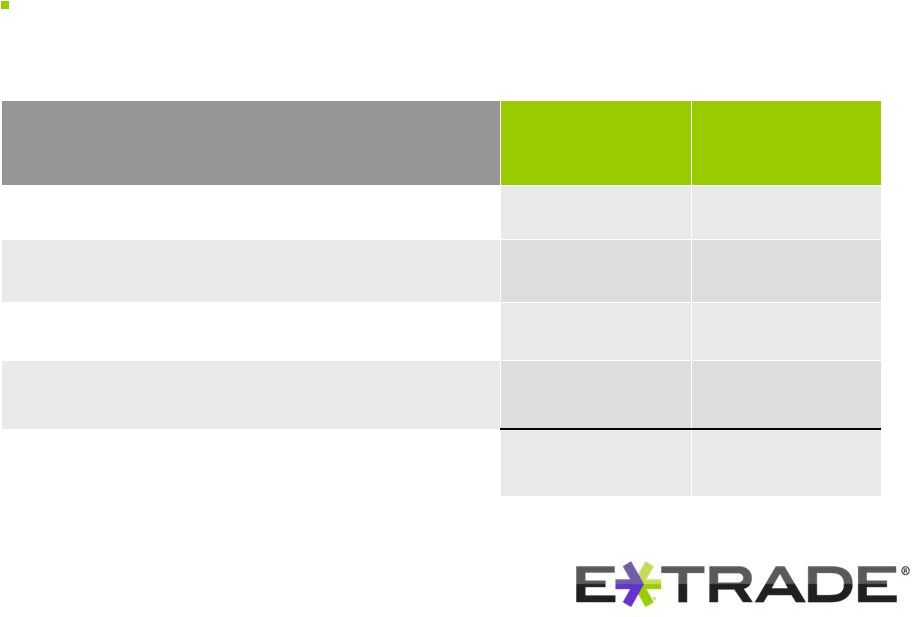
 © 2009 E*TRADE FINANCIAL Corp. All rights reserved. 30 ($14.8) $49.4 $64.2 Total assets – E*TRADE FINANCIAL ($9.1) $23.3 $32.4 Loan Portfolio ($6.2) $14.9 $21.1 Other assets $24.4 $11.2 Balance 3/31/09 ($10.4) $34.8 Risk weighted assets – E*TRADE Bank ($ in billions) Balance 9/30/07 Change Agency securities $10.7 $0.5 Capital Structure Actions: Total Assets Reducing loan portfolio and balance sheet risk |
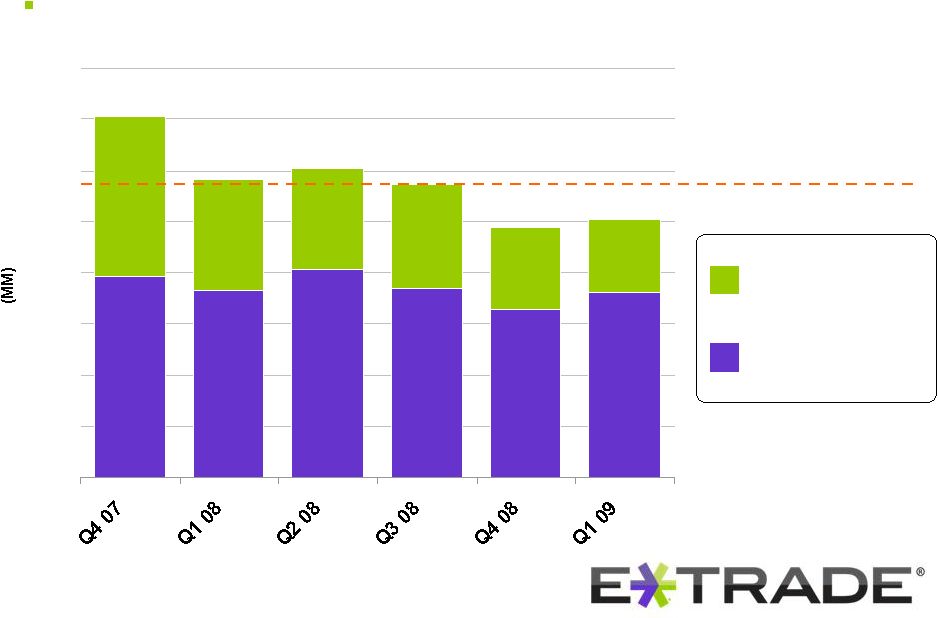 © 2009 E*TRADE FINANCIAL Corp. All rights reserved. $0 $50 $100 $150 $200 $250 $300 $350 $400 6 Quarter Avg: $288MM Capital release (7) from loan run-off 6 Quarter Avg: $102MM Bank earnings (8) 6 Quarter Avg: $186MM 31 Capital Structure Actions: Strong organic capital generation to absorb loan charge-offs Footnoted items are non-GAAP financial measures. See the Appendix for a reconciliation to the most directly comparable GAAP financial measures. |
 © 2009 E*TRADE FINANCIAL Corp. All rights reserved. 32 Total Proceeds 2008 Actions $463 Total $754 $400 $63 Total Proceeds Non-core asset sales Follow-on common stock offering Current Actions ($ in millions) Equity Drawdown Program Capital Structure Actions: Raising additional cash for Bank and enhancing Parent liquidity |
 © 2009 E*TRADE FINANCIAL Corp. All rights reserved. 33 as of 3/31/09 ($ in millions) Actual Ratio Excess to well- capitalized Pro Forma Ratio* Pro Forma Excess* Total capital to risk-weighted assets 11.8% $444 13.9% $944 Tier I Capital to risk-weighted assets 10.5% $1,105 12.6% $1,605 Tier I Capital to adjusted total assets 5.6% $288 6.7% $763 Capital Structure Actions: E*TRADE Bank *Pro forma includes contributions to Bank: $200MM (4/01/09 – 5/31/09) plus $300MM from follow-on common stock offering Maintaining Bank capital in excess of regulatory well-capitalized thresholds |
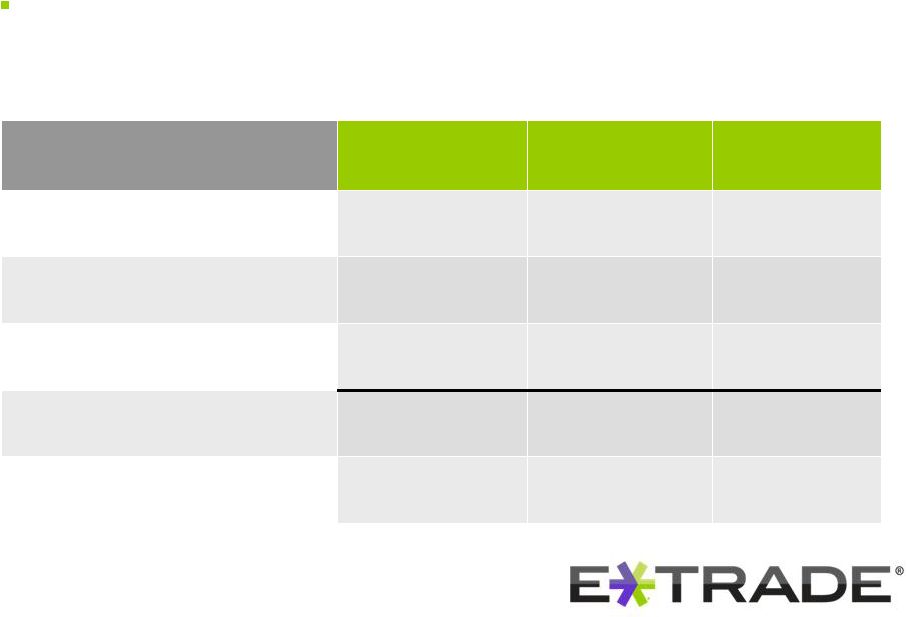
 © 2009 E*TRADE FINANCIAL Corp. All rights reserved. 34 $273 $2,186 12 ½% Due 2017 (9) $150 Management goal $358 $19 $31 $35 Annual interest expense Senior Notes ($ in millions) 8% Due 2011 7 3/8% Due 2013 7 7/8% Due 2015 Total Total outstanding $435 $415 $243 $3,279 Capital Structure Actions: Parent Company Debt Expense Reducing corporate interest expense through debt exchanges Reduce Interest Expense to … |
 © 2009 E*TRADE FINANCIAL Corp. All rights reserved. 35 Capital Structure Actions: Citadel commits to exchange a minimum $800 million At least $200 million – 8% notes due 2011 At least $600 million – 12.5% SLN notes due 2017 Offer to exchange up to $516 million with other bondholders Exchange all outstanding 8% notes due 2011 Exchange up to $310 million face amount of 12.5% SLN notes due 2017 Key convertible debt terms Zero coupon 10 year maturity Conversion price, at the offering price, subject to a collar of $1.00 to $1.20 Offering to exchange zero coupon convertible debt for certain existing company debt |
 © 2009 E*TRADE FINANCIAL Corp. All rights reserved. 36 Overview Thriving online brokerage business Demonstrating leadership in industry with strong secular growth trends Continuing to exceed expectations and remaining competitive among largest online brokers Strategically investing for long-term growth Improving loan performance trends Showing meaningful signs of improvement Proactively strengthening capital structure Reducing balance sheet risk Bolstering Bank capital ratios Reducing Parent debt burden |
 © 2009 E*TRADE FINANCIAL Corp. All rights reserved. 37 |
 © 2009 E*TRADE FINANCIAL Corp. All rights reserved. 38 Appendix Q407 Q108 Q208 Q308 Q408 Q109 Beginning Excess Risk-Based Capital 192 $ 435 $ 695 $ 622 $ 524 $ 715 $ Pre - credit earnings 197 183 204 188 164 181 Loan Portfolio Run-Off 156 108 98 101 79 71 Other (110) (31) (375) (387) (52) (523) Ending Excess Risk-Based Capital 435 $ 695 $ 622 $ 524 $ 715 $ 444 $ 3/31/09 12/31/08 9/30/08 6/30/08 Trailing 4 Qtrs Operating income (251) $ (348) $ (436) $ (105) $ (1,140) $ Add back: Provision for loan losses 454 513 518 319 1,804 (Gain) loss on securities, net (a) (17) 11 160 16 170 Operating income (pre-credit cost) 186 $ 176 $ 242 $ 230 $ 834 $ Explanation of Non-GAAP Measures and Certain Metrics Management believes that operating income (pre-credit cost) and bank earnings before taxes and before credit losses are appropriate measures for evaluating the operating and liquidity performance of the Company. Management believes that the elimination of certain items from the related GAAP measures is helpful to investors and analysts who may wish to use some or all of this information to analyze our current performance, prospects and valuation. Management uses non-GAAP information internally to evaluate our operating performance in formulating our budget for future periods. (1) The attrition rate is calculated by dividing attriting brokerage accounts (a) (annualized) by total brokerage accounts. (a) Attriting brokerage accounts: Gross new brokerage accounts, less net new brokerage accounts (2) The consolidated entity excludes credits costs recorded in the Gain (loss) on loans and securities, net line item of $170MM. (3) Segment income (pre-credit cost) represents the operating income of the Company before loss on securities, net and provision for loan losses. This metric shows the amount of operating income that the Company, after accruing for interest expense on its trust preferred securities, generates each quarter prior to credit related losses, primarily provision and gain (loss) on securities. Management believes this non-GAAP measure is useful to investors and analysts as it is an indication of the underlying profitability of the business that the Company intends to grow in the future. Below is a reconciliation of operating income (pre-credit cost) from GAAP operating income (dollars in millions): (a) (Gain) loss on securities, net is included in the Gain (loss) on loans and securities, net line item on the consolidated statement of loss. (4) Operating margin (pre-credit cost) is the percentage of net revenue that results in income (loss) before credit costs, other income (expense), income taxes and discontinued operations. The percentage is calculated by dividing income (loss) (pre-credit cost) before other income (expense), income taxes and discontinued operations by total net revenue. (5) Represents unpaid principal balances. (6) Net paydowns includes paydowns on loans, as well as limited origination activity, home equity advances, repurchase activity and transfers to real estate owned assets. (7) The capital release from loan run-off only includes the decrease in risk based capital required for our 1-4 family, home equity and consumer loan portfolios. This slide does not depict the capital impact related to changes in other risk-weighted assets (represented in ‘other’ line in the below chart), such as securities, and the impact of our provision for loan losses. |
 © 2009 E*TRADE FINANCIAL Corp. All rights reserved. 39 Appendix Below is a reconciliation of Bank earnings before taxes and before credit losses from Income (loss) before income taxes and discontinued operations (dollars in millions): (a) Excess risk-based capital is the excess capital that E*TRADE Bank has compared to the regulatory minimum well-capitalized threshold. (b) Non-bank loss represents all of the Company’s subsidiaries including Corporate and Brokerage, but excluding the Bank. (c) (Gain) loss on securities, net is included in the Gain (loss) on loans and securities, net line item on the consolidated statement of income (loss). (9) Interest on the 12 ½% Springing Lien Notes may be paid in kind (PIK) through May 2010. 3/31/09 12/31/08 9/30/08 6/30/08 3/31/08 12/31/07 Loss before income taxes and discontinued operations (344) $ (445) $ (502) $ (182) $ (150) $ (2,581) $ Add back: Non-bank loss before tax and discontinued operations(b) 88 85 12 51 91 - Provision for loan losses 454 513 518 319 234 402 (Gain) loss on securities, net(c) (17) 11 160 16 8 2,275 Impairment of goodwill - - - - - 101 Bank earnings before taxes and before credit losses 181 $ 164 $ 188 $ 204 $ 183 $ 197 $ About E*TRADE FINANCIAL The E*TRADE FINANCIAL family of companies provides financial services including trading, investing and related banking products and services to retail investors. Securities products and services are offered by E*TRADE Securities LLC (Member FINRA/SIPC). Bank products and services are offered by E*TRADE Bank, a Federal savings bank, Member FDIC, or its subsidiaries. (8) Bank earnings before taxes and before credit losses represents the pre-tax earnings of E*TRADE Bank Holding Company (“ETBH” or “Bank”) before discontinued operations, loss on securities, net and provision for loan losses. This metric shows the amount of earnings that the Bank, after accruing for the interest expense on its trust preferred securities, generates each quarter prior to credit related losses, primarily provision and gain (loss) on securities. Management believes this non-GAAP measure is useful to investors and analysts as it is an indicator of the level of credit related losses the Bank can absorb without causing a decline in E*TRADE Bank’s excess risk-based capital. |