UNITED STATES
SECURITIES AND EXCHANGE COMMISSION
Washington, D.C. 20549
__________________________________
FORM 6-K
__________________________________
Report of Foreign Private Issuer
Pursuant to Rule 13a-16 or 15d-16 under
the Securities Exchange Act of 1934
For the month of November 2022
Commission File Number 001-38332
__________________________________
QIAGEN N.V.
(Translation of registrant’s name into English)
__________________________________
Hulsterweg 82
5912 PL Venlo
The Netherlands
__________________________________
Indicate by check mark whether the registrant files or will file annual reports under cover of Form 20-F or Form 40-F.
Form 20-F ý Form 40-F o
Indicate by check mark if the registrant is submitting the Form 6-K in paper as permitted by Regulation S-T Rule 101(b)(1): o
Indicate by check mark if the registrant is submitting the Form 6-K in paper as permitted by Regulation S-T Rule 101(b)(7): o
QIAGEN N.V.
Form 6-K
TABLE OF CONTENTS
Item
Signatures

____________________________
NOTICE OF ANNUAL GENERAL MEETING OF SHAREHOLDERS
NOTICE IS HEREBY GIVEN that the Annual General Meeting of Shareholders (the "Annual General Meeting") of QIAGEN N.V., a public limited liability company organized and existing under the laws of the Netherlands, with corporate seat in Venlo, the Netherlands (the "Company" or "QIAGEN") will be held on Thursday, June 23, 2022 at 10:00, local time, at Maaspoort, Oude Markt 30, 5911 HH Venlo, The Netherlands.
AGENDA
Undefined terms in this agenda shall have the meaning as set out in the explanatory notes to the agenda.
1.Opening;
2.Managing Board Report for the year ended December 31, 2021 (“Calendar Year 2021”);
3.Supervisory Board Report on the Company’s Annual Accounts (the “Annual Accounts”) for Calendar Year 2021;
4.Adoption of the Annual Accounts for Calendar Year 2021 (voting item);
5.Advisory Vote on the Remuneration Report 2021 (advisory voting item);
6.Reservation and dividend policy;
7.Discharge from liability of the Managing Directors for the performance of their duties during Calendar Year 2021 (voting item);
8.Discharge from liability of the Supervisory Directors for the performance of their duties during Calendar Year 2021 (voting item);
9.Appointment and reappointment of the following eight Supervisory Directors of the Company for a term running up to and including the day of the Annual General Meeting in 2023 (voting items):
(a)Dr. Metin Colpan;
(b)Mr. Thomas Ebeling;
(c)Dr. Toralf Haag;
(d)Prof. Dr. Ross L. Levine;
(e)Prof. Dr. Elaine Mardis;
(f)Dr. Eva Pisa;
(g)Mr. Lawrence A. Rosen; and
(h)Ms. Elizabeth E. Tallett
10.Reappointment of the following two Managing Directors of the Company for a term running up to and including the day of the Annual General Meeting in 2023 (voting items):
(a)Mr. Thierry Bernard; and
(b)Mr. Roland Sackers.
11.Reappointment of KPMG Accountants N.V. as auditors of the Company for the calendar year ending December 31, 2022 (voting item);
12.Authorization of the Supervisory Board, until December 23, 2023 to (voting items):
(a)issue a number of ordinary shares and financing preference shares and grant rights to subscribe for such shares, the aggregate par value of which shall be equal to the aggregate par value of fifty percent (50%) of shares issued and outstanding in the capital of the Company as at December 31, 2021 as included in the Annual Accounts for Calendar Year 2021;
(b)restrict or exclude the pre-emptive rights with respect to issuing ordinary shares or granting subscription rights, the aggregate par value of such shares or subscription rights shall be up to a maximum of ten percent (10%) of the aggregate par value of all shares issued and outstanding in the capital of the Company as at December 31, 2021;
13.Authorization of the Managing Board, until December 23, 2023, to acquire shares in the Company’s own share capital (voting item);
14.Discretionary rights for the Managing Board to implement a capital repayment by means of a synthetic share repurchase (voting item):
(a)Proposal to amend the Company's Articles of Association in accordance with the draft deed of amendment to the Company's Articles of Association (Part I) to, amongst other things, increase the par value per ordinary share in the share capital of the Company (each a “QIAGEN Share”) by an amount to be determined by the Managing Board of the Company;
(b)Proposal to amend the Company's Articles of Association in accordance with the draft deed of amendment of the Company's Articles of Association (Part II) to, amongst other things, consolidate the QIAGEN Shares at a consolidation ratio to be determined by the Managing Board, subject to the approval of the Supervisory Board (the reverse stock split);
(c)Proposal to amend the Company's Articles of Association in accordance with the draft deed of amendment of the Company's Articles of Association (Part III) to decrease the par value per QIAGEN Share to an amount of EUR 0.01 and to repay to the shareholders an amount to be determined by the Managing Board, subject to the approval of the Supervisory Board, which amount will at maximum be USD 300 million in the aggregate; and
(d)Proposal to authorize each member of the Managing Board of the Company and each lawyer, (candidate) civil law notary and paralegal working at De Brauw Blackstone Westbroek N.V. to execute the three deeds of amendment of the Company's Articles of Association (Part I, II and III);
15.Cancellation of fractional QIAGEN Shares held by the Company (voting item);
16.Questions;
17.Closing.
Meeting documentation
Copies of the Annual Accounts for Calendar Year 2021, the reports of the Supervisory Board and the Managing Board, the Company's 2021 Remuneration Report, the explanatory notes to the agenda, including the list and biographies of binding nominees for (re-)appointment to the Supervisory Board and the Managing Board, a triptych containing an explanation to each of the proposed amendments to the Company's Articles of Association (Part I, II and III) as contemplated by Agenda Item 14 as well as documents reflecting the verbatim text of the amendments proposed under Agenda Item 14 can be obtained free of charge by shareholders and other persons entitled to attend the Annual General Meeting at the offices of the Company at Hulsterweg 82, 5912 PL Venlo, the Netherlands, and at the offices of American Stock Transfer and Trust Company, LLC ("AST") at 6201 15th Avenue, Brooklyn, New York 11219, United States of America, until the close of the Annual General Meeting.
Copies are also available on our website: https://corporate.qiagen.com/agm2022. In order to contribute to sustainability, we strongly encourage you to obtain your copies of the meeting documents electronically via our website.
Record Date
The record date for persons considered as entitled to participate and vote at the Annual General Meeting or by proxy, provided those persons are registered for the Annual General Meeting in accordance with the provisions set forth below, is close of business (05:00 p.m. New York time / 23:00 Frankfurt am Main time) on Thursday, May 26, 2022 (the "Record Date" and such persons 'record holders of shares').
Attendance
On or about May 27, 2022, a proxy statement together with an attendance form and form of proxy will be mailed to the record holders of shares as of the Record Date entitled to participate and vote at the Annual General Meeting. Record holders of shares wishing to exercise their rights in person are obliged to complete, sign and send the attendance form, such that the attendance form is received no later than 5 p.m. New York time (23:00 Frankfurt am Main time) on June 17, 2022 at the offices of AST, 6201 15th Avenue, Brooklyn, New York 11219, United States of America or by email at the following e-mail address: Admin7@Astfinancial.COM.
Proxy
Record holders of shares wishing to exercise their shareholder rights by proxy are obliged to complete, sign and send the proxy card, such that the proxy card is received no later than 5 p.m. New York time (23:00 Frankfurt am Main time) on June 20, 2022 at the offices of AST, 6201 15th Avenue, Brooklyn, New York 11219, United States of America or by email at the following e-mail address: Admin7@Astfinancial.COM.
The Company will send a card of admission to record holders of shares that have properly notified the Company of their intention to attend the Annual General Meeting.
Other matters
In case you have any queries with respect to the Annual General Meeting, please contact agm2022@qiagen.com.
The Annual General Meeting will be streamed live via video webcast on our website https://corporate.qiagen.com/agm2022. Shareholders will be able to follow the meeting in listen and view-only mode. It will not be possible to vote or address the meeting via the webcast.
Furthermore, you are advised to check our website (https://corporate.qiagen.com/agm2022) on a regular basis for updates on the Annual General Meeting. Considering the continuing circumstances regarding COVID-19 and, if, prior to the Annual General Meeting, stricter COVID-19 measures would become applicable, the Company may change the Annual General Meeting to a fully virtual meeting, provided that the Dutch Temporary Act Covid-19 Justice and Safety is still in force and allows so at that time.
Lastly, if you wish to attend the Annual General Meeting you are requested to do a COVID-19 self-test within the 24 hours prior to the meeting. If the test result is positive, you are requested to refrain from attending the Annual General Meeting in person. You are furthermore kindly encouraged to wear a face mask during your attendance of the Annual General Meeting.
The official language of the Annual General Meeting shall be the English language.
The Managing Board
Venlo, The Netherlands
May 11, 2022
Dear Shareholder:
You are cordially invited to attend the Annual General Meeting of Shareholders of QIAGEN N.V. (the “Company”) to be held on Thursday, June 23, 2022 at 10:00, local time, at Maaspoort, Oude Markt 30, 5911 HH Venlo, The Netherlands.1
We have attached a Notice of Annual General Meeting, including the Agenda and Explanatory Notes thereto, and enclosed an attendance form and proxy card for use in connection with the meeting.
We hope that you will be able to attend the Annual General Meeting. If you plan to do so, please complete and sign the enclosed attendance form and return it to American Stock Transfer and Trust Company, as specified thereon. We will then add your name to the admission list for the meeting and forward to you an entrance-ticket for the meeting. The signed attendance form must be received no later than 5 p.m. (New York time) on Friday, June 17, 2022 in order for you to attend the meeting.
The Annual General Meeting will also be streamed live via video webcast on our website https://corporate.qiagen.com/agm2022. Shareholders will be able to follow the meeting in listen and view-only mode. It will not be possible to vote or address the meeting via the webcast.
Whether or not you plan to attend the Annual General Meeting, it is important that your ordinary shares are represented. Therefore, please complete, sign, date and return the enclosed proxy card promptly in the enclosed envelope, which requires no postage if mailed in the United States. The completed proxy card must be received no later than 5:00 p.m. (New York time) on Monday, June 20, 2022 for your vote to count. Votes cast pursuant to a timely received proxy card shall be deemed votes cast in the meeting, and timely submitting your proxy will ensure your proper representation at the Annual General Meeting. If you physically attend the Annual General Meeting, you may vote in person if you wish, even if you have previously returned your proxy.
Sincerely,
/s/ Thierry Bernard /s/ Roland Sackers
THIERRY BERNARD ROLAND SACKERS
Managing Director Managing Director
Venlo, The Netherlands
May 11, 2022
YOUR VOTE IS IMPORTANT.
PLEASE RETURN YOUR PROXY CARD PROMPTLY.
________________________________
1 QIAGEN advises its shareholders to regularly check the Company's website (https://corporate.qiagen.com/agm2022) for updates on the Annual General Meeting. Considering the continuing circumstances regarding COVID-19 and, if, prior to the Annual General Meeting, stricter COVID-19 measures would become applicable, the Company may change the Annual General Meeting to a fully virtual meeting, provided that the Dutch Temporary Act Covid-19 Justice and Safety is still in force and allows so at that time.
QIAGEN N.V.
____________________________
NOTICE OF ANNUAL GENERAL MEETING OF SHAREHOLDERS
TO BE HELD JUNE 23, 2022
____________________________
To The Shareholders:
Notice is hereby given that the Annual General Meeting of Shareholders (the “Annual General Meeting”) of QIAGEN N.V. (the “Company”), a public limited liability company organized and existing under the laws of The Netherlands, will be held on Thursday, June 23, 2022 at 10:00, local time, at Maaspoort, Oude Markt 30, 5911 HH Venlo, The Netherlands.
The Agenda of the Annual General Meeting of the Company, containing proposals of the Managing Board and the Supervisory Board of the Company, is as follows (undefined terms in this Agenda shall have the meaning as set out in the Explanatory Notes thereto):
1.Opening.
2.Managing Board Report for the year ended December 31, 2021 (“Calendar Year 2021”).
3.Supervisory Board Report on the Company’s Annual Accounts (the “Annual Accounts”) for Calendar Year 2021.
4.Adoption of the Annual Accounts for Calendar Year 2021 (voting item).
5.Advisory Vote on the Remuneration Report 2021 (advisory voting item).
6.Reservation and dividend policy.
7.Discharge from liability of the Managing Directors for the performance of their duties during Calendar Year 2021 (voting item).
8.Discharge from liability of the Supervisory Directors for the performance of their duties during Calendar Year 2021 (voting item).
9.Appointment and reappointment of the following eight Supervisory Directors of the Company for term running up to and including the day of the Annual General Meeting in 2023 (voting items):
(a)Dr. Metin Colpan;
(b)Mr. Thomas Ebeling;
(c)Dr. Toralf Haag;
(d)Prof. Dr. Ross L. Levine;
(e)Prof. Dr. Elaine Mardis;
(f)Dr. Eva Pisa;
(g)Mr. Lawrence A. Rosen; and
(h)Ms. Elizabeth E. Tallett.
10.Reappointment of the following two Managing Directors of the Company for a term running up to and including the day of the Annual General Meeting in 2023 (voting items):
(a)Mr. Thierry Bernard; and
(b)Mr. Roland Sackers.
11.Reappointment of KPMG Accountants N.V. as auditors of the Company for the calendar year ending December 31, 2022 (voting item).
12.Authorization of the Supervisory Board, until December 23, 2023 to (voting items):
(a)issue a number of ordinary shares and financing preference shares and grant rights to subscribe for such shares, the aggregate par value of which shall be equal to the aggregate par value of fifty percent (50%) of the shares issued and outstanding in the capital of the Company as at December 31, 2021 as included in the Annual Accounts for Calendar Year 2021; and
(b)restrict or exclude the pre-emptive rights with respect to issuing ordinary shares or granting subscription rights, the aggregate par value of such shares or subscription rights shall be up to a maximum of ten percent (10%) of the aggregate par value of all shares issued and outstanding in the capital of the Company as at December 31, 2021;
13.Authorization of the Managing Board, until December 23, 2023, to acquire shares in the Company’s own share capital (voting item).
14.Discretionary rights for the Managing Board to implement a capital repayment by means of a synthetic share repurchase (voting item):
(a)Proposal to amend the Company's Articles of Association in accordance with the draft deed of amendment to the Company's Articles of Association (Part I) to, amongst other things, increase the par value per ordinary share in the share capital of the Company (each a “QIAGEN Share”) by an amount to be determined by the Managing Board of the Company;
(b)Proposal to amend the Company's Articles of Association in accordance with the draft deed of amendment of the Company's Articles of Association (Part II) to, amongst other things, consolidate the QIAGEN Shares at a consolidation ratio to be determined by the Managing Board, subject to the approval of the Supervisory Board (the reverse stock split);
(c)Proposal to amend the Company's Articles of Association in accordance with the draft deed of amendment of the Company's Articles of Association (Part III) to decrease the par value per QIAGEN Share to an amount of EUR 0.01 and to repay to the shareholders an amount to be determined by the Managing Board, subject to the approval of the Supervisory Board, which amount will at maximum be USD 300 million in the aggregate; and
(d)Proposal to authorize each member of the Managing Board of the Company and each lawyer, (candidate) civil law notary and paralegal working at De Brauw Blackstone Westbroek N.V. to execute the three deeds of amendment of the Company's Articles of Association (Part I, II and III).
15.Cancellation of fractional QIAGEN Shares held by the Company (voting item).
16.Questions.
17.Closing.
Meeting documentation
Under the Articles of Association of the Company and Dutch law, copies of the Annual Accounts for Calendar Year 2021, the reports of the Supervisory Board and the Managing Board, the Company’s 2021 Remuneration Report, the list and biographies of binding nominees for (re-)appointment to the Supervisory Board and the Managing Board, a triptych containing an explanation to each of the proposed amendments to the Company's Articles of Association (Part I, II and III) as contemplated by Agenda Item 14 as well as documents reflecting the verbatim text of the amendments proposed under Agenda Item 14, the information sent to the record holders of QIAGEN Shares in connection with the Annual General Meeting and other documents relevant for the Annual General Meeting can be obtained free of charge by shareholders and other persons entitled to attend the Annual General Meeting at the offices of the Company at Hulsterweg 82, 5912 PL Venlo, The Netherlands, and at the offices of American Stock Transfer and Trust
Company, LLC at 6201 15th Avenue, Brooklyn, New York 11219, United States of America, until the close of the Annual General Meeting.
Copies are also available on our website: https://corporate.qiagen.com/agm2022. In order to contribute to sustainability, we strongly encourage you to obtain your copies of the meeting documents electronically via our website.
In an effort to reduce our cost of printing and mailing documents for the Annual General Meeting and to exhibit environmentally responsible conduct, we are not mailing paper copies of our 2021 Annual Report to our shareholders. The 2021 Annual Report, which provides additional information regarding our 2021 financial results, and copies of the Notice of Annual General Meeting, including the Agenda and Explanatory Notes thereto, and Annual Accounts for Calendar Year 2021, can be accessed on our website: https://corporate.qiagen.com/agm2022. Printed copies of the 2021 Annual Report can also be obtained free of charge by visiting our website: https://corporate.qiagen.com/investor-relations/ir-contacts/information-request-form/ or by contacting QIAGEN Sciences LLC, Attention: Executive Assistant to Chief Financial Officer, 19300 Germantown Rd, Germantown, MD 20874, United States of America, Phone number: +1 240 686 7774 until the close of the Annual General Meeting.
Record date
Close of business (5:00 p.m. New York time / 23:00 Frankfurt am Main time) on Thursday, May 26, 2022 is the record date (the “Record Date”) for the determination of the record holders of QIAGEN Shares entitled to attend and vote at the Annual General Meeting (in person or by proxy).
Attendance
All shareholders are cordially invited to attend the Annual General Meeting. If you plan to do so, please complete and sign the enclosed attendance form and return it as specified thereon. We will then add your name to the admission list for the meeting and forward to you an entrance-ticket for the Annual General Meeting.
Voting
Whether you plan to attend the Annual General Meeting or not, you are requested to complete, sign, date and return the enclosed proxy card as soon as possible in accordance with the instructions on the card. A pre-addressed, postage prepaid return envelope is enclosed for your convenience. Completed proxy cards may also be submitted via email to Admin7@Astfinancial.com.
Other matters
In case you have any queries with respect to the Annual General Meeting, please contact agm2022@qiagen.com.
The Annual General Meeting will be streamed live via video webcast on our website https://corporate.qiagen.com/agm2022. Shareholders will be able to follow the meeting in listen and view-only mode. It will not be possible to vote or address the meeting via the webcast.
Furthermore, you are advised to check our website (https://corporate.qiagen.com/agm2022) on a regular basis for updates on the Annual General Meeting. Considering the continuing circumstances regarding COVID-19 and, if, prior to the Annual General Meeting, stricter COVID-19 measures would become applicable, the Company may change the Annual General Meeting to a fully virtual meeting, provided that the Dutch Temporary Act Covid-19 Justice and Safety is still in force and allows so at that time.
Lastly, if you wish to attend the Annual General Meeting you are requested to do a COVID-19 self-test within the 24 hours prior to the meeting. If the test result is positive, you are requested to refrain from attending the Annual General Meeting in person. You are furthermore kindly encouraged to wear a face mask during your attendance of the Annual General Meeting.
By Order of the Managing Board
/s/ Thierry Bernard /s/ Roland Sackers
THIERRY BERNARD ROLAND SACKERS
Managing Director Managing Director
May 11, 2022
Venlo, The Netherlands
QIAGEN N.V.
____________________________
ANNUAL GENERAL MEETING OF SHAREHOLDERS
____________________________
EXPLANATORY NOTES TO AGENDA
I. General
The enclosed proxy card and the accompanying Notice of Annual General Meeting of Shareholders and Agenda are being mailed to shareholders of QIAGEN N.V. (the “Company” or “QIAGEN”) in connection with the solicitation by the Company of proxies for use at the Annual General Meeting of Shareholders of the Company to be held on Thursday, June 23, 2022 at 10:00 local time, at Maaspoort, Oude Markt 30, 5911 HH Venlo, The Netherlands. These proxy solicitation materials will be mailed on or about May 27, 2022 to all shareholders of record as of Thursday, May 26, 2022, the record date for the Annual General Meeting.
Under the Articles of Association of the Company and Dutch law, copies of the Annual Accounts for Calendar Year 2021, the reports of the Company’s supervisory board (the “Supervisory Board”) and the Company’s managing board (the “Managing Board”), the Company’s 2021 Remuneration Report, the list and biographies of binding nominees for (re-)appointment to the Supervisory Board and the Managing Board, a triptych containing an explanation to each of the proposed amendments to the Company’s Articles of Association (Part I, II and III) as contemplated by Agenda Item 14 as well as documents reflecting the verbatim text of the amendments proposed under Agenda Item 14, the information sent to the record holders of QIAGEN Shares in connection with the Annual General Meeting and other documents relevant for the Annual General Meeting can be obtained free of charge by shareholders and other persons entitled to attend the Annual General Meeting at the offices of the Company at Hulsterweg 82, 5912 PL Venlo, The Netherlands, and at the offices of American Stock Transfer and Trust Company, LLC at 6201 15th Avenue, Brooklyn, New York 11219, United States of America, until the close of the Annual General Meeting. Copies are also available electronically on our website: https:// corporate.qiagen.com/agm2022. In order to contribute to sustainability, we strongly encourage you to obtain your copies of the meeting documents electronically via our website.
In an effort to support sustainable business practices and reduce printing and mailing costs, we are not mailing paper copies of the Company’s 2021 Annual Report (the “2021 Annual Report”) to our shareholders. The 2021 Annual Report, which provides additional information regarding our 2021 financial results, and copies of the Notice of Annual General Meeting, including the Agenda and Explanatory Notes, and Annual Accounts for 2021, can be accessed on our website: https://corporate.qiagen.com/agm2022. Printed copies of the 2021 Annual Report can also be obtained free of charge by visiting our website: https://corporate.qiagen.com/investor-relations/ir-contacts/information-request-form/ or by contacting QIAGEN Sciences LLC, Attention: Executive Assistant to Chief Financial Officer, 19300 Germantown Rd, Germantown, MD 20874, United States of America, Phone number: +1 240 686 7774 until the close of the Annual General Meeting.
The reasonable cost of soliciting proxies, including expenses in connection with preparing and mailing the proxy solicitation materials, will be borne by the Company. In addition, the Company will reimburse brokerage firms and other persons representing beneficial owners of QIAGEN Shares for their expenses in forwarding proxy materials to such beneficial owners. Solicitation of proxies by mail may be supplemented by telephone, telegram, telex, electronic mail and personal solicitation by directors, officers or employees of the Company. No additional compensation will be paid for such solicitation.
The Company is not subject to the proxy solicitation rules contained in Regulation 14A promulgated under the United States Securities Exchange Act of 1934, as amended.
II. Voting and Solicitation
In order to attend, address and vote at the Annual General Meeting, or vote by proxy, the record holders of QIAGEN Shares are requested to advise the Company in writing in accordance with the procedure set forth in the
Notice of Annual General Meeting of Shareholders. Close of business (5:00 p.m. New York time / 23:00 Frankfurt am Main time) on Thursday, May 26, 2022 is the record date for the determination of the record holders of QIAGEN Shares entitled to participate in and vote at the Annual General Meeting or by proxy.
At May 3, 2022, there were 230,829,308.67 shares issued in the Company’s share capital (including 46.56 fractional QIAGEN Shares and 3,375,040.11 QIAGEN Shares held in treasury by the Company, which cannot be voted), which shares
were all QIAGEN Shares (i.e. ordinary shares); no preference shares or financing preference shares have been issued to date.
Shareholders are entitled to one vote for each whole QIAGEN Share held.
Each of the proposals to (re-)appoint members to the Supervisory Board and the Managing Board set forth under Agenda Items 9 and 10 will be adopted irrespective of the number of votes cast in favor, unless such proposal is overruled by at least two-thirds of the votes cast being votes against the proposal, provided such votes also represent more than fifty percent (50%) of the issued share capital of the Company as of the record date of the Annual General Meeting.
The proposals (i) to authorize the Supervisory Board to restrict or exclude the pre-emptive rights with respect to issuing shares or granting subscription rights set forth under Agenda Item 12.b, (ii) to decrease the par value of the QIAGEN Shares through an amendment of the Articles of Association in connection with the discretionary repayment of capital by means of a synthetic share repurchase set forth under Agenda Item 14.c, and (iii) to cancel fractional QIAGEN Shares the Company holds in its own share capital set forth under Agenda Item 15, shall be validly adopted if adopted by at least two-thirds of the votes cast at the Annual General Meeting if less than fifty percent (50%) of the Company’s issued share capital is represented at the Annual General Meeting. If fifty percent (50%) or more of the Company’s issued share capital is represented at the Annual General Meeting, the proposals set forth under Agenda Items 12.b, 14 (being one combined voting item, comprising Agenda Item 14.c referred to above) and 15 shall be validly adopted if adopted by a simple majority of the votes cast at the Annual General Meeting.
All other proposals presented to the shareholders at the Annual General Meeting shall be validly adopted if adopted by a simple majority of the votes cast at the Annual General Meeting. No majority requirement applies to the non-binding advisory vote referred to under Agenda Item 5.
Any proxy given pursuant to this solicitation may be revoked by the person giving it at any time before its use by delivery to the Company of a written notice of revocation or a duly executed proxy bearing a later date. Any shareholder who has executed a proxy but is present at the Annual General meeting, and who wishes to vote in person, may do so by revoking his or her proxy as described in the preceding sentence. Mere attendance at the Annual General Meeting will not serve to revoke a proxy. QIAGEN Shares represented by valid proxies received in time for use at the Annual General Meeting and not revoked prior to the Annual General Meeting, will be voted at the Annual General Meeting.
III. Explanatory Notes to Agenda Items
Explanatory Note to Item 2—Managing Board Report for Calendar Year 2021
At the Annual General Meeting, the Managing Board will conduct a presentation on the performance of the Company during Calendar Year 2021.
Explanatory Note to Item 3—Supervisory Board Report on the Company’s Annual Accounts for Calendar Year 2021
At the Annual General Meeting, the Supervisory Board will conduct a presentation of its report on the Company’s Annual Accounts for Calendar Year 2021.
Explanatory Note to Item 4—Adoption of the Annual Accounts for the Calendar Year 2021
The shareholders of the Company are being asked to adopt the Annual Accounts for Calendar Year 2021. The Annual Report and the Annual Accounts have been prepared by the Managing Board and approved by the Supervisory Board.
THE SUPERVISORY BOARD AND THE MANAGING BOARD UNANIMOUSLY RECOMMEND A VOTE FOR THIS ITEM. COMPLETED PROXY CARDS WILL BE VOTED IN FAVOR THEREOF UNLESS INSTRUCTIONS ARE OTHERWISE PROVIDED.
Explanatory Note to Item 5— Advisory Vote on the Remuneration Report 2021.
At the Annual General Meeting, the Company’s Compensation & Human Resources Committee will conduct a presentation on the implementation of the Remuneration Policies for the Managing Board and Supervisory Board during Calendar Year 2021. Following the presentation, it will be proposed to cast a favorable, non-binding, advisory vote in respect of the Remuneration Report 2021.
THE SUPERVISORY BOARD AND THE MANAGING BOARD UNANIMOUSLY RECOMMEND A NON-BINDING ADVISORY VOTE FOR THIS ITEM. COMPLETED PROXY CARDS WILL BE VOTED IN FAVOR THEREOF UNLESS INSTRUCTIONS ARE OTHERWISE PROVIDED.
Explanatory Note to Item 6—Reservation and Dividend Policy
The Company’s reservation and dividend policy is to retain the profits by way of reserve. Consequently, the Company will not pay a dividend to the shareholders out of the Calendar Year 2021 profits. This policy benefits our shareholders by increasing share value, and the Company believes that this policy is aligned with shareholders’ taxation preferences.
As further set out under Agenda Item 14, the Company is proposing to the Annual General Meeting to grant the Managing Board the discretionary power to, subject to the approval of the Supervisory Board, return capital to the shareholders of the Company by means of a Synthetic Share Repurchase.
Explanatory Note to Item 7—Discharge from Liability of the Managing Directors
Under Dutch law, the adoption of the Annual Accounts does not automatically discharge the members of the Managing Board and the Supervisory Board from liability for the performance of their duties during Calendar Year 2021. The grant of such discharge from liability is typical for Dutch companies, and its approval is commonly included on the agenda for annual general meetings.
The shareholders of the Company are being asked to discharge the members of the Managing Board from liability for the performance of their duties during Calendar Year 2021, as described in the 2021 Annual Report and the 2021 Annual Accounts or as otherwise disclosed to the General Meeting of Shareholders.
THE SUPERVISORY BOARD AND THE MANAGING BOARD UNANIMOUSLY RECOMMEND A VOTE FOR THIS ITEM. COMPLETED PROXY CARDS WILL BE VOTED IN FAVOR THEREOF UNLESS INSTRUCTIONS ARE OTHERWISE PROVIDED.
Explanatory Note to Item 8—Discharge from Liability of the Supervisory Directors
The shareholders of the Company are being asked to discharge the members of the Supervisory Board from liability for the performance of their duties during Calendar Year 2021, as described in the 2021 Annual Report and the 2021 Annual Accounts or as otherwise disclosed to the General Meeting of Shareholders.
THE SUPERVISORY BOARD AND THE MANAGING BOARD UNANIMOUSLY RECOMMEND A VOTE FOR THIS ITEM. COMPLETED PROXY CARDS WILL BE VOTED IN FAVOR THEREOF UNLESS INSTRUCTIONS ARE OTHERWISE PROVIDED.
Explanatory Note to Items 9 and 10 —Reappointment of the Supervisory Directors and the Reappointment of the Managing Directors
The Supervisory Board and the Managing Board acting together at a joint meeting (the “Joint Meeting”) resolved to make a binding nomination for the reappointment of the seven current members of the Supervisory Board and the appointment of one new member to the Supervisory Board (the “Supervisory Directors”). Furthermore, the Joint Meeting resolved to make a binding nomination for the reappointment of the two current members of the Managing Board.
The Supervisory Board consists of such number of members, with a minimum of three members, as the Joint Meeting may determine. The Supervisory Board presently consists of seven members. The Joint Meeting has set the number of members of the Supervisory Board at eight as of the Annual General Meeting. The Supervisory Directors are appointed by a vote of the shareholders of the Company at the Annual General Meeting, subject to the authority of the Supervisory Board to appoint up to one-third of its members if vacancies occur during a calendar year. The Managing Board has one or more members, as determined by the Supervisory Board. The Managing Board presently consists of two members. The members of the Managing Board (the “Managing Directors”) are appointed by a vote of the shareholders of the Company at the Annual General Meeting.
The Supervisory Board and the Managing Board at the Joint Meeting may make a binding nomination to fill each vacancy on the Supervisory Board and Managing Board. At the Annual General Meeting, the shareholders may overrule the binding nature of a nomination by resolution adopted with a majority of at least two-thirds of the votes cast, provided such majority also represents more than half the issued share capital of the Company as of the date of the Annual General Meeting. Our shareholders vote for each nominee for (re-)appointment to our Supervisory Board and Managing Board as a separate voting item.
It is proposed to reappoint the current members of the Supervisory Board and to appoint Dr. Eva Pisa as new Supervisory Board member as per the below, for a period beginning on the date following the date of the Annual General Meeting, until and including the date of the Annual General Meeting held in the following calendar year. It is furthermore proposed to reappoint the persons nominated for appointment to the Managing Board as per the below for a period beginning on the date following the date of the Annual General Meeting, until and including the date of the Annual General Meeting held in the following calendar year.
By unanimous written consent, the Joint Meeting resolved to make a binding nomination for eight members of the Supervisory Board and two members of the Managing Board. The eight binding nominees for election to the Supervisory Board positions are as follows:
•Nomination for position no. 1: Dr. Metin Colpan;
•Nomination for position no. 2: Mr. Thomas Ebeling;
•Nomination for position no. 3: Dr. Toralf Haag;
•Nomination for position no. 4: Prof. Dr. Ross L. Levine;
•Nomination for position no. 5: Prof. Dr. Elaine Mardis;
•Nomination for position no. 6: Dr. Eva Pisa;
•Nomination for position no. 7: Mr. Lawrence A. Rosen; and
•Nomination for position no. 8: Ms. Elizabeth E. Tallett.
The Supervisory Board believes that these nominees meet the criteria for Supervisory Board positions, as approved by the Supervisory Board and set forth on the Company’s website, and that they will continue to deliver significant contributions in view of their broad international, financial and management experience, integrity and ethics. This applies in particular for Dr. Metin Colpan, Prof. Dr. Elaine Mardis, Mr. Lawrence A. Rosen and Ms. Elizabeth E. Tallett, who have served on the Supervisory Board for eight years or more. The Dutch Corporate Governance Code states that reasons should be given for a reappointment after an eight-year period. The Supervisory Board believes that the in-depth knowledge of the Company represented by Dr. Colpan, Prof. Dr. Mardis, Mr. Rosen and Ms. Tallett is very valuable for QIAGEN and beneficially supplements the diverse and mixed profile of the Supervisory Board. The experience and qualifications of each nominee to the Supervisory Board are described below.
The binding nominations for the two Managing Board positions are as follows:
•Nomination for position no. 1: Mr. Thierry Bernard; and
•Nomination for position no. 2: Mr. Roland Sackers.
The following is a brief summary of the background of each of the Supervisory Director and Managing Director nominees. References to “QIAGEN” and the “Company” in relation to periods prior to April 29, 1996 mean QIAGEN GmbH and its consolidated subsidiaries.
Dr. Metin Colpan, 67, is a co-founder of QIAGEN and was the Chief Executive Officer and a Managing Director from 1985 to 2003. Dr. Colpan has been a member of the Supervisory Board since 2004 and has served as Chair of the Science & Technology Committee since 2014. He has been a member of the Nomination & ESG Committee since 2015. Dr. Colpan obtained his Ph.D. and M.S. in Organic Chemistry and Chemical Engineering from the Darmstadt Institute of Technology in 1983. Prior to founding QIAGEN, Dr. Colpan was an Assistant Investigator at the Institute for Biophysics at the University of Düsseldorf. Dr. Colpan has extensive experience in sample technologies, and in particular in the separation and purification of nucleic acids, and has many patents in the field. Dr. Colpan also serves as a Supervisory Board member of CGR GmbH in Mettmann, Germany, and Heilpflanzenwohl AG in Baar, Germany.
Mr. Thomas Ebeling, 63, joined the Supervisory Board and the Nomination & ESG Committee in 2021. Mr. Ebeling has been an advisor in recent years to various businesses after having served as the CEO of the publicly listed German media group ProSiebenSat.1 Media from 2009 to 2018. Prior to that, he worked for the global healthcare company Novartis from 1997 to 2008, including roles as CEO of Novartis Pharmaceuticals and also as CEO of Novartis Consumer Health. Since beginning his career in 1987, Mr. Ebeling held various positions in marketing and sales in the consumer goods industry before joining Novartis. He previously served on the Supervisory Boards of Bayer AG in Germany and Lonza AG in Switzerland. Mr. Ebeling has a degree in psychology from the University of Hamburg.
Dr. Toralf Haag, 56, joined the Supervisory Board and the Audit Committee in 2021. He has served since October 2018 as Chairman of the Corporate Board of Management of Voith GmbH & Co. KGaA in Germany, a global technology company with more than EUR 4 billion in annual sales and over 19,000 employees. Before joining Voith in October 2016 as Chief Financial Officer, Dr. Haag served for more than 11 years as CFO and Member of the Executive Committee of Lonza Group AG. He began his career in 1994 as the personal assistant to the CEO of Thyssen Handelsunion AG after earning a degree in Business Administration from the University of Augsburg and a Ph.D. at the University of Kiel.
Prof. Dr. Ross L. Levine, 50, joined the Supervisory Board and its Science & Technology Committee in 2016. He is a physician-scientist focused on researching and treating blood and bone marrow cancers as the Laurence Joseph Dineen Chair in Leukemia Research, the Chief of Molecular Cancer Medicine, and an Attending Physician at Memorial Sloan Kettering Cancer Center, as well as Professor of Medicine at Weill Cornell Medical College. He leads a research lab investigating genetics and targeted therapies in myeloid malignancies and is interested in application of next-generation sequencing technology in the practice of medicine in hematologic cancers. He trained in internal medicine at Massachusetts General Hospital and in hematology-oncology at the Dana-Farber Cancer Institute, earning board certification in these specialties. He received his M.D. from the Johns Hopkins University School of Medicine and his A.B. degree from Harvard College.
Prof. Dr. Elaine Mardis, 59, joined the Supervisory Board in 2014. She is also a member of the Science & Technology Committee and the Compensation & Human Resources Committee. Dr. Mardis is the Co-Executive Director of the Institute for Genomic Medicine at Nationwide Children’s Hospital in Columbus, OH and is Professor of Pediatrics at the Ohio State University College of Medicine. Dr. Mardis has research interests in the application of genomic technologies to improve our understanding of human disease, and toward improving the precision of medical diagnosis, prognosis and treatment. Dr. Mardis is the former Robert E. and Louise F. Dunn Distinguished Professor of Medicine at Washington University School of Medicine in St. Louis, MO, where she was on the faculty for 22 years. As Co-Director of the McDonnell Genome Institute, she devised methods and automation that contributed to the Human Genome Project and has since played key roles in the 1000 Genomes Project, The Cancer Genome Atlas, and the Pediatric Cancer Genome Project. Prior to joining the Washington University faculty, she was a senior research scientist at BioRad Laboratories in Hercules, California. Dr. Mardis currently serves as a member of the Board of Directors of Singular Genomics Systems, Inc., a publicly listed company in the U.S. Additionally, she is an elected member of the U.S. National Academy of Medicine. She is also a past President of the American Association for Cancer Research, and has scientific advisory roles at PACT Pharma, LLC and Scorpion Therapeutics, LLC. She received her Bachelor of Science degree in Zoology in 1984, and her Ph.D. in Chemistry and Biochemistry in 1989, both from the University of Oklahoma.
Dr. Eva Pisa, 67, is expected to join the Supervisory Board following the 2022 Annual General Meeting. She was the CEO of a Swedish molecular diagnostic start-up from 2001-2007 that was acquired by Cepheid (now part of Danaher) and specialized in infectious diseases affecting immune-compromised patients. She then worked for Roche Diagnostics International from 2007-2020, where she held positions of increasing responsibility. During her tenure, the Roche cobas 6800 / 8800 System was developed and launched. Dr. Pisa most recently served as Senior Vice President at Roche Centralized and POC Solutions from April 2016 to February 2020, where she was responsible for Clinical Chemistry, Endocrinology and Custom Biotech (B2B business). She continues to support and consult with diagnostic and life science companies. Dr. Pisa holds a Ph.D. from the Karolinska Institute in Sweden and an MBA from Heriot-Watt University in Scotland.
Mr. Lawrence A. Rosen, 64, joined the Supervisory Board in 2013 and has served as Chair of the Supervisory Board since 2020. He is also a member of the Audit Committee and the Compensation & Human Resources Committee and Chair of the Nomination & ESG Committee. As a member of the Board of Management and Chief Financial Officer of Deutsche Post DHL from 2009 to 2016, he was responsible for controlling, corporate accounting and reporting, investor relations, corporate finance, corporate internal audit and security, taxes, as well as the group’s global business services. Prior to this role, Mr. Rosen served as Chief Financial Officer of Fresenius Medical Care AG & Co. KGaA in Germany from 2003 to 2009 and earlier served as Senior Vice President and Treasurer for Aventis SA in Strasbourg, France. From 1984 to 2000, he held various positions of increasing responsibility at the Aventis predecessor companies Hoechst AG and American Hoechst/ Hoechst Celanese, Inc. He currently serves on the Supervisory Boards of Deutsch Post DHL Group and Lanxess AG, both publicly listed companies in Germany. Mr. Rosen holds a bachelor’s degree in economics from the State University of New York and an M.B.A. from the University of Michigan.
Ms. Elizabeth E. Tallett, 73, joined the Supervisory Board in 2011, and also became a member of the Audit Committee and the Compensation & Human Resources Committee. She has also served as Chair of the Compensation & Human Resources Committee since 2016, and joined the Nomination & ESG Committee, in that same year. Ms. Tallett was a Principal of Hunter Partners, LLC, a management company for early to mid-stage pharmaceutical, biotechnology and medical device companies, from 2002 until February 2015. Ms. Tallett continues to consult with early stage health care companies. Her senior management experience includes President and CEO of Transcell Technologies Inc., President of Centocor Pharmaceuticals, member of the Parke-Davis Executive Committee, and Director of Worldwide Strategic Planning for Warner-Lambert Company. Ms. Tallett is also a member of the Board of Directors of Anthem, Inc. (where she is currently Chair) and Moderna, Inc., both publicly listed companies in the U.S., and previously served on the Board of Directors of Meredith Corporation and Principal Financial Group, Inc. Ms. Tallett was a founding board member of the Biotechnology Council of New Jersey and is Chair of the Trustees of Solebury School in Pennsylvania. Ms. Tallett graduated from Nottingham University, England with dual bachelor’s degrees with honors in mathematics and economics.
Thierry Bernard, 58, joined QIAGEN in 2015 to lead our growing presence in Molecular Diagnostics, the application of Sample to Insight solutions for molecular testing in human healthcare. He was named Chief Executive Officer in March 2020, after having previously served in this role on an interim basis. Mr. Bernard previously worked at bioMérieux SA, where he served in roles of increasing responsibility for 15 years, most recently as Corporate Vice President, Global Commercial Operations, Investor Relations and the Greater China Region. Prior to joining bioMérieux, he served in management roles in multiple international environments. Mr. Bernard was appointed in 2020 as a member of the Board of Directors of T2 BioSystems, Inc., a publicly listed company in the U.S. Mr. Bernard has earned degrees from Sciences Po (Paris), Harvard Business School, London School of Economics, and the College of Europe and is a member of French Foreign Trade Advisors.
Roland Sackers, 53, joined QIAGEN in 1999 as Vice President Finance and has been Chief Financial Officer since 2004. In 2006, Mr. Sackers became a member of the Managing Board. Between 1995 and 1999, he served as an auditor with Arthur Andersen Wirtschaftsprüfungsgesellschaft Steuerberatungsgesellschaft. Mr. Sackers earned his Diplom-Kaufmann from University of Münster, Germany. Mr. Sackers was appointed in 2021 as Vice Chair of the Supervisory Board of Evotec SE, a publicly listed company in Germany and has been a member and Chair of the Audit Committee since 2019. He is also a board member of the industry association BIO Deutschland in Germany.
Share Ownership
The following table sets forth certain information as of January 31, 2022 concerning the ownership of QIAGEN shares by each current member of the Supervisory Board being proposed for (re-)appointment. In preparing the following table, the Company has relied on information furnished by such persons.
| Name and Country of Residence | Number of Shares Beneficially Owned(1)(2) | ||||
| Dr. Metin Colpan, Germany | 407,783 | ||||
| Mr. Thomas Ebeling, Switzerland | — | ||||
| Dr. Toralf Haag, Germany | 700 | ||||
| Prof. Dr. Ross L. Levine, United States of America | 4,129 | ||||
| Prof. Dr. Elaine Mardis, United States of America | — | ||||
| Dr. Eva Pisa, Switzerland | — | ||||
| Mr. Lawrence A. Rosen, United States of America | — | ||||
| Ms. Elizabeth E. Tallett, United States of America | 34,089 | ||||
___________
(1) The number of QIAGEN Shares outstanding as of January 31, 2022 was 227,073,511. The persons named in the table have sole voting and investment power with respect to all shares shown as beneficially owned by them and have the same voting rights as other shareholders with respect to QIAGEN Shares.
(2) Does not include Common Shares subject to options or awards held by such persons as at January 31, 2022.
The Dutch Authority of Financial Markets (“AFM”) maintains a public database of notifications regarding shareholdings and voting rights of directors on its website. This database includes all notifications made by the current members of the Supervisory Board regarding their holdings of QIAGEN Shares and related voting rights. The database can be accessed through an Internet link on our website: www.qiagen.com.
THE SUPERVISORY BOARD AND THE MANAGING BOARD ACTING TOGETHER AT THE JOINT MEETING UNANIMOUSLY RECOMMEND THE (RE-)APPOINTMENT OF EACH PROPOSED NOMINEE TO THE SUPERVISORY BOARD AND THE APPOINTMENT OR REAPPOINTMENT OF EACH PROPOSED NOMINEE TO THE MANAGING BOARD. COMPLETED PROXY CARDS WILL BE VOTED IN FAVOR THEREOF UNLESS INSTRUCTIONS ARE OTHERWISE PROVIDED.
Explanatory Note to Item 11—Reappointment of Auditor
The Supervisory Board approved a resolution to propose to the shareholders of the Company at the Annual General Meeting, and hereby does so propose, the reappointment of KPMG Accountants N.V. to audit the financial statements of the Company for the calendar year ending December 31, 2022. KPMG Accountants N.V. audited the Company’s financial statements for Calendar Year 2021.
THE SUPERVISORY BOARD AND THE MANAGING BOARD UNANIMOUSLY RECOMMEND A VOTE FOR THIS ITEM. COMPLETED PROXY CARDS WILL BE VOTED IN FAVOR THEREOF UNLESS INSTRUCTIONS ARE OTHERWISE PROVIDED.
Explanatory Note to Item 12—Extension of Certain Powers of the Supervisory Board
At our Annual General Meeting on June 29, 2021, the Supervisory Board was designated, for a period of eighteen (18) months, to:
a)issue a number of ordinary shares and financing preference shares and grant rights to subscribe for such shares, the aggregate par value of which shall be equal to the aggregate par value of fifty percent (50%) of shares issued and outstanding in the capital of the Company as at December 31, 2020 as included in the Annual Accounts for Calendar Year 2020; and
b)restrict or exclude the pre-emptive rights with respect to issuing ordinary shares or granting subscription rights for such shares, the aggregate par value of such shares or subscription rights shall be up to a maximum of ten percent (10%) of the aggregate par value of all shares issued and outstanding in the capital of the Company as at December 31, 2020.
The Managing Board and the Supervisory Board consider it in the best interest of the Company and its shareholders for the Supervisory Board to be able to react in a timely manner when certain opportunities arise that require issuance of our shares. For example, in the past, this designation has been used in relation to the issuance of convertible bonds because of the short window of opportunity for completing such transactions to maximize shareholder value.
Therefore, the Managing Board and the Supervisory Board believe it would be in the best interests of the Company and its shareholders to grant to the Supervisory Board the authority to issue QIAGEN Shares or financing preference shares, or to grant rights to subscribe for such shares, when such occasions occur, and to exclude the pre-emptive rights in situations where it is imperative to be able to act quickly, without having to obtain shareholder approval at an extraordinary general meeting of shareholders, which could take valuable time and may create disrupting market speculations. In addition, the authority to issue QIAGEN Shares may also be applied to meet the Company’s obligations under options, RSUs and PSUs awarded in accordance with applicable employee participation plans or the Company’s remuneration policies.
Notwithstanding the authorization of the Supervisory Board to issue shares as described herein, as a matter of Dutch law (Section 2:107a of the Dutch Civil Code), we must seek the approval of the general meeting of shareholder for resolutions of the Managing Board in respect of any transaction concerning a material change to the identity or the character of the Company or its business.
It is proposed to renew the current authorizations of the Supervisory Board to issue QIAGEN Shares and financing preference shares and to grant rights to subscribe for such shares as well as to restrict or exclude pre-emptive rights in connection therewith, with the same limits as the current authorizations, for a period of 18 months from the date of the Annual General Meeting (i.e., until December 23, 2023).
Designation of the Supervisory Board, for a period of 18 months from the date of the Annual General Meeting, as the body authorized to issue a number of ordinary shares and financing preference shares and grant rights to subscribe for such shares, up to a maximum of fifty percent (50%) of the Company’s issued and outstanding share capital as at December 31, 2021 (Agenda Item 12.a)
It is proposed to designate the Supervisory Board, for a period of 18 months from the date of the Annual General Meeting (i.e., until December 23, 2023), as the body authorized to issue a number of QIAGEN Shares and financing preference shares in the capital of the Company and grant rights to subscribe for such shares, the aggregate par value of which shall be equal to the aggregate par value of fifty percent (50%) of shares issued and outstanding in the capital of the Company as at December 31, 2021 as included in the Annual Accounts for Calendar Year 2021. The designation granted by the general meeting of shareholders held on June 29, 2021, will expire on adoption of this proposed resolution.
Designation of the Supervisory Board, for a period of 18 months from the date of the Annual General Meeting, as the body authorized to restrict or exclude the pre-emptive rights with respect to issuing QIAGEN Shares or granting subscription rights for such shares, up to a maximum of ten percent (10%) of the Company’s issued and outstanding share capital as at December 31, 2021 (Agenda Item 12.b)
In connection with the authorization of the Supervisory Board to issue shares and grant rights to subscribe for shares, it is proposed to also designate the Supervisory Board, for a period of 18 months from the date of the Annual General Meeting (i.e.,
until December 23, 2023), as the body authorized to restrict or exclude the pre-emptive rights with respect to issuing QIAGEN Shares or granting subscription rights for such shares, the aggregate par value of such shares or subscription rights shall be up to a maximum of ten percent (10%) of the aggregate par value of all shares issued and outstanding in the capital of the Company as at December 31, 2021 as included in the Annual Accounts for Calendar Year 2021. The designation granted by the general meeting of shareholders held on June 29, 2021, will expire on adoption of this proposed resolution.
According to Dutch law and the Company’s Articles of Association, the proposal set forth under Agenda Item 12.a may be adopted by an affirmative vote of a simple majority of the votes cast at the Annual General Meeting. The proposal set forth under Agenda Item 12.b requires the affirmative vote of two-thirds of the votes cast at the Annual General Meeting if less than fifty percent (50%) of the Company’s issued share capital is represented at the Annual General Meeting. If fifty percent (50%) or more of the Company’s issued share capital is represented at the Annual General Meeting, the proposal set forth under Agenda Item 12.b shall be validly adopted if adopted by a simple majority of the votes cast at the Annual General Meeting.
THE SUPERVISORY BOARD AND THE MANAGING BOARD UNANIMOUSLY RECOMMEND A VOTE FOR EACH OF THESE ITEMS. COMPLETED PROXY CARDS WILL BE VOTED IN FAVOR THEREOF UNLESS INSTRUCTIONS ARE OTHERWISE PROVIDED.
Explanatory Note to Item 13—Extension of Certain Powers of the Managing Board
Pursuant to Article 6 of the Company’s Articles of Association, the Managing Board shall have the power to cause the Company to acquire for consideration shares in the Company’s own share capital, if and in so far as the Managing Board has been authorized by the General Meeting of Shareholders for this purpose. The grant of such power to the Managing Board is typical for Dutch companies, and its approval is commonly included by such companies on the agenda for annual general meetings.
On June 29, 2021, the Managing Board was authorized by the General Meeting of Shareholders to, subject to the approval of the Supervisory Board and to the provisions of the Company’s Articles of Association and Section 2:98 of the Dutch Civil Code, cause the Company to acquire for consideration shares in the Company’s own share capital, up to a maximum of ten percent (10%) of the Company’s issued share capital on the date of acquisition and provided that the Company or any subsidiary of the Company shall not hold more than ten percent (10%) of the Company’s issued share capital at any time. Such acquisition may occur (i) with respect to QIAGEN Shares, at a price between EUR 0.01 and one hundred ten percent (110%) of the higher of the average closing price of the QIAGEN Shares on the New York Stock Exchange or, as applicable, the Frankfurt Stock Exchange, for the five trading days prior to the day of purchase or (ii) with respect to preference and financing preference shares, at a price between EUR 0.01 and three times the issuance price. This authorization is valid up to and including December 29, 2022.
The power to repurchase shares provides the Managing Board, subject to the approval of the Supervisory Board, with flexibility to repurchase shares for general corporate purposes and allows the Managing Board to return capital to the Company’s shareholders by repurchasing shares. In addition to being a means to return value to shareholders, repurchases of shares in the Company’s own share capital could be used by the Managing Board to streamline the Company’s investor base, demonstrate a commitment to the Company’s business and confidence in the long-term growth of the Company, provide increased liquidity for investors and cover obligations under the Company’s share-based compensation plans.
It is therefore proposed to renew this authorization and authorize the Managing Board, for a period of 18 months from the date of the Annual General Meeting (i.e., until December 23, 2023) and subject to the approval of the Supervisory Board and to the provisions of the Company’s Articles of Association and Section 2:98 of the Dutch Civil Code, to cause the Company to acquire, on a stock exchange or otherwise, for consideration shares in the Company’s own share capital, up to a maximum of ten percent (10%) of the Company’s issued share capital on the date of acquisition and provided that the Company or any subsidiary of the Company shall not hold more than ten percent (10%) of the Company’s issued share capital at any time. Such acquisition may occur (i) with respect to QIAGEN Shares, between EUR 0.01 and one hundred ten percent (110%) of the higher of the average closing price of the QIAGEN Shares on the New York Stock Exchange or, as applicable, the Frankfurt Stock Exchange, for the five trading days prior to the day of purchase or, (ii) with respect to preference and financing preference shares, between EUR 0.01 and three times the issuance price. The authorization granted by the general meeting of shareholders held on June 29, 2021, will expire on adoption of this proposed resolution.
THE SUPERVISORY BOARD AND THE MANAGING BOARD UNANIMOUSLY RECOMMEND A VOTE FOR THIS ITEM. COMPLETED PROXY CARDS WILL BE VOTED IN FAVOR THEREOF UNLESS INSTRUCTIONS ARE OTHERWISE PROVIDED.
Explanatory Note to Item 14—Discretionary rights for the Managing Board to implement a Capital Repayment by means of a Synthetic Share Repurchase
General introduction and key principles
Synthetic Share Repurchase
It is proposed, at the discretion of the Managing Board within the boundaries set forth below, and subject to the approval of the Supervisory Board, to adjust the Company’s capital structure and to repay capital to the Company’s shareholders via a synthetic share repurchase. The key consequences of this synthetic share repurchase, if implemented, will be as follows:
(i)an amount to be determined by the Managing Board, subject to the approval of the Supervisory Board, which amount will at maximum be USD 300 million, will be paid to the holders of QIAGEN Shares as a capital repayment; and
(ii)the number of outstanding QIAGEN Shares will at least be decreased by a number of QIAGEN Shares approximately equal to the number of QIAGEN Shares that could, theoretically, have been repurchased by the Company for the aggregate amount repaid to the holders of QIAGEN Shares (the amount repaid on each outstanding QIAGEN Share, the “Repayment Amount”, the aggregate amount to be repaid to a certain shareholder, the “Shareholder Repayment Amount”, and the aggregate of all Shareholder Repayment Amounts, the “Aggregate Repayment Amount”).
The Company conducted such a Synthetic Share Repurchase in 2016 / 2017, and this program received virtually unanimous shareholder approval at the Extraordinary General Meeting of Shareholders specifically organized for the purpose of resolving upon the program. To retain flexibility as to the implementation of the currently proposed synthetic share repurchase, as well as to reduce the implementation timelines and costs, the resolutions now proposed include a grant of certain discretionary powers (as further described below) to the Managing Board. The adoption by the Company’s shareholders of the resolutions proposed under Agenda Item 14 would, if implemented, reduce the implementation time for such a program from about five (5) months to approximately two and a half (2.5) months (including a mandatory two-month creditor opposition period), and in particular eliminate the need for an Extraordinary General Meeting of Shareholders.
Implementation Steps
If implemented, the synthetic share repurchase will take place in three steps that involve three subsequent amendments to the Company’s Articles of Association, which are all proposed by the Supervisory Board in accordance with article 43.2 of the Company’s Articles of Association:
(i)Step I: firstly, the par value of each QIAGEN Share will be increased by an amount to be determined by the Managing Board, subject to the approval of the Supervisory Board in accordance with the procedure described below (amendment Part I);
(ii)Step II: secondly, the QIAGEN Shares will be consolidated on the basis of a ratio to be determined by the Managing Board, subject to the approval of the Supervisory Board, which share consolidation will decrease the number of issued and outstanding QIAGEN Shares, such that the number of outstanding QIAGEN Shares will be reduced by a number approximately equal to the number of QIAGEN Shares that could, theoretically, have been repurchased by the Aggregate Repayment Amount (amendment Part II); and
(iii)Step III: thirdly, the par value of the QIAGEN Shares will be decreased to EUR 0.01 (the current par value of the QIAGEN Shares) (amendment Part III) and on each outstanding QIAGEN Share the Repayment Amount will be paid, which Repayment Amount will not exceed the amount by which the par value of the QIAGEN Shares will be reduced pursuant to this Step III.
A further explanation to these proposed subsequent amendments to the Company’s Articles of Association (Part I, II and III) and the overall mechanics of the proposed synthetic share repurchase are reflected below. The proposed steps including the related amendments to the Company’s Articles of Association under this Agenda Item 14 are put to a vote as one combined voting item.
Discretionary Powers
After a favorable vote by the Annual General Meeting in respect of this Agenda Item 14, the Managing Board shall have the full discretionary power not to, or, subject to the approval of the Supervisory Board, to implement the synthetic share repurchase. Furthermore, if the synthetic share repurchase were to be implemented, the Managing Board, with the approval of the Supervisory Board, will have the full discretionary power to determine when the synthetic share repurchase will be implemented and what the record date and the payment date(s) of the Shareholder Repayment Amount to shareholders will be, provided that the proposed amendments to the Company’s Articles of Association cannot be effected after 18 months from the date of the Annual General Meeting (i.e., until December 23, 2023).
Furthermore, the Managing Board shall have full discretionary power, subject to the approval of the Supervisory Board, to only implement Step I and III, but not Step II. For example, if the Repayment Amount will be relatively limited and the reduction of the number of QIAGEN Shares pursuant to the consolidation will be limited accordingly. Where the context so requires, references to the synthetic share repurchase should be read to include a reference to the implementation of only Step I and Step III.
The powers of the Managing Board set out in the two preceding paragraphs are jointly referred to as the “Discretionary Powers”. As a result of these Discretionary Powers, a favorable vote by the Annual General Meeting in respect of Agenda Item 14 will not by any means guarantee the actual implementation of a synthetic share repurchase, and therefore, a favorable outcome should expressly not be understood by shareholders as a final and unconditional decision to execute the program. A favorable vote only enables the Managing Board to implement the synthetic share repurchase in a more efficient and economical manner, if and when the Managing Board, using the Discretionary Powers, and with the approval of the Supervisory Board, decides to execute the program. It is emphasized that the Discretionary Powers also leave room to the Managing Board to decide not to implement the synthetic share repurchase at all, for reasons that the Managing Board deems in the best interests of the Company and its affiliated enterprise, taking into account the interests of the Company’s stakeholders, including its shareholders.
Procedure of the synthetic share repurchase
First amendment of the Company’s Articles of Association (Part I) — increase of par value
To make it possible to pay the Repayment Amount to the holders of QIAGEN Shares as a repayment of share capital, the par value of the QIAGEN Shares must be increased. The increase of the par value will take place prior to the share consolidation, if Step II is implemented, and will be such that prior to the decrease of the par value and repayment of share capital as provided for in Step III, the nominal value of the QIAGEN Shares at least equals the Repayment Amount plus EUR 0.01.
This increase of the par value of the QIAGEN Shares will be achieved through an amendment to the Company’s Articles of Association (Part I), as referred to under Agenda Item 14.a.
The increase in par value will be charged to the Company’s share premium reserve. Note that, if Step II is implemented, due to rounding, a second increase of the par value per consolidated QIAGEN Share may take place pursuant to amendment Part II as further described below.
Second amendment of the Company’s Articles of Association (Part II) — share consolidation (reverse stock split)
Secondly it is proposed to consolidate the QIAGEN Shares (including all fractional QIAGEN Shares in issue) in accordance with a consolidation ratio, which will be determined on the basis of the formula below. This consolidation of QIAGEN Shares, or reverse stock split, will be implemented by means of a second amendment of the Company’s Articles of Association (Part II), which amendment is proposed under Agenda Item 14.b.
Under Dutch law the par value per QIAGEN Share must be a multiple of EUR 0.01, therefore if the par value of the QIAGEN Shares after implementation of amendment Part I, divided by the consolidation ratio, would not result in a euro amount that is a multiple of EUR 0.01, the par value of the consolidated QIAGEN Shares will be rounded upwards. This potential subsequent increase of the par value of the QIAGEN shares will again be charged to the Company’s share premium reserve. The par value after amendment Part I will be set at such level that, taking into account such potential increase pursuant to amendment Part II, after amendment Part II the par value of the QIAGEN Shares will be at the level that is required to make the capital repayment as envisaged in the context of amendment Part III.
Third amendment of the Company’s Articles of Association (Part III) — decrease par value and repayment of share capital
Finally, it is proposed to decrease the par value of each (consolidated) QIAGEN Share back to EUR 0.01. This requires a third amendment to the Company’s Articles of Association (Part III), which is proposed under Agenda Item 14.c. In connection with this capital decrease, the Shareholder Repayment Amount will be paid to the holders of QIAGEN Shares and fractional QIAGEN Shares, whereby (i) the Repayment Amount will always be an amount having no more than two decimal places and be determined by the Managing Board, subject to the approval of the Supervisory Board, and (ii) to the extent that a Shareholder Repayment Amount would, as a result of entitlement to payment on fractional QIAGEN Shares, have more than two decimal places, the relevant Shareholder Repayment Amount will be rounded upwards to the nearest amount with two decimal places.
Calculation of the consolidation ratio
The consolidation ratio (“Y”) will be determined by the Managing Board as follows:
A = the total market value of the outstanding QIAGEN Shares in euro calculated on the basis of a market price per QIAGEN Share on a date to be determined by the Managing Board and based on the market price of a QIAGEN Share, which can be a volume weighted average market price on a stock-exchange as determined by the Managing Board and converted into euro if applicable in accordance with an exchange ratio determined by the Managing Board.
B = the intended Aggregate Repayment Amount (subject to rounding).
Y = a fraction as close as possible to Q, provided that Y shall have a denominator not exceeding 25.
| A-B | = | Q | ||||||||||||
| A | ||||||||||||||
Calculation example
Example2
The calculations below provide an example of the procedure. No rights can be derived from this example. The actual values, if and when the synthetic share repurchase would be implemented, will be determined by the Managing Board on the basis of the formulas reflected above.
Total number of outstanding QIAGEN Shares: 200 million
Market price per QIAGEN Share: EUR 40.00
Total market value of QIAGEN Shares: EUR 8 billion
Par value per QIAGEN Share EUR 0.01
Intended Aggregate Repayment Amount EUR 100 million (subject to rounding)
The intended Aggregate Repayment Amount to the holders of QIAGEN Shares in this example amounts to EUR 100 million. This equals one point twenty-five percent (1.25%) of the total market value of the outstanding QIAGEN Shares in this example. Therefore, the total number of issued QIAGEN Shares should be decreased by approximately one point twenty-five percent (1.25%) by means of the reverse stock split to ensure that the market value of an outstanding QIAGEN Share will stay approximately the same. Or, in other words, approximately one point twenty-five percent (1.25%) of the outstanding QIAGEN Shares could theoretically have been repurchased by the Company, if the amount of EUR 100 million was used for a share repurchase against a price per QIAGEN Share of EUR 40.00, the market value of a QIAGEN Share in this example.
____________________
2 Note that these numbers have been included for illustrative purposes only. They should not be considered to give any guidance of the intended amount of the Repayment Amount or the past, current or future value of the QIAGEN Shares.
As can be seen in the formula below, this reduction can be achieved by using a consolidation ratio of 25 pre-split QIAGEN Shares to 24 post-split QIAGEN shares:
| A (EUR 8 billion) -B (EUR 100 million) | = | Q | ≈ | 24 | ||||||||||||||||
| A (EUR 8 bilion) | 25 | |||||||||||||||||||
As set out above under ‘calculation of the consolidation ratio’, the consolidation ratio Y, shall be a fraction as close as possible to Q with a denominator not exceeding 25. In this example, Y therefore equals 24/25. Accordingly, the 200 million outstanding QIAGEN Shares shall be consolidated into 192 million shares, representing a four percent (4%) reduction (note that this percentage deviates from the one point twenty-five percent (1.25%) mentioned earlier, because Y’s denominator cannot exceed 25).
Since the Repayment Amount will be paid on the consolidated QIAGEN Shares, the intended Aggregate Repayment Amount must be divided by 192 million shares. This results in a payment per QIAGEN Share of EUR 0.52083, which will be rounded upwards to EUR 0.53. This rounded amount is the actual Repayment Amount.
As set out above, the par value of the QIAGEN Shares will be increased to such level that prior to the capital reduction as contemplated by Part III, the par value of each QIAGEN Share at least equals the Repayment Amount plus EUR 0.01 in this case EUR 0.54. To arrive at a par value of EUR 0.54 per consolidated QIAGEN Share, taking into account a 24/25 consolidation ratio, the par value pre-consolidation should be EUR 0.5184 (EUR 0.5184 times 25 divided by 24 equals EUR 0.54). In Part I the amount will be rounded such that it allows for the par value to increase to such value after Part II that at least equals the Repayment Amount plus EUR 0.01. In this calculation example each QIAGEN Share shall therefore have a par value of EUR 0.51 after implementation of amendment Part I.
Pursuant to the share consolidation each 25 QIAGEN Shares (aggregate par value 0.51 times 25, equals EUR 12.75) will be consolidated into 24 QIAGEN Shares. This would result in a par value of EUR 0.531325 (EUR 12.75 dividend by 24), which will be rounded upwards as set out above to EUR 0.54. Subsequently, amendment Part III will be implemented pursuant to which the par value will again be reduced to EUR 0.01, and EUR 0.53 will be repaid on each outstanding QIAGEN Share and in pro rata entitlements on each outstanding fractional QIAGEN Share. For QIAGEN Shares or fractional QIAGEN Shares held in treasury, the relevant amount will again be added to the Company’s reserves.
Timeline and implementation process
If the Managing Board resolves to implement the synthetic share repurchase, it will timely announce the intention to implement this program, the relevant Ex Distribution Date, Record Date and Payment Date(s) to the holders of QIAGEN Shares. Note that, in addition to the exercise of the Discretionary Powers by the Managing Board and the required approvals of the Supervisory Board, the implementation of the synthetic share repurchase will be subject to the observance of a statutory creditor opposition procedure, which involves a two-months creditor opposition period and the Company having sufficient reserves to charge the increase of the par value to at the time of the implementation of the synthetic share repurchase.
Shareholders’ interests
Beneficial Shareholders
For persons holding their QIAGEN Shares through the Depository Trust Company, subject to contractual arrangements, the shareholding of beneficial shareholders will be rounded down. As a result, shareholders entitled to fractional QIAGEN Shares in accordance with the consolidation ratio will receive cash from their relevant bank or intermediary.
Registered Shareholders
Shareholdings registered in the Company’s shareholders register will be consolidated into QIAGEN Shares with the new par value in accordance with the consolidation ratio based on the formula described above. Any registered holding of QIAGEN
Shares in the Company that would result in fractional QIAGEN Shares following the application of the consolidation ratio will entitle the holder of those fractional QIAGEN Shares to a fractional dividend but will not entitle the holder to voting rights with respect to such fractional QIAGEN Shares (unless exercised together with other holders of fractional QIAGEN Shares, to the extent their aggregate number of fractional QIAGEN Shares equals the number of fractional QIAGEN Shares one QIAGEN Share comprises or a multiple thereof). Please see article 11 of the Company’s Articles of Association for the provisions applicable to fractional QIAGEN Shares.
Holders of existing fractional shares
Following the consolidation, every holder of fractional QIAGEN Shares will hold a number of fractional shares equal to its existing holding multiplied by the numerator of the consolidation ratio, whereby every QIAGEN Share will, following the consolidation, comprise a number of fractional shares equal to the existing number of fractional shares that comprise a QIAGEN Share (i.e. 27) multiplied by the denominator of the consolidation ratio. Therefore, every holder of fractional QIAGEN Shares will hold the same economic entitlement to a QIAGEN Share before and after the consolidation (with respect to its existing fractional QIAGEN Shares without taking into account any rounding).
If the consolidation would entitle a shareholder that holds both QIAGEN Shares and fractional QIAGEN Shares to fractional entitlements, such entitlements will be added to the number of existing fractional QIAGEN Shares. This addition of fractional QIAGEN Shares to existing fractional QIAGEN Shares, may result in an automatic consolidation of fractional shares into a QIAGEN Share in accordance with the Company’s Articles of Association.
Fractional shares make-whole action
Prior to or following the execution of the synthetic share repurchase, if and to the extent implemented, the Company may undertake certain steps making-whole the then issued and outstanding fractional QIAGEN Shares. These steps may include the unilateral transfer, for no consideration, by the Company of such number of additional fractional QIAGEN Shares to each holder of fractional QIAGEN Shares, that these holders will hold such number of fractional QIAGEN Shares one QIAGEN Share comprises, as a result of which, the fractional QIAGEN Shares will automatically consolidate into a QIAGEN Share in accordance with article 11.7 of the Company’s Articles of Association. If the transfer described above were to be undertaken by the Company, no further action or act of acceptance will be required from the holders of fractional QIAGEN Shares in that respect.
Tax consequences
The amount to be repaid to a holder of QIAGEN Shares in connection with the synthetic share repurchase will not be subject to Dutch dividend withholding tax. Shareholders are encouraged to consult their own tax advisor as to the particular tax consequences in light of their specific circumstances.
Further explanation to the proposed resolutions under Agenda Items 14.a. through 14.d.
The three steps by which the synthetic share repurchase will be effected - if and to the extent the Managing Board, using the Discretionary Powers, decides to implement the synthetic share repurchase - are summarized below and each step will be implemented by a separate deed of amendment to the Company’s Articles of Association. Further explanations to the proposed changes are also included in a triptych (a comparison with the present Company’s Articles of Association) made available to the Company’s shareholders upon convocation of the Annual General Meeting.
14.a. Amendment of the Articles of Association of the Company (Part I) to increase the par value per QIAGEN Share
It is proposed to the Annual General Meeting to resolve to amend the Company’s Articles of Association in accordance with the draft deed of amendment Part I that is made available to the Company’s shareholders upon convocation of the Annual General Meeting.
14.b. Amendment of the Articles of Association of the Company (Part II) (to execute the reverse stock split)
To consolidate the QIAGEN Shares as explained above, it is proposed to the Annual General Meeting to resolve to amend the Company’s Articles of Association in accordance with the draft deed of amendment Part II that is made available to the Company’s shareholders upon convocation of the Annual General Meeting, following the amendment as referred to under Agenda Item 14.a. In addition, in connection with this share consolidation, certain changes will be made to the provisions in the
Company’s Articles of Association relating to fractional QIAGEN Shares as the existing fractional QIAGEN Shares will also be consolidated in accordance with the consolidation ratio.
14.c. Amendment of the Articles of Association (Part III) to decrease the par value of the QIAGEN Shares including a reduction of capital
It is proposed to the Annual General Meeting to resolve to amend the Company’s Articles of Association, following the amendments as referred to under Agenda Items 14.a. and 14.b. (to the extent applicable), in accordance with the draft deed of amendment Part III which is made available to the Company’s shareholders upon convocation of the Annual General Meeting, to decrease the par value of each QIAGEN Share back to EUR 0.01, which will be combined with a capital repayment to the Company’s shareholders.
14.d. Authorization
It is proposed to the Annual General Meeting to authorize each member of the Managing Board and each lawyer, (candidate) civil law notary and paralegal working at De Brauw Blackstone Westbroek N.V. to have the three deeds of amendment of the Company’s Articles of Association as referred to under Agenda Items 14.a.,
14.b. and 14.c executed, if and to the extent the Managing Board, using the Discretionary Powers, decides to proceed with the synthetic share repurchase.
The verbatim text of each of the amendments to the Company’s Articles of Association and a triptych containing explanatory notes thereto are available at the Company’s website (https://corporate.qiagen.com/ agm2022) and at the offices of the Company at Hulsterweg 82, 5912 PL Venlo, The Netherlands, and at the offices of American Stock Transfer and Trust Company, LLC at 6201 15th Avenue, Brooklyn, New York 11219, United States of America, until the close of the Annual General Meeting.
One voting item
The proposals under Agenda Items 14.a. through 14.d. will be put to a vote as one combined voting item and, for the avoidance of doubt, include the grant of the Discretionary Powers to the Managing Board. Pursuant to Dutch law, the resolution to decrease the (aggregate) par value of the issued QIAGEN Shares (both the issued and outstanding QIAGEN Shares and the QIAGEN Shares held in treasury at the time of implementation of the synthetic share repurchase) through the proposed amendment of the Company’s Articles of Association (Part III) reflected in Step III above require a favorable vote by a majority of at least two-thirds of the votes cast at the Annual General Meeting if less than fifty percent (50%) of the Company’s issued share capital is represented at the Annual General Meeting. If fifty percent (50%) or more of the Company’s issued share capital is represented at the Annual General meeting, a simple majority of the votes cast at the Annual General Meeting is sufficient for the resolution to be adopted. As the relevant steps contemplated for the synthetic share repurchase (Steps I through III reflected above) are put to a vote as one combined voting item, the aforementioned majority requirements apply in full to this voting item.
It is once again noted that, if this Agenda Item 14 is adopted by the Annual General Meeting, the implementation of the Agenda Item and the relevant subsections thereof is subject to, among other things, the Managing Board’s use of its Discretionary Powers.
Furthermore, the resolution to reduce the issued share capital as contemplated by Step III only becomes effective after a two-month creditor opposition period as described in section 2:100 of the Dutch Civil Code has been observed.
Under the provisions of section 2:100 of the Dutch Civil Code, creditors may lodge objections to the capital reduction within a period of two months following the announcement of the filings of the resolution to reduce the Company’s share capital with the Dutch Trade Register. The third amendment of the Articles of Association (Part III) effecting the capital reduction may only be implemented after such two-month creditor opposition period has lapsed, provided that no creditor objections have been received by the competent court or, in the event objections have been received, after such opposition has been withdrawn, resolved of lifted by an enforceable court order by the competent court in the Netherlands.
THE SUPERVISORY BOARD AND THE MANAGING BOARD UNANIMOUSLY RECOMMEND A VOTE FOR EACH OF THESE ITEMS. COMPLETED PROXY CARDS WILL BE VOTED IN FAVOR THEREOF UNLESS INSTRUCTIONS ARE OTHERWISE PROVIDED.
Explanatory Note to Item 15—Cancellation of fractional QIAGEN Shares held by the Company
As a result of a repurchase of fractional QIAGEN Shares performed following the synthetic share repurchase the Company implemented in 2016 / 2017, the Company currently holds approximately 44.11 fractional QIAGEN Shares in its own capital. Furthermore, the Company may, in connection with the effectuation of certain steps relating to the synthetic share repurchase proposed under Agenda Item 14, if implemented, acquire a very limited number of additional fractional QIAGEN Shares. In an effort to, as much as possible, clean up the composition of the Company’s share capital, it is contemplated by the Company to cancel all fractional QIAGEN Shares it holds or will hold in own capital as these fractional QIAGEN Shares do not serve any particular purpose and cannot be used for any purpose for which full QIAGEN Shares held in treasury are typically used. The costs for such cancellation(s) will be limited.
It is therefore proposed by the Supervisory Board, in accordance with article 7 read in conjunction with article 11.4 of the Company’s Articles of Association, and with due observance of Section 2:99 of the Dutch Civil Code, to reduce the issued share capital of the Company by cancelling all fractional QIAGEN Shares (i) the Company holds in its own capital at the date of the Annual General Meeting, and (ii) the Company will hold in its own capital as a result of the synthetic share repurchase proposed under Agenda Item 14, if implemented, and the execution of certain steps making-whole the then issued and outstanding fractional QIAGEN Shares as described in the explanatory notes to Agenda Item 14. The cancellation may be executed in one or more tranches, at the discretion of the Managing Board. The number of fractional QIAGEN Shares to be cancelled (whether or not in a tranche) shall be determined by the Managing Board, but shall not exceed the number of fractional QIAGEN Shares the Company may hold in its own share capital following execution of the synthetic share repurchase proposed under Agenda Item 14, if implemented, and any related steps making-whole the then issued and outstanding fractional QIAGEN Shares as described in the explanatory notes to Agenda Item 14.
Under the provisions of Section 2:100 of the Dutch Civil Code, creditors may lodge objections to a capital reduction within a period of two months following the announcement of the filing of the resolution to reduce the Company’s share capital with the Dutch Trade Register. Any resolution of the Managing Board to implement the cancellation of fractional QIAGEN Shares (whether or not in a tranche) will only become effective after such two-month creditor opposition period has lapsed, provided that no creditor objections have been received by the competent court or, in the event objections have been received, after such opposition has been withdrawn, resolved of lifted by an enforceable court order by the competent court in the Netherlands.
According to Dutch law, the proposal set forth under Agenda Item 15 requires the affirmative vote of two-thirds of the votes cast at the Annual General Meeting if less than fifty percent (50%) of the Company’s issued share capital is represented at the Annual General Meeting. If fifty percent (50%) or more of the Company’s issued share capital is represented at the Annual General Meeting, the proposal set forth under Agenda Item 15 shall be validly adopted if adopted by a simple majority of the votes cast at the Annual General Meeting.
THE SUPERVISORY BOARD AND THE MANAGING BOARD UNANIMOUSLY RECOMMEND A VOTE FOR THIS ITEM. COMPLETED PROXY CARDS WILL BE VOTED IN FAVOR THEREOF UNLESS INSTRUCTIONS ARE OTHERWISE PROVIDED.
COMMITTEES OF THE SUPERVISORY BOARD, MEETINGS AND
SHAREHOLDER COMMUNICATIONS TO THE BOARD
Meeting Attendance. During 2021, there were five (5) meetings of the Supervisory Board, and the various committees of the Supervisory Board met a total of nineteen (19) times. No Supervisory Director attended fewer than seventy-five percent (75%) of the total number of meetings of the Supervisory Board and of committees of the Supervisory Board on which they served during the year.
Committees of the Supervisory Board. The Supervisory Board has established an Audit Committee, a Compensation & Human Resources Committee, a Nomination & ESG Committee and a Science & Technology Committee from among its members and can establish other committees as deemed beneficial. The Supervisory Board has approved charters under which each of the committees operates. These charters are published on our website www.qiagen.com. The committees are comprised of the following members as of May 1, 2022:
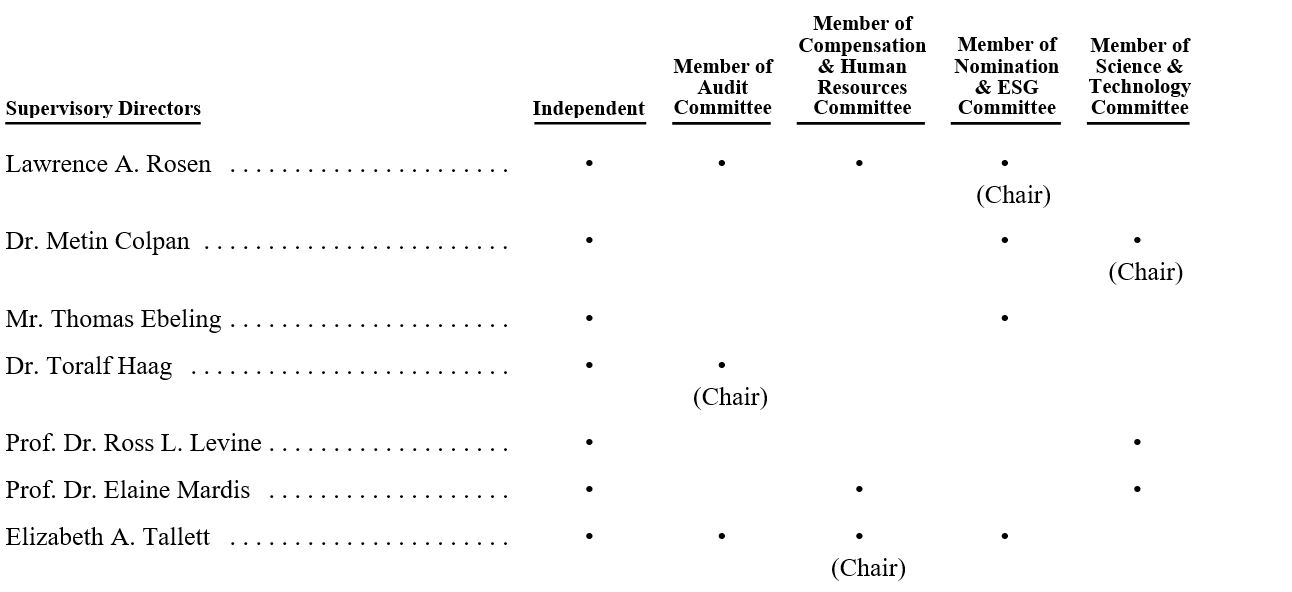
We believe that all of our Supervisory Directors meet the independence requirements set forth in the Dutch Corporate Governance Code (the “Dutch Code”). We further believe that all Supervisory Board Directors qualify as independent under the independence standards set forth in the New York Stock Exchange (the “NYSE”) Listed Company Manual. Pursuant to the NYSE rules, a majority of the Supervisory Directors must qualify as independent, as defined in the Rules.
Audit Committee. The Audit Committee currently consists of three members: Dr. Haag (Chair), Mr. Rosen and Ms. Tallett, and meets at least quarterly. The Audit Committee members are appointed by the Supervisory Board and serve for a term of one year. We believe that all members of this Committee meet the independence requirements as set forth in Rule 10A-3 of the Securities Exchange Act of 1934, as amended, and the NYSE Listed Company Manual. The Board has designated Dr. Haag as an “Audit Committee Financial Expert” as that term is defined in the U.S. Securities and Exchange Commission rules adopted pursuant to the Sarbanes-Oxley Act of 2002 and as referred to in the Dutch Decree on Audit Committees (Besluit instelling audit committee). The Audit Committee performs a self-evaluation of its activities on an annual basis.
The Committee’s primary duties and responsibilities include, among other things, to serve as an independent and objective party to monitor QIAGEN’s accounting and financial reporting process, control and compliance systems and internal risk management, including cyber security. This Committee also is directly responsible for proposing the external auditor to the Supervisory Board, which then proposes the appointment of the external auditor to the Annual General Meeting. Further, this Committee is responsible for the compensation and oversight of QIAGEN’s external auditor and for providing an open avenue of communication among the external auditor as well as the Managing Board and the Supervisory Board. Our Internal Audit department operates under the direct responsibility of the Audit Committee. Further, this Committee is responsible for establishing procedures to allow for the confidential and or anonymous submission by employees of concerns, including the receipt, retention and treatment of submissions received regarding accounting, internal accounting controls, or auditing matters.
The Audit Committee, among other things:
•reviews our financial accounting and reporting principles and policies, and the adequacy of our internal accounting, financial and operating controls and procedures with the external auditor and management;
•considers and approves any recommendations regarding changes to our accounting policies and processes;
•reviews with management and the external auditor our quarterly earnings reports prior to their public release;
•reviews the quarterly and annual reports (reported on Forms 6-K and 20-F) to be furnished to or filed with the U.S. Securities and Exchange Commission and the Deutsche Boerse in Germany; and
•reviews major risk exposures (including cyber security), pre-approves related-party transactions between the Company and members of the Supervisory Board or Managing Board, and reviews any legal matter including compliance topics that could have a significant impact on the financial statements.
The Audit Committee met seven (7) times in 2021 and met with the external auditor excluding members of the Managing Board in December 2021.
Compensation & Human Resources Committee. The Compensation & Human Resources Committee’s primary duties and responsibilities include, among other things:
•preparation of a proposal to the Supervisory Board regarding the Remuneration Policy for the Managing Board and Supervisory Board and proposal for adoption by shareholders at the General Meeting;
•preparation of a proposal concerning the individual compensation for Managing Board members to be adopted by the Supervisory Board; and
•preparation of the Remuneration Report that outlines compensation for the Managing Board members and Supervisory Board members to be adopted by the Supervisory Board and submitted to the Annual General Meeting for an advisory vote in accordance with Dutch law. The Remuneration Report outlines the implementation of the Remuneration Policies for the most recent year.
Additionally, the Compensation & Human Resources Committee is responsible for:
•review and approval of all equity-based compensation;
•review and approval of the annual salaries, bonuses and other benefits of the Executive Committee; and
•review of general policies relating to employee compensation and benefits.
This Committee engages external consultants to ensure that the overall remuneration levels are benchmarked regularly, against a selected group of companies and key markets in which QIAGEN operates.
The Committee currently consists of three members: Ms. Tallett (Chair), Mr. Rosen and Prof. Dr. Mardis. Members are appointed by the Supervisory Board and serve for a term of one year. This Committee met five (5) times in 2021.
Nomination & ESG Committee. The Nomination & ESG Committee’s primarily responsibilities include, among other things:
•preparing selection criteria and appointment procedures for members of the Supervisory Board and Managing Board; and
•conducting periodic evaluations of QIAGEN’s environmental, social and governance (ESG) policies and related public disclosures.
Additionally, this Committee periodically evaluates the scope and composition of the Managing Board and the Supervisory Board, including the profile of the Supervisory Board as well as the functioning of individual members of Boards, and reporting these results to our Supervisory Board. It also proposes the (re-)appointment of members of the Managing Board and Supervisory Board and supervises the policy of the Managing Board in relation to the selection and appointment criteria for senior management.
The Committee currently consists of four members: Mr. Rosen (Chair), Dr. Colpan, Mr. Ebeling and Ms. Tallett. Members are appointed by the Supervisory Board and serve for a one-year term. This Committee met three (3) times in 2021.
Science & Technology Committee. The Science & Technology Committee works with the Scientific Advisory Board which was established in 2021 to provide early evaluation of market and technology developments that could have an influence on QIAGEN’s development and positioning in the Life Sciences and Molecular Diagnostics. The Committee’s primary responsibilities include, among other things:
• reviewing and monitoring research and development projects, programs, budgets, infrastructure management; and
• overseeing the management risks related to our portfolio and information technology platforms.
The Science & Technology Committee provides understanding, clarification and validation of the fundamental technical basis of our businesses in order to enable the Supervisory Board to make informed, strategic business decisions and vote on related matters. Additionally, the Committee guides the Managing Board to ensure that QIAGEN can develop and leverage powerful, world-class science to create value for our stakeholders, including shareholders.
The Committee currently consists of three members: Dr. Colpan (Chair), Prof. Dr. Levine and Prof. Dr. Mardis. Members are appointed by the Supervisory Board and serve for a term of one year. The Science & Technology Committee met four (4) times in 2021.
Shareholder Communications to the Board. Shareholders who have questions or concerns should generally contact our Investor Relations department at +49-2103-29-11709 or ir@qiagen.com. However, any shareholders who wish to address questions regarding our business directly with the Supervisory Board, or any individual Supervisory Director, should direct questions in writing to the Chair of the Supervisory Board, QIAGEN N.V., Hulsterweg 82, 5912 PL Venlo, The Netherlands.
ADDITIONAL INFORMATION REGARDING COMPENSATION OF MANAGING DIRECTORS
The following section summarizes the compensation of the Managing Directors. More detailed information on the way our Remuneration Policy was executed in 2021 can be found in the Remuneration Report of the Company which is published on our website (www.qiagen.com).
At the Annual General Meeting in June 2021, the Remuneration Policy of the Managing Board was adopted. The Remuneration Policy for the Managing Board supports the long-term development and strategy of QIAGEN in a highly dynamic environment while aiming to address the views of various stakeholders and maintaining an acceptable risk profile. It builds on remuneration principles and practices that have proven to be both fitting and effective for QIAGEN. The Supervisory Board ensures that the Remuneration Policy for the Managing Board and its implementation are linked to our objectives.
Remuneration for Managing Board members consists of a combination of base salary, short-term incentives in the form of cash tied to the achievement of annual performance goals and long-term incentives granted in share units that only vest after multiple years upon the achievement of predefined targets. In addition, Managing Board members can receive deferred compensation arrangements and other benefits in line with local market practice.
The remuneration package for Managing Board members is designed to have the vast majority paid in variable awards as part of the “pay-for-performance” culture and to align their interests with stakeholders to generate long-term value. The amount of these variable awards can differ substantially from year to year and depend on actual performance. Within the variable component, the incentives for short-term operational performance have a lower weight than the long-term incentives, which are again aimed at creating sustainable value for QIAGEN’s shareholders and other stakeholders. This is achieved by strongly linking long-term compensation through equity with the outcomes for shareholders in terms of share price appreciation.
The remuneration of the Managing Board in 2021 is based on the Remuneration Policy for the Managing Board, as approved by shareholders in 2021. It includes any remuneration granted by any consolidated subsidiary.
The remuneration of the Managing Board as reflected in the table below is based on incurred accounting expenses in 2021 for the cash and share-based components, and for this reason the table below is provided in addition to the remuneration information provided in the 2021 Annual Report. For the stock plan awards, this valuation is most insightful for the different grants awarded under current and previous policy and are running concurrently. The share-based expense of Mr. Sackers in 2021 includes grants that are vesting over three, five and 10 years of service on the Managing Board. The long-term incentive levels for Mr. Bernard take into account that he joined the Managing Board in 2020.
In $ '000s (1) | Fixed remuneration | Variable remuneration | Proportion of fixed and variable remuneration including share-based award expense | ||||||||||||||||||||||||||||||||||||||
| Managing Board member | Base salary | Deferred compensation | Other benefits (2) | Short-term incentives | Long-term incentives (3) | Total remuneration | |||||||||||||||||||||||||||||||||||
| Thierry Bernard Chief Executive Officer | 900 | 90 | 40 | 1,076 | 4,475 | 6,581 | 16% / 84% | ||||||||||||||||||||||||||||||||||
| Roland Sackers Chief Financial Officer | 606 | 128 | 96 | 476 | 5,902 | 7,208 | 12% / 88% | ||||||||||||||||||||||||||||||||||
| Total Managing Board | 1,506 | 218 | 136 | 1,552 | 10,377 | 13,789 | 13% / 87% | ||||||||||||||||||||||||||||||||||
____________________
(1) The salary of Mr. Bernard is set in U.S. dollars. The salary of Mr. Sackers is set in EUR and subject to fluctuation of exchange rates when reported in U.S. dollars. The exchange rate used for translation was EUR 1 = USD 1.1832.
(2) Includes Amounts include, among others, car lease and reimbursed personal expenses such as tax consulting. We also occasionally reimburse our Managing Directors’ personal expenses related to attending out-of-town meetings but not directly related to their attendance. Amounts do not include the reimbursement of certain expenses relating to travel incurred at the request of QIAGEN, other reimbursements or payments that in total did not exceed $10,000, or tax amounts paid by the Company to tax authorities in order to avoid double-taxation under multi-tax jurisdiction employment agreements.
(3) The value of stock plan grants is based on incurred accounting expenses under IFRS 2 Share-based Payment.
| PART I |  | |||||||||||||
UNOFFICIAL ENGLISH TRANSLATION
DEED OF AMENDMENT
ARTICLES OF ASSOCIATION
QIAGEN N.V.
(Step 1)
On the [●] day of [●] two thousand and [●] appeared before me, [[●], deputy civil law notary, acting for] Professor Martin van Olffen, civil law notary in Amsterdam:
[●].
The person appearing before me declares that on the [●] day of [●] two thousand and [●] the general meeting of the public limited liability company: QIAGEN N.V., with seat in Venlo, the Netherlands, address at Hulsterweg 82, 5912 PL Venlo, the Netherlands and Trade Register number 12036979 (the "Company"), resolved to amend the Company's articles of association and to authorise the person appearing to execute this deed.
In order to implement these resolutions, the person appearing before me declares to amend the Company's articles of association as follows:
I. Article 3.1. will be amended and shall read as follows:
3.1. The authorised capital of the company amounts to [●] euro [and [●] eurocent] (EUR [●]), divided into four hundred and ten million (410,000,000) ordinary shares of [●] euro[cent] (EUR [●]) each, forty million (40,000,000) financing preference shares of one eurocent (EUR 0.01) each and four hundred and fifty million (450,000,000) preference shares of one eurocent (EUR 0.01) each.
II. Article 8.1. will be amended and shall read as follows:
8.1. Shares shall be issued in registered form only. The managing board may decide to identify all or part of the shares in such a manner that it deems appropriate, or to change or cancel the identification of all or part of the shares.
Finally the person appearing declares:
1.the nominal value of each issued ordinary share of one eurocent (EUR 0.01) is increased to [●] euro[cent] (EUR [●]) by and through the execution of this deed of amendment of the articles of association;
2.the obligation to further pay up each issued ordinary share in the amount of [●] euro [and [●] eurocent] (EUR [●]) which has arisen as a result of the increase of the nominal value mentioned under 1, shall be satisfied by charging the share premium reserve of the Company; and
3.as a consequence of the execution of this deed of amendment of the articles of association, the issued and paid-up share capital of the Company amounts to [●] euro [and [●] eurocent] (EUR [●]), consisting of [●] ([●]) ordinary shares, [●] ([●]) fractional shares, [●] ([●]) financing preference shares and [●] ([●]) preference shares.
A document in evidence of the resolutions, referred to in the head of this deed, is attached (in copy) to this deed.
The original copy of this deed was executed in Amsterdam, on the date mentioned at the top of this deed. I summarised and explained the substance of the deed. The individual appearing before me confirmed having taken note of the deed's contents and having agreed to a limited reading of the deed. I then read out those parts of the deed that the law requires. Immediately after this, the individual appearing before me, who is known to me, and I signed the deed at [●].
| PART II | | |||||||||||||
UNOFFICIAL ENGLISH TRANSLATION
DEED OF AMENDMENT
ARTICLES OF ASSOCIATION
QIAGEN N.V.
(Step II)
On the [●] day of [●] two thousand and [●] appeared before me, [[●], candidate civil law notary, acting for] Professor Martin van Olffen, civil law notary in Amsterdam:
[●].
The person appearing before me declares that on the [●] day of [●] two thousand and [●] the general meeting of the public limited liability company: QIAGEN N.V., with seat in Venlo, the Netherlands, address at Hulsterweg 82, 5912 PL Venlo, the Netherlands and Trade Register number 12036979 (the "Company"), resolved to amend the Company's articles of association as well as to authorise the person appearing to execute this deed.
In order to implement these resolutions, the person appearing before me declares to amend the Company's articles of association as follows:
I. Article 3.1. will be amended and will read as follows:
3.1. The authorised capital of the company amounts to [●] euro [and [●] eurocent] (EUR [●]), divided into [●] ([●]) ordinary shares of [●] euro[cent] (EUR [●]) each, forty million (40,000,000) financing preference shares of [●] euro [and [●] eurocent] (EUR [●]) each and [●] ([●]) preference shares of [●] euro [and [●] eurocent] (EUR [●]) each.
II. Article 11.1. will be amended and will read as follows:
11.1. Each ordinary share consists of [●] ([●]) fractional shares. Each fractional share represents [●] ([●]/[●]) portion of the value of an ordinary share.
III. Articles 11.5. up to and including 11.8. will be amended and will read as follows:
11.5. A holder of one or more fractional shares may exercise the meeting and voting rights attaching to an ordinary share together with one or more other holders of one or more fractional shares to the extent the total number of fractional shares held by such holders of fractional shares equals [●] ([●]) or a multiple thereof. These rights shall be exercised either by one of them who has been authorized to that effect by the others in writing, or by a proxy authorized to that effect by those holders of fractional shares in writing.
11.6. Every holder of a fractional share is entitled to [●]/[●] ([●]/[●]) part of the (interim) dividend and any other distribution to which the holder of one (1) ordinary share is entitled.
11.7. In the event the holder of one or more fractional shares acquires such number of fractional shares that the total number of fractional shares held by him at least equals [●] ([●]), then each time [●] ([●]) fractional shares held by him shall by operation of law be consolidated into one (1) ordinary share; this shall be recorded in the shareholders’ register.
11.8. One or more shares held by the company in its own share capital, can be divided into [●] ([●]) fractional shares upon a resolution by the managing board. Fractional shares created in this way, will not be consolidated in accordance with article 11.7 as long as those fractional shares are held by the company, unless the managing board resolves to consolidate in accordance with article 11.7.
Finally the person appearing declares:
1.by and through execution of this deed of amendment of the articles of association, the ordinary shares with a nominal value of [●] euro [and [●] eurocent] (EUR [●]) each held by a shareholder immediately prior to such execution, are consolidated into such number of ordinary shares with a nominal value of [●] euro [and [●] eurocent] each, whereby (i) the number of ordinary shares held by a shareholder as a result of the consolidation shall be found by multiplying the total number of ordinary shares held by such shareholder immediately prior to the execution of this deed of amendment of the articles of association by [●]/[●] ([●]/[●]) (the "Consolidation Ratio"), and (ii) the numerator of a fraction resulting after such multiplication, which fraction shall have a denominator of [●] ([●]), shall indicate the number of fractional shares that such shareholder shall hold as of the moment of the execution of this deed of amendment of the articles of association as a result of the consolidation of ordinary shares, without taking into account the fractional shares that a shareholder may acquire due to the consolidation referred to under 2 and subject to fractional shares being consolidated into one (1) ordinary share in accordance with article 11.7, as it will read at the time of execution of this deed of amendment of the articles of association;
2.by and through execution of this deed of amendment of the articles of association, and only if and insofar fractional shares are issued immediately prior to the execution of this deed of amendment of the articles of association, the fractional shares held by a shareholder immediately prior to such execution are consolidated, whereby the number of fractional shares that will be held by a shareholder as a result of the consolidation, without taking into account the fractional shares that a shareholder may acquire due to the consolidation referred to under 1 and subject to fractional shares being consolidated into one (1) ordinary share in accordance with article 11.7, as it will read at the time of execution of this deed of amendment of the articles of association, shall be found by multiplying the total number of fractional shares held by such shareholder immediately prior to the execution of this deed of amendment of the articles of association by the numerator of the Consolidation Ratio;
3.the obligation to further pay up the issued ordinary shares and/or the fractional shares, potentially resulting from the consolidations as mentioned under 1 and 2, shall be satisfied by charging the share premium reserve of the Company; and
4.as a consequence of the execution of this deed the issued and paid-up share capital of the Company amounts to [●] euro [and [●] eurocent] (EUR [●]), consisting of [●] ([●]) ordinary shares, [●] ([●]) fractional shares, [●] ([●]) financing preference shares and [●] ([●]) preference shares.
A document in evidence of the resolutions, referred to in the head of this deed, is attached (in copy) to this deed.
The original copy of this deed was executed in Amsterdam, on the date mentioned at the top of this deed. I summarised and explained the substance of the deed. The individual appearing before me confirmed having taken note of the deed's contents and having agreed to a limited reading of the deed. I then read out those parts of the deed that the law requires. Immediately after this, the individual appearing before me, who is known to me, and I signed the deed at [●].
| PART III | | |||||||||||||
UNOFFICIAL ENGLISH TRANSLATION
DEED OF AMENDMENT
ARTICLES OF ASSOCIATION
QIAGEN N.V.
(Step III)
On the [●] day of [●] two thousand and [●] appeared before me, [[●] candidate civil law notary, acting for] Professor Martin van Olffen, civil law notary in Amsterdam:
[●].
The person appearing before me declares that on the [●] day of [●] two thousand and [●] the general meeting of the public limited liability company: QIAGEN N.V., with seat in Venlo, the Netherlands, address at Hulsterweg 82, 5912 PL Venlo, the Netherlands and Trade Register number 12036979 (the "Company"), resolved to amend the Company's articles of association and to authorise the person appearing to execute this deed.
In order to implement these resolutions, the person appearing before me declares to amend the Company's articles of association as follows:
Article 3.1. will be amended and shall read as follows:
3.1. The authorised capital of the company amounts to [●] euro [and [●] eurocent] (EUR [●]), divided into [●] ([●]) ordinary shares of one eurocent (EUR 0.01) each, forty million (40,000,000) financing preference shares of one eurocent (EUR 0.01) each and [●] ([●]) preference shares of one eurocent (EUR 0.01) each.
Finally the person appearing declares:
1.the nominal value of each issued ordinary share of [●] euro [and [●] eurocent] (EUR [●]) is decreased to one eurocent (EUR 0.01) by and through the execution of this deed of amendment of the articles of association;
2.as a consequence of the execution of this deed of amendment of the articles of association, the issued and paid-up share capital of the Company amounts to [●] euro [and [●] eurocent] (EUR [●]), consisting of [●] ([●]) ordinary shares, [●] ([●]) fractional shares, [●] ([●]) financing preference shares and [●] ([●]) preference shares;
3.a part of the total amount by which the nominal value of the issued ordinary shares is decreased, less the amount required in connection with the rounding referred to under 7, being an amount of [●] euro [and [●] eurocent] (EUR [●]), shall be added to the Company's share premium reserve;
4.the remainder of the total amount by which the nominal value of the issued ordinary shares is decreased, being an amount of [●] euro [and [●] eurocent] (EUR [●]), shall be repaid at such points in time as determined by the managing board to those persons who on the [●] day of [●] at [●], after processing all settlements as of that time, are registered as holders of ordinary shares and/or fractional shares in a (sub)register designated by the managing board;
5.the amount in cash that will be repaid on each issued and outstanding ordinary share on the date(s) referred to under 4 is equal to [●] euro [and [●] eurocent] (EUR [●]);
6.the amount in cash that will be repaid on each issued and outstanding fractional share on the date(s) referred to under 4 is equal to [●]/[●] ([●]/[●]) part of the amount referred to under 5;
7.any aggregate amount to be repaid to a holder of fractional shares having more than two decimal places, will be rounded upwards to the nearest amount with two decimal places;
8.in respect of each ordinary share and/or each fractional share held by the Company in its own share capital, the amount referred to under 5 and 6, respectively, shall be added to the Company's share premium reserve; and
9.no interest shall be due by the Company on the amount as mentioned under 5 and 6 for the period between the execution of this deed of amendment and the date(s) of repayment as referred to under 4.
A document in evidence of the resolutions, referred to in the head of this deed, is attached (in copy) to this deed.
The original copy of this deed was executed in Amsterdam, on the date mentioned at the top of this deed. I summarised and explained the substance of the deed. The individual appearing before me confirmed having taken note of the deed's contents and having agreed to a limited reading of the deed. I then read out those parts of the deed that the law requires. Immediately after this, the individual appearing before me, who is known to me, and I signed the deed at [●].
| ||||||||||||||
PROPOSED AMENDMENTS OF THE ARTICLES OF ASSOCIATION OF
QIAGEN N.V.
Synthetic Share Repurchase
This document contains an explanation to the proposed amendments of the articles of association of QIAGEN N.V. (the "Company"), in connection with the proposal for a synthetic share repurchase and to, if implemented, repay an amount to be determined by the managing board within the boundaries set forth in the Proxy Statement (as defined below) (the "Repayment Amount") to the holders of ordinary shares and/or fractional shares. A further explanation of the synthetic share repurchase is included in the proxy statement, which includes the agenda of the annual general meeting of the Company, to be held on June 23, 2022 (the "AGM"), and the explanatory notes to the agenda (the "Proxy Statement"). This Proxy Statement is available at the Company's office and on the Company's website (https://corporate.qiagen.com/agm2022).
The synthetic share repurchase, which in principle comprises three subsequent amendments to the Company's articles of association, can be summarized as follows:
1.the first amendment of the Company's articles of association ("Amendment Part I") provides for an increase of the nominal value of each ordinary share, the amount of which increase depends on the share consolidation ratio that the managing board will determine as further explained in the Proxy Statement;
2.the second amendment of the Company's articles of association ("Amendment Part II") provides for (i) a consolidation of the ordinary shares and the fractional shares, and (ii) (possibly) an additional increase of the nominal value needed for rounding purposes, which all depends on the share consolidation ratio that the managing board will determine as further explained in the Proxy Statement; and
3.the third amendment of the Company's articles of association ("Amendment Part III") provides for a decrease of the nominal value of each ordinary share to EUR 0.01 (the current nominal value of the ordinary shares) and the repayment of the Repayment Amount, all as further explained in the Proxy Statement.
This triptych provides the following information:
a.the first column of this document includes the articles of association of the Company as they read immediately prior to the execution of the relevant notarial deed of amendment of the articles of association: for Amendment Part I the relevant provisions of the current articles of association of the Company are included; for Amendment Part II the relevant provisions of the Company's articles of association as proposed under Amendment Part I are included; and for Amendment Part II the relevant provisions of the Company's articles of association as proposed under Amendment Part II are included;
b.the second column states the proposed amendments, to be implemented through the execution of a notarial deed of amendment of the Company's articles of association; and
c.the third column contains the explanatory notes to the proposed amendments.
The concluding statements, which are included at the end of each notarial deed of amendment (as published on the Company's website, in both Dutch and English) do not form part of the amendments to the Company's articles of association, but do form part of the relevant notarial deed.
This document contains unofficial translations of the Company's articles of association and the proposed amendments thereto. As a matter of Dutch law, the Dutch text will prevail. A Dutch version of this triptych, as well as Dutch versions of the drafts deeds of amendment of the articles of association can be found on the Company's website.
| ||||||||||||||
AMENDMENT PART I
| CURRENT ARTICLES | PROPOSED ARTICLES | EXPLANATORY NOTES | ||||||
| I. Proposed amendments to article 3.1 | ||||||||
| 3.1. The authorised capital of the company amounts to nine million euro (EUR 9,000,000), divided into four hundred and ten million (410,000,000) ordinary shares of one eurocent (EUR 0.01) each, forty million (40,000,000) financing preference shares of one eurocent (EUR 0.01) each and four hundred and fifty million (450,000,000) preference shares of one eurocent (EUR 0.01) each. | 3.1. The authorised capital of the company amounts to nine million euro (EUR 9,000,000) [●] euro [and [●] eurocent] (EUR [●]), divided into four hundred and ten million (410,000,000) ordinary shares of one eurocent (EUR 0.01) [●] euro[cent] (EUR [●]) each, forty million (40,000,000) financing preference shares of one eurocent (EUR 0.01) each and four hundred and fifty million (450,000,000) preference shares of one eurocent (EUR 0.01) each. | It is proposed to increase the nominal value of the ordinary shares, as a result of which the issued share capital and the authorised share capital will increase. The new nominal value will depend on the share consolidation ratio that the managing board will determine by using the formula as set out in the Proxy Statement. | ||||||
| II. Proposed amendments to article 8.1 | ||||||||
| 8.1. Shares shall be issued in registered form only and shall be numbered consecutively, the ordinary shares from 1 onwards, the preference shares from P1 onwards and the financing preference shares from F1 onwards. | 8.1. Shares shall be issued in registered form only and shall be numbered consecutively, the ordinary shares from 1 onwards, the preference shares from P1 onwards and the financing preference shares from F1 onwards. The managing board may decide to identify all or part of the shares in such a manner that it deems appropriate, or to change or cancel the identification of all or part of the shares. | It is proposed to amend article 8.1 of the articles of association to grant the managing board discretionary powers in respect of the identification of shares. This amendment provides flexibility for the managing board to decide on any identification of shares, as may be desired at any time. For example, identification or cancellation of the existing manner of identification may be required, respectively, desirable after the synthetic share repurchase, if implemented. | ||||||
| ||||||||||||||
| Concluding statements Amendment Part I | ||||||||
Finally the person appearing declares: 1.the nominal value of each issued ordinary share of one eurocent (EUR 0.01) is increased to [●] euro[cent] (EUR [●]) by and through the execution of this deed of amendment of the articles of association; | These concluding statements state that by and through the execution of the notarial deed implementing Amendment Part I, the nominal value per ordinary share will be increased. The obligation to pay up the issued ordinary shares, due to this increase, will be satisfied by crediting the Company's share premium reserve. | |||||||
2. the obligation to further pay up each issued ordinary share in the amount of [●] euro [and [●] eurocent] (EUR [●]) which has arisen as a result of the increase of the nominal value mentioned under 1, shall be satisfied by charging the share premium reserve of the Company; and | ||||||||
| 3. as a consequence of the execution of this deed of amendment of the articles of association, the issued and paid-up share capital of the Company amounts to [●] euro [and [●] eurocent] (EUR [●]), consisting of [●] ([●]) ordinary shares, [●] ([●]) fractional shares, [●] ([●]) financing preference shares and [●] ([●]) preference shares. | ||||||||
| ||||||||||||||
AMENDMENT PART II
| CURRENT ARTICLES | PROPOSED ARTICLES | EXPLANATORY NOTES | ||||||
| I. Proposed amendments to article 3.1 | ||||||||
| 3.1. The authorised capital of the company amounts to [●] euro [and [●] eurocent] (EUR [●]), divided into four hundred and ten million (410,000,000) ordinary shares of [●] euro[cent] (EUR [●]) each, forty million (40,000,000) financing preference shares of one eurocent (EUR 0.01) each and four hundred and fifty million (450,000,000) preference shares of one eurocent (EUR 0.01) each. | 3.1. The authorised capital of the company amounts to [●] euro [and [●] eurocent] (EUR [●]), divided into four hundred and ten million [●] (410,000,000 [●]) ordinary shares of [●] euro[cent] (EUR [●]) each, forty million (40,000,000) financing preference shares of one eurocent [●] euro [and [●] eurocent] (EUR 0.01 [●]) each and four hundred and fifty million [●] (450,000,000 [●]) preference shares of one eurocent [●] euro [and [●] eurocent] (EUR 0.01 [●]) each. | This clause will reflect the new nominal value of the ordinary shares, after the share consolidation. Pursuant to the share consolidation, the number of issued ordinary shares will decrease. This decrease could result in the issued share capital no longer representing at least one-fifth of the authorized share capital which is required under Dutch law. If that would be the case, the number of ordinary shares in the authorized share capital would be reduced to such number of shares as is necessary to meet the 1/5 threshold, rounded downwards to the nearest multiple of ten million, on the understanding that (i) the number of financing preference shares shall not be amended, (ii) the number of preference shares plus financing preference shares shall equal the number of ordinary shares and (iii) all shares shall have the same nominal value. | ||||||
| II. Proposed amendments to article 11.1 | ||||||||
11.1. Each ordinary share consists of twenty-seven (27) fractional shares. Each fractional share represents one/twenty-seventh (1/27e) portion of the value of an ordinary share | 11.1. Each ordinary share consists of twenty-seven (27) [●] ([●]) fractional shares. Each fractional share represents one/twenty-seventh (1/27e) [●] ([●]/[●]) portion of the value of an ordinary share. | The consolidation of ordinary shares may result in shareholders becoming entitled to fractions of ordinary shares. In order to prevent that due to the share consolidation, a shareholder will be entitled to such number of fractional shares that it cannot receive, because the entitlement is not a multiple of 1/27 of a share, it is proposed to amend this article 11.1. The number of fractional shares that together form one full ordinary share upon implementation of Amendment Part II can be found by multiplying the denominator of the share consolidation ratio with the current number of fractional shares comprising one ordinary share (i.e. 27). | ||||||
| ||||||||||||||
| III. Proposed amendments to article 11.5 up to and including 11.8 | ||||||||
| 11.5. A holder of one or more fractional shares may exercise the meeting and voting rights attaching to an ordinary share together with one or more other holders of one or more fractional shares to the extent the total number of fractional shares held by such holders of fractional shares equals twenty-seven (27) or a multiple thereof. These rights shall be exercised either by one of them who has been authorized to that effect by the others in writing, or by a proxy authorized to that effect by those holders of fractional shares in writing. | 11.5. A holder of one or more fractional shares may exercise the meeting and voting rights attaching to an ordinary share together with one or more other holders of one or more fractional shares to the extent the total number of fractional shares held by such holders of fractional shares equals twenty-seven (27) [●] ([●]) or a multiple thereof. These rights shall be exercised either by one of them who has been authorized to that effect by the others in writing, or by a proxy authorized to that effect by those holders of fractional shares in writing. | Please refer to the explanation to the amendment of article 11.1. | ||||||
| 11.6. Every holder of a fractional share is entitled to one/twenty-seventh (1/27e) part of the (interim) dividend and any other distribution to which the holder of one (1) ordinary share is entitled. | 11.6. Every holder of a fractional share is entitled to one/twenty-seventh (1/27e) [●]/[●] ([●]/[●]) part of the (interim) dividend and any other distribution to which the holder of one (1) ordinary share is entitled. | Please refer to the explanation to the amendment of article 11.1. | ||||||
| 11.7. In the event the holder of one or more fractional shares acquires such number of fractional shares that the total number of fractional shares held by him at least equals twenty-seven (27) then each time twenty-seven (27) fractional shares held by him shall by operation of law be consolidated into one (1) ordinary share; this shall be recorded in the shareholders’ register. | 11.7. In the event the holder of one or more fractional shares acquires such number of fractional shares that the total number of fractional shares held by him at least equals twenty-seven (27) [●] ([●]), then each time twenty-seven (27) [●] ([●]) fractional shares held by him shall by operation of law be consolidated into one (1) ordinary share; this shall be recorded in the shareholders’ register. | Please refer to the explanation to the amendment of article 11.1. | ||||||
| 11.8. One or more shares held by the company in its own share capital, can be divided into twenty-seven (27) fractional shares upon a resolution by the managing board. Fractional shares created in this way, will not be consolidated in accordance with article 11.7 as long as those fractional shares are held by the company, unless the managing board resolves to consolidate in accordance with article 11.7. | 11.8. One or more shares held by the company in its own share capital, can be divided into twenty-seven (27) [●] ([●]) fractional shares upon a resolution by the managing board. Fractional shares created in this way, will not be consolidated in accordance with article 11.7 as long as those fractional shares are held by the company, unless the managing board resolves to consolidate in accordance with article 11.7. | Please refer to the explanation to the amendment of article 11.1. | ||||||
| ||||||||||||||
| Concluding statements Amendment Part II | ||||||||
Finally the person appearing declares: 1.by and through execution of this deed of amendment of the articles of association, the ordinary shares with a nominal value of [●] euro [and [●] eurocent] (EUR [●]) each held by a shareholder immediately prior to such execution, are consolidated into such number of ordinary shares with a nominal value of [●] euro [and [●] eurocent] each, whereby (i) the number of ordinary shares held by a shareholder as a result of the consolidation shall be found by multiplying the total number of ordinary shares held by such shareholder immediately prior to the execution of this deed of amendment of the articles of association by [●]/[●] ([●]/[●]) (the "Consolidation Ratio"), and (ii) the numerator of a fraction resulting after such multiplication, which fraction shall have a denominator of [●] ([●]), shall indicate the number of fractional shares that such shareholder shall hold as of the moment of the execution of this deed of amendment of the articles of association as a result of the consolidation of ordinary shares, without taking into account the fractional shares that a shareholder may acquire due to the consolidation referred to under 2 and subject to fractional shares being consolidated into one (1) ordinary share in accordance with article 11.7, as it will read at the time of execution of this deed of amendment of the articles of association; | These concluding statements state that by and through execution of the notarial deed implementing Amendment Part II, the ordinary shares are consolidated and the nominal value per ordinary share will be increased. In respect of the fractional shares, please refer to the explanation to the amendment of article 11.1. The number of fractional shares that a shareholder will hold following the consolidation is equal to the number of fractional shares held by such holder immediately prior to the execution of the notarial deed implementing Amendment Part II, multiplied by the numerator of the share consolidation ratio (subject to fractional shares being acquired due to the consolidation and any consolidation of fractional shares in accordance with the Company's articles of association). | |||||||
| ||||||||||||||
| 2.by and through execution of this deed of amendment of the articles of association, and only if and insofar fractional shares are issued immediately prior to the execution of this deed of amendment of the articles of association, the fractional shares held by a shareholder immediately prior to such execution are consolidated, whereby the number of fractional shares that will be held by a shareholder as a result of the consolidation, without taking into account the fractional shares that a shareholder may acquire due to the consolidation referred to under 1 and subject to fractional shares being consolidated into one (1) ordinary share in accordance with article 11.7, as it will read at the time of execution of this deed of amendment of the articles of association, shall be found by multiplying the total number of fractional shares held by such shareholder immediately prior to the execution of this deed of amendment of the articles of association by the numerator of the Consolidation Ratio; | ||||||||
| 3. the obligation to further pay up the issued ordinary shares and/or the fractional shares, potentially resulting from the consolidations as mentioned under 1 and 2, shall be satisfied by charging the share premium reserve of the Company; and | ||||||||
| 4. as a consequence of the execution of this deed the issued and paid-up share capital of the Company amounts to [●] euro [and [●] eurocent] (EUR [●]), consisting of [●] ([●]) ordinary shares, [●] ([●]) fractional shares, [●] ([●]) financing preference shares and [●] ([●]) preference shares. | ||||||||
| ||||||||||||||
AMENDMENT PART III
| CURRENT ARTICLES | PROPOSED ARTICLES | EXPLANATORY NOTES | ||||||
| Proposed amendments to article 3.1 | ||||||||
| 3.1. The authorised capital of the company amounts to [●] euro [and [●] eurocent] (EUR [●]), divided into [●] ([●]) ordinary shares of [●] euro[cent] (EUR [●]) each, forty million (40,000,000) financing preference shares of [●] euro [and [●] eurocent] (EUR [●]) each and [●] ([●]) preference shares of [●] euro [and [●] eurocent] (EUR [●]) each. | 3.1. The authorised capital of the company amounts to [●] euro [and [●] eurocent] (EUR [●]), divided into [●] ([●]) ordinary shares of [●] euro[cent] (EUR [●]) one eurocent (EUR 0.01) each, forty million (40,000,000) financing preference shares of [●] euro [and [●] eurocent] (EUR [●]) one eurocent (EUR 0.01) each and [●] ([●]) preference shares of [●] euro [and [●] eurocent] (EUR [●]) one eurocent (EUR 0.01) each. | By means of this amendment, the nominal value of the ordinary shares will be decreased to EUR 0.01 and the total amount of the share capital and authorised share capital will be decreased. | ||||||
| Concluding statements Amendment Part III | ||||||||
Finally the person appearing declares: 1.the nominal value of each issued ordinary share of [●] euro [and [●] eurocent] (EUR [●]) is decreased to one eurocent (EUR 0.01) by and through the execution of this deed of amendment of the articles of association; | These concluding statements determine that (part of) the aggregate amount by which the nominal value of the ordinary shares will be decreased, will be repaid to holders of ordinary shares and/or fractional shares. The amount that will not be repaid to the shareholders, will be added to the share premium reserve of the Company. | |||||||
| 2. as a consequence of the execution of this deed of amendment of the articles of association, the issued and paid-up share capital of the Company amounts to [●] euro [and [●] eurocent] (EUR [●]), consisting of [●] ([●]) ordinary shares, [●] ([●]) fractional shares, [●] ([●]) financing preference shares and [●] ([●]) preference shares; | ||||||||
| 3. a part of the total amount by which the nominal value of the issued ordinary shares is decreased, less the amount required in connection with the rounding referred to under 7, being an amount of [●] euro [and [●] eurocent] (EUR [●]), shall be added to the Company's share premium reserve; | ||||||||
| ||||||||||||||
| 4. the remainder of the total amount by which the nominal value of the issued ordinary shares is decreased, being an amount of [●] euro [and [●] eurocent] (EUR [●]), shall be repaid at such points in time as determined by the managing board to those persons who on the [●] day of [●] at [●], after processing all settlements as of that time, are registered as holders of ordinary shares and/or fractional shares in a (sub)register designated by the managing board; | ||||||||
| 5. the amount in cash that will be repaid on each issued and outstanding ordinary share on the date(s) referred to under 4 is equal to [●] euro [and [●] eurocent] (EUR [●]); | ||||||||
| 6. the amount in cash that will be repaid on each issued and outstanding fractional share on the date(s) referred to under 4 is equal to [●]/[●] ([●]/[●]) part of the amount referred to under 5; | ||||||||
| 7. any aggregate amount to be repaid to a holder of fractional shares having more than two decimal places, will be rounded upwards to the nearest amount with two decimal places; | ||||||||
| 8. in respect of each ordinary share and/or each fractional share held by the Company in its own share capital, the amount referred to under 5 and 6, respectively, shall be added to the Company's share premium reserve; and | ||||||||
| 9. no interest shall be due by the Company on the amount as mentioned under 5 and 6 for the period between the execution of this deed of amendment and the date(s) of repayment as referred to under 4. | ||||||||
BENEFICIAL SHAREHOLDER ATTENDANCE FORM
TO: QIAGEN N.V.
c/o American Stock Transfer and Trust Company
Attention: Proxy Department
6201 15th Avenue
Brooklyn, New York 11219
QIAGEN N.V.
Annual General Meeting of Shareholders
June 23, 2022
The undersigned, beneficial holder of____ registered shares of QIAGEN N.V. (the "Company"), hereby notifies the Company that he/she/it wishes to attend and to exercise his/her/its shareholder rights at the Annual General Meeting of Shareholders of the Company to be held on Thursday, June 23, 2022 at 10:00 a.m., local time, at Maaspoort, Oude Markt 30, 5911 HH Venlo, The Netherlands, and requests that the Company add his/her/its name to the admission list for the Annual General Meeting.
The undersigned beneficial shareholder realizes that he/she/it can only exercise his/her/its shareholder rights for the shares beneficially held in his/her/its name as of the close of business (New York time) on Thursday, May 26, 2022, the record date for the Annual General Meeting.
In witness whereof the undersigned has duly executed this form/caused this form to be duly executed by its authorized officers at ___________________________this ____ day of ____________, 2022.
_______________________________________________________________
(Signature of beneficial shareholder)
_______________________________________________________________
(Signature of beneficial shareholder)
_______________________________________________________________
(Print full name of beneficial shareholder(s))
If the shares are held jointly, each beneficial holder must sign. Notification must be received no later than 5 p.m. (New York time) on Friday, June 17, 2022 at the offices of American Stock Transfer and Trust Company, Attention: Proxy Department, 6201 15`h Avenue, Brooklyn, New York 11219, United States of America.
REGISTERED SHAREHOLDER ATTENDANCE FORM
TO: QIAGEN N.V.
c/o American Stock Transfer and Trust Company
Attention: Proxy Department
6201 15th Avenue
Brooklyn, New York 11219
QIAGEN N.V.
Annual General Meeting of Shareholders
June 23, 2022
The undersigned, holder of registered shares of QIAGEN N.V. (the"Company"), hereby notifies the Company that he/she/it wishes to attend and to exercise his/her/its shareholder rights at the Annual General Meeting of Shareholders of the Company to be held on Thursday, June 23, 2022 at 10:00 a.m., local time, at Maaspoort, Oude Markt 30, 5911 HH Venlo, The Netherlands, and requests that the Company add his/her/its name to the admission list for the Annual General Meeting.
The undersigned registered shareholder realizes that he/she/it can only exercise his/her/its shareholder rights for the shares registered in his/her/its name as of the close of business (New York time) on Thursday, May 26, 2022, the record date for the Annual General Meeting.
In witness whereof the undersigned has duly executed this form/caused this form to be duly executed by its authorized officers at ___________________________this ____ day of ____________, 2022.
_______________________________________________________________
(Signature of registered shareholder)
_______________________________________________________________
(Signature of registered shareholder)
_______________________________________________________________
(Print full name of registered shareholder(s))
If the shares are held jointly, each registered holder must sign. Notification must be received no later than 5 p.m. (New York time) on Friday, June 17, 2022 at the offices of American Stock Transfer and Trust Company, Attention: Proxy Department, 6201 15th Avenue, Brooklyn, New York 11219, United States of America.
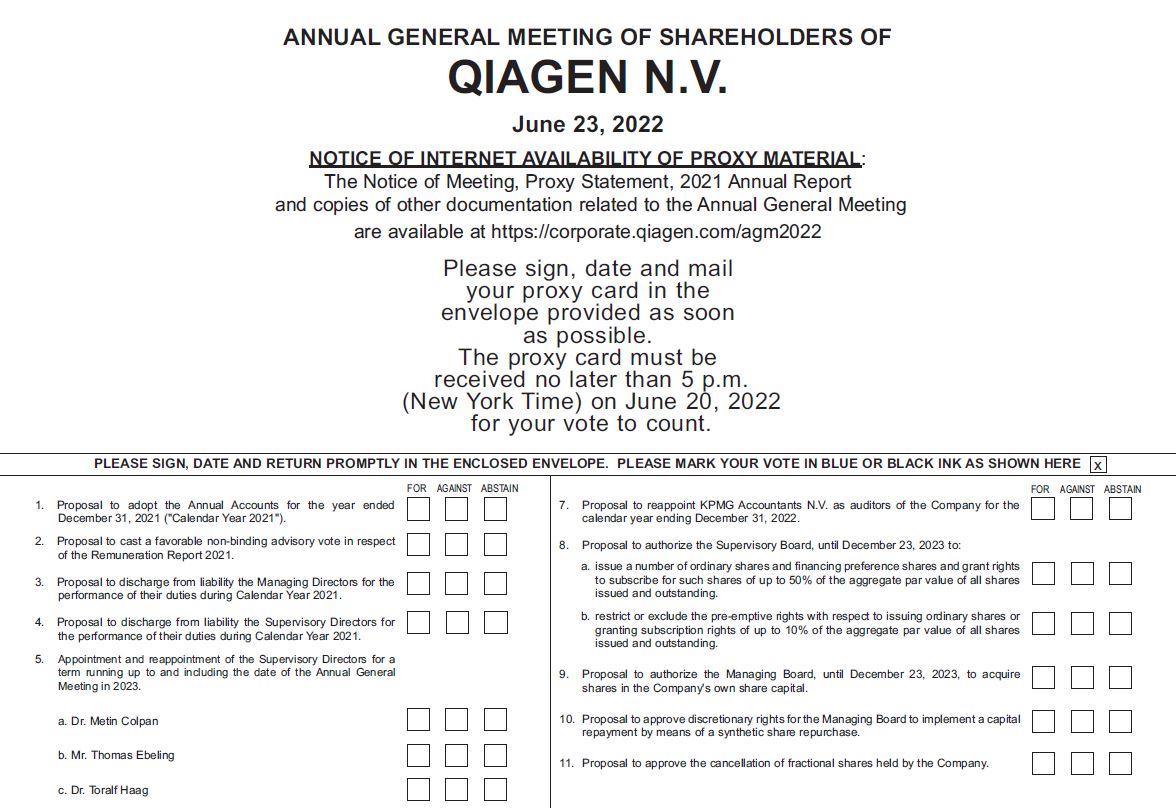
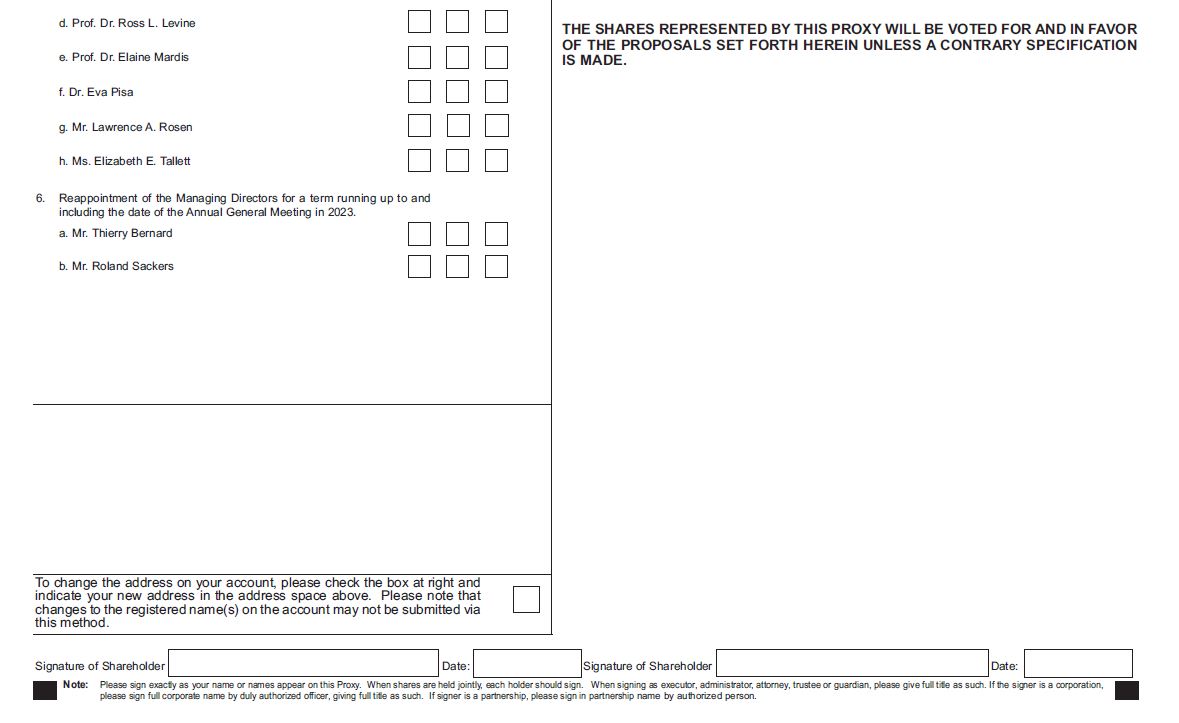
2022 Voting Results
Voting Results of the Annual General Meeting of Shareholders of QIAGEN N.V.
QIAGEN’s Annual General Meeting of Shareholders (the “Annual Meeting”) was held on June 23, 2022. The following actions were taken at the Annual Meeting:
1.Opening (no voting item)
2.Managing Board Report for the year ended December 31, 2021 ("Calendar Year 2021") (no voting item)
3.Supervisory Board Report on the Company's Annual Accounts (the "Annual Accounts") for Calendar Year 2021 (no voting item)
4.Proposal to adopt the Annual Accounts of QIAGEN N.V. (the "Company") for the Calendar Year 2021 was approved
| Votes for | Votes against | Votes abstain | ||||||||||||
| Number of shares | 169,810,095 | 308,517 | 327,167 | |||||||||||
| Percentage | 99.82% | 0.18% | — | |||||||||||
5.Proposal to cast a favorable non-binding advisory vote in respect of the Remuneration Report 2021
| Votes for | Votes against | Votes abstain | ||||||||||||
| Number of shares | 125,344,186 | 44,769,096 | 332,497 | |||||||||||
| Percentage | 73.68% | 26.32% | — | |||||||||||
6.Reservation and dividend policy (no voting item)
7.Proposal to discharge from liability the Managing Directors for the performance of their duties during Calendar Year 2021 was approved
| Votes for | Votes against | Votes abstain | ||||||||||||
| Number of shares | 163,956,416 | 5,820,944 | 668,419 | |||||||||||
| Percentage | 96.57% | 3.43% | — | |||||||||||
8.Proposal to discharge from liability the Supervisory Directors for the performance of their duties during Calendar Year 2021 was approved
| Votes for | Votes against | Votes abstain | ||||||||||||
| Number of shares | 163,954,040 | 5,823,683 | 668,056 | |||||||||||
| Percentage | 96.57% | 3.43% | — | |||||||||||
9a.Proposal to reappoint Dr. Metin Colpan as a Supervisory Director of the Company for a term running up to and including the Annual General Meeting in 2023 was approved
| Votes for | Votes against | Votes abstain | ||||||||||||
| Number of shares | 158,887,460 | 9,399,567 | 2,158,752 | |||||||||||
| Percentage | 94.41% | 5.59% | — | |||||||||||
9b.Proposal to reappoint Mr. Thomas Ebeling as a Supervisory Director of the Company for a term running up to and including the Annual General Meeting in 2023 was approved
| Votes for | Votes against | Votes abstain | ||||||||||||
| Number of shares | 166,556,399 | 3,840,456 | 48,924 | |||||||||||
| Percentage | 97.75% | 2.25% | — | |||||||||||
9c.Proposal to reappoint Dr. Toralf Haag as a Supervisory Director of the Company for a term running up to and including the Annual General Meeting in 2023 was approved
| Votes for | Votes against | Votes abstain | ||||||||||||
| Number of shares | 167,525,918 | 2,870,757 | 49,104 | |||||||||||
| Percentage | 98.32% | 1.68% | — | |||||||||||
9d.Proposal to reappoint Prof. Dr. Ross L. Levine as a Supervisory Director of the Company for a term running up to and including the Annual General Meeting in 2023 was approved
| Votes for | Votes against | Votes abstain | ||||||||||||
| Number of shares | 166,194,864 | 4,201,427 | 49,488 | |||||||||||
| Percentage | 97.53% | 2.47% | — | |||||||||||
9e.Proposal to reappoint Prof. Dr. Elaine Mardis as a Supervisory Director of the Company for a term running up to and including the Annual General Meeting in 2023 was approved
| Votes for | Votes against | Votes abstain | ||||||||||||
| Number of shares | 164,535,117 | 5,865,088 | 45,574 | |||||||||||
| Percentage | 96.56% | 3.44% | — | |||||||||||
9f.Proposal to appoint Dr. Eva Pisa as a Supervisory Director of the Company for a term running up to and including the Annual General Meeting in 2023 was approved
| Votes for | Votes against | Votes abstain | ||||||||||||
| Number of shares | 169,854,478 | 545,463 | 45,838 | |||||||||||
| Percentage | 99.68% | 0.32% | — | |||||||||||
9g.Proposal to reappoint Mr. Lawrence A. Rosen as a Supervisory Director of the Company for a term running up to and including the Annual General Meeting in 2023 was approved
| Votes for | Votes against | Votes abstain | ||||||||||||
| Number of shares | 159,162,379 | 11,237,588 | 45,812 | |||||||||||
| Percentage | 93.41% | 6.59% | — | |||||||||||
9h.Proposal to reappoint Ms. Elizabeth E. Tallett as a Supervisory Director of the Company for a term running up to and including the Annual General Meeting in 2023 was approved
| Votes for | Votes against | Votes abstain | ||||||||||||
| Number of shares | 143,851,438 | 24,439,099 | 2,155,242 | |||||||||||
| Percentage | 85.48% | 14.52% | — | |||||||||||
10a.Proposal to reappoint Mr. Thierry Bernard as a Managing Director of the Company for a term running up to and including the Annual General Meeting in 2023 was approved
| Votes for | Votes against | Votes abstain | ||||||||||||
| Number of shares | 166,649,723 | 3,749,937 | 46,119 | |||||||||||
| Percentage | 97.80% | 2.20% | — | |||||||||||
10b.Proposal to reappoint Mr. Roland Sackers as a Managing Director of the Company for a term running up to and including the Annual General Meeting in 2023 was approved
| Votes for | Votes against | Votes abstain | ||||||||||||
| Number of shares | 166,686,253 | 3,713,167 | 46,359 | |||||||||||
| Percentage | 97.82% | 2.18% | — | |||||||||||
11.Proposal to reappoint KPMG Accountants N.V. as auditors of the Company for the calendar year ending December 31, 2022 was approved
| Votes for | Votes against | Votes abstain | ||||||||||||
| Number of shares | 166,495,028 | 3,907,025 | 43,726 | |||||||||||
| Percentage | 97.71% | 2.29% | — | |||||||||||
12a.Proposal to authorize the Supervisory Board, until December 23, 2023 to issue a number of ordinary shares and financing preference shares and grant rights to subscribe for such shares, the aggregate par value of fifty percent (50%) of shares issued and outstanding in the capital of the Company as at December 31, 2021 as included in the Annual Accounts for Calendar Year 2021 was approved
| Votes for | Votes against | Votes abstain | ||||||||||||
| Number of shares | 150,160,706 | 20,234,198 | 50,875 | |||||||||||
| Percentage | 88.13% | 11.87% | — | |||||||||||
12b.Proposal to authorize the Supervisory Board, until December 23, 2023 to restrict or exclude the pre-emptive rights with respect to issuing ordinary shares or granting subscription rights, the aggregate par value of such shares or subscription rights shall be up to a maximum of ten percent (10%) of the aggregate par value of all shares issued and outstanding in the capital of the Company as at December 31, 2021 was approved
| Votes for | Votes against | Votes abstain | ||||||||||||
| Number of shares | 168,073,048 | 2,347,938 | 24,793 | |||||||||||
| Percentage | 98.62% | 1.38% | — | |||||||||||
13.Proposal to authorize the Managing Board, until December 23, 2023, to acquire shares in the Company's own share capital was approved
| Votes for | Votes against | Votes abstain | ||||||||||||
| Number of shares | 168,033,234 | 2,119,795 | 292,750 | |||||||||||
| Percentage | 98.75% | 1.25% | — | |||||||||||
14.Proposal to approve discretionary rights for the Managing Board to implement a capital repayment by means of a synthetic share repurchase was approved
a.Proposal to amend the Company's Articles of Association in accordance with the draft deed of amendment to the Company's Articles of Association (Part I) to, amongst other things, increase the par value per ordinary share in the share capital of the Company (each a “QIAGEN Share”) by an amount to be determined by the Managing Board of the Company;
b.Proposal to amend the Company's Articles of Association in accordance with the draft deed of amendment of the Company's Articles of Association (Part II) to, amongst other things, consolidate the QIAGEN Shares at a consolidation ratio to be determined by the Managing Board, subject to the approval of the Supervisory Board (the reverse stock split);
c.Proposal to amend the Company's Articles of Association in accordance with the draft deed of amendment of the Company's Articles of Association (Part III) to decrease the par value per QIAGEN Share to an amount of EUR 0.01 and to repay to the shareholders an amount to be determined by the Managing Board, subject to the approval of the Supervisory Board, which amount will at maximum be USD 300 million in the aggregate; and
d.Proposal to authorize each member of the Managing Board of the Company and each lawyer, (candidate) civil law notary and paralegal working at De Brauw Blackstone Westbroek N.V. to execute the three deeds of amendment of the Company's Articles of Association (Part I, II and III)
| Votes for | Votes against | Votes abstain | ||||||||||||
| Number of shares | 170,160,362 | 223,433 | 61,984 | |||||||||||
| Percentage | 99.87% | 0.13% | — | |||||||||||
15.Proposal to approve the cancellation of fractional shares held by the Company was approved
| Votes for | Votes against | Votes abstain | ||||||||||||
| Number of shares | 169,570,589 | 851,751 | 23,439 | |||||||||||
| Percentage | 99.50% | 0.50% | — | |||||||||||
16.Questions (no voting item)
17.Closing (no voting item)
QIAGEN N.V.
TABLE OF CONTENTS
| Annual Report 2021 | |||||
| Page | |||||
| Supervisory Board Report | |||||
| Management Report | |||||
| Corporate Governance Report | |||||
| Environmental, Social and Governance Report | |||||
| Remuneration Report | |||||
| Responsibility Statement of the Managing Board | |||||
| Consolidated Financial Statements QIAGEN N.V. and Subsidiaries | |||||
| Consolidated Balance Sheets | |||||
| Consolidated Income Statements | |||||
| Consolidated Statements of Comprehensive Income | |||||
| Consolidated Statements of Cash Flows | |||||
| Consolidated Statements of Changes in Equity | |||||
| Notes to the Consolidated Financial Statements | |||||
| Company Financial Statements of QIAGEN N.V. | |||||
| Company Balance Sheets | |||||
| Company Income Statements | |||||
| Company Statements of Changes in Equity | |||||
| Notes to the Company Financial Statements | |||||
| Other Information | |||||
Supervisory Board Report
Message from the Chair
Dear Stakeholders:
It is a pleasure to share with you this update on the progress of QIAGEN on behalf of our more than 6,000 employees, our Managing Board and my colleagues in the Supervisory Board.
Building on the events in 2020, the contributions of QIAGEN to society during 2021 has never been more critical as the response to the global pandemic took on new dimensions that were unpredictable at the start of the year.
The Supervisory Board continues to be impressed by how our QIAGENers are responding to the challenges facing us worldwide with a courageous, collaborative and caring spirit. They have again showed what a truly agile and robust company we have in terms of delivering a year with record results. Above all, they are moving forward toward achieving our vision of helping to make improvements in life possible.
We would also like to thank our shareholders, customers, business partners and other stakeholders for honoring QIAGEN with their continued collaboration and trust. Together we have delivered an outstanding performance in 2021 and look forward to executing on our strategy in 2022 and beyond.
2021: Another year of record results
During a year of volatile trends due the pandemic, QIAGEN delivered an outstanding performance in 2021. Net sales rose 20% to $2.25 billion, while profitability improved at a faster pace as adjusted earnings per share (EPS) were up 23% to $2.65. (Adjusted EPS excludes purchased intangibles amortization, long-lived asset impairments and other items such as business integration, acquisition-related costs, litigation costs and restructuring.)
It was indeed a year in which QIAGEN continued to show that it was very relevant for the global response to the pandemic, but not dependent on COVID-19 to grow and create value. The Supervisory Board was closely involved in monitoring the impact of the pandemic on QIAGEN, and supported the decision of the Managing Board to adjust the outlook for 2022 to focus on trends for the non-COVID portfolio and take a more cautious view on volatile COVID-19 testing trends. It is particularly important to recognize the 22% CER growth in our non-COVID product portfolio, which was above the target for 20% CER sales growth in 2021.
Executing on our strategy
QIAGEN is moving ahead to implement a strategy that involves “focus” and “balance” while targeting growth opportunities in an $11 billion market opportunity.
This strategy is anchored in our absolute leadership in Sample technologies, which are used to isolate and purify DNA and RNA – the building blocks of life – from any biological sample, and to develop leading positions in markets that can serve over 500,000 customers worldwide.
A key element of this strategy is to focus on five pillars of growth, which address markets with significant potential and ones in which QIAGEN can achieve / maintain a leading position. We are pleased to see the progress of QuantiFERON-TB as the gold standard for the detection of tuberculosis, as well as the uptake of our newer systems with QIAstat-Dx for syndromic testing, the integrated PCR testing platform NeuMoDx and our entry into digital PCR with QIAcuity.
This strategy also includes developing a business balanced on supporting customers across the continuum from molecular research in the Life Sciences to the use of Molecular Diagnostics in clinical healthcare.
We are also working to develop a balanced global footprint, building up our presence in fast-growing emerging markets as well as in more mature markets.
1
Another element of our strategy is developing the culture of QIAGEN through the EMPOWER initiative. We want to enhance and strengthen our culture to reach a greater level of accountability and agility with the organization, while also seeking to have decision-making closer to customers intertwined with a new level of accountability to make the best decisions in the interests of our customers and QIAGEN.
My colleagues and I in the Supervisory Board fully endorse this strategy and look forward to supporting and advising the Managing Board on implementation. Indeed, QIAGEN is moving forward from a position of strength with robust growth prospects, anchored by a differentiated portfolio and multiple new product launches in the pipeline. As we focus on even greater value creation, QIAGEN has a disciplined capital allocation policy anchored by a healthy balance sheet to support investment in our business along with a commitment to increasing returns to shareholders.
Changes in Supervisory Board composition
As noted in the Supervisory Board report for 2020, we successfully expanded our Supervisory Board with the appointment of two new members with international healthcare and general management experience in early 2021.
We greatly appreciate the contributions of our new colleagues – Thomas Ebeling and Dr. Toralf Haag – and welcome the expertise, international experience and collaborative spirit that they have each brought to QIAGEN. The positive impact has been seen in the effectiveness and level of discussions within the Supervisory Board, as well as the contributions they quickly made to supporting and advising the Managing Board.
These appointments underscore our commitment to creating a Supervisory Board with qualified, experienced and independent members. We have a holistic understanding of diversity that brings together age, gender, qualifications, international experience, cultural backgrounds, sector experience and tenure. These factors should reflect the structure and nature of QIAGEN in order to make better-informed decisions.
As an outcome of our discussions within the Board about the current composition, we initiated in early 2022 a search to find a new, additional Supervisory Board member, and the preference would be for a very experienced professional with a significant track record in our industry.
Developing deeper insights with our new Scientific Advisory Board
A company like QIAGEN thrives from dynamic developments in science and seeks to remain at the cutting edge in Life Sciences and Molecular Diagnostics. To ensure that QIAGEN can develop an even stronger position, and to take early advantage of emerging opportunities, the Managing Board and Supervisory Board created in 2021 a new Scientific Advisory Board (SAB), chaired by Prof. Dr. Ross Levine from our Supervisory Board.
The SAB has a mandate to provide early evaluation of market and technology developments that could have an influence on our development and positioning in highly attractive markets. We have welcomed a group of renown scientific leaders to the SAB, each providing unique expertise but joined together by a commitment to harnessing the power of breakthroughs to advance science and improve clinical outcomes for patients. The discussions in this group, and the insights they have provided to the Managing Board and Supervisory Board, have already proven their value to QIAGEN, and we look forward to greater contributions in the future.
Increasing our commitment to sustainability
QIAGEN is continually increasing its focus on ESG (environment, social and governance) topics. This is backed by our decision in 2021 to expand the scope of our Nomination Committee to also include ESG topics. These are increasingly discussed with management in our Supervisory Board meetings.
The key aspects of our environmental initiatives focus on addressing climate change, a topic that we recognize requires urgent global action. We announced in 2021 our commitment to reduce carbon emissions by setting science-based targets to reach net zero emissions by 2050. This includes achieving by 2030 an at least 40% reduction in Scope 1 and 2 emissions (direct emissions from QIAGEN), along with a 10% reduction in Scope 3 emissions (a broader definition that involves customers and other factors), on the way to achieving this target. QIAGEN has also recently launched the QIAwave portfolio of environmentally friendly products that reduce the use of plastics by up to 63% and cardboard by up to 42% compared to standard QIAGEN kits. Three types were launched in 2021 in this new portfolio, which will help support further reductions in transportation packaging on top of the 9% reduction in plastic transportation packaging in 2021.
2
In our focus on social responsibility, it is our duty to protect our employees – especially to keep them safe during the COVID-19 pandemic – as well as the health and safety of the communities in which we operate. Another key initiative in this area has been to steadily increase the share of women in management roles, and this stood at 34% of all managers at the end of 2021.
In the area of governance, we have well-established systems in place, and I want to again highlight the continuing excellent levels of collaboration and trust between the Managing Board and Supervisory Board members. In addition, we have significantly increased the level of awareness about compliance topics, as well as participation in compliance training.
Moving ahead in 2022 in a dynamic environment
We look forward to 2022 with confidence amid a dynamic and uncertain environment, including the political, economic and social turmoil created by the Russian invasion of Ukraine. This comes as the spread of COVID-19 continues at levels never imagined at the start of this pandemic two years ago.
Against this backdrop, the Supervisory Board believes QIAGEN has the right strategy to create value for all stakeholders by sharpening our focus on targeted growth opportunities in Life Sciences and Molecular Diagnostics. And we proudly recognize the great efforts made by our QIAGENers during these turbulent times.
The devastating impact of the war in Ukraine has again brought out the best in our employees worldwide through their donations, as well actions on the Ukraine border to support refugees from our organizations nearby in Poland, Romania and Austria. We are proud and pleased to see this level of engagement.
In closing, we view our performance in 2021 as one that we can all truly be proud of. We look forward to even more success in the new year, and the years to come, as we position QIAGEN to achieve our vision of making even more improvements in life possible.
Lawrence A. Rosen
Chair of the Supervisory Board
3
Supervisory Board composition
The composition of our Supervisory Board is diverse in gender, nationality, background, knowledge and experience. The Board is comprised of five men and two women. Three members are American, two are German, one is UK-American and one is German-Swiss. Many have spent considerable time during their careers living and working outside their home countries.
The Board’s current members are Lawrence A. Rosen (Chair), Dr. Metin Colpan, Thomas Ebeling, Dr. Toralf Haag, Prof. Dr. Ross L. Levine, Prof. Dr. Elaine Mardis and Elizabeth E. Tallett. Detailed biographical information can be found in the Corporate Governance Report included in this Annual Report.
Following best practice 2.1.10 of the Dutch Corporate Governance Code, the Supervisory Board establishes that its members are able to act critically and independently of one another on the Managing Board. To safeguard this, the Supervisory Board is composed in such a way that all its members are independent in the meaning of best practice 2.1.8 of the Dutch Corporate Governance Code. As a result, the Supervisory Board confirms being of the opinion that the independence requirements referred to in best practice 2.1.7 to 2.1.9 inclusive of the Dutch Corporate Governance Code have been fulfilled.
The targeted profile of the Supervisory Board is reflected in its regulations, which are published on our website under “Supervisory Board.” In terms of members who have a longer tenure, Dr. Metin Colpan joined the Supervisory Board in 2004 and Ms. Elizabeth Tallett has been a Supervisory Board member since 2011. We highly value the scientific and commercial experience of Dr. Colpan and his in-depth knowledge of QIAGEN and the broad industry knowledge, management and board experience of Ms. Tallett. QIAGEN therefore supports the reappointment of Dr. Colpan and Ms. Tallett beyond the eight-year term as recommended by the Dutch Code.
During 2021, the Board changed the scope and composition of its four committees to cover key areas in greater detail, especially Environment, Social and Governance (ESG) and Human Resources topics. The charters of the committees are published on our website under “Supervisory Board.”
The following table outlines the current members in 2021:
| Lawrence A. Rosen (Chair) | Dr. Metin Colpan | Thomas Ebeling | Dr. Toralf Haag | Prof. Dr. Ross Levine | Prof. Dr. Elaine Mardis | Elizabeth E. Tallett | ||||||||||||||||||||||||||||||||||||||||||||||||||||||||||||||||||||||||||||||||
| Age | 64 | 67 | 62 | 55 | 50 | 59 | 72 | |||||||||||||||||||||||||||||||||||||||||||||||||||||||||||||||||||||||||||||||
| Gender | Male | Male | Male | Male | Male | Female | Female | |||||||||||||||||||||||||||||||||||||||||||||||||||||||||||||||||||||||||||||||
| Nationality | U.S. | German | Swiss / German | German | U.S. | U.S. | U.S. / British | |||||||||||||||||||||||||||||||||||||||||||||||||||||||||||||||||||||||||||||||
| Date of appointment | 2013 | 2004 | 2021 | 2021 | 2016 | 2014 | 2011 | |||||||||||||||||||||||||||||||||||||||||||||||||||||||||||||||||||||||||||||||
4
The following table outlines the committee membership and meetings attended in 2021:
| Meeting Attendance | ||||||||||||||||||||||||||||||||
| Supervisory Board | Audit Committee | Compensation & Human Resources Committee | Nomination & ESG Committee | Science & Technology Committee | ||||||||||||||||||||||||||||
| Lawrence A. Rosen | 5/5 | 7/7 | 5/5 | 2/2 (Chair) | ||||||||||||||||||||||||||||
| Dr. Metin Colpan | 5/5 | 2/2 | 4/4 (Chair) | |||||||||||||||||||||||||||||
| Thomas Ebeling | 4/4 | 2/2 | ||||||||||||||||||||||||||||||
| Dr. Toralf Haag | 5/5 | 7/7 (Chair) | ||||||||||||||||||||||||||||||
| Dr. Ross L. Levine | 5/5 | 4/4 | ||||||||||||||||||||||||||||||
| Dr. Elaine Mardis | 5/5 | 5/5 | 4/4 | |||||||||||||||||||||||||||||
| Elizabeth E. Tallett | 5/5 | 6/7 | 5/5 (Chair) | 2/2 | ||||||||||||||||||||||||||||
The following table outlines the skills and experience of the current Supervisory Board members:
| Key competencies | Lawrence A. Rosen (Chair) | Dr. Metin Colpan | Thomas Ebeling | Dr. Toralf Haag | Prof. Dr. Ross Levine | Prof. Dr. Elaine Mardis | Elizabeth E. Tallett | |||||||||||||||||||||||||||||||||||||||||||||||||||||||||||||||||||||||||||||||
| Required | ||||||||||||||||||||||||||||||||||||||||||||||||||||||||||||||||||||||||||||||||||||||
| Integrity | • | • | • | • | • | • | • | |||||||||||||||||||||||||||||||||||||||||||||||||||||||||||||||||||||||||||||||
| Ethics | • | • | • | • | • | • | • | |||||||||||||||||||||||||||||||||||||||||||||||||||||||||||||||||||||||||||||||
| Health | • | • | • | • | • | • | • | |||||||||||||||||||||||||||||||||||||||||||||||||||||||||||||||||||||||||||||||
| English language skills | • | • | • | • | • | • | • | |||||||||||||||||||||||||||||||||||||||||||||||||||||||||||||||||||||||||||||||
| Experience | • | • | • | • | • | • | • | |||||||||||||||||||||||||||||||||||||||||||||||||||||||||||||||||||||||||||||||
| Recommended | ||||||||||||||||||||||||||||||||||||||||||||||||||||||||||||||||||||||||||||||||||||||
| U.S. background | • | • | • | • | ||||||||||||||||||||||||||||||||||||||||||||||||||||||||||||||||||||||||||||||||||
| Entrepreneur | • | • | • | • | ||||||||||||||||||||||||||||||||||||||||||||||||||||||||||||||||||||||||||||||||||
| Corporate management multinational | • | • | • | • | • | |||||||||||||||||||||||||||||||||||||||||||||||||||||||||||||||||||||||||||||||||
| Currently full-time employed / active | • | • | • | |||||||||||||||||||||||||||||||||||||||||||||||||||||||||||||||||||||||||||||||||||
| Public reputation | • | • | • | • | • | • | • | |||||||||||||||||||||||||||||||||||||||||||||||||||||||||||||||||||||||||||||||
| Independence | • | • | • | • | • | • | • | |||||||||||||||||||||||||||||||||||||||||||||||||||||||||||||||||||||||||||||||
| Academic research | • | • | • | |||||||||||||||||||||||||||||||||||||||||||||||||||||||||||||||||||||||||||||||||||
| Industrial research | • | |||||||||||||||||||||||||||||||||||||||||||||||||||||||||||||||||||||||||||||||||||||
| Diagnostics markets | • | • | • | |||||||||||||||||||||||||||||||||||||||||||||||||||||||||||||||||||||||||||||||||||
| Capital markets | • | • | • | • | • | |||||||||||||||||||||||||||||||||||||||||||||||||||||||||||||||||||||||||||||||||
| Financial management | • | • | • | |||||||||||||||||||||||||||||||||||||||||||||||||||||||||||||||||||||||||||||||||||
| M&A, business development | • | • | • | • | • | |||||||||||||||||||||||||||||||||||||||||||||||||||||||||||||||||||||||||||||||||
| Commercial operations | • | • | • | • | ||||||||||||||||||||||||||||||||||||||||||||||||||||||||||||||||||||||||||||||||||
| Public management (e.g. universities) | • | • | • | |||||||||||||||||||||||||||||||||||||||||||||||||||||||||||||||||||||||||||||||||||
| Regulatory / operations | • | • | • | • | ||||||||||||||||||||||||||||||||||||||||||||||||||||||||||||||||||||||||||||||||||
5
Relationship and stakeholder management
The Supervisory Board acts in accordance with the interests of the company and the business connected with it, taking into consideration the interests of our stakeholders. The Chair of the Supervisory Board is in regular close contact with the Managing Board members, and the same applies to the Chair of the Audit Committee.
The Supervisory Board recognizes that the pandemic has forced the implementation of new ways to interact, and welcomes how these new approaches have proved beneficial to ensuring a high level of engagement and interaction.
At the same time, the Supervisory Board looks forward to holding more in-person meetings in 2022 at QIAGEN sites around the world, as allowed by local regulations.
The Supervisory Board interacts with QIAGEN employees on various occasions and in various contexts, and this was done primarily on a virtual basis in 2021 due to the pandemic. They regularly receive information on relevant topics from senior leaders and experts, both internally and externally, during committee meetings, full Supervisory Board meetings, and also as part of their ongoing professional education.
Direct, one-to-one contact between Supervisory Board members and Managing Board and Executive Committee members generally builds on the topics discussed in the meetings of the Supervisory Board. These discussions draw on the expertise of individual Supervisory Board members, whose advice is sought on a wide range of topics. Supervisory Board members also have direct contact with other employees in the course of supporting business operations and in specifically arranged meetings.
In 2021, meetings were generally held virtually due to the pandemic, while any in-person meetings were done in line with local safety measures. These included in particular the onboarding for Mr. Ebeling and Dr. Haag as new members who joined the Supervisory Board in early 2021.
The Supervisory Board takes an active interest in maintaining an in-depth understanding of our stakeholders and their positions on various topics related to QIAGEN’s areas of business.
This includes the perceptions of our shareholders, which is received through direct interaction and calls with major institutional shareholders. The Supervisory Board is also informed of the position of the range of QIAGEN stakeholders by the Managing Board and other senior managers. In addition, the Supervisory Board members collect information through their own individual networks, and this is shared with other members and the Managing Board.
Corporate governance
The Supervisory Board follows the principle of increasing stakeholder value as the members represent the interests of all stakeholders, including shareholders, and has always pursued the highest standards in corporate governance.
QIAGEN is committed to a corporate governance structure that best suits its business and stakeholders, and that complies with relevant rules and regulations. QIAGEN follows the principles described in the Dutch Corporate Governance Code, although some minor deviations, which are explained in detail in our Corporate Governance Report, may result from the impact of factors such as legal requirements imposed on QIAGEN or industry standards.
Our common shares are registered and traded in the U.S. on the New York Stock Exchange (NYSE) and in Germany on the Frankfurt Stock Exchange in the Prime Standard segment. Shareholders in Europe and the U.S. hold the majority of common shares. As a result of these listings for its Global Shares, QIAGEN is subject to the rules regarding Corporate Governance set by the NYSE. QIAGEN believes all of its operations are carried out in accordance with legal frameworks, including Dutch Corporate Law, U.S. laws and regulations, EU regulations and applicable German capital market laws.
6
Role of the Supervisory Board
The Supervisory Board performs its duties of supervising and advising the Managing Board with respect both to recurring standard agenda items for Supervisory Board meetings and to specific topics that become relevant at any given point in time.
The most prominent regular agenda item is an update on business performance, financial results, treasury and investor relations topics. As part of this agenda item, the Supervisory Board tracks the company’s financial performance, approves the annual budget, is updated on capital markets perceptions and expectations, and deliberates on any additional topics as needed.
In light of the COVID-19 pandemic, significant time was spent on business continuity as well as progress on the implementation of QIAGEN’s strategy focused around delivering mid-term growth, in particular from the five pillars of growth. In 2021, the Supervisory Board also discussed and approved a $100 million share repurchase program that was completed during the year.
In line with its role, the Supervisory Board oversaw the strategy of QIAGEN by regularly reviewing with Management our progress toward strategic objectives, and by debating and endorsing important resource allocation decisions. These discussions also included regularly discussing M&A opportunities and relevant developments within our sectors. The Supervisory Board was actively informed about several potential M&A targets during the year, although none of these have yet to come to fruition. The Supervisory Board was additionally involved in reviewing the development of talent and succession planning within QIAGEN, and in particular monitoring and debating the succession planning initiatives for senior management roles.
Supervisory Board meetings
In 2021, the Supervisory Board held a total of five regular meetings, of which one was held in person at our headquarters in Venlo, the Netherlands, and four were held virtually due to the COVID-19 pandemic. These regular meetings included the participation of the Managing Board and Executive Committee members, as well as other QIAGEN managers.
The Supervisory Board also met to review and discuss agenda items in the absence of the Managing Board members, such as management performance and strategy as well as to discuss compensation matters.
All members of the Supervisory Board had adequate time available to devote themselves to their responsibilities.
Supervisory Board evaluation
The Supervisory Board conducted a detailed annual survey among its members to evaluate the functioning of the Supervisory Board, its individual members, its Committees, the Managing Board and the individual members of the Managing Board by means of an online survey. The evaluation process was prepared and monitored by the Nomination & ESG Committee, which also conducted an in-depth analysis of the results that were shared with the Supervisory Board and the Managing Board.
Overall, the Supervisory Board concluded that its activities and responsibilities were all being carried out properly and effectively, especially in view of the regulations set forth in the Dutch Corporate Governance Code, and should continue in the same manner.
The overall feedback from the evaluation in 2021 was again very positive. All topics (team composition, meetings, committees, people processes, agenda definition, etc.) received very high scores. Supervisory Board members appreciate the atmosphere within the Board, as well as the collaborative and constructive engagement with the Managing Board that is built on mutual trust and appreciation for their roles and responsibilities to QIAGEN. All members feel heard, valued and trusted, and appreciate the distinctive strengths of the individual members.
7
Financial statements and audits
In this Annual Report, the financial statements for 2021 are presented as prepared by the Managing Board and audited by KPMG Accountants N.V. (Independent Registered Public Accounting Firm). The Audit Committee examined the financial statements, the proposal for the use of the distributable profit, the consolidated financial statements and the Management report. The Supervisory Board also confirmed that the external auditor acted independently.
The results have been approved by the Supervisory Board and an unqualified opinion was received from the external auditors.
The Supervisory Board will submit the 2021 financial statements to the next Annual General Meeting of Shareholders, which is planned for June 2022. The proposal will recommend that shareholders adopt them and release the Managing Board from all liability in respect of its managerial activities and to release the Supervisory Board from all liability in respect of its Supervisory Board activities.
Venlo, the Netherlands
April 2022
The Supervisory Board
8
Management Report
Operations and Business Environment
Company overview
QIAGEN is a global leader in Sample to Insight solutions that transform biological samples into valuable molecular insights. Our mission is to enable customers across the continuum of molecular testing to unlock valuable insights faster, better and more efficiently - from the raw biological sample to the final interpreted result. Proven QIAGEN solutions and content are providing answers in hospitals and laboratories worldwide, helping make sense of the increasing volumes and complexity of biological information, in keeping with our vision of making improvements in life possible.
We began operations in 1986 as a pioneer in the emerging biotechnology sector, introducing a novel method that standardized and accelerated extraction and purification of nucleic acids from biological samples. As molecular biology and genomic knowledge have grown to influence many areas of life, we have expanded to serve the full spectrum of market needs. We believe our sample technologies are unmatched in quality for isolating and preparing DNA (deoxyribonucleic acid), RNA (ribonucleic acid) and proteins from blood or other liquids, tissue, plants or other materials. Our assay technologies amplify, enrich and make these biomolecules accessible for analysis, such as identifying the genetic information of a pathogen or a gene mutation in a tumor. Our industry-leading bioinformatics solutions allow users to analyze and interpret data with bioinformatics software and knowledge bases to provide relevant, actionable insights. Our automation systems can be used to tie these technologies together in seamless and cost-effective molecular testing workflows.
We have grown by developing new instruments, consumables and digital solutions to meet diverse and growing needs in the market, partnering with researchers and pharma companies, and acquiring companies or technologies to complement our portfolio. We believe the addressable global market for our portfolio of molecular testing products in life science research and molecular diagnostics totals more than $11 billion. We continue to accelerate the growth of our portfolio of Sample to Insight solutions, delivering efficiency and effectiveness, increasing the value of QIAGEN as an employer of choice and enhancing the customer experience. Our growth strategy is anchored in our Five Pillars of Growth: sample technologies, the digital PCR platform QIAcuity, the clinical PCR automation solutions QIAstat-Dx and NeuMoDx and the QuantiFERON technology platform used to detect diseases such as latent tuberculosis.
We have funded our growth through internally generated funds, debt offerings, and private and public sales of equity securities. QIAGEN’s global shares are listed on the New York Stock Exchange under the ticker symbol QGEN and on the Frankfurt Prime Standard as QIA.
The company is registered under its commercial and legal name QIAGEN N.V. with the trade register (kamer van koophandel) of the Dutch region Limburg Noord under file number 12036979. QIAGEN N.V. is a public limited liability company (naamloze vennootschap) under Dutch law as a holding company. Our principal executive office is located at Hulsterweg 82, 5912 PL Venlo, the Netherlands, and our telephone number is +31-77-355-6600.
As a holding company, QIAGEN conducts business through subsidiaries located throughout the world. Further information about QIAGEN can be found at www.qiagen.com. By referring to our website, we do not incorporate the website or any portion of the website by reference into this Annual Report.
Totals within tables presented in U.S. dollar millions may contain rounding differences.
Our Products
Our leadership in molecular testing solutions leverages our product portfolio across a wide range of applications. We provide more than 500 core consumable products (sample and assay kits), instruments and automation systems, and bioinformatics solutions for analysis and interpretation. These products comprise two main categories: consumables and related revenues accounted for between 86% and 89% of total net sales during the last three years and includes sample and assay kits, bioinformatics solutions, royalties, co-development milestone payments and services, while instruments includes related services and contracts and accounted for between 11% and 14% of total net sales during the same time period.
In 2021, we continued to expand our portfolios with solutions used in COVID-19 testing as well as non-COVID related applications.
9
For COVID-19, we have built a comprehensive portfolio of solutions to cover the phases of the pandemic including: a collection of RNA extraction kits and automation instrumentation from our sample technologies portfolio, PCR testing workflows including QIAstat-Dx, NeuMoDx, and other PCR solutions, Original Equipment Manufacturer (OEM) components used by other diagnostic suppliers, antigen and antibody tests, and genomic solutions. New products in 2021 were focused on expanding our solutions for surveillance and providing products for rapid high-throughput PCR testing:
•artus® SARS-CoV-2 Prep&Amp UM Kit - solution for large-scale COVID-19 testing with CE-IVD registration
•QIAstat-Dx Respiratory 4 Plex Flu A-B/RSV/SARS-CoV-2 test - launched as CE-IVD test to identify whether patients have influenza A or B, respiratory syncytial virus (RSV) or SARS-CoV-2
•NeuMoDx™ Flu A-B/RSV/SARS-CoV-2 Vantage Test - launched as FDA approved test to identify whether patients have influenza A or B, respiratory syncytial virus (RSV) or SARS-CoV-2
•QuantiFERON SARS-CoV-2 assay - received CE-marking as an aid to assessment of immunity in vaccinated individuals
•QIAcuity digital PCR wastewater testing workflow - completed US government contract for use in wastewater testing
•PreAnalytix PAXgene Saliva Collector - new method of sample collection for SARS-CoV-2 research. Additional applications are being developed for the sample collection kit, including DNA
•QIAseq DIRECT SARS-CoV-2 Kit - Ultra-Fast sequencing solution for high-throughput genomic surveillance
In our non-COVID product groups, we continued to build menus and release new products to expand our capabilities and prepare our platforms to capture growth in a post-pandemic market.
Consumables launches:
•QIAwave product line - environmentally friendly sample preparation consumables kits
•QIAstat-Dx panels for the diagnosis of more than 20 various conditions through one syndromic test
–Meningitis / Encephalitis - received CE-IVD registration
–Gastrointestinal - submitted for US regulatory clearance
•QIAreach QuantiFERON-TB test - designed for use for the detection of TB in low-resource, high-burden countries (Approved by the Global Fund's Expert Review Panel Diagnostics (ERPD))
•QuantiFERON LIAISON® LymeDetect® assay - test for the early diagnosis of Lyme Borreliosis, a bacterial disease that can cause long-term and debilitating health issue, co-developed and commercialized with DiaSorin
Instrument launches:
•EZ2 Connect - next generation of the EZ1 sample processing instrument for applications including biomedical research, forensics and clinical diagnostics
•QIAcube Connect MDx - sample processing instrument cleared for use in US, EU and other worldwide markets
•QIAsphere - cloud-based solution to enable remote digital monitoring of instrumentation platforms, initially for QIAstat-Dx
10
QIAGEN Product Groups
Sample Technologies
Sample technologies is the first of our Five Pillars of Growth and includes products involved in the first step of any molecular lab process.
Our broad portfolio of sample technologies includes consumables and instruments used in sample collection, stabilization, storage, purification and quality control. Some of our consumables are designed to run on our instruments, while others are universal kits designed for use with any molecular testing platform. These products are used in research and applied testing (forensics, human identification and food safety) laboratories as well as clinical testing.
| Sample technologies | Selected QIAGEN brands | ||||||||||
| Primary sample technology consumables | |||||||||||
•Nucleic stabilization and purification kits designed for primary sample materials (DNA, RNA), manual and automated processing for genotyping, gene expression, viral and bacterial analysis •Mainly based on silica membrane and magnetic bead technologies | •QIAamp •PAXgene •AllPrep | •DNeasy •AdnaTest •QIAprep& | •RNeasy •MagAttract | ||||||||
| Secondary sample technology consumables | |||||||||||
•Kits and components for purification of nucleic acids from secondary sample materials (e.g. gel, plasmid DNA) | •QIAprep •QIAGEN Plasmid •HiSpeed | •QIAquick •QIAfilter •EndoFree | •DyeEx •R.E.A.L. | ||||||||
| Sample technology instruments | |||||||||||
•Instruments for nucleic acid purification, quality control and accessories | •QIAsymphony •EZ1 •TissueLyser | •QIAcube Connect •QIAxpert | •QIAcube HT •QIAxcel | ||||||||
11
Diagnostic Solutions
Diagnostic solutions include our molecular testing platforms and consumables covering three of our five pillars of growth, which are QuantiFERON, QIAstat-Dx and NeuMoDx, as well as Precision Medicine which involves companion diagnostic co-development revenues from projects with pharmaceutical companies, regulated assays and solutions for laboratory developed tests. Additional areas include Oncology and Sexual & Reproductive Health for detection of various diseases and for use in prenatal testing for detection of infectious diseases and for other laboratory processes.
| Diagnostic solutions | Selected QIAGEN brands | ||||||||||
| Immune response consumables | |||||||||||
•Interferon-Gamma Release Assay (IGRA) for TB testing •Assays for post-transplant testing and viral load monitoring | •QuantiFERON | •QIAreach | |||||||||
| Oncology and Sexual & Reproductive health consumables | |||||||||||
•Assays for analysis of genomic variants such as mutations, insertions, deletions and fusions •Assays for prenatal testing and detection of sexually transmitted diseases and HPV | •Therascreen •AmniSure / PartoSure | •Ipsogen | •digene HC2 | ||||||||
| Sample to Insight instruments | |||||||||||
•One-step molecular analysis of hard-to-diagnose syndromes •Fully integrated PCR testing | •QIAstat-Dx | •NeuMoDx | |||||||||
PCR / Nucleic Acid Amplification
PCR / Nucleic Acid Amplification involves our research and applied PCR solutions and components. The product group includes another of our five pillars of growth: QIAcuity. We offer optimized solutions for end-point PCR, quantitative PCR and digital PCR. Our kits, assays, instruments and accessories amplify and detect targets and streamline workflow for virtually any application.
| PCR/Nucleic acid amplification | Selected QIAGEN brands | ||||||||||
| Research PCR consumables | |||||||||||
•Different generations of PCR, quantitative PCR, reverse transcription and combinations (RT-PCR) kits for analysis of gene expression, genotyping and gene regulation, running on QIAGEN or third-party instruments and technologies | •QuantiTect •OneStep RT-PCR •Type-it •OmniScript | •QuantiFast •QIAGEN Multiplex •miRCURY •miScript | •QuantiNova •HotStarTaq •TopTaq | ||||||||
| Human ID / Forensics assay consumables | |||||||||||
•STR assays for Human ID, additional assays for food contamination | •Investigator (human ID / forensics) | •mericon (food safety) | |||||||||
| PCR instruments | |||||||||||
•Digital PCR solutions | •QIAcuity •Rotor-Gene Q | •QIAquant •QIAgility | •QIAamplifier 96 | ||||||||
| OEM consumables | |||||||||||
•Custom-developed and configured enzymes and PCR solutions that are sold to OEM customers | •Provided on an individualized contract basis | ||||||||||
12
Genomics / NGS
This product group includes our universal NGS (next-generation sequencing) solutions for use with any NGS sequencer as well as the full bioinformatics portfolio offered by QIAGEN Digital Insights.
| Genomics / NGS | Selected QIAGEN brands | ||||||||||
| Universal NGS consumables | |||||||||||
•Predefined and custom NGS gene panels (DNA, RNA), library prep kits and components, whole genome amplification, etc. | •QIAseq | •REPLI-g Epitect | |||||||||
| QIAGEN Digital Insights solutions | |||||||||||
•Bioinformatics solutions analyze and interpret data to deliver actionable insights from NGS. This includes freestanding software or cloud-based solutions and is also integrated into many QIAGEN consumables and instruments | •QIAGEN Clinical Insight •N-of-One •Ingenuity Variant Analysis | •CLC Genomics Workbench •OmicSoft •Ingenuity Pathway Analysis | •QIAGEN Knowledge Base •HGMD | ||||||||
| Custom laboratory and genomic services | |||||||||||
•Custom services such as DNA sequencing, whole genome amplification, and non-cGMP DNA production | •Provided on an individualized contract basis | ||||||||||
Other
Revenues from various sources including protein biology products, royalties, intellectual property and freight charges.
Principal Markets
We sell our products to more than 500,000 customers in two broad customer groups: Molecular Diagnostics (clinical testing) and Life Sciences (academia, pharmaceutical R&D and applied testing). We estimate the total addressable market has a volume of about $11 billion per year. The five pillars of growth – sample technologies, immune response, digital PCR, integrated PCR, syndromic testing – account for $6 billion of this total.
Molecular Diagnostics
The molecular diagnostics market includes healthcare providers engaged in many aspects of patient care that require accurate diagnoses and insights to guide treatment decisions in oncology, infectious diseases and immune monitoring.
We offer one of the broadest portfolios of molecular technologies for healthcare. The success of molecular testing in healthcare depends on the ability to accurately analyze purified nucleic acid samples from sources such as blood, tissue, body fluids and stool. Automated systems process tests reliably and efficiently, often handling hundreds of samples simultaneously. Our range of assays for diseases and biomarkers speed up and simplify laboratory workflow and standardize many lab procedures.
Molecular testing is the most dynamic segment of the global in vitro diagnostics market. The pandemic has demonstrated the value of molecular testing in healthcare and we expect the market to provide significant growth opportunities.
We have built a position as a preferred partner to co-develop companion diagnostics paired with targeted drugs and have created a rich pipeline of molecular tests that are transforming the treatment of cancer and other diseases. We have more than 25 master collaboration agreements with pharmaceutical industry customers, some with multiple co-development projects. In 2021 we continued to expand on these partnerships with new agreements to develop NGS based assays. These include partnerships with Inovio for development of an assay for advanced cervical dysplasia, with OncXerna Therapeutics for their ovarian cancer therapeutic and with Sysmex Corporation for liquid biopsy oncology solutions. In addition we signed an agreement with Mirati for a PCR-based assay for Non-Small Cell Lung Cancer. Companion diagnostics move through clinical trials and regulatory approvals, along with the paired drugs, to commercialization and marketing to healthcare providers.
Molecular Diagnostics customers accounted for $1.1 billion, $904 million, and $737 million of our sales in 2021, 2020 and 2019, respectively.
13
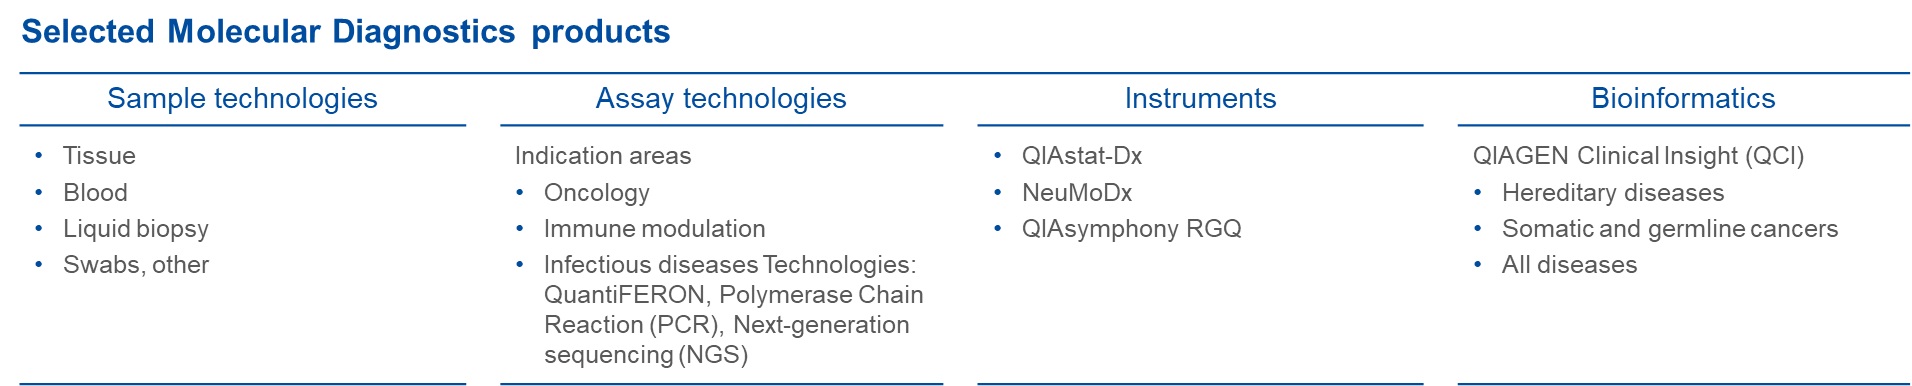
Life Sciences
The Life Sciences market includes governments and biotechnology companies – and researchers who use molecular testing and technologies and are generally served by public funding in areas such as medicine and clinical development, forensics and exploring the building blocks of life.
We partner with customers across diverse disciplines in academia and industry, providing sample technologies, assay technologies, bioinformatics and services to universities and institutes, pharmaceutical and biotech companies, government and law enforcement agencies.
We provide Sample to Insight solutions to academic and research institutions around the world. We focus on enabling researchers to use reliable, fast, highly reproducible and high-quality technologies, sometimes replacing time-consuming traditional or in-house methods. We often partner with leading institutions on research projects and develop customized solutions such as NGS panels for the digital sequencing of multiple gene targets.
In the course of the COVID-19 pandemic, we served increased demand from viral and vaccine researchers for RNA extraction, general PCR reagents and enzymes, and universal NGS solutions.
We are a global leader in solutions for governments and industry, particularly in forensic testing and human identification. The value of genetic "fingerprinting" has been proven in criminal investigations and examinations of paternity or ancestry, as well as in food safety and veterinary diagnostics. We provide sample collection and analytical solutions for law enforcement and human identification labs, as well as advanced technologies for studies of microbiomes and their effect on health and the environment.
We have deep relationships with pharmaceutical and biotechnology companies. Drug discovery and translational research efforts increasingly employ genomic information, both to guide research in diseases and to differentiate patient populations that are most likely to respond to particular therapies. We estimate that about half of our sales to these companies supports research, while the other half supports clinical development, including stratification of patient populations based on genetic information. Also, QIAGEN Digital Insights solutions are widely used to guide pharmaceutical research.
Life Sciences customers accounted for $1.1 billion, $966 million, and $789 million of our sales in 2021, 2020 and 2019, respectively.
14
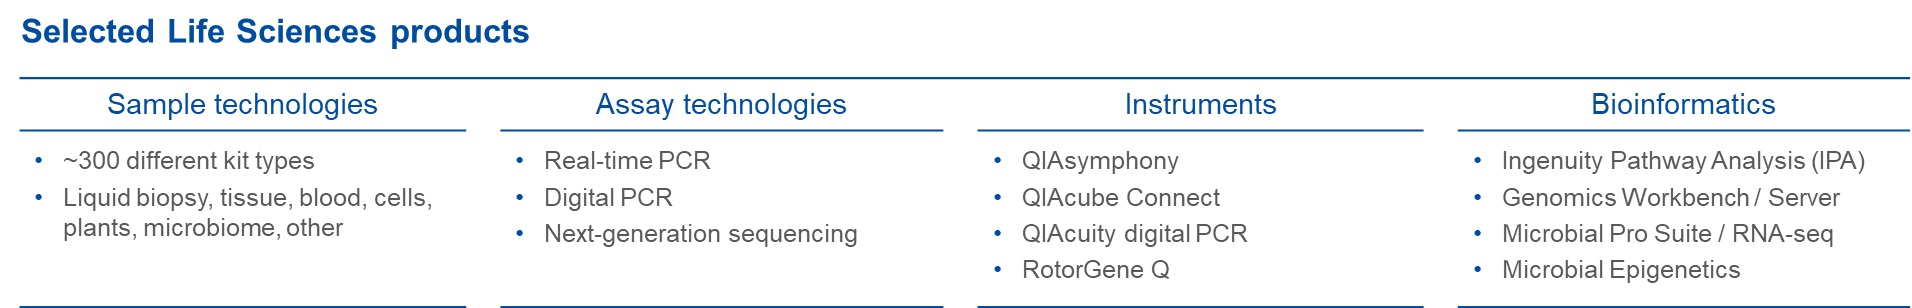
Competition
In sample technology products, we also experience competition in various markets from other companies providing sample preparation products in kit form and assay solutions. These competitors include, but are not limited to, companies with a focus on nucleic acid separation and purification, assay solutions, transfection reagents and protein fractionation products. We compete with other suppliers through innovative technologies and products, offering a comprehensive solution for nucleic acid collection, pre-treatment, separation and purification needs and providing significant advantages in speed, reliability, convenience, reproducibility and ease of use.
Some of our other products within our molecular diagnostics customer class, such as tests for chlamydia, gonorrhea, hepatitis B virus, herpes simplex virus and CMV, compete against existing screening, monitoring and diagnostic technologies, including tissue culture and antigen-based diagnostic methodologies. We believe the primary competitive factors in the market for gene-based probe diagnostics and other screening devices are clinical validation, performance and reliability, ease of use, standardization, cost, proprietary position, competitors' market shares, access to distribution channels, regulatory approvals and reimbursement.
We believe our competitors typically do not have the same comprehensive approach to sample to insight solutions as we do, nor do they have the ability to provide the broad range of technologies and depth of products and services that we offer. With our complete range of manual and fully automated solutions, we believe we offer the value of standardization of procedures and, therefore, more reliable results. We also believe our integrated strategic approach gives us a competitive advantage. The quality of sample technologies - an area in which we have a unique market and leadership position - is a key prerequisite for reliable molecular assay solutions, which increasingly are being applied in emerging markets such as Molecular Diagnostics and Applied Testing.
Current and potential competitors may be in the process of seeking FDA or foreign regulatory approvals for their respective products. Our continued future success will depend in large part on our ability to maintain our technological advantage over competing products, expand our market presence and preserve customer loyalty. There can be no assurance that we will be able to compete effectively in the future or that development by others will not render our technologies or products non-competitive.
Global Presence by Category of Activity and Geographic Market
Product Category Information
Net sales for the product categories are attributed based on those revenues related to sample and assay products and related revenues including bioinformatics solutions, and revenues derived from instrumentation sales.
| Net Sales (in millions) | 2021 | 2020 | 2019 | |||||||||||||||||
| Consumables and related revenues | $1,986.3 | $1,615.4 | $1,354.1 | |||||||||||||||||
| Instrumentation | 265.3 | 254.9 | 172.3 | |||||||||||||||||
| Total | $2,251.7 | $1,870.3 | $1,526.4 | |||||||||||||||||
15
Geographical Information
QIAGEN currently markets products in more than 130 countries. The following table shows total revenue by geographic market for the past three years (net sales are attributed to countries based on the location of the customer, as certain subsidiaries have international distribution):
| Net Sales (in millions) | 2021 | 2020 | 2019 | |||||||||||||||||
| United States | $909.7 | $728.6 | $663.9 | |||||||||||||||||
| Other Americas | 97.7 | 96.9 | 58.1 | |||||||||||||||||
| Total Americas | 1,007.4 | 825.5 | 722.0 | |||||||||||||||||
| Europe, Middle East and Africa | 814.4 | 682.3 | 487.5 | |||||||||||||||||
| Asia Pacific, Japan and Rest of World | 429.9 | 362.6 | 317.0 | |||||||||||||||||
| Total | $2,251.7 | $1,870.3 | $1,526.4 | |||||||||||||||||
We have built an increasing presence in key markets as a growth strategy. In 2021, the top seven growth markets - Brazil, Russia, India, China, South Korea, Mexico and Turkey contributed approximately 14% of net sales.
Seasonality
Our business does not experience significant predictable seasonality. Historically, a significant portion of our sales has been to researchers, universities, government laboratories and private foundations whose funding is dependent upon grants from government agencies, such as the National Institutes of Health and similar bodies. To the extent that our customers experience increases, decreases or delays in funding arrangements and budget approvals, and to the extent that customers' activities are slowed, such as during times of higher unemployment, vacation periods or delays in approval of government budgets, we may experience fluctuations in sales volumes during the year or delays from one period to the next in the recognition of sales. Additionally, we have customers who are active in the diagnostics testing market, and sales to these customers fluctuate to the extent that their activities are impacted by public health concerns such as the timing and severity of viral infections such as the influenza or SARS-CoV-2 viruses.
Suppliers
We strive to ensure that our quality standards, compliance with laws and regulations as well as environmental and social standards are maintained along the entire value chain of suppliers and partners. We demand the same from our business partners. Suppliers are subjected to a risk analysis with regard to environmental and social criteria based on their geographic location. Our procurement policy, which is available on our website, contains requirements with regard to legal compliance, bribery and corruption, labor rights, non-discrimination and fair treatment, health and safety as well as environmental protection and conservation. In 2021, all new suppliers have signed our procurement policy. In addition, first-tier suppliers must confirm REACH, RoHS and conflict minerals compliance as appropriate. As part of our supplier assessment procedures, we evaluate on a monthly basis the supply performance of our raw material and component suppliers, and we assess on a continuous basis potential alternative sources of such materials and components, and on a yearly basis the risks and benefits of reliance on our existing suppliers.
We buy materials for our products from many suppliers, and are not dependent on any one supplier or group of suppliers for our business as a whole. Raw materials generally include chemicals, raw separation media, biologics, plastics, electronics and packaging. Raw materials are generally readily available at competitive, stable prices from a number of suppliers. Certain raw materials are produced under our specifications. We have inventory agreements with the majority of our suppliers and we closely monitor stock levels to maintain adequate supplies. In 2021, we have been able to secure a stable supply of chemicals, bioreagents, plastics and packaging materials with only moderate price adjustments. However in electronics, we have seen shortages that needed to be mitigated with long term contacts and high volume agreements, which at times included price increases. These increases are considered in the pricing of our products. We strive to maintain inventories at a sufficient level to ensure reasonable customer service levels, to guard against normal volatility in availability and we continue to work to circumvent shortages and keep pricing competitive.
16
Research and Development
We are committed to expanding our global leadership in Sample to Insight solutions in Molecular Diagnostics and the Life Sciences. We target our research and development resources at the most promising technologies to address the unmet needs of our customers in healthcare and research labs in key geographic markets.
As a percentage of sales, our research and development investments are among the highest in our industry. 992 employees in research and development work in QIAGEN centers of excellence on three continents.
Innovation at QIAGEN follows parallel paths:
•Creating new systems for automation of workflows - platforms for laboratories, hospitals and other users of novel molecular technologies.
•Expanding our broad portfolio of novel content - including assays to detect and measure biomarkers for disease or genetic identification.
•Integrating QIAGEN Digital Insights with the testing process - software and cloud-based resources to interpret and transform raw molecular data into useful insights.
Innovation in automation systems positions us in fast-growing fields of molecular testing, and generates ongoing demand for our consumable products. We are developing and commercializing a deep pipeline of assays for preventive screening and diagnostic profiling of diseases, detection of biomarkers to guide Precision Medicine in cancer and other diseases, and other molecular targets. Our assay development program aims to commercialize tests that will add value to our QIAsymphony, QIAstat-Dx and NeuMoDx automation systems in the coming years, as well as next-generation sequencing (NGS) kits to support our universal NGS franchise and our in vitro diagnostics partnership with Illumina. We continue to develop applications for the QIAcuity digital PCR system which is designed to make digital PCR technology available to Life Sciences laboratories worldwide.
We collaborate with many institutions and companies to create innovative molecular solutions. In 2021, we joined collaborations to facilitate rapid advancements in building a broader application base for QIAcuity including a partnership with GT Molecular to provide a SARS-CoV-2 wastewater testing workflow, with Atila BioSystems to advance digital PCR in non-invasive prenatal testing, and with Actome to develop protein analysis solutions.
Our QIAGEN Digital Insights teams are developing new software and adding proprietary cloud-based content to support the latest research and clinical trends in molecular testing, especially the interpretation of large volumes of NGS data. We also integrate digital solutions with instruments and molecular content to provide our customers seamless Sample to Insight workflows.
Sales and Marketing
We market our products in more than 130 countries, mainly through subsidiaries in markets in the Americas, Europe, Australia and Asia with the greatest sales potential. Experienced marketing and sales staff, many of them scientists with academic degrees in molecular biology or related areas, sell our products and support our customers. Business managers oversee key accounts to ensure that we serve customers’ commercial needs, such as procurement processes, financing, data on costs and the value of our systems, and collaborative relationships. In many markets, we have specialized independent distributors and importers.
Our marketing strategy focuses on providing differentiated, high-quality products across the value chain from Sample to Insight, integrating components into end-to-end solutions when possible, and enhancing relationships with commitment to technical excellence and customer service. Our omni-channel approach seeks to engage customers through their preferred channels - online, by phone, in person, etc. - and to optimize investment in different customer types.
We continue to drive the growth of our digital marketing channels - including our website (www.qiagen.com), product-specific sites and social media. Since the onset of the pandemic there has been an increase in virtual events and use of digital sales channels. We have likewise increased the activities in digital marketing to adapt to these market changes, such as installing an in-house studio to facilitate creation of video content and live virtual events.
17
Our eCommerce team works with clients to provide automated processes supporting a variety of electronic transactions and all major eProcurement systems. Information contained on our website, or accessed through it, is not part of this Annual Report.
My QIAGEN is an easy-to-use self-service portal that is personalized to our customers' needs and enables customers to manage different activities in one central place. Customers can now easily reorder, place bulk orders, apply quotes to their cart, and then track their order status. Functionality in the dashboard allows customers to monitor their instrument use and view the status of licenses and service agreements. Additionally, customers can access our exclusive content and services, such as webinars, handbooks and other documents.
Our GeneGlobe Design & Analysis Hub (www.geneglobe.com) is a valuable outreach to scientists in pharma and academia, enabling researchers to search and order from approximately 25 million pre-designed and custom PCR assay kits, NGS assay panels and other products. The new hub brings next-level experiment planning, execution and follow-up to life science researchers, linking our QIAGEN Digital Insights solutions with ordering of assays to accelerate research.
We use a range of tools to provide customers with direct access to technical support, inform them of new product offerings, and enhance our reputation for technical excellence, high-quality products and commitment to service. For example, our technical service hotline allows existing or potential customers to discuss a wide range of questions about our products and molecular biology procedures, online or via phone, with Ph.D. and M.Sc. scientists at QIAGEN. Frequent communication with customers enables us to identify market needs, learn of new developments and opportunities, and respond with new products.
We also distribute publications, including our catalog, to existing and potential customers worldwide, providing new product information, updates, and articles about existing and new applications. In addition, we hold numerous scientific seminars at clinical, academic and industrial research institutes worldwide and at major scientific and clinical meetings. We conduct direct marketing campaigns to announce new products and special promotions, and we offer personalized electronic newsletters and webinars highlighting molecular biology applications.
For laboratories that frequently rely on our consumables, the QIAstock program maintains inventory on-site to keep up with their requirements. QIAGEN representatives make regular visits to replenish the stock and help with other needs, and we are automating this process with digital technologies. Easy-to-use online ordering, inventory monitoring and customer-driven changes make QIAstock an efficient system for providing ready access to our products for the hundreds of customers worldwide who use this program.
Intellectual Property, Proprietary Rights and Licenses
We have made and expect to continue to make investments in intellectual property. While we do not depend solely on any individual patent or technology, we are significantly dependent in the aggregate on technology that we own or license. Therefore, we consider protection of proprietary technologies and products one of the major keys to our business success. We rely on a combination of patents, licenses and trademarks to establish and protect proprietary rights. As of December 31, 2021, we owned 338 issued patents in the United States, 273 issued patents in Germany and 1,832 issued patents in other major industrialized countries. We had 425 pending patent applications. Our policy is to file patent applications in Western Europe, the United States and Japan. Patents in most countries have a term of 20 years from the date of filing the patent application. We intend to aggressively prosecute and enforce patents and to otherwise protect our proprietary technologies. We also rely on trade secrets, know-how, continuing technological innovation and licensing opportunities to develop and maintain our competitive position.
Our practice is to require employees, consultants, outside scientific collaborators, sponsored researchers and other advisers to execute confidentiality agreements upon commencement of their relationships with us. These agreements provide that all confidential information developed by or made known to the individual during the course of the relationship is to be kept confidential and not disclosed to third parties, subject to a right to publish certain information in scientific literature in certain circumstances and to other specific exceptions. In the case of our employees, the agreements provide that all inventions conceived by individuals in the course of their employment will be our exclusive property.
See "Risk Management" included below for details regarding risks related to our reliance on patents and proprietary rights.
18
Government Regulations
We are subject to a variety of laws and regulations in the European Union, the United States and other countries. The level and scope of the regulation varies depending on the country or defined economic region, but may include, among other things, the research, development, testing, clinical trials, manufacture, storage, recordkeeping, approval, labeling, promotion and commercial sales and distribution, of many of our products.
European Union Regulations
In the European Union, in vitro diagnostic medical devices (IVDs) have been regulated under EU-Directive 98/79/EC (IVD Directive) and corresponding national provisions. The IVD Directive requires that medical devices meet the essential requirements, including those relating to device safety and efficacy, set out in an annex of the Directive. According to the IVD Directive, EU Member States presume compliance with these essential requirements for devices that are in conformity with the relevant national standards transposing the harmonized standards, such as ISO 13485:2016, the quality system standard for medical device manufacturers.
IVD medical devices, other than devices for performance evaluation, must bear the CE marking of conformity when they are placed on the market. The CE mark is a declaration by the manufacturer that the product meets all the appropriate provisions of the applicable legislation implementing the relevant European Directive. As a general rule, the manufacturer must follow the EU declaration of conformity procedure to obtain a CE marking.
In May 2022, the Directive will be replaced by the In Vitro Diagnostic Device Regulation (IVDR) (EU) 2017/746 that was published in May 2017 and given a 5-year transition period until its full implementation on May 26, 2022. Unlike the Directive, the IVDR has binding legal force throughout every Member State and it will become effective on a set date in all the Member States. The major goals of the IVDR are to standardize diagnostic procedures within the EU, increase reliability of diagnostic analysis and enhance patient safety. Under the IVDR as enacted by the European Commission (EC), IVD devices will be subject to additional legal regulatory requirements after it comes into full effect. Among other things, the IVDR introduces a new risk-based classification system and requirements for conformity assessments. Products already certified by a Notified Body may remain on the market until May 25, 2024 under some conditions including fulfillment of specific requirements in the IVDR, but ultimately most products will have to be approved. Under the Directive the majority of QIAGEN products were under the self-declaration classification, while under IVDR most of QIAGEN products will require pre-approval, and those that are in the highest risk class will have to be tested by a Designated Reference Laboratory. In addition, the IVDR imposes additional requirements relating to post-market surveillance and submission of post-market performance follow-up reports. On January 25, 2022, Regulation (EU) 2022/112 was published to extend the transitional provisions of IVDR (EU) 2017/746, allowing most devices with their EC Declaration of Conformity under the IVD Directive to be placed on the market and/or put into service for an additional timeframe of 3-6 years depending on their appropriate risk class under the IVDR.
The EC has designated six (6) Notified Bodies to perform conformity assessments under the IVDR, including QIAGEN’s Notified Body, TÜV Rheinland. MedTech Europe has issued guidance relating to the IVDR in several areas, e.g., clinical benefit, technical documentation, state of art, accessories, and EUDAMED. Open points still being addressed/defined are the designation of EU Reference Laboratories and Common Specification for high risk IVDs. With respect to the current COVID-19 pandemic, the EC has classified SARS-CoV-2 assays as high risk.
The General Data Protection Regulation (GDPR) of the European Union, imposes restrictions on the transfer, access, use, and disclosure of health and other personal information. We have implemented the requirements set forth by the GDPR, which took effect on May 25, 2018. GDPR and other EU data privacy and security laws impact our business either directly or indirectly. Our failure to comply with applicable privacy or security laws or significant changes in these laws could significantly impact our business and future business plans. For example, we may be subject to regulatory action, fines, or lawsuits in the event we fail to comply with applicable privacy laws. We may face significant liability in the event any of the personal information we maintain is lost or otherwise subject to misuse or other wrongful use, access or disclosure.
The General Data Protection Regulation (GDPR), which applies to all EU member states from May 25, 2018, also applies to some of our operations.
19
United Kingdom
The UK’s withdrawal from the EU has major ramifications for IVD manufacturers. Among other things, companies now have to follow new procedures that apply in the UK, including appointment of a UK Responsible Person rather than relying on European Authorized Representatives, to manage their compliance efforts in the UK.
The UK Medicine and Healthcare Products Regulatory Agency (MHRA) issued guidance on how the country will regulate IVDs after January 1, 2021. According to MHRA, IVDs will require certification in the UK, which is defined as England, Scotland and Wales, while companies will still be able to sell tests in Northern Ireland under existing EU IVD regulations. As described in the guidance, MHRA will continue to recognize CE marks until June 30, 2023, although companies wishing to place IVDs on the UK market are required to register as such with MHRA. After July 1, 2023, companies selling in the UK will have to obtain a new marking called a UK Conformity Assessed mark (UKCA).
U.S. Regulations
In the United States, in vitro diagnostic products are subject to regulation by the FDA as medical devices to the extent that they are intended for use in the diagnosis, treatment, mitigation or prevention of disease or other conditions.
Certain types of tests, like some that we manufacture and sell for research use only in the United States, are not subject to the FDA’s premarket review and controls because we do not promote these tests for clinical diagnostic use, and they are labeled “For Research Use Only,” or RUO, as required by the FDA. Other tests, known as laboratory developed tests (LDTs), which are IVDs that are designed, manufactured and used within a single accredited, clinical laboratory, have generally been subject to enforcement discretion and not actively regulated by the FDA. As LDTs have increased in complexity, the FDA has taken steps towards developing a risk-based approach to the regulation of LDTs; however, most LDTs remain under FDA enforcement discretion. Congress has also signaled interest in clarifying the regulatory landscape for LDTs. In 2020, the Verifying Accurate, Leading-edge IVCT Development (VALID) Act was introduced in both chambers of Congress, and it was reintroduced in substantially unchanged form in June 2021. If enacted, clinical laboratories that develop and offer LDTs and traditional IVD medical device manufacturers would be subject to similar regulatory oversight. The VALID Act defines both LDTs and IVDs as in vitro clinical tests (IVCT) and would establish a new regulatory framework under the Food, Drug and Cosmetic Act (FDCA) for the review and oversight of IVCTs. The proposed regulatory framework adopts various concepts from the FDCA, utilizing a risk-based approach that aims to ensure that all marketed IVCTs have a reasonable assurance of both analytical and clinical validity.
Medical devices are classified into one of three classes depending on the controls deemed by the FDA to be necessary to reasonably assure their safety and effectiveness. Class I devices are generally exempt from premarket review and are subject to general controls, including labeling requirements, and adherence to the FDA’s Quality System Regulations (QSR), which are device-specific current good manufacturing practices. Class II devices are generally subject to premarket notification (or 510(k) clearance), the QSR, general controls and special controls, including performance standards and post-market surveillance. Class III devices are subject to most of the previously identified requirements as well as to premarket approval (PMA). The payment of a user fee, which is typically adjusted annually, to the FDA is usually required upon filing a premarket submission (e.g., premarket notification, premarket approval, or De Novo classification request) for FDA review.
510(k) Premarket Notification. A 510(k) premarket notification requires the sponsor to demonstrate that a medical device is substantially equivalent to another marketed device, termed a “predicate device,” that is legally marketed in the United States and is not subject to premarket approval. A device is substantially equivalent to a predicate device if its intended use(s), performance, safety and technological characteristics are similar to those of the predicate; or has a similar intended use but different technological characteristics, where the information submitted to the FDA does not raise new questions of safety and effectiveness and demonstrates that the device is at least as safe and effective as the legally marketed device.
If the FDA determines that the device (1) is not substantially equivalent to a predicate device, (2) has a new intended use compared to the identified predicate, (3) has different technological characteristics that raise different questions of safety and effectiveness, or (4) has new indications for use or technological characteristics and required performance data were not provided, it will issue a “Not Substantially Equivalent” (NSE) determination. If the FDA determines that the applicant’s device is substantially equivalent to the identified predicate device(s), the agency will issue a 510(k) clearance letter that authorizes commercial marketing of the device for one or more specific indications for use.
20
De Novo Classification. If a previously unclassified new medical device does not qualify for the 510(k) premarket notification process because no predicate device to which it is substantially equivalent can be identified, the device is automatically classified into Class III. However, if such a device would be considered low or moderate risk (in other words, it does not rise to the level of requiring the approval of a PMA), it may be eligible for the De Novo classification process. The De Novo classification process allows a device developer to request that the novel medical device be reclassified as either a Class I or Class II device, rather than having it regulated as a high risk Class III device subject to the PMA requirements. If the manufacturer seeks reclassification into Class II, the classification request must include a draft proposal for special controls that are necessary to provide a reasonable assurance of the safety and effectiveness of the medical device.
In October 2021, FDA issued a final rule that would formally codify requirements for the medical device De Novo process and the procedures and criteria for product developers to file a De Novo classification request (86 Fed. Reg. 54,826). Although the final rule does not affect marketed products, and likely not expected to impact products in current development, the FDA’s goals in promulgating the final rule are to create a predictable, consistent, and transparent De Novo classification process for innovative medical device developers.
Premarket Approval. The PMA process is more complex, costly and time consuming than the 510(k) process. A PMA must be supported by more detailed and comprehensive scientific evidence, including clinical data, to demonstrate the safety and efficacy of the medical device for its intended purpose. A clinical trial involving a “significant risk” device may not begin until the sponsor submits an investigational device exemption (IDE) application to the FDA and obtains approval to begin the trial.
After the PMA is submitted, the FDA has 45 days to make a threshold determination that the PMA is sufficiently complete to permit a substantive review. If the PMA is complete, the FDA will file the PMA and begin the substantive review process. The FDA is subject to a performance goal review time for a PMA that is 180 days from the date of filing, although in practice this review time is longer. Questions from the FDA, requests for additional data and referrals to advisory committees may delay the process considerably. The total process may take several years and there is no guarantee that the PMA will ever be approved. Even if approved, the FDA may limit the indications for which the device may be marketed. The FDA may also request additional clinical data as a condition of approval or after the PMA is approved. Any changes to the medical device may require a supplemental PMA to be submitted and approved before changed medical device may be marketed.
Any products manufactured and sold by us pursuant to FDA clearances or approvals will be subject to pervasive and continuing regulation by the FDA, including quality system requirements, record-keeping requirements, reporting of adverse experiences with the use of the device and restrictions on the advertising and promotion of our products. Device manufacturers are required to register their establishments and list their devices with the FDA and are subject to periodic inspections by the FDA and certain state agencies. Noncompliance with applicable FDA requirements can result in, among other things, warning letters, fines, injunctions, civil penalties, recalls or seizures of products, total or partial suspension of production, refusal of the FDA to grant 510(k) clearance or PMA approval for new devices, withdrawal of 510(k) clearances and/or PMA approvals and criminal prosecution.
As a result of the COVID-19 pandemic, the Secretary of the U.S. Department of Health and Human Services declared a public health emergency and authorized the FDA to issue emergency use authorizations (EUAs) to provide more timely access to critical medical countermeasures (including medicines and diagnostic tests) when there are no adequate, approved, and available alternative options. EUAs remain in effect until the emergency declaration ends unless the FDA decides to revise or revoke an EUA at an earlier point as the agency considers public health needs during the emergency and new data on an authorized product’s safety and effectiveness, or as products meet the criteria for FDA approval or clearance. Manufacturers of several types of SARS-CoV-2 assays have been granted EUAs, including QIAGEN. The FDA has indicated the withdrawal of EUAs for COVID-19 countermeasures will be done in a gradual, phased process and issued draft guidance on a transitional plan.
Regulation of Companion Diagnostic Devices
If a sponsor or the FDA believes that a diagnostic test is essential for the safe and effective use of a corresponding therapeutic product, the sponsor of the therapeutic product will typically work with a collaborator to develop an in vitro companion diagnostic device. The FDA defines an IVD companion diagnostic device as a device that provides information that is essential for the safe and effective use of a corresponding therapeutic product.
21
The FDA has also introduced the concept of complementary diagnostics that are distinct from companion diagnostics because they provide additional information about how a drug is used or identify patients who are likely to derive the greatest benefit from therapy without being required for the safe and effective use of that drug. The FDA has not yet provided much guidance on the regulation and use of complementary diagnostics, but several have been approved.
The FDA indicated that it will apply a risk-based approach to determine the regulatory pathway for IVD companion diagnostic devices, as it does with all medical devices. This means that the regulatory pathway will depend on the level of risk to patients, based on the intended use of the IVD companion diagnostic device and the controls necessary to provide a reasonable assurance of safety and effectiveness. We expect that any IVD companion diagnostic device that we develop will utilize the PMA pathway and that a clinical trial performed under an investigational device exemption, or IDE, will have to be completed before the PMA may be submitted.
The FDA expects that the therapeutic sponsor will address the need for an IVD companion diagnostic device in its therapeutic product development plan and that, in most cases, the therapeutic product and its corresponding IVD companion diagnostic device will be developed contemporaneously. If the companion diagnostic test will be used to make critical treatment decisions such as patient selection, treatment assignment, or treatment arm, it will likely be considered a significant risk device for which a clinical trial will be required.
The sponsor of the IVD companion diagnostic device will be required to comply with the FDA’s IDE requirements that apply to clinical trials of significant risk devices. If the diagnostic test and the therapeutic drug are studied together to support their respective approvals, the clinical trial must meet both the IDE and IND requirements.
Regulation of Research Use Only Products
Some of our products are sold for research purposes in the U.S., and labeled “For Research Use Only” (RUO) or “for molecular biology applications.” RUO refers to devices that are in the laboratory phase of development, while investigational use only, or IUO, refers to devices that are in the product testing phase of development. These types of devices are exempt from most regulatory controls pursuant to long-standing FDA guidance on RUO/IUO diagnostics. Because we do not promote our RUOs for clinical diagnostic use, or provide technical assistance to clinical laboratories with respect to these tests, we believe that these tests are exempt from FDA’s premarket review and other requirements. If the FDA were to disagree with our designation of any of these products, we could be forced to stop selling the product until we obtain appropriate regulatory clearance or approval. Further, it is possible that some of our RUOs may be used by some customers without our knowledge in their LDTs, which they may then develop, validate and promote for clinical use. However, QIAGEN does not promote these products for use in LDTs or assist in the development of the LDTs for clinical diagnostic use.
HIPAA and Other Privacy and Security Laws
The Health Insurance Portability and Accountability Act of 1996 (HIPAA), established comprehensive federal standards for the privacy and security of health information. The HIPAA standards apply to health plans, healthcare clearing houses, and healthcare providers that conduct certain healthcare transactions electronically (Covered Entities,), as well as individuals or entities that perform services for them involving the use, or disclosure of, individually identifiable health information or “protected health information” under HIPAA. Such service providers are called “Business Associates." Title II of HIPAA, the Administrative Simplification Act, contains provisions that address the privacy of health data, the security of health data, the standardization of identifying numbers used in the healthcare system and the standardization of certain healthcare transactions. The privacy regulations protect medical records and other protected health information by limiting their use and release, giving patients the right to access their medical records and limiting most disclosures of health information to the minimum amount necessary to accomplish an intended purpose. The HIPAA security standards require the adoption of administrative, physical, and technical safeguards and the adoption of written security policies and procedures to maintain the security of protected health information.
On February 17, 2009, Congress enacted Subtitle D of the Health Information Technology for Economic and Clinical Health Act (HITECH) provisions of the American Recovery and Reinvestment Act of 2009. HITECH expanded and strengthened HIPAA, created new targets for enforcement, imposed new penalties for noncompliance and established new breach notification requirements for Covered Entities and Business Associates.
22
Under ’HITECH’s breach notification requirements, Covered Entities must report breaches of protected health information that has not been encrypted or otherwise secured. Required breach notices must be made as soon as is reasonably practicable, but no later than 60 days following discovery of the breach. Reports must be made to affected individuals and to the Secretary and, in some cases depending on the size of the breach, they must be reported through local and national media. Breach reports can lead to investigation, enforcement and civil litigation, including class action lawsuits.
Our Redwood City entity serves in some cases as a Business Associate to customers who are subject to the HIPAA regulations. In this capacity, we maintain an active compliance program that is designed to identify security incidents and other issues in a timely fashion and enable us to remediate, mitigate harm or report if required by law. We are subject to prosecution and/or administrative enforcement and increased civil and criminal penalties for non-compliance, including a new, four-tiered system of monetary penalties adopted under HITECH. We are also subject to enforcement by state attorneys general who were given authority to enforce HIPAA under HITECH. To avoid penalties under the HITECH breach notification provisions, we must ensure that breaches of protected health information are promptly detected and reported within the company, so that we can make all required notifications on a timely basis. However, even if we make required reports on a timely basis, we may still be subject to penalties for the underlying breach.
California has also adopted the California Consumer Privacy Act of 2018, or CCPA, which took effect on January 1, 2020 and became enforceable by the state attorney general on July 1, 2020. The CCPA establishes a new privacy framework for covered businesses by creating an expanded definition of personal information, establishing new data privacy rights for consumers in the State of California, imposing special rules on the collection of consumer data from minors, and creating a new and potentially severe statutory damages framework for violations of the CCPA and for businesses that fail to implement reasonable security procedures and practices to prevent data breaches.
The regulations issued under the CCPA have been modified several times. Additionally, a new privacy law, the California Privacy Rights Act, or CPRA, was approved by California voters in the election on November 3, 2020. The CPRA will modify the CCPA significantly, potentially resulting in further uncertainty, additional costs and expenses stemming from efforts to comply, and additional potential for harm and liability for failure to comply. Other states in the U.S. are considering privacy laws similar to the CCPA. In February 2021, the Virginia legislature became the second to enact a state-specific law called the Consumer Data Protection Act, or CDPA, which includes key differences from California’s law, further complicating compliance by industry and other stakeholders.
Many states have also implemented genetic testing and privacy laws imposing specific patient consent requirements and protecting test results by strictly limiting the disclosure of those results. State requirements are particularly stringent regarding predictive genetic tests, due to the risk of genetic discrimination against healthy patients identified through testing as being at a high risk for disease. We believe that we have taken the steps required of us to comply with health information privacy and security statutes and regulations, including genetic testing and genetic information privacy laws in all jurisdictions, both state and federal. However, these laws constantly change, and we may not be able to maintain compliance in all jurisdictions where we do business. Failure to maintain compliance, or changes in state or federal laws regarding privacy or security could result in civil and/or criminal penalties, significant reputational damage and could have a material adverse effect on our business.
U.S. Fraud and Abuse Laws and Other Healthcare Regulations
A variety of state and federal laws prohibit fraud and abuse involving state and federal healthcare programs, as well as commercial insurers. These laws are interpreted broadly and enforced aggressively by various federal and state agencies, including the Centers for Medicare & Medicaid Services (CMS), the Department of Justice (DOJ), and the Office of Inspector General for the U.S. Department of Health and Human Services (OIG). The Company seeks to conduct its business in compliance with all applicable federal and state laws.
State and federal fraud and abuse laws may be interpreted and applied differently, and arrangements and business practices could be subject to scrutiny under them by federal or state enforcement agencies. Sanctions for violations of these laws could result in a wide range of penalties, including but not limited to significant criminal sanctions, civil fines and penalties.
23
The Anti-Kickback Statute
The federal Anti-Kickback Statute (AKS) prohibits, in pertinent part, persons from knowingly and willfully soliciting, receiving, offering or paying remuneration, directly or indirectly, in cash or in kind, in exchange for or to induce that person:
•To refer an individual to a person for the furnishing or arranging for the furnishing of any item or service for which payment may be made by federal healthcare programs; or
•To purchase, lease, order, or arrange for or recommend purchasing, leasing, or ordering, any good, facility, service, or item for which payment may be made by a federal healthcare program.
A person or entity does not need to have actual knowledge of the AKS or specific intent to violate it to have committed a violation. Recognizing that the AKS is broad and potentially applies to innocuous or beneficial arrangements, the OIG issued regulations, commonly known as “safe harbors,” which set forth certain requirements that, if fully met, insulate a given arrangement or conduct from prosecution under the AKS. The AKS also has statutory exceptions that provide protection similar to that of safe harbors. If, however, an arrangement does not meet every requirement of an exception or safe harbor, the arrangement does not necessarily violate the AKS. A facts-and-circumstances analysis is necessary to determine AKS compliance or lack thereof. The statutory penalties for violating the AKS include imprisonment and criminal fines. In addition, through application of other laws, conduct that violates the AKS can give rise to civil monetary penalties and possible exclusion from Medicare, Medicaid, and other federal healthcare programs. Claims including items or services resulting from a violation of the AKS also constitute a false or fraudulent claim for purposes of the False Claims Act.
In addition to the federal AKS, many states have their own anti-kickback laws. Often, these laws closely follow the language of the federal law, although they do not always have the same scope, exceptions, safe harbors or sanctions. In some states, these anti-kickback laws apply to both state healthcare programs and commercial insurers. The penalties for violating state anti-kickback provisions can be severe, including criminal and civil penalties (including penalties under the state false claims law), imprisonment, and exclusion from state healthcare programs.
The False Claims Act
The federal False Claims Act (FCA) imposes civil liability on any person or entity that, among other things, knowingly presents, or causes to be presented, to the federal government, claims for payment that are false or fraudulent; knowingly makes, uses or causes to be made or used, a false statement or record material to a false or fraudulent claim or obligation to pay or transmit money or property to the federal government; or knowingly conceals or knowingly and improperly avoids or decreases an obligation to pay money to the federal government. The FCA also prohibits the knowing retention of overpayments (sometimes referred to as “reverse false claims”).
In addition, the FCA permits a private individual acting as a “whistleblower” (also referred to as a “relator”) to bring FCA actions on behalf of the federal government under the statute’s qui tam provisions, and to share in any monetary recovery. The federal government may elect or decline to intervene in such matters, but if the government declines intervention, the whistleblower may still proceed with the litigation on the government’s behalf.
Penalties for violating the FCA include payment of up to three times the actual damages sustained by the government, plus substantial per-claim statutory penalties, as well as possible exclusion from federal healthcare programs.
Various states have enacted similar laws modeled after the FCA that apply to items and services reimbursed under Medicaid and other state healthcare programs, and, in several states, such laws apply to claims submitted to any payor, including commercial insurers.
There is also a federal criminal false claims statute that prohibits, in pertinent part, the making or presentation of a false claim, knowing such claim to be false, to any person or officer in the civil, military, or naval service or any department or agency thereof. Potential penalties for violating this statute include fines or imprisonment.
24
Health Care Fraud and False Statements
The federal healthcare fraud statute criminalizes knowingly and willfully defrauding a healthcare benefit program, which includes including commercial insurers. A violation of this statute may result in fines, imprisonment, or exclusion from federal healthcare programs. The false statements statute prohibits knowingly and willfully falsifying, concealing, or covering up a material fact or making a materially false, fictitious, or fraudulent statement in connection with the delivery of or payment for healthcare benefits, items, or services. A violation of this statute may result in fines or imprisonment.
Civil Monetary Penalties Law
The federal Civil Monetary Penalties Law (CMP Law) prohibits, among other things, (1) the offering or transfer of remuneration to a beneficiary of Medicare or a state healthcare program if the person knows or should know it is likely to influence the beneficiary’s selection of a particular provider, practitioner, or supplier of services reimbursable by Medicare or a state healthcare program, unless an exception applies; (2) employing or contracting with an individual or entity that the provider knows or should know is excluded from participation in a federal healthcare program; (3) billing for services requested by an unlicensed physician or an excluded provider; and (4) billing for medically unnecessary services. The penalties for violating the CMP Law include exclusion from federal healthcare programs, substantial fines, and payment of up to three times the amount billed, depending on the nature of the offense.
Physician Payments Sunshine Act
The federal Physician Payments Sunshine Act (Sunshine Act) imposes reporting requirements on manufacturers of certain devices, drugs, biologics, and medical supplies for which payment is available under Medicare, Medicaid, or the Children’s Health Insurance Program (CHIP), with certain exceptions. Manufacturers to which the Sunshine Act applies must collect and report annually certain data on certain payments and transfers of value by them (and in some cases their distributors) to physicians, teaching hospitals, and certain advanced non-physician healthcare practitioners, as well as ownership and investment interests held by physicians and their immediate family members. For reporting beginning January 1, 2022, U.S.-licensed physician assistants, clinical nurse specialists, certified nurse-midwives, certified nurse anesthetists, and nurse practitioners must be included in the provider types subject to Sunshine Act reporting. The report program (known as the Open Payments program) is administered by CMS.
There are also an increasing number of state “sunshine” laws that require manufacturers to provide reports to state governments on pricing and marketing information. Several states have enacted legislation requiring manufacturers, including medical device companies to, among other things, establish marketing compliance programs, file periodic reports with the state, make periodic public disclosures on sales and marketing activities, and to prohibit or limit certain other sales and marketing practices.
Failure to comply with the Sunshine Act or state equivalents could result in civil monetary penalties, among other sanctions, depending upon the nature of the violation.
Foreign Corrupt Practices Act
Despite extensive procedures to ensure compliance, we may also be exposed to liabilities under the U.S. Foreign Corrupt Practices Act (FCPA), which generally prohibits companies and their intermediaries from making corrupt payments to foreign officials for the purpose of obtaining or maintaining business or otherwise obtaining favorable treatment, and requires companies to maintain adequate record-keeping and internal accounting practices to accurately reflect the transactions of the company. We are also subject to a number of other laws and regulations relating to money laundering, international money transfers and electronic fund transfers. These laws apply to companies, individual directors, officers, employees and agents.
Environment, Health and Safety
We are subject to laws and regulations related to the protection of the environment, the health and safety of employees and the handling, transportation and disposal of medical specimens, infectious and hazardous waste and radioactive materials. For example, the U.S. Occupational Safety and Health Administration (OSHA) has established extensive requirements relating specifically to workplace safety for healthcare employers in the U.S. This includes requirements to develop and implement multi-faceted programs to protect workers from exposure to blood-borne pathogens, such as HIV and hepatitis B and C, including preventing or minimizing any exposure through needle stick injuries. For purposes of transportation, some biological materials and laboratory supplies are classified as hazardous materials and are subject to regulation by one or more of the following agencies: the U.S. Department of Transportation,
25
the U.S. Public Health Service, the United States Postal Service and the International Air Transport Association. The U.S. Environmental Protection Agency (EPA) has also promulgated regulations setting forth importation, labelling, and registration requirements, among others, which may apply to certain products and/or establishments of the company.
Rest of the World Regulation
In addition to regulations in the United States and the EU, we are subject to a variety of regulations governing clinical studies and commercial sales and distribution of molecular testing instruments, consumables and digital solutions in other jurisdictions around the world. These laws and regulations typically require the licensing of manufacturing facilities, as well as controlled research, testing and governmental authorization of product candidates. Additionally, they may require adherence to good manufacturing, clinical and laboratory practices.
We must obtain approval from regulatory authorities in all countries where we distribute our products. The requirements governing the conduct of product authorization, pricing and reimbursement vary greatly from country to country. If we fail to comply with applicable regulatory requirements, we may be subject to, among other things, fines, suspension or withdrawal of regulatory approvals, product recalls, seizure of products, operating restrictions, or criminal prosecution.
Reimbursement
United States
In the United States, payments for diagnostic tests come from several sources, including commercial insurers, (which might include health maintenance organizations and preferred provider organizations); government healthcare programs (such as Medicare or Medicaid); and, in many cases, the patients themselves. For many years, federal and state governments in the United States have pursued methods to reduce the cost of healthcare delivery. For example, in 2010, the United States enacted major healthcare reform legislation known as the Patient Protection and Affordable Care Act (ACA). Such changes have had, and are expected to continue to have, an impact on our business.
For example, in August 2011, the Budget Control Act of 2011, among other things, created measures for spending reductions by Congress. A Joint Select Committee on Deficit Reduction, tasked with recommending a targeted deficit reduction of at least $1.2 trillion for the years 2013 through 2021, was unable to reach required goals, thereby triggering the legislation’s automatic reduction to several government programs. This includes aggregate reductions of Medicare payments to providers up to 2% per fiscal year, and, due to subsequent legislative amendments, will remain in effect through 2030 unless additional Congressional action is taken. Pursuant to the Coronavirus Aid, Relief, and Economic Security Act, also known as the CARES Act, as well as subsequent legislation, these reductions have been suspended from May 1, 2020 through March 31, 2021 due to the COVID-19 pandemic. The suspension was subsequently extended through March 31, 2022, with a reduction of the suspension to 1% sequester through June 30, 2022.
We frequently identify value propositions on our products and communicate them to payors, providers, and patient stakeholders and attempt to positively impact coverage, coding and payment pathways. However, we have no direct control over payor decisions with respect to coverage and payment levels for our products. The manner and level of reimbursement may depend on the site of care, the procedure(s) performed, the final patient diagnosis, the device(s) and/or drug(s) utilized, the available budget, or a combination of these factors, and coverage and payment levels are determined at each payor’s discretion. Changes in reimbursement levels or methods may positively or negatively affect sales of our products in any given country for any given product. At QIAGEN, we work with several specialized reimbursement consulting companies and maintain regular contact with payors.
As government programs seek to expand healthcare coverage for their citizens, they have at the same time sought to control costs by limiting the amount of reimbursement they will pay for particular procedures, products or services. Many third-party payors have developed payment and delivery mechanisms to support cost control efforts and to focus on paying for quality. Such mechanisms include payment reductions, pay for performance metrics, quality-based performance payments, restrictive coverage policies, studies to compare effectiveness and patient outcomes, and technology assessments. These changes have increased emphasis on the delivery of more cost-effective and quality-driven healthcare.
26
Code Assignment. In the United States, a third-party payor's decisions regarding coverage and payment are impacted, in large part, by the specific Current Procedural Terminology (CPT) code used to identify a test. The American Medical Association (AMA) publishes the CPT, which identifies codes, along with descriptions, for reporting medical services and procedures. The purpose of the CPT is to provide a uniform language that accurately describes medical, surgical, and diagnostic services and therefore to ensure reliable nationwide communication among healthcare providers, patients, and third-party payors. CMS uses its own Healthcare Common Procedure Coding System (HCPCS) codes for medical billing and reimbursement purposes. Level I HCPCS codes are comprised of current CPT codes, while Level II HCPCS codes primarily represent non-physician services and Level III HCPCS codes are local codes developed by Medicaid agencies, Medicare contractors and commercial insurers. Proprietary Laboratory Analyses (PLA) Codes are an addition to the CPT® code set approved by the AMA CPT® Editorial Panel. They are alpha-numeric CPT codes with a corresponding descriptor for labs or manufacturers that want to more specifically identify their test.
A manufacturer of in vitro diagnostic kits or a provider of laboratory services may request establishment of a Category I CPT code for a new product or a PLA Code or both. In addition, Z-Code identifiers are unique five-character alphanumeric tracking codes associated with a specific molecular diagnostic test. When a claim is submitted, it includes the associated CPT code and the Z-Code identifier is entered as a device code. Assignment of a specific CPT code ensures routine processing and payment for a diagnostic test by both commercial insurers and government payors.
The AMA has specific procedures for establishing a new CPT code and, if appropriate, for modifying existing nomenclature to incorporate a new test into an existing code. If the AMA concludes that a new code or modification of nomenclature is unnecessary, the AMA will inform the requestor how to use one or more existing codes to report the test.
While the AMA's decision is pending, billing and collection may be sought under an existing, non-specific CPT code. A manufacturer or provider may decide not to request assignment of a CPT code and instead use an existing, non-specific code for reimbursement purposes. However, use of such codes may result in more frequent denials and/or requests for supporting clinical documentation from the third-party payor and in lower reimbursement rates, which may vary based on geographical location.
CMS reimbursement rates for clinical diagnostic tests are defined by CPT and HCPCS codes in the Clinical Laboratory Fee Schedule (CLFS). In 2012, the AMA added 127 new CPT codes for molecular pathology services that became effective on January 1, 2013. These new CPT codes are biomarker specific and were designed to replace the previous methodology of billing for molecular pathology testing, which involved “stacking” a series of non-biomarker specific CPT codes together to describe the testing performed. CMS issued final national reimbursement prices for the new CPT codes in November 2013. These federal reimbursement amounts are widely acknowledged to be lower than the reimbursement obtained by the now outdated “stacking” method, but commercial insurers and Medicare contractors are still in the process of solidifying their coverage and reimbursement policies for the testing described by these new CPT codes.
As of January 1, 2018, in accordance with the Protecting Access to Medicare Act of 2014 (PAMA), applicable laboratories are required to report to CMS commercial insurer payment rates and volumes for their tests. CMS uses the data reported and the HCPCS code associated with the test to calculate a weighted median payment rate for each test, which is used to establish revised Medicare CLFS reimbursement rates for certain clinical diagnostic laboratory tests (CDLTs), subject to certain phase-in limits. For a CDLT that is assigned a new or substantially revised CPT code, the initial payment rate is assigned using the gap-fill methodology.
If the test at issue falls into the category of new advanced diagnostic laboratory test (ADLT) instead of CDLT, the test will be paid based on an actual list charge for an initial period of three quarters, before being shifted to the weighted median commercial insurer rate reported by the laboratory performing the ADLT. Laboratories offering ADLTs are subject to recoupment if the actual list charge exceeds the weighted median private payor rate by a certain amount.
On December 20, 2019, the President signed the Further Consolidated Appropriations Act, which included the Laboratory Access for Beneficiaries Act (LAB Act). The LAB Act delayed until the first quarter of 2021 the reporting of payment data under PAMA for CDLTs that are not ADLTs. The Coronavirus Aid, Relief, and Economic Security Act (CARES Act), which Congress passed in March 2020, again delayed reporting by an additional year, until the first quarter of 2022. The CARES Act also delayed the next PAMA reporting period for CDLTs to January 1, 2022 through March 31, 2022. Then, on December 10, 2021, Congress passed the Protecting Medicare and American Farmers from Sequester Cuts Act, which included a provision that further delays the next PAMA
27
reporting period for CDLTs that are not ADLTs to January 1, 2023 through March 31, 2023. New CLFS rates for CDLTs will thus be established based on that data beginning in 2024, subject to phase-in limits.
CMS’s methodology under PAMA (as well as the willingness of commercial insurers to recognize the value of diagnostic testing and pay for that testing accordingly) renders commercial insurer payment levels even more significant. This calculation methodology has resulted in significant reductions in reimbursement, even though CMS imposed caps on those reductions. Given the many uncertainties built into PAMA’s price-setting process, it is difficult to predict how payments made by CMS under the CLFS may change from year to year.
Coverage Decisions: When deciding whether to cover a particular diagnostic test, third-party payors generally consider whether the test is a medically necessary and, if so, whether the test will directly impact clinical decision making. For coverage, the testing method should be considered scientifically valid to identify the specific gene biomarker or gene mutation, and must have been demonstrated to improve clinical outcomes for the patient’s condition. Coverage of a drug therapy and its companion diagnostic are usually validated by a NCCN category 1, 2A or 2B recommendation. However, most third-party payors do not cover experimental services. Coverage determinations are often influenced by current standards of practice and clinical data, particularly at the local level. CMS has the authority to make coverage determinations on a national basis, but most Medicare coverage decisions are made at the local level by contractors that administer the Medicare program in specified geographic areas. Commercial insurers and government payors have separate processes for making coverage determinations, and commercial insurer may or may not follow Medicare's coverage decisions. If a third-party payor has a coverage determination in place for a particular diagnostic test, billing for that test must comply with the established policy. Otherwise, the third-party payor makes reimbursement decisions on a case-by-case basis.
Payment: Payment for covered diagnostic tests is determined based on various methodologies, including prospective payment systems and fee schedules. In addition, commercial insurers may negotiate contractual rates with participating providers, establish fee schedule rates, or set rates as a percentage of the billed charge. Diagnostic tests furnished to Medicare inpatients generally are included in the bundled payment made to the hospital under Medicare's Inpatient Prospective Payment System, utilizing Diagnosis Related Groups (DRGs) depending on the patient’s condition. Payment rates for diagnostic tests furnished to Medicare beneficiaries in outpatient settings are the lesser of the amount billed, the local fee for a geographic area, or a national limit. Each year, the fee schedule is updated for inflation and could be modified by Congress in accordance with the CLFS rules and provisions. Medicaid programs generally pay for diagnostic tests based on a fee schedule, but reimbursement varies by geographic region.
European Union
In the European Union, the reimbursement mechanisms used by private and public health insurers vary by country. For the public systems, reimbursement is determined by guidelines established by the legislator or responsible national authority. As elsewhere, inclusion in reimbursement catalogues focuses on the medical usefulness, need, quality and economic benefits to patients and the healthcare system. Acceptance for reimbursement comes with cost, use, and often volume restrictions, which again can vary by country.
Organizational Structure
QIAGEN N.V. is the holding company for more than 50 consolidated subsidiaries, many of which have the primary function of distributing our products and services on a regional basis. Certain subsidiaries also have research and development or production activities. A listing of our significant subsidiaries and their jurisdictions of incorporation is included in Note 28 "Consolidated Companies" of the Consolidated Financial Statements.
Description of Property
Our primary production and manufacturing facilities for consumable products are located in Germany, the United States, Spain and China. Our facilities for software development are located in the United States, Germany, Poland, Denmark and Romania. In recent years, we have made investments in automated and interchangeable production equipment to increase our production capacity and improve efficiency. Our production and manufacturing operations are highly integrated and benefit from sophisticated inventory control. Production management personnel are highly qualified, and many have advanced degrees
28
in engineering, business and science. We also have installed and continue to expand production-planning systems that are included in our integrated information and control system based on the SAP R/3 business software package from SAP SE. Worldwide, we use SAP software to integrate most of our operating subsidiaries.
We have an established quality system, including standard manufacturing and documentation procedures, intended to ensure that products are produced and tested in accordance with the FDA's Quality System Regulations, which impose current Good Manufacturing Practice (cGMP) requirements. For facilities that accommodate cGMP production, special areas were built and these facilities operate in accordance with cGMP requirements.
The consumable products manufactured at QIAGEN GmbH in Germany, and QIAGEN Sciences LLC in Maryland, are produced under ISO 9001: 2015, ISO 13485:2016, MDSAP. Our certifications form part of our ongoing commitment to provide our customers with high-quality, state-of-the-art sample and assay technologies under our Total Quality Management system.
Our corporate headquarters are located in leased office space in Venlo, The Netherlands. The below table summarizes our material facilities. Other subsidiaries throughout the world lease smaller amounts of space.
| Location | Country | Purpose | Owned or Leased | Square feet | ||||||||||||||||||||||
| Hilden | Germany | Manufacturing, warehousing, distribution, research and administration | Owned | 786,000 | ||||||||||||||||||||||
| Germantown, Maryland | USA | Manufacturing, warehousing, distribution and administration | Owned | 285,000 | ||||||||||||||||||||||
| Shenzhen | China | Research, manufacturing, warehousing, distribution, and administration | Leased | 102,150 | ||||||||||||||||||||||
| Manchester | UK | Research and Service Solutions | Leased | 96,300 | ||||||||||||||||||||||
| Ann Arbor, Michigan | USA | Manufacturing, warehousing, distribution, and administration | Leased | 81,000 | ||||||||||||||||||||||
| Wroclaw | Poland | Shared service center | Leased | 65,100 | ||||||||||||||||||||||
| Beverly, Massachusetts | USA | Enzyme manufacturing | Leased | 44,000 | ||||||||||||||||||||||
| Frederick, Maryland | USA | Manufacturing, warehousing, distribution and research | Leased | 42,000 | ||||||||||||||||||||||
| Barcelona | Spain | Research, manufacturing, warehousing, distribution, and administration | Leased | 31,900 | ||||||||||||||||||||||
| Manila | Philippines | Shared service center | Leased | 29,300 | ||||||||||||||||||||||
| Ann Arbor, Michigan | USA | Service Solutions, warehousing and administration | Leased | 28,000 | ||||||||||||||||||||||
| Minden, Nevada | USA | Service Solutions | Leased | 19,000 | ||||||||||||||||||||||
| Germantown, Maryland | USA | Service Solutions and training center | Leased | 13,500 | ||||||||||||||||||||||
| Redwood City, California | USA | Bioinformatics | Leased | 12,700 | ||||||||||||||||||||||
In 2021 and 2020, we made investments to expand production lines in Germany, Spain and the U.S. to meet both current demand as well as future growth. At each of our owned facilities in Hilden, Germany and Germantown, Maryland, there is room for future expansion of up to 300,000 square feet of facility space.
We believe our existing production and distribution facilities can support anticipated production needs for the next 36 months. Our production and manufacturing operations are subject to various federal, state, and local laws and regulations including environmental regulations. We do not believe we have any material issues relating to these laws and regulations.
29
Results of Operations, Financial Position
Results of Operations
Overview
In 2021, QIAGEN exceeded two billion dollars in total net sales for the first time in the company's history due to strong performance of our non-COVID product portfolio and our continued support of the global response to the pandemic through testing solutions for COVID-19. Strong sales in 2021 supported profitability and cash flow while we continued to make investments to strengthen our portfolio, in particular the five pillars of growth which consist of sample technologies, the digital PCR (Polymerase Chain Reaction) platform QIAcuity, the clinical PCR automation solutions QIAstat-Dx and NeuMoDx and the QuantiFERON technology platform used to detect diseases such as latent tuberculosis. We are moving ahead with large manufacturing upscaling projects and investing in research and development for menu expansion of our key platforms. These investments are designed to enable us to transition our installed base of instruments and systems into new applications while supporting the global response to COVID-19 testing.
Financial highlights of 2021 include:
•Net sales grew 20% in 2021 driven by growth of 24% in our non-COVID product portfolio demonstrating that we have a robust portfolio anchored by our five pillars of growth to drive strong business expansion beyond the pandemic. Net sales of our COVID-19 products grew 14% as we continue to support the global response to the COVID-19 pandemic. 2021 results include NeuMoDx Molecular Inc. (NeuMoDx) which we acquired in September 2020. For additional information on this acquisition see Note 5 "Acquisitions."
•Operating income margin rose to 28.2% in 2021 from 20.5% in 2020 primarily due to lower restructuring, acquisition, integration and other expenses. Additionally, we realized efficiencies in sales and marketing as well as general and administrative expenses which more than offset the investments made to our portfolio that resulted in a reduction in gross margin and higher research and development as a percentage of sales during 2021.
•Net income rose due to the increase in operating income as well as the change in other financial results compared to 2020. In addition to the impacts from the change in net income, diluted EPS was also impacted by a lower number of weighted-average common shares outstanding used in calculating diluted EPS in 2021 compared to the prior year.
•Net cash provided by operating activities reflected the strong growth in net sales in 2021. Purchases of property, plant and equipment rose compared to 2020 primarily due to investments made to expand consumables production capacity for key growth products at sites in Europe and the United States.
We determined that we operate as one reportable segment in accordance with IFRS 8 Operating Segments. Our chief operating decision maker (CODM) makes decisions on business operations and resource allocation based on evaluations of the QIAGEN Group as a whole. Considering the acquisitions made during 2020, we determined that we still operate as one reportable segment. We provide certain revenue information by customer class to allow better insight into our operations. This information is estimated using certain assumptions to allocate revenue among the customer classes.
30
Year Ended December 31, 2021, Compared to 2020
Net Sales
| (in millions) | 2021 | 2020 | ||||||||||||||||||||||||||||||
| Product type | Net sales | % of net sales | Net sales | % of net sales | % change | |||||||||||||||||||||||||||
| Consumables and related revenues | $1,986.3 | 88 | % | $1,615.4 | 86 | % | +23 | % | ||||||||||||||||||||||||
| Instruments | 265.3 | 12 | % | 254.9 | 14 | % | +4 | % | ||||||||||||||||||||||||
| Net Sales | $2,251.7 | $1,870.3 | +20 | % | ||||||||||||||||||||||||||||
| Customer class | ||||||||||||||||||||||||||||||||
| Molecular Diagnostics | $1,143.7 | 51 | % | $904.0 | 48 | % | +27 | % | ||||||||||||||||||||||||
| Life Sciences | 1,108.0 | 49 | % | 966.4 | 52 | % | +15 | % | ||||||||||||||||||||||||
| Net Sales | $2,251.7 | $1,870.3 | +20 | % | ||||||||||||||||||||||||||||
| Non-COVID and COVID-19 products | ||||||||||||||||||||||||||||||||
| Non-COVID products | $1,547.2 | 69 | % | $1,252.4 | 67 | % | +24 | % | ||||||||||||||||||||||||
| COVID-19 products | 704.4 | 31 | % | 617.9 | 33 | % | +14 | % | ||||||||||||||||||||||||
| Net Sales | $2,251.7 | $1,870.3 | +20 | % | ||||||||||||||||||||||||||||
Consumables and related revenues showed ongoing solid trends for both non-COVID and COVID-19 related products in 2021 and grew 23% compared to 2020. Net sales of instruments grew 4% in 2021 and represented 12% of total net sales. During 2020, instruments reflected 14% of total net sales as we experienced an increase in our installed base of instruments due to the ability of these to be used in COVID-19 testing. In 2021, sales of non-COVID products grew 24% supported by improved demand trends among both Molecular Diagnostics and Life Sciences customers compared to 2020. Demand for COVID-19 test products continued through 2021 in response to the pandemic, including the rise in testing related to the Omicron variant which was identified in November 2021. Net sales were positively impacted by one percentage point from favorable currency movements against the U.S. dollar.
| (in millions) | 2021 | 2020 | |||||||||||||||||||||||||||||||||
| Product group | Net sales | % of net sales | Net sales | % of net sales | % change | ||||||||||||||||||||||||||||||
| Sample technologies | $850.6 | 38 | % | $803.9 | 43 | % | +6 | % | |||||||||||||||||||||||||||
| Diagnostic solutions | 638.8 | 28 | % | 460.8 | 25 | % | +39 | % | |||||||||||||||||||||||||||
| PCR / Nucleic acid amplification | 434.0 | 19 | % | 363.6 | 19 | % | +19 | % | |||||||||||||||||||||||||||
| Genomics / NGS | 245.1 | 11 | % | 165.6 | 9 | % | +48 | % | |||||||||||||||||||||||||||
| Other | 83.2 | 4 | % | 76.6 | 4 | % | +9 | % | |||||||||||||||||||||||||||
| Net Sales | $2,251.7 | $1,870.3 | +20 | % | |||||||||||||||||||||||||||||||
Sample technologies include both COVID-19 and non-COVID products involved in the first step in any molecular lab process. In 2021, non-COVID product group sales rose 14%, representing 64% of net sales for this product group on higher demand for DNA sample prep due in part to a favorable research funding environment. Sales of sample technologies for COVID-19 testing declined overall primarily due to lower sales of manual sample prep kits and instruments, while sales of automated sample prep kits, namely QIAprep&, were higher driven by demands for high-volume testing.
Diagnostic solutions include molecular testing platforms and products as well as Precision Medicine and companion diagnostic co-development revenues. This product group experienced growth due to improved trends in clinical testing demand in 2021. Key product drivers were the QuantiFERON latent TB test with 48% growth and 2021 sales of $281.4 million together with sales of the QIAstat-Dx syndromic testing system which grew 39% to $75 million. In the first full
31
year following the September 2020 acquisition, NeuMoDx sales totaled $105 million in 2021, supported by demand for COVID-19 testing. Revenues from companion diagnostic co-development projects grew 25% in 2021 on the resumption of pharma research and development projects while sales of Precision Medicine companion diagnostic consumables rose 9%.
PCR / Nucleic acid amplification involves research and applied PCR solutions and components and includes the QIAcuity digital PCR platform launched in September 2020. This product group experienced strong demand for OEM solutions and enzymes used in third-party diagnostic kits while COVID-related sales for both consumables and instruments declined after strong demand in 2020.
Genomics / NGS includes universal NGS solutions as well as the full QIAGEN Digital Insights portfolio. Growth in this product group reflects an increased demand against weaker sales trends in 2020 due to the adverse pandemic impact on customers. As activity levels continued to rise in research and clinical applications in 2021, sales for universal consumables used in NGS in both the Life Sciences and Molecular Diagnostic applications, as well as bioinformatics revenues from QIAGEN Digital Insights, were key drivers of 2021 sales growth.
| Geographic region (in millions) | 2021 | 2020 | % change | ||||||||||||||||||||
| Americas | $1,007.4 | $825.5 | +22 | % | |||||||||||||||||||
| Europe, Middle East and Africa | 814.4 | 682.3 | +19 | % | |||||||||||||||||||
| Asia Pacific, Japan and Rest of World | 429.9 | 362.6 | +19 | % | |||||||||||||||||||
| Net Sales | $2,251.7 | $1,870.3 | +20 | % | |||||||||||||||||||
Top 7 growth markets: Brazil, Russia, India, China, South Korea, Mexico and Turkey (2021: $309 million, 2020: $287 million, +8%)
The Americas led the geographic regions with 22% sales growth in 2021 due to a strong performance in the U.S. which experienced 25% growth including gains in non-COVID product group sales especially in QuantiFERON-TB and QIAcuity. Growth in the U.S. was partially offset by declines in Brazil and in Mexico compared to 2020.
The Europe, Middle East and Africa (EMEA) region was driven by growth throughout Western Europe primarily in Austria, the United Kingdom, Italy and Switzerland during 2021. EMEA was supported by two percentage points of sales growth from positive currency movements in 2021.
The Asia Pacific, Japan and Rest of World region's performance was driven by 27% growth in China compared to 2020 on improving trends in non-COVID product groups. Higher sales were also seen in Japan, Australia and South Korea, more than absorbing the decline in India compared to 2020. Sales in this region were positively impacted by three percentage points from favorable currency movements against the U.S. dollar.
Gross Profit
| (in millions) | 2021 | 2020 | % change | |||||||||||||||||
| Gross Profit | $1,446.5 | $1,227.8 | +18 | % | ||||||||||||||||
| Gross Margin | 64.2 | % | 65.6 | % | ||||||||||||||||
Gross margin between periods can be impacted by significant changes in individual product sales. The gross margin decline of 1.4 percentage points is attributable in part to changes in the consumable product mix, notably the increase in QuantiFERON latent TB test with 48% growth in 2021. Additionally, the lower gross margin reflects higher costs following our investments in expanded production capacity and higher amortization expense. Generally, our consumables and related products have a higher gross margin than our instrumentation products and service arrangements. While net sales have shifted towards a higher percentage of consumables in 2021, fluctuations in the sales levels within the product types can result in changes in gross margin between periods.
In 2021, the amortization expense on acquisition-related intangibles within cost of sales increased to $67.1 million in 2021 from $63.2 million in 2020. This net increase in amortization expense reflects the NeuMoDx intangibles acquired in 2020 partially offset by the full amortization during 2020 of assets previously acquired. Our acquisition-related intangible amortization will increase in the event of future acquisitions.
32
Operating Expenses
| 2021 | 2020 | |||||||||||||||||||||||||||||||
| (in millions) | Expenses | % of net sales | Expenses | % of net sales | % change | |||||||||||||||||||||||||||
| Research and development | ($180.7) | 8.0 | % | ($139.1) | 7.4 | % | +30 | % | ||||||||||||||||||||||||
| Sales and marketing | (474.7) | 21.1 | % | (434.2) | 23.2 | % | +9 | % | ||||||||||||||||||||||||
| General and administrative | (126.2) | 5.6 | % | (110.2) | 5.9 | % | +15 | % | ||||||||||||||||||||||||
| Restructuring, acquisition, integration and other, net | (29.5) | 1.3 | % | (159.9) | 8.6 | % | -82 | % | ||||||||||||||||||||||||
| Long-lived asset impairments | — | — | % | (1.0) | 0.1 | % | -100 | % | ||||||||||||||||||||||||
| Other operating income | 0.6 | — | % | 1.0 | 0.1 | % | -42 | % | ||||||||||||||||||||||||
| Other operating expense | (0.3) | — | % | (0.6) | — | % | -47 | % | ||||||||||||||||||||||||
| Total operating expenses | ($810.8) | 36.0 | % | ($843.9) | 45.1 | % | ||||||||||||||||||||||||||
| Income from operations | $635.7 | 28.2 | % | $383.9 | 20.5 | % | ||||||||||||||||||||||||||
Research and Development
The increase of research and development expenses as a percentage of sales as well as the overall increase in research and development is the result of the focus on our five pillars of growth, including investments in NeuMoDx, QIAstat-Dx and QIAcuity. These investments are targeting new applications within our five pillars of growth to drive sustainable post-pandemic expansion. Research and development costs for the year ended December 31, 2021, include $6.0 million of unfavorable currency exchange impact. In 2020, research and development costs reflect the suspended development of NGS-related instrument systems as discussed in Note 6 "Restructuring and Impairments". As we continue to discover, develop and acquire new products and technologies, we expect to incur additional expenses related to facilities, licenses and employees engaged in research and development. Overall, research and development costs are expected to increase as a result of seeking regulatory approvals, including U.S. FDA Pre-Market Approval (PMA), U.S. FDA 510(k) clearance and EU CE approval of certain assays or instruments. Further, business combinations, along with the acquisition of new technologies, may increase research and development costs in the future. We have a strong commitment to innovation and expect to continue to make investments in our research and development efforts.
Sales and Marketing
The overall increase in expense reflects additional sales and marketing efforts supporting the focus on our five pillars of growth, as well as increases in freight and other supply chain costs in line with the increase in sales and includes unfavorable currency exchange impacts of $8.6 million for the year ended December 31, 2021. The increased use of digital marketing efforts during the COVID-19 pandemic was a driver in reduced sales and marketing expenses as a percentage of sales of 21.1% in 2021 compared to 23.2% in 2020. Sales and marketing expenses are primarily associated with personnel, commissions, advertising, trade shows, publications, freight and logistics expenses, and other promotional expenses. We expect to continue building out our digital customer engagement channels and intend to closely monitor the development of sales and marketing expenses once pandemic restrictions are lifted.
General and Administrative
General and administrative expenses also decreased as a percentage of sales in 2021 compared to 2020 while overall expenses increased. General and administrative expenses include unfavorable currency exchange impacts of $1.8 million for the year ended December 31, 2021. We anticipate continued investments in cyber security and other investments in information technology systems including upgraded enterprise resource planning (ERP) systems in the coming years.
Restructuring, Acquisition, Integration and Other, net
Restructuring, acquisition, integration and other, net expenses decreased $130.5 million in 2021 compared to the prior year. Expenses of $29.5 million during the year ended December 31, 2021 includes costs for the continued integration of NeuMoDx as well as $4.7 million jury-awarded damages to ArcherDX. We also incurred $4.1 million of charges related to the 2019 restructuring program as discussed further in Note 6 "Restructuring and Impairments".
33
During the year ended December 31, 2020, $159.9 million of expenses were incurred including acquisition expenses related to the unsuccessful acquisition attempt by Thermo Fisher of $125.5 million, including a $95.0 million expense reimbursement. Additionally, we incurred net acquisition, integration and other expenses of $32.8 million, including charges for NeuMoDx as well as the $11.7 million gain on the value of our interest held on the acquisition date. We also incurred $1.6 million of charges related to the 2019 restructuring program as discussed further in Note 6.
Long-lived Asset Impairments
Impairments to property, plant and equipment during the year ended 2020 totaled $1.0 million and were incurred in connection with the 2019 restructuring measures as further discussed in Note 6 "Restructuring and Impairments".
Financial Income (Expense)
| (in millions) | 2021 | 2020 | % change | |||||||||||||||||
| Financial income | $9.6 | $10.0 | -5 | % | ||||||||||||||||
| Financial expense | (56.5) | (73.0) | -23 | % | ||||||||||||||||
| Other financial results | 62.4 | (166.0) | -138 | % | ||||||||||||||||
| Total finance expense, net | $15.4 | ($229.0) | -107 | % | ||||||||||||||||
Financial income includes interest earned on cash, cash equivalents and short term investments, income related to certain interest rate derivatives as discussed in Note 26 "Financial Risk Factors and Use of Derivative Financial Instruments" and other components including the interest portion of operating lease transactions. The fluctuation in 2021 compared to the prior year is partially attributable to the duration and level of short-term investments held during the period.
Financial expense primarily relates to debt, discussed in Note 16 "Financial Debts" in the accompanying consolidated financial statements. The decrease in 2021 is driven by the repayment of the majority of the 2021 Notes after the first quarter of 2020.
Other financial results for the year ended December 31, 2021 includes a $35.8 million gain recognized from the receipt and sale of the Invitae shares and related hedge, gains of $28.2 million related to the embedded cash conversion option on the cash convertible notes and $25.3 million related to the fair value change in warrants and embedded conversion option, $12.0 million of income from equity method investments discussed in Note 11 "Equity Accounted Investments", $0.7 million in income, net from the changes in fair value and sale of investments held in other publicly traded companies, and a $0.3 million gain from the sale of an equity method investment. These were partially offset by a $23.9 million loss related to the change in the fair value of the equity options, $3.1 million related to the change in fair value of interest rate derivatives also discussed in Note 26 and $9.0 million loss on foreign currency transactions.
Other financial results for the year ended December 31, 2020 includes losses of $321.2 million related to the embedded cash conversion option on the cash convertible notes and $293.9 million related to the fair value change in the warrants and embedded conversion option, $9.3 million in unrealized losses were recognized for the changes in fair market value of quoted equity securities all marketable equity securities as well as a $2.3 million loss from the sale of an equity security investment as well as $4.1 million net losses on foreign currency transactions. These were partially offset by a gain of $322.6 million related to the change in the fair value of the equity options, a gain of $123.3 million for the sale of our investment in ArcherDX, a gain of $11.7 million related to the acquisition date fair value of the minority interest of NeuMoDx, gains of $5.0 million from investments accounted for under the equity method, a gain of $2.6 million related to the change in fair value of interest rate derivatives and a total of $1.6 million in gains related to prior sales of assets.
QIAGEN N.V.'s presentation currency is the U.S. dollar, and most of our subsidiaries' functional currencies are the local currencies of the countries in which they are headquartered. All amounts in the financial statements of entities whose functional currency is not the U.S. dollar are translated into U.S. dollar equivalents at exchange rates as follows: (1) assets and liabilities at period-end rates, (2) income statement accounts at average exchange rates for the period, and (3) components of shareholders' equity at historical rates. Translation gains or losses are recorded in shareholders' equity, and transaction gains and losses are reflected in net income.
34
Provision for Income Taxes
| (in millions) | 2021 | 2020 | % change | |||||||||||||||||
| Income before income taxes | $651.1 | $154.9 | +320 | % | ||||||||||||||||
| Income taxes | ($114.0) | ($81.3) | +40 | % | ||||||||||||||||
| Net income | $537.1 | $73.6 | ||||||||||||||||||
| Effective tax rate | 17.5 | % | 52.5 | % | ||||||||||||||||
In 2021 and 2020, our effective tax rates were 17.5% and 52.5%, respectively. The effective tax rates in both years reflect higher pre-tax book income due to higher operating income driven by the significant demand for solutions used in COVID-19 testing. Our effective tax rates differ from the Netherlands statutory tax rate of 25% due in part to our operating subsidiaries being exposed to effective tax rates ranging from zero to 35%. Fluctuations in the distribution of pre-tax (loss) income among our operating subsidiaries can lead to fluctuations of the effective tax rate in the consolidated financial statements. We record partial tax exemptions on foreign income primarily derived from operations in Germany, the Netherlands and Singapore. These foreign tax benefits are due to a combination of favorable tax laws, rules, and exemptions in these jurisdictions, including intercompany foreign royalty income in Germany which is statutorily exempt from trade tax. Further, we have intercompany financing arrangements in which the intercompany income is nontaxable in Dubai.
In future periods, our effective tax rate may fluctuate from similar or other factors as discussed in “Changes in tax laws or their application could adversely affect our results of operations or financial flexibility” in Principle Risks and Uncertainties.
Liquidity and Capital Resources
To date, we have funded our business primarily through internally generated funds, debt, and private and public sales of equity. Our primary use of cash has been to support continuing operations and our investing activities including capital expenditure requirements and acquisitions. As of December 31, 2021, we had cash and cash equivalents of $879.9 million and current financial assets of $184.8 million. As of December 31, 2020, we had cash and cash equivalents of $597.0 million and current financial assets of $117.2 million. Cash and cash equivalents are primarily held in U.S. dollars and euros, other than those cash balances maintained in the local currency of subsidiaries to meet local working capital needs. At December 31, 2021, cash and cash equivalents had increased by $282.9 million from December 31, 2020, primarily as a result of cash provided by operating activities of $676.0 million partially offset by cash used in investing activities of $211.7 million and cash used in financing activities of $177.8 million. As of December 31, 2021 and 2020, we had working capital of $447.3 million and $1.03 billion, respectively.
Cash Flow Summary
| (in millions) | 2021 | 2020 | ||||||||||||
| Net cash provided by operating activities | $676.0 | $492.3 | ||||||||||||
| Net cash used in investing activities | ($211.7) | ($453.3) | ||||||||||||
| Net cash used in financing activities | ($177.8) | ($74.3) | ||||||||||||
| Effect of exchange rate changes on cash, cash equivalents and restricted cash | ($3.6) | $4.1 | ||||||||||||
| Net increase (decrease) in cash, cash equivalents and restricted cash | $282.9 | ($31.2) | ||||||||||||
Operating Activities
For the years ended December 31, 2021 and 2020, we generated net cash from operating activities of $676.0 million and $492.3 million, respectively. The net increase in net cash from operating activities is primarily the result of an increase in net income and adjustments for non-cash items. While net income was $537.1 million in 2021, non-cash components in income included $219.5 million of depreciation and amortization, $38.4 million of share-based compensation and $32.0 million of amortization of debt discount. Operating cash flows include a net decrease in operating assets and liabilities primarily due to increased inventories in order to meet the increase in demand and decreased other current liabilities and accounts payable during 2021. Because we rely
35
heavily on cash generated from operating activities to fund our business, a decrease in demand for our products, longer collection cycles or significant technological advances of competitors would have a negative impact on our liquidity.
Investing Activities
Approximately $211.7 million of cash was used in investing activities during 2021, compared to $453.3 million during 2020. Investing activities during 2021 consisted principally of $397.7 million for purchases of unquoted debt securities, $138.6 million in cash paid for purchases of property and equipment which includes the investments we are making in expanded production capacity and $67.9 million paid for intangible assets. This is partially offset by $209.2 million from the sale of unquoted debt securities and $150.4 million proceeds from the sale quoted equity securities as discussed in Note 7 "Financial Assets" and $44.9 million returned to us from our derivative counterparties in connection with cash we had provided to them to collateralize our derivative liabilities with them as discussed in Note 26 "Financial Risk Factors and Use of Derivative Financial Instruments".
Cash used in investing activities in during 2020 includes $239.6 million in cash paid for acquisitions, net of cash acquired primarily for NeuMoDx, $224.3 million paid for intangible assets including $135.9 million of the remaining milestone payments for the digital PCR assets acquired from Formulatrix, $79.9 million purchases of property, plant and equipment, $53.4 million paid for collateral assets and $49.8 million for purchase of unquoted debt securities. This was partially offset by $181.2 million from the sale of unquoted debt securities and $25.6 million net proceeds from sales of investments in privately held companies.
Financing Activities
For the year ended December 31, 2021, cash used in financing activities was $177.8 million compared to.$74.3 million in 2020. Financing activities during 2021 includes net payments of $100.0 million for repurchases of QIAGEN shares, repayments of long-term debt including $41.1 million for two tranches of the German Private Placement (Schuldschein) that matured and $0.2 million for the remaining 2021 Notes, $27.4 million for principal payments on finance leases as well as $23.6 million paid in connection with net share settlement for tax withholding related to the vesting of stock awards. This was partially offset by $8.6 million received from our derivative counterparties to collateralize derivative assets that we hold with them.
In 2020, cash used in financing activities totaled $74.3 million and consisted primarily due to $468.6 million in connection with the final conversion, redemption and termination of the 2021 Cash Convertible Notes as well as $64.0 million for repurchases of QIAGEN shares. This was partially offset by $497.6 million in proceeds from issuance of the 2027 Zero Coupon Convertible Notes.
Other Factors Affecting Liquidity and Capital Resources
As of December 31, 2021, we carry $1.9 billion of long-term debt, of which $845.7 million is current and $1.04 billion is non-current.
In December 2020, we issued $500.0 million aggregate principal amount of zero coupon Convertible Notes due in 2027 (2027 Notes). The 2027 Notes will mature on December 17, 2027 unless converted in accordance with their terms prior to such date as described more fully in Note 16 "Financial Debts".
In November 2018, we issued $500.0 million aggregate principal amount of Cash Convertible Senior Notes which is due in 2024 (2024 Notes). Interest on the 2024 Notes is payable semiannually in arrears at a rate of 1.000% per annum. The 2024 Notes will mature on November 13, 2024 unless repurchased or converted in accordance with their terms prior to such date.
In September 2017, we issued $400.0 million aggregate principal amount of Cash Convertible Senior Notes which are due in 2023 (2023 Notes). Interest on the 2023 Notes is payable semiannually in arrears at a rate of 0.500% per annum. The 2023 Notes will mature on September 13, 2023 unless repurchased or converted in accordance with their terms prior to such date.
Additionally in 2017, we completed a German private placement consisting of several tranches denominated in either U.S. dollars or Euro at either floating or fixed rates and due at various dates through June 2027. As of December 31, 2021, a total of $294.5 million is outstanding, of which $170.6 million is due in October 2022. During 2021, we paid $41.1 million when two tranches matured as described in Note 16 "Financial Debts".
In March 2014, we issued Cash Convertible Senior Notes of which $0.2 million was paid during 2021.
36
In October 2012, we completed a U.S. private placement with three series at a weighted average interest rate of 3.66%. The following two series remain outstanding at December 31, 2020: (1) $300 million 10-year term due in October 16, 2022 (3.75%); and (2) $27 million 12-year term due in October 16, 2024 (3.90%).
In December 2020, we obtained a €400 million syndicated revolving credit facility with a contractual life of three years with the ability to extend by one year two times. No amounts were utilized at December 31, 2021. The facility can be utilized in Euro and bears interest of 0.550% to 1.500% above EURIBOR, and is offered with interest periods of one, three or six months. The interest rate is linked to our environmental, social and governance (ESG) performance. We have additional credit lines totaling €27.0 million with no expiration date, none of which were utilized as of December 31, 2021.
On July 12, 2021, we announced our seventh share repurchase program of up to $100 million of our common shares. During 2021, we repurchased 1.9 million QIAGEN shares for $100.0 million (including transaction costs). This program ended on October 29, 2021. In May 2019, we announced our sixth share repurchase program of up to $100 million of our common shares. During 2020, we repurchased 1.3 million QIAGEN shares for $64.0 million (including transaction costs). This program ended in December 2020. Repurchased shares will be held in treasury in order to satisfy various obligations, which include employee share-based remuneration plans.
We have lease obligations, including interest, in the aggregate amount of $105.4 million, of which $23.6 million is current as of December 31, 2021. We also have purchase obligations and license commitments totaling $139.3 million and $17.8 million, respectively, and in connection with certain acquisitions, we could be required to make additional contingent cash payments totaling up to $26.6 million based on the achievement of certain revenue and operating results milestones. These obligations are further discussed in Note 13 "Leases" and Note 20 "Commitments and Contingencies" in the accompanying financial statements.
Liabilities associated with uncertain tax positions, including interest and penalties, are currently estimated at $107.5 million as of December 31, 2021. Ultimate settlement of these liabilities is dependent on factors outside of our control, such as examinations by each agency and expiration of statutes of limitation for assessment of additional taxes. Therefore, we cannot reasonably estimate when, if ever, this amount will be paid to a government agency.
We did not use special purpose entities and do not have off-balance sheet financing arrangements as of and during the years ended December 31, 2021 and 2020.
We expect that cash from financing activities will continue to be impacted by issuances of our common shares in connection with our equity compensation plans and that the market performance of our stock will impact the timing and volume of the issuances. Additionally, we may make future acquisitions or investments requiring cash payments, the issuance of additional equity or debt financing.
We believe that funds from operations, existing cash and cash equivalents, together with the proceeds from any public and private sales of equity, and availability of financing facilities, will be sufficient to fund our planned operations and expansion during the coming year. However, any global economic downturn may have a greater impact on our business than currently expected, and we may experience a decrease in the sales of our products, which could impact our ability to generate cash. If our future cash flows from operations and other capital resources are not adequate to fund our liquidity needs, we may be required to obtain additional debt or equity financing or to reduce or delay our capital expenditures, acquisitions or research and development projects. If we could not obtain financing on a timely basis or at satisfactory terms, or implement timely reductions in our expenditures, our business could be adversely affected.
Quantitative and Qualitative Disclosures About Market Risk
Our market risk relates primarily to interest rate exposures on cash, short-term investments and borrowings and foreign currency exposures. Financial risk is centrally managed and is regulated by internal guidelines which require a continuous internal risk analysis. The overall objective of our risk management is to reduce the potential negative earnings effects from changes in interest and foreign exchange rates. Exposures are managed through operational methods and financial instruments relating to interest rate and foreign exchange risks. In the ordinary course of business, we use derivative instruments, including swaps, forwards and/or options, to manage potential losses from foreign currency exposures and interest rates. The principal objective of such derivative instruments is to minimize the risks and/or costs associated with global financial and operating activities. We do not utilize derivative or other financial instruments for
37
trading or other speculative purposes. All derivatives are recognized as either assets or liabilities in the balance sheet and are measured at fair value with any change in fair value recognized in earnings in the period of change, unless the derivative qualifies as an effective hedge that offsets certain exposures. In determining fair value, we consider both the counterparty credit risk and our own creditworthiness, to the extent that the derivatives are not covered by collateral agreements with the respective counterparties.
Further details of our derivative and hedging activities can be found in Note 26 "Financial Risk Factors and Use of Derivative Financial Instruments" to the accompanying consolidated financial statements.
Interest Rate Risk
We use interest rate derivatives to align our portfolio of interest bearing assets and liabilities with our risk management objectives. We have entered into interest rate swaps in which we agreed to exchange, at specified intervals, the difference between fixed and floating interest amounts calculated by reference to an agreed-upon notional principal amount.
At December 31, 2021, we had $879.9 million in cash and cash equivalents as well as of $184.8 million of current financial assets. Interest income earned on our cash investments is affected by changes in the relative levels of market interest rates. We only invest in high-grade investment instruments. A hypothetical adverse 10% movement in market interest rates would not have materially impacted our financial statements.
Borrowings against lines of credit are at variable interest rates. We had no amounts outstanding against our lines of credit at December 31, 2021. A hypothetical adverse 10% movement in market interest rates would not have materially impacted our financial statements.
At December 31, 2021, we had $1.9 billion of financial debt. Through the use of interest rate derivatives we have swapped $127.0 million of our fixed rate debt into a variable interest rate based on the 3-months LIBOR. A hypothetical adverse 10% movement in market interest rates would not have materially impacted our financial statements, as the increased interest expense would have been off-set by increased interest income from our variable rate financial assets.
Foreign Currency Exchange Rate Risk
As a global enterprise, we are subject to risks associated with fluctuations in foreign currencies with regard to our ordinary operations. This includes foreign currency-denominated receivables, payables, debt and other balance sheet positions as well as future cash flows resulting from anticipated transactions including intra-group transactions. We manage our balance sheet exposure on a group-wide basis primarily using foreign exchange forward contracts, options and cross-currency swaps.
A significant portion of our revenues and expenses are earned and incurred in currencies other than the U.S. dollar. The euro is the most significant such currency, with others including the British pound, Japanese yen, Chinese renminbi, Turkish lira, Brazilian real, Indian rupee, Swiss franc, and Canadian and Australian dollars. Fluctuations in the value of the currencies in which we conduct our business relative to the U.S. dollar have caused and will continue to cause U.S. dollar translations of such currencies to vary from one period to another. Due to the number of currencies involved, the constantly changing currency exposures, and the potential substantial volatility of currency exchange rates, we cannot predict the effect of exchange rate fluctuations upon future operating results. In general terms, depreciation of the U.S. dollar against our other foreign currencies will increase reported net sales. However, this effect is, at least partially, offset by the fact that we also incur substantial expenses in foreign currencies. We do conduct business in Russia, which represented less than 1% of consolidated net sales in 2021 and as of December 31, 2021, we held assets totaling 381.6 million rubles ($5.1 million as of December 31, 2021). Russia's invasion of Ukraine and the sanctions imposed in response have led to a decline in the value of the ruble which is expected to remain highly volatile.
We have significant production and manufacturing facilities located in Germany and intercompany sales of inventory also expose us to foreign currency exchange rate risk. Intercompany sales of inventory are generally denominated in the local currency of the subsidiary purchasing the inventory in order to centralize foreign currency risk with the manufacturing subsidiary. We use an in-house bank approach to net and settle intercompany payables and receivables as well as intercompany foreign exchanged swaps and forward contracts in order to centralize the foreign exchange rate risk to the extent possible. We have entered in the past and may enter in the future into foreign exchange derivatives including forwards, swaps and options to manage the remaining foreign exchange exposure.
38
Employees
As of December 31, 2021, we employed 6,028 individuals, of which 16% worked in research and development, 37% in sales, 30% in production, 6% in marketing and 11% in administration.
| Region | Research & Development | Sales | Production | Marketing | Administration | Total | ||||||||||||||||||||||||||||||||
| Americas | 215 | 583 | 431 | 77 | 78 | 1,384 | ||||||||||||||||||||||||||||||||
| Europe, Middle East & Africa | 721 | 859 | 1,229 | 189 | 391 | 3,389 | ||||||||||||||||||||||||||||||||
| Asia Pacific, Japan & Rest of World | 56 | 795 | 158 | 85 | 161 | 1,255 | ||||||||||||||||||||||||||||||||
| December 31, 2021 | 992 | 2,237 | 1,818 | 351 | 630 | 6,028 | ||||||||||||||||||||||||||||||||
At December 31, 2020, we employed 5,610 individuals. Management believes that its relations with regional labor unions and employees are good.
As a company headquartered in the European Union, freedom of association and collective bargaining are cornerstones of the good relationship between management and representatives of employees. A significant portion of workforce is employed in the Organization for Security and Co-Operation in Europe (OSCE) member states and in all regions where we operate, we comply with all applicable laws regarding freedom of association and collective bargaining and respect local laws and regulations concerning labor relations.
We strive to respect and promote human rights and our commitment on this issue can be found in our Human Rights Policy available on our website (www.qiagen.com). This policy is communicated to all employees globally on an ongoing basis via the company intranet and also given to newly hired employees. We strive to foster an open-door workplace culture where employees are able to approach management and/or Human Resources about their concerns without fear of retaliation. Our policy states that employees may communicate openly with management regarding their working conditions without threat of reprisal, intimidation or harassment.
Depending on local law and custom, there are different types of employment ranging from long-term fixed contracts to temporary positions, also including flexible time and programs for parents returning from childcare. In 2021, part-time employees represented 2.5% of our workforce (2020: 3.0%) and temporary employees with a fixed-term work contract represented 4.7% (2020: 2.1%).
Management believes that its relations with regional labor unions and employees are good.
Human Capital
The skills, knowledge, dedication and passion of our employees are critical for the success of QIAGEN. We want to recruit, support and retain the best employees, offering performance-based remuneration, development opportunities and measures to balance work and family life. We are committed to diversity in our teams, fueling innovation and engagement with our customers and business partners, and an environment and culture that allow all employees the equal opportunity for success. In a fast-changing, competitive business environment, QIAGEN has a significant commitment to being an employer of choice and further enhancing our position as a great place to work. At the end of 2021, QIAGEN had 6,028 full-time equivalent employees, an increase of 7% from 5,610 at the end of 2020. For 2021, the overall turnover rate at the management level was 6.6%, with an 11.1% voluntary turnover rate for the total workforce. We believe our relationship with our employees is good.
Recognizing that our employees are the key to our success, we seek to be a great place to work. In 2021, many of our subsidiaries have been recognized as an employer of choice including in Germany, where we are recognized again as a “Top Employer” by the Top Employer Institute, a global authority on recognizing excellence in people practices. In 2021, we received the Top Employer Certificate for China, and our subsidiaries in Brazil and Mexico were again recognized as a "Great Place to Work". Our Philippines Shared Service Center won multiple employer certifications in 2021, including Asia's "Great
39
Place to Work' and Asia's "Best Employer Brand in 2021." For the first time in 2021, our subsidiaries in the U.S. India and the Philippines were certified as a “Great Place to Work.”
In 2021, as a continued consequence of the global pandemic, a large portion of our employees continued to work remotely. For our essential workers and in our locations where employees either returned or continued to work on site, we maintained safety measures including routine on-site testing at critical facilities to reduce the risk of COVID-19 transmission.
We are committed to creating an environment that is rich in diversity and empowers all employees. Diverse teams strengthen our organization through the variety of ideas, perspectives and approaches they bring to our business. Our teams outperform and succeed when they are composed of individuals with the widest possible range of personalities, backgrounds and traits. That’s why we value each person’s uniqueness and maintain an environment where all individuals can succeed based on their strengths and characteristics. In 2021, our workforce was composed of at least 80 nationalities with an average age of 39.4. With 49% women, we are well balanced in terms of gender on an aggregate level. Our strategic initiative on gender diversity, which began in 2018, has yielded remarkable results in the past years, particularly with regard to leadership positions. The participation of women in leadership roles rose from just under 28% in 2018 to approximately 34% in 2021. For 2022, we have a goal to achieve participation of women in leadership roles of 35% or more. We have been named to the 2022 Bloomberg Gender Equality Index which provides an opportunity for companies to assess progress towards parity, benchmark against peers and highlight a commitment to gender equality. Our commitment to diversity goes beyond cultural and gender diversity. Our U.S. subsidiary received a score of 100 on the Human Rights Campaign Foundation's 2022 Corporate Equality Index. QIAGEN is also a member of the Business Coalition for the Equality Act.
Employee development is viewed as integral to the success of creating lasting value for our customers, patients, colleagues, partners, and shareholders. We believe we offer opportunities to work on exciting tasks and projects in an engaging work environment. Employees join QIAGEN and stay with QIAGEN because they can see how their work makes a difference to people’s lives everywhere in the world. We offer various training platforms that provide the possibility to either use our global e-learning portfolio or to participate in personal trainings usually offered in a blended format. The focus is on job-specific skills, compliance, competencies and leadership development. In 2021, we conducted both virtual instructor-led and e-learning courses. All in-person trainings remain on hold due to the ongoing COVID-19 pandemic.
We have been committed since our beginning to attract and retain the best talent worldwide via our focus on rewarding for performance. Our compensation system fosters a focus on achieving corporate strategic initiatives as well as personal accountability. We regularly benchmark our compensation strategy to evaluate the level and mix of compensation awarded by companies and industries for a broad range of positions around the world. Our benchmarks include many peer life science and diagnostics companies. QIAGEN has a “pay for performance” culture, with the compensation of employees linked to the achievement of corporate financial and individual performance goals. Business goals are established by senior management. These goals are set at ambitious levels each year to motivate and drive performance, with a focus on both short-term and long-term quantifiable objectives. Furthermore, to align our compensation programs with the interests of shareholders, management levels receive a portion of their total compensation in the form of long-term compensation, which is granted as equity as a reward for performance.
For more information about our human capital, please also see the Environmental, Social and Governance section of this Annual Report.
40
Risk Management:
Our risk management approach embodies the key elements of a sound risk management system including (1) active Supervisory Board and senior management involvement; (2) adequate policies and procedures; (3) adequate risk management, monitoring and information systems; and (4) comprehensive internal controls.
QIAGEN is managed by a Managing Board and an independent Supervisory Board appointed by the General Meeting of Shareholders. One of the Managing Board's responsibilities is the oversight of the risk management system. The Managing Board has developed and implemented strategies, controls and mitigation measures to identify current and developing risks as part of the risk management system. These policies and procedures are embodied in our corporate governance, code of ethics and financial reporting controls and procedures. A variety of functional experts evaluate these business risks, attempting to mitigate and manage these risks on an ongoing basis.
Identified risks are subdivided into three types:
•A base business risk that is specific to us or our industry and threatens our existing business;
•A business growth risk that is specific to us or our industry and threatens our future business growth; and
•An underlying business risk that is not specific to us or our industry, but applies to a larger number of public companies.
All identified risks are evaluated based on their likelihood of occurring and their potential impact (estimated in monetary terms) in disrupting our progress in achieving our business objectives. The overall risk management goal is to identify risks that could significantly threaten our success and to allow management the opportunity to successfully implement mitigation actions on a timely basis. The results of the risk assessment, and any updates, are reported to the Audit Committee of the Supervisory Board on a regular basis. A detailed risk reporting update is provided each quarter to the Audit Committee for specific risks that have been newly identified or have changed since the previous assessment. At least once on an annual basis, the Supervisory Board discusses the corporate strategy and business risks as well as the results of an assessment by the Managing Board and the Audit Committee of the structure and operations of the internal risk management and control systems, including any significant changes.
Our corporate governance structure is based on a strong framework that outlines the responsibilities of our Managing and Supervisory Boards (discussed in more detail in Shareholdings and Other Information section of this Annual Report) and the function of the Audit Committee of the Supervisory Board (discussed in more detail in the Corporate Governance Report section of this Annual Report). We maintain adequate internal controls over financial reporting to ensure the integrity of financial reporting, which is described further in the Corporate Governance Report section of this Annual Report. Additionally, we have a Compliance Committee that consists of senior executives from various functional areas who are responsible for ensuring compliance with legal and regulatory requirements, as well as overseeing the communication of corporate policies, including our Code of Ethics as described further in the Non-Financial Statement section of this Annual Report.
41
| Risk Types | ||
| Base Business Risk | ||
•Identification and monitoring of competitive business threats •Monitoring complexity of product portfolio •Monitoring dependence on key customers for single product groups •Reviewing dependence on individual production sites or suppliers •Evaluating purchasing initiatives, price controls and changes to reimbursements •Monitoring production risks, including contamination prevention, high-quality product assurance •Ensuring ability to defend against intellectual property infringements and maintain competitive advantage after expiration | ||
| Business Growth Risk | ||
•Managing development and success of key R&D projects •Managing successful integration of acquisitions to achieve anticipated benefits | ||
| Underlying Business Risk | ||
•Evaluating financial risks, including global economic risks, and currency rate fluctuations •Evaluating and monitoring international hostilities •Monitoring financial reporting risks, including multi-jurisdiction tax compliance •Reviewing possible asset impairment events •Assessing cyber security, compliance and legal risks, including safety in operations and environmental hazard risks, compliance with various regulatory bodies and pending product approvals •Monitoring risks of FCPA (Foreign Corrupt Practices Act) or antitrust concerns arising from a network of subsidiaries and distributors in foreign countries | ||
The risks described below are listed in the order of our current view of their expected significance. Describing the risk factors in order of significance does not imply that a lower listed risk factor may not have a material adverse impact on our results of operations, liquidity or capital resources.
Our continued growth is dependent on the development and success of new products.
Rapid technological change and frequent new product introductions are typical in the markets we serve. Our success will depend in part on continuous, timely development and introduction of new products that address evolving market requirements, for example products in response to SARS-CoV-2. We believe successful new product introductions provide a significant competitive advantage because customers make an investment of time in selecting and learning to use a new product and are reluctant to switch after these efforts. To the extent that we fail to introduce new and innovative products, or such products suffer significant delays in development or are not accepted in the market, we may lose market share to our competitors that would be difficult or impossible to regain. An inability to successfully develop and introduce new products, for technological or other reasons, could reduce our growth rate or otherwise have an adverse effect on our business. In the past, we have experienced delays in the development and introduction of products, including regulatory approvals, or decisions to stop development of projects, and we may experience delays or make decisions to stop certain products in the future.
As a result, we cannot assure you that we will keep pace with the rapid rate of change in our markets or that our new products will adequately meet the requirements of the marketplace, achieve market acceptance or regulatory approval, or compete successfully with companies offering similar or new technologies. Some of the factors affecting market acceptance of a new product include:
•availability, quality and price relative to existing competitor products;
•the timing of introduction of the new product relative to competitive products;
•opinions of the new product’s utility;
•citation of the new product in published research;
•regulatory trends and approvals; and
•general trends in life sciences research, applied markets and molecular diagnostics.
42
In the development of new products, we may make significant investments in intellectual property, software solutions and manufacturing capacity. These investments increase our fixed costs, resulting in higher operational costs in the short term that will negatively impact our gross profit and operating income until products potentially reach a minimum level of market acceptance and sales. The expenses or losses associated with unsuccessful product development activities or lack of market acceptance of our new products could materially adversely affect our business, financial condition and results of operations.
Our continued growth depends significantly on the success of new products in the molecular testing markets we serve and our ability to scale manufacturing capacities to meet customer demands. Important product programs include our modular medium-throughput QIAsymphony automation platform, QIAstat-Dx system for one-step, fully integrated molecular analysis of hard-to-diagnose syndromes, the high-throughput NeuMoDx 288 and mid-throughput NeuMoDx 96 fully integrated PCR automation systems, sample and assay technologies designed for use with QIAGEN instruments or with "universal" automation systems and instruments, and bioinformatics solutions to analyze and interpret complex genomic data.
The speed and level of adoption of our new automation platforms will affect sales not only of instrumentation but also of consumables – sample and assay kits – designed to run on the systems. The rollouts of new automation platforms are intended to drive the dissemination and increasing sales of consumables for these systems. We are developing or co-developing new kits for each of these platforms and seeking regulatory approvals for a number of these new products. In turn, the availability and regulatory approval of more tests for processing on QIAsymphony, QIAstat-Dx and NeuMoDx systems, especially molecular assays for specific diseases or companion diagnostics paired with new drugs, will influence the value of the instruments to prospective buyers. Slower adoption of the QIAsymphony, QIAstat-Dx, NeuMoDx and QIAcuity systems could significantly affect sales of consumables products designed to run on these platforms.
An inability to manage our growth, manage the expansion of our operations, or successfully integrate acquired businesses could adversely affect our business.
Our business has grown in recent years, with total net sales increasing to $2.25 billion in 2021 from $1.42 billion in 2017. We have made a series of acquisitions in recent years, including the acquisitions of NeuMoDx Molecular, Inc. in 2020, assets from Formulatrix, Inc. in 2019 for our entry into digital PCR with QIAcuity, and N-of-One in January 2019 to strengthen our position in bioinformatics. We intend to identify and acquire other businesses in the future that support our strategy to build on our global leadership position in Sample to Insight solutions focused on molecular testing. The successful integration of acquired businesses requires a significant effort and expense across all operational areas.
We continue to make investments to expand our existing business operations. These projects increase our fixed costs, resulting in higher operational costs in the short term that will negatively impact our gross profit and operating income until we more fully utilize the additional capacity of these facilities. In addition, we have invested in establishing and expanding shared service centers in Poland and the Philippines, opening new commercial operations in emerging markets to expand our geographic footprint, and implementing digitization of business processes to increase sales growth and realize operational efficiencies. The expansion of our business and the addition of new personnel may place a strain on our management and operational systems. As we continue to upgrade our operating and financial systems, as well as expand the geographic presence of our operations, we intend to continue to assess the need to reallocate existing resources or hire new employees, as well as increase responsibilities for both existing and new management personnel.
Our future operating results will depend on our ability to continue to implement and improve our research, product development, manufacturing, sales and marketing and customer support programs, enhance our operational and financial control systems, expand, train and manage our employee base, integrate acquired businesses, and effectively address new issues related to our growth as they arise. There can be no assurance that we will be able to manage our recent or any future expansion or acquisitions successfully, and any inability to do so could have a material adverse effect on our results of operations.
Our acquisitions expose us to new risks, and we may not achieve the anticipated benefits of acquisitions of technologies and businesses.
During the past several years, we have acquired and integrated a number of companies through which we have gained access to new technologies, products and businesses that complement our internally developed product lines. In the future, we expect to acquire additional technologies, products or businesses to expand our operations. Acquisitions potentially expose us to new operating and financial risks, including risks associated with the:
•assimilation of new products, technologies, operations, sites and personnel;
•integration and retention of fundamental personnel and technical expertise;
43
•application for and achievement of regulatory approvals or other clearances;
•diversion of resources from our existing products, business and technologies;
•generation of sales;
•implementation and maintenance of uniform standards and effective controls and procedures;
•exposure to cyber security risks or compromise of acquired entities;
•maintenance of relationships with employees, customers and suppliers, and integration of new management personnel;
•issuance of initially dilutive equity securities;
•incurrence or assumption of debt and contingent liabilities;
•amortization or impairment of acquired intangible assets or potential businesses; and
•exposure to liabilities of and claims against acquired entities or personnel, including patent litigation.
Our failure to address the above risks successfully in the future may prevent us from achieving the anticipated benefits from any acquisition in a reasonable time frame, or at all.
Global economic conditions could adversely affect our business, results of operations and financial condition.
Our results of operations could be materially affected by adverse general conditions in the global economy and financial markets. We may experience an adverse impact on our results of operations due to the current geopolitical tensions caused by the Russian invasion of Ukraine. The governments of the European Union, the United States, Japan and other jurisdictions have recently announced the imposition of sanctions on certain industry sectors and parties in Russia and the regions of Donetsk and Luhansk, as well as enhanced export controls on certain products and industries. These and any additional sanctions and export controls, as well as any counter responses by the governments of Russia or other jurisdictions, could adversely affect, directly or indirectly, the levels of government spending or the global supply chain, with negative implications on the availability and prices of raw materials, energy prices, and our customers, as well as the global financial markets.
Further, the global economy recovery from the COVID-19 pandemic will depend on many factors, including the recovery of the supply chain. In the near term we anticipate continued exposures on the supply chain and we have inventory agreements with the majority of our suppliers and we closely monitor stock levels to maintain adequate supplies. In 2021, we have been able to secure a stable supply of chemicals, bioreagents, plastics and packaging materials with only moderate price adjustments. However in electronics, we have seen shortages that needed to be mitigated with long term contacts and high volume agreements, which at times included price increases. These increases are considered in the pricing of our products. We strive to maintain inventories at a sufficient level to ensure reasonable customer service levels, to guard against normal volatility in availability and we continue to work to circumvent shortages and keep pricing competitive. However, there also is a risk of loss of revenue, penalties due to delayed deliveries and currency losses, or other unforeseen costs which would negatively impact margins.
During challenging economic times, access to financing in the global financial markets has also been adversely affected for many businesses. The central banks in the U.S., the UK and the Euro Zone have started to signal a revision of the very accommodating monetary policies. Combined with the high degree of uncertainty in the global financial markets and the economic conditions generally and as a result of the war in Ukraine, this may impact our future performance. Our customers may face internal financing pressures that adversely impact spending decisions or the ability to purchase our products, or that lead to a delay in collection of receivables and thus negatively impact our cash flow. A severe or prolonged economic downturn could result in a variety of risks to our business that would adversely impact our results of operations, including the reduction or delay in planned improvements to healthcare systems in various countries, the reduction of funding for life sciences research, and intensified efforts by governments and healthcare payors regarding cost-containment efforts.
44
Our results of operations could also be negatively impacted by any governmental action or inaction resulting in automatic government spending cuts (sequestration) that may take effect, particularly in terms of federal government funding in the United States. These conditions may add uncertainty to the timing and budget for investment decisions by our customers, particularly researchers, universities, government laboratories and private foundations whose funding is dependent upon grants from government agencies, such as the U.S. National Institutes of Health (NIH) and similar bodies.
As is the case for many businesses, we face the following risks in regard to financial markets:
•severely limited access to financing over an extended period of time, which may affect our ability to fund our growth strategy and could result in delays to capital expenditures, acquisitions or research and development projects;
•failures of currently solvent financial institutions, which may cause losses from our short-term cash investments or our hedging transactions due to a counterparty’s inability to fulfill its payment obligations;
•inability to refinance existing debt at competitive rates, reasonable terms or sufficient amounts; and
•increased volatility or adverse movements in foreign currency exchange rates.
Our global operations may be affected by actions of governments, global or regional economic or public health developments, weather or transportation delays, epidemics or pandemics, natural disasters or other force majeure events (collectively, unforeseen events) which may negatively impact our suppliers, our customers or us.
Our business involves operations around the world. Our primary consumable manufacturing facilities are located in Germany, the U.S., Spain and China. We have established sales subsidiaries in numerous countries and our products are sold through independent distributors serving more than 40 additional countries. Our global footprint exposes us to unforeseen events, such as the December 2019 outbreak of the novel coronavirus (COVID-19) and the resulting global pandemic, or other natural events which may be associated with climate change. Our facilities may be harmed by unforeseen events, and in the event that we or our customers are affected by a disaster, we may experience delays or reductions in sales or production, increased costs, or we may be required to identify alternate suppliers and/or rely on third-party manufacturers.
To the extent that our suppliers are impacted by a natural disaster or other disruption, we may experience periods of reduced production. Any unexpected interruptions in our production capabilities may lead to delayed or lost sales and may adversely affect our results of operations for the affected period.
In addition, to the extent we temporarily shut down any facility following such an unforeseen event, we may experience disruptions in our ability to manufacture or ship products to customers or otherwise operate our business. Many of our products are manufactured in a single location and we may experience adverse effects to the extent these manufacturing operations are disrupted. While our global operations give us the ability to ship product from alternative sites, we may not be able to do so because our customers’ facilities are shut down or the local logistics infrastructure is not functioning, and our sales will suffer.
Damage to our property due to unforeseen events and the disruption of our business may be covered by insurance, but this insurance may not be sufficient to cover all of our potential losses, and such insurance may not continue to be available to us on acceptable terms, or at all. In addition, we may incur incremental costs following an unforeseen event, which will reduce profits and adversely affect our results of operations.
Terrorist attacks and international hostilities and instability in any region could adversely affect our business.
Terrorist attacks, the outbreak of war, or the existence of international hostilities could damage the world economy, adversely affect the global supply chain and adversely affect both our ability to sell our products to certain regions or purchase supplies from such regions. In particular, the warfare, political turmoil or terrorist attacks in Ukraine could adversely impact our financial condition, result of operations and cash flows. In February 2022, Russian troops invaded Ukraine. Although the severity and duration of the ongoing military action are highly unpredictable, the conflict in Ukraine could materially disrupt our operations in Europe and/or increase their costs. In addition, Russia's prior annexation of Crimea, recent recognition of two separatist republics in the Donetsk and Luhansk regions of Ukraine and subsequent military interventions in Ukraine have led to sanctions being levied by the European Union, the United States
45
and other countries against Russia, with additional potential sanctions threatened and/or proposed. Russia's military incursion and the resulting sanctions could adversely affect the global economy and financial markets and thus could affect our business, operations, operating results and financial condition as well as, potentially, the price of our common shares. The extent and duration of the military action, sanctions and resulting market disruptions are impossible to predict, but could be substantial. Any such disruptions caused by Russian military action or resulting sanctions may magnify the impact of other risks described in this Annual Report.
We depend on suppliers for materials used to manufacture our products, and if shipments from these suppliers are delayed or interrupted, we may be unable to manufacture our products.
We buy materials to create our products from a number of suppliers and are not dependent on any one supplier or group of suppliers for our business as a whole. However, key components of certain products, including certain instrumentation and chemicals, are available only from a single source. If supplies from these vendors are delayed or interrupted for any reason, we may not be able to obtain these materials in a timely manner or in sufficient quantity or quality to produce certain products, and this could have an adverse impact on our results of operations.
The ongoing COVID-19 pandemic has resulted in increased global supply chain constraints and disruption to the operations of certain of our suppliers, and we cannot predict the duration or severity of current supply chain issues, including increased freight costs. Supply chain constraints have required, and may continue to require, in certain instances, alternative delivery arrangements and increased costs and could have a material adverse effect on our business and operations.
We rely heavily on air cargo carriers and other overnight logistics services, and shipping delays or interruptions could harm our business.
Our customers in the scientific research markets typically keep only a modest inventory of our products on hand, and consequently require overnight delivery of purchases. As a result, we rely heavily on air cargo carriers and logistic suppliers. If overnight services are suspended or delayed, and other delivery carriers and logistic suppliers cannot provide satisfactory services, customers may suspend a significant amount of their work. The lack of adequate delivery alternatives would have a serious adverse impact on our results of operations.
Changes in tax laws or their application or the termination or reduction of certain government tax incentives, could adversely impact our overall effective tax rate, results of operations or financial flexibility.
Our effective tax rate reflects the benefit of some income being partially exempt from income taxes due to various intercompany operating and financing activities. The benefit also derives from our global operations, where income or loss in some jurisdictions is taxed at rates higher or lower than the Netherlands’ statutory rate of 25%. Changes in tax laws or their application with respect to matters such as changes in tax rates, transfer pricing and income allocation, utilization of tax loss carryforwards, intercompany dividends, controlled corporations, and limitations on the deductibility of interest and foreign related-party expenses, and changes to tax credit mechanisms, could increase our effective tax rate and adversely affect our results of operations and limit our ability to repurchase our common shares, par value EUR 0.01 per share (Common Shares) without experiencing adverse tax consequences. The increased tax burden as a result of changes in law may adversely affect our results of operations. Additionally, if our tax positions are challenged by tax authorities or other governmental bodies, such as the European Commission, we could incur additional tax liabilities, which could have an adverse effect on our results of operations, financial flexibility or cash flow.
We rely on secure communication and information systems and are subject to privacy and data security laws which, in the event of a disruption, breach, violation or failure, could adversely affect our business.
We rely heavily on communications and information systems to conduct our business. In the ordinary course of business, we collect and store sensitive data, including our own intellectual property and other proprietary business information and that of our customers, suppliers and business partners, as well as personally identifiable information of our customers and employees, in our data centers and on our networks or in the cloud. Our operations rely on the secure processing, storage and transmission of confidential and other information on both our own and cloud-based computer systems and networks. We have made significant investments to ensure our employees are aware of cyber security risks facing our company and how to prevent data breaches. We have modernized our cyber security tools, and are continually updating our cyber security processes, in an attempt to keep pace with evolving cyber security risks. In spite of our efforts, we are unable to completely eliminate these risks and occasionally experience minor cyber security incidents. External phishing emails (occurring
46
outside of our computer services) are a growing threat our customers are facing. These emails could lead to the disclosing of intellectual property or personally identifiable information, which could lead to financial harm or reputational damage. While our cyber security team works diligently with our employees around the world, as well as with our customers, to mitigate these threats by helping to identify and analyze phishing emails, we cannot guarantee that sensitive data will not be lost or stolen.
A breach in cyber security due to unauthorized access to our computer systems or misuse could include the misappropriation of assets or sensitive information, the corruption of data or other operational disruption. Failures in our computer systems and networks could be caused by internal or external events, such as incursions by intruders or hackers, computer viruses, failures in hardware or software, or cyber terrorists. Furthermore, there is an increased risk of cyber security attacks by state actors due to the current conflict between Russia and Ukraine. Recently, Russian ransomware gangs have threatened to increase hacking activity against critical infrastructure of any nation or organization that retaliates against Moscow for its invasion of Ukraine. Any such increase in such attacks on our third-party providers or other systems could adversely affect our network systems or other operations. If we do experience a breach or failure of our systems, we could experience potentially significant operational delays resulting from the disruption of systems, loss due to theft or misappropriation of assets or data, or negative impacts from the loss of confidential data or intellectual property. We may face significant liability in the event personal information we maintain is lost or otherwise subject to misuse or other wrongful use, access or disclosure. Further, we could experience negative publicity resulting in reputation or brand damage with customers or partners.
Additionally, we are subject to privacy and data security laws across multiple jurisdictions, including those relating to the storage of health information, which are complex, overlapping and rapidly evolving. In the U.S., individual states regulate requirements and have authority over privacy and personal data protection. For example, the California Consumer Privacy Act of 2018 (the “CCPA”), which took effect on January 1, 2020, imposes expansive new requirements and protections upon the processing of personal data, aimed at giving California consumers more visibility into and control over their personal information. Virginia and Colorado also enacted comprehensive data privacy laws similar to the CCPA, both of which will be effective in 2023. In addition, laws in all 50 U.S. states require businesses to provide notice to consumers whose personal information has been disclosed as a result of a data breach. State laws are changing rapidly and there is discussion in the U.S. Congress of a new comprehensive federal data privacy law to which we would become subject if it is enacted. There are also European privacy laws, such as the General Data Protection Regulation (GDPR) of the European Union, that impose restrictions on the transfer, access, use and disclosure of health and other personal information. We have implemented the requirements set forth by the GDPR, which took effect on May 25, 2018. As our activities continue to evolve and expand, we may be subject to additional laws that impose further restrictions on the transfer, access, use and disclosure of health and other personal information, which may impact our business either directly or indirectly. A failure to comply with applicable privacy or security laws or significant changes in these laws could subject us to costly regulatory action or lawsuits and could adversely impact our reputation, business and future business plans.
We may encounter delays in receipt, or limits in the amount, of reimbursement approvals and public health funding, which may negatively impact our ability to grow revenues in the healthcare market or our profitability.
Changes in the market availability or reimbursement of our diagnostic testing products by insurance providers and health maintenance organizations could also have a significant adverse impact on our results of operations. Third-party payors are often reluctant to reimburse healthcare providers for the use of medical tests that involve new technologies or provide novel diagnostic information. In addition, third-party payors are increasingly limiting reimbursement coverage for medical diagnostic products and, in many instances, are exerting pressure on suppliers to reduce their prices. Since each third-party payor often makes reimbursement decisions on an individual patient basis, obtaining such approvals is a time-consuming and costly process that requires us to provide scientific and clinical data supporting the clinical benefits of each of our products. As a result, there can be no assurance that reimbursement approvals will be obtained, and the process can delay the broad market introduction of new products. If third-party reimbursement is not consistent or financially adequate to cover the cost of our products, this could limit our ability to sell our products or cause us to reduce prices, which would adversely affect our results of operations.
Further, the ability of many of our customers to successfully market their products depends in part on the extent to which reimbursement for the costs of these products is available from governmental health administrations, private health insurers and other organizations. Governmental and other third-party payors are increasingly seeking to contain healthcare costs and to reduce the price of medical products and services. With evolving political realities in the United States, certain sections of the Patient Protection and Affordable Care Act of 2010 (ACA) have not been fully implemented and the direction of healthcare policy is
47
unpredictable. Uncertainty around the future of the ACA, and in particular the impact to reimbursement levels, may lead to uncertainty or delay in the purchasing decisions of our customers, which may in turn negatively impact our product sales. In accordance with the Protecting Access to Medicare Act of 2014 (PAMA), the Centers for Medicare & Medicaid Services calculate Medicare reimbursement rates for certain clinical diagnostic tests using weighted median private payor rates, which are based on rate information reported by applicable laboratories. This new rate methodology means the lower reimbursement rates previously experienced in the field of molecular pathology testing now extend to additional diagnostic testing codes on the Clinical Laboratory Fee Schedule (CLFS). If there are not adequate reimbursement levels, our business and results of operations could be adversely affected.
Reduction in research and development budgets and government funding may result in reduced sales.
Our customers include researchers at pharmaceutical and biotechnology companies, academic institutions, and government and private laboratories. Fluctuations in the research and development budgets of these organizations could have a significant adverse effect on demand for our products. Research and development budgets are affected by changes in available resources, the mergers of pharmaceutical and biotechnology companies, changes in spending priorities and institutional budgetary policies. Our results of operations could be adversely affected by any significant decrease in expenditures for life sciences research and development by pharmaceutical and biotechnology companies, academic institutions, and government and private laboratories. In addition, short-term changes in administrative, regulatory or purchasing-related procedures can create uncertainties or other impediments that can have an adverse impact on our results of operations.
In recent years, the pharmaceutical and biotechnology industries have undergone substantial restructuring and consolidation. Additional mergers or consolidation within the pharmaceutical and biotechnology industries could cause us to lose existing customers and potential future customers, which could have a material adverse impact on our results of operations.
We sell our products to universities, government laboratories and private foundations, whose funding is dependent on grants from government agencies, such as the NIH (National Institutes of Health) in the United States. Although the level of research funding has been increasing in recent years, we cannot ensure that this trend will continue given federal and state budget constraints. Government funding of research and development is subject to the political process, which is inherently unpredictable. Future sales may be adversely affected if our customers delay purchases as a result of uncertainties regarding the approval of government budget proposals. Also, government proposals to reduce or eliminate budgetary deficits have sometimes included reduced allocations to the NIH and government agencies in other countries that fund life sciences research and development activities. A reduction in government funding for the NIH or government research agencies in other countries could have a serious adverse impact on our results of operations.
Competition could reduce our sales.
The markets for most of our products are very competitive. Competitors may have significant advantages in financial, operational, sales and marketing resources as well as experience in research and development. These competitors may have developed, or could develop in the future, new technologies that compete with our products or even render our products obsolete. Some competitors may obtain regulatory approval from the U.S. Food and Drug Administration (FDA) or similar non-U.S. authorities. Our competitors’ development of alternative products offering superior technology, greater cost-effectiveness and/or receiving regulatory approval could have a material adverse effect on our sales and results of operations.
The growth of our business depends in part on the continued conversion of users from competitive products to our sample and assay technologies and other solutions. Lack of conversion could have a material adverse effect on our sales and results of operations.
It can be difficult for users of our products to switch from their current supplier of a particular product, primarily due to the time and expense required to properly integrate new products into their operations. As a result, if we are unable to be the first to develop and supply new products, our competitive position may suffer, resulting in a material adverse effect on our sales and results of operations.
For our commercial clinical assays, we often compete with solutions developed by our laboratory customers, and driving conversion from such laboratory-developed tests (LDTs) to commercial diagnostics assays can be challenging.
48
The time and expense needed to obtain regulatory approval and respond to changes in regulatory requirements could adversely affect our ability to commercially distribute our products and generate sales.
We and our customers operate in a highly regulated environment characterized by frequent changes in the governing regulatory framework. Genetic research activities and products commonly referred to as “genetically engineered” (such as certain food and therapeutic products) are subject to extensive governmental regulation in most developed countries, especially in the major markets for pharmaceutical and diagnostic products such as the European Union, the U.S., China and Japan. In recent years, several highly publicized scientific events (notably in genomic research, gene editing and cloning) have prompted intense public debate on the ethical, philosophical and religious implications of an unlimited expansion in genetic research and the use of products emerging from this research. As a result of this debate, some key countries may increase or establish regulatory barriers, which could adversely affect demand for our products and prevent us from fulfilling our growth expectations. Furthermore, there can be no assurance that any future changes in applicable regulations will not require further expenditures or an alteration, suspension or liquidation of our operations in certain areas, or even in their entirety.
Changes in the existing regulations or adoption of new requirements or policies could adversely affect our ability to sell our approved or cleared products, or to seek approvals for new products in other countries around the world. Sales of certain products now in development may be dependent upon us successfully conducting preclinical studies, clinical trials and other tasks required to gain regulatory approvals and meet other requirements from the FDA in the U.S. and regulatory agencies in other countries. If we are not able to meet the applicable requirements, we will not be able to commercialize our products and tests, which will have a material adverse effect on our business.
Several of our key products and programs are medical devices that are subject to extensive regulation by the FDA under the U.S. Food, Drug and Cosmetic Act. We plan to apply for FDA clearance or approval of additional products in the future. Regulatory agencies in other countries also have medical device and in vitro diagnostic medical devices (IVD) approval requirements that are becoming more extensive. These regulations govern most commercial activities associated with medical devices, including indications for the use of these products as well as other aspects that include product development, testing, manufacturing, labeling, storage, record-keeping, advertising and promotion. Compliance with these regulations is expensive and time-consuming.
Our cleared or approved devices, including diagnostic tests and related equipment, are subject to numerous post-approval requirements. We are subject to inspection and marketing surveillance by the FDA to determine our compliance with regulatory requirements. If the FDA determines that we have failed to comply, it can institute a wide variety of enforcement actions, ranging from warning letters to more severe sanctions such as fines, injunctions and civil penalties, recalls or seizures of our products, operating restrictions, partial suspension or total shutdown of production, denial of our requests for 510(k) clearance or pre-market approval of product candidates, withdrawal of 510(k) clearance or pre-market approval already granted and civil or criminal prosecution. Any enforcement action by the FDA may affect our ability to commercially distribute these products in the U.S.
Some of our products are sold for research purposes in the U.S. We do not promote these products for clinical diagnostic use, and they are labeled “For Research Use Only” (RUO) or “For Molecular Biology Applications.” If the FDA were to disagree with our designation of a product as having RUO status, we could be forced to stop selling it until appropriate regulatory clearance or approval has been obtained.
We are subject to risks associated with patent litigation.
The biotechnology industry has been characterized by extensive litigation regarding patents and other intellectual property rights, particularly since industry competitors gravitate around common technology platforms. We are aware that patents have been applied for and/or issued to third parties claiming technologies for sample and assay technologies that are closely related to those we use. From time to time, we receive inquiries requesting confirmation that we do not infringe patents of third parties. We endeavor to follow developments in this field, and we do not believe that our technologies or products infringe any proprietary rights of third parties. However, there can be no assurance that third parties will not challenge our activities or, if so challenged, that we will prevail. In addition, the patent and proprietary rights of others could require that we alter our products or processes, pay licensing fees or cease certain activities, and there can be no assurance that we will be able to license any technologies that we may require on acceptable terms. In addition, litigation, including proceedings that may be declared by the U.S. Patent and Trademark Office or the International Trade Commission, may be necessary to respond to any assertions of infringement, enforce our patent rights and/or determine the scope and validity of our proprietary rights or those of third parties. Litigation, or threatened litigation, could involve substantial cost, and there can be no assurance that we would prevail in any proceedings.
49
We rely on collaborative commercial relationships to develop and/or market some of our products.
Our long-term business strategy involves entering into strategic alliances as well as marketing and distribution arrangements with academic, corporate and other partners relating to the development, commercialization, marketing and distribution of certain of our existing and potential products. We may be unable to continue to negotiate these collaborative arrangements on acceptable terms, and these relationships also may not be scientifically or commercially successful. In addition, we may be unable to maintain these relationships, and our collaborative partners may pursue or develop competing products or technologies, either on their own or in collaboration with others.
Our Precision Medicine business includes projects with pharmaceutical and biotechnology companies to co-develop companion diagnostics paired with drugs that those companies either market currently or are developing for future use. The success of these co-development programs, including regulatory approvals for the companion diagnostics, depends upon the continued commitment of our partners to the development of their drugs, the outcome of clinical trials for the drugs and diagnostics, and regulatory approvals of the tests and drugs. In addition, the future level of sales for companion diagnostics depends to a high degree on the commercial success of the related medicines for which the tests have been designed. More companion diagnostics would be sold in combination with a widely prescribed drug than one with limited use.
The successful marketing of QIAGEN products, in some cases, depends on commercial relationships such as joint ventures or distributorships, particularly in emerging markets where we partner with local companies to augment our less-established commercial relationships and infrastructure. The continued commitment of our partners to these ventures, as well as the management of the commercial efforts, could influence QIAGEN's sales and profitability in these markets.
We have made investments in and are expanding our business into growth markets, which exposes us to risks.
Our top seven growth markets are Brazil, China, India, South Korea, Mexico, Russia and Turkey, which together accounted in 2021 for approximately 14% of total sales. We expect to continue to focus on expanding our business in these or other fast-growing markets, including those in the Middle East and Asia. In addition to the currency and operating risks described above, our international operations are subject to a variety of risks arising from the economy, political outlook, language and cultural barriers in countries where we have operations or do business. In many of these emerging markets, we may face several risks that are more significant than in other countries in which we have a history of doing business. These risks include economies that may be dependent on only a few products and are therefore subject to significant fluctuations, weak legal systems that may affect our ability to enforce contractual rights, exchange controls, unstable governments, and privatization or other government actions affecting the flow of goods and currency. In the case of Russia, which represented less than 1.0% of consolidated net sales in 2021, our expansion could be limited due to the economic fallout of the recent and ongoing Russian invasion of Ukraine, which has led to widespread economic sanctions on Russia and the devaluation of the Russian ruble. In conducting our business, we move products from one country to another and may provide services in one country from a subsidiary located in another country. Accordingly, we are vulnerable to abrupt changes in customs and tax regimes that could have significant negative impacts on our results of operations.
Sales practices may change and this may limit our pricing flexibility and harm our business.
Some of our customers have developed purchasing initiatives to reduce the number of vendors from which they purchase products in order to lower their supply costs. In some cases, these customers have established agreements with large distributors, which include discounts and direct involvement in the distributor’s purchasing process. These activities may force us to supply large distributors with our products at discounts in order to continue providing products to some customers. For similar reasons, many larger customers, including the U.S. government, have requested, and may request in the future, special pricing arrangements, which can include blanket purchase agreements. These agreements may limit our pricing flexibility, which could harm our business and affect our results of operations. For a limited number of customers, and at the customers' request, we have conducted sales transactions through distribution and other value-added partners. If sales grow through these intermediaries, this could adversely impact our results of operations, in particular our gross profit.
Exchange rate fluctuations may adversely affect our business and operating results.
Given that we currently market our products throughout the world, a significant portion of our business is conducted in currencies other than the U.S. dollar, our reporting currency. As a result, fluctuations in value relative to the U.S. dollar of the currencies in which we conduct our business have caused and will continue to cause foreign currency transaction gains and losses. Foreign currency transaction gains and losses arising from normal business operations are charged
50
against earnings in the period when incurred. Due to the number of currencies involved, the variability of currency exposures and the potential volatility of currency exchange rates, we cannot predict the effects of future exchange rate fluctuations. While we may engage in foreign exchange hedging transactions to manage our foreign currency exposure, there can be no assurance that our hedging strategy will adequately protect our operating results from the effects of future exchange rate fluctuations.
Our success depends on the continued employment of qualified personnel, any of whom we may lose at any time.
Although we have not experienced any difficulties attracting or retaining management and scientific staff, our ability to recruit and retain qualified, skilled employees will continue to be critical to our success. Given the intense competition for experienced scientists and managers among pharmaceutical and biotechnology companies, as well as academic and other research institutions, there can be no assurance that we will be able to attract and retain employees critical to our success on acceptable terms. Initiatives to expand QIAGEN will also require additional employees, including management with expertise in areas such as research and development, manufacturing, digitization, sales and marketing, and the development of existing managers to lead a growing organization. The failure to recruit and retain qualified employees, or develop existing employees, could have a material adverse impact on our results of operations.
Our ability to accurately forecast our results during each quarter may be negatively impacted by the fact that a substantial percentage of our sales may be recorded in the final weeks or days of the quarter.
In the markets we serve, a high percentage of purchase orders are typically received in the final few weeks or days of each quarter. Although this varies from quarter to quarter, many customers make a large portion of their purchase decisions late in each quarter, in particular because they receive new information during this period on their budgets and requirements. Additionally, volatility in the timing of revenue from companion diagnostic partnerships can be difficult to predict. As a result, even late in each quarter, we cannot predict with certainty whether our sales forecasts for the quarter will be achieved.
Historically, we have been able to rely on the overall pattern of customer purchase orders during prior periods to project with reasonable accuracy our anticipated sales for the current or coming quarters. However, if customer purchasing trends during a quarter vary from historical patterns, as may occur with changes in market and economic conditions, our quarterly financial results could deviate significantly from our projections. As a result, our sales forecasts for any given quarter may prove not to be accurate. We also may not have sufficient, timely information to confirm or revise our sales projections for a specific quarter. If we fail to achieve our forecasted sales for a particular quarter, the value of our Common Shares could be significantly affected.
We have a significant amount of debt that may adversely affect our financial condition and flexibility.
We have a significant amount of debt, debt service obligations and restrictive covenants imposed by our lenders. A high level of indebtedness increases the risk that we may default on our debt obligations, and restrictive covenants may prevent us from borrowing additional funds. There is no assurance that we will be able to generate sufficient cash flow to pay the interest on our debt and comply with our debt covenants, or that future working capital, borrowings or equity financing will be available to repay or refinance our debt. If we are unable to generate sufficient cash flow to pay the interest on our debt and comply with our debt covenants, we may have to delay or curtail our research and development programs. The level of our indebtedness could, among other things:
•make it difficult for us to make required payments on our debt;
•make it difficult in the future for us to obtain financing necessary for working capital, capital expenditures, debt service requirements or other purposes;
•limit our flexibility in planning for, or reacting to, changes in our business and the industry in which we compete; and
•make us more vulnerable in the event of a downturn in our business.
The London Interbank Offered Rate (LIBOR) has historically been widely used as a reference for setting the interest rate on loans globally. LIBOR is the subject of recent national, international and other regulatory guidance and proposals for reform or discontinuation. In particular, on July 27, 2017, the Chief Executive of the U.K. Financial Conduct Authority, which regulates LIBOR, announced that it will no longer persuade or compel banks to submit rates for the calculation of
51
LIBOR after 2021. Subsequently, the ICE Benchmark Administration announced its plan to extend the date most U.S. dollar LIBOR values would cease being computed to June 30, 2023. Following the end of 2021, LIBOR ceased being a widely used benchmark interest rate. Presently, we do hold debt and derivative instruments that use LIBOR. While we expect to settle these instruments in October 2022 and certain agreements do contain language for the determination of interest rates in the event the LIBOR rate is not available, if changes to these agreements are required, we could be negatively impacted by any newly determined alternative benchmark.
Our business may require substantial additional capital, which we may not be able to obtain on terms acceptable to us, if at all.
Our future capital requirements and level of expenses will depend on numerous factors, including the costs associated with:
•marketing, sales and customer support efforts;
•research and development activities;
•expansion of our facilities;
•consummation of possible future acquisitions of technologies, products or businesses;
•demand for our products and services;
•repayment or refinancing of debt; and
•payments in connection with our hedging activities and/or taxes.
We currently anticipate that our short-term capital requirements will be satisfied by cash flow from our operations and/or cash on hand. As of December 31, 2021, we had outstanding long-term debt of approximately $1.9 billion, of which $845.7 million was current.
If at some point in time our existing resources should be insufficient to fund our activities, we may need to raise funds through public or private debt or equity financings. The funds for the refinancing of existing liabilities or for the ongoing funding of our business may not be available or, if available, not on terms acceptable to us. If adequate funds are not available, we may be required to reduce or delay expenditures for research and development, production, marketing, capital expenditures and/or acquisitions, which could have a material adverse effect on our business and results of operations. To the extent that additional capital is raised through the sale of equity or convertible securities, the issuance of any securities could result in dilution to our shareholders.
The accounting for the cash convertible notes we have issued will result in recognition of interest expense significantly greater than the stated interest rate of the notes and may result in volatility to our Consolidated Statements of Income.
We will settle any conversions of the Cash Convertible Notes described under the heading “Other Factors Affecting Liquidity and Capital Resources” elsewhere in this Annual Report, entirely in cash. Accordingly, the conversion option that is part of the Cash Convertible Notes will be accounted for as a derivative pursuant to accounting standards relating to derivative instruments and hedging activities. Refer to Note 26 "Financial Risk Factors and Use of Derivative Financial Instruments" and Note 16 "Financial Debts", of the Notes to Consolidated Financial Statements. In general, this resulted in an initial valuation of the conversion option separate from the debt component of the Cash Convertible Notes, resulting in an original issue discount. The original issue discount will be accreted to interest expense over the term of the Cash Convertible Notes, which will result in an effective interest rate reported in our financial statements significantly in excess of the stated coupon rates of the Cash Convertible Notes. This accounting treatment will reduce our earnings. For each financial statement period after the issuance of the Cash Convertible Notes, a gain (or loss) will be reported in our financial statements to the extent the valuation of the conversion option changes from the previous period. The Call Options issued in connection with the Cash Convertible Notes will also be accounted for as derivative instruments, substantially offsetting the gain (or loss) associated with changes to the valuation of the conversion option. This may result in increased volatility to our results of operations.
52
The cash convertible note hedge and warrant transactions we entered into in connection with the issuance of our Cash Convertible Notes may not provide the benefits we anticipate, and may have a dilutive effect on our common stock.
Concurrently with the issuance of the Cash Convertible Notes, we entered into Call Options and issued Warrants. We entered into the Call Options with the expectation that they would offset potential cash payments by us in excess of the principal amount of the Cash Convertible Notes upon conversion of the Cash Convertible Notes. In the event that the hedge counterparties fail to deliver potential cash payments to us, as required under the Call Options, we would not receive the benefit of such transaction. Separately, we also issued Warrants. The Warrants could separately have a dilutive effect to the extent that the market price per share of our common stock, as measured under the terms of the Warrants, exceeds the strike price of the Warrants.
An impairment of goodwill and intangible assets could reduce our earnings.
At December 31, 2021, our consolidated balance sheet reflected approximately $2.4 billion of goodwill and approximately $803.2 million of intangible assets. Goodwill is recorded when the purchase price of a business exceeds the fair value of the tangible and separately measurable intangible net assets. International Financial Reporting Standards (IFRS) require us to test goodwill for impairment on an annual basis or when events or circumstances occur indicating that goodwill might be impaired. Long-lived assets, such as intangible assets with finite useful lives, are reviewed for impairment whenever events or changes in circumstances indicate that the carrying amount may not be recoverable. The impairment review often cannot be done at the level of the individual asset and it must instead be applied to a group of assets. For the purpose of our annual goodwill impairment testing based on the current circumstances of how we manage our business, this group of assets is the Company as a whole. If we determine that any of our goodwill or intangible assets were impaired, we will be required to take an immediate charge to earnings and our results of operations could be adversely affected.
Our strategic equity investments may result in losses.
We have made, and may continue to make, strategic investments in businesses as opportunities arise. We periodically review the carrying value of these investments for impairment, considering factors that include the most recent stock transactions, book values from the most recent financial statements, and forecasts and expectations of the investee. The results of these valuations may fluctuate due to market conditions and other conditions over which we have no control.
Estimating the fair value of non-marketable equity investments in life science companies is inherently subjective. If actual events differ from our assumptions and unfavorable fluctuations in the valuations of the investments are indicated, we could be required to write down the investment. This could result in future charges on our earnings that could materially adversely affect our results of operations. It is uncertain whether or not we will realize any long-term benefits from these strategic investments.
Doing business internationally creates certain risks.
Our business involves operations in several countries outside of the U.S. Our consumable manufacturing facilities are located in Germany, China, Spain and the U.S. We source raw materials and subcomponents to manufacture our products from different countries. We have established sales subsidiaries in many countries. In addition, our products are sold through independent distributors serving more than 40 other countries. Conducting and launching operations on an international scale requires close coordination of activities across multiple jurisdictions and time zones and consumes significant management resources. We have invested heavily in computerized information systems in order to manage more efficiently the widely dispersed components of our operations. If we fail to coordinate and manage these activities effectively, our business and results of operations will be adversely affected.
Our operations are subject to other risks inherent in international business activities, such as the general economic and public health conditions in the countries in which we operate, trade restrictions and changes in tariffs, longer accounts receivable payment cycles in certain countries, overlap of different tax structures, unexpected changes in regulatory requirements, and compliance with a variety of foreign laws and regulations. Other risks associated with international operations include import and export licensing requirements, exchange controls and changes in freight rates, as may occur as a result of rising energy costs. Further, any misuse or other wrongful use of our products could expose us to negative publicity resulting in reputation or brand damage with customers or partners. As a result of these conditions, an inability to successfully manage our international operations could have a material adverse impact on our business and results of operations.
53
Unethical behavior and non-compliance with laws by our sales representatives, other employees, consultants, commercial partners or distributors or employees could seriously harm our business.
Our business in countries with a history of corruption and transactions with foreign governments increases the risks associated with our international activities. Based on our international operations, we are subject to the U.S. Foreign Corrupt Practices Act (FCPA), the U.K. Bribery Act and other laws that prohibit improper payments or offers of payments to foreign governments and their officials and political parties by business entities for the purpose of obtaining or retaining business. We have operations, agreements with third parties and sales in countries known to experience corruption. Further international expansion may involve increased exposure to such practices. Our activities in these countries and others create risks of unauthorized payments or offers of payments, non-compliance with laws, or other unethical behavior by any of our employees, consultants, sales agents or distributors, that could be in violation of various laws, including the FCPA, even though these parties are not always subject to our control. Our policy is to implement safeguards to discourage these or other unethical practices by our employees and distributors including online and in-person employee trainings, periodic internal audits and standard reviews of our distributors. However, our existing safeguards and any future improvements may not prove to be effective, and our employees, consultants, sales agents or distributors may engage in conduct for which we might be held responsible. Violations of the FCPA and other laws may result in criminal or civil sanctions, which could be severe, and we may be subject to other liabilities, which could negatively affect our business, results of operations and financial condition.
Real or perceived defects in or misuse of our products could adversely affect our results of operations, growth prospects and reputation.
We currently market our products in 130 countries. Due to the size and breadth of our operations, we may not always be able to track the use of our products by the end users. If our products are misused or are perceived to be misused, this could adversely affect our reputation and our customers’ willingness to buy from us, and adversely affect market acceptance or perception of our products.
Many of our customers, especially those in law enforcement and government who use our products for forensic testing, human identification, food testing or other purposes, use our products in applications that are of public interest or critical to their businesses or missions and may thus have a lower risk tolerance to defects in our products than to defects in other, less critical, products. A defect in or misuse of any of our products by our law enforcement customers could lead to interference with the administration of justice, for example by corrupting forensic evidence. Any defects or misuse, real or perceived, cause us to lose sales opportunities, increase our service costs, incur replacement costs, lose customers or subject us to liability for damages and divert our resources from other tasks, any one of which could materially and adversely affect our business, results of operations and financial condition. In addition, our products could be perceived as ineffective for reasons outside of our control.
Additionally, if any of our customers, government or otherwise, use or are perceived to use our products in a manner that is unethical, unlawful or inconsistent with our values, this may damage our reputation and results of operations. We strive to ensure that our products are used only in ethical and lawful ways, but we cannot provide any assurance that we will not be subject to claims from third parties alleging that our products were misused. Any allegations of misuse by our customers or third parties may damage our reputation, even if we took no part in the misuse or take immediate action to sever ties with such customers.
We believe that our brand and reputation are critical to driving our business. Building our brand will depend largely on our ability to continue to provide top-tier service, including high quality products at appropriate price points, which we may not do successfully. Negative reviews or publicity about our products or business, especially on media outlets, could harm our reputation and diminish our ability to make additional sales, which would adversely affect our business, financial condition, and results of operations.
We depend on patents and proprietary rights that may fail to protect our business.
Our success depends to a large extent on our ability to develop proprietary products and technologies and to establish and protect our patent and trademark rights in these products and technologies. As of December 31, 2021, we owned 338 issued patents in the United States, 273 issued patents in Germany and 1,832 issued patents in other major industrialized countries. In addition, as of December 31, 2021, we had 425 pending patent applications, and we intend to file applications for additional patents as our products and technologies are developed. The patent positions of technology-based companies involve complex legal and factual questions and may be uncertain, and the laws governing the scope of patent coverage and the periods of enforceability of patent protection are subject to change. In addition, patent applications in the United States are maintained in secrecy until patents issue, and publication of discoveries in the scientific or patent literature tends to lag behind actual discoveries by several months. Therefore, no assurance can be given that patents will issue from any
54
patent applications that we own or license, or if patents do issue, that the claims allowed will be sufficiently broad to protect our technology. In addition, no assurance can be given that any issued patents that we own or license will not be challenged, invalidated or circumvented, or that the rights granted thereunder will provide us competitive advantages. Further, as issued patents expire, we may lose some competitive advantage as others develop competing products and as a result, we may lose revenue.
Some of our products incorporate patents and technologies that are licensed from third parties and for certain products, these in-licensed patents together with other patents provide us with a competitive advantage. These licenses impose various commercialization, sublicensing and other obligations on us. Our failure to comply with these requirements could result in the conversion of the applicable license from being exclusive to non-exclusive or, in some cases, termination of the license, and as a result, we may lose some competitive advantage and experience a loss of revenue.
We also rely on trade secrets and proprietary know-how, which we seek to protect through confidentiality agreements with our employees and consultants. There can be no assurance that any confidentiality agreements that we have with our employees, consultants, outside scientific collaborators and sponsored researchers and other advisors will provide meaningful protection for our trade secrets or adequate remedies in the event of unauthorized use or disclosure of such information. There also can be no assurance that our trade secrets will not otherwise become known or be independently developed by competitors.
We currently engage in, and may continue to engage in, collaborations with academic researchers and institutions. There can be no assurance that under the terms of such collaborations, third parties will not acquire rights in certain inventions developed during the course of these collaborations.
Our business exposes us to potential product liability.
The marketing and sale of our products and services for certain applications entail a potential risk of product liability. Although we are not currently subject to any material product liability claims, product liability claims may be brought against us in the future. Further, there can be no assurance that our products will not be included in unethical, illegal or inappropriate research or applications, which may in turn put us at risk of litigation. We carry product liability insurance coverage, which is limited in scope and amount. There can be no assurance that we will be able to maintain this insurance at a reasonable cost and on reasonable terms, or that this insurance will be adequate to protect us against any or all potential claims or losses.
We are subject to various laws and regulations generally applicable to businesses in the different jurisdictions in which we operate, including laws and regulations applicable to the handling and disposal of hazardous substances. The risk of accidental contamination or injury from these materials cannot be completely eliminated. In the event of such an accident, we could be held liable for any damages that result, and any such liability could have a material adverse impact on us.
Our operating results may vary significantly from period to period and this may affect the market price of our Common Shares.
Our operating results may vary significantly from quarter to quarter, and also year to year, since they are dependent upon a broad range of factors that include demand for our products, the level and timing of customer research budgets and commercialization efforts, the timing of government funding budgets of our customers, the timing of our research and development activities and related regulatory approvals, the impact of sales and marketing expenses, restructuring activities, introduction of new products by us or our competitors, competitive market conditions, exchange rate fluctuations and general economic conditions. Our expense levels are based in part on our expectations as to future sales trends. As a result, sales and earnings may vary significantly from quarter to quarter or from year to year, and actual sales and earnings results in any one period will not necessarily be indicative of results to be anticipated in subsequent periods. Our results may also fail to meet or exceed the expectations of securities analysts or investors, which could cause a decline in the market price of our Common Shares.
Our holding company structure makes us dependent on the operations of our subsidiaries.
QIAGEN N.V. is incorporated under Dutch law as a public limited liability company (naamloze vennootschap), and is organized as a holding company. Currently, the material assets are the outstanding shares of the QIAGEN subsidiaries, intercompany receivables and other financial assets such as cash, short-term investments and derivative instruments. As a result, QIAGEN N.V. is dependent upon payments, dividends and distributions from the subsidiaries for funds to pay operating and other expenses as well as to pay future cash dividends or distributions, if any, to holders of our Common Shares. Dividends or distributions by subsidiaries in a currency other than the U.S. dollar may result in a loss upon a subsequent conversion into U.S. dollars.
55
Our Common Shares may have a volatile public trading price.
The market price of our Common Shares since our initial public offering in September 1996 has increased significantly and been highly volatile. Since January 10, 2018, our shares have been listed on the New York Stock Exchange (NYSE). Before that, our shares were listed on the NASDAQ through January 9, 2018. In the last two years, the price of our Common Shares has ranged from a high of $59.00 to a low of $32.97. On the Frankfurt Stock Exchange our Common Shares have ranged from a high of €51.56 to a low of €29.55 during the last two years. In addition to overall stock market fluctuations, factors that may have a significant impact on the price of our Common Shares include:
•announcements of technological innovations or the introduction of new products by us or our competitors;
•developments in our relationships with collaborative partners;
•quarterly variations in our operating results or those of our peer companies;
•changes in government regulations, tax laws or patent laws;
•developments in patent or other intellectual property rights;
•developments in government spending budgets for life sciences-related research;
•general market conditions relating to the diagnostics, applied testing, pharmaceutical and biotechnology industries; and
•impact from foreign exchange rates.
The stock market has from time to time experienced extreme price and trading volume fluctuations that have particularly affected the market for technology-based companies. These fluctuations have not necessarily been related to the operating performance of these companies. These broad market fluctuations may adversely affect the market price of our Common Shares.
Holders of our Common Shares should not expect to receive dividend income.
QIAGEN has not paid an annual dividend since its inception, and does not intend to implement one at this time. At the same time, in January 2017 we completed a synthetic share repurchase that combined a direct capital repayment with a reverse stock split. Although we do not anticipate paying any cash dividends on a regular basis, the distribution of any cash dividends through another synthetic share repurchase in a currency other than the U.S. dollar will be subject to the risk of foreign currency transaction losses. Investors should not invest in our Common Shares if they are seeking dividend income; the only return that may be realized through investing in our Common Shares would be through an appreciation in the share price.
Holders of our Common Shares may not benefit from future stock repurchase programs.
QIAGEN has conducted share repurchase programs in the past through open-market transactions. The purpose of our share repurchases has been to hold the shares in treasury in order to satisfy obligations from exchangeable debt instruments, warrants and/or employee share-based remuneration plans and thus to reduce dilution to existing holders of our Common Shares. In 2019, we began net share withholding on the vesting of stock-based awards and as a result, fewer shares are issued than the number of awards outstanding. We may decide not to continue such programs in the future, our covenants with lenders may limit our ability to use available cash to do so, or the market price of our Common Shares may make such repurchases less desirable. In any of these cases, holders of our Common Shares may suffer dilution from conversion of our indebtedness or issuance of shares pursuant to employee remuneration plans that would otherwise be at least partially offset by repurchased shares.
Future sales and issuances of our Common Shares could adversely affect our stock price.
Any future sale or issuance of a substantial number of our Common Shares in the public market, or any perception that a sale may occur, could adversely affect the market price of our Common Shares. Under Dutch law, a company can issue shares up to its authorized share capital provided for in its Articles of
56
Association. Pursuant to our Articles of Association, our authorized share capital amounts to EUR 9.0 million, which is divided into 410.0 million common shares, 40.0 million financing preference shares and 450.0 million preference shares, with all shares having a EUR 0.01 par value. As of December 31, 2021, a total of approximately 227.1 million Common Shares were outstanding along with approximately 4.0 million additional shares reserved for issuance upon exercise or release of outstanding stock options and awards, of which 18.0 thousand were vested. A total of approximately 12.9 million Common Shares are reserved and available for issuances under our stock plans as of December 31, 2021, including the shares subject to outstanding stock options and awards. The majority of our outstanding Common Shares may be sold without restriction, except shares held by our affiliates, which are subject to certain limitations on resale. Additionally, convertible debt issued in 2020 and Warrants issued in connection with the Cash Convertible Notes cover an aggregate of 26.8 million underlying shares of common stock or up to a maximum of 42.5 million shares, subject to customary adjustments under certain circumstances.
Shareholders who are United States residents could be subject to unfavorable tax treatment.
We may be classified as a “passive foreign investment company,” or a PFIC, for U.S. federal income tax purposes if certain tests are met. Our treatment as a PFIC could result in a reduction in the after-tax return to holders of Common Shares and would likely cause a reduction in the value of these shares. If we were determined to be a PFIC for U.S. federal income tax purposes, highly complex rules would apply to our U.S. shareholders. We would be considered a PFIC with respect to a U.S. shareholder if for any taxable year in which the U.S. shareholder held the Common Shares, either (i) 75% or more of our gross income for the taxable year is passive income; or (ii) the average value of our assets (during the taxable year) which produce or are held for the production of passive income is at least 50% of the average value of all assets for such year. Based on our income, assets and activities, we do not believe that we were a PFIC for U.S. federal income tax purposes for our taxable year ended December 31, 2021, and do not expect to be a PFIC for the current taxable year or any future taxable year. No assurances can be made, however, that the Internal Revenue Service will not challenge this position or that we will not subsequently become a PFIC.
Provisions of our Articles of Association and Dutch law and an option we have granted may make it difficult to replace or remove management and may inhibit or delay a takeover.
Our Articles of Association (Articles) provide that our shareholders may only suspend or dismiss our Managing Directors and Supervisory Directors against their wishes with a vote of two-thirds of the votes cast if such votes represent more than 50% of our issued share capital. If the proposal was made by the joint meeting of the Supervisory Board and the Managing Board, a simple majority is sufficient. The Articles also provide that if the members of our Supervisory Board and our Managing Board have been nominated by the joint meeting of the Supervisory Board and Managing Board, shareholders may only overrule this nomination with a vote of two-thirds of the votes cast if such votes represent more than 50% of our issued share capital.
Certain other provisions of our Articles allow us, under certain circumstances, to prevent a third party from obtaining a majority of the voting control of our Common Shares through the issuance of Preference Shares. Pursuant to our Articles and the resolution adopted by our General Meeting of Shareholders, our Supervisory Board is entitled to issue Preference Shares in case of an intended takeover of our company by (i) any person who alone or with one or more other persons, directly or indirectly, have acquired or given notice of an intent to acquire (beneficial) ownership of an equity stake which in aggregate equals 20% or more of our share capital then outstanding or (ii) an “adverse person” as determined by the Supervisory Board. If the Supervisory Board opposes an intended takeover and authorizes the issuance of Preference Shares, the bidder may withdraw its bid or enter into negotiations with the Managing Board and/or Supervisory Board and agree on a higher bid price for our Shares.
In 2004, we granted an option to the Stichting Preferente Aandelen QIAGEN, or the Foundation (Stichting), subject to the conditions described in the paragraph above, which allows the Foundation to acquire Preference Shares from us. The option enables the Foundation to acquire such number of Preference Shares as equals the number of our outstanding Common Shares at the time of the relevant exercise of the option, less one Preference Share. When exercising the option and exercising its voting rights on these Preference Shares, the Foundation must act in our interest and the interests of our stakeholders. The purpose of the Foundation option is to prevent or delay a change of control that would not be in the best interests of our stakeholders. An important restriction on the Foundation’s ability to prevent or delay a change of control is that a public offer must be announced by a third party before it can issue (preference or other) protective shares that would enable the Foundation to exercise rights to 30% or more of the voting rights without an obligation to make a mandatory offer for all shares held by the remaining shareholders. In addition, the holding period for these shares by the Foundation is restricted to two years, and this protective stake must fall below the 30% voting rights threshold before the two-year period ends.
57
Note Regarding Forward-Looking Statements and Risk Factors
Our future operating results may be affected by various risk factors, many of which are beyond our control. Certain statements included in this Annual Report and the documents incorporated herein by reference may be forward-looking statements within the meaning of Section 27A of the U.S. Securities Act of 1933, as amended, and Section 21E of the U.S. Securities Exchange Act of 1934, as amended, including statements regarding potential future net sales, gross profit, net income and liquidity. These statements can be identified by the use of forward-looking terminology such as “believe,” “hope,” “plan,” “intend,” “seek,” “may,” “will,” “could,” “should,” “would,” “expect,” “anticipate,” “estimate,” “continue” or other similar words. Reference is made in particular to the description of our plans and objectives for future operations, assumptions underlying such plans and objectives, and other forward-looking statements. Such statements are based on management’s current expectations and are subject to a number of factors and uncertainties that could cause actual results to differ materially from those described in the forward-looking statements. We caution investors that there can be no assurance that actual results or business conditions will not differ materially from those projected or suggested in such forward-looking statements as a result of various factors. Factors which could cause such results to differ materially from those described in the forward-looking statements include those set forth in the risk factors below. As a result, our future success involves a high degree of risk. When considering forward-looking statements, you should keep in mind that the risk factors could cause our actual results to differ significantly from those contained in any forward-looking statement.
Significant direct and indirect shareholdings
The following table sets forth certain information concerning the ownership of Common Shares of each holder of greater than 5% ownership. None of these holders have any different voting rights than other holders of our Common Shares.
| Shares Beneficially Owned | ||||||||||||||||||||
| Name and Country of Residence | Number | Percent Ownership (1) | ||||||||||||||||||
| BlackRock, Inc., United States and United Kingdom | 31,135,519 | (2) | 13.71 | % | ||||||||||||||||
| Massachusetts Financial Services Company, United States and Canada | 20,456,644 | (3) | 9.01 | % | ||||||||||||||||
(1)The percentage ownership was calculated based on 227,073,961 Common Shares outstanding as of December 31, 2021.
(2)Of the 31,135,519 shares attributed to BlackRock, Inc., it has sole voting power over 29,090,983 and sole dispositive power over all 31,135,519 shares. This information is based solely on the Schedule 13G filed by BlackRock, Inc. with the Securities and Exchange Commission on January 27, 2022, which reported ownership as of December 31, 2021.
(3)Of the 20,456,644 shares attributed to Massachusetts Financial Services Company, it has sole voting power over 17,332,849 and sole dispositive power over all 20,456,644 shares. This information is based solely on the Schedule 13G filed by Massachusetts Financial Services Company with the Securities and Exchange Commission on February 2, 2022, which reported ownership as of December 31, 2021.
Our common stock is traded on the New York Stock Exchange in the United States and on the Prime Standard Segment of the Frankfurt Stock Exchange in Germany. A significant portion of our shares are held electronically in the account of a stockbroker, therefore we generally have no way of determining who our shareholders are, their geographical location or how many shares a particular shareholder owns. As of January 31, 2022, there were 71 shareholders of record of our Common Shares.
Holders of any securities with special control rights
Not applicable.
58
System of control of any employee share scheme where the control rights are not exercised directly by the employees
Not applicable.
Restrictions on voting rights
At the General Meeting, each share shall confer the right to cast one vote, unless otherwise provided by law or our Articles. No votes may be cast in respect of shares that we or our subsidiaries hold, or by usufructuaries and pledgees. All shareholders and other persons entitled to vote at General Meetings are entitled to attend General Meetings, to address the meeting and to vote. They must notify the Managing Board in writing of their intention to be present or represented not later than on the third day prior to the day of the meeting, unless the Managing Board permits notification within a shorter period of time prior to any such meeting. Subject to certain exceptions, resolutions may be passed by a simple majority of the votes cast.
Agreements between shareholders which are known to the Company and may result in restrictions on the transfer of securities and/or voting rights
Not applicable.
Rules governing the appointment and replacement of board members and the amendment of the articles of association
Supervisory Directors and Managing Directors are appointed annually for the period beginning on the date following the Annual General Meeting up to and including the date of the Annual General Meeting held in the following fiscal year.
Managing Directors shall be appointed by the General Meeting upon the joint meeting of the Supervisory Board and the Managing Board (Joint Meeting), having made a binding nomination for each vacancy. However, the General Meeting may at all times overrule the binding nature of such a nomination by a resolution adopted by at least a two-thirds majority of the votes cast, if such majority represents more than half the issued share capital. This is different from the provisions of many American corporate statutes, including the Delaware General Corporation Law, which give the directors of a corporation greater authority in choosing the executive officers of a corporation. Under our Articles, the General Meeting may suspend or dismiss a managing director at any time. The Supervisory Board shall also at all times be entitled to suspend (but not to dismiss) a Managing Director. The Articles provide that the Supervisory Board may adopt management rules governing the internal organization of the Managing Board.
The Supervisory Directors shall be appointed by the General Meeting upon the Joint Meeting having made a binding nomination for each vacancy. If during a financial year a vacancy occurs in the Supervisory Board, the Supervisory Board may appoint a Supervisory Director who will cease to hold office at the next Annual General Meeting. Under Dutch law, in the event that there is a conflict of interest between a Supervisory Director and us and our business on a certain matter, that Supervisory Director shall not participate in the discussions and voting on that matter. Under the Dutch Code, a Supervisory Director should report any conflict of interest or potential conflict of interest in a transaction that is of material significance to the Company and/or to such Supervisory Director to the Chair of the Supervisory Board without delay. The Supervisory Board should decide, outside the presence of the Supervisory Director concerned, whether there is a conflict of interest. If all Supervisory Directors have a conflict of interest, the relevant resolution shall be adopted by the General Meeting. Decisions to enter into transactions under which a Supervisory Director would have a conflict of interest that are of material significance to QIAGEN and/or to the Supervisory Director concerned, require the approval of the Supervisory Board.
The Nomination & ESG Committee is primarily responsible for the preparation of selection criteria and appointment procedures for members of the Supervisory Board and Managing Board as well as the periodic evaluation of the scope and composition of the Managing Board and the Supervisory Board, including the profile of the Supervisory Board. Additionally, the Nomination & ESG Committee periodically evaluates the functioning of individual members of the Managing Board and Supervisory Board, reporting these results to our Supervisory Board. It also proposes the (re-)appointments of members of our Managing Board and Supervisory Board and supervises the policy of our Managing Board in relation to selection and appointment criteria for senior management.
A resolution of the General Meeting to amend our Articles, dissolve QIAGEN, issue shares or grant rights to subscribe for shares or limit or exclude any pre-emptive rights to which shareholders shall be entitled is valid only if proposed to the General Meeting by the Supervisory Board.
59
A resolution of the General Meeting to amend our Articles is further only valid if the complete proposal has been made available for inspection by the shareholders and the other persons entitled to attend General Meetings at our offices as from the day of notice convening such meeting until the end of the meeting. A resolution to amend our Articles to change the rights attached to the shares of a specific class requires the approval of the relevant class meeting.
Powers of board members and in particular the power to issue or buy back shares
The Managing Board manages QIAGEN and is responsible for defining and achieving QIAGEN’s aims, strategy, policies and results. The Managing Board is also responsible for complying with all relevant legislation and regulations as well as for managing the risks associated with the business activities and the financing of QIAGEN. It reports related developments to and discusses the internal risk management and control systems with the Supervisory Board and the Audit Committee. The Managing Board is accountable for the performance of its duties to the Supervisory Board and the General Meeting of Shareholders (General Meeting). The Managing Board provides the Supervisory Board with timely information necessary for the exercise of the duties of the Supervisory Board. In discharging its duties, the Managing Board takes into account the interests of QIAGEN, its enterprises and all parties involved in QIAGEN, including shareholders and other stakeholders.
The members of our Supervisory Board have the powers assigned to them by Dutch law and the Articles. The Supervisory Board assists the Managing Board by providing advice relating to the business activities of QIAGEN. In discharging its duties, the Supervisory Board takes into account the interests of QIAGEN, its enterprise and all parties involved in QIAGEN, including shareholders and other stakeholders. In particular, the Supervisory Board has the authority to (i) issue common shares up to its presently authorized capital of 410 million, (ii) issue Financing Preference Shares up to its presently authorized capital of 40 million (iii) grant rights to subscribe for such common shares and Financing Preference Shares and (iv) exclude or limit the pre-emptive rights of existing shareholders relating to up to 50% of the number of common shares to be issued or rights to subscribe for common shares.
We may acquire our own shares, subject to certain provisions of Dutch law and our Articles, if (i) shareholders’ equity less the payment required to make the acquisition does not fall below the sum of paid-up and called-up capital and any reserves required by Dutch law or the Articles and (ii) we and our subsidiaries would not thereafter hold shares with an aggregate nominal value exceeding half of our issued share capital. Shares that we hold in our own capital or shares held by one of our subsidiaries may not be voted. The Managing Board, subject to the approval of the Supervisory Board, may affect our acquisition of shares in our own capital. Our acquisitions of shares in our own capital may only take place if the General Meeting has granted to the Managing Board the authority to effect such acquisitions. Such authority may apply for a maximum period of 5 years and must specify the number of shares that may be acquired, the manner in which shares may be acquired and the price limits within which shares may be acquired. Dutch corporate law allows for the authorization of the Managing Board to purchase a number of shares equal to up to 50% of the Company’s issued share capital on the date of the acquisition. On June 19, 2018, the General Meeting resolved to extend the authorization of the Managing Board in such manner that the Managing Board may cause us to acquire shares in our own share capital, for an 18-month period beginning June 19, 2018 until December 21, 2019, without limitation at a price between one Euro cent (Euro 0.01) and one hundred ten percent (110%) of the price for such shares on the New York Stock Exchange or, as applicable, the Frankfurt Stock Exchange, for the five trading days prior to the day of purchase, or, with respect to Preference and Finance Preference shares, against a price between one Euro cent (Euro 0.01) and three times the issuance price and in accordance with applicable provisions of Dutch law and our Articles.
Significant agreements to which the Company is a party and which take effect after or terminate upon a change of control of the Company following a takeover bid
Certain other provisions of our Articles allow us, under certain circumstances, to prevent a third party from obtaining a majority of the voting control of our Common Shares through the issuance of Preference Shares. Pursuant to our Articles and the resolution adopted by our General Meeting of Shareholders, our Supervisory Board is entitled to issue Preference Shares in case of an intended takeover of our company by (i) any person who alone or with one or more other persons, directly or indirectly, have acquired or given notice of an intent to acquire (beneficial) ownership of an equity stake which in aggregate equals 20% or more of our share capital then outstanding or (ii) an “adverse person” as determined by the Supervisory Board. If the Supervisory Board opposes an intended takeover and authorizes the issuance of Preference Shares, the bidder may withdraw its bid or enter into negotiations with the Managing Board and/or Supervisory Board and agree on a higher bid price for our Shares.
60
In 2004 (as amended in 2008), we granted an option to the Stichting Preferente Aandelen QIAGEN (the “Foundation” (Stichting)), whereby the exercise of the option by the Foundation is subject to the conditions described in the paragraph above and which option allows the Foundation to acquire preference shares from us. The option enables the Foundation to acquire such number of preference shares as equals the number of our outstanding common shares at the time of the relevant exercise of the right less one share. When exercising the option and exercising its voting rights on such shares, the Foundation must act in our interest and the interests of our stakeholders. The purpose of the Foundation option is to prevent or delay a change of control that would not be in the best interests of us and our stakeholders. An important restriction on the Foundation’s ability to prevent or delay a change of control is that issuing (preference or other) protective shares enabling the Foundation to exercise 30% or more of the voting rights without the obligation to make a mandatory offer for all shares held by the remaining shareholders, is only allowed after a public offer has been announced by a third party. In addition, the holding of such a block of shares by the Foundation is restricted to two years and as a consequence, the size of the protective stake will need to be decreased below the 30% voting rights threshold before the two year period lapses.
We adopted the QIAGEN N.V. Amended and Restated 2005 Stock Plan (the 2005 Plan) which was approved by our shareholders on June 14, 2005. It expired by its terms in April 2015, at which time no further awards will be able to be granted under the 2005 Plan. On June 25, 2014, our shareholders approved the QIAGEN N.V. 2014 Stock Plan (the 2014 Plan), which replaced the 2005 Plan in April 2015. An aggregate of 16.7 million Common Shares were reserved for issuance pursuant to the 2014 Stock Plan, subject to certain antidilution adjustments. We issue Treasury Shares to satisfy option exercises and award releases and had approximately 14.4 million Common Shares reserved and available for issuance under the 2005 and 2014 Plans at December 31, 2021.
Pursuant to the 2005 and 2014 Plans, stock rights, which include options to purchase our Common Shares, stock grants and stock-based awards, may be granted to employees and consultants of QIAGEN and its subsidiaries and to Supervisory Directors. The vesting and exercisability of certain stock rights will be accelerated in the event of a change of control, as defined in the agreements, under the 2005 and 2014 Plans.
Certain of our employment contracts contain provisions which guarantee the payments of certain amounts in the event of a change in control, as defined in the agreements, or if the executive is terminated for reasons other than cause, as defined in the agreements. At December 31, 2021, the commitment under these agreements totaled $9.2 million (2020: $21.2 million).
Agreements between the Company and its board members or employees providing for compensation if they resign or are made redundant without valid reason or if their employment ceases because of a takeover bid
The members of the Managing Board are appointed annually by the General Meeting of Shareholders based on the nomination of the Joint Meeting. Further, the members of the Managing Board have entered into employment agreements with QIAGEN N.V. and other QIAGEN affiliates. The term of these agreements varies for each Managing Board member due to individual arrangements and goes beyond the one year term of appointment by the General Meeting of Shareholders. These agreements cannot be terminated without cause and, absent such cause, have to be fulfilled during their stated term. These agreements contain provisions which guarantee the payments of certain amounts in the event of a change in control, as defined in the agreements. There are no arrangements for any extra compensation in case of resignation or redundancy.
The members of the Supervisory Board are also appointed annually by the General Meeting of Shareholders based on the nomination of the Joint Meeting. There are no additional employments in place and there are no arrangements for any extra compensation in case of resignation or redundancy. The General Meeting determines the remuneration of the members of the Supervisory Board.
Reporting in accordance with Directive 2004/25/EC of the European Parliament and of the Council of April 21, 2004 on takeover bids
Not applicable
61
Structure of our capital, including securities which are not admitted to trading on a regulated market in a Member State of the European Union
The authorized classes of our shares consist of common shares, Financing Preference Shares and Preference Shares. No Financing Preference Shares or Preference Shares have been issued.
As of December 31, 2021, a total of approximately 227.1 million Common Shares were outstanding along with approximately 4.0 million additional shares reserved for issuance upon exercise or release of outstanding stock options and awards, of which 18.0 thousand were vested. A total of approximately 12.9 million Common Shares are reserved and available for issuances under our stock plans as of December 31, 2021, including the shares subject to outstanding stock options and awards. Additionally, convertible debt issued in 2020 and Warrants issued as part of the Call Spread Overlay discussed further in Note 16 "Financial Debts" cover an aggregate of 26.8 million underlying shares of common stock or up to a maximum of 42.5 million shares, subject to customary adjustments under certain circumstances.
Common Shares - Restrictions on the transfer of securities
Common Shares are issued in registered form only. No share certificates are issued for Common Shares and Common Shares are registered in either our shareholders register with American Stock Transfer & Trust Company, or New York Transfer Agent, our transfer agent and registrar in New York, or our shareholder register with TMF Fund Services B.V., Westblaak 89, NL-3012 KG Rotterdam.
The transfer of registered shares requires that a written instrument of transfer and the written acknowledgment of such transfer by us or the New York Transfer Agent (in our name).
62
Outlook
QIAGEN Perspectives for 2022
Against the backdrop of record sales in 2021, we expect demand for our non-COVID product portfolio to continue to grow during 2022, while taking a cautious view on expectations for a significant decline in COVID-19 test sales for the year. The growth in our non-COVID portfolio is expected to be driven by opportunities in the research environment amid increases in national governmental funding programs as well as a resumption in regular clinical testing for molecular diagnostics. Investments have been made to strengthen our portfolio including manufacturing upscaling projects and within research and development for menu expansion of our key platforms. These are expected to support the transition of our installed base of instruments and systems into non-COVID applications. At the same time, QIAGEN remains prepared to continue supporting the global response to the pandemic.
We plan to focus investments in our five pillars of growth with the aim to secure mid-term growth trends for these products. We are seeking to secure our leadership positions in sample technologies and for the QuantiFERON franchise, while seeking to gain market share in the three other pillars involving the QIAcuity digital PCR instruments, as well as the NeuMoDx integrated PCR systems for clinical diagnostics and the QIAstat-Dx syndromic testing platform.
Global Economic Perspectives for 2022
In January 2022, the International Monetary Fund and the World Bank both projected the world economy would grow about 4% on an annual basis.
However, this forecast has been called into doubt in light of the war in Ukraine, and the impact it has had on energy prices, global supply chains and other areas of the global economy. These impacts have combined to cause high inflation rates in many countries across the globe including rates at 40-year highs in the United States as announced by the Bureau of Labor and Statistics in April 2022. We now believe global economic growth is expected to be well below this forecast amid a risk that some regions could begin to face recessionary conditions.
Additionally, the risk continues that COVID-19 variants could emerge that prolong the pandemic and related economic disruptions. The current global economic forecast assumes that vaccination rates continue to improve worldwide and therapies become more effective during the course of 2022. Continued disruptions in the global supply chain as a result of COVID-19 and other factors could negatively impact results of operations for QIAGEN and other companies. Economic growth tends to benefit our performance, while downturn can limit spending by customers. Uncertain geopolitical conditions, including the recent and ongoing Russian invasion of Ukraine, sanctions, and other potential impacts on this region’s economic environment and currencies, may cause demand for our products and services to be volatile, cause changes in our customers' buying patterns, interrupt our ability to supply products to this or other regions or limit the access of our customers to financial resources and ability to satisfy obligations to us. In 2021, net sales in Russia represented less than 1% of consolidated net sales. Currency exchange rates also positively or negatively affect QIAGEN’s results as these are reported in U.S. dollars.
Industry Perspectives for 2022
The demand for testing for active SARS-CoV-2 infections using PCR and antigen products is expected to decline to a lower base level in the next phase of the COVID-19 pandemic recovery. Viral immune-response monitoring using T-cell and antibody testing may increase along with population monitoring to stop new infection hotspots and multiplex PCR tests to discern between COVID-19 and other respiratory illnesses. PCR testing volumes are expected to remain fairly robust in 2022. Elective procedures and laboratory volumes for non-COVID issues are likely to begin to normalize.
The pandemic has accelerated the demand for genomic insights, and this has accelerated the transition from basic research into applications in medicine and other fields, delivering ever-greater value for patients and other users. As innovation drives market expansion, QIAGEN has strong product portfolios to capture opportunities in growing areas.
63
The COVID-19 pandemic has drawn attention to the fact that molecular testing can also evaluate and monitor patients for cancer, infectious diseases and other conditions. Molecular medicine is migrating from research-based institutions to hospitals and reference laboratories in need of quick, accurate results, increasing the demand for standardized tests and automated workflows. Customers are embracing diverse technologies based on different settings and needs – from low-throughput to high-throughput, and from single-target or multiplex PCR analysis to in-depth next-generation sequencing. Customers increasingly want easy-to-use technologies that can also be used outside of a laboratory.
Life science researchers in academia and the pharmaceutical industry rely on novel sample and analytical technologies to explore disease pathways and biomarkers, and also to guide drug development and clinical trials. Genomic insights from molecular biology laboratories are increasingly leading to new drug approvals. Applications of molecular testing also are expanding into public safety fields such as forensics and environmental monitoring.
Venlo, the Netherlands, April 15, 2022
QIAGEN N.V.
Thierry Bernard Roland Sackers
Chief Executive Officer Chief Financial Officer
64
Corporate Governance
Corporate Governance Report
We recognize the importance of clear and straightforward rules on corporate governance and, where appropriate, have adapted our internal organization and processes to these rules. This section provides an overview of QIAGEN’s corporate governance structure and includes details of the information required under the Dutch Corporate Governance Code (the Dutch Code). The Dutch Code is applicable to QIAGEN N.V. (in the following also referred to as the “Company” and "QIAGEN"), as it is a publicly listed company incorporated under the laws of The Netherlands with a registered seat in Venlo, The Netherlands. The Dutch Code contains the principles and concrete provisions which the persons involved in a listed company (including Managing Board members and Supervisory Board members) and stakeholders should observe in relation to one another.
Our corporate governance practices generally derive from the provisions of the Dutch Civil Code and the Dutch Code. Further, due to our listing on the New York Stock Exchange in the U.S., the Managing Board and the Supervisory Board of QIAGEN N.V. declared their intention to disclose in QIAGEN’s Annual Reports the Company’s compliance with the corporate governance practices followed by U.S. companies under the New York Stock Exchange listing standards or state the deviations recorded in the period. A brief summary is presented below under the section Dutch Corporate Governance Code - Comply or explain.
Corporate Structure
QIAGEN is a ‘Naamloze Vennootschap,’ or N.V., a Dutch limited liability company similar to a corporation in the United States. QIAGEN has a two-tier board structure. QIAGEN is managed by a Managing Board consisting of executive management acting under the supervision of a Supervisory Board (non-executives), similar to a Board of Directors in a U.S. corporation. It is in the interest of QIAGEN and all its stakeholders that each Board performs its functions appropriately and that there is a clear division of responsibilities between the Managing Board, the Supervisory Board, the general meeting of shareholders (General Meeting) and the external auditor in a well-functioning system of checks and balances.
65
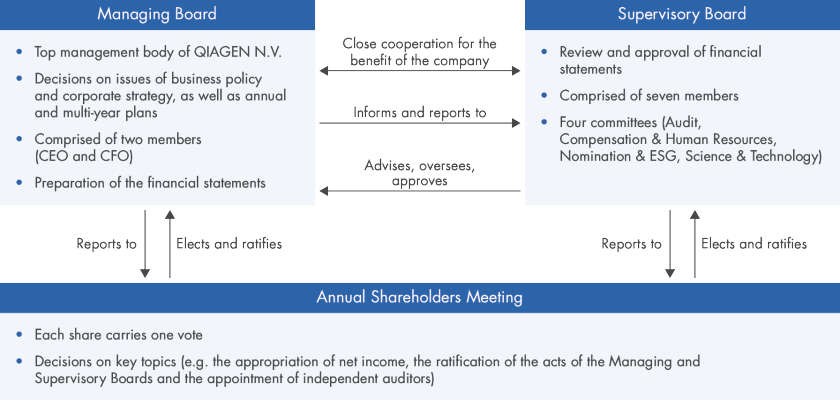
Managing Board
General
The Managing Board manages QIAGEN and is responsible for defining and achieving QIAGEN’s aims, strategy, policies and results and is expected to act in a sustainable manner by focusing on long-term value creation in the performance of their work. The Managing Board is also responsible for complying with all relevant legislation and regulations as well as for managing the risks associated with the business activities and the financing of QIAGEN. It reports related developments to and discusses the internal risk management and control systems with the Supervisory Board and the Audit Committee. Under Dutch Law, QIAGEN's Managing Board, which has two members, has chosen to work with an Executive Committee and is accountable for the actions and decisions of the Executive Committee, which is comprised of the CEO, the CFO and certain experienced leaders who have responsibilities for the operational management of the Company and the achievement of its objectives and results. The Managing Board has ultimate responsibility for the Company’s external reporting and is answerable to shareholders of the Company at the Annual General Meeting of Shareholders. Pursuant to the two-tier corporate structure, the Managing Board is required to render account for the performance of its duties to the Supervisory Board and the General Meeting of Shareholders (General Meeting). The Managing Board provides the Supervisory Board with timely information necessary for the exercise of the duties of the Supervisory Board. In discharging its duties, the Managing Board takes into account the interests of QIAGEN, its enterprises and all parties involved in QIAGEN, including shareholders and other stakeholders.
66
Composition and Appointment
The Managing Board consists of one or more members as determined by the Supervisory Board. The members of the Managing Board are appointed by the General Meeting upon the joint meeting of the Supervisory Board and the Managing Board (the Joint Meeting) having made a binding nomination for each vacancy. However, the General Meeting may at all times overrule the binding nature of such a nomination by a resolution adopted by at least a two-thirds majority of the votes cast, if such majority represents more than half of the issued share capital. Managing Directors are appointed annually for the period beginning on the date following the Annual General Meeting up to and including the date of the Annual General Meeting held in the following year.
Members of the Managing Board may be suspended and dismissed by the General Meeting by a resolution adopted by a two-thirds majority of the votes cast, if such majority represents more than half of the issued share capital, unless the proposal was made by the Joint Meeting, in which case a simple majority of votes cast is sufficient. Furthermore, the Supervisory Board may at any time suspend (but not dismiss) a member of the Managing Board.
Managing Directors:
Our Managing Directors for the year ended December 31, 2021 and their ages as of January 31, 2022, are as follows:
 | Thierry Bernard | ||||
| Chief Executive Officer | |||||
| Gender: Male | |||||
Thierry Bernard, 57, joined QIAGEN in February 2015 to lead QIAGEN’s growing presence in Molecular Diagnostics, the application of Sample to Insight solutions for molecular testing in human healthcare. He was named Chief Executive Officer in March 2020, after having previously served in this role on an interim basis. Mr. Bernard previously worked at bioMérieux SA, where he served in roles of increasing responsibility for 15 years, most recently as Corporate Vice President, Global Commercial Operations, Investor Relations and the Greater China Region. Prior to joining bioMérieux, he served in management roles in multiple international environments. Mr. Bernard was appointed in 2020 as a member of the Board of Directors of T2 BioSystems, Inc., a publicly listed company in the U.S. Mr. Bernard has earned degrees from Sciences Po (Paris), Harvard Business School, London School of Economics, and the College of Europe and is a member of French Foreign Trade Advisors.
 | Roland Sackers | ||||
| Chief Financial Officer | |||||
| Gender: Male | |||||
Roland Sackers, 53, joined QIAGEN in 1999 as Vice President of Finance and has been Chief Financial Officer since 2004. In 2006, Mr. Sackers became a member of the Managing Board. Between 1995 and 1999, he served as an auditor with Arthur Andersen Wirtschaftsprüfungsgesellschaft Steuerberatungsgesellschaft. Mr. Sackers earned his Diplom-Kaufmann from the University of Münster, Germany. Mr. Sackers was appointed in 2021 as Vice Chair of the Supervisory Board of Evotec SE, a publicly listed company in Germany and has been a member of the Supervisory Board and Chair of the Audit Committee since 2019. He is also a board member of the industry association BIO Deutschland in Germany.
67
Conflicts of Interest, Loans or Similar Benefits
Resolutions to enter into transactions under which members of the Managing Board could have a conflict of interest with QIAGEN, and which are of material significance to QIAGEN and/or the relevant member of the Managing Board, require the approval of the Supervisory Board. QIAGEN has not entered into any such transactions in 2021. No credit, loans or similar benefits were granted to members of the Managing Board. Additionally, the Managing Board members did not receive any benefits from third parties that were either promised or granted in view of their position as members of the Managing Board.
Supervisory Board
General
The Supervisory Board supervises the policies of the Managing Board, the general course of QIAGEN’s affairs and strategy and the business enterprises which we operate. The Supervisory Board assists the Managing Board by providing advice relating to the business activities of QIAGEN. In 2021, the Supervisory Board had five regular meetings that were held with the attendance of the Managing Board, while certain agenda items were discussed exclusively between the Supervisory Board members. In discharging its duties, the Supervisory Board takes into account the interests of QIAGEN, its enterprise and all parties involved in QIAGEN, including shareholders and other stakeholders. The Supervisory Board is responsible for the quality of its own performance. In this respect, the Supervisory Board conducts a self-evaluation on an annual basis. Our Supervisory Board has specified matters requiring its approval, including decisions and actions which would fundamentally change the company’s assets, financial position or results of operations. The Supervisory Board has appointed an Audit Committee, a Compensation & Human Resources Committee, a Nomination & ESG Committee and a Science & Technology Committee from among its members and can appoint other committees as deemed beneficial. The Supervisory Board has approved charters pursuant to which each of the committees operates.
Composition and Appointment
The Supervisory Board consists of at least three members, or a larger number as determined by the Joint Meeting. Members of the Supervisory Board are appointed by the General Meeting upon the Joint Meeting having made a binding nomination for each vacancy. However, the General Meeting may at all times overrule the binding nature of such a nomination by a resolution adopted by at least a two-thirds majority of the votes cast, if such majority represents more than half of the issued share capital.
The Supervisory Board shall be composed in a way that enables it to carry out its duties properly and enables its members to act critically and independently of one another and of the Managing Board and any particular interests. To that effect, the Supervisory Board has adopted a profile of its size and composition that takes into account the nature of our business, our activities and the desired diversity, expertise and background of the members of the Supervisory Board. The current profile of the Supervisory Board can be found on our website (www.qiagen.com). The Supervisory Board has appointed a chair from its members who has the duties assigned by the Articles of Association and the Dutch Code.
Members of the Supervisory Board are appointed annually for the period beginning on the date following the General Meeting up to and including the date of the General Meeting held in the following year. Members of the Supervisory Board may be suspended and dismissed by the General Meeting by a resolution adopted by a two-thirds majority of the votes cast, if such majority represents more than half of the issued share capital, unless the proposal was made by the Joint Meeting in which case a simple majority of votes cast is sufficient.
68
Supervisory Directors:
The following is a brief summary of the background of each of the Supervisory Directors. References to “QIAGEN” and the “Company” in relation to periods prior to April 29, 1996 mean QIAGEN GmbH and its consolidated subsidiaries:
 | Lawrence A. Rosen | ||||
| Committees: Audit, Nomination & ESG (Chair), Compensation & Human Resources | |||||
| Gender: Male | |||||
Lawrence A. Rosen, 64, joined QIAGEN as a Supervisory Director in 2013 and has served as Chair of the Supervisory Board since 2020. As a member of the Board of Management and Chief Financial Officer of Deutsche Post DHL from 2009 to 2016, he was responsible for controlling, corporate accounting and reporting, investor relations, corporate finance, corporate internal audit and security, taxes, as well as the group’s global business services. Prior to this role, Mr. Rosen served as Chief Financial Officer of Fresenius Medical Care AG & Co. KGaA in Germany from 2003 to 2009 and earlier served as Senior Vice President and Treasurer for Aventis SA in Strasbourg, France. From 1984 to 2000, he held various positions of increasing responsibility at the Aventis predecessor companies Hoechst AG and American Hoechst/Hoechst Celanese, Inc. He currently serves on the Supervisory Boards of Deutsch Post DHL Group and Lanxess AG, both publicly listed companies in Germany. Mr. Rosen holds a bachelor's degree in economics from the State University of New York and an M.B.A. from the University of Michigan.
 | Dr. Metin Colpan | ||||
| Committees: Science & Technology (Chair), Nomination & ESG | |||||
| Gender: Male | |||||
Dr. Metin Colpan, 67, is a co-founder of QIAGEN, its first Chief Executive Officer and a Managing Director from 1985 to 2003. Dr. Colpan has been a member of the Supervisory Board since 2004 and has served as Chair of the Science & Technology Committee since 2014, and as a member of the Nomination & ESG Committee since 2015. Dr. Colpan obtained his Ph.D. and Master of Science degree in Organic Chemistry and Chemical Engineering from the Darmstadt Institute of Technology in 1983. Prior to founding QIAGEN, Dr. Colpan was an Assistant Investigator at the Institute for Biophysics at the University of Düsseldorf. Dr. Colpan has extensive experience in sample technologies, and in particular in the separation and purification of nucleic acids, and has many patents in the field. Dr. Colpan also serves as a Supervisory Board member of CGR GmbH in Mettmann, Germany and Heilpflanzenwohl AG in Baar, Germany.
69
 | Thomas Ebeling | ||||
| Committee: Nomination & ESG | |||||
| Gender: Male | |||||
Thomas Ebeling, 62, joined the Supervisory Board in 2021. He has been an advisor in recent years to various businesses after having served as the CEO of the publicly listed German media group ProSiebenSat.1 Media from 2009 to 2018. Prior to that, he worked for the global healthcare company Novartis from 1997 to 2008, including roles as CEO of Novartis Pharmaceuticals and as CEO of Novartis Consumer Health. Since beginning his career in 1987, Mr. Ebeling held various positions in marketing and sales in the consumer goods industry before joining Novartis. He previously served on the Supervisory Boards of Bayer AG in Germany and Lonza AG of Switzerland. Mr. Ebeling has a degree in psychology from the University of Hamburg.
 | Dr. Toralf Haag | ||||
| Committee: Audit (Chair and Financial Expert) | |||||
| Gender: Male | |||||
Dr. Toralf Haag, 55, joined the Supervisory Board in 2021. He has served since October 2018 as Chairman of the Corporate Board of Management at Voith GmbH & Co. KGaA in Germany, a global technology company with more than EUR 4 billion in annual sales and over 19,000 employees. Before joining Voith in October 2016 as Chief Financial Officer, Dr. Haag served for more than 11 years as CFO and Member of the Executive Committee of Lonza Group AG. He began his career in 1994 as the personal assistant to the CEO of Thyssen Handelsunion AG after earning a degree in Business Administration from the University of Augsburg and a Ph.D. at the University of Kiel.
 | Prof. Dr. Ross L. Levine | ||||
| Committee: Science & Technology | |||||
| Gender: Male | |||||
Professor Dr. Ross Levine, 50, joined the Supervisory Board in 2016. He is a physician-scientist focused on researching and treating blood and bone marrow cancers as the Laurence Joseph Dineen Chair in Leukemia Research, Chief of Molecular Cancer Medicine, and an Attending Physician at Memorial Sloan Kettering Cancer Center, as well as Professor of Medicine at Weill Cornell Medical College. He leads a research lab investigating genetics and targeted therapies in myeloid malignancies, and is interested in application of next-generation sequencing technology in the practice of medicine in hematologic cancers. He trained in internal medicine at Massachusetts General Hospital and in hematology-oncology at the Dana-Farber Cancer Institute, earning board certification in these specialties. He received his M.D. from the Johns Hopkins University School of Medicine, and his A.B. degree from Harvard College.
70
 | Prof. Dr. Elaine Mardis | ||||
| Committees: Compensation & Human Resources, Science & Technology | |||||
| Gender: Female | |||||
Professor Dr. Elaine Mardis, 59, joined the Supervisory Board in 2014. Dr. Mardis is the Co-Executive Director of the Institute for Genomic Medicine at Nationwide Children’s Hospital in Columbus, Ohio, and is Professor of Pediatrics at the Ohio State University College of Medicine. Dr. Mardis has research interests in the application of genomic technologies to improve our understanding of human disease, and toward improving the precision of medical diagnosis, prognosis and treatment. Dr. Mardis is the former Robert E. and Louise F. Dunn Distinguished Professor of Medicine at Washington University School of Medicine in St. Louis, Missouri, where she was on the faculty for 22 years. As Co-Director of the McDonnell Genome Institute, she devised methods and automation that contributed to the Human Genome Project, and has since played key roles in the 1000 Genomes Project, The Cancer Genome Atlas, and the Pediatric Cancer Genome Project. Prior to joining the Washington University faculty, she was a senior research scientist at BioRad Laboratories in Hercules, California. Dr. Mardis currently serves as a member of the Board of Directors of Singular Genomics Systems, Inc., a publicly listed company in the U.S. Additionally, she is an elected member of the U.S. National Academy of Medicine. She is also a past President of the American Association for Cancer Research, and has scientific advisory roles at PACT Pharma, LLC and Scorpion Therapeutics, LLC. She received her Bachelor of Science degree in Zoology in 1984, and her Ph.D. in Chemistry and Biochemistry in 1989, both from the University of Oklahoma.
 | Elizabeth E. Tallett | ||||
| Committees: Audit, Compensation & Human Resources (Chair), Nomination & ESG | |||||
| Gender: Female | |||||
Elizabeth E. Tallett, 72, joined the Supervisory Board in 2011. Ms. Tallett was a Principal of Hunter Partners, LLC, a management company for early to mid-stage pharmaceutical, biotechnology and medical device companies, from 2002 until February 2015. Ms. Tallett continues to consult with early stage healthcare companies. Her senior management experience includes roles as President and CEO of Transcell Technologies Inc., President of Centocor Pharmaceuticals, member of the Parke-Davis Executive Committee, and Director of Worldwide Strategic Planning for Warner-Lambert Company. Additionally, Ms. Tallett is also a member of the Board of Directors of Anthem, Inc. (where she is currently Chair) and Moderna, Inc., both publicly listed companies in the U.S., and previously served on the boards of Meredith Corporation and Principal Financial Group, Inc. Ms. Tallett was a founding board member of the Biotechnology Council of New Jersey and is Chair of the Trustees of Solebury School in Pennsylvania. Ms. Tallett graduated from Nottingham University, England with dual bachelor's degrees with honors in mathematics and economics.
Stéphane Bancel joined the Supervisory Board in 2013 and did not stand for reappointment at the Annual General Meeting in 2021. He was a member of the Compensation & Human Resources Committee from 2013 through July 2020, and a member of the Audit Committee from 2014 until the end of June 2021. Mr. Bancel serves as Chief Executive Officer of the U.S. biotechnology company Moderna, Inc.
71
Conflicts of Interest, Loans or Similar Benefits
Resolutions to enter into transactions under which members of the Supervisory Board could have a conflict of interest with QIAGEN, and which are of material significance to QIAGEN and/or the relevant member of the Supervisory Board, must be reported and require the approval of the Supervisory Board plenum. A Supervisory Director that has a personal conflict of interest will not participate in the decision making process regarding such item. In 2021, neither QIAGEN nor its Supervisory Board members have entered into any such transactions. No credit, loans or similar benefits were granted to members of the Supervisory Board. Additionally, the Supervisory Board Members did not receive any benefits from third parties that were either promised or granted in view of their position as members of the Supervisory Board.
Committees of the Supervisory Board
The Supervisory Board has established among its members the following four committees:
•Audit Committee;
•Compensation & Human Resources Committee;
•Nomination & ESG Committee; and
•Science & Technology Committee.
The Supervisory Board can establish other committees as deemed beneficial. Charters have been approved by the Supervisory Board under which each of the committees operates. These charters are published on our website at www.qiagen.com.
The committees were comprised of the following members in 2021:
| Supervisory Board Member | Audit Committee | Compensation & Human Resources Committee | Nomination & ESG Committee | Science & Technology Committee | ||||||||||||||||||||||
| Lawrence A. Rosen | • | • | • (Chair) | |||||||||||||||||||||||
| Dr. Metin Colpan | • | • (Chair) | ||||||||||||||||||||||||
| Thomas Ebeling | • | |||||||||||||||||||||||||
| Dr. Toralf Haag | • (Chair) | |||||||||||||||||||||||||
| Dr. Ross L. Levine | • | |||||||||||||||||||||||||
| Dr. Elaine Mardis | • | • | ||||||||||||||||||||||||
| Elizabeth E. Tallett | • | • (Chair) | • | |||||||||||||||||||||||
We believe that all of our Supervisory Board members meet the independence requirements set forth in the Dutch Corporate Governance Code (the Dutch Code). We further believe that all Supervisory Board members qualify as independent under the independence standards set forth in the New York Stock Exchange (NYSE) Listed Company Manual. Pursuant to the NYSE rules, a majority of the Supervisory Directors must qualify as independent, as defined in the Rules.
Audit Committee
The Audit Committee consists of three members appointed annually by the Supervisory Board for one-year terms and meets at least quarterly. We believe that all members of this Committee meet the independence requirements as set forth in Rule 10A-3 of the Securities Exchange Act of 1934, as amended, and the New York Stock Exchange Listed Company Manual. The Board has designated Dr. Haag as an “Audit Committee Financial Expert” as that term is defined in the U.S. Securities and Exchange Commission rules adopted pursuant to the Sarbanes-Oxley Act of 2002 and as referred to in the Dutch Decree on Audit Committees (Besluit instelling audit committee). The Committee performs a self-evaluation of its activities on an annual basis.
72
The Committee's primary duties and responsibilities include, among other things, to serve as an independent and objective party to monitor QIAGEN's accounting and financial reporting process, control and compliance systems and internal risk management, including cyber security. This Committee also is directly responsible for proposing the external auditor to the Supervisory Board, which then proposes the appointment of the external auditor to the Annual General Meeting. Further, this Committee is responsible for the compensation and oversight of QIAGEN’s external auditor and for providing an open avenue of communication among the external auditor as well as the Managing Board and the Supervisory Board. Our Internal Audit department operates under the direct responsibility of the Audit Committee. Further, this Committee is responsible for establishing procedures to allow for the confidential and or anonymous submission by employees of concerns, including the receipt, retention and treatment of submissions received regarding accounting, internal accounting controls, or auditing matters.
The Audit Committee discusses, among other matters:
•Our financial accounting and reporting principles and policies, and the adequacy of our internal accounting, financial and operating controls and procedures with the external auditor and management;
•considers and approves any recommendations regarding changes to our accounting policies and processes;
•reviews with management and the external auditor our quarterly earnings reports prior to their public release;
•reviews the quarterly and annual reports (reported on Forms 6-K and 20-F) to be furnished to or filed with the U.S. Securities and Exchange Commission and the Deutsche Boerse in Germany; and
•reviews major risk exposures (including cyber security), pre-approves related-party transactions between the Company and members of the Supervisory Board or Managing Board, and reviews any legal matter including compliance topics that could have a significant impact on the financial statements.
The Audit Committee met seven times in 2021 and also met with the external auditor excluding members of the Managing Board in December 2021.
Compensation & Human Resources Committee
The Compensation & Human Resources Committee consists of three members appointed annually by the Supervisory Board for one-year terms. Its primary duties and responsibilities include, among other things:
•preparation of a proposal to the Supervisory Board regarding the Remuneration Policy for the Managing Board and Supervisory Board and proposal for adoption by shareholders at the General Meeting;
•preparation of a proposal concerning the individual compensation for Managing Board members to be adopted by the Supervisory Board; and
•preparation of the Remuneration Report that outlines compensation for the Managing Board members and Supervisory Board members to be adopted by the Supervisory Board, and submitted to the Annual General Meeting for an advisory vote in accordance with Dutch law. The Remuneration Report outlines the implementation of the Remuneration Policies for the most recent year.
Additionally, the Compensation & Human Resources Committee is responsible for:
•review and approval of all equity-based compensation;
•review and approval of the annual salaries, bonuses and other benefits of the Executive Committee; and
•review of general policies relating to employee compensation and benefits.
73
This Committee engages external consultants to ensure that the overall remuneration levels are benchmarked regularly, against a selected group of companies and key markets in which QIAGEN operates. The Compensation & Human Resources Committee met five times in 2021.
Nomination & ESG Committee
The Nomination & ESG Committee consists of four members appointed by the Supervisory Board annually for one-year terms. Its primarily responsibilities include, among other things:
•preparing selection criteria and appointment procedures for members of the Supervisory Board and Managing Board; and
•conducting periodic evaluations of QIAGEN's environmental, social and governance (ESG) policies and related public disclosures.
Additionally, this Committee periodically evaluates the scope and composition of the Managing Board and the Supervisory Board, including the profile of the Supervisory Board as well as the functioning of individual members of Boards, and reporting these results to our Supervisory Board. It also proposes the (re-)appointment of members of the Managing Board and Supervisory Board, and supervises the policy of the Managing Board in relation to the selection and appointment criteria for senior management.
The Nomination & ESG committee met three times in 2021.
Science & Technology Committee
The Science & Technology Committee consists of three members appointed annually by the Supervisory Board for one-year terms. The Science & Technology Committee works with the Scientific Advisory Board which was established in 2021 to provide early evaluation of market and technology developments that could have an influence on QIAGEN’s development and positioning in the Life Sciences and Molecular Diagnostics. The Committee's primary responsibilities include, among other things:
•reviewing and monitoring research and development projects, programs, budgets, infrastructure management; and
•overseeing the management risks related to our portfolio and information technology platforms.
The Science & Technology Committee provides understanding, clarification and validation of the fundamental technical basis of our business in order to enable the Supervisory Board to make informed, strategic business decisions and vote on related matters. Additionally, the Committee guides the Managing Board to ensure that QIAGEN can develop and leverage powerful, world-class science to create value for our stakeholders, including shareholders. The Science & Technology Committee met four times in 2021.
Diversity within the Managing Board and Supervisory Board
QIAGEN is not subject to statutory requirements regarding gender diversity within the Managing Board and Supervisory Board. However, in nominating candidates for these boards, QIAGEN supports the trend toward higher participation of women. QIAGEN feels that gender is only one part of diversity and strives for a diverse composition in the Managing Board and Supervisory Board also in terms of other factors such as age, nationality, public reputation, industry or academic background. QIAGEN is committed to expanding diversity while pursuing individuals for these boards with a unique blend of scientific and commercial expertise and experience that will contribute to the future success of its business. Management development programs support the career advancement of leaders regardless of gender and other factors. As a result a number of women are in key leadership roles, particularly in leading commercial and operational positions around the world. In line with this commitment, QIAGEN's Nomination & ESG committee will continue selecting future members of the Managing Board and Supervisory Board with due observance of its aim to have a diverse leadership team on the basis of gender, but also on the basis of age, wide ranging experience, backgrounds, skills, knowledge and insight. This all without compromising QIAGEN's commitment to hiring the best individuals
74
for those positions. More information about diversity within the Board other than gender, can be found in below under the section Dutch Corporate Governance Code - Comply or explain.
Additional Information
Shareholders
Our shareholders exercise their voting rights through Annual and Extraordinary General Meetings. Resolutions of the General Meeting are adopted by an absolute majority of votes cast, unless a different majority of votes or quorum is required by Dutch law or the Articles of Association. Each common share confers the right to cast one vote.
Furthermore, the Managing Board, or where appropriate, the Supervisory Board, shall provide all shareholders and other parties in the financial markets with equal and simultaneous information about matters that may influence QIAGEN's share price.
QIAGEN is required to convene an Annual General Meeting in the Netherlands no later than six months following the end of each year. The agenda for the Annual General Meeting must contain certain matters as specified in QIAGEN's Articles of Association and under Dutch law, including, among other things, the adoption of QIAGEN's annual financial statements.
Additional Extraordinary General Meetings may be convened at any time by the Managing Board, the Supervisory Board or by one or more shareholders jointly representing at least 40% of QIAGEN's issued share capital. Furthermore, one or more shareholders, who jointly represent at least 10% of QIAGEN's issued share capital may, on their application, be authorized by the district court judge having applications for interim relief, to convene a General Meeting. Shareholders are entitled to propose items for the agenda of the General Meeting provided that they hold at least 3% of the issued share capital. Proposals for agenda items for the General Meeting must be submitted at least 60 days prior to the meeting date. The notice convening a General Meeting, accompanied by the agenda, shall be sent no later than 42 days prior to the meeting. QIAGEN informs the General Meeting by means of explanatory notes to the agenda, providing all facts and circumstances relevant to the proposed resolutions.
Pursuant to the Dutch Code, all transactions between the company and legal or natural persons who hold at least 10% of the shares in the company shall be agreed on terms that are customary in the sector concerned. Decisions to enter into transactions in which there are conflicts of interest with such persons that are of material significance to the company and/or to such persons require the approval of the Supervisory Board. QIAGEN has not entered into any such transactions in 2021.
Furthermore, pursuant to the Dutch implementation of the Shareholders Rights Directive II (SRD II), certain material transactions with related parties (in the meaning of the standards adopted by the International Accounting Standards Board and approved by the European Commission) require the approval of the Supervisory Board, or, if all Supervisory Directors are involved in such transaction, the General Meeting of Shareholders.
Stock Plans
We adopted the QIAGEN N.V. Amended and Restated 2005 Stock Plan (the 2005 Plan) which was approved by our shareholders on June 14, 2005. The 2005 Plan expired by its terms in April 2015 and no further awards will be granted under the 2005 Plan. On June 25, 2014, our shareholders approved the QIAGEN N.V. 2014 Stock Plan (the 2014 Plan), which replaced the 2005 Plan in April 2015. An aggregate of 16.7 million Common Shares were reserved for issuance pursuant to the 2014 Plan, subject to certain antidilution adjustments. We issue Treasury Shares to satisfy option exercises and award releases and had approximately 12.9 million Common Shares reserved and available for issuance under the 2005 and 2014 Plans at December 31, 2021.
Pursuant to the 2014 Plan, stock rights, which include options to purchase our Common Shares, stock grants and stock-based awards, may be granted to employees and consultants of QIAGEN and its subsidiaries and to Supervisory Directors. Options granted pursuant to the 2014 Plan may either be incentive stock options within the meaning of Section 422 of the United States Internal Revenue Code of 1986, as amended (the Code), or non-qualified stock options. Options granted to members of the Supervisory Board and the Managing Board must have an exercise price that is higher than the market price at the time of
75
grant. Generally, the stock rights and incentive stock options, as well as non-qualified options, stock grants and stock-based awards have terms of up to five or ten years, subject to earlier termination in the event of death, disability or other termination of employment. The vesting and exercisability of certain stock rights will be accelerated in the event of a Change of Control, as defined in the agreements under the 2014 Plan.
The Plan is administered by the Compensation & Human Resources Committee of the Supervisory Board, which selects participants from among eligible employees, consultants and directors and determines the number of shares subject to the stock-based award, the length of time the award will remain outstanding, the manner and time of the award's vesting, the price per share subject to the award and other terms and conditions of the award consistent with the Plan. The Compensation & Human Resources Committee's decisions are subject to the approval of the Supervisory Board.
The Compensation & Human Resources Committee has the power, subject to Supervisory Board approval, to interpret the plans and to adopt such rules and regulations (including the adoption of “sub plans” applicable to participants in specified jurisdictions) as it may deem necessary or appropriate. The Compensation & Human Resources Committee or the Supervisory Board may at any time amend the plans in any respect, subject to Supervisory Board approval, and except that (i) no amendment that would adversely affect the rights of any participant under any option previously granted may be made without such participant's consent and (ii) no amendment shall be effective prior to shareholder approval to the extent such approval is required to ensure favorable tax treatment for incentive stock options or to ensure compliance with Rule 16b-3 under the United States Securities Exchange Act of 1934, as amended (the Exchange Act) at such times as any participants are subject to Section 16 of the Exchange Act.
As of January 31, 2022, there were 4.0 million stock unit awards outstanding. These awards will be released between February 21, 2022 and May 31, 2028. As of January 31, 2022, 0.7 million stock unit awards were held by the officers and directors of QIAGEN, as a group.
Further detailed information regarding stock options and awards granted under the plan can be found in Note 22 "Share-Based Payments" included in the Consolidated Financial Statements.
Independence
Unlike the New York Stock Exchange listing standards which require a majority of the Supervisory Board Members to be independent, the Dutch Corporate Governance Code distinguishes between certain independence criteria which may be fulfilled by not more than one Supervisory Board Members (as e.g. prior employment with the Company, receiving personal financial compensation from the Company, or an important business relationship with the Company) and other criteria which may not be fulfilled by more than the majority of the Supervisory Board members. In some cases the Dutch independence requirement is more stringent, such as by requiring a longer “look back” period (five years) for former executive directors. In other cases, the New York Stock Exchange rules are more stringent, such as a broader definition of disqualifying affiliations. Currently, all members of our Supervisory Board are “independent” under both the New York Stock Exchange and Dutch definitions.
Risk Management
Reference is made to the discussion in the section "Risk Management" above.
Disclosure Controls and Procedures
Our Managing Directors, with the assistance of other members of management, performed an evaluation of the effectiveness of the design and operation of our disclosure controls and procedures. Based on that evaluation, they concluded that as of December 31, 2021, our disclosure controls and procedures were effective to ensure that information required to be disclosed by us in the reports that we file is recorded, processed, summarized and reported in a timely manner and is accumulated and communicated to our management, including our Managing Directors, as appropriate to allow timely decisions regarding required disclosure.
There are inherent limitations to the effectiveness of any system of disclosure controls and procedures, no matter how well designed, such as the possibility of human error and the circumvention or overriding of the controls and procedures. Therefore, even those systems determined to be effective may not prevent or detect misstatements and can provide only reasonable assurance of achieving their control objectives. In addition, any determination of effectiveness of controls
76
is not a projection of any effectiveness of those controls to future periods, as those controls may become inadequate because of changes in conditions or the degree of compliance with the policies or procedures may deteriorate.
Report of Management on Internal Control over Financial Reporting
Our management is responsible for establishing and maintaining adequate internal control over financial reporting. The Company’s system of internal controls over financial reporting is designed to provide reasonable assurance regarding the reliability of financial reporting and the preparation of the consolidated financial statements in accordance with International Financial Reporting Standards.
Because of its inherent limitations, internal control over financial reporting may not prevent or detect misstatements and even when determined to be effective can provide only reasonable assurance with respect to financial statement preparation and presentation. Projections of any evaluation of effectiveness to future periods are subject to the risk that controls may become inadequate because of changes in conditions, or that the degree of compliance with the policies or procedures may deteriorate.
Our management assessed the effectiveness of the Company’s internal control over financial reporting as of December 31, 2021. In making this assessment, management used the updated criteria set forth in 2013 by the Committee of Sponsoring Organizations of the Treadway Commission (COSO) in Internal Control-Integrated Framework.
Based on our assessment under the COSO Internal Control-Integrated Framework, management believes that, as of December 31, 2021, our internal control over financial reporting is effective.
Changes in Internal Control over Financial Reporting
There has been no change in our internal control over financial reporting during 2021 that has materially affected, or is reasonably likely to materially affect, our internal control over financial reporting.
Independent Auditors
In accordance with the requirements of Dutch law, our independent registered public accounting firm for our statutory consolidated financial statements prepared in accordance with International Financial Reporting Standards as adopted by the European Union and filed with the Netherlands Authority for the Financial Markets (AFM), is appointed, and may be removed by, the General Meeting. The Supervisory Board nominates a candidate for the appointment as external auditor, for which purpose the Audit Committee advises the Supervisory Board. At the Annual General Meeting in 2021, KPMG Accountants N.V. was appointed as external auditor for the Company for the 2021 year. The external auditor is invited to attend the meeting of the Supervisory Board at which the statutory financial statements prepared in accordance with International Financial Reporting Standards and filed with the AFM shall be approved and is furthermore invited to attend the General Meeting at which the statutory financial statements are adopted and may be questioned by the General Meeting on its statement on the fairness of our annual accounts prepared in accordance with International Financial Reporting Standards.
Following the appointment of KPMG Accountants N.V. for the audit of our statutory consolidated financial statements, the external auditor for our consolidated financial statements prepared under U.S. generally accepted accounting principles is KPMG AG Wirtschaftsprüfungsgesellschaft who audited the consolidated financial statements as of and for the year ended December 31, 2021.
The remuneration of the external auditor, and instructions to the external auditor to provide non-audit services, shall be approved by the Supervisory Board on the recommendation of the Audit Committee and after consultation with the Managing Board. At least once every four years, the Supervisory Board and the Audit Committee shall conduct a thorough assessment of the functioning of the external auditor. The main conclusions of this assessment shall be communicated to the General Meeting for the purposes of assessing the nomination for the appointment of the external auditor. The next assessment will be completed in 2023.
77
Whistleblower Policy and Code of Conduct
We have a formal Whistleblower Policy concerning the reporting of alleged irregularities within QIAGEN of a general, operational or financial nature. Furthermore, we have a published Code of Conduct that outlines business principles for our employees and rules of conduct. The Code of Conduct can be found on our website at www.qiagen.com.
Anti-Takeover Measures
In 2004, the Supervisory Board granted an option to the Dutch Foundation Stichting Preferente Aandelen QIAGEN that allows the Foundation to acquire preference shares from QIAGEN if (i) a person has (directly or indirectly) acquired or has expressed a desire to acquire more than 20% of our issued share capital, or (ii) a person holding at least a 10% interest in the share capital has been designated as a hostile person by our Supervisory Board. The option enables the Foundation to acquire preference shares equal to the number of our outstanding common shares at the time of the relevant exercise of the right, less one share. When exercising the option and exercising its voting rights on these shares, the Foundation must act in the interest of QIAGEN and the interests of our stakeholders. No preference shares are currently outstanding.
Dutch Corporate Governance Code - Comply or Explain
The corporate governance structure and compliance with the Dutch Code is the joint responsibility of the Managing Board and the Supervisory Board. They are accountable for this responsibility to the General Meeting. We continue to seek ways to improve our corporate governance by measuring itself against international best practice. The Dutch Code was last amended on December 8, 2016, and can be found at www.commissiecorporategovernance.nl.
Non-application of a specific best practice provision is not in itself considered objectionable by the Dutch Code and may well be justified because of particular circumstances relevant to a company. In accordance with Dutch law, we disclose in our Annual Report the application of the Dutch Code's principles and best practice provisions.
To the extent that we do not apply certain principles and best practice provisions, or do not intend to apply these in the current or the subsequent year, we state the reasons.
We take a positive view of the Dutch Code and apply nearly all of the best practice provisions. However, we prefer not to apply some provisions due to the international character of our business as well as the fact - acknowledged by the Commission that drafted the Dutch Code - that existing contractual agreements between QIAGEN and individual members of the Managing Board cannot be set aside at will.
The following provides an overview of exceptions that we have identified:
1.Best practice provision 2.2.2 recommends that a Supervisory Board member is appointed for a period of four years. A member may be reappointed for a term of additional two years, which appointment may be extended by at most two years.
Members of the Supervisory Board are appointed annually for a one-year period beginning on the day following the General Meeting up to and including the day of the General Meeting held in the following year. Dr. Metin Colpan has joined the Supervisory Board in 2004 and Ms. Elizabeth Tallett has been a Supervisory Board member since 2011. We highly value the scientific and commercial experience of Dr. Colpan and his in-depth knowledge of QIAGEN and the broad industry knowledge, management and board experience of Ms. Tallett. QIAGEN therefore supports the reappointment of Dr. Colpan and Ms. Tallett beyond the eight-year term as recommended by the Dutch Code.
2.Best practice provision 2.1.5 recommends that the Supervisory Board should draw up a diversity policy for the composition of the Management Board, the Supervisory Board and, if applicable, the Executive Committee. The policy should address concrete targets relating to diversity and the diversity aspects to the Company, such as nationality, age, gender and education and work background.
While QIAGEN strives for a diverse composition of the Supervisory Board, Managing Board, Executive Committee and in all other management levels of the Company, we do not consider the definition of concrete targets relating to diversity useful. We are committed to creating an environment where all
78
individuals have the opportunity to grow and contribute to our progress, regardless of their age, educational background, gender, nationality, physical abilities, race and ethnic background, religion, or sexual orientation. We consider it to be a key success factor on the path to achieving our mission and goals. Individuals and teams alike understand the diverse needs of our customers, identify and realize cross-functional opportunities for our business areas, and can quickly adapt to a fast changing environment. In 2021, our multicultural workforce was composed of at least 80 nationalities with an average age of 39.4. With 49% women, we are well balanced in terms of gender on an aggregate level. Information on the composition of our Managing and Supervisory Boards can be found about under the section "Diversity within the Managing Board and Supervisory Board."
3.Best practice provision 3.1.2 vi recommends that when formulating the remuneration policy, it should be considered that shares awarded to members of the Management Board should be held for a period of at least five years
Pursuant to the Company’s Remuneration Policy, long-term equity-based grants to members of the Managing Board under the 2014 Plan primarily consist of an award of performance stock units, i.e. long-term incentive awards which are dependent upon the achievement of pre-defined performance goals. Grants of restricted stock units, which are based on time vesting only, are no longer to be granted. Performance stock units and restricted stock units granted until February 2018 are basically structured so that 40% of a grant vests after three years, 50% after five years and the remaining 10% after ten years. Grants of performance stock units and restricted stock units granted after February 2018 vest 40% after three years, 60% after five years. Beginning in February 2021, grants of performance stock units vest after three years.
4.Best practice provision 3.2.3 recommends that the maximum remuneration in the event of dismissal of a Management Board member may not exceed one year's salary (the "fixed" remuneration component).
Our Managing Board members have entered into agreements with QIAGEN N.V. and some QIAGEN affiliates for which they hold managing positions. In case of termination of an agreement without serious cause as defined by the applicable law, the respective affiliate would remain obliged to compensate the Managing Board member for the remaining term of the employment agreement.
5.Best practice provision 2.2.4 recommends that the Supervisory Board should draw up a retirement schedule in order to avoid, as far as possible, a situation in which many Supervisory Board members retire simultaneously. The retirement schedule should be made generally available and should be posted on the company’s website.
The Supervisory Board follows the practice to discuss retirement plans of individual members early to proactively manage continuity within the Supervisory Board. QIAGEN believes that this practice provides a more flexible and better succession planning than a fixed retirement schedule.
6.Best practice provision 3.3.2 recommends that a Supervisory Board member may not be granted any shares and/or rights to shares by way of remuneration.
QIAGEN has granted stock options to the members of the Supervisory Board as a remuneration component since its establishment until 2013 when we stopped granting stock options. Since 2007, Supervisory Board members have been granted restricted stock units. We believe that the reasonable level of equity-based compensation which we practice allows a positive alignment of shareholder interests with the other duties of the Supervisory Board and that this practice is necessary to attract and retain Supervisory Board members as the granting of share-based compensation to Supervisory Board members is a common practice in our industry.
79
NYSE Exemptions
Exemptions from the NYSE corporate governance standards are available to foreign private issuers, such as QIAGEN when those standards are contrary to a law, rule or regulation of any public authority exercising jurisdiction over such issuer or contrary to generally accepted business practices in the issuer’s country of domicile. In connection with QIAGEN’s listing on the NYSE, the NYSE accepted QIAGEN's exemptions from certain corporate governance standards that are contrary to the laws, rules, regulations or generally accepted business practices of the Netherlands. These exemptions and the practices followed by QIAGEN are described below:
•QIAGEN is exempt from NYSE’s quorum requirements applicable to meetings of ordinary shareholders. In keeping with the law of the Netherlands and generally accepted business practices in the Netherlands, QIAGEN’s Articles of Association provide that there are no quorum requirements generally applicable to meetings of the General Meeting.
•QIAGEN is exempt from NYSE’s requirements that shareholder approval be obtained prior to the establishment of, or material amendments to, stock option or purchase plans and other equity compensation arrangements pursuant to which options or stock may be acquired by directors, officers, employees or consultants. QIAGEN is also exempt from NYSE’s requirements that shareholder approval be obtained prior to certain issuances of stock resulting in a change of control, occurring in connection with acquisitions of stock or assets of another company or issued at a price less than the greater of book or market value other than in a public offering. QIAGEN’s Articles of Association do not require approval of the General Meeting prior to the establishment of a stock plan. The Articles of Association also permit the General Meeting to grant the Supervisory Board general authority to issue shares without further approval of the General Meeting. QIAGEN’s General Meeting has granted the Supervisory Board general authority to issue up to a maximum of our authorized capital without further approval of the General Meeting. QIAGEN plans to seek approval of the General Meetings for stock plans and stock issuances only where required under the law of the Netherlands or under QIAGEN’s Articles of Association.
80
Corporate Governance Statement
This is a statement concerning corporate governance as referred to in article 2a of the decree on additional requirements for annual reports (Vaststellingsbesluit nadere voorschriften inhoud jaarverslag) effective as of January 1, 2010 (the “Decree”). The information required to be included in this corporate governance statement as described in articles 3, 3a and 3b of the Decree can be found in the following sections of this Annual Report:
•The information concerning compliance with the Dutch Corporate Governance Code (published at www.commissiecorporategovernance.nl), as required by article 3 of the Decree, can be found in the relevant sections under "Corporate Governance Report" in this Annual Report;
•The information concerning QIAGEN's risk management and control frameworks relating to the financial reporting process, as required by article 3a sub a of the Decree, can be found in the relevant sections under "Corporate Governance Report" in this Annual Report;
•The information regarding the functioning of QIAGEN's General Meeting of Shareholders, and the authority and rights of QIAGEN's shareholders, as required by article 3a sub b of the Decree, can be found in the relevant sections under "Corporate Governance Report" in this Annual Report;
•The information regarding the composition and functioning of QIAGEN's Managing Board, the Supervisory Board and its committees, as required by article 3a sub c of the Decree, can be found in the relevant sections under "Corporate Governance Report " and the Report of the Supervisory Board in this Annual Report;
•The information concerning the inclusion of the information required by the Decree Article 10 EU Takeover Directive, as required by article 3b of the Decree, can be found in the relevant sections under "Corporate Governance Report" in this Annual Report;
•The information concerning the powers to issue and repurchase shares can be found under "Shareholdings and Other Information" in this Annual Report.
Requirements – Germany
QIAGEN is required, as a company of which the shares are listed on the Frankfurt Stock Exchange, to follow the applicable German capital market laws, in particular the Wertpapierhandelsgesetz.
Requirements – the United States
QIAGEN’s shares are listed on the New York Stock Exchange (NYSE) and must therefore comply with such of the requirements of US legislation, such as the Sarbanes-Oxley Act of 2002, regulations enacted under US securities laws and the listing standards of the NYSE as are applicable to foreign private issuers.
81
Environmental, Social and Governance Report
Our approach to Sustainability
The past two years have demonstrated just how quickly social and environmental developments can affect business and proven that companies cannot effectively hold their strategy and operations separate from the issues facing their communities. Factoring social and environmental considerations into day-to-day business is not about minimizing costs, but rather recognizing them as important investments in the company’s success. Consistently promoting good social well-being and establishing resource efficient business activities supports our goal to operate in a sustainable manner while ensuring operational profits.
At QIAGEN, sustainability means long-term economic growth aligned with respect for both the environment as well as our stakeholders – employees, customers, suppliers, and neighbors. By taking full responsibility for our environmental, social, and governance impact and influence, we strive to be a good corporate citizen and aspire to improve lives both with our range of products and services, as well as in the manner in which we conduct our business.
2021 ESG Commitments
Our commitment to sustainability goes beyond formal regulations. For 2021, we defined and achieved three corporate ESG goals:
(1)To achieve a diversity target of more than 33% of leadership roles filled by women.
(2)To reduce transportation plastic packaging by 9% below 2020 levels.
(3)For our Days Away, Restricted and Transferred (DART) rate / incident rate to be less than 0.9 and near-miss reporting to be established in 14 sites.
The achievement of these Team Goals is linked to the annual performance goals of the Management compensation (short-term incentive, STI) as provided in the Remuneration Report.
In an important step to mitigate our environmental impact, we aligned our mid- and long-term carbon reduction targets in 2021 with the Science Based Targets initiative (SBTi) and committed to reduce our carbon emissions in line with a 1.5°C climate target. In October 2021, we started the SBTi validation process with the commitment to set science-based targets to achieve net-zero by 2050. We plan to finalize the validation in 2022.
During 2021, we continued to advance our environmental, social and governance (ESG) agenda and implemented a dedicated committee within the Supervisory Board to oversee measurement. We also established a Corporate ESG Committee for the strategic and operational work on these topics. The Corporate ESG Committee is led by our Head of Global Sustainability Measurements. This function reports directly to the Head of Global Operations, who is a member of our Executive Committee. The Corporate ESG Committee comprises a cross-functional team representing all areas of the organization.
Full information about our business model, structure, products, customers, and strategy can be found in the Management Report.
Material non-financial information
For guidance on materiality and non-financial disclosure, we apply the reporting standards provided by Global Reporting Initiative (GRI) as well as relevant guidance issued by Sustainability Accounting Standards Board (SASB) to our non-financial reporting.
For management purposes, we also work on the basis of defined materiality topics relating to sustainability. In the reporting period, we reviewed the materiality analysis first conducted in 2019. Our senior management validated the following list of material topics:
•Environmental matters: energy and emissions, water consumption, resource efficiency, sustainable procurement;
•Employee matters: employee satisfaction, occupational safety and health protection, employee development, responsible employer, equal opportunities;
82
•Social matters: access to healthcare, quality and product safety, customer satisfaction, data and cyber security;
•Respect for human rights: conflict minerals; and
•Anti-corruption and bribery matters: antitrust, anti-corruption.
Please refer to our non-financial statement 2019 for a detailed description of the process used to define material topics.
In the future, we will continue our work to gain a better understanding of our operating environment, including market developments and cultural dynamics. We will continue to approach employees, customers, patients, suppliers, shareholders, non-governmental organizations (NGOs) and communities in a range of ways, from standard questionnaires to one-on-one conversations. Employee-led volunteer sustainability committees contribute to environmental discussions and improvements throughout the company.
Environment
At QIAGEN, we are committed to minimizing the environmental impact of our business activities – from the energy we consume and the resources we use in our manufacturing processes, to the materials we use in our own laboratories and offices. We address these issues through global programs – the details of which can be found in this section – while also encouraging our employees to actively pursue ways to conserve energy and reduce waste in their activities, and in the services and products we provide. Some of these activities are driven by local sustainability committees.
In 2021 we documented our commitment in our Global Environment, Health and Safety (EHS) Policy and initiated mandatory sustainability training for all QIAGEN employees. In 2021, work started at our largest manufacturing location in Hilden on the implementation of an Environmental Management System as per ISO 14001.
In order to ensure comparability, certain prior year amounts in the environmental tables that follow have been updated due to improvements in environmental data collection and reporting processes during 2021.
Climate Change
We recognize climate change as one of the most pressing global challenges, bringing with it risks such as extreme weather events and changes in regulations or customer needs and behavior. Operations could, for example, be negatively impacted by fluctuations in the cost of raw materials, components, freight, and energy. New laws or regulations adopted in response to climate change could cause a further rise in energy prices, as well as the price of certain raw materials, components, packaging, and transportation. Our customers are generally very conscious of environmental issues including plastic consumption and the recyclability and durability of products. These factors influence their choice of supplier.
In 2019, we set a goal to reduce emissions in line with the 1.5°C climate target per the 2015 Paris Agreement. As such, we committed to reducing our Scope 1 (direct), Scope 2 (indirect), Scope 3.4. (transportation and distribution) and Scope 3.6. (business travel) emissions.
In 2021 we reaffirmed this commitment by joining the Business Ambition for 1.5°C campaign of the Science Based Target Initiative (SBTi). In joining the SBTi campaign we also joined the Race to Zero, a UN-backed global campaign to take immediate action to reduce emissions across all scopes. We are expanding the calculation and reporting of our emissions accordingly from this reporting year.
In accordance with the SBTi process, we officially committed to reach net-zero across our entire value chain by 2050. The first step of this commitment calls for us to reduce Scope 1 and 2 emissions by 42% and Scope 3 emissions by 12.3% by 2030.
83
By the end of 2021, we recorded an increase of 1.3% or 258 tCO2e in Scope 1 and 2 emissions compared to 2020. The 2021 consumption was driven by increased business activities which exceeded the positive impact of the purchase of renewable electricity for our main production site in Hilden and the implementation of further energy efficiency measures.
Based on our expanded emissions reporting for 2021, we also recorded a significant reduction in Scope 3 emissions, which were 2.2% or 9,084 tCO2e less over a one-year period.
Usage of renewable energy
Throughout 2021, we identified further opportunities for emission reductions. The first was to initiate a global conversion to renewable energy, starting at our main manufacturing and administrative sites. Our subsidiary in Hilden, Germany, set the precedent by switching to 100% green energy, significantly reducing our 2021 corporate carbon footprint. We also installed solar panels at our Hilden site, which, when active in 2022, will produce energy for our own operations and reduce the purchased amounts for this site.
Electric company cars and commuting incentives
To reduce the environmental impact of employee commuting, several of our sites have installed charging stations for electric cars and introduced bike-to-work programs. These include Venlo, Hilden and Germantown. Many facilities provide discounted train and bus tickets to encourage employees to use public transportation. In Hilden, an electric bike program was initiated to encourage employees to avoid using cars.
To further mitigate emissions, from 2022 we will start transitioning our entire fleet of company cars to electric cars over the next couple of years. Additional electric charging stations will be added on the QIAGEN campus in 2022 to compensate the increased need of green energy.
Environmental Performance
Our environmental data is collected through a centralized process that includes all production sites, research centers and offices. In accordance with the requirements for the SBTi commitment, we extended our emissions reporting in 2021 to include additional Scope 3 categories. The total carbon footprint for 2021 amounts to 417,361 tCO2e which is 2.1% or 8,826 tCO2e below the same year ago period of 426,187 tCO2e.
QIAGEN Corporate Carbon Footprint 2021
Emission category (in tCO2e) | 2021 | 2020 | Change in tCO2e 2020 to 2021 | Change in % 2020 to 2021 | ||||||||||||||||||||||
| Scope 1: Direct emissions | 11,054 | 10,202 | 852 | 8.4 | % | |||||||||||||||||||||
| Scope 2: Indirect emissions | 9,822 | 10,416 | (594) | -5.7 | % | |||||||||||||||||||||
| Total Scope 1 and 2 (market based) | 20,876 | 20,618 | 258 | +1.3 | % | |||||||||||||||||||||
| Scope 3.1: Purchased goods | 274,471 | 293,619 | (19,148) | -6.5 | % | |||||||||||||||||||||
| Scope 3.3: Energy related emissions | 2,684 | 3,007 | (323) | -10.7 | % | |||||||||||||||||||||
| Scope 3.4: Transportation and distribution | 33,062 | 36,633 | (3,571) | -9.7 | % | |||||||||||||||||||||
| Scope 3.5: Waste in operations | 6,097 | 3,628 | 2,469 | +68.1 | % | |||||||||||||||||||||
| Scope 3.6: Business travel | 13,542 | 7,900 | 5,642 | +71.4 | % | |||||||||||||||||||||
| Scope 3.7: Employee commuting | 6,188 | 6,613 | (425) | -6.4 | % | |||||||||||||||||||||
| Scope 3.11: Use phase of sold products | 1,475 | 1,534 | (59) | -3.8 | % | |||||||||||||||||||||
| Scope 3.12: End of life | 58,966 | 52,635 | 6,331 | +12.0 | % | |||||||||||||||||||||
| Total Scope 3 | 396,485 | 405,569 | (9,084) | -2.2 | % | |||||||||||||||||||||
| Total Emissions | 417,361 | 426,187 | (8,826) | -2.1 | % | |||||||||||||||||||||
Scope 1 covers direct Greenhouse Gas (GHG) emissions from the combustion of fossil fuels on our own premises and by company vehicles.
84
Scope 2 covers our indirect GHG emissions originating from the external generation of electricity for our operational and business activities. They are reported using both a location-based and market-based approach. A location-based calculation method for Scope 2 emissions reflects the average emissions intensity of grids on which energy consumption occurs; a market-based method reflects emissions calculated with the energy source mix used by each of our sites.
Scope 3 covers upstream and downstream emissions that occur along our value chain. The subcategories are reported separately in table (QIAGEN Corporate Carbon Footprint 2021). We have considered emissions in the following categories as material to our operations: Scopes 3.1. (Purchased goods and services), 3.3. (Energy related activities), 3.4. (Upstream transportation and distribution), 3.5. (Waste in operations), 3.6. (Business travel), 3.7. (Employee commuting), 3.11. (Use phase of sold products) and 3.12. (End of life).
The energy data used to calculate Scope 1 and 2 emissions can be viewed by source in table QIAGEN Energy Consumption Scope 1 and 2.
QIAGEN Energy Consumption Scope 1 and 2
| Energy consumption by source (in kWh) | 2021 | 2020 | 2019 | |||||||||||||||||
| Natural gas | 35,254,698 | 33,854,835 | 34,679,620 | |||||||||||||||||
| Petrol | 10,632,676 | 7,908,050 | 8,677,185 | |||||||||||||||||
| Diesel | 3,833,095 | 3,771,816 | 5,255,293 | |||||||||||||||||
| Liquefied Petroleum Gas (LPG) | 435 | 361 | 50,179 | |||||||||||||||||
| Electricity procurement from conventional tariffs | 22,587,904 | 38,551,191 | 36,130,248 | |||||||||||||||||
| Electricity procurement from green tariffs | 14,507,701 | 136,970 | 1,142,240 | |||||||||||||||||
| Consumption from district heating, district cooling and steam | 1,270,813 | 362,748 | 223,000 | |||||||||||||||||
| Total energy consumption (including green energy) | 88,087,322 | 84,585,971 | 86,157,765 | |||||||||||||||||
In addition to our energy data, we collect data regarding freshwater consumption, waste, and recycling.
Our operations consumed 131.9 megaliters of water in 2021 and 11.6 megaliters were extracted from areas classified as having medium-high, high, or extremely high water stress as defined by World Resource Institute Aqueduct.
QIAGEN Water Consumption by Water Stress Level
| Water stress level of site (in megaliters) | 2021 | 2020 | ||||||||||||
| Low | 105,855 | 96,645 | ||||||||||||
| Low-medium | 14,444 | 12,655 | ||||||||||||
| Medium-high | 6,200 | 4,521 | ||||||||||||
| High | 3,455 | 4,375 | ||||||||||||
| Extremely high | 1,916 | 1,854 | ||||||||||||
| Total water consumption | 131,870 | 120,050 | ||||||||||||
85
The table QIAGEN Environmental Indicators lists the environmental performance data for 2019 through 2021. The data is shown as a ratio of our consolidated environmental data in relation to our net sales (NS in $ thousands), to establish a system for long-term monitoring.
QIAGEN Environmental Indicators
| 2021 | Indicators 2021 | 2020 | Indicators 2020 | 2019 | Indicators 2019 | ||||||||||||||||||||||||||||||||||||||||||
| Energy (in MWh) | 88,087 | 0.0391 | MWh/NS | 84,586 | 0.0452 | MWh/NS | 86,158 | 0.0564 | MWh/NS | ||||||||||||||||||||||||||||||||||||||
GHG emissions Scope 1 + 2 (in tCO2; location-based) | 30,240 | 0.0134 | t/NS | 29,441 | 0.0157 | t/NS | 29,347 | 0.0192 | t/NS | ||||||||||||||||||||||||||||||||||||||
Freshwater use (in m3) | 131,870 | 58.57 | l/NS | 120,051 | 64.19 | l/NS | 174,635 | 114.41 | l/NS | ||||||||||||||||||||||||||||||||||||||
| Total waste (in t) | 2,434 | 1.081 | kg/NS | 2,490 | 1.331 | kg/NS | 1,155 | 0.757 | kg/NS | ||||||||||||||||||||||||||||||||||||||
| Hazardous waste (in t) | 1,534 | 0.681 | kg/NS | 507 | 0.271 | kg/NS | 330 | 0.216 | kg/NS | ||||||||||||||||||||||||||||||||||||||
Product life cycle assessment
In 2019, we conducted a life cycle assessment (LCA) for the QIAamp DNA Mini Kit, one of our best-selling products. An LCA assesses the environmental impact of the full life cycle of a product (so called “cradle to grave”), including the extraction and processing of raw materials, transport to the customer, energy and material input required when using the product, as well as transport to the disposal facility and incineration of remaining materials.
As the QIAamp DNA Mini Kit is similar in composition and manufacturing process to other QIAGEN kits, our aim was to extrapolate ways to improve the environmental performance across our kit portfolio from the findings of the LCA. Areas identified for optimization in the first instance included changes to secondary transportation packaging to reduce plastic usage, further details of which can be found in the section “Plastic Footprint Reduction.”
The LCA of a sample kit, the QIAamp DNA Mini Kit has been updated in 2021 with an increased scope and notable improvements to data quality. The 2021 LCA has been carried out in accordance to ISO 14040/14044 and hence it is certified by an independent third party (GUTcert). The LCA reconfirmed the environmental impacts within the entire life cycle of a QIAamp DNA Mini Kit. The detailed report on the LCA can be found on QIAGEN's website under Sustainability.
Plastic footprint reduction
We use plastics in many of our products and production support materials, as well as for transport and packaging. Our industry faces several challenges in reducing plastic materials due to technical and regulatory requirements, safety, and hygiene standards. However, we are working to eliminate plastics wherever possible without compromising on product quality. Our global cross-functional, plastic footprint reduction team identifies opportunities to reduce plastic, investigates more environmentally friendly alternative materials, and optimizes recyclability where possible.
In 2021, we set a corporate goal to reduce plastic transportation packaging material by 9% below 2020 levels. We surpassed this goal by achieving a 9.6% reduction in plastic transport packaging. Our goal for 2022 is to reduce it by a further 9% compared to 2021.
Many of our plastic reduction initiatives focus on transport material packaging. For example, in 2021 we introduced plant-based material alternatives to replace the expanded polystyrene (EPS) coolers in cold-chain shipments. The straw-based coolers in Europe, the Middle East and Africa (EMEA) and paper-based coolers in the Americas have replaced a total of 15,700 EPS coolers in 2021. We also replaced plastic bubble wrap with paper. We will continue to expand these initiatives in 2022.
As we are responsible for our entire supply chain, we are also actively working with our logistics suppliers on other initiatives to reduce shipping waste. These include, for example, utilizing re-usable passive temperature control shipping systems for certain cold-chain products.
86
In 2021 we developed a new eco-friendly product range called the QIAwave, with the aim of reducing the environmental impact of our products. The new kit design contains less internal plastic packaging, includes more concentrated buffers contained in smaller bottles and uses collection tubes made of 100% recycled plastic. This results in up to 63% less plastic and 42% less cardboard in each kit. New QIAwave kits deliver the same high-quality DNA and RNA, but with a reduced environmental footprint. QIAwave marks the beginning of our journey to translate sustainability into our products. We are working on further improvements to advance the circular economy of our QIAwave.
Environment-friendly facilities
We aim to make our buildings environmentally friendly by seeking LEED certification for new construction. Hilden’s research and development and the production facility were awarded LEED Gold certification, and an extension to the QIAGEN Germantown facility received Silver certification. In 2021, our Manchester, U.K., subsidiary moved to a new site designed with energy saving technology incorporated. Our initiatives to improve energy efficiency include energy modeling during the design phase of buildings, energy extraction from co-generators, improved insulation, heat recovery, lighting replacements, and installation of intelligent building systems. Manchester’s new building includes indoor storage for 36 bicycles, with further provision outside of the building. Furthermore, a first e-bike initiative started at our subsidiary in Stockach, Germany.
Our local volunteer sustainability committees have initiated projects to reduce waste at their sites by introducing recycling and composting programs, replacing single-use items with reusable versions, and donating surplus office furniture and lab equipment to local community organizations. They collaborate across regions and departments to identify and implement impactful sustainability projects.
Employees
Our long-term success and growth depend on the knowledge, skill and passion of our employees. Focusing on human capital therefore drives our economic performance and considerably influences the sustainability of our operations. We are convinced that the professional and personal development of our employees is an integral factor in creating value for customers, patients, colleagues, partners and shareholders. Being the industry’s employer of choice by attracting and developing top talent is one of our global goals. To achieve that, QIAGEN creates a work environment that empowers and involves employees at all levels.
As a company headquartered in the EU, freedom of association and collective bargaining are cornerstones of the good relationship between management and representatives of employees. Around 76% of our workforce is employed in member states of the Organization for Security and Cooperation in Europe (OSCE), and in all regions where we operate, we comply with all applicable laws regarding freedom of association and collective bargaining and respect local laws and regulations concerning labor relations. Our commitment on this issue can also be found in our Human Rights Policy on our Sustainability webpage. This policy is communicated to all employees globally on an ongoing basis via the company intranet and also given to newly hired employees. We strive to foster an open-door workplace culture where employees are able to approach management and/or Human Resources about their concerns without fear of retaliation. Our policy states that employees may communicate openly with management regarding their working conditions without threat of reprisal, intimidation or harassment.
Among all QIAGEN guidelines, the following policies aim to incorporate our culture and values into all of our internal and external relationships. These are available internally for all employees:
•Our Corporate Code of Conduct and Ethics is intended to provide our employees with a clear understanding of the business conduct and ethics that are expected of them.
•Our Ethical Standards Policy: QIAGEN's cultural norms and values are defined in our mission, vision and identity. Our values form the basis of our business success. Every employee is expected to treat everyone in an open, honest and respectful manner.
87
Depending on local law and custom, there are different types of QIAGEN employment ranging from long-term fixed contracts to temporary positions, also including flexible time and programs for parents returning from parental leave. In 2021, we employed 2.5% of our workforce on a part-time basis (2020: 3.0%) and 4.7% on a temporary contract / fixed-term work contract (2020: 2.1%).
Employee training
As a fast-growing technology and knowledge-based company, we consider high-quality training and career development to be an integral part of our success. We offer various training platforms such as QIAlearn, QIAGEN Academy, and MasterControl that provide the possibility to either use our global e-learning portfolio or to participate in personal trainings usually offered in a blended format. The focus is on job-specific skills, compliance, competencies and leadership development.
During 2021, we conducted a mix of virtual instructor-led and e-learning courses totaling approximately 95,000 hours for more than 5,800 attendees. In addition, 35 employees participated in our Global Executive Leadership Development Programs during 2021. All trainings were conducted virtually in 2021 due to the ongoing COVID-19 pandemic.
As part of our talent and succession management, we have established transparent career paths with the QIAGEN Profile Navigator. It defines jobs, core competencies and approaches to advancement across the global organization.
In addition, our global Performance Enhancement System creates a clear framework of regular one-on-one review sessions for each employee and their manager to discuss career development. These include discussions of goals and achievement levels, assessment of relevant competencies, as well as training needs and career planning steps.
As part of the feedback mechanism for continuous improvement to individual leadership competencies, the annual 180o feedback process provides the opportunity for employees and supervisors to give anonymized feedback to managers. For 2021, employees provided very positive feedback overall.
Diversity
At QIAGEN, we are committed to creating an environment that is rich in diversity and empowers all employees. We want to provide an environment where all individuals have the equal opportunity to grow and contribute, regardless of their age, educational background, sex, sexual orientation, gender identity, gender expression, nationality, ethnicity, veteran status, physical abilities or religion. Our diversity is a strength and makes QIAGEN a great place to work.
The QIAGEN Executive Council of Equal Opportunity (ECEO) is made up of senior representatives from each of the business areas across the organization. Globally agreed cross-functional objectives are tied directly to our corporate goals on diversity and inclusion (D&I) and the ECEO drives initiatives within each organizational area. The ECEO sponsors our D&I ambassador program which is comprised of more than 25 employees who volunteer to champion D&I across our global sites. In 2021, the ambassadors hosted site and region-specific speakers and presentations, and organized trainings, workshops and events to educate the community – within QIAGEN and beyond. The ambassadors have updated many D&I resources for employees including our unconscious bias training which emphasizes actions that can be taken beyond awareness of unconscious bias to proactively drive inclusive behavior.
Our strategic initiative on gender diversity started in late 2018 has yielded remarkable results, particularly regarding leadership positions. The participation of women in leadership roles (QIAGEN management and above) rose from approximately 28% in 2018 to 34% in 2021 (2020: 33%). We continue to work towards gender parity and are targeting a 2022 goal of 35% or more women in leadership roles. We have been listed under the 2022 Bloomberg Gender Equality Index which provides an opportunity for companies to assess progress towards parity, benchmark against peers and highlight a commitment to gender equality.
Our commitment to diversity extends beyond cultural and gender diversity. In 2021 we made a targeted review of all our policies and guidelines and updated them to ensure clarity and confirmation of our commitment to equality for LGBTQ+ workers and their families. As a result of these updates as well as other initiatives focused on the LGBTQ+ community during the year, our U.S. subsidiary received a score of 100 on the Human Rights Campaign (HRC) Foundation's 2022 Corporate Equality Index (CEI). We are also a member of the Business Coalition for the Equality Act.
88
In 2021, we launched the first cohort of our mentorship exchange, an internal program pairing employees who are uniquely positioned to support each other’s career goals. The mentorship exchange is designed to support career progress as well as foster a strong sense of culture and inclusiveness at QIAGEN.
Throughout 2021 we have been working towards the launch of QIAGEN communities. During the year we have completed a series of discussions, surveys and focus groups with the aim to identify and support the launch of communities requested by our employees. These groups are all volunteer-led, and in the initial launch, expected in mid-2022, we will focus on four topics: Disability/Accessibility, Parents/Caregivers, LGBTQ+ and Women. We are supporting our employee volunteers by providing training and resources to launch this important initiative.
Diverse teams strengthen our organization through the variety of ideas, perspectives and approaches they bring to our business. Our teams perform best when they are composed of individuals with the widest possible range of personalities, backgrounds and traits. That’s why we value each individual and maintain an environment where everyone can be successful. More information about the policy on diversifying the Management Board and the Supervisory Board can be found in the Corporate Governance Report.
Employee satisfaction and retention
Our employees are the key to our success, and so we seek to be a great place to work. We offer opportunities to work on exciting tasks and projects in an engaging environment. Employees join QIAGEN and stay with us because they can see how their work makes a difference in people’s lives around the world. Internal and external ratings have continued to improve and highlight our good reputation and preferred position within the global working environment. As expected, after a year of incredibly low turnover, our turnover rates did increase year over year but in line with the internal goals to maintain overall voluntary turnover at the management level under 7%. At the same time, the average voluntary annual turnover rate has increased from approximately 8% to more than 11% in 2021.
Turnover at Management Level
| 2021 | 2020 | |||||||||||||||||||||||||||||||
| QIAGEN Leadership | Headcount | Average Headcount | Voluntary Leavers | Voluntary Turnover | Headcount | |||||||||||||||||||||||||||
| Female | 211 | 238 | (16) | 6.7 | % | 265 | ||||||||||||||||||||||||||
| Male | 409 | 446 | (29) | 6.5 | % | 482 | ||||||||||||||||||||||||||
| Total | 620 | 684 | (45) | 6.6 | % | 747 | ||||||||||||||||||||||||||
Work-life balance is an important measure to create and maintain employee satisfaction. We provide services to help employees balance their personal lives with the company’s dynamic work environment, including in-house childcare, and flexible working hours. Our global flexible framework allows all employees who can work remotely to do so up to 25% of the time. We have a significant number of part-time employees (2.5%) and also provide short-term bereavement leave. Regarding the COVID-19 pandemic, we were and continue to be flexible and allow our employees to work from home as guided by local regulations as well as personal situations. Beginning in 2021, we rolled out our global QIAflex program, which is our flexible working framework. QIAflex provides the framework that local site leadership follows in developing the model of flexible working for eligible employees at their location, typically based on a split of 25% remote work and 75% onsite work. We also offer an Employee Assistance Program (EAP) in Poland, Germany, U.S., Canada, UK, Australia and the Philippines. Our employees can make use of consultant service to get support on personal topics. EAP is offered through different communication channels, like in-person meetings, video conferences and phone calls, adapted to the needs of the employees. More than 60% of our employees work in countries that offer an EAP and we are looking to expand this program.
We have implemented frameworks for performance-based compensation and equity-based compensation, and incentive programs for new ideas and innovation. These programs aim to ensure fair and attractive compensation and to encourage each employee to contribute to the company’s long-term success. Our Remuneration Report provides detailed information on the compensation practices regarding our Supervisory and Managing Boards. Our internal pay ratio is defined as the ratio between the average pay of the Managing Board and the average pay of QIAGEN employees on a global level. The combined pay ratio in 2021 for the Managing Board was 68:1 (2020: 72:1).
89
An essential component of our efforts to maintain a high level of satisfaction at work is our corporate health and safety management. We offer a wide range of measures and tools, from annual “health days” with free counseling, screening and medical check-ups, to fitness opportunities in the form of in-house gyms, on-site soccer fields and beach volleyball courts, and online yoga. We also held several online mental health events throughout the year, and added an EAP in many countries.
Our commitment to being an employer of choice is also reflected in the high number of applications we receive for open positions. In 2021, we were once again recognized as a “Top Employer” in Germany and additionally received the Top Employer Certificate in China. The Top Employer Institute is a global authority on recognizing excellence in people practices. The title is awarded after a very rigorous process where companies must share detailed information on their HR practices, have an onsite review and provide several employee interviews. Our Brazil and Mexico subsidiaries were also once again certified. In India, the Philippines and the U.S. we also received “Great Place to Work” awards for the first time. To earn the certification, at least 7 out of 10 employees must classify the company in a survey as a “Great Place to Work.” For the ranking, an assessment of the cultural practices and a complementary questionnaire are considered. Our Shared Service Center in Manila also won multiple employer certifications in 2021 including Asia's “Great Place To Work” and Asia's “Best Employer Brand 2021.”
At QIAGEN, we also deploy short anonymous engagement surveys, or Pulse Checks, globally to provide a snapshot of engagement levels within the organization. In 2021, three Pulse Checks were deployed and had an average participation rate of 65% with an average trending score of 4/5 across all areas of engagement. Participation rates and overall average score by Pulse Check in 2021 are as follows: March: 63% participation rate and overall score 4.0, June: 70% participation rate and overall score 4.06 and November: 62% participation rate and overall score 3.94.
Occupational safety and health protection
We recognize our responsibilities with respect to occupational health and safety. All QIAGEN employees are required to adhere to local health and safety procedures and practices. Safety, orderliness, and cleanliness are a key success factor at QIAGEN.
Our Global EHS team defines the principles and direction of the implementation of global EHS policies and procedures in alignment with International Standard 45001. Local EHS teams at our facilities coordinate, manage, and monitor site-specific occupational health and safety risks and activities, which include the management of permits and licenses, risk analysis and assessments, planning for unplanned events, accident reporting, and health and safety inspections.
In 2021 the global EHS policy was reviewed, and mandatory training provided to all employees. Furthermore, the Hilden site, which is our largest manufacturing location, expanded the local EHS team to implement an occupational health and safety management system according to ISO 45001.
In 2021, we also committed to a company-wide goal to reduce the rate of lost workdays due to injuries, by driving initiatives to improve our culture of safety. To that end, we launched a global digital system for the reporting and investigation of safety incidents across all facilities, and mandatory safety awareness training. These activities supported the 2021 QIAttention campaign which was designed to raise awareness of safety and encourage reporting of safety incidents and near misses.
Our corporate goal is to keep the number of safety incidents that result in Days Away, Restricted and Transferred (DART) below 0.9 /per 100 employees. The data for this metric during 2021 was collected monthly from 14 QIAGEN sites located in the U.S., EMEA and the Asia-Pacific (APAC). The DART rate for 2021 was maintained below 0.9 which was a good achievement in light of an increase in manufacturing hours.
The table below shows the DART rate for our key facilities in 2021 (14 key sites) and 2020 (13 key sites).
90
DART rate for key QIAGEN facilities
2021(2) | 2020(3) | |||||||||||||
Total number of calculated work hours(1) | 8,263,028 | 6,731,500 | ||||||||||||
| Total number of recordable work-related injuries | 40 | 29 | ||||||||||||
| Total number of recordable work-related injuries that caused days away from work, restricted work activities and/or job transfers encountered | 35 | 17 | ||||||||||||
| DART (per 100 employees) | 0.85 | 0.51 | ||||||||||||
(1)Total number of calculated work hours including contractors, temporary workers and QIAGEN employees
(2)In 2021, scope has been extended and now covers 14 sites to include NeuMoDx (United States) acquired in September 2020.
(3)In 2020, scope covered 13 key sites: QIAGEN Iberia SL (Spain); Beverly QIAGEN Inc (United States); DIALUNOX GmbH (Germany); QIAGEN Frederick (United States); QIAGEN Sciences (Unites States); QIAGEN GmbH (Germany); QIAGEN Manchester Ltd (United Kingdom); QIAGEN K.K. (Japan); QIAGEN DNA Synthesis AB (Sweden); QIAGEN Shenzhen Co. Ltd (China); QIAGEN Singapore Pte Ltd (Singapore); TIANGEN Biotech Co. Ltd (China); QIAGEN Business Services (Poland).
The table below shows the Total Recordable Incident Rate (TRIR) for our key facilities in 2021 and 2020, and by QIAGEN employees and non-employees whose work is controlled by QIAGEN. Further information, including a split by employees and non-employees is available on Sustainability page at www.qiagen.com/sustainability.
Health And Safety Indicators For QIAGEN Employees And Employees Whose Work Is Controlled By QIAGEN
| Health and Safety Indicators (employees and non-employees) | 2021 | 2020 | ||||||||||||
| Number of work-related fatalities | 0 | 0 | ||||||||||||
| Total Recordable Incident Rate | 0.97 | 0.86 | ||||||||||||
| Lost Time Case Rate (excludes restricted and transferred work) | 0.80 | 0.51 | ||||||||||||
| Number of near misses (close calls) | 81 | 30 | ||||||||||||
The table below shows the total number of recordable incidents and number of lost workdays for only QIAGEN employees during periods 2021, 2020 and 2019, by region.
Total Number Of Recordable Incidents And Numbers Of Lost Workdays For QIAGEN Employees
Total Recordable Incidents(2) | Days Lost due to Injuries | |||||||||||||||||||||||||||||||||||||
2021(3) | 2020 | 2019 | 2021(3) | 2020 | 2019 | |||||||||||||||||||||||||||||||||
Headcount average per month(1) | 3,815 | 3,220 | 3,132 | 3,815 | 3,220 | 3,132 | ||||||||||||||||||||||||||||||||
| Europe / Middle East / Africa | 30 | 23 | 17 | 471 | 64 | 121 | ||||||||||||||||||||||||||||||||
| Americas | 9 | 6 | 3 | 146 | 49 | 5 | ||||||||||||||||||||||||||||||||
| Asia-Pacific / Japan | 1 | 0 | 0 | 0 | 0 | 0 | ||||||||||||||||||||||||||||||||
(1)Headcount average per month of QIAGEN employees at key manufacturing sites across APAC, US and EMEA.
(2)Recordable incidents include lost workdays, restricted work, and medical treatment beyond first aid.
(3)Data for 2021 equates to 62% of the total number of QIAGEN employees, due to the fact that data has been collected only from key manufacturing sites.
In 2021, reporting of safety incidents that did not result in injury, or “near misses,” were encouraged, to promote further safety awareness and support continuous improvement initiatives. Health and safety training programs were also implemented 2021.
91
Sites that have implemented lean management processes utilize the blue safety cross - a visual data collection tool - to capture the number of daily safety incidents, including near misses and accidents. The tool is used to improve safety and promote good practice within the teams by raising awareness of safety incidents related to their work.
Measures at QIAGEN to fight COVID-19
To further ensure the health and safety of our staff, several measures, capabilities and capacities to fight COVID-19 were expanded and intensified in 2021.
At the Hilden site, we provided all staff with free face masks (surgical or FFP2), placed disinfectants at all central and crucial locations, and we rolled out dedicated onsite rules and regulations, aligned with recommendations from respective authorities. Additionally, we expanded our capacity to provide free coronavirus testing to employees, initiated at the onset of the COVID–19 pandemic in early 2020. In 2021, we ran nearly 70,000 tests in our internal laboratory for Hilden-based employees, their families, and external service providers, using our technologies for sample prep and virus detection. This represents a more than six-fold increase over 2020 numbers. The introduction of a saliva-based sample collection process formed the base for our “Lolli-Test 2go” in-house PCR tests which increased ease of use for self-testing and improved the workflow in the testing lab. Results were delivered within a maximum of 24 hours, and individuals testing positive were called individually to ensure measures were followed to protect the health and safety of all involved. We also provided the Hilden-based SARS-CoV-2 testing to employees at our sites in Köping (Sweden), Stockach (Germany) and Wroclaw (Poland). First and second shot vaccinations against COVID-19 were offered on-site in Hilden in close collaboration with the company physicians.
Human rights
Respect for human rights is an essential component of promoting sustainability in our global business. As a publicly listed company with international operations, we regard ourselves as a responsible corporate citizen in all the countries and regions where we do business. This role includes rights and obligations governed by international and national law, with human rights as one of the foundational elements.
The global crisis created by Russia’s invasion of Ukraine has resulted in the adoption of extensive sectoral and financial sanctions. QIAGEN condemns Russia’s actions against Ukraine and supports the measures, including sanctions and export controls, that the European Union, the United States and other jurisdictions have announced. As a global company and in accordance with our values, we will act responsibly in all matters related to the conflict, including the implementation of sanctions and embargoes. Our employees - particularly in Poland, Romania and Austria - have launched various initiatives to support refugees from Ukraine. We are working closely with our commercial partner in Ukraine to support their colleagues, and also with our QIAGEN employees in Russia, some of whom have family in Ukraine.
In this sense, we acknowledge and endorse the UN Universal Declaration of Human Rights, the European Convention on Human Rights, the business-related Organization for Economic Cooperation and Development (OECD) Guidelines for Multinational Enterprises, the ILO Declaration on Fundamental Principles and Rights at Work, and the UN Guiding Principles on Business and Human Rights and its application in National Actions Plans of our relevant jurisdictions. For the U.K., QIAGEN Ltd has endorsed its official statement about the UK Modern Slavery Act 2015 globally.
Our Human Rights Policy is designed to provide guidance on all human rights issues in our sphere of influence including our relationship with customers, employees, and in our supply chain. For more information on our due diligence processes with regard to human rights in our supply chain, please refer to the "Sustainable supply chain management" section. Our Human Rights Policy can be found on the Sustainability page on our website at www.qiagen.com/sustainability.
Our review of potential compliance matters with respect to human rights violations applies a risk-based approach (see “Compliance” section). It takes into account that our global operations can be classified as either administrative, research and development, manufacturing or sales-based. None of these areas, including our manufacturing sites, allow for employment practices that violate human rights principles (such as child or slave labor). Furthermore, local management is responsible for the observance of the principles set forth in our Code of Conduct and Ethics and our Human Rights Policy at all these sites. We therefore do not apply additional specific human rights reviews of our operations.
92
Sustainable supply chain management
We strive to ensure that our quality standards, compliance with laws and regulations as well as environmental and social standards are maintained along the entire value chain of suppliers and partners, and demand the same from our business partners. Our procurement policy includes specific requirements for corporate governance, environmental and social standards, which we expect our suppliers to adhere to as minimum standards. Among other issues, it includes obligations to reduce the use of substances of concern, to ensure collective bargaining and freedom of association among employees, fair wages, and regulations concerning maximum working time. The procurement policy is available online on QIAGEN’s website.
In alignment with QIAGEN’s Compliance Program (especially QIAGEN’s Corporate Code of Conduct and Ethics), every QIAGEN employee is required to conduct themselves honestly, fairly, and objectively in all business relationships with suppliers and all others with whom QIAGEN maintains business relationships. Our compliance training program ensures that employees in the procurement organization understand our guidelines and comply with them.
Structure of our supply chain
We operate in more than 35 locations worldwide, and our sites are supported by a global supplier network that includes approximately 8,300 (2020: 9,000) suppliers in over 70 (2020: 60) countries, supplying resources such as chemicals and bioreagents, plastics, packaging materials, as well as other materials and services essential to our business. In 2021, 75% (2020: 76%) of our overall purchasing volume came from OECD countries.
Region of origin of suppliers
| Region of origin | 2021 | 2020 | ||||||||||||
| Europe | 47 | % | 48 | % | ||||||||||
| Asia | 25 | % | 25 | % | ||||||||||
| North America | 21 | % | 22 | % | ||||||||||
| South America | 4 | % | 3 | % | ||||||||||
| Australia | 2 | % | 2 | % | ||||||||||
| Africa | 1 | % | 0 | % | ||||||||||
| Total | 100 | % | 100 | % | ||||||||||
Due diligence process
To minimize compliance, environmental and social risks in our supply chain, we apply a multi-stage vendor selection process. Suppliers are subjected to a risk analysis regarding environmental and social criteria based on their geographic location. These criteria were supported by information from the MVO Nederlands platform financed by the Dutch Foreign Ministry as well as the Bertelsmann Stiftung’s Sustainable Development Goals Index in 2020. This analysis identified zero suppliers for whom potential risks exist due to geographic location and sales to QIAGEN.
In 2021, all new suppliers signed our procurement policy as a mandatory part of the contracting process. The policy contains requirements regarding legal compliance, anti-bribery and corruption, labor rights, free speech, right of assembly, non-discrimination and fair treatment, health and safety as well as environmental protection and conservation. QIAGEN provides a whistleblower hotline, which can be used by all employees. The contact details can be found on our website within the Corporate Code of Conduct and Ethics section. In addition, first-tier suppliers must confirm REACH, RoHS and conflict mineral compliance as appropriate.
As part of our supplier selection process, we conduct additional assessments. Some suppliers are analyzed with a supplier risk assessment. This includes all strategic suppliers with a high critical impact on QIAGEN’s security of supply. The analysis is based on the following criteria, among others: quality management, financial stability, embargoes, risks of natural disaster. This process will be evaluated in the future against further criteria in context with evolving compliance, environmental and social standards. The relevant data for the assessment is either submitted via a questionnaire, or the suppliers are assessed on site during a visit. If a supplier does not fulfil all criteria, next steps are decided on an individual basis.
93
Quality audits are conducted on site at least every three years for all “A”-categorized suppliers. We document all audits and share the results with the audited suppliers. In case of non-conformity with respect to quality processes, corrective actions are delivered to the supplier.
Our current processes ensure that our top suppliers, contributing to over 80% of our expenditure, confirm their compliance with our Compliance Policies. Our corporate headquarters in Hilden (Germany) will be subject to the German Supply Chain Due Diligence Act (Lieferkettensorgfaltspflichtgesetz) effective as of January 1, 2024. The new law will impose significant due diligence requirements on the supply chain and impact our global operations. We will start preparing to implement the required tools and processes as of 2022. We are currently reviewing automated solutions which allow for human rights reviews in our supply chain, and we plan to implement these solutions in 2022, as well.
Conflict minerals
The sourcing of certain minerals (known as “conflict minerals”) has been linked with human rights abuses in the Democratic Republic of Congo (DRC) and other conflict zones. Our products consist of sample and assay kits, known as consumables, and automated instrumentation systems. We do not believe that any conflict minerals are necessary for the production or functionality of any of our consumable products. Certain “conflict minerals” are however necessary for the functionality or production of certain instrumentation products that we manufacture or contract to manufacture. After conducting a reasonable country of origin inquiry (RCOI) with the suppliers of certain components used in these products, we have concluded that our products are “DRC conflict free” through December 31, 2020.
We performed a comprehensive analysis of our automation and instrumentation components and identified all suppliers that may source “conflict minerals,” which include columbite-tantalite, cassiterite, gold, wolframite, and their derivatives, tin, tungsten and tantalum. We defined the scope of our RCOI to include all of these direct suppliers. We began conflict minerals inquiries of these direct suppliers in the fourth quarter of 2021 and received responses from the direct suppliers which were either provided on company letterhead or on standard conflict minerals reporting templates established by the Electronic Industry Citizenship Coalition. We conducted our RCOI in good faith and believe that our inquiry was reasonably designed to determine whether any of the conflict minerals originated in the DRC or any adjoining country. In conducting this inquiry, we relied on the direct suppliers’ responses about the source of conflict minerals contained in the components supplied to them. These direct suppliers are similarly reliant upon information provided by their own suppliers.
We received responses to our request for information from all direct suppliers within the scope of the RCOI. Of the responses, all confirmed that the products they supply to QIAGEN are either DRC conflict free or they are not aware of any non-compliance in their supply base.
Based on the RCOI, we have no indication that any conflict minerals used in our products originated in the DRC through December 31, 2020. We disclosed our findings to the U.S. Securities and Exchange Commission (SEC) for the year ending December 31, 2020, on Form SD on March 26, 2021, and will provide updated disclosure to the SEC annually. Our assessment for the year ending December 31, 2021, is ongoing and we expect to provide our disclosure on Form SD by the end of May 2022.
Business ethics and anti-corruption
For QIAGEN, conducting business in a responsible way includes looking beyond our day-to-day business operations into the ethical foundations of our company. This means, in particular, the respect for human rights and legally compliant business behavior.
Ethics in R&D
For our research and development (R&D) activities, we endorse the principles and proposals of scientific organizations and advisory groups – such as the American Society of Human Genetics and the European Society of Human Genetics – that have issued cautionary guidelines on the ethical use of genome editing technologies.
Clinical studies are essential to evaluate the performance and clinical value of our regulated clinical diagnostic tests. This information is required by regulatory authorities to gain marketing approval. More importantly we are committed to bringing high performance products to the market, and this can only be
94
achieved by establishing the performance characteristics of a potential product according to its intended use. Therefore, we and our partners conduct clinical studies for our diagnostics tests that are to be approved for use as in vitro diagnostics in a patient care pathway. In the conduct of these studies, we commit to ensuring the well-being, safety, ethical concerns, and legal rights of the study volunteers.
In light of this, we have built global procedures for the conduct of clinical studies which abide by the following principles:
•The Declaration of Helsinki: this is a statement of ethical principles that was developed by the World Medical Association to guide medical research WMA Declaration of Helsinki – Ethical Principles for Medical Research Involving Human Subjects – WMA – The World Medical Association
•The International Conference on Harmonization and national Good Clinical Practice (GCP) guidelines
•ISO 20916: In vitro diagnostic medical devices — Clinical performance studies using specimens from human subjects —Good study practice
All investigators and staff involved in QIAGEN studies must have up-to-date training in GCP and be suitably qualified for their role. Eligible studies must be approved by ethics committees or the Institutional Review Board prior to starting, and if required, have the appropriate regulatory approvals from authorities in the country in which the study is being conducted.
We use residual (left-over) patient samples whenever possible, minimizing the need to actively collect samples from patients. Where active participation by volunteers in studies is needed, we obtain informed consent by providing volunteers, in accordance with best practice, with a comprehensive overview of the study including its risks and benefits and alternative options for the patient.
Appropriate guidelines, such as ISO20916, Clinical and Laboratory Standards Institute guidelines and feedback from regulatory authorities, are applied in the design of QIAGEN clinical studies. This is to ensure the integrity of study design, adherence to sound scientific principles and that high quality data is generated, while the risk to volunteers is minimized.
We convene a Medical Safety Committee, chaired by the Chief Medical Officer, to oversee study and patient risk, and to assess any adverse event or device event reports, which are then appropriately reviewed and reported.
Personally identifiable data that we collect during the conduct of QIAGEN studies is kept confidential in accordance with all applicable laws and regulations. We issue all volunteers with unique subject identification numbers to de-identify patient data, ensuring we meet the requirement for data privacy.
For transparency and accessibility of clinical performance data of QIAGEN clinical diagnostic tests, QIAGEN undertakes to:
•Register relevant studies on www.clinicaltrials.gov
•Publish studies in peer-reviewed publications in an anonymized fashion
Ethical product use
Following articles in the media about the use of DNA profiling technologies for the genetic surveillance of minorities in certain countries, we reviewed our commercialization channels in such countries and we could not confirm that any such practices were performed with our products.
We endorse the application of our products, our services, and our operations in compliance with Human Rights principles and codes such as the U.N. Guiding Principles on Business and Human Rights. Many of our products, such as DNA or RNA extraction kits, have an intended use for a broad range of research and diagnostic applications, including COVID -19, oncology testing and forensics. None of them are designed for population screening, but we acknowledge that it is technically possible to operate our products for this purpose. As per our Human Rights Policy, we do not tolerate the misuse of our products for purposes such as mass screening and surveillance of ethnic minorities, and we will block customers involved in such practices from further sales should this become known to
95
us. However, as we operate via distributors in many countries, we have no means of monitoring the identity of all of our customers, or control the use of our products by end-customers.
To mitigate this, we will be asking all our distributors in 2022 to sign modified distribution agreements requiring them to block end-customers from further sales in the event they become aware of any misuse of our products as defined by our Human Rights Policy. Those amendments will give us the legal leverage to terminate the respective distribution agreement if necessary.
Our approach to tax
We are committed to conducting business lawfully, ethically, and with the highest degree of integrity. These fundamental values and principles, as defined in our three I’s (Integrity, Inspiration, and Insight), are key to the long-term success of our company and the basis for our tax strategy.
Our tax strategy is embedded in the following guiding principles which reflects our status as a listed company and the regulated nature of our business.
Tax accountability and governance
Tax is part of our corporate governance and is supervised by the QIAGEN Managing Board. The tax function of QIAGEN is centrally managed and controlled by its Global Tax Department, which is part of the Global Finance organization. It is led by the global Head of Tax, who reports to the Chief Financial Officer of the QIAGEN Group. Under the ultimate responsibility of our Audit Committee and Managing Board, the Chief Financial Officer regularly reviews, evaluates, approves and where necessary adjusts QIAGEN’s approach to tax.
Tax follows business
One of the basic principles for sustainable tax management is that taxes should be paid where economic value is generated. We allocate assets to the jurisdictions in which the underlying activities are performed, and risks are assumed. This ensures that the return on our business activities is allocated and taxed where they are actually performed. The volume of product and service flows among entities within the company is significant, and the price of transactions among QIAGEN entities is an important factor in QIAGEN’s overall tax organization. Our Global Transfer Pricing Team determines the policy for the pricing of such transactions based on a full analysis of the value drivers of our business, ensuring that international and local rules are followed. Our objective is that all entities are remunerated at “arm’s length,” in accordance with OECD guidelines and country-specific rules and regulations.
The intellectual property related to our products and also to marketing specific intangibles are key profit drivers within QIAGEN, and profits generated with the employment of such assets are appropriately remunerated with the respective owner. The owner is the company controlling and taking the entrepreneurial risk of investing in the intellectual property. Our main entrepreneurs and intellectual property owners are companies in Germany, the U.S. and Spain.
We will only use business structures that are driven by commercial considerations, are aligned with business activity and have genuine substance. We do not operate in countries that are on the EU list of non-cooperative jurisdictions for tax purposes.
Seeking and accepting tax benefits
Like many companies, we seek to optimize our global tax position by accepting tax incentives. In doing so, we always try to achieve an appropriate balance between corporate, employee and shareholder interests on the one hand and public interest on the other. We are committed to conducting business lawfully, ethically, and with the highest degree of integrity. We seek to comply with both the letter and the spirit of the relevant local and international tax laws and principles wherever we operate, and we anticipate paying tax on profits where our business activities take place and added value is created. If possible and ethically appropriate, we apply for tax incentives and exemptions. Such tax incentive schemes relate to eligible Research and Development activities performed by QIAGEN.
Compliance
We are committed to complying with the tax legislation of the countries in which we operate and create added value and to paying the right amount of tax at the right time. We strive for full and timely tax compliance. To minimize any tax compliance risk, a frequent review process is in place to secure timely and
96
correct tax filings and tax payments. In the execution of tax compliance, third-party tax service providers are often involved under the supervision of the Global Tax Department.
Stakeholder engagement
We seek an open dialogue with our stakeholders, including relevant tax authorities, our shareholders, customers, business partners, employees, governments, regulators, NGOs and the communities in which we operate. In some cases, QIAGEN and the respective tax authority may disagree on the correct application of local tax law. In the event of disputes, we collaborate with the respective tax authority in a fair and positive spirit to find balanced solutions in accordance with the applicable laws.
Transparency
Country-by-Country Reporting (CbCR) requires multinationals to report with aggregate data on the global allocation of income, profit, taxes paid and economic activity among tax jurisdictions in which they operate. This requires QIAGEN N.V., the ultimate parent of the QIAGEN Group, to file an annual CbCR report to the Dutch tax authorities.
We provide in the following selected, aggregated information for the regions Europe, Middle East and Africa (EMEA), North and South America (Americas) and Asia Pacific, Japan and Rest of World (APAC). We also provide more detailed information and reconciliation in accordance with the respective GRI standard on our website within the Financial Reporting section. The following information are presented in US$ thousands if not otherwise stated.
Tax Reporting
| 2021 | 2020 | |||||||||||||||||||||||||||||||||||||||||||||||||
| In '000s, except for headcount | EMEA | Americas | APAC | Total | EMEA | Americas | APAC | Total | ||||||||||||||||||||||||||||||||||||||||||
Headcount (people)(1) | 3,343 | 1,433 | 1,252 | 6,028 | 3,065 | 1,323 | 1,222 | 5,610 | ||||||||||||||||||||||||||||||||||||||||||
Income tax paid(2) | $22,170 | $75,108 | $4,805 | $102,083 | $28,645 | $6,660 | $7,267 | $42,572 | ||||||||||||||||||||||||||||||||||||||||||
Related party revenues(3) | $2,133,257 | $874,037 | $221,178 | $3,228,472 | $1,847,943 | $575,142 | $29,549 | $2,452,634 | ||||||||||||||||||||||||||||||||||||||||||
| Profit before income tax for CbCR | $260,302 | $372,301 | $12,432 | $645,035 | $181,796 | $287,392 | $14,895 | $484,083 | ||||||||||||||||||||||||||||||||||||||||||
Tangible assets(4) | $762,676 | $344,916 | $97,433 | $1,205,025 | $593,367 | $272,812 | $83,602 | $949,781 | ||||||||||||||||||||||||||||||||||||||||||
(1)The total number of employees on a full-time equivalent basis (Headcount) of constituent entities.
(2)The amounts for income tax paid during the relevant years by constituent entities resident for tax purposes in the relevant tax jurisdiction. The disclosed amounts are net and include payments and reimbursements for income tax.
(3)Related party revenues include intra-group sales revenues of all constituent entities as well as other income with constituent entities.
(4)The sum of the net book values of tangibles assets of constituent entities resident for tax purposes in the relevant tax jurisdiction does not include cash or cash equivalents, intangible or financial assets.
Financial assistance from governments
We recognize government grants when there is reasonable assurance that all conditions will be complied with, and the grant will be received. Our government grants generally represent subsidies for specified activities and are therefore recognized when earned as a reduction of the expenses recorded for the activity for which the grants are intended to compensate. Thus, when the grant relates to research and development expenses, the grant is recognized over the same period that the related costs are incurred. Otherwise, amounts received under government grants are recorded as liabilities in the statement of financial position. When the grant relates to an asset, the value of the grant is deducted from the carrying amount of the asset and recognized over the same period that the related asset is depreciated or amortized.
The company has received cost grants and investment grants. In 2021, the company received income from government grants in the amount of $1.3 million (2020: $3.0 million).
97
COVID-19 related grants
Since early 2020, we have been working closely with governments, public health authorities and customers to ensure availability of critical COVID-19 testing diagnostics across the globe, while also developing new dedicated COVID-19 tests to cover all stages of the infection cycle. In this context, QIAGEN launched its largest investment program ever to increase production capacity in Hilden (Germany), Maryland (U.S.) and Barcelona (Spain).
This investment program is being supported by a grant of EUR 18 million from the government of North Rhine-Westphalia (Germany), a grant of $0.6 million from the U.S. government and a grant of EUR 0.5 million from the Spanish government.
COVID-19 related financial measures
Governments around the world are acting decisively to protect their businesses and people from economic disruption resulting from the COVID-19 virus pandemic. QIAGEN has not proactively applied for any COVID-19-related financial stimulus. Some countries, however, have introduced generic measures that apply automatically to all or certain business areas.
Compliance
As a publicly listed company with international operations, QIAGEN is subject to regulation in various jurisdictions. Unethical behavior and non-compliance with laws and regulations have the potential to seriously harm our business, our reputation and our shareholders, and to expose our employees to personal liability. QIAGEN has established a comprehensive Compliance Program, which translates legal and regulatory requirements as well as our fundamental values into clear and precise guidelines in our Corporate Code of Conduct and Ethics, supplementing specific policies for our employees. Our Corporate Code of Conduct and Ethics can be found here on our Compliance webpage under Investor Relations.
The policies include, but are not limited to, aspects such as conflicts of interest, insider trading, revenue recognition, confidentiality and social media. Policies regarding interactions with healthcare professionals are fully compliant with the AdvaMed Code of Ethics and are described in detail in our Global Sales and Marketing Policy that includes guidelines on samples, gifts etc. Moreover, QIAGEN does not make or receive any payments to or from political parties or political action committees. Such actions have been prohibited without exception by QIAGEN’s Code of Conduct since its establishment in 1996. QIAGEN is a member of a number of industry trade associations such as AdvaMedDx (US) and MedTech (Europe) which work to advance important healthcare related initiatives with governmental and non-governmental organizations from time to time. We also collaborate with global health policy institutions such as the World Health Organization and regional consortia such as the African Society for Laboratory Medicine to improve affordable access to testing solutions for neglected diseases in low-resource settings. We had no specific expenditures for these activities in 2021.
We pay special attention to antitrust and anti-corruption laws. Our specific antitrust and anti-corruption policies support our commitment to ensure that QIAGEN and its subsidiaries abide by the antitrust and anti-corruption laws of the countries in which we operate. Our policies on anti-trust and anti-corruption can be found on our Compliance webpage under Investor Relations. We extend our Compliance Program not only to our management and employees, but also to third-party intermediaries such as distributors or agents. Our third-party due diligence program - which lies in the remit of the Global Compliance Manager - focuses on our local distributors and agents and contains the following six elements:
(1)Pre-screening, anti-corruption questionnaire and certification for new distributors, resellers and agents
(2)Annual risk assessment of selected third parties based on a calculated risk score, which factors in location of business and Corruption Perceptions Index
(3)Annual audits of the anti-corruption program and third-party risk management conducted by internal and external auditors
(4)Training for third-party distributors
(5)Contractual obligation to comply with applicable laws (including anti-corruption laws) and QIAGEN's Code of Conduct and Anti-Corruption Policy as well as compliance certification
(6)Due diligence in the form of annual background checks of random selection of third parties and ongoing monitoring
98
All our compliance policies are available to employees through the company’s Compliance@QIAGEN intranet pages. Our employees' awareness of compliance is increased by regular in-person trainings, which are held by external as well as in-house legal and regulatory experts. QIAGEN also offers an online training program focusing on topics such as antitrust and competition, bribery and corruption, conflicts of interest, data protection, gifts and entertainment, harassment, insider trading, reporting as well as respectful communication.
Online training is provided to all employees in their local language, and supported by multiple communication resources. New employees are required to take online training on our Corporate Code of Conduct and Ethics and to confirm that they have read and understood the Code. Additional training customized to the specific area of responsibility is mandatory. Employees in sales and marketing as well as upper management are required to complete training on anti-corruption and antitrust laws. These basic trainings are followed by regular refresher courses (depending on the course, from quarterly to every three years). In 2021 and 2020, our employees completed more than 7,000 online training modules. In addition, employees are informed through the Company’s Compliance@QIAGEN intranet page and regular updates on compliance topics via the company’s internal communication platform Yammer and its quarterly Compliance Newsletter. During 2021 each employee was provided with cyber security, master data governance, and health & safety near miss prevention trainings as required.
We provide a hotline for reporting accounting-related concerns anonymously and in good faith. In accordance with the U.S. Sarbanes-Oxley Act and the listing standards of NYSE, QIAGEN follows a strict non-retaliation policy. QIAGEN will diligently investigate all such complaints and will protect the anonymity of the complainant to ensure protection from retaliation as well as to secure the employment status of the complainant. We also offer a direct email and telephone hotline for employees to address questions or make suggestions for our Compliance Program.
Our Compliance Program is overseen by the Compliance Committee under the leadership of the Head of Global Legal Affairs and Compliance, who reports in this function directly to the Audit Committee of the Supervisory Board. The Compliance Committee consists of managers from Legal, Internal Audit, Human Resources, Commercial Operations, Trade Compliance and Regulatory functions.
In the reporting period, QIAGEN had no legal actions pending or completed regarding antitrust or corruption.
Data and cyber security
As the external threat landscape continues to evolve, managing cyber security risk is a priority for QIAGEN. We are committed to making investments to enhance the cyber resilience of our organization, products and services and to preserve the trust of our customers, partners and employees.
Our cyber security program ensures that data and cyber security efforts and initiatives reflect evolving business requirements, regulatory guidance, and emerging threats.
Our data and cyber security-related processes are based on the ISO 27001 standard as well as the Information Security Forum Standard of Good Practice. Global cyber security and privacy requirements are actively monitored for and discussed as part of QIAGEN's Cyber Security Council as well as Data Protection committee meetings. Cyber Security risks are managed as part of QIAGEN's Enterprise Risk Management and regularly reported to the Audit Committee.
We have supporting privacy and cyber security policies and guidelines in place which are reviewed and approved as part of QIAGEN’s Cyber Security Council and Compliance committee procedures. These documents are available to all employees on QIAGEN’s intranet and we offer further mandatory training on a regularly basis, during which we carry out knowledge checks to ensure that the content was understood by the trainees. We also conduct regular 'phishing' simulations, awareness webinars and workshops on important security topics, as well as role specific trainings.
Recognizing the increasing cyber threat landscape and the importance of preparation for cyber incidents, we refreshed our Cyber Incident Response procedures in 2021. To our knowledge, we did not experience any material cyber security incidents or material breaches of customer data privacy, cases of data theft or data loss related to customer data in 2021. We also did not record any well-founded privacy complaints with Data Protection Authorities.
Our Cyber Security team pro-actively monitors for exposed weaknesses in the organization's systems and services. In addition, we are working with CREST (Council for Registered Ethical Security Testers) certified partners to conduct regular security assessments of our infrastructure. To facilitate information and
99
knowledge exchange, QIAGEN has joined well-known industry and governmental cyber security communities like the Information Security Forum (ISF), Allianz fuer CyberSicherheit, UK Cyber Security Information Sharing Partnership, Health-ISAC and Cyber-Sicherheitsrat Deutschland e.V.
Social matters
QIAGEN’s mission is to make improvements in life possible by enabling our customers to achieve outstanding success and breakthroughs in life sciences, applied testing, pharma and molecular diagnostics. We are committed to delivering our customers and their patients innovative solutions that unlock new insights for scientific research, forensics, food safety or better treatment decisions. We understand and live up to our responsibility to customers and patients who depend on us for reliable, efficient and safe workflows.
Customer satisfaction
Customer satisfaction is an integral part of the QIAGEN mission of making improvements in life possible. Our customers have high expectations in terms of the reliability, safety and environmentally friendly manufacturing of our products. We develop our products and services in close consultation with our customers and incorporate their feedback into our processes.
We commit to continually improving our customers’ experience, taking into account their evolving needs and expectations. Globally, we have established a systematic approach to measure customer experience in the form of an aggregated Customer Experience Indicator. This is measured monthly through a set of internal KPIs – such as product and delivery performance or phone support – and external customer feedback linked to customer experience in our transactions. This allows us to quickly and reliably identify areas for improvement.
Departmental and employee contributions to performance are embedded into our annual goal-setting process. For 2021, we achieved a year-to-date (Jan to Oct) score of 94.4 points out of a maximum of 100 points, versus 92.6 points in 2020. The increase compared to the previous year indicates an improvement in performance throughout all regions, primarily in the area of product availability but also in our ability to respond to customer inquiries, both commercial and technical.
Quality and product safety
QIAGEN stands for quality. Since our founding in 1984, we have been committed to the highest quality, and strive to exceed our customers’ expectations. Our reputation as a quality supplier is best-in-class in our industry and is the foundation of our loyal global customer base. Our products are designed and developed following state-of-the-art usability standards and are verified and validated according to their intended purpose.
To achieve and maintain our quality standards, we established quality management systems (QMS) in all our manufacturing facilities worldwide. These assure consistent high quality, as well as safe and effective medical devices. QIAGEN’s QMS are certified according to ISO 9001, ISO 13485, ISO 18385, and comply to 21 CFR 820 and all other applicable medical device standards around the world (see section “Government Regulations” in the Management Report). Furthermore, we are committed to regularly adapting our system to new or revised regulatory requirements like the new European In Vitro Diagnostic Devices Regulation EU/2017/746 (IVDR).
Our products and their components are safe to use by customers and our employees. In the early stages of product development, the Chemical Compliance Department provides a statement and guidance on the use of specific substances. During this evaluation, we put special emphasis on substances of very high concern (according to REACH in the EU) and ensure that these substances are not added to new products. We use a component tree to reach this goal – a list of all materials that can be used in development, including an overview of qualified substances, suppliers, components and substances that must not be used (i.e. substances of concern). We have also developed a strategy to reduce substances of concern in our production processes.
When assessing the manufacturability of a new product, the evaluation considers technical aspects, regulatory requirements, financial aspects and timeline constraints. We aim to fully eliminate the use of OPnEO and NpnEO (substance groups for substances of very high concern) and have launched a project to substitute OPnEO and NpnEO in non-regulated/non-in-vitro diagnostic (IVD) products within the next four years, and in IVD and otherwise regulated products
100
within the next nine years. To do this, we conducted a detailed technical evaluation to assess the scope and feasibility of substitution of substances of concern. A holistic analysis of multiple parameters will determine the prioritization and sequence of substitution. Such parameters consider:
•volume and concentration of substances of concern in an affected product;
•total annual volume turnaround of the affected product and substance;
•economic aspects (revenues and revenue projection) of the affected product;
•complexity of substitution; and
•product sustainability.
This systematic approach allows us to determine the most effective substitution of substances of concern from affected products.
To ensure the compliance of our products, including automated system products, QIAGEN uses software configured to support supply chain communication and data evaluation. It also monitors conformity with directives such as REACH, RoHS, the Waste Framework and Conflict Minerals.
Our transparent and responsible product and development policy also includes communication and marketing. As with all companies in the medical device/IVD industry, our product claims and properties are verified and validated during development and approved by regulatory bodies around the world as part of the product submission process. All IVD products are specially tested for safety and usability during development. We market products only in accordance with their approved intended purpose and declare potential residual (or remaining) risks in the instructions for use of each product.
QIAGEN, like other companies, is exposed to the financial implications of potential recalls and other adverse events due to equipment failure, manufacturing defects, design flaws, or inadequate disclosure of product-related risks. In the event of a recall, we have established global procedures applicable to all QIAGEN sites that aim to avoid the further use of the product and to guarantee cost-neutral procedures for our customers. We guarantee full traceability of each product to the final customer and can therefore notify customers directly in the event of a recall. Required actions for recalls depend on the individual case. They can range from providing additional information to physically recalling a product. We have defined processes, responsibilities, and improvement programs as required by regulating authorities to avoid the recurrence of recalls. Due to our stringent quality management, recalls rarely occur. In past recalls, we were able to reach 90% to 100% of customers to confirm the recall.
Recalls and Affected Products
| 2021 | 2020 | 2019 | 2018 | 2017 | 2016 | 2015 | ||||||||||||||||||||||||||||||||||||||
| Number of recalls | 6 | 6 | 3 | 4 | 0 | 3 | 1 | |||||||||||||||||||||||||||||||||||||
| Percentage of affected products | 0.08 | % | 0.14 | % | 0.15 | % | 0.09 | % | 0.00 | % | 0.21 | % | 0.02 | % | ||||||||||||||||||||||||||||||
Access to healthcare
We are committed to leaving no one behind when it comes to providing equitable and affordable access to our products across all regions and business areas. In certain areas, we have increased our efforts even further, such as in providing access to COVID-19 testing as part of our contribution to end the global pandemic. We also developed new tools and innovations for tuberculosis (TB) testing and brought TB infection tests to rural areas with little or no laboratory infrastructure. And we helped advance women’s health by closing long-term agreements with the World Health Organization and United Nations Population Fund, among other international bodies, to supply our human papillomavirus (HPV) products to developing countries at the lowest global price.
To help coordinate our efforts on a global scale, in 2021, we created a Global Public Health Task Force composed of representatives from each region where QIAGEN operates. The task force is responsible for developing strategies and initiatives that advance our access goals, with a particular focus on marginalized and vulnerable populations, low resource areas, developing countries, rural communities, and gender-based equity, among other priorities. This group will report on specific metrics and outcomes in 2022.
101
In addition to our core business activities, “QIAGEN Cares” is the company’s Corporate Social Responsibility program, an umbrella for supporting initiatives that improve lives by fighting diseases in which our products can play an important role. These are helping to find new ways to ensure developing countries with scarce resources gain access to affordable diagnostics that play a critical role in helping to prevent and treat diseases. Infectious diseases and various malignancies can be treated much more cost-effectively and with improved patient outcomes through early and precise detection. Yet many developing countries lack properly trained lab personnel and technical infrastructure to utilize the latest molecular testing technologies.
We therefore collaborate with non-governmental health organizations, local nonprofits, and ministries of health on capacity building programs, research projects, training and educational initiatives to help ensure efficient distribution of our products. This year, QIAGEN committed to work with international experts and local partners to undertake a broad infrastructure project in Africa supporting centers of excellence and national reference laboratories on the continent to ensure laboratories have appropriate infrastructure to absorb our product offerings.
In terms of our commitment to affordability, QIAGEN is committed to offering UN agencies, public health authorities, non-profit organizations, and non-governmental organizations operating in low-resource, high-burden countries access to the lowest available global price for our products. This pricing transparency is publicly listed on the websites of the international bodies that procure our products. In most cases, countries that are eligible for Global Fund financing qualify for our global health pricing.
In addition to offering the lowest global price for global health customers, we have also scaled up donations to areas most in need. Our social responsibility efforts aim to provide access to cutting-edge molecular technologies to people worldwide, regardless of their economic or social status, including diagnostic solutions designed especially for settings where limited medical resources are available. In this context we revised and expanded our Global Donation and Sponsorship Policy, which included creating a Global Donation Review Committee in 2022 to help streamline and scale-up these donation activities.
In 2021 our Life Sciences teams were also active in providing research grants and support to various public health, research and academic laboratories in Europe, Asia and North America. For example, the team provided a non-monetary dPCR grant to a public health lab in the United States to support a novel workflow. Six applications were received and the best application was selected for digital PCR.
In Europe, the BioPharma team initiated a Biotech Grant in 2021 specifically aimed at young biotech companies. Grant winners receive up to US $100,000 in instruments and reagents. Finally, in Asia, a research grant was announced for academic institutions in Indonesia, Malaysia, Philippines, Singapore, Thailand and Vietnam, providing two winners with US $10,000 each in dPCR consumables. One of the winning entrants is a cardiovascular research institute that submitted a proposal to decipher the role of identified non-coding RNAs in the disease progression of heart failure.
Tuberculosis
QIAGEN is leading a global effort to advance diagnostics for tuberculosis (TB) and Human papillomavirus (HPV) in low-resource, high-disease burdened countries. Tuberculosis is one of the world’s leading infectious disease killers, claiming three million lives in 2020. It was the first time in more than a decade that TB deaths had increased, due to the effects of the COVID-19 pandemic. We are committed to helping find and treat more cases of TB as countries continue to recover from the decline in case detection caused by the pandemic.
More than 100 million QuantiFERON-TB (QFT) tests have been made available in more than 130 countries, and it has become the recognized gold standard test for TB infection. In October 2021, QIAGEN launched QIAreach QTF, a novel, field-friendly test with ultrasensitive digital detection. It utilizes the same QFT technology built into a fully portable device to help meet a previously unmet medical need in low-resource, decentralized and rural areas. As such, we are committed to making it accessible and affordable in all eligible country partners of The Global Fund to fight AIDS, Tuberculosis and Malaria. To do this we are working with key stakeholders at the country and global levels, including the Stop TB Partnership and the Global Drug Facility, who will be instrumental in helping achieve broad access via their pooled procurement strategies. Programs are already underway in more than a dozen high-burden countries to roll out QIAreach QFT with the goal of identifying and treating more than one million TB patients within the first three years. A QIAreach QFT donation program will also be launched in 2022.
In 2021, QIAGEN was also recognized by the Treatment Action Group as one of the leading private sector investors in TB diagnostics research and development, after increasing our contribution from 2019 and dedicating nearly $4 million in R&D activities in 2020. Importantly, we were very proud to be
102
listed among the top private sector investors in pediatric TB R&D, doubling our contribution in this area over the previous year. Children are often a neglected segment of this already neglected disease. The unique needs of children and adolescents require new tools and innovations, and QIAGEN is a leader in developing testing solutions suitable for this vulnerable population.
Women's health
Over 100 million women have been screened for HPV with a QIAGEN test from our women’s health portfolio, which includes careHPV, QIAscreen and QIAsure. Our goals for these HPV testing solutions are to expand our collaborations with multinational agencies and the NGO community active in the field, particularly in sub-Saharan Africa where HPV testing is ramping up. We aim to reach another 100 million women over the next several years.
In 2021, QIAGEN was recognized by the Clinton Health Access Initiative (CHAI) in a joint WHO/UNAIDS consultation meeting for providing careHPV, the lowest cost HPV test currently available in the market, for public health programs and UN procurement agencies. QIAGEN remains committed to maintaining the lowest global price and has announced an additional donation scheme of careHPV instrumentation for global health partners who commit to working towards scaling up HPV testing in their public health programs.
COVID-19 testing
Since the start of the COVID-19 pandemic, we have been working closely with governments, public health authorities and customers to ensure worldwide availability of critical COVID-19 testing diagnostics, while also developing new dedicated COVID-19 tests to cover all stages of the infection cycle. In order to meet the high demand for COVID-19 tests, we dramatically scaled up production, moving to 24-hour, seven-day-a week operations at our manufacturing sites, and investing in additional equipment capacity.
Dedicated COVID-19 tests brought to market since the start of the pandemic include:
•QIAStat-Dx Respiratory SARS-CoV-2 Panel (EUA, CE-IVD) intended for the qualitative detection and differentiation of nucleic acid from multiple respiratory viral and bacterial organisms, including the SARS-CoV-2 virus, in nasopharyngeal swabs
•NeuMoDX single-plex and 4-plex assays (EUA, CE-IVD) a rapid, automated, in vitro real-time RT-PCR diagnostic test for the direct detection of SARS-CoV-2 Coronavirus RNA from nasopharyngeal, oropharyngeal and nasal swab specimens
•Artus SARS-CoV-2 Prep&Amp UM (CE-IVD) a solution that streamlines RNA extraction and PCR analysis into one process, delivering a result in under one hour and requiring less disposable laboratory plastic-ware than standard PCR tests, helping to avoid resource bottlenecks
•QuantiFERON SARS CoV-2 T cell immune response (CE-IVD) intended to aid in assessing cell-mediated immune (CMI) response in individuals without a history of SARS-CoV-2 infection and who have received COVID-19 vaccination using vaccines targeting the viral spike (S) protein of the SARS-CoV-2 virus.
•QIAseq Direct SARS-CoV-2 and QIAseq SARS CoV-2 primer panel for fast targeted whole genome library preparation of SARS-CoV-2 for genomic surveillance and variant detection; and a suite of next generation sequencing (NGS) and bioinformatics tools - used for epidemiological studies.
Support for local initiatives
We support a broad range of activities in communities where our businesses are based. Our expanded Global Donation and Sponsorship Policy and new Global Donation Committee will help to streamline and scale-up our activities. These include sponsorship of science education, disease awareness campaigns, the installation of school laboratories and promotion of biology in school curricula. Our local engagement goes beyond financial support. In Hilden, for example, we collaborate with the local Rotary Club to help integrate refugees from Syria and other war-torn countries through a program that includes language training and cultural orientation, assessment centers, and internships at QIAGEN.
Hilden also works with Hephata, a local institution for citizens with disabilities, who undertake a broad range of operational tasks for the company, including certain packaging and production responsibilities.
103
In North America, our employees are granted eight hours of paid community service time per year, and in 2021 contributed around 780 hours of volunteer time to meeting community needs. Our Community Service Committee mobilizes volunteers and provides company funds for projects that improve the lives of people locally and nationally.
EU Taxonomy
On December 9, 2021, the European Union formally adopted its delegated taxonomy regulation. The aim of the European Taxonomy Legislation (EU Taxonomy) is to create a uniform language and understanding for sustainable economic activities. To this end, legally binding criteria will be used to define whether certain economic activities contribute significantly to the six key EU environmental goals.
The legislation is still under development: by the beginning of 2022, the taxonomies for two of the six EU environmental goals had been adopted, namely for climate protection and adaptation to climate change (so called Climate Taxonomy) The Environment Taxonomy, i.e., the requirements for the other EU environmental targets as well as are still being developed.
The EU Taxonomy only includes economic activities that are of particular importance for the transformation to an environmentally and climate compatible economy. If a company has no or few economic activities as defined in the taxonomy, then it may be less important for the achievement of the European environmental goals, but this does not imply a negative statement about the environmental performance of the company.
The reporting requirements of the EU Taxonomy include the disclosure of information on how and to what extent activities are associated with activities defined in the EU Taxonomy, using Key Performance Indicators (KPIs) for the proportion of sustainable turnover, capital expenditure (CapEx) and operational expenditure (OpEx). The initial legislative only included the criteria for aligned for CapEx and OpEx. On February 2, 2022, the Commission published more guidance on eligible CapEx and OpEx.
Currently, there is little guidance available on how to interpret the EU Taxonomy. The relevant rules and regulations are still under development. In the coming years, economic activities and environmental objectives will be further elaborated upon, and more guidance will become available.
In 2021, we have examined to what extent we generate revenue from economic activities that are included in the so-called Climate Taxonomy, i.e. in the delegated regulation (EU) 2021/2139. It turned out that our economic activities in the reporting period 2021 are not taxonomy-eligible.
Furthermore, we assessed that we cannot provide the CapEx and OpEx in line with the EU Taxonomy considering data availability limitations and expected low materiality. However during 2022 we will continue to monitor the further development of the EU Taxonomy reporting requirements for non-financial undertakings and will revalidate assessments and disclosures periodically and also will further improve the granularity of relevant information in our global financial reporting systems in order to make them entirely available at the respective aggregation level.
104
QIAGEN's ESG performance at a glance
| Environment | Social | Governance | ||||||||||||
Climate •417,361 tCO2e total carbon footprint for Scope 1, 2 (market based) and 3 •88,087 MWh total energy consumption •100% renewable energy for main production site in Hilden Water •131,870 m3 freshwater use •5,371 m3 in areas with high or extremely high water stress level Waste •9.6% plastic footprint reduction in 2021 compared to 2020 •63% less plastic and 42% less cardboard used for each kit in QIAwave product line •2,434 t total waste Product life cycle assessment •LCAs for best-selling product in accordance with ISO 14040/14044 | Access to healthcare •Production scale-up to meet the demand for COVID-19 tests •More than 100 million QuantiFERON tests for tuberculosis have been made available in more than 130 countries to date •More than 100 million women screened for HPV with a QIAGEN test Local initiatives •780 hours of volunteer time committed to meeting community needs in North America Attractive employer •6,028 employees, 11.1% turnover •6.6% turnover at Management level •Top Employer Certificate in Germany and China •Approximately 95,000 hours of trainings completed Diversity and Inclusion •Diversity & Inclusion program driven by ECEO and D&I ambassadors •34% of women in leadership roles •Perfect score of 100% on the HRC CEI •Listed in 2022 Bloomberg Gender Equality Index Health and safety •0.85 DART rate (per 100 employees) •0.97 recordable incident rate •40 work-related injuries •0 work-related fatalities | Human rights •Human Rights Policy provides guidance for our relationship with customers, product use, employees, and in our supply chain Ethics In R&D •Global procedures for clinical studies in place (Declaration of Helsinki, GCP, ISO 20916) Compliance •More than 7,000 online training modules completed Data security •Processes are based on the ISO 27001 •No material cyber incidents Tax •$102 million income tax paid Quality and product safety •94,4/100 Customer Experience Indicator •0.08% of products affected from a total number of 6 recalls Sustainable supply chain management •Approx. 8,300 suppliers in over 70 countries •75% of purchasing volume sourced from OECD countries •Conflict mineral inquiries for all direct suppliers | ||||||||||||
105
Remuneration Report 2021
Letter from the Chair of the Compensation & Human Resources Committee
On behalf of the Compensation & Human Resources Committee, I am pleased to provide this report on the Committee’s activities during the last year and to present the Remuneration Report for 2021, as approved by the Supervisory Board.
In June 2021, our updated Remuneration Policy for the Managing Board was approved at the Annual General Meeting. In the update, we took the opportunity to revise the Policy to incorporate current best practices, as well as to further align the interests of our stakeholders, in particular shareholders, with those of our Managing Board members. Our common ambition: reward long-term value creation while enhancing our long-standing “pay for performance” culture.
The results of QIAGEN for 2021 clearly underscore the progress QIAGEN has made in achieving our vision of making improvements in life possible. Sales rose above $2 billion for the first time in 2021, led by 22% growth at constant exchange rates (CER) in the base portfolio. These gains were complemented by 13% CER sales growth in products used in COVID-19 pandemic testing and surveillance. Profitability improved at a faster pace, with adjusted diluted earnings per share (EPS) rising 23% to $2.65. Cash flow generation in turn was very strong, as operating cash flow grew 40% to $639 million and supported investments into our five pillars of growth involving QIAGEN’s most promising product portfolios.
Throughout the year and with the support of our external consultants from WTW (Willis Towers Watson), the members of the Committee closely monitored compensation trends in the global, regional and local labor markets.
Our recommendations from the Committee were approved by the Supervisory Board in regard to remuneration for Managing Board, as well as for the remuneration of the Supervisory Board. We believe the remuneration granted for 2021 reinforces our commitment to reward outstanding results while also taking into account the feedback and interests of stakeholders, including shareholders, to ensure long-term value creation and to apply the Remuneration Policy in a fair and transparent manner.
We believe this report will meet with far greater shareholder acceptance than the Remuneration Report for 2020, which was based on the prior Remuneration Policy, and which did not receive majority approval from shareholders. After the last AGM, the Compensation Committee sought active engagement with shareholders and invited clarification of questions, opinions and suggestions for improvement in the implementation of the new Policy.
Key topics include the following:
•We no longer grant Restricted Stock Units (RSUs) to Managing Board members, as was allowed under the old policy up to and including 2020. As of 2021, all share grants will be done in the form of Performance Stock Units (PSUs) that are conditional and based on the achievement of challenging targets set by the Compensation Committee. Full transparency will be provided in the Remuneration Reports on the performance delivered and the achievement levels.
•After the unprecedented volatility created by the COVID-19 pandemic, we have implemented a three-year measurement period for the Long-Term Incentive (LTI) program grant in 2022. The Committee has taken notice of reservations by shareholders toward the one-year performance period used for 2021, and we emphasize that this was due to an exceptional environment. The performance assessment will be based on the achievement of a three-year cumulative net sales target along with a three-year target for the average adjusted operating income margin. Details on these targets are included in this Report. The use of these targets will also help to further increase differentiation from the targets set for the annual Short-Term Incentive (STI) targets.
•The targets in regard to Environment, Social and Governance (ESG) performance have taken on a greater importance in setting the annual QIAGEN Team Goals, which are reviewed in determining the annual performance for the STIs. We have decided to increase their weighting and impact in view of QIAGEN’s sustainability ambitions and in response to stakeholder comments on the importance of this topic. This is also aligned with the commitments made by QIAGEN on ESG topics, which include becoming carbon-neutral by 2050 and making further progress on our long-standing aim to increase the share of
106
women in senior management roles. We have found that the ability to measure ESG targets has been improving, and are considering ways to implement ESG targets in the future into our LTI programs.
•Some shareholders have provided feedback on the legacy agreements with our current Managing Board members in regard to a Change of Control situation involving QIAGEN. The Remuneration Policy approved at the AGM in 2021 stipulates that the cash compensation payments in the event of a change of control will not exceed one year of base salary, and this new Policy will be applied to any new Managing Board members.
Having taken into account the feedback of shareholders and other stakeholders in this Report, the Committee believes the remuneration to the Managing Board as outlined supports the long-term growth and success of QIAGEN and is consistent with a very large part of the input received. We look forward to your support for this Report in the advisory vote at the AGM in June 2022. I also note that no changes to the Remuneration Policies for the Managing Board and Supervisory Board are planned to be presented to shareholders at the AGM.
The Compensation Committee appreciates the ongoing critical input and constructive dialogue with our shareholders and stakeholders during 2021, and we look forward to extending this active engagement. If you have any questions or comments on the contents of this letter or require any additional information, please do not hesitate to contact me via our Investor Relations team at ir@qiagen.com.
Yours sincerely,
Elizabeth E. Tallett
Chair of the Compensation & Human Resources Committee
April 2022
107
Managing Board Remuneration
This section of the Remuneration Report provides a summary of the Remuneration Policy of the Managing Board that was adopted by the AGM in 2021 and an account of how it was implemented in 2021. It also presents the details of the actual remuneration outcomes for our two Managing Board members for their performance during the year.
This Remuneration Report complies with the European Directive (EU) 2017/828 on Shareholder Engagement, SRD II, as implemented into Dutch law. It also complies with the Dutch Corporate Governance Code and provides an explanation where other tried and proven policies are given precedence. The 2021 Remuneration Policy is available on the QIAGEN website at www.qiagen.com.
Remuneration Policy summary
Remuneration as a strategic instrument
The Remuneration Policy for the Managing Board supports the long-term development and strategy of QIAGEN in a highly dynamic environment while aiming to address the views of various stakeholders and maintaining an acceptable risk profile. It builds on remuneration principles and practices that have proven to be both fitting and effective for QIAGEN. The Supervisory Board ensures that the Remuneration Policy for the Managing Board and its implementation are linked to our objectives.
More than ever, the ambition for QIAGEN is to stay true to its mission of advancing the use of its products and solutions for molecular research and clinical testing. These help us achieve our vision of making improvements in life possible. QIAGEN is a global leader in providing a differentiated portfolio of products and services used across the continuum from research in Life Sciences to clinical healthcare using novel products and solutions that are used to unlock valuable insights from any biological sample. Founded in Germany in 1984, QIAGEN has grown by developing new solutions based on consumables kits, related instruments and bioinformatics to meet the diverse and rapidly changing needs of more than 500,000 customers worldwide.
QIAGEN’s strategy is focused on innovation and sustainable value creation with an emphasis on increasing growth, efficiency, engagement and improving customer experience. To successfully develop and implement this strategy, we need to attract and retain highly trained employees at all levels, including the executive management level. U.S. practices have been taken into consideration to set competitive remuneration levels given that many of our leaders, customers, competitors and employees are in this country.
Remuneration principles
QIAGEN strongly believes in competitive remuneration as a precondition to attracting intrinsically motivated top talent throughout all levels of the organization. Furthermore, we believe in a "pay for performance" culture that is based on creating a shared focus on setting ambitious operational and strategic targets that are not rewarded when they are not achieved, rewarded at target when fully achieved and additionally rewarded when the targets are exceeded.
A system of corporate, team and individual performance goals applies to all members of our global workforce. The percentage weighting toward Corporate Goals, and less for Personal Goals, shifts as job levels rise. Likewise, the variable portion of pay linked to achievement of ambitious annual Corporate Goals as a share of total direct remuneration increases with each job level, in line with greater responsibility and more significant impact on the Company’s results.
At the executive level, QIAGEN believes that pay for performance should primarily focus on long-term value creation for shareholders and other stakeholders. Short-Term Incentives (STIs) are essential to highlight the operational targets that are a precondition to realizing our strategy. Long-Term Incentives (LTIs) have the benefit of both being achieved only if QIAGEN is successful in delivering on ambitious goals while they also contribute to long-term retention. In view of these aspects, variable components represent the most significant element of total remuneration.
The remuneration principles are simple, transparent and provide internal consistency. It helps the Supervisory Board to maintain equitable internal pay ratios that support efficient talent recruitment and development and succession planning. The principles are ingrained in our culture, and have proven successful in attracting the global talent that QIAGEN needs to successfully develop and implement a sustainable growth strategy.
108
Remuneration Policy principles
| Simple and transparent | Remuneration schemes are clear and practical | |||||||
| Compliant | Remuneration conforms to high governance standards | |||||||
| Aligned | Remuneration is true to our mission, vision and strategy, ensures internal pay consistency | |||||||
| Competitive | Remuneration is competitive and benchmarked to relevant peers | |||||||
| Performance-driven | Major portion of remuneration value is at risk | |||||||
| Long-term focus | Share-based incentives focused on sustainable long-term value creation | |||||||
Benchmarking to set competitive remuneration levels
The Remuneration Policy and overall remuneration levels offered to members of the Managing Board are benchmarked regularly against a selected group of reference companies to ensure overall competitiveness.
The benchmarking group consists of both European and U.S.-based companies. This is due to QIAGEN’s international scope as a Dutch corporation with stock market listings on the New York Stock Exchange and the Frankfurt Stock Exchange, its strong commercial presence in the U.S. with over 40% of total sales in this country, and the large percentage of U.S. citizens in the Supervisory Board (62%), Managing Board (50%) and in senior leadership roles.
Additionally, this benchmarking group also reflects QIAGEN’s significant U.S. shareholder base and the location of key competitors. It is designed to provide a balanced mix of companies, particularly in the Life Sciences and diagnostics industries. The median remuneration in the benchmarking group serves as a reference level for total remuneration.
The following 18 companies were in the reference group for 2021. They have been selected based on their market capitalization, direct competition for talent, similar complexity, scope of international activities, presence in similar industries and data transparency. The benchmarking group includes seven European and 11 U.S. companies, as listed in the table below, to provide the best comparison and reflect our global competitive position.
Benchmarking group composition
| Europe | United States | |||||||||||||||||||||||||
| BioMerieux SA | Merck KgaA | Agilent Technologies, Inc. | Charles River Laboratories International, Inc. | Illumina, Inc. | ||||||||||||||||||||||
| Carl Zeiss Meditec AG | Sartorius AG | Avantor, Inc. | EXACT Sciences Corporation | PerkinElmer, Inc. | ||||||||||||||||||||||
| Diasorin S.p.A. | Tecan Group AG | Bio-Rad Laboratories, Inc. | Hologic, Inc. | Waters Corporation | ||||||||||||||||||||||
| Eurofins Scientific SE | Bruker Corporation | IDEXX Laboratories, Inc. | ||||||||||||||||||||||||
Supervisory Board evaluation
The Supervisory Board annually reviews the remuneration practices to ensure they remain aligned with QIAGEN’s business demands, stakeholder and shareholder interests, and developments among benchmark companies.
On an annual basis, the Supervisory Board sets the performance targets for the members of the Managing Board, reviews their performance against predetermined targets and determines the remuneration and benefits in line with contractual terms. In making this determination, the Supervisory Board considers the market conditions in which QIAGEN operates, financial performance and strategy implementation.
The Supervisory Board ensures that the remuneration of Managing Board members incentivizes the right behaviors desired for the sustainable success of QIAGEN while also providing the members with fair and attractive remuneration. Furthermore, the Supervisory Board performs an analysis of the possible outcomes for the variable components and how they may affect total remuneration. Through its statutory power, the Supervisory Board has the discretionary right to adjust the variable compensation of the members of the Managing Board if compensation would conflict with principles of reasonableness and fairness in both an upward and downward direction.
109
The Compensation Committee advises the Supervisory Board and prepares resolutions with respect to the review and execution of the Remuneration Policy. In case of policy changes, the Supervisory Board submits the proposals to an AGM for adoption.
Support for Remuneration Policy
As a global company incorporated in the Netherlands, as well as with stock market listings in the U.S. and Germany, QIAGEN intends to fully comply with relevant legal requirements and governance best practices. We engage on a regular basis with stakeholders, including shareholders, on our policies and regularly seek their feedback. Within QIAGEN, the policies for our employees are transparent and meet broad support from teams around the world. Key attributes include creating a strong "pay-for-performance" culture for all employees while ensuring strong internal consistency.
The Compensation Committee monitors the developing views on compensation among shareholders and other stakeholders in Europe, the U.S. and other markets worldwide. The level of support in society for the Remuneration Policy that QIAGEN applies is important for the Supervisory Board, and has been taken into account in formulating the various elements.
Managing Board remuneration structure
Remuneration for Managing Board members consists of a combination of base salary, STIs in the form of cash tied to the achievement of annual performance goals and LTIs granted in share units that only vest after multiple years upon the achievement of predefined targets. In addition, Managing Board members can receive deferred compensation arrangements and other benefits in line with local market practice.
The remuneration package for Managing Board members is designed to have the vast majority paid in variable awards as part of the "pay-for-performance" culture and to align their interests with stakeholders to generate long-term value. The amount of these variable awards can differ substantially from year to year and depend on actual performance. Within the variable component, the incentives for short-term operational performance have a lower weight than the long-term incentives, which are again aimed at creating sustainable value for QIAGEN's shareholders and other stakeholders. This is achieved by strongly linking long-term compensation through equity with the outcomes for shareholders in terms of share price appreciation.
110
The following charts provide information on the remuneration mix for Managing Board members for 2021.
| Thierry Bernard: | Pay mix at target performance | Pay mix at maximum performance | ||||||
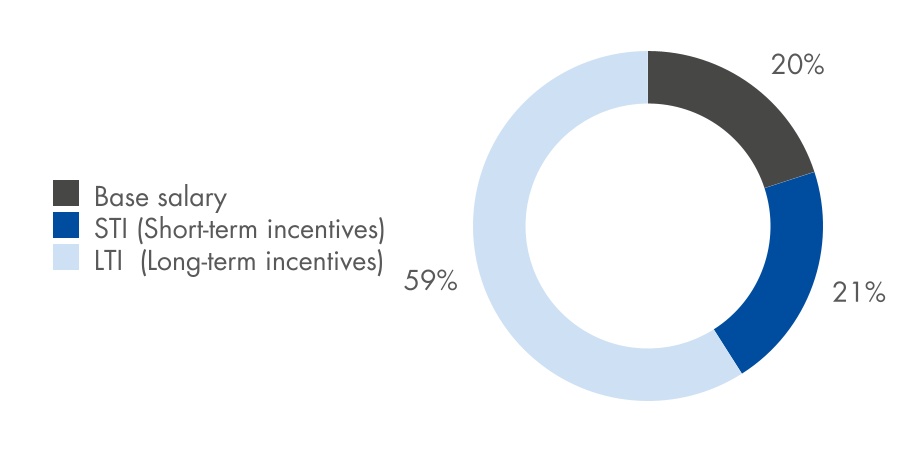
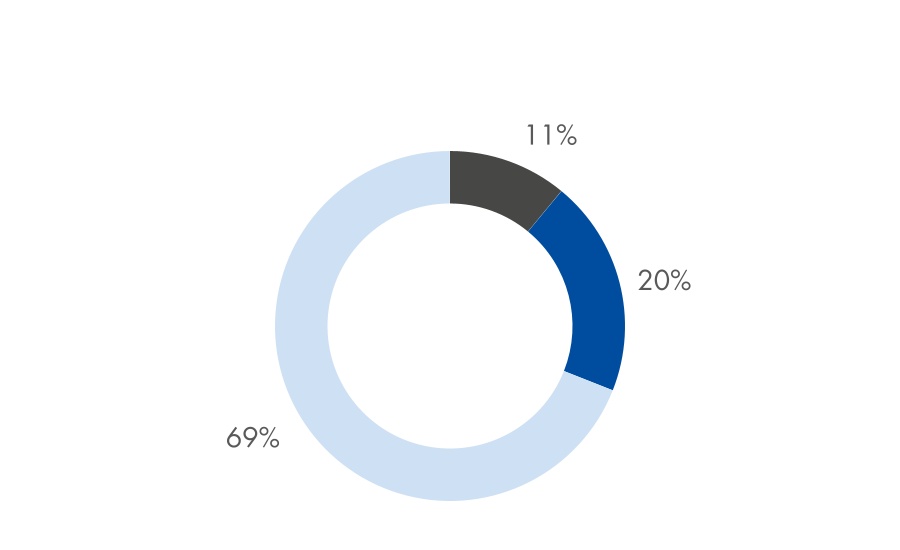
| Roland Sackers: | Pay mix at target performance | Pay mix at maximum performance | ||||||
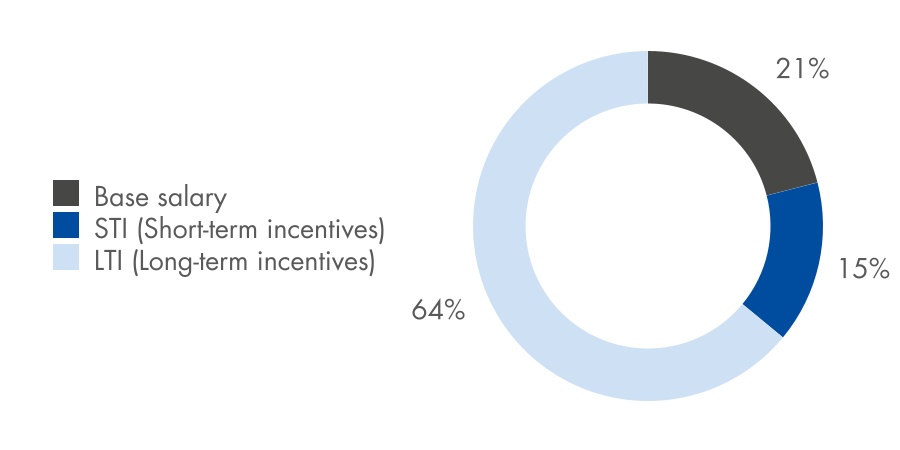
111
2021: Managing Board remuneration structure
| Fixed remuneration | Base salary •Below market practice to allow for a higher share of long-term variable share-based compensation | |||||||
Deferred compensation and other benefits •Below market practice | ||||||||
| Variable remuneration | Short-Term Incentive (STI); Cash payment provides incentives for strong annual financial and non-financial performance as the basis for long-term strategy and sustainable value creation •Opportunity at 100% target achievement: –CEO: 110% of base salary –CFO: 70% of base salary •Performance goals over one-year measurement period: –75% Corporate Goals comprised of 50% Financial Goals (capped at 200%) and 25% Team Goals (capped at 120%) –25% Personal Goals (capped at 100%) –Maximum payout therefore capped at 1.55 times target •Metrics measured over one year against budgeted targets | |||||||
Long-term Incentive (LTI): Performance Stock Units provides incentives for value creation over a multi-year period and the achievement of goals that are aligned with long-term strategy •Opportunity for all Managing Board members –At target to 300% value of fixed remuneration •Performance goals set for a one-year period for 2021 grants due to exceptional nature of the COVID pandemic (return to three-year performance periods starting in 2022) –50% Net sales –50% Adjusted operating income margin (% of sales) –Three-year vesting period with cliff vesting •Driven by performance –No PSUs are earned if minimum threshold performance levels are not achieved, while maximum vesting capped at two times total opportunity in the event of significant overperformance •Net share settlement | ||||||||
2021: Managing Board remuneration implementation
The remuneration of the Managing Board in 2021 is based on the Remuneration Policy for the Managing Board, as approved by shareholders in 2021. It includes any remuneration granted by any consolidated subsidiary.
The remuneration of the Managing Board as reflected in the table below is based on incurred accounting expenses in 2021 for the cash and share-based components. For the stock plan awards, this valuation is most insightful for the different grants awarded under current and previous policy and are running concurrently. The share-based expense of Mr. Sackers in 2021 includes grants that are vesting over three, five and 10 years of service on the Managing Board. The LTI levels for Mr. Bernard take into account that he joined the Managing Board in 2020. An overview of all share grants outstanding and their status in vesting and release is presented in the tables below under the header "Share-based rights."
112
In $ '000s(1) | Fixed remuneration | Variable remuneration | Proportion of fixed and variable remuneration including share-based award expense | |||||||||||||||||||||||||||||||||||||||||
| Managing Board member | Base salary | Deferred compensation | Other benefits(2) | Short-term incentives | Long-term incentives(3) | Total | ||||||||||||||||||||||||||||||||||||||
| Thierry Bernard Chief Executive Officer | 900 | 90 | 40 | 1,076 | 4,475 | 6,581 | 16% / 84% | |||||||||||||||||||||||||||||||||||||
| Roland Sackers Chief Financial Officer | 606 | 128 | 96 | 476 | 5,902 | 7,208 | 12% / 88% | |||||||||||||||||||||||||||||||||||||
| Total Managing Board | 1,506 | 218 | 136 | 1,552 | 10,377 | 13,789 | 13% / 87% | |||||||||||||||||||||||||||||||||||||
(1)The salary of Mr. Bernard is set in U.S. dollars. The salary of Mr. Sackers is set in euros and subject to fluctuation of exchange rates when reported in U.S. dollars. The exchange rate used for translation was EUR 1= USD 1.1832.
(2)Amounts include, among others, car lease and reimbursed personal expenses such as tax consulting. We also occasionally reimburse our Managing Directors' personal expenses related to attending out-of-town meetings but not directly related to their attendance. Amounts do not include the reimbursement of certain expenses relating to travel incurred at the request of QIAGEN, other reimbursements or payments that in total did not exceed $10,000, or tax amounts paid by the Company to tax authorities in order to avoid double-taxation under multi-tax jurisdiction employment agreements.
(3)The value of stock plan grants is based on incurred accounting expenses under IFRS 2 Share-based Payment.
Fixed remuneration
Base salary
QIAGEN aims to provide members of its Managing Board with a base salary that is consistent with the policies and procedures for internal pay levels. It is set below the median of the benchmarking group to allow for a larger proportion of long-term incentives to underscore the performance-driven approach of this Remuneration Policy. Base salary levels are reviewed annually, and any increase is expected to be in line with the general workforce.
Deferred compensation
For 2021, a total of $218,000 was incurred by QIAGEN as part of the Managing Board members participating in deferred compensation, defined contribution benefit or similar plans. The contribution for Mr. Bernard is made into deferred compensation and 401(k) plans. Mr. Sackers has a target retirement under the plan at age 65 and is entitled to a one-time pension payment upon retirement.
Other benefits
Other benefits may be provided to members of the Managing Board in line with market practice. These include customary benefits such as insurance coverage and company vehicles.
Variable remuneration
Variable remuneration is contingent upon the performance of the individual Managing Board member and QIAGEN. Ambitious goals are set annually to motivate and drive performance with a focus on achieving both long-term strategic initiatives as well as short-term targets tied to annual operational plans. The Supervisory Board conducts an annual scenario analysis on the possible outcomes of the variable remuneration components and their effect on the remuneration of the Managing Board members. The scenario analysis results have been taken into consideration in making decisions on remuneration for 2021.
113
Short-Term Incentives (STI)
STIs consist of an annual variable cash bonus award that is based upon the achievement levels of predetermined annual Corporate Goals - which represent 75% of the Goals for the STIs and are comprised of 50% for Financial Goals and 25% for Team Goals. In line with the compensation policy at QIAGEN, the Remuneration Policy additionally provides for incentives on Personal Goals for Managing Board members, and these represent 25% of the target for STIs. The different Goals each have their own opportunity:
•The weighted performance spread for the Financial Goals is 0% for less than achieving the minimum threshold, 100% for full achievement and up to 200% for significant overperformance. Financial Goals are set in accordance with the budget for the year, which is reviewed and approved by the Supervisory Board.
Financial Goals(1) (In $ millions) | Weight | Threshold | Target | Max | Achieved | Award in % of target | ||||||||||||||||||||||||||||||||
| Net sales | 40 | % | 2,019 | 2,282 | 2,378 | 2,266 | 98 | % | ||||||||||||||||||||||||||||||
| Adj. operating income | 40 | % | 578 | 739 | 796 | 755 | 128 | % | ||||||||||||||||||||||||||||||
| Adj. free cash flow | 20 | % | 292 | 350 | 430 | 449 | 200 | % | ||||||||||||||||||||||||||||||
| Total Financial Goals | 100 | % | 131 | % | ||||||||||||||||||||||||||||||||||
(1)Financial Goals are set at budget rates. Performance is measured at budget rates for net sales, and at actual rates for Adj. operating income and Adj. Free Cash Flow. These amounts may differ from results reported publicly by QIAGEN.
•Team Goals are a set of annual cross-functional targets aimed at achieving QIAGEN’s strategy focused on innovation and sustainable value creation. The metrics for the Team Goals are often based on targets from multi-year plans. In the event of Team Goals with multiple components, the possible outcomes are: no achievement, partial achievement or full achievement. In the event of single goals, they are either fully met or not met. When all goals are, or the single goal is, fully met, a performance maximum of 120% of the overall target level may be paid out.
•Personal Goals for the CEO for 2021 were aligned with the Team Goals, which was an achievement level of 86% for 2021. The CFO achieved 100% of his Personal Goals tied to strategy execution and structural improvement as set by the Compensation Committee.
114
| Team Goals | Metric | Achieved | Award granted | |||||||||||||||||||||||
| Accelerate organic growth | 71 | % | Deliver growth targets for defined products and geographic markets, including: •QuantiFERON: > $230 million sales, achieve CE mark for QFT Lyme and launch QIAreach QFT TB test •QIAstat-Dx: > $130 million sales, > 800 placements •QIAcuity: > $45 million sales •NeuMoDx; > $150 million sales and >150 placements •QIAsymphony: > 200 placements | Partially | 40 | % | ||||||||||||||||||||
| Deliver efficiency and effectiveness | 23 | % | •Increase sales per employee to > $1.75 million •Achieve QIAGEN Value Innovation (QVI) of 19% •Stay at or below budgeted 36% OPEX adj. ratio of sales | Yes | 23 | % | ||||||||||||||||||||
| Increase value of QIAGEN as employer of choice | 10 | % | •Voluntary turnover of <11% for all employees; 9% at management levels •Employer of Choice awards (min 1 per region) •Achieve Diversity target of 33% women in management roles | Partially | 7 | % | ||||||||||||||||||||
| Enhance customer experience | 10 | % | •Reach 70% digital transaction share across QIAGEN sales channels •Achieve Customer Experience Index (CEI) above 91.8 points | Yes | 10 | % | ||||||||||||||||||||
| Improve EHS (Environment, Health and Safety) metrics | 6 | % | •Reduce plastic transportation packaging materials by 9% vs. 2020 •Reduce lost working days due to injury < 4.1 | Yes | 6 | % | ||||||||||||||||||||
| Total Team Goals | 120 | % | (Total weight 120% equals maximum performance) | 86 | % | |||||||||||||||||||||
The weighted performance on Financial Goals and Team Goals set out above results in the following total STI payout percentage:
| STI award | Weight | Threshold | Target | Maximum | Achieved | |||||||||||||||||||||||||||
| Financial Goals | 50 | % | 0 | % | 100 | % | 200 | % | 131 | % | ||||||||||||||||||||||
| Team Goals | 25 | % | 0 | % | 100 | % | 120 | % | 86 | % | ||||||||||||||||||||||
| Personal Goals Mr. Bernard / Mr. Sackers | 25 | % | 0 | % | 100 | % | 100 | % | 86% / 100% | |||||||||||||||||||||||
| Weighted total Mr. Bernard / Mr. Sackers | 100 | % | 0 | % | 100 | % | 155 | % | 109% / 112% | |||||||||||||||||||||||
| Corresponding payout (In $ thousands) | ||||||||||||||||||||||||||||||||
| Mr. Bernard | 247 | 990 | 1,534 | 1,076 | ||||||||||||||||||||||||||||
| Mr. Sackers | 106 | 425 | 659 | 476 | ||||||||||||||||||||||||||||
Long-Term Incentives (LTI)
Managing Board members are granted LTIs on an annual basis in the form of Performance Stock Units (PSU). These are subject to rigorous and ambitious performance criteria and multi-year vesting periods.
As per the updated 2021 Remuneration Policy, the value of the regular annual long-term incentive awards at the grant date (depreciated due to factors such as risk of forfeiture, the Company’s risk of failure to achieve its long-term initiatives, and the length of the vesting terms) is 300% of fixed remuneration.
For 2021, the annual PSU grants were subject to a one-year performance period due to the exceptional operating conditions in light of the COVID-19 pandemic. The target levels were directly linked to the achievement of financial milestones as defined in QIAGEN’s multi-year business plan. The performance goals for net sales and adjusted operating income margin were equally weighted. As of 2022, we will use a three-year performance period, a cumulative net sales target and average adjusted operating income margin to further increase differentiation from STI targets. Overachievement may result in an increase in the number of PSUs earned, and is capped at 200% of the target grant. Underachievement below a threshold level will result in a full loss of the grant.
115
The following is an overview of key LTI financial indicators, weights and performance multiplier for 2021. Performance measures are set at budget rates:
| Performance measure | Weight | Threshold | Target | Max | Achieved | Awarded | ||||||||||||||||||||||||||||||||
| Net sales (in $ millions) | 50 | % | 2,019 | 2,282 | 2,378 | 2,266 | 98 | % | ||||||||||||||||||||||||||||||
| Adj. operating income margin | 50 | % | 28.6% | 32.4% | 33.5% | 33.5 | % | 200 | % | |||||||||||||||||||||||||||||
| Total | 100 | % | Performance multiplier: | 149 | % | |||||||||||||||||||||||||||||||||
Based on the outstanding results for 2021, the granted number of PSUs was 149% of the target levels. The PSUs awarded for the performance in 2021 will vest in 2024. The details of the 2021 PSUs are presented in the tables for share-based rights below.
Under the same provisions, vesting occurred in 2021 for a portion of the shares awarded for performance in 2018 (40% of the grant) and for the PSUs awarded for performance in 2016 (60% of the grant), in line with the prior Remuneration Policy. The numbers of shares, and their value at vesting, are presented in the tables for share-based rights below.
Share-based rights
The following tables sets forth the grant details of the long-term incentives of the Managing Board members as of December 31, 2021. PSUs and RSUs have no exercise or purchase price.
| Thierry Bernard | |||||||||||||||||||||||||||||||||||||||||||||||
| Performance Stock Units | in 2021 | ||||||||||||||||||||||||||||||||||||||||||||||
| Year of grant | Outstanding at December 31, 2020 | Granted | Performance adjustment | Vested | Outstanding at December 31, 2021 | Share price on grant date | Share price on release date | ||||||||||||||||||||||||||||||||||||||||
| 2021 | — | 113,683 | 55,704 | — | 169,387 | $48.38 | — | ||||||||||||||||||||||||||||||||||||||||
| 2020 | 176,000 | — | — | — | 176,000 | $35.90 | — | ||||||||||||||||||||||||||||||||||||||||
| 2019 | 53,881 | — | — | — | 53,881 | $38.43 | — | ||||||||||||||||||||||||||||||||||||||||
| 2018 | 50,000 | — | 44,000 | — | 94,000 | $36.30 | — | ||||||||||||||||||||||||||||||||||||||||
| 2018 | 47,100 | — | — | (18,840) | 28,260 | $33.70 | $55.35 | ||||||||||||||||||||||||||||||||||||||||
| 2017 | 23,640 | — | — | — | 23,640 | $28.46 | — | ||||||||||||||||||||||||||||||||||||||||
| 2016 | 45,900 | — | — | (38,250) | 7,650 | $24.38 | $56.02 | ||||||||||||||||||||||||||||||||||||||||
| 2016 | 5,400 | — | — | (4,500) | 900 | $21.11 | $50.36 | ||||||||||||||||||||||||||||||||||||||||
| 2015 | 1,250 | — | — | — | 1,250 | $25.26 | — | ||||||||||||||||||||||||||||||||||||||||
| 403,171 | 113,683 | 99,704 | (61,590) | 554,968 | |||||||||||||||||||||||||||||||||||||||||||
| Thierry Bernard | ||||||||||||||||||||||||||||||||||||||
| Restricted Stock Units | in 2021 | |||||||||||||||||||||||||||||||||||||
| Year of grant | Outstanding at December 31, 2020 | Granted | Vested | Outstanding at December 31, 2021 | Share price on grant date | Share price on release date | ||||||||||||||||||||||||||||||||
| 2020 | 20,000 | — | — | 20,000 | $35.90 | — | ||||||||||||||||||||||||||||||||
| 20,000 | — | — | 20,000 | |||||||||||||||||||||||||||||||||||
116
| Roland Sackers | |||||||||||||||||||||||||||||||||||||||||||||||||||||
| Performance Stock Units | in 2021 | ||||||||||||||||||||||||||||||||||||||||||||||||||||
| Year of grant | Outstanding at December 31, 2020 | Granted | Performance adjustment | Vested | Outstanding at December 31, 2021 | Share price on grant date | Share price on release date | ||||||||||||||||||||||||||||||||||||||||||||||
| 2021 | — | 87,322 | 42,787 | — | 130,109 | $48.38 | — | ||||||||||||||||||||||||||||||||||||||||||||||
| 2020 | 144,000 | — | — | — | 144,000 | $35.90 | — | ||||||||||||||||||||||||||||||||||||||||||||||
| 2019 | 127,017 | — | — | — | 127,017 | $36.30 | — | ||||||||||||||||||||||||||||||||||||||||||||||
| 2018 | 97,000 | — | 85,360 | — | 182,360 | $36.30 | — | ||||||||||||||||||||||||||||||||||||||||||||||
| 2018 | 103,000 | — | — | (41,200) | 61,800 | $33.70 | $55.35 | ||||||||||||||||||||||||||||||||||||||||||||||
| 2017 | 50,094 | — | — | — | 50,094 | $30.38 | — | ||||||||||||||||||||||||||||||||||||||||||||||
| 2016 | 92,098 | — | — | (76,749) | 15,349 | $24.38 | $55.76 | ||||||||||||||||||||||||||||||||||||||||||||||
| 2016 | 12,646 | — | — | (10,539) | 2,107 | $27.71 | $50.00 | ||||||||||||||||||||||||||||||||||||||||||||||
| 2016 | 28,226 | — | — | (23,521) | 4,705 | $21.11 | $50.36 | ||||||||||||||||||||||||||||||||||||||||||||||
| 2015 | 8,980 | — | — | — | 8,980 | $25.26 | — | ||||||||||||||||||||||||||||||||||||||||||||||
| 2013 | 2,896 | — | — | — | 2,896 | $23.16 | — | ||||||||||||||||||||||||||||||||||||||||||||||
| 665,957 | 87,322 | 128,147 | (152,009) | 729,417 | |||||||||||||||||||||||||||||||||||||||||||||||||
| Roland Sackers | |||||||||||||||||||||||||||||||||||||||||
| Restricted Stock Units | in 2021 | ||||||||||||||||||||||||||||||||||||||||
| Year of grant | Outstanding at December 31, 2020 | Granted | Vested | Outstanding at December 31, 2021 | Share price on grant date | Share price on release date | |||||||||||||||||||||||||||||||||||
| 2014 | 11,635 | — | — | 11,635 | $22.25 | — | |||||||||||||||||||||||||||||||||||
| 2013 | 13,207 | — | — | 13,207 | $21.44 | — | |||||||||||||||||||||||||||||||||||
| 2012 | 15,591 | — | — | 15,591 | $15.28 | — | |||||||||||||||||||||||||||||||||||
| 2011 | 13,039 | — | (13,039) | — | $20.63 | $50.00 | |||||||||||||||||||||||||||||||||||
| 53,472 | — | (13,039) | 40,433 | ||||||||||||||||||||||||||||||||||||||
Clawback provisions
During 2021, no circumstances were identified by the Supervisory Board that resulted in the application of clawback provisions. The Supervisory Board has the right to recover variable remuneration from Managing Board members based on its statutory powers in case of a payment was made based on incorrect information in respect to target performance, material financial restatement or individual gross misconduct. Any value adjustment or clawback is at the discretion of the Supervisory Board. It will be accounted for in the Remuneration Report submitted to subsequent AGM.
117
Comparative information
Information on Change in Remuneration and Company Performance
The following table shows the annual change of remuneration based on accounting expense, performance of entity and average remuneration for other employees over the last five years.
| Annual change | 2017 vs. 2016 | 2018 vs. 2017 | 2019 vs. 2018 | 2020 vs. 2019 | 2021 vs. 2020 | 2021 information (in $ millions) | ||||||||||||||||||||||||||||||||||||||||||||
| Managing Board remuneration | ||||||||||||||||||||||||||||||||||||||||||||||||||
| Thierry Bernard | — | % | 3 | % | 6.6 | |||||||||||||||||||||||||||||||||||||||||||||
| Roland Sackers | 21% | 5% | 30% | 34 | % | (4) | % | 7.2 | ||||||||||||||||||||||||||||||||||||||||||
| Peer Schatz | 19 | % | 9 | % | 234 | % | — | % | — | % | — | |||||||||||||||||||||||||||||||||||||||
| Company performance | ||||||||||||||||||||||||||||||||||||||||||||||||||
| Net sales (CER) | 6% | 6% | 4% | 23 | % | 21 | % | 2,266 | ||||||||||||||||||||||||||||||||||||||||||
| Adj. operating income | 14% | 9% | 5% | 49 | % | 20 | % | 755 | ||||||||||||||||||||||||||||||||||||||||||
| Adj. free cash flow | 7 | % | (2) | % | (15) | % | 113 | % | (7) | % | 449 | |||||||||||||||||||||||||||||||||||||||
| Average remuneration (Full-time employees) | ||||||||||||||||||||||||||||||||||||||||||||||||||
Employees(1) | (4) | % | 4 | % | (4) | % | — | % | — | % | 0.1 | |||||||||||||||||||||||||||||||||||||||
(1)Employee data significantly influenced by currency movements.
Pay ratio
Under the Dutch Corporate Governance Code, QIAGEN is required to report the ratio between the remuneration of the Managing Board members and a representative reference group within the Company and its affiliated enterprise. QIAGEN’s internal pay ratio is determined as the ratio between the average pay of the Managing Board as disclosed in the Corporate Governance Report in our 2021 Annual Report and the average pay of QIAGEN employees on a global level. The combined pay ratio in 2021 for the Managing Board was 68:1 (2020: 72:1).
The average remuneration for all employees was calculated using the average number of payroll employees. This ratio is prepared in accordance with the Dutch Corporate Governance Code and has not been prepared to comply with the Pay Ratio Disclosure requirements under U.S. Securities and Exchange Commission regulations.
Management contracts
The contracts for Managing Board members are determined by the Supervisory Board and are built to comply with the framework of the 2021 Remuneration Policy, in accordance with Dutch law. An outline of these contracts is submitted to the AGM upon nomination for appointment. Due to the holding company nature of the legal entity QIAGEN N.V., Managing Board members may be employed by other QIAGEN affiliates. Any compensation for these roles is consolidated in the remuneration reported above.
The contract term of Mr. Bernard is one year, which is aligned with the annual appointment by the AGM. If Mr. Bernard is reappointed, the contract is automatically extended for the same term as outlined in the re-appointment terms, and ends by operation of law at the end of the term of appointment. The contract of Mr. Sackers, which was entered into in 2004, has an indefinite term. However, his appointment as Managing Director is based on a one-year term and subject to annual appointment by the AGM.
The contracts of the Managing Board members can be orderly terminated by the Managing Board member at any time with a notice period of six months and by the Company with a notice period of three months. In case of dismissal without serious cause as defined by the applicable law, QIAGEN is obliged to compensate until the end of the running legacy contract. The agreements of Managing Board members with QIAGEN affiliates in jurisdictions outside the Netherlands may have different notice or severance conditions. No severance payments were made in 2021.
118
Change of Control
In the event of the sale or the transfer of all or substantially all of the Company’s assets or business to an acquirer in one transaction or a series of transactions, including through a merger, consolidation or a transfer of shares to a third party (a “Transaction”), the Managing Board members are entitled under legacy contracts to a Change of Control payment commensurate to a multiple of two times their annual cash compensation (fixed payment plus annual bonus, includes salaries and bonuses set forth in employment agreements with other QIAGEN affiliates). Further, unvested share-based compensation granted to the Managing Board members will be subject to an accelerated vesting in case of a Transaction.
Loans
Members of the Managing Board and Supervisory Board are not eligible for any loans.
Outlook: Managing Board remuneration in 2022
In 2022, we have implemented changes to further improve and align the Managing Board compensation.
For the CEO, the base salary was raised by approximately 5% to $950,000, which still remains below the median benchmark. The pension contribution has been increased to 15% of base salary from the prior level of 10% to also align more closely to the median benchmark. No change has been made to the bonus nor PSU grant level.
For the CFO, the base salary was raised by approximately 3% to EUR 527,900, in line with local market adjustments but still below the median benchmark. The target for full achievement of the STIs has been increased to 75% of base salary from the prior level of 70% to bring this more in line with market practices and also to further increase the "pay for performance" nature of remuneration at QIAGEN. No change has been made to the CFO grant level for PSUs.
For 2022, Managing Board members were granted PSUs subject to rigorous performance criteria over a three-year performance period. The final number of earned PSUs is determined upon completion of the three-year period from 2022-2024, and subject to the achievement of challenging performance goals: 50% for 2022-2024 cumulative net sales (at budget rates); and 50% for 2022-2024 average adjusted operating income margin. The results against these targets, which are confidential and involve competitive information, will be published in the Remuneration Report after the performance period ends.
Supervisory Board Remuneration
At the Annual General Meeting in June 2021, QIAGEN's shareholders approved an updated Remuneration Policy for the Supervisory Board to harmonize compensation levels for the Chairs and Members of the Compensation & Human Resources Committee, the Science & Technology Committee and the Nomination & ESG (Environmental, Social, Governance) Committee. This updated Remuneration Policy came into force at the AGM in June 2021, and has been the basis for the remuneration of the members of the Supervisory Board for 2021.
Remuneration Policy summary
The Remuneration Policy of the Supervisory Board is aimed to attract and retain highly qualified members. Remuneration is aligned to the applicable market standards, considering peer companies of similar size and complexity in similar industries. These companies represent the biotechnology, life sciences, diagnostics and pharmaceuticals industries, and also reflect our nexus to the European Markets as a Dutch company as well as our U.S. focus as a NYSE-listed company subject to U.S. regulations. The Remuneration Policy for the Supervisory Board also reflects the fact that many Supervisory Board members are residents of the United States, a market that also represented more than 40% of QIAGEN’s total sales in 2021. The level of remuneration rewards an intense involvement with the Company, and the high level of responsibility and time spent that goes with it.
119
Fixed remuneration in cash
The Remuneration Policy for the Supervisory Board provides for fixed annual retainers for the Chair and other members, and additional fees for Committee Chairs and members as follows:
| Fee payable to the Chair of the Supervisory Board | $150,000 | |||||||
| Fee payable to each member of the Supervisory Board | $57,500 | |||||||
| Additional compensation payable to members holding the following positions: | ||||||||
| Chair of the Audit Committee | $25,000 | |||||||
| Member of the Audit Committee | $15,000 | |||||||
| Chair of the (i) Compensation & Human Resources Committee, (ii) the Nomination & ESG Committee, or (iii) the Science & Technology Committee | $18,000 | |||||||
| Member of the (i) Compensation & Human Resources Committee, (ii) the Nomination & ESG Committee, or (iii) the Science & Technology Committee | $11,000 | |||||||
| Chair of other Committees | $12,000 | |||||||
| Member of other Committees | $6,000 | |||||||
Further, Supervisory Board members are reimbursed for tax consulting costs incurred in connection with the preparation of their tax returns up to an amount of €5,000 per person per year.
Fixed remuneration in shares
The Supervisory Board members receive grant of Restricted Stock Units (RSUs) pursuant to the terms of the 2014 Stock Plan. These awards have no performance condition and are in line with the principle of the Dutch Corporate Governance Code that remuneration of Supervisory Board members should not be dependent on a company’s results.
Although this policy may be viewed unfavorably by some stakeholders, this compensation component has been a long and tested practice at QIAGEN since the Initial Public Offering (IPO) in 1996 and in line with the practices of many other companies. It has proven effective in attracting and retaining talented Supervisory Board members, as well as creating a strong commitment and creating alignment with our stakeholders, who have given this approach their broad support.
The RSUs represent rights to receive common shares at future dates if the individual continues to provide service to the Company. A total of 40% of each award vests three years after the grant date, and the remaining 60% vests after five years from the grant date. The number of RSUs subject to each annual grant shall be reduced by 0.25% per each 1% increase in the Company’s share price and increased by 0.25% per each 1% decrease in the Company’s share price, whereby the share price shall be determined as the average trading price of the Company’s common shares from July 1 through December 31 of each year preceding the grant.
120
2021: Supervisory Board remuneration implementation
The remuneration of the members of the Supervisory Board, based on incurred accounting expenses in 2021 for the cash components and based on the value of RSUs vested in 2021 for the LTI component, is as follows:
| (In $ thousands) | Fixed remuneration | Committee Chair | Committee membership | Total cash remuneration | RSU awards vested | Total remuneration(1) | Proportion of fixed and variable remuneration including share-based award expense | |||||||||||||||||||||||||||||||||||||
| Lawrence A. Rosen (Chair) | $150.0 | 32.6 | 17.2 | 199.8 | 521.9 | $721.7 | 28% / 72% | |||||||||||||||||||||||||||||||||||||
| Dr. Metin Colpan | $57.5 | 18.0 | 11.0 | 86.5 | 545.3 | $631.8 | 14% / 86% | |||||||||||||||||||||||||||||||||||||
Thomas Ebeling(2) | $47.9 | — | 5.5 | 53.4 | — | $53.4 | 100% / 0% | |||||||||||||||||||||||||||||||||||||
| Dr. Toralf Haag | $57.5 | 10.4 | 8.8 | 76.7 | — | $76.7 | 100% / 0% | |||||||||||||||||||||||||||||||||||||
| Dr. Ross L. Levine | $57.5 | — | 11.0 | 68.5 | 197.3 | $265.8 | 26% / 74% | |||||||||||||||||||||||||||||||||||||
| Dr. Elaine Mardis | $57.5 | — | 22.0 | 79.5 | 521.9 | $601.4 | 13% / 87% | |||||||||||||||||||||||||||||||||||||
| Elizabeth E. Tallett | $57.5 | 18.0 | 26.0 | 101.5 | 521.9 | $623.4 | 16% / 84% | |||||||||||||||||||||||||||||||||||||
Stéphane Bancel(3) | $28.8 | — | 1.2 | 30.0 | 1,452.8 | $1,482.8 | 2% / 98% | |||||||||||||||||||||||||||||||||||||
(1) Total costs incurred for Supervisory Board remuneration are specified in Footnote 24 “Related Party Transactions” to the Consolidated Financial Statements on page 58.
(2) Thomas Ebeling joined the Supervisory Board in February 2021.
(3) Stéphane Bancel did not stand for re-appointment at the Annual General Meeting on June 29, 2021, resulting in the end of his Supervisory Board term.
The Supervisory Board members receive a grant of RSUs pursuant to the terms of the 2014 Stock Plan for grants made as of 2015. Under the terms of the grants, 40% of each award vests three years after the grant date and the remaining 60% vests five years after the grant date. Some grants were made under a previous plan that also included a 10-year vesting tranche. Any granted awards will fully vest in case of a change of control of QIAGEN.
The following tables sets forth the RSUs of the Supervisory Board:
| Lawrence A. Rosen | |||||||||||||||||||||||||||||||||||||||||
| Restricted Stock Units | in 2021 | ||||||||||||||||||||||||||||||||||||||||
| Year of grant | Outstanding at December 31, 2020 | Granted | Vested | Outstanding at December 31, 2021 | Share price on grant date | Share price on release date | |||||||||||||||||||||||||||||||||||
| 2021 | — | 7,482 | — | 7,482 | $50.00 | — | |||||||||||||||||||||||||||||||||||
| 2020 | 9,426 | — | — | 9,426 | $35.90 | — | |||||||||||||||||||||||||||||||||||
| 2019 | 9,331 | — | — | 9,331 | $38.43 | — | |||||||||||||||||||||||||||||||||||
| 2018 | 9,866 | — | (3,946) | 5,920 | $33.70 | $50.00 | |||||||||||||||||||||||||||||||||||
| 2017 | 6,440 | — | — | 6,440 | $28.46 | — | |||||||||||||||||||||||||||||||||||
| 2016 | 6,446 | — | (6,446) | — | $21.11 | $50.36 | |||||||||||||||||||||||||||||||||||
| 41,509 | 7,482 | (10,392) | 38,599 | ||||||||||||||||||||||||||||||||||||||
121
| Dr. Metin Colpan | |||||||||||||||||||||||||||||||||||||||||
| Restricted Stock Units | in 2021 | ||||||||||||||||||||||||||||||||||||||||
| Year of grant | Outstanding at December 31, 2020 | Granted | Vested | Outstanding at December 31, 2021 | Share price on grant date | Share price on release date | |||||||||||||||||||||||||||||||||||
| 2021 | — | 7,482 | — | 7,482 | $50.00 | — | |||||||||||||||||||||||||||||||||||
| 2020 | 9,426 | — | — | 9,426 | $35.90 | — | |||||||||||||||||||||||||||||||||||
| 2019 | 9,331 | — | — | 9,331 | $38.43 | — | |||||||||||||||||||||||||||||||||||
| 2018 | 9,866 | — | (3,946) | 5,920 | $33.70 | $50.00 | |||||||||||||||||||||||||||||||||||
| 2017 | 6,440 | — | — | 6,440 | $28.46 | — | |||||||||||||||||||||||||||||||||||
| 2016 | 6,446 | — | (6,446) | — | $21.11 | $50.36 | |||||||||||||||||||||||||||||||||||
| 2012 | 457 | — | — | 457 | $17.45 | — | |||||||||||||||||||||||||||||||||||
| 2012 | 544 | — | — | 544 | $15.28 | — | |||||||||||||||||||||||||||||||||||
| 2011 | 468 | — | (468) | — | $20.63 | $50.00 | |||||||||||||||||||||||||||||||||||
| 42,978 | 7,482 | (10,860) | 39,600 | ||||||||||||||||||||||||||||||||||||||
| Thomas Ebeling | ||||||||||||||||||||||||||||||||||||||
| Restricted Stock Units | in 2021 | |||||||||||||||||||||||||||||||||||||
| Year of grant | Outstanding at December 31, 2020 | Granted | Vested | Outstanding at December 31, 2021 | Share price on grant date | Share price on release date | ||||||||||||||||||||||||||||||||
| 2021 | — | 7,482 | — | 7,482 | $50.00 | — | ||||||||||||||||||||||||||||||||
| — | 7,482 | — | 7,482 | |||||||||||||||||||||||||||||||||||
| Dr. Toralf Haag | ||||||||||||||||||||||||||||||||||||||
| Restricted Stock Units | in 2021 | |||||||||||||||||||||||||||||||||||||
| Year of grant | Outstanding at December 31, 2020 | Granted | Vested | Outstanding at December 31, 2021 | Share price on grant date | Share price on release date | ||||||||||||||||||||||||||||||||
| 2021 | — | 7,482 | — | 7,482 | $50.00 | — | ||||||||||||||||||||||||||||||||
| — | 7,482 | — | 7,482 | |||||||||||||||||||||||||||||||||||
122
| Prof. Dr. Ross L. Levine | |||||||||||||||||||||||||||||||||||||||||
| Restricted Stock Units | in 2021 | ||||||||||||||||||||||||||||||||||||||||
| Year of grant | Outstanding at December 31, 2020 | Granted | Vested | Outstanding at December 31, 2021 | Share price on grant date | Share price on release date | |||||||||||||||||||||||||||||||||||
| 2021 | — | 7,482 | — | 7,482 | $50.00 | — | |||||||||||||||||||||||||||||||||||
| 2020 | 9,426 | — | — | 9,426 | $35.90 | — | |||||||||||||||||||||||||||||||||||
| 2019 | 9,331 | — | — | 9,331 | $38.43 | — | |||||||||||||||||||||||||||||||||||
| 2018 | 9,866 | — | (3,946) | 5,920 | $33.70 | $50.00 | |||||||||||||||||||||||||||||||||||
| 2017 | 6,440 | — | — | 6,440 | $28.46 | — | |||||||||||||||||||||||||||||||||||
| 35,063 | 7,482 | (3,946) | 38,599 | ||||||||||||||||||||||||||||||||||||||
| Prof. Dr. Elaine Mardis | |||||||||||||||||||||||||||||||||||||||||
| Restricted Stock Units | in 2021 | ||||||||||||||||||||||||||||||||||||||||
| Year of grant | Outstanding at December 31, 2020 | Granted | Vested | Outstanding at December 31, 2021 | Share price on grant date | Share price on release date | |||||||||||||||||||||||||||||||||||
| 2021 | — | 7,482 | — | 7,482 | $50.00 | — | |||||||||||||||||||||||||||||||||||
| 2020 | 9,426 | — | — | 9,426 | $35.90 | — | |||||||||||||||||||||||||||||||||||
| 2019 | 9,331 | — | — | 9,331 | $38.43 | — | |||||||||||||||||||||||||||||||||||
| 2018 | 9,866 | — | (3,946) | 5,920 | $33.70 | $50.00 | |||||||||||||||||||||||||||||||||||
| 2017 | 6,440 | — | — | 6,440 | $28.46 | — | |||||||||||||||||||||||||||||||||||
| 2016 | 6,446 | — | (6,446) | — | $21.11 | $50.36 | |||||||||||||||||||||||||||||||||||
| 41,509 | 7,482 | (10,392) | 38,599 | ||||||||||||||||||||||||||||||||||||||
| Elizabeth E. Tallett | |||||||||||||||||||||||||||||||||||||||||
| Restricted Stock Units | in 2021 | ||||||||||||||||||||||||||||||||||||||||
| Year of grant | Outstanding at December 31, 2020 | Granted | Vested | Outstanding at December 31, 2021 | Share price on grant date | Share price on release date | |||||||||||||||||||||||||||||||||||
| 2021 | — | 7,482 | — | 7,482 | $50.00 | — | |||||||||||||||||||||||||||||||||||
| 2020 | 9,426 | — | — | 9,426 | $35.90 | — | |||||||||||||||||||||||||||||||||||
| 2019 | 9,331 | — | — | 9,331 | $38.43 | — | |||||||||||||||||||||||||||||||||||
| 2018 | 9,866 | — | (3,946) | 5,920 | $33.70 | $50.00 | |||||||||||||||||||||||||||||||||||
| 2017 | 6,440 | — | — | 6,440 | $28.46 | — | |||||||||||||||||||||||||||||||||||
| 2016 | 6,446 | — | (6,446) | — | $21.11 | $50.36 | |||||||||||||||||||||||||||||||||||
| 2012 | 457 | — | — | 457 | $17.45 | — | |||||||||||||||||||||||||||||||||||
| 2012 | 544 | — | — | 544 | $15.28 | — | |||||||||||||||||||||||||||||||||||
| 42,510 | 7,482 | (10,392) | 39,600 | ||||||||||||||||||||||||||||||||||||||
123
| Stéphane Bancel | |||||||||||||||||||||||||||||||||||||||||||||||
| Restricted Stock Units | in 2021 | ||||||||||||||||||||||||||||||||||||||||||||||
| Year of grant | Outstanding at December 31, 2020 | Granted | Vested | Forfeited | Outstanding at December 31, 2021 | Share price on grant date | Share price on release date | ||||||||||||||||||||||||||||||||||||||||
| 2021 | — | 7,482 | (631) | (6,851) | — | $50.00 | $49.37 | ||||||||||||||||||||||||||||||||||||||||
| 2020 | 9,426 | — | (3,183) | (6,243) | — | $35.90 | $49.37 | ||||||||||||||||||||||||||||||||||||||||
| 2019 | 9,331 | — | (5,514) | (3,817) | — | $38.43 | $49.37 | ||||||||||||||||||||||||||||||||||||||||
| 2018 | 9,866 | — | (7,892) | (1,974) | — | $33.70 | $49.69 | ||||||||||||||||||||||||||||||||||||||||
| 2017 | 6,440 | — | (5,581) | (859) | — | $28.46 | $49.37 | ||||||||||||||||||||||||||||||||||||||||
| 2016 | 6,446 | — | (6,446) | — | — | $21.11 | $50.36 | ||||||||||||||||||||||||||||||||||||||||
| 41,509 | 7,482 | (29,247) | (19,744) | — | |||||||||||||||||||||||||||||||||||||||||||
Up until 2012, the Supervisory Board members received stock option grants. All stock options are fully vested. The following tables sets forth the remaining stock options of the Supervisory Board members:
| Elizabeth Tallett | ||||||||||||||||||||||||||||||||||||||||||||
| Stock Options | in 2021 | |||||||||||||||||||||||||||||||||||||||||||
| Year of grant | Outstanding at December 31, 2020 | Vested | Exercised | Outstanding at December 31, 2021 | Average share price at exercise | Exercise price | Expiry | |||||||||||||||||||||||||||||||||||||
| 2012 | 1,563 | — | (1,563) | — | $55.70 | $15.59 | — | |||||||||||||||||||||||||||||||||||||
| 1,563 | — | (1,563) | — | |||||||||||||||||||||||||||||||||||||||||
Outlook: Supervisory Board remuneration in 2022
No changes in compensation are planned for the Supervisory Board in 2022.
124
Share ownership
QIAGEN requires the Managing Board members and other senior executives to build up a significant share ownership to underscore their alignment to the interests of the Company and its shareholders. Under the remuneration policy, Managing Board members must build up a shareholding equal in value to five times their net base salary (after taxes) within four years of their first appointment. At the end of 2021, Mr. Bernard and Mr. Sackers both complied with the requirement. The following table sets forth certain information as of January 31, 2022, concerning the ownership of Common Shares by our Managing Board and Supervisory Board members. In preparing the following table, we have relied on information furnished by such persons.
Shares Beneficially Owned (1) | ||||||||||||||||||||
| Name | Number (2) | |||||||||||||||||||
| Thierry Bernard | 88,601 | (3) | ||||||||||||||||||
| Roland Sackers | 188,414 | (4) | ||||||||||||||||||
| Dr. Metin Colpan | 407,783 | (5) | ||||||||||||||||||
| Thomas Ebeling | — | |||||||||||||||||||
| Dr. Toralf Haag | 700 | |||||||||||||||||||
| Dr. Ross L. Levine | 4,129 | (6) | ||||||||||||||||||
| Dr. Elaine Mardis | — | (7) | ||||||||||||||||||
| Lawrence A. Rosen | — | (8) | ||||||||||||||||||
| Elizabeth Tallett | 34,089 | (9) | ||||||||||||||||||
(1)The number of Common Shares outstanding as of January 31, 2022, was 227,073,511. The persons named in the table have sole voting and investment power with respect to all shares shown as beneficially owned by them and have the same voting rights as shareholders with respect to Common Shares.
(2)Does not include Common Shares subject to options or awards held by such persons as of January 31, 2022. See footnotes below for information regarding stock awards that could become releasable within 60 days of the date of this table.
(3)Does not include 86,852 shares issuable upon the release of unvested stock awards that could become releasable within 60 days from the date of this table.
(4)Does not include 181,086 shares issuable upon the release of unvested stock awards that could become releasable within 60 days from the date of this table.
(5)Includes 357,893 shares held by CC Verwaltungs GmbH, of which Dr. Colpan is the sole stockholder. Does not include 10,716 shares issuable upon the release of unvested stock awards that could become releasable within 60 days from the date of this table.
(6)Does not include 10,172 shares issuable upon the release of unvested stock awards that could become releasable within 60 days from the date of this table.
(7)Does not include 10,172 shares issuable upon the release of unvested stock awards that could become releasable within 60 days from the date of this table.
(8)Does not include 10,172 shares issuable upon the release of unvested stock awards that could become releasable within 60 days from the date of this table.
(9)Does not include 10,716 shares issuable upon the release of unvested stock awards that could become releasable within 60 days from the date of this table.
Share-based remuneration to employees
Pursuant to the 2014 Stock Plan, stock rights – which include options to purchase our Common Shares, stock grants and stock-based awards – may be granted to employees of QIAGEN and its subsidiaries. Generally, the non-qualified stock options (no longer granted since 2013) have terms up to 10 years and stock-based awards have terms of up to five years, subject to earlier termination in the event of death, disability or other termination of employment. The vesting and exercisability of certain stock rights would be accelerated in the event of a change of control, as defined in the agreements under the 2014 Plan. Treasury Shares are issued to satisfy option exercises and award releases.
125
The Plan is administered by the Compensation Committee of the Supervisory Board, which selects participants from among eligible employees and determines the number of shares to be received subject to the stock-based award, the length of time the award will remain outstanding, the manner and time of the award’s vesting, the price per share subject to the award and other terms and conditions of the award consistent with the Plan.
Stock options have not been granted to employees since 2013. Details with respect to the outstanding stock options are set out below:
| Stock Options | Shares | Weighted average exercise price | Weighted average remaining contractual term (in years) | |||||||||||||||||
| Outstanding and Exercisable December 31, 2020 | 40,861 | $17.89 | ||||||||||||||||||
| Exercised | (23,288) | $17.97 | ||||||||||||||||||
| Expired | — | — | ||||||||||||||||||
| Outstanding and Exercisable December 31, 2021 | 17,573 | $1.79 | 1.08 | |||||||||||||||||
Exercise prices for options outstanding and exercisable as of December 31, 2021, range from $16.00 to $18.68.
Details with respect to PSUs outstanding are set out below:
| Performance Stock Units | Shares | Weighted average purchase price | Weighted average remaining contractual term (in years) | Weighted average grant date (Fair value) | ||||||||||||||||||||||
| Outstanding December 31, 2020 | 2,915,884 | $0.00 | $34.09 | |||||||||||||||||||||||
| Awarded | 289,584 | $0.00 | $48.40 | |||||||||||||||||||||||
| Released | (667,141) | $0.00 | $28.45 | |||||||||||||||||||||||
| Forfeited | (326,386) | $0.00 | $35.66 | |||||||||||||||||||||||
| Outstanding December 31, 2021 | 2,211,941 | $0.00 | 1.73 | $37.43 | ||||||||||||||||||||||
| Vested and expected to vest | 1,932,318 | $0.00 | 1.64 | $37.32 | ||||||||||||||||||||||
Details with respect to RSUs outstanding are set out below:
| Restricted Stock Units | Shares | Weighted average purchase price | Weighted average remaining contractual term (in years) | Weighted average grant date (Fair value) | ||||||||||||||||||||||
| Outstanding December 31, 2020 | 303,868 | $0.00 | $30.92 | |||||||||||||||||||||||
| Awarded | 211,458 | $0.00 | $49.81 | |||||||||||||||||||||||
| Released | (62,413) | $0.00 | $23.05 | |||||||||||||||||||||||
| Forfeited | (36,309) | $0.00 | $39.25 | |||||||||||||||||||||||
| Outstanding December 31, 2021 | 416,604 | $0.00 | 1.50 | $40.97 | ||||||||||||||||||||||
| Vested and expected to vest | 365,124 | $0.00 | 1.39 | $40.57 | ||||||||||||||||||||||
126
Responsibility Statement of the Managing Board
In accordance with best practice II.1.5 of the Dutch corporate governance code of December 2008, taking into account the recommendation of the Corporate Governance Code Monitoring Committee on the application thereof, the Managing Board confirms that internal controls over financial reporting provide a reasonable level of assurance that the financial reporting does not contain any material inaccuracies, and confirms that these controls functioned properly in the year under review and that there are no indications that they will not continue to do so. The financial statements fairly represent the Company's financial condition and the results of the Company's operations and provide the required disclosures.
It should be noted that the above does not imply that these systems and procedures provide absolute assurance as to the realization of operational and strategic business objectives, or that they can prevent all misstatements, inaccuracies, errors, fraud and non-compliances with legislation, rules and regulations.
In accordance with Article 5.25c of the Financial Markets Supervisory Act, and in view of all of the above the Managing Board confirms that, to the best of its knowledge, the financial statements give a true and fair view of the assets, liabilities, financial position and profit or loss of the Company and the annual report includes a fair review of the position at the balance sheet date and the development and performance of the business during the financial year together with a description of the principal risks and uncertainties that the Company faces.
QIAGEN N.V.
Thierry Bernard Roland Sackers
Chief Executive Officer Chief Financial Officer
127
QIAGEN N.V.
Consolidated Financial Statements
QIAGEN N.V. Consolidated Balance Sheets
| As of December 31, | ||||||||||||||||||||
| (in thousands) | Note | 2021 | 2020 | |||||||||||||||||
| Assets | ||||||||||||||||||||
| Current assets: | ||||||||||||||||||||
| Cash and cash equivalents | (3) | $879,884 | $597,003 | |||||||||||||||||
| Current financial assets | (7) | 184,785 | 117,249 | |||||||||||||||||
| Trade accounts receivable | (8) | 362,131 | 380,519 | |||||||||||||||||
| Inventories | (3) | 327,525 | 291,181 | |||||||||||||||||
| Fair value of derivative financial instruments | (25, 26) | 175,284 | 14,127 | |||||||||||||||||
| Other current assets | (9) | 143,574 | 198,723 | |||||||||||||||||
| Total current assets | 2,073,183 | 1,598,802 | ||||||||||||||||||
| Non-current assets: | ||||||||||||||||||||
| Property, plant and equipment | (10) | 491,357 | 427,352 | |||||||||||||||||
| Goodwill | (12) | 2,376,440 | 2,389,111 | |||||||||||||||||
| Other intangible assets | (12) | 803,192 | 883,600 | |||||||||||||||||
| Right-of-use assets | (13) | 99,415 | 101,211 | |||||||||||||||||
| Equity accounted investments | (11) | 21,549 | 11,017 | |||||||||||||||||
| Non-current financial assets | (7) | 3,945 | 4,408 | |||||||||||||||||
| Deferred tax assets | (17) | 117,365 | 89,016 | |||||||||||||||||
| Fair value of derivative financial instruments | (25, 26) | 190,430 | 379,080 | |||||||||||||||||
| Other non-current assets | (9) | 31,914 | 44,690 | |||||||||||||||||
| Total non-current assets | 4,135,607 | 4,329,485 | ||||||||||||||||||
| Total Assets | $6,208,790 | $5,928,287 | ||||||||||||||||||
The accompanying notes are an integral part of these consolidated financial statements.
Consolidated Financial Statements 1
QIAGEN N.V. Consolidated Balance Sheets
| As of December 31, | ||||||||||||||||||||
| (in thousands, except par value) | Note | 2021 | 2020 | |||||||||||||||||
| Liabilities and equity | ||||||||||||||||||||
| Current liabilities: | ||||||||||||||||||||
| Current financial debts | (16) | $845,655 | $42,539 | |||||||||||||||||
| Trade and other accounts payable | 101,224 | 118,153 | ||||||||||||||||||
| Provisions | (14) | 6,715 | 6,565 | |||||||||||||||||
| Fair value of derivative financial instruments | (25, 26) | 292,204 | 51,464 | |||||||||||||||||
| Other current liabilities | (15) | 380,047 | 352,174 | |||||||||||||||||
| Total current liabilities | 1,625,845 | 570,895 | ||||||||||||||||||
| Non-current liabilities: | ||||||||||||||||||||
| Non-current financial debts | (16) | 1,040,093 | 1,875,168 | |||||||||||||||||
| Deferred tax liabilities | (17) | 45,238 | 46,041 | |||||||||||||||||
| Fair value of derivative financial instruments | (25, 26) | 429,402 | 766,410 | |||||||||||||||||
| Other non-current liabilities | (15) | 209,320 | 186,724 | |||||||||||||||||
| Total non-current liabilities | 1,724,053 | 2,874,343 | ||||||||||||||||||
| Equity: | ||||||||||||||||||||
| Common Shares, 0.01 EUR par value, authorized—410,000 shares, issued—230,829 shares in 2021 and 2020, respectively | (18) | 2,702 | 2,702 | |||||||||||||||||
| Share premium | 1,877,704 | 1,840,115 | ||||||||||||||||||
| Retained earnings | (18) | 1,490,974 | 998,133 | |||||||||||||||||
| Reserves | (322,758) | (239,600) | ||||||||||||||||||
| Less treasury shares at cost—3,755 and 2,844 shares in 2021 and in 2020, respectively | (18) | (189,730) | (118,301) | |||||||||||||||||
| Total equity | 2,858,892 | 2,483,049 | ||||||||||||||||||
| Total liabilities and equity | $6,208,790 | $5,928,287 | ||||||||||||||||||
The accompanying notes are an integral part of these consolidated financial statements.
Consolidated Financial Statements 2
QIAGEN N.V. Consolidated Income Statements
| Years ended December 31, | ||||||||||||||||||||
| (in thousands, except per share data) | Note | 2021 | 2020 | |||||||||||||||||
| Net sales | (4, 21) | $2,251,657 | $1,870,346 | |||||||||||||||||
| Cost of sales: | ||||||||||||||||||||
| Cost of sales | (738,076) | (579,372) | ||||||||||||||||||
| Acquisition-related intangible amortization | (67,118) | (63,164) | ||||||||||||||||||
| Total cost of sales | (805,194) | (642,536) | ||||||||||||||||||
| Gross profit | 1,446,463 | 1,227,810 | ||||||||||||||||||
| Other operating income | 572 | 992 | ||||||||||||||||||
| Research and development expense | (180,687) | (139,060) | ||||||||||||||||||
| Sales and marketing expense | (474,683) | (434,158) | ||||||||||||||||||
| General and administrative expense | (126,236) | (110,153) | ||||||||||||||||||
| Restructuring, acquisition, integration and other, net | (6) | (29,451) | (159,919) | |||||||||||||||||
| Long-lived asset impairments | (6) | — | (1,034) | |||||||||||||||||
| Other operating expense | (297) | (562) | ||||||||||||||||||
| Total operating expenses, net | (10, 12, 23) | (810,782) | (843,894) | |||||||||||||||||
| Income from operations | 635,681 | 383,916 | ||||||||||||||||||
| Financial income | 9,555 | 10,032 | ||||||||||||||||||
| Financial expense | (16) | (56,487) | (73,002) | |||||||||||||||||
| Other financial results | (5, 7, 26) | 62,353 | (166,019) | |||||||||||||||||
| Total financial income (expense), net | 15,421 | (228,989) | ||||||||||||||||||
| Income before income taxes | 651,102 | 154,927 | ||||||||||||||||||
| Income taxes | (17) | (114,048) | (81,287) | |||||||||||||||||
| Net income | $537,054 | $73,640 | ||||||||||||||||||
| Basic earnings per common share | (19) | $2.36 | $0.32 | |||||||||||||||||
| Diluted earnings per common share | (19) | $2.31 | $0.31 | |||||||||||||||||
| Weighted average shares outstanding (in thousands) | ||||||||||||||||||||
| Basic | (19) | 227,983 | 228,427 | |||||||||||||||||
| Diluted | (19) | 232,034 | 234,214 | |||||||||||||||||
The accompanying notes are an integral part of these consolidated financial statements.
Consolidated Financial Statements 3
QIAGEN N.V. Consolidated Statements of Comprehensive Income
| Years ended December 31, | ||||||||||||||||||||
| (in thousands) | Note | 2021 | 2020 | |||||||||||||||||
| Net income | $537,054 | $73,640 | ||||||||||||||||||
| Other comprehensive income (loss) not reclassified to profit or loss in subsequent periods: | ||||||||||||||||||||
| Gain (loss) on pensions (net of tax of $5 and $16) | 11 | (38) | ||||||||||||||||||
| Other comprehensive (loss) income to be reclassified to profit or loss in subsequent periods: | ||||||||||||||||||||
| Foreign currency translation adjustments (net of tax of $1,674 and $946) | (107,682) | 86,996 | ||||||||||||||||||
| Gains (loss) on cash flow hedges (net of tax of $0 and $2,845) | (26) | 16,780 | (8,536) | |||||||||||||||||
| Reclassification adjustments on cash flow hedges (net of tax of $0 and $4,666) | (26) | (17,010) | 13,999 | |||||||||||||||||
| Net investment hedge | (26) | 24,743 | (26,442) | |||||||||||||||||
| Other comprehensive (loss) income, after tax | (83,158) | 65,979 | ||||||||||||||||||
| Comprehensive income | $453,896 | $139,619 | ||||||||||||||||||
The accompanying notes are an integral part of these consolidated financial statements.
Consolidated Financial Statements 4
QIAGEN N.V. Consolidated Statements of Cash Flows
| Years ended December 31, | ||||||||||||||||||||
| (in thousands) | Note | 2021 | 2020 | |||||||||||||||||
| Cash flows from operating activities: | ||||||||||||||||||||
| Net income | $537,054 | $73,640 | ||||||||||||||||||
| Adjustments to reconcile net income to net cash provided by operating activities: | ||||||||||||||||||||
| Depreciation and amortization | (10, 12) | 219,463 | 209,971 | |||||||||||||||||
| Non-cash impairments | (6, 7) | — | 1,432 | |||||||||||||||||
| Amortization of debt discount and issuance costs | (27) | 32,033 | 42,318 | |||||||||||||||||
| Deferred income taxes | (17) | (15,203) | (14,256) | |||||||||||||||||
| Share based compensation | (22) | 38,391 | 40,936 | |||||||||||||||||
| Loss (gain) on financial assets | (7) | 6,550 | (1,992) | |||||||||||||||||
| Gain on sale of investment | (7) | (36,086) | (121,813) | |||||||||||||||||
| Other items, including fair value changes in derivatives | (11, 16, 26) | (14,045) | 305,045 | |||||||||||||||||
| Changes in operating assets and liabilities: | ||||||||||||||||||||
| Accounts receivable | (8) | (7,402) | (14,711) | |||||||||||||||||
| Inventories | (3) | (81,803) | (107,573) | |||||||||||||||||
| Other current assets | (9) | 13,945 | 896 | |||||||||||||||||
| Other non-current assets | (9) | 1,400 | 316 | |||||||||||||||||
| Accounts payable | (5,975) | 8,442 | ||||||||||||||||||
| Accrued and other liabilities | (15) | (29,927) | 15,967 | |||||||||||||||||
| Other non-current liabilities | (15) | 34,363 | 57,657 | |||||||||||||||||
| Income taxes | (17) | 99,980 | 55,807 | |||||||||||||||||
| Interest paid | (23,617) | (27,056) | ||||||||||||||||||
| Interest received | 8,954 | 9,818 | ||||||||||||||||||
| Income taxes paid, net of refunds | (102,083) | (42,572) | ||||||||||||||||||
| Net cash provided by operating activities | 675,992 | 492,272 | ||||||||||||||||||
| Cash flows from investing activities: | ||||||||||||||||||||
| Purchases of property, plant and equipment | (10) | (138,614) | (79,908) | |||||||||||||||||
| Purchases of intangible assets | (12) | (67,920) | (224,329) | |||||||||||||||||
| Development expenses | (12) | (9,275) | (10,009) | |||||||||||||||||
| Purchases of unquoted debt securities | (7) | (397,650) | (49,770) | |||||||||||||||||
| Proceeds from unquoted debt securities | (7) | 209,157 | 181,223 | |||||||||||||||||
| Purchases of unquoted equity securities | (7) | (3,932) | (408) | |||||||||||||||||
| Proceeds from unquoted equity securities | (7) | 1,287 | 26,046 | |||||||||||||||||
| Proceeds from quoted equity securities | (7) | 150,403 | — | |||||||||||||||||
| Cash paid for acquisitions, net of cash acquired | (5) | — | (239,572) | |||||||||||||||||
| Cash received (paid) for collateral asset | 44,900 | (53,417) | ||||||||||||||||||
| Other investing activities | (57) | (3,146) | ||||||||||||||||||
| Net cash used in investing activities | (211,701) | (453,290) | ||||||||||||||||||
Consolidated Financial Statements 5
QIAGEN N.V. Consolidated Statements of Cash Flows
| Years ended December 31, | ||||||||||||||||||||
| (in thousands) | Note | 2021 | 2020 | |||||||||||||||||
| Cash flows from financing activities: | ||||||||||||||||||||
| Proceeds from short-term debt | — | 59,345 | ||||||||||||||||||
| Repayment of short-term debt | — | (58,705) | ||||||||||||||||||
| Proceeds from long-term debt, net of issuance costs | (16, 17) | — | 497,646 | |||||||||||||||||
| Repayment of long-term debt | (16, 17) | (41,345) | (296,400) | |||||||||||||||||
| Payment for termination of warrants | (16) | — | (174,627) | |||||||||||||||||
| Proceeds from exercise of call option related to cash convertible notes | (16) | — | 239,836 | |||||||||||||||||
| Payment of intrinsic value of cash convertible notes | (16) | — | (237,438) | |||||||||||||||||
| Principal payments on leases | (13) | (27,429) | (24,193) | |||||||||||||||||
| Proceeds from issuance of common shares | 7,919 | 7,662 | ||||||||||||||||||
| Tax withholding related to vesting of stock awards | (23,574) | (13,841) | ||||||||||||||||||
| Purchase of treasury shares | (18) | (99,987) | (63,995) | |||||||||||||||||
| Other financing activities | 6,621 | (9,610) | ||||||||||||||||||
| Net cash used in financing activities | (177,795) | (74,320) | ||||||||||||||||||
| Effect of exchange rate changes on cash and cash equivalents and restricted cash | (3,615) | 4,112 | ||||||||||||||||||
| Net increase (decrease) in cash and cash equivalents and restricted cash | 282,881 | (31,226) | ||||||||||||||||||
| Cash and cash equivalents and restricted cash, beginning of period | 597,003 | 628,229 | ||||||||||||||||||
| Cash and cash equivalents, end of period | $879,884 | $597,003 | ||||||||||||||||||
| Supplemental disclosure of non-cash investing activities: | ||||||||||||||||||||
| Quoted equity securities acquired in non-monetary exchange | (7) | $35,705 | $122,368 | |||||||||||||||||
| Intangible assets received in exchange for note receivable | (24) | $14,989 | $— | |||||||||||||||||
The accompanying notes are an integral part of these consolidated financial statements.
Consolidated Financial Statements 6
QIAGEN N.V. Consolidated Statements of Changes in Equity
| Common Shares | Share premium | Retained earnings | Derivative hedge reserve | Pension reserve | Foreign currency translation | Treasury Shares | Total equity | |||||||||||||||||||||||||||||||||||||||||||||||||||||||||||||||||||||||||||||||
| (in thousands) | Note | Shares | Amount | Shares | Amount | |||||||||||||||||||||||||||||||||||||||||||||||||||||||||||||||||||||||||||||||||
| Balance at January 1, 2020 | 230,829 | $2,702 | $1,790,504 | $948,186 | ($2,289) | ($561) | ($302,729) | (3,077) | ($111,966) | $2,323,847 | ||||||||||||||||||||||||||||||||||||||||||||||||||||||||||||||||||||||||||||
| Net income | — | — | — | 73,640 | — | — | — | — | — | 73,640 | ||||||||||||||||||||||||||||||||||||||||||||||||||||||||||||||||||||||||||||
| Other comprehensive income (loss) | — | — | — | — | (20,979) | (38) | 86,996 | — | — | 65,979 | ||||||||||||||||||||||||||||||||||||||||||||||||||||||||||||||||||||||||||||
| Total comprehensive income | — | — | — | 73,640 | (20,979) | (38) | 86,996 | — | — | 139,619 | ||||||||||||||||||||||||||||||||||||||||||||||||||||||||||||||||||||||||||||
| Purchase of treasury shares | (18) | — | — | — | — | — | — | — | (1,346) | (63,995) | (63,995) | |||||||||||||||||||||||||||||||||||||||||||||||||||||||||||||||||||||||||||
| Tax benefit of employee stock plans | (22) | — | — | 8,675 | — | — | — | — | — | — | 8,675 | |||||||||||||||||||||||||||||||||||||||||||||||||||||||||||||||||||||||||||
| Early conversion of 2021 Notes | (16) | — | — | — | 8,725 | — | — | — | 807 | 30,272 | 38,997 | |||||||||||||||||||||||||||||||||||||||||||||||||||||||||||||||||||||||||||
| Share-based payments | (22) | — | — | 40,936 | — | — | — | — | — | — | 40,936 | |||||||||||||||||||||||||||||||||||||||||||||||||||||||||||||||||||||||||||
| Employee stock plans | (22) | — | — | — | (32,418) | — | — | — | 1,085 | 40,079 | 7,661 | |||||||||||||||||||||||||||||||||||||||||||||||||||||||||||||||||||||||||||
| Tax withholding related to vesting of stock awards | (22) | — | — | — | — | — | — | — | (313) | (12,691) | (12,691) | |||||||||||||||||||||||||||||||||||||||||||||||||||||||||||||||||||||||||||
| Balance at December 31, 2020 | 230,829 | $2,702 | $1,840,115 | $998,133 | ($23,268) | ($599) | ($215,733) | (2,844) | ($118,301) | $2,483,049 | ||||||||||||||||||||||||||||||||||||||||||||||||||||||||||||||||||||||||||||
| Balance at January 1, 2021 | 230,829 | $2,702 | $1,840,115 | $998,133 | ($23,268) | ($599) | ($215,733) | (2,844) | ($118,301) | $2,483,049 | ||||||||||||||||||||||||||||||||||||||||||||||||||||||||||||||||||||||||||||
| Net income | — | — | — | 537,054 | — | — | — | — | — | 537,054 | ||||||||||||||||||||||||||||||||||||||||||||||||||||||||||||||||||||||||||||
| Other comprehensive income (loss) | — | — | — | — | 24,513 | 11 | (107,682) | — | — | (83,158) | ||||||||||||||||||||||||||||||||||||||||||||||||||||||||||||||||||||||||||||
| Total comprehensive income | — | — | — | 537,054 | 24,513 | 11 | (107,682) | — | — | 453,896 | ||||||||||||||||||||||||||||||||||||||||||||||||||||||||||||||||||||||||||||
| Purchase of treasury shares | (18) | — | — | — | — | — | — | — | (1,891) | (99,987) | (99,987) | |||||||||||||||||||||||||||||||||||||||||||||||||||||||||||||||||||||||||||
| Tax benefit of employee stock plans | (22) | — | — | (802) | — | — | — | — | — | — | (802) | |||||||||||||||||||||||||||||||||||||||||||||||||||||||||||||||||||||||||||
| Share-based payments | (22) | — | — | 38,391 | — | — | — | — | — | — | 38,391 | |||||||||||||||||||||||||||||||||||||||||||||||||||||||||||||||||||||||||||
| Employee stock plans | (22) | — | — | — | (44,213) | — | — | — | 1,441 | 52,132 | 7,919 | |||||||||||||||||||||||||||||||||||||||||||||||||||||||||||||||||||||||||||
| Tax withholding related to vesting of stock awards | (22) | — | — | — | — | — | — | — | (461) | (23,574) | (23,574) | |||||||||||||||||||||||||||||||||||||||||||||||||||||||||||||||||||||||||||
| Balance at December 31, 2021 | 230,829 | $2,702 | $1,877,704 | $1,490,974 | $1,245 | ($588) | ($323,415) | (3,755) | ($189,730) | $2,858,892 | ||||||||||||||||||||||||||||||||||||||||||||||||||||||||||||||||||||||||||||
The accompanying notes are an integral part of these consolidated financial statements.
Consolidated Financial Statements 7
Notes to the Consolidated Financial Statements
December 31, 2021
1. Corporate Information, Basis of Presentation and Statement of Compliance
QIAGEN N.V. is a public limited liability company ('naamloze vennootschap') under Dutch law with a registered office at Hulsterweg 82, 5912 PL Venlo, The Netherlands. QIAGEN N.V., a Netherlands holding company, and subsidiaries (we, our or the Company) is a leading global provider of Sample to Insight solutions that enable customers to gain valuable molecular insights from samples containing the building blocks of life. Our sample technologies isolate and process DNA, RNA and proteins from blood, tissue and other materials. Assay technologies make these biomolecules visible and ready for analysis. Bioinformatics software and knowledge bases interpret data to report relevant, actionable insights. Automation solutions tie these together in seamless and cost-effective workflows. We provide solutions to more than 500,000 customers around the world in Molecular Diagnostics (human healthcare) and Life Sciences (academia, pharma R&D and industrial applications, primarily forensics). As of December 31, 2021, we employed more than 6,000 people in over 35 locations worldwide.
The accompanying consolidated financial statements were prepared in accordance with International Financial Reporting standards as endorsed by the European Union (IFRS) and all amounts are presented in U.S. dollars rounded to the nearest thousand, unless otherwise indicated. The consolidated financial statements have been prepared on a historical cost basis, except for derivative financial instruments, contingent consideration and financial assets that have been measured at fair value. The financial statements of the Company have been prepared on the basis of the going concern assumption. Based on our current knowledge and available information, we do not expect COVID-19 to have an impact on our ability to continue as a going concern in the future. The consolidated financial statements also comply with the financial reporting requirements included in Section 9 in Book 2 of the Netherlands Civil Code, as far as applicable.
We undertake acquisitions to complement our own internal product development activities. In September 2020, we completed the acquisition of the remaining shares in NeuMoDx Molecular, Inc. (NeuMoDx), a privately-held U.S. company that designs and develops molecular diagnostics solutions for hospital and clinical reference laboratories. Accordingly, at the acquisition date, all the assets acquired and liabilities assumed were recorded at fair value and our consolidated results of operations include the operating results from the acquired company from the acquisition date.
Certain prior year amounts have been reclassified to conform to the current year presentation.
The consolidated financial statements of QIAGEN for the year ended December 31, 2021, were authorized for issue in accordance with a resolution of the Supervisory Board on April 15, 2022.
2. Effects of New Accounting Policies and Disclosures
Adoption of New and Amended Standards and Interpretations
The consolidated financial statements were prepared based on the same accounting policies as those applied and described in the consolidated financial statements at December 31, 2020.
Consolidated Financial Statements 8
Amended standard not yet adopted:
Below we disclose the forthcoming requirements not yet implemented that could potentially impact our future accounting policies. We intend to adopt the amended standards at their effective dates.
The IASB amended IAS 37, Provisions, Contingent Liabilities and Contingent Assets, to clarify that when assessing if a contract is onerous, the cost of fulfilling the contract includes all costs that related directly to the contract. The amendments apply prospectively for annual reporting periods beginning on or after January 1, 2022. Earlier application is permitted.
To promote consistency in application and clarify the requirements on determining if a liability is current or non-current, the IASB amended IAS 1 Presentation of Financial Statements. The amendments apply retrospectively for annual reporting periods beginning on or after January 1, 2023. Earlier application is permitted.
In February 2021, the Board issued amendments to IAS 8, Definition of Accounting Estimates, in which it introduces a new definition of ‘accounting estimates’. The amendments apply to changes in accounting policies and changes in accounting estimates that occur on or after the start of the January 1, 2023 effective date. Earlier application is permitted.
3. Summary of Significant Accounting Policies, Estimates and Judgments
Significant Accounting Policies
3.1 Consolidation Principles
The consolidated financial statements comprise the financial statements of the Company and its subsidiaries as at December 31, 2021 and for the year then ended.
Subsidiaries are fully consolidated from the date of acquisition, being the date on which the Company obtains control, and continue to be consolidated until the date that such control ceases. An entity is controlled when the Company has power over the entity, exposure or rights to variable returns from its involvement with the entity, and the ability to affect those returns through its power over the entity. In determining whether control exists, potential voting rights must be taken into account if those rights are substantive, in other words they can be exercised on a timely basis when decisions about the relevant activities of the entity are to be taken. Entities consolidated by the Company are referred to as "subsidiaries." The financial statements of the subsidiaries are prepared for the same reporting period as the parent company, using consistent accounting policies. All intra-Company balances, income and expenses, unrealized gains and losses and dividends resulting from intra-Company transactions are eliminated in full.
Profit or loss and each component of other comprehensive income are attributed to the owners of the parent and to the noncontrolling interest. Total comprehensive income is attributed to the owners of the parent and to the noncontrolling interest even this results in a deficit balance.
A change in the ownership interest of a subsidiary, without a change of control, is accounted for as an equity transaction.
If the Company loses control over a subsidiary, it derecognizes the assets (including goodwill) and liabilities of the subsidiary, the carrying amount of any noncontrolling interest, the cumulative translation differences, recorded in equity, recognizes the fair value of the consideration received, recognizes the fair value of any investment retained, any surplus or deficit in profit or loss and reclassifies the parent's share of components previously recognized in other comprehensive income to profit or loss.
3.2 Business Combinations and Goodwill
Business combinations are accounted for using the acquisition method. The cost of an acquisition is measured as the aggregate of the consideration transferred, measured at acquisition date fair value and the amount of any noncontrolling interest in the acquiree. The Company measures the noncontrolling interest in the acquiree at fair-value. Acquisition related costs incurred are expensed.
Consolidated Financial Statements 9
When the Company acquires a business, it assesses the financial assets and liabilities assumed for appropriate classification and designation in accordance with the contractual terms, economic circumstances and pertinent conditions as at the acquisition date.
Any contingent consideration to be transferred by the acquirer will be recognized at fair value at the acquisition date. Subsequent changes to the fair value of the contingent consideration which is deemed to be an asset or liability will be recognized either in profit or loss or as change to other comprehensive income. If the contingent consideration is classified as equity, it shall not be remeasured until it is finally settled within equity.
Goodwill is initially measured at cost being the excess of the consideration transferred and the amount recognized for noncontrolling interest over the Company's net identifiable assets acquired and liabilities assumed. If this consideration is lower than the fair value of the net assets of the subsidiary acquired, the difference is recognized as profit.
After initial recognition, goodwill is measured at cost less any accumulated impairment losses. For the purpose of impairment testing, goodwill acquired in a business combination is, from the acquisition date, allocated to each of the Company's cash generating units that are expected to benefit from the combination, irrespective of whether other assets or liabilities of the acquiree are assigned to those units.
Where goodwill forms part of a cash-generating unit and part of the operation within that unit is disposed of, the goodwill associated with the operation disposed of is included in the carrying amount of the operation when determining the gain or loss on disposal of the operation. Goodwill disposed of in this circumstance is measured based on the relative values of the operation disposed of and the portion of the cash-generating unit retained.
Management monitors and makes decisions regarding the Company's operations on a functional specific and global level. Therefore, we concluded that the consolidated Company as a whole qualifies as one cash generating unit.
3.3 Equity Accounted Investments
Investments in entities in which the Company has significant influence, generally participations of 20% or more of the voting power, but over which it does not exercise management control are accounted for using the equity method.
Under the equity method, the investment is carried in the statement of financial position at cost plus post acquisition changes in the Company's share of net assets of the associate.
After application of the equity method, the Company determines whether it is necessary to recognize an additional impairment loss on the Company's investment. The Company determines at each reporting date whether there is any objective evidence that the investment is impaired. If this is the case the Company calculates the amount of impairment as the difference between the recoverable amount of the investment and its carrying value and recognizes the amount in the income statement.
Upon loss of significant influence over the associate, the Company measures and recognizes any retaining investment at its fair value.
3.4 Foreign Currency Translation
The Company's presentation currency is the U.S. dollar (US$) which is also the parent company's functional currency. The majority of our subsidiaries' functional currencies are the local currency of the respective country. Statements of financial position prepared in the functional currencies are translated to the presentation currency at exchange rates in effect at the end of the accounting period except for shareholders' equity accounts, which are translated at rates in effect when these balances were originally recorded. Revenue and expense accounts are translated at a weighted average of exchange rates during the period. The cumulative effect of translation is included in shareholders' equity. On disposal of a subsidiary, such translation differences are recognized in the income statement as part of the gain or loss on sale.
Foreign currency transactions involving monetary assets and liabilities denominated in a currency other than the functional currency of the entity are translated using the exchange rate prevailing at the dates of the transactions and are subsequently valued at the closing rates at each period end. Foreign currency transaction gains and losses realized until settlement are included in the income statement, except for those related to intercompany transactions of a long-term investment nature which represent in substance part of the reporting entity's net investment in a foreign entity; such gains and losses are included in the
Consolidated Financial Statements 10
cumulative foreign currency translation adjustments component of shareholders' equity. The net loss on foreign currency transactions in 2021 was $9.0 million, and in 2020 was $4.1 million.
The exchange rates of key currencies affecting the Company were as follows:
| Closing rate as at December 31, | Annual average rate | |||||||||||||||||||||||||
| (US$ equivalent for one) | 2021 | 2020 | 2021 | 2020 | ||||||||||||||||||||||
| Euro (EUR) | 1.1326 | 1.2271 | 1.1832 | 1.1411 | ||||||||||||||||||||||
| Pound Sterling (GBP) | 1.3479 | 1.3649 | 1.3758 | 1.2836 | ||||||||||||||||||||||
| Swiss Franc (CHF) | 1.0963 | 1.1360 | 1.0940 | 1.0659 | ||||||||||||||||||||||
| Australian Dollar (AUD) | 0.7253 | 0.7720 | 0.7514 | 0.6905 | ||||||||||||||||||||||
| Canadian Dollar (CAD) | 0.7869 | 0.7849 | 0.7977 | 0.7463 | ||||||||||||||||||||||
| Japanese Yen (JPY) | 0.0087 | 0.0097 | 0.0091 | 0.0094 | ||||||||||||||||||||||
| Chinese Yuan (CNY) | 0.1574 | 0.1530 | 0.1550 | 0.1450 | ||||||||||||||||||||||
3.5 Revenue Recognition
We recognize revenue when the performance obligation is satisfied by transferring the promised goods or services to customers in an amount that reflects the consideration that is expected to be received in exchange for those goods or services. The majority of our sales revenue continues to be recognized when products are shipped to the customers at which point control transfers.
Shipping and handling costs charged to customers are recorded as revenue in the period that the related product sale revenue is recorded. Associated costs of shipping and handling are included in sales and marketing expenses. For the years ended December 31, 2021 and 2020, shipping and handling costs totaled $31.7 million and $32.1 million, respectively.
3.6 Operating Expenses
Advertising Costs
The costs of advertising are expensed as incurred and are included as a component of sales and marketing expense. Advertising costs for the years ended December 31, 2021 and 2020 were $13.5 million and $9.5 million, respectively.
General and Administrative
General and administrative expenses primarily represent the costs required to support administrative infrastructure. These costs include licensing costs in connection with continued investments information technology improvements, including cyber security, across the organization as well as personnel in administrative functions.
Restructuring, Acquisition, Integration and Other
We incur indirect acquisition and business integration costs in connection with business combinations. These costs represent incremental costs that we believe would not have been incurred absent the business combinations. Major components of these costs include consulting and related fees incurred to integrate or restructure the acquired operations, payroll and related costs for employees remaining with the Company on a transitional basis and public relations, advertising and media costs for re-branding of the combined organization.
Restructuring costs include personnel costs (principally termination benefits), facility closure and contract termination costs. Termination benefits are recorded when it is probable that employees will be entitled to benefits and the amounts can be reasonably estimated. Estimates of termination benefits are based on the frequency of past termination benefits, the similarity of benefits under the current plan and prior plans, and the existence of statutory required minimum benefits. Facility closure and other costs are recorded when the liability is incurred. The specific restructuring measures and associated estimated costs are based on
Consolidated Financial Statements 11
management's best business judgment under the existing circumstances at the time the estimates are made. If future events require changes to these estimates, such adjustments will be reflected in the period of the revised estimate. See Note 6 "Restructuring and Impairments" for the details.
On March 3, 2020, QIAGEN and Thermo Fisher Scientific Inc. (NYSE: TMO) announced that their boards of directors, as well as the Managing Board of QIAGEN N.V., unanimously approved Thermo Fisher’s proposal to acquire QIAGEN. On August 13, 2020, QIAGEN announced that Thermo Fisher did not achieve the minimum 66.67% acceptance threshold from QIAGEN shareholders. For the year ended December 31, 2020, we incurred related expenses of $125.5 million, which includes the $95.0 million expense reimbursement which was paid when the minimum acceptance threshold was not met. These costs are recorded within restructuring, acquisition, integration and other expenses, net in the accompanying consolidated income statement.
Research and Development
Research costs are expensed as incurred. Development expenditures on an individual project are recognized as an intangible asset when the Company can demonstrate:
•The technical feasibility of completing the intangible asset so that it will be available for use or sale.
•Its intention to complete and its ability to use or sell the asset.
•How the asset will generate probable future economic benefits.
•The availability of resources to complete the asset and to use or sell the intangible asset.
•The ability to measure reliably the expenditure during development.
Following initial recognition of the development expenditure as an asset, the cost model is applied requiring the asset to be carried at cost less any accumulated amortization and accumulated impairment losses.
Amortization of the asset begins when development is complete and the asset is available for use. It is amortized over the period of expected future benefit. Amortization is recorded in cost of sales. During the period of development, the asset is tested for impairment annually. The capitalized expenses are amortized on a straight-line basis over their estimated useful lives (between three and five years).
3.7 Government Grants
We recognize government grants when there is reasonable assurance that all conditions will be complied with and the grant will be received. Our government grants generally represent subsidies for specified activities and are therefore recognized when earned as a reduction of the expenses recorded for the activity that the grants are intended to compensate. Thus, when the grant relates to research and development expense, the grant is recognized over the same period that the related costs are incurred. Otherwise, amounts received under government grants are recorded as liabilities in the statement of financial position. When the grant relates to an asset, the value of the grant is deducted from the carrying amount of the asset and recognized over the same period that the related asset is depreciated or amortized.
The Company has received cost grants and investment grants. In 2021, the Company recorded income from government grants in the amount of $1.3 million (2020: $3.0 million). As of December 31, 2020, liabilities in the amount of $2.7 million are recorded with respect to grants which have been received but for which not all conditions have been met.
3.8 Borrowing Costs
Borrowing costs directly attributable to the acquisition, construction or production of an asset that takes a substantial period of time to get ready for its intended use or sale are capitalized as part of the cost of the respective assets (qualifying asset) when such borrowing costs are significant. All other borrowing costs are expensed in the period they occur.
Consolidated Financial Statements 12
3.9 Post-Employment Benefits
The Company operates a number of defined benefit and defined contribution plans. For defined benefit plans, the Company provides for benefits payable to their employees on retirement by charging current service costs to income. The defined benefit liability comprises the present value of the defined benefit obligation less past service cost and actuarial gains and losses not yet recognized and less the fair value of plan assets out of which the obligations are to be settled directly. The Company's contributions to the defined contribution pension plans are charged to the income statement in the year to which they relate. Refer to Note 23 "Employee Benefits and Personnel Costs" for more details.
3.10 Share-Based Payments
The Company has a stock option plan, which is described in detail under Note 22 "Share-Based Payments". A compensation charge is calculated at the date the options are granted. This charge is recognized over the stock option's vesting period. When the option is exercised, the proceeds received net of any transaction costs are credited to share capital and share premium.
3.11 Taxation
Taxes reported in the consolidated income statements include current and deferred income taxes.
Current income tax
Current income tax assets and liabilities are measured at the amount expected to be recovered from or paid to the taxation authorities and are presented net within tax jurisdictions where permitted. The tax rates and tax laws used to compute the amount are those that are enacted or substantively enacted, by the reporting date, in the countries where the Company operates and generates taxable income.
Current income tax relating to items recognized directly in equity is recognized in equity and not in the income statement. Management periodically evaluates positions taken in the tax returns with respect to situations in which applicable tax regulations are subject to interpretation and establishes provisions where appropriate.
Deferred tax
Deferred tax is provided using the liability method on temporary differences at the reporting date between the tax bases of assets and liabilities and their carrying amounts for financial reporting purposes.
Deferred tax assets and liabilities are measured at the tax rates that are expected to apply in the year when the asset is realized or the liability is settled, based on tax rates (and tax laws) that have been enacted or substantively enacted at the reporting date.
Deferred tax relating to items recognized outside profit or loss is recognized outside profit or loss. Deferred tax items are recognized in correlation to the underlying transaction either in other comprehensive income or directly in equity.
Deferred tax assets and deferred tax liabilities are offset, if a legally enforceable right exists to set off current tax assets against current income tax liabilities and the deferred taxes relate to the same taxable entity and the same taxation authority.
Income tax exposure
Uncertainties exist with respect to the interpretation of complex tax regulations, changes in tax laws, and the amount and timing of future taxable income. Given the wide range of international business relationships and the long-term nature and complexity of existing contractual agreements, differences arising between the actual results and the assumptions made, or future changes to such assumptions, could necessitate future adjustments to tax income and expense already recorded.
The Company establishes provisions, based on reasonable estimates, for possible consequences of audits by the tax authorities of the respective counties in which it operates. The amount of such provisions is based on various factors, such as experience of previous tax audits and differing interpretations of tax regulations by the taxable entity and the responsible tax authority. Such differences of Interpretation may arise on a wide variety of issues depending on the conditions prevailing in the respective Company's domicile.
Consolidated Financial Statements 13
3.12 Financial Instruments - Recognition and Initial Measurement
The Company's financial assets include cash and short-term deposits, trade and other receivables, loan and other receivables, quoted and unquoted financial instruments, and derivative financial instruments. The Company's financial liabilities include trade and other payables, bank overdraft, loans and borrowings, and derivative financial instruments.
Trade receivables and debt securities issued are initially recognized when they are originated. All other financial assets and financial liabilities are initially recognized when the Company becomes a party to the contractual provisions of the instrument.
A financial asset (unless it is a trade receivable without a significant financing component) or financial liability is initially measured at fair value plus, for an item not at fair value through profit or loss (FVTPL), transaction costs that are directly attributable to its acquisition or issue. A trade receivable without a significant financing component is initially measured at the transaction price.
3.13 Financial Instruments - Classification and Subsequent Measurement
Financial assets
On initial recognition, a financial asset is classified as measured at: amortized costs; fair value through other comprehensive income (FVOCI) - debt investment; FVOCI - equity investment; or FVTPL.
Financial assets are not reclassified subsequent to their initial recognition unless the Company changes its business model for managing financial assets, in which case all affected financial assets are reclassified on the first day of the first reporting period following the change in the business model.
A financial asset is measured at amortized cost if it meets both of the following conditions and is not designated as an FVTPL:
•it is held within a business model whose objective is to hold assets to collect contractual cash flows; and
•its contractual terms give rise on specified dates to cash flows that are solely payments of principal and interest on the principal amount outstanding.
A debt investment is measured at FVOCI if it meets both of the following conditions and is not designated as at FVTPL:
•it is held within a business model whose objective is achieved by both collecting contractual cash flows and selling financial assets; and
•its contractual terms give rise on specified dates to cash flows that are solely payments of principal and interest on the principal amount outstanding.
On initial recognition of an equity investment that is not held for trading, the Company may irrevocably elect to present subsequent changes in the investment's fair value in OCI. This election is made on an investment-by-investment basis.
All financial assets not classified as measured at amortized cost or FVOCI as described above are measured at FVTPL. This includes all derivative financial assets (see Note 26). On initial recognition, the Company may irrevocably designate a financial asset that otherwise meets the requirements to be measured at amortized cost or at FVOCI as at FVTPL if doing so eliminates or significantly reduces an accounting mismatch that would otherwise arise.
Financial assets - Business model assessment
The Company makes an assessment of the objective of the business model in which a financial asset is held at a portfolio level because this best reflects the way the business is managed and information is provided to management. The information considered includes:
•the stated policies and objectives for the portfolio and the operation of those policies in practice. These include whether management’s strategy focuses on earning contractual interest income, maintaining a particular interest rate profile, matching the duration of the financial assets to the duration of any related liabilities or expected cash outflows or realizing cash flows through the sale of the assets;
Consolidated Financial Statements 14
•how the performance of the portfolio is evaluated and reported to the Company’s management;
•the risks that affect the performance of the business model (and the financial assets held within that business model) and how those risks are managed;
•how managers of the business are compensated - e.g. whether compensation is based on the fair value of the assets managed or the contractual cash flows collected; and
•the frequency, volume and timing of sales of financial assets in prior periods, the reasons for such sales and expectations about future sales activity.
Transfers of financial assets to third parties in transactions that do not qualify for derecognition are not considered sales for this purpose, consistent with the Company’s continuing recognition of the assets.
Financial assets that are held for trading or are managed and whose performance is evaluated on a fair value basis are measured at FVTPL.
Financial assets - Assessment whether contractual cash flows are solely payments of principal and interest
For the purposes of this assessment, ‘principal’ is defined as the fair value of the financial asset on initial recognition. ‘Interest’ is defined as consideration for the time value of money and for the credit risk associated with the principal amount outstanding during a particular period of time and for other basic lending risks and costs (e.g. liquidity risk and administrative costs), as well as a profit margin.
In assessing whether the contractual cash flows are solely payments of principal and interest, the Company considers the contractual terms of the instrument. This includes assessing whether the financial asset contains a contractual term that could change the timing or amount of contractual cash flows such that it would not meet this condition. In making this assessment, the Company considers:
•contingent events that would change the amount or timing of cash flows;
•terms that may adjust the contractual coupon rate, including variable-rate features;
•prepayment and extension features; and
•terms that limit the Company’s claim to cash flows from specified assets (e.g. non-recourse features).
A prepayment feature is consistent with the solely payments of principal and interest criterion if the prepayment amount substantially represents unpaid amounts of principal and interest on the principal amount outstanding, which may include reasonable additional compensation for early termination of the contract. Additionally, for a financial asset acquired at a discount or premium to its contractual par amount, a feature that permits or requires prepayment at an amount that substantially represents the contractual par amount plus accrued (but unpaid) contractual interest (which may also include reasonable additional compensation for early termination) is treated as consistent with this criterion if the fair value of the prepayment feature is insignificant at initial recognition.
Financial assets - Subsequent measurement and gains and losses
| Financial assets at FVTPL | These assets are subsequently measured at fair value. Net gains and losses, including any interest or dividend income, are recognized in profit or loss. However, see Note 26 for derivatives designated as hedging instruments. | |||||||
| Financial assets at amortized cost | These assets are subsequently measured at amortized cost using the effective interest method. The amortized cost is reduced by impairment losses. Interest income, foreign exchange gains and losses and impairment are recognized in profit or loss. Any gain or loss on derecognition is recognized in profit or loss. | |||||||
| Debt investments at FVOCI | These assets are subsequently measured at fair value. Interest income calculated using the effective interest method, foreign exchange gains and losses and impairment are recognized in profit or loss. Other net gains and losses are recognized in OCI. On derecognition, gains and losses accumulated in OCI are reclassified to profit or loss. | |||||||
| Equity investments at FVOCI | These assets are subsequently measured at fair value. Dividends are recognized as income in profit or loss unless the dividend clearly represents a recovery of part of the cost of the investment. Other net gains and losses are recognized in OCI and are never reclassified to profit or loss. | |||||||
The Company does not hold any debt or equity investments at FVOCI as of December 31, 2021.
Consolidated Financial Statements 15
Financial liabilities - Classification, subsequent measurement and gains and losses
Financial liabilities are classified as measured at amortized cost or FVTPL. A financial liability is classified as at FVTPL if it is classified as held-for-trading, it is a derivative or it is designated as such on initial recognition. Financial liabilities at FVTPL are measured at fair value and net gains and losses, including any interest expense, are recognized in profit or loss. Other financial liabilities are subsequently measured at amortized cost using the effective interest method. Interest expense and foreign exchange gains and losses are recognized in profit or loss. Any gain or loss on derecognition is also recognized in profit or loss.
See Note 26 for financial liabilities designated as hedging instruments.
3.14 Derecognition
Financial assets
The Company derecognizes a financial asset when the contractual rights to the cash flows from the financial asset expire, or it transfers the rights to receive the contractual cash flows in a transaction in which substantially all of the risks and rewards of ownership of the financial asset are transferred or in which the Company neither transfers nor retains substantially all of the risks and rewards of ownership and it does not retain control of the financial asset.
The Company enters into transactions whereby it transfers assets recognized in its statement of financial position, but retains either all or substantially all of the risks and rewards of the transferred assets. In these cases, the transferred assets are not derecognized.
Financial liabilities
The Company derecognizes a financial liability when its contractual obligations are discharged or canceled, or expire. The Company also derecognizes a financial liability when its terms are modified and the cash flows of the modified liability are substantially different, in which case a new financial liability based on the modified terms is recognized at fair value.
On derecognition of a financial liability, the difference between the carrying amount extinguished and the consideration paid (including any non‑cash assets transferred or liabilities assumed) is recognized in profit or loss.
3.15 Offsetting
Financial assets and financial liabilities are offset and the net amount presented in the statement of financial position when, and only when, the Company currently has a legally enforceable right to set off the amounts and it intends either to settle them on a net basis or to realize the asset and settle the liability simultaneously.
3.16 Derivative Financial Instruments and Hedge Accounting
The Company holds derivative financial instruments to hedge its foreign currency and interest rate risk exposures. Embedded derivatives are separated from the host contract and accounted for separately if the host contract is not a financial asset and certain criteria are met.
Derivatives are initially measured at fair value. Subsequent to initial recognition, derivatives are measured at fair value, and changes therein are generally recognized in profit or loss.
At inception of designated hedging relationships, the Company documents the risk management objective and strategy for undertaking the hedge. The Company also documents the economic relationship between the hedged item and the hedging instrument, including whether the changes in cash flows of the hedged item and hedging instrument are expected to offset each other.
Cash flow hedges
When a derivative is designated as a cash flow hedging instrument, the effective portion of changes in the fair value of the derivative is recognized in OCI and accumulated in the hedging reserve. The effective portion of changes in the fair value of the derivative that is recognized in OCI is limited to the cumulative change in fair value of the hedged item, determined on a present value basis, from inception of the hedge. Any ineffective portion of changes in the fair value of the derivative is recognized immediately in profit or loss.
Consolidated Financial Statements 16
The Company designates only the change in fair value of the spot element of forward exchange contracts as the hedging instrument in cash flow hedging relationships. The change in fair value of the forward element of forward exchange contracts (‘forward points’) is separately accounted for as a cost of hedging and recognized in a costs of hedging reserve within equity.
When the hedged forecast transaction subsequently results in the recognition of a non-financial item such as inventory, the amount accumulated in the hedging reserve and the cost of hedging reserve is included directly in the initial cost of the non-financial item when it is recognized.
For all other hedged forecast transactions, the amount accumulated in the hedging reserve and the cost of hedging reserve is reclassified to profit or loss in the same period or periods during which the hedged expected future cash flows affect profit or loss.
If the hedge no longer meets the criteria for hedge accounting or the hedging instrument is sold, expires, is terminated or is exercised, then hedge accounting is discontinued prospectively. When hedge accounting for cash flow hedges is discontinued, the amount that has been accumulated in the hedging reserve remains in equity until, for a hedge of a transaction resulting in the recognition of a non-financial item, it is included in the non-financial item’s cost on its initial recognition or, for other cash flow hedges, it is reclassified to profit or loss in the same period or periods as the hedged expected future cash flows affect profit or loss.
If the hedged future cash flows are no longer expected to occur, then the amounts that have been accumulated in the hedging reserve and the cost of hedging reserve are immediately reclassified to profit or loss.
Net investment hedges
When a derivative instrument or a non-derivative financial liability is designated as the hedging instrument in a hedge of a net investment in a foreign operation, the effective portion of, for a derivative, changes in the fair value of the hedging instrument or, for a non-derivative, foreign exchange gains and losses is recognized in OCI and presented in the translation reserve within equity. Any ineffective portion of the changes in the fair value of the derivative or foreign exchange gains and losses on the non-derivative is recognized immediately in profit or loss. The amount recognized in OCI is reclassified to profit or loss as a reclassification adjustment on disposal of the foreign operation.
3.17 Cash and Cash Equivalents
Cash and cash equivalents consist of cash on deposit in banks and other cash invested temporarily in various instruments that are short-term and highly liquid, and having an original maturity of less than 90 days at the date of purchase.
| (in thousands) | 2021 | 2020 | ||||||||||||
| Cash at bank and on hand | $234,749 | $244,392 | ||||||||||||
| Money market funds | 366,117 | 273,584 | ||||||||||||
| Commercial paper | 179,844 | — | ||||||||||||
| Short-term bank deposits | 99,174 | 79,027 | ||||||||||||
| Cash and cash equivalents | $879,884 | $597,003 | ||||||||||||
3.18 Inventories
Inventories are stated at the lower of cost and net realizable value. The moving average method of valuation is used. The cost of work in process and finished goods includes raw materials, direct labor and production overhead expenditure based upon normal operating capacity. Net realizable value is the estimated selling price in the ordinary course of business less the cost of completion and distribution expenses. Provisions are established for slow-moving and obsolete inventory.
Consolidated Financial Statements 17
| (in thousands) | 2021 | 2020 | ||||||||||||
| Raw materials | $94,748 | $65,449 | ||||||||||||
| Work in process | 67,679 | 74,398 | ||||||||||||
| Finished goods | 165,098 | 151,334 | ||||||||||||
| Inventories | $327,525 | $291,181 | ||||||||||||
Included in inventories as of December 31, 2021, are $33.4 million (2020: $28.0 million) of inventory provisions. The movement in inventory provisions was recorded under cost of sales. During 2021, inventories in the amount of $323.1 million have been recognized as cost of sales (2020: $253.8 million).
3.19 Property, Plant and Equipment
Property, plant and equipment are stated at cost of acquisition or construction cost less accumulated depreciation and accumulated impairment in value. Depreciation is computed using the straight-line and declining balance methods over the following estimated useful lives of the assets:
| Buildings and improvements | 5-40 years | |||||||
| Machinery and equipment | 3-10 years | |||||||
| Furniture and office equipment | 3-10 years | |||||||
3.20 Leases
Company as a lessee
Leases are recognized as a right-of-use asset and a corresponding liability at the date at which the leased asset is available for use by the company. The right-of-use asset is depreciated over the shorter of the asset's useful life and the lease term on a straight-line basis.
Assets and liabilities arising from a lease are initially measured on a present value basis. Lease liabilities include the net present value of the following lease payments:
•fixed payments, including in-substance fixed payments, less any lease incentives received;
•variable lease payments that are based on an index or a rate;
•amounts expected to be payable to the lessee under residual value guarantees;
•the exercise price of a purchase option if the lessee is reasonably certain to exercise that option; and
•payments of penalties for terminating the lease, if the lease term reflects the lessee exercising that option.
The lease payments are discounted using the interest rate implicit in the lease. If that rate cannot be determined, the lessee's incremental borrowing rate at the lease commencement date is used, which is based on an assessment of interest rates the company would have to pay to borrow funds, including the consideration of factors such as the nature of the asset and location, collateral, market terms and conditions, as applicable. After the commencement date, the amount of lease liabilities is increased to reflect the accretion of interest and reduced for the lease payments made.
Consolidated Financial Statements 18
Each lease payment is allocated between the liability and finance charges. The interest element of the finance cost is recognized in the income statement over the lease period so as to produce a constant periodic rate of interest on the remaining balance of the liability for each period. In addition, the carrying amount of lease liabilities is remeasured if there is a modification, a change in the lease term, a change in the in-substance fixed lease payments or a change in the assessment to purchase the underlying asset.
Right-of-use assets are measured at cost comprising the following:
•the amount of the initial measurement of the lease liability;
•any lease payments made at or before the commencement date less any lease incentives received;
•any initial direct costs; and
•restoration costs.
The company determines the lease term as the non-cancellable term of the lease, together with any periods covered by an option to extend the lease if it is reasonably certain to be exercised, or any periods covered by an option to terminate the lease, if it is reasonably certain not to be exercised. The company applies judgement in evaluating whether it is reasonably certain to exercise the option to renew. That is, it considers all relevant factors that create an economic incentive for it to exercise the renewal.
The company leases various items of real estate, vehicles and other equipment. Rental contracts are typically made for fixed periods but may have extension or termination options.
Company as a lessor
When the company acts as a lessor, it determines at lease inception whether a lease is a finance lease or an operating lease. Leases in which the company does not transfer substantially all the risks and rewards incidental to ownership of an asset are classified as operating leases. The company recognizes lease payments received under operating leases as income on a straight-line basis over the lease terms in the Income Statement.
3.21 Intangible Assets
Intangible assets acquired separately are measured on initial recognition at cost. The cost of intangible assets acquired in a business combination is its fair value as at the date of acquisition. Expenditure on acquired technology rights, patents, trademarks and licenses are capitalized as intangible assets when it is probable that future economic benefits will flow to the Company and the cost can be measured reliably. Following initial recognition, intangible assets are carried at cost less any accumulated amortization and any accumulated impairment losses.
Amortization expense related to developed technology and patent and license rights acquired in a business combination is included in cost of sales. Amortization of trademarks and customer base acquired in a business combination is recorded in sales and marketing expense. Amortization expenses of intangible assets not acquired in a business combination are recorded within cost of sales, research and development, or sales and marketing line items based on the nature and use of the asset.
The useful lives of intangible assets are assessed as either finite or indefinite. Intangible assets with finite lives are amortized over the useful economic life and assessed for impairment whenever there is an indication that the intangible asset may be impaired. The amortization period and the amortization method for an intangible asset with a finite useful life are reviewed at least at each financial year end. Changes in the expected useful life or the expected pattern of consumption of future economic benefits embodied in the asset is accounted for by changing the amortization period or method, as appropriate, and are treated as changes in accounting estimates. The amortization expense on intangible assets with finite lives is recognized in the income statement in the expense category consistent with the function of the intangible asset.
Consolidated Financial Statements 19
Developed technology, patents and license rights, computer software, development costs and other intellectual properties are amortized on a straight-line basis over their estimated useful lives as follows:
| Developed technology, patents and license rights | 5-15 years | |||||||
| Computer software | 3-10 years | |||||||
| Development costs | 3-5 years | |||||||
| Other intellectual properties | 5-15 years | |||||||
3.22 Impairment
Impairment of financial assets
The Company recognizes an allowance for expected credit losses (ECLs) for trade receivables, contract assets, and debt investments carried and amortized cost. ECLs are based on the difference between the contractual cash flows due in accordance with the contract and all the cash flows that the company expects to receive, discounted at an approximation of the original effective interest rate.
ECLs are recognized in two stages. For credit risk exposures for which there has not been a significant increase in credit risk since initial recognition, ECLs are provided for credit losses that result from default events that are possible within the next 12 months (12-month ECLs). The company considers a financial asset to be in default when the counterparty is unlikely to pay its credit obligations to the company in full or when the financial asset is past due. For those credit exposures for which there has been a significant increase in credit risk since initial recognition, a loss allowance is required for credit losses expected over the remaining life of the exposure, irrespective of the timing of the default (lifetime ECLs). When determining whether the credit risk of a financial asset has increased significantly since initial recognition, the Company considers reasonable and supportable information that is relevant and available without undue cost or effort. This includes both quantitative and qualitative information and analysis, based on the company's historical experience and informed credit assessment and including forward-looking information, such as forecast economic conditions.
The Company assess the trade receivables allowance by applying the IFRS 9 simplified approach to measuring expected credit losses (ECLs), which uses the lifetime ECL allowance. To measure the ECLs on trade receivables, the Company considers any credit-risk concentration, collective debt risk based on historical losses, specific circumstances considering the market information on a country specific basis, and other forward looking information. Trade receivables are written off when there is no reasonable expectation of recovery of the asset (for example because of bankruptcy).
Impairment of non-financial assets
The Company assesses at each reporting date whether there is an indication that an asset may be impaired. If any indication exists, or when annual impairment testing for an asset is required, the Company estimates the asset's recoverable amount. An asset's recoverable amount is the higher of an asset's or cash-generating unit's (CGU) fair value less costs to sell and its value in use and is determined for an individual asset, unless the asset does not generate cash inflows that are largely independent of those from other assets or the Company's assets. Where the carrying amount of an asset or CGU exceeds its recoverable amount, the asset is considered impaired and is written down to its recoverable amount. In assessing value in use, the estimated future cash flows are discounted to their present value using a pre-tax discount rate that reflects current market assessments of the time value of money and the risks specific to the asset. In determining fair value less costs to sell, an appropriate valuation model is used. These calculations are corroborated by valuation multiples, quoted share prices for publicly traded subsidiaries or other available fair value indicators.
Impairment losses are recognized in the income statement in those expense categories consistent with the function of the impaired asset, except for property previously revalued where the revaluation was taken to other comprehensive income. In this case, the impairment is also recognized in other comprehensive income up to the amount of any previous revaluation.
For assets excluding goodwill, an assessment is made at each reporting date as to whether there is any indication that previously recognized impairment losses may no longer exist or may have decreased. If such indication exists, the Company estimates the asset's or cash-generating unit's recoverable amount. A previously recognized impairment loss is reversed only if there has been a change in the assumptions used to determine the asset's recoverable amount since
Consolidated Financial Statements 20
the last impairment loss was recognized. The reversal is limited so that the carrying amount of the asset does not exceed its recoverable amount, nor exceed the carrying amount that would have been determined, net of depreciation, had no impairment loss been recognized for the asset in prior years. Such reversal is recognized in the income statement unless the asset is carried at a revalued amount, in which case the reversal is treated as a revaluation increase.
Goodwill
Goodwill is subject to impairment tests annually, as of October 1, or earlier if indicators of potential impairment exist. We assess goodwill for impairment at least annually in the absence of an indicator of possible impairment and immediately upon an indicator of possible impairment.
Impairment is determined for goodwill by assessing the recoverable amount of each cash-generating unit (or Company of cash-generating units) to which the goodwill relates. Where the recoverable amount of the cash generating unit is less than their carrying amount an impairment loss is recognized. Impairment losses relating to goodwill cannot be reversed in future periods.
Intangible assets
Intangible assets with indefinite useful lives are tested for impairment annually as of October 1 either individually or at the cash generating unit level, as appropriate and when circumstances indicate that the carrying value may be impaired.
3.23 Provisions
Provisions are recognized by the Company when a present legal or constructive obligation exists as a result of past events, it is probable that an outflow of resources embodying economic benefits will be required to settle the obligation and a reliable estimate of the amount of the obligation can be made. Where the effect of the time value of money is material, the amount of a provision is the present value of the expenditures expected to be required to settle the obligation. Where discounting is used, the increase in the provision due to the passage of time is recognized as a financing cost.
Restructuring provisions are recorded in the period in which management has committed to a detailed formal plan, has raised a valid expectation in those affected that it will carry out the restructuring and it becomes probable that a liability will be incurred and the amount can be reasonably estimated. Restructuring provisions comprise lease termination penalties, other penalties and employee termination payments.
3.24 Reportable Segment
We determined that we operate as one reportable segment. Our chief operating decision maker (CODM) makes decisions based on the Company as a whole. In addition, we have a common basis of organization and types of products and services which derive revenues and consistent product margins. Accordingly, we operate and make decisions as one cash generating unit.
3.25 Cash Flow Statement
The cash flow statement provides an explanation of the changes in cash and cash equivalents and restricted cash. It is prepared on the basis of a comparison of the statements of financial position as of January 1 and December 31 using the indirect method. Investing and financing transactions that do not require the use of cash or cash equivalents and restricted cash have been excluded from the cash flow statement. In 2021 and 2020, such eliminations primarily related to non-cash impacts from the convertible bonds.
Significant Accounting Estimates and Judgments
The preparation of the consolidated financial statements in conformity with IFRS requires management to make estimates and assumptions that affect the reported amounts of assets and liabilities and disclosure of contingent assets and liabilities at the date of the financial statements and the reported amounts of revenues and expenses during the reporting period. Estimates and assumptions that have a significant risk of causing a material adjustment to the carrying amounts of assets and liabilities within the next financial year are described below.
Purchase Price Allocation
The purchase price allocation for acquisitions requires extensive use of accounting estimates and judgments to allocate the purchase price to the identifiable tangible and intangible assets acquired, including in-process research and development, and liabilities assumed based on their respective fair values. An
Consolidated Financial Statements 21
acquisition may include contingent consideration as part of the purchase price. Contingent consideration is accounted for at fair value at the acquisition date with subsequent changes to the fair value being recognized in earnings. Additionally, we must determine whether an acquired entity is considered to be a business or a set of net assets, because a portion of the purchase price can only be allocated to goodwill in a business combination.
We have made several acquisitions in recent years. The purchase prices for the acquisitions were allocated to tangible and intangible assets acquired and liabilities assumed based on their estimated fair values at the acquisition dates. We engaged an independent third-party valuation firm to assist us in determining the estimated fair values of in-process research and development and identifiable intangible assets. Such a valuation requires significant estimates and assumptions, including but not limited to determining the timing and estimated costs to complete the in-process projects, projecting regulatory approvals, estimating future cash flows, and developing appropriate discount rates. We believe the estimated fair values of contingent consideration and assets acquired and liabilities assumed are based on reasonable assumptions. However, the fair value estimates for the purchase price allocations may change during the allowable allocation period, which is up to one year from the acquisition dates, if additional information becomes available.
Fair Value Measurements
We have categorized our assets and liabilities that are measured at fair value, based on the priority of the inputs to the valuation techniques, in a three-level fair value hierarchy: Level 1 - using quoted prices in active markets for identical assets or liabilities; Level 2 - using observable inputs other than quoted prices; and Level 3 – using unobservable inputs. We primarily apply the market approach for recurring fair value measurements, maximize our use of observable inputs and minimize our use of unobservable inputs. We utilize the mid-point price between bid and ask prices for valuing the majority of our assets and liabilities measured and reported at fair value. In addition to using market data, we make assumptions in valuing assets and liabilities, including assumptions about risk and the risks inherent in the inputs to the valuation technique.
Certain of our derivative instruments, which are classified in Level 2 of the fair value hierarchy, are valued using industry-standard models that consider various inputs, including time value, volatility factors, and current market and contractual prices for the underlying instruments, as well as other relevant economic measures. Substantially all of these inputs are observable in the marketplace throughout the full term of the instrument, can be derived from observable data or are supported by observable prices at which transactions are executed in the marketplace.
Certain of our acquisitions involve contingent consideration, the payment of which is contingent on the occurrence of future events. Contingent consideration is classified in Level 3 of the fair value hierarchy and is initially recognized at fair value as a cost of the acquisition. After the acquisition, the contingent consideration liability is remeasured each reporting period. The fair value of contingent consideration is measured predominantly on unobservable inputs such as assumptions about the likelihood of achieving specified milestone criteria, projections of future financial performance, assumed discount rates and assumed weightings applied to potential scenarios in deriving a probability weighted fair value. Significant judgment is used in developing these estimates and assumptions both at the acquisition date and in subsequent periods. If actual events differ from management's estimates, or to the extent these estimates are adjusted in the future, our financial condition or results of operations could be affected in the period of any change.
For other fair value measurements, we generally use an income approach to measure fair value when there is not a market observable price for an identical or similar asset or liability. This approach utilizes management’s best assumptions regarding expectations of projected cash flows, and discounts the expected cash flows using a commensurate risk-adjusted discount rate.
Impairment of Intangible Assets
Assets are tested or reviewed for impairment in accordance with the accounting policy stated under Note 3.22 "Impairment".
In the fourth quarter of 2021, we performed our annual impairment assessment of goodwill (using data as of October 1, 2021). We performed our goodwill impairment testing on a single cash generating unit basis which is consistent with our reporting structure. Differences in assumptions used in projecting future operating cash flows and cost of funds could have a significant impact on the determination of impairment amounts. In estimating future cash flows, we used our internal five-year projections. Our projections were based on recent sales data for existing products, planned timing of new product launches or capital projects, and customer commitments related to new and existing products. These projections also included assumptions of future production volumes and pricing. Based on the sensitivity analysis performed, we determined that in the event that our estimates of projected future cash flows, growth rates and
Consolidated Financial Statements 22
weighted average cost of capital were too high by 10%, there would still be no impact on the reported value of goodwill. We concluded that no impairment existed at October 1, 2021 or through December 31, 2021.
Due to the numerous variables associated with our judgments and assumptions relating to the valuation of the cash generating unit and the effects of changes in circumstances affecting these valuations, both the precision and reliability of the resulting estimates are subject to uncertainty, and as additional information becomes known, we may change our estimates.
Development Costs
Development costs are capitalized in accordance with the accounting policy stated under Note 3.6 "Research and Development". Determining the amounts to be capitalized requires management to make assumptions regarding the expected future cash generation of the assets, discount rates to be applied and the expected period of benefits. At least annually, management reviews the carrying amount of projects and assessed whether they were impaired or not.
Income Taxes
The Company is subject to income taxes in numerous jurisdictions that require estimates to be made based on interpretations of laws or regulations. Various internal and external factors, such as changes in tax laws, regulations and rates, changing interpretations of existing tax laws or regulations, future level of research and development spending and changes in overall levels of pre-tax income may have favorable or unfavorable effects on the income tax and deferred tax provisions in the period in which such determination is made.
Deferred tax assets are recognized in accordance with the accounting policy stated in Note 3.11 "Taxation". Deferred tax assets are recognized for net operating loss carry-forwards to the extent that it is probable that taxable profit will be available against which the losses can be utilized. Significant management judgment is required to determine the amount of deferred tax assets that can be recognized based upon the likely timing and level of future taxable profits.
Share-Based Payments - Stock Options
The Company utilizes the Black-Scholes-Merton valuation model for estimating the fair value of its stock options as stated under Note 22 "Share-Based Payments". Option valuation models, including Black-Scholes-Merton, require the input of highly subjective assumptions, and changes in the assumptions used can materially affect the grant date fair value of an award.
Share-Based Payments - Restricted Stock Units and Performance Stock Units
Restricted stock units and performance stock units represent rights to receive Common Shares at a future date. The fair market value is determined based on the number of stock units granted and the fair market value of our shares on the grant date. The fair market value at the time of the grant, less an estimate for pre-vesting forfeitures, is recognized in expense over the vesting period. We grant performance-based stock units subject to performance periods of one-year up to three years. Thus the estimates of performance achieved during the performance period may be subject to significant changes from period to period as the performance is completed.
4. Revenue
Nature of Goods and Services
Our revenues are reported net of sales and value added taxes and accruals for estimated rebates and returns and are derived primarily from the sale of consumable and instrumentation products, and to a much lesser extent, from the sale of services, intellectual property and technology. Revenue is recognized when the performance obligation is satisfied by transferring the promised products or services to customers. A good or service is transferred when (or as) the customer obtains control of the products or services. For each performance obligation we determine at contract inception whether it satisfies the performance obligation over time or satisfies the performance obligation at a point in time. If a performance obligation is not satisfied over time, the performance obligation is satisfied at a point in time. The amount recognized reflects the consideration we expect to receive in exchange for those products or services. We enter into
Consolidated Financial Statements 23
contracts that can include various combinations of products and services, which are generally distinct and accounted for as separate performance obligations. The transaction price is allocated to performance obligations based on their relative stand-alone selling prices.
We offer warranties on our products. Certain of our warranties are assurance-type in nature and do not cover anything beyond ensuring that the product is functioning as intended. Based on the guidance in IFRS 15, assurance-type warranties do not represent separate performance obligations. The Company also sells separately-priced service contracts which qualify as service-type warranties and represent separate performance obligations.
We sell our products and services both directly to customers and through distributors generally under agreements with payment terms typically less than 90 days and in most cases not exceeding one year and therefore contracts do not contain a significant financing component.
Consumable and Related Revenue
Consumable Products: In the last three years, revenue from consumable product sales has accounted for approximately 78-81% of our net sales and revenue is recognized when performance obligations under the terms of a contract with a customer are satisfied. The majority of our contracts have either a single performance obligation to transfer a single consumable product or multiple performance obligations to transfer multiple products concurrently. Accordingly, we recognize revenue when control of the products has transferred to the customer, which is generally at the time of shipment of products as this is when title and risk of loss have been transferred. In addition, invoicing typically occurs at this time so this is when we have a present right to payment. Revenue is measured as the amount of consideration we expect to receive in exchange for transferring products and is generally based upon a negotiated formula, list or fixed price.
Related Revenue: Revenues from related products include software-as-a-service (SaaS), licenses, intellectual property and patent sales, royalties and milestone payments and over the last three years has accounted for approximately 6-10% of our net sales.
SaaS arrangements: Revenue from SaaS arrangements, which allow customers to use hosted software over the contract period without taking possession of the software, is recognized over the duration of the agreement unless the terms of the agreement indicate that revenue should be recognized in a different pattern, for example based on usage.
Licenses: Licenses for on-site software, which allow customers to use the software as it exists when made available, are sold as perpetual licenses or term licenses. Revenue from on-site licenses are recognized upfront at the point in time at the later of when the software is made available to the customer and the beginning of the license term. When a portion of the transaction price is allocated to a performance obligation to provide support and/or updates, revenue is recognized as the updates/support are provided, generally over the life of the license. Fees from research collaborations include payments for technology transfer and access rights. Royalties from licensees of intellectual property are based on sales of licensed products and revenues are recognized at the later of (i) when the related sales occur, or (ii) when the performance obligation to which some or all of the royalty has been allocated has been satisfied (or partially satisfied).
Milestone Payments: At the inception of each companion diagnostic co-development arrangement that includes development milestone payments, which represent variable consideration, we evaluate whether the milestones are probable of being reached and estimate the amount to be included in the transaction price using the most likely amount method. If it is probable that a significant revenue reversal would not occur, the associated milestone value is included in the transaction price. Milestone payments that are not within our control, such as milestones which are achieved through regulatory approvals, are considered to be constrained and excluded from the transaction price until those approvals are received. Revenue is recognized following the input method as this is considered to best depict the timing of the transfer of control. This involves measuring actual hours incurred to date as a proportion of the total budgeted hours of the project. At the end of each subsequent reporting period, the proportion of completion is trued-up. We also re-evaluate the probability of achievement of development milestones and any related constraint on a periodic basis, and if necessary, adjust our estimate of the overall transaction price. Any such adjustments are recorded on a cumulative catch-up basis, which would affect revenues and earnings in the period of adjustment.
Consolidated Financial Statements 24
Instruments
Revenue from instrumentation includes the instrumentation equipment, installation, training and other instrumentation services, such as extended warranty services or product maintenance contracts and over the last three years has accounted for approximately 11-14% of net sales. Revenue from instrumentation equipment is recognized when the customer obtains control of the instrument which is predominantly at the time of delivery or when title has transferred to the customer. Service revenue is recognized over the term of the service period as the customers benefit from the service throughout the service period. Revenue related to services performed on a time-and-materials basis is recognized when performed.
Contract Estimates
The majority of our revenue is derived from contracts (i) with an original expected length of one year or less and (ii) contracts for which we recognize revenue at the amount in which we have the right to invoice as product is delivered. We have elected the practical expedient not to disclose the value of remaining performance obligations associated with these types of contracts.
However, we have certain companion diagnostic co-development contracts to provide research and development activities in which our performance obligations extend over multiple years. As of December 31, 2021, we had $54.5 million of remaining performance obligations for which the transaction price is not constrained related to these contracts which we expect to recognize over the next 12 to 18 months.
Revenue expected to be recognized in any future year related to remaining performance obligations, excluding revenue pertaining to contracts that have an original expected duration of one year or less, contracts where revenue is recognized as invoiced and contracts with variable consideration related to undelivered performance obligations, is not material.
Contract Balances
The timing of revenue recognition, billings and cash collections can result in billed accounts receivable, unbilled receivables (contract assets), and customer advances and deposits (contract liabilities) in the consolidated balance sheet.
Contract assets as of December 31, 2021 and 2020 totaled $14.1 million and $8.5 million, respectively, are included in other current assets in the accompanying consolidated balance sheets and relate to the companion diagnostic co-development contracts discussed above.
Contract liabilities primarily relate to non-cancellable advances or deposits received from customers before revenue is recognized and is primarily related to instrument service and Software as a Service (SaaS) arrangements. As of December 31, 2021 and 2020, contract liabilities totaled $74.7 million and $68.9 million, respectively, of which $63.4 million and $57.1 million is included in other current liabilities, respectively, and $11.3 million and $11.8 million in included in other non-current liabilities, respectively. During the years ended December 31, 2021 and 2020, we satisfied the associated performance obligations and recognized revenue of $54.9 million and $48.1 million, respectively, related to advance customer payments previously received.
Disaggregation of Revenue
We disaggregate our revenue based on product type and customer class as shown in the tables below for the years ended December 31, 2021 and 2020:
| (in thousands) | 2021 | 2020 | ||||||||||||
| Consumables and related revenues | $1,027,215 | $774,234 | ||||||||||||
| Instruments | 116,449 | 129,742 | ||||||||||||
| Molecular Diagnostics | 1,143,664 | 903,976 | ||||||||||||
| Consumables and related revenues | 959,093 | 841,201 | ||||||||||||
| Instruments | 148,900 | 125,169 | ||||||||||||
| Life Sciences | 1,107,993 | 966,370 | ||||||||||||
| Total | $2,251,657 | $1,870,346 | ||||||||||||
Consolidated Financial Statements 25
Additionally, we disaggregate our revenue based on product category as shown in the tables below for the years ended December 31, 2021 and 2020:
| (in thousands) | 2021 | 2020 | ||||||||||||
| Sample technologies | $850,636 | $803,867 | ||||||||||||
| Diagnostic solutions | 638,759 | 460,757 | ||||||||||||
| PCR / Nucleic acid amplification | 433,972 | 363,552 | ||||||||||||
| Genomics / NGS | 245,066 | 165,570 | ||||||||||||
| Other | 83,224 | 76,600 | ||||||||||||
| Total | $2,251,657 | $1,870,346 | ||||||||||||
Refer to Note 21 "Reportable Segment" for disclosure of revenue by geographic region.
5. Acquisitions
Business Combinations and Asset Acquisitions
For acquisitions which have been accounted for as business combinations, the acquired companies’ results have been included in the accompanying consolidated statements of income from their respective dates of acquisition. Our acquisitions have historically been made at prices above the fair value of the acquired net assets, resulting in goodwill, due to expectations of synergies of combining the businesses. These synergies include use of our existing infrastructure, such as sales force, shared service centers, distribution channels and customer relations; to expand sales of an acquired business' products; use of the infrastructure of the acquired businesses to cost-effectively expand sales of our products; and elimination of duplicative facilities, functions and staffing.
If the acquired net assets do not constitute a business under the acquisition method of accounting, the transaction is accounted for as an asset acquisition and no goodwill is recognized. In an asset acquisition, the amount allocated to acquired IPR&D is recognized and measured based on its relative fair value in relation to the cost of the group of assets as a whole at the acquisition date.
2020 Business Combinations
On September 17, 2020, we completed the acquisition of the remaining 80.1% of NeuMoDx Molecular, Inc. (NeuMoDx) shares, a privately-held U.S. company in which we held a minority interest. NeuMoDx designs and develops molecular diagnostics solutions for hospital and clinical reference laboratories. Prior to acquisition, we held a 19.9% investment in NeuMoDx with a carrying value of $41.0 million. The cash consideration for the remaining shares totaled $251.7 million. We incurred $2.5 million acquisition related costs to effect the business combination, of which $1.8 million was incurred during the year ended December 31, 2020, and is included in restructuring, acquisition, integration and other, net.
The acquisition date fair value of the minority interest investment was $52.7 million, a gain of $11.7 million was recorded in other financial results in the accompanying consolidated income statement. The fair value of the minority interest investment was determined using an implied purchase price reduced by a 20% control premium.
Consolidated Financial Statements 26
The final purchase price allocation differed from the preliminary purchase price allocation primarily as a result of updates to the acquisition date value of the liability related to acquired litigation, the final valuation and allocation of amounts among the acquired intangible assets as set forth in an independent appraisal, and related deferred tax impacts as follows:
| (in thousands) | Final | Preliminary(1) | Difference | |||||||||||||||||
| Purchase Price: | ||||||||||||||||||||
| Cash consideration | $251,730 | $251,730 | $— | |||||||||||||||||
| Fair value of minority interest | 52,727 | 52,727 | — | |||||||||||||||||
| $304,457 | $304,457 | $— | ||||||||||||||||||
| Preliminary Allocation: | ||||||||||||||||||||
| Cash and cash equivalents | $12,291 | $12,291 | $— | |||||||||||||||||
| Accounts receivable | 5,691 | 5,691 | — | |||||||||||||||||
| Inventories | 20,271 | 20,666 | (395) | |||||||||||||||||
| Other current assets | 5,961 | 5,961 | — | |||||||||||||||||
| Accounts payable | (12,450) | (12,450) | — | |||||||||||||||||
| Other current liabilities | (69,585) | (18,929) | (50,656) | |||||||||||||||||
| Other non-current liabilities | (4,101) | (4,101) | — | |||||||||||||||||
| Fixed and other non-current assets | 7,076 | 7,076 | — | |||||||||||||||||
| Developed technology | 101,000 | 101,000 | — | |||||||||||||||||
| In-process research and development | 55,000 | 55,000 | — | |||||||||||||||||
| Patents and license rights | 770 | 770 | — | |||||||||||||||||
| Customer backlog | 400 | 400 | — | |||||||||||||||||
| Goodwill | 191,343 | 157,627 | 33,716 | |||||||||||||||||
| Deferred tax asset | 30,057 | 12,457 | 17,600 | |||||||||||||||||
| Deferred tax liability on fair value of identifiable intangible assets acquired | (39,267) | (39,002) | (265) | |||||||||||||||||
| Total | $304,457 | $304,457 | $— | |||||||||||||||||
(1)As of December 31, 2020.
The final purchase price allocation includes $55.0 million for the acquisition date value of the liability related to acquired litigation. The final settlement amount, discussed further in Note 20 "Commitments and Contingencies" was $53.0 million. The $2.0 million difference between the final purchase price allocation and final settlement amount was recorded to restructuring, acquisition, integration and other expense, net in the year ended December 31, 2021. The in-process research and development recognized relates to technologies that remain in development and have not yet obtained regulatory approvals. The technologies within in-process research and development are expected to be completed within the next five years. The weighted average amortization period for the acquired intangibles is 10 years. The goodwill acquired is not deductible for tax purposes.
2019 Asset Acquisition
On January 31, 2019, we acquired the digital PCR asset of Formulatrix, Inc., a developer of laboratory automation solutions. We paid Formulatrix $125.0 million in cash upon closing. During 2020, we paid the remaining $135.9 million of milestone payments.
Consolidated Financial Statements 27
6. Restructuring and Impairments
As part of our restructuring activities, we incur expenses that qualify as constructive obligations under IAS 37 arising from a restructuring program including severance and employee costs as well as contract and other costs, primarily contract termination costs, as well as inventory write-offs and other implementation costs primarily related to consulting fees. Personnel costs (principally termination benefits) primarily relate to cash severance and other termination benefits including accelerated share-based compensation. We also incur expenses that are an integral component of, and are directly attributable to, our restructuring activities which do not qualify as constructive obligations under IAS 37, which consist of asset-related costs such as intangible asset impairments and other asset related write-offs.
Termination benefits are recorded when it is probable that employees will be entitled to benefits and the amounts can be reasonably estimated. Estimates of termination benefits are based on the frequency of past termination benefits, the similarity of benefits under the current plan and prior plans, and the existence of statutory required minimum benefits. Other benefits which require future service and are associated to non-recurring benefits are recognized ratably over the future service period. Other assets, including inventory, are impaired or written-off if the carrying value exceeds the fair value. All other costs are recognized as incurred.
2019 Restructuring
In the second half of 2019, we decided to suspend development of NGS-related instrument systems and entered into a new strategic partnership with Illumina to commercialize IVD kits worldwide on Illumina's diagnostic sequencers. In order to align our business with this new strategy, we began restructuring initiatives to target resource allocation to growth opportunities in our Sample to Insight portfolio. In addition, we implemented measures to shift commercial operations activities, transition manufacturing activities into a regional structure, and expand the scope of activities at our shared service centers.
Total cumulative pre-tax costs for the program, which concluded in 2021, were $327.9 million as summarized below:
| Classification and Type of Charge (in thousands) | Note | 2021 | 2020 | Total cumulative charges | ||||||||||||||||||||||
| Restructuring, acquisition, integration and other, net | ||||||||||||||||||||||||||
| Personnel related | $2,534 | ($710) | $72,327 | |||||||||||||||||||||||
| Contract and other costs | 1,762 | 1,835 | 55,846 | |||||||||||||||||||||||
| Accounts receivable | (246) | (622) | 9,957 | |||||||||||||||||||||||
| Inventories | — | 1,014 | 13,350 | |||||||||||||||||||||||
| Other current assets | — | 127 | 17,139 | |||||||||||||||||||||||
| 4,050 | 1,644 | 168,619 | ||||||||||||||||||||||||
| Long-lived asset impairments | ||||||||||||||||||||||||||
| Property, plant and equipment | (10) | — | 616 | 13,983 | ||||||||||||||||||||||
| Other intangible assets | (12) | — | 418 | 140,540 | ||||||||||||||||||||||
| — | 1,034 | 154,523 | ||||||||||||||||||||||||
| Other financial results | ||||||||||||||||||||||||||
| Equity accounted investment impairment | — | — | 4,799 | |||||||||||||||||||||||
| Total | $4,050 | $2,678 | $327,941 | |||||||||||||||||||||||
Consolidated Financial Statements 28
Of the total costs incurred, $1.5 million and $9.5 million are accrued as of December 31, 2021 and December 31, 2020, respectively, in other current liabilities in the accompanying consolidated balance sheets as summarized in the following table that includes the cash components of the restructuring activity.
| (in thousands) | Personnel Related | Contract and Other Costs | Total | |||||||||||||||||||||||||||||
| Liability at December 31, 2019 | $27,924 | $32,233 | $60,157 | |||||||||||||||||||||||||||||
| Additional costs incurred in 2020 | 2,703 | 3,300 | 6,003 | |||||||||||||||||||||||||||||
| Release of accrual | (3,413) | (1,465) | (4,878) | |||||||||||||||||||||||||||||
| Payments | (24,355) | (27,347) | (51,702) | |||||||||||||||||||||||||||||
| Foreign currency translation adjustment | 139 | (242) | (103) | |||||||||||||||||||||||||||||
| Liability at December 31, 2020 | 2,998 | 6,479 | 9,477 | |||||||||||||||||||||||||||||
| Additional costs incurred in 2021 | 2,893 | 7,294 | 10,187 | |||||||||||||||||||||||||||||
| Release of accrual | (359) | (5,532) | (5,891) | |||||||||||||||||||||||||||||
| Payments | (5,273) | (6,690) | (11,963) | |||||||||||||||||||||||||||||
| Foreign currency translation adjustment | (144) | (161) | (305) | |||||||||||||||||||||||||||||
| Liability at December 31, 2021 | $115 | $1,390 | $1,505 | |||||||||||||||||||||||||||||
7. Financial Assets
| (in thousands) | 2021 | 2020 | ||||||||||||
| Current financial assets: | ||||||||||||||
| Unquoted debt securities | $184,785 | $— | ||||||||||||
| Quoted equity securities | — | 117,249 | ||||||||||||
| Current Financial Assets | $184,785 | $117,249 | ||||||||||||
| Non-current financial instruments: | ||||||||||||||
| Quoted equity securities | $— | $266 | ||||||||||||
| Unquoted equity securities | 3,945 | 4,142 | ||||||||||||
| Non-current Financial Assets | $3,945 | $4,408 | ||||||||||||
| Total Financial Assets | $188,730 | $121,657 | ||||||||||||
Unquoted Debt Securities
At December 31, 2021, we had $184.8 million of commercial paper and money market deposits due from financial and nonfinancial institutions. These instruments are non-derivative financial assets with fixed or determinable payments that are not quoted in an active market and carried at either amortized cost or fair market value. All instruments are classified as current financial assets in the accompanying balance sheet as they have a maturity of less than one year or are redeemable at our discretion. Interest income is determined using the effective interest rate method.
Consolidated Financial Statements 29
| (in thousands) | 2021 | 2020 | ||||||||||||
| Balance at beginning of the year | $— | $129,586 | ||||||||||||
| Unquoted debt securities acquired | 397,650 | 49,770 | ||||||||||||
| Unquoted debt securities sold | (209,157) | (181,223) | ||||||||||||
| (Loss) gain on sales of unquoted debt securities | (3,734) | 1,992 | ||||||||||||
| Translation | 26 | (125) | ||||||||||||
| Balance at end of the year | $184,785 | $— | ||||||||||||
Unquoted Equity Securities
At December 31, 2021 and 2020, we had investments in non-publicly traded companies that do not have readily determinable fair values with carrying amounts that totaled $3.9 million and $4.1 million, respectively. These investments are required to be accounted for at fair value through profit and loss unless the investment is not held for trading, and the holder elects at initial recognition to account for it at fair value through other comprehensive income. As this election has not been made, these investments are accounted for at fair value through profit and loss in other financial results.
Changes in these investments for the years ended December 31, 2021 and 2020 are as follows:
| (in thousands) | 2021 | 2020 | ||||||||||||
| Balance at beginning of year | $4,142 | $70,849 | ||||||||||||
| Full acquisition of equity securities | — | (41,001) | ||||||||||||
| Sale of equity securities | — | (23,812) | ||||||||||||
| Loss on sale of equity securities | — | (2,250) | ||||||||||||
| Impairments | — | (398) | ||||||||||||
| Cash investments in equity securities | 81 | 173 | ||||||||||||
| Foreign currency translation adjustments | (278) | 581 | ||||||||||||
| Balance at end of year | $3,945 | $4,142 | ||||||||||||
We made additional investments of $0.1 million in unquoted equity securities for the year ended December 31, 2021.
In 2020, we acquired the remaining shares of NeuMoDx as further discussed in Note 5 "Acquisitions". Invitae Corporation (Invitae), a publicly traded company (NVTA), completed the acquisition of ArcherDX, Inc. (ArcherDX), a company in which we held an approximate 8% investment. In exchange for our shares in ArcherDX, we initially received cash of $21.1 million and 2.4 million shares in Invitae followed by an additional 0.4 million shares for milestone achievement, as discussed above. For the year ended December 31, 2020, we recognized a total gain of $123.3 million in other financial results in the accompanying consolidated income statement as a result of this transaction. Additionally in 2020, we sold two other investments. One investment was sold for its book value and we received $3.7 million in cash. The other investment had a carrying value of $2.5 million and was sold for cash of $0.3 million and the shares in OncoCyte Corporation (OncoCyte), as discussed further below. A loss of $2.3 million was recognized in other financial results on the sale of this investment. We also recorded a $0.4 million impairment in other financial results following indications that the carrying value was no longer recoverable. Accordingly, the investment was fully impaired. Finally, we made additional investments of $0.2 million in unquoted equity securities during the year ended December 31, 2020.
For unquoted equity securities as of both December 31, 2021 and 2020, cumulative upward adjustments for price changes was $0.7 million. These adjustments were due to equity offerings at a higher price from the issuer in orderly transactions for identical or similar investments as those we hold.
Consolidated Financial Statements 30
Quoted Equity Securities
A summary of our investments in quoted equity securities that have readily determinable fair values follows below. These investments are reported at fair value with gains and losses recorded in the income statement. These marketable investments were all sold in 2021.
The changes in quoted equity securities during the year ended December 31, 2021 are as follows:
| Invitae | OncoCyte | Oncimmune Holdings plc (Oncimmune) | HTG Molecular Diagnostics, Inc (HTGM) | |||||||||||||||||||||||||||||||||||||||||||||||
| (in thousands, except shares data) | Shares | Amount | Shares | Amount | Shares | Amount | Shares | Amount | ||||||||||||||||||||||||||||||||||||||||||
| Balance at December 31, 2020 | 2,769,189 | $115,780 | 88,101 | $211 | 560,416 | $1,258 | 55,556 | $266 | ||||||||||||||||||||||||||||||||||||||||||
| Shares received upon milestone achievement | 1,100,190 | 35,338 | 30,152 | 147 | 86,218 | 220 | — | — | ||||||||||||||||||||||||||||||||||||||||||
| (Loss) gain on change in fair value | — | (3,066) | — | 123 | — | 61 | — | 65 | ||||||||||||||||||||||||||||||||||||||||||
| Sale of investment | (3,869,379) | (148,052) | (118,253) | (481) | (646,634) | (1,539) | (55,556) | (331) | ||||||||||||||||||||||||||||||||||||||||||
| Balance at December 31, 2021 | — | $— | — | $— | — | $— | — | $— | ||||||||||||||||||||||||||||||||||||||||||
During 2021, we sold all shares received from Invitae upon milestone achievement and realized a gain of $32.3 million in other financial results in the accompanying consolidated income statement. We are entitled to up to 0.6 million Invitae shares and up to approximately $3.0 million from OncoCyte in the future upon achievement of certain milestones.
As of December 31, 2020, these quoted equity securities are included in current and non-current financial assets in the accompanying consolidated balance sheet as follows:
| Current | Non-current | |||||||||||||||||||||||||
| (in thousands, except shares held) | Invitae | OncoCyte | Oncimmune | HTGM | ||||||||||||||||||||||
| Shares held | 2,769,189 | 88,101 | 560,416 | 55,556 | ||||||||||||||||||||||
| Cost basis | $100,822 | $230 | $657 | $2,000 | ||||||||||||||||||||||
| Fair value | $115,780 | $211 | $1,258 | $266 | ||||||||||||||||||||||
| Total cumulative unrealized gain (loss) | $14,958 | ($19) | $601 | ($1,734) | ||||||||||||||||||||||
In 2020, HTGM completed a 15:1 reverse stock split.
During the year ended December 31, 2020 unrealized losses recognized for the change in fair market value of quoted equity securities totaled $5.7 million, of which $5.4 million is attributable to current financial assets and $0.3 million to non-current financial assets.
Consolidated Financial Statements 31
8. Trade Accounts Receivable
We sell our products worldwide through sales subsidiaries and distributors. There is no concentration of credit risk with respect to trade accounts receivable as we have a large number of internationally dispersed customers. Trade accounts receivable are non-interest bearing and mostly have payment terms of 30-90 days.
| (in thousands) | 2021 | 2020 | ||||||||||||
| Trade accounts receivable | $372,944 | $386,207 | ||||||||||||
| Notes receivable | 12,311 | 21,364 | ||||||||||||
| Allowance for doubtful accounts | (23,124) | (27,052) | ||||||||||||
| Trade accounts receivable, net | $362,131 | $380,519 | ||||||||||||
The notes receivable represent a written promise from customers to pay definite amounts of money on specific future dates.
The changes in the allowance for doubtful accounts receivable are as follows:
| (in thousands) | 2021 | 2020 | ||||||||||||
| Balance at beginning of year | $27,052 | $20,951 | ||||||||||||
| Additions charged to expense | 18 | 15,692 | ||||||||||||
Deductions from allowance(1) | (1,249) | (9,868) | ||||||||||||
| Recoveries collected | 288 | — | ||||||||||||
| Currency translation adjustments and other | (2,985) | 277 | ||||||||||||
| Balance at end of year | $23,124 | $27,052 | ||||||||||||
(1)Write-offs for which an allowance was previously provided.
9. Other Current and Non-current Assets
Other current assets at December 31, 2021 and 2020 consist of the following:
| (in thousands) | Note | 2021 | 2020 | |||||||||||||||||
| Income taxes receivable | (17) | $45,116 | $16,424 | |||||||||||||||||
| Prepaid expenses | 24,868 | 36,537 | ||||||||||||||||||
| Value added tax | 22,884 | 31,128 | ||||||||||||||||||
| Other receivables | 19,175 | 32,901 | ||||||||||||||||||
| Contract assets | (4) | 14,082 | 8,539 | |||||||||||||||||
| Cash collateral | (26) | 11,200 | 56,100 | |||||||||||||||||
| Current loans receivable with related parties including interest | 6,249 | 17,094 | ||||||||||||||||||
| Other current assets | $143,574 | $198,723 | ||||||||||||||||||
Consolidated Financial Statements 32
Other non-current assets at December 31, 2021 and 2020 consist of the following:
| (in thousands) | 2021 | 2020 | ||||||||||||
| Other non-current assets | $15,996 | $16,899 | ||||||||||||
| Prepaid licenses and royalties | 10,980 | 12,493 | ||||||||||||
| Prepayment of intangibles | 3,859 | 5,384 | ||||||||||||
| Non-current deposits and escrow payments | 1,079 | 929 | ||||||||||||
| Non-current loans receivable with related parties including interest | — | 8,985 | ||||||||||||
| Other non-current assets | $31,914 | $44,690 | ||||||||||||
10. Property, Plant and Equipment
| Cost (in thousands) | Land and buildings | Machinery and equipment | Furniture and office equipment | Leasehold improvements | Construction in progress | Total | ||||||||||||||||||||||||||||||||
| January 1, 2020 | $312,976 | $292,294 | $102,901 | $45,739 | $28,355 | $782,265 | ||||||||||||||||||||||||||||||||
| Currency adjustments | 16,230 | 11,420 | 4,382 | 2,815 | 1,817 | 36,664 | ||||||||||||||||||||||||||||||||
| Additions | 543 | 37,607 | 7,587 | 11,440 | 61,408 | 118,585 | ||||||||||||||||||||||||||||||||
| Business combinations | — | 1,143 | 148 | 372 | 315 | 1,978 | ||||||||||||||||||||||||||||||||
| Disposals | (12) | (31,019) | (10,924) | (11,234) | (422) | (53,611) | ||||||||||||||||||||||||||||||||
| Transfers | 2,454 | 10,934 | 4,245 | 482 | (21,894) | (3,779) | ||||||||||||||||||||||||||||||||
| December 31, 2020 | 332,191 | 322,379 | 108,339 | 49,614 | 69,579 | 882,102 | ||||||||||||||||||||||||||||||||
| Currency adjustments | (14,895) | (25,140) | (5,251) | (1,376) | (3,889) | (50,551) | ||||||||||||||||||||||||||||||||
| Additions | 10,710 | 31,228 | 7,257 | 15,463 | 79,766 | 144,424 | ||||||||||||||||||||||||||||||||
| Disposals | (175) | (17,258) | (8,178) | (9,640) | (110) | (35,361) | ||||||||||||||||||||||||||||||||
| Transfers | 15,784 | 32,760 | 3,849 | 889 | (53,282) | — | ||||||||||||||||||||||||||||||||
| December 31, 2021 | $343,615 | $343,969 | $106,016 | $54,950 | $92,064 | $940,614 | ||||||||||||||||||||||||||||||||
Consolidated Financial Statements 33
| Depreciation (in thousands) | Land and buildings | Machinery and equipment | Furniture and office equipment | Leasehold improvements | Construction in progress | Total | ||||||||||||||||||||||||||||||||
| January 1, 2020 | ($100,968) | ($221,289) | ($74,279) | ($29,470) | ($159) | ($426,165) | ||||||||||||||||||||||||||||||||
| Currency adjustments | (6,206) | (11,090) | (3,411) | (2,242) | (41) | (22,990) | ||||||||||||||||||||||||||||||||
| Depreciation | (7,796) | (32,014) | (9,685) | (4,105) | — | (53,600) | ||||||||||||||||||||||||||||||||
| Impairment losses | — | (76) | (315) | — | (225) | (616) | ||||||||||||||||||||||||||||||||
| Disposals | 12 | 26,400 | 10,572 | 11,230 | 407 | 48,621 | ||||||||||||||||||||||||||||||||
| December 31, 2020 | (114,958) | (238,069) | (77,118) | (24,587) | (18) | (454,750) | ||||||||||||||||||||||||||||||||
| Currency adjustments | 5,767 | 19,308 | 3,562 | 966 | 2 | 29,605 | ||||||||||||||||||||||||||||||||
| Depreciation | (8,270) | (35,188) | (10,125) | (3,437) | — | (57,020) | ||||||||||||||||||||||||||||||||
| Disposals | 169 | 15,524 | 8,132 | 9,083 | — | 32,908 | ||||||||||||||||||||||||||||||||
| December 31, 2021 | ($117,292) | ($238,425) | ($75,549) | ($17,975) | ($16) | ($449,257) | ||||||||||||||||||||||||||||||||
| Net book value | ||||||||||||||||||||||||||||||||||||||
| December 31, 2020 | $217,233 | $84,310 | $31,221 | $25,027 | $69,561 | $427,352 | ||||||||||||||||||||||||||||||||
| December 31, 2021 | $226,323 | $105,544 | $30,467 | $36,975 | $92,048 | $491,357 | ||||||||||||||||||||||||||||||||
Impairment of $0.6 million during 2020 were related to the 2019 Restructuring program as further discussed in Note 6 "Restructuring and Impairments." No property, plant and equipment were pledged as security against non-current financial debts at December 31, 2021 and 2020.
The asset's residual values, useful lives and methods of depreciation are reviewed, and adjusted if appropriate, at each financial year end. For the years ended December 31, 2021 and 2020, interest capitalized in connection with construction projects was not significant.
11. Equity Accounted Investments
We have made strategic investments in certain companies that are accounted for using the equity method of accounting. The method of accounting for an investment depends on the level of influence. We monitor changes in circumstances that may require a reassessment of the level of influence. We periodically review the carrying value of these investments for impairment, considering factors such as the most recent stock transactions and book values from the recent financial statements.
Amounts from equity method investments considered in the financial statements are as follows:
| Equity investments as of December 31, | Share of income (loss) for the years ended December 31, | |||||||||||||||||||||||||||||||
| ($ in thousands) | Ownership Percentage | 2021 | 2020 | 2021 | 2020 | |||||||||||||||||||||||||||
| PreAnalytiX GmbH | 50.00 | % | $10,291 | $4,761 | $10,412 | $3,070 | ||||||||||||||||||||||||||
| Apis Assay Technologies Ltd | 19.00 | % | 3,713 | 1,940 | 1,773 | 1,221 | ||||||||||||||||||||||||||
| TVM Life Sciences Ventures III | 3.10 | % | 3,669 | 1,545 | (264) | 630 | ||||||||||||||||||||||||||
| Suzhou Fuda Business Management and Consulting Partnership | 33.67 | % | 2,832 | 3,301 | — | — | ||||||||||||||||||||||||||
| Actome GmbH | 12.50 | % | 1,045 | — | (31) | — | ||||||||||||||||||||||||||
| Hombrechtikon Systems Engineering AG | 19.00 | % | (413) | (530) | 97 | 97 | ||||||||||||||||||||||||||
| $21,137 | $11,017 | $11,987 | $5,018 | |||||||||||||||||||||||||||||
Consolidated Financial Statements 34
Of the net $21.1 million of amounts from equity method investments, the investment assets of $21.5 million are included in equity accounted investments and the amount of $0.4 million, for the investment where we are committed to fund losses, is included in other non-current liabilities in the accompanying consolidated balance sheet as of December 31, 2021. Our share of income is included in other financial results in the accompanying consolidated income statements for the years ended December 31, 2021 and 2020.
During 2021, we made a $1.1 million investment in Actome GmbH (Actome) and as of December 31, 2021 we hold a 12.5% ownership stake in this company that is accounted for under the equity method as we have the ability to exercise significant influence.
TVM Life Science Ventures III is a limited partnership and we account for our 3.1% investment under the equity method as we have the ability to exercise significant influence over the limited partnership. This investment is valued at net asset value (NAV) reported by the counterparty, adjusted as necessary. During 2021, we made $2.4 million in additional cash payments to TVM and have $10.3 million of unfunded commitments through 2029 related to this investment. We do not have the right to redeem these funds under the normal course of operations of this partnership.
During the years ended December 31, 2021 and 2020, we received dividends of $4.7 million and $4.4 million, respectively, from PreAnalytix GmbH. These dividends are included in other items, net including fair value changes in derivatives in the accompanying consolidated statements of cash flows as they are a return on investment and therefore classified as cash flows from operating activities.
The below tables shows the changes in our equity method investments for the years ended December 31, 2021 and 2020:
| (in thousands) | 2021 | 2020 | ||||||||||||
| Balance at beginning of year | $11,017 | $9,729 | ||||||||||||
| Purchases of (proceeds from) investments | 2,946 | (304) | ||||||||||||
| Dividend distribution received | (4,739) | (4,373) | ||||||||||||
| Share of profit | 11,987 | 5,018 | ||||||||||||
| Exchange rate differences / other | (74) | 947 | ||||||||||||
| Balance at end of year | $21,137 | $11,017 | ||||||||||||
The table below reflects the financial information (at 100%) of all individually immaterial equity method investments in the aggregate:
| (in millions) | 2021 | 2020 | ||||||||||||
| Total assets | $194.6 | $156.5 | ||||||||||||
| Shareholders' equity | $181.5 | $110.3 | ||||||||||||
| Net sales | $66.8 | $47.8 | ||||||||||||
| Other comprehensive (loss) income | ($2.0) | $2.9 | ||||||||||||
| Net result | $5.5 | $2.6 | ||||||||||||
Consolidated Financial Statements 35
12. Goodwill and Other Intangible Assets
The changes in the carrying amount of goodwill for the years ended December 31, 2021 and 2020 are as follows:
| (in thousands) | 2021 | 2020 | ||||||||||||
| Balance at beginning of year | $2,389,111 | $2,166,213 | ||||||||||||
| Goodwill acquired during the year | — | 157,627 | ||||||||||||
| Purchase adjustments | 33,716 | 3,382 | ||||||||||||
| Currency adjustments | (46,387) | 61,889 | ||||||||||||
| Balance at end of year | $2,376,440 | $2,389,111 | ||||||||||||
The changes in the carrying amount of goodwill during the year ended December 31, 2021 resulted primarily from changes in foreign currency translation partially offset by purchase adjustments related to the acquisition of NeuMoDx discussed in Note 5 "Acquisitions". The changes in goodwill during the year ended December 31, 2020 resulted primarily from acquisition of NeuMoDx and changes in foreign currency translation.
In the fourth quarter of 2021, we performed our annual impairment assessment of goodwill (using data as of October 1, 2021) in accordance with the provisions of IAS 36. No events or changes in circumstances indicated that the acquired goodwill might be impaired.
Management monitors and makes decisions regarding the Company's operations on a functional specific and global level. Therefore, we concluded that the goodwill impairment test needs to be performed on the level of the consolidated Group as a whole (one cash generating unit). In testing for potential impairment, we measured the estimated fair value of the cash generating unit based upon discounted future operating cash flows using a discount rate reflecting our estimated average cost of funds.
For impairment testing, the recoverable amount of goodwill allocated to the cash generating unit (higher of the cash generating unit's fair value less selling costs and its value in use) is compared to the carrying amount of the net assets employed (including goodwill) of the cash generating unit. Value in use is normally assumed to be higher than the fair value less selling costs; therefore, fair value less selling costs is only investigated when value in use is lower than the carrying amount of the cash generating unit.
Key assumptions used in the value in use calculations
The value in use is calculated based on estimated future cash flow projections expected to result from the use of the cash generating unit, discounted using an appropriate long-term pre-tax discount rate. The value in use calculations use cash flow projections based on financial budgets and models over the projection period (five years) as available for internal reporting purposes and in accordance with standard valuation practices. The growth rates used are based on industry growth forecasts for the projected period as well as for the subsequent period (long-term growth rate of 3% in 2021 and 2020). The discount rates used are based on the pre-tax weighted average cost of capital (6.70% in 2021 and 2020) and are verified against external analyst reports.
Sensitivity to changes in assumptions
Changes in assumptions used in projecting future operating cash flows and cost of funds could have a significant impact on the determination of impairment amounts. In estimating future cash flows, we used our internal budgets. Our budgets were based on recent sales data for existing products, planned timing of new product launches or capital projects, and customer commitments related to new and existing products. These budgets also included assumptions of future production volumes and pricing. The calculation of value in use is most sensitive to discount rates and growth rates used.
Discount rates reflect management's estimate of the risks profile for the respective valuation object. The growth rates used are based on industry growth forecasts for the projected period as well as for the subsequent period.
We concluded that no impairment existed. We believe that any reasonably possible change in the key assumptions would not have an impact on reported goodwill. Even if our estimates of projected future cash flows in respect of discount and growth rates were too high by 10%, there would be no impact on the
Consolidated Financial Statements 36
reported value of goodwill at December 31, 2021. Due to the numerous variables associated with our judgments and assumptions relating to the valuation of the cash generating unit and the effects of changes in circumstances affecting these valuations, both the precision and reliability of the resulting estimates are subject to uncertainty, and as additional information becomes known, we may change our estimates.
Other Intangible Assets
| Cost (in thousands) | Developed technology, patent and license rights | Computer software | Development costs | Other intellectual properties | Total | |||||||||||||||||||||||||||
| January 1, 2020 | $1,086,629 | $372,107 | $23,758 | $322,326 | $1,804,820 | |||||||||||||||||||||||||||
| Currency adjustments | 52,307 | 27,471 | 2,085 | 11,625 | 93,488 | |||||||||||||||||||||||||||
| Additions | 23,964 | 52,879 | 10,009 | 42 | 86,894 | |||||||||||||||||||||||||||
| Business combinations | 101,770 | 50 | — | 55,400 | 157,220 | |||||||||||||||||||||||||||
| Disposals | (106,146) | (144,794) | — | (11,999) | (262,939) | |||||||||||||||||||||||||||
| December 31, 2020 | 1,158,524 | 307,713 | 35,852 | 377,394 | 1,879,483 | |||||||||||||||||||||||||||
| Currency adjustments | (41,302) | (18,683) | (2,218) | (10,982) | (73,185) | |||||||||||||||||||||||||||
| Additions | 23,934 | 51,040 | 9,275 | 35 | 84,284 | |||||||||||||||||||||||||||
| Disposals | (32,750) | (10,085) | — | (40,630) | (83,465) | |||||||||||||||||||||||||||
| December 31, 2021 | $1,108,406 | $329,985 | $42,909 | $325,817 | $1,807,117 | |||||||||||||||||||||||||||
| Amortization (in thousands) | Developed technology, patent and license rights | Computer software | Development costs | Other intellectual properties | Total | |||||||||||||||||||||||||||
| January 1, 2020 | ($561,896) | ($272,964) | ($4,736) | ($214,625) | ($1,054,221) | |||||||||||||||||||||||||||
| Currency adjustments | (37,868) | (21,837) | (820) | (9,711) | (70,236) | |||||||||||||||||||||||||||
| Amortization | (81,654) | (25,013) | (4,910) | (21,576) | (133,153) | |||||||||||||||||||||||||||
| Impairment losses | — | (418) | — | — | (418) | |||||||||||||||||||||||||||
| Disposals | 105,675 | 144,539 | — | 11,931 | 262,145 | |||||||||||||||||||||||||||
| December 31, 2020 | (575,743) | (175,693) | (10,466) | (233,981) | (995,883) | |||||||||||||||||||||||||||
| Currency adjustments | 30,017 | 11,062 | 851 | 8,482 | 50,412 | |||||||||||||||||||||||||||
| Amortization | (85,043) | (28,349) | (4,364) | (19,328) | (137,084) | |||||||||||||||||||||||||||
| Disposals | 28,179 | 9,821 | — | 40,630 | 78,630 | |||||||||||||||||||||||||||
| December 31, 2021 | ($602,590) | ($183,159) | ($13,979) | ($204,197) | ($1,003,925) | |||||||||||||||||||||||||||
| Net book value | ||||||||||||||||||||||||||||||||
| December 31, 2020 | $582,781 | $132,020 | $25,386 | $143,413 | $883,600 | |||||||||||||||||||||||||||
| December 31, 2021 | $505,816 | $146,826 | $28,930 | $121,620 | $803,192 | |||||||||||||||||||||||||||
In 2020, we recorded asset impairment charges totaling $0.4 million related to the 2019 Restructuring program discussed in Note 6 "Restructuring and Impairments".
Amortization expense on intangible assets is included in the line items cost of sales, research and development expense, sales and marketing expense or general and administrative expense in the accompanying consolidated statements of income depending on the nature and use of the asset. In 2021, purchased intangibles amortization related to developed technology and patent and license rights acquired in a business combination is included in cost of sales in the
Consolidated Financial Statements 37
amount of $67.1 million (2020: $63.2 million) and purchased intangibles amortization of trademarks and customer base acquired in a business combination is recorded in sales and marketing expense in the amount of $18.5 million (2020: $20.8 million).
Amortization of capitalized development costs have been recorded to cost of sales in the amount of $4.4 million in 2021 (2020: $4.9 million).
Cash paid for purchases of intangible assets during the year ended December 31, 2021 totaled $67.9 million, of which $8.4 million is related to current year payments for assets that were accrued as of December 31, 2020 and $0.2 million is related to prepayments recorded in other non-current assets in the accompanying consolidated balance sheet. Intangible additions excluding development costs of $75.3 million includes $59.4 million of cash paid during the year, $15.0 million associated to a fully paid-up technology license received in exchange for a convertible note as discussed further in Note 24 "Related Party Transactions" and $0.9 million of additions which were previously recorded as prepayments.
Cash paid for intangible assets during the year ended December 31, 2020 totaled $224.3 million, of which $146.1 million is related to current year payments for licenses that were accrued as of December 31, 2019 and $1.4 million is related to prepayments recorded in other non-current assets in accompanying consolidated balance sheet while the remaining $76.9 million relates to current year additions excluding those related to development costs.
13. Leases
Nature of Existing Leases
We have leases primarily for real estate. The leases generally have terms which range from one year to 15 years, some include options to extend or renew, and some include options to early terminate the leases. As of December 31, 2021 and 2020, no such options have been recognized as part of the right-of-use assets and lease liabilities.
Leases can contain variable lease charges based on index like consumer prices or rates. During the years ended December 31, 2021 and 2020, amounts recorded as variable lease payments not included in the lease liabilities were not material.
When the interest rate implicit in each lease is not readily determinable, we apply our incremental borrowing rate in determining the present value of lease payments.
Supplemental balance sheet and other information related to leases as of December 31 are as follows:
| (in thousands, except lease term and discount rate) | Location in balance sheet | 2021 | 2020 | |||||||||||||||||
| Right-of-use assets | Right-of-use assets | $99,415 | $101,211 | |||||||||||||||||
| Office and buildings | 88,059 | 90,015 | ||||||||||||||||||
| Cars and all other assets | 11,356 | 11,196 | ||||||||||||||||||
| Current lease liabilities | Other current liabilities | $22,048 | $23,450 | |||||||||||||||||
| Non-current lease liabilities | Other non-current liabilities | $76,534 | $85,585 | |||||||||||||||||
| Weighted average remaining lease term | 7.80 years | 7.04 years | ||||||||||||||||||
Consolidated Financial Statements 38
The components of lease expense for the years ended December 31 are as follows:
| (in thousands) | 2021 | 2020 | ||||||||||||
| Amortization of right-of-use assets | $25,326 | $23,344 | ||||||||||||
| Office and buildings | 18,947 | 16,503 | ||||||||||||
| Cars and all other assets | 6,379 | 6,841 | ||||||||||||
| Interest on lease liabilities | ($2,029) | ($1,705) | ||||||||||||
Supplemental cash flow information related to leases for the years ended December 31 are as follows:
| (in thousands) | 2021 | 2020 | ||||||||||||
| Cash paid for amounts included in the measurement of lease liabilities: | ||||||||||||||
| Financing cash flows from principal portion of lease payments | $27,429 | $24,193 | ||||||||||||
| Operating cash flows from interest portion of lease payments | 2,029 | 1,705 | ||||||||||||
| Total cash outflow for leases | $29,458 | $25,898 | ||||||||||||
Maturities of lease liabilities as of December 31 were as follows:
| Year ending December 31, (in thousands) | ||||||||||||||
| 2022 | $23,641 | |||||||||||||
| 2023 | 19,441 | |||||||||||||
| 2024 | 13,930 | |||||||||||||
| 2025 | 9,270 | |||||||||||||
| 2026 | 7,031 | |||||||||||||
| Thereafter | 32,054 | |||||||||||||
| Total lease payments | 105,367 | |||||||||||||
| Less: imputed interest | (6,785) | |||||||||||||
| Total | $98,582 | |||||||||||||
As of December 31, 2021, we do not have any material leases that have not yet commenced.
14. Provisions
For the years ended December 31, 2021 and 2020, provisions as per the accompanying consolidated statements of financial position totaled $6.7 million and $6.6 million, respectively, and included amounts related to our warranty and acquisition related provisions. For all provisions it is expected that the respective amounts will be utilized in the next financial year.
Warranty provision
In the ordinary course of business, we provide a warranty to customers that our products are free of defects and will conform to published specifications. Generally, the applicable product warranty period is one year from the date of delivery of the product to the customer or of site acceptance, if required. Additionally, we typically provide limited warranties with respect to our services. We provide for estimated warranty costs at the time of the product sale. A provision for estimated future warranty costs is recorded in cost of sales at the time product revenue is recognized. We believe our warranty reserves as of
Consolidated Financial Statements 39
December 31, 2021 and 2020 appropriately reflect the estimated cost of such warranty obligations. The changes in the carrying amount of warranty obligations are as follows:
| (in thousands) | 2021 | 2020 | ||||||||||||
| Balance at beginning of year | $4,813 | $3,141 | ||||||||||||
| Provision charged to cost of sales | 7,518 | 5,645 | ||||||||||||
| Usage | (5,774) | (3,978) | ||||||||||||
| Adjustments to previously provided warranties, net | (43) | (125) | ||||||||||||
| Currency translation adjustment | (190) | 130 | ||||||||||||
| Balance at end of year | $6,324 | $4,813 | ||||||||||||
Acquisition related cost
The provision for acquisition and related costs primarily relates to personnel and consulting costs. During 2020, the provision and usage relate primarily with the unsuccessful acquisition attempt by Thermo Fisher.
| (in thousands) | 2021 | 2020 | ||||||||||||
| Balance at beginning of year | $1,752 | $4,988 | ||||||||||||
| Provision charged to expenses | 1,603 | 29,092 | ||||||||||||
| Usage | (2,913) | (32,350) | ||||||||||||
| Currency translation adjustment and other | (51) | 22 | ||||||||||||
| Balance at end of year | $391 | $1,752 | ||||||||||||
15. Other Current and Non-current Liabilities
Other current liabilities at December 31, 2021 and 2020 consist of the following:
| (in thousands) | Note | 2021 | 2020 | |||||||||||||||||
| Payroll and related accrued liabilities | $100,756 | $99,085 | ||||||||||||||||||
| Deferred revenue | (4) | 63,368 | 57,066 | |||||||||||||||||
| Other liabilities | 54,929 | 52,006 | ||||||||||||||||||
| Accrued expenses | 54,271 | 51,024 | ||||||||||||||||||
| Income tax payable | (17) | 27,669 | 14,765 | |||||||||||||||||
| Accrued contingent consideration | (25) | 24,100 | 23,593 | |||||||||||||||||
| Current lease liabilities | (13) | 22,048 | 23,450 | |||||||||||||||||
| Royalties | (20) | 12,559 | 7,427 | |||||||||||||||||
| Cash collateral liability | (26) | 9,200 | 600 | |||||||||||||||||
| Future license payments | 4,945 | 8,673 | ||||||||||||||||||
| Accrued interest on non-current financial debt | (16) | 4,488 | 4,575 | |||||||||||||||||
| Restructuring | (6) | 1,714 | 9,910 | |||||||||||||||||
| Other current liabilities | $380,047 | $352,174 | ||||||||||||||||||
Consolidated Financial Statements 40
Other non-current liabilities at December 31, 2021 and 2020 consist of the following:
| (in thousands) | Note | 2021 | 2020 | |||||||||||||||||
| Accrued expenses | $103,278 | $66,552 | ||||||||||||||||||
| Non-current lease liabilities | (13) | 76,534 | 85,585 | |||||||||||||||||
| Non-current employee benefit obligations | 15,479 | 14,675 | ||||||||||||||||||
| Deferred revenue | (4) | 11,315 | 11,755 | |||||||||||||||||
| Future license payments | 2,714 | 8,157 | ||||||||||||||||||
| Other non-current liabilities | $209,320 | $186,724 | ||||||||||||||||||
16. Financial Debts
At December 31, 2021 and December 31, 2020, total long-term debt, net of debt issuance costs of $8.4 million and $10.7 million, respectively, consists of the following:
| (in thousands) | 2021 | 2020 | ||||||||||||
| 0.875% Senior Unsecured Cash Convertible Notes due 2021 | $— | $200 | ||||||||||||
| 0.500% Senior Unsecured Cash Convertible Notes due 2023 | 375,149 | 361,304 | ||||||||||||
| 1.000% Senior Unsecured Cash Convertible Notes due 2024 | 446,503 | 429,496 | ||||||||||||
| 0.000% Senior Unsecured Convertible Notes due 2027 | 442,753 | 442,481 | ||||||||||||
| 3.75% Series B Senior Notes due October 16, 2022 | 299,872 | 299,719 | ||||||||||||
| 3.90% Series C Senior Notes due October 16, 2024 | 26,967 | 26,956 | ||||||||||||
| German Private Placement (Schuldschein) | 294,504 | 357,551 | ||||||||||||
| Total current and non-current financial debts | 1,885,748 | 1,917,707 | ||||||||||||
| Less: current portion of financial debts | 845,655 | 42,539 | ||||||||||||
| Total non-current financial debts | $1,040,093 | $1,875,168 | ||||||||||||
| Total amount secured | — | — | ||||||||||||
| Unused lines of credit for short-term financing | $483,620 | $523,972 | ||||||||||||
The notes are all unsecured obligations that rank pari passu. Interest expense on long-term debt was $50.7 million and $63.5 million for the years ended December 31, 2021 and 2020, respectively.
Repayments of long-term debt for the years ended December 31, 2021 and 2020 consisted of:
| (in thousands) | 2021 | 2020 | ||||||||||||
| German Private Placement (Schuldschein) | $41,145 | $— | ||||||||||||
| 0.875% Senior Unsecured Cash Convertible Notes due 2021 | 200 | 296,400 | ||||||||||||
| $41,345 | $296,400 | |||||||||||||
Consolidated Financial Statements 41
The principal amount, carrying amount and fair values of long-term debt instruments are summarized below:
| As of December 31, 2021 | ||||||||||||||||||||||||||||||||
| (in thousands) | Principal Amount | Unamortized debt discount and issuance costs | Carrying Amount | Fair Value | ||||||||||||||||||||||||||||
| Amount | Leveling | |||||||||||||||||||||||||||||||
| Cash Convertible Notes due 2023 | $400,000 | ($24,851) | $375,149 | $547,256 | Level 1 | |||||||||||||||||||||||||||
| Cash Convertible Notes due 2024 | 500,000 | (53,497) | 446,503 | 647,100 | Level 1 | |||||||||||||||||||||||||||
Convertible Notes due 2027(1) | 445,949 | (3,196) | 442,753 | 536,400 | Level 1 | |||||||||||||||||||||||||||
| U.S. Private Placement | 327,000 | (161) | 326,839 | 331,566 | Level 2 | |||||||||||||||||||||||||||
| German Private Placement | 294,738 | (234) | 294,504 | 296,587 | Level 2 | |||||||||||||||||||||||||||
| $1,967,687 | ($81,939) | $1,885,748 | $2,358,909 | |||||||||||||||||||||||||||||
| As of December 31, 2020 | ||||||||||||||||||||||||||||||||
| (in thousands) | Principal Amount | Unamortized debt discount and issuance costs | Carrying Amount | Fair Value | ||||||||||||||||||||||||||||
| Amount | Leveling | |||||||||||||||||||||||||||||||
| Cash Convertible Notes due 2021 | $200 | $— | $200 | $370 | Level 1 | |||||||||||||||||||||||||||
| Cash Convertible Notes due 2023 | 400,000 | (38,696) | 361,304 | 530,376 | Level 1 | |||||||||||||||||||||||||||
| Cash Convertible Notes due 2024 | 500,000 | (70,504) | 429,496 | 636,455 | Level 1 | |||||||||||||||||||||||||||
Convertible Notes due 2027(1) | 445,949 | (3,468) | 442,481 | 510,930 | Level 1 | |||||||||||||||||||||||||||
| U.S. Private Placement | 327,000 | (325) | 326,675 | 337,747 | Level 2 | |||||||||||||||||||||||||||
| German Private Placement | 357,911 | (360) | 357,551 | 361,957 | Level 2 | |||||||||||||||||||||||||||
| $2,031,060 | ($113,353) | $1,917,707 | $2,377,835 | |||||||||||||||||||||||||||||
(1)The initial fair value liability of the embedded conversion options for the 2027 Notes was $54.1 million which simultaneously reduced the carrying value of the Convertible Notes as discussed further below.
Future maturities (stated at the carrying values) and future interest as of December 31, 2021 is as follows:
| Years ending December 31, (in thousands) | Carrying value | Loans (fixed and floating-rate) | Convertible notes (fixed-rate) | Total future contractual cash obligations(1) | ||||||||||||||||||||||
| 2022 | $845,655 | $482,749 | $7,000 | $489,749 | ||||||||||||||||||||||
| 2023 | — | 2,353 | 381,549 | 383,902 | ||||||||||||||||||||||
| 2024 | 580,946 | 136,036 | 450,836 | 586,872 | ||||||||||||||||||||||
| 2025 | — | 264 | — | 264 | ||||||||||||||||||||||
| 2026 | — | 264 | — | 264 | ||||||||||||||||||||||
| Thereafter | 459,147 | 16,574 | 442,753 | 459,327 | ||||||||||||||||||||||
| $1,885,748 | $638,240 | $1,282,138 | $1,920,378 | |||||||||||||||||||||||
(1)Future 2022 contractual cash obligations include only amounts due in cash. The 2023 Notes that became convertible pursuant to the indenture on January 1, 2022 and are classified as current as of December 31, 2021, are only convertible during the triggered conversion period and are thus not included as a cash payment until the 2023 date in the table above.
Consolidated Financial Statements 42
Future maturities (stated at the carrying values) and future interest as of December 31, 2020 is as follows:
| Years ending December 31, (in thousands) | Carrying value | Loans (fixed and floating-rate) | Convertible notes (fixed-rate) | Total future contractual cash obligations | ||||||||||||||||||||||
| 2021 | $42,539 | $57,463 | $7,200 | $64,663 | ||||||||||||||||||||||
| 2022 | 480,753 | 493,235 | 7,000 | 500,235 | ||||||||||||||||||||||
| 2023 | 361,304 | 2,462 | 367,704 | 370,166 | ||||||||||||||||||||||
| 2024 | 572,870 | 145,030 | 433,829 | 578,859 | ||||||||||||||||||||||
| 2025 | — | 286 | — | 286 | ||||||||||||||||||||||
| Thereafter | 460,241 | 18,242 | 442,481 | 460,723 | ||||||||||||||||||||||
| $1,917,707 | $716,718 | $1,258,214 | $1,974,932 | |||||||||||||||||||||||
Interest expense for the years ended December 31, 2021 and 2020 related to the 2027 Notes and the Cash Convertible Notes was comprised of the following:
| (in thousands) | 2021 | 2020 | ||||||||||||||||||
| Coupon interest | $7,000 | $9,025 | ||||||||||||||||||
| Amortization of original issuance discount | 28,864 | 38,229 | ||||||||||||||||||
| Amortization of debt issuance costs | 2,521 | 2,942 | ||||||||||||||||||
| Total interest expense related to the Cash Convertible Notes | $38,385 | $50,196 | ||||||||||||||||||
Convertible Notes due 2027
On December 17, 2020, we issued zero coupon convertible notes in an aggregate principal amount of $500.0 million with a maturity date of December 17, 2027 (2027 Notes). The 2027 Notes carry no coupon interest. The net proceeds of the 2027 Notes totaled $497.6 million, after payment of debt issuance costs of $3.7 million.
Because the Convertible Notes contain an embedded conversion option, we have determined that the embedded conversion option is a derivative financial instrument, which is required to be separated from the Convertible Notes and accounted for separately as a derivative liability, with changes in fair value reported in our consolidated statements of income until the conversion option transaction settles or expires. The initial fair value liability of the embedded conversion options for the 2027 Notes was $54.1 million which simultaneously reduced the carrying value of the Convertible Notes. For further discussion of the derivative financial instruments relating to the Convertible Note, refer to Note 26 "Financial Risk Factors and Use of Derivative Financial Instruments".
The effective interest rate of the 2027 Notes is 1.65%, which is imputed based on the amortization of the fair value of the embedded conversion option over the remaining term of the 2027 Note.
The 2027 Notes are convertible into common shares based on an initial conversion rate, subject to adjustment, of 2,477.65 shares per $200,000 principal amount of notes (which represents an initial conversion price of $80.7218 per share, or 6.2 million underlying shares). At conversion, we will settle the 2027 Notes by repaying the principal portion in cash and any excess of the conversion value over the principal amount in shares of common stock.
The notes may be redeemed at the option of each noteholder at their principal amount on December 17, 2025 or in connection with a change of control or delisting event.
The 2027 Notes are convertible in whole, but not in part, at the option of the noteholders on a net share settlement basis, at the prevailing conversion price in the following circumstances beginning after January 27, 2021 through June 16, 2027:
Consolidated Financial Statements 43
•if the last reported sale price of our common stock for at least 20-consecutive trading days during a period of 30-consecutive trading days ending on the last trading day of the immediately preceding calendar quarter is greater than or equal to 130% of the conversion price on each applicable trading day; or
•if we undergo certain fundamental changes, including a change of control, as defined in the agreement; or
•if parity event or trading price unavailability event, as the case maybe occurs during the period of 10 days, including the first business day following the relevant trading price notification date; or
•if we distribute assets or property to all or substantially all of the holders of our common stock and those assets or other property have a value of more than 25% of the average daily volume-weighted average trading price of our common stock for the prior 20 consecutive trading days; or
•in case of early redemption in respect of the outstanding notes at our option, where the conversion date falls in the period from (and including) the date on which the call notice is published to (and including) the 45th business day prior to the redemption date; or
•if we experience certain customary events of default, including defaults under certain other indebtedness, until such event of default has been cured or waived.
The noteholders may convert their notes at any time, without condition, on or after June 17, 2027 until the 45th business day prior to December 17, 2027.
No Contingent Conversion Conditions were triggered for the 2027 Notes as of December 31, 2021.
Cash Convertible Notes due 2021, 2023 and 2024
On March 19, 2014, we issued $730.0 million aggregate principal amount of Cash Convertible Senior Notes in two tranches consisting of $430.0 million due on March 19, 2019 (2019 Notes) and $300.0 million due on March 19, 2021 (2021 Notes). The aggregate net proceeds of the 2019 and 2021 Convertible Notes were $680.7 million, after payment of the net cost of the Call Spread Overlay described below and transaction costs. Repayment of these Notes are further detailed in the table above.
On September 13, 2017, we issued $400.0 million aggregate principal amount of Cash Convertible Senior Notes which is due in 2023 (2023 Notes). The net proceeds of the 2023 Notes were $365.6 million, after payment of the net cost of the Call Spread Overlay described below and transaction costs.
On November 13, 2018, we issued $500.0 million aggregate principal amount of Cash Convertible Senior Notes which is due in 2024 (2024 Notes). The net proceeds of the 2024 Notes were $468.9 million, after payment of the net cost of the Call Spread Overlay described below and transaction costs.
We refer to the 2019 Notes, 2021 Notes 2023 Notes and 2024 Notes, collectively as the “Cash Convertible Notes”.
Interest on the Cash Convertible Notes is payable semi-annually in arrears and will mature on the maturity date unless repurchased or converted with their terms prior to such date. The interest rate and corresponding maturity of each Note are summarized in the table below. The Cash Convertible Notes that remain outstanding as of December 31, 2021 are solely convertible into cash in whole, but not in part, at the option of noteholders under the circumstances described below and during the contingent conversion periods as shown in the table below.
| Cash Convertible Notes | Annual Interest Rate | Date of Interest Payments | Maturity Date | Contingent Conversion Period | Conversion Rate per $200,000 Principal Amount | |||||||||||||||||||||||||||
| 2023 Notes | 0.500% | March 13 and September 13 | September 13, 2023 | From October 24, 2017 to March 13, 2023 | 4,829.7279 | |||||||||||||||||||||||||||
| 2024 Notes | 1.000% | May 13 and November 13 | November 13, 2024 | From December 24, 2018 to August 2, 2024 | 4,360.3098 | |||||||||||||||||||||||||||
Additionally, conversion may occur at any time following a Contingent Conversion Period through the fifth business day immediately preceding the applicable maturity date.
Consolidated Financial Statements 44
Upon conversion, noteholders will receive an amount in cash equal to the Cash Settlement Amount, calculated as described below. The Cash Convertible Notes are not convertible into shares of our common stock or any other securities.
Noteholders may convert Cash Convertible Notes into cash at their option at any time during the Contingent Conversion Periods described above only under the following circumstances (Contingent Conversion Conditions):
•if the last reported sale price of our common stock for at least 20-consecutive trading days during a period of 30-consecutive trading days ending on the last trading day of the immediately preceding calendar quarter is greater than or equal to 130% of the conversion price on each applicable trading day;
•if we undergo certain fundamental changes, including a change of control, as defined in the agreement;
•if parity event or trading price unavailability event, as the case maybe occurs for the 2023 Notes and 2024 Notes during the period of 10 days, including the first business day following the relevant trading price notification date;
•if we elect to distribute assets or property to all or substantially all of the holders of our common stock and those assets or other property have a value of more than 25% of the average daily volume-weighted average trading price of our common stock for the prior 20 consecutive trading days;
•if we elect to redeem the Cash Convertible Notes; or
•if we experience certain customary events of default, including defaults under certain other indebtedness until such event has been cured or waived or the payment of the Notes have been accelerated.
The Contingent Conversion Conditions in the 2023 Notes and 2024 Notes noted above have been analyzed under IFRS 9, Financial Instruments, and, based on our analysis, we determined that each of the embedded features listed above are clearly and closely related to the 2023 Notes and 2024 Notes (i.e., the host contracts). As a result, pursuant to the accounting provisions of IFRS 9, Financial Instruments, these features noted above are not required to be bifurcated as separate instruments.
As of December 31, 2021, the 2023 Notes may be surrendered for conversion through the close of business on March 31, 2022 (the “Relevant Fiscal Quarter”). The 2023 Notes have become convertible pursuant to Section 12.01(b)(iv) of the indenture because the arithmetic mean of the last reported sale prices of our common stock, in each trading day in at least one 20 consecutive trading day period during the 30 consecutive trading day period ending on the last trading day of the preceding fiscal quarter, was greater than 130% of the conversion price in effect on such last trading day. The 2023 Notes will be convertible at a conversion ratio of 4,829.7279 per $200,000 principal amount of 2023 Notes, which is equivalent to a conversion price of approximately $41.4102 per share of our common stock.
No Contingent Conversion Conditions were triggered for the 2024 Notes as of December 31, 2021.
Upon conversion, holders are entitled to a cash payment (Cash Settlement Amount) equal to the average of the conversion rate multiplied by the daily volume-weighted average trading price for our common stock over a 50-day period. The conversion rate is subject to adjustment in certain instances but will not be adjusted for any accrued and unpaid interest. In addition, following the occurrence of certain corporate events that may occur prior to the applicable maturity date, we may be required to pay a cash make-whole premium by increasing the conversion rate for any holder who elects to convert Cash Convertible Notes in connection with the occurrence of such a corporate event.
We may redeem the Cash Convertible Notes in their entirety at a price equal to 100% of the principal amount of the applicable Cash Convertible Notes plus accrued interest at any time when 20% or less of the aggregate principal amount of the applicable Cash Convertible Notes originally issued remain outstanding.
Because the Cash Convertible Notes contain an embedded cash conversion option, we have determined that the embedded cash conversion option is a derivative financial instrument, which is required to be separated from the Cash Convertible Notes and accounted for separately as a derivative liability, with
Consolidated Financial Statements 45
changes in fair value reported in our consolidated statements of income until the cash conversion option transaction settles or expires. The initial fair value liability of the embedded cash conversion options for the 2019 Notes and 2021 Notes was $51.2 million and $54.0 million, respectively, $74.5 million for the 2023 Notes, and $98.5 million for the 2024 Notes, which simultaneously reduced the carrying value of the Cash Convertible Notes (effectively an original issuance discount). For further discussion of the derivative financial instruments relating to the Cash Convertible Note, refer to Note 26 "Financial Risk Factors and Use of Derivative Financial Instruments".
As noted above, the reduced carrying value on the Cash Convertible Notes resulted in a debt discount that is amortized to the principal amount through the recognition of non-cash interest expense using the effective interest method over the expected life of the debt, which is five and seven for the 2019 Notes and 2021 Notes, and six years for the 2023 Notes and 2024 Notes, respectively. This resulted in our recognition of interest expense on the Cash Convertible Notes at an effective rate approximating what we would have incurred had nonconvertible debt with otherwise similar terms been issued. The effective interest rate of the 2019 Notes, 2021 Notes, 2023 Notes and 2024 Notes is 2.937%, 3.809%, 3.997% and 4.782% respectively, which is imputed based on the amortization of the fair value of the embedded cash conversion option over the remaining term of the Cash Convertible Notes.
In connection with the issuance of the May 2014 Cash Convertible Senior Notes, which included 2021 Notes, we incurred approximately $13.1 million in transaction costs. We incurred approximately $6.2 million and $5.7 million in transaction costs for the 2023 and 2024 Notes, respectively. Such costs have been allocated to the Cash Convertible Notes and deferred and are being amortized to interest expense over the terms of the Cash Convertible Notes using the effective interest method.
Cash Convertible Notes Call Spread Overlay
Concurrent with the issuance of the Cash Convertible Notes, we entered into privately negotiated hedge transactions (Call Options) with, and issued warrants to purchase shares of our common stock (Warrants) to, certain financial institutions. We refer to the Call Options and Warrants collectively as the “Call Spread Overlay.” The Call Options are intended to offset any cash payments payable by us in excess of the principal amount due upon any conversion of the Cash Convertible Notes.
The Call Options and Warrants are derivative financial instruments and are discussed further in Note 26 "Financial Risk Factors and Use of Derivative Financial Instruments".
Aside from the initial payment of a premium, we will not be required to make any cash payments under the Call Options, and will be entitled to receive an amount of cash, generally equal to the amount by which the market price per share of our common stock exceeds the exercise price of the Call Options during the relevant valuation period. The exercise price under the Call Options is initially equal to the conversion price of the Cash Convertible Notes.
During 2020, while the 2021 Notes were contingently convertible, we received conversion notices for $119.4 million of outstanding principal. In December 2020, we initiated a tender offer and repurchased a further $177.0 million of outstanding principal. In connection with these transactions, we received $239.8 million in cash upon the exercise of the call options and we paid $237.4 million for the intrinsic value of the 2021 Notes' embedded cash conversion option. The net effect of the cash paid and received of $2.4 million was recognized as a gain in other financial results.
We issued Warrants as summarized in the table below. The number of warrants and exercise prices are subject to customary adjustments under certain circumstances.
| Cash convertible notes | Issued on | Number of share warrants (in millions) | Exercise price per share | Proceeds from issuance of warrants, net of issuance costs (in millions) | Warrants expire over a period of 50 trading days beginning on | |||||||||||||||||||||||||||
| 2023 | September 13, 2017 | 9.7 | $49.9775 | $45.3 | June 26, 2023 | |||||||||||||||||||||||||||
| 2024 | November 13, 2018 | 10.9 | $50.2947 | $72.4 | August 27, 2024 | |||||||||||||||||||||||||||
Consolidated Financial Statements 46
During 2020, 0.8 million common shares were issued in connection with the early conversion of 4.2 million warrants related to the 2021 Notes which resulted in a $8.7 million increase in retained earnings, and a decrease of $30.3 million in treasury shares. The remaining warrants related to the 2021 Notes of 6.3 million were terminated in 2020, resulting in a cash payment of $174.6 million.
The Warrants that were issued with our Cash Convertible Notes, could have a dilutive effect to the extent that the price of our common stock exceeds the applicable strike price of the Warrants. For each Warrant that is exercised, we will deliver to the holder a number of shares of our common stock equal to the amount by which the settlement price exceeds the exercise price, plus cash in lieu of any fractional shares. The Warrants are exercisable only upon expiration and we will not receive any proceeds if the Warrants are exercised.
U.S. Private Placement
In October 2012, we completed a private placement through the issuance of new senior unsecured notes at a total amount of $400.0 million with a weighted average interest rate of 3.66% (settled on October 16, 2012). The notes were issued in three series: (1) 73.0 million 7-year term due and paid in 2019 (3.19%); (2) $300.0 million 10-year term due in October 16, 2022 (3.75%); and (3) $27.0 million 12-year term due in October 16, 2024 (3.90%). We paid $2.1 million in debt issue costs which will be amortized through interest expense over the lifetime of the notes. The note purchase agreement contains certain financial and non-financial covenants, including but not limited to, restrictions on priority indebtedness and the maintenance of certain financial ratios. We were in compliance with these covenants at December 31, 2021.
German Private Placement (Schuldschein)
In 2017, we completed a German private placement bond (Schuldschein) which was issued in several tranches totaling $331.1 million due in various periods through 2027. In the first half of 2021, we repaid $41.1 million for two tranches that matured. The Schuldschein consists of U.S. dollar and several Euro denominated tranches. The Euro tranches are designated as a foreign currency non-derivative hedging instrument that qualifies as a net investment hedge as described in Note 26 "Financial Risk Factors and Use of Derivative Financial Instruments". Based on the spot rate method, the change in the carrying value of the Euro denominated tranches attributed to the net investment hedge as of December 31, 2021 totaled $2.1 million of unrealized loss and is recorded in equity. We paid $1.2 million in debt issuance costs which are being amortized through interest expense over the lifetime of the notes. A summary of the tranches as of December 31, 2021 and 2020 is as follows:
| Carrying Value (in thousands) as of December 31, | ||||||||||||||||||||||||||||||||
| Currency | Notional Amount | Interest Rate | Maturity | 2021 | 2020 | |||||||||||||||||||||||||||
| EUR | €11.5 million | Fixed 0.4% | March 2021 | $— | $14,115 | |||||||||||||||||||||||||||
| EUR | €23.0 million | Floating EURIBOR + 0.4% | March 2021 | — | 28,224 | |||||||||||||||||||||||||||
| EUR | €21.5 million | Fixed 0.68% | October 2022 | 24,340 | 26,361 | |||||||||||||||||||||||||||
| EUR | €64.5 million | Floating EURIBOR + 0.5% | October 2022 | 73,020 | 79,083 | |||||||||||||||||||||||||||
| USD | $45.0 million | Floating LIBOR + 1.2% | October 2022 | 44,976 | 44,948 | |||||||||||||||||||||||||||
| EUR | €25.0 million | Floating EURIBOR + 0.5% | October 2022 | 28,298 | 30,642 | |||||||||||||||||||||||||||
| EUR | €64.0 million | Fixed 1.09% | June 2024 | 72,405 | 78,429 | |||||||||||||||||||||||||||
| EUR | €31.0 million | Floating EURIBOR + 0.7% | June 2024 | 35,071 | 37,989 | |||||||||||||||||||||||||||
| EUR | €14.5 million | Fixed 1.61% | June 2027 | 16,394 | 17,760 | |||||||||||||||||||||||||||
| $294,504 | $357,551 | |||||||||||||||||||||||||||||||
The financial markets regulators in the United Kingdom and the Eurozone have passed regulations wherein non-dollar LIBORs and one-week and two-month USD LIBOR ended after 2021, while the remaining USD LIBOR tenors will end as of June 30, 2023. Market participants and regulators are working on establishing new interest rate benchmarks. While the outcome of this work is not clear yet, the USD tranche of the Schuldschein and our interest rate swaps continue to make reference to the current LIBOR benchmark rate. These agreements contain language for the determination of interest rates in case the
Consolidated Financial Statements 47
benchmark rate is not available. However, as the maturity date for the USD tranche of the Schuldschein and related interest rate swaps is in October 2022, these instruments will be settled before the LIBOR end date of June 30, 2023. Therefore we currently do not anticipate any impact from the LIBOR phase out.
Revolving Credit Facility
Our credit facilities available and undrawn at December 31, 2021 total €427.0 million (approximately $483.6 million). This includes a €400.0 million syndicated multi-currency revolving credit facility expiring December 2024 and three other lines of credit amounting to €27.0 million with no expiration date. The €400.0 million facility can be utilized in Euro and bears interest of 0.550% to 1.500% above EURIBOR, and is offered with interest periods of one, three or six months. The commitment fee is calculated based on 35% of the applicable margin. In 2021 and 2020, $1.3 million and $0.9 million of commitment fees were paid, respectively. The revolving facility agreement contains certain financial and non-financial covenants, including but not limited to, restrictions on the encumbrance of assets and the maintenance of certain financial ratios. We were in compliance with these covenants at December 31, 2021. The credit facilities are for general corporate purposes and no amounts were utilized as at December 31, 2021.
17. Income Tax
Major components of income tax expense as presented in the income statement for the years ended December 31, 2021 and 2020, are:
| (in thousands) | 2021 | 2020 | ||||||||||||
| Current income tax charge | $125,768 | $102,381 | ||||||||||||
| Adjustment in respect of current income tax of previous years | 3,483 | (6,838) | ||||||||||||
| Current income tax | 129,251 | 95,543 | ||||||||||||
| Relating to origination and reversal of temporary differences | (12,837) | (12,811) | ||||||||||||
| Relating to changes in tax rates | (2,366) | (1,445) | ||||||||||||
| Deferred income tax | (15,203) | (14,256) | ||||||||||||
| Total income tax | $114,048 | $81,287 | ||||||||||||
Deferred tax related to items charged or credited directly to equity during 2021 and 2020 shown in the statement of comprehensive income totaled $1.7 million and $2.2 million, respectively.
Consolidated Financial Statements 48
The applicable statutory income tax rate in The Netherlands was 25% in 2021 and in 2020. The principal items comprising the differences between income taxes computed at the Netherlands statutory rate and the effective tax rate for the years ended December 31, 2021 and 2020 is as follows:
| 2021 | 2020 | |||||||||||||||||||||||||
| (in thousands) | Amount | Percent | Amount | Percent | ||||||||||||||||||||||
| Income before tax | $651,102 | — | $154,927 | — | ||||||||||||||||||||||
| At Dutch statutory income tax rate of 25.0% | 162,775 | 25.0 | % | 38,732 | 25.0 | % | ||||||||||||||||||||
Taxation of foreign operations, net(1) | (46,266) | (7.1) | % | (9,534) | (6.2) | % | ||||||||||||||||||||
Tax impact from non-deductible items(2) | 5,785 | 0.9 | % | 70,917 | 45.8 | % | ||||||||||||||||||||
| Prior year taxes | 3,483 | 0.5 | % | (8,635) | (5.6) | % | ||||||||||||||||||||
| Changes in tax rates impacting deferred taxes | (2,366) | (0.4) | % | (1,445) | (0.9) | % | ||||||||||||||||||||
| Tax impact from intangible property transfer | — | — | % | (3,658) | (2.4) | % | ||||||||||||||||||||
| Other | (9,363) | (1.4) | % | (5,090) | (3.3) | % | ||||||||||||||||||||
| Total income tax | $114,048 | 17.5 | % | $81,287 | 52.5 | % | ||||||||||||||||||||
(1)Our effective tax rate reflects the benefit of our global operations where certain income or loss is taxed at rates higher or lower than The Netherlands’ statutory rate of 25% as well as the benefit of some income being partially exempt from income taxes due to various intercompany operating and financing activities. These foreign tax benefits are due to a combination of favorable tax laws, regulations and exemptions in these jurisdictions. Partial tax exemptions exist on foreign income primarily derived from operations in Germany, The Netherlands and Singapore. Further, we have intercompany financing arrangements through Dubai in which the intercompany income is nontaxable or partially exempt or subject to lower statutory tax rates. As of December 31, 2021, we recognized tax benefits of $25.4 million related to U.S. disallowed interest carryforward and $2.2 million related to previously unrecognized tax losses.
(2)During 2020, we established accruals for tax contingencies, primarily related to the potential nondeductibility of the $293.9 million loss recorded for fair value changes in the warrants and embedded conversion options, the $95.0 million expense reimbursement paid in connection with the unsuccessful acquisition attempt by Thermo Fisher and ongoing income tax audits.
We conduct business globally and, as a result, file numerous consolidated and separate income tax returns in The Netherlands, Germany, Switzerland and the U.S. federal jurisdiction, as well as in various other state and foreign jurisdictions. In the normal course of business, we are subject to examination by taxing authorities throughout the world. Tax years in The Netherlands are potentially open back to 2009 for income tax examinations by tax authorities. The German group is open to audit for the tax years starting in 2014 and in 2019, the German tax authority commenced an audit for the 2014-2016 tax years. The U.S. consolidated group is subject to Federal and most state income tax examinations by tax authorities beginning with the year ending December 31, 2018 through the current period. Our other subsidiaries, with few exceptions, are no longer subject to income tax examinations by tax authorities for years before 2017.
As of December 31, 2021 and 2020, our unrecognized tax benefits totaled $103.6 million and $100.1 million, respectively, which, if recognized, would favorably affect our effective tax rate in any future period. It is reasonably possible that approximately $35.1 million of the unrecognized tax benefits may be released or utilized during the next 12 months due to lapse of statute of limitations or settlements with tax authorities; however, various events could cause our current expectations to change in the future. The above unrecognized tax benefits, if ever recognized in the financial statements, would be recorded in the income statement as part of income taxes. Also, we have accrued interest and penalties of $3.8 million and $4.6 million related to these uncertain tax positions at December 31, 2021 and 2020.
Consolidated Financial Statements 49
We have recorded net deferred tax assets of $72.1 million and $43.0 million at December 31, 2021 and 2020, respectively. The components of the net deferred asset and liability at December 31, 2021 and 2020 are as follows:
| (in thousands) | 2021 | 2020 | Change | |||||||||||||||||
| Net operating loss and credit carryforward | $46,527 | $40,780 | $5,747 | |||||||||||||||||
| Inventory | 38,046 | 27,036 | 11,010 | |||||||||||||||||
| Equity awards | 31,677 | 29,350 | 2,327 | |||||||||||||||||
| Accrued liabilities | 26,513 | 22,926 | 3,587 | |||||||||||||||||
| Disallowed interest carryforwards | 16,219 | 16,927 | (708) | |||||||||||||||||
| Depreciation and amortization | 6,046 | 6,099 | (53) | |||||||||||||||||
| Convertible debt | 5,231 | 6,512 | (1,281) | |||||||||||||||||
| Intangibles | 4,066 | 2,817 | 1,249 | |||||||||||||||||
| Other | 7,287 | 10,822 | (3,535) | |||||||||||||||||
| Offsetting | (64,247) | (74,253) | 10,006 | |||||||||||||||||
| Deferred tax asset | 117,365 | 89,016 | 28,349 | |||||||||||||||||
| Intangibles | (62,585) | (55,999) | (6,586) | |||||||||||||||||
| Depreciation and amortization | (36,888) | (30,201) | (6,687) | |||||||||||||||||
Other(1) | (10,012) | (34,094) | 24,082 | |||||||||||||||||
| Offsetting | 64,247 | 74,253 | (10,006) | |||||||||||||||||
| Deferred tax (liability) | (45,238) | (46,041) | 803 | |||||||||||||||||
| Net deferred tax asset | $72,127 | $42,975 | $29,152 | |||||||||||||||||
(1)As of December 31, 2020, amount was primarily related to the unrealized gains on shares held in Invitae as further disclosed in Note 7 "Financial Assets".
The movement in deferred income tax assets and liabilities during the year is as follows:
| (in thousands) | 2021 | 2020 | ||||||||||||
| Change in deferred tax recognized in income | $15,203 | $14,255 | ||||||||||||
Change in deferred tax related to business combinations (1) | 17,335 | (26,545) | ||||||||||||
Change in deferred tax recognized in equity (2) | (3,385) | 6,141 | ||||||||||||
| Change in deferred tax | $29,153 | ($6,149) | ||||||||||||
(1)The change in deferred tax related to business combinations represents the deferred tax liability on fair value of identifiable intangible assets acquired and deferred tax asset on tax loss carry forwards as discussed in Note 5 "Acquisitions".
(2)The change deferred tax recognized in equity represents changes in components of other comprehensive income or loss, equity awards and translation adjustment.
At December 31, 2021, we had $599.5 million in total net operating loss (NOL) carryforwards which included $231.2 million for Germany, $158.8 million for the U.S., $59.7 million for Spain, $55.7 million for The Netherlands and $94.1 million for other foreign jurisdictions. We did not recognize tax benefits related to the NOL carryforwards in the Netherlands of $55.7 million and other foreign jurisdictions of $20.8 million. The NOL carryforwards in Germany, Spain and the Netherlands carryforward indefinitely. The entire NOL carryforward in the U.S. is subject to limitations under Section 382 of the U.S. Internal Revenue Code. The NOL carryforwards in the U.S. expire between 2024 and 2034. NOL carryforwards of $19.9 million in other foreign jurisdictions expire between 2021 and 2030 while the remainder can be carried forward indefinitely. At December 31, 2021, tax credits total $3.0 million which expire between 2031 and 2040.
Consolidated Financial Statements 50
As December 31, 2020, we had $686.3 million in total net operating loss (NOL) carryforwards which included $318.6 million for Germany, $176.4 million for the U.S., $68.5 million for The Netherlands, $49.8 million for Spain, and $73.0 million for other foreign jurisdictions. We did not recognize tax benefits related to the NOL carryforwards in the Netherlands of $68.5 million and other foreign jurisdictions of $30.2 million.
A deferred tax asset can only be recognized to the extent it is "more likely than not" that the assets will be realized. Judgments around realizability depend on the availability and weight of both positive and negative evidence. During 2021 and 2020, we recognized $9.2 million and $2.3 million, respectively, of tax benefit NOL carryforward due to expected future taxable income.
18. Equity
Common Shares
The authorized classes of our shares consist of Common Shares (410 million authorized), Preference Shares (450 million authorized) and Financing Preference Shares (40 million authorized). All classes of shares have a par value of €0.01. No Financing Preference Shares or Preference Shares have been issued. Like all shareholders' equity accounts, common shares are translated to U.S. dollars at the foreign exchange rates in effect when the shares are issued.
Appropriation of Profit of 2020
The financial statements for the reporting year 2020 have been adopted by the Annual General Meeting on June 29, 2021. The Annual General Meeting has adopted the appropriation of profit after tax as proposed by the Managing Board.
Proposal for Profit Appropriation
The General Meeting of Shareholders will be asked to approve the following appropriation of the 2021 net income for the period: an amount of $537.1 million to be added to retained earnings.
Share Repurchase Programs
On July 12, 2021, we announced our seventh share repurchase program of up to $100 million of our common shares. During 2021, we repurchased 1.9 million QIAGEN shares for $100.0 million (including transaction costs). This program ended on October 29, 2021.
On May 6, 2019, we announced our sixth share repurchase program of up to $100 million of our common shares. During 2020, we repurchased 1.3 million QIAGEN shares for $64.0 million (including transaction costs). This program ended on December 17, 2020.
The cost of repurchased shares is included in treasury stock and reported as a reduction in total equity when a repurchase occurs. Repurchased shares will be held in treasury in order to satisfy various obligations, which include exchangeable debt instruments, warrants and employee share-based remuneration plans.
Consolidated Financial Statements 51
19. Earnings per Common Share
We present basic and diluted earnings per share. Basic earnings per share is calculated by dividing the net income by the weighted average number of common shares outstanding. Diluted earnings per share reflect the potential dilution that would occur if all “in the money” securities to issue common shares were exercised.
The following schedule summarizes the information used to compute earnings per common share for the years ended December 31, 2021, and 2020:
| (in thousands, except per share data) | 2021 | 2020 | ||||||||||||
| Net income | $537,054 | $73,640 | ||||||||||||
| Weighted average number of common shares used to compute basic net income per common share | 227,983 | 228,427 | ||||||||||||
| Dilutive effect of stock options and restricted stock units | 3,403 | 3,350 | ||||||||||||
| Dilutive effect of outstanding warrants | 648 | 2,437 | ||||||||||||
| Weighted average number of common shares used to compute diluted net income per common share | 232,034 | 234,214 | ||||||||||||
| Outstanding options and awards having no dilutive effect, not included in above calculation | 8 | 11 | ||||||||||||
| Outstanding warrants having no dilutive effect, not included in above calculation | 19,912 | 26,438 | ||||||||||||
| Basic earnings per common share | $2.36 | $0.32 | ||||||||||||
| Diluted earnings per common share | $2.31 | $0.31 | ||||||||||||
For purposes of considering the 2027 Notes in determining diluted earnings per common share, only an excess of the conversion value over the principal amount would have a dilutive impact using the treasury stock method. Since the 2027 Notes were out of the money and anti-dilutive during the period from December 17, 2020 through December 31, 2021, they were excluded from the diluted earnings per common share calculation in 2020 and 2021.
20. Commitments and Contingencies
Licensing and Purchase Commitments
We have licensing agreements with companies, universities and individuals, some of which require certain up-front payments. Royalty payments are required on net product sales ranging from 0.45 percent to 25 percent of covered products or based on quantities sold. Several of these agreements have minimum royalty requirements. The accompanying consolidated balance sheets include accrued royalties relating to these agreements in the amount of $12.6 million and $7.4 million at December 31, 2021 and 2020. Royalty expense relating to these agreements amounted to $18.5 million and $12.2 million, for the years ended December 31, 2021 and 2020, respectively. Royalty expense is primarily recorded in cost of sales, with a small portion recorded as research and development expense depending on the use of the technology under license. Some of these agreements also have minimum raw material purchase requirements and requirements to perform specific types of research.
Consolidated Financial Statements 52
At December 31, 2021, we had commitments to purchase goods or services, and for future license and royalty payments. They are as follows:
| Years ending December 31, (in thousands) | Purchase Commitments | License & Royalty Commitments | ||||||||||||
| 2022 | $115,180 | $6,701 | ||||||||||||
| 2023 | 14,897 | 3,941 | ||||||||||||
| 2024 | 9,250 | 1,994 | ||||||||||||
| 2025 | — | 1,483 | ||||||||||||
| 2026 | — | 793 | ||||||||||||
| Thereafter | — | 2,885 | ||||||||||||
| $139,327 | $17,797 | |||||||||||||
We have total purchase commitments of $12.3 million included in the table above future license and royalty commitments of $9.2 million associated to a January 2022 agreement that will be paid over the next 19 years with companies in which we hold an interest and are considered related parties.
The information for the comparative period is provided below:
| Years ending December 31, (in thousands) | Purchase Commitments | License & Royalty Commitments | ||||||||||||
| 2021 | $199,843 | $10,003 | ||||||||||||
| 2022 | 42,628 | 7,217 | ||||||||||||
| 2023 | 5,364 | 4,483 | ||||||||||||
| 2024 | 3,000 | 2,623 | ||||||||||||
| 2025 | — | 2,349 | ||||||||||||
| Thereafter | — | 3,364 | ||||||||||||
| $250,835 | $30,039 | |||||||||||||
Contingent Consideration Commitments
Pursuant to the purchase agreements for certain acquisitions we could be required to make additional contingent cash payments, based on the achievement of certain revenue and operating results milestones, totaling up to $26.6 million in 2022 of which $24.1 million is included in other current liabilities in the accompanying consolidated balance sheet as of December 31, 2021.
Employment Agreements
Certain of our employment contracts contain provisions which guarantee the payments of certain amounts in the event of a change in control, as defined in the agreements, or if the executive is terminated for reasons other than cause, as defined in the agreements. At December 31, 2021, the commitment under these agreements totaled $9.2 million (2020: $21.2 million).
Litigation
From time to time, we may be party to legal proceedings incidental to our business. As of December 31, 2021, certain claims, suits or legal proceedings arising out of the normal course of business have been filed or were pending against QIAGEN or our subsidiaries. These matters have arisen in the ordinary course and conduct of business, as well as through acquisition. Although it is not possible to predict the outcome of such litigation, we assess the degree of probability and evaluate the reasonably possible losses that we could incur as a result of these matters. We accrue for any estimated loss when it is probable that a liability has been incurred and the amount of probable loss can be estimated.
Litigation accruals recorded in other current liabilities totaled $5.7 million as of December 31, 2021 (2020: $5.2 million).
Consolidated Financial Statements 53
ArcherDx spun out as an independent company in conjunction with QIAGEN's acquisition of Enzymatics in 2015. In 2018, ArcherDx (recently acquired by Invitae) and Massachusetts General Hospital (MGH) sued QIAGEN for patent infringement. In August 2021, a Federal jury ruled that QIAGEN infringed two patents owned by ArcherDx and awarded damages of $4.7 million which were expensed in Restructuring, acquisition, integration and other, net and remain accrued as of December 31, 2021. We plan to appeal the verdict as soon as the final verdict is entered.
On September 17, 2020, QIAGEN acquired NeuMoDx. As part of the purchase, QIAGEN also acquired preexisting contingencies and became defendant in ongoing litigation matters pertaining to preexisting claims made by Becton Dickinson (BD) and subsidiaries over patent infringement. In addition to patent infringement allegations, the litigation involved trade secret misappropriation and other non-patent claims relating to NeuMoDx and former NeuMoDx officers, before the acquisition by QIAGEN. On September 26, 2021, through mediation, the parties reached a preliminary settlement of $53.0 million due to BD for the past infringements of NeuMoDx prior to QIAGEN's acquisition. On November 5, 2021, QIAGEN and BD reached an agreement to settle their ongoing litigation in the U.S. District Court of the District of Delaware and certain inter partes review proceedings. As part of the settlement, QIAGEN paid $53.0 million to BD in November 2021 and all claims asserted against QIAGEN, as well as counterclaims asserted against BD, were dismissed.
A total of $1.0 million is accrued as of December 31, 2021 for other matters. The estimated amount of a range of possible losses for these matters as of December 31, 2021, is between $0.2 million and $2.1 million. Based on the facts known to QIAGEN and after consultation with legal counsel, management believes that such litigation will not have a material adverse effect on our financial position or results of operations above the amounts accrued. However, the outcome of these matters is ultimately uncertain, thus any settlements or judgments against us in excess of management's expectations could have a material adverse effect on our financial position, results of operations or cash flows.
21. Reportable Segment
We operate as one reportable segment in accordance with IFRS 8 Operating Segments. As a result of our continued restructuring and streamlining of the growing organization, our chief operating decision maker (CODM) continues to make decisions with regards to business operations and resource allocation based on evaluations of QIAGEN as a whole. Accordingly, we operate as one reportable segment. Summarized product category and geographic information and operating income is shown in the tables below.
Product Category Information
Net sales for the product categories are attributed based on those revenues related to sample and assay products and similarly related revenues including bioinformatics solutions, and revenues derived from instrumentation sales. Refer to Note 4 "Revenue" for disaggregation of revenue based on product categories, product type and customer class.
Geographical Information
Net sales are attributed to countries based on the location of the customer. QIAGEN operates manufacturing facilities in Germany, China, and the United States that supply products to customers as well as QIAGEN subsidiaries in other countries. The intersegment portions of such net sales are excluded to derive consolidated net sales. No single customer represents more than ten percent of consolidated net sales. Our country of domicile is the Netherlands, which reported net sales of $28.3 million and $17.8 million for the years ended 2021 and 2020, respectively, and these amounts are included in the line item Europe, Middle East and Africa as shown in the table below.
Consolidated Financial Statements 54
| Net Sales (in thousands) | 2021 | 2020 | ||||||||||||
| Americas: | ||||||||||||||
| United States | $909,690 | $728,577 | ||||||||||||
| Other Americas | 97,686 | 96,880 | ||||||||||||
| Total Americas | 1,007,376 | 825,457 | ||||||||||||
| Europe, Middle East and Africa | 814,417 | 682,289 | ||||||||||||
| Asia Pacific, Japan and Rest of World | 429,864 | 362,600 | ||||||||||||
| Total | $2,251,657 | $1,870,346 | ||||||||||||
Long-lived assets include property, plant and equipment, goodwill, other intangible assets, right-of-use assets, equity accounted investments, non-current financial assets and other non-current assets. The Netherlands, which is included in the balances for Europe, reported long-lived assets of $12.4 million and $19.1 million for the years ended 2021 and 2020, respectively.
| Long-lived Assets (in thousands) | 2021 | 2020 | ||||||||||||
| Americas: | ||||||||||||||
| United States | $2,295,161 | $2,311,406 | ||||||||||||
| Other Americas | 10,094 | 9,335 | ||||||||||||
| Total Americas | 2,305,255 | 2,320,741 | ||||||||||||
| Germany | 676,152 | 629,862 | ||||||||||||
| Other Europe, Middle East and Africa | 605,109 | 647,336 | ||||||||||||
| Asia Pacific, Japan and Rest of World | 241,296 | 263,450 | ||||||||||||
| Total | $3,827,812 | $3,861,389 | ||||||||||||
Operating Income Information
Our chief operating decision maker (CODM) makes decisions with regard to business operations and resource allocation considering many measures, the primary income measure being adjusted operating income. Adjusted results are financial measures that are considered to provide insight into our core business performance. The table below provides details regarding adjustments from the primary metric used by the CODM to income from operations for the years ended 2021 and 2020.
| (in thousands) | 2021 | 2020 | ||||||||||||
| Adjusted income from operations | $755,000 | $626,845 | ||||||||||||
| Purchased intangible amortization | (85,660) | (83,976) | ||||||||||||
| Business integration and acquisition related items | (39,256) | (156,438) | ||||||||||||
| Development costs | 4,911 | 5,099 | ||||||||||||
| Other income and expense | 686 | (7,614) | ||||||||||||
| Income from operations | $635,681 | $383,916 | ||||||||||||
22. Share-Based Payments
We adopted the QIAGEN N.V. Amended and Restated 2005 Stock Plan (the 2005 Plan) in 2005 and the QIAGEN N.V. 2014 Stock Plan (the 2014 Plan) in 2014. The 2005 Plan expired by its terms in April 2015 and no further awards will be granted under the 2005 Plan. The plans allow for the granting of stock
Consolidated Financial Statements 55
rights and incentive stock options, as well as non-qualified options, stock grants and stock-based awards, generally with terms of up to 3 years, with previous grants through 2020 having terms of 5 years subject to earlier termination in certain situations. The vesting and exercisability of certain stock rights will be accelerated in the event of a Change of Control, as defined in the plans. All option grants have been at the market value on the grant date or at a premium above the closing market price on the grant date. We issue Treasury Shares to satisfy option exercises and award releases and had approximately 12.9 million Common Shares reserved and available for issuance under the 2005 and 2014 Plans at December 31, 2021.
Stock Options
We have not granted stock options since 2013. A summary of the status of employee stock options as of December 31, 2021 and 2020, and changes during the years then ended is presented below:
| Stock Options (in thousands) | Weighted Average Exercise Price US$ | |||||||||||||
| Outstanding at January 1, 2021 | 427 | $19.28 | ||||||||||||
| Exercised | (409) | $19.34 | ||||||||||||
| Outstanding at December 31, 2021 | 18 | $17.79 | ||||||||||||
| Vested at December 31, 2021 | 18 | $17.79 | ||||||||||||
| Vested and expected to vest at December 31, 2021 | 18 | $17.79 | ||||||||||||
| Stock Options (in thousands) | Weighted Average Exercise Price US$ | |||||||||||||
| Outstanding at January 1, 2020 | 792 | $20.06 | ||||||||||||
| Exercised | (365) | $20.97 | ||||||||||||
| Outstanding at December 31, 2020 | 427 | $19.28 | ||||||||||||
| Vested at December 31, 2020 | 427 | $19.28 | ||||||||||||
| Vested and expected to vest at December 31, 2020 | 427 | $19.28 | ||||||||||||
The total intrinsic value of options exercised during the years ended December 31, 2021 and 2020 was $14.4 million and $6.5 million, respectively. The actual tax benefit for the tax deductions from option exercises totaled $2.2 million and $1.3 million during the years ended December 31, 2021 and 2020, respectively. At December 31, 2021, there was no unrecognized share-based compensation expense related to employee stock option awards.
At December 31, 2021 and 2020, 18 thousand and 0.4 million options were exercisable at a weighted average price of $17.79 and $19.28 per share, respectively. The options outstanding at December 31, 2021 will expire in various years through 2023.
Stock Units
Stock units represent rights to receive Common Shares at a future date and include restricted stock units which are subject to time-vesting only and performance stock units which include performance conditions in addition to time-vesting. The final number of performance stock units earned is based on the performance achievement which for some grants can reach up to 200% of the granted shares. There is no exercise price and the fair market value at the time of the grant is recognized over the requisite vesting period. The fair market value is determined based on the number of stock units granted and the market value of our shares on the grant date. Pre-vesting forfeitures were estimated to be approximately 6.9% (2020: 6.2%). At December 31, 2021, there was $68.9 million remaining in unrecognized compensation cost including estimated forfeitures related to these awards, which is expected to be recognized over a weighted average period of 1.78 years (2020: $73.1 million over a weighted average of 2.25 years). The weighted average grant date fair value of stock units granted during the year ended December 31, 2021 was $48.77 (2020: $36.92). The total fair value of restricted stock units released during the years ended December 31, 2021 and 2020 was $52.6 million and $29.3 million, respectively.
Consolidated Financial Statements 56
A summary of stock units as of December 31, 2021 and 2020, and changes during the year then ended are presented below:
| (in thousands) | 2021 | 2020 | ||||||||||||
| Outstanding at January 1st | 5,133 | 5,183 | ||||||||||||
| Granted | 739 | 1,035 | ||||||||||||
| Released | (1,031) | (720) | ||||||||||||
| Forfeited | (860) | (365) | ||||||||||||
| Outstanding at December 31st | 3,981 | 5,133 | ||||||||||||
| Vested and expected to vest at December 31st | 3,526 | 3,881 | ||||||||||||
We net share settle for the tax withholding upon the vesting of awards. Shares are issued on the vesting dates net of the applicable statutory tax withholding to be paid by us on behalf of our employees. As a result, fewer shares are issued than the number of stock units outstanding. We record a liability for the tax withholding to be paid by us as a reduction to treasury shares.
Compensation Expense
Share-based compensation expense for the years ended December 31, 2021 and 2020 totaled approximately $38.4 million and $40.9 million, respectively as shown in the table below.
| (in thousands) | 2021 | 2020 | ||||||||||||
| Cost of sales | $40 | $2,897 | ||||||||||||
| Research and development | 4,909 | 7,014 | ||||||||||||
| Sales and marketing | 13,630 | 15,889 | ||||||||||||
| General and administrative | 19,812 | 15,136 | ||||||||||||
| Share-based compensation expense before taxes | 38,391 | 40,936 | ||||||||||||
Less: Income tax benefit (1) | 9,998 | 9,052 | ||||||||||||
| Net share-based compensation expense | $28,393 | $31,884 | ||||||||||||
(1)Does not include the excess tax benefit realized for the tax deductions of the share-based payment arrangements totaled $6.5 million and $2.5 million for the years ended December 31, 2021 and 2020, respectively.
The lower share-based compensation expense in cost of sales in 2021 resulted from forfeitures upon the separation of an executive who received a cash severance payment in lieu of accelerated vesting upon separation per the terms of the arrangement. The cash separation accrual offset the share-based compensation forfeiture.
No share-based compensation cost was capitalized in inventory in 2021 and 2020 as the amounts were not material.
23. Employee Benefits and Personnel Costs
We maintain various benefit plans, including defined contribution and defined benefit plans. Our U.S. defined contribution plan is qualified under Section 401(k) of the Internal Revenue Code, and covers substantially all U.S. employees. Participants may contribute a portion of their compensation not exceeding a limit set annually by the Internal Revenue Service. This plan includes a provision for us to match a portion of employee contributions. Total expense under the 401(k) plans, including the plans acquired via business acquisitions, was $3.7 million and $3.6 million for the years ended December 31, 2021 and 2020, respectively. We also have a defined contribution plan which covers certain executives. We make matching contributions up to an established
Consolidated Financial Statements 57
maximum. Matching contributions made to the plan, and expensed, totaled approximately $0.2 million in each of the years ended December 31, 2021 and 2020.
We have six defined benefit, non-contributory retirement or termination plans that cover certain employees in Germany, France, Italy, Japan, Philippines and the United Arab Emirates. These defined benefit plans provide benefits to covered individuals satisfying certain age and/or service requirements. For certain plans, we calculate the vested benefits to which employees are entitled if they separate immediately. The benefits accrued on a pro-rata basis during the employees’ employment period are based on the individuals’ salaries, adjusted for inflation. The liability under the defined benefit plans was $9.3 million as of both December 31, 2021 and 2020, and is included as a component of other non-current liabilities on the accompanying consolidated balance sheets.
Personnel Costs
Personnel costs amounted to $607.5 million in 2021 (2020: $534.1 million). As of December 31, 2021, there were 6,028 employees within the Group (2020: 5,610).
| (in thousands) | 2021 | 2020 | ||||||||||||
| Salaries and wages | $351,182 | $304,029 | ||||||||||||
| Social security | 129,784 | 118,316 | ||||||||||||
| Share-based payment expense | 38,391 | 40,936 | ||||||||||||
| Termination costs | 2,534 | 904 | ||||||||||||
| Other | 85,655 | 69,896 | ||||||||||||
| Personnel costs | $607,546 | $534,081 | ||||||||||||
The personnel costs are allocated to the functional areas in which the respective employees are working or in the case of the incremental termination benefits which are the result of restructuring activities as discussed in Note 6 "Restructuring and Impairments" are recorded in restructuring, acquisition, integration and other costs.
24. Related Party Transactions
From time to time, we have transactions with other companies in which we hold an interest, all of which are individually and in the aggregate immaterial, as summarized in the table below.
Net sales to related parties for the years ended December 31, 2021 and 2020 are as follows:
| (in thousands) | 2021 | 2020 | ||||||||||||
| Net sales | $9,089 | $6,025 | ||||||||||||
Net sales with related parties primarily reflects our venture in China including our partnership in China to externalize the HPV test franchise for cervical cancer screening in China.
Consolidated Financial Statements 58
As of December 31, 2021 and 2020 balance with related parties are as follows:
| (in thousands) | 2021 | 2020 | ||||||||||||
| Trade accounts receivable | $3,868 | $3,961 | ||||||||||||
| Other current assets | $16,956 | $25,429 | ||||||||||||
| Other non-current assets | $61 | $10,843 | ||||||||||||
| Trade and other accounts payable | $4,149 | $4,050 | ||||||||||||
| Other current liabilities | $1,558 | $1,380 | ||||||||||||
Other current assets include loans receivable and supplier advances from companies with which we have an investment or partnership interest. As of December 31, 2021, other current assets include a $10.0 million convertible note which bears interest at 10% and is due in December 2022 from a privately held company. In the event the company goes public, this note will convert into common shares in the company ranking pari passu with existing common shares. As of December 31, 2020, two convertible notes were due from this company including $15.0 million of principal and $2.1 million accrued interest in other current assets and $10.0 million of principal and $0.2 million of accrued interest in other non-current assets. In 2021, we settled the $15.0 million convertible note in exchange for a fully paid-up technology license.
Remuneration of Managing Board and Supervisory Board
Disclosure of the total board remuneration is based on section 383 book 2 of the Dutch Civil Code. Furthermore, the Chief Executive Officer, Chief Financial Officer and the Supervisory Board meet the definition of key management personnel as defined in IAS 24 ‘Related Parties’. During 2020, our Chief Executive Officer joined our Chief Financial Officer on the Managing Board effective June 30, 2020. The total short-term employee benefits (fixed salary and short-term variable cash bonus), post-employment (defined contribution expenditure), and share-based payment cost (share-based compensation) in accordance with IAS 24 are reported in the tables below for the years ended December 31, 2021 and 2020.
Key management personnel compensation and total board remuneration
Remuneration of the Managing Board
The tables below state the amounts earned on an accrual basis by our key management personnel and Managing Board members in 2021 and 2020.
For the year ended December 31, 2021 (in thousands) | Thierry Bernard | Roland Sackers | ||||||||||||
| Fixed Salary | $900 | $606 | ||||||||||||
Other (1) | 40 | 96 | ||||||||||||
| Total fixed income 2021 | 940 | 702 | ||||||||||||
| Short-term variable cash bonus | 1,076 | 476 | ||||||||||||
| Total short-term income 2021 | 2,016 | 1,178 | ||||||||||||
| Defined contribution on benefit plan | 90 | 128 | ||||||||||||
| Total compensation (excluding long-term share-based compensation) | $2,106 | $1,306 | ||||||||||||
(1)Amounts include, among others, car lease and reimbursed personal expenses such as tax consulting. We also occasionally reimburse our Managing Directors' personal expenses related to attending out-of-town meetings but not directly related to their attendance. Amounts do not include the reimbursement of certain expenses relating to travel incurred at the request of QIAGEN, other reimbursements or payments that in total did not exceed $10,000, or tax amounts paid by the Company to tax authorities in order to avoid double-taxation under multi-tax jurisdiction employment agreements.
Consolidated Financial Statements 59
For the year ended December 31, 2020 (in thousands) | Thierry Bernard(2) | Roland Sackers | ||||||||||||||||||
| Fixed Salary | $900 | $571 | ||||||||||||||||||
Other (1) | 18 | 41 | ||||||||||||||||||
| Total fixed income 2020 | 918 | 612 | ||||||||||||||||||
| Short-term variable cash bonus | 1,492 | 366 | ||||||||||||||||||
| Total short-term income 2020 | 2,410 | 978 | ||||||||||||||||||
| Defined contribution on benefit plan | 90 | 77 | ||||||||||||||||||
| Total compensation (excluding long-term share-based compensation) | $2,500 | $1,055 | ||||||||||||||||||
(1)Amounts include, among others, car lease and reimbursed personal expenses such as tax consulting. We occasionally reimburse our Managing Directors' personal expenses related to attending out-of-town meetings but not directly related to their attendance. Amounts do not include the reimbursement of certain expenses relating to travel incurred at the request of QIAGEN, other reimbursements or payments that in total did not exceed $10,000 or tax amounts paid by the Company to tax authorities in order to avoid double-taxation under multi-tax jurisdiction employment agreements.
(2)Mr. Bernard became a member of the Managing Board on June 30, 2020. Remuneration amounts presented in the table are for the full year. For the six months of 2020 in which Mr. Bernard was a statutory director, his cash compensation amounted to $1.2 million consisting of $0.45 million of fixed salary, $43,000 of defined contribution to benefit plan, $9,000 other and $746,000 variable cash bonus. Recognized IFRS 2 compensation expense for the period July 1, 2020 to December 31, 2020 totaled $2.5 million, resulting in total remuneration as a statutory director of $3.7 million.
The total recognized compensation expense in accordance with IFRS 2 for share-based compensation in the year 2021 (2020) for long-term compensation of stock units amounted to $4.5 million ($3.9 million) for Mr. Bernard and $5.9 million ($6.5 million) for Mr. Sackers. The total compensation including share-based compensation expenses in the year 2021 (2020) was $13.8 million ($13.9 million), and amounts to $6.6 million ($6.4 million) for Mr. Bernard and $7.2 million ($7.5 million) for Mr. Sackers.
Remuneration of the Supervisory Board
The tables below state the amounts earned on an accrual basis by the members of the Supervisory Board in 2021 and 2020 (excluding long-term share-based compensation):
For the year ended December 31, 2021 (in thousands, except for number of share grants) | Fixed remuneration | Committee Chair | Committee membership | Total (1) | Number of restricted stock units granted | |||||||||||||||||||||||||||
| Lawrence A. Rosen | $150.0 | 32.6 | 17.2 | $199.8 | 7,482 | |||||||||||||||||||||||||||
| Dr. Metin Colpan | $57.5 | 18.0 | 11.0 | $86.5 | 7,482 | |||||||||||||||||||||||||||
Thomas Ebeling(2) | $47.9 | — | 5.5 | $53.4 | 7,482 | |||||||||||||||||||||||||||
| Dr. Toralf Haag | $57.5 | 10.4 | 8.8 | $76.7 | 7,482 | |||||||||||||||||||||||||||
| Dr. Ross L. Levine | $57.5 | — | 11.0 | $68.5 | 7,482 | |||||||||||||||||||||||||||
| Dr. Elaine Mardis | $57.5 | — | 22.0 | $79.5 | 7,482 | |||||||||||||||||||||||||||
| Elizabeth E. Tallett | $57.5 | 18.0 | 26.0 | $101.5 | 7,482 | |||||||||||||||||||||||||||
Stéphane Bancel(3) | $28.8 | — | 1.2 | $30.0 | 7,482 | |||||||||||||||||||||||||||
(1)Supervisory Board members are reimbursed for travel costs and for any value-added tax to be paid on their remuneration. These reimbursements are excluded from the amounts presented herein.
(2)Thomas Ebeling joined the Supervisory Board in February 2021.
(3)Stéphane Bancel did not stand for re-appointment at the Annual General Meeting on June 29, 2021, resulting in the end of his Supervisory Board term.
Consolidated Financial Statements 60
For the year ended December 31, 2020 (in thousands, except for number of share grants) | Fixed remuneration | Committee Chair | Committee membership | Total(1) | Number of restricted stock units granted | ||||||||||||||||||||||||||||||
| Lawrence A. Rosen | $88.3 | 29.0 | 5.5 | $122.8 | 9,426 | ||||||||||||||||||||||||||||||
| Dr. Metin Colpan | $57.5 | 12.0 | 6.0 | $75.5 | 9,426 | ||||||||||||||||||||||||||||||
| Dr. Ross L. Levine | $57.5 | — | 6.0 | $63.5 | 9,426 | ||||||||||||||||||||||||||||||
| Dr. Elaine Mardis | $57.5 | — | 9.7 | $67.2 | 9,426 | ||||||||||||||||||||||||||||||
| Elizabeth E. Tallett | $57.5 | 18.0 | 21.0 | $96.5 | 9,426 | ||||||||||||||||||||||||||||||
| Stéphane Bancel | $57.5 | — | 23.5 | $81.0 | 9,426 | ||||||||||||||||||||||||||||||
Dr. Håkan Björklund(2) | $100.0 | 8.0 | 7.3 | $115.3 | 9,426 | ||||||||||||||||||||||||||||||
(1)Supervisory Board members are reimbursed for travel costs and for any value-added tax to be paid on their remuneration. These reimbursements are excluded from the amounts presented herein.
(2)Dr. Håkan Björklund stepped down from his roles as Chair of the Supervisory Board, Member of the Compensation Committee and Selection and Appointment Committee effective August 21, 2020.
The total recognized share-based compensation expense in accordance with IFRS 2 in 2021 (2020) amounted to $1.8 million ($1.5 million) and includes $332.2 thousand ($310.9 thousand) for Mr. Rosen, $231.7 thousand ($285.2 thousand) for Mr. Colpan, $326.7 thousand ($273.4 thousand) for Mr. Levine, $332.2 thousand ($310.9 thousand) for Ms. Mardis, $231.7 thousand ($217.4 thousand) for Ms. Tallett, $217.6 thousand ($310.9 thousand) for Mr. Bancel, $72.7 thousand for Dr. Haag and $66.1 thousand for Mr. Ebeling. Dr. Haag and Mr. Ebeling joined the Supervisory Board in January and February 2021, respectively. In August 2020, Dr. Björklund stepped down from his role on the Supervisory Board. As a result, $209.2 thousand of share-based compensation expense was reversed related to grants forfeited in 2020.
The total recognized compensation expense, including share-based compensation, for members of the Supervisory Board in 2021 (2020) totaled $2.5 million ($2.1 million) and includes amounts of $532.0 thousand ($433.7 thousand) for Mr. Rosen, $318.2 thousand ($360.7 thousand) for Mr. Colpan, $395.2 thousand ($336.9 thousand) for Mr. Levine, $411.7 thousand ($378.1 thousand) for Ms. Mardis, $333.2 thousand ($313.9 thousand) for Ms. Tallett, $247.6 thousand ($391.9 thousand) for Mr. Bancel, $149.4 thousand for Dr. Haag and $119.5 thousand for Mr. Ebeling. As a result of the departure of Dr. Björklund and the reversal of share-based compensation expense due to forfeitures, a net reversal of $93.9 thousand was recorded for compensation in 2020.
25. Fair Value Measurements
Financial Instruments are measured at fair value according the following hierarchy which prioritizes the inputs used in measuring fair value as follows:
•Level 1. Observable inputs, such as quoted prices in active markets;
•Level 2. Inputs, other than the quoted price in active markets, that are observable either directly or indirectly; and
•Level 3. Unobservable inputs in which there is little or no market data, which require the reporting entity to develop its own assumptions.
Consolidated Financial Statements 61
The following table shows the carrying amounts and fair values of financial assets and financial liabilities, including their levels in the fair value hierarchy as of December 31, 2021. It does not include fair value information for financial assets and financial liabilities carried at amortized cost.
| Carrying amount | Fair value | |||||||||||||||||||||||||||||||||||||||||||||||||
| (in thousands) | FV hedging instrument | Amortized cost | Fair value through profit or loss | Total | Level 1 | Level 2 | Level 3 | Total | ||||||||||||||||||||||||||||||||||||||||||
| Cash and cash equivalents | $— | $879,884 | $— | $879,884 | $— | $— | $— | $— | ||||||||||||||||||||||||||||||||||||||||||
| Trade accounts receivable | — | 362,131 | — | 362,131 | — | — | — | — | ||||||||||||||||||||||||||||||||||||||||||
| Financial assets, current | — | 45,000 | 139,785 | 184,785 | — | 139,785 | — | 139,785 | ||||||||||||||||||||||||||||||||||||||||||
| Financial assets, non-current | — | — | 3,945 | 3,945 | — | — | 3,945 | 3,945 | ||||||||||||||||||||||||||||||||||||||||||
| Equity options | — | — | 352,571 | 352,571 | — | 352,571 | — | 352,571 | ||||||||||||||||||||||||||||||||||||||||||
| Foreign exchange forwards and options | — | — | 11,172 | 11,172 | — | 11,172 | — | 11,172 | ||||||||||||||||||||||||||||||||||||||||||
| Interest rate contracts | 1,971 | — | — | 1,971 | — | 1,971 | — | 1,971 | ||||||||||||||||||||||||||||||||||||||||||
| Assets | $1,971 | $1,287,015 | $507,473 | $1,796,459 | $— | $505,499 | $3,945 | $509,444 | ||||||||||||||||||||||||||||||||||||||||||
Lease liabilities(1) | $— | ($98,582) | $— | ($98,582) | $— | $— | $— | $— | ||||||||||||||||||||||||||||||||||||||||||
| Trade accounts payable | — | (101,224) | — | (101,224) | — | — | — | — | ||||||||||||||||||||||||||||||||||||||||||
| Foreign exchange forwards and options | — | — | (19,250) | (19,250) | — | (19,250) | — | (19,250) | ||||||||||||||||||||||||||||||||||||||||||
| Interest rate contracts | (628) | — | — | (628) | — | (628) | — | (628) | ||||||||||||||||||||||||||||||||||||||||||
| Equity options | — | — | (353,859) | (353,859) | — | (353,859) | — | (353,859) | ||||||||||||||||||||||||||||||||||||||||||
| Warrants and embedded conversion option | — | — | (347,869) | (347,869) | — | (347,869) | — | (347,869) | ||||||||||||||||||||||||||||||||||||||||||
| Contingent consideration | — | — | (24,100) | (24,100) | — | — | (24,100) | (24,100) | ||||||||||||||||||||||||||||||||||||||||||
| Liabilities | ($628) | ($199,806) | ($745,078) | ($945,512) | $— | ($721,606) | ($24,100) | ($745,706) | ||||||||||||||||||||||||||||||||||||||||||
(1)Separate disclosure of fair value of lease liabilities is not required.
Consolidated Financial Statements 62
The following table shows the carrying amounts and fair values of financial assets and financial liabilities, including their levels in the fair value hierarchy as of December 31, 2020. It does not include fair value information for financial assets and financial liabilities carried at amortized cost.
| Carrying amount | Fair value | |||||||||||||||||||||||||||||||||||||||||||||||||
| (in thousands) | FV hedging instrument | Amortized cost | Fair value through profit or loss | Total | Level 1 | Level 2 | Level 3 | Total | ||||||||||||||||||||||||||||||||||||||||||
| Cash and cash equivalents | $— | $597,003 | $— | $597,003 | $— | $— | $— | $— | ||||||||||||||||||||||||||||||||||||||||||
| Trade accounts receivable | — | 380,519 | — | 380,519 | — | — | — | — | ||||||||||||||||||||||||||||||||||||||||||
| Financial assets, current | — | — | 117,249 | 117,249 | 117,249 | — | — | 117,249 | ||||||||||||||||||||||||||||||||||||||||||
| Financial assets, non-current | — | — | 4,408 | 4,408 | 266 | — | 4,142 | 4,408 | ||||||||||||||||||||||||||||||||||||||||||
| Equity options | — | — | 376,453 | 376,453 | — | 376,453 | — | 376,453 | ||||||||||||||||||||||||||||||||||||||||||
| Foreign exchange forwards and options | — | — | 11,712 | 11,712 | — | 11,712 | — | 11,712 | ||||||||||||||||||||||||||||||||||||||||||
| Interest rate contracts | 5,042 | — | — | 5,042 | — | 5,042 | — | 5,042 | ||||||||||||||||||||||||||||||||||||||||||
| Assets | $5,042 | $977,522 | $509,822 | $1,492,386 | $117,515 | $393,207 | $4,142 | $514,864 | ||||||||||||||||||||||||||||||||||||||||||
Lease liabilities(1) | $— | ($109,035) | $— | ($109,035) | $— | $— | $— | $— | ||||||||||||||||||||||||||||||||||||||||||
| Trade accounts payable | — | (118,153) | — | (118,153) | — | — | — | — | ||||||||||||||||||||||||||||||||||||||||||
| Foreign exchange forwards and options | — | — | (45,498) | (45,498) | — | (45,498) | — | (45,498) | ||||||||||||||||||||||||||||||||||||||||||
| Interest rate contracts | (17,409) | — | — | (17,409) | — | (17,409) | — | (17,409) | ||||||||||||||||||||||||||||||||||||||||||
| Equity options | — | — | (382,012) | (382,012) | — | (382,012) | — | (382,012) | ||||||||||||||||||||||||||||||||||||||||||
| Warrants | — | — | (372,955) | (372,955) | — | (372,955) | — | (372,955) | ||||||||||||||||||||||||||||||||||||||||||
| Contingent consideration | — | — | (23,593) | (23,593) | — | — | (23,593) | (23,593) | ||||||||||||||||||||||||||||||||||||||||||
| Liabilities | ($17,409) | ($227,188) | ($824,058) | ($1,068,655) | — | ($817,874) | ($23,593) | ($841,467) | ||||||||||||||||||||||||||||||||||||||||||
Our assets and liabilities measured at fair value on a recurring basis consist of quoted equity securities discussed in Note 7 "Financial Assets", which are classified as Level 1, unquoted debt securities, which are classified in Level 2 of the fair value hierarchy, derivative contracts used to hedge currency and interest rate risk and derivative financial instruments entered into in connection with the Cash Convertible Notes discussed in Note 16 "Financial Debts", which are classified in Level 2 of the fair value hierarchy, contingent consideration accruals which are classified in Level 3 of the fair value hierarchy, and are shown in the tables below and unquoted equity securities remeasured during the year ended December 31, 2021 and 2020 are classified within Level 3 in the fair value hierarchy. There were no transfers between levels for the year ended December 31, 2021.
In determining fair value for Level 2 instruments, we apply a market approach, using quoted active market prices relevant to the particular instrument under valuation, giving consideration to the credit risk of both the respective counterparty to the contract and the Company. To determine our credit risk we estimated our credit rating by benchmarking the price of outstanding debt to publicly-available comparable data from rated companies. Using the estimated rating, our credit risk was quantified by reference to publicly-traded debt with a corresponding rating. The Level 2 derivative financial instruments include the Call Options asset, the Warrants liability and the embedded conversion option liability. See Note 16 "Financial Debts" and Note 26 "Financial Risk Factors and Use of Derivative Financial Instruments" for further information. The derivatives are not actively traded and are valued based on an option pricing model that uses observable market data for inputs. Significant market data inputs used to determine fair values included our common stock price, the risk-free interest rate, and the implied volatility of our common stock. The Call Options asset and the embedded cash conversion option liability were designed with the intent that changes in their fair values would substantially offset, with limited net impact to our earnings. Therefore, the sensitivity of changes in the unobservable inputs to the option pricing model for such instruments is substantially mitigated.
Consolidated Financial Statements 63
Our Level 3 instruments include unquoted equity security investments. for which we estimate the value based on valuation methods using the observable transaction price at the transaction date and other unobservable inputs. Under the measurement alternative, the carrying value is measured at cost, less any impairment, plus or minus changes resulting from observable price changes in orderly transactions for the identical or a similar investment of the same issuer. Adjustments are determined primarily based on a market approach as of the transaction date.
Our Level 3 instruments also include contingent consideration liabilities. We value contingent consideration liabilities using unobservable inputs, applying the income approach, such as the discounted cash flow technique, or the probability-weighted scenario method. Contingent consideration arrangements obligate us to pay the sellers of an acquired entity if specified future events occur or conditions are met such as the achievement of technological or revenue milestones. We use various key assumptions, such as the probability of achievement of the milestones (0% to 100%) and the discount rate (between 6.5% and 6.9%), to represent the non-performing risk factors and time value when applying the income approach. We regularly review the fair value of the contingent consideration, and reflect any change in the accrual in the consolidated statements of income in the line items commensurate with the underlying nature of milestone arrangements. If minor changes were made in the key assumptions on which these valuations are based, there would be no material effect on the fair value of contingent consideration on the statement of financial position or the corresponding effect in the consolidated income statement for the years ended December 31, 2021 and 2020. The maximum amount of contingent consideration relating to business combinations is disclosed in Note 20 "Commitments and Contingencies".
Refer to Note 7 "Financial Assets" for the change in unquoted equity securities with Level 3 inputs during the year ended December 31, 2021 and 2020. For contingent consideration liabilities with Level 3 inputs, the following table summarizes the activity as of December 31, 2021 and 2020:
| (in thousands) | 2021 | 2020 | ||||||||||||
| Balance at beginning of year | ($23,593) | ($162,160) | ||||||||||||
| Additions from acquisitions | (507) | (3,223) | ||||||||||||
| Payments | — | 141,790 | ||||||||||||
| Balance at end of year | ($24,100) | ($23,593) | ||||||||||||
As of December 31, 2021, we had $24.1 million accrued for contingent consideration which is included in other current liabilities in the accompanying consolidated balance sheet. During 2021, the $0.5 million of additions is related to the time value increases of existing contingent consideration liabilities related to the 2018 acquisition of STAT-Dx. During 2020, the payments of $141.8 million and time value increases of $3.2 million both related to the STAT-Dx acquisition as well as the 2019 asset acquisition of Formulatrix.
The estimated fair value of non-current financial debts as disclosed in Note 16 "Financial Debts" was based on current interest rates for similar types of borrowings. The estimated fair values may not represent actual values of the financial instruments that could be realized as of the balance sheet date or that will be realized in the future.
The fair values of the financial instruments are presented in Note 16 "Financial Debts" and were determined as follows:
Cash Convertible Notes and Convertible Notes: Fair value is based on an estimation using available over-the-counter market information on the Cash Convertible Notes due in 2023 and 2024 as well as the Convertible Notes due in 2027.
U.S. Private Placement: Fair value of the outstanding bonds is based on an estimation using the changes in the U.S. Treasury rates.
German Private Placement: Fair value is based on an estimation using changes in the euro swap rates.
There were no adjustments in the twelve-month periods ended December 31, 2021 and 2020 for nonfinancial assets or liabilities required to be measured at fair value on a nonrecurring basis.
Consolidated Financial Statements 64
26. Financial Risk Factors and Use of Derivative Financial Instruments
26.1. Financial Risks
Market risk
Our market risk relates primarily to interest rate exposures on cash, short-term investments and borrowings and foreign currency exposures. Financial risk is centrally managed and is regulated by internal guidelines which require a continuous internal risk analysis. The overall objective of our risk management is to reduce the potential negative earnings effects from changes in interest and foreign exchange rates. Exposures are managed through operational methods and financial instruments relating to interest rate and foreign exchange risks. In the ordinary course of business, we use derivative instruments, including swaps, forwards and/or options, to manage potential losses from foreign currency exposures and interest rates. The principal objective of such derivative instruments is to minimize the risks and/or costs associated with global financial and operating activities. We do not utilize derivative or other financial instruments for trading or other speculative purposes. All derivatives are recognized as either assets or liabilities in the balance sheet and are measured at fair value with any change in fair value recognized in earnings in the period of change, unless the derivative qualifies as an effective hedge that offsets certain exposures. In determining fair value, we consider both the counterparty credit risk and our own creditworthiness, to the extent that the derivatives are not covered by collateral agreements with respective counterparties.
Foreign currency exchange rates
As a global enterprise, we are subject to risks associated with fluctuations in foreign currencies with regard to our ordinary operations. This includes foreign currency-denominated receivables, payables, debt, and other balance sheet positions as well as future cash flows resulting from anticipated transactions including intra-group transactions. We manage our balance sheet exposure on a group-wide basis primarily using foreign exchange forward contracts, options and cross-currency swaps.
A significant portion of our revenues and expenses are earned and incurred in currencies other than the U.S. dollar. The euro is the most significant such currency, with others including the British pound, Japanese yen, Chinese renminbi, Turkish lira, Brazilian real, Indian rupee, Swiss franc, and Canadian and Australian dollars. Fluctuations in the value of the currencies in which we conduct our business relative to the U.S. dollar have caused and will continue to cause U.S. dollar translations of such currencies to vary from one period to another. Due to the number of currencies involved, the constantly changing currency exposures, and the potential substantial volatility of currency exchange rates, we cannot predict the effect of exchange rate fluctuations upon future operating results. In general terms, depreciation of the U.S. dollar against our other foreign currencies will increase reported net sales. However, this effect is, at least partially, offset by the fact that we also incur substantial expenses in foreign currencies.
We have significant production and manufacturing facilities located in Germany and intercompany sales of inventory also expose us to foreign currency exchange rate risk. Intercompany sales of inventory are generally denominated in the local currency of the subsidiary purchasing the inventory in order to centralize foreign currency risk with the manufacturing subsidiary. We use an in-house bank approach to net and settle intercompany payables and receivables as well as intercompany foreign exchange swaps and forward contracts in order to centralize the foreign exchange rate risk to the extent possible. We have entered in the past and may enter in the future into foreign exchange derivatives including forwards, swaps and options to manage the remaining foreign exchange exposure.
For the presentation of market risks, IFRS 7 requires sensitivity analyses that show the effects of hypothetical changes of relevant risk variables on profit or loss and shareholders' equity. Currency risks as defined by IFRS 7 arise on account of financial instruments being denominated in a currency that is not the functional currency and being of a monetary nature; differences resulting from the translation of financial statements into the Company's presentation currency are not taken into consideration. Relevant risk variables are generally all non-functional currencies in which QIAGEN has financial instruments.
QIAGEN is exposed to currency risks from financial derivatives. If each of the respective currency pairs for which the Company has financial derivatives in place, which do not qualify for hedge accounting in accordance with IFRS 9, varied from the rates used for the preparation of the consolidated financial statements, this would have had an effect on the net income of the Company. Any effect would have been almost fully off-set by corresponding valuation
Consolidated Financial Statements 65
adjustments in the positions, which economically had been hedged by these financial derivatives. Accordingly, the net effect of such variance in currency rates would not have been material.
If, at December 31, 2021, the U.S. dollar had gained or lost 10% against all identified major currencies, the estimated effect on the fair value of the financial derivatives would have been as follows:
| As of December 31, 2021 | As of December 31, 2020 | |||||||||||||||||||||||||
| (in thousands) | 10% higher | 10% lower | 10% higher | 10% lower | ||||||||||||||||||||||
| Currency | ||||||||||||||||||||||||||
| Euro (EUR) | $17,590 | ($17,590) | $26,438 | ($26,438) | ||||||||||||||||||||||
| Australian Dollar (AUD) | 435 | (435) | 463 | (463) | ||||||||||||||||||||||
| Swedish Krona (SEK) | 563 | (688) | (167) | 204 | ||||||||||||||||||||||
| Japanese Yen (JPY) | 79 | (97) | 31 | (38) | ||||||||||||||||||||||
| Canadian Dollar (CAD) | (572) | 699 | (393) | 480 | ||||||||||||||||||||||
| Singapore Dollar (SGD) | (603) | 737 | (860) | 1,051 | ||||||||||||||||||||||
| Swiss Franc (CHF) | 47,016 | (57,603) | 49,447 | (60,440) | ||||||||||||||||||||||
| Pound Sterling (GBP) | (4,178) | 4,178 | (116) | 409 | ||||||||||||||||||||||
| Turkish Lira (TRY) | 1,095 | (1,359) | 1,841 | (3,258) | ||||||||||||||||||||||
| South Korean Won (KRW) | 222 | (271) | 418 | (510) | ||||||||||||||||||||||
| Chinese Yuan (CNY) | 241 | (294) | (207) | 252 | ||||||||||||||||||||||
| Norwegian Krone (NOK) | 257 | (314) | 330 | (404) | ||||||||||||||||||||||
| Polish Zloty (PLN) | 177 | (217) | 147 | (179) | ||||||||||||||||||||||
| Thai Baht (THB) | 1,465 | (725) | — | — | ||||||||||||||||||||||
| Mexican Peso (MXN) | (415) | 506 | — | — | ||||||||||||||||||||||
| Total | $63,372 | ($73,473) | $77,372 | ($89,334) | ||||||||||||||||||||||
Interest rates
The Company is exposed to interest rate risk by floating rate financial debt and floating rate financial assets. This exposure is managed by varying the proportion of fixed and floating rate debt, while all non-derivative financial assets pay interest on floating rates. Net financial income earned on the Company's net financial assets is generally affected by changes in the level of interest rates, principally the Euro and the U.S. dollar interest rate.
At December 31, 2021, we had $879.9 million in cash and cash equivalents (2020: $597.0 million). Interest income earned on our cash investments is affected by changes in the relative levels of market interest rates. We only invest in high-grade investment instruments. A hypothetical adverse 10% movement in market interest rates would not have materially impact our financial statements.
Borrowings against lines of credit are at variable interest rates. We had no amounts outstanding against our lines of credit at December 31, 2021 and 2020. A hypothetical adverse 10% movement in market interest rates would not have materially impacted our financial statements.
At December 31, 2021, we had $1.9 billion in current and non-current financial debt (2020: $1.9 billion). A hypothetical adverse 10% movement in market interest rates would not have materially impacted our financial statements.
Liquidity risk
To date, we have funded our business primarily through internally generated funds, debt and the private and public sales of equity. Our primary use of cash has been to support continuing operations and our investing activities including capital expenditure requirements and acquisitions. As of December 31, 2021 and 2020, we had cash and cash equivalents of $879.9 million and $597.0 million, respectively. We also had current financial assets of $184.8 million and
Consolidated Financial Statements 66
$117.2 million, respectively. Cash and cash equivalents are primarily held in Euros and U.S. dollars, other than those cash balances maintained in the local currency of subsidiaries to meet local working capital needs. As of December 31, 2021 and 2020, we had working capital of $447.3 million and $1.03 billion, respectively.
We have a €400.0 million syndicated ESG-linked revolving credit facility expiring with a contractual life until December 2024 of which no amounts were utilized at December 31, 2021. We have additional credit lines totaling €27.0 million with no expiration date, none of which were utilized as of December 31, 2021. We also have repayment obligations of $1.9 billion of financial debt (2020: $1.9 billion), of which $845.7 million is current as of December 31, 2021.
As of December 31, 2021, our future contractual cash obligations are as follows:
| Contractual Obligations (in thousands) | Payments Due by Period | |||||||||||||||||||||||||||||||||||||||||||
| Total | 2022 | 2023 | 2024 | 2025 | 2026 | Thereafter | ||||||||||||||||||||||||||||||||||||||
Financial debt (1) | $1,920,378 | $489,749 | $383,902 | $586,872 | $264 | $264 | $459,327 | |||||||||||||||||||||||||||||||||||||
| Purchase obligations | 139,327 | 115,180 | 14,897 | 9,250 | — | — | — | |||||||||||||||||||||||||||||||||||||
| Lease obligations | 117,001 | 25,353 | 20,993 | 16,280 | 10,790 | 6,707 | 36,878 | |||||||||||||||||||||||||||||||||||||
| License and royalty payments | 17,797 | 6,701 | 3,941 | 1,994 | 1,483 | 793 | 2,885 | |||||||||||||||||||||||||||||||||||||
| Total contractual cash obligations | $2,194,503 | $636,983 | $423,733 | $614,396 | $12,537 | $7,764 | $499,090 | |||||||||||||||||||||||||||||||||||||
(1)Amounts include required principal, stated at current carrying values, and interest payments.
Pursuant to the purchase agreements for certain acquisitions we could be required to make additional contingent cash payments, based on the achievement of certain revenue and operating results milestones, totaling up to $26.6 million in 2022 of which $24.1 million is included in other current liabilities in the accompanying consolidated balance sheet as of December 31, 2021.
We believe that funds from operations, existing cash and cash equivalents, together with the proceeds from our public and private sales of equity, and availability of financing facilities, will be sufficient to fund our planned operations and expansion during the coming year. However, any global economic downturn may have a greater impact on our business than currently expected, and we may experience a decrease in the sales of our products, which could impact our ability to generate cash. If our future cash flows from operations and other capital resources are not adequate to fund our liquidity needs, we may be required to obtain additional debt or equity financing or to reduce or delay our capital expenditures, acquisitions or research and development projects. If we could not obtain financing on a timely basis or at satisfactory terms, or implement timely reductions in our expenditures, our business could be adversely affected.
Credit risk
Financial instruments that potentially subject us to concentrations of credit risk are cash and cash equivalents, financial assets, and accounts receivable. We attempt to minimize the risks related to cash and cash equivalents and financial assets by dealing with highly-rated financial institutions and investing in a broad and diverse range of financial instruments. We have established guidelines related to credit quality and maturities of investments intended to maintain safety and liquidity. Concentration of credit risk with respect to accounts receivable is limited due to a large and diverse customer base, which is dispersed over different geographic areas. Allowances are maintained for potential credit losses and such losses have historically been within expected ranges. There were no significant concentrations of credit risk during the reporting period. The maximum exposure to credit risk is represented by the carrying amount of each financial asset in the statement of financial position.
Credit risk is managed on a Company basis, except for credit risk relating to accounts receivable balances. Each local entity is responsible for managing and analyzing the credit risk for each of their new clients before standard payment and delivery terms and conditions are offered.
Consolidated Financial Statements 67
Counterparty risk
The financial instruments used in managing our foreign currency, equity and interest rate exposures have an element of risk in that the counterparties may be unable to meet the terms of the agreements. To the extent that derivatives are not subject to mutual collateralization agreements, we attempt to minimize this risk by limiting the counterparties to a diverse group of highly-rated international financial institutions. The carrying values of our financial instruments incorporate the non-performance risk by using market pricing for credit risk. However, we have no reason to believe that any counterparties will default on their obligations and therefore do not expect to record any losses as a result of counterparty default. In order to minimize our exposure with any single counterparty, we have entered into all derivative agreements, with the exception of the Call Spread Overlay, under master agreement which allow us to manage the exposure with the respective counterparty on a net basis. Most of these master agreements, include bilateral collateral agreements.
Fair values
The fair values of financial assets and financial liabilities are determined in accordance with the accounting policies stated under Notes 3.12 "Financial Instruments" and 3.13 "Financial Instruments - Classification and Subsequent Measurement".
Equity prices
The Warrants issued as part of the Call Spread Overlay discussed in Note 16 "Financial Debts" and Note 26.2 "Use of Derivative Financial Instruments" expose us to income statement volatility due to changes in our own equity price. Changes in the fair value of the Warrants are recognized in other financial results. Assuming a hypothetical 10% increase or decrease in equity prices at December 31, 2021, the estimated effect would have been approximately $101.5 million loss or $91.4 million gain, respectively (2020: $73.7 million loss or $67.9 million gain).
Commodities
The Company has exposures to price risk related to anticipated purchases of certain commodities used as raw materials in its business. A change in commodity prices may alter the gross margin, but due to the limited exposure to any single raw material, a price change is unlikely to have a material unforeseen impact on the Company's earnings.
26.2 Use of Derivative Financial Instruments
Derivatives and Hedging
Objective and Strategy
In the ordinary course of business, we use derivative instruments, including swaps, forwards and/or options, to manage potential losses from foreign currency exposures and interest bearing assets or liabilities. The principal objective of such derivative instruments is to minimize the risks and/or costs associated with our global financial and operating activities. We do not utilize derivative or other financial instruments for trading or other speculative purposes. We recognize all derivatives as either assets or liabilities on the balance sheet on a gross basis, measure those instruments at fair value and recognize the change in fair value in earnings in the period of change, unless the derivative qualifies as an effective hedge that offsets certain exposures. We have agreed with almost all of our counterparties with whom we had entered into cross-currency swaps, interest rate swaps or foreign exchange contracts, to enter into bilateral collateralization contracts under which we will receive or provide cash collateral, as the case may be, for the net position with each of these counterparties. As of December 31, 2021, cash collateral positions consisted of $9.2 million recorded in other current liabilities and $11.2 million recorded in other current assets. As of December 31, 2020, we had cash collateral positions consisting of $0.6 million recorded in other current liabilities and $56.1 million recorded in other current assets in the accompanying consolidated balance sheets.
Non-Derivative Hedging Instrument
Net Investment Hedge
We are party to a foreign currency non-derivative hedging instrument that is designated and qualifies as net investment hedge. The objective of the hedge is to protect part of the net investment in foreign operations against adverse changes in the exchange rate between the Euro and the functional currency of the U.S.
Consolidated Financial Statements 68
dollar. The non-derivative hedging instrument is the German private corporate bond (Schuldschein) which was issued in the total amount of $331.1 million as described in Note 16 "Financial Debts". Of the $331.1 million, which is held in both U.S. dollars and Euro, €255.0 million is designated as the hedging instrument against a portion of our Euro net investments in our foreign operations. As further discussed in Note 16, two tranches of the Schuldschein matured and were paid during 2021 and as a result, €220.5 million remained designated as a hedging instrument as of December 31, 2021. The relative changes in both the hedged item and hedging instrument are calculated by applying the change in spot rate between two assessment dates against the respective notional amount. The effective portion of the hedge is recorded in the cumulative translation adjustment account within other accumulated comprehensive income (loss). Based on the spot rate method, the unrealized loss recorded in equity as of December 31, 2021 and 2020 is $2.1 million and $26.9 million, respectively. Since we are using the debt as the hedging instrument, which is also remeasured based on the spot rate method, there is no hedge ineffectiveness related to the net investment hedge as of December 31, 2021 and 2020.
Derivatives Designated as Hedging Instruments
Cash Flow Hedges
As of December 31, 2021 and 2020, we held derivative instruments that are designated and qualify as cash flow hedges where the effective portion of the gain or loss on the derivative is reported as a component of other comprehensive income (loss) and reclassified into earnings in the same period or periods during which the hedged transaction affects earnings. Gains and losses on the derivative representing either hedge ineffectiveness or hedge components excluded from the assessment of effectiveness are recognized in current earnings. In 2021 and in 2020, we did not record any hedge ineffectiveness related to any cash-flow hedges in earnings. Based on their valuation as of December 31, 2021, we expect approximately $3.4 million of derivative losses included in accumulated other comprehensive loss will be reclassified into income during the next 12 months. The cash flows derived from derivatives are classified in the consolidated statements of cash flows in the same category as the consolidated balance sheet account of the underlying item.
We use interest rate derivative contracts to align our portfolio of interest bearing assets and liabilities with our risk management objectives. We are party to five cross currency interest rate swaps through 2025 for a total notional amount of €180.0 million which qualify for hedge accounting as cash flow hedges. We determined that no ineffectiveness exists related to these swaps. As of December 31, 2021 and 2020, interest receivables of $1.4 million and $1.1 million, respectively are recorded in other current assets in the accompanying consolidated balance sheets.
Fair Value Hedges
As of December 31, 2021 and 2020, we held derivative instruments that qualify for hedge accounting as fair value hedges. For derivative instruments that are designated and qualify as a fair value hedge, the effective portion of the gain or loss on the derivative is reflected in earnings. This earnings effect is offset by the change in the fair value of the hedged item attributable to the risk being hedged that is also recorded in earnings. In 2021 and 2020, we concluded there was no ineffectiveness. The cash flows derived from derivatives are classified in the consolidated statements of cash flows in the same category as the consolidated balance sheet account of the underlying item.
We hold interest rate swaps which effectively fixed the fair value of a portion of our fixed rate private placement debt and qualify for hedge accounting as fair value hedges. We determined that no ineffectiveness exists related to these swaps. As of both December 31, 2021 and 2020, interest receivables of $0.6 million are recorded in other current assets in the accompanying consolidated balance sheets.
Derivatives Not Designated as Hedging Instruments
Call Options and Warrants
We entered into Call Options which, along with the sale of the Warrants, represent the Call Spread Overlay entered into in connection with the Cash Convertible Notes. In these transactions, the Call Options are intended to address the equity price risk inherent in the cash conversion feature of each instrument by offsetting cash payments in excess of the principal amount due upon any conversion of the Cash Convertible Notes.
Aside from the initial payment of premiums for the Call Options, we will not be required to make any cash payments under the Call Options. We will, however, be entitled to receive under the terms of the Call Options, an amount of cash generally equal to the amount by which the market price per share of our common
Consolidated Financial Statements 69
stock exceeds the exercise price of the Call Options during the relevant valuation period. The exercise price under the Call Options is equal to the conversion price of the Cash Convertible Notes.
The Call Options and Warrants, for which our common stock is the underlying security, are derivative assets and liabilities, respectively, that require mark-to-market accounting treatment. The derivatives are measured and reported at fair value on a recurring basis, within Level 2 of the fair value hierarchy. The change in fair value of these instruments is recognized immediately in our consolidated statements of income in other financial results.
The Warrants are more fully described in Note 16 "Financial Debts".
Cash Convertible Notes Embedded Cash Conversion Option
The embedded cash conversion option within the Cash Convertible Notes discussed in Note 16 "Financial Debts" is required to be separated from the Cash Convertible Notes and accounted for separately as a derivative liability, with changes in fair value reported in our consolidated statements of income in other financial results until the cash conversion option settles or expires. The embedded cash conversion option is measured and reported at fair value on a recurring basis, within Level 2 of the fair value hierarchy.
Because the terms of the Cash Convertible Notes' embedded cash conversion option are substantially similar to those of the Call Options, discussed above, we expect the effect on earnings from these two derivative instruments to mostly offset each other.
Embedded Conversion Option
During 2017, we purchased a convertible note for $3.0 million from a publicly listed company considered a related party. The embedded conversion option within the convertible note was required to be separated from the convertible note and accounted for separately as derivative liability, with changes in fair value reported in our consolidated statements of income in other financial results. The embedded cash conversion option was measured and reported at fair value on a recurring basis, within Level 2 of the fair value hierarchy. During 2020, $3.2 million was collected including the principal including accrued interest. For further discussion of the inputs used to determine the fair value of the embedded cash conversion option, refer to Note 25 "Fair Value Measurements".
Foreign Currency Derivatives
As a globally active enterprise, we are subject to risks associated with fluctuations in foreign currencies in our ordinary operations. This includes foreign currency-denominated receivables, payables, debt, and other balance sheet positions including intercompany items. We manage balance sheet exposure on a group-wide basis using foreign exchange forward contracts, foreign exchange options and cross-currency swaps.
We are party to various foreign exchange forward, option and swap arrangements which had, at both December 31, 2021 and 2020, aggregate notional values of $1.3 billion, which expire at various dates through December 2022. The transactions have been entered into to offset the effects from short-term balance sheet exposure to foreign currency exchange risk. Changes in the fair value of these arrangements have been recognized in other financial results.
Consolidated Financial Statements 70
Fair Values of Derivative Instruments
The following table summarizes the fair value amounts of derivative instruments reported in the consolidated balance sheets as of December 31, 2021 and 2020:
| 2021 | 2020 | |||||||||||||||||||||||||
| (in thousands) | Current Asset | Non-current Asset | Current Asset | Non-current Asset | ||||||||||||||||||||||
| Assets: | ||||||||||||||||||||||||||
| Derivative instruments designated as hedges | ||||||||||||||||||||||||||
Interest rate contracts - fair value hedge (1) | $1,971 | $— | $— | $5,042 | ||||||||||||||||||||||
| Total derivative instruments designated as hedges | $1,971 | $— | $— | $5,042 | ||||||||||||||||||||||
| Undesignated derivative instruments | ||||||||||||||||||||||||||
| Equity options | $162,141 | $190,430 | $2,415 | $374,038 | ||||||||||||||||||||||
| Foreign exchange forwards and options | 11,172 | — | 11,712 | — | ||||||||||||||||||||||
| Total undesignated derivative instruments | $173,313 | $190,430 | $14,127 | $374,038 | ||||||||||||||||||||||
| Total derivative assets | $175,284 | $190,430 | $14,127 | $379,080 | ||||||||||||||||||||||
| 2021 | 2020 | |||||||||||||||||||||||||
| (in thousands) | Current Liability | Non-current Liability | Current Liability | Non-current Liability | ||||||||||||||||||||||
| Liabilities: | ||||||||||||||||||||||||||
| Derivative instruments designated as hedges | ||||||||||||||||||||||||||
Interest rate contracts - cash flow hedge (1) | $— | ($628) | $— | ($17,409) | ||||||||||||||||||||||
| Total derivative instruments designated as hedges | $— | ($628) | $— | ($17,409) | ||||||||||||||||||||||
| Undesignated derivative instruments | ||||||||||||||||||||||||||
| Equity options | ($162,608) | ($191,251) | ($5,966) | ($376,046) | ||||||||||||||||||||||
| Warrants and embedded conversion option | (110,346) | (237,523) | — | (372,955) | ||||||||||||||||||||||
| Foreign exchange forwards and options | (19,250) | — | (45,498) | — | ||||||||||||||||||||||
| Total undesignated derivative instruments | ($292,204) | ($428,774) | ($51,464) | ($749,001) | ||||||||||||||||||||||
| Total derivative liabilities | ($292,204) | ($429,402) | ($51,464) | ($766,410) | ||||||||||||||||||||||
(1)The fair value amounts for the interest rate contracts do not include accrued interest.
Consolidated Financial Statements 71
Gains and Losses on Derivative Instruments
The following table summarize the classification and gains and losses on derivative instruments for the years ended December 31, 2021 and 2020:
| 2021 | 2020 | |||||||||||||
| (in thousands) | Other financial results | Other financial results | ||||||||||||
| Total amounts presented in the Consolidated Statements of Income in which the effects of cash flow and fair value hedges are recorded | $62,353 | ($166,019) | ||||||||||||
| Gains (Losses) on Derivatives in Cash Flow Hedges | ||||||||||||||
| Interest rate contracts | ||||||||||||||
| Amount of (loss) gain reclassified from accumulated other comprehensive income | ($17,010) | $18,666 | ||||||||||||
| Amounts excluded from effectiveness testing | — | — | ||||||||||||
| Gains (Losses) on Derivatives in Fair Value Hedges | ||||||||||||||
| Interest rate contracts | ||||||||||||||
| Hedged item | 3,072 | (2,568) | ||||||||||||
| Derivatives designated as hedging instruments | (3,072) | 2,568 | ||||||||||||
| Gains (Losses) Derivatives Not Designated as Hedging Instruments | ||||||||||||||
| Equity options | (23,882) | 322,580 | ||||||||||||
| Cash convertible notes embedded cash conversion option | 28,154 | (321,213) | ||||||||||||
| Warrants and embedded conversion option | 25,348 | (293,865) | ||||||||||||
| Foreign exchange contracts | 10,333 | (12,429) | ||||||||||||
| Total gain (loss) | $22,943 | ($286,261) | ||||||||||||
Balance Sheet Line Items in which the Hedged Item is Included
The following table summarizes the balance sheet line items in which the hedged item is included as of December 31, 2021 and 2020:
| Carrying Amount of the Hedged Liabilities | ||||||||||||||||||||||||||
| (in thousands) | 2021 | 2020 | ||||||||||||||||||||||||
| Current financial debts | ($126,946) | $— | ||||||||||||||||||||||||
| Non-current financial debt | $— | ($126,881) | ||||||||||||||||||||||||
27. Capital Management
The primary objectives of the Group's capital management are to safeguard the Group's ability to continue as a going concern and to ensure financial flexibility to execute the Group's strategic growth targets. We regularly review our capital structure to ensure a low cost of capital to enhance shareholder value. The Group's overall strategy remains unchanged from 2020 and we are not subject to any externally imposed capital requirements. All common shares issued are fully paid.
Consolidated Financial Statements 72
In 2021, we repaid $41.1 million for two tranches of the German Private Placement bond (Schuldschein) that matured and the remaining $0.2 million of 2021 Notes was repaid at the original maturity on March 19, 2021. Both discussed further in Note 16 "Financial Debts".
In 2020, we issued zero coupon convertible notes in an aggregate principal amount of $500.0 million with a maturity date of December 17, 2027 (2027 Notes). The net proceeds of the 2027 Notes totaled $497.6 million, after debt issuance costs of $3.7 million. Also in 2020, we repaid $296.4 million of the 2021 Notes, leaving $0.2 million outstanding as of December 31, 2020. Both as discussed further in Note 16 "Financial Debts".
An important indicator of capital management efforts is the ratio of shareholders' equity compared to total assets as shown in the consolidated statement of financial position:
| (in thousands, except of ratio) | 2021 | 2020 | ||||||||||||
| Shareholders' equity attributable to equity holders of the parent | $2,858,892 | $2,483,049 | ||||||||||||
| Total assets | $6,208,790 | $5,928,287 | ||||||||||||
| Shareholders' equity ratio in % | 46% | 42% | ||||||||||||
Total financial debt consists of convertible notes, cash convertible notes and private placements as discussed in Note 16 "Financial Debts". The changes in financial debts reconciled to the cash flows arising from financing activities as follows:
Reconciliation of Liabilities Arising from Financing Activities
Total financial debt consists of cash convertible notes and private placements as discussed in Note 16. The changes in financial debts reconciled to the cash flows arising from financing activities as follows:
| (in thousands) | 12/30/2020 | Cash flows | Amortization of debt discount and issuance costs (1) | Foreign currency and other(2) | 12/31/2021 | |||||||||||||||||||||||||||||||||
| Cash convertible notes | $791,000 | ($200) | $30,852 | $— | $821,652 | |||||||||||||||||||||||||||||||||
| Convertible notes | 442,481 | — | 272 | — | 442,753 | |||||||||||||||||||||||||||||||||
| Private Placement | 326,675 | — | 164 | — | 326,839 | |||||||||||||||||||||||||||||||||
| German Private Placement (Schuldschein) | 357,551 | (41,145) | 130 | (22,032) | 294,504 | |||||||||||||||||||||||||||||||||
| Total non-current debt | 1,917,707 | (41,345) | 31,418 | (22,032) | 1,885,748 | |||||||||||||||||||||||||||||||||
| Lease liability | 109,035 | (29,458) | — | 19,005 | 98,582 | |||||||||||||||||||||||||||||||||
| Total liabilities from financing activities | $2,026,742 | ($70,803) | $31,418 | ($3,027) | $1,984,330 | |||||||||||||||||||||||||||||||||
(1)Total amortization of debt discount and issuance costs for the years ended December 31, 2021 totaled $32.0 million which included costs related to the €400.0 million syndicated multi-currency revolving credit facility expiring December 2024. No amounts were utilized at December 31, 2021.
(2)For the year ended December 31, 2021, the Convertible notes are net of debt issuance costs. Also during 2021, the German Private Placement experienced unrealized foreign currency losses totaling $24.7 million.
Consolidated Financial Statements 73
| (in thousands) | 12/31/2019 | Cash flows | Amortization of debt discount and issuance costs (1) | Embedded derivative | Foreign currency and other(2) | 12/31/2020 | ||||||||||||||||||||||||||||||||
| Cash convertible notes | $1,046,511 | ($296,400) | $40,889 | $— | $— | $791,000 | ||||||||||||||||||||||||||||||||
| Convertible notes | — | 497,646 | 282 | (54,051) | (1,396) | 442,481 | ||||||||||||||||||||||||||||||||
| Private Placement | 326,510 | — | 165 | — | — | 326,675 | ||||||||||||||||||||||||||||||||
| German Private Placement (Schuldschein) | 330,857 | — | 252 | — | 26,442 | 357,551 | ||||||||||||||||||||||||||||||||
| Total non-current debt | 1,703,878 | 201,246 | 41,588 | (54,051) | 25,046 | 1,917,707 | ||||||||||||||||||||||||||||||||
| Lease liability | 58,370 | (25,898) | — | — | 76,563 | 109,035 | ||||||||||||||||||||||||||||||||
| Total liabilities from financing activities | $1,762,248 | $175,348 | $41,588 | ($54,051) | $101,609 | $2,026,742 | ||||||||||||||||||||||||||||||||
(1)Total amortization of debt discount and issuance costs for the years ended December 31, 2020 totaled $42.3 million which included costs related to the €400.0 million syndicated multi-currency revolving credit facility expiring December 2023 as well as the credit facility in place prior to the facility expiring in December 2023. No amounts were utilized at December 31, 2020.
(2)For the year ended December 31, 2020, the Convertible notes are net of debt issuance costs, of which $1.4 million were unpaid. Also during 2020, the German Private Placement experienced unrealized foreign currency losses totaling $26.4 million.
28. Consolidated Companies
The following is a list of the Company's subsidiaries as of December 31, 2021, other than certain subsidiaries that did not in the aggregate constitute a significant subsidiary.
| Company Name | Jurisdiction of Incorporation | Ownership | Voting Rights | |||||||||||||||||
| Amnisure International LLC | USA | USA | 100 | % | 100 | % | ||||||||||||||
| Cellestis Pty. Ltd. | Turkey | Australia | 100 | % | 100 | % | ||||||||||||||
| Life Biotech Partners B.V. | Australia | Netherlands | 100 | % | 100 | % | ||||||||||||||
| NeuMoDx Inc. | Netherlands | USA | 100 | % | 100 | % | ||||||||||||||
| STAT-Dx Life S.L. | USA | Spain | 100 | % | 100 | % | ||||||||||||||
| QIAGEN Aarhus A/S | Spain | Denmark | 100 | % | 100 | % | ||||||||||||||
| QIAGEN AB | China | Sweden | 100 | % | 100 | % | ||||||||||||||
| QIAGEN AG | Denmark | Switzerland | 100 | % | 100 | % | ||||||||||||||
| QIAGEN Australia Holding Pty. Ltd. | Sweden | Australia | 100 | % | 100 | % | ||||||||||||||
| QIAGEN Benelux B.V. | Switzerland | Netherlands | 100 | % | 100 | % | ||||||||||||||
| QIAGEN Beverly LLC | Australia | USA | 100 | % | 100 | % | ||||||||||||||
| QIAGEN Business Management MEA Ltd. | Netherlands | UAE | 100 | % | 100 | % | ||||||||||||||
| QIAGEN Business Services (Manila), Inc. | USA | Philippines | 100 | % | 100 | % | ||||||||||||||
| QIAGEN Business Services S.p.z.o.o. | China | Poland | 100 | % | 100 | % | ||||||||||||||
| QIAGEN China (Shanghai) Co. Ltd. | Luxembourg | China | 100 | % | 100 | % | ||||||||||||||
| QIAGEN Luxembourg SARL | Germany | Luxembourg | 100 | % | 100 | % | ||||||||||||||
| QIAGEN Deutschland Holding GmbH | France | Germany | 100 | % | 100 | % | ||||||||||||||
| QIAGEN Distribution B.V. | USA | Netherlands | 100 | % | 100 | % | ||||||||||||||
| QIAGEN France S.A.S. | Germany | France | 100 | % | 100 | % | ||||||||||||||
Consolidated Financial Statements 74
| Company Name | Jurisdiction of Incorporation | Ownership | Voting Rights | |||||||||||||||||
| QIAGEN Gaithersburg LLC | Germany | USA | 100 | % | 100 | % | ||||||||||||||
| QIAGEN GmbH | Canada | Germany | 100 | % | 100 | % | ||||||||||||||
| QIAGEN Hamburg GmbH | Switzerland | Germany | 100 | % | 100 | % | ||||||||||||||
| QIAGEN Hong Kong Pte. Ltd. | Japan | China | 100 | % | 100 | % | ||||||||||||||
| QIAGEN Inc. | USA | Canada | 100 | % | 100 | % | ||||||||||||||
| QIAGEN Instruments AG | UK | Switzerland | 100 | % | 100 | % | ||||||||||||||
| QIAGEN K.K. | UK | Japan | 100 | % | 100 | % | ||||||||||||||
| QIAGEN Korea Ltd. | France | Korea (South) | 100 | % | 100 | % | ||||||||||||||
| QIAGEN LLC | USA | USA | 100 | % | 100 | % | ||||||||||||||
| QIAGEN Ltd. | Australia | UK | 100 | % | 100 | % | ||||||||||||||
| QIAGEN Manchester Ltd. | USA | UK | 100 | % | 100 | % | ||||||||||||||
| QIAGEN Marseille S.A. | USA | France | 100 | % | 100 | % | ||||||||||||||
| QIAGEN North American Holdings Inc. | Singapore | USA | 100 | % | 100 | % | ||||||||||||||
| QIAGEN Pty. Ltd. | Italy | Australia | 100 | % | 100 | % | ||||||||||||||
| QIAGEN Redwood City Inc. | UAE | USA | 100 | % | 100 | % | ||||||||||||||
| QIAGEN Sciences LLC | USA | USA | 100 | % | 100 | % | ||||||||||||||
| QIAGEN Shared Services LLC | USA | USA | 100 | % | 100 | % | ||||||||||||||
| QIAGEN Singapore Pte. Ltd. | Singapore | 100 | % | 100 | % | |||||||||||||||
| QIAGEN S.r.l. | Italy | 100 | % | 100 | % | |||||||||||||||
| QIAGEN U.S. Finance LLC | USA | 100 | % | 100 | % | |||||||||||||||
29. Fees Paid to External Auditors
At our 2021 Annual General Meeting of Shareholders on June 29, 2021, our shareholders appointed KPMG Accountants N.V. to serve as our external auditor for our statutory consolidated financial statements prepared in accordance with International Financial Reporting Standards as adopted by the EU for the year ended December 31, 2021. Set forth below are the total fees billed (or expected to be billed), on a consolidated basis, by the independent public accounting firm or their affiliates for providing audit and other professional services in each of the last two years:
| 2021 | 2020 | |||||||||||||||||||||||||
| (in thousands) | KPMG Network | KPMG Accountants N.V. | KPMG Network | KPMG Accountants N.V. | ||||||||||||||||||||||
| Audit fees | $2,971 | $373 | $2,883 | $291 | ||||||||||||||||||||||
| Audit related fees | — | — | 145 | — | ||||||||||||||||||||||
| Tax and all other fees | 300 | — | 16 | — | ||||||||||||||||||||||
| Service fees to external auditors | $3,271 | $373 | $3,044 | $291 | ||||||||||||||||||||||
Audit fees consist of fees and expenses billed for the annual audit and quarterly review of QIAGEN’s consolidated financial statements. They also include fees billed for other audit services, which are those services that only the statutory auditor can provide.
Consolidated Financial Statements 75
Audit-related fees consist of fees and expenses billed for assurance and related services that are related to the performance of the audit or review of QIAGEN’s financial statements and include consultations concerning financial accounting and reporting standards and review of the opening balance sheets of newly acquired companies.
Tax fees include fees and expenses billed for tax compliance services, including assistance on the preparation of tax returns and claims for refund; tax consultations, such as assistance and representation in connection with tax audits and appeals. All other fees include various fees and expenses billed for services, such as transaction due diligence, as approved by the Audit Committee.
30. Subsequent Events
Events that occurred after the balance sheet date that provide no information on the actual situation at the balance sheet date are not recognized in the financial statements. When those events are relevant for the economic decisions of users of the financial statements, the nature and the estimated financial effects of those events are disclosed in the financial statements.
In February 2022, Russian troops invaded Ukraine. Although the severity and duration of the ongoing military action are highly unpredictable, the conflict in Ukraine could materially disrupt our operations in Europe and/or increase their costs. Any disruptions caused by Russian military action or resulting sanctions may magnify the impact of other risks described in this Annual Report. Management considers the conflict and subsequent sanctions to be a non-adjusting event for the financial year ended December 31, 2021.
Consolidated Financial Statements 76
QIAGEN N.V.
Company Financial Statements
Company Financial Statements 77
QIAGEN N.V. Company Balance Sheets
(before profit appropriation)
| As of December 31, | ||||||||||||||||||||
| (in thousands) | Note | 2021 | 2020 | |||||||||||||||||
| Assets | ||||||||||||||||||||
| Fixed assets: | ||||||||||||||||||||
| Intangible fixed assets: | ||||||||||||||||||||
| Goodwill | (2) | $198,888 | $207,645 | |||||||||||||||||
| Other intangible assets | (2) | — | 1 | |||||||||||||||||
| Tangible fixed assets: | ||||||||||||||||||||
| Property, plant and equipment | (3) | 476 | 530 | |||||||||||||||||
| Other tangible fixed assets | (3) | 1,073 | 1,346 | |||||||||||||||||
| Financial fixed assets: | ||||||||||||||||||||
| Non-current financial assets | (4) | 656 | 656 | |||||||||||||||||
| Financial fixed assets | (4) | 5,344,330 | 4,462,178 | |||||||||||||||||
| Fair value of derivative financial instruments | (9) | 190,430 | 379,080 | |||||||||||||||||
| Other financial fixed assets | (4) | 1,722 | 1,323 | |||||||||||||||||
| Total fixed assets | 5,737,575 | 5,052,759 | ||||||||||||||||||
| Current assets: | ||||||||||||||||||||
| Trade and other receivables: | ||||||||||||||||||||
| Receivables from group companies | (5) | 217,098 | 494,377 | |||||||||||||||||
| Prepaid and other current assets | (5) | 22,014 | 82,820 | |||||||||||||||||
| Securities: | ||||||||||||||||||||
| Current financial assets | (4) | 184,785 | 1,469 | |||||||||||||||||
| Fair value of derivative financial instruments | (9) | 175,284 | 14,127 | |||||||||||||||||
| Cash and cash equivalents: | ||||||||||||||||||||
| Cash and cash equivalents | 746,676 | 464,035 | ||||||||||||||||||
| Total current assets | 1,345,857 | 1,056,828 | ||||||||||||||||||
| Total assets | $7,083,432 | $6,109,587 | ||||||||||||||||||
The accompanying notes are an integral part of these company financial statements.
Company Financial Statements 78
QIAGEN N.V. Company Balance Sheets
(before profit appropriation)
| As of December 31, | ||||||||||||||||||||
| (in thousands) | Note | 2021 | 2020 | |||||||||||||||||
| Liabilities and equity | ||||||||||||||||||||
| Shareholders' equity: | ||||||||||||||||||||
| Common shares | (6) | $2,731 | $2,634 | |||||||||||||||||
| Share premium | (7) | 1,877,704 | 1,840,115 | |||||||||||||||||
| Legal reserves | (7) | (285,118) | (206,860) | |||||||||||||||||
| Other reserves | (7) | (588) | (599) | |||||||||||||||||
| Treasury shares | (189,730) | (118,301) | ||||||||||||||||||
| Retained earnings | 916,839 | 892,420 | ||||||||||||||||||
| Net income for the period | 537,054 | 73,640 | ||||||||||||||||||
| Total shareholders' equity | 2,858,892 | 2,483,049 | ||||||||||||||||||
| Non-current liabilities: | ||||||||||||||||||||
| Non-current financial debts | (8) | 1,040,093 | 1,875,169 | |||||||||||||||||
| Fair value of derivative financial instruments | (9) | 429,402 | 766,410 | |||||||||||||||||
| Other non-current liabilities | 787 | 1,150 | ||||||||||||||||||
| Total non-current liabilities | 1,470,282 | 2,642,729 | ||||||||||||||||||
| Current liabilities: | ||||||||||||||||||||
| Current portion of non-current financial debts | (8) | 845,655 | 42,539 | |||||||||||||||||
| Accounts payable trade | 996 | 411 | ||||||||||||||||||
| Payables to group companies | 1,572,316 | 851,900 | ||||||||||||||||||
| Fair value of derivative financial instruments | (9) | 292,204 | 51,464 | |||||||||||||||||
| Accrued liabilities | 43,087 | 37,495 | ||||||||||||||||||
| Total current liabilities | 2,754,258 | 983,809 | ||||||||||||||||||
| Total liabilities and shareholders' equity | $7,083,432 | $6,109,587 | ||||||||||||||||||
The accompanying notes are an integral part of these company financial statements.
Company Financial Statements 79
QIAGEN N.V. Company Income Statements
| Years ended December 31, | ||||||||||||||||||||
| (in thousands) | Note | 2021 | 2020 | |||||||||||||||||
| Other income | $53 | $29 | ||||||||||||||||||
| Operating expenses: | ||||||||||||||||||||
| Sales and marketing expense | (535) | (340) | ||||||||||||||||||
| General and administrative | (5) | (49,362) | 33,864 | |||||||||||||||||
| Restructuring, acquisition, integration and other | (1,846) | (126,534) | ||||||||||||||||||
| Other operating expense | (141) | (68) | ||||||||||||||||||
| Total operating expenses, net | (51,884) | (93,078) | ||||||||||||||||||
| Loss from operations | (51,831) | (93,049) | ||||||||||||||||||
| Financial income | 86,506 | 68,336 | ||||||||||||||||||
| Financial expense | (8) | (53,228) | (67,023) | |||||||||||||||||
| Other financial results | (9) | 19,968 | (287,080) | |||||||||||||||||
| Total finance income (expense), net | 53,246 | (285,767) | ||||||||||||||||||
| Income (loss) before income taxes | 1,415 | (378,816) | ||||||||||||||||||
| Income taxes | (10) | — | 1,821 | |||||||||||||||||
| Income (loss) after income tax | 1,415 | (376,995) | ||||||||||||||||||
| Share in results from participating interests, after tax | 535,639 | 450,635 | ||||||||||||||||||
| Net income for the period | $537,054 | $73,640 | ||||||||||||||||||
The accompanying notes are an integral part of these company financial statements.
Company Financial Statements 80
QIAGEN N.V. Company Statements of Changes in Equity
| Common shares | Share premium | Retained earnings | Net Result | Legal reserves | Other reserves | Treasury shares | Total shareholders' equity | |||||||||||||||||||||||||||||||||||||||||||||||||||||||||||||
| (in thousands) | Note | Shares | Amount | Shares | Amount | |||||||||||||||||||||||||||||||||||||||||||||||||||||||||||||||
| Balance at January 1, 2020 | 230,829 | $2,584 | $1,790,504 | $991,032 | ($69,770) | ($277,976) | ($561) | (3,077) | ($111,966) | $2,323,847 | ||||||||||||||||||||||||||||||||||||||||||||||||||||||||||
| Appropriation of prior year net loss | — | — | — | (69,770) | 69,770 | — | — | — | — | — | ||||||||||||||||||||||||||||||||||||||||||||||||||||||||||
| Net income for period | — | — | — | — | 73,640 | — | — | — | — | 73,640 | ||||||||||||||||||||||||||||||||||||||||||||||||||||||||||
| Effect from capitalized development costs | (11) | — | — | — | (5,099) | — | 5,099 | — | — | — | — | |||||||||||||||||||||||||||||||||||||||||||||||||||||||||
| Effect from foreign currency translation | (11) | — | 50 | — | (50) | — | 86,996 | — | — | — | 86,996 | |||||||||||||||||||||||||||||||||||||||||||||||||||||||||
| Effect from derivative hedges | (11) | — | — | — | — | — | (20,979) | — | — | — | (20,979) | |||||||||||||||||||||||||||||||||||||||||||||||||||||||||
| Effect from pension reserve | (11) | — | — | — | — | — | — | (38) | — | — | (38) | |||||||||||||||||||||||||||||||||||||||||||||||||||||||||
| Purchase of treasury shares | — | — | — | — | — | — | — | (1,346) | (63,995) | (63,995) | ||||||||||||||||||||||||||||||||||||||||||||||||||||||||||
| Tax benefit of employee stock plans | — | — | 8,675 | — | — | — | — | — | — | 8,675 | ||||||||||||||||||||||||||||||||||||||||||||||||||||||||||
| Issuance of common shares in connection with early conversion of 2021 Notes | — | — | — | 8,725 | — | — | — | 807 | 30,272 | 38,997 | ||||||||||||||||||||||||||||||||||||||||||||||||||||||||||
| Stock awards and options | — | — | 40,936 | (32,418) | — | — | — | 1,085 | 40,079 | 48,597 | ||||||||||||||||||||||||||||||||||||||||||||||||||||||||||
| Tax withholding related to vesting of stock awards | — | — | — | — | — | — | — | (313) | (12,691) | (12,691) | ||||||||||||||||||||||||||||||||||||||||||||||||||||||||||
| Balance at December 31, 2020 | 230,829 | $2,634 | $1,840,115 | $892,420 | $73,640 | ($206,860) | ($599) | (2,844) | ($118,301) | $2,483,049 | ||||||||||||||||||||||||||||||||||||||||||||||||||||||||||
| Common shares | Share premium | Retained earnings | Net Result | Legal reserves | Other reserves | Treasury shares | Total shareholders' equity | |||||||||||||||||||||||||||||||||||||||||||||||||||||||||||||
| Note | Shares | Amount | Shares | Amount | ||||||||||||||||||||||||||||||||||||||||||||||||||||||||||||||||
| Balance at January 1, 2021 | 230,829 | $2,634 | $1,840,115 | $892,420 | $73,640 | ($206,860) | ($599) | (2,844) | ($118,301) | $2,483,049 | ||||||||||||||||||||||||||||||||||||||||||||||||||||||||||
| Appropriation of prior year net income | — | — | — | 73,640 | (73,640) | — | — | — | — | — | ||||||||||||||||||||||||||||||||||||||||||||||||||||||||||
| Net income for period | — | — | — | — | 537,054 | — | — | — | — | 537,054 | ||||||||||||||||||||||||||||||||||||||||||||||||||||||||||
| Effect from capitalized development costs | (11) | — | — | — | (4,911) | — | 4,911 | — | — | — | — | |||||||||||||||||||||||||||||||||||||||||||||||||||||||||
| Effect from foreign currency translation | (11) | — | 97 | — | (97) | — | (107,682) | — | — | — | (107,682) | |||||||||||||||||||||||||||||||||||||||||||||||||||||||||
| Effect from derivative hedges | (11) | — | — | — | — | — | 24,513 | — | — | — | 24,513 | |||||||||||||||||||||||||||||||||||||||||||||||||||||||||
| Effect from pension reserve | (11) | — | — | — | — | — | — | 11 | — | — | 11 | |||||||||||||||||||||||||||||||||||||||||||||||||||||||||
| Purchase of treasury shares | — | — | — | — | — | — | — | (1,891) | (99,987) | (99,987) | ||||||||||||||||||||||||||||||||||||||||||||||||||||||||||
| Tax benefit of employee stock plans | — | — | (802) | — | — | — | — | — | — | (802) | ||||||||||||||||||||||||||||||||||||||||||||||||||||||||||
| Stock awards and options | — | — | 38,391 | (44,213) | — | — | — | 1,441 | 52,132 | 46,310 | ||||||||||||||||||||||||||||||||||||||||||||||||||||||||||
| Tax withholding related to vesting of stock awards | — | — | — | — | — | — | — | (461) | (23,574) | (23,574) | ||||||||||||||||||||||||||||||||||||||||||||||||||||||||||
| Balance at December 31, 2021 | 230,829 | $2,731 | $1,877,704 | $916,839 | $537,054 | ($285,118) | ($588) | (3,755) | ($189,730) | $2,858,892 | ||||||||||||||||||||||||||||||||||||||||||||||||||||||||||
The accompanying notes are an integral part of these company financial statements.
Company Financial Statements 81
Notes to the Company Financial Statements
December 31, 2021
1. Accounting Policies
These company financial statements have been prepared in accordance with Title 9, Book 2 of the Dutch Civil Code. For setting the principles for the recognition and measurement of assets and liabilities and determination of results for its separate financial statements, the Company makes use of the option provided in section 2:362(8) of the Dutch Civil Code. This means that the principles for the recognition and measurement of assets and liabilities and determination of the result (hereinafter referred to as principles for recognition and measurement) of the separate financial statements of the Company are the same as those applied for the consolidated EU-IFRS financial statements. These principles also include the classification and presentation of financial instruments, being equity instruments or financial liabilities. In case no other principles are mentioned, refer to the accounting principles as described in the consolidated financial statements. For an appropriate interpretation of these statutory financial statements, the company financial statements should be read in conjunction with the consolidated financial statements.
Information on the use of financial instruments and on related risks for the group is provided in the notes to the consolidated financial statements of the group.
All amounts are presented in U.S. dollars rounded to the nearest thousand, unless otherwise indicated.
Certain prior year amounts have been reclassified to conform to the current year presentation. The reclassifications relate to the presentation of amounts related to participating interests in the Company Income Statement, including general and administrative expense, financial income, other financial results and income taxes. There is no impact on total shareholders' equity or net income for the period.
Participating interests in group companies
Group companies are all entities in which the Company has directly or indirectly control. The Company controls an entity when it is exposed, or has rights, to variable returns from its involvement with the group company and has the ability to affect those returns through its power over the group company. Group companies are recognized from the date on which control is obtained by the Company and derecognized from the date that control by the Company over the group company ceases. Participating interests in group companies are accounted for in the company financial statements according to the net equity value, with separate presentation of the goodwill component under intangible fixed assets, with the principles for the recognition and measurement of assets and liabilities and determination of results as set out in the notes to the consolidated financial statements.
Participating interests with a negative net asset value are valued at nil. This measurement also covers any receivables provided to the participating interests that are, in substance, an extension of the net investment. In particular, this relates to loans for which settlement is neither planned nor likely to occur in the foreseeable future. A share in the profits of the participating interest in subsequent years will only be recognized if and to the extent that the cumulative unrecognized share of loss has been absorbed. If the Company fully or partially guarantees the debts of the relevant participating interest, or if has the constructive obligation to enable the participating interest to pay its debts (for its share therein), then a provision is recognized accordingly to the amount of the estimated payments by the Company on behalf of the participating interest.
Share of result of participating interests
The share in the result of participating interests consists of the share of the Company in the result of these participating interests. Results on transactions involving the transfer of assets and liabilities between the Company and its participating interests and mutually between participating interests themselves, are eliminated to the extent that they can be considered as not realized.
Company Financial Statements 82
2. Intangible Fixed Assets
Goodwill
The changes in the carrying amount of goodwill for the years ended December 31, 2021 and 2020 are as follows:
| (in thousands) | 2021 | 2020 | ||||||||||||
| Balance at the beginning of year | $207,645 | $313,696 | ||||||||||||
| Goodwill acquired during the year | 6,098 | — | ||||||||||||
| Goodwill transferred to indirectly owned Group companies | — | (133,227) | ||||||||||||
| Purchase price adjustments | — | 3,382 | ||||||||||||
| Currency adjustments | (14,855) | 23,794 | ||||||||||||
| Balance at end of year | $198,888 | $207,645 | ||||||||||||
In 2021, the changes in goodwill resulted from goodwill acquired during the year partially offset by foreign current translation. In 2020, the changes in goodwill transferred to indirectly owned Group companies partially offset by foreign currency translation and purchase adjustments during the year.
Other Intangible Assets
Intangible assets represent developed technology, computer software, patent rights and licenses. There were no additions to intangible assets during the years ended December 31, 2021 and 2020. As of December 31, 2021 and 2020, the historic cost of intangibles assets amounted to $8.1 million and accumulated amortization amounted to $8.1 million. Less than $0.1 million of amortization expense on intangible assets was recognized during the years ended December 31, 2021 and 2020.
3. Tangible Fixed Assets
Property, Plant and Equipment
The changes in property, plant and equipment for the years ended December 31, 2021 and 2020 are as follows:
| (in thousands) | 2021 | 2020 | ||||||||||||
| Balance at the beginning of year | $530 | $731 | ||||||||||||
| Additions | 7 | 11 | ||||||||||||
| Depreciation | (61) | (212) | ||||||||||||
| Balance at end of year | $476 | $530 | ||||||||||||
The historic cost as of December 31, 2021 and 2020 for property, plant and equipment was $1.9 million. As of December 31, 2021 and 2020, accumulated amortization was $1.4 million and $1.3 million, respectively.
Other Tangible Fixed Assets
Other financial fixed assets December 31, 2021 and 2020 totaled $1.1 million and $1.3 million, respectively consists of right of use assets, primarily office and buildings, subject to lease arrangements.
Company Financial Statements 83
4. Financial Fixed Assets
Financial Assets
At December 31, 2021, the Company holds investments of $0.7 million for noncontrolling interests in privately-held companies which are considered unquoted equity securities (2020: $0.7 million). At December 31, 2021, the Company holds investments in unquoted debt securities which had a fair value and cost of $184.8 million. At December 31, 2020, the Company holds investments of $1.5 million for noncontrolling interests in publicly-held companies which are classified as quoted equity securities. Information on the accounting for these financial assets is provided in Note 7 "Financial Assets" to the Consolidated Financial Statements of the Group.
| (in thousands) | 2021 | 2020 | ||||||||||||
| Unquoted equity securities | $656 | $656 | ||||||||||||
| Quoted equity securities | — | 1,469 | ||||||||||||
| Unquoted debt securities | 184,785 | — | ||||||||||||
| Financial assets | $185,441 | $2,125 | ||||||||||||
| thereof current financial assets | $184,785 | $1,469 | ||||||||||||
| thereof non-current financial assets | $656 | $656 | ||||||||||||
Financial Fixed Assets
The financial fixed assets are presented in the statements of financial position based on either their net asset value in accordance with the aforementioned accounting principles of the Consolidated Financial Statements of the Group, or at amortized cost. There are no indications the fair value of the financial assets are lower than the values as presented in the statements of financial position as of December 31, 2021.
| (in thousands) | Total | Participating interests in group companies | Other participating interests | Loans receivable | ||||||||||||||||||||||
| January 1, 2020 | $3,376,424 | $2,705,549 | $1,938 | $668,937 | ||||||||||||||||||||||
| Capital payments / additions | 1,278,818 | 365,201 | — | 913,617 | ||||||||||||||||||||||
| Sales / repayments | (16,105) | — | (304) | (15,801) | ||||||||||||||||||||||
| Dividends received | (714,552) | (714,552) | — | — | ||||||||||||||||||||||
| Share in results from participating interests, after tax | 450,635 | 448,784 | 1,851 | — | ||||||||||||||||||||||
| Net actuarial gains/(losses) | (38) | (38) | — | |||||||||||||||||||||||
| Translation adjustments | 86,996 | 90,808 | — | (3,812) | ||||||||||||||||||||||
| December 31, 2020 | $4,462,178 | $2,895,752 | $3,485 | $1,562,941 | ||||||||||||||||||||||
Company Financial Statements 84
| (in thousands) | Total | Participating interests in group companies | Other participating interests | Loans receivable | ||||||||||||||||||||||
| January 1, 2021 | $4,462,178 | $2,895,752 | $3,485 | $1,562,941 | ||||||||||||||||||||||
| Capital payments / additions | 615,831 | 4,239 | 2,387 | 609,205 | ||||||||||||||||||||||
| Sales / repayments | (86,238) | (7,347) | — | (78,891) | ||||||||||||||||||||||
| Dividends received | (75,409) | (75,409) | — | — | ||||||||||||||||||||||
| Results from participating interests, after tax | 535,639 | 534,129 | 1,510 | — | ||||||||||||||||||||||
| Net actuarial gains/(losses) | 11 | 11 | — | — | ||||||||||||||||||||||
| Translation adjustments | (107,682) | (100,930) | — | (6,752) | ||||||||||||||||||||||
| December 31, 2021 | $5,344,330 | $3,250,445 | $7,382 | $2,086,503 | ||||||||||||||||||||||
Other Financial Fixed Assets
Other financial fixed assets December 31, 2021 and 2020 totaled $1.7 million and $1.3 million, respectively, and primarily consist of prepayments.
5. Trade and Other Receivables
The carrying values of the receivables are a reasonable approximation of their respective fair values, given the short maturities of the positions and the fact that allowances for doubtful debts have been recognized, if necessary. All receivables have an estimated maturity shorter than one year.
Receivables from Group Companies
The receivables from group companies mainly include intercompany accounts receivables and intercompany short-term loans receivable. Intercompany accounts receivable include amounts due from the group related to payments that will become due under stock plan reimbursement agreements. The value of the reimbursement receivable is recorded at fair value based on the period end share price, with the change in fair value recorded in general and administrative expense. For the years ended December 31, 2021 and 2020, the fair value change totaled expense of $29.5 million and income of $44.7 million, respectively.
Prepaid and Other Current Assets
Prepaid expenses and other current assets are summarized as follows as of December 31, 2021 and 2020:
| (in thousands) | 2021 | 2020 | ||||||||||||
| Cash collateral | $11,200 | $56,100 | ||||||||||||
| Current loans receivable with related parties including interest | 6,249 | 17,094 | ||||||||||||
| Other receivables | 2,384 | 2,323 | ||||||||||||
| Prepaid expenses | 1,150 | 5,368 | ||||||||||||
| Income taxes receivable | 947 | 1,553 | ||||||||||||
| Value added tax | 84 | 382 | ||||||||||||
| Other current assets | $22,014 | 22014000 | $82,820 | |||||||||||
Company Financial Statements 85
6. Common Shares
The authorized classes of our shares consist of Common Shares, Preference Shares and Financing Preference Shares. No Financing Preference Shares or Preference Shares have been issued. The Company had the following authorized shares issued and outstanding as of December 31, 2021 and 2020:
| Authorized, (in thousands) | 2021 | 2020 | ||||||||||||
| Common shares | 410,000 | 410,000 | ||||||||||||
| Preference shares | 450,000 | 450,000 | ||||||||||||
| Financing preference shares | 40,000 | 40,000 | ||||||||||||
| At December 31st | 900,000 | 900,000 | ||||||||||||
| Issued and outstanding, (in thousands) | 2021 | 2020 | ||||||||||||
| Common shares issued | 230,829 | 230,829 | ||||||||||||
| Treasury shares | (3,755) | (2,844) | ||||||||||||
| Outstanding at December 31st | 227,074 | 227,985 | ||||||||||||
| Par value in EUR per share | 2021 | 2020 | ||||||||||||
| Common shares | 0.01 | 0.01 | ||||||||||||
| Preference shares | 0.01 | 0.01 | ||||||||||||
| Financing preference shares | 0.01 | 0.01 | ||||||||||||
| Par value (in thousands) | 2021 | 2020 | ||||||||||||
| Common shares issued at December 31st in EUR | 2,308 | 2,308 | ||||||||||||
| Common shares issued at December 31st in USD | 2,731 | 2,634 | ||||||||||||
7. Equity
Share Premium
The share premium concerns the income from the issuing of shares in so far as this exceeds the nominal value of the shares (above par income). Of share premium, no legal restrictions apply to the distribution thereof and therefore can be considered freely distributable.
Legal Reserves
Legal reserves as of December 31, 2021 and 2020 were $(285.1) million and $(206.9) million, respectively, and include the amounts as shown in the table below:
Company Financial Statements 86
| (in thousands) | 2021 | 2020 | ||||||||||||
| Cumulative foreign currency translation adjustment | ($323,415) | ($215,733) | ||||||||||||
| Capitalized development costs related to subsidiaries | 37,052 | 32,141 | ||||||||||||
| Cash flow hedge reserve | 1,245 | (23,268) | ||||||||||||
| Legal reserves | ($285,118) | ($206,860) | ||||||||||||
The legal reserves set up in connection with the capitalized development costs related to subsidiaries as described in Note 12 "Goodwill and Intangible Assets" to the Consolidated Financial Statements of the Group. As a result of the capitalization and subsequent amortization of these capitalized development costs, the net impact on the legal reserves was $4.9 million and $5.1 million for the years ended December 31, 2021 and 2020, respectively.
Other Reserves
Other reserves as of December 31, 2021 and 2020 were $(0.6) million and include the amounts as shown in the table below.
| (in thousands) | 2021 | 2020 | ||||||||||||
| Pension reserve | ($588) | ($599) | ||||||||||||
The amounts noted in the table above for other reserves include adjustment for the impact of deferred income taxes.
8. Financial Debts
Information on the financial debts of $446.5 million related to the Cash Convertible Notes due in 2024, $442.8 million related to the Convertible Notes due in 2027, $375.1 million related to the Cash Convertible Notes due in 2023, $326.8 million related to the U.S. Private Placement and $294.5 million related to the German private placement bond (Schuldschein) are provided under Note 16 "Financial Debts" to the Consolidated Financial Statements of the Group. Our revolving facility agreement and private placement contains certain financial and non-financial covenants, including but not limited to, restrictions on the encumbrance of assets, restrictions on priority indebtedness and maintenance of certain financial ratios. We were in compliance with these covenants at December 31, 2021.
Of the total $1.89 billion financial debts as of December 31, 2021, $845.7 million is included in current liabilities and $1.04 billion is included in non-current liabilities in the accompanying balance sheet of QIAGEN N.V. During the years ended December 31, 2021 and 2020, financial expense of $53.2 million and $67.0 million, respectively, is included in the accompanying income statement of QIAGEN N.V. and is primarily associated with these financial debts.
9. Financial Instruments
Information on the use of financial instruments and on related risks is provided in Note 26 "Financial Risk Factors and Use of Derivative Financial Instruments" to the Consolidated Financial Statements of the Group and includes information about the Group's exposure to these risks, the Group's objectives, policies and processes for measuring and managing risk, and the Group's management of capital.
These risks, objectives, policies and processes for measuring and managing risk, and the management of capital apply also to the separate financial statements of QIAGEN N.V.
In the ordinary course of business, we use derivative instruments to manage potential losses from foreign currency exposures and interest bearing assets or liabilities as further described in Note 26 to the Consolidated Financial Statements of the Group. For the years ended December 31, 2021 and 2020, gains and losses on these derivatives instruments are included in Other financial results in the accompanying income statements of QIAGEN N.V.
Company Financial Statements 87
Guarantees
It is our general group policy to ensure that our subsidiaries have access to sufficient financial and other resources to conduct their respective business. It is our intention to provide necessary support to ensure that subsidiaries continue as a going concern and where it has been requested, the Company has issued letters of comfort for certain subsidiaries.
In connection with a building expansion in Hilden, Germany, the Company has issued a parental guarantee to the construction company for €809,400. This guarantee will only lead to cash outflow when called upon and as of December 31, 2021 there was no constructive obligation and no provision required. The guarantee expires at the latest June 30, 2022.
10. Income Tax
The reconciliation of income taxes from the Dutch statutory rate to the effective tax rate is as follows:
| 2021 | 2020 | |||||||||||||||||||||||||
| (in thousands) | Amount | Percent | Amount | Percent | ||||||||||||||||||||||
| Income (loss) before income taxes | $1,415 | — | ($378,816) | — | ||||||||||||||||||||||
| At Dutch statutory income tax rate of 25.0% | 354 | 25.0 | % | (94,704) | 25.0 | % | ||||||||||||||||||||
| Non-deductible expenses | 8,480 | 599.3 | % | 92,796 | (24.5) | % | ||||||||||||||||||||
| Tax exempt income | (5,677) | (401.2) | % | (92) | 0.0 | % | ||||||||||||||||||||
| Adjustment in valuation of deductible losses | (1,723) | (121.8) | % | 2,907 | (0.8) | % | ||||||||||||||||||||
| Other items | (1,434) | (101.3) | % | (2,728) | 0.7 | % | ||||||||||||||||||||
| Total income tax | $0 | 0.0 | % | ($1,821) | 0.4 | % | ||||||||||||||||||||
Together with Life Biotech Partners B.V., the Company forms a fiscal unity for corporate income tax purposes. For value-added tax purposes, the fiscal unity includes all Dutch subsidiaries of the Company. The standard conditions of fiscal unity stipulate that each of the companies is liable for the tax payable of all companies belonging to the fiscal unity.
11. Subsidiaries
The following is a list of the Company's subsidiaries as of December 31, 2021, other than certain subsidiaries that did not in the aggregate constitute a significant subsidiary. A list of subsidiaries has been filed with the Chamber of Commerce in Roermond, the Netherlands, and is available from the company upon request.
| Company Name | Jurisdiction of Incorporation | Ownership | Voting Rights | |||||||||||||||||
| Amnisure International LLC | USA | USA | 100 | % | 100 | % | ||||||||||||||
| Cellestis Pty. Ltd. | Turkey | Australia | 100 | % | 100 | % | ||||||||||||||
| Life Biotech Partners B.V. | Australia | Netherlands | 100 | % | 100 | % | ||||||||||||||
| NeuMoDx Inc. | Netherlands | USA | 100 | % | 100 | % | ||||||||||||||
| STAT-Dx Life S.L. | USA | Spain | 100 | % | 100 | % | ||||||||||||||
| QIAGEN Aarhus A/S | Spain | Denmark | 100 | % | 100 | % | ||||||||||||||
| QIAGEN AB | China | Sweden | 100 | % | 100 | % | ||||||||||||||
Company Financial Statements 88
| Company Name | Jurisdiction of Incorporation | Ownership | Voting Rights | |||||||||||||||||
| QIAGEN AG | Denmark | Switzerland | 100 | % | 100 | % | ||||||||||||||
| QIAGEN Australia Holding Pty. Ltd. | Sweden | Australia | 100 | % | 100 | % | ||||||||||||||
| QIAGEN Benelux B.V. | Switzerland | Netherlands | 100 | % | 100 | % | ||||||||||||||
| QIAGEN Beverly LLC | Australia | USA | 100 | % | 100 | % | ||||||||||||||
| QIAGEN Business Management MEA Ltd. | Netherlands | UAE | 100 | % | 100 | % | ||||||||||||||
| QIAGEN Business Services (Manila), Inc. | USA | Philippines | 100 | % | 100 | % | ||||||||||||||
| QIAGEN Business Services S.p.z.o.o. | China | Poland | 100 | % | 100 | % | ||||||||||||||
| QIAGEN China (Shanghai) Co. Ltd. | Luxembourg | China | 100 | % | 100 | % | ||||||||||||||
| QIAGEN Luxembourg SARL | Germany | Luxembourg | 100 | % | 100 | % | ||||||||||||||
| QIAGEN Deutschland Holding GmbH | France | Germany | 100 | % | 100 | % | ||||||||||||||
| QIAGEN Distribution B.V. | USA | Netherlands | 100 | % | 100 | % | ||||||||||||||
| QIAGEN France S.A.S. | Germany | France | 100 | % | 100 | % | ||||||||||||||
| QIAGEN Gaithersburg LLC | Germany | USA | 100 | % | 100 | % | ||||||||||||||
| QIAGEN GmbH | Canada | Germany | 100 | % | 100 | % | ||||||||||||||
| QIAGEN Hamburg GmbH | Switzerland | Germany | 100 | % | 100 | % | ||||||||||||||
| QIAGEN Hong Kong Pte. Ltd. | Japan | China | 100 | % | 100 | % | ||||||||||||||
| QIAGEN Inc. | USA | Canada | 100 | % | 100 | % | ||||||||||||||
| QIAGEN Instruments AG | UK | Switzerland | 100 | % | 100 | % | ||||||||||||||
| QIAGEN K.K. | UK | Japan | 100 | % | 100 | % | ||||||||||||||
| QIAGEN Korea Ltd. | France | Korea (South) | 100 | % | 100 | % | ||||||||||||||
| QIAGEN LLC | USA | USA | 100 | % | 100 | % | ||||||||||||||
| QIAGEN Ltd. | Australia | UK | 100 | % | 100 | % | ||||||||||||||
| QIAGEN Manchester Ltd. | USA | UK | 100 | % | 100 | % | ||||||||||||||
| QIAGEN Marseille S.A. | USA | France | 100 | % | 100 | % | ||||||||||||||
| QIAGEN North American Holdings Inc. | Singapore | USA | 100 | % | 100 | % | ||||||||||||||
| QIAGEN Pty. Ltd. | Italy | Australia | 100 | % | 100 | % | ||||||||||||||
| QIAGEN Redwood City Inc. | UAE | USA | 100 | % | 100 | % | ||||||||||||||
| QIAGEN Sciences LLC | USA | USA | 100 | % | 100 | % | ||||||||||||||
| QIAGEN Shared Services LLC | USA | USA | 100 | % | 100 | % | ||||||||||||||
| QIAGEN Singapore Pte. Ltd. | Singapore | 100 | % | 100 | % | |||||||||||||||
| QIAGEN S.r.l. | Italy | 100 | % | 100 | % | |||||||||||||||
| QIAGEN U.S. Finance LLC | USA | 100 | % | 100 | % | |||||||||||||||
Company Financial Statements 89
12. Employee Information
| Average Number of Employees | 2021 | 2020 | ||||||||||||
| Research & Development | 947 | 928 | ||||||||||||
| Sales | 2,215 | 2,131 | ||||||||||||
| Production | 1,692 | 1,365 | ||||||||||||
| Marketing | 341 | 320 | ||||||||||||
| Administration | 625 | 610 | ||||||||||||
| Total | 5,820 | 5,354 | ||||||||||||
The average number of employees working outside the Netherlands during the year ended December 31, 2021 was 5,763 (2020: 5,303).
The pension plans applicable to the employees are financed through contributions to external pension insurance companies. The contribution due is accounted for in the profit and loss as an expense. Prepaid contributions are recognized as deferred assets if these lead to a refund or reduction of future payments. Contributions that are due but have not yet been paid are presented as liabilities.
Personnel Costs
Personnel costs for the Company amounted to $2.2 million in 2021 (2020: $2.0 million) as further detailed below by functional area in which the respective employee works.
| (in thousands) | 2021 | 2020 | ||||||||||||
| Salaries and wages | $1,982 | $1,654 | ||||||||||||
| Social security | 124 | 140 | ||||||||||||
| Other | 75 | 194 | ||||||||||||
| Personnel costs | $2,181 | $1,988 | ||||||||||||
13. Related Party Transactions
Information on related party transactions including remuneration of the members of the Managing and Supervisory Board is provided under Note 24 "Related Party Transactions" to the Consolidated Financial Statements of the Group. Information on the remuneration policy is provided in the Corporate Governance Report.
14. Auditor Fees
Information on auditor fees is provided under Note 29 "Fees Paid External Auditors" to the Consolidated Financial Statements of the Group.
15. Subsequent Events
Based on the Company’s review, no events or transactions have occurred subsequent to December 31, 2021 other than those described in Note 30 "Subsequent Events" to the Consolidated Financial Statements of the Group, that would have a material impact on the financial statements as presented.
Company Financial Statements 90
Signatures
Venlo, the Netherlands, April 15, 2022
QIAGEN N.V.
Thierry Bernard Roland Sackers
Chief Executive Officer Chief Financial Officer
91
OTHER INFORMATION
Other Information 92


To: the General Meeting of Shareholders and the Supervisory Board of QIAGEN N.V.
Report on the audit of the financial statements 2021 included in the annual report
Our opinion
In our opinion:
–The accompanying consolidated financial statements give a true and fair view of the financial position of QIAGEN N.V. as of December 31, 2021 and of its result and its cash flows for the year then ended, in accordance with International Financial Reporting Standards as adopted by the European Union (EU-IFRS) and with Part 9 of Book 2 of the Dutch Civil Code.
–The accompanying company financial statements give a true and fair view of the financial position of QIAGEN N.V. as of December 31, 2021 and of its result for the year then ended in accordance with Part 9 of Book 2 of the Dutch Civil Code
What we have audited
We have audited the financial statements 2021 of QIAGEN N.V. (‘the Company’) based in Venlo, the Netherlands. The financial statements include the consolidated financial statements and the Company financial statements.
The consolidated financial statements comprise:
1the consolidated balance sheet as of December 31, 2021;
2the following consolidated statements for 2021: the income statement, the statements of comprehensive income, cash flows and changes in equity; and
3the notes comprising a summary of the significant accounting policies and other explanatory information.
The Company financial statements comprise:
1the Company balance sheet as of December 31, 2021;
2the Company income statement for 2021;
3the Company statement of changes in equity for 2021; and
4the notes comprising a summary of the accounting policies and other explanatory information.
Other Information 93
Basis for our opinion
We conducted our audit in accordance with Dutch law, including the Dutch Standards on Auditing. Our responsibilities under those standards are further described in the ‘Our responsibilities for the audit of the financial statements’ section of our report.
We are independent of QIAGEN N.V. in accordance with the ‘Verordening inzake de onafhankelijkheid van accountants bij assurance-opdrachten’ (ViO, ‘Code of Ethics for Professional Accountants, a regulation with respect to independence’) and other relevant independence regulations in the Netherlands. Furthermore, we have complied with the ‘Verordening gedrags- en beroepsregels accountants’ (VGBA, ‘Dutch Code of Ethics’).
Our audit procedures were determined in the context of our audit of the financial statements as a whole. Our observations in respect of going concern, fraud and non-compliance with laws and regulations and the key audit matters should be viewed in that context and not as separate opinions or conclusions.
We believe the audit evidence we have obtained is sufficient and appropriate to provide a basis for our opinion.
Audit approach
Summary
| Materiality | ||
–Materiality of USD 20 million –3.9% of normalized income before taxes | ||
| Group audit | ||
–Audit coverage of 89% of total assets –Audit coverage of 86% of net sales | ||
| Going concern and Fraud/Noclar | ||
–Going concern: no significant going concern risks identified –Fraud & Non-compliance with laws and regulations (Noclar): we identified management override of controls, laid down in the auditing standards, as a presumed fraud risk | ||
| — | ||
| Key audit matter | ||
–Assessment of unrecognized tax benefits | ||
| Opinion | ||
| Unqualified | ||
Other Information 94
Materiality
Based on our professional judgement we determined the materiality for the financial statements as a whole at USD 20 million (2020: USD 16 million). The materiality is determined with reference to normalized income before taxes (2021: 3.9%, 2020: 4.1%). The income before income taxes is normalized by adjusting for significant items that do not represent normal, continuing operations, as the most significant being the fair value adjustment of the cash conversion option within the convertible note. We consider normalized income before taxes as the most appropriate benchmark because of the nature of the business and the fact that the main stakeholders are primarily focused on income before income tax. We have also taken into account misstatements and/or possible misstatements that in our opinion are material for the users of the financial statements for qualitative reasons.
We agreed with the Supervisory Board that misstatements identified during our audit in excess of USD 1 million would be reported to them, as well as smaller misstatements that in our view must be reported on qualitative grounds.
Scope of the group audit
QIAGEN N.V. is at the head of a group of components. The financial information of this group is included in the financial statements of QIAGEN N.V.
Our group audit mainly focused on significant components. Based on the size and the risk profile of the components, we determined the scope of the audit procedures to be performed. KPMG Germany was engaged by us and received instructions to perform the majority of the audit procedures for the group audit and the audit of the German and foreign locations. In addition, other KPMG offices were involved to perform specified audit procedures on selected accounts of foreign locations.
We have:
–performed audit procedures ourselves at group level;
–made use of the work of the component auditors who performed full scope audit procedures (audit of complete reporting package) and specified audit procedures at the parent and local entity level; and
–performed analytical procedures with assistance of KPMG Germany on the remaining entities, considering their significance and/or their risk profile.
The group audit team set materiality levels for the audits of components, which ranged from USD 1 million to USD 12 million, based on the judgment of the group audit team given the mix of size and risk profile of these entities within the group.
The group audit team has sent detailed instructions to the auditor of the components which includes the significant risk areas that should be covered and sets out the information required to be reported to the group audit team. The group audit team held telephone conferences with the component auditors. During these telephone conferences, the audit approach, the findings and observations reported to the group audit team were discussed in detail.
Due to the restrictions caused by COVID-19, the file review performed on the audit file of KPMG Germany has been done remotely. In addition, due to the inability to arrange in-person meetings with them, we have increased the use of alternative methods of communication with them, including through written instructions, exchange of emails and virtual meetings.
Other Information 95
By performing the procedures mentioned above at components, together with additional procedures at group level, we have been able to obtain sufficient and appropriate audit evidence about the group’s financial information to provide an opinion about the financial statements.
The procedures as described above can be summarized as follows:
Other Information 96
Audit response to going concern - no significant going concern risks identified
The Managing Board has performed its going concern assessment and has not identified any significant going concern risks. To assess the Managing Board’s assessment, we have performed, inter alia, the following procedures:
–we considered whether the Managing Board's assessment of the going concern risks includes all relevant information of which we are aware as a result of our audit;
–we inspected the financing agreements for terms or conditions that could lead to significant going concern risks;
–we analyzed the Company's financial position as of year-end and compared it to the previous financial year in terms of indicators that could identify significant going concern risks.
The outcome of our risk assessment procedures did not give reason to perform additional audit procedures on management’s going concern assessment.
Audit response to the risk of fraud and non-compliance with laws and regulations
In chapters ‘Government Regulations’ and ‘Risk Management’ of the Management Report, the Managing Board describes its procedures in respect of the risk of fraud and non-compliance with laws and regulations and the Supervisory Board reflects on this in the Report of the Supervisory Board.
As part of our audit, we have gained insights into the Company and its business environment, and assessed the design and implementation of the Company’s risk management in relation to fraud and non-compliance.
Our procedures included, among other things:
–inspected and verified the availability to employees of the Company’s Code of Conduct for employees and suppliers and whistleblower policy;
–assessed the matters reported on the Company’s incidents register and its procedures to investigate indications of possible fraud and non-compliance;
–assessed other positions held by management and other employees and paid special attention to procedures and governance/compliance in view of possible conflicts of interest;
–evaluated, if any, correspondence with supervisory authorities and regulators, such as SEC and AFM, as well as legal confirmation letters;
–performed relevant inquiries with the Managing Board the Audit Committee of the Supervisory Board and other relevant functions, such as Internal Audit and Legal.
In addition, we performed procedures to obtain an understanding of the legal and regulatory frameworks that are applicable to the Company and identified the following areas as those most likely to have a material impact on the financial statements:
–medical device regulations (reflecting the nature of the Company’s production and distribution processes);
–export legislation (reflecting the Company’s global customer base).
Other Information 97
We evaluated the fraud and non-compliance risk factors to consider whether those factors indicate a risk of material misstatement in the financial statements.
We assessed the presumed fraud risk on revenue recognition as irrelevant. Revenue is made out of a high volume of relatively small sales transactions. The risk of a material misstatement resulting from fraud related to sales transactions, also taken the control environment into account, is therefore considered low. Our audit response is aligned with this assessment.
Based on the above and on the auditing standards, we identified the following fraud risk that is relevant to our audit, Which is the presumed risk laid down in the auditing standards, and responded as follows:
Presumed risk of management override of controls
Management is in a unique position to manipulate accounting records and prepare fraudulent financial statements by overriding controls that otherwise appear to be operating effectively.
We identified this risk primarily in the areas where judgment is involved as management may rationalize unrealistic or unreliable assumptions used in relation to amongst others unrecognized tax benefits, deferred tax assets, valuation of derivatives and identification of impairment triggers of definite-lived intangible assets.
Our response
We evaluated the design and the implementation and, where considered appropriate, tested the operating effectiveness of internal controls that mitigate fraud risks, such as processes related to journal entries and estimates.
We performed a data analysis of high-risk journal entries such as unexpected journal entries on revenue accounts. Where we identified instances of unexpected journal entries or other risks through our data analytics, we performed additional audit procedures to address each identified risk, including testing of transactions back to source information.
We incorporate elements of unpredictability in the nature, timing and extent of audit procedures, which is ensured through determination of journal entries with high-risk criteria and selection of items being tested by adding/revising routines in the current year.
We evaluate the selection and application of accounting policies to determine if there are indicators that management is intentionally manipulating earnings in the selection and application of accounting policies.
Our audit procedures did not reveal indications and/or reasonable suspicion of fraud and non-compliance that are considered material for our audit.
Our key audit matters
Key audit matters are those matters that, in our professional judgement, were of most significance in our audit of the financial statements. We have communicated the key audit matters to the Supervisory Board. The key audit matters are not a comprehensive reflection of all matters discussed.
Compared to last year the key audit matter with respect to ‘Initial recognition of the fair value of developed technology and in-process research and development assets related to the NeuMoDx business combination’ and ‘Initial recognition and measurement of the USD 500 million convertible notes’ are not included as key audit matters, as they specifically related to the financial year 2020.
Other Information 98
| Assessment of unrecognized tax benefits | ||
Description As disclosed in Note 17 to the consolidated financial statements, the Company has unrecognized tax benefits of USD 103.6 million as of December 31, 2021. The Company conducts its business globally and operates more than 50 consolidated subsidiaries in multiple tax jurisdictions. This multi-jurisdictional business operation involves complex intercompany operating and financing activities. The nature of these activities can result in uncertainties in the estimation of the related tax exposures. The unrecognized tax benefit is recognized and subsequently measured by the Company in its consolidated financial statements when it is most probable that the position will be sustained upon examination by the tax authorities. The interpretation of complex tax laws and tax laws and regulations required significant management judgment and specialized skills and knowledge were required in evaluating the Company’s interpretation and application of tax laws in the jurisdictions where it operates and its estimate of the ultimate resolution of the tax position. We therefore identified the assessment of unrecognized tax benefits as a key audit matter. | ||
Our response The primary procedures we performed to address this key audit matter included the following: –We evaluated the design and operating effectiveness of certain internal controls related to the Company’s unrecognized tax benefit process, including controls related to (1) its interpretation and application of tax statutes and legislation, and changes thereto, in the various jurisdictions in which it operates and (2) its determination of the estimate for the associated unrecognized tax benefit. –We have performed a retrospective analysis to evaluate the historical accuracy of management’s estimates. –We inspected the Company’s legal composition to identify and assess changes in operating structures and financing arrangements. –With respect to the results of inspections by tax authorities, we inquired with the Company’s tax department in combination with inspecting correspondence with the responsible tax authorities. –We involved KPMG tax and transfer pricing specialists with specialized skills and knowledge, who assisted in: –evaluating the Company’s interpretation and application of multi-jurisdictional tax laws, and changes thereto, and its impact on the unrecognized tax benefit by reading advice obtained from the Company’s external specialists; –inspecting the lapse of statute of limitations and settlements with tax authorities over a selection of unrecognized tax benefits to evaluate the amount in the settlement documents compared to the unrecognized tax benefit; and –inspecting a selection of intercompany operating and financing activities between group entities to assess the sustainability of tax positions based on their technical merits and the probabilities of possible settlement alternatives. –Finally we assessed the adequacy of the disclosure in Note 17. | ||
Our observation The results of our procedures on the accounting for unrecognized tax benefits were satisfactory and we found the disclosure in Note 17 to be adequate. | ||
Other Information 99
Report on the other information included in the annual report
In addition to the financial statements and our auditor’s report thereon, the annual report contains other information.
Based on the following procedures performed, we conclude that the other information:
–is consistent with the financial statements and does not contain material misstatements; and
–contains the information as required by Part 9 of Book 2 of the Dutch Civil Code for the management report and other information.
We have read the other information. Based on our knowledge and understanding obtained through our audit of the financial statements or otherwise, we have considered whether the other information contains material misstatements.
By performing these procedures, we comply with the requirements of Part 9 of Book 2 of the Dutch Civil Code and the Dutch Standard 720. The scope of the procedures performed is less than the scope of those performed in our audit of the financial statements.
Management is responsible for the preparation of the other information, including the information as required by Part 9 of Book 2 of the Dutch Civil Code.
Report on other legal and regulatory requirements and ESEF
Engagement
We were firstly engaged by the General Meeting of Shareholders as auditor of QIAGEN N.V. on June 23, 2015 as of the audit for the year 2015 and have operated as statutory auditor ever since that financial year.
No prohibited non-audit services
We have not provided prohibited non-audit services as referred to in Article 5(1) of the EU Regulation on specific requirements regarding statutory audits of public-interest entities.
European Single Electronic Format (ESEF)
QIAGEN N.V. has prepared its annual report in ESEF. The requirements for this format are set out in the Commission Delegated Regulation (EU) 2019/815 with regard to regulatory technical standards on the specification of a single electronic reporting format (these requirements are hereinafter referred to as: the RTS on ESEF).
In our opinion, the annual report prepared in the XHTML format, including the partially tagged consolidated financial statements as included in the reporting package by QIAGEN N.V., has been prepared in all material respects in accordance with the RTS on ESEF.
Management is responsible for preparing the annual report including the financial statements in accordance with the RTS on ESEF, whereby management combines the various components into a single reporting package. Our responsibility is to obtain reasonable assurance for our opinion whether the annual report in this reporting package, is in accordance with the RTS on ESEF.
Our procedures taking into consideration Alert 43 of NBA (the Netherlands Institute of Chartered Accountants), included amongst others:
–obtaining an understanding of the entity's financial reporting process, including the preparation of the reporting package;
Other Information 100
–obtaining the reporting package and performing validations to determine whether the reporting package containing the Inline XBRL instance document and the XBRL extension taxonomy files have been prepared in accordance with the technical specifications as included in the RTS on ESEF;
–examining the information related to the consolidated financial statements in the reporting package to determine whether all required taggings have been applied and whether these are in accordance with the RTS on ESEF.
Description of responsibilities regarding the financial statements
Responsibilities of the Managing Board and the Supervisory Board for the financial statements
The Managing Board is responsible for the preparation and fair presentation of the financial statements in accordance with EU-IFRS and Part 9 of Book 2 of the Dutch Civil Code. Furthermore, the Managing Board is responsible for such internal control as management determines is necessary to enable the preparation of the financial statements that are free from material misstatement, whether due to fraud or error. In that respect the Managing Board, under supervision of the Supervisory Board, is responsible for the prevention and detection of fraud and non-compliance with laws and regulations, including determining measures to resolve the consequences of it and to prevent recurrence.
As part of the preparation of the financial statements, the Managing Board is responsible for assessing the Company’s ability to continue as a going concern. Based on the financial reporting frameworks mentioned, the Managing Board should prepare the financial statements using the going concern basis of accounting unless the Managing Board either intends to liquidate the Company or to cease operations, or has no realistic alternative but to do so. The Managing Board should disclose events and circumstances that may cast significant doubt on the Company’s ability to continue as a going concern in the financial statements.
The Supervisory Board is responsible for overseeing the Company’s financial reporting process.
Our responsibilities for the audit of the financial statements
Our objective is to plan and perform the audit engagement in a manner that allows us to obtain sufficient and appropriate audit evidence for our opinion.
Our audit has been performed with a high, but not absolute, level of assurance, which means we may not detect all material errors and fraud during our audit.
Misstatements can arise from fraud or error and are considered material if, individually or in the aggregate, they could reasonably be expected to influence the economic decisions of users taken on the basis of these financial statements. The materiality affects the nature, timing and extent of our audit procedures and the evaluation of the effect of identified misstatements on our opinion.
A further description of our responsibilities for the audit of the financial statements is located at the website of de ‘Koninklijke Nederlandse Beroepsorganisatie van Accountants’ (NBA, Royal Netherlands Institute of Chartered Accountants) at www.nba.nl/ENG_OOB_01. This description forms part of our auditor’s report.
Eindhoven, April 15, 2022
KPMG Accountants N.V.
M.J.A. Verhoeven RA
Other Information 101
Provisions in the Articles of Association Governing the Appropriation of Net Income
According to Article 40 till 42 of the Articles of Association, the allocation of net income will be as follows. Subject to certain exceptions, dividends may only be paid out of profits as shown in our annual report as adopted by the General Meeting of Shareholders. Distributions may not be made if the distribution would reduce the shareholders’ equity below the sum of the paid-up capital and any reserves required by Dutch Law or the Articles.
Out of profits, dividends must first be paid on any outstanding Preference Shares (the “Preference Share Dividend”) in a percentage (the “Preference Share Dividend Percentage”) of the obligatory amount (call) paid up on such shares at the beginning of the fiscal year in respect of which the distribution is made. The Preference Share Dividend Percentage is equal to the Average Main Refinancing Rates during the financial year for which the distribution is made. Average Main Refinancing Rate shall be made understood to mean the average value on each individual day during the financial year for which the distribution is made of the Main Refinancing Rates prevailing on such day. Main Refinancing Rate shall be understood to mean the rate of the Main Refinancing Operation as determined and published from time to time by the European Central Bank. If and to the extent that profits are not sufficient to pay the Preference Share Dividend in full, the deficit shall be paid out of the reserves, with the exception of any reserve, which was formed as share premium reserve upon the issue of Financing Preference Shares. If in any fiscal year the profit is not sufficient to make the distributions referred to above and if no distribution or only a partial distribution is made from the reserves referred to above, such that the deficit is not fully made good no further distributions will be made as described below until the deficit has been made good.
Out of profits remaining after payment of any dividends on Preference Shares such amounts shall be kept in reserve as determined by the Supervisory Board. Out of any remaining profits not allocated to reserve, a dividend shall be paid on the Financing Preference Shares in a percentage over the par value, increased by the amount of share premium that was paid upon the first issue of Financing Preference Shares, which percentage is related to the average effective yield on the prime interest rate on corporate loans in the United States as quoted in the Wall Street Journal. If and to the extent that the profits are not sufficient to pay the Financing Preference Share Dividend in full, the deficit may be paid out of the reserves if the Managing Board so decides with the approval of the Supervisory Board, with the exception of the reserve which was formed as share premium upon the issue of Financing Preference Shares.
Insofar as the profits have not been distributed or allocated to the reserves as specified above, they are at the free disposal of the General Meeting of Shareholders, provided that no further dividends will be distributed on the Preference Shares or the Financing Preference Shares.
The General Meeting may resolve, on the proposal of the Supervisory Board, to distribute dividends or reserves, wholly or partially, in the form of QIAGEN shares.
Other Information 102
SIGNATURES
Pursuant to the requirements of the Securities Exchange Act of 1934, the registrant has duly caused this Report to be signed on its behalf by the undersigned, thereunto duly authorized.
| QIAGEN N.V. | |||||
| BY: | /s/ Roland Sackers | ||||
| Roland Sackers | |||||
| Chief Financial Officer | |||||
| Date: | November 8, 2022 | ||||