UNITED STATES
SECURITIES AND EXCHANGE COMMISSION
Washington, D.C. 20549
SCHEDULE 14A
(Rule 14a-101)
INFORMATION REQUIRED IN PROXY STATEMENT
SCHEDULE 14A INFORMATION
Proxy Statement Pursuant to Section 14(a) of the
Securities Exchange Act of 1934
(Amendment No. )
Filed by the Registrant ¨ Filed by a Party other than the Registrant x
Check the appropriate box:
| ¨ | Preliminary Proxy Statement |
| ¨ | Confidential, for Use of the Commission Only (as permitted by Rule 14a-6(e)(2)) |
| ¨ | Definitive Proxy Statement |
| x | Definitive Additional Materials |
| ¨ | Soliciting Material under §240.14a-12 |
BARNES & NOBLE, INC.
(Name of Registrant as Specified in Its Charter)
YUCAIPA AMERICAN ALLIANCE FUND II, L.P.
YUCAIPA AMERICAN ALLIANCE (PARALLEL) FUND II, L.P.
YUCAIPA AMERICAN ALLIANCE FUND II, LLC
YUCAIPA AMERICAN FUNDS, LLC
YUCAIPA AMERICAN MANAGEMENT, LLC
THE YUCAIPA COMPANIES LLC
RONALD W. BURKLE
STEPHEN F. BOLLENBACH
MICHAEL S. MCQUARY
ROBERT P. BERMINGHAM
(Name of Person(s) Filing Proxy Statement, if Other than the Registrant)
Payment of Filing Fee (Check the appropriate box):
| x | No fee required. |
| ¨ | Fee computed on table below per Exchange Act Rules 14a-6(i)(1) and 0-11. |
| (1) | Title of each class of securities to which the transaction applies: |
| (2) | Aggregate number of securities to which the transaction applies: |
| (3) | Per unit price or other underlying value of the transaction computed pursuant to Exchange Act Rule 0-11 (set forth the amount on which the filing fee is calculated and state how it was determined): |
| (4) | Proposed maximum aggregate value of the transaction: |
| (5) | Total fee paid: |
| ¨ | Fee paid previously with preliminary materials. |
| ¨ | Check box if any part of the fee is offset as provided by Exchange Act Rule 0-11(a)(2) and identify the filing for which the offsetting fee was paid previously. Identify the previous filing by registration statement number, or the Form or Schedule and the date of its filing. |
| (1) | Amount Previously Paid: |
| (2) | Form, Schedule or Registration Statement No.: |
| (3) | Filing Party: |
| (4) | Date Filed: |
|
The Yucaipa Companies, LLC
Supplemental Investor Presentation
Barnes & Noble, Inc.
(NYSE: BKS)
Enough of the Fiction — Here are the Facts
|
Directors Should Run On Their Record, Not Run From Their Record
Barnes & Noble filed a 55 page investor presentation with lots of color pictures and impressive looking (but misleading) graphs and charts, but they left out the most important parts:
• |
| How the Company performed during the last several years, and what happened to the stock price during just the last year. |
• |
| The fact that the current Board has not done a good job of creating value for you. Instead, they generated very optimistic projections and want you to trust them that “this time it will be different” in the hope that you will give the Company’s nominees three more years in office. |
• |
| The fact that despite initially nominating three Company incumbents for re-election at the Annual Meeting, the Board dumped two members of their slate and are now trying to sell you on their two hand-picked replacements. (Nor did they address the question of whether without our outside pressure and our questions about the business and personal ties of these two incumbents to Leonard Riggio they would have just trotted out the same tainted incumbents and asked you to re-elect them.) |
• |
| The fact that the Board only made changes reactively after we raised questions about the Company’s poor corporate governance, including years of Board-approved related party transactions and other special treatment that has disproportionately benefited the Riggio family. |
We believe that after delivering such miserable performance year after year, the Board was rightly concerned that the stockholders would vote the incumbents out of office in favor of Yucaipa’s three new highly qualified nominees. We believe the Company dropping their incumbents from the Company’s slate at the last minute and substituting two new nominees (who were still selected by the same incumbent Board) is just a strategy to avoid the risk of an embarrassing stockholder rebuke at the ballot box.
Our three nominees have real world retail, corporate governance and technology expertise, and we believe they can make a significant contribution to the Board of Directors. Our nominees will hold management accountable for performance, including achieving management’s most recent projections.
Please send the Board a message of accountability by rejecting all three of the Company’s nominees and voting the GOLD proxy card “FOR” our three highly qualified, outside investor nominated Directors.
1
|
Stockholders Deserve a Proactive Board
Since Yucaipa started actively voicing its concerns about the Company’s corporate governance, the Board has made a number of changes in response to our pressure:
It took us questioning and bringing litigation challenging the poison pill for the Board to amend their poison pill twice in an attempt to address the concerns we raised.
Only after we questioned the qualifications and business and personal entanglements of two of the nominees on the Company’s 2010 slate did the Board drop them from the Company’s slate.
The Board announced a strategic alternatives review process.
After Leonard Riggio took advantage of a poison pill loophole to exercise out-of-the-money stock options to buy himself almost a million extra votes, the Board did nothing until we went to court. The Vice Chancellor recently entered an order prohibiting Mr. Riggio from voting those new shares at the 2010 annual meeting.
Stephen Riggio stepped down as CEO.
Do you think these changes would have been made if Yucaipa had not spoken up? Once the 2010 annual meeting has passed, will the Board go back to business-as-usual without new outside investor-nominated directors to watch what they do?
We believe Barnes & Noble’s stockholders deserve a Board that is proactive rather than reactive. Given our ability to prompt these important changes from the outside, imagine what we might accomplish if you elect our three nominees to the Board.
Help us make more positive changes at Barnes & Noble by voting the GOLD proxy card TODAY “FOR” the election of our three highly qualified director nominees and “FOR” our proposal requesting the Board to amend the poison pill to treat all stockholders the same.
2
|
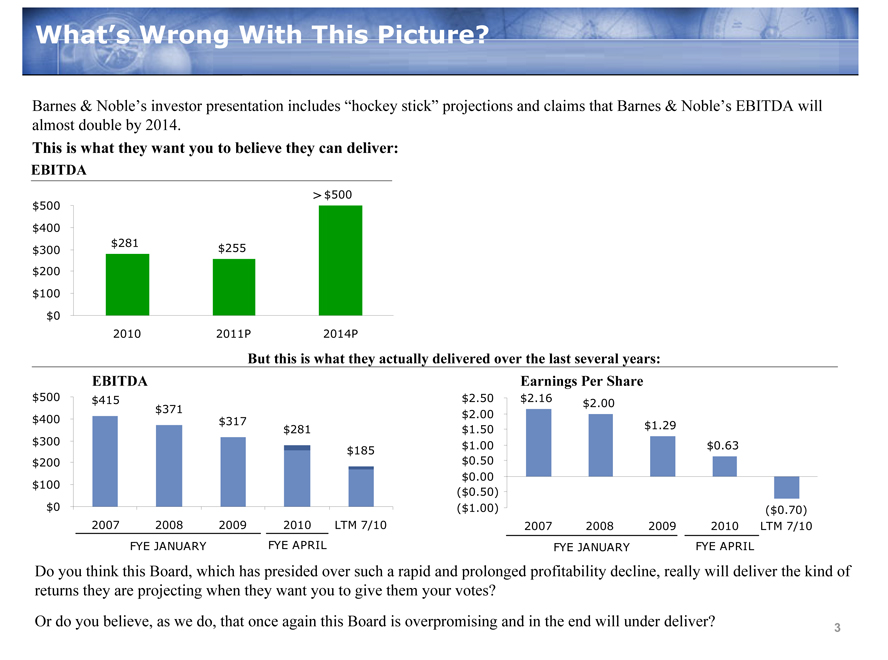
What’s Wrong With This Picture?
Barnes & Noble’s investor presentation includes “hockey stick” projections and claims that Barnes & Noble’s EBITDA will almost double by 2014.
This is what they want you to believe they can deliver:
EBITDA
$500 > $500 $400 $281 $255 $300 $200 $100 $0 2010 2011P 2014P
But this is what they actually delivered over the last several years: EBITDA Earnings Per Share
$500 $415 $371 $400 $317 $281 $300 $185 $200 $100 $0 2007 2008 2009 2010 LTM 7/10 FYE JANUARY FYE APRIL
$2.50 $2.16 $2.00 $2.00 $1.29 $1.50 $1.00 $0.63 $0.50 $0.00
($0.50)
($1.00) ($0.70) 2007 2008 2009 2010 LTM 7/10 FYE JANUARY FYE APRIL
Do you think this Board, which has presided over such a rapid and prolonged profitability decline, really will deliver the kind of returns they are projecting when they want you to give them your votes?
Or do you believe, as we do, that once again this Board is overpromising and in the end will under deliver?
3
|
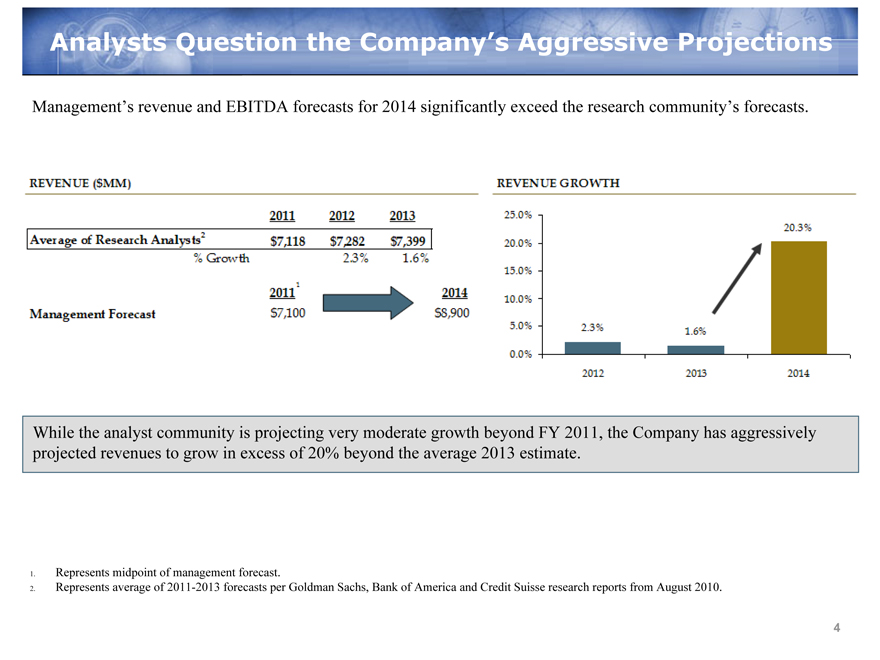
Analysts Question the Company’s Aggressive Projections
Management’s revenue and EBITDA forecasts for 2014 significantly exceed the research community’s forecasts.
REVENUE ($MM)
2011
2012
2013
Average of Research Analysts2
$7,118
$7,282
$7,399
%Growth
2.3%
1.6%
Management Forecast
20111
$7,100
2014
$8,900
REVENUE GROWTH
25.0%
20.0%
15.0%
10.0%
5.0%
0.0%
2012
2013
2014
2.3%
1.6%
20.3%
While the analyst community is projecting very moderate growth beyond FY 2011, the Company has aggressively projected revenues to grow in excess of 20% beyond the average 2013 estimate.
1. Represents midpoint of management forecast.
2. Represents average of 2011-2013 forecasts per Goldman Sachs, Bank of America and Credit Suisse research reports from August 2010.
4
|
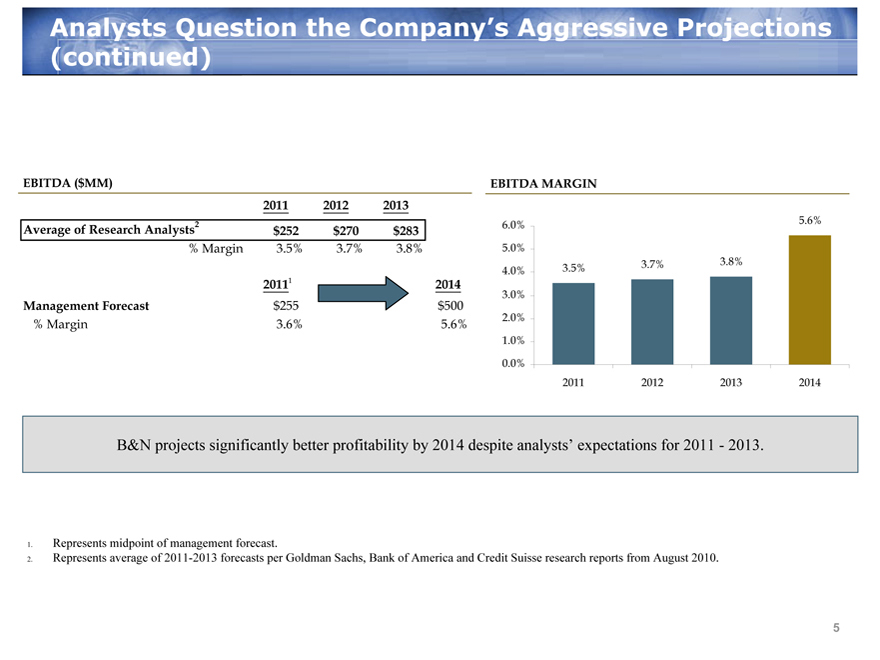
Analysts Question the Company’s Aggressive Projections (continued)
EBITDA ($MM)
Average of Research Analysts2
2011
2012
2013
$252
$270
$283
%Margin
3.5%
3.7%
3.8%
2011 1
$255
3.6%
2014
$500
5.6%
Management Forecase
%Margin
EBITDA MARGIN
6.0%
5.0%
4.0%
3.0%
2.0%
1.0%
0.0%
2011
2012
2013
2014
3.5%
3.7%
3.8%
5.6%
B&N projects significantly better profitability by 2014 despite analysts’ expectations for 2011 - 2013.
1. Represents midpoint of management forecast.
2. Represents average of 2011-2013 forecasts per Goldman Sachs, Bank of America and Credit Suisse research reports from August 2010.
5
|
Analysts Remain Skeptical
Here are just a few of the comments from the professional analysts:
• “[W]e believe it is premature to give the company credit for earning a financial return in the digital book business as its physical book business erodes, particularly as Apple’s efforts gains transaction.” Goldman Sachs, June 30, 2010 report. (Sell rating)
• “Results fell short of our forecast and, more importantly, reduced visibility on achieving objectives going forward, given two factors: (1) Additional disclosure revealed surprisingly low gross profit margins for the .com business, reflecting both sharp, structural margin cuts in the traditional (physical) .com realm, and poor underlying profitability of the digital business in aggregate (Nook + ebooks). (2) Soft superstore sales, as results missed guidance issued two-thirds of the way through the July quarter.” Goldman Sachs, August 26, 2010 report. (Sell rating)
• “We remain cautious on BKS, especially in light of the company’s stepped-up spending on technology and marketing and the lack of visibility on what the return on these investments might be.” CL King & Associates, August 24, 2010 report. (Neutral rating)
• The Company will find it “increasingly difficult to complete in the e-reader market, as it becomes more commoditized amid a continued drop in prices . . . [Amazon and Apple] have well diversified portfolios of profitable businesses to support digital initiatives and marketing budgets that cannot be matched by BKS.” Bank of America, September 15, 2010 report. (Downgrade to Underperform rating)
6
|
Our Nominees Will Emphasize Management Accountability
• Barnes & Noble paid each of its two “Co-CEOs” approximately $15 million in total compensation this year, despite the fact that they are new to their positions and have no track record leading the Company.
• Management is now promising you significant growth immediately (in FY 2011), and asking you to trust they can maintain their very aggressive projected growth trajectory through FY 2014.
• We have said all along that our goal is to help create value for all stockholders. We also have consistently said we believe the Company’s stock is undervalued and that with appropriate changes, significant value could be unlocked. No one would be happier than us if management is able to deliver on their promises.
• However, we believe that accountability is good corporate governance and critical to promoting long term success and stockholder value.
• If elected, our nominees will emphasize that management should be held accountable for their ability to deliver on their promises, and their compensation should be properly tied to the Company’s performance.
• If elected, our nominees are committed to work with their fellow directors to meet or exceed management’s projections, and to foster a culture of good corporate governance and accountability.
7
|
Barnes & Noble Wants You to Ignore Their Poor Stock Performance
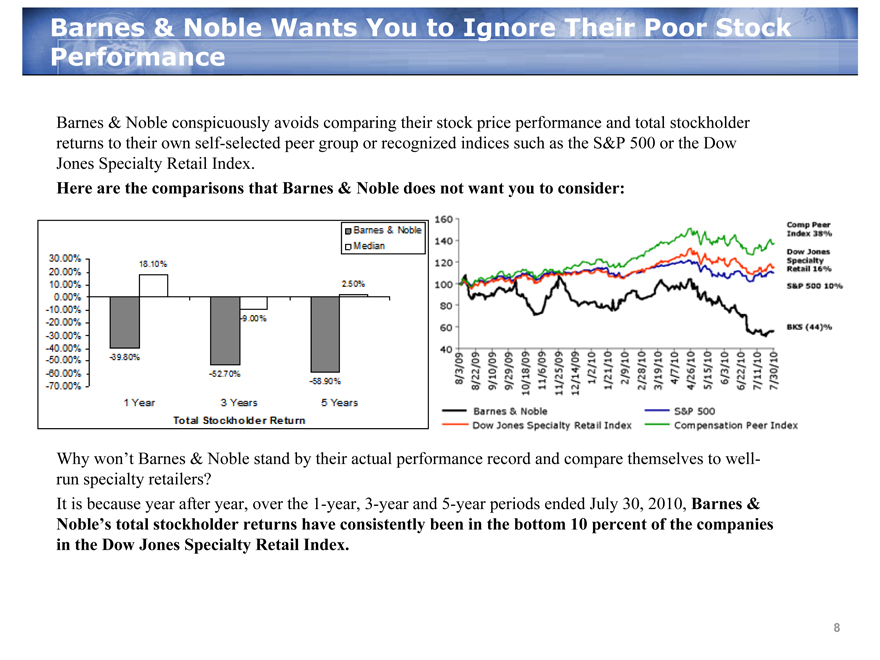
Barnes & Noble conspicuously avoids comparing their stock price performance and total stockholder returns to their own self-selected peer group or recognized indices such as the S&P 500 or the Dow Jones Specialty Retail Index.
Here are the comparisons that Barnes & Noble does not want you to consider:
30.00%
20.00%
10.00%
0.00%
-10.00%
-20.00%
-30.00%
-40.00%
-50.00%
-60.00%
-70.00%
18.10%
-39.80%
-52.70%
-58.90%
-9.00%
2.50%
1 |
| Year |
3 |
| Years |
5 |
| Years |
Barnes & Noble
Median
Total Stockholder Return
160
140
120
100
80
60
40
Barnes & Nobel
Dow Jones Specialty Retail Index
S&P 500
Compensation peer Index
8/3/09
8/22/09
9/29/09
10/18/09
9/10/09
11/6/09
12/14/09
1/2/10
1/21/10
2/9/10
2/28/10
3/19/10
4/7/10
4/26/10
5/15/10
6/3/10
11/25/09
6/22/10
7/11/10
7/30/10
Why won’t Barnes & Noble stand by their actual performance record and compare themselves to well-run specialty retailers?
It is because year after year, over the 1-year, 3-year and 5-year periods ended July 30, 2010, Barnes & Noble’s total stockholder returns have consistently been in the bottom 10 percent of the companies in the Dow Jones Specialty Retail Index.
8 |
|
|
How Low Will Barnes & Noble Go?
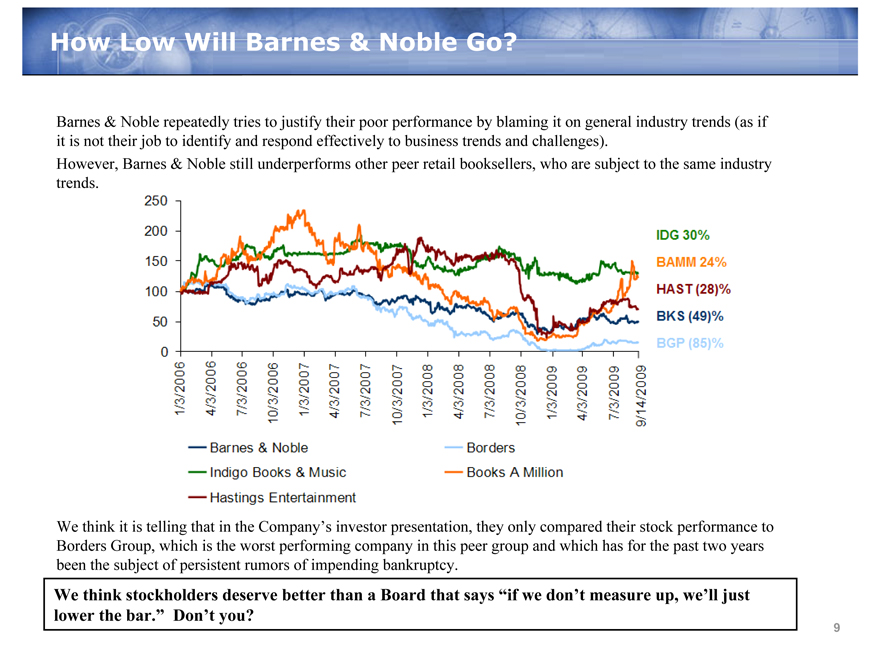
Barnes & Noble repeatedly tries to justify their poor performance by blaming it on general industry trends (as if it is not their job to identify and respond effectively to business trends and challenges).
However, Barnes & Noble still underperforms other peer retail booksellers, who are subject to the same industry trends.
250
200
150
100
50
0
Barnes & Noble
Indigo Books & Music
Hastings Entertainment
Borders
Books A Million
IDG 30%
BAMM 24%
HAST (28)%
BKS (49)%
BGP (85)%
1/3/2006
4/3/2006
7/3/2006
10/3/2006
1/3/2007
4/3/2007
7/3/2007
10/3/2007
1/3/2008
4/3/2008
7/3/2008
10/3/2008
1/3/2009
4/3/2009
7/3/2009
9/14/2009
We think it is telling that in the Company’s investor presentation, they only compared their stock performance to Borders Group, which is the worst performing company in this peer group and which has for the past two years been the subject of persistent rumors of impending bankruptcy.
We think stockholders deserve better than a Board that says “if we don’t measure up, we’ll just lower the bar.” Don’t you?
9
|
Barnes & Noble GameStop Information is Misleading
• This Board wants to claim credit for creating stockholder value from the Gamestop IPO eight years ago and the spin-off of GameStop more than five years ago. Why? Because this Board wants to distract you from the Company’s underperformance during the past five years.
• Ask yourself, if the original investment in the GameStop business was so attractive, why was Leonard Riggio (who was then the CEO and Chairman of Barnes & Noble) permitted to make that investment personally instead of Barnes & Noble?
• The Board fails to point out that Leonard Riggio made nearly four times his original investment when he sold that business (which he bought for approximately $58.5 million) to Barnes & Noble for $218 million (including earn-out payments) in 1999. If Barnes & Noble had instead made the initial investment, the stockholders would have received Leonard Riggio’s profit on that sale.
• The Board tries to convince you they should get credit for the value of the GameStop shares distributed to stockholders based on the arbitrarily selected $63.30 split-adjusted, all-time peak price for those shares, which was reached more than three years after the stock was distributed to Barnes & Noble stockholders and when Barnes & Noble had no involvement in managing the GameStop business.
• The Board doesn’t tell you GameStop’s stock closed at a split-adjusted $11.75 a share on the date it was distributed to stockholders. That price is 81% lower than the all time peak price they misleadingly want you to accept. The Board also conveniently buries in a tiny footnote the fact that the current value of those shares is 75% less than the all-time peak.
• If this Board reaches for credit for the GameStop transaction, don’t you think the Board should take responsibility for the performance of the Barnes & Noble shares actually owned by stockholders today?
10
|
The College Booksellers Transaction — Wrong Fit, Wrong Time
Barnes & Noble continues to defend the related party transaction in which Leonard Riggio took over half a billion dollars off the table and left Barnes & Noble with (a) significantly less cash, (b) over $400 million of new debt, (c) over 600 new bricks and mortar college bookstores, and (d) the technology risk of being a physical textbook seller when online sales, textbook rentals and digital technology are expected to continue to negatively impact the retail textbook business.
In fact, Barnes & Noble’s own investor presentation acknowledges the retail textbook business is in decline and must change significantly to survive, because their stated business strategy revolves largely around convincing students to migrate to digital books, convincing students to use free e-book study software, and convincing colleges to subcontract the management of their own college bookstores to Barnes & Noble.
Barnes & Noble did not need to buy a low-margin, high technology risk retail textbook business to pursue a digital textbook strategy.
In fact, Barnes & Noble could have used the same half billion dollars in cash and debt they used to buy Leonard Riggio’s college textbook business to earlier and better invest in its digital media and e-book strategy.
Instead, they depleted Barnes & Noble’s cash, loaded its balance sheet with unnecessary debt, and are now furiously funneling cash at their e-book strategy in a desperate attempt to come from behind because they failed to understand the importance of digital books at an earlier time.
We believe this Board should be held accountable for destroying more than half a billion dollars in stockholder value based on the difference between $24.04, the closing price of the Company’s stock on the last trading day before the Company announced it was buying Leonard Riggio’s college textbooks business, and the $13.82 closing price on August 2, 2010, the last trading day before the Company announced the strategic review process.
11
|
Barnes & Noble Distorts Yucaipa’s Record
In an effort to deflect attention from the Company’s track record of declining stock price and profitability, the Company has resorted to falsely attacking our record.
Barnes & Noble clearly thought that overwhelming investors with 213 footnotes in their recent stockholder letter would give their statements a veneer of legitimacy. However, the letter contained numerous misleading and irrelevant statements. Here are just some of the most glaring of Barnes & Noble’s many inaccurate statements:
KB Home. Barnes & Noble tried to smear two of our nominees by referring to an October 2009 SEC investigation regarding KB Home’s accounting and disclosure practices. Barnes & Noble failed to disclose that the SEC weeks ago dropped its accounting and disclosure practices investigation against KB Home without any finding of fault, as reported in the Los Angeles Times and numerous other media outlets.1
1 “KB Home says SEC investigation over,” Los Angeles Times (September 2, 2010).
12
|
Barnes & Noble Distorts Yucaipa’s Record (continued)
CalPERS.
Contrary to what the Company said, Yucaipa had absolutely no involvement with the California and New York attorneys general investigations involving CalPERS. Alfred Villalobos and Fred Buenrostro, two individuals Barnes & Noble cited in their letter as being involved in improper activities involving CalPERS, are in no way affiliated with Yucaipa, whether as former employees or otherwise. The Board refers to Daniel Weinstein as a “former Yucaipa manager”, but he has never been a Yucaipa manager or employee. Darius Anderson was a Yucaipa employee but he left Yucaipa more than a decade ago, and as a result Yucaipa had no involvement in or knowledge of the activities Barnes & Noble cites in their letter.
The Board also mischaracterizes Yucaipa’s relationship with former San Francisco Mayor Willie Brown. What the Board fails to disclose is that Mr. Brown was never retained by Yucaipa, that he provided legal services only to a Yucaipa portfolio company and that those services were provided more than 10 years prior to Mr. Brown becoming a member of the CalPERS board.
In addition, Yucaipa never managed the $50 million CalPERS investment referenced in Barnes & Noble’s letter, and obviously did not receive any fee for managing an investment it never managed.
It is unclear why the Board would cite any of these individuals’ names or these activities in reference to Yucaipa, other than as part of their transparent attempts to misdirect your attention from their record of persistently poor performance.
13
|
Barnes & Noble Distorts Yucaipa’s Record (continued)
FiberTech Polymers, Inc. Barnes & Noble also references a shareholder lawsuit that the plaintiffs to this day have never even bothered serving. We think that should tell you something about the merits of that claim and Barnes & Noble’s willingness to sling mud to further their own personal agenda without knowing the facts.
Simon Worldwide, Inc. The Company tries to hold Yucaipa responsible for fraud involving McDonalds’ promotions run by Simon Worldwide which predated Yucaipa’s investment in the company. After Yucaipa became an investor and the fraud was subsequently discovered, Yucaipa helped the company resolve the scandal, even though it was based on actions of which they had no knowledge and in which they were not involved.
These clear and obvious inaccuracies are just a few examples of Barnes & Noble’s willingness to twist the facts and present as “fact” unsubstantiated information in an effort to improperly discredit Yucaipa and mischaracterize our record so hopefully you will forget about their failure to deliver stockholder value.
14
|
Yucaipa Has A Record Of Successful, Constructive Investing
Yucaipa is a premier investment firm founded in 1986 by Ron Burkle.
Yucaipa has a record of fostering economic value through the growth and responsible development of companies.
We have made over 30 investments and completed mergers and acquisitions valued at more than $30 billion.
Since 1986, Yucaipa has generated over a 35% annual return.
As an investor, Yucaipa strives to work with management to strategically reposition businesses and implement operational improvements, resulting in value creation.
Yucaipa is a long-term investor. The average holding period for our realized investments is nearly four years but we have held some investments for over 20 years.
We want to work cooperatively to create long-term value for all stockholders.
Additional information about some of Yucaipa’s investments appears in Annex A.
15
|
Who is this Board Kidding?
In addition to distorting our record in their most recent fight letter, Barnes & Noble also throws in a bunch of what we believe is irrelevant information:
Nearly half of the litigation matters described in the letter were dismissed by the courts.
“In 2008, Burkle was sued in his capacity as a Yahoo director in a derivative action claiming that Yahoo’s directors breached their fiduciary duties in connection with the disclosure by Yahoo to the Chinese government of internet user information about two Chinese dissidents. Following an internal investigation, Yahoo filed a motion to dismiss that was granted in 2010.”
“There are numerous other lawsuits in which Burkle has been involved that are part of the public record.”
It is hard for us to understand how this information has any relevance, other than to distract you from the real issues Barnes & Noble does not want you to focus on: they have done a poor job managing your Company, they were late to develop a winning online internet sales strategy, and now are late to the e-book business. This Board gave Leonard Riggio half a billion dollars for a low-margin, declining college textbooks business instead of investing it on a digital media and e-book strategy that they now are telling you is the key to achieving their pie in the sky projections.
Don’t fall for Barnes & Noble’s inappropriate mudslinging and obvious attempts to misdirect you from what really matters.
16
|
Yucaipa’s Nominees Offer Relevant, Real World Experience
Yucaipa’s nominees have extensive executive and board experience in creating real stockholder value at numerous public companies:
Ronald W. Burkle: Founder of The Yucaipa Companies, has served over ten years on public company boards (including Yahoo! Inc., Occidental Petroleum Corporation and KB Home), and has extensive experience investing in and managing companies in the retail industry.
Stephen F. Bollenbach:
More than 15 years experience as a former CEO or senior executive of major companies, including Hilton Hotels Corporation, The Walt Disney Company and Marriott Corporation (former CFO).
Over 20 years experience as a director of public companies, having served on the boards of Macy’s, Inc., KB Home, Time Warner Inc., American International Group Inc., Harrah’s Entertainment, Inc., Hilton Hotels Corporation and Caesars Entertainment, Inc.
During his tenure as CEO of Hilton Hotels Corporation, the total stockholder return was 257%.
Michael S. McQuary:
CEO of Wheego Electric Cars, Inc., with more than 15 years experience as a former CEO or senior executive of technology-focused companies including EarthLink, Inc. and MindSpring Enterprises, Inc.
Approximately seven years experience as a director of public companies, having served on the boards of EarthLink, Inc. and MindSpring Enterprises, Inc.
From the time he began as COO at MindSpring through his tenure at EarthLink (the company MindSpring merged into), the total stockholder return was 490%.
17
|
Vote the GOLD Proxy Card For Real changeGoldCard For Real Change
Yucaipa is soliciting GOLD proxies to vote “FOR”:
The election of our three highly qualified nominees, Ronald W. Burkle, Stephen F. Bollenbach and Michael S. McQuary, to the nine-member staggered board of directors; and
Yucaipa’s Poison Pill amendment proposal requesting the Board to promptly amend the Poison Pill to apply the same 30% stock ownership limitation to all stockholders.
The 2010 Annual Meeting is September 28, 2010
Please vote Yucaipa’s GOLD proxy card “FOR” Yucaipa’s nominees and
“FOR” Yucaipa’s Proposal to Amend the Poison Pill Today!
If you need assistance voting your GOLD proxy card, contact:
MACKENZIE
PARTNERS, INC.
105 Madison Avenue
New York, NY 10016
bks@mackenziepartners.com
(212) 929-5500 (Call Collect) or
TOLL-FREE (800) 322-2885
18
|
Certain excerpts, data and graphs included in this presentation are from analyst reports regarding Barnes & Noble, Barnes & Noble’s investor presentation, filed on September 13, 2010 (the “BKS Presentation”) with the Securities and Exchange Commission (“SEC”), and Barnes & Noble’s shareholder letter, filed on September 13, 2010 (the “BKS Letter”) with the SEC. The projected EBITDA graph on slide 3 was produced from data in slide 5 of the BKS presentation. The excerpts on slide 16 were from the BKS Letter. Permission to reprint such excerpts, data and graphs was neither sought nor obtained.
Yucaipa has filed a definitive proxy statement and related materials with the SEC in connection with Yucaipa’s solicitation of proxies to elect its nominees to the Barnes & Noble Board of Directors and to approve its proposal to amend Barnes & Noble’s poison pill at the 2010 Annual Meeting of Stockholders. Barnes & Noble stockholders should read Yucaipa’s definitive proxy statement and its other publicly-filed proxy materials as they become available, because they contain important information. Information regarding the direct and indirect interests of Yucaipa and each other participant in the solicitation of proxies by Yucaipa are included in Yucaipa’s proxy materials filed with the SEC. Yucaipa’s proxy materials and other SEC filings may be accessed without charge at the SEC’s website at www.sec.gov.
19
|
Annex A
|
Yucaipa Investment Case Studies
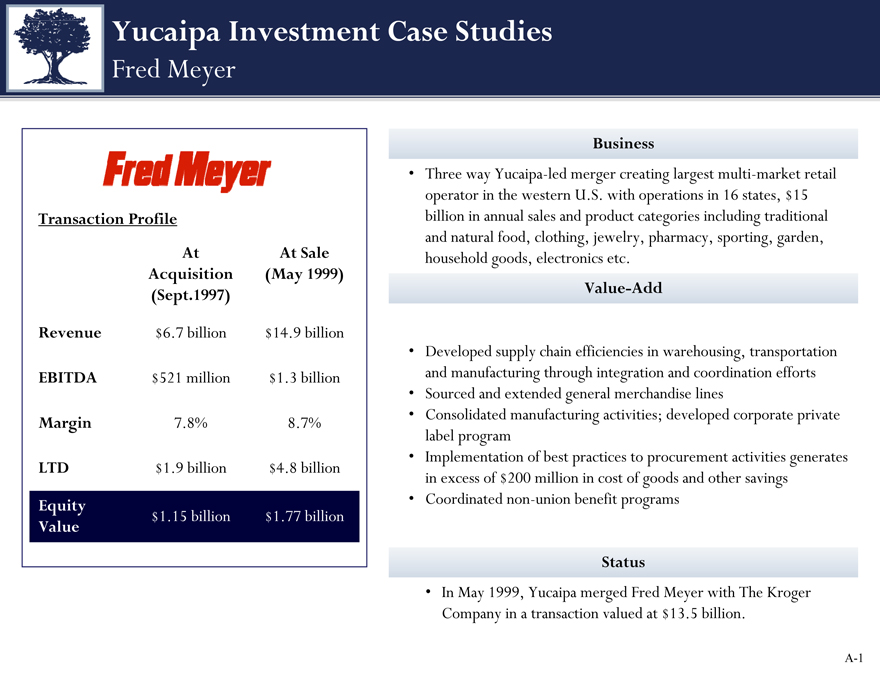
Fred Meyer
Transaction Profile
Revenue
EBITDA
Margin
LTD
Equity
Value
At
Acquisition
(Sept.1997)
$6.7 billion
$521 million
7.8%
$1.9 billion
$1.15 billion
At Sale
(May 1999)
$14.9 billion
$1.3 billion
8.7%
$4.8 billion
$1.77 billion
Business
Three way Yucaipa-led merger creating largest multi-market retail operator in the western U.S. with operations in 16 states, $15 billion in annual sales and product categories including traditional and natural food, clothing, jewelry, pharmacy, sporting, garden, household goods, electronics etc.
Value-Add
Developed supply chain efficiencies in warehousing, transportation and manufacturing through integration and coordination efforts
Sourced and extended general merchandise lines
Consolidated manufacturing activities; developed corporate private label program
Implementation of best practices to procurement activities generates in excess of $200 million in cost of goods and other savings
Coordinated non-union benefit programs
Status
In May 1999, Yucaipa merged Fred Meyer with The Kroger Company in a transaction valued at $13.5 billion.
A-1
|
Yucaipa Investment Case Studies
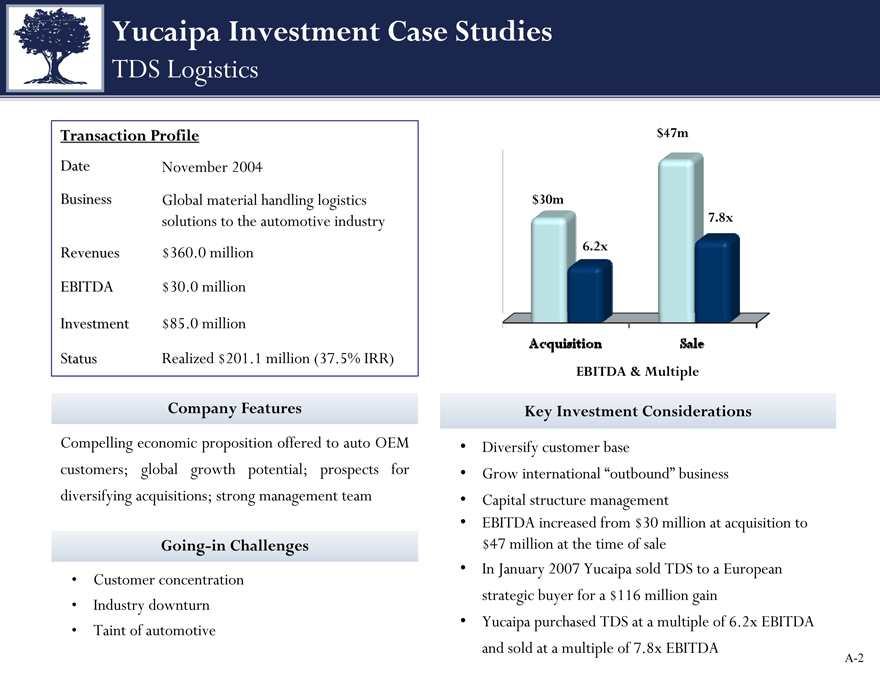
TDS Logistics
Transaction Profile
Date November 2004
Business Global material handling logistics solutions to the automotive industry Revenues $360.0 million
EBITDA $30.0 million
Investment $85.0 million
Status Realized $201.1 million (37.5%%IRR)
Company Features
Compelling economic proposition offered to auto OEM customers; global growth potential; prospects for diversifying acquisitions; strong management team
Going-in Challenges
• Customer concentration
• Industry downturn
• Taint of automotive
$47m
$30m
7.8x
6.2x
Acquisition Sale
EBITDA & Multiple
Key Investment Considerations
• Diversify customer base
• Grow international “outbound” business
• Capital structure management
• EBITDA increased from $30 million at acquisition to $47 million at the time of sale
• In January 2007 Yucaipa sold TDS to a European strategic buyer for a $116 million gain
• Yucaipa purchased TDS at a multiple of 6.2x EBITDA and sold at a multiple of 7.8x EBITDA
A-2
|
Yucaipa Investment Case Studies
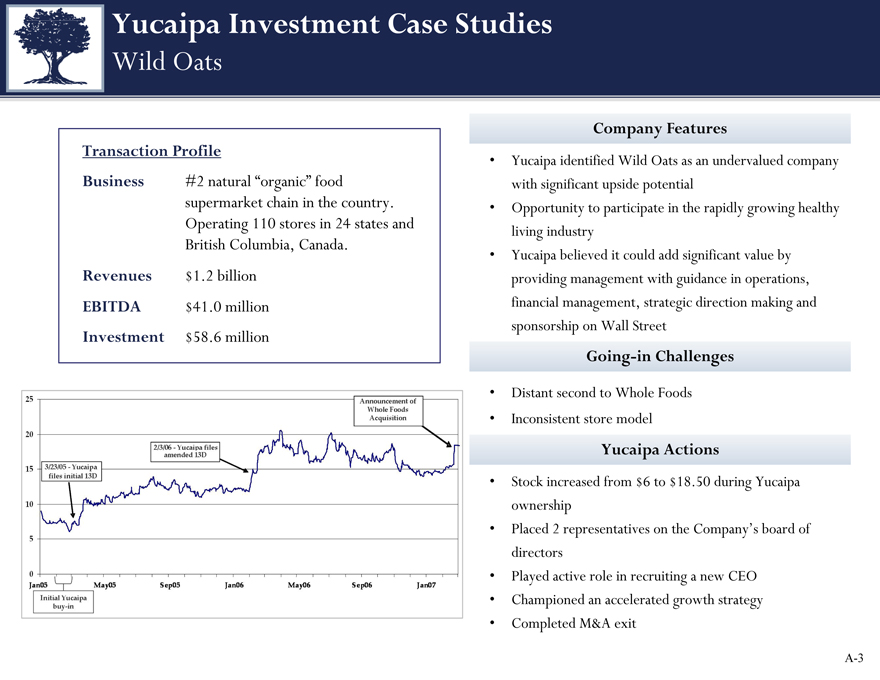
Wild Oats
Transaction Profile
Business
Revenues
EBITDA
Investment #2 natural “organic” food supermarket chain in the country.
Operating 110 stores in 24 states and British Columbia, Canada.
$1.2 billion
$41.0 million
$58.6 million
Company Features
Yucaipa identified Wild Oats as an undervalued company with significant upside potential
Opportunity to participate in the rapidly growing healthy living industry
Yucaipa believed it could add significant value by providing management with guidance in operations, financial management, strategic direction making and sponsorship on Wall Street
Going-in Challenges
Distant second to Whole Foods
Inconsistent store model
Yucaipa Actions
Stock increased from $6 to $18.50 during Yucaipa ownership
Placed 2 representatives on the Company’s board of directors
Played active role in recruiting a new CEO
Championed an accelerated growth strategy
Completed M&A exit
A-3
|
Yucaipa Investment Case Studies
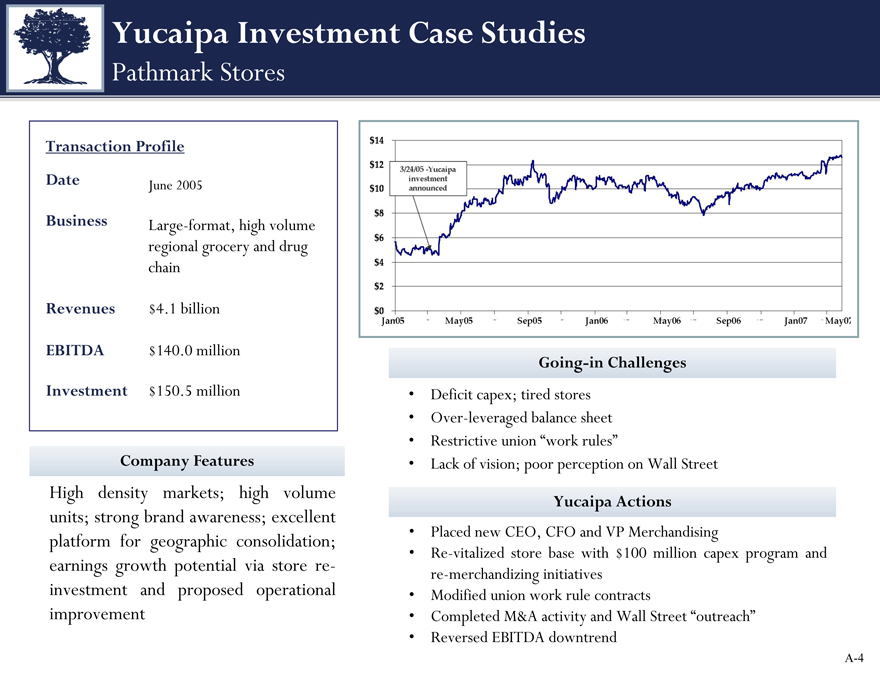
Pathmark Stores
Transaction Profile
Date
June 2005
Business
Large-format, high volume
regional grocery and drug
chain
Revenues
$4.1 billion
EBITDA
$140.0 million
Investment
$150.5 million
Company Features
High density markets; high volume units; strong brand awareness; excellent platform for geographic consolidation; earnings growth potential via store reinvestment and proposed operational improvement
Going-in Challenges
Deficit capex; tired stores
Over-leveraged balance sheet
Restrictive union “work rules”
Lack of vision; poor perception on Wall Street
Yucaipa Actions
Placed new CEO, CFO and VP Merchandising
Re-vitalized store base with $100 million capex program and re-merchandizing initiatives
Modified union work rule contracts
Completed M&A activity and Wall Street “outreach”
Reversed EBITDA downtrend
A-4
|
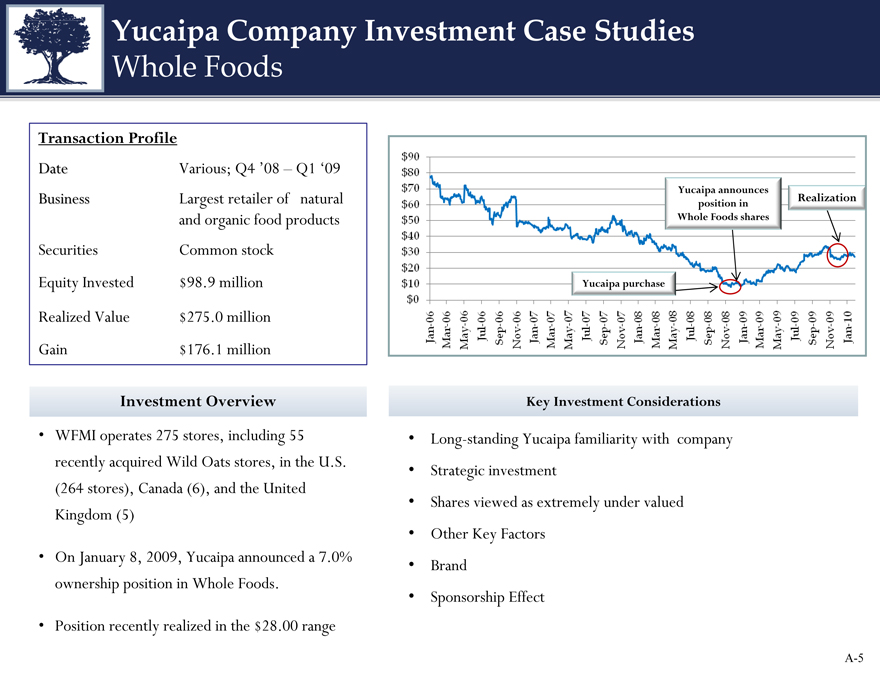
Yucaipa Company Investment Case Studies
Whole Foods
Transaction Profile
Date
Various; Q4 ‘08 – Q1 ‘09
Business
Largest retailer of natural
and organic food products
Securities
Common stock
Equity Invested
$98.9 million
Realized Value
$275.0 million
Gain
$176.1 million
Investment Overview
WFMI operates 275 stores, including 55 recently acquired Wild Oats stores, in the U.S. (264 stores), Canada (6), and the United Kingdom (5)
On January 8, 2009, Yucaipa announced a 7.0% ownership position in Whole Foods.
Position recently realized in the $28.00 range
Yucaipa announces
Realization position in Whole Foods shares
Yucaipa purchase
Key Investment Considerations
Long-standing Yucaipa familiarity with company
Strategic investment
Shares viewed as extremely under valued
Other Key Factors
Brand
Sponsorship Effect
A-5
| The Yucaipa Companies |
Analysis of Selected Public Investments by Ron Burkle/Yucaipa*
Amounts in Millions Except for Per Share Data
| Initial Investment | Exit or Current Value | Comparative S&P Return | |||||||||||||||||||||||||||||
Company | Status | Date1 | Share Price2 | Shares Out | Market Cap | Date3 | Share Price4 | Shares Out | Market Cap | CAGR7 | Value at Investment5 | Value at Exit5 | CAGR | Variance | |||||||||||||||||
Great Atlantic & Pacific | Live | 7/31/2009 | 5.81 | 57.9 | �� | 336.4 | 9/17/2010 | 3.91 | 56.2 | 219.6 | -31.4 | % | 987.5 | 1,124.7 | 12.2 | % | -43.6 | % | |||||||||||||
Pathmark | Realized | 3/24/2005 | 4.48 | 30.1 | 134.7 | 12/3/2007 | 12.85 | 57.6 | 739.8 | 88.1 | % | 1,171.4 | 1,472.4 | 8.9 | % | 79.2 | % | ||||||||||||||
Fleming Companies6 | Realized | 3/22/2001 | 23.72 | 39.8 | 942.9 | 12/18/2001 | 19.55 | 44.4 | 867.2 | -10.7 | % | 1,117.6 | 1,142.9 | 3.1 | % | -13.7 | % | ||||||||||||||
Fred Meyer | Realized | 9/9/1997 | 28.13 | 26.8 | 753.1 | 5/28/1999 | 54.38 | 156.0 | 8,484.5 | 310.4 | % | 933.6 | 1,301.8 | 21.4 | % | 289.0 | % | ||||||||||||||
Smiths Foods | Realized | 5/23/1996 | 28.13 | 25.1 | 705.1 | 9/9/1997 | 58.88 | 15.9 | 933.6 | 24.1 | % | 676.0 | 933.6 | 28.2 | % | -4.1 | % | ||||||||||||||
Dominick’s | Realized | 10/30/1996 | 19.38 | 21.4 | 413.8 | 11/17/1998 | 48.94 | 21.5 | 1,053.7 | 57.8 | % | 700.9 | 1,139.3 | 26.8 | % | 31.0 | % | ||||||||||||||
| * | These investments do not represent all of the investments made by Yucaipa and/or Ron Burkle. Past performance is not any assurance of future success. Yucaipa and/or Ron Burkle have made other investments in which the return on investment was marginal, negative or positive. |
General Notes
| 1.) | Date of Initial Investment: Reference date of first 13D or other public announcement associated with an investment |
| 2.) | Share Price at Initial Investment: Refers to price of common equity at closing on day prior. Source = Bloomberg |
| 3.) | Date of Exit (or Current Date): Reference date of final 13D or other public statement announcing Yucaipa’s exit |
| 4.) | Share Price at Exit (or Current Price): Refers to price of common equity at closing of prior day. Source = Bloomberg |
| 5.) | Value of S&P 500 at Investment & Exit (or Current Value). Source = CapitalIQ |
Investment Notes
| 6.) | Prior to initial 13D filing, at which time, the share price was $23.72, Yucaipa accumulated a meaningful position at an average price of $12.99. Accordingly, Yucaipa’s actual gross return was 55.6% as calculated on a gross basis and does not include adjustment for any incentive or other fee arrangements. This return was calculated using a time weighted IRR on actual cash flows measured on the initial investment date and the investment realization date |
Calculation Notes
| 7.) | CAGR is calculated as the annualized percentage increase in Market Capitalization during Yucaipa’s publicly announced holding period |
| The Yucaipa Companies |
Supporting Documentation for Above Analysis
Document | Date | Prior Date | Closing Price | Shares Out | Market Cap | Comment | ||||||
Great Atlantic & Pacific | ||||||||||||
SEC Form 3 | 7/31/2009 | 7/30/2009 | 5.81 | 57.9 | 336.4 | announcement of acquisition | ||||||
Pathmark | ||||||||||||
8-K | 3/24/2005 | 3/23/2005 | 4.48 | 30.1 | 134.7 | Press release issued re/Yucaipa Investment | ||||||
8-K | 12/3/2007 | 12/2/2007 | 12.85 | 57.6 | 739.8 | Last closing price before sale to A&P | ||||||
Fleming Companies | ||||||||||||
13D | 3/22/2001 | 3/21/2001 | 23.72 | 39.8 | 942.9 | announcement of acquisition | ||||||
13D | 12/18/2001 | 12/17/2001 | 19.55 | 44.4 | 867.2 | announcement of divestiture | ||||||
Fred Meyer | ||||||||||||
10-Q | 9/9/1997 | 9/8/1997 | 28.13 | 26.8 | 753.1 | Date of Smiths Merger | ||||||
News Announcement | 5/28/1999 | 5/27/1999 | 54.38 | 156.0 | 8,484.5 | Date of Kroger Merger | ||||||
Smiths Foods | ||||||||||||
Press Release | 5/23/1996 | 5/22/1996 | 28.13 | 25.1 | 705.1 | Date of Smith's merger with Smitty's | ||||||
10-Q | 9/9/1997 | 9/8/1997 | 58.88 | 15.9 | 933.6 | Date of merger with \Fred Meyer | ||||||
Dominick's | ||||||||||||
S-1 | 10/30/1996 | 10/30/1996 | 19.38 | 21.4 | 413.8 | IPO Price. Shares out from S-1 filing | ||||||
Press Release (SWY) | 11/17/1998 | 11/16/1998 | 48.94 | 21.5 | 1,053.7 | Last closing price before sale to Safeway | ||||||