SECURITIES AND EXCHANGE COMMISSION
Washington, D.C. 20549
FORM 10-K
|
|
x | ANNUAL REPORT PURSUANT TO SECTION 13 OR 15(d) OF THE SECURITIES EXCHANGE ACT OF 1934 |
|
|
| For the fiscal year ended December 31, 2008 |
|
|
| Commission file number 0-28572. |
|
|
|
| ||
OPTIMAL GROUP INC. | ||
(Exact name of registrant as specified in its charter) | ||
| ||
|
|
|
Canada |
| 98-0160833 |
(State or other jurisdiction |
| (I.R.S. Employer |
of incorporation or organization) |
| Identification No.) |
|
|
|
|
|
|
3500 de Maisonneuve Blvd. West, Suite 800, |
| (514) 738-8885 |
Montreal, Quebec, Canada, H3Z 3C1 |
|
|
(Address of principal executive offices and postal code) |
| (Registrant telephone number, including area code) |
|
|
|
Securities registered pursuant to Section 12(b) of the Act: | ||
|
|
|
Title of Each Class |
| Name of Each Exchange on Which Registered |
| ||
Class “A” shares, no par value |
| Nasdaq Stock Market |
|
|
|
Securities registered pursuant to Section 12(g) of the Act: | ||
None | ||
|
|
|
|
|
|
Indicate by check mark if the registrant is a well-known seasoned issuer, as defined in Rule 405 of the Securities Act |
| Yes o No x |
Indicate by check mark if the registrant is not required to file reports pursuant to Section 13 or Section 15(d) of the Act |
| Yes o No x |
Indicate by check mark whether the registrant (1) has filed all reports required to be filed by Section 13 or 15 (d) of the Securities Exchange Act of 1934 during the preceding 12 months (or for such shorter period that the registrant was required to file such reports), and (2) has been subject to such filing requirements for the past 90 days. |
| Yes x No o |
Indicate by check mark if disclosure of delinquent filers pursuant to Item 405 of Regulation S-K is not contained herein and will not be contained, to the best of registrant’s knowledge, in definitive proxy or information statements incorporated by reference in Part III of this Form 10-K or any amendment to this Form 10-K |
| x |
Indicate by check mark whether the registrant is a large accelerated filer, an accelerated filer, a non-accelerated filer, or a smaller reporting company. See the definitions of “large accelerated filer”, “accelerated filer” and “smaller reporting company” in Rule 12 b-2 of the Exchange Act (Check one): |
|
|
|
|
|
|
Large Accelerated filer o | Accelerated filer x | Non-accelerated filer o | Small reporting company o |
(Do not check if a smaller reporting company) | |||
|
|
Indicate by check mark whether the registrant is a shell company (as defined in Rule 12b-2 of the Act). | Yes o No x |
Aggregate market value of the voting stock of the registrant held by non-affiliates of the registrant as of June 30, 2008 (computed by reference to the last reported sale price of the Class “A” shares on the Nasdaq Global Market on such date): $52,221,629. For purposes of this calculation, only executive officers and directors are deemed to be affiliates of the registrant.
Number of Class “A” shares outstanding at February 27, 2009: 25,742,223
DOCUMENTS INCORPORATED BY REFERENCE: NONE.
TABLE OF CONTENTS
Each of Optimal, Optimal Group, Optimal Payments, WowWee, WowWee Robotics, WowWee Flytech, WowWee Alive, WowWee Technologies, Think Wow Toys, Robosapien, Roboraptor, Roboreptile, Robopet, Robopanda, Roboquad, Roboboa, Femisapien, RS Tri-bot, Roborover, Joebot, Flytech Dragonfly, Fun Flyer Moth, Fun Flyer Mosquito, Fun Flyer Butterfly, FlyTech Bladestar, FlyTech Dragon, Flytech Bat, Lightstar, Hoverpod, Crash-FX, Facetronics, Sleeping Cuties, Rovio, True Track, Cinemin and associated logos, are trademarks or registered trademarks of our company or an affiliate of our company. Disney Fairies Tinkerbell and Silvermist, Elvis, Hannah Montana, High School Musical, Jonas Brothers, Winnie the Pooh, Mr. Men Little Miss, Mad Libs, Thumb Wrestling Federation (TWF), In My Pocket, Chuck E Cheese, Hershey, Texas Instruments DLP Technology, Apple, iPod, iPhone, U-Scan and all other trademarks appearing in this annual report are the property of their respective owners.
2
In this Form 10-K, except where otherwise indicated, references to “dollars” or “$” are to United States dollars, references to “Cdn$” are to Canadian dollars, references to our “common shares” are to our Class “A” shares and all references to “our consolidated financial statements” are to our audited consolidated financial statements, which are included in “Item 8. Financial Statements and Supplementary Data.”
Our consolidated financial statements are prepared on the basis of generally accepted accounting principles (“GAAP”) in Canada, which is different in some respects from U.S. GAAP. For a description of the material differences between Canadian GAAP and U.S. GAAP in regard to our consolidated financial statements, see note 25 of the notes to our consolidated financial statements.
Cautionary Statements Regarding Forward-Looking Statements
This Form 10-K contains certain forward-looking statements within the meaning of Section 27A of the Securities Act of 1933 and Section 21E of the Securities Exchange Act of 1934. Words such as “expects”, “intends”, “anticipates”, “plans”, “believes”, “seeks”, “estimates”, or variations of such words and similar expressions are intended to identify such forward-looking statements. Forward-looking statements include, but are not limited to, statements about our current expectations with respect to our future growth strategies, results, opportunities and prospects, competitive position and industry environment. These forward-looking statements are subject to a number of risks, uncertainties and other factors that could cause our actual results, performance, prospects or opportunities, or those of the markets we serve, to differ materially from those expressed in, or implied by, these forward-looking statements, including:
|
|
|
| • | existing and future governmental regulations and disputes with governmental authorities; |
|
|
|
| • | general economic, legal and business conditions in the markets we serve; |
|
|
|
| • | our ability to continue to satisfy Nasdaq’s conditions for continued listing of our common shares on The NASDAQ Global Market; |
|
|
|
| • | consumer confidence in the security of financial information transmitted via the Internet; |
|
|
|
| • | levels of consumer and merchant fraud, disputes between consumers and merchants and merchant insolvency; |
|
|
|
| • | liability for merchant chargebacks; |
|
|
|
| • | our ability to safeguard against breaches of privacy and security when processing electronic transactions and use of our payments systems for illegal purposes; |
|
|
|
| • | the imposition of and our compliance with rules and practice procedures implemented by credit card associations; |
|
|
|
| • | our ability to protect our intellectual property; |
|
|
|
| • | our relationships with our suppliers and the banking associations that we rely upon to process our electronic transactions; |
|
|
|
| • | disruptions in the function of our electronic payments systems and technological defects; |
|
|
|
| • | our ability to complete, integrate and benefit from acquisitions, divestitures, joint ventures and strategic alliances; |
|
|
|
| • | our ability to retain key personnel; |
|
|
|
| • | currency exchange rate fluctuations; |
|
|
|
| • | while we believe that our cash, cash equivalents and short-term investments will be adequate to meet our operating needs for at least the next 12 months, our existing cash, cash equivalents and short-term investments could prove to be inadequate to meet our funding requirements; |
3
|
|
|
| • | our ability to successfully implement our strategies for our recently acquired WowWee business; |
|
|
|
| • | changing consumer preferences for electronics and play products; |
|
|
|
| • | the seasonality of retail sales; |
|
|
|
| • | concentration among our major retail customers for the products of our WowWee business; |
|
|
|
| • | economic, social and political conditions in China, where WowWee’s products are manufactured; |
|
|
|
| • | the price and supply of raw materials used to manufacture WowWee’s products; |
|
|
|
| • | product liability claims and product recalls; |
|
|
|
| • | increased competition; |
|
|
|
| • | litigation; and |
|
|
|
| • | the other risks, uncertainties, trends and other factors discussed under the headings “Item 7. Management’s Discussion and Analysis of Financial Condition and Results of Operations”, “Item 1A. Risk Factors” and “Item 1. Business” and elsewhere in this annual report. |
There may be additional risks and uncertainties and other factors that we do not currently view as material or that are not necessarily known. The forward looking statements made in this annual report are only made as of the date of this annual report.
Except as required by applicable securities laws, we undertake no obligation to publicly update or revise any forward-looking statement, whether as a result of new information, future events, changes in circumstances or any other reason after the date of this annual report.
The Private Securities Litigation Reform Act of 1995 provides a “safe harbor” for forward-looking statements to encourage companies to provide prospective information about their companies without fear of litigation. We are relying on the “safe harbor” provisions of the Private Securities Litigation Reform Act in connection with the forward-looking statements included in this annual report.
|
|
BUSINESS |
Company Overview
We operate in two business segments. Through WowWee (our business segment comprised of WowWee Group Limited, WowWee Canada Inc., WowWee USA, Inc. and WW Sablon Holdings), we design, develop, market and distribute technology-based, consumer robotic, toy and entertainment products. Through Optimal Payments Corp., we process credit card payments for two portfolios of small and medium-sized retail point-of-sale merchants and continue to receive residual payments from a third portfolio.
Our Corporate Organization
Our company was formed in 1984 and is incorporated under the federal laws of Canada. We entered the consumer robotic, toy and entertainment products business segment by the acquisition in November 2007 (see note 5 (a) of the notes to our consolidated financial statements) and we entered the credit card payment processing business segment through the acquisition of Terra Payments Inc. in April 2004. Our principal office is located at 3500 de Maisonneuve Blvd. West, Suite 800, Montreal, Quebec, H3Z 3C1, and our telephone number is (514) 738-8885.
Our Industry Segments
During 2008, we operated in two segments: WowWee (consumer robotic, toy and entertainment products) and Optimal Payments (payment processing) (see note 19 of the notes to our consolidated financial statements).
4
WOWWEE
Our Products
Based in Hong Kong, with offices in Carlsbad, California, New York, New York, Montreal, Quebec, and Wauthier-Braine, Belgium, WowWee designs, develops, markets and distributes technology-based, consumer robotic, toy and entertainment products that can be sold at a variety of price points.
For 2009, WowWee’s product offering encompasses five distinct lines:
|
|
|
| • | WowWee Robotics |
| ||
| • | WowWee Flytech |
| ||
| • | WowWee Alive |
| ||
| • | Think Wow Toys |
| ||
| • | WowWee Technologies |
WowWee Robotics
WowWee is best known for its “robo” line of consumer robotic products. Robosapien, introduced in 2004, was the first in a line of award winning entertainment robotic products that incorporate applied biomorphic robotics technology and are uniquely programmed to perform a variety of functions. The WowWee Robotics line currently includes:
|
|
|
| • | Robosapien, a robotic humanoid |
| ||
| • | Roboraptor, a robotic dinosaur |
| ||
| • | Roboreptile, a robotic reptile |
| ||
| • | Robopet, a robotic dog |
| ||
| • | Robopanda, a touch sensitive robotic panda bear |
| ||
| • | Roboquad, a robotic quadruped |
| ||
| • | Roboboa, a robotic snake |
| ||
| • | Femisapien, a female robot |
| ||
| • | Tri-bot, a quick-moving, talkative, interactive robot |
In 2009, the WowWee Robotics line will include the following new products:
|
|
|
| • | Roborover, a tread-based, talking, roving explorer robot complete with sensor-based LED headlights |
| ||
| • | Joebot, a content-packed, walking, talking interactive robot with an expressive LED face featuring voice command control |
Each of the foregoing items bears the iconic “Robohead” symbol to signify that it is a “fusion of technology and personality”.
Also, new in 2009 are NASCAR branded Zipbot vehicles – battery-operated mini vehicles on bristle bases which are propelled by a gentle vibrating action.
WowWee also markets battery-operated “mini” as well as “nanomini” versions of most of its robotic characters.
WowWee FlyTech
In 2007, WowWee introduced the FlyTech Dragonfly, expanding its product line to include the flight segment. FlyTech Dragonfly, the first commercially available radio controlled ornithopter, was recognized by TIME magazine as one of “The Best Inventions of the Year”.
5
The WowWee FlyTech line currently includes:
|
|
|
|
|
| - | Bladestar, with onboard sensors that enable it to detect and avoid obstacles |
| |||
|
| - | Fun Flyer Moth, Mosquito and Butterfly, easy to use “charge and go” ornithopters |
| |||
|
| - | Bat and Dragon, ornithopters capable of hovering flight |
| |||
|
| - | Disney Fairies Tinkerbell, an easy to use vertical flying version of the loved Disney character |
In 2009, the WowWee FlyTech line will include the following new products:
|
|
|
|
|
| - | Lightstar, an easy to use flyer with built-in LED lights that create a glowing halo-effect |
| |||
|
| - | Hoverpod, a fast moving vehicle capable of moving across carpet, as well as smooth surfaces |
| |||
|
| - | Crash-FX, a toy vehicle that explodes into pieces upon impact and can be quickly reassembled with the “easy- snap” system |
| |||
|
| - | Disney Fairies Silvermist vertical flyer |
WowWee Alive
In 2005, WowWee introduced its WowWee Alive brand, based on highly sophisticated, proprietary Facetronics animatronic technology. The technology was embedded into a realistic Chimpanzee, followed by an Elvis Presley likeness that was introduced in 2007.
In 2008, WowWee Alive introduced the Alive Cubs life-like plush animals that come “alive” when nurtured. Touch sensors trigger animated facial and vocal expressions; tilt sensors trigger responses to positional changes.
Available in four styles – Lion, White Tiger, Panda and Polar Bear - the WowWee Alive Cubs were the featured toy in TIME magazine’s “The Best Inventions of the Year/Tech Buyer’s Guide”.
In 2009, the WowWee Alive brand will be expanded to include:
|
|
| - WowWee Alive II, four new styles including Alive Seal Pup, Husky Puppy, Koala Joey and Leopard Cub |
| |
| - WowWee Alive Minis, collectible versions of the Lion, White Tiger, Panda and Leopard with sound activating feeding bottle, touch and tilt sensors |
| |
| - WowWee Alive Sleeping Cuties, Labradoodle and Beagle puppies who respond to touch by curling up into a sleeping position, and raising their heads when awakened |
Think Wow Toys
Think Wow Toys (TWT), a division of WowWee USA, Inc. with an office located in New York City, develops, manufactures and markets various novelty and plush toys at a variety of price points. TWT products include plush, pillows, novelty food, action figures, dolls, and fashion accessories primarily based on well known third party brands.
TWT’s portfolio of licenses for 2009 include but are not limited to Disney’s Fairies and Princess, Hannah Montana, High School Musical, Jonas Brothers and Winnie the Pooh, Mr. Men Little Miss, Mad Libs, Thumb Wrestling Federation (TWF), In My Pocket and more. In addition, TWT has acquired several food brand licenses including Chuck E Cheese and Hershey and is manufacturing a variety of food decorating and functional play kits based on these well known brands.
TWT sells its products directly through its sales group and through independent sales representatives. Purchasers of the TWT’s products are retail chain stores, department stores, mass merchandisers, toys specialty stores and wholesalers. Due to the TWT’s broad selection of products and key prices points (most products retail under $30.00) its products are sold to a wide variety of retail accounts.
WowWee Technologies
Rovio, a wi-fi enabled mobile webcam, was introduced at the Consumer Electronics Association 2008 International CES as the first product in the WowWee Technologies line. Rovio can be controlled remotely from
6
anywhere in the world using a web-enabled device, including a PC, Mac, cell or smart phone, PDA, or video game console, allowing the user to view and interact with its environment through streaming video and audio. The Rovio device features the True Track navigation system which allows it to locate and navigate user-defined waypoints in the immediate environment. Rovio was selected as an Innovations 2009 Design and Engineering Award honoree by the Consumer Electronics Association in the Personal Electronics product category.
In 2009, WowWee Technologies is launching the Cinemin suite of ultra-portable, multimedia pico projectors, powered by Texas Instruments’ DLP Technology, for ultra clear picture quality. The Cinemin projectors have been designed to work with popular mobile devices such as the Apple iPod and iPhone. The Cinemin Swivel is an affordable lightweight micro projector that features 3-hour battery life, full volume control and a unique 90- degree hinge for ceiling projection; the Cinemin Stick features internal memory and an expandable SD card memory slot; the Cinemin Station is an alarm clock sized media center with an iPod docking station.
Our Competitive Strengths
We believe that WowWee’s key competitive strengths are in product development, engineering and design, including its ability to work with third party manufacturers, technology suppliers and intellectual property owners to develop innovative consumer technology-based products.
We believe that WowWee’s core competency is its ability to identify cutting-edge technologies and, through its flexible design process, to incorporate these technologies in the development of innovative products. The Cinemin suite of products, incorporating Texas Instruments’ DLP technology; the FlyTech products, incorporating technologies that allow for unique performance capabilities and play patterns; Roborover, loaded with features and content and very sharply priced, are some current examples of this core competency.
WowWee has developed robust partnerships with high quality Chinese manufacturers that have demonstrated their commitment to WowWee by investing in advanced manufacturing methodologies and human resources to support WowWee’s product development process. WowWee’s design and engineering team takes a “hands-on” approach, managing these manufacturing relationships with a view to ensuring that each product is manufactured and assembled at the highest quality levels.
Our Business Strategy
We expect to implement specific strategies in order to enhance WowWee’s growth and financial performance. These strategies include:
|
|
|
| • | expanding sales and distribution through a broadening of the sales channels, particularly outside North America; |
| ||
| • | shifting reliance on an international distributor network to direct sales and distribution; |
| ||
| • | refining product design, development and production capabilities to produce a broader assortment of products at varying price points; |
| ||
| • | expanding development initiatives into products that combine computer connectivity, utility and entertainment; |
| ||
| • | adjusting and smoothing out the seasonality of revenues; |
| ||
| • | embarking on branded entertainment initiatives, licensing, publishing and merchandising; and |
| ||
| • | evaluating potential acquisition opportunities. |
7
Our Customers
WowWee products are sold in a range of brick and mortar channels including grocery stores, pharmacies, toy shops, department stores and high-end consumer technologies stores. Key North American retail customers include:
|
|
|
| • | Best Buy |
| ||
| • | Costco |
| ||
| • | Home Shopping |
| ||
| • | J.C. Penney |
| ||
| • | Macy’s |
| ||
| • | QVC |
| ||
| • | Radio Shack |
| ||
| • | Sam’s Club |
| ||
| • | Sears/K-Mart |
| ||
| • | Target |
| ||
| • | Toys “R” Us |
| ||
| • | Wal-Mart |
Each of these retail customers, as well as most other brick and mortar retail customers in the U.S., also carry the full line of WowWee products on their Internet sales sites. Online sales of WowWee’s products are also made through Internet-based “e-tailers” such as Amazon and Buy.com.
Manufacturing
WowWee’s products are predominantly produced in China by third party manufacturers, many with whom WowWee has long-standing relationships. Consistent with industry practice, the use of third party manufacturers allows WowWee to avoid incurring fixed manufacturing costs, while improving flexibility, capacity and production technology.
By outsourcing its manufacturing process, WowWee maintains a flexible business model that enables it to be responsive to changing technology. In addition, once a product has reached its commercialization phase, WowWee is able to minimize inventory risk by manufacturing products based upon actual customer orders; however, certain customer orders may be subject to cancellation. Upon final assembly, products can be shipped directly from the manufacturing locations to retailers and distributors, with title to the products passing to retail customers in the country of origin.
Although WowWee does not conduct the day-to-day manufacturing of its products, it is extensively involved in the design of the product prototype and production tools, dies and molds for its products and seeks to ensure quality control by actively reviewing the production process and testing the products produced by its manufacturers. WowWee employs quality control inspectors who rotate among its manufacturers’ factories to monitor the production of substantially all of its products.
WowWee’s quality assurance personnel advise as to compliance with applicable regulations during each phase of product development, and perform compliance testing, and coordinate third party independent compliance testing, on all WowWee products. See “Government Regulation” below. Once pre-production testing has been completed and product production has been approved, WowWee’s quality assurance personnel monitor production at the manufacturer’s facility for compliance with WowWee’s quality requirements.
Suppliers
The principal raw materials used in the production and sale of WowWee’s products are plastics, metals, plush, integrated circuits and standard electronic components, most of which are currently available from a variety of sources. In certain instances, WowWee purchases components under license from the rights holder. Although WowWee does not manufacture its products, it owns the tools, dies and molds used in the manufacturing process, and these are transferable among manufacturers should WowWee choose to employ alternative manufacturers.
8
Sales, Marketing and Distribution
Within the United States and Canada, WowWee sells its products directly to its retailer customers through its direct sales channel, through independent sales representatives and through distributors. As of January 1, 2009, WowWee products are sold to most European countries directly through WowWee Europe, a recently established subsidiary resulting from the acquisition of Sablon Distribution SA, a former independent distributor – see “Recent Developments” below. For retailers in the rest of the world, WowWee utilizes a network of distributors located in various jurisdictions. WowWee products are also available for sale through WowWee’s Internet-based store (http://www.wowweestore.com). In 2008, approximately 62% of its products were sold in North America, with the balance being sold internationally.
WowWee does not have written agreements with its customers. Instead, sales are made based on purchase orders, primarily against letters of credit. The majority of orders are traditionally written during the first two quarters of the year, with shipments occurring throughout the year as new product becomes available. The majority of the product shipments occur during the third and fourth quarters of the year.
WowWee presents products to its customers at trade shows, such as International CES, and various toy fairs, as well as at private meetings throughout the year. WowWee generally introduces new products to its major customers during the year prior to the year of their introduction for retail sale. WowWee employs a range of advertising and promotional vehicles to promote its products to consumers including broadcast, Internet and print advertising, PR outreach, product placements and sampling and exhibition at consumer expositions. WowWee also maintains a corporate website and individual sites for its brands and products.
WowWee products have been recognized for excellence in technology, design and quality by numerous organizations around the world; including over 30 awards and commendations garnered by the 2008 product line.
In 2008, products from the WowWee Robotics product line were a featured toy in McDonald’s Happy Meal boys brand in Europe, the Middle East and Latin America, following a successful program in most McDonald’s territories worldwide during 2007.
Research and Development; Product Development
WowWee’s engineering and design team develops new technologies using internal capabilities and seeks to identify emerging or underutilized innovations that are currently being developed or that are available in the marketplace. In order to leverage the man-hours invested in prior products, older generations of products frequently form the foundation for the next generation of products as well as new product lines. New technologies are then integrated to enhance the overall functionality of the product.
In sourcing technologies, WowWee reviews the latest technology innovations at trade-shows, conferences, colleges and universities, on the Internet, and through word-of-mouth. WowWee regularly reviews technologies or product concepts from third party sources that it believes could have potential synergies with WowWee’s current product line or that could be successfully commercialized based upon WowWee’s development process.
WowWee generally brings all sought-after third party technologies in-house, but once inside, allows its internal engineering and design team to develop new product concepts with relative autonomy. WowWee also licenses third party technologies for development within unique consumer applications developed by WowWee.
In the course of its product development, WowWee leverages its retail relationships to help gauge potential consumer demand. WowWee conducts “roadshow” meetings with its key retail customers to solicit immediate feedback on its new product concepts. Based upon this early feedback, WowWee determines the course of further development or, as necessary, modifies the products. In the early phases of product development, WowWee works with its third party manufacturers to engineer a manufacturing prototype to determine if the potential product can be manufactured on a commercially viable scale. Once further development work has been conducted, and a preliminary sample is available, WowWee moves to solicit further feedback from key retail customers, and begins to take preliminary orders for the product. If the initial orders from these key retail customers indicates that the product might achieve sufficiently profitable unit sales, WowWee continues its development work and initiates the product tooling process with one of its product manufacturers.
Safety testing of WowWee’s products is done at the manufacturers’ facilities by quality control personnel employed by WowWee or by independent third party contractors engaged by WowWee. Safety testing is designed to ensure compliance with applicable product safety regulations (see “Government Regulation” below). In addition,
9
certain of WowWee’s larger customers use independent laboratories to test WowWee’s products according to their own standards before shipment.
Government Regulation
As a developer and supplier of consumer products, WowWee operates in a highly regulated environment in the United States and international markets. In the United States, WowWee’s products are subject to the provisions of the Consumer Product Safety Act (“CPSA”), the American Society for Testing and Materials (“ASTM”), Underwriters Laboratories (“UL”), the Federal Hazardous Substances Act (“FHSA”), the Flammable Fabrics Act (“FFA”) and the regulations promulgated thereunder, as well as the rules and regulations of the Federal Communications Commission (“FCC Rules”). The CPSA and the FHSA enable the Consumer Products Safety Commission (“CPSC”) to exclude from the market consumer products that fail to comply with applicable product safety regulations or otherwise create a substantial risk of injury, and articles that contain excessive amounts of a banned hazardous substance. The FFA enables the CPSC to regulate and enforce flammability standards for fabrics used in consumer products. The FCC Rules require conformity with technical standards that limit radio frequency emissions in order to control potential interference to radio communications. Similar laws exist in various international markets. WowWee maintains a quality control program designed to ensure compliance with all applicable laws (see “Research and Development; Product Development” above). Regulations that apply to the sale of WowWee’s products also include guidelines for advertising directed toward children.
Competition
WowWee competes with numerous domestic and foreign manufacturers, importers and marketers in each of its product categories. Globally, certain of WowWee’s competitors have greater financial resources, larger sales and marketing and product development departments, stronger brand name recognition, longer operating histories and benefit from greater economies of scale.
Intellectual Property
All of WowWee’s products are produced and sold under trademarks owned by it or, in certain cases, licensed to it. WowWee typically registers its trademarks in certain jurisdictions where its products are sold. WowWee also files design patents in China and other jurisdictions for most of its products and has recently instituted a program under which utility patents will be filed where it is deemed appropriate as a means of protecting WowWee’s proprietary technology.
WowWee maintains ownership of all of the tooling associated with its products.
Employees
As of December 31, 2008, we employed 162 full-time employees. Its employees are not represented by any collective bargaining unit and it has never experienced a work stoppage. We believe that our employee relations are good.
OPTIMAL PAYMENTS
Optimal Payments Corp. processes credit card payments for retail point-of-sale merchants. Optimal Payments generates revenues primarily from fees charged to merchants for processing services. Fees charged to merchants typically include a discount rate, based upon a percentage of the dollar amounts processed, and a variety of fixed transaction fees. Merchant fees charged are based primarily upon the merchant’s transaction volume. Other fees are derived from a variety of fixed transaction fees, including fees for monthly minimum charge volume requirements, statement fees, annual fees and fees for other miscellaneous items, such as handling chargebacks. Revenue is recognized primarily at the time the transaction is performed.
Following the sales in 2008 and 2009 of assets of our payment processing segment, our involvement in this segment is limited to: (i) the processing by Optimal Payments Corp. of credit card payments for two portfolios of small and medium-sized retail point-of-sale merchants - Optimal Payments Corp. has subcontracted the customer service and sales agent management responsibilities related to these portfolios to an independent third party; and (ii) Optimal Payments Corp.’s receipt of a stream of residual payments under a card-present merchant portfolio – this portfolio is managed by United Bank Card, Inc.
10
Financial Information About Segments and Geographic Areas
See note 19 of the notes to our consolidated financial statements.
Where You Can Find Additional Information
We are required to furnish to our shareholders annual reports containing audited consolidated financial statements certified by our auditors and quarterly reports containing unaudited financial data for the first three quarters of each fiscal year following the end of the respective fiscal quarter. We prepare our consolidated financial statements in accordance with accounting principles which are generally accepted in Canada with a reconciliation to accounting principles generally accepted in the United States.
You may request a copy of these filings, at no cost, by writing or telephoning us at the following address or telephone number:
|
|
| Optimal Group Inc. |
| 3500 de Maisonneuve Boulevard West |
| Suite 800 |
| Montreal, Quebec, H3Z 3C1 |
| Tel: (514) 738-8885 |
We file Annual Reports on Form 10-K, Quarterly Reports on Form 10-Q, and Current Reports on Form 8-K with the Securities and Exchange Commission. You may read and copy any materials we file with the Securities and Exchange Commission at the Commission’s Public Reference Room at 450 Fifth Street, NW, Washington, DC 20549. You may obtain information on the hours of operation of the Securities and Exchange Commission’s Public Reference Room by calling the Commission at 1-800-SEC-0330. The Securities and Exchange Commission maintains an Internet site (http://www.sec.gov) that contains reports, proxy and information statements, and other information regarding issuers that file electronically with the Commission. Such reports and all amendments to such reports regarding the Company are available free of charge or through the Company’s website, www.optimalgrp.com, as soon as reasonably practicable after such reports are electronically filed with the Securities and Exchange Commission. Information contained in or otherwise accessed through our website does not form part of this Report. All such references to our website are inactive textual references only.
|
|
RISK FACTORS |
An investment in our common shares involves a high degree of risk. You should carefully consider the risks described below before making an investment decision. Our business, financial condition and results of operations could be materially and adversely affected by any of these risks. The trading price of our common shares could decline due to any of these risks or other factors, and you may lose all or part of your investment. The risks described below are those that we currently believe may materially affect us.
If the current global economic conditions continue to deteriorate and the current financial crisis deepens, WowWee’s business and our financial results may continue to be adversely affected.
The recent global economic deterioration and financial crisis adversely affected WowWee’s business and our financial results in 2008. WowWee designs, manufactures and markets a wide variety of consumer robotic, toy and entertainment products worldwide. WowWee’s sales of these products are affected by the level of discretionary consumer spending, which has deteriorated sharply in the United States and in many countries around the world in which WowWee’s products are sold. Consumers’ discretionary purchases of consumer robotic, toy and entertainment products may be negatively affected by job losses, foreclosures, bankruptcies, reduced access to credit, significantly falling home prices, lower consumer confidence and other macroeconomic factors that curtail consumer spending behavior. If WowWee’s retail customers encounter liquidity problems due to weak retail sales or their inability to raise sufficient capital due to credit constraints, WowWee may not be able to collect accounts receivable from the affected customers. Finally, many of the ultimate effects and consequences of the current global economic crisis are not yet known. Any one or all of these factors could potentially have a material adverse effect on WowWee’s liquidity and capital resources, including increasing our cost of capital or our ability to raise additional capital if needed, or otherwise negatively affect WowWee’s business and our financial results.
11
Liquidity problems or bankruptcy of WowWee’s key customers could have a material adverse effect on WowWee’s business, our financial condition and our results of operations.
Many of WowWee’s key customers are mass-market retailers. In the past, the mass-market retail channel in the United States has experienced significant shifts in market share among competitors, causing some large retailers to experience liquidity problems. Certain of WowWee’s customers filed for bankruptcy in 2008 and the recent global economic crisis has adversely affected the financial condition of most retailers. WowWee’s sales to customers are typically made on credit without collateral. There is a risk that customers will not pay, or that payment might be delayed because of bankruptcy, contraction of credit availability to such customers or other factors beyond WowWee’s control, which could increase WowWee’s exposure to losses from bad debts. In addition, if these or other customers were to cease doing business as a result of bankruptcy or significantly reduce the number of stores operated, it could have a material adverse effect on WowWee’s business, our financial condition, and our results of operations.
The Nasdaq Stock Market has temporarily suspended the listing requirement that the closing bid price for a listed security not fall below $1.00 per share for 30 consecutive days. If the bid price for our common stock does not increase above $1.00 per share following the lifting of this temporary suspension, we may not be able to maintain our listing on the NASDAQ Global Market, which would subject the trading of our common share to the SEC’s penny stock rules and would decrease the liquidity of our common shares.
Our common shares are currently listed on The NASDAQ Global Market (“Nasdaq”), which has quantitative maintenance criteria for the continued listing of our common shares that provide that a stock may be delisted if the closing bid price per share of such stock falls below $1.00 for 30 consecutive business days. Since December 4, 2008, the closing bid price per share of our common shares has been below $1.00. However, due to the current extraordinary market conditions, as of October 16, 2008, Nasdaq implemented a temporary suspension of its rules requiring a minimum $1.00 closing bid price and of the rules requiring a minimum market value of publicly held shares requirements. The suspension was extended on December 19, 2008. During the suspension, Nasdaq will not take any action to delist any security for these concerns. The suspension will remain in effect through Friday, April 17, 2009 and these rules are currently scheduled to be reinstated on Monday, April 20, 2009. If after the suspension is lifted, the closing bid price per share of our common Shares continues to be below $1.00 for a total of 30 consecutive business days, our common shares could be delisted. In accordance with Nasdaq Marketplace Rules, we would have a period of 180 calendar days to regain compliance after the receipt of a Nasdaq staff deficiency letter by maintaining a closing bid price of $1.00 per share for a minimum of 10 consecutive business days. If we do not regain compliance, we may appeal Nasdaq’s delisting determination to a Nasdaq Listing Qualifications Panel. If we fail to maintain continued listing, our common shares may be traded over-the-counter on the OTC Bulletin Board or in the “pink sheets.” These alternative markets, however, are generally considered to be less efficient than, and not as broad as, Nasdaq. Many OTC stocks trade less frequently and in smaller volumes than securities traded on the Nasdaq markets, which could have a material adverse effect on the liquidity of our common shares, and impair our ability to raise additional capital.
In addition, our common shares may become subject to penny stock rules. The SEC generally defines “penny stock” as an equity security that has a market price of less than $5.00 per share, subject to certain exceptions. We are not currently subject to the penny stock rules because our common shares qualify for an exception to the SEC’s penny stock rules for companies that have an equity security that is quoted on The NASDAQ Stock Market. However, if our common shares were delisted, our common shares would become subject to the penny stock rules, which impose additional sales practice requirements on broker-dealers who sell our common shares. If our common shares were considered penny stock, the ability of broker-dealers to sell our common shares and the ability of our stockholders to sell their shares in the secondary market would be limited and, as a result, the market liquidity for our common shares would be adversely affected. We cannot assure you that trading in our common shares will not be subject to these or other regulations in the future.
Should our existing cash, cash equivalents and short-term investments prove to be inadequate to meet our funding requirements, additional sources of funds may not be available on acceptable terms or at all.
Our working capital requirements and cash flows are subject to quarterly and yearly fluctuations, depending on such factors as levels of sales, timing of deliveries and collection of receivables, inventory levels, customer payment terms and supplier terms and conditions. Our primary sources of liquidity are our cash, cash equivalents and short term investments. Should our amount of cash, cash equivalents and short term investments at any time prove to be insufficient to meet our needs, due to the adverse effects, including adverse effects upon our cash flow, of any of the other risks, uncertainties, trends and other factors discussed elsewhere in this annual report, we may need to seek additional funds from external financing sources (which may include a variety of debt and/or equity financings), but these financings may not be available to us on acceptable terms or at all with the result that
12
our liquidity would be materially adversely affected. Any such adverse effect upon our liquidity could have a corresponding material adverse effect on our business, results of operations, and financial condition.
The obligations of United Bank Card Inc. under the Purchase and Sale Option Agreement among Optimal Payments Corp., United Bank Card, Inc. and Jared Isaacman, dated as of February 2, 2009, are unsecured and there is a risk that we will not receive payment in full of the purchase price payable there under.
On February 2, 2009, Optimal Payments Corp. entered into a Purchase and Sale Option Agreement with United Bank Card, Inc. and Jared Isaacman. Under the terms of the agreement, United Bank Card has the right to cause Optimal Payments Corp. to sell, and Optimal Payments Corp. has the right to require United Bank Card to purchase, Optimal Payments Corp.’s right to residual payments and other ancillary revenues from the processing of credit card-present transactions for a portfolio of merchant accounts. The purchase price to be paid by United Bank Card under the agreement is $11 million. The purchase price will be subject to adjustment monthly by: (i) subtracting revenues that have been retained by Optimal Payments Corp. after deducting payment to United Bank Card of fees relating to the servicing of the merchant accounts by United Bank Card and (ii) adding a notional rate of 12% per annum to the resulting amount. United Bank Card will be entitled to exercise its purchase right at any time up to December 31, 2014 and Optimal Payments Corp. will be entitled to exercise its sale right at any time on or following the earlier of: (i) February 2, 2011 and (ii) the sale of United Bank Card. United Bank Card’s obligations under the agreement are being guaranteed by Jared Isaacman, however, neither United Bank Card’s obligations nor Jared Isaacman’s guarantee are secured. If United Bank Card and Jared Isaacman were to default under their obligations, we might not be in a position to collect the purchase price (as reduced pursuant to the adjustments described above) and we might not find another buyer for the portfolio of residual payments and ancillary revenues.
Our business depends upon the services of key personnel.
Our ability to successfully integrate acquisitions and to grow our business depends largely upon the services of our Chief Executive Officer and our Chief Financial Officer, the loss of any of whom could adversely affect our business and overall results of operations.
WowWee’s future success depends largely on the continued contribution of its key executives, designers and technical personnel. The loss of services of any of these key personnel could harm WowWee. Recruiting skilled designers and technical personnel is highly competitive. If WowWee fails to retain any of these key personnel, and/or fails to hire, train and integrate replacement personnel, it might not be able to maintain and expand its business, and our results of operations could be adversely affected.
We may be unable to find suitable acquisition candidates and we may not be able to successfully integrate businesses we acquire into our operations.
Our future growth strategy may include acquiring other businesses. For example, in November 2007 we acquired WowWee. However, we may not be able to identify and acquire suitable target businesses or, to the extent required, obtain financing for such acquisitions on satisfactory terms or at all. Integrating acquired businesses into our operations may involve unforeseen difficulties and may require a disproportionate amount of resources and management attention. Acquisitions involve a number of special risks, including:
|
|
|
| • | the time and expense associated with identifying and evaluating an acquisition, |
| ||
| • | the diversion of management’s attention from day-to-day operations, |
| ||
| • | the difficulty in integrating widely dispersed operations with distinct corporate cultures, |
| ||
| • | the potential loss of key employees of the acquired business, |
| ||
| • | the difficulty of incorporating acquired technologies successfully, |
| ||
| • | the potential impairment of relationships with employees, customers and strategic partners, and |
| ||
| • | the inability to maintain uniform standards, controls, procedures and policies. |
Customer satisfaction or performance problems at an acquired business could adversely affect the reputation of our entire business. Future acquisitions may be financed through the issuance of common shares, which may dilute the ownership of our shareholders, or through the incurrence of indebtedness. Acquisitions may also result in significant charges to earnings. Furthermore, competition for acquisition candidates could escalate, thereby increasing the costs of making acquisitions or making suitable acquisitions more difficult to find.
13
We are subject to the risk that a taxation authority could challenge certain filing positions we have taken, and that a successful challenge could require us to pay significant additional taxes.
Although we believe that all filing positions we take in our tax returns are reasonable and appropriate, there is no assurance that a taxation authority will not challenge those positions. Such challenges could include disputing positions taken in connection with the transfer of our online gaming processing business to FireOne Group plc and its affiliates in 2005, and the subsequent public offering of a portion of the FireOne Group plc ordinary shares. A challenge to certain filing positions we have taken, if successful, could result in us being required to pay additional taxes (including penalties and interest) and the amount of such additional taxes could be material to us.
We are subject to exchange rate fluctuations between the U.S. dollar and the Canadian dollar and Euros.
The majority of our revenues are generated in U.S. dollars and Euros. A significant portion of our expenses are incurred in both Canadian dollars and Euros. A fluctuation in the value of the U.S. dollar relative to the Canadian dollar or the Euro may result in variations in our revenues, expenses and earnings. We have not implemented a currency hedging program.
Our operating strategy for WowWee might not succeed and the anticipated benefits to us from our acquisition of WowWee might not be realized.
Our ability to realize the anticipated benefits of our acquisition of the WowWee business will depend, in part, on the successful implementation of specific new strategies designed to enhance the growth and financial performance of the WowWee business. These include:
|
|
|
| • | Expanding sales and distribution through a broadening of WowWee’s sales channels, particularly outside North America in emerging markets; |
| ||
| • | Expanding product design, development and production capabilities to produce an increased number of products at varying price points; |
| ||
| • | Broadening development initiatives into products that combine computer connectivity, utility and entertainment; |
| ||
| • | Embarking on branded entertainment initiatives, licensing, publishing and merchandising; and |
| ||
| • | Evaluating potential acquisition opportunities. |
If we fail to succeed in implementing these and other strategies that we might develop, WowWee could fail to grow, we may not realize the full benefits anticipated from the acquisition of the WowWee business, and our financial performance and results of operations could be adversely affected.
If WowWee does not satisfy consumer preferences our results of operations may be adversely affected.
WowWee competes with a wide range of manufacturers, marketers and sellers of consumer electronics and play products, many of which are larger than us and have greater financial resources than we do. Consumer preferences change. If its competitors’ products achieve greater market acceptance than WowWee’s products, WowWee’s products are unable to satisfy consumer preferences, or WowWee fails to respond to changes in consumer preferences with products that achieve and sustain market acceptance in a timely and cost-effective manner, demand for WowWee’s products could decrease and our results of operations could be adversely affected.
WowWee’s business is seasonal and its annual operating results depend, in large part, upon the relatively brief holiday season in the fourth quarter of the year.
Retail sales of WowWee’s products are susceptible to seasonal variations, with a majority of sales occurring between September and December. As a result, WowWee’s operating results depend, in large part, upon sales made during this period. If WowWee’s sales, operating earnings or cash flows from operating activities during the September to December period in any fiscal year are low, we may not be able to compensate sufficiently for the generally lower sales, operating earnings, or cash flows from operating activities during the first eight months of the fiscal year.
14
Tighter inventory management by retailers resulting in shorter lead times for production and possible shipping disruptions during peak demand times may adversely affect WowWee’s ability to deliver its products in time to meet retailer demands.
As retailers attempt to manage their inventories better by requiring suppliers to ship products closer to the time the retailers expect to sell products to consumers, suppliers such as WowWee may have shorter lead times for production, and disruptions in shipping, for any reason, from China during peak demand times may affect the ability of WowWee to deliver its products in time to meet retailer demand.
WowWee’s sales are concentrated among a relatively small number of major retailer customers, which exposes WowWee to any financial difficulties or changes in purchasing preferences or policies of these customers.
A small number of major retail customers account for a large proportion of WowWee’s sales. WowWee’s customers make purchases by one-time purchase orders, as opposed to making long-term purchase commitments. These customers could reduce their overall purchases of WowWee’s products for any reason, including due to financial difficulties, or could reduce the shelf space allotted for such products. Any such change by a major customer of WowWee could significantly harm its business and our results of operations.
Consolidation among WowWee’s major customers could compound the effect upon us of any financial difficulties suffered by such customers or any changes in the purchasing preferences or policies of such customers. Increased consolidation among its customers could negatively impact the ability of WowWee to negotiate higher sales prices for its products and could result in lower gross profit margins.
All of WowWee’s products are manufactured in China and we are subject to the risk that political developments, including currency revaluation and trade relations between China and the markets in which WowWee’s products are sold, could increase the costs of producing and delay or prevent shipping such products.
All of WowWee’s products are manufactured by third parties in the People’s Republic of China. Social and economic conditions in China affecting the movement of products from China to the markets in which WowWee’s products are sold, particularly North America, and the labor and other costs of doing business in China could have a significant negative impact on our results of operations. Factors that could negatively affect WowWee include a potential revaluation of the Chinese yuan, which may increase the cost of producing products in China, increased labor costs and labor disputes that could result in difficulties in transporting products manufactured in China to the ports on the western coast of North America. Also, a negative change in China’s trade status with the United States or the European Union, including the imposition of trade sanctions, could significantly increase the cost of products imported from China. Any increase in the cost of producing and the cost of, or disruptions in, shipping WowWee’s products in and from China could significantly adversely affect our results of operations.
A reduction or interruption in the supply of raw materials, parts and components or a significant increase in the price of supplies used to produce WowWee’s products could negatively affect WowWee’s gross profit margins.
WowWee may from time to time encounter shortages of materials, parts and components from its suppliers or a price increase in such materials, parts and components resulting from their shortage. Price increases for components such as resin used in plastics, rising fuel and transportation costs and raw material prices, may significantly increase WowWee’s operating costs, reduce WowWee’s gross profit margins and our results of operations. Due to market conditions, timing of pricing decisions, competition and other factors, there can be no assurance that WowWee will be able to offset any of such increased costs by adjusting the prices of its products because increases in the prices of WowWee’s products could result in lower sales.
As a developer and supplier of consumer products, WowWee is subject to various government regulations, violation of which could subject us to sanctions.
As a developer and supplier of consumer products, WowWee operates in a highly regulated environment in the United States and international markets. Regulations that apply to its products and their importation include regulation of advertising directed toward children and product safety. There can be no assurance that WowWee or its products will be in compliance in the future with such regulations. In addition, changes in laws or regulations may lead to increased compliance-related costs in WowWee’s business. Failure to comply with such regulations could result in monetary liabilities and other sanctions which could have a negative impact on WowWee, our financial condition and our results of operations. WowWee could also be subject to involuntary product recalls or may voluntarily conduct a product recall, the costs of which could be significant. In addition, any product recall, regardless of direct costs of the recall, may harm consumer perceptions of WowWee’s products.
15
WowWee could be the subject of future product liability suits or product recalls, which could harm WowWee.
Products that have been or may be developed by WowWee may expose us to potential liability from personal injury or property damage claims by the users of such products. There can be no assurance that a claim will not be brought against us in the future. While we currently maintain product liability insurance coverage, we may not be able to maintain such coverage or such coverage may not be adequate to cover all potential claims. Moreover, even if we maintain sufficient insurance coverage, any successful claim could significantly harm WowWee’s reputation among consumers, which could result in decrease sales, harming our financial condition and our results of operations.
Failure by WowWee to protect its proprietary intellectual property and information could have a material adverse effect on WowWee, our financial condition and results of operations.
The value of WowWee depends to a large degree on its ability to protect its intellectual property and information, including its trademarks, trade names, copyrights and trade secrets. WowWee’s business is subject to the risk of third parties counterfeiting its products or infringing on its intellectual property rights. Any failure by WowWee to protect its proprietary intellectual property and information or a successful challenge by a third party that WowWee has infringed its intellectual property rights, could have a material adverse effect on WowWee, our financial condition and our results of operations.
Optimal Payments is at risk of loss due to fraud, disputes and merchant insolvency.
Optimal Payments faces risks of loss due to fraud and disputes between consumers and merchants, including the unauthorized use of credit card and bank account information and identity theft, merchant fraud, disputes over the quality of goods and services, breaches of system security, employee fraud and use of its system for illegal or improper purposes. When a consumer pays a merchant for goods or services using a credit card and the cardholder disputes the charge, the amount of the disputed item gets charged back to Optimal Payments and the relevant credit card association may levy fees against Optimal Payments. Chargebacks can arise from the unauthorized use of a cardholder’s card number or from a cardholder’s claim that a merchant failed to perform a transaction. In addition, if Optimal Payments’ chargeback or dispute rate becomes excessive, credit card associations may require it to pay fines and have done so in the past. There is a risk that Optimal Payments may be required to pay fines in the future and the amount of such fines may be material. While Optimal Payments attempts to recover from the merchant the amount charged back and the amount of any fines imposed upon it by credit card associations, Optimal Payments may not always be successful in doing so for various reasons, such as merchant insolvency.
Optimal Payments may not be able to safeguard against security and privacy breaches in its electronic transactions.
A significant element of electronic commerce and communication is the secure transmission of confidential information over public networks. Although Optimal Payments strives to use only proven applications for premium data security and integrity to process electronic transactions, use of these applications may not be sufficient to address changing market conditions or developments in technology or the security and privacy concerns of Optimal Payments’ existing and potential customers.
Optimal Payments may not be able to prevent security or privacy breaches. A security or privacy breach could:
|
|
|
| • | expose Optimal Payments to liability and to potentially costly litigation; |
|
|
|
| • | cause Optimal Payments to incur expenses relating to the remediation of these breaches; and |
|
|
|
| • | cause Optimal Payments’ customers to lose confidence in its services, harm its reputation, and deter customers from using Optimal Payments’ services. |
Although Optimal Payments requires that its agreements with service providers who have access to merchant and consumer data include confidentiality obligations that restrict these parties from using or disclosing any consumer or merchant data except as necessary to perform their services under the applicable agreements, there can be no assurance that these contractual measures will prevent the unauthorized disclosure of merchant or consumer data. Individuals may attempt to circumvent the measures that Optimal Payments takes to protect customer transaction data. Security breaches could result in the disclosure of proprietary information, such as bank account or credit card information.
16
If Optimal Payments is unable to protect the security and privacy of its electronic transactions and data, it could be exposed to risk of loss, litigation and possible liability, and its business volume, revenues and results of operations will be materially adversely affected.
Optimal Payments’ payments systems might be used for illegal or improper purposes.
Despite its measures to detect and prevent identity theft, unauthorized use of credit cards, and similar misconduct, and to monitor and comply with laws and regulations restricting or prohibiting the processing of certain types of transactions for its merchant customers, Optimal Payments’ payments systems are susceptible to illegal or improper uses by third parties. These uses may include illegal online gaming, fraudulent sales of goods or services, illicit sales of prescription medications or controlled substances, software and other intellectual property piracy, money laundering, bank fraud, child pornography trafficking, prohibited sales of alcoholic beverages and tobacco products and online securities fraud. Illegal or improper use of payments systems may lead to increased government regulation of Optimal Payments or other legal consequences which may have an adverse impact on its revenues and results of operations. In addition, laws or regulations that restrict or prohibit the business activities of Optimal Payments’ merchant customers may prevent Optimal Payments from providing, or may make it impracticable for it to continue to provide, its payments systems to such merchants and their customers, which would adversely affect its revenues and results of operations.
Optimal Payments must comply with credit card association rules and practices, which could impose additional costs and burdens on its payments business.
Optimal Payments must comply with the operating rules of the various credit card associations with which it is registered. The associations could adopt operating rules with which it may be difficult or impossible for Optimal Payments to comply. In addition, cases of fraud or disputes between consumers and merchants can result in chargebacks. If Optimal Payments’ chargebacks or disputes become excessive, its processing suppliers could fine it or terminate its ability to accept credit cards for payments. The termination of Optimal Payments’ relationships with credit card associations, or acquiring banks, would limit its ability to provide transaction processing services.
The failure of Optimal Payments’ systems, the systems of third parties or the Internet could negatively impact its business and harm its reputation for reliability.
Computer viruses, disgruntled or rogue employees, electronic break-ins, power losses, telecommunications failures, security breaches, natural disasters and similar events could damage or disrupt the function of Optimal Payments’ systems and those of third parties upon whom it relies, such as bank processing and credit card systems, thereby adversely affecting Optimal Payments’ business and reputation. Optimal Payments’ insurance policies may not adequately compensate it for any losses that may occur due to any failures or interruptions in these systems.
If Optimal Payments’ relationships with its banking partners deteriorated, its ability to process transactions could be impaired or halted.
Optimal Payments relies on strategic partnerships and suppliers to help supply, promote and distribute its services. Optimal Payments particularly depends upon its strategic banking relationships. The credit card association members and financial institutions that process electronic transactions have adopted guidelines that apply to online transactions. While we believe that Optimal Payments’ operations comply with these guidelines, credit card association members and financial institutions could nonetheless decide in the future to refuse to process transactions for Optimal Payments. Such a decision could be implemented with little or no advance notice to Optimal Payments. If such a situation occurred and Optimal Payments were not able to conclude alternative arrangements with other credit card association members or financial institutions, its ability to carry out payment transactions could be impaired or even halted.
Optimal Payments operates in a competitive market for its services.
Potential competitors in Optimal Payments’ market include credit card association members, financial institutions, payment processors and other similar entities, many of which may have greater financial resources than Optimal Payment does, more firmly entrenched market positions or greater brand recognition.
Optimal Payments may not be able to identify, develop, manufacture, market or support new services or offer new services that appeal to its customers as fast as its competitors. If Optimal Payments fails to anticipate or
17
respond effectively to customer requirements or experiences significant delays in product developments or roll-outs, it may lose its market share and our revenues and results of operations could be adversely affected.
Optimal Payments relies upon non-exclusive arrangements with independent sales agents to acquire and retain its customers.
Optimal Payments relies solely upon independent sales agents to acquire and retain its customers. Its arrangements with these independent sales agents are non-exclusive. As a result, Optimal Payments’ sales agents may enter into arrangements with Optimal Payments’ competitors that provide preferential treatment to those competitors or they may terminate their arrangements with Optimal Payments. If Optimal Payments fails to maintain strong relationships with its independent sales agents or fails to provide its independent sales agents with sufficient incentives to motivate their sales efforts, Optimal Payments’ customer base may not expand and could decrease.
Optimal Payments’ business is subject to fluctuations in general business conditions.
The current downturn in general economic conditions has caused some of Optimal Payments’ merchant customers to experience difficulty in supporting their current operations and implementing their business plans. If these merchants make fewer sales of their products and services, Optimal Payments will have fewer transactions to process, resulting in lower revenues.
In addition, in a recessionary environment, the merchants Optimal Payments serves become subject to a higher risk of insolvency, which could adversely affect our results of operations. Optimal Payments bears the credit risk for chargebacks related to billing disputes between credit card holders and merchants. If a merchant seeks protective relief under bankruptcy laws or is otherwise unable or unwilling to reimburse Optimal Payments for chargebacks borne by Optimal Payments, Optimal Payments may be liable for the full transaction amount of a chargeback.
The legal status of online gaming is uncertain in some of the jurisdictions in which Optimal Payments has provided settlement processing services for online gaming activities. Future enforcement proceedings may subject us to substantial penalties. Reports of enforcement proceedings that are unfavorable to Optimal Payments or to its customers or suppliers may adversely affect the trading price of our common shares.
In many jurisdictions there are few, if any, laws or regulations that deal directly with payment processing for online gaming transactions. The legal status of online gaming itself is uncertain in many of the jurisdictions in which Optimal Payments has operated. While some jurisdictions have taken the position that online gaming is legal and have adopted or are in the process of reviewing legislation to regulate online gaming, other jurisdictions have taken the opposite view and enacted legislation to attempt to restrict or prohibit online gaming. For example, the United States Unlawful Internet Gambling Enforcement Act of 2006 prohibits any person engaged in the business of betting or wagering from knowingly accepting payments related to unlawful bets or wagers transmitted over the Internet, which resulted in our then majority owned subsidiary, FireOne Group plc, ceasing to process settlement transactions originating from United States customers that may be viewed as related to online gaming. We may be exposed to adverse consequences as a result of future enforcement proceedings, governmental investigations or lawsuits initiated against Optimal Payments in jurisdictions where online gaming is restricted or prohibited, including the United States in the aftermath of the Unlawful Internet Gambling Enforcement Act of 2006. Any adverse findings, rulings or judgments rendered against Optimal Payments could involve substantial penalties, fines, injunctions or other sanctions being invoked against it and could have a material adverse effect on our financial condition. Any future enforcement or legal proceedings threatened or commenced against Optimal Payments relating to online gaming, whether or not ultimately successful, could involve substantial litigation expense and the diversion of the attention of key executives. The outcome of any such litigation cannot be predicted. From time to time, reports about regulatory initiatives, or enforcement proceedings that are or would be unfavorable to us, or to Optimal Payments’ customers or suppliers, have had a swift and negative impact on the trading price of our common shares, and our common shares may again experience trading price volatility in the future due to such reports.
Optimal Payments’ status under certain financial services regulations is unclear.
Optimal Payments operates in an industry subject to government regulation. Optimal Payments currently is subject to money laundering regulations and may in the past have been subject to money transmitter or electronic money regulations in various jurisdictions. If Optimal Payments is found to have been in violation of any such regulations, it could be exposed to financial liability, including substantial fines which could be imposed on a per transaction basis, and disgorgement of our profits.
18
We have a material amount of intangible assets which, if they become impaired, would result in a reduction in our net income.
Current accounting standards require that goodwill and intangible assets be periodically evaluated for impairment. Goodwill is the amount by which the cost of an acquisition accounted for using the purchase method exceeds the fair value of the identifiable net assets we acquire. We tested the goodwill of Optimal Payments for impairment at June 30, 2008 and we tested the remaining intangibles held in this segment for impairment at December 31, 2008. As a result of our analyses, we recorded a goodwill impairment loss of approximately $10.8 million in the second quarter of 2008 and an impairment charge of approximately $12.2 million in the fourth quarter of 2008. In addition, we tested the consumer, robotic, toy and entertainment segment for impairment at September 30, 2008 and at December 31, 2008, and at December 31, 2008 a goodwill impairment loss of approximately $41.4 million and an impairment loss of approximately $2.4 million on amortizable intangibles were recognized for this segment. We also recorded goodwill impairment losses of $18.3 million and $22.6 million in 2008 and 2007, respectively related to our discontinued operations. After recording these impairment losses, at December 31, 2008, approximately $56.7 million, or 34%, of our total assets represented intangible assets. Any further declines in our assessment of future cash flows from the WowWee segment could result in a further write-down of our intangible assets and a reduction in our net income.
We may be subject to additional litigation stemming from our operation of the U-scan self-checkout business.
In 2004, we settled an action alleging that the U-Scan self-checkout systems that we marketed infringed upon the claimant’s patent. In 1999, 2001 and 2003, a second party sent demand letters to us alleging a different patent infringement. We may in the future be subject to other litigation relating to our prior involvement in the self-checkout business. Defending against such litigation may be time consuming, expensive and distracting from the conduct of our current businesses, and the outcome of litigation is difficult to predict. The adverse resolution of any specific lawsuit could have a material adverse effect on our business, results of operations and financial condition.
|
|
UNRESOLVED STAFF COMMENTS |
We have nothing to report under this item.
|
|
PROPERTIES |
Facilities
Our corporate headquarters and the offices of our subsidiary, WowWee Canada Inc. are currently located in approximately 11,000 square feet of leased space at 3500 de Maisonneuve Blvd West, Suite 800, Montreal, Quebec under a lease that expires on April 30, 2013. We also have a commitment for approximately 12,000 square feet of leased space on the 16th floor at 3500 de Maisonneuve Blvd West, Montreal, Quebec; this space under a lease that expires on October 30, 2010, represents discontinued operations. Since February 1st, 2007, 5,835 square feet of this space has been sublet to a third party.
WowWee Group Limited is located in approximately 20,000 square feet of leased space at Energy Plaza, 92 Granville Road, Tsimshatsui East Kowloon, Hong Kong under leases that expire at various dates between June 2008 and November 2010. WowWee USA, Inc. occupies approximately 1,600 square feet of leased space in La Jolla, California under a lease that expires on December 31, 2009 and 3,400 square feet of leased space in Carlsbad, California under a lease that expires on July 31, 2013. The Think Wow Toys division of WowWee USA, Inc., occupies approximately 2,500 square feet of leased space in New York, New York under a lease that expires on March 31, 2013; this lease is in the name of the former operator of the Think Wow Toys business, however, we bear the rent expense.
Sablon Distribution is located in approximately 3,900 square feet of leased space at Avenue Reine Astrid 2, B-1440 Wauthier Braine, Belgium, under a lease that expires on September 4, 2013. The Sablon Distribution group of companies also has showrooms in Nuremberg, Germany, Lelystad, Netherlands and Sceaux, France.
19
|
|
LEGAL PROCEEDINGS |
Legal Proceedings
On March 20, 2008, we entered into a settlement agreement with Fujitsu, which resolved all potential claims by Fujitsu and brought these arbitration proceedings to an end. The amount that we paid to settle Fujitsu’s claims is not considered to be material to the Company.
We are also party to litigation arising in the normal course of operations. We do not expect the resolution of such matters to have a material adverse effect on our financial position or results of operations.
Following announcements by the U.S. Attorney’s Office in the Southern District of New York relating to its investigation of the U.S. Internet gambling industry, we announced on May 8, 2007 that we had initiated discussions with the U.S. Attorney’s Office in the Southern District of New York and are in the process of responding to a voluntary request for information issued by the U.S. Attorney’s Office. In connection with such ongoing investigation, we announced on May 11, 2007 that we had received a copy of warrants of seizure issued by the U.S. Attorney’s Office against funds of certain payment processors that were on deposit with two U.S. banks. These funds included $19.2 million that were on deposit to the credit of our affiliates. The total amount seized of $19.2 million is presented as long-term asset related to discontinued operations on the consolidated balance sheets. We are not receiving any interest income on this amount. No provision is recorded by us for this matter because the outcome of these discussions and the amount of loss, if any, are not currently determined.
OGOP Payments Inc. (formerly Optimal Payments Inc.) received in the first half of 2008 a request for information from the U.S. Attorney’s Office in the Eastern District of New York pertaining to its former involvement in processing transactions for internet pharmacies. OGOP Payments Inc. has had discussions with that Office relating to those processing activities. No provision has been recorded by OGOP Payments Inc. for this matter because the outcome of these discussions and the amount of any loss, if any, are not determinable.
|
|
SUBMISSION OF MATTERS TO A VOTE OF SECURITY HOLDERS |
No matters were submitted to a vote of our security holders during the fourth quarter of fiscal 2008.
|
|
MARKET FOR REGISTRANT’S COMMON EQUITY, RELATED STOCKHOLDER MATTERS AND ISSUER PURCHASES OF EQUITY SECURITIES |
Market Information
Our common shares trade on the Nasdaq Global Market under the symbol “OPMR.” The following table sets forth the range of high and low sales prices for our common shares as reported by the Nasdaq Global Market.
|
|
|
|
|
|
|
| Nasdaq Global Market |
| ||
|
|
| |||
|
| $ High |
| $ Low |
|
|
|
|
| ||
|
|
|
|
|
|
2008 |
|
|
|
|
|
4th Quarter |
| 1.93 |
| 0.43 |
|
3rd Quarter |
| 2.74 |
| 1.66 |
|
2nd Quarter |
| 3.42 |
| 2.09 |
|
1st Quarter |
| 4.66 |
| 2.75 |
|
|
|
|
|
|
|
2007 |
|
|
|
|
|
4th Quarter |
| 6.00 |
| 3.28 |
|
3rd Quarter |
| 7.79 |
| 5.22 |
|
2nd Quarter |
| 9.56 |
| 7.32 |
|
1st Quarter |
| 9.94 |
| 7.45 |
|
20
Holders
At February 27, 2009, there were 615 stockholders of record of our common shares.
Dividends
Our policy is to retain all earnings, if any are realized, for the development and growth of our business. We have never declared or paid cash dividends on our common shares and we do not anticipate paying cash dividends in the foreseeable future. Any determination to pay dividends will be at the discretion of our Board of Directors and will depend upon our financial condition, results of operations, capital requirements, limitations contained in loan agreements, if any, and such other factors as our Board of Directors deems relevant.
Performance Graph
The following graph compares the cumulative total shareholder return on our common shares with the Nasdaq Composite Index for the five years ended December 31, 2008. The graph sets the beginning value of our common shares and the Nasdaq Composite Index at $100 and assumes that all dividends are reinvested.
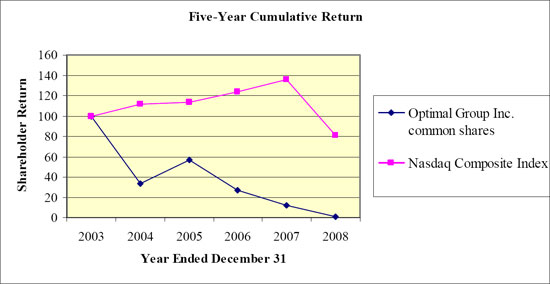
|
|
|
|
|
|
|
|
|
|
|
|
|
|
|
| Dec-03 |
| Dec-04 |
| Dec-05 |
| Dec-06 |
| Dec-07 |
| Dec-08 |
|
|
|
|
|
|
|
|
|
|
|
|
|
|
|
Optimal Group Inc. common shares |
| 100.00 |
| 33.23 |
| 57.15 |
| 26.85 |
| 11.71 |
| 1.35 |
|
Nasdaq Composite Index |
| 100.00 |
| 111.54 |
| 113.07 |
| 123.84 |
| 135.99 |
| 80.86 |
|
21
Purchases of Equity Securities
The following table is a summary of our purchases of common shares for the period from November 21, 2008 to December 31, 2008.
|
|
|
|
|
|
|
|
|
|
Optimal Group Inc. Purchases of Equity Securities | |||||||||
| |||||||||
Period |
| Total |
| Average |
| Total Number of |
| Maximum |
|
|
|
|
|
| |||||
|
|
|
|
|
|
|
|
|
|
November 21, 2008 – November 30, 2008 |
| 60,000 |
| 0.9222 |
| 60,000 |
| 1,230,000 |
|
December 1, 2008 – December 31, 2008 |
| 26,867 |
| 0.8868 |
| 26,867 |
| 1,203,133 |
|
|
|
|
|
|
|
|
|
|
|
|
|
|
|
|
| ||||
Total |
| 86,867 |
| 0.9113 |
| 86,867 |
| 1,203,133 |
|
|
|
|
|
|
| ||||
|
|
|
|
| (1) | We made all purchases of our common shares under our stock purchase program publicly announced on November 14, 2008 under which we are authorized to purchase up to 1,290,000 shares, being approximately 5.0% of the 25,829,090 common shares outstanding as at November 13, 2008. We are authorized under our 2008 stock purchase program to purchase our common shares on the open market through the facilities of the Nasdaq Stock Market from time to time over the course of the 12-month period that commenced on November 21, 2008 and ends on November 20, 2009. |
|
|
|
SELECTED FINANCIAL AND OTHER DATA |
The selected consolidated statements of operations data for the three years ended December 31, 2008 and the consolidated balance sheet data at December 31, 2008 and 2007 should be read in conjunction with the audited financial statements and related “Management’s Discussion and Analysis of Results of Operations and Financial Condition” and other financial information presented elsewhere in this annual report on Form 10-K. The selected consolidated statement of operations for the years ended December 31, 2005 and 2004, which do not reflect the discontinued operations described in footnote 1 below, and the consolidated balance sheet data at December 31, 2006, 2005 and 2004 have been derived from financial statements not included herein. The selected consolidated statement of operations data for the years ended December 31, 2005 and 2004 and the selected consolidated balance sheet data at December 31, 2005 and 2004 include the operations of our former hardware maintenance and repair services business and our former U-Scan self-check-out business as discontinued operations.
Our consolidated financial statements are prepared on the basis of Canadian GAAP, which differs in certain respects from U.S. GAAP. For a description of the material differences between Canadian GAAP and U.S. GAAP as they relate to our consolidated financial statements, see note 25 of the notes to our consolidated financial statements.
22
|
|
|
|
|
|
|
|
|
|
|
|
|
|
|
|
|
|
| Year ended December 31, |
| |||||||||||||
|
| |||||||||||||||
|
| 2008 |
| 2007 |
| 2006 |
| 2005 |
| 2004 |
| |||||
|
| |||||||||||||||
|
| Audited |
| Unaudited |
| |||||||||||
|
| |||||||||||||||
|
| (U.S. dollars, in thousands except per share data) |
| |||||||||||||
Consolidated Statement of Operations Data(1)(2): |
|
|
|
|
|
|
|
|
|
|
|
|
|
|
|
|
Revenues |
| $ | 152,546 |
| $ | 84,908 |
| $ | 81,786 |
| $ | 144,898 |
| $ | 51,491 |
|
Cost of sales and transaction processing, excluding amortization |
|
| 109,131 |
|
| 61,520 |
|
| 57,991 |
|
| 67,495 |
|
| 23,866 |
|
Amortization of intangibles pertaining to cost of sales and transaction processing |
|
| 18,494 |
|
| 12,690 |
|
| 10,280 |
|
| 7,833 |
|
| 1,791 |
|
Amortization of equipment pertaining to cost of sales |
|
| 3,623 |
|
| 581 |
|
| — |
|
| 1,324 |
|
| 1,030 |
|
Selling, general and administrative, excluding amortization and stock-based compensation |
|
| 49,792 |
|
| 20,308 |
|
| 22,802 |
|
| 35,689 |
|
| 13,526 |
|
Amortization of equipment pertaining to selling, general and administrative |
|
| 709 |
|
| 235 |
|
| 161 |
|
| — |
|
| — |
|
Stock-based compensation pertaining to selling, general and administrative |
|
| 3,339 |
|
| 276 |
|
| — |
|
| 20,191 |
|
| 4,394 |
|
Research and development |
|
| 2,931 |
|
| 731 |
|
| — |
|
| 2,659 |
|
| 1,511 |
|
Operating leases |
|
| 1,358 |
|
| 501 |
|
| 583 |
|
| 1,103 |
|
| 623 |
|
Restructuring costs |
|
| — |
|
| — |
|
| — |
|
| 3,299 |
|
| — |
|
Impairment losses |
|
| 66,910 |
|
| — |
|
| — |
|
| — |
|
| — |
|
Investment income |
|
| 1,238 |
|
| 5,831 |
|
| 8,388 |
|
| 2,973 |
|
| 731 |
|
Gain on sale of interest in FireOne |
|
| — |
|
| — |
|
| — |
|
| 30,411 |
|
| — |
|
|
| |||||||||||||||
(Loss) earnings from continuing operations before income taxes |
|
| (102,503 | ) |
| (6,103 | ) |
| (1,643 | ) |
| 38,689 |
|
| 5,481 |
|
Income tax recovery (provision) |
|
| 3,500 |
|
| 618 |
|
| — |
|
| (11,388 | ) |
| (1,486 | ) |
Non-controlling interest |
|
| — |
|
| — |
|
| — |
|
| (4,181 | ) |
| — |
|
|
| |||||||||||||||
(Loss) earnings from continuing operations |
|
| (99,003 | ) |
| (5,485 | ) |
| (1,643 | ) |
| 23,120 |
|
| 3,995 |
|
Net (loss) earnings from discontinued operations, net of income taxes |
|
| (12,000 | ) |
| (31,026 | ) |
| 14,422 |
|
| (22,543 | ) |
| (13,248 | ) |
|
| |||||||||||||||
Net (loss) earnings |
| $ | (111,003 | ) | $ | (36,511 | ) | $ | 12,779 |
| $ | 577 |
| $ | (9,253 | ) |
|
| |||||||||||||||
|
|
|
|
|
|
|
|
|
|
|
|
|
|
|
|
|
Weighted average number of shares (thousands): |
|
|
|
|
|
|
|
|
|
|
|
|
|
|
|
|
Basic |
|
| 25,860 |
|
| 24,179 |
|
| 23,629 |
|
| 22,869 |
|
| 20,290 |
|
Diluted |
|
| 25,860 |
|
| 24,179 |
|
| 25,439 |
|
| 25,345 |
|
| 20,426 |
|
|
| |||||||||||||||
Net (loss) earnings per share: |
|
|
|
|
|
|
|
|
|
|
|
|
|
|
|
|
Basic |
| $ | (4.29 | ) | $ | (1.51 | ) | $ | 0.54 |
| $ | 0.03 |
| $ | (0.46 | ) |
|
| |||||||||||||||
Diluted |
| $ | (4.29 | ) | $ | (1.51 | ) | $ | 0.50 |
| $ | 0.02 |
| $ | (0.46 | ) |
|
| |||||||||||||||
|
|
|
|
|
|
|
|
|
|
|
|
|
|
|
|
|
Balance Sheet Data: |
| December 31, |
| |||||||||||||
|
|
| ||||||||||||||
|
| 2008 |
| 2007 |
| 2006 |
| 2005 |
| 2004 |
| |||||
|
|
| ||||||||||||||
|
| Audited |
| |||||||||||||
|
|
| ||||||||||||||
|
| (U.S. dollars, in thousands) |
| |||||||||||||
|
|
|
|
|
|
|
|
|
|
|
|
|
|
|
|
|
Cash and cash equivalents, short-term investments and settlement assets |
| $ | 39,145 |
| $ | 59,670 |
| $ | 182,604 |
| $ | 201,324 |
| $ | 165,525 |
|
Working capital (excluding cash and short-term investments held as reserves) |
|
| 33,167 |
|
| 35,364 |
|
| 97,395 |
|
| 65,045 |
|
| 68,768 |
|
Total assets |
|
| 169,018 |
|
| 290,281 |
|
| 340,537 |
|
| 385,466 |
|
| 295,246 |
|
Bank indebtedness |
|
| 11,547 |
|
| — |
|
| 8,581 |
|
| 8,390 |
|
| 8,301 |
|
Long-term debt |
|
| 2,005 |
|
| — |
|
| — |
|
| — |
|
| — |
|
Shareholders’ equity |
|
| 93,491 |
|
| 201,705 |
|
| 219,382 |
|
| 203,290 |
|
| 176,681 |
|
23
|
|
|
|
|
|
|
|
|
|
|
|
|
|
|
|
|
U.S. GAAP Financial Data(1)(2): |
| Year ended December 31, |
| |||||||||||||
|
| |||||||||||||||
|
| 2008 |
| 2007 |
| 2006 |
| 2005 |
| 2004 |
| |||||
|
| |||||||||||||||
|
|
|
|
| Audited |
|
|
|
| Unaudited |
| |||||
|
| |||||||||||||||
|
| (U.S. dollars, in thousands except per share data) |
| |||||||||||||
| ||||||||||||||||
Revenues |
| $ | 152,546 |
| $ | 84,908 |
| $ | 81,786 |
| $ | 144,898 |
| $ | 51,491 |
|
Net (loss) earnings |
|
| (111,003 | ) |
| (36,511 | ) |
| 12,779 |
|
| 577 |
|
| (9,253 | ) |
Basic net (loss) earnings per share |
|
| (4.29 | ) |
| (1.51 | ) |
| 0.54 |
|
| 0.03 |
|
| (0.46 | ) |
Diluted net (loss) earnings per share |
|
| (4.29 | ) |
| (1.51 | ) |
| 0.50 |
|
| 0.02 |
|
| (0.46 | ) |
|
|
|
|
|
|
|
|
|
|
|
|
|
|
|
|
|
|
| December 31, |
| |||||||||||||
|
| |||||||||||||||
|
| 2008 |
| 2007 |
| 2006 |
| 2005 |
| 2004 |
| |||||
|
| |||||||||||||||
|
| Audited |
| |||||||||||||
|
| |||||||||||||||
|
| (U.S. dollars, in thousands) |
| |||||||||||||
|
|
|
|
|
|
|
|
|
|
|
|
|
|
|
|
|
Total assets |
| $ | 169,018 |
| $ | 290,281 |
| $ | 340,537 |
| $ | 385,466 |
| $ | 295,246 |
|
|
|
(1) | The statement of operations data has been restated for the years ended December 31, 2006, 2007 and 2008 to reflect the sale of a portion of our payment processing business, (see note 5 (b) (i) of the notes to our consolidated financial statements), which has been classified as discontinued operations. As a result, the statement of operations data for the years ended December 31, 2004 and 2005 (which have not been restated) are not directly comparable to the restated data. In addition, the statement of operations data for the years ended December 31, 2004 and 2005 include the operations of our former hardware maintenance and repair services business and our former U-Scan self-check-out business as discontinued operations. |
|
|
(2) | The statement of operations data includes the results of operations of WowWee and Sablon from November 7, 2007 and August 29, 2008, respectively, the dates of acquisition. See note 5 (a) of the notes to our consolidated financial statements. |
24
|
|
MANAGEMENT’S DISCUSSION AND ANALYSIS OF FINANCIAL CONDITION AND RESULTS OF OPERATIONS |
The following discussion of the financial condition and results of operations of our company describes our business, our vision and strategy, seasonality and trends within our business environment, the critical accounting policies of our company that will help you understand our consolidated financial statements, the principal factors affecting our results of operations, and our liquidity and capital resources. This discussion should be read in conjunction with our consolidated financial statements, the factors set forth under “Item 1A. Risk Factors” and “Cautionary Statement Regarding Forward-Looking Statements” and all other financial information contained elsewhere in this annual report. All dollar amounts are expressed in United States dollars (unless otherwise stated) and, other than those expressed in millions of dollars, have been rounded to the nearest thousand.
We prepare our consolidated financial statements in accordance with Canadian GAAP, with a reconciliation to U.S. GAAP, as disclosed in note 25 of the notes to our consolidated financial statements. For a description of the material differences between Canadian GAAP and U.S. GAAP as they relate to our consolidated financial statements, see note 25 of the notes to our consolidated financial statements.
Overview
We operated businesses in two segments during 2008. Through WowWee (our business segment established by the acquisition in November 2007, and currently comprised of WowWee Group Limited, WowWee Canada Inc., WowWee USA, Inc. and WW Sablon Holdings), we design, develop, market and distribute technology-based, consumer robotic, toy and entertainment products. Through Optimal Payments Corp. we process credit card payments for retail point-of-sale merchants.
On October 1, 2008, we sold substantially all of the assets of the payments processing segment that were used exclusively in the business of processing payments for “card-not-present” transactions for a cash consideration of $7.0 million, and on August 29, 2008, we sold substantially all of the assets of the payment processing segment that were used exclusively in the business of processing payments for Canadian “card-present” transactions, for cash consideration of $1.5 million with up to an additional $0.5 million receivable in the future, contingent on the achievement of certain earnings goals. The results of operations for these business segments are included in discontinued operations in the consolidated statements of operations, and the remaining assets and liabilities of these segments are classified as discontinued in the consolidated balance sheets. Subsequent to year end, we also entered into agreements for the sale of two portfolios of residual payments from merchant processing transactions for a total consideration of approximately $12.0 million. See note 27 of the notes to our consolidated financial statements. The remaining elements of the payment processing operations consist of two U.S. “card-present” merchant portfolios, both of which process credit card payments primarily for small and medium-sized retail point-of-sale merchants and are wholly reliant on independent sales representatives. We manage these operations through a management services agreement with a third party; we do not employ any people in connection with these two portfolios
On August 29, 2008, we acquired Sablon Distribution S.A., a distributor of toy products in the Benelux countries, Austria and Germany, based in Wauthier-Braine, Belgium. The acquisition strengthens and broadens WowWee’s direct distribution model and positions WowWee closer to retailers and end users in Sablon Distribution’s markets. The former owners and senior management team of Sablon Distribution remain with the company and they continue to operate in the same capacities. The acquisition was completed at an all-cash price of approximately $5.3 million (EUR3.8 million) paid upon completion of the acquisition plus up to an additional $1.7 million (EUR1.2 million) payable in the first quarter of 2009 based upon the consolidated net equity of Sablon Distribution at the end of 2008, as well as an earnout based on the consolidated net revenues of Sablon Distribution in each of 2009 and 2010.
We expect the unfavorable economic conditions experienced in 2008 to continue into 2009. We also expect WowWee’s revenues to be under pressure in 2009 as a result of a continued pull-back in consumers’ willingness to spend and retailers’ desire to reduce inventories, weakening foreign exchange in international markets, and the sale of fewer entertainment-related products in 2009. As a result, WowWee is managing its business based on reduced revenue assumptions and taking actions intended to improve gross margins and strengthen its balance sheet, including the following:
|
|
• | WowWee continues to focus on lower price point products |
|
|
• | WowWee continues to renegotiate product costs with vendors |
|
|
• | WowWee is reassessing its advertising spending and strategy with the expectation that 2009 advertising expense will be at the low end of its historical range |
25
|
|
• | WowWee intends to prudently manage its receivable and inventory levels |
|
|
• | WowWee is planning to tightly manage its capital expenditures. |
We intend to focus on gross margins and the preservation of cash in 2009. (See “Liquidity and Capital Resources – Current Economic Environment”).
Our Industry Segments
We operated in two segments during 2008: WowWee (consumer, robotic, toy and entertainment products) and Optimal Payments (payment processing) (see note 19 of the notes to our consolidated financial statements).
WOWWEE
Based in Hong Kong, with offices in Carlsbad, California, New York, New York, Wauthier-Braine, Belgium, and Montreal, Quebec, WowWee designs, develops, markets and distributes technology-based, consumer robotic, toy and entertainment products that can be sold at a variety of price points. For 2008, WowWee’s product offering encompassed five distinct lines: WowWee Robotics, WowWee Flytech, WowWee Alive, WowWee Technologies and Think Wow Toys. See “Item 1 – Business” for details of WowWee’s product lines.
WowWee products are sold in a range of brick and mortar channels. Some of our retail customers in the U.S. also carry certain WowWee products on their Internet sales sites. Online sales of WowWee’s products are also made through Internet-based “e-tailers” such as Amazon.com and Buy.com.
WowWee’s products are predominately produced in China by third party manufacturers with which WowWee has long-standing relationships. Consistent with industry practice, the use of third party manufacturers allows WowWee to avoid incurring fixed manufacturing costs, while improving flexibility, capacity and production technology. By outsourcing its manufacturing process, WowWee maintains a flexible business model that enables it to be responsive to changing technology. In addition, once a product has reached its commercialization phase, WowWee is able to minimize inventory risk by manufacturing products based upon actual customer orders, nonetheless, certain customer orders may be subject to cancellation. Upon final assembly, products can be shipped directly from the manufacturing locations to retailers and distributors, with title to the products passing to retailer customers in the country of origin. Although WowWee does not conduct the day-to-day manufacturing of its products, it is extensively involved in the design of the product prototype and production tools, dies and molds for its products and seeks to ensure quality control by actively reviewing the production process and testing the products produced by its manufacturers. WowWee employs quality control inspectors who rotate among its manufacturers’ factories to monitor the production of substantially all of its products. WowWee’s quality assurance personnel advise as to compliance with applicable regulations during each phase of product development, perform compliance testing and coordinate third party independent compliance testing on all WowWee products. Once pre-production testing has been completed and product production has been approved, WowWee’s quality assurance personnel monitor production at the manufacturer’s facility for compliance with WowWee’s quality requirements.
Within the United States, Canada and Europe, WowWee sells its products directly to its retail customers through its direct sales channel and through independent sales representatives. For retailers across the rest of the world, WowWee utilizes a network of distributors located in various jurisdictions. In 2009, WowWee intends to distribute its products in Europe directly to retailers through Sablon. WowWee products are also available for sale through WowWee’s Internet-based store (http://www.wowweestore.com). In 2008, approximately 62% of its products were sold in North America, with the balance being sold internationally. WowWee does not have written agreements with its customers. Instead, sales are made based on purchase orders, primarily against letters of credit. The majority of orders are traditionally written during the first two quarters of the year, with shipments occurring throughout the year as new product becomes available. The majority of product shipments occur during the third and fourth quarters of the year. Revenue is recognized when (i) persuasive evidence of an arrangement exists; (ii) products are shipped to customers who assume risk of loss, (iii) collection of the respective receivable is probable and (iv) sales price is fixed or determinable. Accruals for customer discounts, rebates, incentives and allowances are recorded when the related revenues are recognized, as a reduction of revenues.
WowWee’s engineering and design team develops new technologies using internal capabilities and seeks to identify emerging or underutilized innovations that are currently being developed or that are available in the marketplace. In order to leverage the man-hours invested in prior products, older generations of products frequently form the foundation for the next generation of products as well as new product lines. New technologies are then integrated to enhance the overall functionality of the product. In sourcing technologies, WowWee reviews the latest technology innovations at trade-shows, conferences, colleges and universities, on the Internet, and through word-of-mouth. WowWee regularly reviews technologies or product concepts from third party sources that it believes could
26
have potential synergies with WowWee’s current product line or that could be successfully commercialized based upon WowWee’s development process. WowWee also licenses third party technologies for development within unique consumer applications developed by WowWee.
Significant Developments in this Segment in 2008
On August 29, 2008, we acquired Sablon Distribution S.A., a distributor of products in the Benelux countries, Austria and Germany, based in Wauthier-Braine, Belgium. The acquisition strengthens and broadens WowWee’s direct distribution structure and positions WowWee closer to retailers and end users in Sablon Distribution’s markets. The former owners and senior management team of Sablon Distribution remain with the company and they continue to operate in the same capacities. The acquisition was completed at an all-cash price of approximately $5.3 million (EUR3.8 million) paid upon completion of the acquisition plus up to an additional $1.7 million (EUR1.2 million) payable in the first quarter of 2009 based upon the consolidated net equity of Sablon Distribution at the end of 2008, as well as an earnout based on the consolidated net revenues of Sablon Distribution in each of 2009 and 2010.
OPTIMAL PAYMENTS
Optimal Payments Corp. processes credit card payments for retail point-of-sale merchants.
Optimal Payments generates revenues primarily from fees charged to merchants for processing services. Fees charged to merchants typically include a discount rate, based upon a percentage of the dollar amounts processed, and a variety of fixed transaction fees. Merchant fees charged are based upon the merchant’s transaction volume. Other fees are derived from a variety of fixed transaction fees, including fees for monthly minimum charge volume requirements, statement fees, annual fees and fees for other miscellaneous items. Discount and other fees related to payment transactions are recognized at the time the merchant’s transactions are processed. Revenues derived from service fees are recognized at the time the service is performed.
Significant Developments in this Segment in 2008
On October 1, 2008, we sold substantially all of the assets of the payments processing segment that were used exclusively in the business of processing payments for “card-not-present” transactions for a cash consideration of $7.0 million and on August 29, 2008, we sold substantially all of the assets of the payment processing segment that were used exclusively in the business of processing payments for Canadian “card-present” transactions for cash consideration of $1.5 million with up to an additional $0.5 million receivable in the future, contingent on the achievement of certain earnings goals. The results of operations for these business segments are included in discontinued operations in the consolidated statements of operations, and the remaining assets and liabilities of these segments are classified as discontinued in the consolidated balance sheets. Subsequent to year end, we also entered into agreements for the sale of two portfolios of residual payments from merchant processing transactions for a total consideration of approximately $12.0 million. See note 27 of the notes to our consolidated financial statements. The remaining elements of the payment processing operations consist of two U.S. “card-present” merchant portfolios, both of which process credit card payments primarily for small and medium-sized retail point-of-sale merchants and are wholly reliant on independent sales representatives we manage these operations through a management services agreement with a third party; we do not employ any people in connection with these two portfolios.
Seasonality
Revenue derived from the payments processing business segment is currently not subject to seasonality.
Revenue from the WowWee business segment (consumer robotic, toy and entertainment) is subject to seasonal variability. In 2008, the majority of our net sales were made in the third and fourth quarters. Generally, the first quarter is the period of lowest shipments and sales in our business and the toy industry generally and therefore the least profitable due to various fixed costs. Seasonality factors will cause our operating results to fluctuate significantly from quarter to quarter. Our results of operations may also fluctuate as a result of factors such as the timing of new products (and related expenses), the advertising activities of our competitors, delivery schedules set by our customers and the emergence of new market entrants. We believe, however, that the low retail price of our lower-priced products may be less subject to seasonal fluctuations than our higher priced toy products.
These seasonal purchasing patterns and requisite production lead times causes risk in our business associated with the underproduction of popular toys and the overproduction of toys that do not match consumer demand. Retailers are also attempting to manage their inventories more tightly in recent years, requiring us to ship
27
products closer to the time the retailers expect to sell the products to consumers. These factors increase the risk that we may not be able to meet demand for certain products at peak demand times, or that our own inventory levels may increase due to the need to pre-build products before orders are placed.
In anticipation of retail sales in the traditional holiday season, the Company significantly increases its production in advance of the peak selling period, resulting in a corresponding build-up of inventory levels in the first three quarters of its fiscal year. Seasonal shipping patterns result in significant peaks in the third and fourth quarters in the respective levels of inventories and accounts receivable, which result in seasonal working capital financing requirements.
We ship products in accordance with delivery schedules specified by our customers, who usually request delivery of their products within three to six weeks of the date of their orders for orders shipped FOB China or Hong Kong and within three days on orders shipped domestically. Because customer orders may be canceled at any time without penalty, our backlog may not accurately indicate sales for any future period.
Critical Accounting Policies and Estimates
Our consolidated financial statements have been prepared in accordance with Canadian GAAP, which requires us to make numerous estimates and assumptions. Financial results as determined by actual events could differ from those estimates and assumptions, and therefore affect our reported results of operations and financial position. Our significant accounting policies are more fully described in notes 3 and 4 of the notes to our consolidated financial statements. The critical accounting policies described here are those that are most important to the depiction of our financial condition and results of operations. The preparation of financial statements also involves significant management judgment in making estimates about the effect of matters that are inherently uncertain. While best estimates have been used for reporting financial statement items subject to measurement uncertainty, management considers that it is possible, based on existing knowledge, that changes in future conditions in the near term could affect the reported amounts of assets and liabilities and disclosures in our consolidated financial statements. “Near term” is considered to be within one year from the date of the financial statements.
Goodwill and Other Intangibles
We account for business acquisitions using the purchase method. Accordingly, the purchase price of a business acquisition is allocated to its identifiable net assets, including identifiable intangible assets, on the basis of estimated fair values as at the date of purchase, with any excess being assigned to goodwill. We estimate the fair value of assets and liabilities acquired at the date of acquisition using a projected discounted cash flow method and other valuation methods. We make a number of significant estimates when calculating fair value using a projected discounted cash flow method. These estimates include estimating projected future cash flows, the number of years used, the discount rate and others. We believe that our estimates and valuation methods are reasonable. They are consistent with our inherent planning and reflect our best estimates, but they have inherent uncertainties that management may not be able to control.
Goodwill is not amortized but rather evaluated under an impairment approach. Factors we consider important which could trigger an impairment review include the following: a) significant underperformance relative to expected historical or projected future operating results; b) significant changes in the manner of our use of the acquired assets or the strategy for our overall business; and c) significant negative industry or economic trends.
Due to the subjective nature of the impairment analysis, significant changes in the assumptions used to develop the estimate could materially affect the conclusion regarding the future cash flows necessary to support the valuation of long-lived assets, including goodwill. The valuation of goodwill involves a high degree of judgment and consists of a comparison of the fair value of a reporting unit with its book value. Based on the assumptions underlying the valuation, impairment is determined by estimating the fair value of a reporting unit and comparing that value to the reporting unit’s book value. If the fair value is more than the book value of the reporting unit, an impairment loss is not indicated. If impairment exists, the fair value of the reporting unit is allocated to all of its assets and liabilities excluding goodwill, with the excess amount representing the fair value of goodwill. An impairment loss is measured as the amount by which the book value of the reporting unit’s goodwill exceeds the estimated fair value of that goodwill.
To determine the fair value of our reporting units, we generally use a present value technique (discounted cash flow). The factor most sensitive to change with respect to our discounted cash flow analyses is the estimated future cash flows of each reporting unit which is, in turn, sensitive to our estimates of future revenue growth and margins for these businesses. If actual revenue growth and/or margins are lower than our expectations, the
28
impairment test results could differ. We applied what we believe to be the most appropriate and consistent valuation methodology for each of the reporting units. If we had established different reporting units or utilized different valuation methodologies, the impairment test results could differ.
Other intangible assets with finite lives continue to be amortized over their estimated useful lives. The amounts recorded as intangible assets at the date of acquisition represent the estimated fair value of these assets based on estimated future cash flows discounted at appropriate discount rates. For intangibles with finite lives, we make estimates of future cash flows to be generated from the related assets.
In 2008, we recorded impairment losses of $66.9 million on goodwill and other intangibles relating to continuing operations and an additional $18.3 million are recorded in the results from discontinued operations. See “Results of Operations”.
Allowance for Doubtful Accounts
Our allowance for doubtful accounts is based on management’s assessment of the business environment, customers’ financial condition, historical collection experience, accounts receivable aging, customer disputes and the collectability of specific customer accounts. If there were a deterioration of a major customer’s creditworthiness, or actual defaults were higher than our historical experience, our estimates of the recoverability of amounts due to us could be overstated, which could have an adverse impact on our operating results. The size of the allowance for doubtful accounts is also affected by the timing of the realization of uncollectible accounts receivable balances as well as the offsetting allowance.
Major customers’ accounts are monitored on an ongoing basis; more in depth reviews are performed based on changes in a customer’s financial condition and/or the level of credit being extended. When a significant event occurs, such as a bankruptcy filing by a specific customer, and on a quarterly basis, the allowance is reviewed for adequacy and the balance adjusted to reflect our current assessment of credit loss.
Revenue Recognition
Our revenue recognition policy is to recognize revenue when persuasive evidence of an arrangement exists, title transfer has occurred (product shipment), the price is fixed or readily determinable, and collectability is probable. Sales are recorded net of sales returns and discounts, which are estimated at the time of shipment based upon historical data. We routinely enter into arrangements with our customers to provide sales incentives, support customer promotions, and provide allowances for returns and defective merchandise. Such programs are based primarily on customer purchases, customer performance of specified promotional activities, and other specified factors such as sales to consumers. Accruals for these programs are recorded as sales adjustments that reduce gross revenue in the period the related revenue is recognized.
Reserve for Inventory Obsolescence
We value our inventory at the lower of cost or net realizable value. Based upon a consideration of quantities on hand, actual and projected sales volume, anticipated product selling prices and product lines planned to be discontinued, slow-moving and obsolete inventory is written down to its net realizable value.
Failure to accurately predict and respond to consumer demand could result in our under producing popular items or overproducing less popular items. Furthermore, significant changes in demand for our products would impact management’s estimates in establishing our inventory provision.
Management estimates are monitored on a quarterly basis and a further adjustment to reduce inventory to its net realizable value is recorded, as an increase to cost of sales, when deemed necessary under the lower of cost or market standard.
Income Taxes
We provide for income taxes using the asset and liability method of tax allocation. Under this method, future income tax assets and liabilities are determined based on deductible or taxable temporary differences between financial statement values and tax values of assets and liabilities using substantively enacted income tax rates expected to be in effect for the year in which the differences are expected to reverse. We establish a valuation allowance against future income tax assets if, based on available information, it is more likely than not that some or all of the future income tax assets will not be realized. In assessing the reliability of tax assets, we consider whether
29
it is more likely than not that some portion or all of the tax assets will not be realized. The ultimate realization of the future tax assets is dependent upon the generation of future taxable income during the periods in which the temporary differences become deductible. We considered the scheduled reversal of tax liabilities, projected future taxable income, and tax planning strategies in making this assessment.
We accrue a tax reserve for additional income taxes and interest, which may become payable in future years as a result of audit adjustments by tax authorities. The reserve is based on management’s assessment of all relevant information, and is periodically reviewed and adjusted as circumstances warrant. As of December 31, 2008, our income tax reserves are approximately $8.5 million.
Stock-based Compensation
We use the fair value-based method to account for stock-based compensation and other stock-based payments, such as stock options and restricted share units. Under the fair value-based method, compensation cost is measured at fair value at the date of grant and is expensed over the award’s vesting period. The fair value of stock options granted is determined at the date of grant using the Black-Scholes option pricing model, which requires certain assumptions, including future stock price volatility, risk-free interest rates, and expected time to exercise. Changes to any of these assumptions, or the use of a different option pricing model, would result in different fair values for stock-based compensation.
Contingent liabilities
Our former gaming payment processing services segment derived a substantial portion of its revenue prior to October 13, 2006 from processing transactions from U.S. based gaming. Therefore, we may be exposed to adverse consequences as a result of enforcement proceedings, governmental investigations or lawsuits initiated against us in jurisdictions where gaming is restricted or prohibited. Following announcements by the U.S. Attorney’s Office in the Southern District of New York relating to its investigation of the U.S. Internet gambling industry, we announced on May 8, 2007 that we had initiated discussions with the U.S. Attorney’s Office in the Southern District of New York and were in the process of responding to a voluntary request for information issued by the U.S. Attorney’s Office. We have not recorded any provision for this matter because the outcome of these discussions and the amount of loss, if any, are not determinable. While best estimates have been used for reporting financial statement items subject to measurement uncertainty, management considers that it is possible that changes in future conditions in the near term could require a material change in the recognized amounts of certain assets and liabilities. “Near term” is considered to be within one year from the date of the financial statements.
OGOP Payments Inc. has received a request for information from the U.S. Attorney’s Office in the Eastern District of New York pertaining to its former involvement in processing transactions for internet pharmacies. OGOP Payments Inc. has had discussions with that Office relating to those processing activities. No provision has been recorded by OGOP Payments Inc. for this matter because the outcome of these discussions and the amount of any loss, if any, are not determinable.
We are also party to litigation arising in the normal course of operations. The results of legal proceedings cannot be predicted with certainty. Should we fail to prevail in any of these legal matters or should several legal matters be resolved against us in the same reporting period, the consolidated operating results of a particular reporting period could be materially adversely affected.
Recent Accounting Pronouncements
|
|
(a) | New Accounting Policies |
|
|
| The following accounting standards have recently been issued by the Canadian Institute of Chartered Accountants (CICA), and the Financial Accounting Standards Board (FASB) that are relevant to our company. References to FASB and Statement of Financial Accounting Standards (SFAS) relate to U.S. GAAP and therefore may affect the note to our consolidated financial statements that discloses Canadian/U.S. GAAP differences. |
|
|
| Capital Disclosures |
|
|
| On January 1, 2008, we adopted Section 1535, Capital Disclosures, which established guidelines for disclosure of both qualitative and quantitative information that enables users of financial statements to |
30
|
|
| evaluate the entity’s objectives, policies and processes for managing capital. This new standard relates to disclosure only and did not impact our financial results. |
|
|
| Financial Instruments |
|
|
| On January 1, 2008, we adopted Section 3862, Financial Instruments - Disclosure, which describes the required disclosure for the assessment of the significance of financial instruments for an entity’s financial position and performance and of the nature and extent of risk arising from financial instruments to which the entity is exposed and how the entity manages those risks. In addition, we adopted Section 3863, Financial Instruments – Presentation, which establishes standards for presentation of financial instruments and non-financial derivatives. It carries forward the presentation related requirements of Section 3861, Financial Instruments - Disclosure and Presentation. These new standards relate to disclosure only and did not impact our financial results. |
|
|
| Inventories |
|
|
| On January 1, 2008, we adopted Section 3031, Inventories, which replaces Section 3030 and harmonizes the Canadian standards related to inventories with the International Financial Reporting Standards (“IFRS”). This section provides changes to the measurement and more extensive guidance on the determination of cost, including allocation of overhead; narrows the permitted cost formulas; requires impairment testing; and expands the disclosure requirements to increase transparency. The adoption of this standard did not have a significant effect on our consolidated financial statements. |
|
|
| SFAS No. 157 - Fair Value Measurements |
|
|
| On January 1, 2008 we adopted SFAS No. 157, Fair Value Measurements. SFAS No. 157 clarifies the principle that fair value should be based on the assumptions market participants would use when pricing an asset or liability and establishes a fair value hierarchy that prioritizes the information used to develop those assumptions. Under the standard, fair value measurements would be separately disclosed by level within the fair value hierarchy. The standard did not have a significant effect on our consolidated financial statements. |
|
|
(b) | Future Accounting Pronouncements |
|
|
| The following accounting pronouncements have recently been issued by the CICA and the FASB and may be relevant to our company. References to FASB and SFAS relate to U.S. GAAP and therefore may affect the note to our consolidated financial statements that discloses Canadian/U.S. GAAP differences. |
|
|
| Goodwill and intangible assets |
|
|
| In February 2008, the CICA issued Section 3064, Goodwill and Intangible Assets, which will replace Section 3062, Goodwill and Other Intangible Assets and Section 3450, Research and Development Costs. The standard provides guidance on the recognition of intangible assets in accordance with the definition of an asset and the criteria for asset recognition, as well as clarifying the application of the concept of matching revenues and expenses, whether these assets are separately acquired or internally developed. This standard applies to interim and annual financial statements relating to fiscal years beginning on or after October 1, 2008. We expect that the adoption of this standard will not have a significant effect on our financial results. |
|
|
| International Financial Reporting Standards |
|
|
| In February 2008, Canada’s Accounting Standards Board (“AcSB”) confirmed that Canadian GAAP as used by publicly accountable enterprises will be fully converged with IFRS, as issued by the International Accounting Standards Board (“IASB”). The changeover date is for interim and annual financial statements relating to fiscal years beginning on or after January 1, 2011. We are currently assessing the future impact of these new standards on the consolidated financial statements. |
31
|
|
| Business Combinations and Consolidations |
|
|
| In January 2009, the CICA issued CICA Handbook Section 1582, Business Combinations, Section 1601, Consolidations, and Section 1602, Non-controlling Interests. These sections will replace the former CICA Handbook Section 1581, Business Combinations and Section 1600, Consolidated Financial Statements and establish a new section for accounting for a non-controlling interest in a subsidiary. CICA Handbook Section 1582 establishes standards for the accounting for a business combination, and states that all assets and liabilities of an acquired business will be recorded at fair value. Obligations for contingent considerations and contingencies will also be recorded at fair value at the acquisition date. The standard also states that acquisition-related costs will be expensed as incurred and that restructuring charges can only be recorded when the definition of a liability is met, which will generally result in these amounts being expensed in the periods after the acquisition date. It provides the Canadian equivalent to IFRS 3, Business Combinations (January 2008). The section applies prospectively to business combinations for which the acquisition date is on or after the beginning of the first annual reporting period beginning on or after January 1, 2011 and early adoption is permitted. |
|
|
| CICA Handbook Section 1601 establishes standards for the preparation of consolidated financial statements. |
|
|
| CICA Handbook Section 1602 establishes standards for accounting for a non-controlling interest in a subsidiary in the preparation of consolidated financial statements subsequent to a business combination. It is equivalent to the corresponding provisions of IFRS International Accounting Standards (“IAS”) 27, Consolidated and Separate Financial Statements (January 2008). |
|
|
| CICA Handbook Section 1601 and Section 1602 apply to interim and annual consolidated financial statements relating to fiscal years beginning on or after January 1, 2011. Earlier adoption of these sections is permitted as of the beginning of a fiscal year. All three sections must be adopted concurrently. We are currently evaluating the effect of the adoption of these sections. |
|
|
| Credit Risk and Fair Value |
|
|
| In January 2009, the CICA issued EIC-173, Credit Risk and the Fair Value of Financial Assets and Financial Liabilities, which clarifies that the credit risk of counterparties should be taken into account in determining the fair value of derivative financial instruments. The EIC-173 will be adopted on January 1, 2009. The adoption of this standard is not expected to have a significant effect in our financial results. |
|
|
| SFAS No. 141R, Business Combinations |
|
|
| In December 2007, the FASB issued a revised standard on accounting for business combinations. The major changes to accounting for business combinations include the following: all business acquisitions will be measured at fair value; the existing definition of a business would be expanded; certain pre-acquisition contingencies would be measured at fair value; most acquisition-related costs would be recognized as expenses are incurred (they would no longer be part of the purchase consideration); obligations for contingent consideration would be measured and recognized at fair value at the date of acquisition (measurement and recognition would no longer be dependent on settlement of the contingency); non-controlling interests would be measured at fair value at the date of acquisition (i.e., 100% of the assets and liabilities would be measured at fair value even when an acquisition is less than 100%); goodwill, if any, arising on a business combination reflects the excess of the fair value of the acquiree, as a whole, over the net amount of the recognized identifiable assets acquired and liabilities assumed, and would be allocated to the acquirer and the non-controlling interest. The statement is effective for periods beginning on or after January 1, 2009. We will apply the standard for acquisitions occurring after this date. |
|
|
| SFAS No. 160 - Non-controlling interest in consolidated financial statements |
|
|
| In December 2007, the FASB issued a revised standard on accounting for non-controlling interests and transactions with non-controlling interest holders in consolidated financial statements. This revised standard specifies that non-controlling interests are to be treated as a separate component of equity, not as a liability or other items outside of equity. Because non-controlling interests are an element of equity, increases and decreases in the parent’s ownership interest that leave control intact are accounted for as capital transactions rather than as a step acquisition or dilution gains or losses. The carrying amount of the |
32
|
|
| non-controlling interests is adjusted to reflect the changes in ownership interests, and any difference between the amount by which the non-controlling interests are adjusted and the fair value of the consideration paid or received is recognized directly in equity attributable to the controlling interests. |
|
|
| This standard requires net income and comprehensive income to be displayed for both the controlling and the non-controlling interests. Additional required disclosures and reconciliations include a separate schedule that shows the effects of any transactions with the non-controlling interests on the equity attributable to the controlling interests. |
|
|
| The statement is effective for periods beginning on or after December 15, 2008. SFAS 160 will be applied prospectively to all non-controlling interests, including any that arose before the effective date. We do not expect the adoption of SFAS 160 to materially impact our consolidated financial statements. |
|
|
| SFAS No. 161 - Disclosures about derivative instruments and hedging activities, an amendment to FASB Statement No. 133 |
|
|
| In March 2008, the FASB issued the above-noted statement, which requires qualitative disclosures about objectives and strategies for using derivatives, quantitative disclosures about fair value amounts of and gains and losses on derivative instruments, and disclosures about credit-risk related contingent features on derivative agreements. The statement is effective for periods beginning on or after November 15, 2008. We do not expect the adoption of SFAS No. 161 to materially affect our consolidated financial statements. |
|
|
| SFAS No. 162 – The Hierarchy of Generally Accepted Accounting Principles and SFAS 163 - Accounting for Financial Guarantee Insurance Contracts |
|
|
| In May 2008, the FASB issued the above-noted statements. We do not expect the adoption of these statements to affect our consolidated financial statements. |
Financial Condition
As at December 31, 2008, cash and cash equivalents and short-term investments totaled $39.1 million, compared to $59.7 million as at December 31, 2007. The decrease in cash and cash equivalents and short-term investments is primarily due to business acquisitions ($6.6 million), as well as cash used in operations ($23.2 million) and the purchase of property and equipment and intangibles ($4.8 million), off-set by proceeds received from the sale of card-not-present and Canadian card-present payment processing assets ($8.5 million). We have various credit facilities through our subsidiaries located in Belgium and Hong Kong, of which $11.5 million were used at December 31, 2008. Of this amount, $5.7 million was assumed at the date of the Sablon acquisition. See note 11 of the notes to our consolidated financial statements. As at year end, our cash and cash equivalents and short-term investments, net of bank indebtedness were as follows:
|
|
|
|
|
|
|
|
(U.S. dollars, in thousands) |
| 2008 |
| 2007 |
| ||
|
|
|
| ||||
| |||||||
Cash and cash equivalents |
| $ | 32,849 |
| $ | 47,193 |
|
Short-term investments |
|
| 6,296 |
|
| 12,477 |
|
|
|
| |||||
|
|
| 39,145 |
|
| 59,670 |
|
Less: |
|
|
|
|
|
|
|
Bank indebtedness |
|
| (11,547 | ) |
| — |
|
|
|
| |||||
| |||||||
Net |
| $ | 27,598 |
| $ | 59,670 |
|
|
|
| |||||
Our portfolio of liquid and investment grade short-term investments consists of U.S. denominated discounted and undiscounted notes and bonds.
Working capital as at December 31, 2008 was $33.2 million, as compared to $35.4 million at December 31, 2007. This decrease is due primarily to cash used in the acquisition of Sablon Distribution, cash used in operations and the purchase of property and equipment and intangibles, off-set by proceeds received from the sale of card-not-present and Canadian card-present payment processing assets.
33
Accounts receivable as at December 31, 2008 were $25.1 million, as compared to $17.2 million at December 31, 2007. The increase of $7.9 million resulted primarily from the acquisition of Sablon Distribution.
Inventories as at December 31, 2008 were $19.4 million, as compared to $3.1 million at December 31, 2007. The increase of $16.3 million resulted from an increase of $4.3 million of raw materials due to a greater amount of product lines in 2008 and an increase of finished goods of $12.0 million due to the acquisition of Sablon Distribution.
As a result of the impairment losses recorded during 2008, we have no goodwill as at December 31, 2008, compared to $47.9 million of goodwill as at December 31, 2007. See the explanation of impairment losses below.
Intangible assets decreased by $28.4 million, from $85.1 million as at December 31, 2007 to $56.7 million as at December 31, 2008. This decrease is due primarily to amortization during the year of $18.5 million and impairment losses of $14.6 million, offset by acquisitions of $4.8 million.
Shareholders’ equity as at December 31, 2008 was $93.5 million, as compared to $201.7 million as at December 31, 2007. The decrease is attributable primarily to our net loss, which includes the impairment of goodwill for the period.
Quarterly Results
The following table sets forth certain summarized unaudited quarterly financial data for the periods presented. The financial data has been derived from unaudited financial statements that, in the opinion of management, reflect all adjustments, consisting only of normal recurring adjustments, necessary for a fair presentation of such quarterly data. The operating results for any quarter are not necessarily indicative of the results to be expected for any future period.
The unaudited financial statements are prepared on the basis of Canadian GAAP, which is different in some regards from U.S. GAAP. The following quarterly results are adjusted to present the revenues of the Canadian “card-present” and “card-not-present” payment processing businesses as discontinued operations, and include the results of operations of WowWee and Sablon from November 7, 2007 and August 29, 2008, respectively, the dates of acquisition.
|
|
|
|
|
|
|
|
|
|
|
|
|
|
|
|
|
|
|
|
|
|
|
|
|
|
|
| For the quarter ended |
| ||||||||||||||||||||||
|
| ||||||||||||||||||||||||
|
| Dec. 31, |
| Sept. 30, |
| June 30, |
| March 31, |
| Dec. 31, |
| Sept. 30, |
| June 30, |
| March 31, |
| ||||||||
|
| ||||||||||||||||||||||||
|
| (U.S. dollars, in thousands except per share data) |
| ||||||||||||||||||||||
Revenues |
| $ | 33,396 |
| $ | 66,445 |
| $ | 31,134 |
| $ | 21,571 |
| $ | 28,423 |
| $ | 18,968 |
| $ | 18,520 |
| $ | 18,997 |
|
|
| ||||||||||||||||||||||||
| |||||||||||||||||||||||||
Net (loss) earnings |
| $ | (56,270 | ) | $ | 1,707 |
| $ | (48,394 | ) | $ | (8,046 | ) | $ | (31,603 | ) | $ | (413 | ) | $ | 1,157 |
| $ | (5,652 | ) |
|
| ||||||||||||||||||||||||
| |||||||||||||||||||||||||
Net (loss) earnings per share: |
|
|
|
|
|
|
|
|
|
|
|
|
|
|
|
|
|
|
|
|
|
|
|
|
|
Basic |
| $ | (2.18 | ) | $ | 0.07 |
| $ | (1.87 | ) | $ | (0.32 | ) | $ | (1.26 | ) | $ | (0.02 | ) | $ | 0.05 |
| $ | (0.24 | ) |
Diluted |
| $ | (2.18 | ) | $ | 0.07 |
| $ | (1.87 | ) | $ | (0.32 | ) | $ | (1.26 | ) | $ | (0.02 | ) | $ | 0.05 |
| $ | (0.24 | ) |
|
| ||||||||||||||||||||||||
The net loss for the interim periods ended December 31, 2007, June 30, 2008 and December 31, 3008 include pre-tax impairment charges of $22.5 million, $29.0 million and $56.1 million, respectively, related to goodwill and amortizable intangibles.
Results of Operations
On October 1, 2008, we sold substantially all of the assets of the payments processing segment that were used exclusively in the business of processing payments for “card-not-present” transactions for a cash consideration of $7.0 million, and on August 29, 2008 we sold substantially all of the assets of the payment processing segment that were used exclusively in the business of processing payments for Canadian “card-present” business for cash consideration of $1.5 million with up to an additional $0.5 million receivable in the future, contingent on the achievement of certain earnings goals.
The results of operations for these businesses are included in discontinued operations in the consolidated statements of operations, and the remaining assets and liabilities of these businesses are classified as discontinued in the consolidated balance sheets.
34
On August 29, 2008, we acquired Sablon Distribution S.A., a distributor of products in the Benelux countries, Austria and Germany, based in Wauthier-Braine, Belgium. The acquisition strengthens and broadens WowWee’s direct distribution structure and positions WowWee closer to retailers and end users in Sablon Distribution’s markets. The former owners and senior management team of Sablon Distribution remain with the company and they continue to operate in the same capacities. The acquisition was completed at an all-cash price of approximately $5.3 million (EUR3.8 million) paid upon completion of the acquisition plus up to an additional $1.7 million (EUR1.2 million) payable in the first quarter of 2009 based upon the consolidated net equity of Sablon Distribution at the end of 2008, as well as an earnout based on the consolidated net revenues of Sablon Distribution in each of 2009 and 2010.
2008 Compared with 2007 (excluding amounts classified as discontinued operations)
Revenues increased by $67.6 million from $84.9 million during the year ended December 31, 2007 to $152.5 million during the year ended December 31, 2008. The increase is due primarily to the acquisition of WowWee in November 2007 and our acquisition of Sablon Distribution in August 2008. In 2008, revenues in the consumer robotic, toy and entertainment segment were $93.4 million, compared to $11.3 million in 2007. Revenues in 2008 comprised a full year of activity from the WowWee acquisition and four months of activity from the Sablon Distribution acquisition completed on August 29, 2008. In 2007, revenues in this segment were comprised of revenues from WowWee from November 2007, the date of acquisition. Revenues in payment processing decreased from $73.6 million to $59.2 million as a result of the sale of the “card-not-present” and Canadian “card-present” payment processing assets in 2008, as previously described. In January and February 2009, we sold two other payment processing portfolios in this segment and expect revenues and costs to decline significantly in 2009. We expect to focus our activities on the consumer robotic, toy and entertainment segment in the future
Approximately 73% of revenues were derived from customers located in the United States in 2008 compared to 89% in 2007. We expect this percentage to decline in 2009 as a result of the Sablon acquisition, which will result in greater European sales, and the sale of the payment processing businesses.
Cost of sales and transaction processing (excluding amortization) increased by $47.6 million, from $61.5 million during the year ended December 31, 2007 to $109.1 million during the year ended December 31, 2008 due primarily to the acquisition of WowWee in November 2007 and our acquisition of Sablon Distribution in August 2008.
Amortization of intangibles pertaining to cost of sales and transaction processing costs increased by $5.8 million, from $12.7 million during the year ended December 31, 2007 to $18.5 million during the year ended December 31, 2008. The increase in amortization is due primarily to the intangible assets acquired in connection with our acquisition of WowWee in November 2007 and our acquisition of Sablon Distribution in August 2008.
Selling, general and administrative expenses (excluding amortization and stock-based compensation) increased by $29.5 million, from $20.3 million during the year ended December 31, 2007 to $49.8 million during the year ended December 31, 2008. The increase in selling, general and administrative expenses is due primarily to our acquisition of WowWee in November 2007 and our acquisition of Sablon Distribution in August 2008.
The stock-based compensation pertaining to selling, general and administrative expense is attributable to the accounting for the fair value of stock options granted. Stock-based compensation expense for the year ended December 31, 2008 increased by $3.0 million, from $0.3 million in the year ended December 31, 2007 to $3.3 million in the year ended December 31, 2008. The increase is primarily due to options issued in November 2007, and to a modification to the expiry date of options issued in 2004 from April 29, 2009 to April 29, 2014. Since these options were vested at the date of modification, the incremental value of the fair value of the modified options of $1.4 million was expensed in 2008.
Research and development expense increased by $2.2 million during the year, from $0.7 million during the year ended December 31, 2007 to $2.9 million during the year ended December 31, 2008. Research and development expenses are comprised primarily of personnel-related expenditures associated with the development of new products in the WowWee business segment.
Amortization of property and equipment pertaining to costs of sales increased by $3.0 million, from $0.6 million during the year ended December 31, 2007 to $3.6 million during the year ended December 31, 2008. The increase is due primarily to the addition of capital assets as a result of the WowWee and Sablon Distribution acquisitions.
35
Impairment losses were recorded in both the consumer robotic, toy and entertainment and payment processing segments. In the consumer robotic, toy and entertainment segment, impairment losses were recorded due largely to a general deterioration of the economic environment. Sales, operating profits and cash flows in the consumer robotic, toy and entertainment products segment were lower than expected in 2008. We tested the consumer robotic, toy and entertainment segment for impairment at September 30, 2008 and December 31, 2008. We revised our forecast for the next five years to reflect lower growth expectations for this segment. At December 31, 2008, a goodwill impairment loss of $41.4 million and an impairment loss of $2.4 million on amortizable intangibles was recognized for this segment. The fair value of the segment was estimated using the expected present value of future cash flows. In addition, at June 30, 2008, we tested goodwill for impairment in the payment processing segment as we determined that there was a more likely than not expectation that a significant portion, or this entire segment, would be sold over the course of the following 12 months. As a result of this analysis, the goodwill in the segment was determined to be impaired since the estimated fair value to be realized as proceeds from transactions would be less than the carrying value of the segment including goodwill. As a result, we recorded a non-cash goodwill impairment loss of $10.8 million in the second quarter of 2008.We also tested the remaining intangibles held in the payment processing segment at December 31, 2008 for impairment as we determined that there was a more likely than not expectation that a significant portion of these intangibles would be sold over the course of the next twelve months. As a result of this analysis, we recorded a non-cash impairment charge of $12.2 million at December 31, 2008 based on the estimated fair value to be realized as proceeds from these transactions.
The recovery for income taxes was $3.5 million for the year ended December 31, 2008 compared to $0.6 million for the year ended December 31, 2007. Significant components of our 2008 tax provision include the effect of the goodwill impairment loss in the amount of $7.5 million and of stock-based compensation in the amount of $1.0 million, which are not deductible for tax. Other significant components of our 2008 provision are the change in the valuation allowance of $12.6 million, which reflects an increase in the benefit of losses not recorded, and an increase of $5.8 million caused by differences in tax rates in the jurisdictions in which we operate. Significant components of our 2007 tax provision include the change in valuation allowance of $3.1 million.
Our tax provision includes the effect of future taxes on unrealized foreign exchange gains and losses, which arise upon the conversion into Canadian dollars of net monetary assets and liabilities denominated in U.S. dollars for purposes of determining taxable income under Canadian income tax regulations. Since the U.S. dollar is our measurement currency and our consolidated financial statements are presented in U.S. dollars, these foreign exchange gains/losses do not impact earnings before income taxes. In 2008, our tax provision includes a future tax charge of $0.5 million related to unrealized foreign exchange compared to a recovery of $2.2 million in 2007.
With respect to future income tax assets, as at December 31, 2008 we have recorded a valuation allowance of approximately $44.8 million (2007 - $28.5 million) related to assets that we determined were not more likely than not to be realized. Our ability to ultimately realize these future income tax assets is dependent upon our future profitability within the allowable carry-forward period, thus creating sufficient taxable income to realize the benefit of these assets.
Our net loss in 2008 was $111.0 million (or $(4.29) per share - basic and diluted), compared to net loss of $36.5 million ($1.51 per share – basic and diluted) in 2007.
EBITDA was a loss of $10.7 million (or $(0.41) per diluted share) for 2008 compared to EBITDA of $1.8 million (or $0.08 per diluted share) for 2007.
A reconciliation of this non-GAAP financial information is presented in the table below. We use non-GAAP measures to assess our operating performance. Securities regulations require that companies caution readers that earning and other measures adjusted to a basis other than GAAP do not have standardized meanings and are unlikely to be comparable to similar measures used by other companies. Accordingly, they should not be considered in isolation. We use EBITDA to measure our performance from one period to the next without the variation caused by certain adjustments that could potentially distort the analysis of trends in our operating performance, and because we believe it provides meaningful information on our financial condition and operating results.
EBITDA, as we use it, is calculated as earnings before investment income, taxes and depreciation and amortization and excludes the impacts of impairment loss, stock-based compensation and discontinued operations. We believe it is useful to exclude these items as they are either non-cash expenses, items that cannot be influenced by management in the short term, or items that do not impact core operating performance. Excluding these items does not imply they are necessarily non-recurring.
36
|
|
|
|
|
|
|
|
Reconciliation of Non-GAAP Financial Information | |||||||
|
|
|
|
|
|
|
|
|
| Twelve months ended |
| ||||
|
| 2008 |
| 2007 |
| ||
|
| Unaudited |
| Unaudited |
| ||
|
|
|
|
|
|
|
|
Net loss |
| $ | (111,003 | ) | $ | (36,511 | ) |
| |||||||
Add (deduct): |
|
|
|
|
|
|
|
Impairment losses |
|
| 66,910 |
|
| — |
|
Amortization of intangibles pertaining to cost of sales and transaction processing |
|
| 18,494 |
|
| 12,690 |
|
Amortization of equipment pertaining to cost of sales |
|
| 3,623 |
|
| 581 |
|
Amortization of equipment pertaining to selling, general and administrative |
|
| 709 |
|
| 235 |
|
Stock-based compensation pertaining to selling, general and administrative |
|
| 3,339 |
|
| 276 |
|
Investment income |
|
| (1,238 | ) |
| (5,831 | ) |
Income tax recovery |
|
| (3,500 | ) |
| (618 | ) |
Loss from discontinued operations |
|
| 12,000 |
|
| 31,026 |
|
|
|
|
|
|
|
|
|
EBITDA |
| $ | (10,666 | ) |
| 1,848 |
|
|
|
|
|
|
|
|
|
Diluted shares |
|
| 25,860 |
|
| 24,179 |
|
|
|
|
|
|
|
|
|
EBITDA per diluted share |
| $ | (0.41 | ) | $ | 0.08 |
|
2007 Compared with 2006 (excluding amounts classified as discontinued operations)
Revenues increased by $3.1 million, from $81.8 million during the year ended December 31, 2006 to $84.9 million during the year ended December 31, 2007. The increase in revenues was due primarily to approximately $11.0 million of revenue resulting from the acquisition of WowWee in November 2007, offset by a decrease in revenue in our payment processing business segment. The decrease in revenue in our payments processing segment was due primarily to the cessation, in October 2006, of payment processing for the U.S. gaming business as a result of the Unlawful Internet Gambling Enforcement Act of 2006, in the United States.
Cost of sales and transaction processing increased by $3.5 million, from $58.0 million during the year ended December 31, 2006 to $61.5 million during the year ended December 31, 2007. The increase in transaction processing costs and cost of sales was due to our acquisition of WowWee in November 2007.
Amortization of intangibles pertaining to transaction processing costs and cost of sales increased by $2.4 million, from $10.3 million during the year ended December 31, 2006 to $12.7 million during the year ended December 31, 2007. The increase in amortization is due primarily to the intangible assets acquired in connection with our acquisition of WowWee in November 2007.
Selling, general and administrative expenses decreased by $2.5 million, from $22.8 million during the year ended December 31, 2006 to $20.3 million during the year ended December 31, 2007. The decrease in selling, general and administrative expenses is due primarily to the reduction of our payments processing business segment. Approximately $3.0 million of these expenses are attributed to WowWee.
The stock-based compensation pertaining to selling, general and administrative expense is attributable to the accounting for the fair value of stock options and restricted share units granted. Stock-based compensation expense of $0.3 million was incurred for the year ended December 31, 2007.
37
Research and development expenses of $0.7 million were incurred during the year ended December 31, 2007. Research and development expenses are comprised primarily of personnel-related expenditures associated with the development of products in the WowWee business segment.
Operating lease expenses remained constant at approximately $0.5 million during the years ended December 31, 2007 and 2006.
Amortization of equipment pertaining to cost of sales of $0.6 million were incurred during the year ended December 31, 2007, principally due to the addition of capital assets as a result of the WowWee acquisition.
Amortization of equipment pertaining to selling, general and administrative remained constant at approximately $0.2 million during the years ended December 31, 2007 and 2006, principally due to the addition of capital assets as a result of the WowWee acquisition.
The recovery for income taxes was $0.6 million for the year ended December 31, 2007 compared to nil for the year ended December 31, 2006. Significant components of our 2007 provision are the change in the valuation allowance of $3.1 million, which reflects an increase in the benefit of losses not recorded. Significant components of our 2006 tax provision included permanent differences and other differences of $0.5 million.
Our tax provision includes the effect of future taxes on unrealized foreign exchange gains and losses, which arise upon the conversion into Canadian dollars of net monetary assets and liabilities denominated in U.S. dollars for purposes of determining taxable income under Canadian income tax regulations. Since the U.S. dollar is our measurement currency and our consolidated financial statements are presented in U.S. dollars, these foreign exchange gains/losses do not impact earnings before income taxes. In 2007, our tax provision includes a future tax recovery of $2.2 million related to unrealized foreign exchange compared to a recovery of $0.1 million in 2006.
With respect to future income tax assets, as at December 31, 2007 we have recorded a valuation allowance of approximately $28.5 million (2006 - $23.9 million) related to assets that we determined were not more likely than not to be realized. Our ability to ultimately realize these future income tax assets is dependent upon our future profitability within the allowable carry-forward period, thus creating sufficient taxable income to realize the benefit of these assets.
Our net loss in 2007 was $36.5 million (or $(1.51) per share - basic and diluted), compared to net earnings of $12.8 million ($0.54 per share – basic and $0.50 per share – diluted) in 2006.
EBITDA was $1.8 million (or $0.08 per diluted share) for 2007 compared to EBITDA of $0.4 million (or $0.02 per diluted share) for 2006.
A reconciliation of this non-GAAP financial information is presented in the table below. We use non-GAAP measures to assess our operating performance. Securities regulations require that companies caution readers that earning and other measures adjusted to a basis other than GAAP do not have standardized meanings and are unlikely to be comparable to similar measures used by other companies. Accordingly, they should not be considered in isolation. We use EBITDA to measure our performance from one period to the next without the variation caused by certain adjustments that could potentially distort the analysis of trends in our operating performance, and because we believe it provides meaningful information on our financial condition and operating results.
EBITDA, as we use it, is calculated as earnings before investment income, taxes and depreciation and amortization and excludes the impacts of impairment loss, stock-based compensation and discontinued operations. We believe it is useful to exclude these items as they are either non-cash expenses, items that cannot be influenced by management in the short term, or items that do not impact core operating performance. Excluding these items does not imply they are necessarily non-recurring.
38
|
|
|
|
|
|
|
|
Reconciliation of Non-GAAP Financial Information |
| ||||||
|
|
|
| ||||
|
| Twelve months ended |
| ||||
|
| 2007 |
| 2006 |
| ||
|
| Unaudited |
| Unaudited |
| ||
| |||||||
Net (loss) earnings |
| $ | (36,511 | ) | $ | 12,779 |
|
|
|
|
|
|
|
|
|
Add (deduct): |
|
|
|
|
|
|
|
Amortization of intangibles pertaining to cost of sales and transaction processing |
|
| 12,690 |
|
| 10,280 |
|
Amortization of equipment pertaining to cost of sales |
|
| 581 |
|
| — |
|
Amortization of equipment pertaining to selling, general and administrative |
|
| 235 |
|
| 161 |
|
Stock-based compensation pertaining to selling, general and administrative |
|
| 276 |
|
| — |
|
Investment income |
|
| (5,831 | ) |
| (8,388 | ) |
Income tax provision |
|
| (618 | ) |
| — |
|
Loss (gain) from discontinued operations |
|
| 31,026 |
|
| (14,422 | ) |
|
|
|
|
|
|
|
|
EBITDA |
| $ | 1,848 |
|
| 410 |
|
|
|
|
|
|
|
|
|
Diluted shares |
|
| 24,179 |
|
| 25,439 |
|
|
|
|
|
|
|
|
|
EBITDA per diluted share |
| $ | 0.08 |
| $ | 0.02 |
|
Liquidity and Capital Resources
As at December 31, 2008, cash and cash equivalents and short-term investments totaled $39.1 million, compared to $59.7 million as at December 31, 2007. The decrease in cash and cash equivalents and short-term investments is primarily due to business acquisition ($6.6 million), cash used in operations ($23.2 million) and the purchase of property and equipment and intangibles ($4.8 million), off-set by proceeds received from the sale of card-not-present and Canadian card-present assets ($8.5 million) in the payment processing business segment. We have various credit facilities through our subsidiaries located in Belgium and Hong Kong, of which $11.5 million were used at December 31, 2008. Of this amount, $5.7 million was assumed at the date of the Sablon Distribution acquisition. See note 11 of the notes to our consolidated financial statements. We intend to finance our 2009 operations from available cash resources and existing credit lines. We expect to use less cash from operations in 2009 compared to 2008 by managing costs in line with reduced revenue expectations and reducing our investments in working capital. As at December 31, 2008, our cash and cash equivalents and short-term investments, net of bank indebtedness, totaled $27.6 million.
Operating activities used $23.2 million of cash and cash equivalents in 2008, as compared to using $37.3 million in 2007. This decrease in use is due mainly to a decrease in use of cash from discontinued operating assets and liabilities. Cash used in operating activities from continuing operations was $24.6 million in 2008 compared to cash generated of $4.3 million in 2007. The decrease in 2008 is primarily due to the increased loss from operations, as well as additional investments in working capital (accounts receivable and inventories) in 2008 compared to 2007.
Financing activities generated $5.5 million of cash in 2008, compared to using $8.6 million in 2007. In 2008, we utilized additional financing from available credit facilities in Belgium and Hong Kong of $6.2 million. In 2007, we repaid the bank indebtedness of $8.6 million.
39
Investing activities from continuing operations generated $4.6 million of cash in 2008, compared with $7.5 million in 2007. The decrease of approximately $2.9 million can be explained primarily by the following:
Increases:
|
|
|
| • | In 2008, proceeds from dispositions of property and equipment and businesses increased by $10.3 million; |
|
|
|
| • | In 2008, $39.5 million less cash was used for acquisitions; and |
|
|
|
| • | In 2008, transaction costs related to business acquisitions and disposals decreased by $0.6 million. |
|
|
|
| Decreases: | |
|
|
|
| • | In 2008, $53.0 million less cash was generated on the maturity of short-term investments; and |
|
|
|
| • | In 2008, purchases of property, equipment and intangibles increased by $0.3 million. |
Current Economic Environment
The downturn in the global economy had a significant effect on the toy industry and our company. Consumer confidence reached an all-time low in December of 2008, driving retail sales weakness in the fourth quarter as consumers, fearful of the economy’s direction, cut back their discretionary spending. Toy retailers and manufacturers were impacted by the economic downturn, with estimates a significant number of Chinese toy manufacturers closing their operations and significant toy sellers in the U.S., U.K., Mexico, and other major markets closing their operations or entering bankruptcy. As a result of lower than expected sales, margins and cash flows in the consumer robotic, toy and entertainment segment, we recorded goodwill impairment losses of $41.4 million in 2008.
We expect the unfavourable economic conditions experienced in 2008 to continue into 2009. We also expect revenues to be under pressure in 2009 as a result of a continued pull-back in consumers’ willingness to spend and retailers’ desire to reduce inventories, weakening foreign exchange in international markets, and the sale of fewer entertainment-related products in 2009. As a result, we are managing our business based on reduced revenue assumptions and taking actions intended to improve margins and strengthen our balance sheet.
Risk management strategies are likely to evolve in response to future conditions and circumstances, including the effects and consequences resulting from the current economic downturn. These future strategies may not fully insulate us in the near term from adverse effects, the more significant of which relate to liquidity and capital resources as well as exposure to credit losses.
We expect to focus on margins and conserve cash in 2009. As a result, we are planning to tightly manage our inventories, capital expenditures and other spending activity in 2009. We expect that some of our customers and vendors may experience difficulty in obtaining the liquidity required to buy inventory or raw materials.
Our focus for 2009 is on strengthening our balance sheet and managing costs in line with anticipated reduced revenues with the goal of improving the profitability and cash flows generated by our business.
We believe that our cash, cash equivalents and short-term investments will be adequate to meet our needs for at least the next 12 months.
We have no financial obligations of significance, including any off-balance sheet arrangements, other than long-term lease commitments for our premises in the United States, Canada and Hong Kong. These are summarized in note 16 (a) of the notes to our consolidated financial statements.
The timing of our contractual commitments during the next five years and thereafter, related to our operating leases, is as follows (in thousands of U.S. dollars):
40
|
|
|
|
|
|
|
|
|
|
|
|
|
|
|
|
|
|
|
|
|
Contractual |
| Total |
| 2009 |
| 2010 to |
| 2012 to |
| Thereafter |
| |||||||||
|
|
|
|
|
| |||||||||||||||
Operating Leases |
| $ | 3,923 |
| $ | 1,551 |
|
| $ | 1,605 |
|
|
| $ | 767 |
|
|
| $ — |
|
Long-Term Debt |
| $ | 3,015 |
| $ | 1,010 |
|
| $ | 1,744 |
|
|
| $ | 261 |
|
|
| $ — |
|
We have granted two letters of guarantee, issued by highly rated financial institutions to indemnify third parties in the event that we do not perform their contractual obligations. As at December 31, 2008, the maximum potential liability under these letters of guarantee was $1.3 million. We have not included long-term liabilities related to discontinued operations of $10.8 million in the above table because these will only be settled upon resolution of the investigation by the U.S. Attorney’s Office (see note 16 (e) of the notes to our consolidated financial statements).
|
|
QUANTITATIVE AND QUALITATIVE DISCLOSURES ABOUT MARKET RISK |
The table below provides information about our financial instruments that are sensitive to changes in interest rates and foreign currency exchange rates.
Interest rate and foreign currency exchange rate sensitivity table
|
|
|
|
|
|
|
|
|
| December 31, 2008 |
| ||||
|
|
| |||||
|
| Carrying |
| Fair |
| ||
|
|
| |||||
|
| (thousands of U.S. dollars) |
| ||||
| |||||||
Notes denominated in U.S. dollars, with a weighted average effective yield of 1.7%, maturing on March 9, 2009. |
| $ | 6,296 |
| $ | 6,296 |
|
|
|
| |||||
|
|
|
|
|
|
|
|
TOTAL: |
| $ | 6,296 |
| $ | 6,296 |
|
|
|
| |||||
(1) Fair value has been determined based upon quoted market values as at December 31, 2008.
Interest rate risk is the risk that the fair value or future cash flows of a financial instrument will fluctuate because of changes in market interest rates.
Short-term investments consist of short-term notes invested at fixed interest rates. The risk that we will realize a loss as a result of a decline in the fair value of these investments is limited because although available for sale, these investments are short-term and are generally held to maturity.
We are exposed primarily to interest rate fluctuations as a result of cash and bank indebtedness which bears interest at variable interest rates. A 0.5% increase in the interest rate would have decreased the net loss and comprehensive loss by $0.2 million in the twelve-month period ended December 31, 2008. An equal but opposite effect would result assuming a 0.5% decrease in interest rates.
A significant portion of our cash flows and financial assets and liabilities are denominated in U.S. dollars, which is our functional and reporting currency. Foreign currency risk is limited to the portion of our business transactions denominated in currencies other than U.S. dollars, primarily for head office expenses in Canada and European operations. Our foreign currency transactions fluctuate in the respective exchange rates relative to the U.S. dollar which will create volatility in our cash flows and the reported amounts for revenues and selling, general and administrative expenses in its consolidated statement of operations on a period-to-period basis. Additional earnings variability arises from the translation of monetary assets and liabilities denominated in currencies other than the U.S. dollar at the rates of exchange at each balance sheet date, the impact of which is reported as a foreign exchange gain and loss which is included as part of selling, general and administrative expenses in the statement of operations and comprehensive loss.
Our objective in managing our foreign currency risk is to minimize our net exposures to foreign currency cash flows, by transacting with third parties in U.S. dollars to the maximum extent possible and practical and holding cash and cash equivalents in U.S. dollars. We monitor and forecast the values of net foreign currency cash
41
flow and balance sheet exposures and with the aid of external consultants manage our cash flow to hold on hand sufficient levels of foreign currencies to meet our obligations. From time to time, we engage in the use of derivative financial instruments to manage our currency exposure.
Note 22 (b) of the notes to our consolidated financial statements presents an indication of our significant foreign currency exposures. Based on these exposures, a 5% weakening of the U.S. dollar relative to the Canadian dollar and Euro would have increased the net loss and comprehensive loss in 2008 by $0.8 million. As assumed 5% strengthening of the U.S. dollar would have an equal but opposite effect on our net loss.
42
|
|
FINANCIAL STATEMENTS AND SUPPLEMENTARY DATA |
|
|
| Consolidated Financial Statements of |
|
|
| OPTIMAL GROUP INC. |
|
|
| Three years ended December 31, 2008 |
43

|
|
|
KPMG LLP | Telephone | (514) 840-2100 |
Chartered Accountants | Fax | (514) 840-2187 |
600 de Maisonneuve Blvd. West | Internet | www.kpmg.ca |
Suite 1500 |
|
|
Tour KPMG |
|
|
Montréal, Quebec H3A 03A |
|
|
REPORT OF INDEPENDENT REGISTERED PUBLIC ACCOUNTING FIRM
To the Board of Directors of Optimal Group Inc.:
We have audited the accompanying consolidated balance sheets of Optimal Group Inc. and subsidiaries (the “Company”) as of December 31, 2008 and 2007 and the related consolidated statements of operations and comprehensive (loss) income, shareholders’ equity and cash flows for each of the years in the three-year period ended December 31, 2008. These financial statements are the responsibility of the Company’s management. Our responsibility is to express an opinion on these financial statements based on our audits.
We conducted our audits in accordance with the standards of the Public Company Accounting Oversight Board (United States). Those standards require that we plan and perform the audit to obtain reasonable assurance about whether the financial statements are free of material misstatement. An audit includes examining, on a test basis, evidence supporting the amounts and disclosures in the financial statements. An audit also includes assessing the accounting principles used and significant estimates made by management, as well as evaluating the overall financial statement presentation. We believe that our audits provide a reasonable basis for our opinion.
In our opinion, the consolidated financial statements referred to above present fairly, in all material respects, the financial position of Optimal Group Inc. and subsidiaries as of December 31, 2008 and 2007, and the results of their operations and their cash flows for each of the years in the three-year period ended December 31, 2008, in conformity with Canadian generally accepted accounting principles.
Canadian generally accepted accounting principles vary in certain significant respects from U.S. generally accepted accounting principles. Information relating to the nature and effect of such differences is presented in note 25 to the consolidated financial statements.
We have also audited, in accordance with the standards of the Public Company Accounting Oversight Board (United States), the Company’s internal control over financial reporting as of December 31, 2008, based on criteria established in Internal Control - Integrated Framework Issued by the Committee of Sponsoring Organizations of the Treadway Commission (COSO), and our report dated March 13, 2009 expressed an unqualified opinion on the effectiveness of internal control over financial reporting.
(signed) KPMG LLP*
Chartered Accountants
Montréal, Canada
March 13, 2009
|
|
*CA Auditor permit no 14114 | |
|
|
| KPMG LLP is a Canadian limited liability partnership and a member firm of the KPMG network of independent member firms affiliated with KPMG International, a Swiss cooperative. KPMG Canada provides services to KPMG LLP. |
44
|
|
|
KPMG LLP | Telephone | (514) 840-2100 |
Chartered Accountants | Fax | (514) 840-2187 |
600 de Maisonneuve Blvd. West | Internet | www.kpmg.ca |
Suite 1500 |
|
|
Tour KPMG |
|
|
Montréal, Quebec H3A 03A |
|
|
REPORT OF INDEPENDENT REGISTERED PUBLIC ACCOUNTING FIRM
To the Board of Directors of Optimal Group Inc.:
We have audited Optimal Group Inc.’s (the “Company”) internal control over financial reporting as of December 31, 2008, based on criteria established in Internal Control - Integrated Framework Issued by the Committee of Sponsoring Organizations of the Treadway Commission (COSO). The Company’s management is responsible for maintaining effective internal control over financial reporting and for its assessment of the effectiveness of internal control over financial reporting, included in the accompanying Management’s Report on Internal Control over Financial Reporting appearing under Item 9A of the Company’s Form 10-K for the year ended December 31, 2008. Our responsibility is to express an opinion on the Company’s internal control over financial reporting based on our audit based on the assessed risk.
We conducted our audit in accordance with the standards of the Public Company Accounting Oversight Board (United States). Those standards require that we plan and perform the audit to obtain reasonable assurance about whether effective internal control over the financial reporting was maintained in all material respects. Our audit included obtaining an understanding of internal control over financial reporting, assessing the risk that a material weakness exists, and testing and evaluating the design and operating effectiveness of internal control. Our audit also included performing such other procedures as we considered necessary in the circumstances. We believe that our audit provides a reasonable basis for our opinion.
A company’s internal control over financial reporting is a process designed to provide reasonable assurance regarding the reliability of financial reporting and the preparation of financial statements for external purposes in accordance with generally accepted accounting principles. A company’s internal control over financial reporting includes those policies and procedures that (1) pertain to the maintenance of records that, in reasonable detail, accurately and fairly reflect the transactions and dispositions of the assets of the company; (2) provide reasonable assurance that transactions are recorded as necessary to permit preparation of financial statements in accordance with generally accepted accounting principles, and that receipts and expenditures of the company are being made only in accordance with authorizations of management and directors of the company; and (3) provide reasonable assurance regarding prevention or timely detection of unauthorized acquisition, use, or disposition of the company’s assets that could have a material effect on the financial statements.
Because of its inherent limitations, internal control over financial reporting may not prevent or detect misstatements. Also, projections of any evaluation of effectiveness to future periods are subject to the risk that controls may become inadequate because of changes in conditions, or that the degree of compliance with the policies or procedures may deteriorate.
|
|
*CA Auditor permit no 14114 |
|
|
|
| KPMG LLP is a Canadian limited liability partnership and a member firm of the KPMG network of independent member firms affiliated with KPMG International, a Swiss cooperative. KPMG Canada provides services to KPMG LLP. |
The Company acquired substantially all of the assets and liabilities of two companies in the third quarter of 2008 and management excluded from its assessment of the effectiveness of the Company’s internal control over financial reporting as of December 31, 2008 internal control over financial reporting associated with total assets of $20,957,000 (of which $1,582,000 represents intangibles included within the scope of the assessment) and total revenues of $12,882,000 included in the consolidated financial statements of the Company as at and for the year ended December 31, 2008. Our audit of internal control over financial reporting of the Company also excluded an evaluation of the internal control over financial reporting of these two acquisitions.
In our opinion, the Company maintained, in all material respects, effective internal control over financial reporting as of December 31, 2008, based on criteria established in Internal Control - Integrated Framework Issued by the Committee of Sponsoring Organizations of the Treadway Commission (COSO).
We also have audited, in accordance with the standards of the Public Company Accounting Oversight Board (United States), the consolidated balance sheets of Optimal Group Inc. and subsidiaries as of December 31, 2008 and 2007, and the related consolidated statements of operations and comprehensive (loss) income, shareholders’ equity and cash flows for each of the years in the three-year period ended December 31, 2008, and our report dated March 13, 2009 expressed an unqualified opinion on those consolidated financial statements.
(signed) KPMG LLP*
Chartered Accountants
Montréal, Canada
March 13, 2009
OPTIMAL GROUP INC.
Consolidated Financial Statements
Three years ended December 31, 2008
(expressed in U.S. dollars)
|
|
Financial Statements |
|
| |
48 | |
| |
Consolidated Statements of Operations and Comprehensive (Loss) Income | 49 |
| |
50 | |
| |
51 | |
| |
52 |
OPTIMAL GROUP INC.
Consolidated Balance Sheets
December 31, 2008 and 2007
(expressed in thousands of U.S. dollars)
|
|
|
|
|
|
|
|
|
|
|
| 2008 |
| 2007 |
| ||
|
|
|
|
|
|
|
|
|
Assets |
|
|
|
|
|
|
| |
|
|
|
|
|
|
|
|
|
Current assets: |
|
|
|
|
|
|
| |
| Cash and cash equivalents |
| $ | 32,849 |
| $ | 47,193 |
|
| Short-term investments (note 6) |
|
| 6,296 |
|
| 12,477 |
|
| Accounts and other receivables (note 7) |
|
| 25,050 |
|
| 17,175 |
|
| Inventories (note 8) |
|
| 19,439 |
|
| 3,088 |
|
| Income taxes receivable |
|
| 302 |
|
| 2,970 |
|
| Prepaid expenses and other assets |
|
| 2,040 |
|
| 2,531 |
|
| Future income taxes (note 18) |
|
| — |
|
| 714 |
|
| Current assets related to discontinued operations |
|
| 2,877 |
|
| 15,273 |
|
| ||||||||
|
|
|
| 88,853 |
|
| 101,421 |
|
|
|
|
|
|
|
|
|
|
Property and equipment (note 9) |
|
| 4,299 |
|
| 3,789 |
| |
Intangible assets (note 10) |
|
| 56,683 |
|
| 85,064 |
| |
Goodwill (note 10) |
|
| — |
|
| 47,931 |
| |
Future income taxes (note 18) |
|
| — |
|
| 6,200 |
| |
Long-term assets related to discontinued operations (note 5 (b)) |
|
| 19,183 |
|
| 45,876 |
| |
|
|
|
|
|
|
|
|
|
|
|
| $ | 169,018 |
| $ | 290,281 |
|
|
|
|
|
|
|
|
|
|
Liabilities and Shareholders’ Equity |
|
|
|
|
|
|
| |
|
|
|
|
|
|
|
|
|
Current liabilities: |
|
|
|
|
|
|
| |
| Bank indebtedness (note 11) |
| $ | 11,547 |
| $ | — |
|
| Accounts payable and accrued liabilities (note 12) |
|
| 38,947 |
|
| 33,908 |
|
| Income taxes payable |
|
| 1,370 |
|
| 4,484 |
|
| Future income taxes (note 18) |
|
| 838 |
|
| 1,270 |
|
| Current liabilities related to discontinued operations |
|
| 2,984 |
|
| 26,395 |
|
| ||||||||
|
|
|
| 55,686 |
|
| 66,057 |
|
|
|
|
|
|
|
|
|
|
Future income taxes (note 18) |
|
| 6,965 |
|
| 11,648 |
| |
Long-term debt (note 13) |
|
| 2,005 |
|
| — |
| |
Long-term liabilities related to discontinued operations (note 5 (b)) |
|
| 10,871 |
|
| 10,871 |
| |
|
|
|
|
|
|
|
|
|
Shareholders’ equity: |
|
|
|
|
|
|
| |
| Share capital (note 14) |
|
| 210,032 |
|
| 211,998 |
|
| Warrants |
|
| 2,696 |
|
| 2,696 |
|
| Additional paid-in capital |
|
| 34,316 |
|
| 29,561 |
|
| Deficit |
|
| (152,069 | ) |
| (41,066 | ) |
| Accumulated other comprehensive loss |
|
| (1,484 | ) |
| (1,484 | ) |
| ||||||||
|
|
|
| 93,491 |
|
| 201,705 |
|
|
|
|
|
|
|
|
|
|
Commitments, contingencies and guarantees (note 16) |
|
|
|
|
|
|
| |
Subsequent events (note 27) |
|
|
|
|
|
|
| |
|
|
|
|
|
|
|
|
|
|
|
| $ | 169,018 |
| $ | 290,281 |
|
See accompanying notes to consolidated financial statements.
Approved by the Board of Directors
|
|
|
|
|
/s/ HOLDEN L. OSTRIN | Director |
| /s/ NEIL S. WECHSLER | Director |
|
48
OPTIMAL GROUP INC.
Consolidated Statements of Operations and Comprehensive (Loss) Income
Three-year period ended December 31, 2008
(expressed in thousands of U.S. dollars, except share and per share amounts)
|
|
|
|
|
|
|
|
|
|
|
|
|
|
| 2008 |
| 2007 |
| 2006 |
| |||
|
|
|
|
|
|
|
|
|
|
|
|
Revenues |
| $ | 152,546 |
| $ | 84,908 |
| $ | 81,786 |
| |
|
|
|
|
|
|
|
|
|
|
|
|
Expenses: |
|
|
|
|
|
|
|
|
|
| |
| Cost of sales and transaction processing, excluding amortization |
|
| 109,131 |
|
| 61,520 |
|
| 57,991 |
|
| Amortization of intangibles pertaining to cost of sales and transaction processing |
|
| 18,494 |
|
| 12,690 |
|
| 10,280 |
|
| Amortization of equipment pertaining to cost of sales |
|
| 3,623 |
|
| 581 |
|
| — |
|
| Selling, general and administrative, excluding amortization and stock-based compensation |
|
| 49,792 |
|
| 20,308 |
|
| 22,802 |
|
| Amortization of equipment pertaining to selling, general and administrative |
|
| 709 |
|
| 235 |
|
| 161 |
|
| Stock-based compensation pertaining to selling, general and administrative (note 17) |
|
| 3,339 |
|
| 276 |
|
| — |
|
| Research and development |
|
| 2,931 |
|
| 731 |
|
| — |
|
| Operating leases |
|
| 1,358 |
|
| 501 |
|
| 583 |
|
| Impairment losses (note 10) |
|
| 66,910 |
|
| — |
|
| — |
|
| |||||||||||
|
|
|
| 256,287 |
|
| 96,842 |
|
| 91,817 |
|
|
|
|
|
|
|
|
|
|
|
|
|
Loss from continuing operations before undernoted items |
|
| (103,741 | ) |
| (11,934 | ) |
| (10,031 | ) | |
|
|
|
|
|
|
|
|
|
|
|
|
Investment income |
|
| 1,238 |
|
| 5,831 |
|
| 8,388 |
| |
|
|
|
|
|
|
|
|
|
|
|
|
Loss from continuing operations before income taxes |
|
| (102,503 | ) |
| (6,103 | ) |
| (1,643 | ) | |
|
|
|
|
|
|
|
|
|
|
|
|
Income tax recovery (note 18) |
|
| 3,500 |
|
| 618 |
|
| — |
| |
|
|
|
|
|
|
|
|
|
|
|
|
Net loss from continuing operations |
|
| (99,003 | ) |
| (5,485 | ) |
| (1,643 | ) | |
|
|
|
|
|
|
|
|
|
|
|
|
Net (loss) earnings from discontinued operations, net of income taxes (note 5 (b)) |
|
| (12,000 | ) |
| (31,026 | ) |
| 14,422 |
| |
|
|
|
|
|
|
|
|
|
|
|
|
Net (loss) earnings and comprehensive (loss) income |
| $ | (111,003 | ) | $ | (36,511 | ) | $ | 12,779 |
| |
|
|
|
|
|
|
|
|
|
|
|
|
Weighted average number of shares: |
|
|
|
|
|
|
|
|
|
| |
| Basic |
|
| 25,860,128 |
|
| 24,179,134 |
|
| 23,628,604 |
|
| Plus impact of stock options and warrants |
|
| — |
|
| — |
|
| 1,810,527 |
|
|
|
|
|
|
|
|
|
|
|
|
|
| Diluted |
|
| 25,860,128 |
|
| 24,179,134 |
|
| 25,439,131 |
|
|
|
|
|
|
|
|
|
|
|
|
|
(Loss) earnings per share: |
|
|
|
|
|
|
|
|
|
| |
| Continuing operations: |
|
|
|
|
|
|
|
|
|
|
| Basic |
| $ | (3.83 | ) | $ | (0.23 | ) | $ | (0.07 | ) |
| Diluted |
|
| (3.83 | ) |
| (0.23 | ) |
| (0.07 | ) |
| Discontinued operations: |
|
|
|
|
|
|
|
|
|
|
| Basic |
|
| (0.46 | ) |
| (1.28 | ) |
| 0.61 |
|
| Diluted |
|
| (0.46 | ) |
| (1.28 | ) |
| 0.57 |
|
| Net: |
|
|
|
|
|
|
|
|
|
|
| Basic |
|
| (4.29 | ) |
| (1.51 | ) |
| 0.54 |
|
| Diluted |
|
| (4.29 | ) |
| (1.51 | ) |
| 0.50 |
|
|
|
|
|
|
|
|
|
|
|
|
|
See accompanying notes to consolidated financial statements.
49
OPTIMAL GROUP INC.
Consolidated Statements of Shareholders’ Equity
Three-year period ended December 31, 2008
(expressed in thousands of U.S. dollars, except share amounts)
|
|
|
|
|
|
|
|
|
|
|
|
|
|
|
|
|
|
|
|
|
|
|
|
|
| Warrants |
| Addi- |
| Deficit |
| Accu- |
| Total |
| ||||||||
|
|
|
|
|
|
|
|
| |||||||||||||
|
|
|
|
|
|
|
|
| |||||||||||||
|
| Class “A” shares |
|
|
|
|
|
| |||||||||||||
|
|
|
|
|
|
|
| ||||||||||||||
|
| Number |
| Dollars |
|
|
|
|
|
| |||||||||||
| |||||||||||||||||||||
Balance, December 31, 2005 |
| 23,277,126 |
| $ | 195,149 |
| $ | — |
| $ | 25,884 |
| $ | (16,259 | ) | $ | (1,484 | ) | $ | 203,290 |
|
|
|
|
|
|
|
|
|
|
|
|
|
|
|
|
|
|
|
|
|
|
|
Exercise of stock options and warrants: |
|
|
|
|
|
|
|
|
|
|
|
|
|
|
|
|
|
|
|
|
|
Cash proceeds |
| 713,073 |
|
| 5,172 |
|
| — |
|
| — |
|
| — |
|
| — |
|
| 5,172 |
|
Ascribed value |
| — |
|
| 3,120 |
|
| — |
|
| (3,120 | ) |
| — |
|
| — |
|
| — |
|
Ascribed value credited to non-controlling interest from exercise of restricted share units |
| — |
|
| — |
|
| — |
|
| (2,296 | ) |
| — |
|
| — |
|
| (2,296 | ) |
|
|
|
|
|
|
|
|
|
|
|
|
|
|
|
|
|
|
|
|
|
|
Cancellation of shares pursuant to stock buyback program (note 14) |
| (141,109 | ) |
| (1,189 | ) |
| — |
|
| — |
|
| (1,075 | ) |
| — |
|
| (2,264 | ) |
|
|
|
|
|
|
|
|
|
|
|
|
|
|
|
|
|
|
|
|
|
|
Stock-based compensation (note 17) |
| — |
|
| — |
|
| — |
|
| 1,707 |
|
| — |
|
| — |
|
| 1,707 |
|
|
|
|
|
|
|
|
|
|
|
|
|
|
|
|
|
|
|
|
|
|
|
Stock dividend of restricted share units issued by OPIL to non-controlling interest |
| — |
|
| — |
|
| — |
|
| 994 |
|
| — |
|
| — |
|
| 994 |
|
|
|
|
|
|
|
|
|
|
|
|
|
|
|
|
|
|
|
|
|
|
|
Net earnings |
| — |
|
| — |
|
| — |
|
| — |
|
| 12,779 |
|
| — |
|
| 12,779 |
|
|
|
|
|
|
|
|
|
|
|
|
|
|
|
|
|
|
|
|
|
|
|
Balance, December 31, 2006 |
| 23,849,090 |
|
| 202,252 |
|
| — |
|
| 23,169 |
|
| (4,555 | ) |
| (1,484 | ) |
| 219,382 |
|
|
|
|
|
|
|
|
|
|
|
|
|
|
|
|
|
|
|
|
|
|
|
Shares issued on acquisition of WowWee (note 5 (a)) |
| 2,169,197 |
|
| 10,000 |
|
| — |
|
| — |
|
| — |
|
| — |
|
| 10,000 |
|
|
|
|
|
|
|
|
|
|
|
|
|
|
|
|
|
|
|
|
|
|
|
Warrants issued on acquisition of WowWee (note 5 (a)) |
| — |
|
| — |
|
| 2,696 |
|
| — |
|
| — |
|
| — |
|
| 2,696 |
|
|
|
|
|
|
|
|
|
|
|
|
|
|
|
|
|
|
|
|
|
|
|
Exercise of stock options: |
|
|
|
|
|
|
|
|
|
|
|
|
|
|
|
|
|
|
|
|
|
Cash proceeds |
| 18,261 |
|
| 87 |
|
| — |
|
| — |
|
| — |
|
| — |
|
| 87 |
|
Ascribed value |
| — |
|
| 95 |
|
| — |
|
| (95 | ) |
| — |
|
| — |
|
| — |
|
|
|
|
|
|
|
|
|
|
|
|
|
|
|
|
|
|
|
|
|
|
|
Cancellation of shares pursuant to stock buyback program (note 14) |
| (53,400 | ) |
| (436 | ) |
| — |
|
| 230 |
|
| — |
|
| — |
|
| (206 | ) |
|
|
|
|
|
|
|
|
|
|
|
|
|
|
|
|
|
|
|
|
|
|
Stock-based compensation (note 17) |
| — |
|
| — |
|
| — |
|
| 6,257 |
|
| — |
|
| — |
|
| 6,257 |
|
|
|
|
|
|
|
|
|
|
|
|
|
|
|
|
|
|
|
|
|
|
|
Net loss |
| — |
|
| — |
|
| — |
|
| — |
|
| (36,511 | ) |
| — |
|
| (36,511 | ) |
|
|
|
|
|
|
|
|
|
|
|
|
|
|
|
|
|
|
|
|
|
|
Balance, December 31, 2007 |
| 25,983,148 |
|
| 211,998 |
|
| 2,696 |
|
| 29,561 |
|
| (41,066 | ) |
| (1,484 | ) |
| 201,705 |
|
|
|
|
|
|
|
|
|
|
|
|
|
|
|
|
|
|
|
|
|
|
|
Cancellation of shares pursuant to stock buyback program (note 14) |
| (240,925 | ) |
| (1,966 | ) |
| — |
|
| 1,416 |
|
| — |
|
| — |
|
| (550 | ) |
|
|
|
|
|
|
|
|
|
|
|
|
|
|
|
|
|
|
|
|
|
|
Stock-based compensation (note 17) |
| — |
|
| — |
|
| — |
|
| 3,339 |
|
| — |
|
| — |
|
| 3,339 |
|
|
|
|
|
|
|
|
|
|
|
|
|
|
|
|
|
|
|
|
|
|
|
Net loss |
| — |
|
| — |
|
| — |
|
| — |
|
| (111,003 | ) |
| — |
|
| (111,003 | ) |
|
|
|
|
|
|
|
|
|
|
|
|
|
|
|
|
|
|
|
|
|
|
Balance, December 31, 2008 |
| 25,742,223 |
| $ | 210,032 |
| $ | 2,696 |
| $ | 34,316 |
| $ | (152,069 | ) | $ | (1,484 | ) | $ | 93,491 |
|
See accompanying notes to consolidated financial statements.
50
OPTIMAL GROUP INC.
Consolidated Statements of Cash Flows
Three-year period ended December 31, 2008
(expressed in thousands of U.S. dollars)
|
|
|
|
|
|
|
|
|
|
|
|
|
|
| 2008 |
| 2007 |
| 2006 |
| |||
|
|
|
|
|
|
|
|
|
|
|
|
Cash flows (used in) from operating activities: |
|
|
|
|
|
|
|
|
|
| |
| Net (loss) earnings |
| $ | (111,003 | ) | $ | (36,511 | ) | $ | 12,779 |
|
| Add (deduct): loss (earnings) from discontinued operations |
|
| 12,000 |
|
| 31,026 |
|
| (14,422 | ) |
| |||||||||||
| Net loss from continuing operations |
|
| (99,003 | ) |
| (5,485 | ) |
| (1,643 | ) |
|
|
|
|
|
|
|
|
|
|
|
|
| Adjustments for items not affecting cash: |
|
|
|
|
|
|
|
|
|
|
| Amortization |
|
| 22,826 |
|
| 13,506 |
|
| 10,441 |
|
| Future income taxes |
|
| (3,526 | ) |
| (148 | ) |
| — |
|
| Stock-based compensation |
|
| 3,339 |
|
| 276 |
|
| — |
|
| Foreign exchange |
|
| 415 |
|
| (333 | ) |
| (390 | ) |
| Impairment losses |
|
| 66,910 |
|
| — |
|
| — |
|
| Net change in operating assets and liabilities (note 24 (a)) |
|
| (15,521 | ) |
| (3,489 | ) |
| (1,633 | ) |
| |||||||||||
|
|
|
| (24,560 | ) |
| 4,327 |
|
| 6,775 |
|
| Operating cash flows (used in) from discontinued operations |
|
| 1,351 |
|
| (41,616 | ) |
| (6,572 | ) |
| |||||||||||
|
|
|
| (23,209 | ) |
| (37,289 | ) |
| 203 |
|
Cash flows (used in) from financing activities: |
|
|
|
|
|
|
|
|
|
| |
| Increase (decrease) in bank indebtedness |
|
| 6,156 |
|
| (8,581 | ) |
| 159 |
|
| Repayment of long-term debt |
|
| (79 | ) |
| — |
|
| — |
|
| Repurchase of Class “A” shares |
|
| (550 | ) |
| (206 | ) |
| (2,264 | ) |
| Proceeds from issuance of Class “A” shares |
|
| — |
|
| 87 |
|
| 5,172 |
|
| |||||||||||
|
|
|
| 5,527 |
|
| (8,700 | ) |
| 3,067 |
|
| Financing cash flows from (used in) discontinued operations |
|
| — |
|
| 58 |
|
| (4,772 | ) |
| |||||||||||
|
|
|
| 5,527 |
|
| (8,642 | ) |
| (1,705 | ) |
Cash flows (used in) from investing activities: |
|
|
|
|
|
|
|
|
|
| |
| Acquisition of WowWee, net of cash of $483 (note 5 (a)) |
|
| — |
|
| (46,087 | ) |
| — |
|
| Other business acquisitions |
|
| (6,557 | ) |
| — |
|
| — |
|
| Purchase of property, equipment and intangible assets |
|
| (4,780 | ) |
| (4,441 | ) |
| (2,198 | ) |
| Net proceeds from maturity of short-term investments |
|
| 6,181 |
|
| 59,144 |
|
| 10,740 |
|
| Proceeds from sale of property and equipment |
|
| 1,834 |
|
| — |
|
| — |
|
| Proceeds from disposition of payment processing businesses (note 5 (b)) |
|
| 8,500 |
|
| — |
|
| — |
|
| Transaction costs related to business acquisitions and disposals |
|
| (583 | ) |
| (1,155 | ) |
| — |
|
| |||||||||||
|
|
|
| 4,595 |
|
| 7,461 |
|
| 8,542 |
|
| Investing cash flows used in discontinued operations |
|
| (361 | ) |
| (18,609 | ) |
| (1,777 | ) |
| |||||||||||
|
|
|
| 4,234 |
|
| (11,148 | ) |
| 6,765 |
|
|
|
|
|
|
|
|
|
|
|
| |
Effect of exchange rate changes on cash and cash equivalents during the year |
|
| (896 | ) |
| 350 |
|
| 423 |
| |
|
|
|
|
|
|
|
|
|
|
|
|
Net (decrease) increase in cash and cash equivalents |
|
| (14,344 | ) |
| (56,729 | ) |
| 5,686 |
| |
|
|
|
|
|
|
|
|
|
|
|
|
Cash and cash equivalents, beginning of year |
|
| 47,193 |
|
| 103,922 |
|
| 98,236 |
| |
|
|
|
|
|
|
|
|
|
|
|
|
Cash and cash equivalents, end of year |
| $ | 32,849 |
| $ | 47,193 |
| $ | 103,922 |
| |
Supplemental disclosure of cash flow information (note 24).
See accompanying notes to consolidated financial statements.
51
OPTIMAL GROUP INC.
Notes to Consolidated Financial Statements
Three-year period ended December 31, 2008
(expressed in thousands of U.S. dollars, except share and per share amounts)
|
|
|
|
|
|
1. | Nature of operations: | |
|
|
|
| Optimal Group Inc. (the “Company”) is incorporated under the Canada Business Corporations Act. The Company’s principal activities are to design, develop, market and distribute innovative high-tech consumer robotic, toy and entertainment products and to provide payment processing services. | |
|
|
|
2. | Basis of presentation: | |
|
|
|
| The results of the sale of the “card-not-present” payment processing business and the “Canadian card-present” payment processing business sold in 2008 and the hardware maintenance and repair services business segment up to its date of sale in September 2006 are presented separately under discontinued operations in the consolidated statements of operations and comprehensive (loss) income for the current and prior periods. The balance sheet also presents the assets and liabilities related to the discontinued operations separately for current and prior years. | |
|
|
|
3. | Changes in accounting policies: | |
|
|
|
| (a) | New accounting policies: |
|
|
|
|
| Effective January 1, 2008, the Company adopted the Canadian Institute of Chartered Accountants (“CICA”) Handbook Section 1535, Capital Disclosures, CICA Handbook Section 3862, Financial Instruments - Disclosure, and CICA Handbook Section 3863, Financial Instruments - Presentation. The sections relate to disclosure and presentation only and did not have an impact on the Company’s financial results (refer to notes 21, 22 and 23). |
|
|
|
|
| Effective January 1, 2008, the Company also adopted CICA Handbook Section 3031, Inventories, which replaces Section 3030 and harmonizes the Canadian standards related to inventories with International Financial Reporting Standards (“IFRS”). This section provides changes to the measurement and more extensive guidance on the determination of cost, including allocation of overhead; narrows the permitted cost formulas; and expands the disclosure requirements to increase transparency. The adoption of this standard did not have a significant effect on the consolidated financial statements. |
|
|
|
|
| Effective January 1, 2007, the Company adopted CICA Handbook Section 1535, Comprehensive Income, CICA Handbook Section 3251, Equity, CICA Handbook Section 3855, Financial Instruments - Recognition and Measurement, and CICA Handbook Section 3865, Hedges. The adoption of these standards did not have a significant effect on the consolidated financial statements. |
|
|
|
| (b) | Future accounting pronouncements: |
|
|
|
|
| The CICA issued Section 3064, Goodwill and Intangible Assets, which will replace Section 3062, Goodwill and Other Intangible Assets, and Section 3450, Research and Development Costs. The standard provides guidance on the recognition of intangible assets in accordance with the definition of an asset and the criteria for asset recognition, as well as clarifying the application of the concept of matching revenues and expenses, whether these assets are separately acquired or internally developed. This standard applies to interim and annual financial statements relating to fiscal years beginning on or after October 1, 2008, and will be adopted by the Company effective January 1, 2009. The adoption of this standard is not expected to have a significant effect on the Company’s financial results. |
52
OPTIMAL GROUP INC.
Notes to Consolidated Financial Statements, Continued
Three-year period ended December 31, 2008
(expressed in thousands of U.S. dollars, except share and per share amounts)
|
|
|
|
|
|
3. | Changes in accounting policies (continued): | |
|
|
|
| (b) | Future accounting pronouncements (continued): |
|
|
|
|
| In February 2008, Canada’s Accounting Standards Board (“AcSB”) confirmed that Canadian generally accepted accounting principles as used by publicly accountable enterprises will be fully converged with International Financial Reporting Standards (“IFRS”), as issued by the International Accounting Standards Board (“IASB”). The changeover date is for interim and annual financial statements relating to fiscal years beginning on or after January 1, 2011. The Company is currently assessing the future impact of these new standards on the consolidated financial statements. |
|
|
|
|
| In January 2009, the CICA issued CICA Handbook Section 1582, Business Combinations, Section 1601, Consolidations, and Section 1602, Non-controlling Interests. These sections will replace the former CICA Handbook Section 1581, Business Combinations, and Section 1600, Consolidated Financial Statements, and establish a new section for accounting for a non-controlling interest in a subsidiary. CICA Handbook Section 1582 establishes standards for the accounting for a business combination, and states that all assets and liabilities of an acquired business will be recorded at fair value. Obligations for contingent considerations and contingencies will also be recorded at fair value at the acquisition date. The standard also states that acquisition-related costs will be expensed as incurred and that restructuring charges can only be recorded when the definition of a liability is met, which will generally result in these amounts being expensed in the periods after the acquisition date. It provides the Canadian equivalent to IFRS 3, Business Combinations (January 2008). The section applies prospectively to business combinations for which the acquisition date is on or after the beginning of the first annual reporting period beginning on or after January 1, 2011 and early adoption is permitted. |
|
|
|
|
| CICA Handbook Section 1601 establishes standards for the preparation of consolidated financial statements. |
|
|
|
|
| CICA Handbook Section 1602 establishes standards for accounting for a non-controlling interest in a subsidiary in the preparation of consolidated financial statements subsequent to a business combination. It is equivalent to the corresponding provisions of IFRS International Accounting Standards (“IAS”) 27, Consolidated and Separate Financial Statements (January 2008). |
|
|
|
|
| CICA Handbook Section 1601 and Section 1602 apply to interim and annual consolidated financial statements relating to fiscal years beginning on or after January 1, 2011. Earlier adoption of these sections is permitted as of the beginning of a fiscal year. All three sections must be adopted concurrently. The Company is currently evaluating the effect of the adoption of these sections. |
|
|
|
|
| In January 2009, the CICA issued EIC-173, Credit Risk and the Fair Value of Financial Assets and Financial Liabilities, which clarifies that the credit risk of counterparties should be taken into account in determining the fair value of derivative financial instruments. The EIC-173 will be adopted on January 1, 2009. The adoption of this standard is not expected to have a significant effect in the Company’s financial results. |
53
OPTIMAL GROUP INC.
Notes to Consolidated Financial Statements, Continued
Three-year period ended December 31, 2008
(expressed in thousands of U.S. dollars, except share and per share amounts)
|
|
|
|
|
|
4. | Significant accounting policies: | |
|
|
|
| These consolidated financial statements have been prepared in accordance with Canadian GAAP. These principles conform, in all material respects, with U.S. GAAP, except as described in note 25. The significant accounting policies of the Company are summarized as follows: | |
|
|
|
| (a) | Principles of consolidation: |
|
|
|
| (b) | Cash and cash equivalents: |
|
|
|
| (c) | Short-term investments: |
|
|
|
| (d) | Financial assets and liabilities: |
|
|
|
|
| All financial instruments are classified into one of the following five categories: held-for-trading, held-to-maturity investments, loans and receivables, available-for-sale financial assets or other financial liabilities. All financial instruments, including derivatives, are included in the consolidated balance sheet and are measured at fair market value, with the exception of loans and receivables, investments held-to-maturity and other financial liabilities, which are measured at amortized cost. Subsequent measurement and recognition of changes in fair value of financial instruments depend on their initial classification. Held-for-trading financial investments are measured at fair value and all gains and losses are included in net income in the period in which they arise. Available-for-sale financial instruments are measured at fair value with revaluation gains and losses included in other comprehensive income until the assets are removed from the balance sheet or if there is an impairment in fair value of these assets that is other than temporary. |
|
|
|
|
| Derivative instruments are recorded as either assets or liabilities measured at their fair value unless exempted from derivative treatment as a normal purchase and sale. Certain derivatives embedded in other contracts must also be measured at fair value. All changes in the fair value of derivatives are recognized in earnings unless specific hedge criteria are met, which requires that a company must formally document, designate and assess the effectiveness of transactions that receive hedge accounting. |
|
|
|
|
| The Company has classified its cash equivalents and short-term investments as available-for-sale financial assets and are measured at fair market value. The Company has also classified accounts receivable as loans and receivables, and bank indebtedness, accounts payable and accrued liabilities, and long-term debt as other financial liabilities, and they are measured at amortized cost. |
|
|
|
| (e) | Inventories: |
|
|
|
|
| Inventories are measured at the lower of cost (weighted average cost) and net realizable value. |
54
OPTIMAL GROUP INC.
Notes to Consolidated Financial Statements, Continued
Three-year period ended December 31, 2008
(expressed in thousands of U.S. dollars, except share and per share amounts)
|
|
|
|
|
|
4. | Significant accounting policies (continued): | |
|
|
|
| (f) | Research and investment tax credits: |
|
|
|
|
| Research and investment tax credits are recorded as a reduction of the related expense or the cost of the assets acquired. Tax credits are given recognition when reasonable assurance exists that they will be realized. |
|
|
|
| (g) | Property and equipment: |
|
|
|
|
| Property and equipment are recorded at cost. Amortization is provided for over the estimated useful lives of the assets using the straight-line method at the following annual rates: |
|
|
|
|
|
|
|
|
|
|
Computer equipment and software |
|
| 33% - 50% |
|
Equipment |
|
| 10% - 33% |
|
Moulds |
|
| 33% - 50% |
|
Leasehold improvements |
|
| Lower of lease |
|
|
|
|
|
|
|
|
|
| (h) | Goodwill and other intangible assets: |
|
|
|
|
| Goodwill: |
|
|
|
|
| Goodwill is the residual amount that results when the purchase price of an acquired business exceeds the sum of the amounts allocated to the assets acquired, less liabilities assumed, based on their fair values. Goodwill is allocated, as of the date of the business combination, to the Company’s reporting units that are expected to benefit from the synergies of the business combination. |
|
|
|
|
| Goodwill is not amortized but is tested for impairment annually, or more frequently, if events or changes in circumstances indicate that the asset may be impaired. The impairment test is carried out in two steps. In the first step, the carrying amount of the reporting unit is compared with its fair value. When the fair value of a reporting unit exceeds its carrying amount, goodwill of the reporting unit is considered not to be impaired, and the second step of the impairment test is not required. The second step is performed when the carrying amount of a reporting unit exceeds its fair value, in which case, the implied fair value of the reporting unit’s goodwill is compared with its carrying amount to measure the impairment loss, if any. When the carrying amount of the reporting unit’s goodwill exceeds the implied fair value of goodwill, an impairment loss is recognized in an amount equal to the excess and is presented as a separate line item on the consolidated statement of operations. |
55
OPTIMAL GROUP INC.
Notes to Consolidated Financial Statements, Continued
Three-year period ended December 31, 2008
(expressed in thousands of U.S. dollars, except share and per share amounts)
|
|
|
|
| |
4. | Significant accounting policies (continued): | |
|
|
|
| (h) | Goodwill and other intangible assets (continued): |
|
|
|
|
| Other intangible assets: |
|
|
|
|
| Intangible assets acquired either individually or with a group of other assets are initially recognized and measured at cost. The cost of a group of intangible assets, including those acquired in a business combination that meet the specified criteria for recognition apart from goodwill, is allocated to the individual assets based on their fair values. |
|
|
|
|
| Intangible assets with finite useful lives are amortized using the straight-line method over the following periods: |
|
|
|
|
|
|
|
|
|
|
Customer relationships and service agreements |
|
| 24 - 120 months |
|
ISO/ISA relations |
|
| 84 months |
|
Intellectual property |
|
| 36 months |
|
Tradename |
|
| 60 months |
|
Other |
|
| 36 - 84 months |
|
|
|
|
|
|
|
|
|
|
| As at December 31, 2008, estimated amortization expense for each of the next five years is expected to be as follows: |
|
|
|
|
|
|
|
|
|
|
2009 |
| $ | 13,916 |
|
2010 |
|
| 13,527 |
|
2011 |
|
| 11,392 |
|
2012 |
|
| 7,615 |
|
2013 |
|
| 2,117 |
|
|
|
|
|
|
|
|
|
|
| Estimated future amortization expense is based on the amount of other intangible assets recorded as of December 31, 2008. Actual amounts will increase or decrease if additional amortizable intangible assets are acquired or disposed of, or become impaired. |
|
|
|
| (i) | Impairment of long-lived assets: |
|
|
|
|
| Long-lived assets, consisting of property and equipment and intangible assets with finite useful lives, are reviewed whenever events or changes in circumstances indicate that the carrying amount of an asset may not be recoverable. An impairment is recognized for long-lived assets when the carrying amount of an asset to be held and used exceeds the sum of the undiscounted cash flows expected from its use and disposal; the impairment recognized is measured as the amount by which the carrying amount of the asset exceeds its fair value. |
56
OPTIMAL GROUP INC.
Notes to Consolidated Financial Statements, Continued
Three-year period ended December 31, 2008
(expressed in thousands of U.S. dollars, except share and per share amounts)
|
|
|
|
|
|
4. | Significant accounting policies (continued): | |
|
|
|
| (j) | Income taxes: |
|
|
|
|
| The Company provides for income taxes using the asset and liability method of tax allocation. Under this method, future income tax assets and liabilities are determined based on deductible or taxable temporary differences between financial statement values and tax values of assets and liabilities using enacted or substantively enacted income tax rates expected to be in effect for the year in which the differences are expected to reverse. |
|
|
|
|
| The Company establishes a valuation allowance against future income tax assets if, based on available information, it is more-likely-than-not that some or all of the future income tax assets will not be realized. |
|
|
|
| (k) | Revenue recognition: |
|
|
|
|
| Revenue from the sale of consumer robotic, toy and entertainment products is recognized when (i) persuasive evidence of an arrangement exists; (ii) products are shipped to a customer who assumes risk of loss; (iii) collection of the respective receivable is probable; and (iv) the sales price is fixed or determinable. Accruals for customer discounts, rebates, incentives and allowances are recorded as the related revenues are recognized as a reduction of revenues. |
|
|
|
|
| Payment service revenues are generated primarily from fees charged to merchants for payment processing services. Merchants are charged a discount fee or rate, which is based upon the merchant’s monthly charge volume and risk profile, and this fee is calculated as a percentage of the dollar amount of each transaction. Other payment service revenues are derived from a variety of fixed transaction or service fees, including fees for monthly minimum charge volume requirements, statement fees, annual fees and fees for other miscellaneous services. Discount and other fees related to payment transactions are recognized at the time the merchant’s transactions are processed. Revenues derived from service fees are recognized at the time the service is performed. |
|
|
|
|
| Where the Company is the primary party responsible for providing payment processing services, revenue is recorded on a gross basis and amounts paid to the acquiring processing suppliers are recorded as part of transaction processing expenses. Where the Company is not the primary party in providing a merchant with payment processing services, the Company records revenue net of amounts paid to the acquiring processing supplier. |
57
OPTIMAL GROUP INC.
Notes to Consolidated Financial Statements, Continued
Three-year period ended December 31, 2008
(expressed in thousands of U.S. dollars, except share and per share amounts)
|
|
|
|
|
|
4. | Significant accounting policies (continued): | |
|
| |
| (l) | Foreign currency translation: |
|
|
|
|
| The functional currency of the Company is the U.S. dollar and, accordingly, the consolidated financial statements have been prepared in U.S. dollars. Monetary assets and liabilities of the Canadian and foreign operations denominated in currencies other than the U.S. dollar are translated into U.S. dollars at the rates of exchange prevailing at the balance sheet dates. Other assets and liabilities denominated in currencies other than the U.S. dollar are translated into U.S. dollars at the rate of exchange prevailing when the assets were acquired or the liabilities incurred. Revenue and expense transactions denominated in currencies other than the U.S. dollar are translated into U.S. dollars at the average rate of exchange in effect for the period during which the transaction occurred, except for amortization which is translated into U.S. dollars at the rate of exchange in effect when the related transaction occurred. Foreign exchange gains and losses are included in the determination of net earnings (loss). |
|
|
|
| (m) | Stock-based compensation: |
|
|
|
|
| The fair value-based method is used to account for all transactions whereby goods and services are received in exchange for stock-based compensation and other stock-based payments. Under the fair value-based method, compensation cost is measured at fair value at the date of grant and is expensed over the award’s vesting periods, with a credit to additional paid-in capital. |
|
|
|
| (n) | Research and development expenses: |
|
|
|
|
| Research costs, which include all costs incurred to establish technological feasibility, are charged to operations in the period in which they are incurred. Once technological feasibility has been established, development costs are evaluated for deferral and subsequent amortization over the estimated period of benefit. As at December 31, 2008 and 2007, the Company had no deferred development costs. |
|
|
|
| (o) | Other costs of operation: |
|
|
|
|
| The costs of advertising, promotion and marketing programs are charged to operations in the period incurred. |
|
|
|
|
| Costs related to shipment and handling of goods to customers are expensed as incurred. |
|
|
|
|
| Products design and development costs are charged to operations as incurred. |
58
OPTIMAL GROUP INC.
Notes to Consolidated Financial Statements, Continued
Three-year period ended December 31, 2008
(expressed in thousands of U.S. dollars, except share and per share amounts)
|
|
|
|
|
|
|
|
4. | Significant accounting policies (continued): | ||
|
|
|
|
| (p) | Earnings per share: | |
|
|
|
|
|
| Basic earnings per share are determined using the weighted average number of Class “A” shares outstanding during the period. Diluted earnings per share are calculated using the treasury stock method. Diluted earnings per share are computed in a manner consistent with basic earnings per share, except that the weighted average shares outstanding are increased to include additional shares from the assumed exercise of options and warrants, if dilutive. The number of additional shares is calculated by assuming that outstanding options and warrants were exercised, and that the proceeds from such exercises, including unrecognized compensation costs of stock-based option grants attributed to future services, are used to repurchase Class “A” shares at the average market price during the reporting period. | |
|
|
|
|
| (q) | Use of estimates: | |
|
|
|
|
|
| The preparation of financial statements in conformity with GAAP requires management to make estimates and assumptions based on existing knowledge that affect the reported amounts of assets and liabilities and disclosures at the date of the financial statements and revenues and expenses during the reporting periods. Significant areas requiring the use of management estimates and assumptions include: determining the allowance for doubtful accounts and reserves for obsolescence and sales allowances; estimating the useful lives of long-lived assets, including property and equipment and intangible assets; estimating the fair value of identifiable intangibles acquired in a business acquisition; estimating stock-based compensation costs; assessing goodwill, as well as the recoverability of long-lived assets, research and development tax credits receivable and future tax assets; and the resolution of contingent liabilities. The reported amounts and note disclosures are determined to reflect the most probable set of economic conditions and planned courses of action. It is reasonably possible that management’s reassessments of these and other estimates and assumptions in the near term as well as actual results could require a material change in reported amounts and disclosures in the consolidated financial statements of future periods. | |
|
|
|
|
5. | Business acquisitions and disposals: | ||
|
|
|
|
| (a) | Acquisitions: | |
|
|
|
|
|
| (i) | 2008 acquisitions: |
|
|
|
|
|
|
| On August 29, 2008, the Company acquired all the outstanding shares of Sablon Distribution S.A. (“Sablon”), a Belgium-based toy distributor operating in the Benelux countries, France and Germany. The Company believes the acquisition strengthens and broadens the direct distribution structure of the consumer robotics, toy and entertainment products business segment and positions this segment closer to retailers and end users in Sablon’s markets. |
59
OPTIMAL GROUP INC.
Notes to Consolidated Financial Statements, Continued
Three-year period ended December 31, 2008
(expressed in thousands of U.S. dollars, except share and per share amounts)
|
|
|
|
|
| ||
5. | Business acquisitions and disposals: | ||
|
|
|
|
| (a) | Acquisitions (continued): | |
|
|
|
|
|
| (i) | 2008 acquisitions (continued): |
|
|
|
|
|
|
| In July 2008, the Company purchased certain assets and liabilities of a toy operation based in New York, USA. |
|
|
|
|
|
|
| The total purchase price for both acquisitions was $8,502, consisting of cash consideration paid of $6,557, transaction costs of $271 and, in connection with the Sablon acquisition, additional consideration payable of $1,674 (EUR 1,200). Additional consideration is also payable in each of 2009 and 2010 based on the consolidated net revenues of Sablon in these years. In connection with the second acquisition, the agreement provides for an additional payment payable upon the achievement of defined financial milestones. Any additional contingent consideration paid for these acquisitions will be accounted for as goodwill. |
|
|
|
|
|
|
| The acquisitions were accounted for using the purchase method, and the results were consolidated with those of the Company from the date of acquisition. The Company has allocated the purchase prices on a preliminary basis to the assets acquired and the liabilities assumed based on management’s best estimate of their fair values and taking into account all relevant information available at that time. Since the Company is still in the process of finalizing the valuation of identifiable intangible assets as well as other assets acquired and liabilities assumed at the date of acquisition, the allocation of the purchase price is subject to change. The Company expects to finalize the allocation of the purchase price during 2009. |
|
|
|
|
|
|
| The following table presents the estimated fair value of the assets purchased and liabilities assumed at the date of acquisition in connection with these acquisitions: |
|
|
|
|
|
|
|
|
|
|
|
|
Assets acquired: |
|
|
|
| |
| Cash and cash equivalents |
| $ | 23 |
|
| Accounts receivable |
|
| 4,099 |
|
| Inventories |
|
| 7,491 |
|
| Income tax receivable |
|
| 322 |
|
| Property and equipment |
|
| 2,447 |
|
| Customer relationships |
|
| 2,600 |
|
| Non-compete agreement |
|
| 1,892 |
|
| Future income taxes |
|
| 993 |
|
| Goodwill |
|
| 3,965 |
|
| |||||
|
|
|
| 23,832 |
|
|
|
|
|
|
|
Liabilities assumed: |
|
|
|
| |
| Bank indebtedness |
|
| 5,703 |
|
| Accounts payable and accrued liabilities |
|
| 5,242 |
|
| Customer deposits |
|
| 313 |
|
| Long-term debt |
|
| 3,254 |
|
| Future income taxes |
|
| 818 |
|
| |||||
|
|
|
| 15,330 |
|
|
|
|
|
|
|
Net assets acquired |
| $ | 8,502 |
| |
60
|
OPTIMAL GROUP INC. |
Notes to Consolidated Financial Statements, Continued |
|
Three-year period ended December 31, 2008 |
(expressed in thousands of U.S. dollars, except share and per share amounts) |
|
|
|
|
|
5. | Business acquisitions and disposals (continued): | ||
|
|
| |
| (a) | Acquisitions (continued): | |
|
|
|
|
|
| (i) | 2008 acquisitions (continued): |
|
|
|
|
|
|
| |||||
|
|
|
|
|
|
| Consideration: |
|
|
|
|
| Cash |
| $ | 6,557 |
|
| Additional consideration payable in cash |
|
| 1,674 |
|
| Transaction costs |
|
| 271 |
|
|
|
|
|
|
|
| |||||
| Total purchase price |
| $ | 8,502 |
|
|
|
|
|
|
|
|
|
| Goodwill recorded in connection with these transactions is not expected to be deductible for tax purposes. | |
|
|
|
| |
|
| (ii) | 2007 acquisitions: | |
|
|
|
| |
|
|
| (a) | Optimal Acquisition Inc.: |
|
|
|
|
|
|
|
|
| On February 23, 2007, Optimal Acquisition Inc. completed the acquisition of all of the outstanding shares held by non-controlling shareholders of Optimal Payments (Ireland) Limited for $16,463, which as of that date became a wholly-owned subsidiary of the Company. As a result of the acquisition, non-controlling interest is no longer recorded in the consolidated financial statements. The transaction was accounted for using the purchase method. |
|
|
|
|
|
|
|
| (b) | Wow Wee Limited: |
|
|
|
|
|
|
|
|
| On November 7, 2007, the Company completed the acquisition of substantially all of the assets of Wow Wee Limited, a privately-held Hong Kong-based developer, marketer and supplier of technology-based, consumer robotic, toy and entertainment products, as well as substantially all of the assets of WowWee Marketing, Inc., with offices in California, and Wow Wee Group Company, with offices in Canada (collectively, “WowWee”). WowWee Marketing, Inc. and Wow Wee Group Company were service providers to Wow Wee Limited in the operation of its business. The Company believes that the acquisition will provide the WowWee business with greater financial and operational resources to grow both in North America and internationally. In addition, the Company will be able to build upon the existing consumer-focused franchise of the business, by capitalizing on its corporate brands through the development of a cross-platform entertainment media strategy. |
61
|
OPTIMAL GROUP INC. |
Notes to Consolidated Financial Statements, Continued |
|
Three-year period ended December 31, 2008 |
(expressed in thousands of U.S. dollars, except share and per share amounts) |
|
|
|
|
|
|
5. | Business acquisitions and disposals (continued): | |||
|
| |||
| (a) | Acquisitions (continued): | ||
|
|
|
| |
|
| (ii) | 2007 acquisitions (continued): | |
|
|
|
| |
|
|
| (b) | Wow Wee Limited (continued): |
|
|
|
|
|
|
|
|
| The total purchase price was $60,421, consisting of a cash consideration of $46,570, the issuance of 2,169,197 Class “A” shares with a fair value of $10,000, 820,000 warrants to purchase 820,000 Class ”A” shares having an estimated fair value of $2,696 and transaction costs of $1,155. The warrants have an exercise price of $5.56 per share and are exercisable for a period of seven years. |
|
|
|
|
|
|
|
|
| The acquisition was accounted for using the purchase method, and the results of WowWee were consolidated with those of the Company from the date of acquisition. The following table presents the estimated fair value of the assets purchased and liabilities assumed from WowWee on November 7, 2007: |
|
|
|
|
|
|
|
|
|
|
Assets acquired: |
|
|
|
|
Cash and cash equivalents |
| $ | 483 |
|
Accounts receivable |
|
| 9,722 |
|
Inventories |
|
| 5,285 |
|
Income tax receivable |
|
| 2,966 |
|
Prepaid expenses and deposits |
|
| 771 |
|
Property and equipment |
|
| 1,991 |
|
Customer relationships |
|
| 21,171 |
|
Intellectual property |
|
| 5,520 |
|
Tradename |
|
| 14,797 |
|
Goodwill |
|
| 37,455 |
|
|
|
| 100,161 |
|
|
|
|
|
|
Liabilities assumed: |
|
|
|
|
Accounts payable and accrued liabilities |
|
| 33,445 |
|
Future income taxes |
|
| 6,295 |
|
|
|
| 39,740 |
|
|
|
|
|
|
Net assets acquired |
| $ | 60,421 |
|
|
|
|
|
|
Consideration: |
|
|
|
|
Cash |
| $ | 46,570 |
|
2,169,197 Class “A” shares |
|
| 10,000 |
|
Warrants |
|
| 2,696 |
|
Transaction costs |
|
| 1,155 |
|
Total purchase price |
| $ | 60,421 |
|
62
|
OPTIMAL GROUP INC. |
Notes to Consolidated Financial Statements, Continued |
|
Three-year period ended December 31, 2008 |
(expressed in thousands of U.S. dollars, except share and per share amounts) |
|
|
|
|
|
|
5. | Business acquisitions and disposals (continued): | |||
|
| |||
| (a) | Acquisitions (continued): | ||
|
|
| ||
|
| (ii) | 2007 acquisitions (continued): | |
|
|
|
| |
|
|
| (b) | Wow Wee Limited (continued): |
|
|
|
|
|
|
|
|
| Goodwill recorded in connection with this transaction is not expected to be deductible for tax purposes. |
|
|
|
|
|
|
|
|
| The fair value of the warrants was estimated using the Black-Scholes model using the following assumptions: exercise price $5.56, share price $5.48, volatility 56%, risk-free rate 3.74%, and dividend yield 0%. |
|
|
|
|
|
|
|
|
| In 2008, goodwill on this acquisition was increased by $342 as a result of fair value adjustments to certain assets and liabilities at the date of acquisition. |
|
|
|
|
|
| (b) | Disposals: |
| |
|
|
|
| |
|
| (i) | 2008 disposals: | |
|
|
|
| |
|
|
| Sale of Canadian Card-Present and Card-Not-Present businesses: | |
|
|
|
| |
|
|
| Effective October 1, 2008, the Company sold substantially all of the payment processing assets that were used exclusively in the business of processing payments for “card-not-present” transactions for a cash consideration of $7,000 and, effective August 5, 2008, sold substantially all of the payment processing assets that were used exclusively in the business of processing payments for Canadian card-present business for a cash consideration of $1,500. In connection with the second transaction, additional proceeds of $500 may be received by the Company based on the achievement of certain earnings goals by the purchaser. | |
|
|
|
| |
|
|
| At December 31, 2008, the Company continues to operate certain merchant portfolios that formed part of the payment processing segment. | |
|
|
|
| |
|
| (ii) | 2006 disposals: | |
|
|
|
| |
|
|
| Sale of hardware maintenance and repair services segment: | |
|
|
|
| |
|
|
| Effective September 30, 2006, the Company sold its Canadian hardware maintenance and repair services segment for cash consideration of $200. | |
|
|
|
| |
|
| The results of operations for these businesses are included in discontinued operations in the consolidated statements of operations, and the remaining assets and liabilities of these segments are classified as discontinued in the consolidated balance sheets. | ||
63
|
OPTIMAL GROUP INC. |
Notes to Consolidated Financial Statements, Continued |
|
Three-year period ended December 31, 2008 |
(expressed in thousands of U.S. dollars, except share and per share amounts) |
|
|
|
|
5. | Business acquisitions and disposals (continued): | |
|
|
|
| (b) | Disposals (continued): |
|
|
|
|
| The following table summarizes the book value of the assets and liabilities relating to the businesses sold by the Company in 2008 and 2006: |
|
|
|
|
|
|
|
|
|
| 2008 |
| 2006 |
| ||
| |||||||
Current assets: |
|
|
|
|
|
|
|
Cash and short-term investments held in reserve |
| $ | 6,010 |
| $ | — |
|
Settlement assets |
|
| 1,679 |
|
| — |
|
Accounts receivable |
|
| 3,622 |
|
| 3,733 |
|
Inventories |
|
| 12 |
|
| 2,074 |
|
Prepaid expenses and deposits |
|
| 215 |
|
| 807 |
|
|
|
| 11,538 |
|
| 6,614 |
|
|
|
|
|
|
|
|
|
Long-term assets: |
|
|
|
|
|
|
|
Property and equipment |
|
| 738 |
|
| 2,546 |
|
Intangible assets |
|
| 811 |
|
| — |
|
|
|
| 1,549 |
|
| 2,546 |
|
|
|
|
|
|
|
|
|
Current liabilities: |
|
|
|
|
|
|
|
Accounts payable and accrued liabilities |
|
| 4,169 |
|
| 4,409 |
|
Customer reserves and security deposits |
|
| 7,868 |
|
| — |
|
Obligations under capital lease |
|
| — |
|
| 268 |
|
|
|
| 12,037 |
|
| 4,677 |
|
|
|
|
|
|
|
|
|
Net assets sold |
|
| 1,050 |
|
| 4,483 |
|
|
|
|
|
|
|
|
|
Proceeds from sale, net of transaction cost of $312 in 2008 |
|
| 8,188 |
|
| 200 |
|
|
|
|
|
|
|
|
|
Net gain (loss) on sale of net assets |
| $ | 7,138 |
| $ | (4,283 | ) |
64
|
OPTIMAL GROUP INC. |
Notes to Consolidated Financial Statements, Continued |
|
Three-year period ended December 31, 2008 |
(expressed in thousands of U.S. dollars, except share and per share amounts) |
|
|
|
|
5. | Business acquisitions and disposals (continued): | |
|
|
|
| (b) | Disposals (continued): |
|
|
|
|
| The results of operations of the businesses disposed of for the years ended December 31, 2008, 2007 and 2006 were as follows: |
|
|
|
|
|
|
|
|
|
|
|
|
| 2008 |
| 2007 |
| 2006 |
| |||
|
|
|
|
|
|
|
|
|
|
|
Revenues |
| $ | 31,956 |
| $ | 38,420 |
| $ | 135,986 |
|
|
|
|
|
|
|
|
|
|
|
|
Costs and expenses: |
|
|
|
|
|
|
|
|
|
|
|
|
|
|
|
|
|
|
|
|
|
Transaction processing, service costs and cost of sales |
|
| 14,421 |
|
| 17,165 |
|
| 58,682 |
|
Selling, general and administrative |
|
| 11,054 |
|
| 12,903 |
|
| 34,733 |
|
Amortization of property, equipment and intangibles |
|
| 1,487 |
|
| 2,373 |
|
| 3,467 |
|
Stock-based compensation |
|
| — |
|
| 5,981 |
|
| 1,707 |
|
Operating leases |
|
| 495 |
|
| 695 |
|
| 2,740 |
|
Foreign exchange |
|
| (1,468 | ) |
| 1,015 |
|
| 693 |
|
Impairment losses |
|
| 18,279 |
|
| 22,552 |
|
| 1,910 |
|
Restructuring |
|
| — |
|
| — |
|
| 4,995 |
|
|
|
| 44,268 |
|
| 62,684 |
|
| 108,927 |
|
|
|
|
|
|
|
|
|
|
|
|
(Loss) earnings before income taxes |
|
| (12,312 | ) |
| (24,264 | ) |
| 27,059 |
|
|
|
|
|
|
|
|
|
|
|
|
Income tax recovery (provision): |
|
|
|
|
|
|
|
|
|
|
Current |
|
| 4,993 |
|
| (2,090 | ) |
| (8,176 | ) |
Future |
|
| (11,819 | ) |
| (4,513 | ) |
| 6,756 |
|
|
|
| (6,826 | ) |
| (6,603 | ) |
| (1,420 | ) |
|
|
|
|
|
|
|
|
|
|
|
(Loss) earnings before non-controlling interest |
|
| (19,138 | ) |
| (30,867 | ) |
| 25,639 |
|
|
|
|
|
|
|
|
|
|
|
|
Non-controlling interest |
|
| — |
|
| (159 | ) |
| (6,934 | ) |
|
|
|
|
|
|
|
|
|
|
|
Net (loss) earnings from discontinued operations before undernoted item |
|
| (19,138 | ) |
| (31,026 | ) |
| 18,705 |
|
|
|
|
|
|
|
|
|
|
|
|
Net gain (loss) on disposal of assets |
|
| 7,138 |
|
| — |
|
| (4,283 | ) |
|
|
|
|
|
|
|
|
|
|
|
Net (loss) earnings from discontinued operations |
| $ | (12,000 | ) | $ | (31,026 | ) | $ | 14,422 |
|
The results of operations include management assumptions and adjustments related to cost allocations, which are inherently subjective.
On September 30, 2006, the United States Congress passed the Unlawful Internet Gambling Enforcement Act of 2006 (the “Act”). The Act prohibits any person engaged in the business of betting or wagering from knowingly accepting any financial instrument in connection with unlawful Internet gambling.
65
|
OPTIMAL GROUP INC. |
Notes to Consolidated Financial Statements, Continued |
|
Three-year period ended December 31, 2008 |
(expressed in thousands of U.S. dollars, except share and per share amounts) |
|
|
|
|
5. | Business acquisitions and disposals (continued): | |
|
|
|
| (b) | Disposals (continued): |
|
|
|
|
| Upon the enactment of the Act, the Company immediately ceased processing settlement transactions originating from United States consumers that may be viewed as related to online gambling, which represented approximately 81% of the Company’s total gaming payment processing services segment revenue for the year ended December 31, 2006. The enactment of the Act has had a significant negative impact on the Company’s results as follows: |
|
|
|
|
| 2008 |
| ||
|
| At June 30, 2008, the Company tested goodwill for impairment in the payment processing segment as the Company determined that there was a more likely than not expectation that a significant portion, or this entire segment, would be sold over the course of the following 12 months. As a result of this analysis, the goodwill in the segment was determined to be impaired since the estimated fair value to be realized as proceeds from transactions would be less than the carrying value of the segment including goodwill. As a result, the Company recorded a non-cash goodwill impairment loss of $18,279 in the second quarter of 2008 related to the Canadian Card-Present and Card-Not-Present businesses. |
|
|
|
|
| 2007 |
|
|
|
|
| The Company tested the payment processing segment for impairment at December 31, 2007. The Company revised its forecast for the following five years to reflect higher merchant attrition and lower growth expectations for this segment. At December 31, 2007, a goodwill impairment loss of $22,552 was recognized in the payment processing segment. The fair value of the segment was estimated using the expected present value of future cash flows. |
|
|
|
|
| In May 2007, the Company received a copy of warrants of seizure issued by the U.S. Attorney’s Office against funds of certain payment processors that were on deposit with two U.S. banks. These funds included $19,183 on deposit to the credit of the Company’s affiliates. The total amount seized is presented as long-term assets related to discontinued operations on the consolidated balance sheet. Refer to note 16 (e) - Commitments, contingencies and guarantees. In addition, long-term liabilities related to discontinued operations include customer reserves received from merchants of $10,871 that will only be settled upon resolution of the investigation by the U.S. Attorney’s Office. |
|
|
|
|
| 2006 |
|
|
|
|
| As a result of the significant negative impact on the business, an impairment loss of $1,910 related to customer relationships was recorded. The impairment loss represented the estimated amount by which the carrying amount of this asset exceeded its fair value. The fair value was determined using cash flow projections prepared by management. |
|
|
|
|
| The Company also embarked upon a restructuring of its operations and cost base and, as a result, recorded a restructuring charge in 2006 in the amount of $1,581 for associated costs, consisting primarily of employee |
66
|
OPTIMAL GROUP INC. |
Notes to Consolidated Financial Statements, Continued |
|
Three-year period ended December 31, 2008 |
(expressed in thousands of U.S. dollars, except share and per share amounts) |
|
|
|
|
5. | Business acquisitions and disposals (continued): | |
|
|
|
| (b) | Disposals (continued): |
|
|
|
|
| 2006 (continued) |
|
|
|
|
| termination benefits and costs of leased premises no longer utilized. All of these costs were paid by December 31, 2008. |
|
|
|
|
| During 2006, restructuring costs of $3,414 were also incurred related to the discontinued operations of the hardware maintenance and repair services segment. The restructuring costs related primarily to employee termination benefits, inventory write-offs, costs of leased premises no longer utilized, and facility closure costs. All these costs were paid in 2006 and 2007. |
|
|
|
6. | Short-term investments: | |
|
|
|
|
|
|
|
|
| |||||||
|
|
| 2008 |
| 2007 | ||
| |||||||
|
|
|
|
|
| ||
| Notes denominated in U.S. dollars with a weighted average effective yield of 1.70% (2007 - 4.43%), maturing on March 9, 2009 (2007 - matured between March 11, 2008 and April 24, 2008) |
| $ | 6,296 |
| $ | 12,477 |
| |||||||
|
|
|
|
|
|
|
|
7. | Accounts and other receivables: | ||||||
|
|
|
|
|
|
|
|
| |||||||
|
|
| 2008 |
| 2007 | ||
| |||||||
| Trade accounts receivable, net of provision for doubtful accounts of $758 (2007 - $765) |
| $ | 22,780 |
| $ | 14,653 |
| Other |
|
| 2,270 |
|
| 2,522 |
|
|
|
|
|
|
|
|
| |||||||
|
|
| $ | 25,050 |
| $ | 17,175 |
| |||||||
|
|
|
|
|
|
|
|
8. | Inventories: | ||||||
|
|
|
|
|
|
|
|
| |||||||
|
|
| 2008 |
| 2007 | ||
| |||||||
| Raw materials |
| $ | 7,286 |
| $ | 2,967 |
| Finished goods |
|
| 12,153 |
|
| 121 |
|
|
|
|
|
|
|
|
| |||||||
|
|
| $ | 19,439 |
| $ | 3,088 |
| |||||||
67
|
OPTIMAL GROUP INC. |
Notes to Consolidated Financial Statements, Continued |
|
Three-year period ended December 31, 2008 |
(expressed in thousands of U.S. dollars, except share and per share amounts) |
|
|
|
|
|
|
|
|
|
|
|
|
9. | Property and equipment: | |||||||||
|
|
|
|
|
|
|
|
|
|
|
| ||||||||||
|
|
|
|
|
| 2008 |
| 2007 | ||
| ||||||||||
|
|
|
|
|
|
|
|
|
|
|
| Cost: |
|
|
|
|
|
|
|
|
|
| Equipment |
|
|
|
| $ | 476 |
| $ | 272 |
| Computer equipment and software |
|
|
|
|
| 1,936 |
|
| 591 |
| Leasehold improvements |
|
|
|
|
| 1,353 |
|
| 490 |
| Moulds |
|
|
|
|
| 6,781 |
|
| 4,016 |
| ||||||||||
|
|
|
|
|
|
| 10,546 |
|
| 5,369 |
|
|
|
|
|
|
|
|
|
|
|
| Accumulated amortization: |
|
|
|
|
|
|
|
|
|
| Equipment |
|
|
|
|
| 181 |
|
| 87 |
| Computer equipment and software |
|
|
|
|
| 1,000 |
|
| 287 |
| Leasehold improvements |
|
|
|
|
| 334 |
|
| 123 |
| Moulds |
|
|
|
|
| 4,732 |
|
| 1,083 |
| ||||||||||
|
|
|
|
|
|
| 6,247 |
|
| 1,580 |
|
|
|
|
|
|
|
|
|
|
|
| ||||||||||
| Net book value |
|
|
|
| $ | 4,299 |
| $ | 3,789 |
| ||||||||||
|
|
|
|
|
|
|
|
|
|
|
10. | Goodwill and intangible assets: | |||||||||
|
|
|
|
|
|
|
|
|
|
|
| ||||||||||
|
|
|
|
|
|
|
|
| December 31, | |
| ||||||||||
|
|
| Gross |
| Accumulated |
| Net book | |||
| ||||||||||
|
|
|
|
|
|
|
| |||
| Customer relationships and service agreements |
| $ | 87,095 |
| $ | 50,728 |
| $ | 36,367 |
| ISO/ISA relations |
|
| 7,180 |
|
| 3,334 |
|
| 3,846 |
| Intellectual property |
|
| 5,520 |
|
| 2,147 |
|
| 3,373 |
| Tradename |
|
| 14,797 |
|
| 3,453 |
|
| 11,344 |
| Other |
|
| 3,020 |
|
| 1,267 |
|
| 1,753 |
|
|
|
|
|
|
|
|
|
|
|
| ||||||||||
|
|
| $ | 117,612 |
| $ | 60,929 |
| $ | 56,683 |
| ||||||||||
68
OPTIMAL GROUP INC.
Notes to Consolidated Financial Statements, Continued
|
|
Three-year period ended December 31, 2008 | |
(expressed in thousands of U.S. dollars, except share and per share amounts) | |
|
|
|
|
10. | Goodwill and intangible assets (continued): |
|
|
|
|
|
|
|
|
|
|
|
|
| December 31, |
| |||||||
|
| Gross |
| Accumulated |
| Net book |
| |||
|
|
|
|
|
|
|
|
|
|
|
Goodwill |
| $ | 47,931 |
| $ | — |
| $ | 47,931 |
|
|
|
|
|
|
|
|
|
|
|
|
Customer relationships and service agreements |
|
| 84,495 |
|
| 24,178 |
|
| 60,317 |
|
ISO/ISA relations |
|
| 7,180 |
|
| 2,308 |
|
| 4,872 |
|
Intellectual property |
|
| 5,520 |
|
| 307 |
|
| 5,213 |
|
Tradename |
|
| 14,797 |
|
| 492 |
|
| 14,305 |
|
Other |
|
| 834 |
|
| 477 |
|
| 357 |
|
|
|
| 112,826 |
|
| 27,762 |
|
| 85,064 |
|
|
|
|
|
|
|
|
|
|
|
|
|
| $ | 160,757 |
| $ | 27,762 |
| $ | 132,995 |
|
69
OPTIMAL GROUP INC.
Notes to Consolidated Financial Statements, Continued
|
|
Three-year period ended December 31, 2008 | |
(expressed in thousands of U.S. dollars, except share and per share amounts) | |
|
|
|
|
10. | Goodwill and intangible assets (continued): |
|
|
| Excluding amounts included in discontinued operations, changes in goodwill and intangible assets were as follows: |
|
|
| |
|
|
|
|
|
|
|
|
|
|
|
|
|
|
|
|
|
|
|
|
|
|
|
|
| Goodwill |
| Customer relationships |
| ISO/ISA |
| Intellectual property |
| Trade- |
| Other |
| Total |
| |||||||
|
|
|
|
|
|
|
|
|
|
|
|
|
|
|
|
|
|
|
|
|
|
|
Balance, |
| $ | 10,818 |
| $ | 46,952 |
| $ | 5,898 |
| $ | — |
| $ | — |
| $ | 872 |
| $ | 64,540 |
|
|
|
|
|
|
|
|
|
|
|
|
|
|
|
|
|
|
|
|
|
|
|
|
Acquisitions: |
|
|
|
|
|
|
|
|
|
|
|
|
|
|
|
|
|
|
|
|
|
|
WowWee |
|
| 37,113 |
|
| 21,171 |
|
| — |
|
| 5,520 |
|
| 14,797 |
|
| — |
|
| 78,601 |
|
Other |
|
| — |
|
| 2,250 |
|
| — |
|
| — |
|
| — |
|
| 294 |
|
| 2,544 |
|
|
|
|
|
|
|
|
|
|
|
|
|
|
|
|
|
|
|
|
|
|
|
|
Amortization |
|
| — |
|
| (10,056 | ) |
| (1,026 | ) |
| (307 | ) |
| (492 | ) |
| (809 | ) |
| (12,690 | ) |
|
|
|
|
|
|
|
|
|
|
|
|
|
|
|
|
|
|
|
|
|
|
|
Balance, |
|
| 47,931 |
|
| 60,317 |
|
| 4,872 |
|
| 5,213 |
|
| 14,305 |
|
| 357 |
|
| 132,995 |
|
|
|
|
|
|
|
|
|
|
|
|
|
|
|
|
|
|
|
|
|
|
|
|
Acquisitions: |
|
|
|
|
|
|
|
|
|
|
|
|
|
|
|
|
|
|
|
|
|
|
WowWee |
|
| 342 |
|
| — |
|
| — |
|
| — |
|
| — |
|
| — |
|
| 342 |
|
Sablon (note 5) |
|
| 3,965 |
|
| 2,600 |
|
| — |
|
| — |
|
| — |
|
| — |
|
| 6,565 |
|
Other (note 5) |
|
| — |
|
| — |
|
| — |
|
| — |
|
| — |
|
| 1,892 |
|
| 1,892 |
|
Other |
|
| — |
|
| — |
|
| — |
|
| — |
|
| — |
|
| 293 |
|
| 293 |
|
|
|
|
|
|
|
|
|
|
|
|
|
|
|
|
|
|
|
|
|
|
|
|
Impairment losses: |
|
|
|
|
|
|
|
|
|
|
|
|
|
|
|
|
|
|
|
|
|
|
WowWee |
|
| (37,455 | ) |
| — |
|
| — |
|
| — |
|
| — |
|
| — |
|
| (37,455 | ) |
Sablon |
|
| (3,965 | ) |
| (2,427 | ) |
| — |
|
| — |
|
| — |
|
| — |
|
| (6,392 | ) |
Card-not-present |
|
| (10,818 | ) |
| (12,156 | ) |
| — |
|
| — |
|
| — |
|
| (89 | ) |
| (23,063 | ) |
|
|
|
|
|
|
|
|
|
|
|
|
|
|
|
|
|
|
|
|
|
|
|
Amortization |
|
| — |
|
| (11,967 | ) |
| (1,026 | ) |
| (1,840 | ) |
| (2,961 | ) |
| (700 | ) |
| (18,494 | ) |
|
|
|
|
|
|
|
|
|
|
|
|
|
|
|
|
|
|
|
|
|
|
|
Balance, |
| $ | — |
| $ | 36,367 |
| $ | 3,846 |
| $ | 3,373 |
| $ | 11,344 |
| $ | 1,753 |
| $ | 56,683 |
|
|
|
| Due largely to a general deterioration of the economic environment, sales, operating profits and cash flows in the consumer robotic, toy and entertainment products segment were lower than expected in 2008. The Company tested the consumer robotic, toy and entertainment segment for impairment at September 30, 2008 and December 31, 2008. The Company revised its forecast for the next five years to reflect lower growth expectations for this segment. At December 31, 2008, a goodwill impairment loss of $41,420 and an impairment |
70
OPTIMAL GROUP INC.
Notes to Consolidated Financial Statements, Continued
|
|
Three-year period ended December 31, 2008 | |
(expressed in thousands of U.S. dollars, except share and per share amounts) | |
|
|
|
|
10. | Goodwill and intangible assets (continued): |
|
|
| loss of $2,427 on amortizable intangibles were recognized for this segment. The fair value of the segment was estimated using the expected present value of future cash flows. |
|
|
| With respect to the continuing operations of the payment processing segment: |
|
|
| At June 30, 2008, the Company tested goodwill for impairment in the payment processing segment as the Company determined that there was a more likely than not expectation that a significant portion, or this entire segment, would be sold over the course of the following 12 months. As a result of this analysis, the goodwill in the segment was determined to be impaired since the estimated fair value to be realized as proceeds from transactions would be less than the carrying value of the segment including goodwill. As a result, the Company recorded a non-cash goodwill impairment loss of $10,818 in the second quarter of 2008. |
|
|
| In addition, the Company tested the remaining intangibles held in the payment processing segment at December 31, 2008 for impairment as the Company determined that there was a more likely than not expectation that a significant portion of these intangibles would be sold over the course of the next twelve months. As a result of this analysis, the Company recorded a non-cash impairment charge of $12,156 at December 31, 2008 based on the estimated fair value to be realized as proceeds from these transactions. |
|
|
11. | Bank indebtedness: |
|
|
| In 2008, the Company had credit facilities available through its subsidiaries as follows: |
|
|
| Through its European subsidiaries, the Company has entered into various credit facilities for up to approximately $9,300 (EUR 6,650) which could be utilized in the form of loans and letters of guarantee. At December 31, 2008, the Company utilized $6,577 (EUR 4,714) of the facilities. The borrowings are due on demand, bear interest at the bank’s prime rate plus a premium ranging between 0.5% and 1%, and are secured by a first ranking hypothec on certain assets of the subsidiaries. |
|
|
| In Europe, the Company’s subsidiaries also have additional facilities based on qualifying accounts receivable, of which $1,698 (EUR 1,217) has been utilized as at December 31, 2008. These facilities are due on demand, and bear interest at the bank’s prime rate plus a premium ranging between 1% and 1.75%. |
|
|
| Through its Hong Kong subsidiary, the Company has entered into credit facilities for up to approximately $5,128 (40,000 HKD), based on qualifying accounts receivable, which could have been utilized in the form of loans and letters of guarantee. At December 31, 2008, the Company utilized $3,272 (25,522 HKD) of the facilities. The borrowings are due on demand and bear interest at the interbank rate in Hong Kong plus a premium ranging between 0.5% and 2%. Under this agreement, the Company is subject to financial covenants, which were met at December 31, 2008. |
|
|
| In 2007, the Company did not have any credit facilities. |
71
|
OPTIMAL GROUP INC. |
Notes to Consolidated Financial Statements, Continued |
|
Three-year period ended December 31, 2008 |
(expressed in thousands of U.S. dollars, except share and per share amounts) |
|
|
|
12. | Accounts payable and accrued liabilities: |
|
|
|
|
|
|
|
|
|
| 2008 |
| 2007 |
| ||
|
|
|
|
|
|
|
|
Trade accounts payable |
| $ | 19,436 |
| $ | 16,737 |
|
Accrued trade liabilities |
|
| 7,585 |
|
| 5,672 |
|
Accrued salaries and benefits |
|
| 3,424 |
|
| 2,760 |
|
Reserve for sales returns and allowances |
|
| 3,879 |
|
| 2,698 |
|
Current portion of long-term debt (note 13) |
|
| 1,010 |
|
| — |
|
Other |
|
| 3,613 |
|
| 6,041 |
|
|
|
|
|
|
|
|
|
|
| $ | 38,947 |
| $ | 33,908 |
|
|
|
13. | Long-term debt: |
|
|
|
|
|
|
|
|
|
| 2008 |
| 2007 |
| ||
|
|
|
|
|
|
|
|
Loan payable to a selling shareholder, assumed at date of acquisition, maturing in 2011, bearing interest at 8.85% up to March 2009, and 7% thereafter (EUR 1,600) |
| $ | 2,231 |
| $ | — |
|
|
|
|
|
|
|
|
|
Other loans, bearing interest at rates ranging from 5% to 8.85% (EUR 562) |
|
| 784 |
|
| — |
|
|
|
| 3,015 |
|
| — |
|
|
|
|
|
|
|
|
|
Less current portion included in accounts payable and accrued liabilities |
|
| 1,010 |
|
| — |
|
|
|
|
|
|
|
|
|
Long-term debt |
| $ | 2,005 |
| $ | — |
|
|
|
|
| Principal repayments over the next four years are as follows: 2009 - $1,010; 2010 - $872; 2011 - $872; 2012 - $174 and $87 thereafter. | |
|
|
|
14. | Share capital: | |
|
|
|
| The Company’s authorized share capital consists of an unlimited number of Class ”A” shares, and Class ”B” and Class ”C” preference shares. | |
|
| |
| – | The Class “A” shares are designated as common shares. |
|
|
|
| – | The Class “B” preference shares are voting, non-participating and redeemable at the option of the Company for the amount paid up thereon. In the event of the liquidation, dissolution or wind-up of the Company, the Class “B” preference shares rank in priority to all other classes. |
|
|
|
| – | The Class “C” preference shares are issuable in series with rights, privileges, restrictions and conditions designated by the directors. In the event of the liquidation, dissolution or wind-up of the Company, the Class ”C” preference shares rank in priority to the common shares. |
72
|
OPTIMAL GROUP INC. |
Notes to Consolidated Financial Statements, Continued |
|
Three-year period ended December 31, 2008 |
(expressed in thousands of U.S. dollars, except share and per share amounts) |
|
|
|
|
14. | Share capital (continued): | |
|
|
|
| No Class “B” or Class “C” shares have been issued. | |
|
|
|
| On November 6, 2007, and again on November 5, 2008, the Board of Directors renewed its stock buyback program authorizing the Company to purchase up to 5% of its outstanding Class “A” shares on the open market through the facilities of the Nasdaq Stock Market. The 2007 program expired on November 20, 2008 and the 2008 program will expire on November 20, 2009. | |
|
|
|
| All shares purchased under the stock buyback program have been cancelled. The purchase of 240,925 (2007 - 53,400) such shares, having a book value of $1,966 (2007 - $436), was settled in 2008 for a total consideration of $550 (2007 - $206). The excess of the book value of the shares over the purchase price, in the amount of $1,416 (2007 - $230) was credited to contributed surplus. During 2006, the purchase of 141,109 Class “A” shares, having a book value of $1,189, was settled for a total consideration of $2,264. The excess of the purchase price over book value of the shares, in the amount of $1,075, was charged to the deficit. | |
|
|
|
15. | Stock options and warrants: | |
|
|
|
| (a) | Optimal Group Inc.: |
|
|
|
|
| The Company has a stock option plan that provides for the granting of options to employees and directors for the purchase of the Company’s Class “A” shares to be issued from treasury. Options may be granted by the Board of Directors for terms of up to ten years. The Board of Directors establishes the exercise period, vesting terms and other conditions for each grant at the grant date. The maximum number of options that may be granted under the plan is 9,000,000. Options may be granted with exercise prices at the then current market price. |
73
|
OPTIMAL GROUP INC. |
Notes to Consolidated Financial Statements, Continued |
|
Three-year period ended December 31, 2008 |
(expressed in thousands of U.S. dollars, except share and per share amounts) |
|
|
|
|
15. | Stock options and warrants (continued): | |
|
|
|
| (a) | Optimal Group Inc. (continued): |
|
|
|
|
| Details of outstanding stock options are as follows: |
|
|
|
|
|
|
|
|
|
| Number of |
| Weighted |
| ||
|
|
|
|
|
|
|
|
Options outstanding, December 31, 2005 |
|
| 4,374,623 |
| $ | 7.10 |
|
|
|
|
|
|
|
|
|
Granted |
|
| 67,500 |
|
| 9.36 |
|
Expired/cancelled |
|
| (2,285 | ) |
| 7.10 |
|
Exercised |
|
| (506,667 | ) |
| 7.10 |
|
|
|
|
|
|
|
|
|
Options outstanding, December 31, 2006 |
|
| 3,933,171 |
|
| 7.14 |
|
|
|
|
|
|
|
|
|
Granted |
|
| 1,636,000 |
|
| 4.21 |
|
Expired/cancelled |
|
| (30,630 | ) |
| 9.31 |
|
|
|
|
|
|
|
|
|
Options outstanding, December 31, 2007 |
|
| 5,538,541 |
|
| 6.26 |
|
|
|
|
|
|
|
|
|
Expired/cancelled |
|
| (66,667 | ) |
| 7.73 |
|
|
|
|
|
|
|
|
|
Options outstanding, December 31, 2008 |
|
| 5,471,874 |
| $ | 6.24 |
|
|
|
| For the year ended December 31, 2008, no options were granted. |
|
|
| At December 31, 2008, 5,471,874 (2007 - 5,538,541; 2006 - 67,500) stock options could potentially dilute basic earnings per share in the future. They were not included in the computation of diluted earnings per share because to do so would have been anti-dilutive. |
|
|
| There are 4,655,874 stock options exercisable at December 31, 2008 with a weighted average exercise price per share of $6.60. |
74
|
OPTIMAL GROUP INC. |
Notes to Consolidated Financial Statements, Continued |
|
Three-year period ended December 31, 2008 |
(expressed in thousands of U.S. dollars, except share and per share amounts) |
|
|
|
|
15. | Stock options and warrants (continued): | |
|
|
|
| (a) | Optimal Group Inc. (continued): |
|
|
|
|
| The following table summarizes information about the options outstanding and exercisable at December 31, 2008: |
|
|
|
|
|
|
|
|
|
|
|
|
|
|
|
|
|
| Options outstanding |
| Options exercisable |
| ||||||
Exercise |
| Weighted |
| Number |
| Weighted |
| Number |
| Weighted |
| ||
|
|
|
|
|
|
|
|
|
|
|
| ||
$7.10 |
| 5.33 |
| 3,837,374 |
| $ | 7.10 |
| 3,837,374 |
| $ | 7.10 |
|
$9.36 |
| 2.97 |
| 7,500 |
|
| 9.36 |
| 5,000 |
|
| 9.36 |
|
$4.21 |
| 5.88 |
| 1,627,000 |
|
| 4.21 |
| 813,500 |
|
| 4.21 |
|
|
|
|
|
|
|
|
|
|
|
|
|
|
|
|
|
|
| 5,471,874 |
| $ | 6.24 |
| 4,655,874 |
| $ | 6.60 |
|
|
|
|
|
| In June 2008, the shareholders of the Company approved the extension of the expiry date of options issued in April 2004 at an exercise price of $7.10 per share from April 2009 to April 2014. See note 27 (c). |
|
|
|
| (b) | Terra Payments Inc.: |
|
|
|
|
| Under the terms of the 2004 Combination Agreement with Terra Payments Inc. (“Terra”), the Company assumed Terra’s stock option plan, whereby stock options governed by this plan would be exercisable for the Company’s Class “A” shares. The exercise price and number of options outstanding on April 6, 2004, the effective date of the acquisition of Terra, were adjusted based on the exchange ratio of 0.4532 of the Company’s Class “A” shares for each share of Terra. |
75
|
OPTIMAL GROUP INC. |
Notes to Consolidated Financial Statements, Continued |
|
Three-year period ended December 31, 2008 |
(expressed in thousands of U.S. dollars, except share and per share amounts) |
|
|
|
|
15. | Stock options and warrants (continued): | |
|
|
|
| (b) | Terra Payments Inc. (continued): |
|
|
|
|
| Details of the stock options outstanding under the Terra plan as at December 31, 2008 are as follows: |
|
|
|
|
|
|
|
|
|
|
|
|
|
| U.S. dollar exercise price |
| Canadian dollar exercise price |
| ||||||
|
| Number |
| Exercise price |
| Number |
| Weighted average |
| ||
|
|
|
|
|
|
|
|
|
|
|
|
Balance, December 31, 2005 |
| 217,451 |
| $ | 7.43 |
| 324,143 |
| $ | 8.56 |
|
|
|
|
|
|
|
|
|
|
|
|
|
Expired/cancelled |
| — |
|
| — |
| (19,317 | ) |
| 10.31 |
|
Exercised |
| (83,338 | ) |
| 7.43 |
| (123,068 | ) |
| 8.84 |
|
|
|
|
|
|
|
|
|
|
|
|
|
Balance, December 31, 2006 |
| 134,113 |
|
| 7.43 |
| 181,758 |
|
| 8.19 |
|
|
|
|
|
|
|
|
|
|
|
|
|
Expired/cancelled |
| — |
|
| — |
| (22,788 | ) |
| 10.24 |
|
Exercised |
| — |
|
| — |
| (18,261 | ) |
| 5.12 |
|
|
|
|
|
|
|
|
|
|
|
|
|
Balance, December 31, 2007 |
| 134,113 |
|
| 7.43 |
| 140,709 |
|
| 8.26 |
|
|
|
|
|
|
|
|
|
|
|
|
|
Expired/cancelled |
| — |
|
| — |
| (86,325 | ) |
| 6.58 |
|
|
|
|
|
|
|
|
|
|
|
|
|
Balance, December 31, 2008 |
| 134,113 |
| $ | 7.43 |
| 54,384 |
| $ | 10.92 |
|
|
|
| All of these options were fully vested at December 31, 2005. |
|
|
| All U.S. dollar exercise price options are exercisable at $7.43 per share. All Canadian dollar exercise price options are exercisable at $10.92 per share. |
|
|
| These options expire on various dates up to April 2009. |
|
|
| The 134,113 options outstanding with a U.S. dollar exercise price of $7.43 have a remaining contractual life of 0.25 year as at December 31, 2008. |
|
|
| As at December 31, 2007, there were 21,978 warrants outstanding with a weighted average exercise price of CA$0.01, which expired in March 2008. |
|
|
| There are Terra options to acquire 188,497 Class “A” shares (2007 - 274,822; 2006 - 70,246) that could potentially dilute basic earnings per share in the future that were not included in the computation of diluted earnings per share for the year ended December 31, 2008 because to do so would have been anti-dilutive. |
76
|
OPTIMAL GROUP INC. |
Notes to Consolidated Financial Statements, Continued |
|
Three-year period ended December 31, 2008 |
(expressed in thousands of U.S. dollars, except share and per share amounts) |
|
|
|
|
16. | Commitments, contingencies and guarantees: | |
|
|
|
| (a) | Operating leases: |
|
|
|
|
| The Company has entered into operating leases for its premises and certain office equipment. Minimum lease payments for the next five years and thereafter are approximately as follows: |
|
|
|
|
|
|
|
|
|
|
2009 |
| $ | 1,551 |
|
2010 |
|
| 1,088 |
|
2011 |
|
| 517 |
|
2012 |
|
| 519 |
|
2013 |
|
| 248 |
|
Thereafter |
|
| — |
|
|
|
|
|
|
|
| $ | 3,923 |
|
|
|
|
|
| In addition, the Company is also responsible for operating costs and taxes under the operating leases. |
|
|
|
| (b) | The Company has granted two letters of guarantee, issued by highly rated financial institutions to indemnify third parties in the event the Company does not perform its contractual obligations. As at December 31, 2008, the maximum potential liabilities under these letters of guarantee were $110 and $1,232 (CA$1,500) [2007 - $1,487 (CA$1,500)]. |
|
|
|
|
| As at December 31, 2008 and 2007, the Company recorded no liability with respect to these guarantees, as the Company does not expect to make any payment for the aforementioned items. Management believes that the fair value of the non-contingent obligations, to stand ready to perform in the event that specified triggering events or conditions occur, approximates the cost of obtaining the letter of guarantee. |
|
|
|
| (c) | The Company is party to litigation arising in the normal course of operations. The Company does not expect the resolution of such matters to have a material adverse effect on its financial position or results of operations. However, the results of legal proceedings cannot be predicted with certainty. Should the Company fail to prevail in any of these legal matters or should several legal matters be resolved against the Company in the same reporting period, the consolidated operating results of a particular reporting period could be materially adversely affected. |
77
|
OPTIMAL GROUP INC. |
Notes to Consolidated Financial Statements, Continued |
|
Three-year period ended December 31, 2008 |
(expressed in thousands of U.S. dollars, except share and per share amounts) |
|
|
|
|
16. | Commitments, contingencies and guarantees (continued): | |
|
|
|
| (d) | In the sale or other disposition of assets out of the ordinary course of business, in addition to possible indemnification relating to failure to perform covenants and breach of representations and warranties, the Company might agree to indemnify the buyer against claims from its past conduct of its business. Typically, the term and amount of such indemnification will be limited by agreement. No provision has been made in these financial statements with respect to this item as the Company does not expect to make any payments for these items and the standby liability is nominal. |
|
|
|
| (e) | As previously announced, immediately following the enactment of the Unlawful Internet Gambling Enforcement Act of 2006 (the “Act”) on October 13, 2006, the Company’s then majority-owned subsidiary, OPIL, ceased to process settlement transactions originating from United States consumers. This represented a substantial portion of its revenues derived from processing transactions from online gambling. The Company is exposed to adverse consequences as a result of possible enforcement proceedings, governmental investigations or lawsuits initiated against it in jurisdictions where online gambling is restricted or prohibited. |
|
|
|
|
| Following announcements by the U.S. Attorney’s Office in the Southern District of New York relating to its investigation of the U.S. Internet gambling industry, the Company announced on May 8, 2007 that it had initiated discussions with the U.S. Attorney’s Office in the Southern District of New York and it was in the process of responding to a voluntary request for information issued by the U.S. Attorney’s Office. In connection with such ongoing investigation, the Company announced on May 11, 2007 that it had received a copy of warrants of seizure issued by the U.S. Attorney’s Office against funds of certain payment processors that were on deposit with two U.S. banks. These funds included $19,183 on deposit to the credit of the Company’s affiliates. The total amount seized of $19,183 is presented as long-term asset related to discontinued operations on the consolidated balance sheets. The Company is not receiving any interest income on this amount. No provision has been recorded by the Company for this matter because the outcome of these discussions and the amount of loss, if any, are not currently determinable. |
|
|
|
|
| While best estimates have been used for reporting financial statement items subject to measurement uncertainty, management considers that it is possible that changes in future conditions in the near term could require a material change in the recognized amounts of certain assets and liabilities. “Near term” is considered to be within one year from the date of the financial statements. |
|
|
|
| (f) | On March 20, 2008, the Company entered into a settlement agreement with Fujitsu, which resolved all potential claims by Fujitsu and brought arbitration proceedings to an end. The amount that the Company paid to settle Fujitsu’s claims is not considered to be material to the Company. |
|
|
|
| (g) | OGOP Payments Inc. (formerly Optimal Payments Inc.) has received a request for information from the U.S. Attorney’s Office in the Eastern District of New York pertaining to its former involvement in processing transactions for internet pharmacies. OGOP Payments Inc. has had discussions with that Office relating to those processing activities. No provision has been recorded by OGOP Payments Inc. for this matter because the outcome of these discussions and the amount of any loss, if any, are not determinable. |
78
|
OPTIMAL GROUP INC. |
Notes to Consolidated Financial Statements, Continued |
|
Three-year period ended December 31, 2008 |
(expressed in thousands of U.S. dollars, except share and per share amounts) |
|
|
|
17. | Stock-based compensation: |
|
|
| Stock-based compensation expense in the consolidated statements of operations was comprised of: |
|
|
|
|
|
|
|
|
|
|
|
|
| 2008 |
| 2007 |
| 2006 |
| |||
|
|
|
|
|
|
|
|
|
|
|
Expense related to options granted in 2004 and amended in 2008 (i) |
| $ | 1,356 |
| $ | — |
| $ | — |
|
Expense related to options granted in 2007 |
|
| 1,983 |
|
| 276 |
|
| — |
|
Expense related to options granted in 2006 |
|
| — |
|
| 14 |
|
| 30 |
|
Expense related to OPIL restricted stock unit plan (ii) |
|
| — |
|
| 5,967 |
|
| 1,677 |
|
|
|
|
|
|
|
|
|
|
|
|
|
| $ | 3,339 |
| $ | 6,257 |
| $ | 1,707 |
|
|
|
|
| (i) | In June 2008, the shareholders approved a modification to the expiry date of 3,840,041 options exercisable at $7.10 per share from April 29, 2009 to April 2014. Since these options were vested at the date of modification, the incremental value of $1,356 of the fair value of the modified option over the value of the old option immediately before its terms were modified was expensed in the second quarter of 2008. |
|
|
|
| (ii) | As a result of the Company’s acquisition of all of the issued ordinary shares of OPIL held by non-controlling shareholders in February 2007, all of the unvested restricted share units became exercisable. All of the restricted share units were exercised by the holders in connection with this transaction. In addition, in the first quarter of 2007, the remaining unamortized compensation cost of $5,967 related to unvested restricted share units was recognized by the Company. No restricted share units remain outstanding subsequent to this transaction. |
|
|
|
|
|
|
|
|
|
|
|
|
| 2008 |
| 2007 |
| 2006 |
| |||
|
|
|
|
|
|
|
|
|
|
|
Presentation: |
|
|
|
|
|
|
|
|
|
|
Continuing operations |
| $ | 3,339 |
| $ | 276 |
| $ | — |
|
Discontinued operations |
|
| — |
|
| 5,981 |
|
| 1,707 |
|
|
|
|
|
|
|
|
|
|
|
|
|
| $ | 3,339 |
| $ | 6,257 |
| $ | 1,707 |
|
|
|
| The fair value of stock options granted in 2007 and 2006 was determined at the date of grant using the Black-Scholes option pricing model and the following weighted average assumptions: |
|
|
|
|
|
|
|
|
|
| 2007 |
| 2006 |
| ||
|
|
|
|
|
|
|
|
Expected volatility |
|
| 56.3 | % |
| 50.9 | % |
Expected life in years |
|
| 7 |
|
| 5 |
|
Risk-free interest rate |
|
| 3.74 | % |
| 4.5 | % |
Expected dividend rate |
|
| 0 | % |
| 0 | % |
|
|
|
|
|
|
|
|
79
|
OPTIMAL GROUP INC. |
Notes to Consolidated Financial Statements, Continued |
|
Three-year period ended December 31, 2008 |
(expressed in thousands of U.S. dollars, except share and per share amounts) |
|
|
|
17. | Stock-based compensation (continued): |
|
|
| There were no options granted during the year ended December 31, 2008. The weighted average fair value of 1,636,000 stock options (2006 - 67,500 options) granted in fiscal 2007 was $2.52 (2006 - $4.64) per option. |
|
|
18. | Income taxes: |
|
|
| The income tax provision differs from the amount computed by applying the combined Canadian federal and Québec provincial tax rates to earnings before income taxes. The reasons for the difference and the related tax effects are as follows: |
|
|
|
|
|
|
|
|
|
|
|
|
| 2008 |
| 2007 |
| 2006 |
| |||
|
|
|
|
|
|
|
|
|
|
|
Loss from continuing operations before income taxes and non-controlling interest |
| $ | (102,503 | ) | $ | (6,103 | ) | $ | (1,643 | ) |
|
|
|
|
|
|
|
|
|
|
|
Combined Canadian federal and provincial income taxes at 31% (2007 - 32%; 2006 - 32%) |
| $ | 31,674 |
| $ | 1,953 |
| $ | 526 |
|
Foreign exchange(1) |
|
| (459 | ) |
| 2,238 |
|
| 97 |
|
Change in valuation allowance |
|
| (12,597 | ) |
| (3,091 | ) |
| (24 | ) |
Difference in tax rates in foreign jurisdictions |
|
| (5,751 | ) |
| (194 | ) |
| (95 | ) |
Stock-based compensation not deductible |
|
| (1,006 | ) |
| (89 | ) |
| — |
|
Goodwill impairment loss not deductible |
|
| (7,528 | ) |
| — |
|
| — |
|
Change in future tax rates |
|
| (121 | ) |
| (774 | ) |
| — |
|
Permanent differences and other |
|
| (712 | ) |
| 575 |
|
| (504 | ) |
|
|
|
|
|
|
|
|
|
|
|
Income tax recovery of continuing operations |
| $ | 3,500 |
| $ | 618 |
| $ | — |
|
|
|
|
| (1) | For purposes of calculating the income tax provision of the Company, a tax liability (recovery) is recognized on foreign exchange gains or losses which arise on the conversion into Canadian dollars of the net monetary assets denominated in U.S. dollars; such conversion is required for tax purposes. As these financial statements are presented in U.S. dollars, these foreign exchange gains or losses do not impact (loss) earnings before income taxes, even though the income tax provision would include a tax effect for these items. Future fluctuations in the foreign exchange rate between the Canadian and U.S. dollar will change the amount of the foreign exchange gains or losses and, thus, the provision for income or recovery taxes thereon. |
80
|
OPTIMAL GROUP INC. |
Notes to Consolidated Financial Statements, Continued |
|
Three-year period ended December 31, 2008 |
(expressed in thousands of U.S. dollars, except share and per share amounts) |
|
|
|
18. | Income taxes (continued): |
|
|
| The (provision) recovery for income taxes from continuing operations is composed of the following: |
|
|
|
|
|
|
|
|
|
|
|
|
| 2008 |
| 2007 |
| 2006 |
| |||
|
|
|
|
|
|
|
|
|
|
|
Current income taxes |
| $ | (26 | ) | $ | 470 |
| $ | — |
|
Future income taxes |
|
| 3,526 |
|
| 148 |
|
| — |
|
|
|
|
|
|
|
|
|
|
|
|
|
| $ | 3,500 |
| $ | 618 |
| $ | — |
|
|
|
| Income tax expense has been based on the following components of (loss) earnings before income taxes from continuing operations and non-controlling interest: |
|
|
|
|
|
|
|
|
|
|
|
|
| 2008 |
| 2007 |
| 2006 |
| |||
|
|
|
|
|
|
|
|
|
|
|
Domestic |
| $ | (6,743 | ) | $ | 728 |
| $ | (2,379 | ) |
Foreign |
|
| (95,760 | ) |
| (6,831 | ) |
| 736 |
|
|
|
|
|
|
|
|
|
|
|
|
|
| $ | (102,503 | ) | $ | (6,103 | ) | $ | (1,643 | ) |
81
|
OPTIMAL GROUP INC. |
Notes to Consolidated Financial Statements, Continued |
|
Three-year period ended December 31, 2008 |
(expressed in thousands of U.S. dollars, except share and per share amounts) |
|
|
|
18. | Income taxes (continued): |
|
|
| The future income tax balances are summarized as follows: |
|
|
|
|
|
|
|
|
|
|
| 2008 |
| 2007 |
| |||
|
|
|
|
|
|
|
| |
Future income tax assets (liabilities): |
|
|
|
|
|
|
| |
| Intangible assets |
| $ | 14,792 |
| $ | 4,128 |
|
| Non-capital losses |
|
| 19,016 |
|
| 25,984 |
|
| Capital losses |
|
| 10,237 |
|
| 2,629 |
|
| Reserves |
|
| 786 |
|
| 801 |
|
| Foreign exchange and other |
|
| — |
|
| 3,822 |
|
| ||||||||
|
|
|
| 44,831 |
|
| 37,364 |
|
|
|
|
|
|
|
|
|
|
| Less valuation allowance |
|
| (44,831 | ) |
| (28,475 | ) |
| ||||||||
|
|
| — |
|
| 8,889 |
| |
|
|
|
|
|
|
|
| |
| Intangible assets and other |
|
| (7,803 | ) |
| (14,893 | ) |
|
|
|
|
|
|
|
| |
Net future income tax liability |
| $ | (7,803 | ) | $ | (6,004 | ) | |
|
|
|
|
|
|
|
| |
Presented as: |
|
|
|
|
|
|
| |
| Current assets |
| $ | — |
| $ | 714 |
|
| Long-term assets |
|
| — |
|
| 6,200 |
|
| Current liabilities |
|
| (838 | ) |
| (1,270 | ) |
| Long-term liabilities |
|
| (6,965 | ) |
| (11,648 | ) |
|
|
|
|
|
|
|
|
|
|
|
| $ | (7,803 | ) | $ | (6,004 | ) |
|
|
| In assessing the realizability of future tax assets, management considers whether it is more-likely-than-not that some portion or all of the future income tax assets will be realized. The ultimate realization of future tax assets is dependent upon the generation of future taxable income, the reversal of taxable temporary differences, and/or tax planning strategies. |
|
|
|
|
|
|
|
|
|
| Foreign |
| Canada |
| ||
|
|
|
|
|
|
|
|
Loss carryforwards: |
|
|
|
|
|
|
|
Expiry between 2009 and 2017 |
| $ | 467 |
| $ | 16,790 |
|
Expiry between 2018 and 2028 |
|
| 38,206 |
|
| 19,289 |
|
|
|
|
|
|
|
|
|
|
| $ | 38,673 |
| $ | 36,079 |
|
82
|
OPTIMAL GROUP INC. |
Notes to Consolidated Financial Statements, Continued |
|
Three-year period ended December 31, 2008 |
(expressed in thousands of U.S. dollars, except share and per share amounts) |
|
|
|
|
19. | Segmented information: | |
|
|
|
| As of November 7, 2007, as a result of the acquisition of the assets of Wow Wee Limited as discussed in note 5 (a), the Company operates in the consumer robotic, toy and entertainment products segment in addition to payment processing. In 2006, the Company operated in the payment processing segment. | |
|
| |
| (a) | Information on the operating segments is as follows: |
|
|
|
|
|
|
|
|
|
|
|
|
|
|
|
| Consumer |
| Payment |
| Eliminations/ |
| Consolidated |
| ||||
|
|
|
|
|
|
|
|
|
| ||||
Year ended December 31, 2008: |
|
|
|
|
|
|
|
|
|
|
|
|
|
|
|
|
|
|
|
|
|
|
|
|
|
|
|
Revenues |
| $ | 93,395 |
| $ | 59,151 |
| $ | — |
| $ | 152,546 |
|
|
|
|
|
|
|
|
|
|
|
|
|
|
|
Cost of sales and transaction processing |
|
| 66,400 |
|
| 42,731 |
|
| — |
|
| 109,131 |
|
Selling, general and administrative |
|
| 34,548 |
|
| 14,468 |
|
| 776 |
|
| 49,792 |
|
Research and development |
|
| 2,931 |
|
| — |
|
| — |
|
| 2,931 |
|
Operating leases |
|
| 1,006 |
|
| 352 |
|
| — |
|
| 1,358 |
|
|
|
| (11,490 | ) |
| 1,600 |
|
| (776 | ) |
| (10,666 | ) |
|
|
|
|
|
|
|
|
|
|
|
|
|
|
Stock-based compensation |
|
| 187 |
|
| — |
|
| 3,152 |
|
| 3,339 |
|
Impairment losses |
|
| 43,847 |
|
| 23,063 |
|
| — |
|
| 66,910 |
|
Amortization |
|
| 11,759 |
|
| 10,937 |
|
| 130 |
|
| 22,826 |
|
|
|
| (67,283 | ) |
| (32,400 | ) |
| (4,058 | ) |
| (103,741 | ) |
|
|
|
|
|
|
|
|
|
|
|
|
|
|
Investment income |
|
| — |
|
| — |
|
| 1,238 |
|
| 1,238 |
|
|
|
|
|
|
|
|
|
|
|
|
|
|
|
Loss from continuing operations before income taxes |
|
| (67,283 | ) |
| (32,400 | ) |
| (2,820 | ) |
| (102,503 | ) |
|
|
|
|
|
|
|
|
|
|
|
|
|
|
Income tax recovery (provision) |
|
| 3,674 |
|
| — |
|
| (174 | ) |
| 3,500 |
|
|
|
|
|
|
|
|
|
|
|
|
|
|
|
Net loss from continuing operations |
| $ | (63,609 | ) | $ | (32,400 | ) | $ | (2,994 | ) | $ | (99,003 | ) |
83
|
OPTIMAL GROUP INC. |
Notes to Consolidated Financial Statements, Continued |
|
Three-year period ended December 31, 2008 |
(expressed in thousands of U.S. dollars, except share and per share amounts) |
|
|
|
|
19. | Segmented information (continued): | |
|
|
|
| (a) | Information on the operating segments is as follows (continued): |
|
|
|
|
|
|
|
|
|
|
|
|
|
|
|
| Consumer |
| Payment |
| Eliminations/ |
| Consolidated |
| ||||
|
|
|
|
|
|
|
|
|
|
|
|
|
|
Year ended December 31, 2007: |
|
|
|
|
|
|
|
|
|
|
|
|
|
|
|
|
|
|
|
|
|
|
|
|
|
|
|
Revenues |
| $ | 11,311 |
| $ | 73,597 |
| $ | — |
| $ | 84,908 |
|
|
|
|
|
|
|
|
|
|
|
|
|
|
|
Cost of sales and transaction processing |
|
| 9,452 |
|
| 52,068 |
|
| — |
|
| 61,520 |
|
Selling, general and administrative |
|
| 3,042 |
|
| 15,709 |
|
| 1,557 |
|
| 20,308 |
|
Research and development |
|
| 431 |
|
| — |
|
| 300 |
|
| 731 |
|
Operating leases |
|
| 96 |
|
| 405 |
|
| — |
|
| 501 |
|
|
|
| (1,710 | ) |
| 5,415 |
|
| (1,857 | ) |
| 1,848 |
|
|
|
|
|
|
|
|
|
|
|
|
|
|
|
Stock-based compensation |
|
| 22 |
|
| — |
|
| 254 |
|
| 276 |
|
Amortization |
|
| 1,784 |
|
| 11,708 |
|
| 14 |
|
| 13,506 |
|
|
|
| (3,516 | ) |
| (6,293 | ) |
| (2,125 | ) |
| (11,934 | ) |
|
|
|
|
|
|
|
|
|
|
|
|
|
|
Investment income |
|
| — |
|
| — |
|
| 5,831 |
|
| 5,831 |
|
|
|
|
|
|
|
|
|
|
|
|
|
|
|
(Loss) earnings from continuing operations before income taxes |
|
| (3,516 | ) |
| (6,293 | ) |
| 3,706 |
|
| (6,103 | ) |
|
|
|
|
|
|
|
|
|
|
|
|
|
|
Income tax recovery |
|
| 148 |
|
| — |
|
| 470 |
|
| 618 |
|
|
|
|
|
|
|
|
|
|
|
|
|
|
|
Net loss (income) from continuing operations |
| $ | (3,368 | ) | $ | (6,293 | ) | $ | 4,176 |
| $ | (5,485 | ) |
84
|
OPTIMAL GROUP INC. |
Notes to Consolidated Financial Statements, Continued |
|
Three-year period ended December 31, 2008 |
(expressed in thousands of U.S. dollars, except share and per share amounts) |
|
|
|
|
19. | Segmented information (continued): | |
|
|
|
| (a) | Information on the operating segments is as follows (continued): |
|
|
|
|
|
|
|
|
|
|
|
|
|
|
|
| Consumer |
| Payment |
| Eliminations/ |
| Consolidated |
| ||||
|
|
|
|
|
|
|
|
|
|
|
|
|
|
December 31, 2008: |
|
|
|
|
|
|
|
|
|
|
|
|
|
|
|
|
|
|
|
|
|
|
|
|
|
|
|
Total assets |
| $ | 91,189 |
| $ | 23,968 |
| $ | 53,861 |
| $ | 169,018 |
|
|
|
|
|
|
|
|
|
|
|
|
|
|
|
Total additions to goodwill for the year ended December 31, 2008 |
|
| 4,307 |
|
| — |
|
| — |
|
| 4,307 |
|
|
|
|
|
|
|
|
|
|
|
|
|
|
|
Total additions to property and equipment and other intangibles for the year ended December 31, 2008 |
|
|
|
|
|
|
|
|
|
|
|
|
|
- through business acquisition |
|
| 6,939 |
|
| — |
|
| — |
|
| 6,939 |
|
- other |
|
| 4,359 |
|
| — |
|
| 620 |
|
| 4,979 |
|
|
|
|
|
|
|
|
|
|
|
|
|
|
|
December 31, 2007: |
|
|
|
|
|
|
|
|
|
|
|
|
|
|
|
|
|
|
|
|
|
|
|
|
|
|
|
Total assets |
|
| 104,560 |
|
| 66,156 |
|
| 119,565 |
|
| 290,281 |
|
|
|
|
|
|
|
|
|
|
|
|
|
|
|
Total additions to goodwill for the year ended December 31, 2007 |
|
| 37,113 |
|
| — |
|
| — |
|
| 37,113 |
|
|
|
|
|
|
|
|
|
|
|
|
|
|
|
Total additions to property and equipment and other intangibles for the year ended December 31, 2007 |
|
|
|
|
|
|
|
|
|
|
|
|
|
- through business acquisition |
|
| 43,945 |
|
| — |
|
| — |
|
| 43,945 |
|
- other |
|
| 1,597 |
|
| 2,809 |
|
| 35 |
|
| 4,441 |
|
|
|
|
|
|
|
|
|
|
|
|
|
|
|
|
|
| Included in total assets under the unallocated column for 2008 are $22,060 of assets of discontinued operations (2007 - $61,149). |
85
|
OPTIMAL GROUP INC. |
Notes to Consolidated Financial Statements, Continued |
|
Three-year period ended December 31, 2008 |
(expressed in thousands of U.S. dollars, except share and per share amounts) |
|
|
|
|
19. | Segmented information (continued): | |
|
|
|
| (b) | Geographic information is as follows: |
|
|
|
|
|
|
|
|
|
|
|
|
|
|
|
|
|
|
|
|
| Revenues |
|
|
| Property and equipment, goodwill and intangibles |
| |||||||
|
|
|
|
|
|
|
|
|
|
|
| |||||
|
| 2008 |
| 2007 |
| 2006 |
| 2008 |
| 2007 |
| |||||
|
|
|
|
|
|
|
|
|
|
|
|
|
|
|
|
|
United States |
| $ | 111,764 |
| $ | 76,423 |
| $ | 81,786 |
| $ | 23,588 |
| $ | 58,627 |
|
Europe |
|
| 31,499 |
|
| 6,017 |
|
| — |
|
| 657 |
|
| — |
|
Central America |
|
| 2,202 |
|
| 3 |
|
| — |
|
| — |
|
| — |
|
Canada |
|
| 2,333 |
|
| 871 |
|
| — |
|
| 638 |
|
| 193 |
|
Hong Kong |
|
| 128 |
|
| — |
|
| — |
|
| 36,099 |
|
| 77,964 |
|
Other |
|
| 4,620 |
|
| 1,594 |
|
| — |
|
| — |
|
| — |
|
|
|
|
|
|
|
|
|
|
|
|
|
|
|
|
|
|
|
| $ | 152,546 |
| $ | 84,908 |
| $ | 81,786 |
| $ | 60,982 |
| $ | 136,784 |
|
|
|
|
|
| Revenues are attributed to countries based on the location of the customers. The “Other” caption includes countries in Africa, Australia and Asia (excluding Hong Kong). |
|
|
|
| (c) | Major customers: |
|
|
|
|
| The Company has no customers in the current and prior periods from which 10% or more of total revenue is derived. |
|
|
|
20. | Related party transactions: | |
|
|
|
| The Company paid consulting fees to a corporation controlled by a former director of the Company in the amount of $200 (2007 - $260; 2006 - $497). The transactions have been recorded at the exchange amount, which is the amount of consideration agreed to by the parties. | |
|
|
|
21. | Capital disclosures: | |
|
|
|
| The Company’s objective is to maintain a strong capital base to maintain investor, creditor and market confidence and to sustain future development of the business. | |
|
|
|
| Management defines capital as the Company’s shareholders’ equity, excluding accumulated other comprehensive income, plus long-term debt. | |
|
|
|
| In order to maximize flexibility in financing the Company’s ongoing growth and be able to take advantage of additional new capital investment and acquisition opportunities, the Company does not currently pay a dividend. To maintain or adjust the capital structure, the Company may also repurchase existing shares, issue new shares or long-term debt, or sell assets to adjust to changes in economic conditions and the risk characteristic of the underlying assets (refer to note 14 to the Company’s stock buyback program.) | |
|
|
|
| There were no changes to the Company’s approach to capital management during the period. Neither the Company nor any of its subsidiaries is subject to externally imposed capital requirements. | |
86
|
OPTIMAL GROUP INC. |
Notes to Consolidated Financial Statements, Continued |
|
Three-year period ended December 31, 2008 |
(expressed in thousands of U.S. dollars, except share and per share amounts) |
|
|
|
|
22. | Financial risk management: | |
|
|
|
| This note provides disclosures relating to the nature and extent of the Company’s exposure arising from financial instruments, including interest rate risk, foreign currency risk, credit risk and liquidity risk and how the Company currently manages these risks. Risk management strategies are likely to evolve in response to future conditions and circumstances, including the effects and consequences resulting from the current economic downturn. These future strategies may not fully insulate the Company in the near term from adverse effects, the more significant of which relate to liquidity and capital resources as well as exposure to credit losses. | |
|
|
|
| (a) | Interest rate risk: |
|
|
|
|
| Interest rate risk is the risk that the fair value or future cash flows of a financial instrument will fluctuate because of changes in market interest rates. |
|
|
|
|
| Short-term investments consist of short-term notes invested at fixed interest rates. The risk that the Company will realize a loss as a result of a decline in the fair value of these investments is limited because, although available for sale, these investments are short-term and are generally held to maturity. |
|
|
|
|
| The Company is exposed primarily to interest rate fluctuations as a result of cash and bank indebtedness which bears interest at variable interest rates. A 0.5% increase in the interest rate would have decreased the net loss and comprehensive loss by $177 in the twelve-month period ended December 31, 2008. An equal but opposite effect would result assuming a 0.5% decrease in interest rates. |
|
|
|
| (b) | Foreign currency risk: |
|
|
|
|
| A significant portion of the Company’s cash flows and financial assets and liabilities are denominated in U.S. dollars, which is the Company’s functional and reporting currency. Foreign currency risk is limited to the portion of the Company’s business transactions denominated in currencies other than U.S. dollars, primarily for head office expenses in Canada and European operations. For the Company’s foreign currency transactions, fluctuations in the respective exchange rates relative to the U.S. dollar will create volatility in the Company’s cash flows and the reported amounts for revenues and selling, general and administrative expenses in its consolidated statement of operations on a period-to-period basis. Additional earnings variability arises from the translation of monetary assets and liabilities denominated in currencies other than the U.S. dollar at the rates of exchange at each balance sheet date, the impact of which is reported as a foreign exchange gain and loss which is included as part of selling, general and administrative expenses in the statement of operations and comprehensive loss. |
|
|
|
|
| The Company’s objective in managing its foreign currency risk is to minimize its net exposures to foreign currency cash flows, by transacting with third parties in U.S. dollars to the maximum extent possible and practical and holding cash and cash equivalents in U.S. dollars. The Company monitors and forecasts the values of net foreign currency cash flow and balance sheet exposures and with the aid of external consultants manages its cash flow to hold on hand sufficient levels of foreign currencies to meet its obligations. From time to time, the Company engages in the use of derivative financial instruments to manage its currency exposure. |
87
|
OPTIMAL GROUP INC. |
|
Three-year period ended December 31, 2008 |
|
|
|
|
22. | Financial risk management (continued): | |
|
| |
| (b) | Foreign currency risk (continued): |
|
|
|
|
| The following table provides an indication of the Company’s significant foreign currency exposures expressed in U.S. dollars: |
|
|
|
|
|
|
|
|
|
|
|
|
| December 31, 2008 |
| |||||||
|
| CAD |
| GBP |
| EURO |
| |||
| ||||||||||
Cash and cash equivalents |
|
| 3,325 |
|
| 85 |
|
| 1,384 |
|
Bank indebtedness |
|
| — |
|
| — |
|
| (8,275 | ) |
Accounts payable and accrued liabilities |
|
| (4,019 | ) |
| (60 | ) |
| (5,607 | ) |
Current liabilities related to discontinued operations |
|
| (64 | ) |
| (127 | ) |
| — |
|
Long-term debt |
|
| — |
|
| — |
|
| (2,162 | ) |
|
|
|
|
|
|
|
|
|
|
|
Balance sheet exposure |
|
| (758 | ) |
| (102 | ) |
| (14,660 | ) |
|
|
|
|
| In addition to the foreign currency exposures noted above, the Company also incurs a portion of its operating costs in its consumer robotic, toy and entertainment products segment, in Hong Kong dollars. However, the Company does not view its exposure to the Hong Kong dollar as a significant foreign exchange risk since the Hong Kong dollar is pegged to the U.S. dollar and historically has not fluctuated significantly. |
|
|
|
|
| The following are the exchange rates applied during the year ended December 31, 2008: |
|
|
|
|
|
|
|
|
|
|
|
|
|
| ||
|
| Average rate |
| Rate as at |
| ||
| |||||||
CAD to USD |
|
| 0.9381 |
|
| 0.8210 |
|
GBP to USD |
|
| 1.8401 |
|
| 1.4614 |
|
EUR to USD |
|
| 1.4637 |
|
| 1.3920 |
|
|
|
|
|
|
|
|
|
88
|
OPTIMAL GROUP INC. |
|
Three-year period ended December 31, 2008 |
|
|
|
|
|
22. | Financial risk management (continued): | ||
|
|
|
|
| (b) | Foreign currency risk (continued): | |
|
|
| |
|
| Based on the Company’s foreign currency exposures noted above, varying the above exchange rates to reflect a 5% weakening of the U.S. dollar would affect earnings and comprehensive earnings as follows: | |
|
|
|
|
|
|
|
|
|
|
|
|
| CAD |
| GBP |
| EURO |
| |||
|
| Year ended |
| Year ended |
| Year ended |
| |||
|
|
|
|
|
|
|
|
|
|
|
Increase in net loss |
| $ | (38 | ) | $ | (5 | ) | $ | (733 | ) |
|
|
|
|
|
| An assumed 5% strengthening of the U.S. dollar would have an equal but opposite effect on the above currencies to the amounts shown above. | |
|
|
|
|
| (c) | Credit risk: | |
|
|
| |
|
| Credit risk is the risk of an unexpected loss if a customer or counterparty to a financial instrument fails to meet its contractual obligations. Financial instruments that potentially subject the Company to concentrations of credit risk consist primarily of cash and cash equivalents, short-term investments and accounts receivable: | |
|
|
|
|
|
| (i) | Cash and cash equivalents and short-term investments: |
|
|
|
|
|
| (ii) | Accounts receivable: |
|
|
|
|
|
|
| Consumer robotic, toy and entertainment segment: |
|
|
|
|
|
|
| Credit risk for this segment arises primarily from the segment’s trade receivables. Allowances are provided for potential losses. The amounts disclosed in the balance sheet are net of these allowances for bad debts. Accounts receivable are assessed for impairment on a case-by-case basis when they are past due or when objective evidence is received that a customer will default. The Company takes into consideration the customer’s payment history, its creditworthiness and the current economic environment in which the customer operates to assess impairments. All bad debts are charged to selling, general and administrative expenses on the statement of operations and comprehensive loss. |
89
|
OPTIMAL GROUP INC. |
|
Three-year period ended December 31, 2008 |
|
|
|
|
|
22. | Financial risk management (continued): | ||
|
|
|
|
| (c) | Credit risk (continued): | |
|
|
| |
|
| (ii) | Accounts receivable (continued): |
|
|
|
|
|
|
| Consumer robotic, toy and entertainment segment (continued): |
|
|
|
|
|
|
| The credit risk for trade receivables is concentrated as the majority of sales are to a relatively small group of wholesale distributors and mass market retailers. However, the majority of these wholesale distributors and mass market retailers are large companies which have been customers of the acquired business for a number of years. Customers generally do not provide collateral in exchange for credit, but some customers provide letters of credit for purchase orders. |
|
|
|
|
|
|
| Payment processing segment: |
|
|
|
|
|
|
| Credit risk in the payment processing segment prior to the disposals noted in note 5 (b) (i) arose primarily from the following: |
|
|
|
|
|
|
| Disputes between credit card holders and merchants may arise as a result of, among other things, consumer dissatisfaction with merchandise quality or services provided by merchants. Such disputes may not be resolved in the merchant’s favour which means the transaction amount is refunded to the consumer and, in certain cases, charged to the merchant. If the merchant has insufficient funds, the Company bears the credit risk for the full amount of the transaction. Management evaluates the risk of such transactions and estimates the loss for disputed transactions based primarily on historical experience and other relevant factors. |
|
|
|
|
|
|
| The Company retains a portion of amounts owed to certain merchants (based on processing dollar volume) as reserves to help offset its exposure to chargebacks and other losses for merchant transactions that have been previously processed and on which revenues have been recorded. Management analyzes the adequacy of its reserve for merchant losses in each reporting period. The reserve for merchant losses is comprised of specifically identifiable reserves for merchant transactions for which losses can be estimated and an estimate of loss in the remaining portfolio based on experience. |
|
|
|
|
|
|
| The payment processing segment’s credit risk is also decreased because its customers consist of a diverse portfolio of small- and medium-sized merchants and because of the strong proprietary risk management expertise it has developed to help reduce the inherently higher risk associated with card-not-present transactions. |
|
|
|
|
|
|
| The maximum credit exposure to the Company is the carrying amount of financial assets plus credit risk on chargebacks, as previously explained, which are provided for separately. |
|
|
|
|
|
|
| The net charge for the provision for merchant losses for the ongoing operations of the payment processing segment is included in selling, general and administrative expenses in the statement of operations and comprehensive loss. As at December 31, 2008, the reserve for losses on merchant |
90
|
OPTIMAL GROUP INC. |
|
Three-year period ended December 31, 2008 |
|
|
|
|
|
22. | Financial risk management (continued): | ||
|
| ||
| (c) | Credit risk (continued): | |
|
|
| |
|
| (ii) | Accounts receivable (continued): |
|
|
|
|
|
|
| accounts is not considered significant and is included in “Accounts payable and accrued liabilities” on the balance sheet. |
|
|
|
|
|
|
| Included in accounts and other receivables are trade receivables in the consumer robotic, toy and entertainment segment of $22,780. The aging of the trade receivables at the reporting date was as follows: |
|
|
|
|
|
|
| December 31, |
| |
| ||||
Not past due |
| $ | 9,665 |
|
Past due 0-30 days |
|
| 5,763 |
|
Past due 31-60 days |
|
| 5,970 |
|
Past due 61-120 days |
|
| 1,382 |
|
|
|
|
|
|
Trade receivables |
| $ | 22,780 |
|
|
|
|
|
|
A breakdown of trade receivables by type of customer is presented below: |
|
|
|
|
|
|
|
|
|
|
| December 31, |
| |
|
|
|
|
|
Distributors |
| $ | 3,225 |
|
Mass-market retailers |
|
| 19,555 |
|
|
|
|
|
|
|
| $ | 22,780 |
|
|
|
|
| (d) | Liquidity risk: |
|
|
|
|
| Liquidity risk is the risk that the Company will not be able to meet its financial obligations as they fall due. The Company manages liquidity risk through the management of its capital structure and by continuously monitoring actual and projected cash flows. In recent years, the Company has financed its acquisitions through mainly internally-generated funds as well as credit facilities entered into by its Belgium and Hong Kong operations. |
|
|
|
|
| As at December 31, 2008, the Company has $39,145 of cash, cash equivalents, and short-term investments and has an outstanding balance of $11,547 on its credit facilities. |
91
|
OPTIMAL GROUP INC. |
|
Three-year period ended December 31, 2008 |
|
|
|
|
22. | Financial instruments (continued): | |
|
| |
| (d) | Liquidity risk (continued): |
|
|
|
|
| The following are the contractual maturities of financial liabilities at December 31, 2008: |
|
|
|
|
|
|
|
|
|
|
|
|
|
|
|
| Carrying |
| 0 to 12 |
| 1 to 3 |
| 4 - 5 |
| ||||
| |||||||||||||
Bank indebtedness |
| $ | 11,547 |
| $ | 11,547 |
| $ | — |
| $ | — |
|
Accounts payable and accrued liabilities |
|
|
|
|
|
|
|
|
|
|
|
|
|
(excluding current portion of long-term debt) |
|
| 37,937 |
|
| 37,937 |
|
| — |
|
| — |
|
Long-term debt |
|
| 3,015 |
|
| 1,010 |
|
| 1,918 |
|
| 87 |
|
Current liabilities related to discontinued operations |
|
| 2,984 |
|
| 2,984 |
|
| — |
|
| — |
|
|
|
|
|
|
|
|
|
|
|
|
|
|
|
Total |
| $ | 55,483 |
| $ | 53,478 |
| $ | 1,918 |
| $ | 87 |
|
|
|
|
|
| The long-term liabilities related to discontinued operations of $10,871 represent customer reserves from merchants that will only be settled upon resolution of the investigation by the U.S. Attorney’s Office. See note 16 (e). |
|
|
|
23. | Financial instruments: | |
|
|
|
| (a) | Fair values: |
|
|
|
|
| The Company has determined that the fair value of its short-term financial assets and liabilities approximates their respective fair values as at the balance sheet dates because of the short-term maturity of those instruments. The carrying value of the long-term debt also approximates its fair value. The fair value of the long-term debt is calculated using the present value of future principal payments discounted at current market rate for the remaining term to maturity. The fair values of the long-term assets and liabilities related to discontinued operations has not been determined because of the uncertainty related to the timing and resolution of the investigation by the U.S. Attorney’s office. See note 16 (e). |
92
OPTIMAL GROUP INC.
Notes to Consolidated Financial Statements, Continued
Three-year period ended December 31, 2008
(expressed in thousands of U.S. dollars, except share and per share amounts)
|
|
|
|
|
|
|
|
23. | Financial instruments (continued): | ||
|
|
|
|
| (b) | Financial income: | |
|
|
|
|
|
| The following components of income and expense relating to financial instruments are included in the statement of operations and comprehensive loss: | |
|
|
|
|
|
| (i) | Interest income: |
|
|
|
|
|
|
|
|
|
|
|
|
| 2008 |
| 2007 |
| 2006 |
| |||
|
|
|
|
|
|
|
|
|
|
|
Interest income on available-for-sale financial assets |
| $ | 1,238 |
| $ | 5,831 |
| $ | 8,388 |
|
|
|
|
|
|
|
| Interest income on available-for-sale financial assets consists of interest earned from cash and cash equivalents and short-term investments invested in short-term deposits. |
|
|
|
|
|
| (ii) | Impairment losses recognized on trade receivables in consumer robotic, toy and entertainment products segment: |
|
|
|
|
|
|
| The Company recorded a bad debt expense of $1,046 for the year ended December 31, 2008 (2007 - $80; 2006 - nil) in “Selling, general and administrative expenses” in the statement of operations and comprehensive loss. |
|
|
|
|
| (c) | Other: | |
|
|
|
|
|
| At December 31, 2008, the Company had entered into forward contracts to buy US dollars with a notional amount of $3,350 at rates ranging from 1.281 to 1.4386 US/EUR. The contracts mature at various dates to March 31, 2009. The Company has also entered into an interest rate swap contract (from variable rate receive to fixed rate pay) on a notional amount of EUR 1,000. This contract matures in March 2013. At December 31, 2008, the fair value of these contracts was not significant. No contracts were outstanding at December 31, 2007. | |
93
OPTIMAL GROUP INC.
Notes to Consolidated Financial Statements, Continued
Three-year period ended December 31, 2008
(expressed in thousands of U.S. dollars, except share and per share amounts)
|
|
|
|
| |
24. | Supplemental disclosure of cash flow and other information: | |
|
|
|
| (a) | Net change in operating assets and liabilities: |
|
|
|
|
|
|
|
|
|
|
|
|
| 2008 |
| 2007 |
| 2006 |
| |||
|
|
|
|
|
|
|
|
|
|
|
Accounts receivable |
| $ | (2,326 | ) | $ | (4,303 | ) | $ | (641 | ) |
Inventories |
|
| (9,143 | ) |
| 2,480 |
|
| — |
|
Income taxes receivable |
|
| 2,990 |
|
| 297 |
|
| — |
|
Prepaid expenses and deposits |
|
| 491 |
|
| (1,410 | ) |
| (94 | ) |
Accounts payable and accrued liabilities |
|
| (4,419 | ) |
| (4,419 | ) |
| (898 | ) |
Income taxes payable |
|
| (3,114 | ) |
| 3,866 |
|
| — |
|
|
|
|
|
|
|
|
|
|
|
|
Net change in operating assets and liabilities |
| $ | (15,521 | ) | $ | (3,489 | ) | $ | (1,633 | ) |
|
|
|
| (b) | Cash paid for interest and income taxes: |
|
|
|
|
|
|
|
|
|
|
|
|
| 2008 |
| 2007 |
| 2006 |
| |||
|
|
|
|
|
|
|
|
|
|
|
Interest |
| $ | 439 |
| $ | 12 |
| $ | — |
|
Income taxes |
|
| 450 |
|
| 859 |
|
| 5,540 |
|
|
|
|
| (c) | Non-cash transactions: |
|
|
|
|
|
|
|
|
|
|
|
|
| 2008 |
| 2007 |
| 2006 |
| |||
|
|
|
|
|
|
|
|
|
|
|
Shares and warrants issued in connection with WowWee acquisition |
| $ | — |
| $ | 12,696 |
| $ | — |
|
Additional consideration payable on Sablon acquisition |
|
| 1,674 |
|
| — |
|
| — |
|
Addition of property, equipment and intangibles included in accounts payable and accrued liabilities |
|
| 199 |
|
| — |
|
| — |
|
Adjustments to WowWee purchase price equation to goodwill |
|
| 342 |
|
| — |
|
| — |
|
|
|
|
| (d) | Cash and cash equivalents: |
|
|
|
|
|
|
|
|
|
|
|
|
| 2008 |
| 2007 |
| 2006 |
| |||
|
|
|
|
|
|
|
|
|
|
|
Cash and cash equivalents consist of: |
|
|
|
|
|
|
|
|
|
|
Cash balances with banks |
| $ | 26,925 |
| $ | 47,193 |
| $ | 59,069 |
|
Short-term investments, bearing interest at 2.57% (2006 - 5.29% to 5.32%) |
|
| 5,924 |
|
| — |
|
| 44,853 |
|
|
|
|
|
|
|
|
|
|
|
|
|
| $ | 32,849 |
| $ | 47,193 |
| $ | 103,922 |
|
|
|
|
| (e) | Foreign exchange: |
|
|
|
|
| Included in “Selling, general and administrative expenses” in the consolidated statement of operations is a foreign exchange loss of $98 in 2008 (2007 - loss of $131; 2006 - gain of $306). |
94
OPTIMAL GROUP INC.
Notes to Consolidated Financial Statements, Continued
Three-year period ended December 31, 2008
(expressed in thousands of U.S. dollars, except share and per share amounts)
|
|
|
|
|
|
|
|
25. | Canadian/U.S. reporting differences: | ||
|
|
|
|
| The consolidated financial statements of the Company are prepared in accordance with Canadian GAAP, which conform, in all material respects, with U.S. GAAP, except as described below: | ||
|
|
|
|
| (a) | Consolidated balance sheets: | |
|
|
|
|
|
| Differences between Canadian and U.S. GAAP in the presentation of share capital, additional paid-in capital and deficit are as follows: | |
|
|
|
|
|
| (i) | Share capital: |
|
|
|
|
|
|
|
|
|
| 2008 |
| 2007 |
| ||
|
|
|
|
|
|
|
|
Share capital in accordance with Canadian GAAP |
| $ | 210,032 |
| $ | 211,998 |
|
Stock-based compensation costs on options exercised: (1) |
|
|
|
|
|
|
|
Cumulative effect of prior years |
|
| 39,868 |
|
| 39,868 |
|
Change in reporting currency (2) |
|
| 2,588 |
|
| 2,588 |
|
|
|
|
|
|
|
|
|
Share capital in accordance with U.S. GAAP |
| $ | 252,488 |
| $ | 254,454 |
|
|
|
|
|
|
| (ii) | Additional paid-in capital: |
|
|
|
|
|
|
|
|
|
|
| 2008 |
|
| 2007 |
|
|
|
|
|
|
|
|
|
Additional paid-in capital in accordance with Canadian GAAP |
| $ | 34,316 |
| $ | 29,561 |
|
Stock-based compensation costs: (1) |
|
|
|
|
|
|
|
Cumulative effect of prior years |
|
| 68,757 |
|
| 68,757 |
|
Stock-based compensation costs on options exercised: (1) |
|
|
|
|
|
|
|
Cumulative effect of prior years |
|
| (39,868 | ) |
| (39,868 | ) |
Change in reporting currency (2) |
|
| 968 |
|
| 968 |
|
|
|
|
|
|
|
|
|
Additional paid-in capital in accordance with U.S. GAAP |
| $ | 64,173 |
| $ | 59,418 |
|
|
|
|
|
|
| (iii) | Deficit: |
|
|
|
|
|
|
|
|
|
|
| 2008 |
|
| 2007 |
|
|
|
|
|
|
|
|
|
Deficit in accordance with Canadian GAAP |
| $ | (152,069 | ) | $ | (41,066 | ) |
Stock-based compensation costs: (1) |
|
|
|
|
|
|
|
Cumulative effect of prior years |
|
| (68,757 | ) |
| (68,757 | ) |
Stock-based compensation to non-employees (1) |
|
| (834 | ) |
| (834 | ) |
Change in reporting currency (2) |
|
| (1,189 | ) |
| (1,189 | ) |
|
|
|
|
|
|
|
|
Deficit in accordance with U.S. GAAP |
| $ | (222,849 | ) | $ | (111,846 | ) |
95
OPTIMAL GROUP INC.
Notes to Consolidated Financial Statements, Continued
Three-year period ended December 31, 2008
(expressed in thousands of U.S. dollars, except share and per share amounts)
|
|
|
|
|
| ||
25. | Canadian/U.S. reporting differences (continued): | ||
|
|
|
|
| (a) | Consolidated Balance Sheets (continued): | |
|
|
|
|
|
| (iii) | Deficit (continued): |
|
|
|
|
|
| (1) | Stock-based compensation: |
|
|
|
|
|
|
| For U.S. GAAP purposes, the Company adopted Statement of Financial Accounting Standards (SFAS) No-123R, Share-based Payments, on January 1, 2006, which requires the expensing of all options based on the grant date fair value, over the period during which the employee is required to provide service. The Company adopted SFAS 123R using the modified prospective approach, which requires application of the standard to all awards granted, modified or cancelled after January 1, 2006 and to all awards for which the requisite service has not been rendered at such date. Previously, effective January 1, 2003, the Company adopted the fair value recognition provisions of SFAS 123. For periods after January 1, 2003, there are no differences between Canadian GAAP and U.S. GAAP. The differences relate to periods up to January 1, 2003, when the Company accounted for its stock-based compensation plans under the recognition and measurement provisions of APB No. 25, Accounting for Stock Issued to Employees, and Related Interpretations. |
|
|
|
|
|
|
| A description of the Company’s stock option plans is presented in note 15. |
|
|
|
|
|
|
| Additional disclosures required under SFAS 123R are as follows: |
|
|
|
|
|
|
|
|
|
|
|
|
| Stock |
| Terra |
| OPIL |
| |||
|
|
|
|
|
|
|
|
|
|
|
Aggregate intrinsic value: |
|
|
|
|
|
|
|
|
|
|
Options and restricted share units exercised during 2007 |
| $ | — |
| $ | 59 |
| $ | 2,625 |
|
Options and warrants outstanding and exercisable: |
|
|
|
|
|
|
|
|
|
|
December 31, 2007 |
|
| — |
|
| 91 |
|
| — |
|
December 31, 2008 |
|
| — |
|
| — |
|
| — |
|
|
|
|
|
|
|
|
|
|
|
|
|
|
|
|
|
|
| The aggregate intrinsic value for outstanding and exercisable options at December 31, 2008 and 2007 represents the pre-tax intrinsic value based on the Company’s closing stock price at these dates, which would have been received by option holders had they exercised their securities at that date. The aggregate intrinsic value of all outstanding and exercisable options was nil at December 31, 2008. No options were exercised during the year ended December 31, 2008. |
96
OPTIMAL GROUP INC.
Notes to Consolidated Financial Statements, Continued
Three-year period ended December 31, 2008
(expressed in thousands of U.S. dollars, except share and per share amounts)
|
|
|
|
|
| ||
25. | Canadian/U.S. reporting differences (continued): | ||
|
|
|
|
| (a) | Consolidated Balance Sheets (continued): | |
|
|
|
|
|
| (iii) | Deficit (continued): |
|
|
|
|
|
| (2) | Change in reporting currency: |
|
|
|
|
|
|
| In 1998, the Company adopted the U.S. dollar as its reporting currency. Under Canadian GAAP, at the time of change in reporting currency, the historical financial statements were presented using a translation of convenience. Under U.S. GAAP, the financial statements, including prior years, are translated using the current rate method. Accordingly, the cumulative translation account included as part of accumulated other comprehensive income in shareholders’ equity under Canadian GAAP does not exist for U.S. GAAP purposes. |
|
|
|
|
| (b) | Accumulated other comprehensive income (loss): | |
|
|
|
|
|
| Accumulated other comprehensive income (loss) under U.S. GAAP, which resulted solely from the translation of the financial statements up to June 30, 2000, the date the Company adopted the United States dollar as its measurement currency, in accordance with the current rate method, is $(3,018) as at December 31, 2008, 2007 and 2006. | |
|
|
|
|
| (c) | Supplementary information: | |
|
|
|
|
|
| Under U.S. GAAP, separate disclosure is required for the under mentioned item. There is no similar requirement under Canadian GAAP. | |
|
|
|
|
|
|
|
|
|
|
|
|
| 2008 |
| 2007 |
| 2006 |
| |||
|
|
|
|
|
|
|
|
|
|
|
Advertising expense |
| $ | 8,397 |
| $ | 59 |
| $ | 59 |
|
|
|
|
|
| The rollforward of valuation and qualifying accounts is as follows: |
|
|
|
|
|
|
|
|
|
|
|
|
| Balance, |
| Net |
| Balance, |
| |||
|
|
|
|
|
|
|
|
|
|
|
Allowance for doubtful accounts |
| $ | 765 |
| $ | (7 | ) | $ | 758 |
|
Inventory obsolescence |
|
| 3,827 |
|
| 1,602 |
|
| 5,429 |
|
Reserve for sales returns and allowances |
|
| 2,698 |
|
| 1,181 |
|
| 3,879 |
|
|
|
|
|
|
|
|
|
|
|
|
97
OPTIMAL GROUP INC.
Notes to Consolidated Financial Statements, Continued
Three-year period ended December 31, 2008
(expressed in thousands of U.S. dollars, except share and per share amounts)
|
|
|
|
| |
25. | Canadian/U.S. reporting differences (continued): | |
|
|
|
| (d) | FIN 48 - Accounting for tax uncertainties: |
|
|
|
|
| For U.S. GAAP purposes, the Company adopted Financial Accounting Standards Board Interpretation No. 48, Accounting for Uncertainty in Income Taxes - an Interpretation of FASB Statement No. 109 (FIN 48) on January 1, 2007. FIN 48 clarifies the accounting for income taxes recognized in a company’s financial statements in accordance with FASB statement No. 109. FIN 48 prescribes a more-likely-than-not recognition threshold for tax uncertainties. For U.S. GAAP tax purposes, unrecognized tax benefits would be classified as non-current other liabilities. The Company recognizes interest and penalties related to unrecognized tax benefits in income tax expense. At December 31, 2008 and December 31, 2007, the total liability for unrecognized tax benefits was approximately $8,500 and $14,500, respectively, of which $8,500 and $8,200, respectively, would impact the annual effective rate if realized. The decrease in the liability is principally due to reductions in reserves for tax position of prior years, net of the effect of foreign exchange fluctuations and additional interest. |
|
|
|
|
| The Company and its subsidiaries file income tax returns with federal and provincial tax authorities within Canada. The Company’s foreign affiliates file income tax returns in various jurisdictions, the most significant of which are the United States and Hong Kong. In general, the Company is subject to examination by taxing authorities for years after 2000. The Canadian tax authorities have commenced examinations of tax returns for certain Canadian subsidiaries for the taxation years 2005 to 2006. |
|
|
|
| (e) | SFAS No. 157 - Fair value measurements: |
|
|
|
|
| On January 1, 2008, the Company adopted Statement of Financial Accounting Standards (SFAS) No. 157, Fair Value Measurements. SFAS No. 157 clarifies the principle that fair value should be based on the assumptions market participants would use when pricing an asset or liability and establishes a fair value hierarchy that prioritizes the information used to develop those assumptions. Under the standard, fair value measurements would be separately disclosed by level within the fair value hierarchy. |
|
|
|
|
| Assets measured at fair value on a recurring basis: |
|
|
|
|
|
|
|
|
|
|
|
|
|
|
|
| Fair value measurements at reporting date using |
| ||||||||||
|
| December 31, |
| Quoted prices |
| Significant |
| Significant |
| ||||
|
|
|
|
|
|
|
|
|
|
|
|
|
|
Available-for-sale securities |
| $ | 6,296 |
| $ | 6,296 |
| $ | — |
| $ | — |
|
|
|
|
|
| The Company has elected to defer for one year the application of Statement No. 157 for non-financial assets and non-financial liabilities (except for items that are recognized or disclosed at fair value in the financial statements on a recurring basis). |
98
OPTIMAL GROUP INC.
Notes to Consolidated Financial Statements, Continued
Three-year period ended December 31, 2008
(expressed in thousands of U.S. dollars, except share and per share amounts)
|
|
|
|
|
|
25. | Canadian/U.S. reporting differences (continued): | |
|
|
|
| (f) | Recent accounting pronouncements: |
|
|
|
|
| SFAS No. 141R, Business Combinations: |
|
|
|
|
| In December 2007, the FASB issued a revised standard on accounting for business combinations. The major changes to accounting for business combinations include the following: all business acquisitions would be measured at fair value; the existing definition of a business would be expanded; pre-acquisition contingencies would be measured at fair value; most acquisition-related costs would be recognized as expenses as incurred (they would no longer be part of the purchase consideration); obligations for contingent consideration would be measured and recognized at fair value at the acquisition date (measurement would no longer need to wait until the contingency is settled); non-controlling interests would be measured at fair value at the date of acquisition (i.e., 100% of the assets and liabilities would be measured at fair value even when an acquisition is for less than 100%); goodwill, if any, arising on a business combination reflects the excess of the fair value of the acquiree, as a whole, over the net amount of the recognized identifiable assets acquired and liabilities assumed, and would be allocated to the acquirer and the non-controlling interest. The statement is effective for periods beginning on or after January 1, 2009. The Company will apply the standard for acquisitions occurring after this date. |
|
|
|
|
| SFAS No. 160 - Non-controlling interest in consolidated financial statements: |
|
|
|
|
| In December 2007, the FASB issued a revised standard on accounting for non-controlling interests and transactions with non-controlling interest holders in consolidated financial statements. This statement specifies that non-controlling interests are to be treated as a separate component of equity, not as a liability or other item outside of equity. Because non-controlling interests are an element of equity, increases and decreases in the parent’s ownership interest that leave control intact are accounted for as capital transactions rather than as step acquisitions or generating dilution gains or losses. The carrying amount of the non-controlling interests is adjusted to reflect the changes in ownership interests, and any difference between the amount by which the non-controlling interests are adjusted and the fair value of the consideration paid or received is recognized directly in equity attributable to the controlling interests. |
|
|
|
|
| This standard requires net income and comprehensive income to be displayed for both the controlling and the non-controlling interests. Additional required disclosures and reconciliations include a separate schedule that shows the effects of any transactions with the non-controlling interests on the equity attributable to the controlling interests. |
|
|
|
|
| The Statement is effective for periods beginning on or after December 15, 2008. SFAS No. 160 will be applied prospectively to all non-controlling interests, including any that arose before the effective date. The Company does not expect the adoption of SFAS No. 160 to materially affect its consolidated financial statements. |
99
OPTIMAL GROUP INC.
Notes to Consolidated Financial Statements, Continued
Three-year period ended December 31, 2008
(expressed in thousands of U.S. dollars, except share and per share amounts)
|
|
|
|
|
|
25. | Canadian/U.S. reporting differences (continued): | |
|
|
|
| (f) | Recent accounting pronouncements (continued): |
|
|
|
|
| SFAS No. 161 - Disclosures about derivative instruments and hedging activities, an amendment to FASB Statement No. 133: |
|
|
|
|
| In March 2008, the FASB issued the above-noted statement, which requires qualitative disclosures about objectives and strategies for using derivatives, quantitative disclosures about fair value amounts of gains and losses on derivative instruments, and disclosures about credit-risk related contingent features on derivative agreements. The statement is effective for periods beginning on or after November 15, 2008. The Company does not expect the adoption of SFAS No. 161 to materially affect its consolidated financial statements. |
|
|
|
|
| SFAS No. 162 - The hierarchy of generally accepted accounting principles and SFAS 163 - Accounting for financial guarantee insurance contracts: |
|
|
|
|
| In May 2008, the FASB issued the above-noted statements. The Company does not expect the adoption of these statements to affect its consolidated financial statements. |
|
|
|
26. | Comparative figures: | |
|
|
|
| Certain of the comparative figures have been reclassified in order to conform with the current year’s presentation. | |
|
|
|
27. | Subsequent events: | |
|
|
|
| (a) | On February 2, 2009, the Company entered an agreement with a buyer, giving the Company the right to cause the buyer to purchase, and giving the buyer the right to cause the Company to sell, a portfolio of residual payments from merchants processing credit card-present transactions. In substance, the transaction represents the sale of a portfolio of residual payments from merchants processing credit card-present transactions for a purchase price of approximately $11 million. |
|
|
|
|
| The aggregate amount of monthly residuals earned on the portfolio, net of a service fee, will be set off against and will reduce the balance of the purchase price receivable. The adjusted purchase price will be increased monthly by a notional rate of interest. The Company’s right to cause the buyer to purchase (to effectively settle the purchase price) may be exercised any time on or after February 2, 2011. The buyer’s right to cause the Company to sell the portfolio (to effectively settle the purchase price) may be exercised at any time up to December 31, 2014. Under the terms of this agreement, the Company has also received a warrant, exercisable for a nominal consideration, giving the Company the right to acquire treasury shares, representing up to 3.5% of the outstanding shares of the purchaser, if the purchase price is not settled prior to specified dates. |
100
OPTIMAL GROUP INC.
Notes to Consolidated Financial Statements, Continued
Three-year period ended December 31, 2008
(expressed in thousands of U.S. dollars, except share and per share amounts)
|
|
|
|
| |
27. | Subsequent events (continued): | |
|
|
|
| (b) | On February 4, 2009, Optimal Payments Corp., a wholly-owned subsidiary of the Company, sold a portfolio of merchant processing contracts and associated sales channel contracts for a cash consideration of approximately $1,035. |
|
|
|
| (c) | On March 13, 2009, the Board of Directors approved the cancellation of all options outstanding under the Company’s stock option plan, which comprised 1,531,000 options exercisable at $4.21 per share and 3,646,356 options exercisable at $7.10 per share. The cancellation of any outstanding options and the forfeiture of the option holder’s rights thereunder are subject to, and will be effective only once the option holder has consented to such cancellation. |
101
|
|
CHANGES IN AND DISAGREEMENTS WITH ACCOUNTANTS ON ACCOUNTING AND FINANCIAL DISCLOSURE |
We have nothing to report under this item.
|
|
CONTROLS AND PROCEDURES |
Conclusion Regarding the Effectiveness of Disclosure Controls and Procedures
Under the supervision and with the participation of our management, including our chief executive officer and chief financial officer, we conducted an evaluation of our disclosure controls and procedures, as such term is defined under Rule 13a-15(e) promulgated under the Securities Exchange Act of 1934, as amended (the Exchange Act). Based on this evaluation, our principal executive officer and our principal accounting officer concluded that our disclosure controls and procedures were effective as of the end of the period covered by this annual report.
Management’s Report on Internal Control Over Financial Reporting
Internal control over financial reporting is designed to provide reasonable assurance regarding the reliability of financial reporting and preparation of financial statements prepared for external purposes in accordance with generally accepted accounting principles. Because of its inherent limitations, internal control over financial reporting may not prevent or detect misstatements. Also, projections of any evaluation of effectiveness to future periods are subject to the risk that controls may become inadequate because of changes in conditions, or that the degree of compliance with the policies or procedures may deteriorate.
Our management is responsible for establishing and maintaining adequate internal control over financial reporting, as such term is defined in Exchange Act Rules 13a-15(f). Under the supervision and with the participation of our management, including our principal executive officer and principal accounting officer, we conducted an evaluation of the effectiveness of our internal control over financial reporting based on the framework in Internal Control - Integrated Framework issued by the Committee of Sponsoring Organizations of the Treadway Commission. Based on our evaluation under the framework in Internal Control - Integrated Framework, our management concluded that our internal control over financial reporting was effective as of December 31, 2008.
Management’s assessment of the effectiveness of our internal control over financial reporting as of December 31, 2008 excluded Sablon Distribution, which we acquired on August 29, 2008 and Think Tank Toys which we acquired on July 1, 2008. Sablon Distribution and the assets and liabilities of Think Tank Toys are wholly-owned by us and their total assets and total net sales represented 12% of our consolidated total assets and less than 10% of our consolidated net sales, respectively, as of and for the year ended December 31, 2008. Companies are allowed to exclude acquisitions from their assessment of internal control over financial reporting during the first year of an acquisition while integrating the acquired company under guidelines established by the Securities and Exchange Commission. Other than with respect to the acquisition of Sablon Distribution and Think Tank Toys, no changes in our internal control over financial reporting occurred during our last fiscal quarter that have materially affected, or are likely to materially affect, our internal control over financial reporting.
KPMG LLP (“KPMG”), an independent registered public accounting firm, has issued an attestation report on the effectiveness of internal control over financial reporting as of December 31, 2008, and their report is included herein.
|
|
OTHER INFORMATION |
We have nothing to report under this item.
102
|
|
DIRECTORS, EXECUTIVE OFFICERS AND CORPORATE GOVERNANCE |
The names, ages and positions of our directors and executive officers are as follows:
|
|
|
|
|
|
|
|
| Name |
| Age |
| Position |
|
|
|
| |||
| Neil S. Wechsler |
| 42 |
| Co-Chairman, Chief Executive Officer and Director | |
| Holden L. Ostrin |
| 49 |
| Co-Chairman and Director | |
| Gary S. Wechsler, C.A. |
| 51 |
| Treasurer and Chief Financial Officer | |
| O. Bradley McKenna, C.A |
| 59 |
| Vice-President, Administration and Human Resources | |
| Tommy Boman(1)(2)(4) |
| 70 |
| Director | |
| James S. Gertler(1)(2)(3)(4) |
| 42 |
| Director | |
| Henry M. Karp |
| 54 |
| Director | |
| Thomas D. Murphy(1)(2)(3)(4) |
| 55 |
| Director | |
| Jonathan J. Ginns(2)(3)(4) |
| 44 |
| Director | |
|
|
|
| (1) | Member of Compensation Committee |
|
|
|
| (2) | Member of the Nominating Committee |
|
|
|
| (3) | Member of Audit Committee |
|
|
|
| (4) | Independent Director |
The number of directors of our company is currently set at seven, divided into three classes. Messrs. N. Wechsler, Gertler and Murphy, as members of a single class of directors, have been elected to hold office until the close of our 2009 annual meeting of shareholders; and Messrs. Karp and Ginns, as members of a single class of directors, have been elected to hold office until the close of our 2010 annual meeting of shareholders; and Messrs. Ostrin and Boman, as members of a single class of directors, have been elected to hold office until the close of our 2011 annual meeting of shareholders
Executive officers of our company are appointed annually and serve until their successors are duly appointed and qualified.
There are no family relationships between any of our directors or executive officers, except for Neil S. Wechsler and Gary S. Wechsler, who are brothers.
The business experience of our directors and executives officers for the past five years is as follows:
Neil S. Wechsler has been a director and executive officer of our company since June 1995, and held other positions within the Company since 1994
Holden L. Ostrin has been a director and executive officer of our company since June 1996.
Gary S. Wechsler, C.A. has been the Treasurer and Chief Financial Officer of our company since May 1994.
O. Bradley McKenna, C.A. has been the Vice-President, Administration and Human Resources of our company since June 1999, and held other positions within the Company since 1994
Tommy Boman has been a director of our company since April 2004. Mr. Boman served as a director of Terra Payments Inc. from March 2003 until April 2004. Prior to 1998, Mr. Boman was Vice-Chairman of IMS International and President and Chief Executive Officer of IMS America, a market research company for the pharmaceutical and healthcare industries.
James S. Gertler has been a director of our company since November 1997. He is a managing member of Independent Outdoor Advertising, LLC, an outdoor media company in the United States and is a principal of the general partner of Signal International, an offshore rig repair, maintenance, upgrade and conversion company in the Gulf of Mexico.
Henry M. Karp has been a director of our company since June 1996. From June 1999 through December 2005, Mr. Karp was our President and Chief Operating Officer.
103
Thomas D. Murphy has been a director of our company since July 2000. Mr. Murphy is the President of Peak Tech Consulting, a firm that specializes in information technology management and related benefit realization.
Jonathan J. Ginns has been a director of our company since October 2001. Since 1996, Mr. Ginns has been Managing Partner of ACON Investments, a Washington, D.C.-based private equity investment firm.
Audit Committee Report
The following Audit Committee Report does not constitute soliciting material and should not be deemed filed or incorporated by reference into any other filing of ours under the 1933 Act or the Exchange Act, except to the extent we specifically incorporate this Report by reference therein.
In accordance with its written charter, the Audit Committee oversees our financial reporting process on behalf of our Board of Directors. Management has the primary responsibility for our consolidated financial statements and the overall reporting process, including our system of financial controls. In fulfilling its oversight responsibilities during fiscal 2008, the Audit Committee:
|
|
|
| • | discussed the quarterly and year-to-date financial information contained in each quarterly earnings announcement with senior members of our financial management and KPMG, independent auditors, prior to public release; |
|
|
|
| • | reviewed our audited consolidated financial statements as of and for the year ended December 31, 2008, as well as the quarterly unaudited consolidated financial statements and earnings release with senior members of our financial management and KPMG; |
|
|
|
| • | reviewed with our financial management and KPMG their judgments as to the quality, not just the acceptability, of our accounting principles; |
|
|
|
| • | discussed with KPMG the overall scope and plan for their audit; |
|
|
|
| • | reviewed our financial controls and financial reporting process; |
|
|
|
| • | reviewed our litigation matters; |
|
|
|
| • | reviewed significant financial reporting issues and practices, including judgmental items, change in accounting principles and disclosure practice; pre-approved all services performed by KPMG; met with KPMG, without management present, to discuss the results of their examinations, their evaluation of the effectiveness of internal control over financial reporting; and met with our financial management, without KPMG present, to discuss the quality of services provided by KPMG. |
In addition, the Audit Committee has discussed with KPMG their independence from management and our company, including the matters in the written disclosures required by PCAOB rules regarding communications with audit committees regarding independence and other required communications, and considered whether the provision of all other non-audit services provided to us by KPMG during fiscal 2008 was compatible with the auditors’ independence.
In reliance on the reviews and discussions referred to above and representations by management that the consolidated financial statements were prepared in accordance with Canadian and U.S. generally accepted accounting principles, the Audit Committee recommended to our Board of Directors that our consolidated financial statements be included in this annual report on Form 10-K for the fiscal year ended December 31, 2008 for filing with the Commission. The Audit Committee selected KPMG as our independent auditors for the fiscal year ending December 31, 2009.
|
|
| THE AUDIT COMMITTEE |
|
|
| James S. Gertler, Chairman |
| Jonathan J. Ginns |
| Thomas D. Murphy |
For more specific information concerning the role, independence and responsibilities of our Audit Committee, pleaser refer to our Audit Committee Charter included as Exhibit 99.1 to this Form 10-K.
104
Audit Committee Financial Expert
Our Board of Directors has determined that each of James S. Gertler, Chairman of the Audit Committee, and Audit Committee member Jonathan J. Ginns is an audit committee financial expert as defined by Item 407(d)(5) of Regulation S-K of the Exchange Act, is financially sophisticated for the purpose of Nasdaq Rule 4350(d)(2) and is independent within the meaning of Item 7(d)(3)(iv) of Schedule 14A of the Exchange Act.
Section 16(a) Beneficial Ownership Reporting Compliance
Section 16(a) of the Exchange Act requires our executive officers and directors, and persons who own more than 10% of a registered class of our equity securities, to file reports of ownership and changes in ownership with the Commission. Executive officers, directors and greater than 10% stockholders are required by the Exchange Act to furnish us with copies of all Section 16(a) forms they file. Based solely upon a review of the forms furnished to us, we believe that during 2008 our executive officers and directors complied with all applicable Section 16(a) filing requirements.
Complaint procedures for accounting and auditing matters
In accordance with Section 301 of the Sarbanes-Oxley Act of 2002 and Rule 10A-3 under the Exchange Act, the Nasdaq Rules prohibit the listing of any company whose audit committee does not, among other things, establish procedures for (a) the receipt, retention, and treatment of complaints received by the company regarding accounting, internal accounting controls, or auditing matters, and (b) the submission by employees of the company on a confidential and anonymous basis, of concerns regarding questionable accounting or auditing matters. Accordingly, our Audit Committee has adopted complaint procedures that are in compliance with the Nasdaq Rules.
Code of Ethics
We have adopted a code of business conduct and ethics for all directors and employees (including officers) within the meaning of the regulations adopted by the Commission under section 406 of the Sarbanes - Oxley Act of 2002. The code has been designed to deter wrongdoing and promote: honest and ethical conduct, including the ethical handling of actual or apparent conflicts of interest between personal and professional relationships; full, fair, accurate, timely, and understandable disclosure in reports and documents that we file with, or submit to, the Commission and in other public communications made by us; compliance with applicable governmental laws, rules and regulations; the prompt internal reporting of violations of the code to an appropriate person or persons; and accountability for adherence to the code. The application of the code to the persons it applies to may only be waived by our Board of Directors in accordance with Commission regulations and the Sarbanes - Oxley Act of 2002. A copy of the code is available to the general public at our website at http://www.optimalgrp.com. In addition, we will disclose on our website any amendment to the code and any waiver of the code that applies to our principal executive officer, principal financial officer, principal accounting officer or controller, or any person performing similar functions.
|
|
EXECUTIVE COMPENSATION |
COMPENSATION DISCUSSION AND ANALYSIS
Material factors underlying compensation policies and decisions:
Objectives of the compensation program
The Compensation Committee has overall responsibility with respect to approving and monitoring our executive compensation plans, policies and programs. The Committee’s objective is to promote an executive compensation program that supports our overall objective of rewarding performance thereby enhancing shareholder value. The goals of all executive compensation decision making is to:
|
|
|
| • | Offer market competitive total compensation opportunities to attract and retain talented executives. |
105
|
|
|
| • | Provide strong links between our performance and total compensation earned – i.e., pay for performance. |
|
|
|
| • | Emphasize our company’s long-term performance, thus enhancing shareholder value. |
Elements of compensation
Executive compensation consists of salary, bonus and equity-based instruments that are designed to reward behaviors consistent with each component.
|
|
|
| • | Salary decisions are made in light of market conditions to ensure that we offer compensation that allows us to retain the knowledge and leadership of our executives. The salary of our Co-Chairman and Chief Executive Officer, our Treasurer and Chief Financial Officer and our three other most highly compensated executive officers (being our Named Executive Officers) has been established by contract and is subject to increase from time to time at the discretion of the Board. |
|
|
|
| • | Bonus incentives are discretionary and are established from time to time by the Compensation Committee with Board approval. Bonus incentives that have in the past been offered have been tied directly to our financial performance as it relates to revenue growth and to qualitative metrics. Due to the weak economic environment, no bonus plan was approved for 2008 and no bonuses, discretionary or otherwise, were paid. |
|
|
|
| • | Equity-based compensation is designed to reward decision-making that leads to the performance of our share price and thus increases shareholder value. |
Management of compensation
The Compensation Committee ascribes to the following guiding principles in the management of compensation:
|
|
|
|
| 1) | Executive compensation should be designed to attract and retain the best executives for our company. | |
|
|
|
|
| 2) | To retain our best executives, we need to offer an industry competitive compensation model. | |
|
|
|
|
| 3) | Executive compensation will be evaluated along four dimensions: | |
|
|
|
|
|
| a. | Cash compensation, e.g., annual salary and bonus incentives. Bonus incentives are discretionary and are designed to reward the executive for past performance at both the individual and team level. |
|
|
|
|
|
| b. | Equity compensation, e.g., stock options as long-term incentives. These awards are inherently performance-based as the compensation element is tied to performance of our company’s stock price. |
|
|
|
|
|
| c. | Benefits and perquisites, e.g., health and life insurance. In general, the offerings should be consistent for all levels of executive management albeit the amount of the benefit may vary by individual. |
|
|
|
|
|
| d. | Severance terms, e.g., all items that are triggered by a severance event, are consistent across executives but vary by amount. These are set forth in each executive’s employment contract. |
|
|
|
|
| 4) | Compensation reviews, via either external consultants or internal analysis, should be completed in conjunction with cash compensation decision making, to ensure our model is consistent within our industry and with regulatory guidelines and trends. | |
106
Equity-based compensation
It is the Compensation Committee’s objective to provide equity-based compensation as part of the overall executive and employee compensation plan to motivate long-term decisions that positively affect our stock performance. To accomplish this, the Committee has engaged in the following actions:
|
|
|
| 1) | The Committee considers grants of options within the parameters of our stock option plan, which was adopted in February 1997 and amended twice, in April 2000 and October 2001. Our shareholders have approved the adoption of the plan and each amendment to the plan. Options may be granted for a term of up to 10 years and the Board determines the term during which such options may be exercised at the time of each grant of options. The conditions of vesting and exercise of the options are established by the Board when such options are granted including the option exercise price, which has traditionally been equal to the closing price for our stock on the date prior to the date of grant. However, under the terms of our stock option plan, the Board is permitted to grant options with a discounted exercise price provided that the discount is not greater than that permitted by law and by the regulations, rules and policies of the several securities authorities and stock exchanges or markets (including, without limitation, the Nasdaq Stock Market) to which we may then be subject. |
|
|
|
| 2) | The Committee works in conjunction with management to determine the appropriate allocation of the options across executives and employees. This grant program is then submitted to the Board for approval. |
No options were granted under our stock option plan in 2008. In June 2008, at our annual and special meeting of shareholders, our shareholders approved an amendment to certain outstanding five-year stock options granted in April 2004 at an exercise price of $7.10 per share, to defer the expiration date of the options from April 2009 to April 2014. At the time, it was considered to be in the best interests of shareholders to defer the expiration of the 2004 Options having an exercise price of $7.10 per share, rather than to allow the 2004 Options to expire and to consider a future grant of options to certain, or all, of the holders of the 2004 Options at an exercise price that might be less than $7.10 per share.
Bonus-based compensation
No bonus plan or arrangements were approved for 2008.
Material increase or decrease in compensation
There were no material increases or decreases in cash compensation paid to any of the Named Executive Officers in 2008.
Performance Graph
We have included a performance graph that compares the cumulative total shareholder return on our common shares with the Nasdaq composite Index for the five years ended December 31, 2008. The graph sets the beginning value of our common shares and the Nasdaq Composite Index at $100 and assumes that all dividends are reinvested.
Setting Executive Compensation
The Compensation Committee considers a number of factors in setting compensation levels including peer company practices, general legal and regulatory guidelines, overall industry practices and trends, specific financial performance, personal and qualitative performance, and comparisons to overall compensation of all employees.
Since no cash compensation decisions were made in 2008, no review of executive compensation was conducted in 2008.
107
COMPENSATION COMMITTEE REPORT
The Compensation Committee of our company has reviewed and discussed the Compensation Discussion and Analysis required by Item 402(b) of Regulation S-K with management and, based on such review and discussions, the Compensation Committee recommended to the Board that the Compensation Discussion and Analysis be included in the company’s proxy statement and Annual Report on Form 10-K.
|
|
| THE COMPENSATION COMMITTEE |
|
|
| Thomas D. Murphy, Chairman |
| Tommy Boman |
| James Gertler |
2008 SUMMARY COMPENSATION TABLE
|
|
|
|
|
|
|
|
|
|
|
|
|
|
|
|
|
|
|
|
|
|
|
Name and Principal |
| Year |
| Salary ($)(1) |
| Bonus |
| Stock |
| Option |
| Non- |
| Change in |
| All other |
| Total ($) |
| |||
|
|
|
|
|
|
|
|
|
| |||||||||||||
Neil S. Wechsler Co- |
| 2008 |
| 1,407,129 |
| 0 |
| 0 |
|
| 782,973 | (3) |
| 0 |
| 0 |
| 13,176 | (5)(7) |
| 2,203,279 |
|
Chairman and Chief |
| 2007 |
| 1,395,349 |
| 0 |
| 1,036,079 | (2) |
| 65,009 | (3) |
| 0 |
| 0 |
| 0 |
|
| 2,496,437 |
|
Executive Officer |
| 2006 |
| 1,322,401 |
| 410,000 |
| 272,652 |
|
| 0 |
|
| 0 |
| 0 |
| 0 |
|
| 2,005,053 |
|
Holden L. Ostrin |
| 2008 |
| 1,407,129 |
| 0 |
| 0 |
|
| 782,973 | (3) |
| 0 |
| 0 |
| 50,691 | (5)(6) |
| 2,240,793 |
|
Co-Chairman |
| 2007 |
| 1,395,349 |
| 0 |
| 1,036,079 | (2) |
| 65,009 | (3) |
| 0 |
| 0 |
| 48,885 |
|
| 2,545,322 |
|
|
| 2006 |
| 1,322,401 |
| 410,000 |
| 272,652 |
|
| 0 |
|
| 0 |
| 0 |
| 46,534 |
|
| 2,051,587 |
|
Gary S. Wechsler |
| 2008 |
| 685,976 |
| 0 |
| 0 |
|
| 370,329 | (3) |
| 0 |
| 0 |
| 0 | (4) |
| 1,056,305 |
|
Treasurer and Chief |
| 2007 |
| 680,233 |
| 0 |
| 394,697 | (2) |
| 30,337 | (3) |
| 0 |
| 0 |
| 0 |
|
| 1,105,267 |
|
Financial Officer |
| 2006 |
| 644,671 |
| 285,000 |
| 103,868 |
|
| 0 |
|
| 0 |
| 0 |
| 0 |
|
| 1,033,539 |
|
Peter Yanofsky |
|
|
|
|
|
|
|
|
|
|
|
|
|
|
|
|
|
|
|
|
|
|
President, WowWee |
|
|
|
|
|
|
|
|
|
|
|
|
|
|
|
|
|
|
|
|
|
|
USA, Inc.(8) |
| 2008 |
| 750,000 |
| 0 |
| 0 |
|
| 0 |
|
| 0 |
| 0 |
| 0 | (4) |
| 750,000 |
|
Richard Yanofsky |
|
|
|
|
|
|
|
|
|
|
|
|
|
|
|
|
|
|
|
|
|
|
President, WowWee |
|
|
|
|
|
|
|
|
|
|
|
|
|
|
|
|
|
|
|
|
|
|
Canada Inc.(8) |
| 2008 |
| 750,000 |
| 0 |
| 0 |
|
| 0 |
|
| 0 |
| 0 |
| 0 | (4) |
| 750,000 |
|
|
|
(1) | We pay salary in Canadian dollars. The average exchange rate used for 2006, 2007 and 2008 used to convert these salaries into dollars were: US$1.00=Cdn$1.1343 (2006), US$1.00=Cdn$1.0750 (2007) and US$1.00=Cdn$1.0600 (2008). |
|
|
(2) | Reflects the full amount of the previously unamortized accounting expense that was recognized for financial statement reporting purposes for 2007 in accordance with Statement of Financial Accounting Standards No. 123 (revised 2004) “Share-Based Payment” (“SFAS 123(R)”). In connection with an offer by Optimal Acquisition Inc., our subsidiary, for all the issued and outstanding shares of our then majority owned subsidiary, FireOne Group plc (based on the fair value of each FireOne share underlying the restricted share units (“RSUs”) on the date of the grant – fair value was determined to be the exercise price at the date of the grant, as the exercise price of the RSU’s was a nominal amount). As a result of that transaction, all outstanding FireOne Group plc RSUs held by our employees became vested and were paid in 2007. The actual value realized by our executives was: Mr. Neil Wechsler $409,751, Mr. Holden Ostrin $409,770 and Mr. Gary Wechsler $167,571. |
|
|
(3) | Reflects the expense recognized for financial statement reporting purposes for fiscal year 2007 and 2008 in accordance with SFAS 123(R). We determined the fair value of the options issued using the Black-Scholes option pricing model with the following assumptions: Expected volatility - 56.31%, Expected life in years - 7, Risk-free interest rate - 3.74% and Expected dividend rate - 0%. |
|
|
(4) | The dollar value of all perquisites and other personal benefits or property was less than $10,000. |
|
|
(5) | Perquisites for both the Co-Chairman and Chief Executive Officer and the Co-Chairman include the payment of life insurance premiums. See “Executive Employment and Separation Agreements.” |
|
|
(6) | The perquisites include the interest free benefit of a home loan granted in 1996 amounting to $2,782 and life insurance premiums amounting to $47,909. |
|
|
(7) | The perquisites include life insurance premiums amounting to $13,176. |
|
|
(8) | Mr. Peter Yanofsky and Mr. Richard Yanofsky were not named executive officers in 2006 and 2007; accordingly, only compensation for 2008 is shown in the Summary Compensation table. Mr. Peter Yanofsky has been the President of WowWee USA, Inc. since November 2007. Mr. Richard Yanofsky has been the President of WowWee Canada Inc. since November 2007. |
108
2008 GRANTS OF PLAN - BASED AWARDS
|
|
|
|
|
|
|
|
|
|
|
|
|
|
|
|
|
|
| All Other Stock |
| All Other Option |
| Exercise or Base |
| Grant Date |
| |||
|
|
|
|
|
|
|
| |||||||
Name |
| Grant Date(1) |
| Maximum |
|
|
|
|
|
|
|
|
|
|
|
|
|
|
|
|
|
|
|
|
|
| |||
Neil S. Wechsler |
|
|
|
|
|
|
|
|
|
|
|
|
|
|
Co-Chairman and |
|
|
|
|
|
|
|
|
|
|
|
|
|
|
Chief Executive Officer |
| 06/25/08 |
| 0 |
| 870,000 |
|
| 7.10 |
|
| 307,110 |
|
|
Holden L. Ostrin |
|
|
|
|
|
|
|
|
|
|
|
|
|
|
Co-Chairman |
| 06/25/08 |
| 0 |
| 870,000 |
|
| 7.10 |
|
| 307,110 |
|
|
Gary S. Wechsler |
|
|
|
|
|
|
|
|
|
|
|
|
|
|
Treasurer and Chief Financial Officer |
| 06/25/08 |
| 0 |
| 420,000 |
|
| 7.10 |
|
| 148,260 |
|
|
Peter Yanofsky |
|
|
|
|
|
|
|
|
|
|
|
|
|
|
President, WowWee USA, Inc. |
| — |
| 0 |
| 0 |
|
| 0 |
|
| 0 |
|
|
Richard Yanofsky |
|
|
|
|
|
|
|
|
|
|
|
|
|
|
President, WowWee Canada Inc. |
| — |
| 0 |
| 0 |
|
| 0 |
|
| 0 |
|
|
|
|
(1) | In June 2008, the shareholders approved a modification to the expiry date of 3,840,041 options with an exercise price of $7.10 per share from April 29, 2009 to April 29, 2014. Since these options were vested at the date of modification, the incremental value of $1,355,535 representing the excess of the fair value of the modified option over the value of the old option immediately before its terms were modified was expensed in 2008 for financial statement reporting purposes in accordance with SFAS 123(R). We determined the fair value of the modified options using the Black-Scholes option pricing model with the following assumptions: Expected volatility - 42.91%, Expected life in years - 6, Risk-free interest rate - 3.61% and Expected dividend rate - 0%. |
|
|
(2) | This represents the options (originally issued April 2004) that were modified (see footnote No. 1 above). No new options were issued. |
OUTSTANDING EQUITY AWARDS AT FISCAL YEAR-END – DECEMBER 31, 2008
|
|
|
|
|
|
|
|
|
|
|
|
|
|
|
|
|
|
|
|
|
|
| Option awards |
| Stock awards |
| |||||||||||||||
|
|
|
| |||||||||||||||||
Name |
| Number of |
| Number of |
| Option |
| Option expiration date |
| Number |
| Market |
| Equity |
| Equity |
| |||
|
|
|
|
|
|
|
|
| ||||||||||||
Neil S. Wechsler |
|
|
|
|
|
|
|
|
|
|
|
|
|
|
|
|
|
|
|
|
Co-Chairman and |
| 187,500 |
|
| 187,500 | (1) |
| 4.21 |
|
| November 12, 2014 |
| 0 |
| 0 |
| 0 |
| 0 |
|
Chief Executive Officer |
| 870,000 |
|
| 0 |
|
| 7.10 |
|
| April 29, 2014 |
| 0 |
| 0 |
| 0 |
| 0 |
|
Holden L. Ostrin |
| 187,500 |
|
| 187,500 | (1) |
| 4.21 |
|
| November 12, 2014 |
| 0 |
| 0 |
| 0 |
| 0 |
|
Co-Chairman |
| 870,000 |
|
| 0 |
|
| 7.10 |
|
| April 29, 2014 |
| 0 |
| 0 |
| 0 |
| 0 |
|
Gary S. Wechsler |
|
|
|
|
|
|
|
|
|
|
|
|
|
|
|
|
|
|
|
|
Treasurer and Chief |
| 87,500 |
|
| 87,500 | (1) |
| 4.21 |
|
| November 12, 2014 |
| 0 |
| 0 |
| 0 |
| 0 |
|
Financial Officer |
| 420,000 |
|
| 0 |
|
| 7.10 |
|
| April 29, 2014 |
| 0 |
| 0 |
| 0 |
| 0 |
|
Peter Yanofsky |
|
|
|
|
|
|
|
|
|
|
|
|
|
|
|
|
|
|
|
|
President |
|
|
|
|
|
|
|
|
|
|
|
|
|
|
|
|
|
|
|
|
WowWee USA, Inc. |
| 0 |
|
| 0 |
|
| 0 |
|
| — |
| 0 |
| 0 |
| 0 |
| 0 |
|
Richard Yanofsky |
|
|
|
|
|
|
|
|
|
|
|
|
|
|
|
|
|
|
|
|
President |
|
|
|
|
|
|
|
|
|
|
|
|
|
|
|
|
|
|
|
|
WowWee Canada Inc. |
| 0 |
|
| 0 |
|
| 0 |
|
| — |
| 0 |
| 0 |
| 0 |
| 0 |
|
|
|
(1) | These options will be exercisable on November 12, 2009. |
109
OPTION EXERCISES AND STOCK VESTED DURING 2008
|
|
|
|
|
|
|
|
|
|
|
| Option Awards |
| Stock Awards |
| ||||
|
|
|
| ||||||
Name |
| Number of shares |
| Value realized on |
| Number of shares |
| Value realized |
|
|
|
|
|
| |||||
Neil S. Wechsler Co-Chairman |
| 0 |
| 0 |
| 0 |
| 0 |
|
Holden L. Ostrin |
| 0 |
| 0 |
| 0 |
| 0 |
|
Gary S. Wechsler Treasurer |
| 0 |
| 0 |
| 0 |
| 0 |
|
Peter Yanofsky President |
| 0 |
| 0 |
| 0 |
| 0 |
|
Richard Yanofsky President |
| 0 |
| 0 |
| 0 |
| 0 |
|
NONQUALIFIED DEFERRED COMPENSATION FOR 2008
There was no nonqualified deferred compensation for 2008.
Executive Employment and Separation Agreements
We have entered into employment agreements with each of the Named Executive Officers.
Neil S. Wechsler
Our agreement with Mr. Wechsler was entered into on March 5, 2004. Under the terms of his agreement, Mr. Wechsler receives a minimum annual salary and is entitled to participate in any bonus plan for senior executives that might be established by our Board of Directors, and we have agreed to pay or reimburse him for the premiums for a life and disability term or whole life insurance policy with a minimum coverage of $5.0 million, in addition to any other coverage previously paid for or provided for by the company.
If we terminate Mr. Wechsler’s employment other than for cause or death or disability, or for any reason following the announcement of a change of control, or if he terminates his employment for good reason (as defined in his agreement) or for any reason following a change of control, (i) we will pay to him a lump sum amount equal to two times the sum of the highest salary and bonus paid to him during the term of his employment – as at December 31, 2008, this amount would have totaled $3,327,340, (ii) all options held by him shall become immediately exercisable and we will compensate him for the determined value of his options if he is required by the terms of our option plan to exercise his options before their expiry date due to the termination of his employment – as at December 31, 2008, the exercise price of all options was greater than the market price therefore no amount would be payable, (iii) the term insurance, for which we have been reimbursing premiums, will be converted to a level deposit premium insurance policy to age 80, for which we will pay the premiums – as at December 31, 2008, the total premium for such a policy would have amounted to $1,196,321, and (iv) we will acquire medical insurance coverage for Mr. Wechsler and his family for a period of five years, equivalent to the coverage already enjoyed by him as a senior officer of our company – as at December 31, 2008, the cost of such coverage would have been $26,010. Mr. Wechsler’s agreement also provides for the forgiveness of any indebtedness of his to the company if he leaves the employment of our company for any reason – as at December 31, 2008, Mr. Wechsler was not indebted to our company.
Mr. Wechsler’s agreement also contains a covenant on the part of Mr. Wechsler not to compete with our company for a period of 24 months following the date upon which he ceases to be an employee of our company.
110
Holden L. Ostrin
Our agreement with Mr. Ostrin was entered into on March 5, 2004. Under the terms of his agreement, Mr. Ostrin receives a minimum annual salary and is entitled to participate in any bonus plan for senior executives that might be established by our Board of Directors, and we have agreed to pay or reimburse him for the premiums for a life and disability term or whole life insurance policy with a minimum coverage of $5.0 million, in addition to any other coverage previously paid for or provided for by the company.
If we terminate Mr. Ostrin’s employment other than for cause or death or disability, or for any reason following the announcement of a change of control, or if he terminates his employment for good reason (as defined in his agreement) or for any reason following a change of control, (i) we will pay to him a lump sum amount equal to two times the sum of the highest salary and bonus paid to him during the term of his employment – as at December 31, 2008, this amount would have totaled $3,327,340, (ii) all options held by him shall become immediately exercisable and we will compensate him for the determined value of his options if he is required by the terms of our option plan to exercise his options before their expiry date due to the termination of his employment – as at December 31, 2008, the exercise price of all options was greater than the market price therefore no amount would be payable, (iii) the term insurance, for which we have been reimbursing premiums, will be converted to a level deposit premium insurance policy to age 80, for which we will pay the premiums – as at December 31, 2008, the total premium for such a policy would have amounted to $1,493,456, and (iv) we will acquire medical insurance coverage for Mr. Ostrin and his family for a period of five years, equivalent to the coverage already enjoyed by him as a senior officer of our company – as at December 31, 2008, the cost of such coverage would have been $26,010. Mr. Ostrin’s agreement also provides for the forgiveness of any indebtedness of his to the company if he leaves the employment of our company for any reason – as at December 31, 2008, Mr. Ostrin was indebted to our company in the amount of $55,665 on account of a home loan granted to him in 1996.
Mr. Ostrin’s agreement also contains a covenant on the part of Mr. Ostrin not to compete with our company for a period of 24 months following the date upon which he ceases to be an employee of our company.
Gary S. Wechsler
Our agreement with Mr. Wechsler was entered into on March 5, 2004. Under the terms of his agreement, Mr. Wechsler receives a minimum annual salary and is entitled to participate in any bonus plan for senior executives that might be established by our Board of Directors, and we have agreed to pay or reimburse him for the premiums for a life and disability term or whole life insurance policy with a minimum coverage of $3.0 million, in addition to any other coverage previously paid for or provided for by the company.
If we terminate Mr. Wechsler’s employment other than for cause or death or disability, or for any reason following the announcement of a change of control, or if he terminates his employment for good reason (as defined in his agreement) or for any reason following a change of control, (i) we will pay to him a lump sum amount equal to two times the sum of the highest salary and bonus paid to him during the term of his employment – as at December 31, 2008, this amount would have totaled $1,806,732, (ii) all options held by him shall become immediately exercisable and we will compensate him for the determined value of his options if he is required by the terms of our option plan to exercise his options before their expiry date due to the termination of his employment – as at December 31, 2008, the exercise price of all options was greater than the market price therefore no amount would be payable, and (iii) the term insurance, for which we have been reimbursing premiums, will be converted to a level deposit premium insurance policy to age 80, for which we will pay the premiums – as at December 31, 2008, the total premium for such a policy would have amounted to $966,019. Mr. Wechsler’s agreement also provides for the forgiveness of any indebtedness of his to the company if he leaves the employment of our company for any reason – as at December 31, 2008, Mr. Wechsler was not indebted to our company.
Mr. Wechsler’s agreement also contains a covenant on the part of Mr. Wechsler not to compete with our company for a period of 24 months following the date upon which he ceases to be an employee of our company.
Peter Yanofsky
Our agreement with Mr. Yanofsky was entered into on November 7, 2007. Under the terms of his agreement, Mr. Yanofsky receives a minimum annual salary and shall be entitled to participate in any bonus plan for senior executives that might be established by our Board of Directors.
111
If we terminate Mr. Yanofsky’s employment other than for cause or death or disability, or for any reason following the announcement of a change of control, or if he terminates his employment for good reason (as defined in his agreement) or for any reason following a change of control, we will pay to him a lump sum amount equal to his then current annual salary - as at December 31, 2008, this amount would have totaled $750,000.
Mr. Yanofsky’s agreement also contains a covenant on the part of Mr. Yanofsky not to compete with our company for a period of 12 months following the date upon which he ceases to be an employee of our company.
Richard Yanofsky
Our agreement with Mr. Yanofsky was entered into on November 7, 2007. Under the terms of his agreement, Mr. Yanofsky receives a minimum annual salary and shall be entitled to participate in any bonus plan for senior executives that might be established by our Board of Directors.
If we terminate Mr. Yanofsky’s employment other than for cause or death or disability, or for any reason following the announcement of a change of control, or if he terminates his employment for good reason (as defined in his agreement) or for any reason following a change of control, we will pay to him a lump sum amount equal to his then current annual salary - as at December 31, 2008, this amount would have totaled $750,000.
Mr. Yanofsky’s agreement also contains a covenant on the part of Mr. Yanofsky not to compete with our company for a period of 12 months following the date upon which he ceases to be an employee of our company.
Compensation of Directors
For 2008 each of our non-executive directors receives an annual Board retainer of $40,000 and $1,000 for each Board meeting attended. Those of our non-executive directors who serve as members of a committee of our Board of Directors receive additional compensation as follows: for service as member of either the audit committee or the compensation committee, an annual retainer of $3,000 per committee plus $1,000 for each committee meeting attended, and for service as member of the nominating committee, an annual retainer of $2,000 plus $1,000 for each committee meeting attended. In addition to their annual committee retainers, the chairmen of the audit and compensation committees each receive an annual retainer of $4,000 and the chairman of the nominating committee receives an annual retainer of $1,000. For 2009, a non-executive director who fails to attend in person at least 50% of the quarterly Board meetings shall receive an annual Board retainer of only $20,000. In addition, the four non-executive directors shall be members of the Nominating Committee and no retainer or meeting fees shall be payable to them in such capacity.
DIRECTOR COMPENSATION
|
|
|
|
|
|
|
|
|
|
|
|
|
|
|
|
|
|
|
|
|
|
|
Name |
| Year |
| Fees Earned |
| Stock |
| Option |
| Non-Equity |
| Change in |
| All Other |
| Total ($) | ||||||
Tommy Boman |
| 2008 |
| $ | 53,000 |
|
| 0 |
| $ | 57,104 |
|
| 0 |
| 0 |
| 0 |
|
| $ | 110,104 |
James S. Gertler |
| 2008 |
| $ | 62,000 |
|
| 0 |
| $ | 57,104 |
|
| 0 |
| 0 |
| 0 |
|
| $ | 119,104 |
Jonathan J. Ginns |
| 2008 |
| $ | 51,000 |
|
| 0 |
| $ | 57,104 |
|
| 0 |
| 0 |
| 0 |
|
| $ | 108,104 |
Henry M. Karp |
| 2008 |
| $ | 43,000 |
|
| 0 |
| $ | 152,276 |
|
| 0 |
| 0 |
| 0 |
|
| $ | 195,276 |
Thomas D. Murphy |
| 2008 |
| $ | 58,000 |
|
| 0 |
| $ | 57,104 |
|
| 0 |
| 0 |
| 0 |
|
| $ | 115,104 |
Sydney Sweibel (2) |
| 2008 |
| $ | 55,000 |
|
| 0 |
|
| 0 | (4) |
| 0 |
| 0 |
| 0 |
|
| $ | 55,000 |
Stephen J. Shaper (2) |
| 2008 |
|
| 0 | (3) |
| 0 |
|
| 0 | (4) |
| 0 |
| 0 |
| 209,483 | (3) |
| $ | 209,483 |
112
|
|
(1) | This reflects the expense recognized for financial statement reporting purposes for 2008 in accordance with SFAS 123(R) for grants during 2007. Each of Messrs. Boman, Gertler, Ginns, Murphy, Sweibel and Shaper received 45,000 stock options with a grant date fair value of $113,895 and Mr. Karp received 120,000 stock options with a grant date fair value of $303,720; the options were issued on November 12, 2007 and will vest in equal installments on the each of the first two anniversaries of the grant. We determined the fair value using the Black-Scholes option pricing model with the following assumptions: Expected volatility - 56.31%, Expected life in years - 7, Risk-free interest rate - 3.74% and Expected dividend rate - 0%. |
|
|
(2) | On November 5, 2008, Mr. Shaper and Mr. Sweibel resigned from the Board of Directors. |
|
|
(3) | Mr. Shaper was an employee of our company until September 30, 2008 and earned no separate director fees in 2008. His salary for the year was $9,962 and a company that he controls also provided consulting services to the company for total fees in 2008 of $199,521. |
|
|
(4) | Mr. Shaper and Mr. Sweibel’s stock options were not vested at the time of their departure and therefore no expense is recognized for 2008 in accordance with SFAS 123(R). |
Options to Purchase Securities
On February 7, 1997, our Board of Directors adopted a share option plan known as the 1997 Stock Option Plan (as amended, the “1997 Plan”).
Pursuant to the provisions of the 1997 Plan, we may grant options to purchase common shares to our full-time employees or directors. Options may be granted for a term of up to 10 years and the term during which such options may be exercised will be determined by our Board of Directors at the time of each grant of options. The conditions of vesting and exercise of the options and the option price will be established by our Board of Directors when such options are granted and the option price shall not involve a discount greater than that permitted by law and by the regulations, rules and policies of the securities regulatory authorities to which we may then be subject.
Options granted under the 1997 Plan cannot be assigned or transferred, except by will or by the laws of descent and distribution of the domicile of the deceased optionee. Upon an optionee’s employment with our company being terminated for cause or upon an optionee being removed from office as a director or becoming disqualified from being a director by law, any option or the unexercised portion thereof shall terminate forthwith. If an optionee’s employment with our company is terminated otherwise than by reason of death or termination for cause, or if any optionee ceases to be a director other than by reason of death, removal or disqualification by law, any option or the unexercised portion thereof may be exercised by the optionee for that number of shares only which he was entitled to acquire under the option at the time of such termination or cessation, provided that such option shall only be exercisable within 90 days after such termination or cessation or prior to the expiration of the term of the option, whichever occurs earlier. If an optionee dies while employed by our company or while serving as a director, any option or the unexercised portion thereof may be exercised by the person to whom the option is transferred by will or the laws of descent and distribution for that number of shares only which the optionee was entitled to acquire under the option at the time of death, provided that such option shall only be exercisable within 180 days following the date of death or prior to the expiration of the term of the option, whichever occurs earlier.
Upon its establishment, 3,000,000 common shares were authorized for issuance pursuant to options granted under the 1997 Plan. In each of 2000 and 2001, shareholders approved an additional 3,000,000 shares for issuance under the 1997 Plan. As at February 28, 2009, 3,246,028 common shares had been issued under the 1997 Plan and 5,206,464 options were outstanding under the 1997 Plan, leaving 547,508 common shares available for issuance pursuant to future option grants under the 1997 Plan.
In accordance with the terms of our January 20, 2004 combination agreement with Terra Payments, pursuant to which we acquired Terra Payments on April 6, 2004, we assumed all of the options outstanding under the Terra Payments share option plan, which now represent options to purchase common shares. As at February 28, 2009, 399,067 common shares had been issued upon the exercise of Terra Payments options and an additional 63,618 common shares underlie the outstanding balance of the Terra Payments options.
Equity Compensation Plan Information
The following table sets forth the number of common shares to be issued upon exercise of outstanding options, rights and warrants issued pursuant to our equity compensation plans, the weighted average exercise price of such options, rights and warrants and the number of common shares remaining available for future issuance under our equity compensation plans, all as at December 31, 2008.
113
Our Board of Directors has approved the cancellation of all options outstanding under our stock option plan. The cancellation of any outstanding options and the forfeiture of the option holder’s rights there under are subject to, and will become effective only once the option holder has consented to the cancellation.
|
|
|
|
|
|
|
|
|
|
|
Plan Category |
| Number of |
| Weighted- |
| Number of |
| |||
|
|
|
| |||||||
Equity compensation plans approved by security holders (1) |
| 5,471,874 |
|
| 6.24 |
|
| 282,098 |
|
|
Equity compensation plans not approved by security holders (2) |
| 134,113 |
|
| 7.43 |
|
| Nil |
|
|
Equity compensation plans not approved by security holders (2) |
| 54,384 |
|
| Cdn$10.92 |
|
| Nil |
|
|
|
|
|
|
|
|
|
|
|
|
|
Total |
| 5,660,371 |
|
| 6.29 | (3) |
| 282,098 |
|
|
|
|
|
| (1) | The 1997 Plan (referred to under “Executive Compensation – Options to Purchase Securities,” above), is our only equity compensation plan that has been approved by shareholders. |
|
|
|
| (2) | Our only equity compensation plan not approved by our shareholders is the share option plan of Terra Payments, which we assumed in accordance with the terms of our acquisition of Terra Payments on April 6, 2004. |
|
|
|
| (3) | The figure includes the weighted average exercise price of 54,384 share purchase options having a Canadian dollar exercise price which was converted at the closing rate on December 31, 2008 of US$1.00=Cdn$1.2180. |
|
|
SECURITY OWNERSHIP OF CERTAIN BENEFICIAL OWNERS AND MANAGEMENT AND RELATED STOCKHOLDER MATTERS |
The following table sets forth, as of February 28, 2009, certain information regarding the beneficial ownership of our common shares by (i) each person known to us to be a beneficial owner of more than 5% of the common shares of our company, (ii) each director and Named Executive Officer of our company and (iii) all directors and executive officers of our company as a group.
114
|
|
|
|
|
|
|
|
|
|
|
|
Name and Address of Beneficial Owner |
| Amount and Nature of |
| Percent of |
| ||||||
|
|
| |||||||||
Hans-Martin Rϋter |
|
|
| 2,381,739 | (1) |
|
|
| 9.25 | % |
|
William Blair & Company LLC |
|
|
| 1,871,648 | (2) |
|
|
| 7.27 | % |
|
Renaissance Technologies LLC |
|
|
| 1,810,300 | (3) |
|
|
| 7.03 | % |
|
River Road Asset Management, LLC |
|
|
| 1,647,030 | (4) |
|
|
| 6.40 | % |
|
Neil S. Wechsler |
|
|
| 1,203,107 | (5) |
|
|
| 4.45 | % |
|
Holden L. Ostrin |
|
|
| 1,200,357 | (5) |
|
|
| 4.44 | % |
|
Henry M. Karp |
|
|
| 1,072,857 | (6) |
|
|
| 3.99 | % |
|
Gary S. Wechsler |
|
|
| 700,357 | (7) |
|
|
| 2.67 | % |
|
Peter Yanofsky |
|
|
| 583,112 | (8) |
|
|
| 2.26 | % |
|
Richard Yanofsky |
|
|
| 583,112 | (8) |
|
|
| 2.26 | % |
|
James S. Gertler |
|
|
| 109,050 | (9) |
|
|
|
| ** |
|
Jonathan J. Ginns |
|
|
| 92,500 | (10) |
|
|
|
| ** |
|
Thomas D. Murphy |
|
|
| 81,459 | (11) |
|
|
|
| ** |
|
Tommy Boman |
|
|
| 60,672 | (12) |
|
|
|
| ** |
|
All directors and executive officers as a group |
|
|
| 4,650,859 | (13) |
|
|
| 15.63 | % |
|
|
|
|
| ** | Does not exceed one percent (1%) |
|
|
(1) | The address of this beneficial owner is Abteistrasse 25, 20149 Hamburg, Germany. According to the Schedule 13D, dated January 22, 2009, filed with the United States Securities and Exchange Commission by this beneficial owner, Hans-Martin Rüter holds sole voting power and sole dispositive power over all 2,381,739 shares. The information in this table is based exclusively on the most recent Schedule 13D filed by this beneficial owner with the United States Securities and Exchange Commission. We make no representation as to the accuracy or completeness of the information reported. |
|
|
(2) | The address of this beneficial owner is 222 West Adam Street, Chicago, IL 60606. According to the Schedule 13G/A, dated January 12, 2009, filed with the United States Securities and Exchange Commission by this beneficial owner, William Blair & Company, L.L.C. is a broker dealer and investment advisor holding sole voting and sole dispositive power over all 1,871,648 shares. The information in this table is based exclusively on the most recent Schedule 13G/A filed by this beneficial owner with the United States Securities and Exchange Commission. We make no representation as to the accuracy or completeness of the information reported. |
|
|
(3) | The address of this beneficial owner is 800 Third Avenue, New York, NY, 10022. According to the Schedule 13G/A, dated February 13, 2009, filed with the United States Securities and Exchange Commission by Renaissance Technologies LLC and James H. Simons, Renaissance Technologies LLC is an investment advisor and James H. Simons is a control person of Renaissance Technologies LLC. Each of Renaissance Technologies LLC and James H. Simons has sole voting power and sole dispositive power over 1,810,300 shares. The information in this table is based exclusively on the most recent Schedule 13G/A filed by these beneficial owners with the United States Securities and Exchange Commission. We make no representation as to the accuracy or completeness of the information reported. |
|
|
(4) | The address of this beneficial owner is 462 S. 4th Street, Suite 1600, Louisville, KY 40202. According to the Schedule 13G, dated February 17, 2009, filed with the United States Securities and Exchange Commission by this beneficial owner, River Road Asset Management, LLC is an investment advisor holding sole voting power over 1,181,250 shares and sole dispositive power over all 1,647,030 shares. The information in this table is based exclusively on the most recent Schedule 13G filed by this beneficial owner with the United States Securities and Exchange Commission. We make no representation as to the accuracy or completeness of the information reported. |
|
|
(5) | Includes 1,057,500 common shares underlying vested options. Excludes 187,500 common shares underlying unvested options. |
|
|
(6) | Includes 930,000 common shares underlying vested options. Excludes 60,000 common shares underlying unvested options. |
|
|
(7) | Includes 507,500 common shares underlying vested options. Excludes 87,500 common shares underlying unvested options. |
|
|
(8) | Includes 93,480 commons shares underlying vested warrants. Excludes 93,480 common shares underlying unvested warrants. |
|
|
(9) | Includes 108,750 common shares underlying vested options. Excludes 22,500 common shares underlying unvested options. |
|
|
(10) | Includes 92,500 common shares underlying vested options. Excludes 22,500 common shares underlying unvested options. |
|
|
(11) | Includes 76,459 common shares underlying vested options. Excludes 22,500 common shares underlying unvested options. |
|
|
(12) | Includes 57,500 common shares underlying vested options. Excludes 22,500 common shares underlying unvested options. |
|
|
(13) | Includes 4,005,209 common shares underlying vested options. Excludes 620,000 common shares underlying unvested options. |
115
|
|
CERTAIN RELATIONSHIPS AND RELATED TRANSACTIONS, AND DIRECTOR INDEPENDENCE |
Mr. Stephen Shaper provided us with consulting services and, as a result, in 2008 we incurred approximately $199,521 (2007 - $260,000) to Middlemarch Capital Corporation, a company under his control. Effective September 30, 2008, we no longer used his consulting services.
Our Board of Directors has not adopted a formal policy pertaining to the review, approval and ratification of related party transactions.
|
|
PRINCIPAL ACCOUNTING FEES AND SERVICES |
Upon the recommendation of our Audit Committee, our shareholders appointed KPMG as our independent auditors for the fiscal year ended December 31, 2008.
Fees Incurred by our Company for KPMG
The following table shows the fees paid or accrued by our company for the audit and other services provided by KPMG for fiscal 2008 and 2007(1).
|
|
|
|
|
|
|
|
|
| 2008 |
| 2007 |
| ||
|
|
| |||||
Audit Fees(2) |
| $ | 814,151 |
| $ | 984,884 |
|
Audit-Related Fees(3) |
|
| 23,964 |
|
| 48,788 |
|
Tax Fees(4) |
|
| 121,266 |
|
| 56,651 |
|
All Other Fees(5) |
|
| 65,608 |
|
| 134,219 |
|
|
| ||||||
|
|
|
|
|
|
|
|
Total |
| $ | 1,024,990 |
| $ | 1,224,542 |
|
| |||||||
|
| ||||||
|
|
|
| (1) | We pay fees to KPMG in Canadian dollars. The respective average exchange rates for 2008 and 2007 used to convert these fees into dollars were: US$1.00=Cdn$1.060 (2008) and US$1.00=Cdn$1.0750 (2007). |
|
|
|
| (2) | Audit fees represent fees for professional services provided in connection with the audit of our consolidated financial statements, the review of our quarterly financial statements and the statutory audit of various foreign subsidiaries. |
|
|
|
| (3) | Audit-related fees represent primarily fees for sundry accounting consultations. |
|
|
|
| (4) | Tax fees related to assistance in preparing corporate tax returns, claiming research and development tax credits and sundry tax consultations. |
|
|
|
| (5) | All other fees relates primarily to financial due diligence in connection with acquisitions. |
The Audit Committee has delegated to the Chairman of the Audit Committee the authority to pre-approve audit-related and non-audit services not prohibited by law to be performed by our independent auditors and associated fees up to a maximum for any one non-audit service of $50,000, provided that the Chairman shall report any decisions to pre-approve such audit-related or non-audit services and fees to the full Audit Committee at its next regular meeting. The Audit Committee has also delegated to our Chief Financial Officer the authority to pre-approve the following non-audit services to be performed by our independent auditors, provided that the Chief Financial Officer shall report any decisions to pre-approve such non-audit services and fees to the full Audit Committee at its next regular meeting: tax advisory services of up to Cdn$60,000 during each fiscal year, provided that no individual mandate is estimated by our independent auditors to cost in excess of Cdn$20,000; acquisition-related financial due diligence services of up to Cdn$150,000 during each fiscal year, provided that no individual mandate is estimated by our independent auditors to cost in excess of Cdn$25,000; and, other, general services of up to Cdn$60,000 during each fiscal year, provided that no individual mandate is estimated by our independent auditors to cost in excess of Cdn$10,000. Approximately 69% of the audit-related and non-audit services performed by our independent auditors in 2008 were approved by the Chairman of the Audit Committee or our Chief Financial Officer through the pre-approval policies.
116
|
|
EXHIBITS, FINANCIAL STATEMENT SCHEDULES. |
|
|
|
|
| |
Exhibit | Exhibit | |
| 3.1 | Certificate and Articles of Continuance (incorporated by reference to Exhibit 3.1 to the Company’s Registration Statement on Form F-1, file 333-4950, filed with the Commission on October 24, 1996) |
|
|
|
| 3.2 | By-laws (incorporated by reference to Exhibit 3.2 to the Company’s Annual Report on Form 10-K, File No. 0-28572, filed with the Commission on March 8, 1999) |
|
|
|
| 3.3 | Certificate and Articles of Amendment (incorporated by reference to Exhibit 3.3 to the Company’s Annual Report on Form 10-K for the year ended December 31, 2000, filed with the Commission on March 1, 2001) |
|
|
|
| 4 | Specimen certificate of the common shares (incorporated by reference to Exhibit 1.1 to the Company’s Registration Statement on Form 8, File No. 0-28572, filed with the Commission on July 17, 1996) |
|
|
|
| 10.1 | Employment Agreement with Leon P. Garfinkle (incorporated by reference to Exhibit 10.13 to the Company’s Annual Report on Form 10-K for the year ended December 31, 2002, filed with the Commission on March 31, 2003) |
|
|
|
| 10.2 | Employment Agreement with Neil S. Wechsler (incorporated by reference to Exhibit 10.14 to the Company’s Annual Report on Form 10-K for the year ended December 31, 2003, filed with the Commission on March 10, 2004) |
|
|
|
| 10.3 | Employment Agreement with Henry M. Karp (incorporated by reference to Exhibit 10.15 to the Company’s Annual Report on Form 10-K for the year ended December 31, 2003, filed with the Commission on March 10, 2004) |
|
|
|
| 10.4 | Employment Agreement with Holden L. Ostrin (incorporated by reference to Exhibit 10.16 to the Company’s Annual Report on Form 10-K for the year ended December 31, 2003, filed with the Commission on March 10, 2004) |
|
|
|
| 10.5 | Employment Agreement with Gary S. Wechsler (incorporated by reference to Exhibit 10.17 to the Company’s Quarterly Report on Form 10-Q for the quarterly period ended March 31, 2004, filed with the Commission on April 30, 2004) |
|
|
|
| 10.6 | Combination Agreement between Optimal Robotics Corp. and Terra Payments Inc. (incorporated by reference to Exhibit 10.18 to the Company’s Quarterly Report on Form 10-Q for the quarterly period ended March 31, 2004, filed with the Commission on April 30, 2004) |
|
|
|
| 10.7 | Asset Purchase Agreement among NCR Corporation, and certain of its affiliates, and Optimal Robotics Corp. and certain of its affiliates (incorporated by reference to Exhibit 10.19 to the Company’s Quarterly Report on Form 10-Q for the quarterly period ended March 31, 2004, filed with the Commission on April 30, 2004) |
|
|
|
| 10.8 | Asset Purchase Agreement among Fujitsu Transaction Solutions Inc., Optimal Robotics Corp. and Optimal Robotics Inc. (incorporated by reference to Exhibit 10.20 to the Company’s Quarterly Report on Form 10-Q for the quarterly period ended June 30, 2004, filed with the Commission on August 9, 2004) |
|
|
|
| 10.9 | Amendment to Asset Purchase Agreement among Fujitsu Transaction Solutions Inc., Optimal Robotics Corp. and Optimal Robotics Inc. (incorporated by reference to Exhibit 10.21 to the Company’s Quarterly Report on Form 10-Q for the quarterly period ended June 30, 2004, filed with the Commission on August 9, 2004) |
|
|
|
| 10.10 | Asset Purchase Agreement among Optimal Payments Corp. and NPS Holdings LLC, NPS Manager, Inc. and The Members of NPS Holdings LLC (incorporated by reference to Exhibit 10.22 to the Company’s Quarterly Report on Form 10-Q for the quarterly period ended September 30, 2004, filed with the Commission on November 4, 2004) |
|
|
|
| 10.11 | Purchase Agreement dated May 6, 2005 among United Bank Card, Inc. and Optimal Payments Corp. (incorporated by reference to Exhibit 2.1 to the Company’s Form 8-K, filed with the Commission on May 11, 2005) |
|
|
|
| 10.12 | Placing Agreement relating to placing of ordinary shares of FireOne Group plc dated May 27, 2005 (incorporated by reference to Exhibit 99.1 to the Company’s Form 8-K, filed with the Commission on June 2, 2005) |
|
|
|
| 10.13 | Tax Deed relating to placing of ordinary shares of FireOne Group plc dated May 27, 2005 (incorporated by reference |
117
|
|
|
|
| to Exhibit 99.2 to the Company’s Form 8-K, filed with the Commission on June 2, 2005) |
|
|
|
| 10.14 | Purchase Agreement dated October 5, 2005 among Moneris Solutions, Inc. and Optimal Payments Corp. (incorporated by reference to Exhibit 2.1 to the Company’s Form 8-K, filed with the Commission on October 11, 2005) |
|
|
|
| 10.15 | Recommended cash offer by Optimal Acquisition Inc. for FireOne Group plc (incorporated by reference to Exhibit 99 to the Company’s Form 8-K, filed with the Commission on December 18, 2006) |
|
|
|
| 10.16 | Employment Agreement with Douglas P. Lewin (incorporated by reference to Exhibit 10.16 to the Company’s Annual Report on Form 10-K for the year ended December 31, 2006, filed with the Commission on March 15, 2007) |
|
|
|
| 10.17 | Amendment to Employment Agreement with Douglas P. Lewin (incorporated by reference to Exhibit 10.17 to the Company’s Annual Report on Form 10-K for the year ended December 31, 2006, filed with the Commission on March 15, 2007) |
|
|
|
| 10.18 | Employment Agreement with Benjamin A. Dalfen (incorporated by reference to Exhibit 10.18 to the Company’s Annual Report on Form 10-K for the year ended December 31, 2006, filed with the Commission on March 15, 2007) |
|
|
|
| 10.19 | Asset Purchase Agreement dated September 26, 2007 among Optimal Group Inc., Wow Wee Limited, Wow Wee Group Company, WowWee Marketing, Inc., Power Assets Pacific Ltd., Richard Yanofsky, Peter Yanofsky, David Goldhar, and Eric Lau Tung Ching (incorporated by reference to Exhibit 2.1 to the Company’s Form 8-K, filed with the Commission on October 2, 2007) |
|
|
|
| 10.20 | Amendment dated as of November 7, 2007 to Asset Purchase Agreement dated September 26, 2007 among Optimal Group Inc., Wow Wee Limited, Wow Wee Group Company, WowWee Marketing, Inc., Power Assets Pacific Ltd., Richard Yanofsky, Peter Yanofsky, David Goldhar, and Eric Lau Tung Ching (incorporated by reference to Exhibit 2.1 to the Company’s Form 8-K, filed with the Commission on November 13, 2007) |
|
|
|
| 10.21 | Asset Purchase Agreement among Optimal Payments Inc., Optimal Payments Limited, Optimal Payments (Ireland) Limited, Optimal Payments Corp. and 7012985 Canada Inc., on its behalf and/or that of a designee, with the interventions of Card One Plus Ltd. and Optimal Group Inc., dated August 5, 2008 (incorporated by reference to Exhibit 2.1 to the Company’s Form 8-K, filed with the Commission on August 11, 2008) |
|
|
|
| 10.22 | Amendment dated as of September 30, 2008 to Asset Purchase Agreement among Optimal Payments Inc., Optimal Payments Limited, Optimal Payments (Ireland) Limited, Optimal Payments Corp. and 7012985 Canada Inc., on its behalf and/or that of a designee, with the interventions of Card One Plus Ltd. and Optimal Group Inc., dated August 5, 2008 (incorporated by reference to Exhibit 2.1 to the Company’s Form 8-K, filed with the Commission on October 7, 2008) |
|
|
|
| ||
|
|
|
| ||
|
|
|
| Certification required under Section 302 of the Sarbanes-Oxley Act of 2002. | |
|
|
|
| Certification required under Section 302 of the Sarbanes-Oxley Act of 2002. | |
|
|
|
| ||
|
|
|
| ||
|
|
|
| 99.1 | Audit Committee Charter (incorporated by reference to Exhibit 99.1 to the Company’s Annual Report on Form 10-K for the year ended December 31, 2003, filed with the Commission on March 10, 2004) |
118
SIGNATURES
Pursuant to the requirements of Section 13 or 15(d) of the Exchange Act, the registrant has duly caused this report to be signed on its behalf by the undersigned, thereunto duly authorized.
|
|
|
March 13, 2009 | Optimal Group Inc. | |
|
|
|
| By: | /s/ NEIL S. WECHSLER |
|
| |
|
| Neil S. Wechsler, Co-Chairman |
|
| and Chief Executive Officer |
|
| (Principal Executive Officer) |
|
|
|
|
|
|
| By: | /s/ GARY S. WECHSLER |
|
| |
|
| Gary S. Wechsler, Chief Financial Officer |
|
| (Principal Accounting Officer) |
Pursuant to the Exchange Act, this report has been signed below by the following persons on behalf of the registrant and in the capacities and on the dates indicated.
|
|
|
March 13, 2009 | By: | /s/ NEIL S. WECHSLER |
|
| |
|
| Neil S. Wechsler, Director |
|
|
|
March 13, 2009 | By: | /s/ HOLDEN L. OSTRIN |
|
| |
|
| Holden L. Ostrin, Director |
|
|
|
March 13, 2009 | By: | /s/ TOMMY BOMAN |
|
| |
|
| Tommy Boman, Director |
|
|
|
March 13, 2009 | By: | /s/ JAMES S. GERTLER |
|
| |
|
| James S. Gertler, Director |
|
|
|
March 13, 2009 | By: | /s/ JONATHAN J. GINNS |
|
| |
|
| Jonathan J. Ginns, Director |
|
|
|
March 13, 2009 | By: | /s/ HENRY M. KARP |
|
| |
|
| Henry M. Karp, Director |
|
|
|
March 13, 2009 | By: | /s/ THOMAS D. MURPHY |
|
| |
|
| Thomas D. Murphy, Director |
119