| | OMB APPROVAL |
| | OMB Number: | 3235-0570 |
| | Expires: | August 31, 2011 |
| UNITED STATES | Estimated average burden hours per response. . . . . . . . . . . . . . . . .18.9 |
| SECURITIES AND EXCHANGE COMMISSION | |
| Washington, D.C. 20549 | |
| | | | |
FORM N-CSR
CERTIFIED SHAREHOLDER REPORT OF REGISTERED
MANAGEMENT INVESTMENT COMPANIES
Investment Company Act file number | 811-7651 |
|
ING Variable Portfolios, Inc. |
(Exact name of registrant as specified in charter) |
|
7337 E. Doubletree Ranch Rd., Scottsdale, AZ | | 85258 |
(Address of principal executive offices) | | (Zip code) |
|
The Corporation Trust Incorporated, 300 E. Lombard Street, Baltimore, MD 21201 |
(Name and address of agent for service) |
|
Registrant’s telephone number, including area code: | 1-800-992-0180 | |
|
Date of fiscal year end: | December 31 | |
|
Date of reporting period: | January 1, 2009 to June 30, 2009 | |
| | | | | | | | | |
ITEM 1. REPORTS TO STOCKHOLDERS.
The following is a copy of the report transmitted to stockholders pursuant to Rule 30e-1 under the Act (17 CFR 270.30e-1):

Semi-Annual Report
June 30, 2009
Classes ADV, I, S and S2
ING Variable Product Funds
Domestic Equity and Income Portfolios
n ING Balanced Portfolio*
n ING Growth and Income Portfolio*
Domestic Equity Growth Portfolios
n ING Opportunistic LargeCap Growth Portfolio
n ING Small Company Portfolio*
Domestic Equity Value Portfolio
n ING Opportunistic LargeCap Portfolio (formerly, ING Opportunistic LargeCap Value Portfolio)
Fixed-Income Portfolios
n ING Intermediate Bond Portfolio*
n ING Money Market Portfolio*
Global Equity Portfolio
n ING BlackRock Science and Technology Opportunities Portfolio (formerly, ING BlackRock Global Science and Technology Portfolio)
* Prior to May 1, 2009, the Portfolio's name contained the "VP" prefix.
 E-Delivery Sign-up – details inside
This report is submitted for general information to shareholders of the ING Funds. It is not authorized for distribution to prospective shareholders unless accompanied or preceded by a prospectus which includes details regarding the funds' investment objectives, risks, charges, expenses and other information. This information should be read carefully.
MUTUAL FUNDS

TABLE OF CONTENTS
| President's Letter | | | 1 | | |
|
| Market Perspective | | | 2 | | |
|
| Shareholder Expense Examples | | | 4 | | |
|
| Statements of Assets and Liabilities | | | 6 | | |
|
| Statements of Operations | | | 10 | | |
|
| Statements of Changes in Net Assets | | | 12 | | |
|
| Financial Highlights | | | 16 | | |
|
| Notes to Financial Statements | | | 20 | | |
|
| Portfolios of Investments | | | 39 | | |
|
 Go Paperless with E-Delivery!
Sign up now for on-line prospectuses, fund reports, and proxy statements. In less than five minutes, you can help reduce paper mail and lower fund costs.
Just go to www.ingfunds.com, click on the E-Delivery icon from the home page, follow the directions and complete the quick 5 Steps to Enroll.
You will be notified by e-mail when these communications become available on the internet. Documents that are not available on the internet will continue to be sent by mail.
PROXY VOTING INFORMATION
A description of the policies and procedures that the Portfolios use to determine how to vote proxies related to portfolio securities is available: (1) without charge, upon request, by calling Shareholder Services toll-free at (800) 992-0180; (2) on the ING Funds' website at www.ingfunds.com; and (3) on the U.S. Securities and Exchange Commission's (the "SEC") website at www.sec.gov. Information regarding how the Portfolios voted proxies related to portfolio securities during the most recent 12-month period ended June 30 is available without charge on the ING Funds' website at www.ingfunds.com and on the SEC's website at www.sec.gov.
QUARTERLY PORTFOLIO HOLDINGS
The Portfolios file their complete schedule of portfolio holdings with the SEC for the first and third quarters of each fiscal year on Form N-Q. The Portfolios' Forms N-Q are available on the SEC's website at www.sec.gov. The Portfolios' Forms N-Q may be reviewed and copied at the SEC's Public Reference Room in Washington, DC, and information on the operation of the Public Reference Room may be obtained by calling (800) SEC-0330; and is available upon request from the Portfolios by calling Shareholder Services toll-free at (800) 992-0180.
PRESIDENT'S LETTER
Dear Shareholder,
As we enter the third quarter of 2009, we look forward hopefully to the end of the recession, at least in the United States. While recent economic news can best be characterized as less bad (as opposed to good), there is a chance that recovery could begin sometime in the third quarter.
Could this be the hour before the dawn? The financial markets seem to have factored in expectations of recovery, as evidenced by recent gains. The stock market, as measured by the S&P 500® Index(1), has advanced into the mid-900 range, a substantial climb from its mid-600s low in early March. The Dow Jones Industrial Average(2) recently broke through 9,000 to reach its highest level since January of this year. As investors become less risk-averse, they are shifting back into stocks.
Should you be doing the same? The answer depends on several important factors unique to your situation: your long-term investment goals, your tolerance for risk and your current portfolio allocation. If you made any changes to your portfolio allocation over the past year or so — perhaps in an effort to avoid losses during a time of high uncertainty or to feel more comfortable with your investments — your portfolio now may be out of alignment with your long-term goals. On the other hand, your current portfolio may now be better suited to your tolerance for risk. You may still want to reallocate your portfolio, but you should first rethink your goals in the context of the volatility you are willing to bear. This is particularly important in that the market may continue to experience periods of volatility as economic conditions stabilize and recover.
As always, we encourage you to discuss these matters thoroughly with your financial advisor before making any changes to your portfolio. Thank you for your continued confidence in ING Funds. We look forward to serving your investment needs in the future.
Sincerely,

Shaun Mathews
President & Chief Executive Officer
ING Funds
June 30, 2009
The views expressed in the President's Letter reflect those of the President as of the date of the letter. Any such views are subject to change at any time based upon market or other conditions and ING Funds disclaim any responsibility to update such views. These views may not be relied on as investment advice and because investment decisions for an ING Fund are based on numerous factors, may not be relied on as an indication of investment intent on behalf of any ING Fund. Reference to specific company securities should not be construed as recommendations or investment advice. Consider the fund's investment objectives, risks, and charges and expenses carefully before investing. The prospectus contains this information and other information about the fund.
International investing poses special risks including currency fluctuation, economic and political risks not found in investments that are solely domestic.
(1) The S&P 500® Index is an unmanaged index that measures the performance of securities of approximately 500 of the largest companies in the United States.
(2) The Dow Jones Industrial Average is a widely followed measurement of the stock market. The average is comprised of 30 stocks that represent leading companies in major industries.

1
MARKET PERSPECTIVE: SIX MONTHS ENDED JUNE 30, 2009
Many were hopeful as the year started that the newly elected U.S. president's promised $1 trillion stimulus package, a federal funds rate now reduced to 0%-0.25%, and record low mortgage rates would help to put a base under slumping economies and markets. But global equities in the form of the MSCI World® Index,(1) measured in local currencies, including net reinvested dividends ("MSCI" for regions discussed below), soon resumed their slide and by March 9, 2009, the index had dropped nearly 22% for the year to date, to the previous cycle lows of late 2002. Abruptly however, markets recovered, surgi ng by 34%, to record a gain of 4.8% for the six-month period ended June 30, 2009. Markets generally wavered somewhat at the end of the period, as the World Bank raised its estimate for the drop in global gross domestic product ("GDP") for 2009. In currencies, the dollar was initially strong but then fell back, gaining 0.3% on the euro, 5.7% against the yen, but losing 12.4% against the pound.
While credit markets had improved since the dark days of late 2008, most banks had tightened lending standards despite large capital infusions under the Troubled Asset Relief Program ("TARP"). The problem remained the enormous volumes of distressed loans and toxic assets of indeterminate value on bank balance sheets. The Administration soon announced a Public-Private Investment Program to buy these assets up. The Federal Reserve would also expand its purchases of agency mortgage-backed securities and buy up to $300 billion in longer dated Treasuries to push mortgage interest rates lower. Another $750 billion beyond TARP would be made available. A $75 billion plan would cut mortgage payments for struggling homeowners. Much of this was set out in the president's first budget, which projected a $1.75 trillion deficit!
While policy initiatives helped on balance, the reasons for the collective resurgence of equities after March 9, 2009 are hard to pin down. Troubled Citigroup's claim on March 10 that the year 2009 had been profitable so far was one catalyst. More generally, the economic reports from which markets seemed to be taking heart were only improving weakly and erratically. Nonetheless they were soon being referred to as "green shoots".
In housing, the Standard & Poor's ("S&P")/Case-Shiller National U.S. Home Price Index(2) of house prices in 20 cities sank a record 19% year-over-year in January. But from there the declines moderated to 18.1% in the most recent report. By the end of June 2009, sales of existing homes had risen for two months and the proportion of distressed sales was down to about one-third, from nearly half earlier in the year.
A flimsier (but welcome) green shoot emerged in the final employment report, where May payrolls fell by the smallest number in eight months, even as the rate increased to 9.4%, a 25-year record. The fall in the 2009 first quarter GDP was revised down to 5.5% annualized, having first been reported near the 2008 fourth quarter's decades high 6.3%.
Consumer demand was weak, evidenced by the largest annual drop in the consumer price index, 1.3%, since 1950. But the government's stimulus plan boosted incomes by 1.4% in May 2009, sending the savings rate to 6.9%, the most in 15 years. Still, retail sales were reported higher, the first increase in three months.
U.S. fixed income markets at first sight had an undistinguished first half. The Barclays Capital U.S. Aggregate Bond Index(3) of investment grade bonds returned 1.90%. But within this figure improved risk appetite propelled the index of investment grade corporate bonds to an 8.32% gain amid surging new issuances. Conversely, the Treasury index lost 4.30%, weighed by concerns about massive government borrowing, and the excess yield on 10-year Treasuries over 2-year issues briefly reached a record 275 basis points ("bp"). The star performers however, were high yield bonds, represented by the Barclays Capital High Yield Bond-2 % Issuer Constrained Index(4), which returned a remarkable 30.92%. By contrast, the yield on the 90-day Treasury Bills remained in the range of 6bp to 31bp throughout the period.
U.S. equities, represented by the S&P 500® Index,(5) including dividends, returned 3.2% in the first six months of 2009. As with stock markets generally, March 9, 2009, marked the low point for the index, closing at September 1996 levels. Profits for S&P 500® Index companies would be certain to suffer their eighth straight quarter of decline, but from March 9, 2009, investors only had eyes for green shoots and from there the market returned 36.9%, led by the financials component which soared 93.1%. The index broke through its 200-day moving average on June 1, 2009, but then drifted back, finally returning the last of the month's gains on June 30, 2009, as a reading of consumer confidence disappointed.
In international markets, the MSCI Japan® Index(6) rose 9.2% for the six months through June 30, 2009. The slump in exports stabilized during the period and despite two consecutive quarterly falls in GDP of 3.8%,
2
MARKET PERSPECTIVE: SIX MONTHS ENDED JUNE 30, 2009
there were hopes that stimulus packages in China and in Japan itself would speed a recovery. The MSCI Europe ex UK® Index(7) added 3.8%. Despite a bigger than expected drop in GDP of 2.5% in the first quarter and the first annual decline in consumer prices for 48 years, confidence proved resilient. The European Central Bank cut rates to 1% and finally embarked on a program to lend unlimited amounts to banks for one year at this interest rate. The MSCI UK® Index(8) lost 1.3%. The Bank of England reduced rates three times, to 0.5%, the lowest since it w as founded in 1694, as the UK suffered the largest annual fall in GDP, 4.9%, since records began in 1948.
(1) The MSCI World® Index is an unmanaged index that measures the performance of over 1,400 securities listed on exchanges in the U.S., Europe, Canada, Australia, New Zealand and the Far East.
(2) The S&P/Case-Shiller National U.S. Home Price Index tracks the value of single-family housing within the United States. The index is a composite of single-family home price indices for the nine U.S. Census divisions and is calculated quarterly.
(3) The Barclays Capital U.S. Aggregate Bond Index is an unmanaged index of publicly issued investment grade U.S. Government, mortgage-backed, asset-backed and corporate debt securities.
(4) The Barclays Capital High Yield Bond — 2% Issuer Constrained Composite Index is an unmanaged index that measures the performance of non-investment grade fixed-income securities.
(5) The S&P 500® Index is an unmanaged index tha.t measures the performance of securities of approximately 500 of the largest companies in the United States.
(6) The MSCI Japan® Index is a free float-adjusted market capitalization index that is designed to measure developed market equity performance in Japan.
(7) The MSCI Europe ex UK® Index is a free float-adjusted market capitalization index that is designed to measure developed market equity performance in Europe, excluding the UK.
(8) The MSCI UK® Index is a free float-adjusted market capitalization index that is designed to measure developed market equity performance in the UK.
Parenthesis denote a negative number.
All indices are unmanaged and investors cannot invest directly in an index.
Past performance does not guarantee future results. The performance quoted represents past performance. Investment return and principal value of an investment will fluctuate, and shares, when redeemed, may be worth more or less than their original cost. The Portfolios' performance is subject to change since the period's end and may be lower or higher than the performance data shown. Please call (800) 992-0180 or log on to www.ingfunds.com to obtain performance data current to the most recent month end.
Market Perspective reflects the views of ING's Chief Investment Risk Officer only through the end of the period, and is subject to change based on market and other conditions.
3
SHAREHOLDER EXPENSE EXAMPLES (UNAUDITED)
As a shareholder of a Portfolio, you incur two types of costs: (1) transaction costs, including redemption fees and exchange fees; and (2) ongoing costs, including management fees, distribution and/or service (12b-1) fees, and other Portfolio expenses. These Examples are intended to help you understand your ongoing costs (in dollars) of investing in a Portfolio and to compare these costs with the ongoing costs of investing in other mutual funds.
The Examples are based on an investment of $1,000 invested at the beginning of the period and held for the entire period from January 1, 2009 to June 30, 2009. The Portfolios' expenses are shown without the imposition of any charges which are, or may be, imposed under your annuity contract. Expenses would have been higher if such charges were included.
Actual Expenses
The first section of the table shown, "Actual Portfolio Return," provides information about actual account values and actual expenses. You may use the information in this section, together with the amount you invested, to estimate the expenses that you paid over the period. Simply divide your account value by $1,000 (for example, an $8,600 account value divided by $1,000 = 8.6), then multiply the result by the number in the first section under the heading entitled "Expenses Paid During the Period" to estimate the expenses you paid on your account during this period.
Hypothetical Example for Comparison Purposes
The second section of the table shown, "Hypothetical (5% return before expenses)," provides information about hypothetical account values and hypothetical expenses based on a Portfolio's actual expense ratio and an assumed rate of return of 5% per year before expenses, which is not a Portfolio's actual return. The hypothetical account values and expenses may not be used to estimate the actual ending account balance or expenses you paid for the period. You may use this information to compare the ongoing costs of investing in a Portfolio and other mutual funds. To do so, compare this 5% hypothetical example with the 5% hypothetical examples that appear in the shareholder reports of the other mutual funds.
Please note that the expenses shown in the table are meant to highlight your ongoing costs only and do not reflect any transactional costs, such as redemption fees or exchange fees. Therefore, the hypothetical lines of the table are useful in comparing ongoing costs only, and will not help you determine the relative total costs of owning different mutual funds. In addition, if these transactional costs were included, your costs would have been higher.
| | | Actual Portfolio Return | | Hypothetical (5% return before expenses) | |
| ING Balanced Portfolio | | Beginning
Account
Value
January 1,
2009 | | Ending
Account
Value
June 30,
2009 | | Annualized
Expense
Ratio | | Expenses Paid
During the
Period Ended
June 30,
2009* | | Beginning
Account
Value
January 1,
2009 | | Ending
Account
Value
June 30,
2009 | | Annualized
Expense
Ratio | | Expenses Paid
During the
Period Ended
June 30,
2009* | |
| Class ADV | | $ | 1,000.00 | | | $ | 1,022.20 | | | | 1.13 | % | | $ | 5.67 | | | $ | 1,000.00 | | | $ | 1,019.19 | | | | 1.13 | % | | $ | 5.66 | | |
| Class I | | | 1,000.00 | | | | 1,021.50 | | | | 0.63 | | | | 3.16 | | | | 1,000.00 | | | | 1,021.67 | | | | 0.63 | | | | 3.16 | | |
| Class S | | | 1,000.00 | | | | 1,020.40 | | | | 0.88 | | | | 4.41 | | | | 1,000.00 | | | | 1,020.43 | | | | 0.88 | | | | 4.41 | | |
| Class S2(1) | | | 1,000.00 | | | | 1,166.60 | | | | 1.03 | | | | 3.79 | | | | 1,000.00 | | | | 1,019.69 | | | | 1.03 | | | | 5.16 | | |
| ING Growth and Income Portfolio | |
| Class ADV | | $ | 1,000.00 | | | $ | 1,072.50 | | | | 1.11 | % | | $ | 5.70 | | | $ | 1,000.00 | | | $ | 1,019.29 | | | | 1.11 | % | | $ | 5.56 | | |
| Class I | | | 1,000.00 | | | | 1,074.80 | | | | 0.61 | | | | 3.14 | | | | 1,000.00 | | | | 1,021.77 | | | | 0.61 | | | | 3.06 | | |
| Class S | | | 1,000.00 | | | | 1,074.00 | | | | 0.86 | | | | 4.42 | | | | 1,000.00 | | | | 1,020.53 | | | | 0.86 | | | | 4.31 | | |
| Class S2(1) | | | 1,000.00 | | | | 1,271.90 | | | | 1.01 | | | | 3.90 | | | | 1,000.00 | | | | 1,019.79 | | | | 1.01 | | | | 5.06 | | |
| ING Opportunistic LargeCap Growth Portfolio | |
| Class ADV | | $ | 1,000.00 | | | $ | 1,077.90 | | | | 1.22 | % | | $ | 6.29 | | | $ | 1,000.00 | | | $ | 1,018.74 | | | | 1.22 | % | | $ | 6.11 | | |
| Class I | | | 1,000.00 | | | | 1,079.30 | | | | 0.72 | | | | 3.71 | | | | 1,000.00 | | | | 1,021.22 | | | | 0.72 | | | | 3.61 | | |
| Class S | | | 1,000.00 | | | | 1,078.20 | | | | 0.97 | | | | 5.00 | | | | 1,000.00 | | | | 1,019.98 | | | | 0.97 | | | | 4.86 | | |
* Expenses are equal to each Portfolio's respective annualized expense ratios multiplied by the average account value over the period, multiplied by 181/365 to reflect the most recent fiscal half-year.
(1) Commencement of operations was February 27, 2009. Expenses paid for the Actual Portfolio Return reflect the 124 day period ended June 30, 2009.
4
SHAREHOLDER EXPENSE EXAMPLES (UNAUDITED) (CONTINUED)
| | | Actual Portfolio Return | | Hypothetical (5% return before expenses) | |
| ING Small Company Portfolio | | Beginning
Account
Value
January 1,
2009 | | Ending
Account
Value
June 30,
2009 | | Annualized
Expense
Ratio | | Expenses Paid
During the
Period Ended
June 30,
2009* | | Beginning
Account
Value
January 1,
2009 | | Ending
Account
Value
June 30,
2009 | | Annualized
Expense
Ratio | | Expenses Paid
During the
Period Ended
June 30,
2009* | |
| Class ADV | | $ | 1,000.00 | | | $ | 1,027.00 | | | | 1.36 | % | | $ | 6.84 | | | $ | 1,000.00 | | | $ | 1,018.05 | | | | 1.36 | % | | $ | 6.80 | | |
| Class I | | | 1,000.00 | | | | 1,029.40 | | | | 0.86 | | | | 4.33 | | | | 1,000.00 | | | | 1,020.53 | | | | 0.86 | | | | 4.31 | | |
| Class S | | | 1,000.00 | | | | 1,028.90 | | | | 1.11 | | | | 5.58 | | | | 1,000.00 | | | | 1,019.29 | | | | 1.11 | | | | 5.56 | | |
| Class S2(1) | | | 1,000.00 | | | | 1,283.10 | | | | 1.26 | | | | 4.89 | | | | 1,000.00 | | | | 1,018.55 | | | | 1.26 | | | | 6.31 | | |
| ING Opportunistic LargeCap Portfolio | |
| Class ADV | | $ | 1,000.00 | | | $ | 945.90 | | | | 1.22 | % | | $ | 5.89 | | | $ | 1,000.00 | | | $ | 1,018.74 | | | | 1.22 | % | | $ | 6.11 | | |
| Class I | | | 1,000.00 | | | | 946.00 | | | | 0.72 | | | | 3.47 | | | | 1,000.00 | | | | 1,021.22 | | | | 0.72 | | | | 3.61 | | |
| Class S | | | 1,000.00 | | | | 944.90 | | | | 0.97 | | | | 4.68 | | | | 1,000.00 | | | | 1,019.98 | | | | 0.97 | | | | 4.86 | | |
| ING Intermediate Bond Portfolio | |
| Class ADV | | $ | 1,000.00 | | | $ | 1,015.30 | | | | 1.01 | % | | $ | 5.05 | | | $ | 1,000.00 | | | $ | 1,019.79 | | | | 1.01 | % | | $ | 5.06 | | |
| Class I | | | 1,000.00 | | | | 1,021.30 | | | | 0.51 | | | | 2.56 | | | | 1,000.00 | | | | 1,022.27 | | | | 0.51 | | | | 2.56 | | |
| Class S | | | 1,000.00 | | | | 1,020.60 | | | | 0.76 | | | | 3.81 | | | | 1,000.00 | | | | 1,021.03 | | | | 0.76 | | | | 3.81 | | |
| Class S2(1) | | | 1,000.00 | | | | 1,048.70 | | | | 0.91 | | | | 3.17 | | | | 1,000.00 | | | | 1,020.28 | | | | 0.91 | | | | 4.56 | | |
| ING Money Market Portfolio | |
| Class I | | $ | 1,000.00 | | | $ | 1,002.00 | | | | 0.36 | % | | $ | 1.79 | | | $ | 1,000.00 | | | $ | 1,023.01 | | | | 0.36 | % | | $ | 1.81 | | |
| ING BlackRock Science and Technology Opportunities Portfolio | |
| Class ADV | | $ | 1,000.00 | | | $ | 1,184.60 | | | | 1.56 | % | | $ | 8.45 | | | $ | 1,000.00 | | | $ | 1,017.06 | | | | 1.56 | % | | $ | 7.80 | | |
| Class I | | | 1,000.00 | | | | 1,189.00 | | | | 1.06 | | | | 5.75 | | | | 1,000.00 | | | | 1,019.54 | | | | 1.06 | | | | 5.31 | | |
| Class S | | | 1,000.00 | | | | 1,187.70 | | | | 1.31 | | | | 7.11 | | | | 1,000.00 | | | | 1,018.30 | | | | 1.31 | | | | 6.56 | | |
| Class S2(1) | | | 1,000.00 | | | | 1,282.40 | | | | 1.46 | | | | 5.66 | | | | 1,000.00 | | | | 1,017.55 | | | | 1.46 | | | | 7.30 | | |
* Expenses are equal to each Portfolio's respective annualized expense ratios multiplied by the average account value over the period, multiplied by 181/365 to reflect the most recent fiscal half-year.
(1) Commencement of operations was February 27, 2009. Expenses paid for the Actual Portfolio Return reflect the 124 day period ended June 30, 2009.
5
STATEMENTS OF ASSETS AND LIABILITIES AS OF JUNE 30, 2009 (UNAUDITED)
| | | ING
Balanced
Portfolio | | ING
Growth
and Income
Portfolio | | ING
Opportunistic
LargeCap Growth
Portfolio | | ING
Small
Company
Portfolio | |
| ASSETS: | |
| Investments in securities at value+* | | $ | 585,328,098 | | | $ | 2,003,790,848 | | | $ | 67,921,139 | | | $ | 500,370,826 | | |
| Short-term investments** | | | 48,806,335 | | | | 28,476,975 | | | | 1,798,322 | | | | 31,278,815 | | |
| Short-term investments in affiliates*** | | | 17,914,000 | | | | 35,788,000 | | | | 188,000 | | | | 2,651,000 | | |
| Cash | | | 29,980,470 | | | | 692,981 | | | | 361 | | | | 346 | | |
| Cash collateral for futures | | | 3,195,034 | | | | — | | | | — | | | | — | | |
| Foreign currencies at value**** | | | 196,427 | | | | 120,926 | | | | — | | | | — | | |
| Receivables: | |
| Investment securities sold | | | 18,803,234 | | | | — | | | | 1,474,655 | | | | 13,523,329 | | |
Investment securities sold on a delayed-delivery or
when-issued basis | | | 41,988,857 | | | | — | | | | — | | | | — | | |
| Fund shares sold | | | 84,467 | | | | 131,785 | | | | 19,678 | | | | 1,118,017 | | |
| Dividends and interest | | | 1,928,012 | | | | 2,132,439 | | | | 77,386 | | | | 620,624 | | |
| Upfront payments made on swap agreements | | | 260,842 | | | | — | | | | — | | | | — | | |
| Unrealized appreciation on swap agreements | | | 201,318 | | | | — | | | | — | | | | — | | |
| Prepaid expenses | | | 11,395 | | | | 37,386 | | | | 1,319 | | | | 8,237 | | |
| Total assets | | | 748,698,489 | | | | 2,071,171,340 | | | | 71,480,860 | | | | 549,571,194 | | |
| LIABILITIES: | |
| Payable for investment securities purchased | | | 19,273,729 | | | | 5,018,095 | | | | 1,033,039 | | | | 9,003,728 | | |
Payable for investment securities purchased on a
delayed-delivery or when-issued basis | | | 90,646,811 | | | | — | | | | — | | | | — | | |
| Payable for fund shares redeemed | | | 468,311 | | | | 1,314,063 | | | | 31,836 | | | | 234,316 | | |
| Payable upon receipt of securities loaned | | | 49,131,766 | | | | 28,561,378 | | | | 1,833,148 | | | | 31,619,673 | | |
| Payable for terminated investment contracts (Note 12) | | | 716,432 | | | | — | | | | — | | | | — | | |
| Upfront payments received on swap agreements | | | 293,772 | | | | — | | | | — | | | | — | | |
| Unrealized depreciation on swap agreements | | | 497,723 | | | | — | | | | — | | | | — | | |
| Payable to affiliates | | | 269,781 | | | | 991,676 | | | | 39,009 | | | | 355,914 | | |
| Payable for directors fees | | | 14,425 | | | | 18,449 | | | | 6,788 | | | | 1,450 | | |
| Other accrued expenses and liabilities | | | 88,416 | | | | 266,013 | | | | 33,990 | | | | 63,459 | | |
| Total liabilities | | | 161,401,166 | | | | 36,169,674 | | | | 2,977,810 | | | | 41,278,540 | | |
| NET ASSETS | | $ | 587,297,323 | | | $ | 2,035,001,666 | | | $ | 68,503,050 | | | $ | 508,292,654 | | |
| NET ASSETS WERE COMPRISED OF: | |
| Paid-in capital | | $ | 854,937,511 | | | $ | 4,634,494,770 | | | $ | 258,144,637 | | | $ | 675,074,215 | | |
| Undistributed net investment income | | | 4,475,309 | | | | 14,914,555 | | | | 204,542 | | | | 1,637,284 | | |
Accumulated net realized loss on investments, foreign
currency related transactions, futures, and swaps | | | (261,031,403 | ) | | | (2,717,496,663 | ) | | | (191,627,074 | ) | | | (161,911,042 | ) | |
Net unrealized appreciation or depreciation on
investments, foreign currency related transactions,
futures, and swaps | | | (11,084,094 | ) | | | 103,089,004 | | | | 1,780,945 | | | | (6,507,803 | ) | |
| NET ASSETS | | $ | 587,297,323 | | | $ | 2,035,001,666 | | | $ | 68,503,050 | | | $ | 508,292,654 | | |
| + Including securities loaned at value | | $ | 48,022,737 | | | $ | 27,102,777 | | | $ | 1,757,806 | | | $ | 30,577,132 | | |
| * Cost of investments in securities | | $ | 595,608,301 | | | $ | 1,900,617,561 | | | $ | 66,105,368 | | | $ | 506,537,771 | | |
| ** Cost of short-term investments | | $ | 49,131,766 | | | $ | 28,561,378 | | | $ | 1,833,148 | | | $ | 31,619,673 | | |
| *** Cost of short-term investments in affiliates | | $ | 17,914,000 | | | $ | 35,788,000 | | | $ | 188,000 | | | $ | 2,651,000 | | |
| **** Cost of foreign currencies | | $ | 164,779 | | | $ | 119,755 | | | $ | — | | | $ | — | | |
See Accompanying Notes to Financial Statements
6
STATEMENTS OF ASSETS AND LIABILITIES AS OF JUNE 30, 2009 (UNAUDITED) (CONTINUED)
| | | ING
Balanced
Portfolio | | ING
Growth
and Income
Portfolio | | ING
Opportunistic
LargeCap Growth
Portfolio | | ING
Small
Company
Portfolio | |
| Class ADV: | |
| Net assets | | $ | 611 | | | $ | 659,889 | | | $ | 647,434 | | | $ | 3,184 | | |
| Shares authorized | | | 500,000,000 | | | | unlimited | | | | 100,000,000 | | | | 100,000,000 | | |
| Par value | | $ | 0.001 | | | $ | 1.000 | | | $ | 0.001 | | | $ | 0.001 | | |
| Shares outstanding | | | 68 | | | | 40,923 | | | | 86,692 | | | | 270 | | |
| Net asset value and redemption price per share | | $ | 8.95 | | | $ | 16.13 | | | $ | 7.47 | | | $ | 11.81 | | |
| Class I: | |
| Net assets | | $ | 580,828,964 | | | $ | 1,749,938,410 | | | $ | 60,245,466 | | | $ | 455,089,322 | | |
| Shares authorized | | | 500,000,000 | | | | unlimited | | | | 100,000,000 | | | | 100,000,000 | | |
| Par value | | $ | 0.001 | | | $ | 1.000 | | | $ | 0.001 | | | $ | 0.001 | | |
| Shares outstanding | | | 65,007,808 | | | | 107,783,192 | | | | 8,074,693 | | | | 38,048,137 | | |
| Net asset value and redemption price per share | | $ | 8.93 | | | $ | 16.24 | | | $ | 7.46 | | | $ | 11.96 | | |
| Class S: | |
| Net assets | | $ | 6,464,416 | | | $ | 284,399,553 | | | $ | 7,610,150 | | | $ | 53,196,326 | | |
| Shares authorized | | | 500,000,000 | | | | unlimited | | | | 100,000,000 | | | | 100,000,000 | | |
| Par value | | $ | 0.001 | | | $ | 1.000 | | | $ | 0.001 | | | $ | 0.001 | | |
| Shares outstanding | | | 726,855 | | | | 17,657,362 | | | | 1,026,632 | | | | 4,497,760 | | |
| Net asset value and redemption price per share | | $ | 8.89 | | | $ | 16.11 | | | $ | 7.41 | | | $ | 11.83 | | |
| Class S2: | |
| Net assets | | $ | 3,332 | | | $ | 3,814 | | | | n/a | | | $ | 3,822 | | |
| Shares authorized | | | 500,000,000 | | | | unlimited | | | | n/a | | | | 100,000,000 | | |
| Par value | | $ | 0.001 | | | $ | 1.000 | | | | n/a | | | $ | 0.001 | | |
| Shares outstanding | | | 376 | | | | 236 | | | | n/a | | | | 324 | | |
| Net asset value and redemption price per share | | $ | 8.85 | | | $ | 16.14 | | | | n/a | | | $ | 11.81 | | |
See Accompanying Notes to Financial Statements
7
STATEMENTS OF ASSETS AND LIABILITIES AS OF JUNE 30, 2009 (UNAUDITED)
| | | ING
Opportunistic
LargeCap
Portfolio | | ING
Intermediate
Bond
Portfolio | | ING
Money
Market
Portfolio | | ING
BlackRock Science and
Technology Opportunities
Portfolio | |
| ASSETS: | |
| Investments in securities at value+* | | $ | 75,026,930 | | | $ | 3,121,365,722 | | | $ | — | | | $ | 214,549,077 | | |
| Short-term investments** | | | 1,103,446 | | | | 641,131,157 | | | | 927,609 | | | | 7,236,530 | | |
| Short-term investments in affiliates*** | | | 634,000 | | | | 76,799,000 | | | | — | | | | — | | |
| Short-term investments at amortized cost | | | — | | | | 189,218,692 | | | | 1,340,248,341 | | | | — | | |
| Repurchase agreement | | | — | | | | — | | | | 161,412,000 | | | | — | | |
| Cash | | | 191 | | | | 4,754,319 | | | | 2,219 | | | | 4,686,072 | | |
| Cash collateral for futures | | | — | | | | 31,258,668 | | | | — | | | | — | | |
| Foreign currencies at value**** | | | — | | | | 2,125,390 | | | | — | | | | 1,176,005 | | |
| Receivables: | |
| Investment securities sold | | | 2,203,797 | | | | 226,610,357 | | | | 95,881,450 | | | | 3,295,174 | | |
Investment securities sold on a delayed-delivery or
when-issued basis | | | — | | | | 385,456,692 | | | | — | | | | — | | |
| Fund shares sold | | | 75,359 | | | | 9,632,485 | | | | 16,502 | | | | 723 | | |
| Dividends and interest | | | 91,194 | | | | 19,603,699 | | | | 1,293,241 | | | | 38,862 | | |
Unrealized appreciation on forward foreign
currency contracts | | | — | | | | — | | | | — | | | | 2,975 | | |
| Upfront payments made on swap agreements | | | — | | | | 3,487,455 | | | | — | | | | — | | |
| Unrealized appreciation on swap agreements | | | — | | | | 2,481,358 | | | | — | | | | — | | |
| Prepaid expenses | | | 1,589 | | | | 58,138 | | | | 36,311 | | | | 2,831 | | |
| Reimbursement due from manager | | | — | | | | — | | | | — | | | | 8,391 | | |
| Total assets | | | 79,136,506 | | | | 4,713,983,132 | | | | 1,599,817,673 | | | | 230,996,640 | | |
| LIABILITIES: | |
| Payable for investment securities purchased | | | 1,824,499 | | | | 245,578,998 | | | | — | | | | 4,788,492 | | |
Payable for investment securities purchased on a
delayed-delivery or when-issued basis | | | — | | | | 1,086,283,616 | | | | — | | | | — | | |
| Payable for fund shares redeemed | | | 28 | | | | 1,538,332 | | | | 15,047,988 | | | | 821,341 | | |
| Payable upon receipt of securities loaned | | | 1,148,804 | | | | 533,761,298 | | | | 1,077,010 | | | | 7,315,890 | | |
| Payable for terminated investment contracts (Note 12) | | | — | | | | 2,597,084 | | | | — | | | | — | | |
Unrealized depreciation on forward foreign
currency contracts | | | — | | | | — | | | | — | | | | 70,251 | | |
| Upfront payments received on swap agreements | | | — | | | | 3,902,356 | | | | — | | | | — | | |
| Unrealized depreciation on swap agreements | | | — | | | | 6,401,442 | | | | — | | | | — | | |
| Payable to affiliates | | | 43,596 | | | | 1,283,071 | | | | 404,320 | | | | 208,835 | | |
| Payable for directors fees | | | 4,294 | | | | 1,760 | | | | — | | | | 874 | | |
| Payable for borrowings against line of credit | | | — | | | | 2,430,000 | | | | — | | | | — | | |
| Other accrued expenses and liabilities | | | 25,375 | | | | 144,590 | | | | 17,417 | | | | 44,265 | | |
| Total liabilities | | | 3,046,596 | | | | 1,883,922,547 | | | | 16,546,946 | | | | 13,249,948 | | |
| NET ASSETS | | $ | 76,089,910 | | | $ | 2,830,060,585 | | | $ | 1,583,270,938 | | | $ | 217,746,692 | | |
| NET ASSETS WERE COMPRISED OF: | |
| Paid-in capital | | $ | 130,390,460 | | | $ | 3,375,104,788 | | | $ | 1,584,783,463 | | | $ | 278,603,239 | | |
| Undistributed net investment income | | | 841,960 | | | | 21,783,562 | | | | 775 | | | | 465,885 | | |
Accumulated net realized loss on investments, foreign
currency related transactions, futures, and swaps | | | (55,615,531 | ) | | | (416,212,208 | ) | | | (1,363,899 | ) | | | (55,600,037 | ) | |
Net unrealized appreciation or depreciation on
investments, foreign currency related transactions,
futures, and swaps | | | 473,021 | | | | (150,615,557 | ) | | | (149,401 | ) | | | (5,722,395 | ) | |
| NET ASSETS | | $ | 76,089,910 | | | $ | 2,830,060,585 | | | $ | 1,583,270,938 | | | $ | 217,746,692 | | |
| + Including securities loaned at value | | $ | 1,108,732 | | | $ | 522,237,271 | | | $ | 1,058,427 | | | $ | 6,919,949 | | |
| * Cost of investments in securities | | $ | 74,508,551 | | | $ | 3,264,711,291 | | | $ | — | | | $ | 220,134,510 | | |
| ** Cost of short-term investments | | $ | 1,148,804 | | | $ | 642,921,804 | | | $ | 1,077,010 | | | $ | 7,315,890 | | |
| *** Cost of short-term investments in affiliates | | $ | 634,000 | | | $ | 76,799,000 | | | $ | — | | | $ | — | | |
| **** Cost of foreign currencies | | $ | — | | | $ | 1,791,710 | | | $ | — | | | $ | 1,167,250 | | |
See Accompanying Notes to Financial Statements
8
STATEMENTS OF ASSETS AND LIABILITIES AS OF JUNE 30, 2009 (UNAUDITED) (CONTINUED)
| | | ING
Opportunistic
LargeCap
Portfolio | | ING
Intermediate
Bond
Portfolio | | ING
Money
Market
Portfolio | | ING
BlackRock Science and
Technology Opportunities
Portfolio | |
| Class A: | |
| Net assets | | $ | 498 | | | $ | 839 | | | | n/a | | | $ | 3,515 | | |
| Shares authorized | | | 100,000,000 | | | | unlimited | | | | n/a | | | | 100,000,000 | | |
| Par value | | $ | 0.001 | | | $ | 1.000 | | | | n/a | | | $ | 0.001 | | |
| Shares outstanding | | | 64 | | | | 74 | | | | n/a | | | | 912 | | |
| Net asset value and redemption price per share | | $ | 7.84 | | | $ | 11.29 | | | | n/a | | | $ | 3.85 | | |
| Class I: | |
| Net assets | | $ | 65,693,243 | | | $ | 1,654,978,266 | | | $ | 1,583,270,938 | | | $ | 73,897,556 | | |
| Shares authorized | | | 100,000,000 | | | | unlimited | | | | unlimited | | | | 100,000,000 | | |
| Par value | | $ | 0.001 | | | $ | 1.000 | | | $ | 1.000 | | | $ | 0.001 | | |
| Shares outstanding | | | 8,322,637 | | | | 146,999,294 | | | | 1,579,677,662 | | | | 18,952,388 | | |
| Net asset value and redemption price per share | | $ | 7.89 | | | $ | 11.26 | | | $ | 1.00 | | | $ | 3.90 | | |
| Class S: | |
| Net assets | | $ | 10,396,169 | | | $ | 1,175,078,348 | | | | n/a | | | $ | 143,841,775 | | |
| Shares authorized | | | 100,000,000 | | | | unlimited | | | | n/a | | | | 100,000,000 | | |
| Par value | | $ | 0.001 | | | $ | 1.000 | | | | n/a | | | $ | 0.001 | | |
| Shares outstanding | | | 1,323,914 | | | | 104,955,235 | | | | n/a | | | | 37,250,477 | | |
| Net asset value and redemption price per share | | $ | 7.85 | | | $ | 11.20 | | | | n/a | | | $ | 3.86 | | |
| Class S2: | |
| Net assets | | | n/a | | | $ | 3,132 | | | | n/a | | | $ | 3,846 | | |
| Shares authorized | | | n/a | | | | unlimited | | | | n/a | | | | 100,000,000 | | |
| Par value | | | n/a | | | $ | 1.000 | | | | n/a | | | $ | 0.001 | | |
| Shares outstanding | | | n/a | | | | 278 | | | | n/a | | | | 997 | | |
| Net asset value and redemption price per share | | | n/a | | | $ | 11.26 | | | | n/a | | | $ | 3.86 | | |
See Accompanying Notes to Financial Statements
9
STATEMENTS OF OPERATIONS FOR THE SIX MONTHS ENDED JUNE 30, 2009 (UNAUDITED)
| | | ING
Balanced
Portfolio | | ING
Growth
and Income
Portfolio | | ING
Opportunistic
LargeCap Growth
Portfolio | | ING
Small
Company
Portfolio | |
| INVESTMENT INCOME: | |
| Dividends, net of foreign taxes withheld*(1) | | $ | 4,293,883 | | | $ | 20,774,124 | | | $ | 448,955 | | | $ | 3,547,859 | | |
| Interest | | | 5,251,454 | | | | 39,782 | | | | — | | | | — | | |
| Securities lending income, net | | | 120,702 | | | | 50,893 | | | | — | | | | 60,058 | | |
| Total investment income | | | 9,666,039 | | | | 20,864,799 | | | | 448,955 | | | | 3,607,917 | | |
| EXPENSES: | |
| Investment management fees | | | 1,406,130 | | | | 4,581,015 | | | | 194,189 | | | | 1,729,564 | | |
| Distribution and service fees: | | | | | | | | | | | | | | | | | |
| Class ADV | | | — | | | | 1,606 | | | | 1,446 | | | | 8 | | |
| Class S | | | 7,766 | | | | 331,328 | | | | 9,171 | | | | 57,969 | | |
| Class S2 | | | 4 | | | | 6 | | | | — | | | | 6 | | |
| Transfer agent fees | | | 739 | | | | 6,653 | | | | 319 | | | | 427 | | |
| Administrative service fees | | | 154,669 | | | | 503,898 | | | | 17,800 | | | | 126,831 | | |
| Shareholder reporting expense | | | 21,085 | | | | 79,378 | | | | 2,055 | | | | 11,540 | | |
| Registration fees | | | 293 | | | | 795 | | | | — | | | | 183 | | |
| Professional fees | | | 56,120 | | | | 116,886 | | | | 4,858 | | | | 32,960 | | |
| Custody and accounting expense | | | 70,680 | | | | 123,482 | | | | 1,073 | | | | 38,285 | | |
| Directors fees | | | 33,690 | | | | 96,873 | | | | 4,237 | | | | 21,480 | | |
| Miscellaneous expense | | | 44,479 | | | | 126,023 | | | | 7,038 | | | | 27,133 | | |
| Merger expense | | | — | | | | — | | | | 1,414 | | | | — | | |
| Interest expense | | | — | | | | 1,083 | | | | — | | | | — | | |
| Total expenses | | | 1,795,655 | | | | 5,969,026 | | | | 243,600 | | | | 2,046,386 | | |
| Net waived and reimbursed fees | | | (7,539 | ) | | | (18,782 | ) | | | (212 | ) | | | (4,734 | ) | |
| Net expenses | | | 1,788,116 | | | | 5,950,244 | | | | 243,388 | | | | 2,041,652 | | |
| Net investment income | | | 7,877,923 | | | | 14,914,555 | | | | 205,567 | | | | 1,566,265 | | |
REALIZED AND UNREALIZED GAIN (LOSS) ON
INVESTMENTS, FOREIGN CURRENCY RELATED
TRANSACTIONS, FUTURES, AND SWAPS | |
| Net realized gain (loss) on: | |
| Investments | | | (109,007,495 | ) | | | (170,570,339 | ) | | | (9,219,278 | ) | | | (87,746,890 | ) | |
| Foreign currency related transactions | | | (359,853 | ) | | | (5,113 | ) | | | — | | | | — | | |
| Futures | | | 1,371,241 | | | | 1,637,534 | | | | — | | | | — | | |
| Swaps | | | 2,844,583 | | | | — | | | | — | | | | — | | |
Net realized loss on investments, foreign currency
related transactions, futures, and swaps | | | (105,151,524 | ) | | | (168,937,918 | ) | | | (9,219,278 | ) | | | (87,746,890 | ) | |
Net change in unrealized appreciation
or depreciation on: | |
| Investments | | | 112,574,076 | | | | 295,611,061 | | | | 13,978,982 | | | | 109,508,803 | | |
| Foreign currency related transactions | | | 194,261 | | | | (16,514 | ) | | | — | | | | — | | |
| Futures | | | 247,401 | | | | (24,446 | ) | | | — | | | | — | | |
| Swaps | | | (3,923,387 | ) | | | — | | | | — | | | | — | | |
Net change in unrealized appreciation or
depreciation on investments, foreign currency
related transactions, futures, and swaps | | | 109,092,351 | | | | 295,570,101 | | | | 13,978,982 | | | | 109,508,803 | | |
Net realized and unrealized gain on investments,
foreign currency related transactions, futures,
and swaps | | | 3,940,827 | | | | 126,632,183 | | | | 4,759,704 | | | | 21,761,913 | | |
| Increase in net assets resulting from operations | | $ | 11,818,750 | | | $ | 141,546,738 | | | $ | 4,965,271 | | | $ | 23,328,178 | | |
| * Foreign taxes withheld | | $ | 1,105 | | | $ | 371,899 | | | $ | — | | | $ | 1,466 | | |
| (1) Dividends from affiliates | | $ | 22,928 | | | $ | 62,243 | | | $ | 990 | | | $ | 20,302 | | |
See Accompanying Notes to Financial Statements
10
STATEMENTS OF OPERATIONS FOR THE SIX MONTHS ENDED JUNE 30, 2009 (UNAUDITED)
| | | ING
Opportunistic
LargeCap
Portfolio | | ING
Intermediate
Bond
Portfolio | | ING
Money
Market
Portfolio | | ING
BlackRock Science and
Technology Opportunities
Portfolio | |
| INVESTMENT INCOME: | |
| Dividends, net of foreign taxes withheld*(1) | | $ | 1,122,174 | | | $ | 1,104,800 | | | $ | — | | | $ | 874,191 | | |
| Interest | | | — | | | | 63,199,070 | | | | 6,565,191 | | | | 7,111 | | |
| Securities lending income, net | | | 767 | | | | 1,171,669 | | | | — | | | | 18,086 | | |
| Total investment income | | | 1,122,941 | | | | 65,475,539 | | | | 6,565,191 | | | | 899,388 | | |
| EXPENSES: | |
| Investment management fees | | | 221,549 | | | | 5,567,861 | | | | 2,128,000 | | | | 810,156 | | |
| Distribution and service fees: | | | | | | | | | | | | | | | | | |
| Class ADV | | | — | | | | 4 | | | | — | | | | 8 | | |
| Class S | | | 12,722 | | | | 1,422,065 | | | | — | | | | 135,734 | | |
| Class S2 | | | — | | | | 4 | | | | — | | | | 6 | | |
| Transfer agent fees | | | 380 | | | | 6,353 | | | | 1,181 | | | | 480 | | |
| Administrative service fees | | | 20,308 | | | | 765,556 | | | | 468,151 | | | | 46,902 | | |
| Shareholder reporting expense | | | 3,160 | | | | 79,810 | | | | 80,396 | | | | 6,154 | | |
| Registration fees | | | — | | | | 957 | | | | 2,079 | | | | — | | |
| Professional fees | | | 7,277 | | | | 209,020 | | | | 144,239 | | | | 22,557 | | |
| Custody and accounting expense | | | 4,490 | | | | 179,075 | | | | 79,135 | | | | 27,693 | | |
| Directors fees | | | 2,490 | | | | 125,930 | | | | 93,742 | | | | 9,611 | | |
| Miscellaneous expense | | | 7,657 | | | | 171,057 | | | | 80,659 | | | | 16,493 | | |
| Interest expense | | | — | | | | 1,466 | | | | — | | | | — | | |
| Total expenses | | | 280,033 | | | | 8,529,158 | | | | 3,077,582 | | | | 1,075,794 | | |
| Net waived and reimbursed fees | | | (167 | ) | | | (42,973 | ) | | | — | | | | (40,194 | ) | |
| Net expenses | | | 279,866 | | | | 8,486,185 | | | | 3,077,582 | | | | 1,035,600 | | |
| Net investment income (loss) | | | 843,075 | | | | 56,989,354 | | | | 3,487,609 | | | | (136,212 | ) | |
REALIZED AND UNREALIZED GAIN (LOSS) ON
INVESTMENTS, FOREIGN CURRENCY RELATED
TRANSACTIONS, FUTURES, AND SWAPS | |
| Net realized gain (loss) on: | |
| Investments | | | (24,649,629 | ) | | | (320,171,741 | ) | | | 741,616 | | | | (18,328,430 | ) | |
| Foreign currency related transactions | | | — | | | | (6,156,406 | ) | | | — | | | | (370,249 | ) | |
| Futures | | | — | | | | 12,056,252 | | | | — | | | | — | | |
| Swaps | | | — | | | | 31,113,695 | | | | — | | | | — | | |
Net realized gain (loss) on investments, foreign
currency related transactions, futures, and swaps | | | (24,649,629 | ) | | | (283,158,200 | ) | | | 741,616 | | | | (18,698,679 | ) | |
Net change in unrealized appreciation
or depreciation on: | |
| Investments | | | 18,781,901 | | | | 304,555,766 | | | | — | | | | 49,450,443 | | |
| Foreign currency related transactions | | | — | | | | 2,639,063 | | | | — | | | | 539,610 | | |
| Futures | | | — | | | | 12,940,053 | | | | — | | | | — | | |
| Swaps | | | — | | | | (41,527,907 | ) | | | — | | | | — | | |
Net change in unrealized appreciation or
depreciation on investments foreign currency
related transactions, futures, and swaps | | | 18,781,901 | | | | 278,606,975 | | | | — | | | | 49,990,053 | | |
Net realized and unrealized gain (loss) on investments,
foreign currency related transactions, futures,
amd swaps | | | (5,867,728 | ) | | | (4,551,225 | ) | | | 741,616 | | | | 31,291,374 | | |
Increase (decrease) in net assets resulting from
operations | | $ | (5,024,653 | ) | | $ | 52,438,129 | | | $ | 4,229,225 | | | $ | 31,155,162 | | |
| * Foreign taxes withheld | | $ | 2,654 | | | $ | — | | | $ | — | | | $ | 28,275 | | |
| (1) Dividends from affiliates | | $ | 630 | | | $ | 209,959 | | | $ | — | | | $ | — | | |
See Accompanying Notes to Financial Statements
11
STATEMENTS OF CHANGES IN NET ASSETS (UNAUDITED)
| | | ING Balanced Portfolio | | ING Growth and Income Portfolio | |
| | | Six Months
Ended
June 30,
2009 | | Year
Ended
December 31,
2008 | | Six Months
Ended
June 30,
2009 | | Year
Ended
December 31,
2008 | |
| FROM OPERATIONS: | |
| Net investment income | | $ | 7,877,923 | | | $ | 25,162,629 | | | $ | 14,914,555 | | | $ | 39,466,367 | | |
Net realized loss on investments, foreign currency related
transactions, futures, swaps, and payments by affiliates | | | (105,151,524 | ) | | | (151,906,752 | ) | | | (168,937,918 | ) | | | (673,802,804 | ) | |
Net change in unrealized appreciation or depreciation on
investments, foreign currency related transactions,
futures, and swaps | | | 109,092,351 | | | | (137,938,086 | ) | | | 295,570,101 | | | | (515,276,248 | ) | |
| Increase (decrease) in net assets resulting from operations | | | 11,818,750 | | | | (264,682,209 | ) | | | 141,546,738 | | | | (1,149,612,685 | ) | |
| FROM DISTRIBUTIONS TO SHAREHOLDERS: | |
| Net investment income: | |
| Class ADV | | | (24 | ) | | | (24 | ) | | | — | | | | (11,483 | ) | |
| Class I | | | (27,220,392 | ) | | | (30,852,412 | ) | | | — | | | | (33,754,627 | ) | |
| Class S | | | (283,520 | ) | | | (281,504 | ) | | | — | | | | (5,751,055 | ) | |
| Class S2 | | | (162 | ) | | | — | | | | — | | | | — | | |
| Net realized gains: | | | | | | | | | | | | | | | | | |
| Class ADV | | | — | | | | (81 | ) | | | — | | | | — | | |
| Class I | | | — | | | | (79,796,689 | ) | | | — | | | | — | | |
| Class S | | | — | | | | (795,569 | ) | | | — | | | | — | | |
| Total distributions | | | (27,504,098 | ) | | | (111,726,279 | ) | | | — | | | | (39,517,165 | ) | |
| FROM CAPITAL SHARE TRANSACTIONS: | |
| Net proceeds from sale of shares | | | 15,136,420 | | | | 5,172,233 | | | | 127,090,772 | | | | 347,174,111 | | |
| Proceeds from shares issued in merger (Note 14) | | | — | | | | — | | | | — | | | | 353,711,801 | | |
| Reinvestment of distributions | | | 27,503,912 | | | | 111,726,174 | | | | — | | | | 39,492,686 | | |
| | | | 42,640,332 | | | | 116,898,407 | | | | 127,090,772 | | | | 740,378,598 | | |
| Cost of shares redeemed | | | (49,157,260 | ) | | | (187,770,892 | ) | | | (146,663,775 | ) | | | (460,715,815 | ) | |
Net increase (decrease) in net assets resulting from capital
share transactions | | | (6,516,928 | ) | | | (70,872,485 | ) | | | (19,573,003 | ) | | | 279,662,783 | | |
| Net increase (decrease) in net assets | | | (22,202,276 | ) | | | (447,280,973 | ) | | | 121,973,735 | | | | (909,467,067 | ) | |
| NET ASSETS: | |
| Beginning of period | | | 609,499,599 | | | | 1,056,780,572 | | | | 1,913,027,931 | | | | 2,822,494,998 | | |
| End of period | | $ | 587,297,323 | | | $ | 609,499,599 | | | $ | 2,035,001,666 | | | $ | 1,913,027,931 | | |
| Undistributed net investment income at end of period | | $ | 4,475,309 | | | $ | 24,101,484 | | | $ | 14,914,555 | | | $ | — | | |
See Accompanying Notes to Financial Statements
12
STATEMENTS OF CHANGES IN NET ASSETS (UNAUDITED)
| | | ING Opportunistic
LargeCap Growth Portfolio | | ING Small Company Portfolio | |
| | | Six Months
Ended
June 30,
2009 | | Year
Ended
December 31,
2008 | | Six Months
Ended
June 30,
2009 | | Year
Ended
December 31,
2008 | |
| FROM OPERATIONS: | |
| Net investment income | | $ | 205,567 | | | $ | 426,592 | | | $ | 1,566,265 | | | $ | 3,896,021 | | |
| Net realized loss on investments | | | (9,219,278 | ) | | | (42,958,725 | ) | | | (87,746,890 | ) | | | (73,348,618 | ) | |
Net change in unrealized appreciation or depreciation on
investments | | | 13,978,982 | | | | (18,373,805 | ) | | | 109,508,803 | | | | (127,986,885 | ) | |
| Increase (decrease) in net assets resulting from operations | | | 4,965,271 | | | | (60,905,938 | ) | | | 23,328,178 | | | | (197,439,482 | ) | |
| FROM DISTRIBUTIONS TO SHAREHOLDERS: | |
| Net investment income: | | | | | | | | | | | | | | | | | |
| Class ADV | | | — | | | | — | | | | (21 | ) | | | — | | |
| Class I | | | (404,193 | ) | | | (749,873 | ) | | | (3,140,359 | ) | | | (5,835,407 | ) | |
| Class S | | | (18,353 | ) | | | (45,652 | ) | | | (330,410 | ) | | | (24,190 | ) | |
| Class S2 | | | — | | | | — | | | | (26 | ) | | | — | | |
| Net realized gains: | | | | | | | | | | | | | | | | | |
| Class I | | | — | | | | — | | | | — | | | | (73,864,230 | ) | |
| Class S | | | — | | | | — | | | | — | | | | (384,889 | ) | |
| Total distributions | | | (422,546 | ) | | | (795,525 | ) | | | (3,470,816 | ) | | | (80,108,716 | ) | |
| FROM CAPITAL SHARE TRANSACTIONS: | |
| Net proceeds from sale of shares | | | 2,572,736 | | | | 5,106,219 | | | | 76,638,436 | | | | 213,494,928 | | |
| Reinvestment of distributions | | | 422,546 | | | | 795,525 | | | | 3,470,816 | | | | 80,108,716 | | |
| | | | 2,995,282 | | | | 5,901,744 | | | | 80,109,252 | | | | 293,603,644 | | |
| Cost of shares redeemed | | | (6,070,728 | ) | | | (36,759,935 | ) | | | (57,068,076 | ) | | | (157,042,784 | ) | |
Net increase (decrease) in net assets resulting from capital
share transactions | | | (3,075,446 | ) | | | (30,858,191 | ) | | | 23,041,176 | | | | 136,560,860 | | |
| Net increase (decrease) in net assets | | | 1,467,279 | | | | (92,559,654 | ) | | | 42,898,538 | | | | (140,987,338 | ) | |
| NET ASSETS: | |
| Beginning of period | | | 67,035,771 | | | | 159,595,425 | | | | 465,394,116 | | | | 606,381,454 | | |
| End of period | | $ | 68,503,050 | | | $ | 67,035,771 | | | $ | 508,292,654 | | | $ | 465,394,116 | | |
| Undistributed net investment income at end of period | | $ | 204,542 | | | $ | 421,521 | | | $ | 1,637,284 | | | $ | 3,541,835 | | |
See Accompanying Notes to Financial Statements
13
STATEMENTS OF CHANGES IN NET ASSETS (UNAUDITED)
| | | ING Opportunistic
LargeCap Portfolio | | ING Intermediate Bond Portfolio | |
| | | Six Months
Ended
June 30,
2009 | | Year
Ended
December 31,
2008 | | Six Months
Ended
June 30,
2009 | | Year
Ended
December 31,
2008 | |
| FROM OPERATIONS: | |
| Net investment income | | $ | 843,075 | | | $ | 2,635,604 | | | $ | 56,989,354 | | | $ | 171,309,481 | | |
Net realized loss on investments, foreign currency related
transactions, futures, swaps, and payments by affiliates | | | (24,649,629 | ) | | | (29,961,978 | ) | | | (283,158,200 | ) | | | (95,627,508 | ) | |
Net change in unrealized appreciation or depreciation on
investments, foreign currency related transactions,
futures, and swaps | | | 18,781,901 | | | | (25,565,739 | ) | | | 278,606,975 | | | | (382,926,910 | ) | |
| Increase (decrease) in net assets resulting from operations | | | (5,024,653 | ) | | | (52,892,113 | ) | | | 52,438,129 | | | | (307,244,937 | ) | |
| FROM DISTRIBUTIONS TO SHAREHOLDERS: | |
| Net investment income: | |
| Class ADV | | | (13 | ) | | | (11 | ) | | | — | | | | (47 | ) | |
| Class I | | | (2,288,544 | ) | | | (2,288,554 | ) | | | (7,992,679 | ) | | | (118,136,444 | ) | |
| Class S | | | (323,400 | ) | | | (316,610 | ) | | | (2,661,647 | ) | | | (72,938,302 | ) | |
| Class S2 | | | — | | | | — | | | | (15 | ) | | | — | | |
| Net realized gains: | | | | | | | | | | | | | | | | | |
| Class ADV | | | — | | | | (140 | ) | | | — | | | | (23 | ) | |
| Class I | | | — | | | | (17,966,905 | ) | | | — | | | | (47,870,738 | ) | |
| Class S | | | — | | | | (3,013,623 | ) | | | — | | | | (29,295,110 | ) | |
| Total distributions | | | (2,611,957 | ) | | | (23,585,843 | ) | | | (10,654,341 | ) | | | (268,240,664 | ) | |
| FROM CAPITAL SHARE TRANSACTIONS: | |
| Net proceeds from sale of shares | | | 992,305 | | | | 1,563,145 | | | | 236,021,862 | | | | 1,096,749,148 | | |
| Proceeds from shares issued in merger (Note 14) | | | — | | | | — | | | | — | | | | 48,015,614 | | |
| Reinvestment of distributions | | | 2,611,944 | | | | 23,585,688 | | | | 10,652,225 | | | | 268,200,908 | | |
| | | | 3,604,249 | | | | 25,148,833 | | | | 246,674,087 | | | | 1,412,965,670 | | |
| Cost of shares redeemed | | | (5,623,423 | ) | | | (30,249,954 | ) | | | (415,802,241 | ) | | | (1,226,745,331 | ) | |
Net increase (decrease) in net assets resulting from capital
share transactions | | | (2,019,174 | ) | | | (5,101,121 | ) | | | (169,128,154 | ) | | | 186,220,339 | | |
| Net decrease in net assets | | | (9,655,784 | ) | | | (81,579,077 | ) | | | (127,344,366 | ) | | | (389,265,262 | ) | |
| NET ASSETS: | |
| Beginning of period | | | 85,745,694 | | | | 167,324,771 | | | | 2,957,404,951 | | | | 3,346,670,213 | | |
| End of period | | $ | 76,089,910 | | | $ | 85,745,694 | | | $ | 2,830,060,585 | | | $ | 2,957,404,951 | | |
Undistributed net investment income (distributions in
excess of net investment income) at end of period | | $ | 841,960 | | | $ | 2,610,842 | | | $ | 21,783,562 | | | $ | (24,551,451 | ) | |
See Accompanying Notes to Financial Statements
14
STATEMENTS OF CHANGES IN NET ASSETS (UNAUDITED)
| | | ING Money Market Portfolio | | ING BlackRock
Science and Technology
Opportunities Portfolio | |
| | | Six Months
Ended
June 30,
2009 | | Year
Ended
December 31,
2008 | | Six Months
Ended
June 30,
2009 | | Year
Ended
December 31,
2008 | |
| FROM OPERATIONS: | |
| Net investment income (loss) | | $ | 3,487,609 | | | $ | 46,716,063 | | | $ | (136,212 | ) | | $ | 48,982 | | |
Net realized gain (loss) on investments and foreign
currency related transactions | | | 741,616 | | | | 2,471,989 | | | | (18,698,679 | ) | | | (17,342,801 | ) | |
Net change in unrealized appreciation or depreciation on
investments and foreign currency related transactions | | | — | | | | (149,401 | ) | | | 49,990,053 | | | | (70,362,339 | ) | |
| Increase (decrease) in net assets resulting from operations | | | 4,229,225 | | | | 49,038,651 | | | | 31,155,162 | | | | (87,656,158 | ) | |
| FROM DISTRIBUTIONS TO SHAREHOLDERS: | |
| Net investment income | | | (3,486,834 | ) | | | (124,653,168 | ) | | | — | | | | — | | |
| Total distributions | | | (3,486,834 | ) | | | (124,653,168 | ) | | | — | | | | — | | |
| FROM CAPITAL SHARE TRANSACTIONS: | |
| Net proceeds from sale of shares | | | 58,471,183 | | | | 384,970,723 | | | | 58,859,984 | | | | 52,450,776 | | |
| Proceeds from shares issued in merger (Note 14) | | | — | | | | — | | | | — | | | | 123,216,459 | | |
| Reinvestment of distributions | | | 3,486,834 | | | | 124,653,168 | | | | — | | | | — | | |
| | | | 61,958,017 | | | | 509,623,891 | | | | 58,859,984 | | | | 175,667,235 | | |
| Cost of shares redeemed | | | (278,262,395 | ) | | | (346,315,736 | ) | | | (17,717,867 | ) | | | (41,644,715 | ) | |
Net increase (decrease) in net assets resulting from capital
share transactions | | | (216,304,378 | ) | | | 163,308,155 | | | | 41,142,117 | | | | 134,022,520 | | |
| Net increase (decrease) in net assets | | | (215,561,987 | ) | | | 87,693,638 | | | | 72,297,279 | | | | 46,366,362 | | |
| NET ASSETS: | |
| Beginning of period | | | 1,798,832,925 | | | | 1,711,139,287 | | | | 145,449,413 | | | | 99,083,051 | | |
| End of period | | $ | 1,583,270,938 | | | $ | 1,798,832,925 | | | $ | 217,746,692 | | | $ | 145,449,413 | | |
| Undistributed net investment income at end of period | | $ | 775 | | | $ | — | | | $ | 465,885 | | | $ | 602,097 | | |
See Accompanying Notes to Financial Statements
15
FINANCIAL HIGHLIGHTS (UNAUDITED)
Selected data for a share of beneficial interest outstanding throughout each year or period.
| | | | | Income (loss)
from investment
operations | | | | Less distributions | | | |
| | | Net asset value, beginning of year or period | | Net investment income (loss) | | Net realized and unrealized gain (loss) | | Total from investment operations | | From net investment income | | From net realized gains | | From return of capital | | Total distributions | | Net asset value, end of year or period | |
| | | | | | | | | | | | | | | | | | | | |
| Year or period ended | | ($) | | ($) | | ($) | | ($) | | ($) | | ($) | | ($) | | ($) | | ($) | |
| ING Balanced Portfolio | | | |
| Class ADV | | | |
| 06-30-09 | | | 9.11 | | | | 0.09 | | | | 0.10 | | | | 0.19 | | | | 0.35 | | | | — | | | | — | | | | 0.35 | | | | 8.95 | | |
| 12-31-08 | | | 14.34 | | | | 0.29 | | | | (4.03 | ) | | | (3.74 | ) | | | 0.34 | | | | 1.15 | | | | — | | | | 1.49 | | | | 9.11 | | |
| 12-31-07 | | | 14.65 | | | | 0.29 | | | | 0.37 | | | | 0.66 | | | | 0.39 | | | | 0.58 | | | | — | | | | 0.97 | | | | 14.34 | | |
| 12-29-06(4)-12-31-06 | | | 14.65 | | | | (0.00 | )* | | | — | | | | (0.00 | )* | | | — | | | | — | | | | — | | | | — | | | | 14.65 | | |
| Class I | | | |
| 06-30-09 | | | 9.18 | | | | 0.14 | | | | 0.04 | | | | 0.18 | | | | 0.43 | | | | — | | | | — | | | | 0.43 | | | | 8.93 | | |
| 12-31-08 | | | 14.45 | | | | 0.40 | | | | (4.07 | ) | | | (3.67 | ) | | | 0.45 | | | | 1.15 | | | | — | | | | 1.60 | | | | 9.18 | | |
| 12-31-07 | | | 14.65 | | | | 0.39 | • | | | 0.38 | | | | 0.77 | | | | 0.39 | | | | 0.58 | | | | — | | | | 0.97 | | | | 14.45 | | |
| 12-31-06 | | | 13.64 | | | | 0.34 | • | | | 1.00 | | | | 1.34 | | | | 0.33 | | | | — | | | | — | | | | 0.33 | | | | 14.65 | | |
| 12-31-05 | | | 13.40 | | | | 0.29 | • | | | 0.27 | | | | 0.56 | | | | 0.32 | | | | — | | | | — | | | | 0.32 | | | | 13.64 | | |
| 12-31-04 | | | 12.50 | | | | 0.29 | | | | 0.87 | | | | 1.16 | | | | 0.26 | | | | — | | | | — | | | | 0.26 | | | | 13.40 | | |
| Class S | | | |
| 06-30-09 | | | 9.12 | | | | 0.13 | | | | 0.04 | | | | 0.17 | | | | 0.40 | | | | — | | | | — | | | | 0.40 | | | | 8.89 | | |
| 12-31-08 | | | 14.36 | | | | 0.34 | | | | (4.02 | ) | | | (3.68 | ) | | | 0.41 | | | | 1.15 | | | | — | | | | 1.56 | | | | 9.12 | | |
| 12-31-07 | | | 14.57 | | | | 0.35 | • | | | 0.38 | | | | 0.73 | | | | 0.36 | | | | 0.58 | | | | — | | | | 0.94 | | | | 14.36 | | |
| 12-31-06 | | | 13.58 | | | | 0.32 | • | | | 0.97 | | | | 1.29 | | | | 0.30 | | | | — | | | | — | | | | 0.30 | | | | 14.57 | | |
| 12-31-05 | | | 13.35 | | | | 0.27 | | | | 0.25 | | | | 0.52 | | | | 0.29 | | | | — | | | | — | | | | 0.29 | | | | 13.58 | | |
| 12-31-04 | | | 12.49 | | | | 0.22 | | | | 0.89 | | | | 1.11 | | | | 0.25 | | | | — | | | | — | | | | 0.25 | | | | 13.35 | | |
| Class S2 | | | |
| 02-27-09(4)-06-30-09 | | | 7.97 | | | | 0.06 | • | | | 1.25 | | | | 1.31 | | | | 0.43 | | | | — | | | | — | | | | 0.43 | | | | 8.85 | | |
| ING Growth and Income Portfolio | | | |
| Class ADV | | | |
| 06-30-09 | | | 15.04 | | | | 0.10 | | | | 0.99 | | | | 1.09 | | | | — | | | | — | | | | — | | | | — | | | | 16.13 | | |
| 12-31-08 | | | 24.61 | | | | 0.23 | • | | | (9.58 | ) | | | (9.35 | ) | | | 0.22 | | | | — | | | | — | | | | 0.22 | | | | 15.04 | | |
| 12-31-07 | | | 23.38 | | | | 0.72 | • | | | 0.84 | | | | 1.56 | | | | 0.33 | | | | — | | | | — | | | | 0.33 | | | | 24.61 | | |
| 12-20-06(4)-12-31-06 | | | 23.70 | | | | 0.01 | • | | | (0.06 | ) | | | (0.05 | ) | | | 0.27 | | | | — | | | | — | | | | 0.27 | | | | 23.38 | | |
| Class I | | | |
| 06-30-09 | | | 15.11 | | | | 0.12 | | | | 1.01 | | | | 1.13 | | | | — | | | | — | | | | — | | | | — | | | | 16.24 | | |
| 12-31-08 | | | 24.76 | | | | 0.36 | | | | (9.69 | ) | | | (9.33 | ) | | | 0.32 | | | | — | | | | — | | | | 0.32 | | | | 15.11 | | |
| 12-31-07 | | | 23.38 | | | | 0.33 | • | | | 1.40 | | | | 1.73 | | | | 0.35 | | | | — | | | | — | | | | 0.35 | | | | 24.76 | | |
| 12-31-06 | | | 20.71 | | | | 0.25 | • | | | 2.69 | | | | 2.94 | | | | 0.27 | | | | — | | | | — | | | | 0.27 | | | | 23.38 | | |
| 12-31-05 | | | 19.35 | | | | 0.23 | | | | 1.35 | | | | 1.58 | | | | 0.22 | | | | — | | | | — | | | | 0.22 | | | | 20.71 | | |
| 12-31-04 | | | 18.28 | | | | 0.28 | | | | 1.24 | | | | 1.52 | | | | 0.45 | | | | — | | | | — | | | | 0.45 | | | | 19.35 | | |
| Class S | | | |
| 06-30-09 | | | 15.00 | | | | 0.11 | | | | 1.00 | | | | 1.11 | | | | — | | | | — | | | | — | | | | — | | | | 16.11 | | |
| 12-31-08 | | | 24.63 | | | | 0.25 | • | | | (9.58 | ) | | | (9.33 | ) | | | 0.30 | | | | — | | | | — | | | | 0.30 | | | | 15.00 | | |
| 12-31-07 | | | 23.30 | | | | 0.37 | • | | | 1.29 | | | | 1.66 | | | | 0.33 | | | | — | | | | — | | | | 0.33 | | | | 24.63 | | |
| 12-31-06 | | | 20.69 | | | | 0.20 | • | | | 2.64 | | | | 2.84 | | | | 0.23 | | | | — | | | | — | | | | 0.23 | | | | 23.30 | | |
| 12-31-05 | | | 19.34 | | | | 0.14 | | | | 1.41 | | | | 1.55 | | | | 0.20 | | | | — | | | | — | | | | 0.20 | | | | 20.69 | | |
| 12-31-04 | | | 18.26 | | | | 0.21 | | | | 1.26 | | | | 1.47 | | | | 0.39 | | | | — | | | | — | | | | 0.39 | | | | 19.34 | | |
| Class S2 | | | |
| 02-27-09(4)-06-30-09 | | | 12.69 | | | | 0.04 | | | | 3.41 | | | | 3.45 | | | | — | | | | — | | | | — | | | | — | | | | 16.14 | | |
| | | | | Ratios to average net assets | | Supplemental data | |
| | | Total Return(1) | | Expenses before reductions/additions(2)(3) | | Expenses net of fee waivers and/or recoupments, if any(2)(3) | | Expenses net of all reductions/additions(2)(3) | | Net investment income (loss)(2)(3) | | Net assets, end of year or period | | Portfolio turnover rate | |
| | | | | | | | | | | | | | | | |
| Year or period ended | | (%) | | (%) | | (%) | | (%) | | (%) | | ($000's) | | (%) | |
| ING Balanced Portfolio | |
| Class ADV | |
| 06-30-09 | | | 2.22 | | | | 1.14 | | | | 1.13 | † | | | 1.13 | † | | | 2.12 | † | | | 1 | | | | 182 | | |
| 12-31-08 | | | (28.62 | ) | | | 1.12 | | | | 1.12 | † | | | 1.12 | † | | | 2.44 | † | | | 1 | | | | 294 | | |
| 12-31-07 | | | 4.78 | | | | 1.10 | | | | 1.10 | † | | | 1.10 | † | | | 2.05 | † | | | 1 | | | | 257 | | |
| 12-29-06(4)-12-31-06 | | | — | | | | 1.10 | | | | 1.10 | † | | | 1.10 | † | | | (1.10 | )† | | | 1 | | | | 236 | | |
| Class I | |
| 06-30-09 | | | 2.15 | | | | 0.64 | | | | 0.63 | † | | | 0.63 | † | | | 2.80 | † | | | 580,829 | | | | 182 | | |
| 12-31-08 | | | (28.10 | ) | | | 0.62 | | | | 0.62 | † | | | 0.62 | † | | | 2.97 | † | | | 602,815 | | | | 294 | | |
| 12-31-07 | | | 5.57 | | | | 0.60 | | | | 0.60 | † | | | 0.60 | † | | | 2.68 | † | | | 1,046,498 | | | | 257 | | |
| 12-31-06 | | | 9.99 | | | | 0.60 | | | | 0.60 | † | | | 0.60 | † | | | 2.44 | † | | | 1,183,928 | | | | 236 | | |
| 12-31-05 | | | 4.24 | | | | 0.60 | | | | 0.60 | | | | 0.60 | | | | 2.30 | | | | 1,236,327 | | | | 308 | | |
| 12-31-04 | | | 9.42 | | | | 0.59 | | | | 0.59 | | | | 0.59 | | | | 2.15 | | | | 1,357,854 | | | | 272 | | |
| Class S | |
| 06-30-09 | | | 2.04 | | | | 0.89 | | | | 0.88 | † | | | 0.88 | † | | | 2.61 | † | | | 6,464 | | | | 182 | | |
| 12-31-08 | | | (28.28 | ) | | | 0.87 | | | | 0.87 | † | | | 0.87 | † | | | 2.73 | † | | | 6,684 | | | | 294 | | |
| 12-31-07 | | | 5.31 | | | | 0.85 | | | | 0.85 | † | | | 0.85 | † | | | 2.43 | † | | | 10,281 | | | | 257 | | |
| 12-31-06 | | | 9.62 | | | | 0.85 | | | | 0.85 | † | | | 0.85 | † | | | 2.29 | † | | | 10,683 | | | | 236 | | |
| 12-31-05 | | | 3.99 | | | | 0.85 | | | | 0.85 | | | | 0.85 | | | | 2.06 | | | | 3,170 | | | | 308 | | |
| 12-31-04 | | | 9.06 | | | | 0.84 | | | | 0.84 | | | | 0.84 | | | | 1.98 | | | | 3,116 | | | | 272 | | |
| Class S2 | |
| 02-27-09(4)-06-30-09 | | | 16.66 | | | | 1.14 | | | | 1.03 | † | | | 1.03 | † | | | 2.21 | † | | | 3 | | | | 182 | | |
| ING Growth and Income Portfolio | |
| Class ADV | |
| 06-30-09 | | | 7.25 | | | | 1.12 | | | | 1.11 | † | | | 1.11 | † | | | 1.24 | † | | | 660 | | | | 54 | | |
| 12-31-08 | | | (37.94 | )(a) | | | 1.10 | | | | 1.10 | † | | | 1.10 | † | | | 1.14 | † | | | 791 | | | | 169 | | |
| 12-31-07 | | | 6.66 | | | | 1.09 | | | | 1.09 | † | | | 1.09 | † | | | 2.95 | † | | | 1,211 | | | | 146 | | |
| 12-20-06(4)-12-31-06 | | | (0.23 | ) | | | 1.09 | | | | 1.09 | † | | | 1.09 | † | | | 1.08 | † | | | 1 | | | | 103 | | |
| Class I | |
| 06-30-09 | | | 7.48 | | | | 0.62 | | | | 0.61 | † | | | 0.61 | † | | | 1.66 | † | | | 1,749,938 | | | | 54 | | |
| 12-31-08 | | | (37.63 | )(a) | | | 0.60 | | | | 0.60 | † | | | 0.60 | † | | | 1.64 | † | | | 1,622,085 | | | | 169 | | |
| 12-31-07 | | | 7.40 | | | | 0.59 | | | | 0.59 | † | | | 0.59 | † | | | 1.32 | † | | | 2,796,115 | | | | 146 | | |
| 12-31-06 | | | 14.20 | | | | 0.59 | | | | 0.59 | † | | | 0.59 | † | | | 1.15 | † | | | 3,098,120 | | | | 103 | | |
| 12-31-05 | | | 8.13 | | | | 0.59 | | | | 0.59 | | | | 0.59 | | | | 1.03 | | | | 3,146,025 | | | | 80 | | |
| 12-31-04 | | | 8.39 | | | | 0.58 | | | | 0.58 | | | | 0.58 | | | | 1.41 | | | | 3,531,422 | | | | 139 | | |
| Class S | |
| 06-30-09 | | | 7.40 | | | | 0.87 | | | | 0.86 | † | | | 0.86 | † | | | 1.43 | † | | | 284,400 | | | | 54 | | |
| 12-31-08 | | | (37.82 | )(a) | | | 0.85 | | | | 0.85 | † | | | 0.85 | † | | | 1.44 | † | | | 290,152 | | | | 169 | | |
| 12-31-07 | | | 7.13 | | | | 0.84 | | | | 0.84 | † | | | 0.84 | † | | | 1.50 | † | | | 25,169 | | | | 146 | | |
| 12-31-06 | | | 13.72 | | | | 0.84 | | | | 0.84 | † | | | 0.84 | † | | | 0.94 | † | | | 4,758 | | | | 103 | | |
| 12-31-05 | | | 7.98 | | | | 0.84 | | | | 0.84 | | | | 0.84 | | | | 0.78 | | | | 2,431 | | | | 80 | | |
| 12-31-04 | | | 8.10 | | | | 0.83 | | | | 0.83 | | | | 0.83 | | | | 1.18 | | | | 1,776 | | | | 139 | | |
| Class S2 | |
| 02-27-09(4)-06-30-09 | | | 27.19 | | | | 1.12 | | | | 1.01 | † | | | 1.01 | † | | | 0.85 | † | | | 4 | | | | 54 | | |
See Accompanying Notes to Financial Statements
16
FINANCIAL HIGHLIGHTS (UNAUDITED) (CONTINUED)
Selected data for a share of beneficial interest outstanding throughout each year or period.
| | | | | Income (loss)
from investment
operations | | | | Less distributions | | | |
| | | Net asset value, beginning of year or period | | Net investment income (loss) | | Net realized and unrealized gain (loss) | | Total from investment operations | | From net investment income | | From net realized gains | | From return of capital | | Total distributions | | Net asset value, end of year or period | |
| | | | | | | | | | | | | | | | | | | | |
| Year or period ended | | ($) | | ($) | | ($) | | ($) | | ($) | | ($) | | ($) | | ($) | | ($) | |
| ING Opportunistic LargeCap Growth Portfolio | | | |
| Class ADV | | | |
| 06-30-09 | | | 6.93 | | | | 0.00 | * | | | 0.54 | | | | 0.54 | | | | — | | | | — | | | | — | | | | — | | | | 7.47 | | |
| 12-31-08 | | | 12.46 | | | | (0.01 | )• | | | (5.52 | ) | | | (5.53 | ) | | | — | | | | — | | | | — | | | | — | | | | 6.93 | | |
| 12-31-07 | | | 10.65 | | | | (0.02 | )• | | | 1.85 | | | | 1.83 | | | | 0.02 | | | | — | | | | — | | | | 0.02 | | | | 12.46 | | |
| 12-29-06(4)-12-31-06 | | | 10.65 | | | | (0.00 | )* | | | — | | | | (0.00 | )* | | | — | | | | — | | | | — | | | | — | | | | 10.65 | | |
| Class I | | | |
| 06-30-09 | | | 6.96 | | | | 0.03 | | | | 0.52 | | | | 0.55 | | | | 0.05 | | | | — | | | | — | | | | 0.05 | | | | 7.46 | | |
| 12-31-08 | | | 12.53 | | | | 0.05 | | | | (5.54 | ) | | | (5.49 | ) | | | 0.08 | | | | — | | | | — | | | | 0.08 | | | | 6.96 | | |
| 12-31-07 | | | 10.65 | | | | 0.05 | • | | | 1.85 | | | | 1.90 | | | | 0.02 | | | | — | | | | — | | | | 0.02 | | | | 12.53 | | |
| 12-31-06 | | | 10.38 | | | | 0.02 | • | | | 0.26 | | | | 0.28 | | | | 0.01 | | | | — | | | | — | | | | 0.01 | | | | 10.65 | | |
| 12-31-05 | | | 9.56 | | | | 0.02 | | | | 0.87 | | | | 0.89 | | | | 0.07 | | | | — | | | | — | | | | 0.07 | | | | 10.38 | | |
| 12-31-04 | | | 8.93 | | | | 0.06 | | | | 0.58 | | | | 0.64 | | | | 0.01 | | | | — | | | | — | | | | 0.01 | | | | 9.56 | | |
| Class S | | | |
| 06-30-09 | | | 6.89 | | | | 0.01 | | | | 0.53 | | | | 0.54 | | | | 0.02 | | | | — | | | | — | | | | 0.02 | | | | 7.41 | | |
| 12-31-08 | | | 12.39 | | | | 0.02 | • | | | (5.49 | ) | | | (5.47 | ) | | | 0.03 | | | | — | | | | — | | | | 0.03 | | | | 6.89 | | |
| 12-31-07 | | | 10.56 | | | | 0.00 | * | | | 1.85 | | | | 1.85 | | | | 0.02 | | | | — | | | | — | | | | 0.02 | | | | 12.39 | | |
| 12-31-06 | | | 10.31 | | | | (0.01 | ) | | | 0.26 | | | | 0.25 | | | | — | | | | — | | | | — | | | | — | | | | 10.56 | | |
| 12-31-05 | | | 9.50 | | | | (0.00 | )* | | | 0.85 | | | | 0.85 | | | | 0.04 | | | | — | | | | — | | | | 0.04 | | | | 10.31 | | |
| 12-31-04 | | | 8.88 | | | | 0.04 | | | | 0.58 | | | | 0.62 | | | | — | | | | — | | | | — | | | | — | | | | 9.50 | | |
| ING Small Company Portfolio | | | |
| Class ADV | | | |
| 06-30-09 | | | 11.58 | | | | 0.01 | | | | 0.30 | | | | 0.31 | | | | 0.08 | | | | — | | | | — | | | | 0.08 | | | | 11.81 | | |
| 12-16-08(4)-12-31-08 | | | 11.13 | | | | 0.00 | *• | | | 0.45 | | | | 0.45 | | | | — | | | | — | | | | — | | | | — | | | | 11.58 | | |
| Class I | | | |
| 06-30-09 | | | 11.70 | | | | 0.03 | | | | 0.31 | | | | 0.34 | | | | 0.08 | | | | — | | | | — | | | | 0.08 | | | | 11.96 | | |
| 12-31-08 | | | 19.56 | | | | 0.11 | • | | | (5.52 | ) | | | (5.41 | ) | | | 0.18 | | | | 2.27 | | | | — | | | | 2.45 | | | | 11.70 | | |
| 12-31-07 | | | 21.70 | | | | 0.24 | • | | | 0.99 | | | | 1.23 | | | | 0.04 | | | | 3.33 | | | | — | | | | 3.37 | | | | 19.56 | | |
| 12-31-06 | | | 21.65 | | | | 0.05 | | | | 3.46 | | | | 3.51 | | | | 0.09 | | | | 3.37 | | | | — | | | | 3.46 | | | | 21.70 | | |
| 12-31-05 | | | 19.94 | | | | 0.10 | | | | 1.92 | | | | 2.02 | | | | 0.03 | | | | 0.28 | | | | — | | | | 0.31 | | | | 21.65 | | |
| 12-31-04 | | | 17.48 | | | | 0.04 | | | | 2.47 | | | | 2.51 | | | | 0.05 | | | | — | | | | — | | | | 0.05 | | | | 19.94 | | |
| Class S | | | |
| 06-30-09 | | | 11.57 | | | | 0.02 | • | | | 0.31 | | | | 0.33 | | | | 0.07 | | | | — | | | | — | | | | 0.07 | | | | 11.83 | | |
| 12-31-08 | | | 19.39 | | | | 0.09 | • | | | (5.50 | ) | | | (5.41 | ) | | | 0.14 | | | | 2.27 | | | | — | | | | 2.41 | | | | 11.57 | | |
| 12-31-07 | | | 21.54 | | | | 0.18 | • | | | 1.00 | | | | 1.18 | | | | — | | | | 3.33 | | | | — | | | | 3.33 | | | | 19.39 | | |
| 12-31-06 | | | 21.59 | | | | (0.05 | )• | | | 3.41 | | | | 3.36 | | | | 0.04 | | | | 3.37 | | | | — | | | | 3.41 | | | | 21.54 | | |
| 12-31-05 | | | 19.90 | | | | 0.06 | | | | 1.92 | | | | 1.98 | | | | 0.01 | | | | 0.28 | | | | — | | | | 0.29 | | | | 21.59 | | |
| 12-31-04 | | | 17.49 | | | | 0.03 | • | | | 2.43 | | | | 2.46 | | | | 0.05 | | | | — | | | | — | | | | 0.05 | | | | 19.90 | | |
| Class S2 | | | |
| 02-27-09(4)-06-30-09 | | | 9.27 | | | | 0.01 | • | | | 2.61 | | | | 2.62 | | | | 0.08 | | | | — | | | | — | | | | 0.08 | | | | 11.81 | | |
| | | | | Ratios to average net assets | | Supplemental data | |
| | | Total Return(1) | | Expenses before reductions/additions(2)(3) | | Expenses net of fee waivers and/or recoupments, if any(2)(3) | | Expenses net of all reductions/additions(2)(3) | | Net investment income (loss)(2)(3) | | Net assets, end of year or period | | Portfolio turnover rate | |
| | | | | | | | | | | | | | | | |
| Year or period ended | | (%) | | (%) | | (%) | | (%) | | (%) | | ($000's) | | (%) | |
| ING Opportunistic LargeCap Growth Portfolio | |
| Class ADV | |
| 06-30-09 | | | 7.79 | | | | 1.22 | | | | 1.22 | † | | | 1.22 | † | | | 0.15 | † | | | 647 | | | | 77 | | |
| 12-31-08 | | | (44.38 | ) | | | 1.24 | | | | 1.24 | † | | | 1.24 | † | | | (0.08 | )† | | | 590 | | | | 259 | | |
| 12-31-07 | | | 17.21 | | | | 1.20 | | | | 1.20 | † | | | 1.20 | † | | | (0.18 | )† | | | 1,386 | | | | 279 | | |
| 12-29-06(4)-12-31-06 | | | — | | | | 1.19 | | | | 1.19 | | | | 1.19 | | | | (1.19 | ) | | | 1 | | | | 188 | | |
| Class I | |
| 06-30-09 | | | 7.93 | | | | 0.72 | | | | 0.72 | † | | | 0.72 | † | | | 0.67 | † | | | 60,245 | | | | 77 | | |
| 12-31-08 | | | (44.06 | ) | | | 0.74 | | | | 0.74 | † | | | 0.74 | † | | | 0.43 | † | | | 59,412 | | | | 259 | | |
| 12-31-07 | | | 17.86 | | | | 0.70 | | | | 0.70 | † | | | 0.70 | † | | | 0.42 | † | | | 137,104 | | | | 279 | | |
| 12-31-06 | | | 2.65 | | | | 0.69 | | | | 0.69 | | | | 0.69 | | | | 0.19 | | | | 186,495 | | | | 188 | | |
| 12-31-05 | | | 9.38 | (c) | | | 0.69 | | | | 0.69 | | | | 0.69 | | | | 0.08 | | | | 175,297 | | | | 119 | | |
| 12-31-04 | | | 7.19 | | | | 0.69 | | | | 0.69 | | | | 0.69 | | | | 0.61 | | | | 193,280 | | | | 123 | | |
| Class S | |
| 06-30-09 | | | 7.82 | | | | 0.97 | | | | 0.97 | † | | | 0.97 | † | | | 0.42 | † | | | 7,610 | | | | 77 | | |
| 12-31-08 | | | (44.21 | ) | | | 0.99 | | | | 0.99 | † | | | 0.99 | † | | | 0.17 | † | | | 7,034 | | | | 259 | | |
| 12-31-07 | | | 17.54 | | | | 0.95 | | | | 0.95 | † | | | 0.95 | † | | | 0.23 | † | | | 21,105 | | | | 279 | | |
| 12-31-06 | | | 2.42 | | | | 0.94 | | | | 0.94 | | | | 0.94 | | | | (0.06 | ) | | | 273 | | | | 188 | | |
| 12-31-05 | | | 9.05 | (c) | | | 0.94 | | | | 0.94 | | | | 0.94 | | | | (0.17 | ) | | | 285 | | | | 119 | | |
| 12-31-04 | | | 6.98 | | | | 0.94 | | | | 0.94 | | | | 0.94 | | | | 0.44 | | | | 356 | | | | 123 | | |
| ING Small Company Portfolio | |
| Class ADV | |
| 06-30-09 | | | 2.70 | | | | 1.36 | | | | 1.36 | † | | | 1.36 | † | | | 0.20 | † | | | 3 | | | | 72 | | |
| 12-16-08(4)-12-31-08 | | | 4.04 | | | | 1.35 | | | | 1.35 | † | | | 1.35 | † | | | 0.65 | † | | | 3 | | | | 145 | | |
| Class I | |
| 06-30-09 | | | 2.94 | | | | 0.86 | | | | 0.86 | † | | | 0.86 | † | | | 0.70 | † | | | 455,089 | | | | 72 | | |
| 12-31-08 | | | (31.05 | ) | | | 0.85 | | | | 0.85 | † | | | 0.85 | † | | | 0.71 | † | | | 420,626 | | | | 145 | | |
| 12-31-07 | | | 5.90 | | | | 0.84 | | | | 0.84 | † | | | 0.84 | † | | | 1.16 | † | | | 603,492 | | | | 106 | | |
| 12-31-06 | | | 16.79 | | | | 0.85 | | | | 0.85 | † | | | 0.85 | † | | | 0.26 | † | | | 512,446 | | | | 83 | | |
| 12-31-05 | | | 10.27 | (c) | | | 0.85 | | | | 0.85 | | | | 0.85 | | | | 0.43 | | | | 393,700 | | | | 72 | | |
| 12-31-04 | | | 14.39 | | | | 0.84 | | | | 0.84 | | | | 0.84 | | | | 0.21 | | | | 461,014 | | | | 93 | | |
| Class S | |
| 06-30-09 | | | 2.89 | | | | 1.11 | | | | 1.11 | † | | | 1.11 | † | | | 0.45 | † | | | 53,196 | | | | 72 | | |
| 12-31-08 | | | (31.28 | ) | | | 1.10 | | | | 1.10 | † | | | 1.10 | † | | | 0.71 | † | | | 44,764 | | | | 145 | | |
| 12-31-07 | | | 5.68 | | | | 1.09 | | | | 1.09 | † | | | 1.09 | † | | | 0.90 | † | | | 2,890 | | | | 106 | | |
| 12-31-06 | | | 16.07 | | | | 1.10 | | | | 1.10 | † | | | 1.10 | † | | | (0.24 | )† | | | 2,162 | | | | 83 | | |
| 12-31-05 | | | 10.05 | (c) | | | 1.10 | | | | 1.10 | | | | 1.10 | | | | 0.26 | | | | 68,768 | | | | 72 | | |
| 12-31-04 | | | 14.09 | | | | 1.09 | | | | 1.09 | | | | 1.09 | | | | 0.19 | | | | 72,225 | | | | 93 | | |
| Class S2 | |
| 02-27-09(4)-06-30-09 | | | 28.31 | | | | 1.36 | | | | 1.26 | † | | | 1.26 | † | | | 0.37 | † | | | 4 | | | | 72 | | |
See Accompanying Notes to Financial Statements
17
FINANCIAL HIGHLIGHTS (UNAUDITED) (CONTINUED)
Selected data for a share of beneficial interest outstanding throughout each year or period.
| | | | | Income (loss)
from investment
operations | | | | Less distributions | | | |
| | | Net asset value, beginning of year or period | | Net investment income (loss) | | Net realized and unrealized gain (loss) | | Total from investment operations | | From net investment income | | From net realized gains | | From return of capital | | Total distributions | | Net asset value, end of year or period | |
| | | | | | | | | | | | | | | | | | | | |
| Year or period ended | | ($) | | ($) | | ($) | | ($) | | ($) | | ($) | | ($) | | ($) | | ($) | |
| ING Opportunistic LargeCap Portfolio | | | |
| Class ADV | | | |
| 06-30-09 | | | 8.52 | | | | 0.08 | | | | (0.55 | ) | | | (0.47 | ) | | | 0.21 | | | | — | | | | — | | | | 0.21 | | | | 7.84 | | |
| 12-31-08 | | | 15.82 | | | | 0.20 | | | | (5.19 | ) | | | (4.99 | ) | | | 0.16 | | | | 2.15 | | | | — | | | | 2.31 | | | | 8.52 | | |
| 12-31-07 | | | 15.72 | | | | 0.16 | | | | 0.20 | | | | 0.36 | | | | 0.26 | | | | — | | | | — | | | | 0.26 | | | | 15.82 | | |
| 12-29-06(4)-12-31-06 | | | 15.72 | | | | (0.00 | )* | | | — | | | | (0.00 | )* | | | — | | | | — | | | | — | | | | — | | | | 15.72 | | |
| Class I | | | |
| 06-30-09 | | | 8.65 | | | | 0.10 | | | | (0.58 | ) | | | (0.48 | ) | | | 0.28 | | | | — | | | | — | | | | 0.28 | | | | 7.89 | | |
| 12-31-08 | | | 16.05 | | | | 0.29 | | | | (5.27 | ) | | | (4.98 | ) | | | 0.27 | | | | 2.15 | | | | — | | | | 2.42 | | | | 8.65 | | |
| 12-31-07 | | | 15.84 | | | | 0.23 | • | | | 0.24 | | | | 0.47 | | | | 0.26 | | | | — | | | | — | | | | 0.26 | | | | 16.05 | | |
| 12-31-06 | | | 13.84 | | | | 0.23 | • | | | 1.98 | | | | 2.21 | | | | 0.21 | | | | — | | | | — | | | | 0.21 | | | | 15.84 | | |
| 12-31-05 | | | 13.19 | | | | 0.19 | • | | | 0.71 | | | | 0.90 | | | | 0.25 | | | | — | | | | — | | | | 0.25 | | | | 13.84 | | |
| 12-31-04 | | | 12.08 | | | | 0.24 | | | | 0.98 | | | | 1.22 | | | | 0.11 | | | | — | | | | — | | | | 0.11 | | | | 13.19 | | |
| Class S | | | |
| 06-30-09 | | | 8.58 | | | | 0.10 | | | | (0.58 | ) | | | (0.48 | ) | | | 0.25 | | | | — | | | | — | | | | 0.25 | | | | 7.85 | | |
| 12-31-08 | | | 15.93 | | | | 0.26 | | | | (5.23 | ) | | | (4.97 | ) | | | 0.23 | | | | 2.15 | | | | — | | | | 2.38 | | | | 8.58 | | |
| 12-31-07 | | | 15.72 | | | | 0.19 | • | | | 0.24 | | | | 0.43 | | | | 0.22 | | | | — | | | | — | | | | 0.22 | | | | 15.93 | | |
| 12-31-06 | | | 13.77 | | | | 0.19 | • | | | 1.96 | | | | 2.15 | | | | 0.20 | | | | — | | | | — | | | | 0.20 | | | | 15.72 | | |
| 12-31-05 | | | 13.12 | | | | 0.16 | • | | | 0.71 | | | | 0.87 | | | | 0.22 | | | | — | | | | — | | | | 0.22 | | | | 13.77 | | |
| 12-31-04 | | | 12.03 | | | | 0.13 | | | | 1.05 | | | | 1.18 | | | | 0.09 | | | | — | | | | — | | | | 0.09 | | | | 13.12 | | |
| ING Intermediate Bond Portfolio | | | |
| Class ADV | | | |
| 06-30-09 | | | 11.12 | | | | 0.22 | | | | (0.05 | ) | | | 0.17 | | | | — | | | | — | | | | — | | | | — | | | | 11.29 | | |
| 12-31-08 | | | 13.23 | | | | 0.58 | | | | (1.77 | ) | | | (1.19 | ) | | | 0.62 | | | | 0.30 | | | | — | | | | 0.92 | | | | 11.12 | | |
| 12-31-07 | | | 12.96 | | | | 0.63 | | | | 0.09 | | | | 0.72 | | | | 0.45 | | | | — | | | | — | | | | 0.45 | | | | 13.23 | | |
| 12-20-06(4)-12-31-06 | | | 13.53 | | | | 0.02 | | | | (0.06 | ) | | | (0.04 | ) | | | 0.53 | | | | — | | | | — | | | | 0.53 | | | | 12.96 | | |
| Class I | | | |
| 06-30-09 | | | 11.08 | | | | 0.22 | | | | 0.01 | | | | 0.23 | | | | 0.05 | | | | — | | | | — | | | | 0.05 | | | | 11.26 | | |
| 12-31-08 | | | 13.22 | | | | 0.64 | • | | | (1.73 | ) | | | (1.09 | ) | | | 0.75 | | | | 0.30 | | | | — | | | | 1.05 | | | | 11.08 | | |
| 12-31-07 | | | 12.96 | | | | 0.69 | • | | | 0.08 | | | | 0.77 | | | | 0.51 | | | | — | | | | — | | | | 0.51 | | | | 13.22 | | |
| 12-31-06 | | | 12.97 | | | | 0.65 | • | | | (0.12 | ) | | | 0.53 | | | | 0.54 | | | | — | | | | — | | | | 0.54 | | | | 12.96 | | |
| 12-31-05 | | | 13.14 | | | | 0.54 | | | | (0.13 | ) | | | 0.41 | | | | 0.51 | | | | 0.07 | | | | — | | | | 0.58 | | | | 12.97 | | |
| 12-31-04 | | | 14.15 | | | | 0.53 | | | | 0.13 | | | | 0.66 | | | | 1.11 | | | | 0.56 | | | | — | | | | 1.67 | | | | 13.14 | | |
| Class S | | | |
| 06-30-09 | | | 11.00 | | | | 0.21 | | | | 0.02 | | | | 0.23 | | | | 0.03 | | | | — | | | | — | | | | 0.03 | | | | 11.20 | | |
| 12-31-08 | | | 13.14 | | | | 0.60 | • | | | (1.72 | ) | | | (1.12 | ) | | | 0.72 | | | | 0.30 | | | | — | | | | 1.02 | | | | 11.00 | | |
| 12-31-07 | | | 12.89 | | | | 0.65 | • | | | 0.08 | | | | 0.73 | | | | 0.48 | | | | — | | | | — | | | | 0.48 | | | | 13.14 | | |
| 12-31-06 | | | 12.91 | | | | 0.61 | • | | | (0.12 | ) | | | 0.49 | | | | 0.51 | | | | — | | | | — | | | | 0.51 | | | | 12.89 | | |
| 12-31-05 | | | 13.09 | | | | 0.41 | | | | (0.03 | ) | | | 0.38 | | | | 0.49 | | | | 0.07 | | | | — | | | | 0.56 | | | | 12.91 | | |
| 12-31-04 | | | 14.13 | | | | 0.40 | | | | 0.22 | | | | 0.62 | | | | 1.10 | | | | 0.56 | | | | — | | | | 1.66 | | | | 13.09 | | |
| Class S2 | | | |
| 02-27-09(4)-06-30-09 | | | 10.79 | | | | 0.14 | • | | | 0.38 | | | | 0.52 | | | | 0.05 | | | | — | | | | — | | | | 0.05 | | | | 11.26 | | |
| ING Money Market Portfolio(d) | | | |
| Class I | | | |
| 06-30-09 | | | 1.00 | | | | 0.00 | * | | | 0.00 | * | | | 0.00 | * | | | 0.00 | * | | | — | | | | — | | | | 0.00 | * | | | 1.00 | | |
| 12-31-08 | | | 1.05 | | | | 0.02 | | | | 0.00 | | | | 0.02 | | | | 0.07 | | | | — | | | | — | | | | 0.07 | | | | 1.00 | | |
| 12-31-07 | | | 1.04 | | | | 0.05 | | | | (0.00 | ) | | | 0.05 | | | | 0.04 | | | | — | | | | — | | | | 0.04 | | | | 1.05 | | |
| 12-31-06 | | | 1.02 | | | | 0.05 | | | | 0.00 | | | | 0.05 | | | | 0.03 | | | | — | | | | — | | | | 0.03 | | | | 1.04 | | |
| 12-31-05 | | | 1.00 | | | | 0.03 | | | | (0.00 | ) | | | 0.03 | | | | 0.01 | | | | — | | | | — | | | | 0.01 | | | | 1.02 | | |
| 12-31-04 | | | 1.00 | | | | 0.01 | | | | (0.00 | ) | | | 0.01 | | | | 0.01 | | | | — | | | | — | | | | 0.01 | | | | 1.00 | | |
| | | | | Ratios to average net assets | | Supplemental data | |
| | | Total Return(1) | | Expenses before reductions/additions(2)(3) | | Expenses net of fee waivers and/or recoupments, if any(2)(3) | | Expenses net of all reductions/additions(2)(3) | | Net investment income (loss)(2)(3) | | Net assets, end of year or period | | Portfolio turnover rate | |
| | | | | | | | | | | | | | | | |
| Year or period ended | | (%) | | (%) | | (%) | | (%) | | (%) | | ($000's) | | (%) | |
| ING Opportunistic LargeCap Portfolio | |
| Class ADV | |
| 06-30-09 | | | (5.41 | ) | | | 1.22 | | | | 1.22 | † | | | 1.22 | † | | | 1.93 | † | | | 0 | * | | | 143 | | |
| 12-31-08 | | | (36.01 | )(a) | | | 1.21 | | | | 1.21 | † | | | 1.21 | † | | | 1.68 | † | | | 1 | | | | 132 | | |
| 12-31-07 | | | 2.33 | | | | 1.19 | | | | 1.19 | † | | | 1.19 | † | | | 0.99 | † | | | 1 | | | | 197 | | |
| 12-29-06(4)-12-31-06 | | | — | | | | 1.19 | | | | 1.19 | | | | 1.19 | | | | (1.19 | ) | | | 1 | | | | 83 | | |
| Class I | |
| 06-30-09 | | | (5.40 | ) | | | 0.72 | | | | 0.72 | † | | | 0.72 | † | | | 2.32 | † | | | 65,693 | | | | 143 | | |
| 12-31-08 | | | (35.61 | )(a) | | | 0.71 | | | | 0.71 | † | | | 0.71 | † | | | 2.16 | † | | | 73,764 | | | | 132 | | |
| 12-31-07 | | | 3.01 | | | | 0.69 | | | | 0.69 | † | | | 0.69 | † | | | 1.44 | † | | | 143,438 | | | | 197 | | |
| 12-31-06 | | | 16.10 | | | | 0.69 | | | | 0.69 | | | | 0.69 | | | | 1.58 | | | | 173,014 | | | | 83 | | |
| 12-31-05 | | | 6.95 | | | | 0.70 | | | | 0.70 | | | | 0.70 | | | | 1.47 | | | | 178,828 | | | | 94 | | |
| 12-31-04 | | | 10.15 | | | | 0.69 | | | | 0.69 | | | | 0.69 | | | | 1.61 | | | | 219,889 | | | | 16 | | |
| Class S | |
| 06-30-09 | | | (5.51 | ) | | | 0.97 | | | | 0.97 | † | | | 0.97 | † | | | 2.07 | † | | | 10,396 | | | | 143 | | |
| 12-31-08 | | | (35.80 | )(a) | | | 0.96 | | | | 0.96 | † | | | 0.96 | † | | | 1.91 | † | | | 11,981 | | | | 132 | | |
| 12-31-07 | | | 2.77 | | | | 0.94 | | | | 0.94 | † | | | 0.94 | † | | | 1.19 | † | | | 23,886 | | | | 197 | | |
| 12-31-06 | | | 15.77 | | | | 0.94 | | | | 0.94 | | | | 0.94 | | | | 1.32 | | | | 28,391 | | | | 83 | | |
| 12-31-05 | | | 6.76 | | | | 0.95 | | | | 0.95 | | | | 0.95 | | | | 1.18 | | | | 30,125 | | | | 94 | | |
| 12-31-04 | | | 9.88 | | | | 0.94 | | | | 0.94 | | | | 0.94 | | | | 1.36 | | | | 3,505 | | | | 16 | | |
| ING Intermediate Bond Portfolio | |
| Class ADV | |
| 06-30-09 | | | 1.53 | | | | 1.01 | | | | 1.01 | † | | | 1.01 | † | | | 3.96 | † | | | 1 | | | | 397 | | |
| 12-31-08 | | | (9.16 | ) | | | 1.01 | | | | 1.00 | † | | | 1.00 | † | | | 4.58 | † | | | 1 | | | | 666 | | |
| 12-31-07 | | | 5.60 | (b) | | | 0.99 | | | | 0.99 | † | | | 0.99 | † | | | 4.77 | † | | | 1 | | | | 438 | | |
| 12-20-06(4)-12-31-06 | | | (0.30 | ) | | | 0.99 | | | | 0.99 | † | | | 0.99 | † | | | 6.82 | † | | | 1 | | | | 390 | | |
| Class I | |
| 06-30-09 | | | 2.13 | | | | 0.51 | | | | 0.51 | † | | | 0.51 | † | | | 4.20 | † | | | 1,654,978 | | | | 397 | | |
| 12-31-08 | | | (8.41 | ) | | | 0.51 | | | | 0.50 | † | | | 0.50 | † | | | 5.05 | † | | | 1,803,886 | | | | 666 | | |
| 12-31-07 | | | 5.95 | (b) | | | 0.49 | | | | 0.49 | † | | | 0.49 | † | | | 5.19 | † | | | 2,267,008 | | | | 438 | | |
| 12-31-06 | | | 4.06 | | | | 0.49 | | | | 0.49 | † | | | 0.49 | † | | | 4.97 | † | | | 1,909,376 | | | | 390 | | |
| 12-31-05 | | | 3.14 | | | | 0.49 | | | | 0.49 | | | | 0.49 | | | | 4.14 | | | | 1,148,075 | | | | 589 | | |
| 12-31-04 | | | 4.88 | | | | 0.48 | | | | 0.48 | | | | 0.48 | | | | 3.79 | | | | 1,092,938 | | | | 407 | | |
| Class S | |
| 06-30-09 | | | 2.06 | | | | 0.76 | | | | 0.76 | † | | | 0.76 | † | | | 3.95 | † | | | 1,175,078 | | | | 397 | | |
| 12-31-08 | | | (8.73 | ) | | | 0.76 | | | | 0.75 | † | | | 0.75 | † | | | 4.82 | † | | | 1,153,518 | | | | 666 | | |
| 12-31-07 | | | 5.70 | (b) | | | 0.74 | | | | 0.74 | † | | | 0.74 | † | | | 4.92 | † | | | 1,079,662 | | | | 438 | | |
| 12-31-06 | | | 3.77 | | | | 0.74 | | | | 0.74 | † | | | 0.74 | † | | | 4.69 | † | | | 620,849 | | | | 390 | | |
| 12-31-05 | | | 2.94 | | | | 0.74 | | | | 0.74 | | | | 0.74 | | | | 3.94 | | | | 617,269 | | | | 589 | | |
| 12-31-04 | | | 4.58 | | | | 0.73 | | | | 0.73 | | | | 0.73 | | | | 3.52 | | | | 301,346 | | | | 407 | | |
| Class S2 | |
| 02-27-09(4)-06-30-09 | | | 4.87 | | | | 1.01 | | | | 0.91 | † | | | 0.91 | † | | | 3.75 | † | | | 3 | | | | 397 | | |
| ING Money Market Portfolio(d) | |
| Class I | |
| 06-30-09 | | | 0.20 | | | | 0.36 | | | | 0.36 | | | | 0.36 | | | | 0.41 | | | | 1,583,271 | | | | — | | |
| 12-31-08 | | | 2.67 | | | | 0.35 | | | | 0.35 | | | | 0.35 | | | | 2.66 | | | | 1,798,833 | | | | — | | |
| 12-31-07 | | | 5.13 | | | | 0.33 | | | | 0.33 | | | | 0.33 | | | | 5.03 | | | | 1,711,139 | | | | — | | |
| 12-31-06 | | | 4.88 | | | | 0.34 | | | | 0.34 | | | | 0.34 | | | | 4.79 | | | | 1,355,850 | | | | — | | |
| 12-31-05 | | | 2.98 | | | | 0.35 | | | | 0.35 | | | | 0.35 | | | | 2.93 | | | | 1,073,018 | | | | — | | |
| 12-31-04 | | | 1.06 | | | | 0.34 | | | | 0.34 | | | | 0.34 | | | | 1.11 | | | | 1,101,471 | | | | — | | |
See Accompanying Notes to Financial Statements
18
FINANCIAL HIGHLIGHTS (UNAUDITED) (CONTINUED)
Selected data for a share of beneficial interest outstanding throughout each year or period.
| | | | | Income (loss)
from investment
operations | | | | Less distributions | | | |
| | | Net asset value, beginning of year or period | | Net investment income (loss) | | Net realized and unrealized gain (loss) | | Total from investment operations | | From net investment income | | From net realized gains | | From return of capital | | Total distributions | | Net asset value, end of year or period | |
| | | | | | | | | | | | | | | | | | | | |
| Year or period ended | | ($) | | ($) | | ($) | | ($) | | ($) | | ($) | | ($) | | ($) | | ($) | |
| ING BlackRock Science and Technology Opportunities Portfolio | | | |
| Class ADV | | | |
| 06-30-09 | | | 3.25 | | | | (0.01 | ) | | | 0.61 | | | | 0.60 | | | | — | | | | — | | | | — | | | | — | | | | 3.85 | | |
| 12-16-08(4)-12-31-08 | | | 3.29 | | | | (0.01 | ) | | | (0.03 | ) | | | (0.04 | ) | | | — | | | | — | | | | — | | | | — | | | | 3.25 | | |
| Class I | | | |
| 06-30-09 | | | 3.28 | | | | 0.00 | * | | | 0.62 | | | | 0.62 | | | | — | | | | — | | | | — | | | | — | | | | 3.90 | | |
| 12-31-08 | | | 5.45 | | | | 0.00 | * | | | (2.17 | ) | | | (2.17 | ) | | | — | | | | — | | | | — | | | | — | | | | 3.28 | | |
| 12-31-07 | | | 4.58 | | | | (0.01 | ) | | | 0.88 | | | | 0.87 | | | | — | | | | — | | | | — | | | | — | | | | 5.45 | | |
| 12-31-06 | | | 4.27 | | | | (0.01 | ) | | | 0.32 | | | | 0.31 | | | | — | | | | — | | | | — | | | | — | | | | 4.58 | | |
| 12-31-05 | | | 3.82 | | | | (0.02 | ) | | | 0.47 | | | | 0.45 | | | | — | | | | — | | | | — | | | | — | | | | 4.27 | | |
| 12-31-04 | | | 3.87 | | | | (0.03 | ) | | | (0.02 | ) | | | (0.05 | ) | | | — | | | | — | | | | — | | | | — | | | | 3.82 | | |
| Class S | | | |
| 06-30-09 | | | 3.25 | | | | (0.01 | ) | | | 0.62 | | | | 0.61 | | | | — | | | | — | | | | — | | | | — | | | | 3.86 | | |
| 12-31-08 | | | 5.42 | | | | (0.01 | ) | | | (2.16 | ) | | | (2.17 | ) | | | — | | | | — | | | | — | | | | — | | | | 3.25 | | |
| 12-31-07 | | | 4.56 | | | | (0.02 | ) | | | 0.88 | | | | 0.86 | | | | — | | | | — | | | | — | | | | — | | | | 5.42 | | |
| 12-31-06 | | | 4.27 | | | | (0.02 | ) | | | 0.31 | | | | 0.29 | | | | — | | | | — | | | | — | | | | — | | | | 4.56 | | |
| 07-20-05(5)-12-31-05 | | | 3.90 | | | | (0.01 | ) | | | 0.38 | | | | 0.37 | | | | — | | | | — | | | | — | | | | — | | | | 4.27 | | |
| 01-01-03 -12-16-03(5) | | | 2.65 | | | | (0.07 | ) | | | 1.09 | | | | 1.02 | | | | — | | | | — | | | | — | | | | — | | | | 3.67 | | |
| 12-31-02 | | | 4.53 | | | | (0.04 | ) | | | (1.84 | ) | | | (1.88 | ) | | | — | | | | — | | | | — | | | | — | | | | 2.65 | | |
| Class S2 | | | |
| 02-27-09(4)-06-30-09 | | | 3.01 | | | | 0.00 | *• | | | 0.85 | | | | 0.85 | | | | — | | | | — | | | | — | | | | — | | | | 3.86 | | |
| | | | | Ratios to average net assets | | Supplemental data | |
| | | Total Return(1) | | Expenses before reductions/additions(2)(3) | | Expenses net of fee waivers and/or recoupments, if any(2)(3) | | Expenses net of all reductions/additions(2)(3) | | Net investment income (loss)(2)(3) | | Net assets, end of year or period | | Portfolio turnover rate | |
| | | | | | | | | | | | | | | | |
| Year or period ended | | (%) | | (%) | | (%) | | (%) | | (%) | | ($000's) | | (%) | |
| ING BlackRock Science and Technology Opportunities Portfolio | |
| Class ADV | |
| 06-30-09 | | | 18.46 | | | | 1.60 | | | | 1.56 | | | | 1.56 | | | | (0.47 | ) | | | 4 | | | | 42 | | |
| 12-16-08(4)-12-31-08 | | | (1.22 | ) | | | 1.58 | | | | 1.56 | | | | 1.56 | | | | (2.08 | ) | | | 3 | | | | 137 | | |
| Class I | |
| 06-30-09 | | | 18.90 | | | | 1.10 | | | | 1.06 | | | | 1.06 | | | | 0.01 | | | | 73,898 | | | | 42 | | |
| 12-31-08 | | | (39.82 | ) | | | 1.08 | | | | 1.06 | | | | 1.06 | | | | 0.09 | | | | 55,899 | | | | 137 | | |
| 12-31-07 | | | 19.00 | | | | 1.08 | | | | 1.08 | | | | 1.08 | | | | (0.24 | ) | | | 97,943 | | | | 84 | | |
| 12-31-06 | | | 7.26 | | | | 1.08 | | | | 1.08 | | | | 1.08 | | | | (0.29 | ) | | | 81,599 | | | | 129 | | |
| 12-31-05 | | | 11.78 | | | | 1.06 | | | | 1.06 | | | | 1.06 | | | | (0.48 | ) | | | 84,523 | | | | 118 | | |
| 12-31-04 | | | (1.29 | ) | | | 1.05 | | | | 1.05 | | | | 1.05 | | | | (0.67 | ) | | | 86,291 | | | | 163 | | |
| Class S | |
| 06-30-09 | | | 18.77 | | | | 1.35 | | | | 1.31 | | | | 1.31 | | | | (0.26 | ) | | | 143,842 | | | | 42 | | |
| 12-31-08 | | | (40.04 | ) | | | 1.33 | | | | 1.31 | | | | 1.31 | | | | (0.02 | ) | | | 89,548 | | | | 137 | | |
| 12-31-07 | | | 18.86 | | | | 1.33 | | | | 1.33 | | | | 1.33 | | | | (0.50 | ) | | | 1,140 | | | | 84 | | |
| 12-31-06 | | | 6.79 | | | | 1.33 | | | | 1.33 | | | | 1.33 | | | | (0.51 | ) | | | 551 | | | | 129 | | |
| 07-20-05(5)-12-31-05 | | | 9.49 | | | | 1.31 | | | | 1.31 | | | | 1.31 | | | | (0.73 | ) | | | 78 | | | | 118 | | |
| 01-01-03 -12-16-03(5) | | | 38.49 | | | | 1.35 | | | | 1.35 | | | | 1.36 | | | | (1.13 | ) | | | — | | | | 15 | | |
| 12-31-02 | | | (41.50 | ) | | | 1.36 | | | | 1.36 | | | | 1.37 | | | | (1.14 | ) | | | 7 | | | | 61 | | |
| Class S2 | |
| 02-27-09(4)-06-30-09 | | | 28.24 | | | | 1.60 | | | | 1.46 | | | | 1.46 | | | | (0.36 | ) | | | 4 | | | | 42 | | |
(1) Total return is calculated assuming reinvestment of all dividends and capital gain distributions at net asset value and does not reflect the effect of insurance contract charges. Total return for periods less than one year is not annualized.
(2) Annualized for periods less than one year.
(3) Expense ratios reflect operating expenses of a Portfolio. Expenses before reductions do not reflect amounts reimbursed by the Investment Adviser and/or Distributor or reductions from brokerage commission recapture arrangements or other expense offset arrangements and do not represent the amount paid by a Portfolio during periods when reimbursements or reductions occur. Expenses net of fee waivers reflect expenses after reimbursement by the Investment Adviser and/or Distributor but prior to reductions from brokerage commission recapture arrangements or other expense offset arrangements. Expenses net of all reductions represent the net expenses paid by a Portfolio. Net investment income (loss) is net of all such additions or reductions.
(4) Commencement of operations.
(5) Class S was fully redeemed on December 16, 2003 and recommenced operations on July 20, 2005.
* Amount is less than $0.005 or $500 or more than $(0.005).
• Calculated using average number of shares outstanding throughout the period.
† Impact of waiving the advisory fee for the ING Institutional Prime Money Market Fund holding has less than 0.005% impact on the expense ratio and net investment income or loss ratio (Note 4).
(a) There was no impact on total return by the affiliate payment in Note 15.
(b) There was no impact on total return by the affiliate payment.
(c) In 2005, the Investment Adviser fully reimbursed the Portfolio for a loss incurred from a transaction not meeting a Portfolio's investment's guidelines. There was no impact on total return.
(d) NAV and per share amounts have been restated to reflect the stock split that occurred on October 7, 2008. Effective October 7, 2008, the Portfolio converted to a stable share price of $1.00 per share. In connection with this change, the Portfolio utilized a stock split and distributed additional shares to its shareholders (adjustment factor: 12.926 shares to 1 share) such that each shareholder's proportionate interest and aggregate value of investment in the Portfolio remained the same.
See Accompanying Notes to Financial Statements
19
NOTES TO FINANCIAL STATEMENTS AS OF JUNE 30, 2009 (UNAUDITED)
NOTE 1 — ORGANIZATION
Organization. The ING Variable Product Funds are comprised of ING Balanced Portfolio, Inc., ING Variable Funds, ING Variable Portfolios, Inc., ING Intermediate Bond Portfolio, and ING Money Market Portfolio (collectively, "Registrants"), all of which are open-end investment management companies registered under the Investment Company Act of 1940, as amended ("1940 Act" or "Act").
ING Balanced Portfolio, Inc. is a company incorporated under the laws of Maryland on December 14, 1988 with one portfolio, ING Balanced Portfolio ("Balanced"). ING Variable Funds is a business trust formed under the laws of Massachusetts on January 25, 1984 with one portfolio, ING Growth and Income Portfolio ("Growth and Income"). ING Variable Portfolios, Inc. is a company incorporated under the laws of Maryland on June 4, 1996 and has nineteen separate active portfolios. The four portfolios that are in this report are: ING Opportunistic LargeCap Growth Portfolio ("Opportunistic LargeCap Growth"), ING Small Company Portfolio ("Small Company"), ING Opportunistic LargeCap Portfolio ("Opportunistic LargeCap"), formerly ING Opportunistic LargeCap Value Portfolio and ING BlackRock Science and Technology Opportunities Portfolio ("Science and Technology Opportunities"), formerly ING BlackRock Global Science and Technology Portfolio. ING Intermediat e Bond Portfolio is a business trust formed under the laws of Massachusetts on January 25, 1984 with one portfolio, ING Intermediate Bond Portfolio ("Intermediate Bond"). ING Money Market Portfolio is a business trust formed under the laws of Massachusetts on January 25, 1984 with one portfolio, ING Money Market Portfolio ("Money Market"). Prior to May 1, 2009, Balanced, Growth and Income, Small Company, Intermediate Bond and Money Market contained the "VP" prefix in their name. Each of the portfolios is a "Portfolio" and collectively, they are the "Portfolios".
The following is a brief description of each Portfolio's investment objective:
• Balanced seeks to maximize investment return consistent with reasonable safety of principal, by investing in a diversified portfolio of one or more of the following asset classes: stocks, bonds, and cash equivalents based on the judgment of the Portfolio's management, of which of those sectors or mix thereof offers the best investment prospects;
• Growth and Income seeks to maximize total return through investments in a diversified portfolio of common stocks and securities convertible into common stock;
• Opportunistic LargeCap Growth seeks growth of capital through investment in a diversified portfolio consisting primarily of common stocks and securities convertible into common stock believed to offer growth potential;
• Small Company seeks growth of capital primarily through investment in a diversified portfolio of common stocks and securities of companies with smaller market capitalizations;
• Opportunistic LargeCap seeks growth of capital primarily through investment in a diversified portfolio of common stocks;
• Intermediate Bond seeks to maximize total return consistent with reasonable risk;
• Money Market seeks to provide high current return, consistent with preservation of capital and liquidity, through investment in high-quality money market investments while maintaining a stable share price of $1.00(1); and
• Science and Technology Opportunities seeks long-term capital appreciation.
(1) Effective October 7, 2008, Money Market seeks to maintain a stable share price of $1.00 per share. In connection with this change, the Portfolio utilized a stock split and distributed additional shares to its shareholders such that each shareholder's proportionate interest and aggregate value of investment in the Portfolio remained the same.
Each Portfolio offers Class I and Class S shares. Each Portfolio, except Money Market, offers Adviser ("ADV") Class shares. Each Portfolio, except, Opportunistic LargeCap Growth, Opportunistic LargeCap and Money Market, offers Service 2 Class (Class "S2") shares. The four classes differ principally in applicable distribution and service fees. Shareholders of each class also bear certain expenses that pertain to that particular class. All shareholders bear the common expenses of the Portfolios and earn income and realized gains/losses from the Portfolio pro rata based on the average daily net assets of each class, without discrimination between share classes. Common expenses of the Portfolios (including custodial asset-based fees, legal and audit fees, printing and mailing expenses, transfer agency out-of-pocket expenses, and fees and expenses of the independent directors/trustees) are allocated to each Portfolio in proportion to its average net assets. Expenses directly attributable to a particular Portfolio (including advisory, administration, custodial transaction-based, registration, other professional, distribution and/or service fees, certain taxes, and offering costs) are charged directly to that Portfolio. Differences in per share dividend rates generally result from differences in separate class expenses, including distribution and shareholder service fees, if applicable.
20
NOTES TO FINANCIAL STATEMENTS AS OF JUNE 30, 2009 (UNAUDITED) (CONTINUED)
NOTE 1 — ORGANIZATION (continued)
Shares of the Portfolios may be offered to separate accounts of insurance companies as investment options under variable annuity contracts and variable life insurance policies. Shares may also be offered to qualified pension and retirement plans outside the variable contract and to certain investment advisers and their affiliates. Class I shares may be made available to other investment companies, including series of the companies under fund-of-funds arrangements.
Participating insurance companies and other designated organizations are authorized to receive purchase orders on each Portfolio's behalf.
ING Investments, LLC ("ING Investments'' or the "Investment Adviser"), an Arizona limited liability company, serves as the investment adviser to the Portfolios. ING Investments has engaged ING Investment Management Co. ("ING IM''), a Connecticut corporation, to serve as the sub-adviser to each Portfolio, with the exception of Science and Technology Opportunities. ING Funds Distributor, LLC ("IFD" or the "Distributor") is the principal underwriter of the Portfolios. ING Investments, ING IM and IFD are indirect, wholly-owned subsidiaries of ING Groep N.V. ("ING Groep"). ING Groep is a global financial institution of Dutch origin offering banking, investments, life insurance and retirement services.
On October 19, 2008, ING Groep announced that it reached an agreement with the Dutch government to strengthen its capital position. ING Groep issued non-voting core Tier-1 securities for a total consideration of EUR 10 billion to the Dutch State. The transaction boosts ING Bank's core Tier-1 ratio, strengthens the insurance balance sheet and reduces ING Groep's Debt/Equity ratio.
NOTE 2 — SIGNIFICANT ACCOUNTING POLICIES`
The following significant accounting policies are consistently followed by the Portfolios in the preparation of their financial statements. Such policies are in conformity with U.S. generally accepted accounting principles for investment companies.
A. Security Valuation. Investments in equity securities traded on a national securities exchange are valued at the last reported sale price. Securities reported by NASDAQ are valued at the NASDAQ official closing prices. Securities traded on an exchange or NASDAQ for which there has been no sale and securities traded in the over-the-counter-market are valued at the mean between the last reported bid and ask prices. All investments quoted in foreign currencies are valued daily in U.S. dollars on the basis of the foreign currency exchange rates prevailing at that time. Debt securities acquired with more than 60 days to maturity are fair valued using matrix pricing methods determined by an independent pricing servi ce which takes into consideration such factors as yields, maturities, liquidity, ratings and traded prices in similar or identical securities. Securities for which valuations are not readily available from an independent pricing service may be valued by brokers which use prices provided by market makers or estimates of fair market value obtained from yield data relating to investments or securities with similar characteristics. U.S. government obligations are valued by using market quotations or independent pricing services that use prices provided by market-makers or estimates of market values obtained from yield data relating to instruments or securities with similar characteristics. Investments in open-end mutual funds are valued at net asset value.
Securities and assets for which market quotations are not readily available (which may include certain restricted securities, which are subject to limitations as to their sale) are valued at their fair values, as defined in the 1940 Act, and as determined in good faith by or under the supervision of the Portfolios' Board of Directors/Trustees ("Board"), in accordance with methods that are specifically authorized by the Board. Securities traded on exchanges, including foreign exchanges, which close earlier than the time that a Portfolio calculates its net asset value ("NAV") may also be valued at their fair values as defined by the 1940 Act, and as determined in good faith by or under the supervision of the Board, in accordance with methods that are specifically authorized by the Board. The valuation techniques applied in any specific instance are likely to vary from case to case. With respect to a restricted security, for example, considerat ion is generally given to the cost of the investment, the market value of any unrestricted securities of the same class at the time of valuation, the potential expiration of restrictions on the security, the existence of any registration rights, the costs to the Portfolios related to registration of the security, as well as factors relevant to the issuer itself. Consideration may also be given to the price and extent of any public trading in similar securities of the issuer or comparable companies' securities. The value of a foreign security traded on an exchange outside the United States is generally based on its price on the principal
21
NOTES TO FINANCIAL STATEMENTS AS OF JUNE 30, 2009 (UNAUDITED) (CONTINUED)
NOTE 2 — SIGNIFICANT ACCOUNTING POLICIES (continued)
foreign exchange where it trades as of the time a Portfolio determines its NAV or if the foreign exchange closes prior to the time a Portfolio determines its NAV, the most recent closing price of the foreign security on its principal exchange. Trading in certain non-U.S. securities may not take place on all days on which the New York Stock Exchange ("NYSE") is open. Further, trading takes place in various foreign markets on days on which the NYSE is not open. Consequently, the calculation of a Portfolio's NAV may not take place contemporaneously with the determination of the prices of securities held by a Portfolio in foreign securities markets. Further, the value of a Portfolio's assets may be significantly affected by foreign trading on days when a shareholder cannot purchase or redeem shares of a Portfolio. In calculating a Portfolio's NAV, foreign securities denominated in foreign currency are converted to U.S. dollar equivalents. If an event occurs after the time at which the market for foreign securities held by a Portfolio closes but before the time that a Portfolio's NAV is calculated, such event may cause the closing price on the foreign exchange to not represent a readily available reliable market value quotation for such securities at the time a Portfolio determines its NAV. In such a case, a Portfolio will use the fair value of such securities as determined under a Portfolio's valuation procedures. Events after the close of trading on a foreign market that could require a Portfolio to fair value some or all of its foreign securities include, among others, securities trading in the U.S. and other markets, corporate announcements, natural and other disasters, and political and other events. Among other elements of analysis in the determination of a security's fair value, the Board has authorized the use of one or more independent research services to assist with such determinations. An independent research service may use statistical analyses and quantitative models to help determine fair value as of the time a Portfolio calculates its NAV. There can be no assurance that such models accurately reflect the behavior of the applicable markets or the effect of the behavior of such markets on the fair value of securities, or that such markets will continue to behave in a fashion that is consistent with such models. Unlike the closing price of a security on an exchange, fair value determinations employ elements of judgment. Consequently, the fair value assigned to a security may not represent the actual value that a Portfolio could obtain if it were to sell the security at the time of the close of the NYSE. Pursuant to procedures adopted by the Board, a Portfolio is not obligated to use the fair valuations suggested by any research service, and valuation recommendations provided by such research services may be overridden if other events have occurred or if other fair valu ations are determined in good faith to be more accurate. Unless an event is such that it causes a Portfolio to determine that the closing prices for one or more securities do not represent readily available reliable market value quotations at the time a Portfolio determines its NAV, events that occur between the time of the close of the foreign market on which they are traded and the close of regular trading on the NYSE will not be reflected in a Portfolio's NAV. Investments in securities maturing in 60 days or less from date of acquisition are valued at amortized cost which approximates market value.
Money Market uses the amortized cost method to value its portfolio securities, which approximates market value. The amortized cost method involves valuing a security at its cost and amortizing any discount or premium over the period until maturity, regardless of the impact of fluctuating interest rates or the market value of the security.
Effective for fiscal years beginning after November 15, 2007, Financial Accounting Standards Board ("FASB") Statement of Financial Accounting Standards No. 157, "Fair Value Measurements", establishes a hierarchy for measuring fair value of assets and liabilities. As required by the standard, each investment asset or liability of the Portfolios is assigned a level at measurement date based on the significance and source of the inputs to its valuation. Quoted prices in active markets for identical securities are classified as "Level 1", inputs other than quoted prices for an asset or liability that are observable are classified as "Level 2" and unobservable inputs, including the sub-adviser's judgment about the assumptions that a market participant would use in pricing an asset or liability are classified as "Level 3". The inputs used for valuing securities are not necessarily an indication of the risks associated with investing in those secur ities. A table summarizing each Portfolio's investments under these levels of classification is included following the Portfolios of Investments. For the six months ended June 30, 2009, there have been no significant changes to the fair valuation methodologies.
Effective for fiscal years and interim periods ending after November 15, 2008, the FASB issued
22
NOTES TO FINANCIAL STATEMENTS AS OF JUNE 30, 2009 (UNAUDITED) (CONTINUED)
NOTE 2 — SIGNIFICANT ACCOUNTING POLICIES (continued)
FASB Staff Position ("FSP") No. FAS 133-1 and FASB Interpretation Number ("FIN") 45-4, "Disclosures about Credit Derivatives and Certain Guarantees: An Amendment of FASB Statement No. 133 and FASB Interpretation No. 45; and Clarification of the Effective Date of FASB Statement No. 161." The amendments to FAS 133 require enhanced disclosure regarding credit derivatives sold, including (1) the nature and terms of the credit derivative, reasons for entering into the credit derivative, the events or circumstances that would require the seller to perform under the credit derivative, and the current status of the payment/performance risk of the credit derivative, (2) the maximum potential amount of future payments (undiscounted) the seller could be required to make under the credit derivative, (3) the fair value of the credit derivative, and (4) the nature of any recourse provisions and assets held either as collateral or by third parties. The ame ndments to FIN 45 require additional disclosures about the current status of the payment/performance risk of a guarantee. All changes to accounting policies have been made in accordance with the FSP and incorporated for the current period as part of the Notes to Financial Statements and Portfolio of Investments.
On March 19, 2008, the FASB issued Statement of Financial Accounting Standards No. 161 ("SFAS No. 161"), "Disclosure about Derivative Instruments and Hedging Activities." This new accounting statement requires enhanced disclosures about an entity's derivative and hedging activities. Entities are required to provide enhanced disclosures about (a) how and why an entity invests in derivatives, (b) how derivatives are accounted for under SFAS No. 133, and (c) how derivatives affect an entity's financial position, financial performance, and cash flows. SFAS No. 161 also requires enhanced disclosures regarding credit-risk-related contingent features of derivative instruments. All changes to disclosures have been made in accordance with SFAS 161 and have been incorporated for the current period as part of the Notes to Financial Statements and Portfolio of Investments.
On April 9, 2009, the FASB issued FASB Staff Position No. FAS 157-4, Determining Fair Value When the Volume and Level of Activity for the Asset or Liability Have Significantly Decreased and Identifying Transactions That Are Not Orderly ("FSP 157-4"). FSP 157-4 requires enhanced disclosures about the inputs and valuation technique(s) used to measure fair value and a discussion of changes in valuation techniques and related inputs, if any, during the period. In addition, the three-level hierarchy disclosure and the level three roll-forward disclosure are to be expanded for each major category of equity and debt securities. There was no change to the financial position of the Portfolios and the results of their operations due to the adoption of FSP 157-4 and all disclosures have been made for the current period as part of the Notes to Financial Statements and Portfolio of Investments.
B. Security Transactions and Revenue Recognition. Securities transactions are accounted for on the trade date. Realized gains and losses are reported on the basis of identified cost of securities sold. Interest income is recorded on an accrual basis. Dividend income is recorded on the ex-dividend date, or for certain foreign securities, when the information becomes available to the Portfolios. Premium amortization and discount accretion are determined by the effective yield method.
C. Foreign Currency Translation. The books and records of the Portfolios are maintained in U.S. dollars. Any foreign currency amounts are translated into U.S. dollars on the following basis:
(1) Market value of investment securities, other assets and liabilities — at the exchange rates prevailing at the end of the day.
(2) Purchases and sales of investment securities, income and expenses — at the rates of exchange prevailing on the respective dates of such transactions.
Although the net assets and the market values are presented at the foreign exchange rates at the end of the day, the Portfolios do not isolate the portion of the results of operations resulting from changes in foreign exchange rates on investments from the fluctuations arising from changes in market prices of securities held. Such fluctuations are included with the net realized and unrealized gains or losses from investments. For securities, which are subject to foreign withholding tax upon disposition, liabilities are recorded on the Statements of Assets and Liabilities for the estimated tax withholding based on the securities' current market value. Upon disposition, realized gains or losses on such securities are recorded net of foreign withholding tax.
23
NOTES TO FINANCIAL STATEMENTS AS OF JUNE 30, 2009 (UNAUDITED) (CONTINUED)
NOTE 2 — SIGNIFICANT ACCOUNTING POLICIES (continued)
Reported net realized foreign exchange gains or losses arise from sales of foreign currencies, currency gains or losses realized between the trade and settlement dates on securities transactions, the difference between the amounts of dividends, interest, and foreign withholding taxes recorded on a Portfolio's books, and the U.S. dollar equivalent of the amounts actually received or paid. Net unrealized foreign exchange gains and losses arise from changes in the value of assets and liabilities other than investments in securities at fiscal year end, resulting from changes in the exchange rate. Foreign security and currency transactions may involve certain considerations and risks not typically associated with investing in U.S. companies and U.S. government securities. These risks include, but are not limited to, revaluation of currencies and future adverse political and economic developments, which could cause securities and their markets to be less liquid and prices more volatile than those of comparable U.S. companies and U.S. government securities.
D. Risk Exposures and the use of Derivative Instruments. The Portfolios' investment objectives permit the Portfolios to enter into various types of derivatives contracts, including, but not limited to, futures contracts, forward foreign currency exchange contracts, credit default swaps, interest rate swaps, total return swaps, and purchased and written options. In doing so, a Portfolio will employ strategies in differing combinations to permit it to increase or decrease the level of risk, or change the level or types of exposure to market risk factors. This may allow a Portfolio to pursue its objectives more quickly, and efficiently than if it were to make direct purchases or sales of securities capable of affecting a similar response to market factors.
Market Risk Factors. In pursuit of its investment objectives, a Portfolio may seek to use derivatives to increase or decrease its exposure to the following market risk factors:
Credit Risk. Credit risk relates to the ability of the issuer to meet interest and principal payments, or both, as they come due. In general, lower-grade, higher-yield bonds are subject to credit risk to a greater extent than lower-yield, higher-quality bonds.
Equity Risk. Equity risk relates to the change in value of equity securities as they relate to increases or decreases in the general market.
Foreign Exchange Rate Risk. Foreign exchange rate risk relates to the change in U.S. dollar value of a security held that is denominated in a foreign currency. The U.S. dollar value of a foreign currency denominated security will decrease as the dollar appreciates against the currency, while the U.S. dollar value will increase as the dollar depreciates against the currency.
Interest Rate Risk. Interest rate risk refers to the fluctuations in value of fixed-income securities resulting from the inverse relationship between price and yield. For example, an increase in general interest rates will tend to reduce the market value of already issued fixed-income investments, and a decline in general interest rates will tend to increase their value. In addition, debt securities with longer maturities, which tend to have higher yields, are subject to potentially greater fluctuations in value from changes in interest rates than obligations with shorter maturities.
Risks of Investing in Derivatives. A Portfolio's use of derivatives can result in losses due to unanticipated changes in the market risk factors and the overall market. In instances where a Portfolio is using derivatives to decrease, or hedge, exposures to market risk factors for securities held by a Portfolio, there are also risks that those derivatives may not perform as expected resulting in losses for the combined or hedged positions.
The use of these strategies involves certain special risks, including a possible imperfect correlation, or even no correlation, between price movements of derivative instruments and price movements of related investments. While some strategies involving derivative instruments can reduce the risk of loss, they can also reduce the opportunity for gain or even result in losses by offsetting favorable price movements in related investments or otherwise, due to the possible inability of a Portfolio to purchase or sell a portfolio security at a time that otherwise would be favorable or the possible need to sell a portfolio security at a disadvantageous time because the Portfolio is required to maintain asset coverage or offsetting positions in connection with transactions in derivative instruments. Additional associated risks from investing in derivatives also exist and potentially could have significant effects on the valuation of the derivative and a Portfolio. Associated risks are not the risks that a Portfolio is attempting to increase or decrease exposure to, per their investment objectives, but are the additional risks from investing in derivatives. Examples of
24
NOTES TO FINANCIAL STATEMENTS AS OF JUNE 30, 2009 (UNAUDITED) (CONTINUED)
NOTE 2 — SIGNIFICANT ACCOUNTING POLICIES (continued)
these associated risks are liquidity risk, which is the risk that a Portfolio will not be able to sell the derivative in the open market in a timely manner, and counterparty credit risk, which is the risk that the counterparty will not fulfill its obligation to a Portfolio. Associated risks can be different for each type of derivative and are discussed by each derivative type in the following notes.
Counterparty Credit Risk. Certain derivative positions are subject to counterparty credit risk, which is the risk that the counterparty will not fulfill its obligation to a Portfolio. Each Portfolio's derivative counterparties are financial institutions who are subject to market conditions that may weaken their financial position. A Portfolio intends to enter into financial transactions with counterparties that they believe to be creditworthy at the time of the transaction. To reduce this risk, a Portfolio has entered into master netting arrangements, established within the Portfolios' International Swap and Derivatives Association, Inc. ("ISDA") Master Agreements. These agreements are with select counterparties and they govern transactions, including certain over-the counter derivative and foreign exchange contracts, entered into by a Portfolio and the counterpar ty. The ISDA Master Agreements maintain provisions for general obligations, representations, agreements, collateral, and events of default or termination. The occurrence of a specified event of termination may give a counterparty the right to terminate all of its contracts and affect settlement of all outstanding transactions under the applicable ISDA Master Agreement.
A Portfolio may also enter into collateral agreements with certain counterparties to further mitigate counterparty risk on swaps, OTC derivatives and forward foreign currency contracts. Subject to established minimum levels, collateral is generally determined based on the net aggregate unrealized gain or loss on contracts with a certain counterparty. Collateral pledged to a Portfolio is held in a segregated account by a third-party agent and can be in the form of cash or debt securities issued by the U.S. government or related agencies. At June 30, 2009, Intermediate Bond has pledged $1,130,000 in collateral to various counterparties. The collateral is being held by a third-party agent and is not reflected on the Statement of Assets and Liabilities.
E. Forward Foreign Currency Transactions and Futures Contracts. Certain Portfolios may enter into foreign currency exchange transactions to convert to and from different foreign currencies and to and from the U.S. dollar in connection with the planned purchases or sales of securities. When entering into a forward foreign currency contract, a Portfolio agrees to receive or deliver a fixed quantity of foreign currency for an agreed-upon price on an agreed future date. A Portfolio either enters into these transactions on a spot basis at the spot rate prevailing in th e foreign currency exchange market or uses forward foreign currency contracts to purchase or sell foreign currencies. When the contract is fulfilled or closed, gains or losses are realized. Until then, the gain or loss is included in unrealized appreciation or depreciation. Risks may arise upon entering into forward contracts from the potential inability of counterparties to meet the terms of their forward contracts and from unanticipated movements in the value of foreign currencies relative to the U.S. dollar.
For the six months ended June 30, 2009, Science and Technology Opportunities has entered into forward foreign currency contracts with the obligation to buy and sell specified foreign currencies in the future at a currently negotiated forward rate in order to increase or decrease exposure to foreign exchange rate risk. The Portfolio uses forward foreign currency contracts to enhance potential gain, hedge against anticipated currency exchange rates, gain exposure to foreign currencies and to maintain diversity and liquidity of the portfolio.
For the six months ended June 30, 2009, the total amount of all open forward foreign currency contracts as presented following the Portfolio of Investments is indicative of the volume of this derivative type.
Each Portfolio, with the exception of Money Market, may enter into futures contracts involving foreign currency, interest rates, securities and security indices. A futures contract is a commitment to buy or sell a specific amount of a financial instrument at a negotiated price on a stipulated future date. A Portfolio may buy and sell futures contracts. Futures contracts traded on a commodities or futures exchange will be valued at the final settlement price or official closing price on the principal exchange as reported by such principal exchange at its trading session ending at, or most recently prior to, the time when each Portfolio's assets are valued.
Upon entering into a futures contract, a Portfolio is required to deposit either cash or securities (initial margin) in an amount equal to a certain percentage of the contract value. Subsequent payments (variation margin) are made or received by a Portfolio each day. The variation margin
25
NOTES TO FINANCIAL STATEMENTS AS OF JUNE 30, 2009 (UNAUDITED) (CONTINUED)
NOTE 2 — SIGNIFICANT ACCOUNTING POLICIES (continued)
payments are equal to the daily changes in the contract value and are recorded as unrealized gains and losses. Open futures contracts are reported on a table following each Portfolio's Portfolio of Investments. Securities held in collateralized accounts to cover initial margin requirements on open futures contracts are footnoted in the Portfolio of Investments. Cash collateral held by the broker to cover initial margin requirements on open futures contracts are noted in the Statements of Assets and Liabilities. The net change in unrealized appreciation and depreciation is reported in the Statements of Operations. Realized gains (losses) are reported in the Statements of Operations at the closing or expiration of futures contracts.
Futures contracts are exposed to the market risk factor of the underlying financial instrument. During the six months ended June 30, 2009, Balanced, Growth and Income, and Intermediate Bond have purchased futures contracts on various equity indexes to increase exposure to equity risk. Balanced and Intermediate Bond also purchased futures contracts on various bonds and notes to increase exposure to interest rate risk. In addition, Balanced and Intermediate Bond sold futures contracts on various bonds and notes to decrease exposure to interest rate risk. Additional associated risks of entering into futures contracts include the possibility that there may be an illiquid market where a Portfolio is unable to liquidate the contract or enter into an offsetting position and, if used for hedging purposes, the risk that the price of the contract will correlate imperfectly with the prices of a Portfolio's securities. For the six months ended June 30, 2009, the total amount of all open futures contracts as presented following each Portfolio of Investments is indicative of the volume of this derivative type.
F. Distributions to Shareholders. The Portfolios record distributions to their shareholders on the ex-dividend date. Balanced, Opportunistic LargeCap Growth, Small Company, Opportunistic LargeCap and Science and Technology Opportunities declare and pay dividends annually. Growth and Income and Intermediate Bond, declare and pay dividends semi-annually. Money Market declares dividends daily and pays dividends, if any, monthly. Each Portfolio distributes capital gains, if any, annually. The Portfolios may make distributions on a more frequent basis to comply with the distribution requirements of the Internal Revenue Code. The characteristics of income and gains to be distributed are determined in accordance with i ncome tax regulations, which may differ from U.S. generally accepted accounting principles for investment companies.
G. Federal Income Taxes. It is the policy of the Portfolios to comply with subchapter M of the Internal Revenue Code and related excise tax provisions applicable to regulated investment companies and to distribute substantially all of their net investment income and any net realized capital gains to their shareholders. Therefore, no federal income tax provision is required. Management has considered the sustainability of each Portfolio's tax positions taken on federal income tax returns for all open tax years in making this determination. No capital gain distributions shall be made until any capital loss carryforwards have been fully utilized or expired.
H. Use of Estimates. The preparation of financial statements in conformity with U.S. generally accepted accounting principles requires management to make estimates and assumptions that affect the reported amounts of assets and liabilities and disclosure of contingent assets and liabilities at the date of the financial statements and the reported amounts of increases and decreases in net assets from operations during the reporting period. Actual results could differ from those estimates.
I. Repurchase Agreements. Each Portfolio may invest in repurchase agreements only with government securities dealers recognized by the Board of Governors of the Federal Reserve System. Under such agreements, the seller of the security agrees to repurchase it at a mutually agreed upon time and price. The resale price is in excess of the purchase price and reflects an agreed upon interest rate for the period of time the agreement is outstanding. The period of the repurchase agreements is usually short, from overnight to one week, while the underlying securities generally have longer maturities. Each Portfolio will receive as collateral securities acceptable to it whose market value is equal to at least 100% of the carrying amount of the repurchase agreements, plus accrued interest, be ing invested by the Portfolio. The underlying collateral is valued daily on a mark-to-market basis to assure that the value, including accrued interest is at least equal to the repurchase price. There would be potential loss to the Portfolio in the event the Portfolio is delayed or prevented from exercising its right to dispose of the collateral, and it might incur disposition costs in liquidating the collateral.
26
NOTES TO FINANCIAL STATEMENTS AS OF JUNE 30, 2009 (UNAUDITED) (CONTINUED)
NOTE 2 — SIGNIFICANT ACCOUNTING POLICIES (continued)
J. Securities Lending. Each Portfolio has the option to temporarily loan up to 331/3% of its total assets to brokers, dealers or other financial institutions in exchange for a negotiated lender's fee. The borrower is required to fully collateralize the loans with cash or U.S. government securities. Generally, in the event of counterparty default, a Portfolio has the right to use collateral to offset losses incurred. There would be potential loss to a Portfolio in the event a Por tfolio is delayed or prevented from exercising its right to dispose of the collateral. A Portfolio bears the risk of loss with respect to the investment of collateral. Engaging in securities lending could have a leveraging effect, which may intensify the credit, market and other risks associated with investing in a Portfolio.
K. Illiquid and Restricted Securities. Each Portfolio may not invest more than 15% (10% for Money Market) of its net assets in illiquid securities. Illiquid securities are not readily marketable. Disposing of illiquid investments may involve time-consuming negotiation and legal expenses, and it may be difficult or impossible for the Portfolios to sell them promptly at an acceptable price. The Portfolios may also invest in restricted securities, which include those sold under Rule 144A of the Securities Act of 1933 ("1933 Act") or securities offered pursuant to Section 4(2) of the 1933 Act, and/or are subject to legal or contractual restrictions on resale and may not be publicly sold without registration under the 1933 Act. Certain restricted securities may be considered liquid pursu ant to guidelines approved by the Board or may be deemed to be illiquid because they may not be readily marketable. Illiquid and restricted securities are valued using market quotations when readily available. In the absence of market quotations, the securities are valued based upon their fair value, as defined by the Act, determined under procedures approved by the Board.
L. When-Issued and Delayed-Delivery Transactions. Each Portfolio may purchase or sell securities on a when-issued or forward commitment basis. The price of the underlying securities and date when the securities will be delivered and paid for are fixed at the time the transaction is negotiated. The market value of such is identified in the Portfolio of Investments. Losses may arise due to changes in the market value of the securities or from the inability of counterparties to meet the terms of the contract. In connection with such purchases, the Portfolios are required to hold liquid assets as collateral with the Portfolios' custodian sufficient to cover the purchase price.
M. Mortgage Dollar Roll Transactions. Each Portfolio, except Opportunistic LargeCap Growth and Small Company, may engage in dollar roll transactions with respect to mortgage-backed securities issued by Government National Mortgage Association, Federal National Mortgage Association and Federal Home Loan Mortgage Corp. In a dollar roll transaction, a Portfolio sells a mortgage-backed security to a financial institution, such as a bank or broker/dealer, and simultaneously agrees to repurchase a substantially similar (i.e., same type, coupon, and maturity) security from the institution on a delayed delivery basis at an agreed upon price. The mortgage-backed securities that are repurchased will bear the same interest rate as those sold, but generally will be collateralized by different p ools of mortgages with different prepayment histories. The Portfolios account for dollar roll transactions as purchases and sales.
N. Swap Agreements. Certain Portfolios may enter into swap agreements. A swap is an agreement between two parties pursuant to which each party agrees to make one or more payments to the other at specified future intervals based on the return of an asset (such as a stock, bond or currency) or non-asset reference (such as an interest rate or index). The swap agreement will specify the "notional" amount of the asset or non-asset reference to which the contract relates. Subsequent changes in market value, if any, are calculated based upon changes in the performance of the asset or non-asset reference multiplied by the notional value of the contract. A Portfolio may enter into credit default, interest rate, total return and currency swaps to manage its exposure to credit, currency and in terest rate risk. All outstanding swap agreements are reported following each Portfolio's Portfolio of Investments.
Swaps are marked to market daily using quotations primarily from third party pricing services, counterparties or brokers. The value of the swap contract is recorded on each Portfolio's Statements of Assets or Liabilities. During the term of the swap, changes in the value of the swap, if any, are recorded as unrealized gains or losses on the Statements of Operations. Upfront payments paid or received by a Portfolio when entering into the agreements are reported on the Statements of Assets and Liabilities and as a component of the changes in unrealized gains or losses on the Statements of Operations. These upfront payments represent the amounts paid or received when initially entering into the swap agreement to compensate for differences between the stated
27
NOTES TO FINANCIAL STATEMENTS AS OF JUNE 30, 2009 (UNAUDITED) (CONTINUED)
NOTE 2 — SIGNIFICANT ACCOUNTING POLICIES (continued)
terms of the swap agreement and the prevailing market conditions. The upfront payments are included as a component in the realized gains or losses on each Portfolio's Statement of Operations upon termination or maturity of the swap. A Portfolio also records net periodic payments paid or received on the swap contract as a realized gain or loss on the Statements of Operations.
Entering into swap agreements involves the risk that the maximum potential loss of an investment exceeds the current value of the investment as reported on each Portfolio's Statements of Assets and Liabilities. Other risks involve the possibility that the counterparty to the agreements may default on its obligation to perform, that there will be no liquid market for these investments and that unfavorable changes in the market will have a negative impact on the value of the index or securities underlying the respective swap agreement.
Credit Default Swap Contracts. A credit default swap is a bilateral agreement between counterparties in which the buyer of the protection agrees to make a stream of periodic payments to the seller of protection in exchange for the right to receive a specified return in the event of a default or other credit event for a referenced entity, obligation or index. As a seller of protection on credit default swaps, a Portfolio will generally receive from the buyer a fixed payment stream based on the notional amount of the swap contract. This fixed payment stream will continue until the swap contract expires or a defined credit event occurs.
A Portfolio is subject to credit risk in the normal course of pursuing its investment objectives. As a seller of protection in a credit default swap, a Portfolio may execute these contracts to manage its exposure to the market or certain sectors of the market. Certain Portfolios may also enter into credit default swaps to speculate on changes in an issuer's credit quality, to take advantage of perceived spread advantages, or to offset an existing short equivalent (i.e. buying protection on an equivalent reference entity).
Certain Portfolios may sell credit default swaps which expose these Portfolios to the risk of loss from credit risk- related events specified in the contract. Although contract specific, credit events are generally defined as bankruptcy, failure to pay, restructuring, obligation acceleration, obligation default or repudiation/moratorium. If a Portfolio is a seller of protection, and a credit event occurs, as defined under the terms of that particular swap agreement, a Portfolio will generally either (i) pay to the buyer an amount equal to the notional amount of the swap and take delivery of the referenced obligation, other deliverable obligations, or underlying securities comprising a referenced index or (ii) pay a net settlement amount in the form of cash or securities equal to the notional amount of the swap less the recovery value of the referenced obligation or unde rlying securities comprising a referenced index. If a Portfolio is a buyer of protection and a credit event occurs, as defined under the terms of that particular swap agreement, a Portfolio will either (i) receive from the seller of protection an amount equal to the notional amount of the swap and deliver the referenced obligation, other deliverable obligations or underlying securities comprising the referenced index or (ii) receive a net settlement amount in the form of cash or securities equal to the notional amount of the swap less the recovery value of the referenced obligation or underlying securities comprising the referenced index. Recovery values are assumed by market makers considering either industry standard recovery rates or entity specific factors and considerations until a credit event occurs. If a credit event has occurred, the recovery value is determined by a facilitated auction whereby a minimum number of allowable broker bids, together with a specified valuation method, are used to calcula te the settlement value.
Implied credit spreads, represented in absolute terms, utilized in determining the market value of credit default swap agreements on corporate issues or sovereign issues are disclosed in each Portfolio's Portfolio of Investment and serve as an indicator of the current status of the payment/performance risk and represent the likelihood or risk of default for the credit derivative. The implied credit spread of a particular referenced entity reflects the cost of buying/selling protection and may include upfront payments required to be made to enter into the agreement. For credit default swaps on asset-backed securities or credit indices, the quoted market prices and resulting market values serve as the indicator of the current status of the payment/performance risk. Wider credit spreads and increasing market values, in absolute terms when compared to the notional amount of the swap, represent a deterioration of the referenced entity's credit so undness and a greater likelihood
28
NOTES TO FINANCIAL STATEMENTS AS OF JUNE 30, 2009 (UNAUDITED) (CONTINUED)
NOTE 2 — SIGNIFICANT ACCOUNTING POLICIES (continued)
or risk of default or other credit event occurring as defined under the terms of the agreement.
The maximum amount of future payments (undiscounted) that a Portfolio as seller of protection could be required to make under a credit default swap agreement would be an amount equal to the notional amount of the agreement. Notional amounts of all credit default swap agreements outstanding as of June 30, 2009, for which a Portfolio is seller of protection are disclosed in each Portfolio's Portfolio of Investments. These potential amounts would be partially offset by any recovery values of the respective referenced obligations, upfront payments received upon entering into the agreements, or net amounts received from the settlement of buy protection credit default swap agreements entered into by a Portfolio for the same referenced entity or entities.
For the six months ended June 30, 2009, both Balanced and Intermediate Bond have purchased credit protection through credit default swaps to decrease exposure to the credit risk of individual securities and to hedge against anticipated potential credit events.
For the six months ended June 30, 2009, both Balanced and Intermediate Bond have sold credit protection through credit default swaps to gain exposure to the credit risk of individual securities that are either unavailable or considered to be less attractive in the bond market.
Balanced and Intermediate Bond invest in derivatives only if the expected risks and rewards are consistent with their investment objectives, and overall risk profile as described in the accompanying Notes to Financial Statements. For the six months ended June 30, 2009, the total notional amount of all open swap positions as presented following each Portfolio of Investments is indicative of the volume of this derivative type.
O. Indemnifications. In the normal course of business, the Registrants may enter into contracts that provide certain indemnifications. The Registrants' maximum exposure under these arrangements is dependent on future claims that may be made against the Portfolios and, therefore, cannot be estimated; however, based on experience, the risk of loss from such claims is considered remote.
NOTE 3 — INVESTMENT TRANSACTIONS
For the six months ended June 30, 2009, the cost of purchases and the proceeds from the sales of securities, excluding short-term and U.S. government securities, were as follows:
| | | Purchases | | Sales | |
| Balanced | | $ | 329,576,212 | | | $ | 397,852,039 | | |
| Growth and Income | | | 979,481,665 | | | | 967,903,404 | | |
| Opportunistic LargeCap Growth | | | 50,133,465 | | | | 53,238,350 | | |
| Small Company | | | 351,481,160 | | | | 326,332,461 | | |
| Opportunistic LargeCap | | | 105,971,811 | | | | 110,602,333 | | |
| Intermediate Bond | | | 975,024,878 | | | | 1,201,001,539 | | |
Science and Technology
Opportunities | | | 115,472,734 | | | | 68,217,960 | | |
U.S. government securities not included above were as follows:
| | | Purchases | | Sales | |
| Balanced | | $ | 717,779,017 | | | $ | 689,125,300 | | |
| Intermediate Bond | | | 11,712,045,051 | | | | 11,485,479,031 | | |
NOTE 4 — INVESTMENT MANAGEMENT AND ADMINISTRATIVE FEES
The Portfolios entered into investment management agreements ("Investment Management Agreements") with the Investment Adviser. The Investment Management Agreements compensate the Investment Adviser with a fee, computed daily and payable monthly, based on the average daily net assets of each Portfolio, at the following annual rates:
| Balanced | | | 0.500 | % | |
| Growth and Income | | | 0.500% on first $10 billion;
0.450% on next $5 billion; and
0.425% over $15 billion | | |
| Opportunistic LargeCap Growth | | | 0.600 | % | |
| Small Company | | | 0.750 | % | |
| Opportunistic LargeCap | | | 0.600 | % | |
| Intermediate Bond | | | 0.400 | % | |
| Money Market | | | 0.250 | % | |
Science and Technology
Opportunities | | | 0.950 | % | |
The Investment Adviser entered into sub-advisory agreements with ING IM. ING IM acts as sub-adviser to all Portfolios except for Science and Technology Opportunities. Subject to such policies as the Board or the Investment Adviser may determine, ING IM manages the Portfolios' assets in accordance with the Portfolios' investment objectives, policies, and limitations.
BlackRock Advisors, LLC ("BlackRock"), serves as Sub-Adviser to Science and Technology Opportunities pursuant to a Sub-Advisory Agreement, effective February 2, 2007, between the Investment Adviser and BlackRock.
ING Portfolios are permitted to invest end-of-day cash balances into ING Institutional Prime Money Market
29
NOTES TO FINANCIAL STATEMENTS AS OF JUNE 30, 2009 (UNAUDITED) (CONTINUED)
NOTE 4 — INVESTMENT MANAGEMENT AND ADMINISTRATIVE FEES (continued)
Fund. Investment management fees paid by the Portfolios will be reduced by an amount equal to the management fees paid indirectly to ING Institutional Prime Money Market Fund with respect to assets invested by the Portfolios. For the six months ended June 30, 2009, the Investment Adviser for Balanced, Growth and Income, Opportunistic LargeCap Growth, Small Company, Opportunistic LargeCap and Intermediate Bond waived $7,538, $18,781, $212, $4,733, $167, and $42,972 of such management fees, respectively. These fees are not subject to recoupment.
Pursuant to administration agreements, ING Funds Services, LLC ("IFS"), an indirect, wholly-owned subsidiary of ING Groep, acts as administrator and provides certain administrative and shareholder services necessary for Portfolio operations and is responsible for the supervision of other service providers.
IFS is entitled to receive from each Portfolio a fee at an annual rate of 0.055% on the first $5 billion of daily net assets and 0.03% thereafter.
In placing equity security transactions, each sub-adviser is required to use its best efforts to choose a broker capable of providing brokerage services necessary to obtain the best execution for each transaction. Subject to this requirement, each sub-adviser may allocate equity security transactions through certain designated broker-dealers. Some of these broker-dealers participate in commission recapture programs that have been established for the benefit of the Portfolios. Under these programs, the participating broker-dealers will return to a Portfolio a portion of the brokerage commissions (in the form of a credit to a Portfolio) paid to the broker-dealers to pay certain expenses of a Portfolio. These commission recapture payments benefit the Portfolios and not the sub-adviser. Any amount credited to a Portfolio is recognized as brokerage commission recapture in the Statements of Operations.
NOTE 5 — DISTRIBUTION AND SERVICE FEES
ADV Class and Class S2 shares of the respective Portfolios are subject to a Shareholder Service and Distribution Plan (the "Plan"). Under the Plan, the Distributor is paid an annual shareholder service fee at the rate of 0.25% and an annual distribution fee at the rate of 0.25% of the average daily net assets attributable to its ADV Class and Class S2 shares. The Distributor has contractually agreed to waive a portion of its fee equal to 0.10% of the average daily net assets attributable to the distribution fee paid by Class S2 of the Portfolios, so that the actual fee paid by a Portfolio is an annual rate of 0.15%. The expense waiver will continue through at least May 1, 2010.
Class S shares of the Portfolios have adopted Distribution Plans pursuant to Rule 12b-1 under the 1940 Act (the "12b-1 Plans"), whereby the Distributor is compensated by each Portfolio for expenses incurred in the distribution of each Portfolio's shares ("Distribution Fees"). Pursuant to the 12b-1 Plans, the Distributor is entitled to a payment each month to compensate for expenses incurred in the distribution and promotion of each Portfolio's shares, including expenses incurred in printing prospectuses and reports used for sales purposes, expenses incurred in preparing and printing sales literature and other such distribution related expenses, including any distribution or shareholder servicing fees ("Service Fees") paid to securities dealers who have executed a distribution agreement with the Distributor. Under the 12b-1 Plans, Class S shares of the Portfolios pay the Distributor a fee calculated at an annual rate of 0.25% of average daily net assets.
NOTE 6 — OTHER TRANSACTIONS WITH AFFILIATED AND RELATED PARTIES
At June 30, 2009, the Portfolios had the following amounts recorded in payable to affiliates on the accompanying Statements of Assets and Liabilities (see Notes 4 and 5):
| | | Accrued
Investment
Management
Fees | | Accrued
Administrative
Fees | | Accrued
Shareholder
Service and
Distribution
Fees | | Total | |
| Balanced | | $ | 241,730 | | | $ | 26,717 | | | $ | 1,334 | | | $ | 269,781 | | |
| Growth and Income | | | 839,521 | | | | 92,685 | | | | 59,470 | | | | 991,676 | | |
Opportunistic LargeCap
Growth | | | 34,036 | | | | 3,124 | | | | 1,849 | | | | 39,009 | | |
| Small Company | | | 321,557 | | | | 23,641 | | | | 10,716 | | | | 355,914 | | |
| Opportunistic LargeCap | | | 37,950 | | | | 3,484 | | | | 2,162 | | | | 43,596 | | |
| Intermediate Bond | | | 919,044 | | | | 126,878 | | | | 237,149 | | | | 1,283,071 | | |
| Money Market | | | 331,412 | | | | 72,908 | | | | — | | | | 404,320 | | |
Science and Technology
Opportunities | | | 169,585 | | | | 9,818 | | | | 29,432 | | | | 208,835 | | |
The Registrants have adopted a Deferred Compensation Plan (the "Policy"), which allows eligible non-affiliated directors as described in the Policy to defer the receipt of all or a portion of the directors' fees payable. Deferred fees are invested in various funds advised by ING Investments until distribution in accordance with the Policy.
At June 30, 2009, the following ING Portfolios or indirect, wholly owned subsidiaries of ING Groep owned more than 5% of the following Portfolios:
ING Life Insurance and Annuity Company — Balanced (91.40%); Growth and Income (9.40%); Opportunistic
30
NOTES TO FINANCIAL STATEMENTS AS OF JUNE 30, 2009 (UNAUDITED) (CONTINUED)
NOTE 6 — OTHER TRANSACTIONS WITH AFFILIATED AND RELATED PARTIES (continued)
LargeCap Growth (91.40%); Small Company (41.00%); Opportunistic LargeCap Value (83.80%); Intermediate Bond (32.50%); Money Market (98.10%); and Science and Technology Opportunities (33.10%)
ING LifeStyle Growth Portfolio — Small Company (16.10%)
ING LifeSyle Moderate Growth Portfolio — Intermediate Bond (7.30%)
ING LifeSyle Moderate Portfolio — Intermediate Bond (5.30%)
ING Solution 2025 Portfolio — Small Company (9.20%)
ING USA Annuity and Life Insurance Company — Growth and Income (84.80%); Small Company (10.00%); Opportunistic LargeCap (13.10%); Intermediate Bond (40.30%); and Science and Technology Opportunities (63.90%)
Reliastar Life Insurance Company — Opportunistic LargeCap Growth (6.60%)
Control is defined by the 1940 Act as the beneficial ownership, either directly or through one or more controlled companies, of more than 25% of the voting securities of a company. The 1940 Act defines affiliates as companies that are under common control. Therefore, because the Portfolios have a common owner that owns over 25% of the outstanding securities of the Portfolios, they may be deemed to be affiliates of each other. Investment activities of these shareholders could have a material impact on the Portfolios.
NOTE 7 — EXPENSE LIMITATION AGREEMENTS
ING Investments entered into written expense limitation agreements ("Expense Limitation Agreements") with each of the following Portfolios whereby the Investment Adviser has agreed to limit expenses, excluding interest expense, taxes, brokerage commissions and extraordinary expenses (and acquired fund fees and expenses) to the levels listed below:
| | | Class ADV | | Class I | | Class S | | Class S2 | |
Opportunistic LargeCap
Growth | | | 1.30 | % | | | 0.80 | % | | | 1.05 | % | | n/a | |
| Small Company | | | 1.45 | % | | | 0.95 | % | | | 1.20 | % | | | 1.35 | % | |
| Opportunistic LargeCap | | | 1.30 | % | | | 0.80 | % | | | 1.05 | % | | n/a | |
Science and Technology
Opportunities | | | 1.55 | % | | | 1.05 | % | | | 1.30 | % | | | 1.45 | % | |
The Investment Adviser may at a later date recoup from a Portfolio management fees waived and other expenses assumed by the Investment Adviser during the previous 36 months, but only if, after such recoupment, the Portfolio's expense ratio does not exceed the percentage described above. Waived and reimbursed fees net of any recoupment by the Investment Adviser of such waived and reimbursed fees are reflected on the accompanying Statements of Operations. Amounts payable by the Investment Manager are reflected on the accompanying Statements of Assets and Liabilities for each Portfolio.
As of June 30, 2009, the amount of waived and reimbursed fees that are subject to recoupment by the Investment Adviser, and the related expiration dates are as follows:
| | | June 30, | | | |
| | | 2010 | | 2011 | | 2012 | | Total | |
Science and Technology
Opportunities | | $ | — | | | $ | — | | | $ | 72,286 | | | $ | 72,286 | | |
The Expense Limitation Agreements are contractual and shall renew automatically for one-year terms unless ING Investments provides written notice of the termination of an Expense Limitation Agreement within 90 days of the end of the then current term.
NOTE 8 — LINE OF CREDIT
The Portfolios, in addition to certain other portfolios managed by the Investment Adviser, have entered into an unsecured committed revolving line of credit agreement (the "Credit Agreement") with The Bank of New York Mellon for an aggregate amount of $100,000,000. The proceeds may be used to: (1) temporarily finance the purchase or sale of securities; and (2) finance the redemption of shares of an investor in the Portfolios to which the loan is made. The Portfolios to which the line of credit is available pay a commitment fee equal to 0.125% per annum on the daily unused portion of the committed line amount.
Generally, borrowings under the Credit Agreement accrue interest at the federal funds rate plus a specified margin. Repayments generally must be made within 60 days after the date of a revolving credit advance. The following Portfolios utilized the line of credit during the six months ended June 30, 2009:
| | | Days
Utilized | | Approximate
Average Daily
Balance | | Approximate
Weighted
Average
Interest Rate | |
| Growth and Income | | | 42 | | | $ | 804,762 | | | | 1.17 | % | |
| Intermediate Bond(1) | | | 5 | | | | 9,146,000 | | | | 1.17 | | |
(1) At June 30, 2009, Intermediate Bond had an outstanding balance of $2,430,000.
31
NOTES TO FINANCIAL STATEMENTS AS OF JUNE 30, 2009 (UNAUDITED) (CONTINUED)
NOTE 9 — CAPITAL SHARES
Transactions in capital shares and dollars were as follows:
| | | Shares sold | | Proceeds
from shares
issued
in merger | | Reinvestment
of
distributions | | Shares
redeemed | | Net increase
(decrease)
in shares
outstanding | | Shares sold | | Proceeds
from shares
issued
in merger | | Reinvestment
of
distributions | | Shares
redeemed | | Net increase
(decrease) | |
| Year or period ended | | # | | # | | # | | # | | # | | ($) | | ($) | | ($) | | ($) | | ($) | |
| Balanced | | | |
| Class ADV | | | |
| 06-30-09 | | | — | | | | — | | | | — | | | | (1 | ) | | | (1 | ) | | | — | | | | — | | | | — | | | | (8 | ) | | | (8 | ) | |
| 12-31-08 | | | — | | | | — | | | | — | | | | (1 | ) | | | (1 | ) | | | — | | | | — | | | | — | | | | (12 | ) | | | (12 | ) | |
| Class I | | | |
| 06-30-09 | | | 1,836,674 | | | | — | | | | 3,161,486 | | | | (5,656,562 | ) | | | (658,402 | ) | | | 14,958,327 | | | | — | | | | 27,220,392 | | | | (48,648,111 | ) | | | (6,469,392 | ) | |
| 12-31-08 | | | 354,934 | | | | — | | | | 9,121,937 | | | | (16,235,628 | ) | | | (6,758,757 | ) | | | 3,692,548 | | | | — | | | | 110,649,102 | | | | (185,483,682 | ) | | | (71,142,032 | ) | |
| Class S | | | |
| 06-30-09 | | | 20,550 | | | | — | | | | 33,083 | | | | (59,676 | ) | | | (6,043 | ) | | | 175,093 | | | | — | | | | 283,520 | | | | (509,141 | ) | | | (50,528 | ) | |
| 12-31-08 | | | 125,814 | | | | — | | | | 89,235 | | | | (198,053 | ) | | | 16,996 | | | | 1,479,685 | | | | — | | | | 1,077,072 | | | | (2,287,198 | ) | | | 269,559 | | |
| Class S2 | | | |
| 02-27-09(1) - 06-30-09 | | | 376 | | | | — | | | | — | | | | — | | | | 376 | | | | 3,000 | | | | — | | | | — | | | | — | | | | 3,000 | | |
| Growth and Income | | | |
| Class ADV | | | |
| 06-30-09 | | | 4,745 | | | | — | | | | — | | | | (16,415 | ) | | | (11,670 | ) | | | 69,936 | | | | — | | | | — | | | | (229,205 | ) | | | (159,269 | ) | |
| 12-31-08 | | | 40,306 | | | | — | | | | 792 | | | | (37,703 | ) | | | 3,395 | | | | 848,718 | | | | — | | | | 11,483 | | | | (780,408 | ) | | | 79,793 | | |
| Class I | | | |
| 06-30-09 | | | 8,642,028 | | | | — | | | | — | | | | (8,242,971 | ) | | | 399,057 | | | | 124,511,911 | | | | — | | | | — | | | | (120,375,996 | ) | | | 4,135,915 | | |
| 12-31-08 | | | 11,913,505 | | | | — | | | | 2,316,631 | | | | (19,771,802 | ) | | | (5,541,666 | ) | | | 251,520,863 | | | | — | | | | 33,730,148 | | | | (402,121,000 | ) | | | (116,869,989 | ) | |
| Class S | | | |
| 06-30-09 | | | 167,637 | | | | — | | | | — | | | | (1,848,868 | ) | | | (1,681,231 | ) | | | 2,505,925 | | | | — | | | | — | | | | (26,058,574 | ) | | | (23,552,649 | ) | |
| 12-31-08 | | | 4,145,988 | | | | 16,787,613 | | | | 397,722 | | | | (3,014,524 | ) | | | 18,316,799 | | | | 94,804,530 | | | | 353,711,801 | | | | 5,751,055 | | | | (57,814,407 | ) | | | 396,452,979 | | |
| Class S2 | | | |
| 02-27-09(1) - 06-30-09 | | | 236 | | | | — | | | | — | | | | — | | | | 236 | | | | 3,000 | | | | — | | | | — | | | | — | | | | 3,000 | | |
| Opportunistic LargeCap Growth | | | |
| Class ADV | | | |
| 06-30-09 | | | 14,542 | | | | — | | | | — | | | | (12,856 | ) | | | 1,686 | | | | 99,660 | | | | — | | | | — | | | | (85,962 | ) | | | 13,698 | | |
| 12-31-08 | | | 41,857 | | | | — | | | | — | | | | (68,101 | ) | | | (26,244 | ) | | | 449,026 | | | | — | | | | — | | | | (677,704 | ) | | | (228,678 | ) | |
| Class I | | | |
| 06-30-09 | | | 116,912 | | | | — | | | | 57,009 | | | | (636,671 | ) | | | (462,750 | ) | | | 815,827 | | | | — | | | | 404,193 | | | | (4,387,199 | ) | | | (3,167,179 | ) | |
| 12-31-08 | | | 252,635 | | | | — | | | | 69,368 | | | | (2,727,762 | ) | | | (2,405,759 | ) | | | 2,567,062 | | | | — | | | | 749,873 | | | | (27,428,648 | ) | | | (24,111,713 | ) | |
| Class S | | | |
| 06-30-09 | | | 238,763 | | | | — | | | | 2,607 | | | | (235,521 | ) | | | 5,849 | | | | 1,657,249 | | | | — | | | | 18,353 | | | | (1,597,567 | ) | | | 78,035 | | |
| 12-31-08 | | | 221,013 | | | | — | | | | 4,259 | | | | (907,567 | ) | | | (682,295 | ) | | | 2,090,131 | | | | — | | | | 45,652 | | | | (8,653,583 | ) | | | (6,517,800 | ) | |
| Small Company | | | |
| Class ADV | | | |
| 06-30-09 | | | — | | | | — | | | | — | | | | — | | | | — | | | | — | | | | — | | | | — | | | | — | | | | — | | |
| 12-16-08(1) - 12-31-08 | | | 270 | | | | — | | | | — | | | | — | | | | 270 | | | | 3,000 | | | | — | | | | — | | | | — | | | | 3,000 | | |
| Class I | | | |
| 06-30-09 | | | 5,914,832 | | | | — | | | | 272,837 | | | | (4,090,869 | ) | | | 2,096,800 | | | | 59,677,602 | | | | — | | | | 3,140,406 | | | | (46,459,836 | ) | | | 16,358,172 | | |
| 12-31-08 | | | 9,251,093 | | | | — | | | | 4,962,617 | | | | (9,110,644 | ) | | | 5,103,066 | | | | 147,087,480 | | | | — | | | | 79,699,637 | | | | (145,489,311 | ) | | | 81,297,806 | | |
| Class S | | | |
| 06-30-09 | | | 1,575,337 | | | | — | | | | 29,034 | | | | (973,954 | ) | | | 630,417 | | | | 16,957,834 | | | | — | | | | 330,410 | | | | (10,608,240 | ) | | | 6,680,004 | | |
| 12-31-08 | | | 4,478,420 | | | | — | | | | 25,696 | | | | (785,827 | ) | | | 3,718,289 | | | | 66,404,448 | | | | — | | | | 409,079 | | | | (11,553,473 | ) | | | 55,260,054 | | |
| Class S2 | | | |
| 02-27-09(1) - 06-30-09 | | | 324 | | | | — | | | | — | | | | — | | | | 324 | | | | 3,000 | | | | — | | | | — | | | | — | | | | 3,000 | | |
| Opportunistic LargeCap | | | |
| Class ADV | | | |
| 06-30-09 | | | — | | | | — | | | | — | | | | — | | | | — | | | | — | | | | — | | | | — | | | | — | | | | — | | |
| 12-31-08 | | | — | | | | — | | | | — | | | | (1 | ) | | | (1 | ) | | | — | | | | — | | | | — | | | | (11 | ) | | | (11 | ) | |
| Class I | | | |
| 06-30-09 | | | 97,480 | | | | — | | | | 302,318 | | | | (601,579 | ) | | | (201,781 | ) | | | 761,801 | | | | — | | | | 2,288,544 | | | | (4,532,628 | ) | | | (1,482,283 | ) | |
| 12-31-08 | | | 136,501 | | | | — | | | | 1,629,562 | | | | (2,175,855 | ) | | | (409,792 | ) | | | 1,384,980 | | | | — | | | | 20,255,455 | | | | (25,817,102 | ) | | | (4,176,667 | ) | |
| Class S | | | |
| 06-30-09 | | | 29,797 | | | | — | | | | 42,891 | | | | (144,621 | ) | | | (71,933 | ) | | | 230,504 | | | | — | | | | 323,400 | | | | (1,090,795 | ) | | | (536,891 | ) | |
| 12-31-08 | | | 14,810 | | | | — | | | | 269,654 | | | | (387,908 | ) | | | (103,444 | ) | | | 178,165 | | | | — | | | | 3,330,233 | | | | (4,432,841 | ) | | | (924,443 | ) | |
(1) Commencement of operations.
32
NOTES TO FINANCIAL STATEMENTS AS OF JUNE 30, 2009 (UNAUDITED) (CONTINUED)
NOTE 9 — CAPITAL SHARES (continued)
| | | Shares sold | | Proceeds
from shares
issued
in merger | | Reinvestment
of
distributions | | Shares
redeemed | | Net increase
(decrease)
in shares
outstanding | | Shares sold | | Proceeds
from shares
issued
in merger | | Reinvestment
of
distributions | | Shares
redeemed | | Net increase
(decrease) | |
| Year or period ended | | # | | # | | # | | # | | # | | ($) | | ($) | | ($) | | ($) | | ($) | |
| Intermediate Bond | |
| Class ADV | |
| 06-30-09 | | | — | | | | — | | | | — | | | | (1 | ) | | | (1 | ) | | | — | | | | — | | | | — | | | | (11 | ) | | | (11 | ) | |
| 12-31-08 | | | — | | | | — | | | | — | | | | (1 | ) | | | (1 | ) | | | — | | | | — | | | | — | | | | (12 | ) | | | (12 | ) | |
| Class I | |
| 06-30-09 | | | 12,595,624 | | | | — | | | | 731,736 | | | | (29,111,497 | ) | | | (15,784,137 | ) | | | 138,160,565 | | | | — | | | | 7,990,578 | | | | (316,574,353 | ) | | | (170,423,210 | ) | |
| 12-31-08 | | | 53,358,622 | | | | 2,918,609 | | | | 14,350,541 | | | | (79,274,180 | ) | | | (8,646,408 | ) | | | 686,343,323 | | | | 37,264,333 | | | | 165,967,496 | | | | (993,285,707 | ) | | | (103,710,555 | ) | |
| Class S | |
| 06-30-09 | | | 8,989,876 | | | | — | | | | 245,087 | | | | (9,099,439 | ) | | | 135,524 | | | | 97,858,297 | | | | — | | | | 2,661,647 | | | | (99,227,877 | ) | | | 1,292,067 | | |
| 12-31-08 | | | 32,168,698 | | | | 848,254 | | | | 8,949,716 | | | | (19,339,594 | ) | | | 22,627,074 | | | | 410,405,825 | | | | 10,751,281 | | | | 102,233,412 | | | | (233,459,612 | ) | | | 289,930,906 | | |
| Class S2 | |
| 02-27-09(1) - 06-30-09 | | | 278 | | | | — | | | | — | | | | — | | | | 278 | | | | 3,000 | | | | — | | | | — | | | | — | | | | 3,000 | | |
| Money Market | |
| Class I | |
| 06-30-09 | | | 58,471,183 | | | | — | | | | 3,588,024 | | | | (278,262,395 | ) | | | (216,203,188 | ) | | | 58,471,183 | | | | — | | | | 3,486,834 | | | | (278,262,395 | ) | | | (216,304,378 | ) | |
| 12-31-08 | | | 1,747,332,311 | | | | — | | | | 16,756,212 | | | | (94,879,849 | ) | | | 1,669,208,674 | | | | 384,970,723 | | | | — | | | | 124,653,168 | | | | (346,315,736 | ) | | | 163,308,155 | | |
| Science and Technology Opportunities | |
| Class ADV | |
| 06-30-09 | | | — | | | | — | | | | — | | | | — | | | | — | | | | — | | | | — | | | | — | | | | — | | | | — | | |
| 12-16-08(1) - 12-31-08 | | | 912 | | | | — | | | | — | | | | — | | | | 912 | | | | 3,000 | | | | — | | | | — | | | | — | | | | 3,000 | | |
| Class I | |
| 06-30-09 | | | 2,634,294 | | | | — | | | | — | | | | (720,976 | ) | | | 1,913,318 | | | | 9,265,952 | | | | — | | | | — | | | | (2,448,135 | ) | | | 6,817,817 | | |
| 12-31-08 | | | 3,072,997 | | | | — | | | | — | | | | (3,991,670 | ) | | | (918,673 | ) | | | 14,071,302 | | | | — | | | | — | | | | (18,237,345 | ) | | | (4,166,043 | ) | |
| Class S | |
| 06-30-09 | | | 14,346,033 | | | | — | | | | — | | | | (4,622,865 | ) | | | 9,723,168 | | | | 49,591,029 | | | | — | | | | — | | | | (15,269,729 | ) | | | 34,321,300 | | |
| 12-31-08 | | | 8,356,135 | | | | 24,911,193 | | | | — | | | | (5,950,375 | ) | | | 27,316,953 | | | | 38,376,474 | | | | 123,216,459 | | | | — | | | | (23,407,370 | ) | | | 138,185,563 | | |
| Class S2 | |
| 02-27-09(1)-06-30-09 | | | 998 | | | | — | | | | — | | | | (1 | ) | | | 997 | | | | 3,003 | | | | — | | | | — | | | | (3 | ) | | | 3,000 | | |
(1) Commencement of operations.
NOTE 10 — ILLIQUID SECURITIES
Pursuant to guidelines adopted by the Board, the following securities have been deemed to be illiquid. Each Portfolio currently limits investment in illiquid securities to 15% (10% for Money Market) of the Portfolio's net assets, at market value, at time of purchase.
| | | Security | | Principal
Amount/
Shares | | Initial
Acquision
Date | | Cost | | Value | | Percent
of Net
Assets | |
| Balanced | | Greater Ohio Ethanol, LLC,
12.630%, due 12/31/13 | | | 700,000 | | | 11/21/06 | | $ | 683,243 | | | $ | — | | | | 0.0 | % | |
| | | Greater Ohio Ethanol, LLC,
6.301%, due 12/31/13 | | | 600,000 | | | 11/21/06 | | | 597,758 | | | | — | | | | 0.0 | % | |
| | | PEA Lima, LLC,
0.000%, due 03/20/14 | | | 92,655 | | | 03/20/09 | | | 5,226 | | | | 9 | | | | 0.0 | % | |
| | | | | | | | | | | $ | 1,286,227 | | | $ | 9 | | | | 0.0 | % | |
| Growth and Income | | Seagate Technology, Inc. - Escrow | | | 2,600 | | | 05/09/02 | | $ | — | | | $ | — | | | | 0.0 | % | |
| | | | | | | | | | | $ | — | | | $ | — | | | | 0.0 | % | |
| Intermediate Bond | | Greater Ohio Ethanol, LLC,
6.301%, due 12/31/13 | | | 4,000,000 | | | 11/21/06 | | $ | 3,985,331 | | | $ | — | | | | 0.0 | % | |
| | | Greater Ohio Ethanol, LLC,
12.630%, due 12/31/13 | | | 4,900,000 | | | 11/21/06 | | | 4,850,115 | | | | — | | | | 0.0 | % | |
| | | PEA Lima, LLC,
0.000%, due 03/20/14 | | | 617,699 | | | 03/20/09 | | | 34,843 | | | | 62 | | | | 0.0 | % | |
| | | | | | | | | | | $ | 8,870,289 | | | $ | 62 | | | | 0.0 | % | |
33
NOTES TO FINANCIAL STATEMENTS AS OF JUNE 30, 2009 (UNAUDITED) (CONTINUED)
NOTE 11 — SECURITIES LENDING
Under an agreement with The Bank of New York Mellon ("BNY"), the Portfolios can lend their securities to approved brokers, dealers and other financial institutions. Loans are collateralized by cash and U.S. government securities. The collateral is equal to at least 105% of the market value of non-U.S. securities loaned and 102% of the market value of U.S. securities. The market value of the loaned securities is determined at the close of business of the Portfolios at their last sale price or official closing price on the principal exchange or system on which they are traded and any additional collateral is delivered to the Portfolios on the next business day. The cash collateral received is invested in approved investments as defined in the Securities Lending Agreement with BNY (the "Agreement"). The Portfolios bear the risk of loss with respect to the investment of collateral. Currently, the cash collateral is invested in the Bank of New Yo rk Mellon Corp. Institutional Cash Reserves Fund ("BICR Fund"). BNY serves as investment manager, custodian and operational trustee of the BICR Fund. As of June 30, 2009, and throughout the period covered by this report, the BICR Fund held certain defaulted securities that had market values significantly below amortized cost. The Portfolios agreed to the terms of capital support extended by The Bank of New York Mellon Corporation ("BNYC"), an affiliated company of BNY, for the certain defaulted securities held by the BICR Fund. BNYC will support the value of these securities up to a certain amount and subject, in part, to the Portfolios' continued lending of securities. The recorded value of each Portfolio's investment in the BICR Fund includes the value of the underlying securities held by the BICR Fund and the estimated value of the support to be provided by BNYC. The investment in the BICR Fund is included in the Portfolio of Investments under Securities Lending Collateral and the unrealized loss on such investment is included in Net Unrealized Depreciation on the Statements of Assets and Liabilities.
Generally, in the event of counterparty default, the Portfolios have the right to use the collateral to offset losses incurred. The Agreement contains certain guarantees by BNY in the event of counterparty default and/or a borrower's failure to return a loaned security; however, there would be a potential loss to the Portfolios in the event the Portfolios are delayed or prevented from exercising their right to dispose of the collateral. Engaging in securities lending could have a leveraging effect, which may intensify the credit, market and other risks associated with investing in a Portfolio. At June 30, 2009, the following Portfolios had securities on loan with the following market values:
| | | Value of
Securities
Loaned | | Cash
Collateral
Received* | |
| Balanced | | $ | 48,022,737 | | | $ | 49,131,766 | | |
| Growth and Income | | | 27,102,777 | | | | 28,561,378 | | |
| Opportunistic LargeCap Growth | | | 1,757,806 | | | | 1,833,148 | | |
| Small Company | | | 30,577,132 | | | | 31,619,673 | | |
| Opportunistic LargeCap | | | 1,108,732 | | | | 1,148,804 | | |
| Intermediate Bond | | | 522,237,271 | | | | 533,761,298 | | |
| Money Market | | | 1,058,427 | | | | 1,077,010 | | |
Science and Technology
Opportunities | | | 6,919,949 | | | | 7,315,890 | | |
* Cash collateral received was invested in the BICR Fund, the fair value of which is presented in the respective Portfolio's Portfolio of Investments.
NOTE 12 — CONCENTRATION OF INVESTMENT RISKS
Concentration (Science and Technology Opportunities). The Portfolio concentrates (for purposes of the 1940 Act) its assets in securities related to a particular industry, which means that at least 25% of its assets will be invested in that particular industry at all times. As a result, the Portfolio may be subject to greater market fluctuation than a portfolio which has securities representing a broader range of investment alternatives.
Foreign Securities (All Portfolios). Investments in foreign securities may entail risks not present in domestic investments. Since securities in which the Portfolios may invest are denominated in foreign currencies, changes in the relationship of these foreign currencies to the U.S. dollar can significantly affect the value of the investments and earnings of the Portfolios. Foreign investments may also subject the Portfolios to foreign government exchange restrictions, expropriation, taxation or other political, social or economic developments, as well as changes vis-a-vis the U.S. dollar from movements in currency, and changes in security value and interest rate, all of which could affect the market and/or credit risk of the Portfolios' investments.
Emerging Markets Investments (Intermediate Bond and Science and Technology Opportunities). Because of less developed markets and economies and, in some countries, less mature governments and governmental institutions, the risks of investing in foreign securities can be intensified in the case of investments in issuers domiciled or doing substantial business in emerging market countries.
Derivatives (All Portfolios except Opportunistic LargeCap and Money Market). Generally, derivatives can be characterized as financial instruments whose performance is derived, at least in part, from the performance of an underlying asset or assets. Some derivatives are sophisticated instruments that typically
34
NOTES TO FINANCIAL STATEMENTS AS OF JUNE 30, 2009 (UNAUDITED) (CONTINUED)
NOTE 12 — CONCENTRATION OF INVESTMENT RISKS (continued)
involve a small investment of cash relative to the magnitude of risks assumed. These may include swap agreements, options, forwards and futures. Derivative securities are subject to market risk which could be significant for those that have a leveraging effect. Derivatives are also subject to credit risks related to the counterparty's ability to perform and any deterioration in the counterparty's creditworthiness could adversely affect the instrument. In addition, derivatives and their underlying securities may experience periods of illiquidity which could cause a Portfolio to hold a security it might otherwise sell or could force the sale of a security at inopportune times or for prices that do not reflect current market value. A risk of using derivatives is that a Portfolio's adviser or sub-adviser might imperfectly judge the market's direction.
Corporate Debt Securities (Balanced and Intermediate Bond). Corporate debt securities are subject to the risk of the issuer's inability to meet principal and interest payment on the obligation and may also be subject to price volatility due to such factors as interest rate sensitivity, market perception of the creditworthiness of the issue and general market liquidity. When interest rates decline, the value of the Portfolio's debt securities can be expected to rise, and when interest rates rise, the value of those securities can be expected to decline. Debt securities with longer maturities tend to be more sensitive to interest rate movements than those with shorter maturities.
During the year ended December 31, 2008, Lehman Brothers Holdings, Inc. (LBHI) and certain of its affiliates sought protection under the insolvency laws of their jurisdictions of organization, including the United States, the United Kingdom and Japan. During that period, Balanced and Intermediate Bond had outstanding securities trades with counterparties affiliated with LBHI. As a result of these events, LBHI's affiliates were unable to fulfill their commitments and, in certain cases, Balanced and Intermediate Bond terminated their trades and related agreements with the relevant entities and, where appropriate, are in the process of initiating claims for damages. Management has determined that the financial impact to the Portfolios relating to these events is immaterial.
NOTE 13 — FEDERAL INCOME TAXES
The amount of distributions from net investment income and net realized capital gains are determined in accordance with federal income tax regulations, which may differ from U.S. generally accepted accounting principles for investment companies. These book/tax differences may be either temporary or permanent. Permanent differences are reclassified within the capital accounts based on their federal tax-basis treatment; temporary differences are not reclassified. Key differences include the treatment of short-term capital gains, foreign currency transactions, and wash sale deferrals. Distributions in excess of net investment income and/or net realized capital gains for tax purposes are reported as return of capital.
Dividends paid by the Portfolios from net investment income and distributions of net realized short-term capital gains are, for federal income tax purposes, taxable as ordinary income to shareholders.
The tax composition of dividends and distributions to shareholders was as follows:
| | | Six Months Ended June 30, 2009 | | Year Ended December 31, 2008 | |
| | | Ordinary
Income | | Ordinary
Income | | Long-Term
Capital Gains | |
| Balanced | | $ | 27,504,098 | | | $ | 60,981,872 | | | $ | 50,744,407 | | |
| Growth and Income | | | — | | | | 39,517,165 | | | | — | | |
| Opportunistic Large Cap Growth | | | 422,546 | | | | 795,525 | | | | — | | |
| Small Company | | | 3,470,816 | | | | 5,865,236 | | | | 74,243,480 | | |
| Opportunistic Large Cap | | | 2,611,957 | | | | 2,609,792 | | | | 20,976,051 | | |
| Intermediate Bond | | | 10,654,341 | | | | 268,240,664 | | | | — | | |
| Money Market | | | 3,486,834 | | | | 124,653,168 | | | | — | | |
The tax-basis components of distributable earnings and the expiration dates of the capital loss carryforwards which may be used to offset future realized capital gains for federal income tax purposes as of December 31, 2008 were:
| | | Undistributed
Ordinary
Income | | Unrealized
Appreciation/
(Depreciation) | | Post-October
Capital Loss
Deferred | | Capital Loss
Carryforwards | | Expiration
Dates | |
| Balanced | | $ | 27,501,921 | | | $ | (144,712,701 | ) | | $ | — | | | $ | (574,085 | ) | | | 2009 | | |
| | | | | | | | | | (134,169,975 | ) | | | 2016 | | |
| | | | | | | | | $ | (134,744,060 | )* | | | | | |
| Growth and Income | | | — | | | | (307,525,947 | ) | | | (121,332,257 | ) | | | (1,745,504,149 | ) | | | 2009 | | |
| | | | | | | | | | (63,082,574 | ) | | | 2010 | | |
| | | | | | | | | | (48,933,227 | ) | | | 2015 | | |
| | | | | | | | | | (454,661,688 | ) | | | 2016 | | |
| | | | | | | | | $ | (2,312,181,638 | )* | | | | | |
35
NOTES TO FINANCIAL STATEMENTS AS OF JUNE 30, 2009 (UNAUDITED) (CONTINUED)
NOTE 13 — FEDERAL INCOME TAXES (continued)
| | | Undistributed
Ordinary
Income | | Unrealized
Appreciation/
(Depreciation) | | Post-October
Capital Loss
Deferred | | Capital Loss
Carryforwards | | Expiration
Dates | |
| Opportunistic Large Cap Growth | | $ | 421,521 | | | $ | (13,379,890 | ) | | $ | — | | | $ | (71,685,369 | ) | | | 2009 | | |
| | | | | | | | | | | | | | | | (65,982,870 | ) | | | 2010 | | |
| | | | | | | | | | | | | | | | (1,529,437 | ) | | | 2011 | | |
| | | | | | | | | | | | | | | | (42,028,267 | ) | | | 2016 | | |
| | | | | | | | | | | | | | | $ | (181,225,943 | )* | | | | | |
| Small Company | | | 3,469,382 | | | | (137,432,190 | ) | | | — | | | | (52,676,115 | ) | | | 2016 | | |
| Opportunistic Large Cap | | | 2,610,842 | | | | (19,977,868 | ) | | | — | | | | (29,296,914 | ) | | | 2016 | | |
| Intermediate Bond | | | 10,648,573 | | | | (441,758,355 | ) | | | (155,718,209 | ) | | | — | | | | — | | |
| Money Market | | | — | | | | (149,401 | ) | | | — | | | | (1,860,826 | ) | | | 2009 | | |
| | | | | | | | | | | | | | | | (169 | ) | | | 2011 | | |
| | | | | | | | | | | | | | | | (244,520 | ) | | | 2012 | | |
| | | | | | | | | | | | | | | $ | (2,105,515 | ) | | | | | |
| Science and Technology Opportunities | | | — | | | | (59,100,007 | ) | | | — | | | | (6,713,564 | ) | | | 2009 | | |
| | | | | | | | | | | | | | | | (3,997,473 | ) | | | 2010 | | |
| | | | | | | | | | | | | | | | (3,997,473 | ) | | | 2011 | | |
| | | | | | | | | | | | | | | | (4,991,402 | ) | | | 2015 | | |
| | | | | | | | | | | | | | | | (13,211,790 | ) | | | 2016 | | |
| | | | | | | | | | | | | | | $ | (32,911,702 | )* | | | | | |
* Utilization of these capital losses is subject to annual limitations under Section 382 of the Internal Revenue Code. Amounts and years of expiration may be adjusted to reflect future gain/loss activity to comply with the limitation rules.
The Portfolios' major tax jurisdictions are federal, Arizona, and Massachusetts. The earliest tax year that remains subject to examination by these jurisdictions is 2004.
As of June 30, 2009, no provisions for income tax would be required in the Portfolios' financial statements as a result of tax positions taken on federal income tax returns for open tax years. The Portfolios' federal and state income and federal excise tax returns for tax years for which the applicable statutes of limitations have not expired are subject to examination by the Internal Revenue Service and state department of revenue.
NOTE 14 — REORGANIZATIONS
On September 8, 2008, Growth and Income, as listed below ("Acquiring Portfolio"), acquired the assets and certain liabilities of ING Capital Guardian U.S. Equities Portfolio, also listed below ("Acquired Portfolio"), in a tax-free reorganization in exchange for shares of the Acquiring Portfolio, pursuant to a plan of reorganization approved by the Acquired Portfolio's shareholders. The number and value of shares issued by the Acquiring Portfolio are presented in Note 9 — Capital Shares. Net assets and unrealized depreciation as of the reorganization date were as follows:
Acquiring
Portfolio | | Acquired
Portfolio | | Total
Net Assets of
Acquired
Portfolio (000's) | | Total
Net Assets of
Acquiring
Portfolio (000's) | | Acquired
Capital Loss
Carryforwards
(000's) | | Acquired Portfolio
Unrealized
Appreciation (000's) | | Conversion
Ratio | |
| Growth and | | ING Capital Guardian | | | | | | | | | | | | | | | | | | |
| | |
| Income | | U.S. Equities Portfolio | | $ | 353,712 | | | $ | 2,384,341 | | | $ | (48,933 | ) | | $ | 6,331 | | | | 0.35 | | |
The net assets of Growth and Income after the acquisition were $2,738,052,537.
On April 28, 2008, Science and Technology Opportunities and Intermediate Bond, as listed below ("Acquiring Portfolios"), acquired the assets and certain liabilities of ING Global Technology Portfolio and ING Lord Abbett U.S. Government Securities Portfolio, also listed below ("Acquired Portfolios"), respectively, in a tax-free reorganization in exchange for shares of each Acquiring Portfolio, pursuant to a plan of reorganization approved by each Acquired
36
NOTES TO FINANCIAL STATEMENTS AS OF JUNE 30, 2009 (UNAUDITED) (CONTINUED)
NOTE 14 — REORGANIZATIONS (continued)
Portfolio's shareholders. The number and value of shares issued by each Acquiring Portfolio are presented in Note 9 — Capital Shares. Net assets and unrealized depreciation as of the reorganization date were as follows:
Acquiring
Portfolios | | Acquired
Portfolio | | Total
Net Assets of
Acquired
Portfolio (000's) | | Total
Net Assets of
Acquiring
Portfolio (000's) | | Acquired
Capital Loss
Carryforwards
(000's) | | Acquired Portfolio
Unrealized
Depreciation (000's) | | Conversion
Ratio | |
| Science and | | ING Global | | | | | | | | | | | |
| Technology | | Technology | | | | | | | | | |
| |
| Opportunities | | Portfolio | | $ | 123,216 | | | $ | 87,851 | | | $ | (4,991 | ) | | $ | (128 | ) | | | 1.30 | | |
Intermediate
Bond | | ING Lord Abbett U.S
Government Securities
Portfolio | | | 48,016 | | | | 3,557,999 | | | | — | | | | — | | | | 0.77 | | |
The net assets of Science and Technology Opportunities and Intermediate Bond after the acquisitions were $211,067,879 and $3,606,015,157, respectively.
NOTE 15 — INFORMATION REGARDING TRADING OF ING'S U.S. MUTUAL FUNDS
As discussed in earlier supplements that were previously filed with the SEC, ING agreed with the Portfolios to indemnify and hold harmless the Portfolios from all damages resulting from wrongful conduct by ING or its employees or from ING's internal investigation, any investigations conducted by any governmental or self-regulatory agencies, litigation or other formal proceedings, including any proceedings by the U.S. Securities and Exchange Commission in connection with investigations related to mutual funds and variable insurance products. In December 2008, ING settled its indemnification commitments by making payments to the affected Portfolios. In connection with the settlement, ING paid $2,198 to Growth and Income, and $22,573 to Opportunistic LargeCap.
NOTE 16 — LITIGATION
On December 12, 2003, Aeltus Investment Management, Inc. (now known as ING Investment Management Co.)( "IIM" ) received a copy of a complaint (the "Complaint") filed in the United States Bankruptcy Court for the Southern District of New York in the matter of Enron Corp. v. Mass Mutual Life Insurance Co., et al. Among other defendants named in the Complaint are defendants ING VP Balanced Portfolio Inc. and ING VP Bond Portfolio (the "Subject Portfolios"). As of August 6, 2004, the ING VP Bond Portfolio changed its name to the ING VP Intermediate Bond Portfolio. As of May 1, 2009, the ING VP Intermediate Bond Portfolio and the ING VP Balanced Portfolio changed their names to ING Intermediate Bond Portfolio and ING Balanced Portfolio, respectively. The Complaint alleges that Enron Corp. ("Enron") transf erred to the defendants, including the Subject Portfolios, over $1 billion in the aggregate for the purpose of prepaying certain commercial paper issued by Enron (the "Notes") and held by the defendants prior to the filing by Enron for bankruptcy protection under Chapter 11 of Title 11 of the Bankruptcy Code (the "Bankruptcy Code").
The Complaint seeks to recover from the defendants including the Subject Portfolios, these transfers under the alternative but interrelated bankruptcy theories of preferential transfer and fraudulent conveyance. Although the Complaint does not specify the amount of each transfer in dispute, it appears that the sale of ING VP Balanced Portfolio, Inc. of $23,181,757 of the Notes on or about October 29, 2001, and the sale by ING VP Bond Portfolio of $24,963,125 of the Notes on or about October 29, 2001 are in dispute. The Complaint seeks to require the Subject Portfolios to repay to Enron the full amount of these transfers, in which event the Subject Portfolios would be granted unsecured claims against the Enron bankruptcy estate in the amounts of the repayments. If Enron proves up the elements of preferential transfer and/or fraudulent conveyance, these are strict liability theories of recovery.
The Subject Portfolios are part of a defense group of similarly-situated defendants. Along with those and other defendants, the Subject Portfolios moved to dismiss all counts of the Complaint, contending, among other things, that section 546(e) of the Bankruptcy Code provides a complete defense.
The bankruptcy court denied the motion on July 1, 2005. Accordingly, the Subject Portfolios filed an answer to the Complaint on July 29, 2005. The Subject Portfolios moved for leave to pursue an immediate appeal (the "Appeal") of the bankruptcy court's decision to the district court.
On April 4, 2006, the Securities and Exchange Commission filed a memorandum in support of the
37
NOTES TO FINANCIAL STATEMENTS AS OF JUNE 30, 2009 (UNAUDITED) (CONTINUED)
NOTE 16 — LITIGATION (continued)
Subject Portfolio's motion for leave with the U.S. District Court. In addition, the U.S. Attorney's office, on behalf of the United States of America and the Department of Treasury as well as the Federal Reserve Board has each filed statements of interest in support of the Appeal.
On January 25, 2008, the United States District Court of Southern New York denied the motion for leave to appeal the bankruptcy court's denial of the Subject Portfolios' motion to dismiss. The court found there were questions of fact that still needed to be resolved.
On April 29, 2008, IIM and the Funds joined a plenary motion for summary judgment filed by Goldman Sachs. In addition, a separate brief was filed on behalf of IIM asserting the defenses unique to the investment advisor defendants; that they were merely conduits. On April 7, 2009, the court heard oral arguments on the motions for summary judgment. The SEC intervened in the action and argued in favor of the defendants on the grounds that a decision against ING Funds would have a negative impact on the financial markets.
On June 29, 2009, the court ruled on the motion for summary judgment and held that the pre-payments made were not protected from avoidance by section 546(e) of the Bankruptcy Code and denied the summary judgment to the Funds; however, the court did grant the summary judgment to dismiss IIM. As a result the Funds will be bearing the full cost of the continuing litigation. Management is discussing next steps with bankruptcy counsel and Fund counsel. Currently, the most promising approach appears to be an appeal or a trial in the district court.
NOTE 17 — SUBSEQUENT EVENTS
Dividends. Subsequent to June 30, 2009, the following Portfolios declared dividends of:
| | | Type | | Per Share
Amount | | Payable Date | | Record Date | |
Opportunistic
LargeCap
Growth | |
| Class ADV | | NII | | $ | 0.0035 | | | August 6, 2009 | | August 4, 2009 | |
| Class I | | NII | | | 0.0234 | | | August 6, 2009 | | August 4, 2009 | |
| Class S | | NII | | | 0.0126 | | | August 6, 2009 | | August 4, 2009 | |
| Money Market | |
| Class I | | NII | | | 0.0002 | | | 8/3/09 | | Daily | |
NII — Net investment income
The Board approved a proposal to reorganize Opportunistic LargeCap Growth into Opportunistic LargeCap. Shareholder approval was obtained and the reorganization closed on August 7, 2009.
The Portfolios have evaluated events occurring after the balance sheet date (subsequent events) through August 26, 2009, the date the financial statements were available to be issued, to determine whether any subsequent events necessitated adjustment to or disclosure in the financial statements. Other than the above, no such subsequent events were identified.
38
PORTFOLIO OF INVESTMENTS
ING BALANCED PORTFOLIO AS OF JUNE 30, 2009 (UNAUDITED)
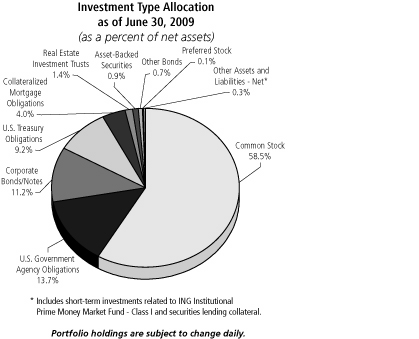
| Shares | | | | | | Value | |
| COMMON STOCK: 58.5% | | | |
| | | | | Advertising: 0.4% | |
| | 13,127 | | | | | Harte-Hanks, Inc. | | $ | 121,425 | | |
| | 146,370 | | | @ | | Interpublic Group of Cos., Inc. | | | 739,169 | | |
| | 2,905 | | | @ | | inVentiv Health, Inc. | | | 39,305 | | |
| | 36,439 | | | | | Omnicom Group | | | 1,150,744 | | |
| | | | 2,050,643 | | |
| | | | | Aerospace/Defense: 2.4% | |
| | 1,864 | | | @ | | AAR Corp. | | | 29,917 | | |
| | 1,056 | | | @ | | Aerovironment, Inc. | | | 32,588 | | |
| | 3,294 | | | @ | | Alliant Techsystems, Inc. | | | 271,294 | | |
| | 1,729 | | | @ | | BE Aerospace, Inc. | | | 24,828 | | |
| | 4,100 | | | | | Cubic Corp. | | | 146,739 | | |
| | 1,970 | | | | | Curtiss-Wright Corp. | | | 58,568 | | |
| | 1,290 | | | @ | | Esterline Technologies Corp. | | | 34,920 | | |
| | 22,467 | | | | | General Dynamics Corp. | | | 1,244,447 | | |
| | 18,974 | | | | | Goodrich Corp. | | | 948,131 | | |
| | 22,700 | | | | | L-3 Communications
Holdings, Inc. | | | 1,574,926 | | |
| | 35,201 | | | | | Lockheed Martin Corp. | | | 2,838,961 | | |
| | 1,438 | | | @ | | Moog, Inc. | | | 37,115 | | |
| | 1,058 | | | | | National Presto Industries, Inc. | | | 80,514 | | |
| | 51,430 | | | | | Northrop Grumman Corp. | | | 2,349,322 | | |
| | 4,064 | | | @ | | Orbital Sciences Corp. | | | 61,651 | | |
| | 43,650 | | | | | Raytheon Co. | | | 1,939,370 | | |
| | 1,700 | | | @ | | Teledyne Technologies, Inc. | | | 55,675 | | |
| | 1,032 | | | | | Triumph Group, Inc. | | | 41,280 | | |
| | 49,156 | | | | | United Technologies Corp. | | | 2,554,146 | | |
| | | | 14,324,392 | | |
| Shares | | | | | | Value | |
| | | | | Agriculture: 1.2% | |
| | 11,050 | | | @ | | Alliance One International, Inc. | | $ | 41,990 | | |
| | 124,121 | | | | | Altria Group, Inc. | | | 2,034,343 | | |
| | 2,203 | | | | | Andersons, Inc. | | | 65,958 | | |
| | 39,850 | | | | | Archer-Daniels-Midland Co. | | | 1,066,785 | | |
| | 61,460 | | | | | Philip Morris International, Inc. | | | 2,680,885 | | |
| | 30,416 | | | | | Reynolds American, Inc. | | | 1,174,666 | | |
| | | | 7,064,627 | | |
| | | | | Airlines: 0.0% | |
| | 12,315 | | | | | Skywest, Inc. | | | 125,613 | | |
| | | | 125,613 | | |
| | | | | Apparel: 0.2% | |
| | 9,479 | | | @ | | Carter's, Inc. | | | 233,278 | | |
| | 6,756 | | | @ | | CROCS, Inc. | | | 22,970 | | |
| | 1,290 | | | @ | | Deckers Outdoor Corp. | | | 90,648 | | |
| | 7,202 | | | @ | | Iconix Brand Group, Inc. | | | 110,767 | | |
| | 346 | | | @ | | Maidenform Brands, Inc. | | | 3,969 | | |
| | 1,898 | | | | | Oxford Industries, Inc. | | | 22,112 | | |
| | 4,324 | | | | | Polo Ralph Lauren Corp. | | | 231,507 | | |
| | 124 | | | @ | | Skechers USA, Inc. | | | 1,211 | | |
| | 9,284 | | | @ | | Timberland Co. | | | 123,199 | | |
| | 2,700 | | | @,L | | True Religion Apparel, Inc. | | | 60,210 | | |
| | 943 | | | @,L | | Under Armour, Inc. | | | 21,104 | | |
| | 1,451 | | | @,L | | Volcom, Inc. | | | 18,138 | | |
| | 2,800 | | | @ | | Warnaco Group, Inc. | | | 90,720 | | |
| | 1,937 | | | | | Wolverine World Wide, Inc. | | | 42,730 | | |
| | | | 1,072,563 | | |
| | | | | Auto Manufacturers: 0.1% | |
| | 55,600 | | | @ | | Ford Motor Co. | | | 337,492 | | |
| | 3,600 | | | | | Oshkosh Truck Corp. | | | 52,344 | | |
| | 3,860 | | | L | | Wabash National Corp. | | | 2,702 | | |
| | | | 392,538 | | |
| | | | | Auto Parts & Equipment: 0.1% | |
| | 5,800 | | | | | BorgWarner, Inc. | | | 198,070 | | |
| | 4,609 | | | | | Spartan Motors, Inc. | | | 52,220 | | |
| | 7,354 | | | | | Superior Industries International | | | 103,691 | | |
| | | | 353,981 | | |
| | | | | Banks: 4.8% | |
| | 17,200 | | | | | Associated Banc-Corp. | | | 215,000 | | |
| | 12,381 | | | | | Bancorpsouth, Inc. | | | 254,182 | | |
| | 5,557 | | | | | Bank Mutual Corp. | | | 48,457 | | |
| | 272,303 | | | | | Bank of America Corp. | | | 3,594,400 | | |
| | 3,561 | | | | | Bank of Hawaii Corp. | | | 127,591 | | |
| | 33,544 | | | | | Bank of New York Mellon Corp. | | | 983,175 | | |
| | 4,000 | | | | | Bank of the Ozarks, Inc. | | | 86,520 | | |
| | 32,770 | | | | | BB&T Corp. | | | 720,285 | | |
| | 12,900 | | | L | | Cascade Bancorp. | | | 18,189 | | |
| | 4,990 | | | | | Central Pacific Financial Corp. | | | 18,713 | | |
| | 197,600 | | | S,L | | Citigroup, Inc. | | | 586,872 | | |
| | 75 | | | | | Columbia Banking System, Inc. | | | 767 | | |
| | 4,617 | | | | | Commerce Bancshares, Inc. | | | 146,959 | | |
| | 4,181 | | | | | Community Bank System, Inc. | | | 60,875 | | |
| | 2,900 | | | | | Cullen/Frost Bankers, Inc. | | | 133,748 | | |
| | 4,547 | | | @@,L | | First Bancorp. Puerto Rico | | | 17,961 | | |
| | 4,842 | | | | | First Financial Bancorp. | | | 36,412 | | |
| | 4,150 | | | S,L | | First Financial Bankshares, Inc. | | | 208,994 | | |
| | 18,221 | | | | | First Midwest Bancorp., Inc. | | | 133,196 | | |
| | 13,958 | | | | | FirstMerit Corp. | | | 237,007 | | |
| | 1,141 | | | L | | Frontier Financial Corp. | | | 1,381 | | |
See Accompanying Notes to Financial Statements
39
PORTFOLIO OF INVESTMENTS
ING BALANCED PORTFOLIO AS OF JUNE 30, 2009 (UNAUDITED) (CONTINUED)
| Shares | | | | | | Value | |
| | | | | Banks (continued) | |
| | 6,850 | | | | | Fulton Financial Corp. | | $ | 35,689 | | |
| | 6,992 | | | | | Glacier Bancorp., Inc. | | | 103,272 | | |
| | 23,542 | | | | | Goldman Sachs Group, Inc. | | | 3,471,032 | | |
| | 4,037 | | | | | Hancock Holding Co. | | | 131,162 | | |
| | 327 | | | | | Home Bancshares, Inc. | | | 6,226 | | |
| | 6,079 | | | | | Independent Bank Corp. | | | 119,756 | | |
| | 14,400 | | | L | | International Bancshares Corp. | | | 148,464 | | |
| | 131,357 | | | | | JPMorgan Chase & Co. | | | 4,480,587 | | |
| | 12,500 | | | L | | M&T Bank Corp. | | | 636,625 | | |
| | 26,099 | | | | | Morgan Stanley | | | 744,082 | | |
| | 21,400 | | | | | National Penn Bancshares, Inc. | | | 98,654 | | |
| | 1,700 | | | | | NBT Bancorp., Inc. | | | 36,907 | | |
| | 21,410 | | | | | Northern Trust Corp. | | | 1,149,289 | | |
| | 10,839 | | | | | Old National Bancorp. | | | 106,439 | | |
| | 34,263 | | | | | PNC Financial Services
Group, Inc. | | | 1,329,747 | | |
| | 7,100 | | | | | Prosperity Bancshares, Inc. | | | 211,793 | | |
| | 10,333 | | | | | S&T Bancorp, Inc. | | | 125,649 | | |
| | 885 | | | @ | | Signature Bank | | | 24,001 | | |
| | 2,523 | | | | | Simmons First National Corp. | | | 67,415 | | |
| | 17,836 | | | | | State Street Corp. | | | 841,859 | | |
| | 7,267 | | | | | Sterling Bancorp. | | | 60,679 | | |
| | 20,500 | | | | | Sterling Bancshares, Inc. | | | 129,765 | | |
| | 27,284 | | | | | Susquehanna Bancshares, Inc. | | | 133,419 | | |
| | 2,257 | | | | | Tompkins Financial Corp. | | | 108,223 | | |
| | 11,300 | | | | | Trustco Bank Corp. | | | 66,783 | | |
| | 9,500 | | | | | Trustmark Corp. | | | 183,540 | | |
| | 167 | | | | | UCBH Holdings, Inc. | | | 210 | | |
| | 5,660 | | | | | UMB Financial Corp. | | | 215,137 | | |
| | 1,207 | | | | | Umpqua Holdings Corp. | | | 9,366 | | |
| | 2,050 | | | L | | United Bankshares, Inc. | | | 40,057 | | |
| | 50,178 | | | | | US Bancorp. | | | 899,190 | | |
| | 177,733 | | | | | Wells Fargo & Co. | | | 4,311,803 | | |
| | 3,550 | | | L | | Westamerica Bancorp. | | | 176,116 | | |
| | 1,768 | | | L | | Wilmington Trust Corp. | | | 24,151 | | |
| | 4,700 | | | | | Wilshire Bancorp., Inc. | | | 27,025 | | |
| | 1,148 | | | | | Wintrust Financial Corp. | | | 18,460 | | |
| | | | 27,903,256 | | |
| | | | | Beverages: 0.5% | |
| | 21,881 | | | | | Coca-Cola Co. | | | 1,050,069 | | |
| | 41,345 | | | | | Coca-Cola Enterprises, Inc. | | | 688,394 | | |
| | 2,675 | | | @,L | | Green Mountain Coffee
Roasters, Inc. | | | 158,146 | | |
| | 4,598 | | | @ | | Hansen Natural Corp. | | | 141,710 | | |
| | 1,100 | | | @ | | Peet's Coffee & Tea, Inc. | | | 27,720 | | |
| | 4,600 | | | | | Pepsi Bottling Group, Inc. | | | 155,664 | | |
| | 3,430 | | | | | PepsiAmericas, Inc. | | | 91,958 | | |
| | 15,510 | | | | | PepsiCo, Inc. | | | 852,430 | | |
| | | | 3,166,091 | | |
| | | | | Biotechnology: 0.6% | |
| | 29,045 | | | @ | | Amgen, Inc. | | | 1,537,642 | | |
| | 4,200 | | | @ | | Arqule, Inc. | | | 25,788 | | |
| | 18,255 | | | @ | | Biogen Idec, Inc. | | | 824,213 | | |
| | 1,050 | | | @ | | Charles River Laboratories
International, Inc. | | | 35,438 | | |
| | 10,200 | | | @ | | Cubist Pharmaceuticals, Inc. | | | 186,966 | | |
| | 2,050 | | | @ | | Enzo Biochem, Inc. | | | 9,082 | | |
| | 5,417 | | | @ | | Gilead Sciences, Inc. | | | 253,732 | | |
| | 6,120 | | | @ | | Martek Biosciences Corp. | | | 129,438 | | |
| | 2,071 | | | @ | | OSI Pharmaceuticals, Inc. | | | 58,464 | | |
| | 5,896 | | | @ | | Regeneron Pharmaceuticals, Inc. | | | 105,656 | | |
| | 10,700 | | | @ | | Vertex Pharmaceuticals, Inc. | | | 381,348 | | |
| | | | 3,547,767 | | |
| Shares | | | | | | Value | |
| | | | | Building Materials: 0.1% | |
| | 7,550 | | | | | Apogee Enterprises, Inc. | | $ | 92,865 | | |
| | 4,550 | | | | | Eagle Materials, Inc. | | | 114,842 | | |
| | 8,516 | | | | | Gibraltar Industries, Inc. | | | 58,505 | | |
| | 838 | | | | | Lennox International, Inc. | | | 26,908 | | |
| | 18,544 | | | | | Louisiana-Pacific Corp. | | | 63,420 | | |
| | 1,250 | | | | | Martin Marietta Materials, Inc. | | | 98,600 | | |
| | 6,150 | | | @,L | | NCI Building Systems, Inc. | | | 16,236 | | |
| | 170 | | | | | Simpson Manufacturing Co., Inc. | | | 3,675 | | |
| | 1,430 | | | L | | Texas Industries, Inc. | | | 44,845 | | |
| | 3,200 | | | | | Universal Forest Products, Inc. | | | 105,888 | | |
| | | | 625,784 | | |
| | | | | Chemicals: 1.0% | |
| | 7,747 | | | | | Airgas, Inc. | | | 313,986 | | |
| | 1,450 | | | | | Albemarle Corp. | | | 37,077 | | |
| | 1,363 | | | | | American Vanguard Corp. | | | 15,402 | | |
| | 2,864 | | | | | Arch Chemicals, Inc. | | | 70,426 | | |
| | 5,337 | | | | | Ashland, Inc. | | | 149,703 | | |
| | 5,765 | | | | | Balchem Corp. | | | 141,358 | | |
| | 14,170 | | | | | Cabot Corp. | | | 178,259 | | |
| | 3,608 | | | | | CF Industries Holdings, Inc. | | | 267,497 | | |
| | 54,600 | | | | | Dow Chemical Co. | | | 881,244 | | |
| | 5,127 | | | | | FMC Corp. | | | 242,507 | | |
| | 4,340 | | | | | HB Fuller Co. | | | 81,462 | | |
| | 4,918 | | | | | Lubrizol Corp. | | | 232,671 | | |
| | 4,626 | | | | | Minerals Technologies, Inc. | | | 166,629 | | |
| | 7,664 | | | | | Monsanto Co. | | | 569,742 | | |
| | 1,760 | | | | | NewMarket Corp. | | | 118,501 | | |
| | 2,200 | | | | | Olin Corp. | | | 26,158 | | |
| | 4,820 | | | @ | | OM Group, Inc. | | | 139,876 | | |
| | 17,735 | | | @ | | PolyOne Corp. | | | 48,062 | | |
| | 25,090 | | | | | PPG Industries, Inc. | | | 1,101,451 | | |
| | 3,881 | | | | | Quaker Chemical Corp. | | | 51,578 | | |
| | 8,920 | | | | | Schulman A, Inc. | | | 134,781 | | |
| | 6,610 | | | | | Sherwin-Williams Co. | | | 355,288 | | |
| | 740 | | | | | Stepan Co. | | | 32,678 | | |
| | 10,300 | | | | | Terra Industries, Inc. | | | 249,466 | | |
| | 7,961 | | | | | Valspar Corp. | | | 179,361 | | |
| | 1,975 | | | | | Zep, Inc. | | | 23,799 | | |
| | | | 5,808,962 | | |
| | | | | Coal: 0.1% | |
| | 9,983 | | | | | Arch Coal, Inc. | | | 153,439 | | |
| | 4,960 | | | @,L | | Patriot Coal Corp. | | | 31,645 | | |
| | 17,900 | | | | | Peabody Energy Corp. | | | 539,864 | | |
| | | | 724,948 | | |
| | | | | Commercial Services: 1.6% | |
| | 2,400 | | | L | | Aaron Rents, Inc. | | | 71,568 | | |
| | 1,456 | | | | | ABM Industries, Inc. | | | 26,310 | | |
| | 5,100 | | | | | Administaff, Inc. | | | 118,677 | | |
| | 7,617 | | | @,L | | Alliance Data Systems Corp. | | | 313,744 | | |
| | 1,600 | | | @ | | American Public Education, Inc. | | | 63,376 | | |
| | 3,900 | | | @ | | AMN Healthcare Services, Inc. | | | 24,882 | | |
| | 10,981 | | | @ | | Apollo Group, Inc. - Class A | | | 780,969 | | |
| | 1,912 | | | | | Arbitron, Inc. | | | 30,382 | | |
| | 19,500 | | | | | Automatic Data Processing, Inc. | | | 691,080 | | |
| | 2,900 | | | @,L | | Bankrate, Inc. | | | 73,196 | | |
| | 3,100 | | | @ | | Brink's Home Security
Holdings, Inc. | | | 87,761 | | |
| | 1,900 | | | @,L | | Capella Education Co. | | | 113,905 | | |
| | 8,500 | | | @ | | Career Education Corp. | | | 211,565 | | |
| | 2,755 | | | | | CDI Corp. | | | 30,718 | | |
| | 3,650 | | | | | Chemed Corp. | | | 144,102 | | |
See Accompanying Notes to Financial Statements
40
PORTFOLIO OF INVESTMENTS
ING BALANCED PORTFOLIO AS OF JUNE 30, 2009 (UNAUDITED) (CONTINUED)
| Shares | | | | | | Value | |
| | | | | Commercial Services (continued) | |
| | 1,114 | | | @ | | Coinstar, Inc. | | $ | 29,744 | | |
| | 1,467 | | | @ | | Consolidated Graphics, Inc. | | | 25,555 | | |
| | 15,300 | | | @ | | Corinthian Colleges, Inc. | | | 259,029 | | |
| | 3,289 | | | @ | | Corrections Corp. of America | | | 55,880 | | |
| | 1,200 | | | @ | | Corvel Corp. | | | 27,324 | | |
| | 2,070 | | | | | Deluxe Corp. | | | 26,517 | | |
| | 5,050 | | | @ | | Forrester Research, Inc. | | | 123,978 | | |
| | 5,445 | | | @ | | FTI Consulting, Inc. | | | 276,170 | | |
| | 11,500 | | | @ | | Gartner, Inc. | | | 175,490 | | |
| | 5,450 | | | @ | | Geo Group, Inc. | | | 101,261 | | |
| | 10,300 | | | | | Global Payments, Inc. | | | 385,838 | | |
| | 1,600 | | | | | Healthcare Services Group | | | 28,608 | | |
| | 9,650 | | | | | Heartland Payment Systems, Inc. | | | 92,351 | | |
| | 10,000 | | | @ | | Hewitt Associates, Inc. | | | 297,800 | | |
| | 2,102 | | | | | Hillenbrand, Inc. | | | 34,977 | | |
| | 1,415 | | | @ | | HMS Holdings Corp. | | | 57,619 | | |
| | 1,950 | | | @ | | ITT Educational Services, Inc. | | | 196,287 | | |
| | 6,000 | | | | | Kelly Services, Inc. | | | 65,700 | | |
| | 6,333 | | | @ | | Kendle International, Inc. | | | 77,516 | | |
| | 6,450 | | | | | Lender Processing Services, Inc. | | | 179,117 | | |
| | 6,712 | | | @ | | Live Nation, Inc. | | | 32,620 | | |
| | 7,350 | | | | | Manpower, Inc. | | | 311,199 | | |
| | 9,300 | | | | | Moody's Corp. | | | 245,055 | | |
| | 17,900 | | | @ | | MPS Group, Inc. | | | 136,756 | | |
| | 4,796 | | | @ | | Navigant Consulting, Inc. | | | 61,964 | | |
| | 16,050 | | | @ | | On Assignment, Inc. | | | 62,756 | | |
| | 1,450 | | | @ | | Parexel International Corp. | | | 20,851 | | |
| | 11,733 | | | | | Pharmaceutical Product
Development, Inc. | | | 272,440 | | |
| | 1,750 | | | @,L | | Pre-Paid Legal Services, Inc. | | | 76,283 | | |
| | 11,000 | | | @ | | Rent-A-Center, Inc. | | | 196,130 | | |
| | 61,623 | | | | | RR Donnelley & Sons Co. | | | 716,059 | | |
| | 21,250 | | | @ | | SAIC, Inc. | | | 394,188 | | |
| | 18,300 | | | | | Service Corp. International | | | 100,284 | | |
| | 2,958 | | | @ | | Spherion Corp. | | | 12,187 | | |
| | 550 | | | L | | Strayer Education, Inc. | | | 119,961 | | |
| | 3,700 | | | @ | | TeleTech Holdings, Inc. | | | 56,055 | | |
| | 4,400 | | | @ | | Ticketmaster | | | 28,248 | | |
| | 5,940 | | | @ | | TrueBlue, Inc. | | | 49,896 | | |
| | 3,000 | | | @ | | Universal Technical Institute, Inc. | | | 44,790 | | |
| | 5,240 | | | | | Viad Corp. | | | 90,233 | | |
| | 1,200 | | | | | Watson Wyatt Worldwide, Inc. | | | 45,036 | | |
| | 60,977 | | | | | Western Union Co. | | | 1,000,023 | | |
| | 5,756 | | | @ | | Wright Express Corp. | | | 146,605 | | |
| | | | 9,518,615 | | |
| | | | | Computers: 3.8% | |
| | 36,022 | | | @ | | Apple, Inc. | | | 5,130,613 | | |
| | 5,240 | | | @ | | CACI International, Inc. | | | 223,800 | | |
| | 22,650 | | | @ | | Ciber, Inc. | | | 70,215 | | |
| | 16,898 | | | @ | | Computer Sciences Corp. | | | 748,581 | | |
| | 47,499 | | | @ | | Dell, Inc. | | | 652,161 | | |
| | 9,100 | | | | | Diebold, Inc. | | | 239,876 | | |
| | 7,302 | | | @ | | DST Systems, Inc. | | | 269,809 | | |
| | 100,120 | | | @ | | EMC Corp. | | | 1,311,572 | | |
| | 128,245 | | | | | Hewlett-Packard Co. | | | 4,956,669 | | |
| | 2,663 | | | @,L | | Hutchinson Technology, Inc. | | | 5,193 | | |
| | 10,600 | | | | | Imation Corp. | | | 80,666 | | |
| | 9,457 | | | @ | | Insight Enterprises, Inc. | | | 91,355 | | |
| | 61,551 | | | | | International Business
Machines Corp. | | | 6,427,155 | | |
| | 3,900 | | | | | Jack Henry & Associates, Inc. | | | 80,925 | | |
| | 6,900 | | | @ | | Manhattan Associates, Inc. | | | 125,718 | | |
| Shares | | | | | | Value | |
| | 3,300 | | | @ | | Mercury Computer Systems, Inc. | | $ | 30,525 | | |
| | 11,584 | | | @ | | Micros Systems, Inc. | | | 293,307 | | |
| | 1,390 | | | | | MTS Systems Corp. | | | 28,704 | | |
| | 26,031 | | | @ | | NCR Corp. | | | 307,947 | | |
| | 6,350 | | | @,L | | Palm, Inc. | | | 105,220 | | |
| | 9,070 | | | @ | | Radisys Corp. | | | 81,721 | | |
| | 5,550 | | | @ | | SYKES Enterprises, Inc. | | | 100,400 | | |
| | 3,750 | | | @,L | | Synaptics, Inc. | | | 144,938 | | |
| | 9,388 | | | @ | | Synopsys, Inc. | | | 183,160 | | |
| | 15,395 | | | @ | | Teradata Corp. | | | 360,705 | | |
| | | | 22,050,935 | | |
| | | | | Cosmetics/Personal Care: 0.7% | |
| | 882 | | | | | Alberto-Culver Co. | | | 22,429 | | |
| | 1,050 | | | @,L | | Chattem, Inc. | | | 71,505 | | |
| | 76,835 | | | | | Procter & Gamble Co. | | | 3,926,269 | | |
| | | | 4,020,203 | | |
| | | | | Distribution/Wholesale: 0.2% | |
| | 12,960 | | | @ | | Brightpoint, Inc. | | | 81,259 | | |
| | 3,200 | | | @ | | Fossil, Inc. | | | 77,056 | | |
| | 20,137 | | | @ | | Ingram Micro, Inc. | | | 352,398 | | |
| | 10,450 | | | @ | | LKQ Corp. | | | 171,903 | | |
| | 5,061 | | | @ | | Scansource, Inc. | | | 124,096 | | |
| | 6,842 | | | @ | | School Specialty, Inc. | | | 138,277 | | |
| | 8,232 | | | @ | | Tech Data Corp. | | | 269,269 | | |
| | 2,450 | | | L | | Watsco, Inc. | | | 119,879 | | |
| | | | 1,334,137 | | |
| | | | | Diversified Financial Services: 1.0% | |
| | 940 | | | @ | | Affiliated Managers Group, Inc. | | | 54,699 | | |
| | 46,000 | | | | | American Express Co. | | | 1,069,040 | | |
| | 11,800 | | | @,L | | AmeriCredit Corp. | | | 159,890 | | |
| | 84,650 | | | | | Charles Schwab Corp. | | | 1,484,761 | | |
| | 2,524 | | | | | CME Group, Inc. | | | 785,242 | | |
| | 2,170 | | | | | Eaton Vance Corp. | | | 58,048 | | |
| | 452 | | | | | Financial Federal Corp. | | | 9,289 | | |
| | 1,150 | | | L | | Greenhill & Co., Inc. | | | 83,042 | | |
| | 4,300 | | | @ | | IntercontinentalExchange, Inc. | | | 491,232 | | |
| | 4,526 | | | @ | | Investment Technology
Group, Inc. | | | 92,285 | | |
| | 16,150 | | | | | Jefferies Group, Inc. | | | 344,480 | | |
| | 499 | | | @ | | LaBranche & Co., Inc. | | | 2,146 | | |
| | 33,050 | | | @ | | Nasdaq Stock Market, Inc. | | | 704,296 | | |
| | 10,380 | | | | | National Financial Partners Corp. | | | 75,982 | | |
| | 7,720 | | | | | OptionsXpress Holdings, Inc. | | | 119,892 | | |
| | 1,380 | | | @,L | | Portfolio Recovery
Associates, Inc. | | | 53,447 | | |
| | 2,200 | | | @ | | Stifel Financial Corp. | | | 105,798 | | |
| | 3,230 | | | | | SWS Group, Inc. | | | 45,123 | | |
| | 852 | | | @ | | TradeStation Group, Inc. | | | 7,208 | | |
| | 3,498 | | | | | Waddell & Reed Financial, Inc. | | | 92,242 | | |
| | 5,347 | | | @,L | | World Acceptance, Corp. | | | 106,459 | | |
| | | | 5,944,601 | | |
| | | | | Electric: 1.9% | |
| | 16,340 | | | @ | | AES Corp. | | | 189,707 | | |
| | 2,550 | | | | | Alliant Energy Corp. | | | 66,632 | | |
| | 1,600 | | | | | Avista Corp. | | | 28,496 | | |
| | 1,850 | | | | | Central Vermont Public
Service Corp. | | | 33,485 | | |
| | 4,178 | | | | | CH Energy Group, Inc. | | | 195,113 | | |
| | 72,320 | | | | | CMS Energy Corp. | | | 873,626 | | |
| | 12,800 | | | | | Dominion Resources, Inc. | | | 427,776 | | |
See Accompanying Notes to Financial Statements
41
PORTFOLIO OF INVESTMENTS
ING BALANCED PORTFOLIO AS OF JUNE 30, 2009 (UNAUDITED) (CONTINUED)
| Shares | | | | | | Value | |
| | | | | Electric (continued) | |
| | 8,300 | | | | | DPL, Inc. | | $ | 192,311 | | |
| | 3,697 | | | | | DTE Energy Co. | | | 118,304 | | |
| | 53,700 | | | | | Exelon Corp. | | | 2,749,977 | | |
| | 9,900 | | | | | FirstEnergy Corp. | | | 383,625 | | |
| | 24,116 | | | | | FPL Group, Inc. | | | 1,371,236 | | |
| | 14,300 | | | | | Hawaiian Electric Industries | | | 272,558 | | |
| | 6,000 | | | | | MDU Resources Group, Inc. | | | 113,820 | | |
| | 11,800 | | | | | NSTAR | | | 378,898 | | |
| | 1,949 | | | | | NV Energy, Inc. | | | 21,030 | | |
| | 7,000 | | | | | OGE Energy Corp. | | | 198,240 | | |
| | 4,100 | | | | | PNM Resources, Inc. | | | 43,911 | | |
| | 27,900 | | | | | PPL Corp. | | | 919,584 | | |
| | 54,100 | | | | | Public Service Enterprise
Group, Inc. | | | 1,765,283 | | |
| | 4,065 | | | | | Unisource Energy Corp. | | | 107,885 | | |
| | 25,000 | | | | | Xcel Energy, Inc. | | | 460,250 | | |
| | | | 10,911,747 | | |
| | | | | | | Electrical Components &
Equipment: 0.1% | | | | | |
| | 5,250 | | | | | Ametek, Inc. | | | 181,545 | | |
| | 3,933 | | | | | Belden CDT, Inc. | | | 65,681 | | |
| | 4,700 | | | @ | | Energizer Holdings, Inc. | | | 245,528 | | |
| | 7,259 | | | | | Hubbell, Inc. | | | 232,724 | | |
| | | | 725,478 | | |
| | | | | Electronics: 0.8% | |
| | 1,000 | | | | | American Science &
Engineering, Inc. | | | 69,120 | | |
| | 16,700 | | | | | Amphenol Corp. | | | 528,388 | | |
| | 12,600 | | | @ | | Arrow Electronics, Inc. | | | 267,624 | | |
| | 16,086 | | | @ | | Avnet, Inc. | | | 338,289 | | |
| | 350 | | | @ | | Axsys Technologies, Inc. | | | 18,774 | | |
| | 883 | | | | | Badger Meter, Inc. | | | 36,203 | | |
| | 1,503 | | | | | Bel Fuse, Inc. | | | 24,108 | | |
| | 15,360 | | | @ | | Benchmark Electronics, Inc. | | | 221,184 | | |
| | 9,600 | | | S | | Brady Corp. | | | 241,152 | | |
| | 10,095 | | | @ | | Checkpoint Systems, Inc. | | | 158,391 | | |
| | 14,041 | | | | | CTS Corp. | | | 91,969 | | |
| | 127 | | | @ | | Cymer, Inc. | | | 3,776 | | |
| | 2,400 | | | | | Daktronics, Inc. | | | 18,480 | | |
| | 2,848 | | | @ | | Dionex Corp. | | | 173,813 | | |
| | 1,615 | | | @ | | FEI Co. | | | 36,984 | | |
| | 2,811 | | | S | | Gentex Corp. | | | 32,608 | | |
| | 1,023 | | | @ | | Itron, Inc. | | | 56,337 | | |
| | 847 | | | @ | | LoJack Corp. | | | 3,549 | | |
| | 9,850 | | | | | Methode Electronics, Inc. | | | 69,147 | | |
| | 3,627 | | | @,@@ | | Mettler Toledo International, Inc. | | | 279,823 | | |
| | 8,500 | | | @ | | Newport Corp. | | | 49,215 | | |
| | 1,408 | | | | | Park Electrochemical Corp. | | | 30,314 | | |
| | 30,239 | | | | | PerkinElmer, Inc. | | | 526,159 | | |
| | 3,970 | | | @ | | Plexus Corp. | | | 81,226 | | |
| | 379 | | | @ | | Rogers Corp. | | | 7,667 | | |
| | 6,150 | | | @ | | Thomas & Betts Corp. | | | 177,489 | | |
| | 3,190 | | | @ | | Trimble Navigation Ltd. | | | 62,620 | | |
| | 8,979 | | | @ | | TTM Technologies, Inc. | | | 71,473 | | |
| | 5,708 | | | @ | | Varian, Inc. | | | 225,066 | | |
| | 23,800 | | | @ | | Vishay Intertechnology, Inc. | | | 161,602 | | |
| | 5,885 | | | @ | | Waters Corp. | | | 302,901 | | |
| | 5,950 | | | | | Watts Water Technologies, Inc. | | | 128,163 | | |
| | 7,900 | | | | | Woodward Governor Co. | | | 156,420 | | |
| | | | 4,650,034 | | |
| Shares | | | | | | Value | |
| | | | | Energy-Alternate Sources: 0.0% | |
| | 2,892 | | | @ | | Headwaters, Inc. | | $ | 9,717 | | |
| | | | 9,717 | | |
| | | | | Engineering & Construction: 0.7% | |
| | 6,500 | | | @ | | Aecom Technology Corp. | | | 208,000 | | |
| | 10,655 | | | @ | | Dycom Industries, Inc. | | | 117,951 | | |
| | 11,810 | | | @ | | EMCOR Group, Inc. | | | 237,617 | | |
| | 24,640 | | | | | Fluor Corp. | | | 1,263,786 | | |
| | 4,500 | | | | | Granite Construction, Inc. | | | 149,760 | | |
| | 2,326 | | | @ | | Insituform Technologies, Inc. | | | 39,472 | | |
| | 26,300 | | | @ | | Jacobs Engineering Group, Inc. | | | 1,106,967 | | |
| | 13,573 | | | | | KBR, Inc. | | | 250,286 | | |
| | 8,408 | | | @ | | Shaw Group, Inc. | | | 230,463 | | |
| | 1,100 | | | @ | | Stanley, Inc. | | | 36,168 | | |
| | 6,820 | | | @ | | URS Corp. | | | 337,726 | | |
| | | | 3,978,196 | | |
| | | | | Entertainment: 0.0% | |
| | 1,935 | | | @ | | DreamWorks Animation
SKG, Inc. | | | 53,387 | | |
| | 6,056 | | | @ | | Pinnacle Entertainment, Inc. | | | 56,260 | | |
| | 8,500 | | | @ | | Shuffle Master, Inc. | | | 56,185 | | |
| | | | 165,832 | | |
| | | | | Environmental Control: 0.1% | |
| | 5,378 | | | @ | | Calgon Carbon Corp. | | | 74,700 | | |
| | 704 | | | @ | | Clean Harbors, Inc. | | | 38,009 | | |
| | 5,445 | | | @ | | Darling International, Inc. | | | 35,937 | | |
| | 3,280 | | | @ | | Tetra Tech, Inc. | | | 93,972 | | |
| | 9,583 | | | @ | | Waste Connections, Inc. | | | 248,296 | | |
| | | | 490,914 | | |
| | | | | Food: 1.1% | |
| | 1,369 | | | L | | Cal-Maine Foods, Inc. | | | 34,170 | | |
| | 1,405 | | | | | Corn Products International, Inc. | | | 37,640 | | |
| | 11,500 | | | @ | | Dean Foods Co. | | | 220,685 | | |
| | 3,514 | | | | | Diamond Foods, Inc. | | | 98,041 | | |
| | 10,800 | | | | | General Mills, Inc. | | | 605,016 | | |
| | 127 | | | @ | | Hain Celestial Group, Inc. | | | 1,982 | | |
| | 4,000 | | | | | J&J Snack Foods Corp. | | | 143,600 | | |
| | 98,724 | | | | | Kraft Foods, Inc. | | | 2,501,666 | | |
| | 12,638 | | | | | Kroger Co. | | | 278,668 | | |
| | 2,785 | | | | | Lancaster Colony Corp. | | | 122,735 | | |
| | 789 | | | | | Lance, Inc. | | | 18,250 | | |
| | 1,890 | | | | | Nash Finch Co. | | | 51,143 | | |
| | 4,405 | | | @ | | Ralcorp Holdings, Inc. | | | 268,353 | | |
| | 4,852 | | | | | Ruddick Corp. | | | 113,682 | | |
| | 2,000 | | | | | Sanderson Farms, Inc. | | | 90,000 | | |
| | 79,490 | | | | | Sara Lee Corp. | | | 775,822 | | |
| | 4,700 | | | @,L | | Smithfield Foods, Inc. | | | 65,659 | | |
| | 1,586 | | | | | Spartan Stores, Inc. | | | 19,682 | | |
| | 9,750 | | | | | Supervalu, Inc. | | | 126,263 | | |
| | 4,243 | | | @ | | TreeHouse Foods, Inc. | | | 122,071 | | |
| | 43,600 | | | | | Tyson Foods, Inc. | | | 549,796 | | |
| | 2,550 | | | @ | | United Natural Foods, Inc. | | | 66,938 | | |
| | | | 6,311,862 | | |
| | | | | Forest Products & Paper: 0.2% | |
| | 4,650 | | | @ | | Buckeye Technologies, Inc. | | | 20,879 | | |
| | 1,100 | | | @ | | Clearwater Paper Corp. | | | 27,819 | | |
| | 45,316 | | | | | International Paper Co. | | | 685,631 | | |
| | 20,500 | | | | | MeadWestvaco Corp. | | | 336,405 | | |
| | 3,900 | | | | | Schweitzer-Mauduit
International, Inc. | | | 106,119 | | |
| | | | 1,176,853 | | |
See Accompanying Notes to Financial Statements
42
PORTFOLIO OF INVESTMENTS
ING BALANCED PORTFOLIO AS OF JUNE 30, 2009 (UNAUDITED) (CONTINUED)
| Shares | | | | | | Value | |
| | | | | Gas: 0.5% | |
| | 10,550 | | | | | AGL Resources, Inc. | | $ | 335,490 | | |
| | 13,102 | | | | | Atmos Energy Corp. | | | 328,074 | | |
| | 3,598 | | | | | Energen Corp. | | | 143,560 | | |
| | 151 | | | | | Laclede Group, Inc. | | | 5,003 | | |
| | 2,200 | | | | | National Fuel Gas Co. | | | 79,376 | | |
| | 7,021 | | | | | New Jersey Resources Corp. | | | 260,058 | | |
| | 950 | | | | | Northwest Natural Gas Co. | | | 42,104 | | |
| | 4,322 | | | | | Piedmont Natural Gas Co. | | | 104,203 | | |
| | 17,141 | | | | | Sempra Energy | | | 850,708 | | |
| | 2,100 | | | | | South Jersey Industries, Inc. | | | 73,269 | | |
| | 3,100 | | | | | Southwest Gas Corp. | | | 68,851 | | |
| | 13,997 | | | | | UGI Corp. | | | 356,784 | | |
| | 3,350 | | | | | Vectren Corp. | | | 78,491 | | |
| | 3,000 | | | | | WGL Holdings, Inc. | | | 96,060 | | |
| | | | 2,822,031 | | |
| | | | | Hand/Machine Tools: 0.0% | |
| | 1,175 | | | | | Baldor Electric Co. | | | 27,953 | | |
| | 1,053 | | | | | Kennametal, Inc. | | | 20,197 | | |
| | 2,550 | | | | | Lincoln Electric Holdings, Inc. | | | 91,902 | | |
| | 1,457 | | | | | Regal-Beloit Corp. | | | 57,872 | | |
| | | | 197,924 | | |
| | | | | Healthcare-Products: 1.5% | |
| | 663 | | | @ | | Abaxism, Inc. | | | 13,618 | | |
| | 12,204 | | | @ | | Affymetrix, Inc. | | | 72,370 | | |
| | 6,800 | | | @ | | Align Technology, Inc. | | | 72,080 | | |
| | 12,535 | | | @ | | American Medical Systems
Holdings, Inc. | | | 198,053 | | |
| | 1,480 | | | | | Beckman Coulter, Inc. | | | 84,567 | | |
| | 6,377 | | | | | Becton Dickinson & Co. | | | 454,744 | | |
| | 47,600 | | | @ | | Boston Scientific Corp. | | | 482,664 | | |
| | 2,526 | | | | | Cooper Cos., Inc. | | | 62,468 | | |
| | 5,970 | | | @ | | Cyberonics | | | 99,281 | | |
| | 1,318 | | | @ | | Edwards Lifesciences Corp. | | | 89,664 | | |
| | 4,481 | | | @ | | Gen-Probe, Inc. | | | 192,593 | | |
| | 1,900 | | | @ | | Haemonetics Corp. | | | 108,300 | | |
| | 6,950 | | | @ | | Henry Schein, Inc. | | | 333,253 | | |
| | 8,433 | | | S | | Hill-Rom Holdings, Inc. | | | 136,783 | | |
| | 20,598 | | | @ | | Hologic, Inc. | | | 293,110 | | |
| | 18,400 | | | @ | | Hospira, Inc. | | | 708,768 | | |
| | 1,038 | | | @ | | ICU Medical, Inc. | | | 42,714 | | |
| | 567 | | | @ | | Idexx Laboratories, Inc. | | | 26,195 | | |
| | 5,900 | | | | | Invacare Corp. | | | 104,135 | | |
| | 55,790 | | | | | Johnson & Johnson | | | 3,168,872 | | |
| | 5,190 | | | @ | | Kensey Nash Corp. | | | 136,030 | | |
| | 5,340 | | | @ | | Kinetic Concepts, Inc. | | | 145,515 | | |
| | 33,412 | | | | | Medtronic, Inc. | | | 1,165,745 | | |
| | 1,100 | | | | | Meridian Bioscience, Inc. | | | 24,838 | | |
| | 2,133 | | | @ | | Merit Medical Systems, Inc. | | | 34,768 | | |
| | 7,130 | | | @ | | PSS World Medical, Inc. | | | 131,976 | | |
| | 4,741 | | | @ | | Resmed, Inc. | | | 193,101 | | |
| | 10,750 | | | | | Steris Corp. | | | 280,360 | | |
| | 400 | | | | | Techne Corp. | | | 25,524 | | |
| | 2,900 | | | @ | | Thoratec Corp. | | | 77,662 | | |
| | 890 | | | | | West Pharmaceutical
Services, Inc. | | | 31,017 | | |
| | | | 8,990,768 | | |
| | | | | Healthcare-Services: 1.3% | |
| | 24,857 | | | | | Aetna, Inc. | | | 622,668 | | |
| | 709 | | | @ | | Air Methods Corp. | | | 19,398 | | |
| | 2,430 | | | @,L | | Amedisys, Inc. | | | 80,239 | | |
| Shares | | | | | | Value | |
| | 7,303 | | | @ | | AMERIGROUP Corp. | | $ | 196,086 | | |
| | 5,950 | | | @ | | Amsurg Corp. | | | 127,568 | | |
| | 5,800 | | | @ | | Centene Corp. | | | 115,884 | | |
| | 11,105 | | | | | Cigna Corp. | | | 267,519 | | |
| | 13,146 | | | @ | | Community Health Systems, Inc. | | | 331,937 | | |
| | 750 | | | @ | | Covance, Inc. | | | 36,900 | | |
| | 12,400 | | | @,S | | Coventry Health Care, Inc. | | | 232,004 | | |
| | 1,000 | | | @ | | Genoptix, Inc. | | | 31,990 | | |
| | 4,242 | | | @ | | Gentiva Health Services, Inc. | | | 69,823 | | |
| | 32,738 | | | @ | | Health Management
Associates, Inc. | | | 161,726 | | |
| | 12,300 | | | @ | | Health Net, Inc. | | | 191,265 | | |
| | 7,350 | | | @ | | Healthspring, Inc. | | | 79,821 | | |
| | 5,690 | | | @ | | Healthways, Inc. | | | 76,531 | | |
| | 8,544 | | | @ | | Humana, Inc. | | | 275,629 | | |
| | 900 | | | @ | | IPC The Hospitalist Co., Inc. | | | 24,021 | | |
| | 5,600 | | | @ | | Kindred Healthcare, Inc. | | | 69,272 | | |
| | 9,482 | | | @ | | Laboratory Corp. of
America Holdings | | | 642,785 | | |
| | 2,450 | | | @ | | LHC Group, Inc. | | | 54,415 | | |
| | 9,300 | | | @ | | LifePoint Hospitals, Inc. | | | 244,125 | | |
| | 10,300 | | | @ | | Lincare Holdings, Inc. | | | 242,256 | | |
| | 6,100 | | | @ | | Magellan Health Services, Inc. | | | 200,202 | | |
| | 7,080 | | | @ | | Mednax, Inc. | | | 298,280 | | |
| | 3,687 | | | @,L | | Molina Healthcare, Inc. | | | 88,193 | | |
| | 5,887 | | | @ | | Odyssey HealthCare, Inc. | | | 60,518 | | |
| | 7,700 | | | | | Quest Diagnostics | | | 434,511 | | |
| | 2,200 | | | @ | | RehabCare Group, Inc. | | | 52,646 | | |
| | 551 | | | @ | | Res-Care, Inc. | | | 7,879 | | |
| | 59,003 | | | | | UnitedHealth Group, Inc. | | | 1,473,895 | | |
| | 5,950 | | | | | Universal Health Services, Inc. | | | 290,658 | | |
| | 4,500 | | | @ | | WellCare Health Plans, Inc. | | | 83,205 | | |
| | 13,400 | | | @ | | WellPoint, Inc. | | | 681,926 | | |
| | | | 7,865,775 | | |
| | | | | Home Builders: 0.3% | |
| | 37,000 | | | | | D.R. Horton, Inc. | | | 346,320 | | |
| | 21,100 | | | | | KB Home | | | 288,648 | | |
| | 25,300 | | | | | Lennar Corp. | | | 245,157 | | |
| | 4,170 | | | | | M/I Homes, Inc. | | | 40,824 | | |
| | 5,350 | | | | | MDC Holdings, Inc. | | | 161,089 | | |
| | 4,550 | | | @ | | Meritage Homes Corp. | | | 85,813 | | |
| | 550 | | | @ | | NVR, Inc. | | | 276,315 | | |
| | 4,250 | | | | | Ryland Group, Inc. | | | 71,230 | | |
| | 16,917 | | | @ | | Standard-Pacific Corp. | | | 34,342 | | |
| | 6,371 | | | | | Thor Industries, Inc. | | | 117,035 | | |
| | 14,100 | | | @ | | Toll Brothers, Inc. | | | 239,277 | | |
| | | | 1,906,050 | | |
| | | | | Home Furnishings: 0.0% | |
| | 1,124 | | | @ | | DTS, Inc. | | | 30,427 | | |
| | 9,247 | | | | | La-Z-Boy, Inc. | | | 43,646 | | |
| | 3,500 | | | @ | | Universal Electronics, Inc. | | | 70,595 | | |
| | | | 144,668 | | |
| | | | | Household Products/Wares: 0.4% | |
| | 7,296 | | | | | Avery Dennison Corp. | | | 187,361 | | |
| | 8,747 | | | @ | | Central Garden & Pet Co. | | | 86,158 | | |
| | 5,280 | | | | | Church & Dwight Co., Inc. | | | 286,757 | | |
| | 3,200 | | | @ | | Helen of Troy Ltd. | | | 53,728 | | |
| | 25,234 | | | | | Kimberly-Clark Corp. | | | 1,323,019 | | |
| | 4,644 | | | | | Tupperware Corp. | | | 120,837 | | |
| | | | 2,057,860 | | |
See Accompanying Notes to Financial Statements
43
PORTFOLIO OF INVESTMENTS
ING BALANCED PORTFOLIO AS OF JUNE 30, 2009 (UNAUDITED) (CONTINUED)
| Shares | | | | | | Value | |
| | | | | Housewares: 0.0% | |
| | 4,657 | | | L | | Toro Co. | | $ | 139,244 | | |
| | | | 139,244 | | |
| | | | | Insurance: 1.7% | |
| | 13,546 | | | | | Aflac, Inc. | | | 421,145 | | |
| | 13,675 | | | | | American Financial Group, Inc. | | | 295,107 | | |
| | 178 | | | | | American Physicians Capital, Inc. | | | 6,970 | | |
| | 4,752 | | | @ | | Amerisafe, Inc. | | | 73,941 | | |
| | 36,762 | | | | | AON Corp. | | | 1,392,177 | | |
| | 5,404 | | | | | Arthur J. Gallagher & Co. | | | 115,321 | | |
| | 1,106 | | | | | Brown & Brown, Inc. | | | 22,043 | | |
| | 54,273 | | | | | Chubb Corp. | | | 2,164,407 | | |
| | 8,651 | | | | | Delphi Financial Group | | | 168,089 | | |
| | 1,698 | | | | | Employers Holdings, Inc. | | | 23,008 | | |
| | 6,629 | | | @@ | | Everest Re Group Ltd. | | | 474,438 | | |
| | 18,561 | | | | | Fidelity National Title Group, Inc. | | | 251,130 | | |
| | 10,050 | | | | | First American Corp. | | | 260,396 | | |
| | 2,969 | | | | | Hanover Insurance Group, Inc. | | | 113,149 | | |
| | 7,023 | | | | | HCC Insurance Holdings, Inc. | | | 168,622 | | |
| | 14,700 | | | | | Horace Mann Educators Corp. | | | 146,559 | | |
| | 3,633 | | | | | Infinity Property &
Casualty Corp. | | | 132,459 | | |
| | 9,000 | | | | | Loews Corp. | | | 246,600 | | |
| | 13,000 | | | | | Marsh & McLennan Cos., Inc. | | | 261,690 | | |
| | 2,100 | | | @ | | Navigators Group, Inc. | | | 93,303 | | |
| | 6,319 | | | | | Old Republic International Corp. | | | 62,242 | | |
| | 5,400 | | | @ | | ProAssurance Corp. | | | 249,534 | | |
| | 17,400 | | | @ | | Progressive Corp. | | | 262,914 | | |
| | 1,300 | | | | | Protective Life Corp. | | | 14,872 | | |
| | 5,143 | | | | | Reinsurance Group of
America, Inc. | | | 179,542 | | |
| | 144 | | | | | RLI Corp. | | | 6,451 | | |
| | 1,762 | | | | | Safety Insurance Group, Inc. | | | 53,847 | | |
| | 4,214 | | | | | Selective Insurance Group | | | 53,813 | | |
| | 5,400 | | | | | Stancorp Financial Group, Inc. | | | 154,872 | | |
| | 1,422 | | | | | Stewart Information
Services Corp. | | | 20,264 | | |
| | 10,910 | | | | | Torchmark Corp. | | | 404,106 | | |
| | 4,310 | | | | | Tower Group, Inc. | | | 106,802 | | |
| | 22,052 | | | | | Travelers Cos., Inc. | | | 905,014 | | |
| | 13,047 | | | | | Unitrin, Inc. | | | 156,825 | | |
| | 39,829 | | | | | UnumProvident Corp. | | | 631,688 | | |
| | 3,850 | | | | | WR Berkley Corp. | | | 82,660 | | |
| | 59 | | | L | | Zenith National Insurance Corp. | | | 1,283 | | |
| | | | 10,177,283 | | |
| | | | | Internet: 1.6% | |
| | 14,532 | | | @ | | Amazon.com, Inc. | | | 1,215,747 | | |
| | 2,054 | | | @ | | Avocent Corp. | | | 28,674 | | |
| | 4,820 | | | @ | | Blue Coat Systems, Inc. | | | 79,723 | | |
| | 1,390 | | | @,L | | Blue Nile, Inc. | | | 59,756 | | |
| | 1,152 | | | @ | | comScore, Inc. | | | 15,345 | | |
| | 5,070 | | | @ | | Cybersource Corp. | | | 77,571 | | |
| | 3,439 | | | @ | | DealerTrack Holdings, Inc. | | | 58,463 | | |
| | 2,533 | | | @ | | Digital River, Inc. | | | 91,999 | | |
| | 85,567 | | | @ | | eBay, Inc. | | | 1,465,763 | | |
| | 2,700 | | | @ | | Equinix, Inc. | | | 196,398 | | |
| | 6,668 | | | @ | | eResearch Technology, Inc. | | | 41,408 | | |
| | 5,250 | | | @ | | F5 Networks, Inc. | | | 181,598 | | |
| | 8,839 | | | @ | | Google, Inc. - Class A | | | 3,726,434 | | |
| | 8,208 | | | @ | | j2 Global Communications, Inc. | | | 185,172 | | |
| | 1,553 | | | @ | | Knot, Inc. | | | 12,238 | | |
| | 2,100 | | | @,L | | NetFlix, Inc. | | | 86,814 | | |
| Shares | | | | | | Value | |
| | 4,040 | | | L | | Nutri/System, Inc. | | $ | 58,580 | | |
| | 7,790 | | | @ | | Perficient, Inc. | | | 54,452 | | |
| | 3,450 | | | @,L | | Priceline.com, Inc. | | | 384,848 | | |
| | 6,460 | | | @ | | Stamps.com, Inc. | | | 54,781 | | |
| | 68,070 | | | @ | | Symantec Corp. | | | 1,059,169 | | |
| | 17,251 | | | | | United Online, Inc. | | | 112,304 | | |
| | 12,500 | | | @ | | Valueclick, Inc. | | | 131,500 | | |
| | 4,842 | | | @ | | Websense, Inc. | | | 86,381 | | |
| | 2,953 | | | @ | | Yahoo!, Inc. | | | 46,244 | | |
| | | | 9,511,362 | | |
| | | | | Investment Companies: 0.0% | |
| | 2,265 | | | | | Apollo Investment Corp. | | | 13,590 | | |
| | | | 13,590 | | |
| | | | | Iron/Steel: 0.3% | |
| | 3,800 | | | | | Allegheny Technologies, Inc. | | | 132,734 | | |
| | 13,133 | | | | | Cliffs Natural Resources, Inc. | | | 321,365 | | |
| | 7,979 | | | | | Nucor Corp. | | | 354,507 | | |
| | 8,500 | | | | | Reliance Steel & Aluminum Co. | | | 326,315 | | |
| | 9,999 | | | | | Steel Dynamics, Inc. | | | 147,285 | | |
| | 18,230 | | | L | | United States Steel Corp. | | | 651,540 | | |
| | | | 1,933,746 | | |
| | | | | Leisure Time: 0.0% | |
| | 145 | | | | | Brunswick Corp. | | | 626 | | |
| | 3,550 | | | @ | | Interval Leisure Group, Inc. | | | 33,086 | | |
| | 2,337 | | | L | | Polaris Industries, Inc. | | | 75,064 | | |
| | | | 108,776 | | |
| | | | | Lodging: 0.0% | |
| | 1,698 | | | | | Marcus Corp. | | | 17,863 | | |
| | | | 17,863 | | |
| | | | | | | Machinery-Construction &
Mining: 0.1% | | | | | |
| | 3,200 | | | | | Bucyrus International, Inc. | | | 91,392 | | |
| | 10,049 | | | | | Joy Global, Inc. | | | 358,950 | | |
| | 5,361 | | | @ | | Terex Corp. | | | 64,707 | | |
| | | | 515,049 | | |
| | | | | Machinery-Diversified: 0.4% | |
| | 3,917 | | | @ | | AGCO Corp. | | | 113,867 | | |
| | 2,079 | | | | | Albany International Corp. | | | 23,658 | | |
| | 7,500 | | | | | Applied Industrial
Technologies, Inc. | | | 147,750 | | |
| | 2,000 | | | | | Briggs & Stratton Corp. | | | 26,680 | | |
| | 3,000 | | | | | Cognex Corp. | | | 42,390 | | |
| | 10,100 | | | | | Flowserve Corp. | | | 705,081 | | |
| | 8,750 | | | @ | | Gardner Denver, Inc. | | | 220,238 | | |
| | 1,450 | | | | | Graco, Inc. | | | 31,929 | | |
| | 9,581 | | | | | IDEX Corp. | | | 235,405 | | |
| | 5,624 | | | @ | | Intermec, Inc. | | | 72,550 | | |
| | 643 | | | L | | Lindsay Manufacturing Co. | | | 21,283 | | |
| | 1,024 | | | | | Nordson Corp. | | | 39,588 | | |
| | 2,684 | | | | | Robbins & Myers, Inc. | | | 51,667 | | |
| | 4,300 | | | | | Rockwell Automation, Inc. | | | 138,116 | | |
| | 8,698 | | | | | Roper Industries, Inc. | | | 394,106 | | |
| | 6,042 | | | | | Wabtec Corp. | | | 194,371 | | |
| | | | 2,458,679 | | |
| | | | | Media: 1.0% | |
| | 170,432 | | | | | Comcast Corp. - Class A | | | 2,469,560 | | |
| | 26,850 | | | @,L | | DIRECTV Group, Inc. | | | 663,464 | | |
See Accompanying Notes to Financial Statements
44
PORTFOLIO OF INVESTMENTS
ING BALANCED PORTFOLIO AS OF JUNE 30, 2009 (UNAUDITED) (CONTINUED)
| Shares | | | | | | Value | |
| | | | | Media (continued) | |
| | 1,100 | | | L | | Factset Research Systems, Inc. | | $ | 54,857 | | |
| | 4,200 | | | | | McGraw-Hill Cos., Inc. | | | 126,462 | | |
| | 4,998 | | | @ | | Time Warner Cable, Inc. | | | 158,287 | | |
| | 65,916 | | | | | Time Warner, Inc. | | | 1,660,424 | | |
| | 39,000 | | | @ | | Viacom - Class B | | | 885,300 | | |
| | | | 6,018,354 | | |
| | | | | Metal Fabricate/Hardware: 0.3% | |
| | 550 | | | | | Kaydon Corp. | | | 17,908 | | |
| | 1,100 | | | | | Lawson Products | | | 15,631 | | |
| | 7,946 | | | | | Mueller Industries, Inc. | | | 165,277 | | |
| | 14,464 | | | | | Precision Castparts Corp. | | | 1,056,306 | | |
| | 95 | | | @ | | RTI International Metals, Inc. | | | 1,679 | | |
| | 6,000 | | | | | Timken Co. | | | 102,480 | | |
| | 1,200 | | | | | Valmont Industries, Inc. | | | 86,496 | | |
| | 9,884 | | | | | Worthington Industries | | | 126,416 | | |
| | | | 1,572,193 | | |
| | | | | Mining: 0.0% | |
| | 1,950 | | | | | Amcol International Corp. | | | 42,081 | | |
| | 1,689 | | | @ | | Brush Engineered Materials, Inc. | | | 28,291 | | |
| | 152 | | | @ | | Century Aluminum Co. | | | 947 | | |
| | | | 71,319 | | |
| | | | | Miscellaneous Manufacturing: 1.9% | |
| | 11,700 | | | | | Actuant Corp. | | | 142,740 | | |
| | 3,860 | | | L | | Acuity Brands, Inc. | | | 108,273 | | |
| | 140 | | | | | AO Smith Corp. | | | 4,560 | | |
| | 765 | | | | | Aptargroup, Inc. | | | 25,834 | | |
| | 1,653 | | | @ | | AZZ, Inc. | | | 56,880 | | |
| | 6,067 | | | | | Brink's Co. | | | 176,125 | | |
| | 7,250 | | | | | Carlisle Cos., Inc. | | | 174,290 | | |
| | 5,260 | | | @ | | Ceradyne, Inc. | | | 92,892 | | |
| | 3,183 | | | | | Clarcor, Inc. | | | 92,912 | | |
| | 17,300 | | | | | Cooper Industries Ltd. | | | 537,165 | | |
| | 4,479 | | | | | Crane Co. | | | 99,926 | | |
| | 6,873 | | | | | Donaldson Co., Inc. | | | 238,081 | | |
| | 58,570 | | | | | Dover Corp. | | | 1,938,081 | | |
| | 3,100 | | | | | Eaton Corp. | | | 138,291 | | |
| | 6,000 | | | @,S | | EnPro Industries, Inc. | | | 108,060 | | |
| | 3,155 | | | @ | | ESCO Technologies, Inc. | | | 141,344 | | |
| | 11,405 | | | | | Federal Signal Corp. | | | 87,248 | | |
| | 360,562 | | | | | General Electric Co. | | | 4,225,787 | | |
| | 5,536 | | | @ | | Griffon Corp. | | | 46,060 | | |
| | 8,284 | | | | | Harsco Corp. | | | 234,437 | | |
| | 17,000 | | | | | Honeywell International, Inc. | | | 533,800 | | |
| | 36,423 | | | | | ITT Corp. | | | 1,620,824 | | |
| | 3,150 | | | | | John Bean Technologies Corp. | | | 39,438 | | |
| | 2,342 | | | | | Myers Industries, Inc. | | | 19,485 | | |
| | 3,147 | | | | | Pentair, Inc. | | | 80,626 | | |
| | 2,098 | | | | | SPX Corp. | | | 102,739 | | |
| | 1,403 | | | | | Standex International Corp. | | | 16,275 | | |
| | 2,347 | | | L | | Sturm Ruger & Co., Inc. | | | 29,197 | | |
| | 2,300 | | | | | Teleflex, Inc. | | | 103,109 | | |
| | 5,000 | | | | | Tredegar Corp. | | | 66,600 | | |
| | | | 11,281,079 | | |
| | | | | Office Furnishings: 0.1% | |
| | 10,202 | | | | | Herman Miller, Inc. | | | 156,499 | | |
| | 2,250 | | | | | HNI, Corp. | | | 40,635 | | |
| | 6,469 | | | | | Interface, Inc. | | | 40,108 | | |
| | | | 237,242 | | |
| Shares | | | | | | Value | |
| | | | | Office/Business Equipment: 0.3% | |
| | 64,400 | | | | | Pitney Bowes, Inc. | | $ | 1,412,292 | | |
| | 70,704 | | | | | Xerox Corp. | | | 458,162 | | |
| | | | 1,870,454 | | |
| | | | | Oil & Gas: 4.7% | |
| | 13,029 | | | | | Anadarko Petroleum Corp. | | | 591,386 | | |
| | 11,588 | | | | | Apache Corp. | | | 836,074 | | |
| | 8,562 | | | @ | | Atwood Oceanics, Inc. | | | 213,279 | | |
| | 4,900 | | | @ | | Bill Barrett Corp. | | | 134,554 | | |
| | 56,076 | | | | | Chevron Corp. | | | 3,715,035 | | |
| | 3,500 | | | | | Cimarex Energy Co. | | | 99,190 | | |
| | 3,935 | | | @ | | Comstock Resources, Inc. | | | 130,052 | | |
| | 14,527 | | | | | ConocoPhillips | | | 611,006 | | |
| | 9,700 | | | L | | Diamond Offshore Drilling | | | 805,585 | | |
| | 8,600 | | | @ | | Encore Acquisition Co. | | | 265,310 | | |
| | 161,832 | | | | | ExxonMobil Corp. | | | 11,313,675 | | |
| | 4,850 | | | @ | | Forest Oil Corp. | | | 72,362 | | |
| | 18,612 | | | | | Frontier Oil Corp. | | | 244,003 | | |
| | 9,050 | | | | | Helmerich & Payne, Inc. | | | 279,374 | | |
| | 9,883 | | | | | Hess Corp. | | | 531,211 | | |
| | 4,655 | | | | | Holly Corp. | | | 83,697 | | |
| | 9,475 | | | | | Marathon Oil Corp. | | | 285,482 | | |
| | 25,124 | | | | | Murphy Oil Corp. | | | 1,364,736 | | |
| | 9,460 | | | @ | | Newfield Exploration Co. | | | 309,058 | | |
| | 33,414 | | | | | Occidental Petroleum Corp. | | | 2,198,975 | | |
| | 18,300 | | | | | Patterson-UTI Energy, Inc. | | | 235,338 | | |
| | 1,850 | | | | | Penn Virginia Corp. | | | 30,285 | | |
| | 758 | | | @ | | Petroleum Development Corp. | | | 11,893 | | |
| | 82 | | | @ | | Petroquest Energy, Inc. | | | 303 | | |
| | 1,995 | | | @ | | Pioneer Drilling Co. | | | 9,556 | | |
| | 5,746 | | | @ | | Plains Exploration &
Production Co. | | | 157,211 | | |
| | 5,850 | | | @ | | Pride International, Inc. | | | 146,601 | | |
| | 11,550 | | | @,L | | Quicksilver Resources, Inc. | | | 107,300 | | |
| | 14,960 | | | @ | | Southwestern Energy Co. | | | 581,196 | | |
| | 3,072 | | | | | St. Mary Land & Exploration Co. | | | 64,113 | | |
| | 9,298 | | | @ | | Stone Energy Corp. | | | 68,991 | | |
| | 48 | | | @ | | Swift Energy Co. | | | 799 | | |
| | 28,379 | | | L | | Tesoro Corp. | | | 361,265 | | |
| | 37,100 | | | | | XTO Energy, Inc. | | | 1,414,994 | | |
| | | | 27,273,889 | | |
| | | | | Oil & Gas Services: 1.3% | |
| | 3,842 | | | @ | | Basic Energy Services, Inc. | | | 26,241 | | |
| | 43,072 | | | | | BJ Services Co. | | | 587,071 | | |
| | 65,920 | | | @ | | Cameron International Corp. | | | 1,865,536 | | |
| | 1,621 | | | L | | CARBO Ceramics, Inc. | | | 55,438 | | |
| | 2,600 | | | @ | | Dril-Quip, Inc. | | | 99,060 | | |
| | 7,800 | | | @ | | Exterran Holdings, Inc. | | | 125,112 | | |
| | 1,980 | | | | | Gulf Island Fabrication, Inc. | | | 31,343 | | |
| | 4,467 | | | @ | | Helix Energy Solutions
Group, Inc. | | | 48,556 | | |
| | 4,377 | | | @ | | Hornbeck Offshore Services, Inc. | | | 93,624 | | |
| | 2,489 | | | @,L | | ION Geophysical Corp. | | | 6,397 | | |
| | 1,100 | | | | | Lufkin Industries, Inc. | | | 46,255 | | |
| | 5,700 | | | @ | | Matrix Service Co. | | | 65,436 | | |
| | 1,397 | | | @ | | NATCO Group, Inc. | | | 45,989 | | |
| | 60,619 | | | @ | | National Oilwell Varco, Inc. | | | 1,979,817 | | |
| | 2,921 | | | @ | | Oceaneering International, Inc. | | | 132,029 | | |
| | 5,825 | | | @ | | Oil States International, Inc. | | | 141,023 | | |
| | 33,768 | | | | | Schlumberger Ltd. | | | 1,827,186 | | |
| | 3,079 | | | @ | | SEACOR Holdings, Inc. | | | 231,664 | | |
See Accompanying Notes to Financial Statements
45
PORTFOLIO OF INVESTMENTS
ING BALANCED PORTFOLIO AS OF JUNE 30, 2009 (UNAUDITED) (CONTINUED)
| Shares | | | | | | Value | |
| | | | | Oil & Gas Services (continued) | |
| | 3,600 | | | @ | | Superior Energy Services | | $ | 62,172 | | |
| | 6,104 | | | @ | | Tetra Technologies, Inc. | | | 48,588 | | |
| | | | 7,518,537 | | |
| | | | | Packaging & Containers: 0.5% | |
| | 7,539 | | | | | Ball Corp. | | | 340,461 | | |
| | 31,524 | | | | | Bemis Co. | | | 794,405 | | |
| | 6,500 | | | | | Packaging Corp. of America | | | 105,300 | | |
| | 35,300 | | | @ | | Pactiv Corp. | | | 766,010 | | |
| | 6,030 | | | | | Rock-Tenn Co. | | | 230,105 | | |
| | 28,244 | | | | | Sealed Air Corp. | | | 521,102 | | |
| | 10,611 | | | | | Sonoco Products Co. | | | 254,133 | | |
| | 3,290 | | | | | Temple-Inland, Inc. | | | 43,165 | | |
| | | | 3,054,681 | | |
| | | | | Pharmaceuticals: 3.6% | |
| | 54,396 | | | | | Abbott Laboratories | | | 2,558,788 | | |
| | 29,738 | | | | | AmerisourceBergen Corp. | | | 527,552 | | |
| | 70,272 | | | | | Bristol-Myers Squibb Co. | | | 1,427,224 | | |
| | 3,950 | | | @ | | Catalyst Health Solutions, Inc. | | | 98,513 | | |
| | 72,596 | | | | | Eli Lilly & Co. | | | 2,514,725 | | |
| | 15,650 | | | @ | | Endo Pharmaceuticals
Holdings, Inc. | | | 280,448 | | |
| | 14,960 | | | @ | | Express Scripts, Inc. | | | 1,028,500 | | |
| | 30,814 | | | @ | | Forest Laboratories, Inc. | | | 773,740 | | |
| | 27,600 | | | @ | | King Pharmaceuticals, Inc. | | | 265,788 | | |
| | 4,829 | | | S | | McKesson Corp. | | | 212,476 | | |
| | 27,028 | | | @ | | Medco Health Solutions, Inc. | | | 1,232,747 | | |
| | 1,513 | | | | | Medicis Pharmaceutical Corp. | | | 24,692 | | |
| | 16,706 | | | | | Merck & Co., Inc. | | | 467,100 | | |
| | 10,450 | | | | | Omnicare, Inc. | | | 269,192 | | |
| | 3,650 | | | @ | | Par Pharmaceutical Cos., Inc. | | | 55,298 | | |
| | 3,450 | | | | | Perrigo Co. | | | 95,841 | | |
| | 325,370 | | | | | Pfizer, Inc. | | | 4,880,550 | | |
| | 6,300 | | | @ | | PharMerica Corp. | | | 123,669 | | |
| | 2,180 | | | @ | | Salix Pharmaceuticals Ltd. | | | 21,517 | | |
| | 53,860 | | | | | Schering-Plough Corp. | | | 1,352,963 | | |
| | 12,100 | | | @ | | Sepracor, Inc. | | | 209,572 | | |
| | 11,050 | | | @,L | | Valeant Pharmaceuticals
International | | | 284,206 | | |
| | 11,020 | | | @ | | Viropharma, Inc. | | | 65,349 | | |
| | 13,950 | | | @ | | Watson Pharmaceuticals, Inc. | | | 469,976 | | |
| | 46,259 | | | | | Wyeth | | | 2,099,696 | | |
| | | | 21,340,122 | | |
| | | | | Pipelines: 0.1% | |
| | 5,516 | | | | | Oneok, Inc. | | | 162,667 | | |
| | 16,400 | | | | | Williams Cos., Inc. | | | 256,004 | | |
| | | | 418,671 | | |
| | | | | Real Estate: 0.0% | |
| | 2,850 | | | @,L | | Forestar Real Estate Group, Inc. | | | 33,858 | | |
| | | | 33,858 | | |
| | | | | Retail: 4.3% | |
| | 3,200 | | | @ | | 99 Cents Only Stores | | | 43,456 | | |
| | 8,550 | | | | | Advance Auto Parts, Inc. | | | 354,740 | | |
| | 7,400 | | | @ | | Aeropostale, Inc. | | | 253,598 | | |
| | 3,200 | | | | | American Eagle Outfitters | | | 45,344 | | |
| | 26,800 | | | @,L | | Autonation, Inc. | | | 464,980 | | |
| | 7,700 | | | L | | Barnes & Noble, Inc. | | | 158,851 | | |
| | 1,474 | | | | | Big 5 Sporting Goods Corp. | | | 16,302 | | |
| | 4,800 | | | @ | | BJ's Wholesale Club, Inc. | | | 154,704 | | |
| Shares | | | | | | Value | |
| | 2,146 | | | | | Bob Evans Farms, Inc. | | $ | 61,676 | | |
| | 11,113 | | | S | | Brinker International, Inc. | | | 189,254 | | |
| | 4,360 | | | | | Buckle, Inc. | | | 138,517 | | |
| | 1,800 | | | @,L | | Buffalo Wild Wings, Inc. | | | 58,536 | | |
| | 6,450 | | | @ | | Cabela's, Inc. | | | 79,335 | | |
| | 6,200 | | | @ | | California Pizza Kitchen, Inc. | | | 82,398 | | |
| | 8,293 | | | @,L | | Carmax, Inc. | | | 121,907 | | |
| | 3,500 | | | | | Casey's General Stores, Inc. | | | 89,915 | | |
| | 6,200 | | | | | Cash America International, Inc. | | | 145,018 | | |
| | 9,600 | | | | | Cato Corp. | | | 167,424 | | |
| | 3,000 | | | @ | | CEC Entertainment, Inc. | | | 88,440 | | |
| | 5,578 | | | @ | | Charlotte Russe Holding, Inc. | | | 71,845 | | |
| | 10,657 | | | @ | | Cheesecake Factory | | | 184,366 | | |
| | 15,600 | | | @ | | Chico's FAS, Inc. | | | 151,788 | | |
| | 4,791 | | | @ | | Childrens Place Retail
Stores, Inc. | | | 126,626 | | |
| | 2,250 | | | @,L | | Chipotle Mexican Grill, Inc. | | | 180,000 | | |
| | 344 | | | | | Christopher & Banks Corp. | | | 2,308 | | |
| | 11,600 | | | @ | | Coldwater Creek, Inc. | | | 70,296 | | |
| | 4,247 | | | @ | | Collective Brands, Inc. | | | 61,879 | | |
| | 1,992 | | | @ | | Copart, Inc. | | | 69,063 | | |
| | 2,389 | | | | | Cracker Barrel Old Country Store | | | 66,653 | | |
| | 53,490 | | | | | CVS Caremark Corp. | | | 1,704,726 | | |
| | 6,200 | | | @ | | Dick's Sporting Goods, Inc. | | | 106,640 | | |
| | 1,551 | | | L | | DineEquity, Inc. | | | 48,376 | | |
| | 8,550 | | | @ | | Dollar Tree, Inc. | | | 359,955 | | |
| | 9,700 | | | @,L | | Dress Barn, Inc. | | | 138,710 | | |
| | 18,810 | | | | | Family Dollar Stores, Inc. | | | 532,323 | | |
| | 6,050 | | | | | Finish Line | | | 44,891 | | |
| | 6,230 | | | @ | | First Cash Financial Services, Inc. | | | 109,150 | | |
| | 13,950 | | | | | Foot Locker, Inc. | | | 146,057 | | |
| | 10,105 | | | | | Fred's, Inc. | | | 127,323 | | |
| | 48,598 | | | | | Gap, Inc. | | | 797,007 | | |
| | 885 | | | @ | | Genesco, Inc. | | | 16,611 | | |
| | 2,300 | | | | | Group 1 Automotive, Inc. | | | 59,846 | | |
| | 3,653 | | | | | Guess ?, Inc. | | | 94,174 | | |
| | 5,050 | | | @ | | Gymboree Corp. | | | 179,174 | | |
| | 2,300 | | | | | Haverty Furniture Cos., Inc. | | | 21,045 | | |
| | 3,150 | | | @,L | | Hibbett Sporting Goods, Inc. | | | 56,700 | | |
| | 84,764 | | | | | Home Depot, Inc. | | | 2,002,973 | | |
| | 6,300 | | | @ | | HOT Topic, Inc. | | | 46,053 | | |
| | 4,300 | | | @ | | HSN, Inc. | | | 45,451 | | |
| | 2,100 | | | @ | | Jack in the Box, Inc. | | | 47,145 | | |
| | 14,800 | | | | | JC Penney Co., Inc. | | | 424,908 | | |
| | 3,750 | | | @ | | Jo-Ann Stores, Inc. | | | 77,513 | | |
| | 2,568 | | | @,L | | JoS. A Bank Clothiers, Inc. | | | 88,493 | | |
| | 19,400 | | | @ | | Kohl's Corp. | | | 829,350 | | |
| | 651 | | | L | | Landry's Restaurants, Inc. | | | 5,599 | | |
| | 47,400 | | | S | | Limited Brands, Inc. | | | 567,378 | | |
| | 46,700 | | | | | Lowe's Cos., Inc. | | | 906,447 | | |
| | 6,700 | | | @ | | MarineMax, Inc. | | | 23,048 | | |
| | 34,460 | | | | | McDonald's Corp. | | | 1,981,105 | | |
| | 4,352 | | | | | Men's Wearhouse, Inc. | | | 83,471 | | |
| | 5,818 | | | | | MSC Industrial Direct Co. | | | 206,423 | | |
| | 408 | | | | | OfficeMax, Inc. | | | 2,562 | | |
| | 3,200 | | | @ | | Panera Bread Co. | | | 159,552 | | |
| | 4,251 | | | @ | | PetMed Express, Inc. | | | 63,893 | | |
| | 14,760 | | | | | Petsmart, Inc. | | | 316,750 | | |
| | 4,010 | | | @,L | | PF Chang's China Bistro, Inc. | | | 128,561 | | |
| | 5,419 | | | | | Phillips-Van Heusen | | | 155,471 | | |
| | 252 | | | @,L | | Red Robin Gourmet Burgers, Inc. | | | 4,725 | | |
| | 9,332 | | | | | Regis Corp. | | | 162,470 | | |
| | 13,650 | | | | | Ross Stores, Inc. | | | 526,890 | | |
| | 3,608 | | | @ | | Ruby Tuesday, Inc. | | | 24,029 | | |
| | 8,100 | | | @,L | | Sears Holding Corp. | | | 538,812 | | |
See Accompanying Notes to Financial Statements
46
PORTFOLIO OF INVESTMENTS
ING BALANCED PORTFOLIO AS OF JUNE 30, 2009 (UNAUDITED) (CONTINUED)
| Shares | | | | | | Value | |
| | | | | Retail (continued) | |
| | 9,992 | | | | | Stage Stores, Inc. | | $ | 110,911 | | |
| | 23,695 | | | | | Staples, Inc. | | | 477,928 | | |
| | 9,900 | | | @ | | Starbucks Corp. | | | 137,511 | | |
| | 6,929 | | | @ | | Steak N Shake Co. | | | 60,559 | | |
| | 6,812 | | | @ | | Stein Mart, Inc. | | | 60,354 | | |
| | 38,504 | | | | | Target Corp. | | | 1,519,753 | | |
| | 2,770 | | | @ | | Texas Roadhouse, Inc. | | | 30,221 | | |
| | 8,127 | | | | | TJX Cos., Inc. | | | 255,675 | | |
| | 5,900 | | | @ | | Tractor Supply Co. | | | 243,788 | | |
| | 1,025 | | | @ | | Tuesday Morning Corp. | | | 3,454 | | |
| | 1,953 | | | @ | | Urban Outfitters, Inc. | | | 40,759 | | |
| | 20,863 | | | | | Walgreen Co. | | | 613,372 | | |
| | 75,733 | | | | | Wal-Mart Stores, Inc. | | | 3,668,507 | | |
| | 10,200 | | | | | Williams-Sonoma, Inc. | | | 121,074 | | |
| | 4,360 | | | | | World Fuel Services Corp. | | | 179,763 | | |
| | 1,055 | | | @,L | | Zale Corp. | | | 3,629 | | |
| | 462 | | | @ | | Zumiez, Inc. | | | 3,701 | | |
| | | | 25,191,958 | | |
| | | | | Savings & Loans: 0.5% | |
| | 384 | | | | | Brookline Bancorp., Inc. | | | 3,579 | | |
| | 52 | | | | | Dime Community Bancshares | | | 474 | | |
| | 14,120 | | | | | First Niagara Financial
Group, Inc. | | | 161,250 | | |
| | 139,631 | | | | | Hudson City Bancorp., Inc. | | | 1,855,696 | | |
| | 36,550 | | | | | New York Community
Bancorp., Inc. | | | 390,720 | | |
| | 20,100 | | | | | NewAlliance Bancshares, Inc. | | | 231,150 | | |
| | | | 2,642,869 | | |
| | | | | Semiconductors: 1.2% | |
| | 6,100 | | | @ | | Broadcom Corp. | | | 151,219 | | |
| | 133 | | | @ | | Cabot Microelectronics Corp. | | | 3,763 | | |
| | 3,300 | | | @,L | | Cree, Inc. | | | 96,987 | | |
| | 21,797 | | | @ | | Cypress Semiconductor Corp. | | | 200,532 | | |
| | 2,570 | | | @ | | Diodes, Inc. | | | 40,195 | | |
| | 4,601 | | | @ | | DSP Group, Inc. | | | 31,103 | | |
| | 1,400 | | | @ | | Hittite Microwave Corp. | | | 48,650 | | |
| | 17,400 | | | @ | | Integrated Device
Technology, Inc. | | | 105,096 | | |
| | 84,530 | | | | | Intel Corp. | | | 1,398,972 | | |
| | 6,223 | | | | | Intersil Corp. | | | 78,223 | | |
| | 6,200 | | | @ | | Kopin Corp. | | | 22,754 | | |
| | 1,576 | | | @ | | Kulicke & Soffa Industries, Inc. | | | 5,406 | | |
| | 4,200 | | | @ | | Lam Research Corp. | | | 109,200 | | |
| | 11,321 | | | @ | | Microsemi Corp. | | | 156,230 | | |
| | 6,950 | | | @ | | MKS Instruments, Inc. | | | 91,671 | | |
| | 3,600 | | | @ | | Rudolph Technologies, Inc. | | | 19,872 | | |
| | 9,174 | | | @ | | Semtech Corp. | | | 145,958 | | |
| | 2,500 | | | @,S | | Silicon Laboratories, Inc. | | | 94,850 | | |
| | 18,100 | | | @ | | Skyworks Solutions, Inc. | | | 177,018 | | |
| | 900 | | | @,L | | Supertex, Inc. | | | 22,599 | | |
| | 125,600 | | | | | Texas Instruments, Inc. | | | 2,675,280 | | |
| | 6,503 | | | @ | | Triquint Semiconductor, Inc. | | | 34,531 | | |
| | 3,600 | | | @ | | Ultratech, Inc. | | | 44,316 | | |
| | 7,435 | | | @ | | Varian Semiconductor
Equipment Associates, Inc. | | | 178,366 | | |
| | 7,335 | | | @ | | Veeco Instruments, Inc. | | | 85,013 | | |
| | 34,708 | | | | | Xilinx, Inc. | | | 710,126 | | |
| | | | 6,727,930 | | |
| | | | | Software: 2.7% | |
| | 11,294 | | | | | Acxiom Corp. | | | 99,726 | | |
| | 1,049 | | | @,L | | Advent Software, Inc. | | | 34,397 | | |
| Shares | | | | | | Value | |
| | 5,350 | | | @ | | Ansys, Inc. | | $ | 166,706 | | |
| | 1,410 | | | @ | | Avid Technology, Inc. | | | 18,908 | | |
| | 3,947 | | | | | Blackbaud, Inc. | | | 61,376 | | |
| | 16,300 | | | | | Broadridge Financial
Solutions ADR | | | 270,254 | | |
| | 63,166 | | | | | CA, Inc. | | | 1,100,983 | | |
| | 2,850 | | | @,L | | Cerner Corp. | | | 177,527 | | |
| | 4,685 | | | @ | | Commvault Systems, Inc. | | | 77,677 | | |
| | 59,300 | | | @ | | Compuware Corp. | | | 406,798 | | |
| | 3,903 | | | @ | | Concur Technologies, Inc. | | | 121,305 | | |
| | 7,147 | | | @ | | CSG Systems International | | | 94,626 | | |
| | 884 | | | @ | | Digi International, Inc. | | | 8,619 | | |
| | 709 | | | @ | | Ebix, Inc. | | | 22,206 | | |
| | 9,236 | | | @ | | Eclipsys Corp. | | | 164,216 | | |
| | 14,950 | | | @ | | Epicor Software Corp. | | | 79,235 | | |
| | 12,950 | | | | | Fair Isaac Corp. | | | 200,207 | | |
| | 39,996 | | | | | Fidelity National Information
Services, Inc. | | | 798,320 | | |
| | 12,640 | | | @ | | Fiserv, Inc. | | | 577,648 | | |
| | 9,780 | | | @ | | Informatica Corp. | | | 168,118 | | |
| | 9,800 | | | @ | | Intuit, Inc. | | | 275,968 | | |
| | 4,400 | | | @ | | JDA Software Group, Inc. | | | 65,824 | | |
| | 7,000 | | | @ | | Metavante Technologies, inc. | | | 181,020 | | |
| | 250,332 | | | | | Microsoft Corp. | | | 5,950,353 | | |
| | 168,294 | | | @ | | Oracle Corp. | | | 3,604,857 | | |
| | 14,250 | | | @ | | Parametric Technology Corp. | | | 166,583 | | |
| | 6,780 | | | @ | | Phase Forward, Inc. | | | 102,446 | | |
| | 4,600 | | | @ | | Progress Software Corp. | | | 97,382 | | |
| | 852 | | | | | Quality Systems, Inc. | | | 48,530 | | |
| | 3,760 | | | @ | | Smith Micro Software, Inc. | | | 36,923 | | |
| | 2,700 | | | @ | | SPSS, Inc. | | | 90,099 | | |
| | 10,643 | | | @ | | Sybase, Inc. | | | 333,552 | | |
| | 4,900 | | | @ | | SYNNEX Corp. | | | 122,451 | | |
| | 8,870 | | | @ | | Take-Two Interactive
Software, Inc. | | | 83,999 | | |
| | 3,200 | | | @ | | Taleo Corp. | | | 58,464 | | |
| | 2,381 | | | @ | | Tyler Technologies, Inc. | | | 37,191 | | |
| | 4,900 | | | @ | | Wind River Systems, Inc. | | | 56,154 | | |
| | | | 15,960,648 | | |
| | | | | Storage/Warehousing: 0.0% | |
| | 309 | | | @ | | Mobile Mini, Inc. | | | 4,533 | | |
| | | | 4,533 | | |
| | | | | Telecommunications: 3.3% | |
| | 44,050 | | | @ | | 3Com Corp. | | | 207,476 | | |
| | 7,541 | | | @ | | ADC Telecommunications, Inc. | | | 60,026 | | |
| | 1,194 | | | | | Adtran, Inc. | | | 25,635 | | |
| | 1,960 | | | @ | | Anixter International, Inc. | | | 73,676 | | |
| | 2,100 | | | | | Applied Signal Technology, Inc. | | | 53,571 | | |
| | 15,618 | | | @ | | Arris Group, Inc. | | | 189,915 | | |
| | 193,957 | | | | | AT&T, Inc. | | | 4,817,892 | | |
| | 3,421 | | | | | Black Box Corp. | | | 114,501 | | |
| | 2,700 | | | @ | | Cbeyond, Inc. | | | 38,745 | | |
| | 16,400 | | | @,S | | Cincinnati Bell, Inc. | | | 46,576 | | |
| | 272,461 | | | @ | | Cisco Systems, Inc. | | | 5,078,673 | | |
| | 11,563 | | | @ | | CommScope, Inc. | | | 303,644 | | |
| | 5,170 | | | @ | | Comtech Telecommunications | | | 164,820 | | |
| | 18,912 | | | | | Corning, Inc. | | | 303,727 | | |
| | 4,980 | | | | | Embarq Corp. | | | 209,459 | | |
| | 7,340 | | | | | Fairpoint Communications, Inc. | | | 4,404 | | |
| | 3,000 | | | @ | | General Communication, Inc. | | | 20,790 | | |
| | 15,000 | | | @ | | Harmonic, Inc. | | | 88,350 | | |
| | 9,487 | | | | | Harris Corp. | | | 269,051 | | |
See Accompanying Notes to Financial Statements
47
PORTFOLIO OF INVESTMENTS
ING BALANCED PORTFOLIO AS OF JUNE 30, 2009 (UNAUDITED) (CONTINUED)
| Shares | | | | | | Value | |
| | | | | Telecommunications (continued) | |
| | 3,000 | | | | | Iowa Telecommunications
Services, Inc. | | $ | 37,530 | | |
| | 4,350 | | | @ | | Netgear, Inc. | | | 62,684 | | |
| | 9,600 | | | @ | | NeuStar, Inc. | | | 212,736 | | |
| | 2,400 | | | @ | | Neutral Tandem, Inc. | | | 70,848 | | |
| | 6,098 | | | @ | | Novatel Wireless, Inc. | | | 55,004 | | |
| | 11,016 | | | | | Plantronics, Inc. | | | 208,313 | | |
| | 4,400 | | | @ | | Polycom, Inc. | | | 89,188 | | |
| | 61,066 | | | | | Qualcomm, Inc. | | | 2,760,183 | | |
| | 32,600 | | | L | | Qwest Communications
International, Inc. | | | 135,290 | | |
| | 116,595 | | | @ | | Sprint Nextel Corp. | | | 560,822 | | |
| | 6,903 | | | @ | | Symmetricom, Inc. | | | 39,830 | | |
| | 5,611 | | | @ | | Syniverse Holdings, Inc. | | | 89,944 | | |
| | 4,200 | | | @ | | Tekelec | | | 70,686 | | |
| | 6,025 | | | | | Telephone & Data Systems, Inc. | | | 170,508 | | |
| | 93,725 | | | | | Verizon Communications, Inc. | | | 2,880,169 | | |
| | | | 19,514,666 | | |
| | | | | Textiles: 0.1% | |
| | 6,700 | | | | | Cintas Corp. | | | 153,028 | | |
| | 6,430 | | | | | G&K Services, Inc. | | | 135,995 | | |
| | 882 | | | @ | | Mohawk Industries, Inc. | | | 31,470 | | |
| | 1,866 | | | | | Unifirst Corp. | | | 69,359 | | |
| | | | 389,852 | | |
| | | | | Toys/Games/Hobbies: 0.0% | |
| | 348 | | | @ | | Jakks Pacific, Inc. | | | 4,465 | | |
| | 5,400 | | | @ | | Marvel Entertainment, Inc. | | | 192,186 | | |
| | | | 196,651 | | |
| | | | | Transportation: 0.8% | |
| | 1,153 | | | @ | | Bristow Group, Inc. | | | 34,163 | | |
| | 2,800 | | | | | CH Robinson Worldwide, Inc. | | | 146,020 | | |
| | 949 | | | | | Con-way, Inc. | | | 33,509 | | |
| | 34,200 | | | | | CSX Corp. | | | 1,184,346 | | |
| | 8,975 | | | | | Heartland Express, Inc. | | | 132,112 | | |
| | 6,271 | | | @ | | HUB Group, Inc. | | | 129,433 | | |
| | 2,607 | | | | | JB Hunt Transport Services, Inc. | | | 79,592 | | |
| | 1,512 | | | @ | | Kansas City Southern | | | 24,358 | | |
| | 4,091 | | | @ | | Kirby Corp. | | | 130,053 | | |
| | 1,600 | | | | | Knight Transportation, Inc. | | | 26,480 | | |
| | 4,222 | | | | | Landstar System, Inc. | | | 151,612 | | |
| | 3,000 | | | @ | | Old Dominion Freight Line | | | 100,710 | | |
| | 6,974 | | | | | Tidewater, Inc. | | | 298,975 | | |
| | 17,117 | | | | | Union Pacific Corp. | | | 891,111 | | |
| | 30,200 | | | | | United Parcel Service,
Inc. - Class B | | | 1,509,698 | | |
| | | | 4,872,172 | | |
| | | | | Trucking & Leasing: 0.0% | |
| | 800 | | | | | GATX Corp. | | | 20,576 | | |
| | | | 20,576 | | |
| | | | | Water: 0.0% | |
| | 7,900 | | | | | Aqua America, Inc. | | | 141,410 | | |
| | | | 141,410 | | |
Total Common Stock
(Cost $342,073,483) | | | 343,664,621 | | |
| Shares | | | | | | Value | |
| REAL ESTATE INVESTMENT TRUSTS: 1.4% | | | |
| | | | | Apartments: 0.3% | |
| | 4,300 | | | | | BRE Properties, Inc. | | $ | 102,168 | | |
| | 7,125 | | | | | Camden Property Trust | | | 196,650 | | |
| | 28,366 | | | | | Equity Residential | | | 630,576 | | |
| | 2,160 | | | | | Home Properties, Inc. | | | 73,656 | | |
| | 3,600 | | | | | Mid-America Apartment
Communities, Inc. | | | 132,156 | | |
| | 1,800 | | | | | Post Properties, Inc. | | | 24,192 | | |
| | 25,000 | | | | | UDR, Inc. | | | 258,250 | | |
| | | | 1,417,648 | | |
| | | | | Diversified: 0.1% | |
| | 7,855 | | | | | Colonial Properties Trust | | | 58,127 | | |
| | 13,235 | | | | | Cousins Properties, Inc. | | | 112,498 | | |
| | 9,402 | | | | | Duke Realty Corp. | | | 82,456 | | |
| | 4,340 | | | | | Entertainment Properties Trust | | | 89,404 | | |
| | 14,292 | | | | | Lexington Realty Trust | | | 48,593 | | |
| | 13,450 | | | | | Liberty Property Trust | | | 309,888 | | |
| | 1,626 | | | | | PS Business Parks, Inc. | | | 78,763 | | |
| | | | 779,729 | | |
| | | | | Forest Products & Paper: 0.1% | |
| | 9,550 | | | | | Rayonier, Inc. | | | 347,143 | | |
| | | | 347,143 | | |
| | | | | Health Care: 0.1% | |
| | 9,100 | | | | | Medical Properties Trust, Inc. | | | 55,237 | | |
| | 12,900 | | | | | Nationwide Health
Properties, Inc. | | | 332,046 | | |
| | 9,020 | | | | | Senior Housing Properties Trust | | | 147,206 | | |
| | | | 534,489 | | |
| | | | | Hotels: 0.1% | |
| | 20,711 | | | @ | | DiamondRock Hospitality Co. | | | 129,651 | | |
| | 17,800 | | | @ | | Hospitality Properties Trust | | | 211,642 | | |
| | 9,789 | | | | | LaSalle Hotel Properties | | | 120,796 | | |
| | | | 462,089 | | |
| | | | | Office Property: 0.2% | |
| | 674 | | | | | Alexandria Real Estate
Equities, Inc. | | | 24,122 | | |
| | 13,010 | | | | | BioMed Realty Trust, Inc. | | | 133,092 | | |
| | 5,300 | | | | | Corporate Office Properties
Trust SBI MD | | | 155,449 | | |
| | 2,500 | | | | | Franklin Street Properties Corp. | | | 33,125 | | |
| | 6,736 | | | | | Highwoods Properties, Inc. | | | 150,684 | | |
| | 3,099 | | | | | Kilroy Realty Corp. | | | 63,653 | | |
| | 12,200 | | | | | Mack-Cali Realty Corp. | | | 278,160 | | |
| | 4,830 | | | | | Parkway Properties, Inc. | | | 62,790 | | |
| | 9,350 | | | | | SL Green Realty Corp. | | | 214,489 | | |
| | | | 1,115,564 | | |
| | | | | Regional Malls: 0.3% | |
| | 4,576 | | | L | | Macerich Co. | | | 80,583 | | |
| | 8,650 | | | L | | Pennsylvania Real Estate
Investment Trust | | | 43,250 | | |
| | 34,282 | | | L | | Simon Property Group, Inc. | | | 1,763,123 | | |
| | | | 1,886,956 | | |
| | | | | Shopping Centers: 0.1% | |
| | 1,004 | | | | | Acadia Realty Trust | | | 13,102 | | |
| | 7,950 | | | @ | | Cedar Shopping Centers, Inc. | | | 35,934 | | |
| | 1,200 | | | | | Federal Realty Investment Trust | | | 61,824 | | |
See Accompanying Notes to Financial Statements
48
PORTFOLIO OF INVESTMENTS
ING BALANCED PORTFOLIO AS OF JUNE 30, 2009 (UNAUDITED) (CONTINUED)
| Shares | | | | | | Value | |
| | | | | Shopping Centers (continued) | |
| | 1,500 | | | | | Inland Real Estate Corp. | | $ | 10,500 | | |
| | 18,100 | | | | | Kite Realty Group Trust | | | 52,852 | | |
| | 1,500 | | | | | Regency Centers Corp. | | | 52,365 | | |
| | 1,950 | | | | | Tanger Factory Outlet
Centers, Inc. | | | 63,239 | | |
| | 9,100 | | | | | Weingarten Realty Investors | | | 132,041 | | |
| | | | 421,857 | | |
| | | | | Single Tenant: 0.0% | |
| | 4,750 | | | | | National Retail Properties, Inc. | | | 82,413 | | |
| | 1,650 | | | | | Realty Income Corp. | | | 36,168 | | |
| | | | 118,581 | | |
| | | | | Storage: 0.1% | |
| | 2,915 | | | @ | | Extra Space Storage, Inc. | | | 24,340 | | |
| | 9,150 | | | | | Public Storage, Inc. | | | 599,142 | | |
| | 3,196 | | | | | Sovran Self Storage, Inc. | | | 78,622 | | |
| | | | 702,104 | | |
| | | | | Warehouse/Industrial: 0.0% | |
| | 2,600 | | | | | AMB Property Corp. | | | 48,906 | | |
| | 1,250 | | | | | EastGroup Properties, Inc. | | | 41,275 | | |
| | | | 90,181 | | |
Total Real Estate
Investment Trusts
(Cost $8,389,242) | | | 7,876,341 | | |
| PREFERRED STOCK: 0.1% | | | |
| | | | | Diversified Financial Services: 0.1% | |
| | 857 | | | #,P | | Zurich RegCaPS Funding Trust | | | 519,288 | | |
Total Preferred Stock
(Cost $814,150) | | | 519,288 | | |
Principal
Amount | | | | | | Value | |
| CORPORATE BONDS/NOTES: 11.2% | | | |
| | | | | Agriculture: 0.2% | |
| $ | 699,000 | | | | | Altria Group, Inc.,
9.700%, due 11/10/18 | | $ | 802,636 | | |
| | 215,000 | | | | | Philip Morris
International, Inc.,
6.875%, due 03/17/14 | | | 242,835 | | |
| | | | 1,045,471 | | |
| | | | | Banks: 2.8% | |
| | 541,000 | | | | | American Express Bank FSB,
5.500%, due 04/16/13 | | | 531,367 | | |
| | 676,000 | | | C | | Bank of America Corp.,
8.000%, due 12/29/49 | | | 565,388 | | |
| | 140,000 | | | @@,C | | Bank of Ireland, 0.875%,
due 12/29/49 | | | 39,018 | | |
| | 1,438,000 | | | @@,# | | Barclays Bank PLC, 6.050%,
due 12/04/17 | | | 1,248,955 | | |
| | 200,000 | | | @@,C | | BNP Paribas, 1.928%,
due 09/29/49 | | | 84,000 | | |
| | 171,000 | | | | | Capital One Financial Corp.,
7.375%, due 05/23/14 | | | 176,511 | | |
| | 1,065,000 | | | | | Citigroup, Inc., 5.000%,
due 09/15/14 | | | 893,787 | | |
| | 721,000 | | | | | Citigroup, Inc., 5.250%,
due 02/27/12 | | | 704,483 | | |
Principal
Amount | | | | | | Value | |
| $ | 82,000 | | | | | Citigroup, Inc., 8.500%,
due 05/22/19 | | $ | 83,552 | | |
| | 241,000 | | | #,C | | Dresdner Funding Trust I,
8.151%, due 06/30/31 | | | 117,439 | | |
| | 1,114,000 | | | | | Fifth Third Bancorp.,
8.250%, due 03/01/38 | | | 854,691 | | |
| | 864,000 | | | | | First Tennessee Bank NA,
5.650%, due 04/01/16 | | | 648,270 | | |
| | 318,000 | | | | | Goldman Sachs Group, Inc.,
5.250%, due 04/01/13 | | | 325,484 | | |
| | 372,000 | | | | | Goldman Sachs Group, Inc.,
5.450%, due 11/01/12 | | | 384,935 | | |
| | 427,000 | | | | | Goldman Sachs Group, Inc.,
5.500%, due 11/15/14 | | | 428,468 | | |
| | 638,000 | | | | | Goldman Sachs Group, Inc.,
6.000%, due 05/01/14 | | | 666,549 | | |
| | 600,000 | | | @@,C | | HSBC Bank PLC, 1.288%,
due 06/29/49 | | | 285,000 | | |
| | 387,000 | | | | | JPMorgan Chase & Co.,
4.650%, due 06/01/14 | | | 386,398 | | |
| | 344,000 | | | | | JPMorgan Chase Bank NA,
5.875%, due 06/13/16 | | | 332,006 | | |
| | 803,000 | | | | | Morgan Stanley, 2.250%,
due 03/13/12 | | | 810,599 | | |
| | 396,000 | | | | | Morgan Stanley, 4.750%,
due 04/01/14 | | | 374,447 | | |
| | 167,000 | | | C | | Morgan Stanley, 5.300%,
due 03/01/13 | | | 169,288 | | |
| | 84,000 | | | C | | Morgan Stanley, 6.750%,
due 04/15/11 | | | 88,033 | | |
| | 511,000 | | | C | | Morgan Stanley, 7.300%,
due 05/13/19 | | | 530,811 | | |
| | 1,015,000 | | | C | | National City Preferred
Capital Trust I, 12.000%,
due 12/29/49 | | | 1,063,968 | | |
| | 960,000 | | | @@,#,C | | Rabobank, 11.000%,
due 12/29/49 | | | 1,070,706 | | |
| | 50,000 | | | @@,C | | Societe Generale, 1.375%,
due 11/29/49 | | | 21,906 | | |
| | 1,239,000 | | | L | | State Street Corp., 2.150%,
due 04/30/12 | | | 1,245,454 | | |
| | 506,000 | | | | | SunTrust Bank/Atlanta GA,
5.450%, due 12/01/17 | | | 445,148 | | |
| | 622,000 | | | | | Wachovia Bank NA, 6.000%,
due 11/15/17 | | | 627,885 | | |
| | 796,000 | | | S | | Wachovia Bank NA, 6.600%,
due 01/15/38 | | | 778,404 | | |
| | 365,000 | | | | | Wachovia Corp., 5.500%,
due 05/01/13 | | | 377,369 | | |
| | | | 16,360,319 | | |
| | | | | Beverages: 0.3% | |
| | 596,000 | | | #,C | | Anheuser-Busch InBev
Worldwide, Inc., 5.375%,
due 11/15/14 | | | 602,009 | | |
| | 547,000 | | | #,C | | Anheuser-Busch InBev
Worldwide, Inc., 7.750%,
due 01/15/19 | | | 599,251 | | |
| | 396,000 | | | C | | Dr Pepper Snapple
Group, Inc., 6.820%,
due 05/01/18 | | | 419,472 | | |
| | | | 1,620,732 | | |
See Accompanying Notes to Financial Statements
49
PORTFOLIO OF INVESTMENTS
ING BALANCED PORTFOLIO AS OF JUNE 30, 2009 (UNAUDITED) (CONTINUED)
Principal
Amount | | | | | | Value | |
| | | | | Chemicals: 0.2% | |
| $ | 287,000 | | | #,C | | Chevron Phillips Chemical Co.
LLC, 7.000%, due 06/15/14 | | $ | 293,740 | | |
| | 267,000 | | | #,C | | Chevron Phillips Chemical Co.
LLC, 8.250%, due 06/15/19 | | | 279,011 | | |
| | 432,000 | | | C | | Dow Chemical Co.,
7.600%, due 05/15/14 | | | 445,409 | | |
| | | | 1,018,160 | | |
| | | | | Computers: 0.1% | |
| | 521,000 | | | C | | Hewlett-Packard Co., 4.750%,
due 06/02/14 | | | 544,487 | | |
| | | | 544,487 | | |
| | | | | Diversified Financial Services: 1.5% | |
| | 940,000 | | | @@,#,C | | Aiful Corp., 4.450%,
due 02/16/10 | | | 686,287 | | |
| | 341,000 | | | | | American Express Credit Corp.,
7.300%, due 08/20/13 | | | 354,854 | | |
| | 307,000 | | | | | Capital One Bank USA NA,
6.500%, due 06/13/13 | | | 303,721 | | |
| | 684,000 | | | | | Capital One Bank USA NA,
8.800%, due 07/15/19 | | | 699,949 | | |
| | 241,000 | | | #,C | | Corestates Capital Trust I,
8.000%, due 12/15/26 | | | 158,132 | | |
| | 545,000 | | | | | FIA Card Services NA, 6.625%,
due 06/15/12 | | | 566,532 | | |
| | 428,000 | | | C | | Fund American Cos., Inc.,
5.875%, due 05/15/13 | | | 403,511 | | |
| | 1,238,000 | | | | | General Electric Capital Corp.,
2.200%, due 06/08/12 | | | 1,245,220 | | |
| | 730,000 | | | | | General Electric Capital Corp.,
5.875%, due 01/14/38 | | | 579,456 | | |
| | 1,203,000 | | | | | General Electric Capital Corp.,
6.875%, due 01/10/39 | | | 1,086,030 | | |
| | 1,131,000 | | | @@,# | | Mantis Reef Ltd., 4.799%,
due 11/03/09 | | | 1,120,573 | | |
| | 240,000 | | | | | Merrill Lynch & Co., Inc.,
4.250%, due 02/08/10 | | | 240,986 | | |
| | 468,000 | | | | | Merrill Lynch & Co., Inc.,
6.050%, due 08/15/12 | | | 469,565 | | |
| | 336,000 | | | C | | National Rural Utilities
Cooperative Finance
Corp., 10.375%,
due 11/01/18 | | | 421,953 | | |
| | 62,855 | | | # | | Power Receivable Finance,
LLC, 6.290%, due 01/01/12 | | | 61,999 | | |
| | 4,534,049 | | | #,Z | | Toll Road Investors
Partnership II LP, 5.000%,
due 02/15/45 | | | 413,832 | | |
| | 530,000 | | | #,±,C | | Twin Reefs Pass-through Trust,
1.386%, due 12/10/49 | | | 1,723 | | |
| | | | 8,814,323 | | |
| | | | | Electric: 1.3% | |
| | 284,000 | | | C | | Ameren Corp., 8.875%,
due 05/15/14 | | | 293,414 | | |
| | 1,298,000 | | | C | | Commonwealth Edison Co.,
6.950%, due 07/15/18 | | | 1,315,648 | | |
| | 391,000 | | | C | | DTE Energy Co., 7.050%,
due 06/01/11 | | | 409,358 | | |
| | 210,000 | | | C | | Duke Energy Corp., 6.300%,
due 02/01/14 | | | 226,950 | | |
Principal
Amount | | | | | | Value | |
| $ | 242,000 | | | C | | Entergy Texas, Inc., 7.125%,
due 02/01/19 | | $ | 252,724 | | |
| | 222,000 | | | C | | Indiana Michigan Power,
7.000%, due 03/15/19 | | | 239,023 | | |
| | 153,000 | | | C | | Jersey Central Power and Light,
7.350%, due 02/01/19 | | | 168,496 | | |
| | 359,856 | | | #,C | | Juniper Generation, LLC,
6.790%, due 12/31/14 | | | 326,823 | | |
| | 451,000 | | | C | | Metropolitan Edison, 7.700%,
due 01/15/19 | | | 494,142 | | |
| | 47,000 | | | C | | Nevada Power Co., 7.125%,
due 03/15/19 | | | 50,317 | | |
| | 1,214,000 | | | C | | NorthWestern Corp., 5.875%,
due 11/01/14 | | | 1,236,151 | | |
| | 419,000 | | | C | | Oncor Electric Delivery Co.,
6.800%, due 09/01/18 | | | 448,514 | | |
| | 568,000 | | | C | | Oncor Electric Delivery Co.,
7.500%, due 09/01/38 | | | 642,752 | | |
| | 243,000 | | | C | | Progress Energy, Inc., 6.050%,
due 03/15/14 | | | 255,782 | | |
| | 191,000 | | | C | | Progress Energy, Inc., 7.050%,
due 03/15/19 | | | 212,293 | | |
| | 473,000 | | | C | | Sierra Pacific Power Co.,
6.250%, due 04/15/12 | | | 491,239 | | |
| | 460,000 | | | C | | Southwestern Electric Power,
5.550%, due 01/15/17 | | | 447,711 | | |
| | | | 7,511,337 | | |
| | | | | Energy-Alternate Sources: 0.0% | |
| | 600,000 | | | I,±,X | | Greater Ohio Ethanol, LLC,
6.301%, due 12/31/13 | | | — | | |
| | 700,000 | | | I,±,X | | Greater Ohio Ethanol, LLC,
12.630%, due 12/31/13 | | | — | | |
| | 92,655 | | | I,X | | PEA Lima, LLC, 0.000%,
due 03/20/14 | | | 9 | | |
| | | | 9 | | |
| | | | | Entertainment: 0.0% | |
| | 203,000 | | | | | International Game Technology,
7.500%, due 06/15/19 | | | 205,179 | | |
| | | | 205,179 | | |
| | | | | Food: 0.2% | |
| | 631,000 | | | | | Kraft Foods, Inc., 6.125%,
due 02/01/18 | | | 653,490 | | |
| | 138,000 | | | | | Kraft Foods, Inc., 6.500%,
due 08/11/17 | | | 145,574 | | |
| | 205,000 | | | C | | Safeway, Inc., 6.250%,
due 03/15/14 | | | 220,219 | | |
| | | | 1,019,283 | | |
| | | | | Forest Products & Paper: 0.0% | |
| | 111,000 | | | C | | International Paper Co.,
7.400%, due 06/15/14 | | | 110,608 | | |
| | | | 110,608 | | |
| | | | | Gas: 0.1% | |
| | 596,000 | | | C | | Sempra Energy, 6.500%,
due 06/01/16 | | | 622,993 | | |
| | | | 622,993 | | |
See Accompanying Notes to Financial Statements
50
PORTFOLIO OF INVESTMENTS
ING BALANCED PORTFOLIO AS OF JUNE 30, 2009 (UNAUDITED) (CONTINUED)
Principal
Amount | | | | | | Value | |
| | | | | Healthcare-Services: 0.0% | |
| $ | 255,000 | | | C | | HCA, Inc., 9.250%,
due 11/15/16 | | $ | 251,813 | | |
| | | | 251,813 | | |
| | | | | Insurance: 0.8% | |
| | 1,355,000 | | | @@,C | | Aegon NV, 3.610%,
due 12/31/49 | | | 531,838 | | |
| | 785,000 | | | | | American International
Group, Inc., 5.850%,
due 01/16/18 | | | 415,886 | | |
| | 331,000 | | | C | | Hartford Financial Services
Group, Inc., 5.250%,
due 10/15/11 | | | 320,076 | | |
| | 416,000 | | | C | | Hartford Financial Services
Group, Inc., 6.000%,
due 01/15/19 | | | 319,266 | | |
| | 683,000 | | | C | | Metlife, Inc., 7.717%,
due 02/15/19 | | | 731,811 | | |
| | 462,000 | | | #,C | | Pacific Life Insurance Co.,
9.250%, due 06/15/39 | | | 449,490 | | |
| | 266,000 | | | C | | Principal Financial Group, Inc.,
7.875%, due 05/15/14 | | | 280,511 | | |
| | 194,000 | | | | | Prudential Financial, Inc.,
5.700%, due 12/14/36 | | | 145,978 | | |
| | 387,000 | | | | | Prudential Financial, Inc.,
6.000%, due 12/01/17 | | | 364,659 | | |
| | 623,000 | | | | | Prudential Financial, Inc.,
6.625%, due 12/01/37 | | | 541,349 | | |
| | 251,000 | | | | | Prudential Financial, Inc.,
7.375%, due 06/15/19 | | | 246,867 | | |
| | 244,000 | | | @@,C | | XL Capital, Ltd., 6.500%,
due 12/31/49 | | | 119,708 | | |
| | | | 4,467,439 | | |
| | | | | Iron/Steel: 0.1% | |
| | 398,000 | | | @@ | | ArcelorMittal, 9.850%,
due 06/01/19 | | | 430,215 | | |
| | | | 430,215 | | |
| | | | | Media: 1.2% | |
| | 156,000 | | | C | | Comcast Corp., 5.300%,
due 01/15/14 | | | 161,489 | | |
| | 145,000 | | | C | | Comcast Corp., 5.900%,
due 03/15/16 | | | 150,198 | | |
| | 714,000 | | | C | | Comcast Corp., 6.300%,
due 11/15/17 | | | 756,906 | | |
| | 1,006,000 | | | #,C | | COX Communications, Inc.,
6.250%, due 06/01/18 | | | 996,136 | | |
| | 276,000 | | | #,C | | COX Communications, Inc.,
6.950%, due 06/01/38 | | | 266,495 | | |
| | 80,000 | | | #,C | | Cox Communications, Inc.,
8.375%, due 03/01/39 | | | 89,461 | | |
| | 255,000 | | | C | | Echostar DBS Corp., 7.125%,
due 02/01/16 | | | 239,063 | | |
| | 395,000 | | | C | | News America, Inc., 6.650%,
due 11/15/37 | | | 356,370 | | |
| | 855,000 | | | #,C | | News America, Inc., 6.900%,
due 03/01/19 | | | 892,497 | | |
| | 1,541,000 | | | C | | Time Warner Cable, Inc.,
6.200%, due 07/01/13 | | | 1,625,095 | | |
| | 377,000 | | | C | | Time Warner Cable, Inc.,
6.750%, due 06/15/39 | | | 368,088 | | |
Principal
Amount | | | | | | Value | |
| $ | 1,013,000 | | | C | | Time Warner, Inc., 5.500%,
due 11/15/11 | | $ | 1,046,680 | | |
| | 75,000 | | | C | | Time Warner, Inc., 7.700%,
due 05/01/32 | | | 73,895 | | |
| | | | 7,022,373 | | |
| | | | | Miscellaneous Manufacturing: 0.2% | |
| | 521,000 | | | | | General Electric Co., 5.250%,
due 12/06/17 | | | 512,505 | | |
| | 615,000 | | | @@,C | | Tyco International Finance,
8.500%, due 01/15/19 | | | 683,033 | | |
| | | | 1,195,538 | | |
| | | | | Oil & Gas: 0.2% | |
| | 257,000 | | | C | | Chesapeake Energy Corp.,
7.250%, due 12/15/18 | | | 224,875 | | |
| | 221,000 | | | C | | Hess Corp., 8.125%,
due 02/15/19 | | | 252,029 | | |
| | 388,000 | | | C | | Marathon Oil Corp., 6.500%,
due 02/15/14 | | | 415,205 | | |
| | 191,000 | | | C | | Marathon Oil Corp., 7.500%,
due 02/15/19 | | | 208,829 | | |
| | | | 1,100,938 | | |
| | | | | Oil & Gas Services: 0.0% | |
| | 231,000 | | | @@,C | | Weatherford International, Ltd.,
9.625%, due 03/01/19 | | | 272,194 | | |
| | | | 272,194 | | |
| | | | | Pharmaceuticals: 0.1% | |
| | 244,000 | | | C | | Express Scripts, Inc., 6.250%,
due 06/15/14 | | | 258,452 | | |
| | 61,000 | | | C | | Express Scripts, Inc., 7.250%,
due 06/15/19 | | | 67,388 | | |
| | 216,000 | | | @@,C | | Novartis Securities Investment
Ltd., 5.125%, due 02/10/19 | | | 221,404 | | |
| | | | 547,244 | | |
| | | | | Pipelines: 0.4% | |
| | 417,000 | | | C | | Enbridge Energy Partners,
9.875%, due 03/01/19 | | | 484,219 | | |
| | 360,000 | | | C | | Energy Transfer Partners,
9.700%, due 03/15/19 | | | 413,967 | | |
| | 90,000 | | | C | | Kinder Morgan Energy
Partners L.P., 6.850%,
due 02/15/20 | | | 92,424 | | |
| | 345,000 | | | C | | Northwest Pipeline Corp.,
7.000%, due 06/15/16 | | | 364,416 | | |
| | 147,000 | | | @@,C | | Trans-Canada Pipelines,
7.125%, due 01/15/19 | | | 166,202 | | |
| | 163,000 | | | @@,C | | Trans-Canada Pipelines,
7.625%, due 01/15/39 | | | 190,850 | | |
| | 460,000 | | | C | | Transcontinental Gas
Pipe Line Corp., 6.400%,
due 04/15/16 | | | 472,743 | | |
| | | | 2,184,821 | | |
| | | | | Real Estate: 0.0% | |
| | 298,000 | | | C,L | | Simon Property Group, Inc.,
6.750%, due 05/15/14 | | | 299,738 | | |
| | | | 299,738 | | |
See Accompanying Notes to Financial Statements
51
PORTFOLIO OF INVESTMENTS
ING BALANCED PORTFOLIO AS OF JUNE 30, 2009 (UNAUDITED) (CONTINUED)
Principal
Amount | | | | | | Value | |
| | | | | Retail: 0.1% | |
| $ | 214,000 | | | C | | CVS Caremark Corp., 6.600%,
due 03/15/19 | | $ | 229,072 | | |
| | 453,598 | | | #,C | | CVS Lease Pass-through,
6.036%, due 12/10/28 | | | 388,604 | | |
| | | | 617,676 | | |
| | | | | Software: 0.1% | |
| | 421,000 | | | | | Oracle Corp., 5.000%,
due 07/08/19 | | | 419,430 | | |
| | 280,000 | | | | | Oracle Corp., 6.125%,
due 07/08/39 | | | 278,135 | | |
| | | | 697,565 | | |
| | | | | Telecommunications: 1.0% | |
| | 1,252,000 | | | C | | AT&T, Inc., 6.550%,
due 02/15/39 | | | 1,253,844 | | |
| | 471,000 | | | | | Bellsouth Telecommunications,
Inc., 7.000%, due 12/01/95 | | | 412,761 | | |
| | 136,000 | | | @@,C | | British Telecommunications PLC,
5.150%, due 01/15/13 | | | 135,639 | | |
| | 227,000 | | | @@,C | | British Telecommunications PLC,
5.950%, due 01/15/18 | | | 204,913 | | |
| | 155,000 | | | @@,C | | Deutsche Telekom
International Finance,
5.250%, due 07/22/13 | | | 159,350 | | |
| | 44,000 | | | C | | Embarq Corp., 6.738%,
due 06/01/13 | | | 44,453 | | |
| | 594,000 | | | C | | Embarq Corp., 7.995%,
due 06/01/36 | | | 523,670 | | |
| | 255,000 | | | C | | Sprint Nextel Corp., 6.000%,
due 12/01/16 | | | 209,738 | | |
| | 349,000 | | | @@,C | | Telecom Italia Capital SA,
7.175%, due 06/18/19 | | | 354,404 | | |
| | 154,000 | | | @@,C | | Telefonica Emisones SAU,
5.877%, due 07/15/19 | | | 159,073 | | |
| | 430,000 | | | @@,C | | Telefonica Emisones SAU,
6.421%, due 06/20/16 | | | 460,407 | | |
| | 491,000 | | | C | | Verizon Communications, Inc.,
7.350%, due 04/01/39 | | | 536,718 | | |
| | 447,000 | | | C | | Verizon Communications, Inc.,
8.950%, due 03/01/39 | | | 566,189 | | |
| | 1,000,000 | | | #,C | | Verizon Wireless Capital LLC,
5.550%, due 02/01/14 | | | 1,062,699 | | |
| | | | 6,083,858 | | |
| | | | | Transportation: 0.3% | |
| | 453,000 | | | C | | CSX Corp., 6.250%,
due 04/01/15 | | | 468,895 | | |
| | 517,000 | | | C | | CSX Corp., 7.450%,
due 04/01/38 | | | 561,532 | | |
| | 206,000 | | | C | | Union Pacific Corp., 5.125%,
due 02/15/14 | | | 213,149 | | |
| | 572,000 | | | C | | Union Pacific Corp., 5.700%,
due 08/15/18 | | | 574,178 | | |
| | | | 1,817,754 | | |
Total Corporate Bonds/Notes
(Cost $68,039,943) | | | 65,862,067 | | |
Principal
Amount | | | | | | Value | |
| U.S. GOVERNMENT AGENCY OBLIGATIONS: 13.7% | | | |
| | | | | | | Federal Home Loan Mortgage
Corporation##: 3.6% | | | | | |
| $ | 279,923 | | | S | | 4.969%, due 04/01/35 | | $ | 290,592 | | |
| | 2,842,000 | | | W | | 5.000%, due 08/15/33 | | | 2,878,858 | | |
| | 7,102,634 | | | S | | 5.000%, due 08/15/16-04/15/32 | | | 7,418,012 | | |
| | 2,918,000 | | | W | | 5.500%, due 07/15/34 | | | 3,012,380 | | |
| | 1,969,502 | | | S | | 5.500%, due 12/15/20-02/15/34 | | | 2,037,004 | | |
| | 5,156,673 | | | S | | 6.000%, due 01/15/29 | | | 5,499,246 | | |
| | 225,272 | | | S | | 6.500%, due 11/01/28-12/01/31 | | | 242,129 | | |
| | | | 21,378,221 | | |
| | | | | | | Federal National Mortgage
Association##: 7.4% | | | | | |
| | 104,137 | | | S | | 0.454%, due 04/25/35 | | | 95,403 | | |
| | 35,355 | | | S | | 0.664%, due 08/25/33 | | | 34,750 | | |
| | 866,000 | | | | | 4.000%, due 02/25/39 | | | 839,749 | | |
| | 4,043,000 | | | W | | 4.500%, due 07/25/18-07/15/35 | | | 4,067,657 | | |
| | 579,922 | | | S | | 5.000%, due 02/25/29-07/01/36 | | | 594,756 | | |
| | 6,463,000 | | | | | 5.000%, due 07/01/37 | | | 6,610,437 | | |
| | 6,187,000 | | | W | | 5.500%, due 07/15/34 | | | 6,387,112 | | |
| | 1,876,000 | | | S | | 5.500%, due 05/25/30 | | | 1,961,498 | | |
| | 4,329,000 | | | W | | 6.000%, due 07/01/37 | | | 4,524,480 | | |
| | 6,741,470 | | | S | | 6.000%, due 06/01/16-01/01/38 | | | 7,184,318 | | |
| | 8,654,000 | | | W | | 6.500%, due 08/01/39 | | | 9,180,007 | | |
| | 1,147,103 | | | S | | 7.000%, due 06/01/29-07/01/32 | | | 1,259,593 | | |
| | 182,339 | | | S | | 7.500%, due 11/01/29-11/01/30 | | | 199,103 | | |
| | 497,860 | | | S | | 7.500%, due 01/25/48 | | | 537,183 | | |
| | | | 43,476,046 | | |
| | | | | | | Government National Mortgage
Association: 2.7% | | | | | |
| | 16,384 | | | S | | 4.125%, due 12/20/29 | | | 16,636 | | |
| | 6,778,000 | | | W | | 4.500%, due 07/01/39 | | | 6,767,413 | | |
| | 747,552 | | | S | | 4.500%, due 04/15/39 | | | 747,990 | | |
| | 1,730,000 | | | W | | 5.000%, due 08/01/33 | | | 1,756,761 | | |
| | 63,653 | | | S | | 5.375%, due 04/20/28 | | | 65,665 | | |
| | 275,366 | | | S | | 5.500%, due 09/15/38 | | | 284,896 | | |
| | 678,243 | | | | | 5.500%, due 03/20/39 | | | 699,917 | | |
| | 532,000 | | | S | | 6.000%, due 10/15/38 | | | 554,922 | | |
| | 2,540,000 | | | | | 6.000%, due 07/15/33 | | | 2,645,966 | | |
| | 98,993 | | | S | | 6.500%, due 10/15/31 | | | 106,838 | | |
| | 964,155 | | | S | | 7.000%, due 09/15/24-11/15/24 | | | 1,048,147 | | |
| | 861,235 | | | S | | 7.500%, due 12/15/23 | | | 940,787 | | |
| | | | 15,635,938 | | |
Total U.S. Government
Agency Obligations
(Cost $79,105,232) | | | 80,490,205 | | |
| U.S. TREASURY OBLIGATIONS: 9.2% | | | |
| | | | | U.S. Treasury Bonds: 1.0% | |
| | 6,464,000 | | | S | | 3.500%, due 02/15/39 | | | 5,591,379 | | |
| | | | 5,591,379 | | |
| | | | | U.S. Treasury Notes: 8.2% | |
| | 5,420,000 | | | S | | 0.875%, due 05/31/11 | | | 5,402,239 | | |
| | 1,530,000 | | | | | 1.125%, due 06/30/11 | | | 1,530,478 | | |
| | 6,810,000 | | | L | | 1.875%, due 06/15/12 | | | 6,861,640 | | |
| | 16,583,000 | | | L | | 2.250%, due 05/31/14 | | | 16,365,315 | | |
| | 497,000 | | | S | | 2.625%, due 04/30/16 | | | 480,692 | | |
| | 14,540,000 | | | | | 2.625%, due 06/30/14 | | | 14,590,061 | | |
| | 3,018,000 | | | L | | 3.125%, due 05/15/19 | | | 2,919,924 | | |
| | | | 48,150,349 | | |
Total U.S. Treasury Obligations
(Cost $53,419,842) | | | 53,741,728 | | |
See Accompanying Notes to Financial Statements
52
PORTFOLIO OF INVESTMENTS
ING BALANCED PORTFOLIO AS OF JUNE 30, 2009 (UNAUDITED) (CONTINUED)
Principal
Amount | | | | | | Value | |
| ASSET-BACKED SECURITIES: 0.9% | | | |
| | | | | | | Automobile Asset-Backed
Securities: 0.1% | | | | | |
| $ | 376,000 | | | S | | Honda Auto Receivables Owner
Trust, 4.880%, due 09/18/14 | | $ | 393,214 | | |
| | 241,000 | | | S | | Nissan Auto Receivables Owner
Trust, 2.940%, due 07/15/11 | | | 242,698 | | |
| | 113,000 | | | S | | Nissan Auto Receivables Owner
Trust, 4.460%, due 04/16/12 | | | 116,200 | | |
| | | | 752,112 | | |
| | | | | | | Home Equity Asset-Backed
Securities: 0.4% | | | | | |
| | 1,733,878 | | | S | | GSAA Trust, 5.242%,
due 06/25/34 | | | 1,599,628 | | |
| | 428,000 | | | #,S | | Irwin Home Equity, 5.960%,
due 08/25/37 | | | 95,580 | | |
| | 153,045 | | | S | | Merrill Lynch Mortgage
Investors Trust, 0.674%,
due 07/25/34 | | | 81,838 | | |
| | 168 | | | S | | Renaissance Home Equity Loan
Trust, 4.456%, due 05/25/35 | | | 163 | | |
| | 387,857 | | | S | | Residential Funding Mortgage
Securities II, Inc., 5.890%,
due 05/25/37 | | | 327,005 | | |
| | | | 2,104,214 | | |
| | | | | Other Asset-Backed Securities: 0.4% | |
| | 107,455 | | | S | | Amortizing Residential
Collateral Trust, 0.564%,
due 05/25/32 | | | 57,774 | | |
| | 69,434 | | | S | | Chase Funding Mortgage
Loan Asset-Backed
Certificates, 0.914%,
due 07/25/33 | | | 54,303 | | |
| | 826 | | | S | | Chase Funding Mortgage
Loan Asset-Backed
Certificates, 4.045%,
due 05/25/33 | | | 774 | | |
| | 104,000 | | | S | | Countrywide Asset-Backed
Certificates, 5.689%,
due 10/25/46 | | | 45,310 | | |
| | 733,647 | | | S | | Credit-Based Asset
Servicing and
Securitization, LLC, 4.831%,
due 08/25/35 | | | 613,495 | | |
| | 851,801 | | | S | | Credit-Based Asset
Servicing and
Securitization, LLC, 5.501%,
due 12/25/36 | | | 584,213 | | |
| | 459,000 | | | #,S | | Credit-Based Asset
Servicing and
Securitization, LLC, 5.746%,
due 12/25/37 | | | 333,253 | | |
| | 241,000 | | | #,S | | Credit-Based Asset
Servicing and
Securitization, LLC, 6.020%,
due 12/25/37 | | | 142,675 | | |
| | 524,516 | | | S | | Equity One, Inc., 5.050%,
due 09/25/33 | | | 369,435 | | |
| | 927,000 | | | S | | Hudson Mezzanine Funding,
1.314%, due 06/12/42 | | | — | | |
Principal
Amount | | | | | | Value | |
| $ | 281,922 | | | S | | Merrill Lynch Mortgage
Investors Trust, 5.609%,
due 03/25/37 | | $ | 130,917 | | |
| | 1,528 | | | S | | Popular Mortgage
Pass-through Trust, 4.000%,
due 12/25/34 | | | 1,482 | | |
| | 20,045 | | | S | | Residential Asset Mortgage
Products, Inc., 0.934%,
due 06/25/33 | | | 12,141 | | |
| | 329,414 | | | S | | Structured Asset Securities
Corp., 4.910%, due 06/25/33 | | | 278,029 | | |
| | | | 2,623,801 | | |
Total Asset-Backed Securities
(Cost $8,075,568) | | | 5,480,127 | | |
| COLLATERALIZED MORTGAGE OBLIGATIONS: 4.0% | | | |
| | 752,170 | | | C,S | | American Home Mortgage
Assets, 2.260%, due 11/25/46 | | | 251,404 | | |
| | 1,342,710 | | | C,S | | American Home Mortgage
Investment Trust, 0.694%,
due 11/25/45 | | | 315,256 | | |
| | 1,420,396 | | | C,S | | Banc of America Funding Corp.,
5.258%, due 09/20/35 | | | 775,773 | | |
| | 887,287 | | | C,S | | Banc of America Mortgage
Securities, Inc., 5.145%,
due 09/25/35 | | | 709,169 | | |
| | 678,826 | | | C,S | | Banc of America Mortgage
Securities, Inc., 5.500%,
due 11/25/33 | | | 609,736 | | |
| | 191,706 | | | C,S | | Bear Stearns Alternative-A
Trust, 0.634%, due 07/25/34 | | | 96,248 | | |
| | 418,619 | | | C,S | | Chase Manhattan Bank-First
Union National Bank,
7.439%, due 08/15/31 | | | 417,854 | | |
| | 954,809 | | | C,S | | Chase Mortgage Finance Corp.,
5.500%, due 11/25/35 | | | 881,977 | | |
| | 539,489 | | | C,S | | Citicorp Mortgage Securities,
Inc., 5.500%, due 02/25/22 | | | 430,161 | | |
| | 790,000 | | | C,S | | Citigroup Commercial
Mortgage Trust, 5.888%,
due 12/10/49 | | | 626,795 | | |
| | 618,956 | | | C,S | | Countrywide Alternative
Loan Trust, 1.398%,
due 11/25/46 | | | 108,232 | | |
| | 304,423 | | | C,S | | Countrywide Home Loan
Mortgage Pass-through Trust,
0.634%, due 04/25/35 | | | 45,008 | | |
| | 539,633 | | | C,S | | Countrywide Home Loan
Mortgage Pass-through Trust,
5.250%, due 10/25/35 | | | 366,732 | | |
| | 429,548 | | | C,S | | Credit Suisse First Boston
Mortgage Securities Corp.,
3.727%, due 03/15/35 | | | 417,494 | | |
| | 1,116,581 | | | C,S | | Credit Suisse Mortgage
Capital Certificates, 7.000%,
due 08/25/36 | | | 543,473 | | |
| | 505,560 | | | C,S | | First Horizon Mortgage
Pass-through Trust, 5.394%,
due 10/25/35 | | | 429,113 | | |
| | 543,405 | | | C,S | | First Horizon Mortgage
Pass-through Trust, 5.500%,
due 12/25/35 | | | 479,732 | | |
See Accompanying Notes to Financial Statements
53
PORTFOLIO OF INVESTMENTS
ING BALANCED PORTFOLIO AS OF JUNE 30, 2009 (UNAUDITED) (CONTINUED)
Principal
Amount | | | | | | Value | |
| COLLATERALIZED MORTGAGE OBLIGATIONS (continued) | | | |
| $ | 1,442,752 | | | C,S | | First Union National Bank
Commercial Mortgage,
6.663%, due 01/12/43 | | $ | 1,486,410 | | |
| | 142,756 | | | C,S | | GE Capital Commercial
Mortgage Corp., 5.560%,
due 06/10/38 | | | 146,632 | | |
| | 1,378,570 | | | C,S | | GMAC Mortgage Corp. Loan
Trust, 5.261%, due 03/18/35 | | | 1,208,745 | | |
| | 152,243 | | | C,S | | GMAC Mortgage Corp. Loan
Trust, 5.466%, due 11/19/35 | | | 114,013 | | |
| | 683,130 | | | #,C,S | | GSMPS Mortgage Loan Trust,
0.714%, due 04/25/36 | | | 592,280 | | |
| | 765,246 | | | S | | GSMPS Mortgage Loan Trust,
0.872%, due 01/25/35 | | | 496,868 | | |
| | 378,783 | | | C,S | | GSR Mortgage Loan Trust,
5.500%, due 07/25/35 | | | 359,568 | | |
| | 198,248 | | | C,S | | Harborview Mortgage
Loan Trust, 0.663%,
due 01/19/35 | | | 87,208 | | |
| | 270,932 | | | C,S | | Homebanc Mortgage Trust,
1.174%, due 08/25/29 | | | 138,989 | | |
| | 200,380 | | | C,S | | JPMorgan Alternative
Loan Trust, 5.506%,
due 01/25/36 | | | 131,350 | | |
| | 246,517 | | | C,S | | JPMorgan Chase Commercial
Mortgage Securities Corp.,
4.262%, due 08/12/40 | | | 245,606 | | |
| | 1,180,000 | | | C,S | | JPMorgan Chase Commercial
Mortgage Securities Corp.,
5.399%, due 05/15/45 | | | 937,952 | | |
| | 81,940 | | | C,S | | JPMorgan Chase Commercial
Mortgage Securities Corp.,
6.023%, due 04/15/45 | | | 83,198 | | |
| | 690,000 | | | C,S | | LB-UBS Commercial Mortgage
Trust, 6.080%, due 06/15/38 | | | 579,552 | | |
| | 837,922 | | | C,S | | LB-UBS Commercial Mortgage
Trust, 7.370%, due 08/15/26 | | | 858,121 | | |
| | 569,490 | | | C,S | | Luminent Mortgage Trust,
0.514%, due 10/25/46 | | | 234,847 | | |
| | 21,468 | | | C,S | | MASTR Alternative
Loans Trust, 6.500%,
due 05/25/33 | | | 18,582 | | |
| | 201,506 | | | C,S | | MASTR Alternative
Loans Trust, 8.500%,
due 05/25/33 | | | 189,471 | | |
| | 100,072 | | | C,S | | MLCC Mortgage Investors, Inc.,
0.634%, due 01/25/29 | | | 78,870 | | |
| | 108,418 | | | C,S | | MortgageIT Trust, 0.684%,
due 11/25/35 | | | 18,493 | | |
| | 788,000 | | | C,S | | New York Mortgage Trust, Inc.,
5.658%, due 05/25/36 | | | 511,163 | | |
| | 325,521 | | | C,S | | Prime Mortgage Trust, 0.814%,
due 02/25/35 | | | 185,780 | | |
| | 82,941 | | | C,S | | Prudential Commercial
Mortgage Trust, 3.669%,
due 02/11/36 | | | 81,704 | | |
| | 379,621 | | | C,S | | Residential Accredit Loans, Inc.,
0.554%, due 04/25/46 | | | 65,874 | | |
| | 110,669 | | | C,S | | Sequoia Mortgage Trust,
0.585%, due 01/20/35 | | | 61,644 | | |
Principal
Amount | | | | | | Value | |
| $ | 3,151 | | | C,S | | Structured Adjustable Rate
Mortgage Loan Trust,
0.624%, due 07/25/35 | | $ | 1,386 | | |
| | 181,568 | | | C,S | | Structured Asset Mortgage
Investments, Inc., 0.553%,
due 04/19/35 | | | 91,651 | | |
| | 960,000 | | | C,S | | Wachovia Bank Commercial
Mortgage Trust, 5.083%,
due 03/15/42 | | | 828,221 | | |
| | 1,130,000 | | | C,S | | Wachovia Bank Commercial
Mortgage Trust, 5.308%,
due 11/15/48 | | | 866,080 | | |
| | 304,637 | | | C,S | | Washington Mutual Mortgage
Pass-through Certificates,
0.624%, due 01/25/45 | | | 142,051 | | |
| | 111,705 | | | C,S | | Washington Mutual Mortgage
Pass-through Certificates,
0.634%, due 08/25/45 | | | 60,760 | | |
| | 49,652 | | | C,S | | Washington Mutual Mortgage
Pass-through Certificates,
0.733%, due 06/25/44 | | | 26,650 | | |
| | 1,748,267 | | | C,S | | Washington Mutual Mortgage
Pass-through Certificates,
2.080%, due 01/25/47 | | | 615,970 | | |
| | 912,712 | | | C,S | | Washington Mutual Mortgage
Pass-through Certificates,
2.260%, due 09/25/46 | | | 174,748 | | |
| | 61,133 | | | C,S | | Washington Mutual Mortgage
Pass-through Certificates,
2.310%, due 05/25/46 | | | 10,416 | | |
| | 254,779 | | | C,S | | Washington Mutual Mortgage
Pass-through Certificates,
2.310%, due 06/25/46 | | | 90,640 | | |
| | 1,354,079 | | | C,S | | Washington Mutual Mortgage
Pass-through Certificates,
6.000%, due 06/25/34 | | | 1,214,358 | | |
| | 1,245,000 | | | C,S | | Wells Fargo Mortgage-Backed
Securities Trust, 4.775%,
due 07/25/34 | | | 1,129,852 | | |
| | 565,567 | | | C,S | | Wells Fargo Mortgage-Backed
Securities Trust, 4.878%,
due 08/25/34 | | | 510,752 | | |
| | 2,006,583 | | | C,S | | Wells Fargo Mortgage-Backed
Securities Trust, 5.388%,
due 08/25/35 | | | 1,524,009 | | |
Total Collateralized
Mortgage Obligations
(Cost $31,870,651) | | | 23,704,621 | | |
| OTHER BONDS: 0.7% | | | |
| | | | | Foreign Government Bonds: 0.7% | |
| BRL | 8,953,000 | | | | | Brazil Notas do Tesouro
Nacional Series F, 10.000%,
due 01/01/17 | | | 3,989,100 | | |
Total Other Bonds
(Cost $3,820,190) | | | 3,989,100 | | |
Total Long-Term Investments
(Cost $595,608,301) | | | 585,328,098 | | |
See Accompanying Notes to Financial Statements
54
PORTFOLIO OF INVESTMENTS
ING BALANCED PORTFOLIO AS OF JUNE 30, 2009 (UNAUDITED) (CONTINUED)
Principal
Amount | | | | | | Value | |
| SHORT-TERM INVESTMENTS: 11.3% | |
| | | | | Money Market: 3.0% | |
| $ | 17,914,000 | | | S | | ING Institutional Prime
Money Market Fund - Class I | | $ | 17,914,000 | | |
Total Money Market
(Cost $17,914,000) | | | 17,914,000 | | |
| | | Securities Lending Collateralcc: 8.3% | |
| | 49,131,766 | | | Bank of New York Mellon Corp.
Institutional Cash Reserves | | | 48,806,335 | | |
Total Securities Lending
Collateral
(Cost $49,131,766) | | | 48,806,335 | | |
Total Short-Term Investments
(Cost $67,045,766) | | | 66,720,335 | | |
Total Investments in
Securities
(Cost $662,654,067)* | | | 111.0 | % | | $ | 652,048,433 | | |
Other Assets and
Liabilities - Net | | | (11.0 | ) | | | (64,751,110 | ) | |
| Net Assets | | | 100.0 | % | | $ | 587,297,323 | | |
@ Non-income producing security
@@ Foreign Issuer
ADR American Depositary Receipt
MASTR Mortgage Asset Securitization Transaction, Inc.
# Securities with purchases pursuant to Rule 144A or section 4(2), under the Securities Act of 1933 and may not be resold subject to that rule except to qualified institutional buyers. Unless otherwise noted, these securities have been determined to be liquid under the guidelines established by the Funds' Board of Directors/Trustees.
C Bond may be called prior to maturity date.
P Preferred Stock may be called prior to convertible date.
cc Securities purchased with cash collateral for securities loaned.
## On September 7, 2008, the Federal Housing Finance Agency placed the Federal National Mortgage Association and the Federal Home Loan Mortgage Corporation into conservatorship and the U.S. Treasury guaranteed the debt issued by those organizations.
W Settlement is on a when-issued or delayed-delivery basis.
S All or a portion of this security is segregated to cover collateral requirements for applicable futures, options, swaps, foreign forward currency contracts and/or when-issued or delayed-delivery securities.
I Illiquid security
L Loaned security, a portion or all of the security is on loan at June 30, 2009.
± Defaulted security
X Fair value determined by ING Funds Valuation Committee appointed by the Funds' Board of Directors/Trustees.
Z Indicates Zero Coupon Bond; rate shown reflects current effective yield.
BRL Brazilian Real
* Cost for federal income tax purposes is $693,295,726.
Net unrealized depreciation consists of:
| Gross Unrealized Appreciation | | $ | 31,483,032 | | |
| Gross Unrealized Depreciation | | | (72,730,325 | ) | |
| Net Unrealized Depreciation | | $ | (41,247,293 | ) | |
| Fair Value Measurements* | |
The following is a summary of the inputs used as of June 30, 2009 in determining the Portfolio's investments at fair value for purposes of SFAS 157:
| | | Quoted Prices
in Active
Markets
for Identical
Investments
(Level 1) | | Significant
Other
Observable
Inputs
(Level 2) | | Significant
Unobservable
Inputs
(Level 3) | |
| Common Stock** | | $ | 343,664,621 | | | $ | — | | | $ | — | | |
Real Estate
Investment Trusts | | | 7,876,341 | | | | — | | | | — | | |
| Preferred Stock | | | — | | | | 519,288 | | | | — | | |
| Corporate Bonds/Notes | | | — | | | | 65,778,058 | | | | 84,009 | | |
U.S. Government
Agency Obligations | | | — | | | | 80,490,205 | | | | — | | |
U.S. Treasury
Obligations | | | — | | | | 53,741,728 | | | | — | | |
Asset-Backed
Securities | | | — | | | | 5,480,127 | | | | — | | |
Collateralized
Mortgage
Obligations | | | — | | | | 23,704,621 | | | | — | | |
Foreign Government
Bonds | | | — | | | | — | | | | 3,989,100 | | |
Short-Term
Investments | | | 17,914,000 | | | | 48,806,335 | | | | — | | |
| Total | | $ | 375,046,341 | | | $ | 272,928,983 | | | $ | 4,073,109 | | |
Other Financial
Instruments*** | | | (213,703 | ) | | | (329,335 | ) | | | — | | |
| Total | | $ | (213,703 | ) | | $ | (329,335 | ) | | $ | — | | |
The following is a reconciliation of the fair value measurements using significant unobservable inputs (Level 3) for the period ended June 30, 2009:
| | | Beginning
Balance
12/31/08 | | Net
Purchases/
(Sales) | | Accrued
Discounts/
(Premiums) | | Total
Realized
Gain/(Loss) | | Total
Unrealized
Appreciation/
(Depreciation) | | Net Transfers
In/(Out) of
Level 3 | | Ending
Balance
at 06/30/09 | |
| Corporate Bonds/Notes | | $ | — | | | $ | — | | | $ | 5,226 | | | $ | — | | | $ | (5,217 | ) | | $ | 84,000 | | | $ | 84,009 | | |
| Foreign Government Bonds | | | 2,290,460 | | | | 2,990,736 | | | | (129,189 | ) | | | (752,279 | ) | | | 582,997 | | | | (993,625 | ) | | | 3,989,100 | | |
| Total | | $ | 2,290,460 | | | $ | 2,990,736 | | | $ | (123,963 | ) | | $ | (752,279 | ) | | $ | 577,780 | | | $ | (909,625 | ) | | $ | 4,073,109 | | |
For the period ended June 30, 2009, total change in unrealized gain (loss) on Level 3 securities still held at period end and included in the change in net assets was $(345,582). Total unrealized gain (loss) for all securities (including Level 1 and Level 2) can be found on the accompanying Statement of Operations.
See Accompanying Notes to Financial Statements
55
PORTFOLIO OF INVESTMENTS
ING BALANCED PORTFOLIO AS OF JUNE 30, 2009 (UNAUDITED) (CONTINUED)
"Fair value" for purposes of SFAS 157 is different from "fair value" as used in the 1940 Act. The former generally implies market value, and can include market quotations as a source of value, and the latter refers to determinations of value in absence of available market quotations.
* See NOTE 2, "Significant Accounting Policies" in the Notes to Financial Statements for additional information.
** For further breakdown of Common Stock by industry type, please refer to the Portfolio of Investments.
*** Other financial instruments may include open forward foreign currency contracts, futures, swaps, and written options. Forward foreign currency contracts and futures are reported at their unrealized gain/loss at period end. Swaps and written options are reported at their market value at period end.
ING Balanced Portfolio Open Futures Contracts on June 30, 2009:
Contract
Description | | Number of
Contracts | | Expiration
Date | | Unrealized
Appreciation/
(Depreciation) | |
| Long Contracts | |
| Russell 2000 Mini Index | | | 22 | | | 09/18/09 | | $ | 6,355 | | |
| S&P 500 | | | 20 | | | 09/17/09 | | | (62,192 | ) | |
| S&P Mid 400 E-Mini | | | 23 | | | 09/18/09 | | | (16,434 | ) | |
| U.S. Treasury 2-Year Note | | | 26 | | | 09/30/09 | | | (8,596 | ) | |
| | | | | | | | | $ | (80,867 | ) | |
| Short Contracts | |
| U.S. Treasury 10-Year Note | | | 9 | | | 09/21/09 | | $ | (3,468 | ) | |
| U.S. Treasury Long Bond | | | 47 | | | 09/21/09 | | | (129,368 | ) | |
| | | | | | | | | $ | (132,836 | ) | |
ING Balanced Portfolio Credit Default Swap Agreements Outstanding on June 30, 2009:
Credit Default Swaps on Corporate and Sovereign Issues — Buy Protection(1)
| Counterparty | | Reference
Entity/Obligation | | Buy/Sell
Protection | | (Pay)/
Receive
Fixed
Rate (%) | | Termination
Date | | Notional
Amount(2) | | Market
Value(3) | | Upfront
Premium
Paid/
(Received) | | Unrealized
Appreciation/
(Depreciation) | |
Morgan Stanley
Capital
Services Inc. | | Domtar Inc.
7.875%, 10/15/11 | | Buy | | | (2.650 | ) | | 09/20/11 | | USD | 543,500 | | | $ | 43,945 | | | $ | — | | | $ | 43,945 | | |
Goldman Sachs
International | | Dow Chemical Co.
7.375%, 11/01/29 | | Buy | | | (1.280 | ) | | 12/20/13 | | USD | 681,000 | | | | 32,819 | | | | — | | | | 32,819 | | |
Barclays Bank
PLC | | GAP Inc.
8.800%, 12/15/08* | | Buy | | | (1.200 | ) | | 06/20/13 | | USD | 344,000 | | | | (10,905 | ) | | | — | | | | (10,905 | ) | |
Citibank N.A.,
New York | | MBIA Inc.
6.625%, 10/01/28 | | Buy | | | (5.000 | ) | | 09/20/13 | | USD | 140,000 | | | | 38,905 | | | | 39,978 | | | | (1,073 | ) | |
Citibank N.A.,
New York | | MBIA Inc.
6.625%, 10/01/28 | | Buy | | | (5.000 | ) | | 09/20/13 | | USD | 284,000 | | | | 78,921 | | | | 77,833 | | | | 1,088 | | |
JPMorgan
Chase Bank,
N.A. New York | | MBIA Inc.
6.625%, 10/01/28 | | Buy | | | (5.000 | ) | | 09/20/13 | | USD | 959,000 | | | | 266,497 | | | | 143,031 | | | | 123,466 | | |
| | | | | | | | | | | | | $ | 2,951,500 | | | $ | 450,182 | | | $ | 260,842 | | | $ | 189,340 | | |
Credit Default Swaps on Corporate and Sovereign Issues — Sell Protection(4)
| Counterparty | | Reference
Entity/Obligation | | Buy/Sell
Protection | | (Pay)/
Receive
Fixed
Rate (%) | | Termination
Date | | Implied
Credit
Spread at
12/31/08(5) | | Notional
Amount(2) | | Market
Value(3) | | Upfront
Premium
Paid/
(Received) | | Unrealized
Appreciation/
(Depreciation) | |
| UBS AG | | Domtar Inc.
7.875%, 10/15/11 | | Sell | | | 2.600 | | | 09/20/11 | | | 6.71 | | | USD | 542,000 | | | $ | (44,364 | ) | | $ | — | | | $ | (44,364 | ) | |
Citibank N.A.,
New York | | MBIA Global Funding
LLC, FRN, 10/06/10 | | Sell | | | 5.000 | | | 09/20/13 | | | 43.87 | | | USD | 139,000 | | | | (89,324 | ) | | | (44,165 | ) | | | (45,159 | ) | |
Citibank N.A.,
New York | | MBIA Global Funding
LLC, FRN, 10/06/10 | | Sell | | | 5.000 | | | 09/20/13 | | | 43.87 | | | USD | 284,000 | | | | (182,503 | ) | | | (98,437 | ) | | | (84,066 | ) | |
Goldman Sachs
International | | MBIA Global Funding
LLC, FRN, 10/06/10 | | Sell | | | 5.000 | | | 09/20/13 | | | 43.87 | | | USD | 241,000 | | | | (154,870 | ) | | | (75,603 | ) | | | (79,267 | ) | |
See Accompanying Notes to Financial Statements
56
PORTFOLIO OF INVESTMENTS
ING BALANCED PORTFOLIO AS OF JUNE 30, 2009 (UNAUDITED) (CONTINUED)
| Counterparty | | Reference
Entity/Obligation | | Buy/Sell
Protection | | (Pay)/
Receive
Fixed
Rate (%) | | Termination
Date | | Implied
Credit
Spread at
12/31/08(5) | | Notional
Amount(2) | | Market
Value(3) | | Upfront
Premium
Paid/
(Received) | | Unrealized
Appreciation/
(Depreciation) | |
JPMorgan Chase
Bank, N.A.
New York | | MBIA Global Funding
LLC, FRN, 10/06/10 | | Sell | | | 5.000 | | | | 09/20/13 | | | | 43.87 | | | USD | 480,000 | | | $ | (308,456 | ) | | $ | (75,567 | ) | | $ | (232,889 | ) | |
| | | | | | | | | | | | | | | | | | | $ | 1,686,000 | | | $ | (779,517 | ) | | $ | (293,772 | ) | | $ | (485,745 | ) | |
* In the event of a default, if this bond is no longer available an equivalent bond will be delivered.
(1) If a Fund is a buyer of protection and a credit event occurs, as defined under the terms of that particular swap agreement, a Fund will either 1.) receive from the seller of protection an amount equal to the notional amount of the swap and deliver the referenced obligation, other deliverable obligations or underlying securities comprising the referenced index or 2.) receive a net settlement amount in the form of cash or securities equal to the notional amount of the swap less the recovery value of the referenced obligation or underlying securities comprising the referenced index.
(2) The maximum amount of future payments (undiscounted) that a Fund as seller of protection could be required to make or receive as a buyer of credit protection under a credit default swap agreement would be an amount equal to the notional amount of the agreement.
(3) The market values for credit default swap agreements serve as an indicator of the current status of the payment/performance risk and represent the likelihood or risk of default for the credit derivative. Increasing market values, in absolute terms, when compared to the notional amount of the agreement, represent a deterioration of the referenced obligation's credit soundness and a greater likelihood or risk of default or other credit event occurring.
(4) If the Fund is a seller of protection, and a credit event occurs, as defined under the terms of that particular swap agreement, the Fund will generally either 1.) Pay to the buyer an amount equal to the notional amount of the swap and take delivery of the referenced obligation, other deliverable obligations, or underlying securities comprising a referenced index or 2.) Pay a net settlement amount in the form of cash or securities equal to the notional amount of the swap less the recovery value of the referenced obligation or underlying securities comprising a referenced index.
(5) Implied credit spreads, represented in absolute terms, utilized in determining the market value of credit default swap agreements on corporate issues or sovereign issues are disclosed in the table above and serve as an indicator of the current status of the payment/performance risk and represent the likelihood or risk of default for the credit derivative. The implied credit spread of a particular referenced entity reflects the cost of buying/selling protection and may include upfront payments required to be made to enter into the agreement. For credit default swaps on asset-backed securities or credit indices, the quoted market prices and resulting market values serve as the indicator of the current status of the payment/performance risk. Wider credit spreads and increasing market values, in absolute terms when compared to the notional amount of the swap, represent a deterioration of the referenced entity's credit soundness an d a greater likelihood or risk of default or other credit event occurring as defined under the terms of the agreement.
A summary of derivative instruments by primary risk exposure is outlined in the following tables.
The fair value of derivative instruments as of June 30, 2009 was as follows:
Derivatives not accounted for as hedging
instruments under SFAS No. 133 | | Location on Statement of Assets and Liabilities | | Fair Value | |
| Asset Derivatives | |
| Credit contracts | | Unrealized appreciation on swap agreements, net of upfront payments made | | $ | 462,160 | | |
| Total Asset Derivatives | | | | $ | 462,160 | | |
| Liability Derivatives | |
| Credit contracts | | Unrealized depreciation on swap agreements, net of upfront payments received | | $ | 791,495 | | |
| Total Liability Derivatives | | | | $ | 791,495 | | |
The effect of derivative instruments on the Portfolio's Statement of Operations for the six months ended June 30, 2009 was as follows:
| Amount of Realized Gain or (Loss) on Derivatives Recognized in Income | |
Derivatives not accounted for as hedging
instruments under SFAS No. 133 | | Forward Foreign
Currency Contracts | | Futures | | Swaps | | Total | |
| Equity contracts | | $ | — | | | $ | 880,973 | | | $ | — | | | $ | 880,973 | | |
| Foreign exchange contracts | | | (397,488 | ) | | | — | | | | — | | | | (397,488 | ) | |
| Interest rate contracts | | | — | | | | 490,268 | | | | 70,204 | | | | 560,472 | | |
| Credit contracts | | | — | | | | — | | | | 2,774,379 | | | | 2,774,379 | | |
| Total | | $ | (397,488 | ) | | $ | 1,371,241 | | | $ | 2,844,583 | | | $ | 3,818,336 | | |
See Accompanying Notes to Financial Statements
57
PORTFOLIO OF INVESTMENTS
ING BALANCED PORTFOLIO AS OF JUNE 30, 2009 (UNAUDITED) (CONTINUED)
| Change in Unrealized Appreciation or (Depreciation) on Derivatives Recognized in Income | |
Derivatives not accounted for as hedging
instruments under SFAS No. 133 | | Forward Foreign
Currency Contracts | | Futures | | Swaps | | Total | |
| Equity contracts | | $ | — | | | $ | (236,536 | ) | | $ | — | | | $ | (236,536 | ) | |
| Foreign exchange contracts | | | 163,392 | | | | — | | | | — | | | | 163,392 | | |
| Interest rate contracts | | | — | | | | 483,937 | | | | (164,419 | ) | | | 319,518 | | |
| Credit contracts | | | — | | | | — | | | | (3,758,968 | ) | | | (3,758,968 | ) | |
| Total | | $ | 163,392 | | | $ | 247,401 | | | $ | (3,923,387 | ) | | $ | (3,512,594 | ) | |
See Accompanying Notes to Financial Statements
58
PORTFOLIO OF INVESTMENTS
ING GROWTH AND INCOME PORTFOLIO AS OF JUNE 30, 2009 (UNAUDITED)
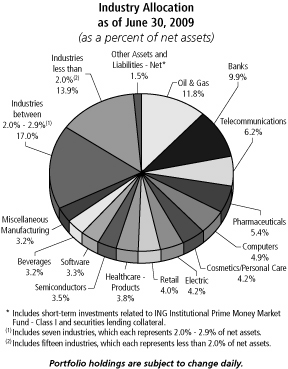
| Shares | | | | | | Value | |
| COMMON STOCK: 98.5% | | | |
| | | | | Advertising: 0.0% | |
| | 812 | | | @ | | Interpublic Group of Cos., Inc. | | $ | 4,101 | | |
| | | | 4,101 | | |
| | | | | Aerospace/Defense: 0.6% | |
| | 325,103 | | | @ | | TransDigm Group, Inc. | | | 11,768,729 | | |
| | | | 11,768,729 | | |
| | | | | Agriculture: 0.6% | |
| | 757,838 | | | | | Altria Group, Inc. | | | 12,420,965 | | |
| | | | 12,420,965 | | |
| | | | | Apparel: 1.1% | |
| | 840,237 | | | | | Coach, Inc. | | | 22,585,571 | | |
| | | | 22,585,571 | | |
| | | | | Auto Manufacturers: 1.9% | |
| | 366,317 | | | @ | | Navistar International Corp. | | | 15,971,421 | | |
| | 696,300 | | | | | Paccar, Inc. | | | 22,636,713 | | |
| | | | 38,608,134 | | |
| | | | | Auto Parts & Equipment: 1.1% | |
| | 805,300 | | | @@ | | Autoliv, Inc. | | | 23,168,481 | | |
| | | | 23,168,481 | | |
| | | | | Banks: 9.9% | |
| | 872,900 | | | | | Bank of America Corp. | | | 11,522,280 | | |
| | 188,200 | | | | | Comerica, Inc. | | | 3,980,430 | | |
| | 304,400 | | | | | Goldman Sachs Group, Inc. | | | 44,880,736 | | |
| | 1,655,160 | | | | | JPMorgan Chase & Co. | | | 56,457,507 | | |
| | 1,001,200 | | | | | Morgan Stanley | | | 28,544,212 | | |
| Shares | | | | | | Value | |
| | 273,700 | | | | | PNC Financial Services
Group, Inc. | | $ | 10,622,297 | | |
| | 1,891,300 | | | | | Wells Fargo & Co. | | | 45,882,938 | | |
| | | | 201,890,400 | | |
| | | | | Beverages: 3.2% | |
| | 756,600 | | | | | Coca-Cola Co. | | | 36,309,234 | | |
| | 506,450 | | | | | PepsiCo, Inc. | | | 27,834,492 | | |
| | | | 64,143,726 | | |
| | | | | Biotechnology: 1.6% | |
| | 695,400 | | | @ | | Gilead Sciences, Inc. | | | 32,572,536 | | |
| | | | 32,572,536 | | |
| | | | | Computers: 4.9% | |
| | 399,005 | | | @ | | Apple, Inc. | | | 56,830,283 | | |
| | 1,116,800 | | | | | Hewlett-Packard Co. | | | 43,164,320 | | |
| | 2,600 | | | I,X | | Seagate Technology,
Inc. - Escrow | | | — | | |
| | | | 99,994,603 | | |
| | | | | Cosmetics/Personal Care: 4.2% | |
| | 1,654,292 | | | | | Procter & Gamble Co. | | | 84,534,322 | | |
| | | | 84,534,322 | | |
| | | | | Distribution/Wholesale: 0.5% | |
| | 188,609 | | | | | Watsco, Inc. | | | 9,228,638 | | |
| | | | 9,228,638 | | |
| | | | | Diversified Financial Services: 0.7% | |
| | 167,531 | | | @@ | | Deutsche Boerse AG | | | 13,038,099 | | |
| | | | 13,038,099 | | |
| | | | | Electric: 4.2% | |
| | 347,000 | | | | | Entergy Corp. | | | 26,899,440 | | |
| | 638,900 | | | | | Exelon Corp. | | | 32,718,069 | | |
| | 653,800 | | | | | Pacific Gas & Electric Co. | | | 25,132,072 | | |
| | | | 84,749,581 | | |
| | | | | Electronics: 2.8% | |
| | 785,900 | | | | | Amphenol Corp. | | | 24,865,876 | | |
| | 787,900 | | | @ | | Thermo Electron Corp. | | | 32,122,683 | | |
| | | | 56,988,559 | | |
| | | | | Entertainment: 0.7% | |
| | 1,069,600 | | | | | Regal Entertainment Group | | | 14,214,984 | | |
| | | | 14,214,984 | | |
| | | | | Food: 2.6% | |
| | 459,800 | | | | | JM Smucker Co. | | | 22,373,868 | | |
| | 645,300 | | | | | Kellogg Co. | | | 30,051,621 | | |
| | | | 52,425,489 | | |
| | | | | Healthcare-Products: 3.8% | |
| | 585,510 | | | @@ | | Covidien PLC | | | 21,921,494 | | |
| | 508,060 | | | | | Johnson & Johnson | | | 28,857,808 | | |
| | 636,000 | | | @ | | St. Jude Medical, Inc. | | | 26,139,600 | | |
| | | | 76,918,902 | | |
| | | | | Healthcare-Services: 0.8% | |
| | 637,200 | | | | | Aetna, Inc. | | | 15,961,860 | | |
| | | | 15,961,860 | | |
See Accompanying Notes to Financial Statements
59
PORTFOLIO OF INVESTMENTS
ING GROWTH AND INCOME PORTFOLIO AS OF JUNE 30, 2009 (UNAUDITED) (CONTINUED)
| Shares | | | | | | Value | |
| | | | | Insurance: 2.9% | |
| | 1,253,100 | | | | | Principal Financial Group, Inc. | | $ | 23,608,404 | | |
| | 464,585 | | | | | Reinsurance Group of
America, Inc. | | | 16,218,662 | | |
| | 772,400 | | | @@ | | Willis Group Holdings Ltd. | | | 19,873,852 | | |
| | | | 59,700,918 | | |
| | | | | Internet: 2.3% | |
| | 111,874 | | | @ | | Google, Inc. - Class A | | | 47,164,959 | | |
| | | | 47,164,959 | | |
| | | | | Iron/Steel: 0.9% | |
| | 529,000 | | | L | | United States Steel Corp. | | | 18,906,460 | | |
| | | | 18,906,460 | | |
| | | | | Machinery-Diversified: 2.4% | |
| | 334,500 | | | @ | | AGCO Corp. | | | 9,723,915 | | |
| | 578,500 | | | | | Cummins, Inc. | | | 20,368,985 | | |
| | 430,300 | | | | | Roper Industries, Inc. | | | 19,496,893 | | |
| | | | 49,589,793 | | |
| | | | | Media: 2.0% | |
| | 3,006,300 | | | | | CBS Corp. - Class B | | | 20,803,596 | | |
| | 750,458 | | | @ | | Liberty Media Corp. -
Entertainment | | | 20,074,752 | | |
| | | | 40,878,348 | | |
| | | | | Mining: 2.0% | |
| | 974,600 | | | | | Alcoa, Inc. | | | 10,067,618 | | |
| | 381,900 | | | @@,L | | BHP Billiton Ltd. ADR | | | 20,901,387 | | |
| | 205,100 | | | | | Freeport-McMoRan Copper &
Gold, Inc. | | | 10,277,561 | | |
| | | | 41,246,566 | | |
| | | | | Miscellaneous Manufacturing: 3.2% | |
| | 1,453,781 | | | | | General Electric Co. | | | 17,038,313 | | |
| | 901,600 | | | | | Honeywell International, Inc. | | | 28,310,240 | | |
| | 540,600 | | | | | Illinois Tool Works, Inc. | | | 20,186,004 | | |
| | | | 65,534,557 | | |
| | | | | Oil & Gas: 11.8% | |
| | 264,500 | | | | | Apache Corp. | | | 19,083,675 | | |
| | 298,200 | | | @@ | | EnCana Corp. | | | 14,751,954 | | |
| | 1,535,315 | | | | | ExxonMobil Corp. | | | 107,333,872 | | |
| | 933,800 | | | | | Marathon Oil Corp. | | | 28,135,394 | | |
| | 852,041 | | | @@ | | Nexen, Inc. | | | 18,446,687 | | |
| | 388,300 | | | @@ | | Royal Dutch Shell
PLC ADR - Class A | | | 19,488,777 | | |
| | 292,500 | | | @ | | Transocean, Ltd. | | | 21,729,825 | | |
| | 264,200 | | | | | XTO Energy, Inc. | | | 10,076,588 | | |
| | | | 239,046,772 | | |
| | | | | Oil & Gas Services: 1.8% | |
| | 1,196,300 | | | | | BJ Services Co. | | | 16,305,569 | | |
| | 368,300 | | | | | Schlumberger Ltd. | | | 19,928,713 | | |
| | | | 36,234,282 | | |
| | | | | Packaging & Containers: 0.8% | |
| | 338,300 | | | | | Silgan Holdings, Inc. | | | 16,586,849 | | |
| | | | 16,586,849 | | |
| | | | | Pharmaceuticals: 5.4% | |
| | 751,950 | | | | | Abbott Laboratories | | | 35,371,727 | | |
| | 540,200 | | | | | McKesson Corp. | | | 23,768,800 | | |
| Shares | | | | | | Value | |
| | 2,044,100 | | | | | Pfizer, Inc. | | $ | 30,661,500 | | |
| | 422,150 | | | @@ | | Teva Pharmaceutical Industries
Ltd. ADR | | | 20,828,881 | | |
| | | | 110,630,908 | | |
| | | | | Retail: 4.0% | |
| | 705,400 | | | L | | Abercrombie & Fitch Co. | | | 17,910,106 | | |
| | 383,900 | | | | | Home Depot, Inc. | | | 9,071,557 | | |
| | 1,419,542 | | | | | Macy's, Inc. | | | 16,693,814 | | |
| | 1,174,700 | | | | | Staples, Inc. | | | 23,693,699 | | |
| | 297,500 | | | | | Wal-Mart Stores, Inc. | | | 14,410,900 | | |
| | | | 81,780,076 | | |
| | | | | Semiconductors: 3.5% | |
| | 888,100 | | | | | Applied Materials, Inc. | | | 9,742,457 | | |
| | 1,580,000 | | | | | Intel Corp. | | | 26,149,000 | | |
| | 766,000 | | | | | Linear Technology Corp. | | | 17,886,100 | | |
| | 1,905,000 | | | @@ | | Taiwan Semiconductor
Manufacturing Co.,
Ltd. ADR | | | 17,926,050 | | |
| | | | 71,703,607 | | |
| | | | | Software: 3.3% | |
| | 994,261 | | | | | Microsoft Corp. | | | 23,633,584 | | |
| | 2,016,350 | | | @ | | Oracle Corp. | | | 43,190,217 | | |
| | | | 66,823,801 | | |
| | | | | Telecommunications: 6.2% | |
| | 1,919,000 | | | | | AT&T, Inc. | | | 47,667,960 | | |
| | 2,390,700 | | | @ | | Cisco Systems, Inc. | | | 44,562,648 | | |
| | 761,150 | | | | | Qualcomm, Inc. | | | 34,403,980 | | |
| | | | 126,634,588 | | |
| | | | | Transportation: 0.8% | |
| | 527,700 | | | | | JB Hunt Transport
Services, Inc. | | | 16,110,681 | | |
| | | | 16,110,681 | | |
Total Common Stock
(Cost $1,900,617,561) | | | 2,003,790,845 | | |
Principal
Amount | | | | | | Value | |
| CORPORATE BONDS/NOTES: 0.0% | | | |
| | | | | Electric: 0.0% | |
| $ | 20,000,000 | | | ±,L | | Mirant Corp. - Escrow,
due 06/15/21 | | $ | 2 | | |
| | 10,000,000 | | | ± | | Southern Energy - Escrow,
due 07/15/49 | | | 1 | | |
Total Corporate Bonds/Notes
(Cost $—) | | | 3 | | |
Total Long-Term Investments
(Cost $1,900,617,561) | | | 2,003,790,848 | | |
| Shares | | | | | | Value | |
| SHORT-TERM INVESTMENTS: 3.1% | | | |
| | | Affiliated Mutual Fund: 1.7% | |
| | | | | | 35,788,000 | | | ING Institutional Prime
Money Market Fund - Class I | | $ | 35,788,000 | | |
Total Mutual Fund
(Cost $35,788,000) | | | 35,788,000 | | |
See Accompanying Notes to Financial Statements
60
PORTFOLIO OF INVESTMENTS
ING GROWTH AND INCOME PORTFOLIO AS OF JUNE 30, 2009 (UNAUDITED) (CONTINUED)
Principal
Amount | |
| | Value | |
| | | Securities Lending Collateralcc: 1.4% | |
| $ | 28,561,378 | | | Bank of New York Mellon Corp.
Institutional Cash Reserves | | $ | 28,476,975 | | |
Total Securities Lending Collateral
(Cost $28,561,378) | | | 28,476,975 | | |
Total Short-Term Investments
(Cost $64,349,378) | | | 64,264,975 | | |
Total Investments in
Securities
(Cost $1,964,966,939)* | | | 101.6 | % | | $ | 2,068,055,823 | | |
Other Assets and
Liabilities - Net | | | (1.6 | ) | | | (33,054,157 | ) | |
| Net Assets | | | 100.0 | % | | $ | 2,035,001,666 | | |
@ Non-income producing security
@@ Foreign Issuer
ADR American Depositary Receipt
cc Securities purchased with cash collateral for securities loaned.
± Defaulted security
L Loaned security, a portion or all of the security is on loan at June 30, 2009.
I Illiquid security
X Fair value determined by ING Funds Valuation Committee appointed by the Funds' Board of Directors/Trustees.
* Cost for federal income tax purposes is $2,044,952,116.
Net unrealized appreciation consists of:
| Gross Unrealized Appreciation | | $ | 210,260,230 | | |
| Gross Unrealized Depreciation | | | (187,156,523 | ) | |
| Net Unrealized Appreciation | | $ | 23,103,707 | | |
Fair Value Measurements*
The following is a summary of the inputs used as of June 30, 2009 in determining the Portfolio's investments at fair value for purposes of SFAS 157:
| | | Quoted Prices
in Active
Markets
for Identical
Investments
(Level 1) | | Significant
Other
Observable
Inputs
(Level 2) | | Significant
Unobservable
Inputs
(Level 3) | |
| Common Stock | |
| Advertising | | $ | 4,101 | | | $ | — | | | $ | — | | |
| Aerospace/Defense | | | 11,768,729 | | | | — | | | | — | | |
| Agriculture | | | 12,420,965 | | | | — | | | | — | | |
| Apparel | | | 22,585,571 | | | | — | | | | — | | |
| Auto Manufacturers | | | 38,608,134 | | | | — | | | | — | | |
Auto Parts &
Equipment | | | 23,168,481 | | | | — | | | | — | | |
| Banks | | | 201,890,400 | | | | — | | | | — | | |
| Beverages | | | 64,143,726 | | | | — | | | | — | | |
| Biotechnology | | | 32,572,536 | | | | — | | | | — | | |
| Computers | | | 99,994,603 | | | | — | | | | — | | |
Cosmetics/Personal
Care | | | 84,534,322 | | | | — | | | | — | | |
| Distribution/Wholesale | | | 9,228,638 | | | | — | | | | — | | |
Diversified Financial
Services | | | — | | | | 13,038,099 | | | | — | | |
| Electric | | | 84,749,581 | | | | — | | | | — | | |
| Electronics | | | 56,988,559 | | | | — | | | | — | | |
| Entertainment | | | 14,214,984 | | | | — | | | | — | | |
| Food | | | 52,425,489 | | | | — | | | | — | | |
| Healthcare - Products | | | 76,918,902 | | | | — | | | | — | | |
| Healthcare - Services | | | 15,961,860 | | | | — | | | | — | | |
| Insurance | | | 59,700,918 | | | | — | | | | — | | |
| Internet | | | 47,164,959 | | | | — | | | | — | | |
| Iron/Steel | | | 18,906,460 | | | | — | | | | — | | |
| Machinery - Diversified | | | 49,589,793 | | | | — | | | | — | | |
| Media | | | 40,878,348 | | | | — | | | | — | | |
| Mining | | | 41,246,566 | | | | — | | | | — | | |
Miscellaneous
Manufacturing | | | 65,534,557 | | | | — | | | | — | | |
| Oil & Gas | | | 239,046,772 | | | | — | | | | — | | |
| Oil & Gas Services | | | 36,234,282 | | | | — | | | | — | | |
| Packaging & Containers | | | 16,586,849 | | | | — | | | | — | | |
| Pharmaceuticals | | | 110,630,908 | | | | — | | | | — | | |
| Retail | | | 81,780,076 | | | | — | | | | — | | |
| Semiconductors | | | 71,703,607 | | | | — | | | | — | | |
| Software | | | 66,823,801 | | | | — | | | | — | | |
| Telecommunications | | | 126,634,588 | | | | — | | | | — | | |
| Transportation | | | 16,110,681 | | | | — | | | | — | | |
| Total Common Stock | | $ | 1,990,752,746 | | | $ | 13,038,099 | | | $ | — | | |
| Corporate Bonds/Notes | | | — | | | | — | | | | 3 | | |
| Short-Term Investments | | | 35,788,000 | | | | 28,476,975 | | | | — | | |
| Total | | $ | 2,026,540,746 | | | $ | 41,515,074 | | | $ | 3 | | |
Other Financial
Instruments** | | | — | | | | — | | | | — | | |
| Total | | $ | — | | | $ | — | | | $ | — | | |
See Accompanying Notes to Financial Statements
61
PORTFOLIO OF INVESTMENTS
ING GROWTH AND INCOME PORTFOLIO AS OF JUNE 30, 2009 (UNAUDITED) (CONTINUED)
The following is a reconciliation of the fair value measurements using significant unobservable inputs (Level 3) for the period ended June 30, 2009:
| | | Beginning
Balance
12/31/08 | | Net
Purchases/
(Sales) | | Accrued
Discounts/
(Premiums) | | Total
Realized
Gain/(Loss) | | Total
Unrealized
Appreciation/
(Depreciation) | | Net Transfers
In/(Out) of
Level 3 | | Ending
Balance
at 06/30/09 | |
| Corporate Bonds/Notes | | $ | — | | | $ | — | | | $ | — | | | $ | — | | | $ | 3 | | | $ | — | | | $ | 3 | | |
| Total | | $ | — | | | $ | — | | | $ | — | | | $ | — | | | $ | 3 | | | $ | — | | | $ | 3 | | |
For the period ended June 30, 2009, total change in unrealized gain (loss) on Level 3 securities still held at period end and included in the change in net assets was $3. Total unrealized gain (loss) for all securities (including Level 1 and Level 2) can be found on the accompanying Statement of Operations.
"Fair value" for purposes of SFAS 157 is different from "fair value" as used in the 1940 Act. The former generally implies market value, and can include market quotations as a source of value, and the latter refers to determinations of value in absence of available market quotations.
* See NOTE 2, "Significant Accounting Policies" in the Notes to Financial Statements for additional information.
** Other financial instruments may include open forward foreign currency contracts, futures, swaps, and written options. Forward foreign currency contracts and futures are reported at their unrealized gain/loss at period end. Swaps and written options are reported at their market value at period end.
See Accompanying Notes to Financial Statements
62
ING OPPORTUNISTIC LARGECAP PORTFOLIO OF INVESTMENTS
GROWTH PORTFOLIO AS OF JUNE 30, 2009 (UNAUDITED)
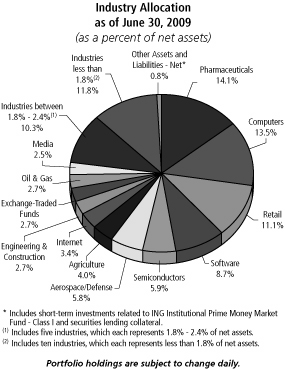
| Shares | | | | | | Value | |
| COMMON STOCK: 96.5% | | | |
| | | | | Aerospace/Defense: 5.8% | |
| | 12,000 | | | | | Goodrich Corp. | | $ | 599,640 | | |
| | 19,100 | | | | | Lockheed Martin Corp. | | | 1,540,415 | | |
| | 29,300 | | | | | Raytheon Co. | | | 1,301,799 | | |
| | 10,100 | | | | | United Technologies Corp. | | | 524,796 | | |
| | | | 3,966,650 | | |
| | | | | Agriculture: 4.0% | |
| | 82,100 | | | | | Altria Group, Inc. | | | 1,345,619 | | |
| | 32,200 | | | | | Philip Morris International, Inc. | | | 1,404,564 | | |
| | | | 2,750,183 | | |
| | | | | Banks: 2.4% | |
| | 6,000 | | | | | Goldman Sachs Group, Inc. | | | 884,640 | | |
| | 13,500 | | | | | Northern Trust Corp. | | | 724,680 | | |
| | | | 1,609,320 | | |
| | | | | Beverages: 1.1% | |
| | 13,200 | | | | | PepsiCo, Inc. | | | 725,472 | | |
| | | | 725,472 | | |
| | | | | Biotechnology: 1.6% | |
| | 10,300 | | | @ | | Biogen Idec, Inc. | | | 465,045 | | |
| | 18,500 | | | @ | | Myriad Genetics, Inc. | | | 659,525 | | |
| | | | 1,124,570 | | |
| | | | | Chemicals: 0.9% | |
| | 12,600 | | | | | Sigma-Aldrich Corp. | | | 624,456 | | |
| | | | 624,456 | | |
| Shares | | | | | | Value | |
| | | | | Computers: 13.5% | |
| | 28,800 | | | @ | | Apple, Inc. | | $ | 4,101,984 | | |
| | 80,500 | | | @ | | EMC Corp. | | | 1,054,551 | | |
| | 25,400 | | | | | Hewlett-Packard Co. | | | 981,710 | | |
| | 23,700 | | | | | International Business
Machines Corp. | | | 2,474,754 | | |
| | 23,000 | | | @ | | Western Digital Corp. | | | 609,500 | | |
| | | | 9,222,499 | | |
| | | | | Diversified Financial Services: 0.8% | |
| | 30,400 | | | @ | | TD Ameritrade Holding Corp. | | | 533,216 | | |
| | | | 533,216 | | |
| | | | | Electronics: 1.5% | |
| | 28,300 | | | @ | | Dolby Laboratories, Inc. | | | 1,055,024 | | |
| | | | 1,055,024 | | |
| | | | | Engineering & Construction: 2.7% | |
| | 36,700 | | | | | Fluor Corp. | | | 1,882,343 | | |
| | | | 1,882,343 | | |
| | | | | Food: 1.5% | |
| | 52,300 | | | @ | | Dean Foods Co. | | | 1,003,637 | | |
| | | | 1,003,637 | | |
| | | | | Healthcare-Services: 1.5% | |
| | 9,400 | | | | | Quest Diagnostics | | | 530,442 | | |
| | 21,200 | | | | | UnitedHealth Group, Inc. | | | 529,576 | | |
| | | | 1,060,018 | | |
| | | | | Household Products/Wares: 1.5% | |
| | 20,000 | | | | | Kimberly-Clark Corp. | | | 1,048,600 | | |
| | | | 1,048,600 | | |
| | | | | Internet: 3.4% | |
| | 7,800 | | | @ | | Amazon.com, Inc. | | | 652,548 | | |
| | 2,800 | | | @ | | Google, Inc. - Class A | | | 1,180,452 | | |
| | 26,100 | | | @ | | VeriSign, Inc. | | | 482,328 | | |
| | | | 2,315,328 | | |
| | | | | Machinery-Diversified: 0.9% | |
| | 8,600 | | | | | Flowserve Corp. | | | 600,366 | | |
| | | | 600,366 | | |
| | | | | Media: 2.5% | |
| | 88,600 | | | | | Comcast Corp. - Class A | | | 1,283,814 | | |
| | 18,700 | | | @,L | | DIRECTV Group, Inc. | | | 462,077 | | |
| | | | 1,745,891 | | |
| | | | | Miscellaneous Manufacturing: 1.8% | |
| | 27,900 | | | | | ITT Corp. | | | 1,241,550 | | |
| | | | 1,241,550 | | |
| | | | | Oil & Gas: 2.7% | |
| | 17,900 | | | | | Murphy Oil Corp. | | | 972,328 | | |
| | 22,800 | | | | | XTO Energy, Inc. | | | 869,592 | | |
| | | | 1,841,920 | | |
| | | | | Oil & Gas Services: 1.9% | |
| | 28,500 | | | @ | | Cameron International Corp. | | | 806,550 | | |
| | 15,600 | | | @ | | National Oilwell Varco, Inc. | | | 509,496 | | |
| | | | 1,316,046 | | |
See Accompanying Notes to Financial Statements
63
ING OPPORTUNISTIC LARGECAP PORTFOLIO OF INVESTMENTS
GROWTH PORTFOLIO AS OF JUNE 30, 2009 (UNAUDITED) (CONTINUED)
| Shares | | | | | | Value | |
| | | | | Packaging & Containers: 2.1% | |
| | 60,300 | | | @ | | Crown Holdings, Inc. | | $ | 1,455,642 | | |
| | | | 1,455,642 | | |
| | | | | Pharmaceuticals: 14.1% | |
| | 11,000 | | | | | Abbott Laboratories | | | 517,440 | | |
| | 35,600 | | | | | AmerisourceBergen Corp. | | | 631,544 | | |
| | 50,500 | | | | | Bristol-Myers Squibb Co. | | | 1,025,655 | | |
| | 20,800 | | | | | Eli Lilly & Co. | | | 720,512 | | |
| | 28,100 | | | @ | | Express Scripts, Inc. | | | 1,931,875 | | |
| | 28,100 | | | @ | | Forest Laboratories, Inc. | | | 705,591 | | |
| | 23,300 | | | @ | | Medco Health Solutions, Inc. | | | 1,062,713 | | |
| | 59,500 | | | @,L | | Mylan Laboratories | | | 776,475 | | |
| | 4,625 | | | @ | | Myriad Pharmaceuticals, Inc. | | | 21,506 | | |
| | 24,900 | | | | | Omnicare, Inc. | | | 641,424 | | |
| | 22,400 | | | | | Schering-Plough Corp. | | | 562,688 | | |
| | 31,000 | | | @ | | Watson Pharmaceuticals, Inc. | | | 1,044,390 | | |
| | | | 9,641,813 | | |
| | | | | Retail: 11.1% | |
| | 11,200 | | | | | Advance Auto Parts, Inc. | | | 464,688 | | |
| | 6,600 | | | @ | | Autozone, Inc. | | | 997,326 | | |
| | 13,900 | | | @ | | Dollar Tree, Inc. | | | 585,190 | | |
| | 19,100 | | | | | Family Dollar Stores, Inc. | | | 540,530 | | |
| | 6,000 | | | | | McDonald's Corp. | | | 344,940 | | |
| | 25,600 | | | | | Petsmart, Inc. | | | 549,376 | | |
| | 21,000 | | | | | Ross Stores, Inc. | | | 810,600 | | |
| | 63,300 | | | | | TJX Cos., Inc. | | | 1,991,418 | | |
| | 27,300 | | | | | Wal-Mart Stores, Inc. | | | 1,322,412 | | |
| | | | 7,606,480 | | |
| | | | | Savings & Loans: 0.5% | |
| | 23,400 | | | | | Hudson City Bancorp., Inc. | | | 310,986 | | |
| | | | 310,986 | | |
| | | | | Semiconductors: 5.9% | |
| | 62,000 | | | | | Altera Corp. | | | 1,009,360 | | |
| | 13,200 | | | | | Linear Technology Corp. | | | 308,220 | | |
| | 96,400 | | | @,@@ | | Marvell Technology Group Ltd. | | | 1,122,096 | | |
| | 77,500 | | | | | Xilinx, Inc. | | | 1,585,650 | | |
| | | | 4,025,326 | | |
| | | | | Software: 8.7% | |
| | 17,600 | | | @ | | BMC Software, Inc. | | | 594,704 | | |
| | 89,000 | | | | | CA, Inc. | | | 1,551,270 | | |
| | 30,600 | | | | | Microsoft Corp. | | | 727,362 | | |
| | 61,600 | | | @ | | Oracle Corp. | | | 1,319,472 | | |
| | 33,400 | | | @ | | Red Hat, Inc. | | | 672,342 | | |
| | 18,300 | | | @ | | Salesforce.com, Inc. | | | 698,511 | | |
| | 13,800 | | | @ | | VMware, Inc. | | | 376,326 | | |
| | | | 5,939,987 | | |
| | | | | Telecommunications: 2.1% | |
| | 19,400 | | | @ | | Cisco Systems, Inc. | | | 361,616 | | |
| | 11,700 | | | | | Qualcomm, Inc. | | | 528,840 | | |
| | 129,400 | | | L | | Qwest Communications
International, Inc. | | | 537,010 | | |
| | | | 1,427,466 | | |
Total Common Stock
(Cost $64,443,808) | | | 66,074,789 | | |
| Shares | | | | | | Value | |
| EXCHANGE-TRADED FUNDS: 2.7% | |
| | | | | Exchange-Traded Funds: 2.7% | |
| | 45,000 | | | | | iShares Russell 1000 Growth
Index Fund | | $ | 1,846,350 | | |
Total Exchange-Traded Funds
(Cost $1,661,560) | | | 1,846,350 | | |
Total Long-Term Investments
(Cost $66,105,368) | | | 67,921,139 | | |
| SHORT-TERM INVESTMENTS: 2.9% | |
| | | | | Affiliated Mutual Fund: 0.3% | |
| | 188,000 | | | | | ING Institutional Prime
Money Market Fund - Class I | | | 188,000 | | |
Total Mutual Fund
(Cost $188,000) | | | 188,000 | | |
Principal
Amount | | | | | | Value | |
| | | Securities Lending Collateralcc: 2.6% | |
| $ | 1,833,148 | | | Bank of New York Mellon Corp.
Institutional Cash Reserves | | $ | 1,798,322 | | |
Total Securities Lending Collateral
(Cost $1,833,148) | | | 1,798,322 | | |
Total Short-Term Investments
(Cost $2,021,148) | | | 1,986,322 | | |
Total Investments in
Securities
(Cost $68,126,516)* | | | 102.1 | % | | $ | 69,907,461 | | |
Other Assets and
Liabilities - Net | | | (2.1 | ) | | | (1,404,411 | ) | |
| Net Assets | | | 100.0 | % | | $ | 68,503,050 | | |
@ Non-income producing security
@@ Foreign Issuer
cc Securities purchased with cash collateral for securities loaned.
L Loaned security, a portion or all of the security is on loan at June 30, 2009.
* Cost for federal income tax purposes is $68,966,996.
Net unrealized appreciation consists of:
| Gross Unrealized Appreciation | | $ | 4,880,007 | | |
| Gross Unrealized Depreciation | | | (3,939,542 | ) | |
| Net Unrealized Appreciation | | $ | 940,465 | | |
See Accompanying Notes to Financial Statements
64
ING OPPORTUNISTIC LARGECAP PORTFOLIO OF INVESTMENTS
GROWTH PORTFOLIO AS OF JUNE 30, 2009 (UNAUDITED) (CONTINUED)
Fair Value Measurements*
The following is a summary of the inputs used as of June 30, 2009 in determining the Portfolio's investments at fair value for purposes of SFAS 157:
| | | Quoted Prices
in Active
Markets
for Identical
Investments
(Level 1) | | Significant
Other
Observable
Inputs
(Level 2) | | Significant
Unobservable
Inputs
(Level 3) | |
| Common Stock** | | $ | 66,074,789 | | | $ | — | | | $ | — | | |
| Exchange-Traded Funds | | | 1,846,350 | | | | — | | | | — | | |
| Short-Term Investments | | | 188,000 | | | | 1,798,322 | | | | — | | |
| Total | | $ | 68,109,139 | | | $ | 1,798,322 | | | $ | — | | |
Other Financial
Instruments*** | | | — | | | | — | | | | — | | |
| Total | | $ | — | | | $ | — | | | $ | — | | |
"Fair value" for purposes of SFAS 157 is different from "fair value" as used in the 1940 Act. The former generally implies market value, and can include market quotations as a source of value, and the latter refers to determinations of value in absence of available market quotations.
* See NOTE 2, "Significant Accounting Policies" in the Notes to Financial Statements for additional information.
** For further breakdown of Common Stock by industry type, please refer to the Portfolio of Investments.
*** Other financial instruments may include open forward foreign currency contracts, futures, swaps, and written options. Forward foreign currency contracts and futures are reported at their unrealized gain/loss at period end. Swaps and written options are reported at their market value at period end.
See Accompanying Notes to Financial Statements
65
PORTFOLIO OF INVESTMENTS
ING SMALL COMPANY PORTFOLIO AS OF JUNE 30, 2009 (UNAUDITED)
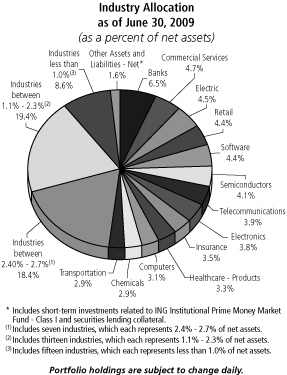
| Shares | | | | | | Value | |
| COMMON STOCK: 92.7% | | | |
| | | | | Advertising: 0.4% | |
| | 169,540 | | | @ | | inVentiv Health, Inc. | | $ | 2,293,876 | | |
| | | | 2,293,876 | | |
| | | | | Aerospace/Defense: 2.0% | |
| | 167,126 | | | @ | | Moog, Inc. | | | 4,313,522 | | |
| | 123,800 | | | @ | | Orbital Sciences Corp. | | | 1,878,046 | | |
| | 118,600 | | | @ | | Teledyne Technologies, Inc. | | | 3,884,150 | | |
| | | | 10,075,718 | | |
| | | | | Apparel: 2.7% | |
| | 215,288 | | | @ | | Carter's, Inc. | | | 5,298,238 | | |
| | 141,700 | | | @,L | | True Religion Apparel, Inc. | | | 3,159,910 | | |
| | 232,500 | | | | | Wolverine World Wide, Inc. | | | 5,128,950 | | |
| | | | 13,587,098 | | |
| | | | | Auto Parts & Equipment: 0.5% | |
| | 234,604 | | | | | Cooper Tire & Rubber Co. | | | 2,327,272 | | |
| | | | 2,327,272 | | |
| | | | | Banks: 6.5% | |
| | 288,314 | | | | | Bank Mutual Corp. | | | 2,514,098 | | |
| | 263,254 | | | | | FirstMerit Corp. | | | 4,470,053 | | |
| | 60,000 | | | | | Glacier Bancorp., Inc. | | | 886,200 | | |
| | 69,300 | | | | | IBERIABANK Corp. | | | 2,731,113 | | |
| | 290,300 | | | | | Old National Bancorp. | | | 2,850,746 | | |
| | 188,715 | | | | | PacWest Bancorp | | | 2,483,489 | | |
| | 127,918 | | | | | Prosperity Bancshares, Inc. | | | 3,815,794 | | |
| | 147,150 | | | @ | | Signature Bank | | | 3,990,708 | | |
| | 93,230 | | | | | UMB Financial Corp. | | | 3,543,672 | | |
| Shares | | | | | | Value | |
| | 59,000 | | | L | | Westamerica Bancorp. | | $ | 2,926,990 | | |
| | 423,422 | | | @ | | Western Alliance Bancorp. | | | 2,896,206 | | |
| | | | 33,109,069 | | |
| | | | | Biotechnology: 2.4% | |
| | 48,891 | | | @ | | Acorda Therapeutics, Inc. | | | 1,378,237 | | |
| | 24,200 | | | @,L | | AMAG Pharmaceuticals, Inc. | | | 1,323,014 | | |
| | 75,700 | | | @ | | Cubist Pharmaceuticals, Inc. | | | 1,387,581 | | |
| | 25,400 | | | @,L | | Dendreon Corp. | | | 631,190 | | |
| | 230,100 | | | @,L | | Human Genome Sciences, Inc. | | | 658,086 | | |
| | 131,200 | | | @,L | | InterMune, Inc. | | | 1,994,240 | | |
| | 140,785 | | | @ | | Medicines Co. | | | 1,181,186 | | |
| | 40,500 | | | @ | | OSI Pharmaceuticals, Inc. | | | 1,143,315 | | |
| | 274,874 | | | @ | | RTI Biologics, Inc. | | | 1,179,209 | | |
| | 112,000 | | | @ | | Seattle Genetics, Inc. | | | 1,088,640 | | |
| | | | 11,964,698 | | |
| | | | | Chemicals: 2.9% | |
| | 133,000 | | | | | Albemarle Corp. | | | 3,400,810 | | |
| | 76,100 | | | | | Cytec Industries, Inc. | | | 1,416,982 | | |
| | 218,500 | | | | | HB Fuller Co. | | | 4,101,245 | | |
| | 67,700 | | | | | Minerals Technologies, Inc. | | | 2,438,554 | | |
| | 244,400 | | | | | RPM International, Inc. | | | 3,431,376 | | |
| | | | 14,788,967 | | |
| | | | | Commercial Services: 4.7% | |
| | 214,737 | | | | | Arbitron, Inc. | | | 3,412,171 | | |
| | 82,500 | | | @,L | | Capella Education Co. | | | 4,945,875 | | |
| | 75,500 | | | @ | | FTI Consulting, Inc. | | | 3,829,360 | | |
| | 94,100 | | | | | Global Payments, Inc. | | | 3,524,986 | | |
| | 176,900 | | | @ | | PHH Corp. | | | 3,216,042 | | |
| | 196,248 | | | @ | | TrueBlue, Inc. | | | 1,648,483 | | |
| | 85,710 | | | | | Watson Wyatt Worldwide, Inc. | | | 3,216,696 | | |
| | | | 23,793,613 | | |
| | | | | Computers: 3.1% | |
| | 127,700 | | | @ | | CACI International, Inc. | | | 5,454,067 | | |
| | 672,769 | | | @ | | Mentor Graphics Corp. | | | 3,680,046 | | |
| | 142,300 | | | @ | | Micros Systems, Inc. | | | 3,603,036 | | |
| | 82,600 | | | @,L | | Synaptics, Inc. | | | 3,192,490 | | |
| | | | 15,929,639 | | |
| | | | | Cosmetics/Personal Care: 1.1% | |
| | 84,700 | | | @,L | | Chattem, Inc. | | | 5,768,070 | | |
| | | | 5,768,070 | | |
| | | | | Distribution/Wholesale: 2.7% | |
| | 204,100 | | | @ | | Fossil, Inc. | | | 4,914,728 | | |
| | 94,500 | | | | | Owens & Minor, Inc. | | | 4,140,990 | | |
| | 93,700 | | | L | | Watsco, Inc. | | | 4,584,741 | | |
| | | | 13,640,459 | | |
| | | | | Diversified Financial Services: 2.6% | |
| | 176,500 | | | | | Duff & Phelps Corp. | | | 3,138,170 | | |
| | 238,953 | | | @ | | Knight Capital Group, Inc. | | | 4,074,149 | | |
| | 234,269 | | | | | Sanders Morris Harris Group, Inc. | | | 1,288,480 | | |
| | 93,547 | | | @ | | Stifel Financial Corp. | | | 4,498,675 | | |
| | | | 12,999,474 | | |
| | | | | Electric: 4.5% | |
| | 133,500 | | | | | Black Hills Corp. | | | 3,069,165 | | |
| | 288,600 | | | | | Cleco Corp. | | | 6,470,412 | | |
| | 221,600 | | | @ | | El Paso Electric Co. | | | 3,093,536 | | |
| | 101,118 | | | | | Idacorp, Inc. | | | 2,643,225 | | |
| | 71,000 | | | | | NorthWestern Corp. | | | 1,615,960 | | |
| | 311,268 | | | | | Portland General Electric Co. | | | 6,063,502 | | |
| | | | 22,955,800 | | |
See Accompanying Notes to Financial Statements
66
PORTFOLIO OF INVESTMENTS
ING SMALL COMPANY PORTFOLIO AS OF JUNE 30, 2009 (UNAUDITED) (CONTINUED)
| Shares | | | | | | Value | |
| | | | | | | Electrical Components &
Equipment: 0.6% | | | | | |
| | 351,561 | | | @ | | Advanced Energy Industries, Inc. | | $ | 3,160,532 | | |
| | | | 3,160,532 | | |
| | | | | Electronics: 3.8% | |
| | 113,600 | | | | | Brady Corp. | | | 2,853,632 | | |
| | 203,900 | | | @ | | FEI Co. | | | 4,669,310 | | |
| | 136,554 | | | @ | | Flir Systems, Inc. | | | 3,080,658 | | |
| | 118,707 | | | @ | | Varian, Inc. | | | 4,680,617 | | |
| | 183,000 | | | | | Watts Water Technologies, Inc. | | | 3,941,820 | | |
| | | | 19,226,037 | | |
| | | | | Entertainment: 1.1% | |
| | 195,700 | | | @ | | Bally Technologies, Inc. | | | 5,855,344 | | |
| | | | 5,855,344 | | |
| | | | | Environmental Control: 1.3% | |
| | 58,139 | | | @ | | Clean Harbors, Inc. | | | 3,138,925 | | |
| | 124,899 | | | @ | | Waste Connections, Inc. | | | 3,236,133 | | |
| | | | 6,375,058 | | |
| | | | | Food: 1.5% | |
| | 67,600 | | | @,L | | American Italian Pasta Co. | | | 1,969,864 | | |
| | 108,669 | | | | | Flowers Foods, Inc. | | | 2,373,331 | | |
| | 255,700 | | | | | Spartan Stores, Inc. | | | 3,173,237 | | |
| | | | 7,516,432 | | |
| | | | | Gas: 0.4% | |
| | 65,400 | | | | | WGL Holdings, Inc. | | | 2,094,108 | | |
| | | | 2,094,108 | | |
| | | | | Hand/Machine Tools: 0.9% | |
| | 113,400 | | | | | Regal-Beloit Corp. | | | 4,504,248 | | |
| | | | 4,504,248 | | |
| | | | | Healthcare-Products: 3.3% | |
| | 78,800 | | | @ | | Gen-Probe, Inc. | | | 3,386,824 | | |
| | 101,575 | | | @ | | Greatbatch, Inc. | | | 2,296,611 | | |
| | 62,800 | | | @ | | Haemonetics Corp. | | | 3,579,600 | | |
| | 94,900 | | | @ | | Immucor, Inc. | | | 1,305,824 | | |
| | 198,252 | | | | | Meridian Bioscience, Inc. | | | 4,476,530 | | |
| | 184,624 | | | @ | | Micrus Endovascular Corp. | | | 1,669,001 | | |
| | | | 16,714,390 | | |
| | | | | Healthcare-Services: 2.3% | |
| | 100,400 | | | @ | | AMERIGROUP Corp. | | | 2,695,740 | | |
| | 122,933 | | | @ | | Healthsouth Corp. | | | 1,775,153 | | |
| | 172,600 | | | @ | | Psychiatric Solutions, Inc. | | | 3,924,924 | | |
| | 67,406 | | | | | Universal Health Services, Inc. | | | 3,292,783 | | |
| | | | 11,688,600 | | |
| | | | | Home Builders: 0.5% | |
| | 163,800 | | | | | Ryland Group, Inc. | | | 2,745,288 | | |
| | | | 2,745,288 | | |
| | | | | Home Furnishings: 0.2% | |
| | 122,400 | | | | | Ethan Allen Interiors, Inc. | | | 1,268,064 | | |
| | | | 1,268,064 | | |
| | | | | Housewares: 0.4% | |
| | 75,300 | | | L | | Toro Co. | | | 2,251,470 | | |
| | | | 2,251,470 | | |
| Shares | | | | | | Value | |
| | | | | Insurance: 3.5% | |
| | 107,332 | | | @,@@ | | Argo Group International
Holdings Ltd. | | $ | 3,028,909 | | |
| | 121,000 | | | | | Delphi Financial Group | | | 2,351,030 | | |
| | 73,300 | | | @ | | Navigators Group, Inc. | | | 3,256,719 | | |
| | 171,500 | | | @@ | | Platinum Underwriters
Holdings Ltd. | | | 4,903,185 | | |
| | 96,918 | | | @ | | ProAssurance Corp. | | | 4,478,581 | | |
| | | | 18,018,424 | | |
| | | | | Internet: 2.6% | |
| | 339,597 | | | @ | | Avocent Corp. | | | 4,740,774 | | |
| | 251,824 | | | @ | | Blue Coat Systems, Inc. | | | 4,165,169 | | |
| | 149,548 | | | @ | | j2 Global Communications, Inc. | | | 3,373,803 | | |
| | 101,800 | | | @ | | Valueclick, Inc. | | | 1,070,936 | | |
| | | | 13,350,682 | | |
| | | | | Investment Companies: 0.6% | |
| | 498,913 | | | L | | Apollo Investment Corp. | | | 2,993,478 | | |
| | | | 2,993,478 | | |
| | | | | Machinery-Diversified: 2.7% | |
| | 78,800 | | | @ | | AGCO Corp. | | | 2,290,716 | | |
| | 124,927 | | | @ | | Gardner Denver, Inc. | | | 3,144,413 | | |
| | 284,000 | | | @ | | Intermec, Inc. | | | 3,663,600 | | |
| | 62,968 | | | | | Nordson Corp. | | | 2,434,343 | | |
| | 61,421 | | | | | Wabtec Corp. | | | 1,975,914 | | |
| | | | 13,508,986 | | |
| | | | | Metal Fabricate/Hardware: 0.8% | |
| | 238,600 | | | | | Commercial Metals Co. | | | 3,824,758 | | |
| | | | 3,824,758 | | |
| | | | | Miscellaneous Manufacturing: 1.2% | |
| | 228,600 | | | | | Actuant Corp. | | | 2,788,920 | | |
| | 270,590 | | | | | Barnes Group, Inc. | | | 3,217,315 | | |
| | | | 6,006,235 | | |
| | | | | Oil & Gas: 2.7% | |
| | 98,700 | | | @ | | Bill Barrett Corp. | | | 2,710,302 | | |
| | 171,228 | | | @,L | | Carrizo Oil & Gas, Inc. | | | 2,936,560 | | |
| | 198,400 | | | | | Frontier Oil Corp. | | | 2,601,024 | | |
| | 342,600 | | | @ | | McMoRan Exploration Co. | | | 2,041,896 | | |
| | 127,300 | | | @ | | Unit Corp. | | | 3,509,661 | | |
| | | | 13,799,443 | | |
| | | | | Oil & Gas Services: 1.8% | |
| | 48,665 | | | L | | Core Laboratories NV | | | 4,241,155 | | |
| | 96,100 | | | @ | | Dril-Quip, Inc. | | | 3,661,410 | | |
| | 166,824 | | | @ | | Tetra Technologies, Inc. | | | 1,327,919 | | |
| | | | 9,230,484 | | |
| | | | | Packaging & Containers: 1.1% | |
| | 112,400 | | | | | Silgan Holdings, Inc. | | | 5,510,972 | | |
| | | | 5,510,972 | | |
| | | | | Pharmaceuticals: 1.8% | |
| | 327,600 | | | @ | | Akorn, Inc. | | | 393,120 | | |
| | 157,094 | | | @ | | Nektar Therapeutics | | | 1,017,969 | | |
| | 129,566 | | | | | Omnicare, Inc. | | | 3,337,620 | | |
| | 120,600 | | | @ | | Onyx Pharmaceuticals, Inc. | | | 3,408,156 | | |
| | 71,900 | | | @,L | | Savient Pharmaceuticals, Inc. | | | 996,534 | | |
| | | | 9,153,399 | | |
See Accompanying Notes to Financial Statements
67
PORTFOLIO OF INVESTMENTS
ING SMALL COMPANY PORTFOLIO AS OF JUNE 30, 2009 (UNAUDITED) (CONTINUED)
| Shares | | | | | | Value | |
| | | | | Retail: 4.4% | |
| | 169,700 | | | | | Casey's General Stores, Inc. | | $ | 4,359,593 | | |
| | 205,400 | | | @,L | | Dress Barn, Inc. | | | 2,937,220 | | |
| | 218,437 | | | @ | | Jack in the Box, Inc. | | | 4,903,911 | | |
| | 162,213 | | | @ | | Jo-Ann Stores, Inc. | | | 3,352,943 | | |
| | 190,012 | | | @ | | Papa John's International, Inc. | | | 4,710,397 | | |
| | 670,700 | | | @ | | Wet Seal, Inc. | | | 2,059,049 | | |
| | | | 22,323,113 | | |
| | | | | Savings & Loans: 1.8% | |
| | 324,168 | | | | | NewAlliance Bancshares, Inc. | | | 3,727,932 | | |
| | 276,199 | | | | | Provident Financial Services, Inc. | | | 2,513,411 | | |
| | 294,141 | | | | | Westfield Financial, Inc. | | | 2,664,917 | | |
| | | | 8,906,260 | | |
| | | | | Semiconductors: 4.1% | |
| | 115,900 | | | @,L | | Emulex Corp. | | | 1,133,502 | | |
| | 573,000 | | | @ | | Entegris, Inc. | | | 1,558,560 | | |
| | 213,800 | | | @ | | Formfactor, Inc. | | | 3,685,912 | | |
| | 192,400 | | | | | Micrel, Inc. | | | 1,408,368 | | |
| | 215,600 | | | @ | | MKS Instruments, Inc. | | | 2,843,764 | | |
| | 421,700 | | | @ | | ON Semiconductor Corp. | | | 2,892,862 | | |
| | 114,400 | | | | | Power Integrations, Inc. | | | 2,721,576 | | |
| | 367,837 | | | @,@@ | | Verigy Ltd. | | | 4,476,576 | | |
| | | | 20,721,120 | | |
| | | | | Software: 4.4% | |
| | 149,692 | | | @ | | Ansys, Inc. | | | 4,664,403 | | |
| | 58,300 | | | @ | | Concur Technologies, Inc. | | | 1,811,964 | | |
| | 82,900 | | | @ | | Parametric Technology Corp. | | | 969,101 | | |
| | 176,700 | | | @ | | Progress Software Corp. | | | 3,740,739 | | |
| | 321,900 | | | @ | | Quest Software, Inc. | | | 4,487,286 | | |
| | 224,200 | | | @ | | Solera Holdings, Inc. | | | 5,694,680 | | |
| | 172,850 | | | @ | | THQ, Inc. | | | 1,237,606 | | |
| | | | 22,605,779 | | |
| | | | | Telecommunications: 3.9% | |
| | 381,160 | | | | | Alaska Communications Systems
Group, Inc. | | | 2,790,091 | | |
| | 166,200 | | | | | NTELOS Holdings Corp. | | | 3,061,404 | | |
| | 276,037 | | | @ | | Polycom, Inc. | | | 5,595,270 | | |
| | 247,828 | | | @ | | RCN Corp. | | | 1,479,533 | | |
| | 152,200 | | | @ | | SBA Communications Corp. | | | 3,734,988 | | |
| | 176,200 | | | @ | | Tekelec | | | 2,965,446 | | |
| | | | 19,626,732 | | |
| | | | | Transportation: 2.9% | |
| | 140,811 | | | @ | | Atlas Air Worldwide
Holdings, Inc. | | | 3,265,407 | | |
| | 257,300 | | | | | Heartland Express, Inc. | | | 3,787,456 | | |
| | 158,481 | | | @ | | HUB Group, Inc. | | | 3,271,048 | | |
| | 99,400 | | | @ | | Kirby Corp. | | | 3,159,926 | | |
| | 38,400 | | | @ | | Old Dominion Freight Line | | | 1,289,088 | | |
| | | | 14,772,925 | | |
Total Common Stock
(Cost $479,151,713) | | | 470,986,114 | | |
| REAL ESTATE INVESTMENT TRUSTS: 4.4% | | | |
| | | | | Apartments: 0.8% | |
| | 182,800 | | | | | American Campus
Communities, Inc. | | | 4,054,504 | | |
| | | | 4,054,504 | | |
| Shares | | | | | | Value | |
| | | | | Hotels: 0.4% | |
| | 335,100 | | | @ | | DiamondRock Hospitality Co. | | $ | 2,097,726 | | |
| | | | 2,097,726 | | |
| | | | | Mortgage: 1.1% | |
| | 72,281 | | | | | Hatteras Financial Corp. | | | 2,066,514 | | |
| | 252,269 | | | | | Redwood Trust, Inc. | | | 3,723,490 | | |
| | | | 5,790,004 | | |
| | | | | Office Property: 0.7% | |
| | 163,700 | | | | | Highwoods Properties, Inc. | | | 3,661,969 | | |
| | | | 3,661,969 | | |
| | | | | Shopping Centers: 0.6% | |
| | 242,156 | | | | | Acadia Realty Trust | | | 3,160,136 | | |
| | | | 3,160,136 | | |
| | | | | Single Tenant: 0.8% | |
| | 220,272 | | | L | | National Retail Properties, Inc. | | | 3,821,719 | | |
| | | | 3,821,719 | | |
Total Real Estate
Investment Trusts
(Cost $20,954,084) | | | 22,586,058 | | |
| EXCHANGE-TRADED FUNDS: 1.3% | | | |
| | | | | Exchange-Traded Funds: 1.3% | |
| | 19,876 | | | L | | iShares Russell 2000 Index Fund | | | 1,012,881 | | |
| | 124,345 | | | L | | iShares Russell 2000 Value
Index Fund | | | 5,785,773 | | |
Total Exchange-Traded Funds
(Cost $6,431,974) | | | 6,798,654 | | |
Total Long-Term Investments
(Cost $506,537,771) | | | 500,370,826 | | |
| SHORT-TERM INVESTMENTS: 6.7% | | | |
| | | Affiliated Mutual Fund: 0.5% | |
| | 2,651,000 | | | ING Institutional Prime
Money Market Fund - Class I | | | | | 2,651,000 | | |
Total Mutual Fund
(Cost $2,651,000) | | | 2,651,000 | | |
Principal
Amount | | | | Value | |
| | | | | Securities Lending Collateralcc: 6.2% | |
| $ | 31,619,673 | | | Bank of New York Mellon Corp.
Institutional Cash Reserves | | $ | 31,278,815 | | |
Total Securities Lending Collateral
(Cost $31,619,673) | | | 31,278,815 | | |
Total Short-Term Investments
(Cost $34,270,673) | | | 33,929,815 | | |
Total Investments in
Securities
(Cost $540,808,444)* | | | 105.1 | % | | $ | 534,300,641 | | |
Other Assets and
Liabilities - Net | | | (5.1 | ) | | | (26,007,987 | ) | |
| Net Assets | | | 100.0 | % | | $ | 508,292,654 | | |
@ Non-income producing security
@@ Foreign Issuer
See Accompanying Notes to Financial Statements
68
PORTFOLIO OF INVESTMENTS
ING SMALL COMPANY PORTFOLIO AS OF JUNE 30, 2009 (UNAUDITED) (CONTINUED)
cc Securities purchased with cash collateral for securities loaned.
L Loaned security, a portion or all of the security is on loan at June 30, 2009.
* Cost for federal income tax purposes is $570,074,628.
Net unrealized depreciation consists of:
| Gross Unrealized Appreciation | | $ | 35,997,797 | | |
| Gross Unrealized Depreciation | | | (71,771,784 | ) | |
| Net Unrealized Depreciation | | $ | (35,773,987 | ) | |
| Fair Value Measurements* | |
The following is a summary of the inputs used as of June 30, 2009 in determining the Portfolio's investments at fair value for purposes of SFAS 157:
| | | Quoted Prices
in Active
Markets
for Identical
Investments
(Level 1) | | Significant
Other
Observable
Inputs
(Level 2) | | Significant
Unobservable
Inputs
(Level 3) | |
| Common Stock** | | $ | 470,986,114 | | | $ | — | | | $ | — | | |
Real Estate
Investment Trusts | | | 22,586,058 | | | | — | | | | — | | |
Exchange-Traded
Funds | | | 6,798,654 | | | | — | | | | — | | |
Short-Term
Investments | | | 2,651,000 | | | | 31,278,815 | | | | — | | |
| Total | | $ | 503,021,826 | | | $ | 31,278,815 | | | $ | — | | |
Other Financial
Instruments*** | | | — | | | | — | | | | — | | |
| Total | | $ | — | | | $ | — | | | $ | — | | |
"Fair value" for purposes of SFAS 157 is different from "fair value" as used in the 1940 Act. The former generally implies market value, and can include market quotations as a source of value, and the latter refers to determinations of value in absence of available market quotations.
* See NOTE 2, "Significant Accounting Policies" in the Notes to Financial Statements for additional information.
** For further breakdown of Common Stock by industry type, please refer to the Portfolio of Investments.
*** Other financial instruments may include open forward foreign currency contracts, futures, swaps, and written options. Forward foreign currency contracts and futures are reported at their unrealized gain/loss at period end. Swaps and written options are reported at their market value at period end.
See Accompanying Notes to Financial Statements
69
ING OPPORTUNISTIC PORTFOLIO OF INVESTMENTS
LARGECAP PORTFOLIO AS OF JUNE 30, 2009 (UNAUDITED)
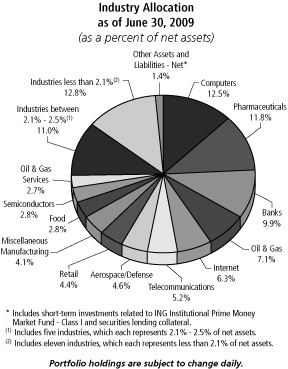
| Shares | | | | | | Value | |
| COMMON STOCK: 95.8% | | | |
| | | | | Aerospace/Defense: 4.6% | |
| | 14,200 | | | | | Lockheed Martin Corp. | | $ | 1,145,230 | | |
| | 15,200 | | | | | Northrop Grumman Corp. | | | 694,336 | | |
| | 18,900 | | | | | Raytheon Co. | | | 839,727 | | |
| | 15,800 | | | | | United Technologies Corp. | | | 820,968 | | |
| | | | 3,500,261 | | |
| | | | | Agriculture: 1.6% | |
| | 30,800 | | | | | Reynolds American, Inc. | | | 1,189,496 | | |
| | | | 1,189,496 | | |
| | | | | Banks: 9.9% | |
| | 113,500 | | | | | Bank of America Corp. | | | 1,498,200 | | |
| | 9,900 | | | | | Goldman Sachs Group, Inc. | | | 1,459,656 | | |
| | 311 | | | @@ | | HSBC Holdings PLC ADR | | | 12,990 | | |
| | 40,000 | | | | | JPMorgan Chase & Co. | | | 1,364,400 | | |
| | 10,900 | | | | | Northern Trust Corp. | | | 585,112 | | |
| | 20,700 | | | | | PNC Financial Services Group, Inc. | | | 803,367 | | |
| | 74,500 | | | | | Wells Fargo & Co. | | | 1,807,370 | | |
| | | | 7,531,095 | | |
| | | | | Biotechnology: 1.5% | |
| | 25,300 | | | @ | | Biogen Idec, Inc. | | | 1,142,295 | | |
| | | | 1,142,295 | | |
| | | | | Computers: 12.5% | |
| | 27,800 | | | @@ | | Accenture Ltd. | | | 930,188 | | |
| | 13,994 | | | @ | | Apple, Inc. | | | 1,993,165 | | |
| | 25,600 | | | @ | | Computer Sciences Corp. | | | 1,134,080 | | |
| | 79,700 | | | @ | | EMC Corp. | | | 1,044,070 | | |
| Shares | | | | | | Value | |
| | 47,200 | | | | | Hewlett-Packard Co. | | $ | 1,824,280 | | |
| | 24,600 | | | | | International Business
Machines Corp. | | | 2,568,732 | | |
| | | | 9,494,515 | | |
| | | | | Diversified Financial Services: 2.5% | |
| | 42,500 | | | | | American Express Co. | | | 987,700 | | |
| | 52,200 | | | | | Charles Schwab Corp. | | | 915,588 | | |
| | | | 1,903,288 | | |
| | | | | Electric: 1.6% | |
| | 15,700 | | | | | Exelon Corp. | | | 803,997 | | |
| | 11,900 | | | | | Public Service Enterprise
Group, Inc. | | | 388,297 | | |
| | | | 1,192,294 | | |
| | | | | Food: 3.4% | |
| | 49,603 | | | @ | | Dean Foods Co. | | | 951,882 | | |
| | 30,500 | | | | | Kraft Foods, Inc. | | | 772,870 | | |
| | 86,500 | | | | | Sara Lee Corp. | | | 844,240 | | |
| | | | 2,568,992 | | |
| | | | | Healthcare-Services: 1.3% | |
| | 41,000 | | | | | UnitedHealth Group, Inc. | | | 1,024,180 | | |
| | | | 1,024,180 | | |
| | | | | Home Builders: 0.9% | |
| | 74,200 | | | | | D.R. Horton, Inc. | | | 694,512 | | |
| | | | 694,512 | | |
| | | | | Household Products/Wares: 1.0% | |
| | 14,900 | | | | | Kimberly-Clark Corp. | | | 781,207 | | |
| | | | 781,207 | | |
| | | | | Insurance: 2.1% | |
| | 21,800 | | | @@ | | ACE Ltd. | | | 964,214 | | |
| | 40,300 | | | | | UnumProvident Corp. | | | 639,158 | | |
| | | | 1,603,372 | | |
| | | | | Internet: 6.3% | |
| | 14,300 | | | @ | | Amazon.com, Inc. | | | 1,196,338 | | |
| | 78,900 | | | @ | | eBay, Inc. | | | 1,351,557 | | |
| | 2,461 | | | @ | | Google, Inc. - Class A | | | 1,037,533 | | |
| | 78,500 | | | @ | | Symantec Corp. | | | 1,221,460 | | |
| | | | 4,806,888 | | |
| | | | | Iron/Steel: 0.7% | |
| | 13,300 | | | | | Reliance Steel & Aluminum Co. | | | 510,587 | | |
| | | | 510,587 | | |
| | | | | Media: 2.1% | |
| | 111,600 | | | | | Comcast Corp. - Class A | | | 1,617,084 | | |
| | | | 1,617,084 | | |
| | | | | Metal Fabricate/Hardware: 1.0% | |
| | 10,100 | | | | | Precision Castparts Corp. | | | 737,603 | | |
| | | | 737,603 | | |
| | | | | Miscellaneous Manufacturing: 4.1% | |
| | 15,100 | | | | | Cooper Industries Ltd. | | | 468,855 | | |
| | 33,600 | | | | | Dover Corp. | | | 1,111,824 | | |
| | 130,300 | | | | | General Electric Co. | | | 1,527,116 | | |
| | | | 3,107,795 | | |
See Accompanying Notes to Financial Statements
70
ING OPPORTUNISTIC PORTFOLIO OF INVESTMENTS
LARGECAP PORTFOLIO AS OF JUNE 30, 2009 (UNAUDITED) (CONTINUED)
| Shares | | | | | | Value | |
| | | | | Office/Business Equipment: 1.0% | |
| | 33,200 | | | | | Pitney Bowes, Inc. | | $ | 728,076 | | |
| | | | 728,076 | | |
| | | | | Oil & Gas: 7.1% | |
| | 7,000 | | | @@,L | | China Petroleum &
Chemical Corp. ADR | | | 531,020 | | |
| | 26,800 | | | | | ExxonMobil Corp. | | | 1,873,588 | | |
| | 25,300 | | | | | Murphy Oil Corp. | | | 1,374,296 | | |
| | 27,700 | | | @@ | | Nexen, Inc. | | | 599,705 | | |
| | 34,400 | | | | | Noble Corp. | | | 1,040,600 | | |
| | | | 5,419,209 | | |
| | | | | Oil & Gas Services: 2.7% | |
| | 33,600 | | | @ | | Cameron International Corp. | | | 950,880 | | |
| | 33,800 | | | @ | | National Oilwell Varco, Inc. | | | 1,103,908 | | |
| | | | 2,054,788 | | |
| | | | | Packaging & Containers: 2.2% | |
| | 31,300 | | | @ | | Crown Holdings, Inc. | | | 755,582 | | |
| | 44,300 | | | @ | | Pactiv Corp. | | | 961,310 | | |
| | | | 1,716,892 | | |
| | | | | Pharmaceuticals: 11.8% | |
| | 41,600 | | | | | AmerisourceBergen Corp. | | | 737,984 | | |
| | 24,400 | | | | | Eli Lilly & Co. | | | 845,216 | | |
| | 15,000 | | | @ | | Express Scripts, Inc. | | | 1,031,250 | | |
| | 51,800 | | | @ | | Forest Laboratories, Inc. | | | 1,300,698 | | |
| | 29,400 | | | @ | | Medco Health Solutions, Inc. | | | 1,340,934 | | |
| | 26,600 | | | | | Omnicare, Inc. | | | 685,216 | | |
| | 150,900 | | | | | Pfizer, Inc. | | | 2,263,500 | | |
| | 22,400 | | | @ | | Watson Pharmaceuticals, Inc. | | | 754,656 | | |
| | | | 8,959,454 | | |
| | | | | Retail: 4.4% | |
| | 22,300 | | | | | Family Dollar Stores, Inc. | | | 631,090 | | |
| | 45,800 | | | | | Home Depot, Inc. | | | 1,082,254 | | |
| | 18,600 | | | | | Ross Stores, Inc. | | | 717,960 | | |
| | 13,900 | | | @,L | | Sears Holding Corp. | | | 924,628 | | |
| | | | 3,355,932 | | |
| | | | | Savings & Loans: 1.5% | |
| | 85,700 | | | | | Hudson City Bancorp., Inc. | | | 1,138,953 | | |
| | | | 1,138,953 | | |
| | | | | Semiconductors: 2.8% | |
| | 69,900 | | | @,@@ | | Marvell Technology Group Ltd. | | | 813,636 | | |
| | 25,500 | | | @@ | | Taiwan Semiconductor
Manufacturing Co., Ltd. ADR | | | 239,955 | | |
| | 52,000 | | | | | Texas Instruments, Inc. | | | 1,107,600 | | |
| | | | 2,161,191 | | |
| | | | | Telecommunications: 5.2% | |
| | 38,500 | | | @,@@ | | Amdocs Ltd. | | | 825,825 | | |
| | 110,300 | | | @ | | Cisco Systems, Inc. | | | 2,055,992 | | |
| | 223,300 | | | @ | | Sprint Nextel Corp. | | | 1,074,073 | | |
| | | | 3,955,890 | | |
Total Common Stock
(Cost $72,360,860) | | | 72,895,849 | | |
| Shares | | | | | | Value | |
| REAL ESTATE INVESTMENT TRUSTS: 0.7% | | | |
| | | | | Regional Malls: 0.7% | |
| | 11,000 | | | L | | Simon Property Group, Inc. | | $ | 565,730 | | |
Total Real Estate Investment Trusts
(Cost $594,268) | | | 565,730 | | |
| EXCHANGE-TRADED FUNDS: 2.1% | | | |
| | | | | Exchange-Traded Funds: 2.1% | |
| | 41,300 | | | | | Consumer Staples Select
Sector SPDR Fund | | | 949,487 | | |
| | 6,700 | | | | | SPDR Trust Series 1 | | | 615,864 | | |
Total Exchange-Traded Funds
(Cost $1,553,423) | | | 1,565,351 | | |
Total Long-Term Investments
(Cost $74,508,551) | | | 75,026,930 | | |
| SHORT-TERM INVESTMENTS: 2.3% | | | |
| | | | | Affiliated Mutual Fund: 0.8% | |
| | 634,000 | | | | | ING Institutional Prime
Money Market Fund - Class I | | | 634,000 | | |
Total Mutual Fund
(Cost $634,000) | | | 634,000 | | |
Principal
Amount | | | | | | Value | |
| | | | | Securities Lending Collateralcc: 1.5% | |
| $ | 1,148,804 | | | | | Bank of New York Mellon Corp.
Institutional Cash Reserves | | $ | 1,103,446 | | |
Total Securities Lending Collateral
(Cost $1,148,804) | | | | 1,103,446 | |
Total Short-Term Investments
(Cost $1,782,804) | | | | 1,737,446 | |
Total Investments in
Securities
(Cost $76,291,355)* | | | 100.9 | % | | $ | 76,764,376 | | |
Other Assets and
Liabilities - Net | | | (0.9 | ) | | | (674,466 | ) | |
| Net Assets | | | 100.0 | % | | $ | 76,089,910 | | |
@ Non-income producing security
@@ Foreign Issuer
ADR American Depositary Receipt
cc Securities purchased with cash collateral for securities loaned.
L Loaned security, a portion or all of the security is on loan at June 30, 2009.
* Cost for federal income tax purposes is $79,633,865.
Net unrealized depreciation consists of:
| Gross Unrealized Appreciation | | $ | 3,145,611 | | |
| Gross Unrealized Depreciation | | | (6,015,100 | ) | |
| Net Unrealized Depreciation | | $ | (2,869,489 | ) | |
See Accompanying Notes to Financial Statements
71
ING OPPORTUNISTIC PORTFOLIO OF INVESTMENTS
LARGECAP PORTFOLIO AS OF JUNE 30, 2009 (UNAUDITED) (CONTINUED)
The following is a summary of the inputs used as of June 30, 2009 in determining the Portfolio's investments at fair value for purposes of SFAS 157:
| | | Quoted Prices
in Active
Markets
for Identical
Investments
(Level 1) | | Significant
Other
Observable
Inputs
(Level 2) | | Significant
Unobservable
Inputs
(Level 3) | |
| Common Stock** | | $ | 72,895,849 | | | $ | — | | | $ | — | | |
Real Estate
Investment Trusts | | | 565,730 | | | | — | | | | — | | |
Exchange-Traded
Funds | | | 1,565,351 | | | | — | | | | — | | |
Short-Term
Investments | | | 634,000 | | | | 1,103,446 | | | | — | | |
| Total | | $ | 75,660,930 | | | $ | 1,103,446 | | | $ | — | | |
Other Financial
Instruments*** | | | — | | | | — | | | | — | | |
| Total | | $ | — | | | $ | — | | | $ | — | | |
"Fair value" for purposes of SFAS 157 is different from "fair value" as used in the 1940 Act. The former generally implies market value, and can include market quotations as a source of value, and the latter refers to determinations of value in absence of available market quotations.
* See NOTE 2, "Significant Accounting Policies" in the Notes to Financial Statements for additional information.
** For further breakdown of Common Stock by industry type, please refer to the Portfolio of Investments.
*** Other financial instruments may include open forward foreign currency contracts, futures, swaps, and written options. Forward foreign currency contracts and futures are reported at their unrealized gain/loss at period end. Swaps and written options are reported at their market value at period end.
See Accompanying Notes to Financial Statements
72
PORTFOLIO OF INVESTMENTS
ING INTERMEDIATE BOND PORTFOLIO AS OF JUNE 30, 2009 (UNAUDITED)
| U.S. Government Agency Obligations | | | 38.5 | % | |
| Corporate Bonds/Notes | | | 30.4 | % | |
| U.S. Treasury Obligations | | | 26.0 | % | |
| Collateralized Mortgage Obligations | | | 11.6 | % | |
| Other Bonds | | | 1.9 | % | |
| Asset-Backed Securities | | | 1.7 | % | |
| Preferred Stock | | | 0.2 | % | |
| Other Assets and Liabilities — Net* | | | (10.3 | )% | |
| Net Assets | | | 100.0 | % | |
Investment Type Allocation
as of June 30, 2009
(as a percent of net assets)
* Includes short-term investments related to commercial paper, ING Institutional Prime Money Market Fund — Class I, securities lending collateral and U.S. Treasury Bill.
Portfolio holdings are subject to change daily.
Principal
Amount | | | | | | Value | |
| CORPORATE BONDS/NOTES: 30.4% | | | |
| | | | | Agriculture: 0.5% | |
| $ | 8,994,000 | | | | | Altria Group, Inc.,
9.700%, due 11/10/18 | | $ | 10,327,477 | | |
| | 620,000 | | | | | Philip Morris
International, Inc.,
5.650%, due 05/16/18 | | | 651,013 | | |
| | 2,798,000 | | | | | Philip Morris
International, Inc.,
6.875%, due 03/17/14 | | | 3,160,243 | | |
| | | | 14,138,733 | | |
| | | | | Banks: 7.4% | |
| | 7,348,000 | | | | | American Express Bank FSB,
5.500%, due 04/16/13 | | | 7,217,162 | | |
| | 8,714,000 | | | C | | Bank of America Corp.,
8.000%, due 12/29/49 | | | 7,288,154 | | |
| | 3,090,000 | | | @@,C | | Bank of Ireland, 0.875%,
due 12/29/49 | | | 861,183 | | |
| | 2,120,000 | | | @@,C | | Barclays Bank PLC,
1.875%, due 08/29/49 | | | 879,800 | | |
| | 16,627,000 | | | @@,# | | Barclays Bank PLC,
6.050%, due 12/04/17 | | | 14,441,148 | | |
| | 2,600,000 | | | @@,C | | BNP Paribas, 1.928%,
due 09/29/49 | | | 1,092,000 | | |
| | 2,140,000 | | | | | Capital One Financial Corp.,
7.375%, due 05/23/14 | | | 2,208,970 | | |
| | 13,279,000 | | | | | Citigroup, Inc., 5.000%,
due 09/15/14 | | | 11,144,228 | | |
| | 8,999,000 | | | | | Citigroup, Inc., 5.250%,
due 02/27/12 | | | 8,792,851 | | |
| | 1,020,000 | | | | | Citigroup, Inc., 8.500%,
due 05/22/19 | | | 1,039,306 | | |
| | 3,280,000 | | | #,C | | Dresdner Funding Trust I,
8.151%, due 06/30/31 | | | 1,598,334 | | |
Principal
Amount | | | | | | Value | |
| $ | 13,925,000 | | | | | Fifth Third Bancorp.,
8.250%, due 03/01/38 | | $ | 10,683,636 | | |
| | 10,773,000 | | | | | First Tennessee Bank NA,
5.650%, due 04/01/16 | | | 8,083,122 | | |
| | 3,650,000 | | | | | Goldman Sachs Group, Inc.,
5.250%, due 04/01/13 | | | 3,735,899 | | |
| | 4,974,000 | | | | | Goldman Sachs Group, Inc.,
5.450%, due 11/01/12 | | | 5,146,956 | | |
| | 6,202,000 | | | | | Goldman Sachs Group, Inc.,
5.500%, due 11/15/14 | | | 6,223,329 | | |
| | 8,651,000 | | | | | Goldman Sachs Group, Inc.,
6.000%, due 05/01/14 | | | 9,038,115 | | |
| | 7,580,000 | | | @@,C | | HSBC Bank PLC, 1.288%,
due 06/29/49 | | | 3,600,500 | | |
| | 3,796,000 | | | | | JPMorgan Chase & Co.,
4.650%, due 06/01/14 | | | 3,790,093 | | |
| | 5,734,000 | | | | | JPMorgan Chase Bank NA,
5.875%, due 06/13/16 | | | 5,534,078 | | |
| | 3,037,000 | | | | | Morgan Stanley, 2.250%,
due 03/13/12 | | | 3,065,739 | | |
| | 5,797,000 | | | | | Morgan Stanley, 4.750%,
due 04/01/14 | | | 5,481,481 | | |
| | 2,296,000 | | | C | | Morgan Stanley, 5.300%,
due 03/01/13 | | | 2,327,458 | | |
| | 8,806,000 | | | C | | Morgan Stanley, 6.750%,
due 04/15/11 | | | 9,228,750 | | |
| | 4,399,000 | | | C | | Morgan Stanley, 7.300%,
due 05/13/19 | | | 4,569,549 | | |
| | 13,106,000 | | | C | | National City Preferred
Capital Trust I, 12.000%,
due 12/29/49 | | | 13,738,286 | | |
| | 12,495,000 | | | @@,#,C | | Rabobank, 11.000%,
due 12/29/49 | | | 13,935,911 | | |
| | 660,000 | | | @@,C | | Societe Generale, 1.375%,
due 11/29/49 | | | 289,163 | | |
| | 17,277,000 | | | | | State Street Corp., 2.150%,
due 04/30/12 | | | 17,366,996 | | |
| | 6,361,000 | | | | | SunTrust Bank/Atlanta GA,
5.450%, due 12/01/17 | | | 5,596,026 | | |
| | 4,189,000 | | | | | Wachovia Bank NA,
6.000%, due 11/15/17 | | | 4,228,636 | | |
| | 10,798,000 | | | | | Wachovia Bank NA,
6.600%, due 01/15/38 | | | 10,559,299 | | |
| | 6,681,000 | | | | | Wachovia Corp., 5.500%,
due 05/01/13 | | | 6,907,412 | | |
| | | | 209,693,570 | | |
| | | | | Beverages: 0.8% | |
| | 8,214,000 | | | #,C | | Anheuser-Busch InBev
Worldwide, Inc., 5.375%,
due 11/15/14 | | | 8,296,822 | | |
| | 7,979,000 | | | #,C | | Anheuser-Busch InBev
Worldwide, Inc., 7.750%,
due 01/15/19 | | | 8,741,170 | | |
| | 3,790,000 | | | C | | Dr Pepper Snapple
Group, Inc., 6.820%,
due 05/01/18 | | | 4,014,645 | | |
| | 1,606,000 | | | C | | Dr Pepper Snapple
Group, Inc., 7.450%,
due 05/01/38 | | | 1,708,309 | | |
| | | | 22,760,946 | | |
See Accompanying Notes to Financial Statements
73
PORTFOLIO OF INVESTMENTS
ING INTERMEDIATE BOND PORTFOLIO AS OF JUNE 30, 2009 (UNAUDITED) (CONTINUED)
Principal
Amount | | | | | | Value | |
| | | | | Chemicals: 0.5% | |
| $ | 3,616,000 | | | #,C | | Chevron Phillips
Chemical Co. LLC,
7.000%, due 06/15/14 | | $ | 3,700,922 | | |
| | 3,316,000 | | | #,C | | Chevron Phillips
Chemical Co. LLC,
8.250%, due 06/15/19 | | | 3,465,174 | | |
| | 5,995,000 | | | C | | Dow Chemical Co.,
7.600%, due 05/15/14 | | | 6,181,079 | | |
| | | | 13,347,175 | | |
| | | | | Computers: 0.2% | |
| | 6,750,000 | | | C | | Hewlett-Packard Co.,
4.750%, due 06/02/14 | | | 7,054,290 | | |
| | | | 7,054,290 | | |
| | | | | Diversified Financial Services: 4.1% | |
| | 13,709,000 | | | @@,#,C | | Aiful Corp., 4.450%,
due 02/16/10 | | | 10,008,845 | | |
| | 4,859,000 | | | | | American Express
Credit Corp., 7.300%,
due 08/20/13 | | | 5,056,416 | | |
| | 3,840,000 | | | | | Capital One Bank USA NA,
6.500%, due 06/13/13 | | | 3,798,985 | | |
| | | | | | 9,127,000 | | | Capital One Bank USA NA,
8.800%, due 07/15/19 | | | 9,339,814 | | |
| | 3,403,000 | | | #,C | | Corestates Capital Trust I,
8.000%, due 12/15/26 | | | 2,232,875 | | |
| | 7,753,000 | | | | | FIA Card Services NA,
6.625%, due 06/15/12 | | | 8,059,306 | | |
| | 6,198,000 | | | C | | Fund American Cos., Inc.,
5.875%, due 05/15/13 | | | 5,843,363 | | |
| | 16,876,000 | | | | | General Electric
Capital Corp., 2.200%,
due 06/08/12 | | | 16,974,421 | | |
| | 7,666,000 | | | | | General Electric
Capital Corp., 5.875%,
due 01/14/38 | | | 6,085,087 | | |
| | 15,708,000 | | | | | General Electric
Capital Corp., 6.875%,
due 01/10/39 | | | 14,180,673 | | |
| | 11,976,000 | | | | | International Lease
Finance Corp., 6.625%,
due 11/15/13 | | | 9,226,167 | | |
| | 6,907,000 | | | @@,# | | Mantis Reef Ltd.,
4.799%, due 11/03/09 | | | 6,843,324 | | |
| | 3,245,000 | | | | | Merrill Lynch & Co., Inc.,
4.250%, due 02/08/10 | | | 3,258,327 | | |
| | 6,334,000 | | | | | Merrill Lynch & Co., Inc.,
6.050%, due 08/15/12 | | | 6,355,181 | | |
| | 4,574,000 | | | C | | National Rural Utilities
Cooperative Finance Corp.,
10.375%, due 11/01/18 | | | 5,744,089 | | |
| | 630,249 | | | # | | Power Receivable
Finance, LLC, 6.290%,
due 01/01/12 | | | 621,667 | | |
| | 30,862,493 | | | #,S,Z | | Toll Road Investors
Partnership II LP,
5.000%, due 02/15/45 | | | 2,816,881 | | |
| | 4,098,000 | | | #,±,C | | Twin Reefs Pass-through
Trust, 1.386%,
due 12/10/49 | | | 13,319 | | |
| | | | 116,458,740 | | |
Principal
Amount | | | | | | Value | |
| | | | | Electric: 3.1% | |
| $ | 3,541,000 | | | C | | Ameren Corp.,
8.875%, due 05/15/14 | | $ | 3,658,381 | | |
| | 1,760,000 | | | C | | Commonwealth
Edison Co., 6.150%,
due 03/15/12 | | | 1,869,534 | | |
| | 13,524,000 | | | C | | Commonwealth
Edison Co., 6.950%,
due 07/15/18 | | | 13,707,872 | | |
| | 4,306,000 | | | C | | DTE Energy Co.,
7.050%, due 06/01/11 | | | 4,508,171 | | |
| | 658,000 | | | C | | DTE Energy Co.,
7.625%, due 05/15/14 | | | 687,422 | | |
| | 2,708,000 | | | C | | Duke Energy Corp.,
6.300%, due 02/01/14 | | | 2,926,574 | | |
| | 3,534,000 | | | C | | Entergy Texas, Inc.,
7.125%, due 02/01/19 | | | 3,690,599 | | |
| | 3,197,000 | | | C | | Indiana Michigan Power,
7.000%, due 03/15/19 | | | 3,442,146 | | |
| | 2,236,000 | | | C | | Jersey Central
Power and Light,
7.350%, due 02/01/19 | | | 2,462,460 | | |
| | 945,336 | | | #,C | | Juniper Generation, LLC,
6.790%, due 12/31/14 | | | 858,558 | | |
| | 6,504,000 | | | C | | Metropolitan Edison,
7.700%, due 01/15/19 | | | 7,126,166 | | |
| | 2,398,000 | | | C | | Nevada Power Co.,
7.125%, due 03/15/19 | | | 2,567,227 | | |
| | 9,278,000 | | | C | | NorthWestern Corp.,
5.875%, due 11/01/14 | | | 9,447,286 | | |
| | 4,673,000 | | | C | | Oncor Electric
Delivery Co., 6.800%,
due 09/01/18 | | | 5,002,161 | | |
| | 6,356,000 | | | C | | Oncor Electric
Delivery Co.,
7.500%, due 09/01/38 | | | 7,192,481 | | |
| | 3,317,000 | | | C | | Progress Energy, Inc.,
6.050%, due 03/15/14 | | | 3,491,481 | | |
| | 2,607,000 | | | C | | Progress Energy, Inc.,
7.050%, due 03/15/19 | | | 2,897,628 | | |
| | 5,053,000 | | | C | | Sierra Pacific Power Co.,
6.250%, due 04/15/12 | | | 5,247,844 | | |
| | 6,562,000 | | | C | | Southwestern Electric
Power, 5.550%,
due 01/15/17 | | | 6,386,696 | | |
| | | | 87,170,687 | | |
| | | | | Energy-Alternate Sources: 0.0% | |
| | 4,000,000 | | | I,±,X | | Greater Ohio
Ethanol, LLC, 6.301%,
due 12/31/13 | | | — | | |
| | 4,900,000 | | | I,±,X | | Greater Ohio
Ethanol, LLC,
12.630%, due 12/31/13 | | | — | | |
| | 617,699 | | | I,X | | PEA Lima, LLC, 0.000%,
due 03/20/14 | | | 62 | | |
| | | | 62 | | |
| | | | | Entertainment: 0.1% | |
| | 2,542,000 | | | | | International Game
Technology, 7.500%,
due 06/15/19 | | | 2,569,281 | | |
| | | | 2,569,281 | | |
See Accompanying Notes to Financial Statements
74
PORTFOLIO OF INVESTMENTS
ING INTERMEDIATE BOND PORTFOLIO AS OF JUNE 30, 2009 (UNAUDITED) (CONTINUED)
Principal
Amount | | | | | | Value | |
| | | | | Food: 0.6% | |
| $ | 7,616,000 | | | | | Kraft Foods, Inc., 6.125%,
due 02/01/18 | | $ | 7,887,449 | | |
| | 3,278,000 | | | | | Kraft Foods, Inc., 6.125%,
due 08/23/18 | | | 3,400,633 | | |
| | 1,994,000 | | | | | Kraft Foods, Inc., 6.500%,
due 08/11/17 | | | 2,103,445 | | |
| | 2,893,000 | | | C | | Safeway, Inc., 6.250%,
due 03/15/14 | | | 3,107,768 | | |
| | | | 16,499,295 | | |
| | | | | Forest Products & Paper: 0.1% | |
| | 1,563,000 | | | C | | International Paper Co.,
7.400%, due 06/15/14 | | | 1,557,486 | | |
| | | | 1,557,486 | | |
| | | | | Gas: 0.3% | |
| | 8,238,000 | | | C | | Sempra Energy, 6.500%,
due 06/01/16 | | | 8,611,107 | | |
| | | | 8,611,107 | | |
| | | | | Healthcare-Services: 0.1% | |
| | 3,225,000 | | | C | | HCA, Inc., 9.250%,
due 11/15/16 | | | 3,184,688 | | |
| | | | 3,184,688 | | |
| | | | | Insurance: 1.9% | |
| | 10,157,000 | | | @@,C | | Aegon NV, 3.610%,
due 12/31/49 | | | 3,986,623 | | |
| | 8,012,000 | | | | | American International
Group, Inc., 5.850%,
due 01/16/18 | | | 4,244,685 | | |
| | 4,824,000 | | | C | | Hartford Financial Services
Group, Inc., 5.250%,
due 10/15/11 | | | 4,664,789 | | |
| | 4,366,000 | | | C | | Hartford Financial Services
Group, Inc., 6.000%,
due 01/15/19 | | | 3,350,761 | | |
| | 9,940,000 | | | C | | Metlife, Inc., 7.717%,
due 02/15/19 | | | 10,650,362 | | |
| | 6,004,000 | | | #,C | | Pacific Life Insurance Co.,
9.250%, due 06/15/39 | | | 5,841,424 | | |
| | 3,323,000 | | | C | | Principal Financial
Group, Inc., 7.875%,
due 05/15/14 | | | 3,504,273 | | |
| | 2,288,000 | | | | | Prudential Financial, Inc.,
5.700%, due 12/14/36 | | | 1,721,635 | | |
| | 4,220,000 | | | | | Prudential Financial, Inc.,
6.000%, due 12/01/17 | | | 3,976,388 | | |
| | 7,923,000 | | | | | Prudential Financial, Inc.,
6.625%, due 12/01/37 | | | 6,884,604 | | |
| | 3,798,000 | | | | | Prudential Financial, Inc.,
7.375%, due 06/15/19 | | | 3,735,455 | | |
| | 2,275,000 | | | @@,C | | XL Capital, Ltd., 6.500%,
due 12/31/49 | | | 1,116,126 | | |
| | | | 53,677,125 | | |
| | | | | Iron/Steel: 0.2% | |
| | 4,977,000 | | | @@ | | ArcelorMittal, 9.850%,
due 06/01/19 | | | 5,379,848 | | |
| | | | 5,379,848 | | |
Principal
Amount | | | | | | Value | |
| | | | | Media: 3.5% | |
| $ | 2,270,000 | | | C | | Comcast Corp., 5.300%,
due 01/15/14 | | $ | 2,349,865 | | |
| | 3,261,000 | | | C | | Comcast Corp., 5.700%,
due 05/15/18 | | | 3,284,176 | | |
| | 2,093,000 | | | C | | Comcast Corp., 5.900%,
due 03/15/16 | | | 2,168,030 | | |
| | 3,514,000 | | | C | | Comcast Corp., 6.300%,
due 11/15/17 | | | 3,725,163 | | |
| | 3,373,000 | | | C | | Comcast Corp., 6.500%,
due 01/15/17 | | | 3,583,624 | | |
| | 3,935,000 | | | #,C | | COX Communications, Inc.,
6.250%, due 06/01/18 | | | 3,896,417 | | |
| | 3,855,000 | | | #,C | | COX Communications, Inc.,
6.950%, due 06/01/38 | | | 3,722,242 | | |
| | 5,521,000 | | | #,C | | Cox Communications, Inc.,
8.375%, due 03/01/39 | | | 6,173,897 | | |
| | 3,376,000 | | | #,C | | Cox Enterprises, Inc.,
7.375%, due 07/15/27 | | | 3,290,709 | | |
| | 3,225,000 | | | C | | Echostar DBS Corp.,
7.125%, due 02/01/16 | | | 3,023,438 | | |
| | 5,290,000 | | | C | | News America, Inc.,
6.150%, due 03/01/37 | | | 4,500,166 | | |
| | 4,379,000 | | | C | | News America, Inc.,
6.650%, due 11/15/37 | | | 3,950,747 | | |
| | 9,094,000 | | | #,C | | News America, Inc.,
6.900%, due 03/01/19 | | | 9,492,826 | | |
| | 1,133,000 | | | C | | Time Warner Cable, Inc.,
6.200%, due 07/01/13 | | | 1,194,830 | | |
| | 6,568,000 | | | C | | Time Warner Cable, Inc.,
6.750%, due 07/01/18 | | | 6,852,532 | | |
| | 2,247,000 | | | C | | Time Warner Cable, Inc.,
6.750%, due 06/15/39 | | | 2,193,881 | | |
| | 11,237,000 | | | C | | Time Warner Cable, Inc.,
8.750%, due 02/14/19 | | | 13,112,444 | | |
| | 1,865,000 | | | | | Time Warner
Entertainment Co. LP,
8.375%, due 07/15/33 | | | 2,093,276 | | |
| | 7,923,000 | | | C | | Time Warner, Inc., 5.500%,
due 11/15/11 | | | 8,186,424 | | |
| | 7,139,000 | | | C | | Time Warner, Inc., 7.700%,
due 05/01/32 | | | 7,033,835 | | |
| | 5,710,000 | | | C | | Viacom, Inc., 6.875%,
due 04/30/36 | | | 5,275,983 | | |
| | | | 99,104,505 | | |
| | | | | Miscellaneous Manufacturing: 0.7% | |
| | 9,100,000 | | | | | General Electric Co.,
5.250%, due 12/06/17 | | | 8,951,615 | | |
| | 8,763,000 | | | @@,C | | Tyco International Finance,
8.500%, due 01/15/19 | | | 9,732,389 | | |
| | | | 18,684,004 | | |
| | | | | Oil & Gas: 0.5% | |
| | 3,218,000 | | | C | | Chesapeake Energy Corp.,
7.250%, due 12/15/18 | | | 2,815,750 | | |
| | 3,266,000 | | | C | | Hess Corp., 8.125%,
due 02/15/19 | | | 3,724,553 | | |
| | 5,618,000 | | | C | | Marathon Oil Corp.,
6.500%, due 02/15/14 | | | 6,011,906 | | |
| | 2,793,000 | | | C | | Marathon Oil Corp.,
7.500%, due 02/15/19 | | | 3,053,710 | | |
| | | | 15,605,919 | | |
See Accompanying Notes to Financial Statements
75
PORTFOLIO OF INVESTMENTS
ING INTERMEDIATE BOND PORTFOLIO AS OF JUNE 30, 2009 (UNAUDITED) (CONTINUED)
Principal
Amount | | | | | | Value | |
| | | | | Oil & Gas Services: 0.1% | |
| $ | 3,301,000 | | | @@,C | | Weatherford
International, Ltd.,
9.625%, due 03/01/19 | | $ | 3,889,671 | | |
| | | | 3,889,671 | | |
| | | | | Pharmaceuticals: 0.3% | |
| | 3,066,000 | | | C | | Express Scripts, Inc.,
6.250%, due 06/15/14 | | | 3,247,602 | | |
| | 763,000 | | | C | | Express Scripts, Inc.,
7.250%, due 06/15/19 | | | 842,907 | | |
| | 3,046,000 | | | @@,C | | Novartis Securities
Investment Ltd., 5.125%,
due 02/10/19 | | | 3,122,205 | | |
| | | | 7,212,714 | | |
| | | | | Pipelines: 0.9% | |
| | 5,758,000 | | | C | | Enbridge Energy Partners,
9.875%, due 03/01/19 | | | 6,686,172 | | |
| | 4,845,000 | | | C | | Energy Transfer Partners,
9.700%, due 03/15/19 | | | 5,571,309 | | |
| | 1,176,000 | | | C | | Kinder Morgan Energy
Partners L.P., 6.850%,
due 02/15/20 | | | 1,207,678 | | |
| | 1,893,000 | | | C | | Northwest Pipeline Corp.,
7.000%, due 06/15/16 | | | 1,999,536 | | |
| | 2,106,000 | | | @@,C | | Trans-Canada Pipelines,
7.125%, due 01/15/19 | | | 2,381,094 | | |
| | 2,337,000 | | | @@,C | | Trans-Canada Pipelines,
7.625%, due 01/15/39 | | | 2,736,290 | | |
| | 2,894,000 | | | C | | Transcontinental Gas Pipe
Line Corp., 6.400%,
due 04/15/16 | | | 2,974,172 | | |
| | 1,848,000 | | | # | | Williams Companies, Inc.,
8.750%, due 01/15/20 | | | 1,929,863 | | |
| | | | 25,486,114 | | |
| | | | | Real Estate: 0.1% | |
| | 4,114,000 | | | C | | Simon Property Group, Inc.,
6.750%, due 05/15/14 | | | 4,137,993 | | |
| | | | 4,137,993 | | |
| | | | | Retail: 0.3% | |
| | 2,890,000 | | | C | | CVS Caremark Corp.,
6.600%, due 03/15/19 | | | 3,093,540 | | |
| | 5,450,706 | | | #,C | | CVS Lease Pass-through,
6.036%, due 12/10/28 | | | 4,669,702 | | |
| | | | 7,763,242 | | |
| | | | | Software: 0.3% | |
| | 5,481,000 | | | | | Oracle Corp., 5.000%,
due 07/08/19 | | | 5,460,556 | | |
| | 3,635,000 | | | | | Oracle Corp., 6.125%,
due 07/08/39 | | | 3,610,791 | | |
| | | | 9,071,347 | | |
| | | | | Telecommunications: 3.0% | |
| | 6,783,000 | | | C | | AT&T, Inc., 6.550%,
due 02/15/39 | | | 6,792,991 | | |
| | 7,623,000 | | | C | | AT&T, Inc., 6.700%,
due 11/15/13 | | | 8,379,712 | | |
Principal
Amount | | | | | | Value | |
| $ | 6,675,000 | | | | | Bellsouth
Telecommunications, Inc.,
7.000%, due 12/01/95 | | $ | 5,849,636 | | |
| | 1,938,000 | | | @@,C | | British
Telecommunications PLC,
5.150%, due 01/15/13 | | | 1,932,853 | | |
| | 5,566,000 | | | @@,C | | British
Telecommunications PLC,
5.950%, due 01/15/18 | | | 5,024,423 | | |
| | 2,292,000 | | | @@,C | | Deutsche Telekom
International Finance,
5.250%, due 07/22/13 | | | 2,356,318 | | |
| | 1,839,000 | | | @@,C | | Deutsche Telekom
International Finance BV,
5.875%, due 08/20/13 | | | 1,930,739 | | |
| | 3,942,000 | | | C | | Embarq Corp., 6.738%,
due 06/01/13 | | | 3,982,591 | | |
| | 4,125,000 | | | C | | Embarq Corp., 7.995%,
due 06/01/36 | | | 3,636,600 | | |
| | 3,225,000 | | | C | | Sprint Nextel Corp.,
6.000%, due 12/01/16 | | | 2,652,563 | | |
| | 4,501,000 | | | @@,C | | Telecom Italia Capital SA,
7.175%, due 06/18/19 | | | 4,570,693 | | |
| | 3,282,000 | | | @@,C | | Telefonica Emisones SAU,
5.855%, due 02/04/13 | | | 3,462,471 | | |
| | 2,007,000 | | | @@,C | | Telefonica Emisones SAU,
5.877%, due 07/15/19 | | | 2,073,113 | | |
| | 2,441,000 | | | @@,C | | Telefonica Emisones SAU,
6.421%, due 06/20/16 | | | 2,613,613 | | |
| | 6,631,000 | | | C | | Verizon
Communications, Inc.,
7.350%, due 04/01/39 | | | 7,248,426 | | |
| | 6,060,000 | | | C | | Verizon
Communications, Inc.,
8.950%, due 03/01/39 | | | 7,675,844 | | |
| | 708,000 | | | #,C | | Verizon Wireless, 8.500%,
due 11/15/18 | | | 847,545 | | |
| | 12,280,000 | | | #,C | | Verizon Wireless
Capital LLC, 5.550%,
due 02/01/14 | | | 13,049,944 | | |
| | | | 84,080,075 | | |
| | | | | Transportation: 0.8% | |
| | 5,315,000 | | | C | | CSX Corp., 6.250%,
due 04/01/15 | | | 5,501,493 | | |
| | 7,491,000 | | | C | | CSX Corp., 7.450%,
due 04/01/38 | | | 8,136,245 | | |
| | 5,856,000 | | | C | | Union Pacific Corp.,
5.125%, due 02/15/14 | | | 6,059,215 | | |
| | 4,222,000 | | | C | | Union Pacific Corp.,
5.700%, due 08/15/18 | | | 4,238,077 | | |
| | | | 23,935,030 | | |
Total Corporate
Bonds/Notes
(Cost $858,812,878) | | | 861,073,647 | | |
See Accompanying Notes to Financial Statements
76
PORTFOLIO OF INVESTMENTS
ING INTERMEDIATE BOND PORTFOLIO AS OF JUNE 30, 2009 (UNAUDITED) (CONTINUED)
Principal
Amount | | | | | | Value | |
| U.S. GOVERNMENT AGENCY OBLIGATIONS: 38.5% | | | |
| | | | | | | Federal Home Loan Mortgage
Corporation##: 10.6% | | | | | |
| $ | 14,960,021 | | | S | | 0.669%, due 05/15/33 | | $ | 14,265,974 | | |
| | 3,697,737 | | | S | | 1.206%, due 04/15/32 | | | 3,642,836 | | |
| | 1,040,354 | | | S | | 4.969%, due 04/01/35 | | | 1,080,006 | | |
| | 82,511,000 | | | W | | 5.000%, due 08/15/33 | | | 83,581,085 | | |
| | 1,631,319 | | | S | | 5.000%, due 05/01/28 | | | 1,674,980 | | |
| | 7,331,914 | | | S,^ | | 5.000%, due 05/15/17 | | | 468,259 | | |
| | 63,302,723 | | | S | | 5.000%, due 08/15/16-
02/15/35 | | | 65,959,297 | | |
| | 61,700 | | | S | | 5.078%, due 11/01/35 | | | 63,621 | | |
| | 88,440,343 | | | S | | 5.500%, due 08/15/20-
02/15/34 | | | 91,834,717 | | |
| | 79,798 | | | S | | 5.699%, due 03/01/36 | | | 82,580 | | |
| | 167,832 | | | S | | 5.855%, due 12/01/37 | | | 175,925 | | |
| | 12,514,067 | | | S | | 6.000%, due 02/01/29-
02/01/36 | | | 13,154,044 | | |
| | 12,401,516 | | | S | | 6.000%, due 01/15/29 | | | 13,225,770 | | |
| | 7,600,000 | | | W | | 6.500%, due 08/15/34 | | | 8,050,064 | | |
| | 1,178,242 | | | S | | 7.000%, due 09/01/26-
11/01/31 | | | 1,279,187 | | |
| | 418,352 | | | S | | 7.500%, due 11/01/28 | | | 456,679 | | |
| | | | 298,995,024 | | |
| | | | | | | Federal National Mortgage
Association##: 22.0% | | | | | |
| | 503,420 | | | S | | 0.454, due 04/25/35 | | | 461,195 | | |
| | 337,153 | | | S | | 0.664%, due 08/25/33 | | | 331,390 | | |
| | 2,061,153 | | | S | | 0.772%, due 07/25/36 | | | 1,987,783 | | |
| | 9,941,000 | | | W | | 4.000%, due 02/25/39 | | | 9,639,663 | | |
| | 52,608,000 | | | W | | 4.500%, due 07/25/18-
07/15/35 | | | 52,607,670 | | |
| | 1,169,759 | | | S | | 4.982%, due 04/01/35 | | | 1,208,422 | | |
| | 28,194,531 | | | S | | 5.000%, due 02/25/29-
07/01/36 | | | 29,021,612 | | |
| | 34,159,043 | | | | | 5.000%, due 07/01/37 | | | 34,938,293 | | |
| | 1,370,367 | | | S | | 5.027%, due 07/01/35 | | | 1,429,725 | | |
| | 861,660 | | | S | | 5.224%, due 08/01/35 | | | 897,583 | | |
| | 192,829,000 | | | W | | 5.500%, due 07/15/34 | | | 199,065,861 | | |
| | 26,132,993 | | | S | | 5.500%, due 11/01/16-
01/01/39 | | | 27,117,582 | | |
| | 108,370,000 | | | W | | 6.000%, due 07/01/37 | | | 113,263,556 | | |
| | 6,837,286 | | | S,^ | | 6.000%, due 08/25/33 | | | 1,119,606 | | |
| | 41,362,028 | | | S | | 6.000%, due 06/01/16-
08/01/38 | | | 43,599,698 | | |
| | 4,100,000 | | | W | | 6.000%, due 04/15/38 | | | 4,278,735 | | |
| | 14,642,953 | | | S,^ | | 6.276%, due 06/25/36 | | | 1,427,729 | | |
| | 57,218,000 | | | W | | 6.500%, due 08/01/39 | | | 60,695,824 | | |
| | 6,403,615 | | | S | | 6.500%, due 01/01/23-
09/01/37 | | | 6,836,162 | | |
| | 11,546,628 | | | S | | 7.000%, due 08/01/25-
04/01/38 | | | 12,577,351 | | |
| | 241,975 | | | S | | 7.500%, due 11/01/29-
09/01/31 | | | 264,229 | | |
| | 1,221,680 | | | S | | 7.500%, due 01/25/48 | | | 1,318,172 | | |
| | 155,291 | | | S | | 10.000%, due 02/25/19 | | | 177,405 | | |
| | 6,174,926 | | | S | | 14.716%, due 03/25/38 | | | 6,709,485 | | |
| | 587,099 | | | S | | 27.345%, due 02/25/34 | | | 722,507 | | |
| | 8,796,137 | | | S | | 27.945%, due 03/25/35 | | | 10,944,844 | | |
| | | | 622,642,082 | | |
Principal
Amount | | | | | | Value | |
| | | | | | | Government National Mortgage
Association: 5.9% | | | | | |
| $ | 46,045 | | | S | | 4.125%, due 12/20/29 | | $ | 46,753 | | |
| | 45,400,000 | | | W | | 4.500%, due 07/01/39 | | | 45,329,085 | | |
| | 7,594,067 | | | S | | 4.500%, due 04/15/39 | | | 7,598,517 | | |
| | 26,000,000 | | | W | | 5.000%, due 08/01/33 | | | 26,402,194 | | |
| | 67,923 | | | S | | 5.375%, due 04/20/28 | | | 70,070 | | |
| | 17,772,000 | | | W | | 5.500%, due 07/15/33 | | | 18,352,362 | | |
| | 9,445,571 | | | S | | 5.500%, due 09/15/38 | | | 9,772,476 | | |
| | 6,008,965 | | | | | 5.500%, due 03/20/39 | | | 6,200,985 | | |
| | 65,828,245 | | | S,^ | | 5.885%, due 04/20/39 | | | 4,987,477 | | |
| | 907,000 | | | S | | 6.000%, due 10/15/38 | | | 946,079 | | |
| | 42,203,000 | | | W | | 6.000%, due 07/15/33 | | | 43,963,667 | | |
| | 10,389,956 | | | S,^ | | 6.182%, due 05/16/38 | | | 1,064,211 | | |
| | 1,909,344 | | | S | | 6.500%, due 01/15/29-
01/15/32 | | | 2,060,245 | | |
| | 601,902 | | | S | | 7.000%, due 04/15/26-
05/15/32 | | | 655,709 | | |
| | 1,034,037 | | | S | | 7.500%, due 04/15/22-
06/15/32 | | | 1,132,375 | | |
| | | | 168,582,205 | | |
Total U.S. Government
Agency Obligations
(Cost $1,077,919,514) | | | 1,090,219,311 | | |
| U.S. TREASURY OBLIGATIONS: 26.0% | | | |
| | | | | U.S. Treasury Bonds: 2.7% | |
| | 87,993,000 | | | S | | 3.500%, due 02/15/39 | | | 76,114,209 | | |
| | | | 76,114,209 | | |
| | | | | U.S. Treasury Notes: 23.3% | |
| | 9,210,000 | | | L | | 0.875%, due 05/31/11 | | | 9,179,819 | | |
| | 2,600,000 | | | | | 1.125%, due 06/30/11 | | | 2,600,813 | | |
| | 175,155,000 | | | L | | 1.875%, due 06/15/12 | | | 176,483,200 | | |
| | 258,800,000 | | | L | | 2.250%, due 05/31/14 | | | 255,402,732 | | |
| | 186,985,000 | | | | | 2.625%, due 06/30/14-
04/30/16 | | | 187,685,680 | | |
| | 29,324,000 | | | L | | 3.125%, due 05/15/19 | | | 28,371,058 | | |
| | | | 659,723,302 | | |
Total U.S. Treasury
Obligations
(Cost $730,523,491) | | | 735,837,511 | | |
| ASSET-BACKED SECURITIES: 1.7% | | | |
| | | | | | | Automobile Asset-Backed
Securities: 0.4% | | | | | |
| | 4,887,000 | | | S | | Honda Auto Receivables
Owner Trust, 4.880%,
due 09/18/14 | | | 5,110,731 | | |
| | 3,246,000 | | | S | | Nissan Auto Receivables
Owner Trust, 2.940%,
due 07/15/11 | | | 3,268,868 | | |
| | 2,017,500 | | | S | | Nissan Auto Receivables
Owner Trust, 4.280%,
due 06/16/14 | | | 2,061,462 | | |
| | 1,473,000 | | | S | | Nissan Auto Receivables
Owner Trust, 4.460%,
due 04/16/12 | | | 1,514,707 | | |
| | | | 11,955,768 | | |
See Accompanying Notes to Financial Statements
77
PORTFOLIO OF INVESTMENTS
ING INTERMEDIATE BOND PORTFOLIO AS OF JUNE 30, 2009 (UNAUDITED) (CONTINUED)
Principal
Amount | | | | | | Value | |
| | | | | | | Home Equity Asset-Backed
Securities: 0.6% | | | | | |
| $ | 1,253,000 | | | S | | GMAC Mortgage Corp.
Loan Trust, 6.249%,
due 12/25/37 | | $ | 337,900 | | |
| | 6,784,991 | | | S | | GSAA Trust, 5.242%,
due 06/25/34 | | | 6,259,645 | | |
| | 3,328,000 | | | #,S | | Irwin Home Equity,
5.960%, due 08/25/37 | | | 743,199 | | |
| | 350,262 | | | S | | Merrill Lynch Mortgage
Investors Trust, 0.674%,
due 07/25/34 | | | 187,296 | | |
| | 2,468,056 | | | S | | Morgan Stanley
Capital, Inc., 1.514%,
due 06/25/33 | | | 1,402,361 | | |
| | 197,897 | | | S | | Renaissance Home Equity
Loan Trust, 4.456%,
due 05/25/35 | | | 192,083 | | |
| | 3,074,761 | | | S | | Residential
Funding Mortgage
Securities II, Inc., 5.890%,
due 05/25/37 | | | 2,592,355 | | |
| | 4,000,000 | | | S | | Specialty Underwriting &
Residential Finance,
0.514%, due 12/25/36 | | | 2,879,768 | | |
| | 812,362 | | | S | | Wells Fargo Home
Equity Trust, 3.970%,
due 05/25/34 | | | 782,308 | | |
| | 500,000 | | | S | | Wells Fargo Home
Equity Trust, 4.430%,
due 05/25/34 | | | 457,430 | | |
| | | | 15,834,345 | | |
| | | | | Other Asset-Backed Securities: 0.7% | |
| | 261,482 | | | S | | Amortizing Residential
Collateral Trust, 0.564%,
due 05/25/32 | | | 140,587 | | |
| | 2,854,217 | | | S | | Bear Stearns Asset-Backed
Securities, Inc., 0.694%,
due 06/25/36 | | | 1,407,516 | | |
| | 1,087,413 | | | S | | Bear Stearns Asset-Backed
Securities, Inc., 0.714%,
due 07/25/36 | | | 238,245 | | |
| | 579,693 | | | S | | CenterPoint Energy
Transition Bond Co., LLC,
4.192%, due 02/01/20 | | | 588,271 | | |
| | 401,922 | | | S | | Chase Funding Mortgage
Loan Asset-Backed
Certificates, 0.914%,
due 07/25/33 | | | 314,331 | | |
| | 16,193 | | | S | | Chase Funding Mortgage
Loan Asset-Backed
Certificates, 4.045%,
due 05/25/33 | | | 15,163 | | |
| | 85,000 | | | S | | Countrywide Asset-Backed
Certificates, 5.689%,
due 10/25/46 | | | 37,032 | | |
| | 4,956,389 | | | S | | Credit-Based Asset
Servicing and
Securitization, LLC,
4.831%, due 08/25/35 | | | 4,144,663 | | |
| | 2,389,131 | | | S | | Credit-Based Asset
Servicing and
Securitization, LLC,
5.501%, due 12/25/36 | | | 1,638,601 | | |
Principal
Amount | | | | | | Value | |
| $ | 3,360,000 | | | #,S | | Credit-Based Asset
Servicing and
Securitization, LLC,
5.746%, due 12/25/37 | | $ | 2,439,502 | | |
| | 2,876,000 | | | #,S | | Credit-Based Asset
Servicing and
Securitization, LLC,
6.020%, due 12/25/37 | | | 1,702,634 | | |
| | 2,527,211 | | | S | | Equity One, Inc., 5.050%,
due 09/25/33 | | | 1,780,005 | | |
| | 2,159,777 | | | S | | First Horizon Asset
Back Trust, 0.444%,
due 09/25/29 | | | 1,084,031 | | |
| | 6,265,000 | | | S | | Hudson Mezzanine
Funding, 1.314%,
due 06/12/42 | | | — | | |
| | 2,015,962 | | | S | | Lehman XS Trust, 0.594%,
due 08/25/35 | | | 921,297 | | |
| | 804,129 | | | S | | Merrill Lynch Mortgage
Investors Trust, 0.494%,
due 09/25/36 | | | 168,108 | | |
| | 899,485 | | | S | | Merrill Lynch Mortgage
Investors Trust, 5.609%,
due 03/25/37 | | | 417,695 | | |
| | 23,498 | | | S | | Popular Mortgage
Pass-through Trust,
4.000%, due 12/25/34 | | | 22,783 | | |
| | 45,890 | | | S | | Residential Asset
Mortgage Products, Inc.,
0.934%, due 06/25/33 | | | 27,795 | | |
| | 2,233,348 | | | S | | Structured Asset
Securities Corp., 4.910%,
due 06/25/33 | | | 1,884,964 | | |
| | | | 18,973,223 | | |
Total Asset-Backed Securities
(Cost $68,317,131) | | | 46,763,336 | | |
| COLLATERALIZED MORTGAGE OBLIGATIONS: 11.6% | | | |
| | 735,193 | | | C,S | | American Home Mortgage
Assets, 2.130%,
due 02/25/47 | | | 117,040 | | |
| | 8,557,544 | | | C,S | | American Home Mortgage
Assets, 2.260%,
due 11/25/46 | | | 2,860,253 | | |
| | 4,235,287 | | | C,S | | American Home Mortgage
Assets, 2.340%,
due 09/25/46 | | | 768,414 | | |
| | 4,356,617 | | | C,S | | American Home Mortgage
Investment Trust,
0.604%, due 11/25/45 | | | 1,926,045 | | |
| | 14,849,531 | | | C,S | | American Home Mortgage
Investment Trust,
0.694%, due 11/25/45 | | | 3,486,530 | | |
| | 8,094,715 | | | C,S | | Banc of America
Alternative Loan Trust,
6.243%, due 11/25/21 | | | 5,915,722 | | |
| | 1,855,323 | | | C,S | | Banc of America
Commercial
Mortgage, Inc.,
4.772%, due 07/11/43 | | | 1,890,016 | | |
See Accompanying Notes to Financial Statements
78
PORTFOLIO OF INVESTMENTS
ING INTERMEDIATE BOND PORTFOLIO AS OF JUNE 30, 2009 (UNAUDITED) (CONTINUED)
Principal
Amount | | | | | | Value | |
| COLLATERALIZED MORTGAGE OBLIGATIONS (continued) | | | |
| $ | 10,112,233 | | | C,S | | Banc of America
Funding Corp., 5.258%,
due 09/20/35 | | $ | 5,522,964 | | |
| | 4,744,910 | | | C,S | | Banc of America
Funding Corp., 5.750%,
due 09/20/34 | | | 4,209,178 | | |
| | 5,106,187 | | | C,S | | Banc of America Mortgage
Securities, Inc., 5.145%,
due 09/25/35 | | | 4,081,151 | | |
| | 1,953,296 | | | C,S | | Banc of America Mortgage
Securities, Inc., 5.500%,
due 11/25/33 | | | 1,754,493 | | |
| | 2,834,877 | | | C,S | | Banc of America Mortgage
Securities, Inc., 5.500%,
due 06/25/35 | | | 2,604,150 | | |
| | 1,110,016 | | | C,S | | Bear Stearns
Alternative-A Trust,
0.634%, due 07/25/34 | | | 557,296 | | |
| | 300,341 | | | C,S | | Bear Stearns Commercial
Mortgage Securities,
5.415%, due 04/12/38 | | | 303,117 | | |
| | 2,142,271 | | | C,S | | Bear Stearns Commercial
Mortgage Securities,
7.780%, due 02/15/32 | | | 2,159,135 | | |
| | 1,253,333 | | | C,S | | Chase Manhattan Bank-First
Union National Bank,
7.439%, due 08/15/31 | | | 1,251,043 | | |
| | 9,642,525 | | | C,S | | Chase Mortgage
Finance Corp., 5.407%,
due 12/25/35 | | | 7,521,129 | | |
| | 5,075,080 | | | C,S | | Chase Mortgage
Finance Corp., 5.500%,
due 11/25/35 | | | 4,687,959 | | |
| | 1,564,221 | | | C,S | | Citicorp Mortgage
Securities, Inc., 5.500%,
due 02/25/22 | | | 1,247,230 | | |
| | 5,915,000 | | | C,S | | Citigroup Commercial
Mortgage Trust, 5.888%,
due 12/10/49 | | | 4,693,028 | | |
| | 4,523,000 | | | #,C,S | | Citigroup Mortgage Loan
Trust, Inc., 5.466%,
due 11/19/35 | | | 4,127,238 | | |
| | 1,736,375 | | | C,S | | Commercial Mortgage
Pass-through Certificates,
6.010%, due 12/10/49 | | | 1,384,785 | | |
| | 2,217,480 | | | C,S | | Countrywide Alternative
Loan Trust, 0.554%,
due 11/25/46 | | | 592,759 | | |
| | 7,158,975 | | | C,S | | Countrywide Alternative
Loan Trust, 1.398%,
due 11/25/46 | | | 1,251,828 | | |
| | 3,366,448 | | | C,S | | Countrywide Home
Loan Mortgage
Pass-through Trust,
0.634%, due 04/25/35 | | | 497,723 | | |
| | 10,564,010 | | | C,S | | Countrywide Home
Loan Mortgage
Pass-through Trust,
5.000%, due 04/25/35 | | | 8,523,412 | | |
| | 3,876,360 | | | C,S | | Countrywide Home
Loan Mortgage
Pass-through Trust,
5.250%, due 10/25/35 | | | 2,634,358 | | |
Principal
Amount | | | | | | Value | |
| $ | 12,328,841 | | | C,S | | Countrywide Home
Loan Mortgage
Pass-through Trust,
5.500%, due 10/25/35 | | $ | 9,525,683 | | |
| | 1,191,800 | | | C,S | | Credit Suisse First Boston
Mortgage Securities
Corp., 3.727%,
due 03/15/35 | | | 1,158,355 | | |
| | 811,634 | | | C,S | | Credit Suisse First Boston
Mortgage Securities
Corp., 3.819%,
due 05/15/36 | | | 776,838 | | |
| | 1,000,000 | | | C,S | | Credit Suisse First Boston
Mortgage Securities
Corp., 4.801%,
due 03/15/36 | | | 942,977 | | |
| | 1,133,191 | | | C,S | | Credit Suisse First Boston
Mortgage Securities
Corp., 5.000%, due 08/25/20 | | | 1,003,687 | | |
| | 3,369,283 | | | C,S | | Credit Suisse Mortgage
Capital Certificates,
7.000%, due 08/25/36 | | | 1,639,929 | | |
| | 3,000,000 | | | S | | Fannie Mae, 5.000%,
due 05/25/32 | | | 3,118,094 | | |
| | 2,888,066 | | | C,S | | First Horizon Mortgage
Pass-through Trust,
5.500%, due 12/25/35 | | | 2,549,663 | | |
| | 3,270,237 | | | C,S | | First Union National
Bank Commercial
Mortgage, 6.663%,
due 01/12/43 | | | 3,369,195 | | |
| | 500,000 | | | C,S | | GE Capital Commercial
Mortgage Corp., 4.371%,
due 01/10/38 | | | 494,863 | | |
| | 578,019 | | | C,S | | GE Capital Commercial
Mortgage Corp., 5.560%,
due 06/10/38 | | | 593,712 | | |
| | 2,820,000 | | | C,S | | GE Capital Commercial
Mortgage Corp., 6.531%,
due 05/15/33 | | | 2,903,878 | | |
| | 2,512,562 | | | C,S | | GMAC Commercial
Mortgage Securities, Inc.,
5.785%, due 11/15/39 | | | 2,534,449 | | |
| | 3,058,787 | | | C,S | | GMAC Mortgage Corp.
Loan Trust, 4.587%,
due 10/19/33 | | | 2,726,159 | | |
| | 6,521,106 | | | C,S | | GMAC Mortgage Corp.
Loan Trust, 5.261%,
due 03/18/35 | | | 5,717,778 | | |
| | 4,326,441 | | | C,S | | GMAC Mortgage Corp.
Loan Trust, 5.466%,
due 11/19/35 | | | 3,240,014 | | |
| | 159,239 | | | C,S | | GMAC Mortgage Corp.
Loan Trust, 5.500%,
due 09/25/34 | | | 159,712 | | |
| | 11,090,000 | | | C,S | | Greenwich Capital
Commercial Funding
Corp., 5.444%,
due 03/10/39 | | | 8,869,158 | | |
| | 1,118,083 | | | S | | GSMPS Mortgage Loan
Trust, 0.872%,
due 01/25/35 | | | 725,962 | | |
See Accompanying Notes to Financial Statements
79
PORTFOLIO OF INVESTMENTS
ING INTERMEDIATE BOND PORTFOLIO AS OF JUNE 30, 2009 (UNAUDITED) (CONTINUED)
Principal
Amount | | | | | | Value | |
| COLLATERALIZED MORTGAGE OBLIGATIONS (continued) | | | |
| $ | 2,614,509 | | | C,S | | GSR Mortgage Loan
Trust, 5.500%,
due 07/25/35 | | $ | 2,481,880 | | |
| | 908,901 | | | C,S | | Harborview Mortgage
Loan Trust, 0.663%,
due 01/19/35 | | | 399,819 | | |
| | 607,944 | | | C,S | | Homebanc Mortgage Trust,
1.174%, due 08/25/29 | | | 311,878 | | |
| | 15,000,000 | | | C,S | | JPMorgan Alternative
Loan Trust, 0.484%,
due 08/25/36 | | | 6,222,476 | | |
| | 914,452 | | | C,S | | JPMorgan Alternative
Loan Trust, 5.506%,
due 01/25/36 | | | 599,427 | | |
| | 465,498 | | | C,S | | JPMorgan Chase
Commercial Mortgage
Securities Corp., 4.200%,
due 07/12/35 | | | 465,678 | | |
| | 3,280,964 | | | C,S | | JPMorgan Chase
Commercial Mortgage
Securities Corp., 4.275%,
due 01/12/37 | | | 3,195,926 | | |
| | 386,938 | | | C,S | | JPMorgan Chase
Commercial Mortgage
Securities Corp., 6.023%,
due 04/15/45 | | | 392,878 | | |
| | 12,088,699 | | | C,S | | JPMorgan Mortgage
Trust, 5.397%,
due 11/25/35 | | | 9,976,366 | | |
| | 509,000 | | | C,S | | LB-UBS Commercial
Mortgage Trust, 4.310%,
due 02/15/30 | | | 499,371 | | |
| | 1,717,000 | | | C,S | | LB-UBS Commercial
Mortgage Trust, 4.510%,
due 12/15/29 | | | 1,520,458 | | |
| | 5,920,000 | | | C,S | | LB-UBS Commercial
Mortgage Trust, 5.372%,
due 09/15/39 | | | 4,815,216 | | |
| | 2,075,000 | | | C,S | | LB-UBS Commercial
Mortgage Trust, 5.594%,
due 06/15/31 | | | 2,085,522 | | |
| | 705,000 | | | C,S | | LB-UBS Commercial
Mortgage Trust, 6.080%,
due 06/15/38 | | | 592,151 | | |
| | 3,275,000 | | | C,S | | LB-UBS Commercial
Mortgage Trust, 6.317%,
due 04/15/41 | | | 2,525,349 | | |
| | 10,000,000 | | | C,S | | LB-UBS Commercial
Mortgage Trust, 6.365%,
due 12/15/28 | | | 10,231,184 | | |
| | 11,162,795 | | | C,S | | LB-UBS Commercial
Mortgage Trust, 7.370%,
due 08/15/26 | | | 11,431,886 | | |
| | 4,674,772 | | | C | | Lehman Mortgage Trust,
5.000%, due 12/25/35 | | | 4,256,469 | | |
| | 2,888,127 | | | C,S | | Luminent Mortgage Trust,
0.514%, due 10/25/46 | | | 1,191,007 | | |
| | 332,249 | | | C,S | | MASTR Adjustable Rate
Mortgages Trust, 2.080%,
due 01/25/47 | | | 84,335 | | |
| | 63,239 | | | C,S | | MASTR Alternative
Loans Trust, 6.500%,
due 05/25/33 | | | 54,739 | | |
Principal
Amount | | | | | | Value | |
| $ | 512,275 | | | C,S | | MASTR Alternative
Loans Trust, 8.500%,
due 05/25/33 | | $ | 481,679 | | |
| | 1,316,207 | | | C,S | | MASTR Asset Securitization
Trust, 5.500%,
due 06/25/33 | | | 1,214,639 | | |
| | 3,494,576 | | | #,C,S | | MASTR Reperforming
Loan Trust, 0.674%,
due 07/25/35 | | | 2,931,611 | | |
| | 861,318 | | | C,S | | MLCC Mortgage
Investors, Inc., 0.544%,
due 04/25/29 | | | 648,142 | | |
| | 408,692 | | | C,S | | MLCC Mortgage
Investors, Inc., 0.634%,
due 01/25/29 | | | 322,103 | | |
| | 7,280,000 | | | C,S | | Morgan Stanley Capital I,
5.283%, due 12/15/43 | | | 6,950,571 | | |
| | 1,646,523 | | | C,S | | Morgan Stanley Dean
Witter Capital I, 4.180%,
due 03/12/35 | | | 1,595,896 | | |
| | 60,697 | | | C,S | | MortgageIT Trust, 0.684%,
due 11/25/35 | | | 10,353 | | |
| | 3,764,000 | | | C,S | | New York Mortgage
Trust, Inc., 5.658%,
due 05/25/36 | | | 2,441,647 | | |
| | 1,804,000 | | | C,S | | Nomura Asset Securities
Corp., 6.690%,
due 03/15/30 | | | 1,918,930 | | |
| | 1,540,500 | | | C,S | | Prime Mortgage Trust,
0.814%, due 02/25/35 | | | 879,187 | | |
| | 1,808,896 | | | C,S | | Prudential Commercial
Mortgage Trust, 3.669%,
due 02/11/36 | | | 1,781,920 | | |
| | 10,763,685 | | | C,S | | RAAC Series, 5.250%,
due 09/25/34 | | | 10,230,253 | | |
| | 1,500,592 | | | C,S | | Residential Accredit
Loans, Inc., 0.544%,
due 05/25/46 | | | 264,605 | | |
| | 4,200,801 | | | C,S | | Residential Accredit
Loans, Inc., 0.554%,
due 04/25/46 | | | 728,947 | | |
| | 15,199,610 | | | C,S | | Residential Accredit
Loans, Inc., 5.500%,
due 05/25/34 | | | 8,950,609 | | |
| | 889,830 | | | C,S | | Residential Funding
Mortgage Securities I,
0.764%, due 05/25/33 | | | 649,263 | | |
| | 586,479 | | | C,S | | Sequoia Mortgage Trust,
0.585%, due 01/20/35 | | | 326,672 | | |
| | 717,434 | | | C,S | | Structured Adjustable Rate
Mortgage Loan Trust,
0.624%, due 07/25/35 | | | 315,472 | | |
| | 1,131,434 | | | C,S | | Structured Asset Mortgage
Investments, Inc.,
0.553%, due 04/19/35 | | | 571,121 | | |
| | 5,402,224 | | | C,S | | Structured Asset Mortgage
Investments, Inc.,
3.763%, due 12/27/35 | | | 1,968,062 | | |
| | 1,036,532 | | | C,S | | Structured Asset
Securities Corp., 5.500%,
due 07/25/33 | | | 910,927 | | |
| | 1,655,170 | | | C,S | | Thornburg Mortgage
Securities Trust, 0.664%,
due 12/25/33 | | | 1,268,449 | | |
See Accompanying Notes to Financial Statements
80
PORTFOLIO OF INVESTMENTS
ING INTERMEDIATE BOND PORTFOLIO AS OF JUNE 30, 2009 (UNAUDITED) (CONTINUED)
Principal
Amount | | | | | | Value | |
| COLLATERALIZED MORTGAGE OBLIGATIONS (continued) | | | |
| $ | 1,728,536 | | | C,S | | Thornburg Mortgage
Securities Trust, 0.684%,
due 09/25/44 | | $ | 1,395,558 | | |
| | 1,415,000 | | | C,S | | TIAA Seasoned Commercial
Mortgage Trust, 6.095%,
due 08/15/39 | | | 1,326,865 | | |
| | 5,970,000 | | | C,S | | Wachovia Bank Commercial
Mortgage Trust, 5.083%,
due 03/15/42 | | | 5,150,496 | | |
| | 8,900,000 | | | C,S | | Wachovia Bank Commercial
Mortgage Trust, 5.308%,
due 11/15/48 | | | 6,821,337 | | |
| | 2,801,956 | | | C,S | | Wachovia Bank Commercial
Mortgage Trust, 5.506%,
due 03/15/45 | | | 2,797,082 | | |
| | 7,034,153 | | | C,S | | Washington Mutual
Mortgage Pass-through
Certificates, 0.604%,
due 09/25/46 | | | 1,105,074 | | |
| | 823,287 | | | C,S | | Washington Mutual
Mortgage Pass-through
Certificates, 0.624%,
due 01/25/45 | | | 383,897 | | |
| | 1,062,603 | | | C,S | | Washington Mutual
Mortgage Pass-through
Certificates, 0.634%,
due 08/25/45 | | | 577,981 | | |
| | 1,543,666 | | | C,S | | Washington Mutual
Mortgage Pass-through
Certificates, 0.714%,
due 08/25/45 | | | 513,297 | | |
| | 792,668 | | | C,S | | Washington Mutual
Mortgage Pass-through
Certificates, 0.733%,
due 06/25/44 | | | 425,450 | | |
| | 6,826,774 | | | C,S | | Washington Mutual
Mortgage Pass-through
Certificates, 2.040%,
due 03/25/47 | | | 2,292,567 | | |
| | 12,232,111 | | | C,S | | Washington Mutual
Mortgage Pass-through
Certificates, 2.080%,
due 01/25/47 | | | 4,309,765 | | |
| | 4,998,906 | | | C,S | | Washington Mutual
Mortgage Pass-through
Certificates, 2.090%,
due 06/25/47 | | | 868,292 | | |
| | 8,285,376 | | | C,S | | Washington Mutual
Mortgage Pass-through
Certificates, 2.100%,
due 04/25/47 | | | 1,616,551 | | |
| | 12,013,796 | | | C,S | | Washington Mutual
Mortgage Pass-through
Certificates, 2.110%,
due 04/25/47 | | | 4,912,717 | | |
| | 4,372,193 | | | C,S | | Washington Mutual
Mortgage Pass-through
Certificates, 2.110%,
due 05/25/47 | | | 1,226,215 | | |
| | 685,543 | | | C,S | | Washington Mutual
Mortgage Pass-through
Certificates, 2.150%,
due 12/25/46 | | | 135,629 | | |
Principal
Amount | | | | | | Value | |
| $ | 4,559,247 | | | C,S | | Washington Mutual
Mortgage Pass-through
Certificates, 2.150%,
due 07/25/47 | | $ | 1,706,916 | | |
| | 10,794,463 | | | C,S | | Washington Mutual
Mortgage Pass-through
Certificates, 2.150%,
due 07/25/47 | | | 2,029,840 | | |
| | 7,195,137 | | | C,S | | Washington Mutual
Mortgage Pass-through
Certificates, 2.180%,
due 11/25/46 | | | 2,550,369 | | |
| | 1,344,885 | | | C,S | | Washington Mutual
Mortgage Pass-through
Certificates, 2.180%,
due 11/25/46 | | | 328,974 | | |
| | 3,889,371 | | | C,S | | Washington Mutual
Mortgage Pass-through
Certificates, 2.300%,
due 09/25/46 | | | 1,412,701 | | |
| | 5,929,855 | | | C,S | | Washington Mutual
Mortgage Pass-through
Certificates, 2.310%,
due 05/25/46 | | | 1,010,334 | | |
| | 763,719 | | | C,S | | Washington Mutual
Mortgage Pass-through
Certificates, 2.310%,
due 06/25/46 | | | 271,699 | | |
| | 9,006,593 | | | C,S | | Washington Mutual
Mortgage Pass-through
Certificates, 2.330%,
due 06/25/46 | | | 3,222,372 | | |
| | 1,568,492 | | | C,S | | Washington Mutual
Mortgage Pass-through
Certificates, 2.840%,
due 11/25/46 | | | 345,068 | | |
| | 1,382,814 | | | C,S | | Washington Mutual
Mortgage Pass-through
Certificates, 2.880%,
due 10/25/46 | | | 620,503 | | |
| | 3,072,265 | | | C,S | | Washington Mutual
Mortgage Pass-through
Certificates, 6.000%,
due 06/25/34 | | | 2,755,253 | | |
| | 8,712,000 | | | C,S | | Wells Fargo
Mortgage-Backed
Securities Trust, 4.775%,
due 07/25/34 | | | 7,908,450 | | |
| | 3,264,864 | | | C,S | | Wells Fargo
Mortgage-Backed
Securities Trust, 4.878%,
due 08/25/34 | | | 2,948,433 | | |
| | 4,991,103 | | | C,S | | Wells Fargo
Mortgage-Backed
Securities Trust, 5.000%,
due 12/25/33 | | | 4,341,497 | | |
| | 11,215,580 | | | #,C,S | | Wells Fargo
Mortgage-Backed
Securities Trust, 5.317%,
due 06/26/35 | | | 9,196,776 | | |
| | 9,091,879 | | | C,S | | Wells Fargo
Mortgage-Backed
Securities Trust,
5.388%, due 08/25/35 | | | 6,905,325 | | |
See Accompanying Notes to Financial Statements
81
PORTFOLIO OF INVESTMENTS
ING INTERMEDIATE BOND PORTFOLIO AS OF JUNE 30, 2009 (UNAUDITED) (CONTINUED)
Principal
Amount | | | | | | Value | |
| COLLATERALIZED MORTGAGE OBLIGATIONS (continued) | | | |
| $ | 6,498,247 | | | C,S | | Wells Fargo
Mortgage-Backed
Securities Trust, 5.921%,
due 11/25/36 | | $ | 4,301,046 | | |
Total Collateralized
Mortgage Obligations
(Cost $467,957,798) | | | 327,027,504 | | |
| OTHER BONDS: 1.9% | | | |
| | | | | Foreign Government Bonds: 1.9% | |
| BRL | 123,511,000 | | | | | Brazil Notas do Tesouro
Nacional Series F,
10.000%, due 01/01/17 | | | 55,031,573 | | |
Total Other Bonds
(Cost $52,694,129) | | | 55,031,573 | | |
| Shares | | | | | | Value | |
| PREFERRED STOCK: 0.2% | | | |
| | | | | Diversified Financial Services: 0.2% | |
| | 8,933 | | | #,P | | Zurich RegCaPS
Funding Trust | | $ | 5,412,840 | | |
Total Preferred Stock
(Cost $8,486,350) | | | 5,412,840 | | |
Total Long-Term Investments
(Cost $3,264,711,291) | | | 3,121,365,722 | | |
| SHORT-TERM INVESTMENTS: 32.0% | | | |
| | | | | Affiliated Mutual Fund: 2.7% | |
| | 76,799,000 | | | S | | ING Institutional Prime
Money Market
Fund - Class I | | | 76,799,000 | | |
Total Mutual Fund
(Cost $76,799,000) | | | 76,799,000 | | |
Principal
Amount | | | | | | Value | |
| | | | | Commercial Paper: 10.3% | |
| $ | 6,000,000 | | | S | | ASB Finance Ltd., 0.550%,
due 07/15/09 | | $ | 5,998,628 | | |
| | 25,000,000 | | | | | Barton Capital, 0.260%,
due 07/15/09 | | | 24,997,292 | | |
| | 23,100,000 | | | | | Caisse Nationale des
Caisses d' Epargne,
0.440%, due 09/16/09 | | | 23,076,438 | | |
| | 15,000,000 | | | S | | Caisse Nationale des
Caisses d' Epargne,
0.600%, due 07/01/09 | | | 14,999,712 | | |
| | 733,000 | | | S | | Ciesco L.P., 0.390%,
due 08/19/09 | | | 732,363 | | |
| | 10,894,000 | | | S | | General Mills, Inc., 0.400%,
due 07/21/09 | | | 10,891,458 | | |
| | 4,000,000 | | | S | | General Mills, Inc., 0.450%,
due 07/10/09 | | | 3,999,500 | | |
| | 25,000,000 | | | | | HSBC Finance Corp.,
0.480%, due 07/27/09 | | | 24,991,000 | | |
| | 7,355,000 | | | | | Kellogg Co., 0.300%,
due 07/13/09 | | | 7,354,203 | | |
Principal
Amount | | | | | | Value | |
| $ | 12,000,000 | | | | | Kellogg Co., 0.400%,
due 07/06/09 | | $ | 11,999,200 | | |
| | 8,000,000 | | | S | | Kellogg Co., 0.400%,
due 07/09/09 | | | 7,999,200 | | |
| | 12,465,000 | | | S | | Louis Drefus Corp.,
0.420%, due 09/01/09 | | | 12,455,901 | | |
| | 4,750,000 | | | S | | Louis Drefus Corp.,
0.450%, due 07/06/09 | | | 4,749,644 | | |
| | 26,750,000 | | | S | | Louis Drefus Corp.,
0.460%, due 09/21/09 | | | 26,721,378 | | |
| | 10,500,000 | | | S | | Natixis Finance, 0.600%,
due 10/13/09 | | | 10,481,625 | | |
| | 20,000,000 | | | S | | Natixis Finance, 0.520%,
due 08/03/09 | | | 20,010,366 | | |
| | 25,000,000 | | | | | Verizon
Communications, Inc.,
0.320%, due 07/16/09 | | | 24,996,445 | | |
| | 25,500,000 | | | | | Weatherford
International Ltd.,
0.450%, due 07/01/09 | | | 25,499,681 | | |
| | 29,500,000 | | | S | | Westpac Banking Corp.,
0.570%, due 09/14/09 | | | 29,478,759 | | |
Total Commercial Paper
(Cost $291,399,089) | | | 291,432,793 | | |
| | | | | U.S. Treasury Bills: 0.2% | |
| | 7,000,000 | | | | | 0.160%, due 09/24/09 | | | 6,997,270 | | |
Total U.S. Treasury Bills
(Cost $6,980,109) | | | 6,997,270 | | |
| | | | | Securities Lending Collateralcc: 18.8% | |
| | 533,761,298 | | | | | Bank of New York
Mellon Corp. Institutional
Cash Reserves | | | 531,919,786 | | |
Total Securities
Lending Collateral
(Cost $533,761,298) | | | | 531,919,786 | |
Total Short-Term Investments
(Cost $908,939,496) | | | | 907,148,849 | |
Total Investments in
Securities
(Cost $4,173,650,787)* | | | 142.3 | % | | $ | 4,028,514,571 | | |
Other Assets and
Liabilities - Net | | | (42.3 | ) | | | (1,198,453,986 | ) | |
| Net Assets | | | 100.0 | % | | $ | 2,830,060,585 | | |
@@ Foreign Issuer
MASTR Mortgage Asset Securitization Transaction, Inc.
# Securities with purchases pursuant to Rule 144A or section 4(2), under the Securities Act of 1933 and may not be resold subject to that rule except to qualified institutional buyers. Unless otherwise noted, these securities have been determined to be liquid under the guidelines established by the Funds' Board of Directors/Trustees.
C Bond may be called prior to maturity date.
P Preferred Stock may be called prior to convertible date.
cc Securities purchased with cash collateral for securities loaned.
## On September 7, 2008, the Federal Housing Finance Agency placed the Federal National Mortgage Association and the Federal Home Loan Mortgage Corporation into conservatorship and the U.S. Treasury guaranteed the debt issued by those organizations.
W Settlement is on a when-issued or delayed-delivery basis.
See Accompanying Notes to Financial Statements
82
PORTFOLIO OF INVESTMENTS
ING INTERMEDIATE BOND PORTFOLIO AS OF JUNE 30, 2009 (UNAUDITED) (CONTINUED)
S All or a portion of this security is segregated to cover collateral requirements for applicable futures, options, swaps, foreign forward currency contracts and/or when-issued or delayed-delivery securities.
I Illiquid security
L Loaned security, a portion or all of the security is on loan at June 30, 2009.
± Defaulted security
X Fair value determined by ING Funds Valuation Committee appointed by the Funds' Board of Directors/Trustees.
^ Interest only securities represent the right to receive the monthly interest payments on an underlying pool of mortgage loans. Principal amount shown represents the notional amount on which current interest is calculated. Payments of principal on the pool reduce the value of the interest only security.
Z Indicates Zero Coupon Bond; rate shown reflects current effective yield.
BRL Brazilian Real
* Cost for federal income tax purposes is $4,182,902,191.
Net unrealized depreciation consists of:
| Gross Unrealized Appreciation | | $ | 72,644,268 | | |
| Gross Unrealized Depreciation | | | (227,031,888 | ) | |
| Net Unrealized Depreciation | | $ | (154,387,620 | ) | |
The following is a summary of the inputs used as of June 30, 2009 in determining the Portfolio's investments at fair value for purposes of SFAS 157:
| | | Quoted Prices
in Active
Markets
for Identical
Investments
(Level 1) | | Significant
Other
Observable
Inputs
(Level 2) | | Significant
Unobservable
Inputs
(Level 3) | |
| Preferred Stock | | $ | — | | | $ | 5,412,840 | | | $ | — | | |
| Corporate Bonds/Notes | | | — | | | | 859,981,585 | | | | 1,092,062 | | |
U.S. Government
Agency Obligations | | | — | | | | 1,090,219,311 | | | | — | | |
U.S. Treasury
Obligations | | | — | | | | 735,837,511 | | | | — | | |
Asset-Backed
Securities | | | — | | | | 46,763,336 | | | | — | | |
Collateralized
Mortgage
Obligations | | | — | | | | 317,485,660 | | | | 9,541,844 | | |
Foreign Government
Bonds | | | — | | | | — | | | | 55,031,573 | | |
Short-Term
Investments | | | 76,799,000 | | | | 830,349,849 | | | | — | | |
| Total | | $ | 76,799,000 | | | $ | 3,886,050,092 | | | $ | 65,665,479 | | |
Other Financial
Instruments** | | | (1,892,937 | ) | | | (4,334,985 | ) | | | — | | |
| Total | | $ | (1,892,937 | ) | | $ | (4,334,985 | ) | | $ | — | | |
The following is a reconciliation of the fair value measurements using significant unobservable inputs (Level 3) for the period ended June 30, 2009:
| | | Beginning
Balance
12/31/08 | | Net
Purchases/
(Sales) | | Accrued
Discounts/
(Premiums) | | Total
Realized
Gain/(Loss) | | Total
Unrealized
Appreciation/
(Depreciation) | | Net Transfers
In/(Out) of
Level 3 | | Ending
Balance
at 06/30/09 | |
| Corporate Bonds/Notes | | $ | 13,813,319 | | | $ | (10,954,200 | ) | | $ | (103,062 | ) | | $ | (4,970,645 | ) | | $ | 3,306,650 | | | $ | — | | | $ | 1,092,062 | | |
Collateralized Mortgage
Obligations | | | 9,310,838 | | | | 957,496 | | | | (26,108 | ) | | | (1,763,600 | ) | | | 1,063,218 | | | | — | | | | 9,541,844 | | |
| Foreign Government Bonds | | | 21,291,606 | | | | 38,804,508 | | | | (824,133 | ) | | | (18,395,608 | ) | | | 21,531,775 | | | | (7,376,575 | ) | | | 55,031,573 | | |
| Total | | $ | 44,415,763 | | | $ | 28,807,804 | | | $ | (953,303 | ) | | $ | (25,129,853 | ) | | $ | 25,901,643 | | | $ | (7,376,575 | ) | | $ | 65,665,479 | | |
For the period ended June 30, 2009, total change in unrealized gain (loss) on Level 3 securities still held at period end and included in the change in net assets was $4,795,538. Total unrealized gain (loss) for all securities (including Level 1 and Level 2) can be found on the accompanying Statement of Operations.
"Fair value" for purposes of SFAS 157 is different from "fair value" as used in the 1940 Act. The former generally implies market value, and can include market quotations as a source of value, and the latter refers to determinations of value in absence of available market quotations.
* See NOTE 2, "Significant Accounting Policies" in the Notes to Financial Statements for additional information.
** Other financial instruments may include open forward foreign currency contracts, futures, swaps, and written options. Forward foreign currency contracts and futures are reported at their unrealized gain/loss at period end. Swaps and written options are reported at their market value at period end.
ING Intermediate Bond Portfolio Open Futures Contracts on June 30, 2009:
Contract
Description | | Number of
Contracts | | Expiration
Date | | Unrealized
Depreciation | |
| Long Contracts | |
| U.S. Treasury 2-Year Note | | | 7 | | | 09/30/09 | | $ | (2,314 | ) | |
| | | | | | | | | $ | (2,314 | ) | |
| Short Contracts | |
| U.S. Treasury 10-Year Note | | | 542 | | | 09/21/09 | | $ | (208,842 | ) | |
| U.S. Treasury Long Bond | | | 611 | | | 09/21/09 | | | (1,681,781 | ) | |
| | | | | | | | | $ | (1,890,623 | ) | |
See Accompanying Notes to Financial Statements
83
PORTFOLIO OF INVESTMENTS
ING INTERMEDIATE BOND PORTFOLIO AS OF JUNE 30, 2009 (UNAUDITED) (CONTINUED)
ING Intermediate Bond Portfolio Credit Default Swap Agreements Outstanding on June 30, 2009:
Credit Default Swaps on Corporate and Sovereign Issues — Buy Protection(1)
| Counterparty | | Reference
Entity/Obligation | | Buy/Sell
Protection | | (Pay)/
Receive
Fixed
Rate (%) | | Termination
Date | | Notional
Amount(2) | | Market
Value(3) | | Upfront
Premium
Paid/
(Received) | | Unrealized
Appreciation/
(Depreciation) | |
Morgan Stanley
Capital
Services Inc. | | Domtar Inc.
7.875%, 10/15/11 | | Buy | | | (2.650 | ) | | 09/20/11 | | USD | 2,758,500 | | | $ | 223,041 | | | $ | — | | | $ | 223,041 | | |
Goldman Sachs
International | | Dow Chemical Co.
7.375%, 11/01/29 | | Buy | | | (1.280 | ) | | 12/20/13 | | USD | 9,850,000 | | | | 474,691 | | | | — | | | | 474,691 | | |
Barclays
Bank PLC | | Gap Inc.
8.800%, 12/15/08* | | Buy | | | (1.200 | ) | | 06/20/13 | | USD | 3,711,000 | | | | (117,644 | ) | | | — | | | | (117,644 | ) | |
Citibank N.A.,
New York | | MBIA Inc.
6.625%, 10/01/28 | | Buy | | | (5.000 | ) | | 09/20/13 | | USD | 1,710,000 | | | | 475,193 | | | | 488,300 | | | | (13,107 | ) | |
Citibank N.A.,
New York | | MBIA Inc.
6.625%, 10/01/28 | | Buy | | | (5.000 | ) | | 09/20/13 | | USD | 3,460,000 | | | | 961,503 | | | | 948,254 | | | | 13,249 | | |
JPMorgan Chase
Bank, N.A.
New York | | MBIA Inc.
6.625%, 10/01/28 | | Buy | | | (5.000 | ) | | 09/20/13 | | USD | 13,751,000 | | | | 3,821,278 | | | | 2,050,901 | | | | 1,770,377 | | |
| | | | | | | | | | | | | $ | 35,240,500 | | | $ | 5,838,062 | | | $ | 3,487,455 | | | $ | 2,350,607 | | |
Credit Default Swaps on Corporate and Sovereign Issues — Sell Protection(4)
| Counterparty | | Reference
Entity/Obligation | | Buy/Sell
Protection | | (Pay)/
Receive
Fixed
Rate (%) | | Termination
Date | | Implied
Credit
Spread at
06/30/09(%)(5) | | Notional
Amount(2) | | Market
Value(3) | | Upfront
Premium
Paid/
(Received) | | Unrealized
Appreciation/
(Depreciation) | |
| UBS AG | | Domtar Inc.
7.875%, 10/15/11 | | Sell | | | 2.600 | | | 09/20/11 | | | 6.71 | | | USD | 2,761,000 | | | $ | (225,993 | ) | | $ | — | | | $ | (225,993 | ) | |
Citibank N.A.,
New York | | MBIA Global Funding
LLC, FRN, 10/06/10 | | Sell | | | 5.000 | | | 09/20/13 | | | 43.87 | | | USD | 1,710,000 | | | | (1,098,874 | ) | | | (543,320 | ) | | | (555,554 | ) | |
Citibank N.A.,
New York | | MBIA Global Funding
LLC, FRN, 10/06/10 | | Sell | | | 5.000 | | | 09/20/13 | | | 43.87 | | | USD | 3,460,000 | | | | (2,223,451 | ) | | | (1,199,261 | ) | | | (1,024,190 | ) | |
Goldman Sachs
International | | MBIA Global Funding
LLC, FRN, 10/06/10 | | Sell | | | 5.000 | | | 09/20/13 | | | 43.87 | | | USD | 3,435,000 | | | | (2,207,386 | ) | | | (1,077,590 | ) | | | (1,129,796 | ) | |
JPMorgan
Chase
Bank, N.A.
New York | | MBIA Global Funding
LLC, FRN, 10/06/10 | | Sell | | | 5.000 | | | 09/20/13 | | | 43.87 | | | USD | 6,874,000 | | | | (4,417,342 | ) | | | (1,082,184 | ) | | | (3,335,158 | ) | |
| | | | | | | | | | | | | | | | | $ | 18,240,000 | | | $ | (10,173,047 | ) | | $ | (3,902,356 | ) | | $ | (6,270,691 | ) | |
* In the event of a default, if this bond is no longer available an equivalent bond will be delivered.
(1) If a Fund is a buyer of protection and a credit event occurs, as defined under the terms of that paticular swap agreement, a Fund will either 1.) receive from the seller of protection an amount equal to the notional amount of the swap and deliver the referenced obligation, other deliverable obligations or underlying securities comprising the referenced index or 2.) receive a net settlement amount in the form of cash or securities equal to the notional amount of the swap less the recovery value of the referenced obligation or underlying securities comprising the referenced index.
(2) The maximum amount of future payments (undiscounted) that a Fund as seller of protection could be required to make or receive as a buyer of credit protection under a credit default swap agreement would be an amount equal to the notional amount of the agreement.
(3) The market values for credit default swap agreements serve as an indicator of the current status of the payment/performance risk and represent the likelihood or risk of default for the credit derivative. Increasing market values, in absolute terms, when compared to the notional amount of the agreement, represent a deterioration of the referenced obligation's credit soundness and a greater likelihood or risk of default or other credit event occurring.
(4) If the Fund is a seller of protection, and a credit event occurs, as defined under the terms of that particular swap agreement, the Fund will generally either 1.) Pay to the buyer an amount equal to the notional amount of the swap and take delivery of the referenced obligation, other deliverable obligations, or underlying securities comprising a referenced index or 2.) Pay a net settlement amount in the form of cash or securities equal to the notional amount of the swap less the recovery value of the referenced obligation or underlying securities comprising a referenced index.
See Accompanying Notes to Financial Statements
84
PORTFOLIO OF INVESTMENTS
ING INTERMEDIATE BOND PORTFOLIO AS OF JUNE 30, 2009 (UNAUDITED) (CONTINUED)
(5) Implied credit spreads, represented in absolute terms, utilized in determining the market value of credit default swap agreements on corporate issues or sovereign issues are disclosed in the table above and serve as an indicator of the current status of the payment/performance risk and represent the likelihood or risk of default for the credit derivative. The implied credit spread of a particular referenced entity reflects the cost of buying/selling protection and may include upfront payments required to be made to enter into the agreement. For credit default swaps on asset-backed securities or credit indices, the quoted market prices and resulting market values serve as the indicator of the current status of the payment/performance risk. Wider credit spreads and increasing market values, in absolute terms when compared to the notional amount of the swap, represent a deterioration of the referenced entity's credit soundness an d a greater likelihood or risk of default or other credit event occurring as defined under the terms of the agreement.
A summary of derivative instruments by primary risk exposure is outlined in the following tables.
The fair value of derivative instruments as of June 30, 2009 was as follows:
Derivatives not accounted for as hedging
instruments under SFAS No. 133 | | Location on Statement of Assets and Liabilities | | Fair Value | |
| Asset Derivatives | |
| Credit contracts | | Unrealized appreciation on swap agreements, net of upfront payments made | | $ | 5,968,813 | | |
| Total Asset Derivatives | | | | $ | 5,968,813 | | |
| Liability Derivatives | |
| Credit contracts | | Unrealized depreciation on swap agreements, net of upfront payments received | | $ | 10,303,798 | | |
| Total Liability Derivatives | | | | $ | 10,303,798 | | |
The effect of derivative instruments on the Portfolio's Statement of Operations for the six months ended June 30, 2009 was as follows:
| Amount of Realized Gain or (Loss) on Derivatives Recognized in Income | |
Derivatives not accounted for as hedging
instruments under SFAS No. 133 | | Forward Foreign
Currency Contracts | | Futures | | Swaps | | Total | |
| Foreign exchange contracts | | $ | (5,891,329 | ) | | $ | — | | | $ | — | | | $ | (5,891,329 | ) | |
| Interest rate contracts | | | — | | | | 12,056,252 | | | | 1,649,279 | | | | 13,705,531 | | |
| Credit contracts | | | — | | | | — | | | | 29,464,416 | | | | 29,464,416 | | |
| Total | | $ | (5,891,329 | ) | | $ | 12,056,252 | | | $ | 31,113,695 | | | $ | 37,278,618 | | |
| Change in Unrealized Appreciation or (Depreciation) on Derivatives Recognized in Income | |
Derivatives not accounted for as hedging
instruments under SFAS No. 133 | | Forward Foreign
Currency Contracts | | Futures | | Swaps | | Total | |
| Foreign exchange contracts | | $ | 2,296,570 | | | $ | — | | | $ | — | | | $ | 2,296,570 | | |
| Interest rate contracts | | | — | | | | 12,940,053 | | | | (1,803,696 | ) | | | 11,136,357 | | |
| Credit contracts | | | — | | | | — | | | | (39,724,211 | ) | | | (39,724,211 | ) | |
| Total | | $ | 2,296,570 | | | $ | 12,940,053 | | | $ | (41,527,907 | ) | | $ | (26,291,284 | ) | |
See Accompanying Notes to Financial Statements
85
PORTFOLIO OF INVESTMENTS
ING MONEY MARKET PORTFOLIO(1) AS OF JUNE 30, 2009 (UNAUDITED)
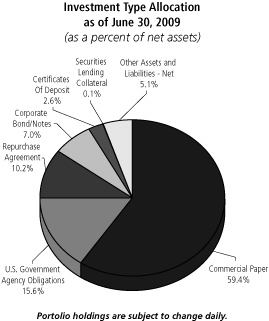
Principal
Amount | | | | | | Value | |
| CERTIFICATES OF DEPOSIT: 2.6% | | | |
| $ | 19,000,000 | | | | | Svenska Handelsbanken AB,
0.570%, due 07/17/09 | | $ | 19,000,674 | | |
22,000,000 UBS AG, 0.280%,
due 07/01/09 | | | 22,000,000 | | |
Total Certificates of Deposit
(Cost $41,000,674) | | | 41,000,674 | | |
| COMMERCIAL PAPER: 59.4% | | | |
| | 5,500,000 | | | | | American Honda Finance,
0.630%, due 08/25/09 | | | 5,494,615 | | |
| | 2,000,000 | | | | | ANZ National Bank Ltd.,
0.510%, due 09/14/09 | | | 1,997,833 | | |
| | 6,000,000 | | | | | ASB Finance Ltd., 0.510%,
due 09/21/09 | | | 5,992,893 | | |
| | 7,000,000 | | | | | ASB Finance Ltd., 0.690%,
due 09/15/09 | | | 6,989,656 | | |
| | 10,000,000 | | | | | ASB Finance Ltd., 0.790%,
due 10/22/09 | | | 9,974,889 | | |
| | 5,000,000 | | | | | Barton Capital, LLC, 0.310%,
due 07/06/09 | | | 4,999,743 | | |
| | 1,500,000 | | | | | Barton Capital, LLC, 0.340%,
due 07/07/09 | | | 1,499,900 | | |
| | 6,500,000 | | | | | Barton Capital, LLC, 0.340%,
due 08/18/09 | | | 6,496,967 | | |
| | 10,635,000 | | | | | Barton Capital, LLC, 0.350%,
due 08/10/09 | | | 10,630,819 | | |
| | 3,444,000 | | | | | Barton Capital, LLC, 0.350%,
due 09/09/09 | | | 3,441,656 | | |
| | 11,000,000 | | | | | Barton Capital, LLC, 0.350%,
due 09/17/09 | | | 10,991,658 | | |
Principal
Amount | | | | | | Value | |
| $ | 17,000,000 | | | | | Barton Capital, LLC, 0.440%,
due 07/17/09 | | $ | 16,996,480 | | |
| | 4,000,000 | | | | | Cafco, LLC, 0.340%,
due 08/20/09 | | | 3,998,056 | | |
| | 16,500,000 | | | | | Cafco, LLC, 0.370%,
due 08/27/09 | | | 16,490,073 | | |
| | 7,000,000 | | | | | Cafco, LLC, 0.470%,
due 08/11/09 | | | 6,996,173 | | |
| | 25,000,000 | | | | | Cafco, LLC, 0.740%,
due 09/15/09 | | | 24,960,416 | | |
| | 10,500,000 | | | | | Caisse Nationale des
Caisses d'Epargne et
de Prevoyance, 0.440%,
due 09/16/09 | | | 10,489,894 | | |
| | 12,000,000 | | | | | Caisse Nationale des
Caisses d'Epargne et
de Prevoyance, 0.470%,
due 08/31/09 | | | 11,990,240 | | |
| | 3,000,000 | | | | | Caisse Nationale des
Caisses d'Epargne et
de Prevoyance, 0.360%,
due 07/01/09 | | | 3,000,000 | | |
| | 22,000,000 | | | | | CBA Finance, Inc., 0.350%,
due 09/30/09 | | | 21,980,535 | | |
| | 12,000,000 | | | | | Ciesco, LLC, 0.380%,
due 07/27/09 | | | 11,996,620 | | |
| | 8,500,000 | | | | | Ciesco, LLC, 0.390%,
due 08/19/09 | | | 8,495,372 | | |
| | 12,000,000 | | | | | Ciesco, LLC, 0.440%,
due 09/09/09 | | | 11,989,500 | | |
| | 25,000,000 | | | | | Ciesco, LLC, 0.740%,
due 09/14/09 | | | 24,960,937 | | |
| | 22,500,000 | | | | | Concord Minutemen
Capital Co., LLC, 1.770%,
due 08/27/09 | | | 22,435,875 | | |
| | 32,000,000 | | | | | Concord Minutemen
Capital Co., LLC, 1.910%,
due 10/22/09 | | | 31,807,147 | | |
| | 22,000,000 | | | | | Crown Point Capital Co.,
1.770%, due 08/26/09 | | | 21,938,400 | �� | |
| | 32,500,000 | | | | | Crown Point Capital Co.,
1.910%, due 10/21/09 | | | 32,305,866 | | |
| | 1,500,000 | | | | | Danske Corp., 0.370%,
due 09/08/09 | | | 1,498,908 | | |
| | 7,000,000 | | | | | Danske Corp., 0.480%,
due 07/29/09 | | | 6,997,278 | | |
| | 15,000,000 | | | | | Danske Corp., 0.550%,
due 12/18/09 | | | 14,961,042 | | |
| | 22,000,000 | | | | | Dexia, 0.290%, due 07/06/09 | | | 21,998,931 | | |
| | 18,000,000 | | | | | Edison Asset Securities, LLC,
0.540%, due 10/30/09 | | | 17,966,927 | | |
| | 16,750,000 | | | | | Edison Asset Securities, LLC,
0.580%, due 09/21/09 | | | 16,728,065 | | |
| | 13,250,000 | | | | | Edison Asset Securities, LLC,
0.680%, due 10/20/09 | | | 13,222,219 | | |
| | 7,000,000 | | | | | Edison Asset Securities, LLC,
0.700%, due 10/21/09 | | | 6,984,756 | | |
| | 19,000,000 | | | | | Jupiter Securities Co., LLC,
0.300%, due 07/13/09 | | | 18,997,910 | | |
| | 7,000,000 | | | | | Jupiter Securities Co., LLC,
0.300%, due 08/25/09 | | | 6,996,685 | | |
| | 25,500,000 | | | | | Jupiter Securities Co., LLC,
0.340%, due 07/23/09 | | | 25,494,610 | | |
See Accompanying Notes to Financial Statements
86
PORTFOLIO OF INVESTMENTS
ING MONEY MARKET PORTFOLIO(1) AS OF JUNE 30, 2009 (UNAUDITED) (CONTINUED)
Principal
Amount | | | | | | Value | |
| COMMERCIAL PAPER (continued) | | | |
| $ | 4,000,000 | | | | | Jupiter Securities Co., LLC,
0.360%, due 08/12/09 | | $ | 3,998,273 | | |
| | 22,000,000 | | | | | KFW International Finance,
Inc., 0.170%, due 07/07/09 | | | 21,999,267 | | |
| | 23,000,000 | | | | | Natexis Banques Populaires
US Finance Co, LLC,
0.510%, due 08/24/09 | | | 22,982,060 | | |
| | 4,000,000 | | | | | Old Line Funding, LLC,
0.350%, due 09/02/09 | | | 3,997,480 | | |
| | 2,500,000 | | | | | Old Line Funding, LLC,
0.370%, due 09/15/09 | | | 2,498,047 | | |
| | 1,000,000 | | | | | Old Line Funding, LLC,
0.390%, due 08/13/09 | | | 999,522 | | |
| | 10,500,000 | | | | | Old Line Funding, LLC,
0.400%, due 07/14/09 | | | 10,498,321 | | |
| | 28,000,000 | | | | | Old Line Funding, LLC,
0.400%, due 10/15/09 | | | 27,966,198 | | |
| | 8,500,000 | | | | | Old Line Funding, LLC,
0.450%, due 07/15/09 | | | 8,498,413 | | |
| | 5,500,000 | | | | | Park Avenue Receivables,
0.240%, due 07/21/09 | | | 5,499,236 | | |
| | 4,500,000 | | | | | Park Avenue Receivables,
0.270%, due 07/10/09 | | | 4,499,663 | | |
| | 13,500,000 | | | | | Park Avenue Receivables,
0.270%, due 07/22/09 | | | 13,497,795 | | |
| | 9,000,000 | | | | | Park Avenue Receivables,
0.340%, due 08/05/09 | | | 8,996,938 | | |
| | 10,000,000 | | | | | Park Avenue Receivables,
0.360%, due 08/06/09 | | | 9,996,300 | | |
| | 10,000,000 | | | | | Park Avenue Receivables,
0.370%, due 07/13/09 | | | 9,998,667 | | |
| | 5,000,000 | | | | | Societe Generale, 0.440%,
due 09/15/09 | | | 4,995,250 | | |
| | 6,000,000 | | | | | Societe Generale, 0.710%,
due 07/16/09 | | | 6,000,025 | | |
| | 12,500,000 | | | @@,# | | Societe Generale, 1.060%,
due 09/04/09 | | | 12,500,000 | | |
| | 3,000,000 | | | | | Thunder Bay Funding, LLC,
0.350%, due 09/10/09 | | | 2,997,929 | | |
| | 8,500,000 | | | | | Thunder Bay Funding, LLC,
0.360%, due 09/08/09 | | | 8,494,135 | | |
| | 17,000,000 | | | | | Thunder Bay Funding, LLC,
0.390%, due 07/07/09 | | | 16,998,725 | | |
| | 12,500,000 | | | | | Thunder Bay Funding, LLC,
0.400%, due 10/19/09 | | | 12,484,722 | | |
| | 8,500,000 | | | | | Thunder Bay Funding, LLC,
0.450%, due 07/15/09 | | | 8,498,413 | | |
| | 7,500,000 | | | | | Thunder Bay Funding, LLC,
0.550%, due 10/08/09 | | | 7,488,656 | | |
| | 13,100,000 | | | | | Toyota Motor Credit Corp.,
0.660%, due 07/10/09 | | | 13,100,000 | | |
| | 2,000,000 | | | | | Tulip Funding Corp., 0.260%,
due 07/14/09 | | | 1,999,798 | | |
| | 12,000,000 | | | | | Tulip Funding Corp., 0.270%,
due 07/10/09 | | | 11,999,100 | | |
| | 28,000,000 | | | | | Tulip Funding Corp., 0.280%,
due 07/31/09 | | | 27,993,232 | | |
| | 19,000,000 | | | | | Variable Funding Capital,
0.570%, due 08/25/09 | | | 18,983,164 | | |
| | 25,000,000 | | | | | Variable Funding Capital,
0.960%, due 10/15/09 | | | 24,928,597 | | |
| | 12,000,000 | | | | | Variable Funding Capital,
1.120%, due 08/10/09 | | | 11,984,667 | | |
Principal
Amount | | | | | | Value | |
| $ | 14,000,000 | | | @@,# | | Westpac Banking Corp.,
0.560%, due 07/03/09 | | $ | 14,000,000 | | |
| | 9,000,000 | | | | | Westpac Banking Corp.,
0.570%, due 09/14/09 | | | 8,989,125 | | |
| | 10,000,000 | | | | | Windmill Funding Corp.,
0.270%, due 07/31/09 | | | 9,997,667 | | |
| | 8,000,000 | | | | | Yorktown Capital, LLC,
0.370%, due 09/21/09 | | | 7,992,893 | | |
| | 1,000,000 | | | | | Yorktown Capital, LLC,
0.390%, due 08/10/09 | | | 999,556 | | |
| | 8,500,000 | | | | | Yorktown Capital, LLC,
0.490%, due 08/03/09 | | | 8,496,104 | | |
| | 12,000,000 | | | | | Yorktown Capital, LLC,
0.490%, due 09/10/09 | | | 11,988,167 | | |
| | 15,000,000 | | | | | Yorktown Capital, LLC,
0.500%, due 10/09/09 | | | 14,979,167 | | |
12,000,000 Yorktown Capital, LLC,
0.500%, due 10/16/09 | | | 11,982,167 | | |
Total Commercial Paper
(Cost $939,986,983) | | | 939,986,983 | | |
| CORPORATE BONDS/NOTES: 7.0% | | | |
| | 10,000,000 | | | | | American Honda Finance,
0.200%, due 07/14/09 | | | 9,999,206 | | |
| | 7,500,000 | | | | | American Honda Finance,
0.470%, due 09/16/09 | | | 7,492,300 | | |
| | 23,000,000 | | | @@,# | | Australia & New Zealand
Banking Group Ltd.,
0.890%, due 09/02/09 | | | 23,000,000 | | |
| | 11,000,000 | | | | | BNP Paribas, 0.250%,
due 07/29/09 | | | 11,000,000 | | |
| | 14,000,000 | | | @@ | | BNP Paribas, 1.150%,
due 08/13/09 | | | 14,000,000 | | |
| | 18,000,000 | | | | | Rabobank USA Financial Corp.,
0.070%, due 07/02/09 | | | 17,999,930 | | |
| | 3,300,000 | | | | | Rabobank USA Financial Corp.,
0.150%, due 07/13/09 | | | 3,299,825 | | |
25,000,000 US Bank NA, 0.760%,
due 08/24/09 | | | 25,000,000 | | |
Total Corporate Bonds/Notes
(Cost $111,791,261) | | | 111,791,261 | | |
| U.S. GOVERNMENT AGENCY OBLIGATIONS: 15.6% | | | |
| | 113,775,000 | | | | | Federal Home Loan Bank,
0.700%, due 12/14/09 | | | 113,407,760 | | |
| | 4,000,000 | | | | | Federal Home Loan Bank,
0.720%, due 08/07/09 | | | 4,008,028 | | |
| | 23,000,000 | | | | | Federal Home Loan Bank,
0.800%, due 11/18/09 | | | 22,928,444 | | |
| | 3,000,000 | | | | | Federal Home Loan
Mortgage Corporation,
0.560%, due 08/10/09 | | | 2,998,100 | | |
| | 25,000,000 | | | L | | Federal Home Loan
Mortgage Corporation,
0.710%, due 07/12/10 | | | 25,878,685 | | |
| | 5,500,000 | | | | | Federal Home Loan
Mortgage Corporation,
0.860%, due 01/05/10 | | | 5,475,299 | | |
| | 3,750,000 | | | | | Federal Home Loan
Mortgage Corporation,
0.880%, due 02/09/10 | | | 3,841,179 | | |
| | 48,222,000 | | | | | Federal National Mortgage
Association, 0.620%,
due 12/01/09 | | | 48,093,827 | | |
See Accompanying Notes to Financial Statements
87
PORTFOLIO OF INVESTMENTS
ING MONEY MARKET PORTFOLIO(1) AS OF JUNE 30, 2009 (UNAUDITED) (CONTINUED)
Principal
Amount | | | | | | Value | |
| U.S. GOVERNMENT AGENCY OBLIGATIONS (continued) | |
| $ | 3,500,000 | | | | | Federal National Mortgage
Association, 0.690%,
due 07/12/10 | | $3,583,004 | |
| | 17,000,000 | | | | | Federal National Mortgage
Association, 1.330%,
due 12/15/09 | | | | | 17,255,097 | | |
| | | | Total U.S. Government
Agency Obligations
(Cost $247,469,423) | | | | | 247,469,423 | | |
| REPURCHASE AGREEMENT: 10.2% | |
| | 105,412,000 | | | Goldman Sachs Repurchase
Agreement dated 06/30/09,
0.040%, due 07/01/09,
$296,310,138 to be received
upon repurchase
(Collateralized by $105,412,117
U.S. Treasury, Discount Notes,
Market Value $108,574,366,
due 05/15/26-02/15/36) | | | 105,412,000 | | |
56,000,000Morgan Stanley Repurchase
Agreement dated 06/30/09,
0.030%, due 07/01/09,
$54,285,000 to be received
upon repurchase
(Collateralized by $56,000,047
Federal Home Loan Mortgage
Corporation, 1.450%-6.875%,
Market Value plus accrued
interest $58,151,234,
due 05/28/10-03/27/19) | | | 56,000,000 | | |
Total Repurchase Agreement
(Cost $161,412,000) | | | 161,412,000 | | |
| SECURITIES LENDING COLLATERALcc: 0.1% | | | |
1,077,010Bank of New York Mellon Corp.
Institutional Cash Reserves | | | 927,609 | | |
Total Securities Lending Collateral
(Cost $1,077,010) | | | 927,609 | | |
Total Investments in
Securities
(Cost $1,502,737,351)* | | | 94.9 | % | | $ | 1,502,587,950 | | |
Other Assets and
Liabilities - Net | | | 5.1 | | | | 80,682,988 | | |
| Net Assets | | | 100.0 | % | | $ | 1,583,270,938 | | |
(1) All securities with a maturity date of greater than 13 months have either a variable rate, a demand feature, prerefunded, optional or mandatory put resulting in a maturity of one year or less. Rate shown reflects current rate.
@@ Foreign Issuer
# Securities with purchases pursuant to Rule144A or section 4(2), under the Securities Act of 1933 and may not be resold subject to that rule except to qualified institutional buyers. Unless otherwise noted, these securities have been determined to be liquid under the guidelines established by the Funds' Board of Directors/Trustees.
cc Securities purchased with cash collateral for securities loaned.
L Loaned security, a portion or all of the security is on loan at June 30, 2009.
* Cost for federal income tax purposes is the same as for
financial statement purposes.
Net unrealized depreciation consists of:
| Gross Unrealized Appreciation | | $ | — | | |
| Gross Unrealized Depreciation | | | (149,401 | ) | |
| Net Unrealized Depreciation | | $ | (149,401 | ) | |
| Fair Value Measurements* | |
The following is a summary of the inputs used as of June 30, 2009 in determining the Portfolio's investments at fair value for purposes of SFAS 157:
| | | Quoted Prices
in Active
Markets
for Identical
Investments
(Level 1) | | Significant
Other
Observable
Inputs
(Level 2) | | Significant
Unobservable
Inputs
(Level 3) | |
Short-Term
Investments | | $ | — | | | $ | 1,502,587,950 | | | $ | — | | |
| Total | | $ | — | | | $ | 1,502,587,950 | | | $ | — | | |
Other Financial
Instruments** | | | — | | | | — | | | | — | | |
| Total | | $ | — | | | $ | — | | | $ | — | | |
"Fair value" for purposes of SFAS 157 is different from "fair value" as used in the 1940 Act. The former generally implies market value, and can include market quotations as a source of value, and the latter refers to determinations of value in absence of available market quotations.
| Money market securities are valued using the amortized cost method, in accordance with rules under the 1940 Act. Generally, amortized cost approximates the market value of a security, but since the value is not obtained from a quoted price in an active market, such securities are reflected as Level 2. | |
* See NOTE 2, "Significant Accounting Policies" in the Notes to Financial Statements for additional information.
** Other financial instruments may include open forward foreign currency contracts, futures, swaps, and written options. Forward foreign currency contracts and futures are reported at their unrealized gain/loss at period end. Swaps and written options are reported at their market value at period end.
See Accompanying Notes to Financial Statements
88
ING BLACKROCK SCIENCE AND PORTFOLIO OF INVESTMENTS
TECHNOLOGY OPPORTUNITIES PORTFOLIO AS OF JUNE 30, 2009 (UNAUDITED)
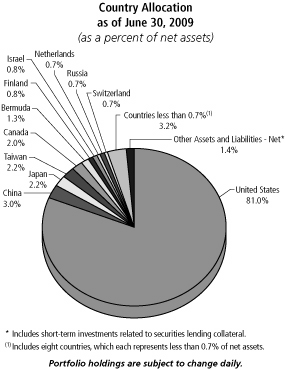
| Shares | | | | | | Value | |
| COMMON STOCK: 98.6% | | | |
| | | | | Bermuda: 1.3% | |
| | 234,900 | | | @ | | Marvell Technology Group Ltd. | | $ | 2,734,236 | | |
| | | | 2,734,236 | | |
| | | | | Canada: 2.0% | |
| | 96,800 | | | @ | | Celestica, Inc. | | | 660,176 | | |
| | 33,400 | | | @,L | | Open Text Corp. | | | 1,216,428 | | |
| | 35,500 | | | @ | | Research In Motion Ltd. | | | 2,522,275 | | |
| | | | 4,398,879 | | |
| | | | | China: 3.0% | |
| | 38,100 | | | @ | | AsiaInfo Holdings, Inc. | | | 655,701 | | |
| | 2,800 | | | @ | | Baidu.com ADR | | | 843,052 | | |
| | 20,200 | | | @ | | Changyou.com Ltd. ADR | | | 777,094 | | |
| | 23,000 | | | @ | | Longtop Financial Technologies
Ltd. ADR | | | 564,880 | | |
| | 27,400 | | | @ | | Netease.com ADR | | | 963,932 | | |
| | 37,900 | | | @,L | | Perfect World Co., Ltd. ADR | | | 1,083,940 | | |
| | 12,500 | | | @,L | | Shanda Interactive
Entertainment Ltd. ADR | | | 653,625 | | |
| | 31,000 | | | @ | | Sina Corp. | | | 913,880 | | |
| | | | 6,456,104 | | |
| | | | | Finland: 0.8% | |
| | 114,200 | | | L | | Nokia OYJ ADR | | | 1,665,036 | | |
| | | | 1,665,036 | | |
| | | | | Germany: 0.5% | |
| | | | | | 26,800 | | | SAP AG ADR | | | 1,077,092 | | |
| | | | 1,077,092 | | |
| Shares | | | | | | Value | |
| | | | | Hong Kong: 0.5% | |
| | 191,500 | | | | | ASM Pacific Technology | | $ | 979,285 | | |
| | | | 979,285 | | |
| | | | | India: 0.1% | |
| | 15,900 | | | @ | | Bharti Airtel Ltd. | | | 265,790 | | |
| | | | 265,790 | | |
| | | | | Ireland: 0.2% | |
| | 12,900 | | | | | Covidien PLC | | | 482,976 | | |
| | | | 482,976 | | |
| | | | | Israel: 0.8% | |
| | 73,300 | | | @ | | Check Point Software
Technologies | | | 1,720,351 | | |
| | | | 1,720,351 | | |
| | | | | Japan: 2.2% | |
| | 33,200 | | | | | Canon, Inc. | | | 1,084,445 | | |
| | 19,700 | | | L | | Disco Corp. | | | 834,538 | | |
| | 90,700 | | | | | Konica Minolta Holdings, Inc. | | | 947,674 | | |
| | 19,200 | | | | | Nidec Corp. | | | 1,168,692 | | |
| | 2,300 | | | | | Nintendo Co., Ltd. | | | 636,536 | | |
| | | | 4,671,885 | | |
| | | | | Luxembourg: 0.5% | |
| | 19,300 | | | @,L | | Millicom International
Cellular SA | | | 1,085,818 | | |
| | | | 1,085,818 | | |
| | | | | Netherlands: 0.7% | |
| | 73,200 | | | | | ASML Holding NV | | | 1,584,780 | | |
| | | | 1,584,780 | | |
| | | | | Portugal: 0.5% | |
| | 117,600 | | | | | Portugal Telecom SGPS SA | | | 1,153,554 | | |
| | | | 1,153,554 | | |
| | | | | Russia: 0.7% | |
| | 123,600 | | | | | Vimpel-Communications
OAO ADR | | | 1,454,772 | | |
| | | | 1,454,772 | | |
| | | | | South Korea: 0.5% | |
| | 2,400 | | | | | Samsung Electronics Co., Ltd. | | | 1,109,675 | | |
| | | | 1,109,675 | | |
| | | | | Switzerland: 0.7% | |
| | 13,600 | | | | | Alcon, Inc. | | | 1,579,232 | | |
| | | | 1,579,232 | | |
| | | | | Taiwan: 2.2% | |
| | 956,400 | | | | | Advanced Semiconductor
Engineering, Inc. | | | 553,138 | | |
| | 293,152 | | | | | Asustek Computer, Inc. | | | 378,967 | | |
| | 118,100 | | | L | | AU Optronics Corp. ADR | | | 1,143,208 | | |
| | 58,220 | | | | | High Tech Computer Corp. | | | 818,108 | | |
| | 128,300 | | | L | | Siliconware Precision
Industries Co. ADR | | | 795,460 | | |
| | 113,912 | | | | | Taiwan Semiconductor
Manufacturing Co., Ltd. ADR | | | 1,071,912 | | |
| | | | 4,760,793 | | |
See Accompanying Notes to Financial Statements
89
ING BLACKROCK SCIENCE AND PORTFOLIO OF INVESTMENTS
TECHNOLOGY OPPORTUNITIES PORTFOLIO AS OF JUNE 30, 2009 (UNAUDITED) (CONTINUED)
| Shares | | | | | | Value | |
| | | | | United Kingdom: 0.4% | |
| | 458,600 | | | | | ARM Holdings PLC | | $ | 905,032 | | |
| | | | 905,032 | | |
| | | | | United States: 81.0% | |
| | 97,300 | | | @ | | Adobe Systems, Inc. | | | 2,753,591 | | |
| | 64,600 | | | @ | | Agilent Technologies, Inc. | | | 1,312,026 | | |
| | 62,900 | | | @ | | Akamai Technologies, Inc. | | | 1,206,422 | | |
| | 81,200 | | | | | Altera Corp. | | | 1,321,936 | | |
| | 34,300 | | | @ | | American Tower Corp. | | | 1,081,479 | | |
| | 19,300 | | | @ | | Amgen, Inc. | | | 1,021,742 | | |
| | 52,800 | | | | | Amphenol Corp. | | | 1,670,592 | | |
| | 75,700 | | | | | Analog Devices, Inc. | | | 1,875,846 | | |
| | 29,400 | | | @ | | Anaren, Inc. | | | 519,792 | | |
| | 81,800 | | | @ | | Apple, Inc. | | | 11,650,774 | | |
| | 437,100 | | | | | Applied Materials, Inc. | | | 4,794,987 | | |
| | 34,400 | | | @ | | ArcSight, Inc. | | | 611,288 | | |
| | 124,800 | | | @ | | Ariba, Inc. | | | 1,228,032 | | |
| | 36,700 | | | @ | | Arrow Electronics, Inc. | | | 779,508 | | |
| | 44,600 | | | | | AT&T, Inc. | | | 1,107,864 | | |
| | 47,500 | | | @ | | Atheros Communications, Inc. | | | 913,900 | | |
| | 40,100 | | | @ | | ATMI, Inc. | | | 622,753 | | |
| | 49,800 | | | @ | | Autodesk, Inc. | | | 945,204 | | |
| | 47,400 | | | | | Automatic Data Processing, Inc. | | | 1,679,856 | | |
| | 63,100 | | | @ | | BMC Software, Inc. | | | 2,132,149 | | |
| | 118,500 | | | @ | | Boston Scientific Corp. | | | 1,201,590 | | |
| | 164,700 | | | @ | | Broadcom Corp. | | | 4,082,913 | | |
| | 190,100 | | | @ | | Brocade Communications
Systems, Inc. | | | 1,486,582 | | |
| | 87,800 | | | | | CA, Inc. | | | 1,530,354 | | |
| | 53,000 | | | @ | | Cavium Networks, Inc. | | | 890,930 | | |
| | 95,400 | | | @,L | | Ciena Corp. | | | 987,390 | | |
| | 292,400 | | | @ | | Cisco Systems, Inc. | | | 5,450,336 | | |
| | 81,200 | | | @ | | Citrix Systems, Inc. | | | 2,589,468 | | |
| | 113,400 | | | | | Corning, Inc. | | | 1,821,204 | | |
| | 54,400 | | | | | CVS Caremark Corp. | | | 1,733,728 | | |
| | 37,600 | | | @ | | Digital River, Inc. | | | 1,365,632 | | |
| | 9,900 | | | @ | | DigitalGlobe, Inc. | | | 190,080 | | |
| | 156,200 | | | @ | | eBay, Inc. | | | 2,675,706 | | |
| | 51,700 | | | @ | | Electronic Arts, Inc. | | | 1,122,924 | | |
| | 225,300 | | | @ | | EMC Corp. | | | 2,951,430 | | |
| | 42,000 | | | @ | | F5 Networks, Inc. | | | 1,452,780 | | |
| | 10,410 | | | @ | | Google, Inc. - Class A | | | 4,388,752 | | |
| | 141,700 | | | | | Hewlett-Packard Co. | | | 5,476,705 | | |
| | 340,500 | | | | | Intel Corp. | | | 5,635,275 | | |
| | 8,900 | | | @ | | IntercontinentalExchange, Inc. | | | 1,016,736 | | |
| | 75,000 | | | | | International Business
Machines Corp. | | | 7,831,500 | | |
| | 39,400 | | | @ | | Intuit, Inc. | | | 1,109,504 | | |
| | 98,600 | | | @ | | Juniper Networks, Inc. | | | 2,326,960 | | |
| | 92,800 | | | | | KLA-Tencor Corp. | | | 2,343,200 | | |
| | 85,800 | | | @ | | Lam Research Corp. | | | 2,230,800 | | |
| | 4,800 | | | @ | | LogMeIn, Inc. | | | 76,800 | | |
| | 30 | | | @ | | Macrovision Solutions Corp. | | | 654 | | |
| | 101,600 | | | @ | | McAfee, Inc. | | | 4,286,504 | | |
| | 67,600 | | | | | Medtronic, Inc. | | | 2,358,564 | | |
| | 192,900 | | | @ | | Micron Technology, Inc. | | | 976,074 | | |
| | 257,600 | | | | | Microsoft Corp. | | | 6,123,152 | | |
| | 204,900 | | | | | Motorola, Inc. | | | 1,358,487 | | |
| | 67,700 | | | @ | | NetApp, Inc. | | | 1,335,044 | | |
| | 57,800 | | | @ | | Netlogic Microsystems, Inc. | | | 2,107,388 | | |
| | 75,800 | | | @ | | Novellus Systems, Inc. | | | 1,265,860 | | |
| | 75,000 | | | @ | | Nvidia Corp. | | | 846,750 | | |
| | 272,000 | | | @ | | Oracle Corp. | | | 5,826,240 | | |
| Shares | | | | | | Value | |
| | 151,800 | | | @ | | PMC - Sierra, Inc. | | $ | 1,208,328 | | |
| | 55,000 | | | @ | | Polycom, Inc. | | | 1,114,850 | | |
| | 18,300 | | | @,L | | Priceline.com, Inc. | | | 2,041,365 | | |
| | 59,000 | | | @ | | Progress Software Corp. | | | 1,249,030 | | |
| | 43,800 | | | @ | | QLogic Corp. | | | 555,384 | | |
| | 184,380 | | | | | Qualcomm, Inc. | | | 8,333,977 | | |
| | 53,400 | | | @ | | Red Hat, Inc. | | | 1,074,942 | | |
| | 27,000 | | | @ | | Riverbed Technolgoy, Inc. | | | 626,130 | | |
| | 71,200 | | | @ | | Sandisk Corp. | | | 1,045,928 | | |
| | 126,400 | | | | | Seagate Technology, Inc. | | | 1,322,144 | | |
| | 27,300 | | | @,L | | Starent Networks Corp. | | | 666,393 | | |
| | 85,600 | | | @ | | Sybase, Inc. | | | 2,682,704 | | |
| | 185,900 | | | @ | | Symantec Corp. | | | 2,892,604 | | |
| | 50,500 | | | @ | | Synopsys, Inc. | | | 985,255 | | |
| | 142,400 | | | @ | | Tellabs, Inc. | | | 815,952 | | |
| | 33,100 | | | @ | | Teradata Corp. | | | 775,533 | | |
| | 152,200 | | | @ | | Teradyne, Inc. | | | 1,044,092 | | |
| | 204,100 | | | | | Texas Instruments, Inc. | | | 4,347,330 | | |
| | 93,800 | | | @ | | TTM Technologies, Inc. | | | 746,648 | | |
| | 115,600 | | | @ | | VeriSign, Inc. | | | 2,136,288 | | |
| | 37,000 | | | | | Verizon Communications, Inc. | | | 1,137,010 | | |
| | 35,900 | | | @ | | Vertex Pharmaceuticals, Inc. | | | 1,279,476 | | |
| | 94,600 | | | @ | | Vishay Intertechnology, Inc. | | | 642,334 | | |
| | 40,200 | | | @ | | Western Digital Corp. | | | 1,065,300 | | |
| | 52,800 | | | | | Western Union Co. | | | 865,920 | | |
| | 38,300 | | | | | Wyeth | | | 1,738,437 | | |
| | 53,900 | | | | | Xilinx, Inc. | | | 1,102,794 | | |
| | 209,700 | | | @ | | Yahoo!, Inc. | | | 3,283,902 | | |
| | | | 176,463,787 | | |
Total Common Stock
(Cost $220,134,510) | | | 214,549,077 | | |
Principal
Amount | | | | | | Value | |
| SHORT-TERM INVESTMENTS: 3.3% | | | |
| | | Securities Lending Collateralcc: 3.3% | |
| $ | 7,315,890 | | | Bank of New York Mellon Corp.
Institutional Cash Reserves | | $ | 7,236,530 | | |
Total Short-Term Investments
(Cost $7,315,890) | | | 7,236,530 | | |
Total Investments in
Securities
(Cost $227,450,400)* | | | 101.9 | % | | $ | 221,785,607 | | |
Other Assets and
Liabilities - Net | | | (1.9 | ) | | | (4,038,915 | ) | |
| Net Assets | | | 100.0 | % | | $ | 217,746,692 | | |
@ Non-income producing security
ADR American Depositary Receipt
cc Securities purchased with cash collateral for securities loaned.
L Loaned security, a portion or all of the security is on loan at June 30, 2009.
* Cost for federal income tax purposes is $234,278,124.
Net unrealized depreciation consists of:
| Gross Unrealized Appreciation | | $ | 11,185,345 | | |
| Gross Unrealized Depreciation | | | (23,677,862 | ) | |
| Net Unrealized Depreciation | | $ | (12,492,517 | ) | |
See Accompanying Notes to Financial Statements
90
ING BLACKROCK SCIENCE AND PORTFOLIO OF INVESTMENTS
TECHNOLOGY OPPORTUNITIES PORTFOLIO AS OF JUNE 30, 2009 (UNAUDITED) (CONTINUED)
| Industry | | Percentage of
Net Assets | |
| Biotechnology | | | 1.0 | % | |
| Commercial Services | | | 1.2 | | |
| Computers | | | 18.5 | | |
| Diversified Financial Services | | | 0.5 | | |
| Electronics | | | 3.7 | | |
| Hand/Machine Tools | | | 0.4 | | |
| Healthcare - Products | | | 2.6 | | |
| Internet | | | 14.2 | | |
| Miscellaneous Manufacturing | | | 0.4 | | |
| Office/Business Equipment | | | 0.5 | | |
| Pharmaceuticals | | | 0.8 | | |
| Retail | | | 0.8 | | |
| Semiconductors | | | 21.6 | | |
| Software | | | 16.7 | | |
| Telecommunications | | | 15.4 | | |
| Toys/Games/Hobbies | | | 0.3 | | |
| Short-Term Investments | | | 3.3 | | |
| Other Assets and Liabilities - Net | | | (1.9 | ) | |
| Net Assets | | | 100.0 | % | |
| Fair Value Measurements* | |
The following is a summary of the inputs used as of June 30, 2009 in determining the Portfolio's investments at fair value for purposes of SFAS 157:
| | | Quoted Prices
in Active
Markets
for Identical
Investments
(Level 1) | | Significant
Other
Observable
Inputs
(Level 2)+ | | Significant
Unobservable
Inputs
(Level 3) | |
| Common Stock | |
| Bermuda | | $ | 2,734,236 | | | $ | — | | | $ | — | | |
| Canada | | | 4,398,879 | | | | — | | | | — | | |
| China | | | 5,372,164 | | | | 1,083,940 | | | | — | | |
| Finland | | | 1,665,036 | | | | — | | | | — | | |
| Germany | | | 1,077,092 | | | | — | | | | — | | |
| Hong Kong | | | — | | | | 979,285 | | | | — | | |
| India | | | — | | | | 265,790 | | | | — | | |
| Ireland | | | 482,976 | | | | — | | | | — | | |
| Israel | | | 1,720,351 | | | | — | | | | — | | |
| Japan | | | — | | | | 4,671,885 | | | | — | | |
| Luxembourg | | | 1,085,818 | | | | — | | | | — | | |
| Netherlands | | | 1,584,780 | | | | — | | | | — | | |
| Portugal | | | — | | | | 1,153,554 | | | | — | | |
| Russia | | | 1,454,772 | | | | — | | | | — | | |
| South Korea | | | — | | | | 1,109,675 | | | | — | | |
| Switzerland | | | 1,579,232 | | | | — | | | | — | | |
| Taiwan | | | 3,010,580 | | | | 1,750,213 | | | | — | | |
| United Kingdom | | | — | | | | 905,032 | | | | — | | |
| United States | | | 176,463,787 | | | | — | | | | — | | |
| Total Common Stock | | $ | 202,629,703 | | | $ | 11,919,374 | | | $ | — | | |
Short-Term
Investments | | | — | | | | 7,236,530 | | | | — | | |
| Total | | $ | 202,629,703 | | | $ | 19,155,904 | | | $ | — | | |
Other Financial
Instruments** | | | — | | | | (67,276 | ) | | | — | | |
| Total | | $ | — | | | $ | (67,276 | ) | | $ | — | | |
"Fair value" for purposes of SFAS 157 is different from "fair value" as used in the 1940 Act. The former generally implies market value,
and can include market quotations as a source of value, and the latter refers to determinations of value in absence of available market quotations.
* See NOTE 2, "Significant Accounting Policies" in the Notes to Financial Statements for additional information.
** Other financial instruments may include open forward foreign currency contracts, futures, swaps, and written options. Forward foreign currency contracts and futures are reported at their unrealized gain/loss at period end. Swaps and written options are reported at their market value at period end.
+ The earlier close of the foreign markets gives rise to the possibility that significant events, including broad market moves, may have occurred in the interim and may materially affect the value of those securities. To account for this, the Portfolio may frequently value many of its foreign equity securities using fair value prices based on third party vendor modeling tools to the extent available. Accordingly, a significant portion of the Portfolio's investments are categorized as Level 2 investments.
At June 30, 2009 the following forward foreign currency contracts were outstanding for the ING BlackRock Science and Technology Opportunities Portfolio:
| Currency | | Buy/Sell | | Settlement
Date | | In
Exchange
For | | Value | | Unrealized
Appreciation/
(Depreciation) | |
| Hong Kong | | | | | | | | | |
| |
| Sar Dollar | | | | | | | | | |
| |
| HKD | 2,855,000 | | | BUY | | 8/26/09 | | | 368,531 | | | | 368,568 | | | $ | 37 | | |
Hong Kong
Sar Dollar
HKD 1,796,000 | | BUY | | 8/26/09 | | | 231,845 | | | | 231,856 | | | | 11 | | |
| | | $ | 48 | | |
EU Euro
| |
| EUR | 576,000 | | | SELL | | 8/26/09 | | | 809,691 | | | | 808,008 | | | $ | 1,683 | | |
British Pound
GBP 395,000 | | SELL | | 8/26/09 | | | 638,948 | | | | 649,813 | | | | (10,865 | ) | |
Hong Kong
Sar Dollar
HKD 5,183,000 | | SELL | | 8/26/09 | | | 669,166 | | | | 669,102 | | | | 64 | | |
Japanese Yen
JPY
305,799,000 | | SELL | | 8/26/09 | | | 3,117,045 | | | | 3,176,431 | | | | (59,386 | ) | |
Japanese Yen
JPY
23,369,000 | | SELL | | 8/26/09 | | | 243,921 | | | | 242,741 | | | | 1,180 | | |
| | | $ | (67,324 | ) | |
For the six months ended June 30, 2009, net realized gain (loss) on forward foreign currency contracts and the net change in unrealized gain (loss) on forward foreign currency contracts can be found on the Portfolio's Statement of Operations. For additional information on the reason(s) why the Portfolio may enter into forward foreign currency contracts and the risks associated with these contracts, please refer to NOTE 2 in the accompanying Notes to Financial Statements.
See Accompanying Notes to Financial Statements
91
Investment Adviser
ING Investments, LLC
7337 East Doubletree Ranch Road
Scottsdale, Arizona 85258
Administrator
ING Funds Services, LLC
7337 East Doubletree Ranch Road
Scottsdale, Arizona 85258
Distributor
ING Funds Distributor, LLC
7337 East Doubletree Ranch Road
Scottsdale, Arizona 85258
Transfer Agent
PNC Global Investment Servicing (U.S.) Inc.
301 Bellevue Parkway
Wilmington, Delaware 19809
Custodian
The Bank of New York Mellon
One Wall Street
New York, New York 10286
Legal Counsel
Goodwin Procter LLP
Exchange Place
53 State Street
Boston, Massachusetts 02109
Before investing, carefully consider the investment objectives, risks, charges and expenses of the variable annuity contract and the underlying variable investment options. This and other information is contained in the prospectus for the variable annuity contract and the underlying variable investment options. Obtain these prospectuses from your agent/registered representative and read them carefully before investing.
VPSAR-ACAPAPALL (0609-082809)


Semi-Annual Report
June 30, 2009
Classes I and S
Domestic Equity Index Portfolios
| n | ING Index Plus LargeCap Portfolio* |
| n | ING Index Plus MidCap Portfolio* |
| n | ING Index Plus SmallCap Portfolio* |
| * | | Prior to May 1, 2009, the Portfolio’s name contained the “VP” prefix. |
| | |
 | | E-Delivery Sign-up – details inside |
This report is submitted for general information to shareholders of the ING Funds. It is not authorized for distribution to prospective shareholders unless accompanied or preceded by a prospectus which includes details regarding the funds’ investment objectives, risks, charges, expenses and other information. This information should be read carefully.
MUTUAL FUNDS 
| |
TABLE OF CONTENTS
| | | | |
| | | |
| | Go Paperless with E-Delivery! | | |
Sign up now for on-line prospectuses, fund reports, and proxy statements. In less than five minutes, you can help reduce paper mail and lower fund costs. Just go to www.ingfunds.com, click on the E-Delivery icon from the home page, follow the directions and complete the quick 5 Steps to Enroll. You will be notified by e-mail when these communications become available on the internet. Documents that are not available on the internet will continue to be sent by mail. |
PROXY VOTING INFORMATION
A description of the policies and procedures that the Portfolios use to determine how to vote proxies related to portfolio securities is available: (1) without charge, upon request, by calling Shareholder Services toll-free at (800) 992-0180; (2) on the ING Funds’ website at www.ingfunds.com; and (3) on the U.S. Securities and Exchange Commission’s (“SEC”) website at www.sec.gov. Information regarding how the Portfolios voted proxies related to portfolio securities during the most recent 12-month period ended June 30 is available without charge on the ING Funds’ website at www.ingfunds.com and on the SEC’s website at www.sec.gov.
QUARTERLY PORTFOLIO HOLDINGS
The Portfolios file their complete schedule of portfolio holdings with the SEC for the first and third quarters of each fiscal year on Form N-Q. The Portfolios’ Forms N-Q are available on the SEC’s website at www.sec.gov. The Portfolios’ Forms N-Q may be reviewed and copied at the SEC’s Public Reference Room in Washington, DC, and information on the operation of the Public Reference Room may be obtained by calling (800) SEC-0330; and is available upon request from the Portfolios by calling Shareholder Services toll-free at (800) 992-0180.
PRESIDENT’S LETTER

Dear Shareholder,
As we enter the third quarter of 2009, we look forward hopefully to the end of the recession, at least in the United States. While recent economic news can best be characterized as less bad (as opposed to good), there is a chance that recovery could begin sometime in the third quarter.
Could this be the hour before the dawn? The financial markets seem to have factored in expectations of recovery, as evidenced by recent gains. The stock market, as measured by the S&P 500® Index(1), has advanced into the mid-900 range, a substantial climb from its mid-600s low in early March. The Dow Jones Industrial Average(2) recently broke through 9,000 to reach its highest level since January of this year. As investors become less risk-averse, they are shifting back into stocks.
Should you be doing the same? The answer depends on several important factors unique to your situation: your long-term investment goals, your tolerance for risk and
your current portfolio allocation. If you made any changes to your portfolio allocation over the past year or so — perhaps in an effort to avoid losses during a time of high uncertainty or to feel more comfortable with your investments — your portfolio now may be out of alignment with your long-term goals. On the other hand, your current portfolio may now be better suited to your tolerance for risk. You may still want to reallocate your portfolio, but you should first rethink your goals in the context of the volatility you are willing to bear. This is particularly important in that the market may continue to experience periods of volatility as economic conditions stabilize and recover.
As always, we encourage you to discuss these matters thoroughly with your financial advisor before making any changes to your portfolio. Thank you for your continued confidence in ING Funds. We look forward to serving your investment needs in the future.
Sincerely,

Shaun Mathews
President & Chief Executive Officer
ING Funds
June 30, 2009
The views expressed in the President’s Letter reflect those of the President as of the date of the letter. Any such views are subject to change at any time based upon market or other conditions and ING Funds disclaim any responsibility to update such views. These views may not be relied on as investment advice and because investment decisions for an ING Fund are based on numerous factors, may not be relied on as an indication of investment intent on behalf of any ING Fund. Reference to specific company securities should not be construed as recommendations or investment advice. Consider the fund’s investment objectives, risks, and charges and expenses carefully before investing. The prospectus contains this information and other information about the fund.
International investing poses special risks including currency fluctuation, economic and political risks not found in investments that are solely domestic.
| (1) | | The S&P 500® Index is an unmanaged index that measures the performance of securities of approximately 500 of the largest companies in the United States. |
| (2) | | The Dow Jones Industrial Average is a widely followed measurement of the stock market. The average is comprised of 30 stocks that represent leading companies in major industries. |
1
MARKET PERSPECTIVE: SIX MONTHS ENDED JUNE 30, 2009
Many were hopeful as the year started that the newly elected U.S. president’s promised $1 trillion stimulus package, a federal funds rate now reduced to 0% —0.25%, and record low mortgage rates would help to put a base under slumping economies and markets. But global equities in the form of the MSCI World® Index,(1) measured in local currencies, including net reinvested dividends (“MSCI” for regions discussed below), soon resumed their slide and by March 9, 2009, the index had dropped nearly 22% for the year to date, to the previous cycle lows of late 2002. Abruptly however, markets recovered, surging by 34%, to record a gain of 4.8% for the six-month period ended June 30, 2009. Markets generally wavered somewhat at the end of the period, as the World Bank raised its estimate for the drop in global gross domestic product (“GDP”) for 2009. In currencies, the dollar was initially strong but then fell back, gaining 0.3% on the euro, 5.7% against the yen, but losing 12.4% against the pound.
While credit markets had improved since the dark days of late 2008, most banks had tightened lending standards despite large capital infusions under the Troubled Asset Relief Program (“TARP”). The problem remained the enormous volumes of distressed loans and toxic assets of indeterminate value on bank balance sheets. The Administration soon announced a Public-Private Investment Program to buy these assets up. The Federal Reserve would also expand its purchases of agency mortgage-backed securities and buy up to $300 billion in longer dated Treasuries to push mortgage interest rates lower. Another $750 billion beyond TARP would be made available. A $75 billion plan would cut mortgage payments for struggling homeowners. Much of this was set out in the president’s first budget, which projected a $1.75 trillion deficit!
While policy initiatives helped on balance, the reasons for the collective resurgence of equities after March 9, 2009 are hard to pin down. Troubled Citigroup’s claim on March 10 that the year 2009 had been profitable so far was one catalyst. More generally, the economic reports from which markets seemed to be taking heart were only improving weakly and erratically. Nonetheless they were soon being referred to as “green shoots”.
In housing, the Standard & Poor’s (“S&P”) /Case-Shiller National U.S. Home Price Index(2) of house prices in 20 cities sank a record 19% year-over-year in January. But from there the declines moderated to 18.1% in the most recent report. By the end of June 2009, sales of existing homes had risen for two months
and the proportion of distressed sales was down to about one-third, from nearly half earlier in the year.
A flimsier (but welcome) green shoot emerged in the final employment report, where May payrolls fell by the smallest number in eight months, even as the rate increased to 9.4%, a 25-year record. The fall in the 2009 first quarter GDP was revised down to 5.5% annualized, having first been reported near the 2008 fourth quarter’s decades high 6.3%.
Consumer demand was weak, evidenced by the largest annual drop in the consumer price index, 1.3%, since 1950. But the government’s stimulus plan boosted incomes by 1.4% in May 2009, sending the savings rate to 6.9%, the most in 15 years. Still, retail sales were reported higher, the first increase in three months.
U.S. fixed income markets at first sight had an undistinguished first half. The Barclays Capital U.S. Aggregate Bond Index(3) of investment grade bonds returned 1.90%. But within this figure improved risk appetite propelled the index of investment grade corporate bonds to an 8.32% gain amid surging new issuances. Conversely, the Treasury index lost 4.30%, weighed by concerns about massive government borrowing, and the excess yield on 10-year Treasuries over 2-year issues briefly reached a record 275 basis points (“bp”). The star performers however, were high yield bonds, represented by the Barclays Capital High Yield Bond — 2% Issuer Constrained Index(4), which returned a remarkable 30.92%. By contrast, the yield on the 90-day Treasury Bills remained in the range of 6bp to 31bp throughout the period.
U.S. equities, represented by the S&P 500® Index,(5) including dividends, returned 3.2% in the first six months of 2009. As with stock markets generally, March 9, 2009, marked the low point for the index, closing at September 1996 levels. Profits for S&P 500® Index companies would be certain to suffer their eighth straight quarter of decline, but from March 9, 2009, investors only had eyes for green shoots and from there the market returned 36.9%, led by the financials component which soared 93.1%. The index broke through its 200-day moving average on June 1, 2009, but then drifted back, finally returning the last of the month’s gains on June 30, 2009, as a reading of consumer confidence disappointed.
In international markets, the MSCI Japan® Index(6) rose 9.2% for the six months through June 30, 2009. The slump in exports stabilized during the period and despite two consecutive quarterly falls in GDP of 3.8%, there were hopes that stimulus packages in China and
2
MARKET PERSPECTIVE: SIX MONTHS ENDED JUNE 30, 2009
in Japan itself would speed a recovery. The MSCI Europe ex UK® Index(7) added 3.8%. Despite a bigger than expected drop in GDP of 2.5% in the first quarter and the first annual decline in consumer prices for 48 years, confidence proved resilient. The European Central Bank cut rates to 1% and finally embarked on a program to lend unlimited amounts to banks for one year at this interest rate. The MSCI UK® Index(8) lost 1.3%. The Bank of England reduced rates three times, to 0.5%, the lowest since it was founded in 1694, as the UK suffered the largest annual fall in GDP, 4.9%, since records began in 1948.
(1) The MSCI World® Index is an unmanaged index that measures the performance of over 1,400 securities listed on exchanges in the U.S., Europe, Canada, Australia, New Zealand and the Far East.
(2) The S&P/Case-Shiller National U.S. Home Price Index tracks the value of single-family housing within the United States. The index is a composite of single-family home price indices for the nine U.S. Census divisions and is calculated quarterly.
(3) The Barclays Capital U.S. Aggregate Bond Index is an unmanaged index of publicly issued investment grade U.S. Government, mortgage-backed, asset-backed and corporate debt securities.
(4) The Barclays Capital High Yield Bond — 2% Issuer Constrained Composite Index is an unmanaged index that measures the performance of non-investment grade fixed-income securities.
(5) The S&P 500® Index is an unmanaged index that measures the performance of securities of approximately 500 of the largest companies in the United States.
(6) The MSCI Japan® Index is a free float-adjusted market capitalization index that is designed to measure developed market equity performance in Japan.
(7) The MSCI Europe ex UK® Index is a free float-adjusted market capitalization index that is designed to measure developed market equity performance in Europe, excluding the UK.
(8) The MSCI UK® Index is a free float-adjusted market capitalization index that is designed to measure developed market equity performance in the UK.
Parentheses denote a negative number.
All indices are unmanaged and investors cannot invest directly in an index.
Past performance does not guarantee future results. The performance quoted represents past performance. Investment return and principal value of an investment will fluctuate, and shares, when redeemed, may be worth more or less than their original cost. The Portfolios’ performance is subject to change since the period’s end and may be lower or higher than the performance data shown. Please call (800) 992-0180 or log on to www.ingfunds.com to obtain performance data current to the most recent month end.
Market Perspective reflects the views of ING’s Chief Investment Risk Officer only through the end of the period, and is subject to change based on market and other conditions.
3
SHAREHOLDER EXPENSE EXAMPLES (UNAUDITED)
As a shareholder of a Portfolio, you incur two types of costs: (1) transaction costs, including redemption fees and exchange fees; and (2) ongoing costs, including management fees, distribution and/or service (12b-1) fees, and other Portfolio expenses. These Examples are intended to help you understand your ongoing costs (in dollars) of investing in a Portfolio and to compare these costs with the ongoing costs of investing in other mutual funds.
The Examples are based on an investment of $1,000 invested at the beginning of the period and held for the entire period from January 1, 2009 to June 30, 2009. The Portfolios’ expenses are shown without the imposition of any charges which are, or may be, imposed under your annuity contract. Expenses would have been higher if such charges were included.
Actual Expenses
The first section of the table shown, “Actual Portfolio Return,” provides information about actual account values and actual expenses. You may use the information in this section, together with the amount you invested, to estimate the expenses that you paid over the period. Simply divide your account value by $1,000 (for example, an $8,600 account value divided by $1,000 = 8.6), then multiply the result by the number in the first section under the heading entitled “Expenses Paid During the Period” to estimate the expenses you paid on your account during this period.
Hypothetical Example for Comparison Purposes
The second section of the table shown, “Hypothetical (5% return before expenses),” provides information about hypothetical account values and hypothetical expenses based on a Portfolio’s actual expense ratio and an assumed rate of return of 5% per year before expenses, which is not a Portfolio’s actual return. The hypothetical account values and expenses may not be used to estimate the actual ending account balance or expenses you paid for the period. You may use this information to compare the ongoing costs of investing in a Portfolio and other mutual funds. To do so, compare this 5% hypothetical example with the 5% hypothetical examples that appear in the shareholder reports of the other mutual funds.
Please note that the expenses shown in the table are meant to highlight your ongoing costs only and do not reflect any transactional costs, such as redemption fees or exchange fees. Therefore, the hypothetical lines of the table are useful in comparing ongoing costs only, and will not help you determine the relative total costs of owning different mutual funds. In addition, if these transactional costs were included, your costs would have been higher.
| | | | | | | | | | | | | | | | | | | | | | | | |
| | | Actual Portfolio Return | | Hypothetical (5% return before expenses) |
| | | Beginning
Account
Value
January 1, 2009 | | Ending
Account Value
June 30, 2009 | | Annualized
Expense Ratio | | | Expenses Paid
During the
Period Ended
June 30, 2009* | | Beginning
Account
Value
January 1, 2009 | | Ending
Account Value
June 30, 2009 | | Annualized
Expense Ratio | | | Expenses Paid
During the
Period Ended
June 30, 2009* |
ING Index Plus LargeCap Portfolio | | | | | | | | | | | | | | | | |
Class I | | $ | 1,000.00 | | $ | 1,013.80 | | 0.51 | % | | $ | 2.55 | | $ | 1,000.00 | | $ | 1,022.27 | | 0.51 | % | | $ | 2.56 |
Class S | | | 1,000.00 | | | 1,012.60 | | 0.76 | | | | 3.79 | | | 1,000.00 | | | 1,021.03 | | 0.76 | | | | 3.81 |
ING Index Plus MidCap Portfolio | | | | | | | | | | | | | | | | |
Class I | | $ | 1,000.00 | | $ | 1,050.60 | | 0.55 | % | | $ | 2.80 | | $ | 1,000.00 | | $ | 1,022.07 | | 0.55 | % | | $ | 2.76 |
Class S | | | 1,000.00 | | | 1,049.10 | | 0.80 | | | | 4.06 | | | 1,000.00 | | | 1,020.83 | | 0.80 | | | | 4.01 |
ING Index Plus SmallCap Portfolio | | | | | | | | | | | | | | | | |
Class I | | $ | 1,000.00 | | $ | 1,004.70 | | 0.56 | % | | $ | 2.78 | | $ | 1,000.00 | | $ | 1,022.02 | | 0.56 | % | | $ | 2.81 |
Class S | | | 1,000.00 | | | 1,004.00 | | 0.81 | | | | 4.02 | | | 1,000.00 | | | 1,020.78 | | 0.81 | | | | 4.06 |
| * | | Expenses are equal to each Portfolio’s respective annualized expense ratios multiplied by the average account value over the period, multiplied by 181/365 to reflect the most recent fiscal half-year. |
4
STATEMENTS OF ASSETS AND LIABILITIESASOF JUNE 30, 2009 (UNAUDITED)
| | | | | | | | | | | | |
| | | ING
Index Plus
LargeCap
Portfolio | | | ING
Index Plus
MidCap
Portfolio | | | ING
Index Plus
SmallCap
Portfolio | |
ASSETS: | | | | | | | | | | | | |
Investments in securities at value+* | | $ | 814,054,257 | | | $ | 547,665,833 | | | $ | 268,545,220 | |
Short-term investments** | | | 10,042,154 | | | | 29,605,305 | | | | 17,388,621 | |
Short-term investments in affiliates*** | | | 5,860,000 | | | | 18,796,000 | | | | 11,876,000 | |
Cash | | | 307 | | | | 132,222 | | | | 12,591 | |
Cash collateral for futures | | | 1,926,020 | | | | 1,939,946 | | | | 1,039,517 | |
Receivables: | | | | | | | | | | | | |
Investment securities sold | | | — | | | | 17,932,410 | | | | 4,756,534 | |
Fund shares sold | | | 241,794 | | | | 333,968 | | | | 376,389 | |
Dividends and interest | | | 1,143,772 | | | | 479,204 | | | | 306,690 | |
Prepaid expenses | | | 16,571 | | | | 10,850 | | | | 5,923 | |
| | | | | | | | | | | | |
Total assets | | | 833,284,875 | | | | 616,895,738 | | | | 304,307,485 | |
| | | | | | | | | | | | |
LIABILITIES: | | | | | | | | | | | | |
Payable for investment securities purchased | | | — | | | | 14,187,599 | | | | 3,526,843 | |
Payable for fund shares redeemed | | | 1,453,152 | | | | 568,867 | | | | 26,380 | |
Payable upon receipt of securities loaned | | | 10,363,915 | | | | 30,175,543 | | | | 17,674,474 | |
Payable to affiliates | | | 311,428 | | | | 240,976 | | | | 125,200 | |
Payable for directors fees | | | 84,131 | | | | 39,517 | | | | 33,480 | |
Other accrued expenses and liabilities | | | 337,628 | | | | 176,212 | | | | 119,055 | |
| | | | | | | | | | | | |
Total liabilities | | | 12,550,254 | | | | 45,388,714 | | | | 21,505,432 | |
| | | | | | | | | | | | |
NET ASSETS | | $ | 820,734,621 | | | $ | 571,507,024 | | | $ | 282,802,053 | |
| | | | | | | | | | | | |
NET ASSETS WERE COMPRISED OF: | | | | | | | | | | | | |
Paid-in capital | | $ | 1,351,291,876 | | | $ | 938,127,611 | | | $ | 511,235,044 | |
Undistributed net investment income | | | 8,530,206 | | | | 3,590,951 | | | | 1,276,821 | |
Accumulated net realized loss on investments and futures | | | (521,430,765 | ) | | | (324,760,676 | ) | | | (183,880,044 | ) |
Net unrealized depreciation on investments and futures | | | (17,656,696 | ) | | | (45,450,862 | ) | | | (45,829,768 | ) |
| | | | | | | | | | | | |
NET ASSETS | | $ | 820,734,621 | | | $ | 571,507,024 | | | $ | 282,802,053 | |
| | | | | | | | | | | | |
| | | | | | | | | | | | |
+ Including securities loaned at value | | $ | 9,810,637 | | | $ | 29,356,333 | | | $ | 17,186,512 | |
* Cost of investments in securities | | $ | 831,266,347 | | | $ | 592,108,597 | | | $ | 313,871,426 | |
** Cost of short-term investments | | $ | 10,363,915 | | | $ | 30,175,543 | | | $ | 17,674,474 | |
*** Cost of short-term investments in affiliates | | $ | 5,860,000 | | | $ | 18,796,000 | | | $ | 11,876,000 | |
| | | | | | | | | | | | |
Class I: | | | | | | | | | | | | |
Net assets | | $ | 651,216,169 | | | $ | 450,687,811 | | | $ | 193,014,656 | |
Shares authorized | | | 200,000,000 | | | | 100,000,000 | | | | 100,000,000 | |
Par value | | $ | 0.001 | | | $ | 0.001 | | | $ | 0.001 | |
Shares outstanding | | | 63,747,851 | | | | 43,984,614 | | | | 20,814,483 | |
Net asset value and redemption price per share | | $ | 10.22 | | | $ | 10.25 | | | $ | 9.27 | |
Class S: | | | | | | | | | | | | |
Net assets | | $ | 169,518,452 | | | $ | 120,819,213 | | | $ | 89,787,397 | |
Shares authorized | | | 100,000,000 | | | | 100,000,000 | | | | 100,000,000 | |
Par value | | $ | 0.001 | | | $ | 0.001 | | | $ | 0.001 | |
Shares outstanding | | | 16,702,180 | | | | 11,901,023 | | | | 9,766,590 | |
Net asset value and redemption price per share | | $ | 10.15 | | | $ | 10.15 | | | $ | 9.19 | |
See Accompanying Notes to Financial Statements
5
STATEMENTS OF OPERATIONSFORTHE SIX MONTHS ENDED JUNE 30, 2009 (UNAUDITED)
| | | | | | | | | | | | |
| | | ING
Index Plus
LargeCap
Portfolio | | | ING
Index Plus
MidCap
Portfolio | | | ING
Index Plus
SmallCap
Portfolio | |
INVESTMENT INCOME: | | | | | | | | | | | | |
Dividends, net of foreign taxes withheld*(1) | | $ | 10,481,797 | | | $ | 5,004,089 | | | $ | 1,925,433 | |
Interest | | | 46 | | | | 298 | | | | — | |
Securities lending income, net | | | 213,739 | | | | 176,121 | | | | 191,654 | |
| | | | | | | | | | | | |
Total investment income | | | 10,695,582 | | | | 5,180,508 | | | | 2,117,087 | |
| | | | | | | | | | | | |
EXPENSES: | | | | | | | | | | | | |
Investment management fees | | | 1,356,228 | | | | 1,057,922 | | | | 522,746 | |
Distribution and service fees — Class S | | | 202,756 | | | | 141,753 | | | | 104,665 | |
Transfer agent fees | | | 1,391 | | | | 941 | | | | 602 | |
Administrative service fees | | | 213,116 | | | | 145,459 | | | | 71,875 | |
Shareholder reporting expense | | | 68,906 | | | | 44,150 | | | | 19,460 | |
Registration fees | | | 729 | | | | 411 | | | | 257 | |
Professional fees | | | 101,094 | | | | 63,352 | | | | 32,469 | |
Custody and accounting expense | | | 68,299 | | | | 53,526 | | | | 35,643 | |
Directors fees | | | 74,204 | | | | 36,200 | | | | 27,060 | |
Miscellaneous expense | | | 75,317 | | | | 46,103 | | | | 26,419 | |
Interest expense | | | 852 | | | | 73 | | | | 180 | |
| | | | | | | | | | | | |
Total expenses | | | 2,162,892 | | | | 1,589,890 | | | | 841,376 | |
Net waived and reimbursed fees | | | (2,333 | ) | | | (3,430 | ) | | | (1,961 | ) |
| | | | | | | | | | | | |
Net expenses | | | 2,160,559 | | | | 1,586,460 | | | | 839,415 | |
| | | | | | | | | | | | |
Net investment income | | | 8,535,023 | | | | 3,594,048 | | | | 1,277,672 | |
| | | | | | | | | | | | |
REALIZED AND UNREALIZED GAIN (LOSS) ON INVESTMENTS AND FUTURES | | | | | | | | | | | | |
Net realized gain (loss) on: | | | | | | | | | | | | |
Investments | | | (149,630,269 | ) | | | (147,478,420 | ) | | | (63,025,497 | ) |
Futures | | | 571,766 | | | | 909,486 | | | | 1,479,884 | |
| | | | | | | | | | | | |
Net realized loss on investments and futures | | | (149,058,503 | ) | | | (146,568,934 | ) | | | (61,545,613 | ) |
| | | | | | | | | | | | |
Net change in unrealized appreciation or depreciation on: | | | | | | | | | | | | |
Investments | | | 147,432,641 | | | | 168,469,505 | | | | 60,133,685 | |
Futures | | | (398,802 | ) | | | (1,165,012 | ) | | | (578,418 | ) |
| | | | | | | | | | | | |
Net change in unrealized appreciation or depreciation on investments and futures | | | 147,033,839 | | | | 167,304,493 | | | | 59,555,267 | |
| | | | | | | | | | | | |
Net realized and unrealized gain (loss) on investments and futures | | | (2,024,664 | ) | | | 20,735,559 | | | | (1,990,346 | ) |
| | | | | | | | | | | | |
Increase (decrease) in net assets resulting from operations | | $ | 6,510,359 | | | $ | 24,329,607 | | | $ | (712,674 | ) |
| | | | | | | | | | | | |
| | | | | | | | | | | | |
* Foreign taxes withheld | | $ | 3,301 | | | $ | — | | | $ | 571 | |
(1) Affiliated Income | | $ | 10,412 | | | $ | 14,700 | | | $ | 7,535 | |
See Accompanying Notes to Financial Statements
6
STATEMENTS OF CHANGES IN NET ASSETS (UNAUDITED)
| | | | | | | | | | | | | | | | |
| | | ING Index Plus LargeCap Portfolio | | | ING Index Plus MidCap Portfolio | |
| | | Six Months
Ended June 30, 2009 | | | Year Ended December 31, 2008 | | | Six Months
Ended June 30, 2009 | | | Year Ended December 31, 2008 | |
FROM OPERATIONS: | | | | | | | | | | | | | | | | |
Net investment income | | $ | 8,535,023 | | | $ | 26,863,703 | | | $ | 3,594,048 | | | $ | 10,508,459 | |
Net realized loss on investments and futures | | | (149,058,503 | ) | | | (359,254,975 | ) | | | (146,568,934 | ) | | | (171,579,849 | ) |
Net change in unrealized appreciation or depreciation on investments and futures | | | 147,033,839 | | | | (298,275,881 | ) | | | 167,304,493 | | | | (229,635,499 | ) |
| | | | | | | | | | | | | | | | |
Increase (decrease) in net assets resulting from operations | | | 6,510,359 | | | | (630,667,153 | ) | | | 24,329,607 | | | | (390,706,889 | ) |
| | | | | | | | | | | | | | | | |
FROM DISTRIBUTIONS TO SHAREHOLDERS: | | | | | | | | | | | | | | | | |
Net investment income: | | | | | | | | | | | | | | | | |
Class I | | | (21,659,222 | ) | | | (36,524,688 | ) | | | (8,141,406 | ) | | | (11,952,630 | ) |
Class S | | | (5,041,109 | ) | | | (5,640,026 | ) | | | (1,755,366 | ) | | | (2,200,936 | ) |
Net realized gains: | | | | | | | | | | | | | | | | |
Class I | | | — | | | | (128,358,189 | ) | | | — | | | | (112,082,941 | ) |
Class S | | | — | | | | (21,899,099 | ) | | | — | | | | (26,411,236 | ) |
| | | | | | | | | | | | | | | | |
Total distributions | | | (26,700,331 | ) | | | (192,422,002 | ) | | | (9,896,772 | ) | | | (152,647,743 | ) |
| | | | | | | | | | | | | | | | |
FROM CAPITAL SHARE TRANSACTIONS: | | | | | | | | | | | | | | | | |
Net proceeds from sale of shares | | | 11,242,123 | | | | 365,179,995 | | | | 11,354,312 | | | | 114,639,139 | |
Reinvestment of distributions | | | 26,700,331 | | | | 192,422,002 | | | | 9,896,772 | | | | 152,647,743 | |
| | | | | | | | | | | | | | | | |
| | | 37,942,454 | | | | 557,601,997 | | | | 21,251,084 | | | | 267,286,882 | |
Cost of shares redeemed | | | (62,696,156 | ) | | | (1,512,259,207 | ) | | | (35,987,561 | ) | | | (575,777,856 | ) |
| | | | | | | | | | | | | | | | |
Net decrease in net assets resulting from capital share transactions | | | (24,753,702 | ) | | | (954,657,210 | ) | | | (14,736,477 | ) | | | (308,490,974 | ) |
| | | | | | | | | | | | | | | | |
Net decrease in net assets | | | (44,943,674 | ) | | | (1,777,746,365 | ) | | | (303,642 | ) | | | (851,845,606 | ) |
| | | | | | | | | | | | | | | | |
NET ASSETS: | | | | | | | | | | | | | | | | |
Beginning of period | | | 865,678,295 | | | | 2,643,424,660 | | | | 571,810,666 | | | | 1,423,656,272 | |
| | | | | | | | | | | | | | | | |
End of period | | $ | 820,734,621 | | | $ | 865,678,295 | | | $ | 571,507,024 | | | $ | 571,810,666 | |
| | | | | | | | | | | | | | | | |
Undistributed net investment income at end of period | | $ | 8,530,206 | | | $ | 26,695,514 | | | $ | 3,590,951 | | | $ | 9,893,675 | |
| | | | | | | | | | | | | | | | |
See Accompanying Notes to Financial Statements
7
STATEMENTS OF CHANGES IN NET ASSETS (UNAUDITED)
| | | | | | | | |
| | | ING Index Plus SmallCap Portfolio | |
| | | Six Months
Ended June 30, 2009 | | | Year Ended December 31, 2008 | |
FROM OPERATIONS: | | | | | | | | |
Net investment income | | $ | 1,277,672 | | | $ | 5,475,352 | |
Net realized loss on investments and futures | | | (61,545,613 | ) | | | (114,398,924 | ) |
Net change in unrealized appreciation or depreciation on investments and futures | | | 59,555,267 | | | | (73,817,310 | ) |
| | | | | | | | |
Decrease in net assets resulting from operations | | | (712,674 | ) | | | (182,740,882 | ) |
| | | | | | | | |
FROM DISTRIBUTIONS TO SHAREHOLDERS: | | | | | | | | |
Net investment income: | | | | | | | | |
Class I | | | (3,679,025 | ) | | | (4,491,258 | ) |
Class S | | | (1,395,586 | ) | | | (934,827 | ) |
Net realized gains: | | | | | | | | |
Class I | | | — | | | | (30,586,826 | ) |
Class S | | | — | | | | (9,757,114 | ) |
| | | | | | | | |
Total distributions | | | (5,074,611 | ) | | | (45,770,025 | ) |
| | | | | | | | |
FROM CAPITAL SHARE TRANSACTIONS: | | | | | | | | |
Net proceeds from sale of shares | | | 9,994,786 | | | | 102,067,744 | |
Reinvestment of distributions | | | 5,074,611 | | | | 45,770,025 | |
| | | | | | | | |
| | | 15,069,397 | | | | 147,837,769 | |
Cost of shares redeemed | | | (24,044,202 | ) | | | (442,222,983 | ) |
| | | | | | | | |
Net decrease in net assets resulting from capital share transactions | | | (8,974,805 | ) | | | (294,385,214 | ) |
| | | | | | | | |
Net decrease in net assets | | | (14,762,090 | ) | | | (522,896,121 | ) |
| | | | | | | | |
NET ASSETS: | | | | | | | | |
Beginning of period | | | 297,564,143 | | | | 820,460,264 | |
| | | | | | | | |
End of period | | $ | 282,802,053 | | | $ | 297,564,143 | |
| | | | | | | | |
Undistributed net investment income at end of period | | $ | 1,276,821 | | | $ | 5,073,760 | |
| | | | | | | | |
See Accompanying Notes to Financial Statements
8
FINANCIAL HIGHLIGHTS (UNAUDITED)
Selected data for a share of beneficial interest outstanding throughout each year or period.
| | | | | | | | | | | | | | | | | | | | | | | | | | | | | | | | | | | | | | | |
| | | | | Income (loss)
from
investment
operations | | | | | | Less distributions | | | | | | | | | Ratios to average net assets | | | Supplemental
data |
| | | | | | | | | | | | | | | | | | | | | | | | | | | | | | | | | | | | | | | |
| | | Net asset value, beginning of year or period | | Net investment income (loss) | | | Net realized and unrealized gain (loss) | | | Total from investment operations | | | From net investment income | | From net realized gains | | From return of capital | | Total distributions | | Net asset value, end of year or period | | Total Return(1) | | | Expenses before reductions/ additions(2) | | Expenses net of fee waivers and/or recoupments, if any(2)(3) | | | Expenses net of all reductions/ additions(2)(3) | | | `Net investment income (loss)(2)(3) | | | Net assets, end of year or period | | Portfolio turnover rate |
| | | | | | | | | | | | | | | | | | | | | | | | | | | | | | | | | | | | | | | |
Year or period ended | | ($) | | ($) | | | ($) | | | ($) | | | ($) | | ($) | | ($) | | ($) | | ($) | | (%) | | | (%) | | (%) | | | (%) | | | (%) | | | ($000’s) | | (%) |
ING Index Plus LargeCap Portfolio | | | | | | | | | | | | | | | | | | | | | | | | | | | | | | | | | | | | | | | |
Class I | | | | | | | | | | | | | | | | | | | | | | | | | | | | | | | | | | | | | | | |
06-30-09 | | 10.44 | | 0.12 | | | 0.01 | | | 0.13 | | | 0.35 | | — | | — | | 0.35 | | 10.22 | | 1.38 | | | 0.51 | | 0.51 | † | | 0.51 | † | | 2.25 | † | | 651,216 | | 72 |
12-31-08 | | 18.13 | | 0.25 | • | | (6.57 | ) | | (6.32 | ) | | 0.30 | | 1.07 | | — | | 1.37 | | 10.44 | | (37.21 | ) | | 0.47 | | 0.47 | † | | 0.47 | † | | 1.70 | † | | 680,918 | | 175 |
12-31-07 | | 17.48 | | 0.29 | • | | 0.58 | | | 0.87 | | | 0.22 | | — | | — | | 0.22 | | 18.13 | | 5.03 | †† | | 0.44 | | 0.44 | † | | 0.44 | † | | 1.62 | † | | 2,323,707 | | 121 |
12-31-06 | | 15.42 | | 0.23 | • | | 2.00 | | | 2.23 | | | 0.17 | | — | | — | | 0.17 | | 17.48 | | 14.58 | | | 0.43 | | 0.43 | † | | 0.43 | † | | 1.46 | † | | 2,352,193 | | 128 |
12-31-05 | | 14.82 | | 0.19 | • | | 0.60 | | | 0.79 | | | 0.19 | | — | | — | | 0.19 | | 15.42 | | 5.38 | | | 0.45 | | 0.45 | | | 0.45 | | | 1.30 | | | 1,389,139 | | 89 |
Class S | | | | | | | | | | | | | | | | | | | | | | | | | | | | | | | | | | | | | | | |
06-30-09 | | 10.34 | | 0.10 | • | | 0.02 | | | 0.12 | | | 0.31 | | — | | — | | 0.31 | | 10.15 | | 1.26 | | | 0.76 | | 0.76 | † | | 0.76 | † | | 2.00 | † | | 169,518 | | 72 |
12-31-08 | | 17.99 | | 0.21 | • | | (6.51 | ) | | (6.30 | ) | | 0.28 | | 1.07 | | — | | 1.35 | | 10.34 | | (37.40 | ) | | 0.72 | | 0.72 | † | | 0.72 | † | | 1.53 | † | | 184,760 | | 175 |
12-31-07 | | 17.32 | | 0.25 | • | | 0.57 | | | 0.82 | | | 0.15 | | — | | — | | 0.15 | | 17.99 | | 4.77 | †† | | 0.69 | | 0.69 | † | | 0.69 | † | | 1.38 | † | | 319,717 | | 121 |
12-31-06 | | 15.30 | | 0.18 | • | | 1.99 | | | 2.17 | | | 0.15 | | — | | — | | 0.15 | | 17.32 | | 14.28 | | | 0.68 | | 0.68 | † | | 0.68 | † | | 1.13 | † | | 209,440 | | 128 |
12-31-05 | | 14.73 | | 0.16 | • | | 0.59 | | | 0.75 | | | 0.18 | | — | | — | | 0.18 | | 15.30 | | 5.15 | | | 0.70 | | 0.70 | | | 0.70 | | | 1.10 | | | 557,134 | | 89 |
| | | | | | | | | | | | | | | | |
ING Index Plus MidCap Portfolio | | | | | | | | | | | | | | | | | | | | | | | | | | | | | | | | | | | | | | | |
Class I | | | | | | | | | | | | | | | | | | | | | | | | | | | | | | | | | | | | | | | |
06-30-09 | | 9.94 | | 0.07 | | | 0.43 | | | 0.50 | | | 0.19 | | — | | — | | 0.19 | | 10.25 | | 5.06 | | | 0.55 | | 0.55 | † | | 0.55 | † | | 1.41 | † | | 450,688 | | 56 |
12-31-08 | | 18.33 | | 0.22 | | | (6.37 | ) | | (6.15 | ) | | 0.22 | | 2.02 | | — | | 2.24 | | 9.94 | | (37.56 | ) | | 0.52 | | 0.52 | † | | 0.52 | † | | 1.14 | † | | 447,503 | | 113 |
12-31-07 | | 18.89 | | 0.21 | | | 0.83 | | | 1.04 | | | 0.15 | | 1.45 | | — | | 1.60 | | 18.33 | | 5.50 | †† | | 0.49 | | 0.49 | † | | 0.49 | † | | 1.06 | † | | 1,177,708 | | 127 |
12-31-06 | | 18.69 | | 0.17 | • | | 1.57 | | | 1.74 | | | 0.12 | | 1.42 | | — | | 1.54 | | 18.89 | | 9.44 | | | 0.49 | | 0.49 | † | | 0.49 | † | | 0.92 | † | | 1,148,074 | | 84 |
12-31-05 | | 18.16 | | 0.16 | • | | 1.77 | | | 1.93 | | | 0.09 | | 1.31 | | — | | 1.40 | | 18.69 | | 11.14 | | | 0.49 | | 0.49 | | | 0.49 | | | 0.87 | | | 844,703 | | 100 |
Class S | | | | | | | | | | | | | | | | | | | | | | | | | | | | | | | | | | | | | | | |
06-30-09 | | 9.82 | | 0.07 | | | 0.41 | | | 0.48 | | | 0.15 | | — | | — | | 0.15 | | 10.15 | | 4.91 | | | 0.80 | | 0.80 | † | | 0.80 | † | | 1.16 | † | | 120,819 | | 56 |
12-31-08 | | 18.13 | | 0.14 | | | (6.26 | ) | | (6.12 | ) | | 0.17 | | 2.02 | | — | | 2.19 | | 9.82 | | (37.73 | ) | | 0.77 | | 0.77 | † | | 0.77 | † | | 0.91 | † | | 124,308 | | 113 |
12-31-07 | | 18.69 | | 0.15 | | | 0.84 | | | 0.99 | | | 0.10 | | 1.45 | | — | | 1.55 | | 18.13 | | 5.26 | †† | | 0.74 | | 0.74 | † | | 0.74 | † | | 0.81 | † | | 245,948 | | 127 |
12-31-06 | | 18.53 | | 0.12 | | | 1.55 | | | 1.67 | | | 0.09 | | 1.42 | | — | | 1.51 | | 18.69 | | 9.12 | | | 0.74 | | 0.74 | † | | 0.74 | † | | 0.63 | † | | 227,616 | | 84 |
12-31-05 | | 18.05 | | 0.11 | • | | 1.75 | | | 1.86 | | | 0.07 | | 1.31 | | — | | 1.38 | | 18.53 | | 10.84 | | | 0.74 | | 0.74 | | | 0.74 | | | 0.62 | | | 278,554 | | 100 |
See Accompanying Notes to Financial Statements
9
FINANCIAL HIGHLIGHTS (UNAUDITED) (CONTINUED)
Selected data for a share of beneficial interest outstanding throughout each year or period.
| | | | | | | | | | | | | | | | | | | | | | | | | | | | | | | | | | | | | | | |
| | | | | Income (loss)
from
investment
operations | | | | | | Less distributions | | | | | | | | | Ratios to average net assets | | | Supplemental
data |
| | | | | | | | | | | | | | | | | | | | | | | | | | | | | | | | | | | | | | | |
| | | Net asset value, beginning of year or period | | Net investment income (loss) | | | Net realized and unrealized gain (loss) | | | Total from investment operations | | | From net investment income | | From net realized gains | | From return of capital | | Total distributions | | Net asset value, end of year or period | | Total Return(1) | | | Expenses before reductions/ additions(2) | | Expenses net of fee waivers and/or recoupments, if any(2)(3) | | | Expenses net of all reductions/ additions(2)(3) | | | Net investment income (loss)(2)(3) | | | Net assets, end of year or period | | Portfolio turnover rate |
| | | | | | | | | | | | | | | | | | | | | | | | | | | | | | | | | | | | | | | |
Year or period ended | | ($) | | ($) | | | ($) | | | ($) | | | ($) | | ($) | | ($) | | ($) | | ($) | | (%) | | | (%) | | (%) | | | (%) | | | (%) | | | ($000’s) | | (%) |
ING Index Plus SmallCap Portfolio | | | | | | | | | | | | | | | | | | | | | | | | | | | | | | | | | | | | | | | |
Class I | | | | | | | | | | | | | | | | | | | | | | | | | | | | | | | | | | | | | | | |
06-30-09 | | 9.41 | | 0.05 | | | (0.01 | ) | | 0.04 | | | 0.18 | | — | | — | | 0.18 | | 9.27 | | 0.47 | | | 0.56 | | 0.56 | † | | 0.56 | † | | 1.06 | † | | 193,015 | | 38 |
12-31-08 | | 15.19 | | 0.14 | • | | (4.97 | ) | | (4.83 | ) | | 0.12 | | 0.83 | | — | | 0.95 | | 9.41 | | (33.58 | ) | | 0.52 | | 0.52 | † | | 0.52 | † | | 1.10 | † | | 201,978 | | 100 |
12-31-07 | | 17.99 | | 0.12 | | | (1.07 | ) | | (0.95 | ) | | 0.08 | | 1.77 | | — | | 1.85 | | 15.19 | | (6.22 | ) | | 0.49 | | 0.49 | † | | 0.49 | † | | 0.67 | † | | 638,474 | | 126 |
12-31-06 | | 16.68 | | 0.09 | • | | 2.20 | | | 2.29 | | | 0.07 | | 0.91 | | — | | 0.98 | | 17.99 | | 13.82 | | | 0.49 | | 0.49 | † | | 0.49 | † | | 0.52 | † | | 745,115 | | 93 |
12-31-05 | | 16.39 | | 0.11 | • | | 1.09 | | | 1.20 | | | 0.05 | | 0.86 | | — | | 0.91 | | 16.68 | | 7.62 | | | 0.49 | | 0.49 | | | 0.49 | | | 0.66 | | | 378,121 | | 71 |
Class S | | | | | | | | | | | | | | | | | | | | | | | | | | | | | | | | | | | | | | | |
06-30-09 | | 9.30 | | 0.04 | | | (0.01 | ) | | 0.03 | | | 0.14 | | — | | — | | 0.14 | | 9.19 | | 0.40 | | | 0.81 | | 0.81 | † | | 0.81 | † | | 0.81 | † | | 89,787 | | 38 |
12-31-08 | | 15.01 | | 0.13 | | | (4.93 | ) | | (4.80 | ) | | 0.08 | | 0.83 | | — | | 0.91 | | 9.30 | | (33.73 | ) | | 0.77 | | 0.77 | † | | 0.77 | † | | 0.87 | † | | 95,586 | | 100 |
12-31-07 | | 17.79 | | 0.07 | | | (1.06 | ) | | (0.99 | ) | | 0.02 | | 1.77 | | — | | 1.79 | | 15.01 | | (6.49 | ) | | 0.74 | | 0.74 | † | | 0.74 | † | | 0.42 | † | | 181,986 | | 126 |
12-31-06 | | 16.53 | | 0.04 | • | | 2.18 | | | 2.22 | | | 0.05 | | 0.91 | | — | | 0.96 | | 17.79 | | 13.48 | | | 0.74 | | 0.74 | † | | 0.74 | † | | 0.25 | † | | 204,246 | | 93 |
12-31-05 | | 16.28 | | 0.07 | • | | 1.08 | | | 1.15 | | | 0.04 | | 0.86 | | — | | 0.90 | | 16.53 | | 7.36 | | | 0.74 | | 0.74 | | | 0.74 | | | 0.43 | | | 333,092 | | 71 |
| (1) | | Total return is calculated assuming reinvestment of all dividends and capital gain distributions at net asset value and does not reflect the effect of insurance contract charges. Total return for periods less than one year is not annualized. |
| (2) | | Annualized for periods less than one year. |
| (3) | | Expense ratios reflect operating expenses of a Series. Expenses before reductions do not reflect amounts reimbursed by the Investment Adviser and/or Distributor or reductions from brokerage commission recapture arrangements or other expense offset arrangements and do not represent the amount paid by a Series during periods when reimbursements or reductions occur. Expenses net of fee waivers reflect expenses after reimbursement by the Investment Adviser and/or Distributor but prior to reductions from brokerage commission recapture arrangements or other expense offset arrangements. Expenses net of all reductions represent the net expenses paid by a Series. Net investment income (loss) is net of all such additions or reductions. |
| (4) | | Commencement of operations. |
| · | | Calculated using average number of shares outstanding throughout the period. |
| † | | Impact of waiving the advisory fee for the ING Institutional Prime Money Market Fund holding has less than 0.005% impact on the expense ratio and net investment income or less ratio. |
See Accompanying Notes to Financial Statements
10
NOTES TO FINANCIAL STATEMENTSASOF JUNE 30, 2009 (UNAUDITED)
NOTE 1 — ORGANIZATION
Organization. ING Variable Portfolios, Inc. (the “Company”) is registered under the Investment Company Act of 1940, as amended (“1940 Act” or “Act”) as an open-end management investment company.
ING Variable Portfolios, Inc. is a company incorporated under the laws of Maryland on June 4, 1996. There are nineteen active separate investment series that comprise the Company. The three series (each a “Portfolio”, collectively the “Portfolios”) that are in this report are: ING Index Plus LargeCap Portfolio (“Index Plus LargeCap”), formerly ING VP Index Plus LargeCap Portfolio, ING Index Plus MidCap Portfolio (“Index Plus MidCap”), formerly ING VP Index Plus MidCap Portfolio and ING Index Plus SmallCap Portfolio (“Index Plus SmallCap”), formerly ING VP Index Plus SmallCap Portfolio.
Index Plus LargeCap seeks to outperform the total return performance of the Standard & Poor’s 500® Composite Stock Price Index (“S&P 500® Index”), while maintaining a market level of risk.
Index Plus MidCap seeks to outperform the total return performance of the Standard & Poor’s (“S&P”) MidCap 400 Index, while maintaining a market level of risk.
Index Plus SmallCap seeks to outperform the total return performance of the S&P SmallCap 600 Index, while maintaining a market level of risk.
Each Portfolio offers Class I and Class S shares. The two classes differ principally in the applicable distribution and service fees. Shareholders of each class also bear certain expenses that pertain to that particular class. All shareholders bear the common expenses of the Portfolio and earn income and realized gains/losses from the Portfolio pro rata based on the average daily net assets of each class, without distinction between share classes. Common expenses of the Portfolios (including custodial asset-based fees, legal and audit fees, printing and mailing expenses, transfer agency out-of-pocket expenses, and fees and expenses of the independent directors) are allocated to each Portfolio in proportion to its average net assets. Expenses directly attributable to a particular Portfolio (including advisory, administration, custodial transaction-based, registration, other professional, distribution and/or service fees, certain taxes, and offering costs) are charged directly to that Portfolio. Differences in per share dividend rates generally result from differences in separate class expenses, including distribution and shareholder service fees, if applicable.
Shares of the Portfolios may be offered to separate accounts of insurance companies as investment options under variable annuity contracts and variable life insurance policies (“Variable Contracts”). Shares may also be offered to qualified pension and retirement plans outside the Variable Contract and to certain investment advisers and their affiliates. Class I shares may be made available to other investment companies, including other series of the Company under fund-of-funds arrangements.
Participating insurance companies and other designated organizations are authorized to receive purchase orders on each Portfolio’s behalf.
ING Investments, LLC (“ING Investments” or the “Investment Adviser”), an Arizona limited liability company, serves as the Investment Adviser to the Portfolios. ING Investments has engaged ING Investment Management Co. (“ING IM” or “Sub-Adviser”), a Connecticut corporation, to serve as the sub-adviser to the Portfolios. ING Funds Distributor, LLC (the “Distributor” or ”IFD”) is the principal underwriter of the Portfolios. ING Investments, ING IM and the Distributor are indirect, wholly-owned subsidiaries of ING Groep N.V. (“ING Groep”). ING Groep is a global financial institution of Dutch origin offering banking, investments, life insurance and retirement services.
On October 19, 2008, ING Groep announced that it reached an agreement with the Dutch government to strengthen its capital position. ING Groep issued non-voting core Tier-1 securities for a total consideration of EUR 10 billion to the Dutch State. The transaction boosts ING Bank’s core Tier-1 ratio, strengthens the insurance balance sheet and reduces ING Groep’s Debt/Equity ratio.
NOTE 2 — SIGNIFICANT ACCOUNTING POLICIES
The following significant accounting policies are consistently followed by the Portfolios in the preparation of their financial statements. Such policies are in conformity with U.S. generally accepted accounting principles for investment companies.
| A. | Security Valuation. Investments in equity securities traded on a national securities exchange are valued at the last reported sale price. Securities reported by NASDAQ are valued at the NASDAQ official closing prices. Securities traded on an exchange or NASDAQ for which there has been no sale and securities traded in the over-the-counter-market are valued at the mean between the last reported bid and ask prices. All investments quoted |
11
NOTES TO FINANCIAL STATEMENTSASOF JUNE 30, 2009 (UNAUDITED) (CONTINUED)
NOTE 2 — SIGNIFICANT ACCOUNTING POLICIES (continued)
| | in foreign currencies will be valued daily in U.S. dollars on the basis of the foreign currency exchange rates prevailing at that time. Debt securities acquired with more than 60 days to maturity are fair valued using matrix pricing methods determined by an independent pricing service which takes into consideration such factors as yields, maturities, liquidity, ratings and traded prices in similar or identical securities. Securities for which valuations are not readily available from an independent pricing service may be valued by brokers which use prices provided by market makers or estimates of fair market value obtained from yield data relating to investments or securities with similar characteristics. U.S. government obligations are valued by using market quotations or independent pricing services that use prices provided by market- makers or estimates of market values obtained from yield data relating to instruments or securities with similar characteristics. |
Securities and assets for which market quotations are not readily available (which may include certain restricted securities which are subject to limitations as to their sale) are valued at their fair values, as defined in the 1940 Act, and as determined in good faith by or under the supervision of the Portfolios’ Board of Directors (“Board”), in accordance with methods that are specifically authorized by the Board. Securities traded on exchanges, including foreign exchanges, which close earlier than the time that a Portfolio calculates its net asset value (“NAV”) may also be valued at their fair values, as defined by the 1940 Act, and as determined in good faith by or under the supervision of the Board, in accordance with methods that are specifically authorized by the Board. The valuation techniques applied in any specific instance are likely to vary from case to case. With respect to a restricted security, for example, consideration is generally given to the cost of the investment, the market value of any unrestricted securities of the same class at the time of valuation, the potential expiration of restrictions on the security, the existence of any registration rights, the costs to the Portfolios related to registration of the security, as well as factors relevant to the issuer itself. Consideration may also be given to the price and extent of any public trading in similar
securities of the issuer or comparable companies’ securities. The value of a foreign security traded on an exchange outside the United States is generally based on its price on the principal foreign exchange where it trades as of the time a Portfolio determines its NAV or if the foreign exchange closes prior to the time a Portfolio determines its NAV, the most recent closing price of the foreign security on its principal exchange. Trading in certain non-U.S. securities may not take place on all days on which the New York Stock Exchange (“NYSE”) is open. Further, trading takes place in various foreign markets on days on which the NYSE is not open. Consequently, the calculation of a Portfolio’s NAV may not take place contemporaneously with the determination of the prices of securities held by a Portfolio in foreign securities markets. Further, the value of a Portfolio’s assets may be significantly affected by foreign trading on days when a shareholder cannot purchase or redeem shares of a Portfolio. In calculating a Portfolio’s NAV, foreign securities denominated in foreign currency are converted to U.S. dollar equivalents. If an event occurs after the time at which the market for foreign securities held by a Portfolio closes but before the time that a Portfolio’s NAV is calculated, such event may cause the closing price on the foreign exchange to not represent a readily available reliable market value quotation for such securities at the time a Portfolio determines its NAV. In such a case, a Portfolio will use the fair value of such securities as determined under a Portfolio’s valuation procedures. Events after the close of trading on a foreign market that could require a Portfolio to fair value some or all of its foreign securities include, among others, securities trading in the U.S. and other markets, corporate announcements, natural and other disasters, and political and other events. Among other elements of analysis in the determination of a security’s fair value, the Board has authorized the use of one or more independent research services to assist with such determinations. An independent research service may use statistical analyses and quantitative models to help determine fair value as of the time a Portfolio calculates its NAV. There can be no assurance that such models accurately reflect the behavior of the applicable markets or the effect of the behavior of such markets on the fair value of securities, or that such markets will continue to behave in a fashion that is consistent with such
12
NOTES TO FINANCIAL STATEMENTSASOF JUNE 30, 2009 (UNAUDITED) (CONTINUED)
NOTE 2 — SIGNIFICANT ACCOUNTING POLICIES (continued)
models. Unlike the closing price of a security on an exchange, fair value determinations employ elements of judgment. Consequently, the fair value assigned to a security may not represent the actual value that a Portfolio could obtain if it were to sell the security at the time of the close of the NYSE. Pursuant to procedures adopted by the Board, a Portfolio is not obligated to use the fair valuations suggested by any research service, and valuation recommendations provided by such research services may be overridden if other events have occurred or if other fair valuations are determined in good faith to be more accurate. Unless an event is such that it causes a Portfolio to determine that the closing prices for one or more securities do not represent readily available reliable market value quotations at the time the Portfolio determines its NAV, events that occur between the time of the close of the foreign market on which they are traded and the close of regular trading on the NYSE will not be reflected in a Portfolio’s NAV. Investments in securities maturing in 60 days or less from date of acquisition are valued at amortized cost which approximates market value.
Effective for fiscal years beginning after November 15, 2007, Financial Accounting Standards Board (“FASB”) Statement of Financial Accounting Standards No. 157, “Fair Value Measurements”, establishes a hierarchy for measuring fair value of assets and liabilities. As required by the standard, each investment asset or liability of the Portfolios is assigned a level at measurement date based on the significance and source of the inputs to its valuation. Quoted prices in active markets for identical securities are classified as “Level 1”, inputs other than quoted prices for an asset or liability that are observable are classified as “Level 2” and unobservable inputs, including the sub-adviser’s judgment about the assumptions that a market participant would use in pricing an asset or liability are classified as “Level 3”. The inputs used for valuing securities are not necessarily an indication of the risks associated with investing in those securities. A table summarizing the Portfolios’ investments under these levels of classification is included following the Portfolios of Investments. For the six months ended June 30, 2009, there have been no significant changes to the fair valuation methodologies.
On April 9, 2009, the FASB issued FASB Staff Position No. FAS 157-4, Determining Fair Value When the Volume and Level of Activity for the Asset or Liability Have Significantly Decreased and Identifying Transactions That Are Not Orderly (“FSP 157-4”). FSP 157-4 requires enhanced disclosures about the inputs and valuation technique(s) used to measure fair value and a discussion of changes in valuation techniques and related inputs, if any, during the period. In addition, the three-level hierarchy disclosure and the level three roll-forward disclosure are to be expanded for each major category of equity and debt securities. There was no change to the financial position of the Portfolios and the results of their operations due to the adoption of FSP 157-4 and all disclosures have been made for the current period as part of the Notes to Financial Statements and Portfolio of Investments.
On March 19, 2008, the FASB issued Statement of Financial Accounting Standards No. 161 (“SFAS No. 161”), “Disclosure about Derivative Instruments and Hedging Activities.” This new accounting statement requires enhanced disclosures about an entity’s derivative and hedging activities. Entities are required to provide enhanced disclosures about (a) how and why an entity invests in derivatives, (b) how derivatives are accounted for under SFAS No. 133, and (c) how derivatives affect an entity’s financial position, financial performance, and cash flows. SFAS No. 161 also requires enhanced disclosures regarding credit-risk-related contingent features of derivative instruments. All changes to disclosures have been made in accordance with SFAS 161 and have been incorporated for the current period as part of the Notes to Financial Statements and Portfolio of Investments.
| B. | Security Transactions and Revenue Recognition. Securities transactions are accounted for on the trade date. Realized gains and losses are reported on the basis of identified cost of securities sold. Interest income is recorded on an accrual basis. Dividend income is recorded on the ex-dividend date, or for certain foreign securities, when the information becomes available to the Portfolios. Premium amortization and discount accretion are determined by the effective yield method. |
13
NOTES TO FINANCIAL STATEMENTSASOF JUNE 30, 2009 (UNAUDITED) (CONTINUED)
NOTE 2 — SIGNIFICANT ACCOUNTING POLICIES (continued)
| C. | Foreign Currency Translation. The books and records of the Portfolios are maintained in U.S. dollars. Any foreign currency amounts are translated into U.S. dollars on the following basis: |
| | (1) | Market value of investment securities, other assets and liabilities — at the exchange rates prevailing at the end of the day. |
| | (2) | Purchases and sales of investment securities, income and expenses — at the rates of exchange prevailing on the respective dates of such transactions. |
Although the net assets and the market values are presented at the foreign exchange rates at the end of the day, the Portfolios do not isolate the portion of the results of operations resulting from changes in foreign exchange rates on investments from the fluctuations arising from changes in market prices of securities held. Such fluctuations are included with the net realized and unrealized gains or losses from investments. For securities, which are subject to foreign withholding tax upon disposition, liabilities are recorded on the Statements of Assets and Liabilities for the estimated tax withholding based on the securities’ current market value. Upon disposition, realized gains or losses on such securities are recorded net of foreign withholding tax.
Reported net realized foreign exchange gains or losses arise from sales of foreign currencies, currency gains or losses realized between the trade and settlement dates on securities transactions, the difference between the amounts of dividends, interest, and foreign withholding taxes recorded on a Portfolio’s books, and the U.S. dollar equivalent of the amounts actually received or paid. Net unrealized foreign exchange gains and losses arise from changes in the value of assets and liabilities other than investments in securities at fiscal year end, resulting from changes in the exchange rate. Foreign security and currency transactions may involve certain considerations and risks not typically associated with investing in U.S. companies and U.S. Government securities. These risks include, but are not limited to, revaluation of currencies and future adverse political and economic developments which could cause securities and their markets to be less liquid and prices more volatile than those of comparable U.S. companies and U.S. Government securities.
| D. | Risk Exposures and the use of Derivative Instruments. Each Portfolio’s investment objectives permit it to enter into various types of derivatives contracts, including, but not limited to, futures contracts, forward foreign currency exchange contracts, credit default swaps, interest rate swaps, total return swaps, and purchased and written options. In doing so, the Portfolio will employ strategies in differing combinations to permit it to increase or decrease the level of risk, or change the level or types of exposure to market risk factors. This may allow the Portfolio to pursue its objectives more quickly, and efficiently than if it were to make direct purchases or sales of securities capable of affecting a similar response to market factors. |
Market Risk Factors. In pursuit of its investment objectives, a Portfolio may seek to use derivatives to increase or decrease its exposure to the following market risk factors:
Credit Risk. Credit risk relates to the ability of the issuer to meet interest and principal payments, or both, as they come due. In general, lower-grade, higher-yield bonds are subject to credit risk to a greater extent than lower-yield, higher-quality bonds.
Equity Risk. Equity risk relates to the change in value of equity securities as they relate to increases or decreases in the general market.
Foreign Exchange Rate Risk. Foreign exchange rate risk relates to the change in U.S. dollar value of a security held that is denominated in a foreign currency. The U.S. dollar value of a foreign currency denominated security will decrease as the dollar appreciates against the currency, while the U.S. dollar value will increase as the dollar depreciates against the currency.
Interest Rate Risk. Interest rate risk refers to the fluctuations in value of fixed-income securities resulting from the inverse relationship between price and yield. For example, an increase in general interest rates will tend to reduce the market value of already issued fixed-income investments, and a decline in general interest rates will tend to increase their value. In addition, debt securities with longer maturities, which tend to have higher yields, are subject to potentially greater fluctuations in value from changes in interest rates than obligations with shorter maturities.
14
NOTES TO FINANCIAL STATEMENTSASOF JUNE 30, 2009 (UNAUDITED) (CONTINUED)
NOTE 2 — SIGNIFICANT ACCOUNTING POLICIES (continued)
Risks of Investing in Derivatives. Each Portfolio’s use of derivatives can result in losses due to unanticipated changes in the market risk factors and the overall market. In instances where a Portfolio is using derivatives to decrease, or hedge, exposures to market risk factors for securities held by a Portfolio, there are also risks that those derivatives may not perform as expected resulting in losses for the combined or hedged positions.
The use of these strategies involves certain special risks, including a possible imperfect correlation, or even no correlation, between price movements of derivative instruments and price movements of related investments. While some strategies involving derivative instruments can reduce the risk of loss, they can also reduce the opportunity for gain or even result in losses by offsetting favorable price movements in related investments or otherwise, due to the possible inability of a Portfolio to purchase or sell a portfolio security at a time that otherwise would be favorable or the possible need to sell a portfolio security at a disadvantageous time because the Portfolio is required to maintain asset coverage or offsetting positions in connection with transactions in derivative instruments. Additional associated risks from investing in derivatives also exist and potentially could have significant effects on the valuation of the derivative and a Portfolio. Associated risks are not the risks that a Portfolio is attempting to increase or decrease exposure to, per their investment objectives, but are the additional risks from investing in derivatives. Examples of these associated risks are liquidity risk, which is the risk that a Portfolio will not be able to sell the derivative in the open market in a timely manner, and counterparty credit risk, which is the risk that the counterparty will not fulfill its obligation to a Portfolio. Associated risks can be different for each type of derivative and are discussed by each derivative type in the following notes.
| E. | Foreign Currency Transactions and Futures Contracts. Each Portfolio may enter into foreign currency exchange transactions to convert to and from different foreign currencies and to and from the U.S. dollar in connection with the planned purchases or sales of securities. When entering into a currency forward contract, a Portfolio agrees to |
| | receive or deliver a fixed quantity of foreign currency for an agreed-upon price on an agreed upon date. The Portfolios either enter into these transactions on a spot basis at the spot rate prevailing in the foreign currency exchange market or use forward foreign currency contracts to purchase or sell foreign currencies. When the contract is fulfilled or closed, gains or losses are realized. Until then, the gain or loss is included in unrealized appreciation or depreciation. Risks may arise upon entering into forward contracts from the potential inability of counterparties to meet the terms of their forward contracts and from unanticipated movements in the value of foreign currencies relative to the U.S. dollar. |
Each Portfolio may enter into futures contracts involving foreign currency, interest rates, securities and security indices. A futures contract is a commitment to buy or sell a specific amount of a financial instrument at a negotiated price on a stipulated future date. Each Portfolio may buy and sell futures contracts. Futures contracts traded on a commodities or futures exchange will be valued at the final settlement price or official closing price on the principal exchange as reported by such principal exchange at its trading session ending at, or most recently prior to, the time when the Portfolios assets are valued.
Upon entering into a futures contract, each Portfolio is required to deposit either cash or securities (initial margin) in an amount equal to a certain percentage of the contract value. Subsequent payments (variation margin) are made or received by the Portfolio each day. The variation margin payments are equal to the daily changes in the contract value and are recorded as unrealized gains and losses. Open futures contracts are reported on a table following the each Portfolio of Investments. Securities held in collateralized accounts to cover initial margin requirements on open futures contracts are footnoted in the Portfolio of Investments. Cash collateral held by the broker to cover initial margin requirements on open futures contracts are noted in each Portfolio’s Statement of Assets and Liabilities. The net change in unrealized appreciation and depreciation is reported in each Portfolio’s Statement of Operations. Realized gains (losses) are reported in each Portfolio’s Statement of Operations at the closing or expiration of futures contracts.
15
NOTES TO FINANCIAL STATEMENTSASOF JUNE 30, 2009 (UNAUDITED) (CONTINUED)
NOTE 2 — SIGNIFICANT ACCOUNTING POLICIES (continued)
Futures contracts are exposed to the market risk factor of the underlying financial instrument. During the six months ended June 30, 2009, each Portfolio has purchased futures contracts on various equity indexes to increase exposure to equity risk. Additional associated risks of entering into futures contracts include the possibility that there may be an illiquid market where each Portfolio is unable to liquidate the contract or enter into an offsetting position and, if used for hedging purposes, the risk that the price of the contract will correlate imperfectly with the prices of each Portfolio’s securities.
Each Portfolio invests in derivatives only if the expected risks and rewards are consistent with its investment objectives, and overall risk profile. For the six months ended June 30, 2009, the total number of open futures contracts as presented following each Portfolio of Investments is indicative of the volume of this derivative type.
| F. | Distributions to Shareholders. The Portfolios record distributions to their shareholders on the ex- dividend date. Dividends from net investment income and capital gains, if any, are declared and paid annually by the Portfolios. The Portfolios may make distributions on a more frequent basis to comply with the distribution requirements of the Internal Revenue Code. The characteristics of income and gains to be distributed are determined in accordance with income tax regulations, which may differ from U.S. generally accepted accounting principles for investment companies. |
| G. | Federal Income Taxes. It is the policy of each Portfolio to comply with subchapter M of the Internal Revenue Code and related excise tax provisions applicable to regulated investment companies and to distribute substantially all of its net investment income and any net realized capital gains to their shareholders. Therefore, no federal income tax provision is required. Management has considered the sustainability of the Portfolios’ tax positions taken on federal income tax returns for all open tax years in making this determination. No capital gain distributions shall be made until any capital loss carryforwards have been fully utilized or expired. |
| H. | Use of Estimates. The preparation of financial statements in conformity with U.S. generally accepted accounting principles requires |
| | management to make estimates and assumptions that affect the reported amounts of assets and liabilities and disclosure of contingent assets and liabilities at the date of the financial statements and the reported amounts of increases and decreases in net assets from operations during the reporting period. Actual results could differ from those estimates. |
| I. | Securities Lending. Each Portfolio has the option to temporarily loan up to 33 1/3% of its total assets to brokers, dealers or other financial institutions in exchange for a negotiated lender’s fee. The borrower is required to fully collateralize the loans with cash or U.S. Government securities. Generally, in the event of counterparty default, each Portfolio has the right to use collateral to offset losses incurred. There would be potential loss to a Portfolio in the event the Portfolio is delayed or prevented from exercising its right to dispose of the collateral. Each Portfolio bears the risk of loss with respect to the investment of collateral. Engaging in securities lending could have a leveraging effect, which may intensify the credit, market and other risks associated with investing in a Portfolio. |
| J. | Illiquid and Restricted Securities. Each Portfolio may not invest more than 10% of its net assets in illiquid securities. Illiquid securities are not readily marketable. Disposing of illiquid investments may involve time-consuming negotiation and legal expenses, and it may be difficult or impossible for the Portfolios to sell them promptly at an acceptable price. Each Portfolio may also invest in restricted securities, which include those sold under Rule 144A of the Securities Act of 1933 (“1933 Act”) or securities offered pursuant to Section 4(2) of the 1933 Act, and/or are subject to legal or contractual restrictions on resale and may not be publicly sold without registration under the 1933 Act. Certain restricted securities may be considered liquid pursuant to procedures adopted by the Board or may be deemed to be illiquid because they may not be readily marketable. Illiquid and restricted securities are valued using market quotations when readily available. In the absence of market quotations, the securities are valued based upon their fair value, as defined in the Act, determined under procedures approved by the Board. |
| K. | Indemnifications. In the normal course of business, the Company may enter into contracts that provide certain indemnifications. The Company’s maximum exposure under these arrangements is dependent |
16
NOTES TO FINANCIAL STATEMENTSASOF JUNE 30, 2009 (UNAUDITED) (CONTINUED)
NOTE 2 — SIGNIFICANT ACCOUNTING POLICIES (continued)
| | on future claims that may be made against the Portfolios and, therefore, cannot be estimated; however, based on experience, the risk of loss from such claims is considered remote. |
NOTE 3 — INVESTMENT TRANSACTIONS
For the six months ended June 30, 2009, the cost of purchases and the proceeds from the sale of securities, excluding short-term securities, were as follows:
| | | | | | |
| | | Purchases | | Sales |
Index Plus LargeCap | | $ | 561,163,907 | | $ | 591,665,185 |
Index Plus MidCap | | | 292,939,244 | | | 320,619,109 |
Index Plus SmallCap | | | 97,778,287 | | | 118,178,250 |
NOTE 4 — INVESTMENT MANAGEMENT AND ADMINISTRATIVE FEES
The Portfolios entered into an investment management agreement (“Investment Management Agreement”) with the Investment Adviser. The Investment Management Agreement compensates the Investment Adviser with a fee, computed daily and payable monthly, based on the average daily net assets of each Portfolio, at the following annual rates:
| | | |
Index Plus LargeCap | | 0.35 | % |
Index Plus MidCap | | 0.40 | % |
Index Plus SmallCap | | 0.40 | % |
The Investment Adviser entered into a sub-advisory agreement with ING IM. Subject to such policies as the Board or the Investment Adviser may determine, ING IM manages the Portfolios’ assets in accordance with the Portfolios’ investment objectives, policies, and limitations.
ING Portfolios are permitted to invest end-of-day cash balances into ING Institutional Prime Money Market Fund. Investment management fees paid by the Portfolios will be reduced by an amount equal to the management fees paid indirectly to the ING Institutional Prime Money Market Fund with respect to assets invested by the Portfolios. For the six months ended June 30, 2009, the Investment Adviser for Index Plus LargeCap, Index Plus MidCap and Index Plus SmallCap waived $2,333, $3,430 and $1,961 of such management fees, respectively. These fees are not subject to recoupment.
Pursuant to the Administration Agreement, ING Funds Services, LLC (“IFS”), an indirect, wholly-owned subsidiary of ING Groep, acts as administrator and
provides certain administrative and shareholder services necessary for Portfolio operations and is responsible for the supervision of other service providers. IFS is entitled to receive from each Portfolio a fee at an annual rate of 0.055% on the first $5 billion of daily net assets and 0.03% thereafter.
In placing equity security transactions, the Investment Adviser or Sub-Adviser is required to use its best efforts to choose a broker capable of providing brokerage services necessary to obtain the best execution for each transaction. Subject to this requirement, the Investment Adviser or Sub-Adviser may allocate equity security transactions through certain designated broker-dealers. Some of these broker-dealers participate in commission recapture programs that have been established for the benefit of the Portfolios. Under these programs, the participating broker-dealers will return to a Portfolio a portion of the brokerage commissions (in the form of a credit to a Portfolio) paid to the broker-dealers to pay certain expenses of a Portfolio. These commission recapture payments benefit the Portfolios and not the Investment Adviser or Sub-Adviser. Any amount credited to a Portfolio is reflected as brokerage commission recapture in the Statements of Operations.
NOTE 5 — DISTRIBUTION FEES
Class S shares of the respective Portfolios have adopted a Distribution Plan pursuant to Rule 12b-1 under the 1940 Act (the “12b-1 Plans”), whereby the Distributor is compensated by each Portfolio for expenses incurred in the distribution of each Portfolio’s Class S shares (“Distribution Fees”). Pursuant to the 12b-1 Plans, the Distributor is entitled to a payment each month to compensate for expenses incurred in the distribution and promotion of each Portfolio’s S shares, including expenses incurred in printing prospectuses and reports used for sales purposes, expenses incurred in preparing and printing sales literature and other such distribution related expenses, including any distribution or shareholder servicing fees (“Service Fees”) paid to securities dealers who have executed a distribution agreement with the Distributor. Under the 12b-1 Plans, Class S shares of the Portfolios pays the Distributor Distribution Fees at a rate of 0.25% based on average daily net assets.
NOTE 6 — OTHER TRANSACTIONS WITH AFFILIATED AND RELATED PARTIES
At June 30, 2009, the Portfolios had the following amounts recorded in payable to affiliates on the
17
NOTES TO FINANCIAL STATEMENTSASOF JUNE 30, 2009 (UNAUDITED) (CONTINUED)
accompanying Statements of Assets and Liabilities (see Notes 4 and 5):
| | | | | | | | | | | | |
Fund | | Accrued Investment Management Fees | | Accrued Administrative Fees | | Accrued Shareholder Service and Distribution Fees | | Total |
Index Plus LargeCap | | $ | 238,624 | | $ | 37,556 | | $ | 35,248 | | $ | 311,428 |
Index Plus MidCap | | | 189,602 | | | 26,202 | | | 25,172 | | | 240,976 |
Index Plus SmallCap | | | 93,556 | | | 12,941 | | | 18,703 | | | 125,200 |
At June 30, 2009, the following indirect, wholly-owned subsidiaries of ING Groep owned more than 5% of the following Portfolios:
ING Life Insurance and Annuity Company — Index Plus LargeCap Portfolio (70.10%); Index Plus MidCap Portfolio (70.90%); Index Plus SmallCap Portfolio (53.60%)
ING USA Annuity and Life Insurance Company — Index Plus LargeCap Portfolio (19.60%); Index Plus MidCap Portfolio (19.70%); Index Plus SmallCap Portfolio (29.60%)
Control is defined by the 1940 Act as the beneficial ownership, either directly or through one or more controlled companies, of more than 25% of the voting securities of a company. The 1940 Act defines affiliates as companies that are under common control. Therefore, because the Portfolios have a common owner that owns over 25% of the outstanding securities of the Portfolios, they may be deemed to be affiliates of each other. Investment activities of these shareholders could have a material impact on the Portfolios.
The Company has adopted a Deferred Compensation Plan (“Policy”), which allows eligible non-affiliated directors as described in the Policy to defer the receipt of all or a portion of the directors’ fees payable. Deferred fees are invested in various funds advised by ING Investments until distribution in accordance with the Policy.
NOTE 7 — EXPENSE LIMITATION AGREEMENTS
ING Investments entered into written expense limitation agreements (“Expense Limitation Agreements”) with each of the Portfolios whereby the Investment Adviser has agreed to limit expenses, excluding interest, taxes, brokerage commissions and extraordinary expenses (and acquired fund fees and expenses) to the levels listed below:
| | | | | | |
| | | Class I | | | Class S | |
Index Plus LargeCap | | 0.55 | % | | 0.80 | % |
Index Plus MidCap | | 0.60 | % | | 0.85 | % |
Index Plus SmallCap | | 0.60 | % | | 0.85 | % |
The Investment Adviser may at a later date recoup from a Portfolio for management fees waived and other expenses assumed by the Investment Adviser during the previous 36 months, but only if, after such recoupment, the Portfolio’s expense ratio does not exceed the percentage described above. Waived and reimbursed fees and any recoupment by the Investment Adviser of such waived and reimbursed fees are reflected on the accompanying Statements of Operations for each Portfolio. Amounts payable by the Investment Adviser are reflected on the accompanying Statements of Assets and Liabilities for each Portfolio.
As of June 30, 2009, the Portfolios did not have any amount of waived or reimbursed fees that would be subject to possible recoupment by the Investment Adviser.
The Expense Limitation Agreements are contractual and shall renew automatically for one-year terms unless ING Investments provides written notice of the termination of an Expense Limitation Agreement within 90 days of the end of the then current term.
NOTE 8 — LINE OF CREDIT
All of the Portfolios included in this report, in addition to certain other portfolios managed by the Investment Adviser, have entered into an unsecured committed revolving line of credit agreement (the “Credit Agreement”) with The Bank of New York Mellon for an aggregate amount of $100,000,000. The proceeds may be used to: (1) temporarily finance the purchase or sale of securities; and (2) finance the redemption of shares of an investor of a Portfolio to which a loan is made. The Portfolios to which the line of credit is available pay a commitment fee equal to 0.125% per annum on the daily unused portion of the committed line amount.
Generally, borrowings under the Credit Agreement accrue interest at the federal funds rate plus a specified margin. Repayments generally must be made within 60 days after the date of a revolving credit advance. Each Portfolio utilized the line of credit during the six-months ended June 30, 2009:
| | | | | | | | |
| | | Days
Utilized | | Approximate
Average Daily
Balance | | Approximate
Weighted
Average
Interest Rate | |
Index Plus LargeCap | | 17 | | $ | 1,524,118 | | 1.20 | % |
Index Plus MidCap | | 3 | | | 736,667 | | 1.20 | |
Index Plus SmallCap | | 5 | | | 1,094,000 | | 1.20 | |
18
NOTES TO FINANCIAL STATEMENTSASOF JUNE 30, 2009 (UNAUDITED) (CONTINUED)
NOTE 9 — CAPITAL SHARES
Transactions in capital shares and dollars were as follows:
| | | | | | | | | | | | | | | | | | | | | | |
| | | Shares
sold | | Reinvestment
of
distributions | | Shares
redeemed | | | Net increase
(decrease) in
shares
outstanding | | | | | Shares
sold | | Reinvestment
of
distributions | | Shares
redeemed | | | Net increase
(decrease) in
shares
outstanding | |
Year or period ended | | # | | # | | # | | | # | | | | | ($) | | ($) | | ($) | | | ($) | |
Index Plus LargeCap | | | | | | | | | | | | | | | | |
Class I | | | | | | | | | | | | | | | | | | | | | | |
06-30-09 | | 1,073,160 | | 2,226,025 | | (4,796,778 | ) | | (1,497,593 | ) | | | | 10,352,160 | | 21,659,222 | | (45,839,990 | ) | | (13,828,608 | ) |
12-31-08 | | 18,229,336 | | 10,840,426 | | (92,001,496 | ) | | (62,931,734 | ) | | | | 282,508,457 | | 164,882,876 | | (1,413,077,540 | ) | | (965,686,207 | ) |
Class S | | | | | | | | | | | | | | | | | | | | | | |
06-30-09 | | 91,812 | | 521,314 | | (1,776,915 | ) | | (1,163,789 | ) | | | | 889,963 | | 5,041,109 | | (16,856,166 | ) | | (10,925,094 | ) |
12-31-08 | | 5,309,574 | | 1,823,783 | | (7,040,019 | ) | | 93,338 | | | | | 82,671,538 | | 27,539,126 | | (99,181,667 | ) | | 11,028,997 | |
Index Plus MidCap | | | | | | | | | | | | | | | | |
Class I | | | | | | | | | | | | | | | | | | | | | | |
06-30-09 | | 1,043,365 | | 816,590 | | (2,906,762 | ) | | (1,046,807 | ) | | | | 9,998,489 | | 8,141,406 | | (26,244,335 | ) | | (8,104,440 | ) |
12-31-08 | | 6,462,183 | | 8,397,804 | | (34,069,136 | ) | | (19,209,149 | ) | | | | 96,400,909 | | 124,035,571 | | (517,320,853 | ) | | (296,884,373 | ) |
Class S | | | | | | | | | | | | | | | | | | | | | | |
06-30-09 | | 142,195 | | 177,669 | | (1,077,117 | ) | | (757,253 | ) | | | | 1,355,823 | | 1,755,366 | | (9,743,226 | ) | | (6,632,037 | ) |
12-31-08 | | 1,214,189 | | 1,955,719 | | (4,074,969 | ) | | (905,061 | ) | | | | 18,238,230 | | 28,612,172 | | (58,457,003 | ) | | (11,606,601 | ) |
Index Plus SmallCap | | | | | | | | | | | | | | | | |
Class I | | | | | | | | | | | | | | | | | | | | | | |
06-30-09 | | 1,016,371 | | 407,422 | | (2,075,430 | ) | | (651,637 | ) | | | | 8,706,427 | | 3,679,025 | | (17,259,118 | ) | | (4,873,666 | ) |
12-31-08 | | 6,415,118 | | 2,651,405 | | (29,643,796 | ) | | (20,577,273 | ) | | | | 85,265,910 | | 35,078,084 | | (392,832,028 | ) | | (272,488,034 | ) |
Class S | | | | | | | | | | | | | | | | | | | | | | |
06-30-09 | | 154,044 | | 155,931 | | (816,863 | ) | | (506,888 | ) | | | | 1,288,359 | | 1,395,586 | | (6,785,084 | ) | | (4,101,139 | ) |
12-31-08 | | 1,235,200 | | 815,556 | | (3,898,281 | ) | | (1,847,525 | ) | | | | 16,801,834 | | 10,691,941 | | (49,390,955 | ) | | (21,897,180 | ) |
NOTE 10 — SECURITIES LENDING
Under an agreement with The Bank of New York Mellon (“BNY”), the Portfolios can lend their securities to approved brokers, dealers and other financial institutions. Loans are collateralized by cash and U.S. government securities. The collateral is equal to at least 105% of the market value of non-U.S. securities loaned and 102% of the market value of U.S. securities loaned. The market value of the loaned securities is determined at the close of business of the Portfolios at their last sale price or official closing price on the principal exchange or system on which they are traded and any additional collateral is delivered to the Portfolios on the next business day. The cash collateral received is invested in approved investments as defined in the Securities Lending Agreement with BNY (the “Agreement”). The Portfolios bear the risk of loss with respect to the investment of collateral. Currently, the cash collateral is invested in the Bank of New York Mellon Corp. Institutional Cash Reserves Fund (“BICR Fund”). BNY serves as investment manager, custodian
and operational trustee of the BICR Fund. As of June 30, 2009 and throughout the period covered by this report, the BICR Fund held certain defaulted securities that had market values significantly below amortized cost. The investment in the BICR Fund is included in the Portfolio of Investments under Securities Lending Collateral and the unrealized loss on such investment is included in Net Unrealized Depreciation on the Statements of Assets and Liabilities. The Portfolios agreed to the terms of capital support extended by The Bank of New York Mellon Corporation (“BNYC”), an affiliated company of BNY, for the certain defaulted securities held by the BICR Fund. BNYC will support the value of these securities up to a certain amount and subject, in part, to the Portfolios’ continued lending of securities. The recorded value of each Portfolio’s investment in the BICR Fund includes the value of the underlying securities held by the BICR Fund and the estimated value of the support to be provided by BNYC.
19
NOTES TO FINANCIAL STATEMENTSASOF JUNE 30, 2009 (UNAUDITED) (CONTINUED)
NOTE 10 — SECURITIES LENDING (continued)
Generally, in the event of counterparty default, the Portfolios have the right to use the collateral to offset losses incurred. The Agreement contains certain guarantees by BNY in the event of counterparty default and/or a borrower’s failure to return a loaned security; however, there would be a potential loss to the Portfolios in the event the Portfolios are delayed or prevented from exercising their right to dispose of the collateral. Engaging in securities lending could have a leveraging effect, which may intensify the credit, market and other risks associated with investing in a Portfolio. At June 30, 2009, the following Portfolios had securities on loan with the following market values:
| | | | | | |
| | | Value of Securities Loaned | | Cash Collateral Received* |
Index Plus LargeCap | | $ | 9,810,637 | | $ | 10,363,915 |
Index Plus MidCap | | | 29,356,333 | | | 30,175,543 |
Index Plus SmallCap | | | 17,186,512 | | | 17,674,474 |
| * | | Cash collateral received was invested in the BICR Fund, the fair value of which is presented in the respective Portfolio’s Portfolio of Investments. |
NOTE 11 — FEDERAL INCOME TAXES
The amount of distributions from net investment income and net realized capital gains are determined in accordance with federal income tax regulations, which may differ from U.S. generally accepted accounting principles for investment companies. These book/tax differences may be either temporary or permanent. Permanent differences are reclassified within the capital accounts based on their federal tax-basis treatment; temporary differences are not reclassified. Key differences include the treatment of short-term capital gains, foreign currency transactions, and wash sale deferrals. Distributions in excess of net investment income and/or net realized capital gains for tax purposes are reported as return of capital.
Dividends paid by the Portfolios from net investment income and distributions of net realized short-term capital gains are, for federal income tax purposes, taxable as ordinary income to shareholders.
The tax composition of dividends and distributions to shareholders was as follows:
| | | | | | | | | |
| | | Six Months Ended
June 30, 2009 | | Year Ended
December 31, 2008 |
| | | Ordinary
Income | | Ordinary
Income | | Long-Term
Capital Gains |
Index Plus LargeCap | | $ | 26,700,331 | | $ | 71,475,961 | | $ | 120,946,041 |
Index Plus MidCap | | | 9,896,772 | | | 23,925,398 | | | 128,722,345 |
Index Plus SmallCap | | | 5,074,611 | | | 5,433,138 | | | 40,336,887 |
The tax-basis components of distributable earnings and the expiration dates of the capital loss carryforwards which may be used to offset future realized capital gains for federal income tax purposes as of December 31, 2008 were:
| | | | | | | | | | | | | |
| | | Undistributed
Ordinary
Income | | Unrealized
Appreciation/
(Depreciation) | | | Capital Loss
Carryforwards | | | Expiration
Dates |
Index Plus LargeCap | | $ | 26,695,514 | | $ | (205,097,739 | ) | | $ | (331,965,058 | ) | | 2016 |
Index Plus MidCap | | | 9,893,675 | | | (229,163,490 | ) | | | (161,783,607 | ) | | 2016 |
Index Plus SmallCap | | | 5,073,760 | | | (118,609,455 | ) | | | (109,110,011 | ) | | 2016 |
The Portfolios’ major tax jurisdictions are federal and Arizona. The earliest tax year that remains subject to examination by these jurisdictions is 2004.
As of June 30, 2009, no provisions for income tax would be required in the Portfolios’ financial statements as a result of tax positions taken on federal income tax returns for open tax years. The Portfolios’ federal and state income and federal excise tax returns for tax years for which the applicable statutes of limitations have not expired are subject to examination by the Internal Revenue Service and state department of revenue.
NOTE 12 — SUBSEQUENT EVENTS
The Portfolios have evaluated events occurring after the balance sheet date (subsequent events) through August 20, 2009, the date the financial statements were available to be issued, to determine whether any subsequent events necessitated adjustment to or disclosure in the financial statements. No such subsequent events were identified.
20
| | |
| ING INDEX PLUS LARGECAP PORTFOLIO | | PORTFOLIO OF INVESTMENTS ASOF JUNE 30, 2009 (UNAUDITED) |
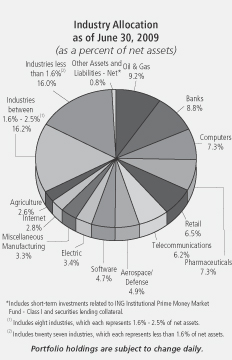
| | | | | | | |
| Shares | | | | | | Value |
| | | | | | | |
COMMON STOCK: 98.1% |
Advertising: 0.7% | | | |
| 449,450 | | @ | | Interpublic Group of Cos., Inc. | | $ | 2,269,723 |
| 109,099 | | | | Omnicom Group | | | 3,445,346 |
| | | | | | | |
| | | | | | | 5,715,069 |
| | | | | | | |
Aerospace/Defense: 4.9% | | | |
| 71,429 | | | | General Dynamics Corp. | | | 3,956,452 |
| 60,414 | | | | Goodrich Corp. | | | 3,018,888 |
| 65,900 | | | | L-3 Communications Holdings, Inc. | | | 4,572,142 |
| 105,232 | | | | Lockheed Martin Corp. | | | 8,486,961 |
| 154,650 | | | | Northrop Grumman Corp. | | | 7,064,412 |
| 131,100 | | | | Raytheon Co. | | | 5,824,773 |
| 146,697 | | | | United Technologies Corp. | | | 7,622,376 |
| | | | | | | |
| | | | | | | 40,546,004 |
| | | | | | | |
Agriculture: 2.6% | | | |
| 380,871 | | | | Altria Group, Inc. | | | 6,242,476 |
| 120,286 | | | | Archer-Daniels-Midland Co. | | | 3,220,056 |
| 188,317 | | | | Philip Morris International, Inc. | | | 8,214,388 |
| 91,158 | | | | Reynolds American, Inc. | | | 3,520,522 |
| | | | | | | |
| | | | | | | 21,197,442 |
| | | | | | | |
Apparel: 0.1% | | | |
| 12,522 | | | | Polo Ralph Lauren Corp. | | | 670,428 |
| | | | | | | |
| | | | | | | 670,428 |
| | | | | | | |
Auto Manufacturers: 0.1% | | | |
| 158,000 | | @ | | Ford Motor Co. | | | 959,060 |
| | | | | | | |
| | | | | | | 959,060 |
| | | | | | | |
Banks: 8.8% | | | |
| 823,450 | | | | Bank of America Corp. | | | 10,869,540 |
| 104,989 | | | | Bank of New York Mellon Corp. | | | 3,077,228 |
| | | | | | | |
| Shares | | | | | | Value |
| | | | | | | |
Banks: (continued) | | | |
| 99,050 | | | | BB&T Corp. | | $ | 2,177,119 |
| 599,400 | | L | | Citigroup, Inc. | | | 1,780,218 |
| 72,728 | | | | Goldman Sachs Group, Inc. | | | 10,723,016 |
| 397,251 | | | | JPMorgan Chase & Co. | | | 13,550,232 |
| 36,600 | | L | | M&T Bank Corp. | | | 1,864,038 |
| 84,507 | | | | Morgan Stanley | | | 2,409,295 |
| 70,397 | | | | Northern Trust Corp. | | | 3,778,911 |
| 101,234 | | | | PNC Financial Services Group, Inc. | | | 3,928,892 |
| 56,247 | | | | State Street Corp. | | | 2,654,858 |
| 149,975 | | | | US Bancorp. | | | 2,687,552 |
| 537,885 | | | | Wells Fargo & Co. | | | 13,049,090 |
| | | | | | | |
| | | | | | | 72,549,989 |
| | | | | | | |
Beverages: 1.0% | | | |
| 66,056 | | | | Coca-Cola Co. | | | 3,170,027 |
| 126,902 | | | | Coca-Cola Enterprises, Inc. | | | 2,112,918 |
| 13,950 | | | | Pepsi Bottling Group, Inc. | | | 472,068 |
| 48,757 | | | | PepsiCo, Inc. | | | 2,679,685 |
| | | | | | | |
| | | | | | | 8,434,698 |
| | | | | | | |
Biotechnology: 1.0% | | | |
| 88,235 | | @ | | Amgen, Inc. | | | 4,671,161 |
| 54,267 | | @ | | Biogen Idec, Inc. | | | 2,450,155 |
| 20,179 | | @ | | Gilead Sciences, Inc. | | | 945,184 |
| | | | | | | |
| | | | | | | 8,066,500 |
| | | | | | | |
Chemicals: 1.2% | | | |
| 10,672 | | | | CF Industries Holdings, Inc. | | | 791,222 |
| 165,400 | | | | Dow Chemical Co. | | | 2,669,556 |
| 24,193 | | | | Monsanto Co. | | | 1,798,508 |
| 77,150 | | | | PPG Industries, Inc. | | | 3,386,885 |
| 19,900 | | S | | Sherwin-Williams Co. | | | 1,069,625 |
| | | | | | | |
| | | | | | | 9,715,796 |
| | | | | | | |
Coal: 0.2% | | | |
| 55,300 | | | | Peabody Energy Corp. | | | 1,667,848 |
| | | | | | | |
| | | | | | | 1,667,848 |
| | | | | | | |
Commercial Services: 1.3% | | | |
| 34,018 | | @ | | Apollo Group, Inc. - Class A | | | 2,419,360 |
| 60,100 | | | | Automatic Data Processing, Inc. | | | 2,129,944 |
| 26,400 | | | | Moody’s Corp. | | | 695,640 |
| 190,977 | | | | RR Donnelley & Sons Co. | | | 2,219,153 |
| 190,851 | | | | Western Union Co. | | | 3,129,956 |
| | | | | | | |
| | | | | | | 10,594,053 |
| | | | | | | |
Computers: 7.3% | | | |
| 108,993 | | @ | | Apple, Inc. | | | 15,523,873 |
| 53,011 | | @ | | Computer Sciences Corp. | | | 2,348,387 |
| 157,474 | | @ | | Dell, Inc. | | | 2,162,118 |
| 301,350 | | @ | | EMC Corp. | | | 3,947,685 |
| 388,176 | | | | Hewlett-Packard Co. | | | 15,003,002 |
| 186,369 | | | | International Business Machines Corp. | | | 19,460,651 |
| 46,162 | | @ | | Teradata Corp. | | | 1,081,576 |
| | | | | | | |
| | | | | | | 59,527,292 |
| | | | | | | |
Cosmetics/Personal Care: 1.4% | | | |
| 230,092 | | | | Procter & Gamble Co. | | | 11,757,701 |
| | | | | | | |
| | | | | | | 11,757,701 |
| | | | | | | |
Diversified Financial Services: 1.6% | | | |
| 139,600 | | | | American Express Co. | | | 3,244,304 |
| 252,331 | | | | Charles Schwab Corp. | | | 4,425,886 |
See Accompanying Notes to Financial Statements
21
| | |
| ING INDEX PLUS LARGECAP PORTFOLIO | | PORTFOLIO OF INVESTMENTS AS OF JUNE 30, 2009 (UNAUDITED) (CONTINUED) |
| | | | | | | |
| Shares | | | | | | Value |
| | | | | | | |
Diversified Financial Services: (continued) | | | |
| 7,352 | | | | CME Group, Inc. | | $ | 2,287,281 |
| 12,600 | | @ | | IntercontinentalExchange, Inc. | | | 1,439,424 |
| 101,700 | | @ | | Nasdaq Stock Market, Inc. | | | 2,167,227 |
| | | | | | | |
| | | | | | | 13,564,122 |
| | | | | | | |
Electric: 3.4% | | | |
| 64,455 | | @ | | AES Corp. | | | 748,323 |
| 226,595 | | | | CMS Energy Corp. | | | 2,737,268 |
| 38,600 | | | | Dominion Resources, Inc. | | | 1,290,012 |
| 9,322 | | | | DTE Energy Co. | | | 298,304 |
| 160,700 | | | | Exelon Corp. | | | 8,229,447 |
| 31,400 | | | | FirstEnergy Corp. | | | 1,216,750 |
| 72,073 | | | | FPL Group, Inc. | | | 4,098,071 |
| 81,700 | | | | PPL Corp. | | | 2,692,832 |
| 161,400 | | | | Public Service Enterprise Group, Inc. | | | 5,266,482 |
| 71,400 | | | | Xcel Energy, Inc. | | | 1,314,474 |
| | | | | | | |
| | | | | | | 27,891,963 |
| | | | | | | |
Electronics: 0.5% | | | |
| 47,500 | | | | Amphenol Corp. | | | 1,502,900 |
| 91,954 | | | | PerkinElmer, Inc. | | | 1,600,000 |
| 19,060 | | @ | | Waters Corp. | | | 981,018 |
| | | | | | | |
| | | | | | | 4,083,918 |
| | | | | | | |
Engineering & Construction: 0.9% | | | |
| 75,429 | | | | Fluor Corp. | | | 3,868,753 |
| 81,000 | | @ | | Jacobs Engineering Group, Inc. | | | 3,409,290 |
| | | | | | | |
| | | | | | | 7,278,043 |
| | | | | | | |
Food: 1.8% | | | |
| 32,400 | | @ | | Dean Foods Co. | | | 621,756 |
| 32,700 | | | | General Mills, Inc. | | | 1,831,854 |
| 289,583 | | | | Kraft Foods, Inc. | | | 7,338,033 |
| 38,211 | | | | Kroger Co. | | | 842,553 |
| 254,013 | | | | Sara Lee Corp. | | | 2,479,167 |
| 31,857 | | | | Supervalu, Inc. | | | 412,548 |
| 132,300 | | | | Tyson Foods, Inc. | | | 1,668,303 |
| | | | | | | |
| | | | | | | 15,194,214 |
| | | | | | | |
Forest Products & Paper: 0.4% | | | |
| 140,331 | | | | International Paper Co. | | | 2,123,208 |
| 58,000 | | S | | MeadWestvaco Corp. | | | 951,780 |
| | | | | | | |
| | | | | | | 3,074,988 |
| | | | | | | |
Gas: 0.3% | | | |
| 51,894 | | | | Sempra Energy | | | 2,575,499 |
| | | | | | | |
| | | | | | | 2,575,499 |
| | | | | | | |
Healthcare - Products: 2.3% | | | |
| 19,649 | | | | Becton Dickinson & Co. | | | 1,401,170 |
| 144,400 | | @ | | Boston Scientific Corp. | | | 1,464,216 |
| 55,100 | | @ | | Hospira, Inc. | | | 2,122,452 |
| 172,323 | | | | Johnson & Johnson | | | 9,787,946 |
| 110,311 | | | | Medtronic, Inc. | | | 3,848,751 |
| | | | | | | |
| | | | | | | 18,624,535 |
| | | | | | | |
Healthcare - Services: 1.7% | | | |
| 76,544 | | | | Aetna, Inc. | | | 1,917,427 |
| 38,024 | | | | Cigna Corp. | | | 915,998 |
| 35,200 | | @ | | Coventry Health Care, Inc. | | | 658,592 |
| 26,576 | | @ | | Humana, Inc. | | | 857,342 |
| 31,308 | | @ | | Laboratory Corp. of America Holdings | | | 2,122,369 |
| | | | | | | |
| Shares | | | | | | Value |
| | | | | | | |
Healthcare - Services: (continued) | | | |
| 23,100 | | | | Quest Diagnostics | | $ | 1,303,533 |
| 176,238 | | | | UnitedHealth Group, Inc. | | | 4,402,425 |
| 38,800 | | @ | | WellPoint, Inc. | | | 1,974,532 |
| | | | | | | |
| | | | | | | 14,152,218 |
| | | | | | | |
Home Builders: 0.3% | | | |
| 109,400 | | | | D.R. Horton, Inc. | | | 1,023,984 |
| 59,800 | | | | KB Home | | | 818,064 |
| 72,100 | | | | Lennar Corp. | | | 698,649 |
| | | | | | | |
| | | | | | | 2,540,697 |
| | | | | | | |
Household Products/Wares: 0.6% | | | |
| 21,015 | | S | | Avery Dennison Corp. | | | 539,665 |
| 76,326 | | | | Kimberly-Clark Corp. | | | 4,001,772 |
| | | | | | | |
| | | | | | | 4,541,437 |
| | | | | | | |
Insurance: 2.5% | | | |
| 45,695 | | | | Aflac, Inc. | | | 1,420,658 |
| 108,816 | | | | AON Corp. | | | 4,120,862 |
| 158,701 | | | | Chubb Corp. | | | 6,328,996 |
| 26,900 | | | | Loews Corp. | | | 737,060 |
| 40,700 | | | | Marsh & McLennan Cos., Inc. | | | 819,291 |
| 52,900 | | @ | | Progressive Corp. | | | 799,319 |
| 34,855 | | | | Torchmark Corp. | | | 1,291,029 |
| 64,827 | | | | Travelers Cos., Inc. | | | 2,660,500 |
| 127,461 | | | | UnumProvident Corp. | | | 2,021,531 |
| | | | | | | |
| | | | | | | 20,199,246 |
| | | | | | | |
Internet: 2.8% |
| 44,078 | | @ | | Amazon.com, Inc. | | | 3,687,565 |
| 258,607 | | @ | | eBay, Inc. | | | 4,429,938 |
| 27,300 | | @ | | Google, Inc. - Class A | | | 11,509,407 |
| 210,000 | | @ | | Symantec Corp. | | | 3,267,600 |
| 8,780 | | @ | | Yahoo!, Inc. | | | 137,495 |
| | | | | | | |
| | | | | | | 23,032,005 |
| | | | | | | |
Iron/Steel: 0.4% |
| 10,800 | | | | Allegheny Technologies, Inc. | | | 377,244 |
| 24,218 | | | | Nucor Corp. | | | 1,076,006 |
| 56,550 | | | | United States Steel Corp. | | | 2,021,097 |
| | | | | | | |
| | | | | | | 3,474,347 |
| | | | | | | |
Machinery - Diversified: 0.3% |
| 31,000 | | | | Flowserve Corp. | | | 2,164,110 |
| 12,300 | | | | Rockwell Automation, Inc. | | | 395,076 |
| | | | | | | |
| | | | | | | 2,559,186 |
| | | | | | | |
Media: 2.2% |
| 509,030 | | | | Comcast Corp. - Class A | | | 7,375,845 |
| 84,050 | | @, L | | DIRECTV Group, Inc. | | | 2,076,876 |
| 12,600 | | | | McGraw-Hill Cos., Inc. | | | 379,386 |
| 17,389 | | @ | | Time Warner Cable, Inc. | | | 550,710 |
| 205,528 | | | | Time Warner, Inc. | | | 5,177,250 |
| 114,400 | | @ | | Viacom - Class B | | | 2,596,880 |
| | | | | | | |
| | | | | | | 18,156,947 |
| | | | | | | |
Metal Fabricate/Hardware: 0.4% |
| 44,950 | | | | Precision Castparts Corp. | | | 3,282,699 |
| | | | | | | |
| | | | | | | 3,282,699 |
| | | | | | | |
Miscellaneous Manufacturing: 3.3% |
| 51,700 | | | | Cooper Industries Ltd. | | | 1,605,285 |
| 176,200 | | | | Dover Corp. | | | 5,830,458 |
See Accompanying Notes to Financial Statements
22
| | |
| ING INDEX PLUS LARGECAP PORTFOLIO | | PORTFOLIO OF INVESTMENTS ASOF JUNE 30, 2009 (UNAUDITED) (CONTINUED) |
| | | | | | | |
| Shares | | | | | | Value |
| | | | | | | |
Miscellaneous Manufacturing: (continued) |
| 8,700 | | | | Eaton Corp. | | $ | 388,107 |
| 1,085,633 | | | | General Electric Co. | | | 12,723,619 |
| 55,100 | | | | Honeywell International, Inc. | | | 1,730,140 |
| 110,741 | | | | ITT Corp. | | | 4,927,975 |
| | | | | | | |
| | | | | | | 27,205,584 |
| | | | | | | |
Office/Business Equipment: 0.7% |
| 193,200 | | | | Pitney Bowes, Inc. | | | 4,236,876 |
| 219,393 | | | | Xerox Corp. | | | 1,421,667 |
| | | | | | | |
| | | | | | | 5,658,543 |
| | | | | | | |
Oil & Gas: 9.2% |
| 39,827 | | | | Anadarko Petroleum Corp. | | | 1,807,748 |
| 35,407 | | | | Apache Corp. | | | 2,554,615 |
| 175,158 | | | | Chevron Corp. | | | 11,604,218 |
| 46,919 | | | | ConocoPhillips | | | 1,973,413 |
| 29,100 | | L | | Diamond Offshore Drilling | | | 2,416,755 |
| 494,539 | | | | ExxonMobil Corp. | | | 34,573,221 |
| 29,392 | | | | Hess Corp. | | | 1,579,820 |
| 31,369 | | | | Marathon Oil Corp. | | | 945,148 |
| 75,045 | | | | Murphy Oil Corp. | | | 4,076,444 |
| 102,768 | | | | Occidental Petroleum Corp. | | | 6,763,162 |
| 45,834 | | @ | | Southwestern Energy Co. | | | 1,780,651 |
| 88,262 | | | | Tesoro Corp. | | | 1,123,575 |
| 106,500 | | | | XTO Energy, Inc. | | | 4,061,910 |
| | | | | | | |
| | | | | | | 75,260,680 |
| | | | | | | |
Oil & Gas Services: 2.3% |
| 112,573 | | | | BJ Services Co. | | | 1,534,370 |
| 193,950 | | @ | | Cameron International Corp. | | | 5,488,785 |
| 179,504 | | @ | | National Oilwell Varco, Inc. | | | 5,862,601 |
| 104,792 | | | | Schlumberger Ltd. | | | 5,670,295 |
| | | | | | | |
| | | | | | | 18,556,051 |
| | | | | | | |
Packaging & Containers: 0.9% |
| 25,863 | | | | Ball Corp. | | | 1,167,973 |
| 90,933 | | | | Bemis Co. | | | 2,291,512 |
| 109,800 | | @ | | Pactiv Corp. | | | 2,382,660 |
| 86,063 | | | | Sealed Air Corp. | | | 1,587,862 |
| | | | | | | |
| | | | | | | 7,430,007 |
| | | | | | | |
Pharmaceuticals: 7.3% |
| 167,734 | | | | Abbott Laboratories | | | 7,890,207 |
| 90,708 | | | | AmerisourceBergen Corp. | | | 1,609,160 |
| 208,832 | | | | Bristol-Myers Squibb Co. | | | 4,241,378 |
| 218,171 | | | | Eli Lilly & Co. | | | 7,557,443 |
| 45,950 | | @ | | Express Scripts, Inc. | | | 3,159,063 |
| 93,551 | | @ | | Forest Laboratories, Inc. | | | 2,349,066 |
| 78,500 | | @, S | | King Pharmaceuticals, Inc. | | | 755,955 |
| 18,972 | | S | | McKesson Corp. | | | 834,768 |
| 81,046 | | @ | | Medco Health Solutions, Inc. | | | 3,696,508 |
| 55,831 | | | | Merck & Co., Inc. | | | 1,561,035 |
| 978,050 | | | | Pfizer, Inc. | | | 14,670,750 |
| 164,500 | | | | Schering-Plough Corp. | | | 4,132,240 |
| 41,941 | | @ | | Watson Pharmaceuticals, Inc. | | | 1,412,992 |
| 137,003 | | | | Wyeth | | | 6,218,566 |
| | | | | | | |
| | | | | | | 60,089,131 |
| | | | | | | |
Pipelines: 0.1% | | | |
| 49,900 | | | | Williams Cos., Inc. | | | 778,939 |
| | | | | | | |
| | | | | | | 778,939 |
| | | | | | | |
| | | | | | | |
| Shares | | | | | | Value |
| | | | | | | |
Retail: 6.5% | | | |
| 76,200 | | @ | | Autonation, Inc. | | $ | 1,322,070 |
| 162,300 | | | | CVS Caremark Corp. | | | 5,172,501 |
| 57,326 | | | | Family Dollar Stores, Inc. | | | 1,622,326 |
| 481 | | @ | | GameStop Corp. | | | 10,587 |
| 158,531 | | | | Gap, Inc. | | | 2,599,908 |
| 255,612 | | | | Home Depot, Inc. | | | 6,040,112 |
| 42,200 | | | | JC Penney Co., Inc. | | | 1,211,562 |
| 59,700 | | @ | | Kohl’s Corp. | | | 2,552,175 |
| 134,400 | | | | Limited Brands, Inc. | | | 1,608,768 |
| 141,900 | | | | Lowe’s Cos., Inc. | | | 2,754,279 |
| 105,379 | | | | McDonald’s Corp. | | | 6,058,239 |
| 24,500 | | @, L | | Sears Holding Corp. | | | 1,629,740 |
| 70,042 | | | | Staples, Inc. | | | 1,412,747 |
| 30,200 | | @ | | Starbucks Corp. | | | 419,478 |
| 119,234 | | | | Target Corp. | | | 4,706,166 |
| 27,483 | | | | TJX Cos., Inc. | | | 864,615 |
| 64,567 | | | | Walgreen Co. | | | 1,898,270 |
| 229,252 | | | | Wal-Mart Stores, Inc. | | | 11,104,967 |
| | | | | | | |
| | | | | | | 52,988,510 |
| | | | | | | |
Savings & Loans: 0.7% | | | |
| 419,402 | | | | Hudson City Bancorp., Inc. | | | 5,573,853 |
| | | | | | | |
| | | | | | | 5,573,853 |
| | | | | | | |
Semiconductors: 1.8% | | | |
| 18,600 | | @ | | Broadcom Corp. | | | 461,094 |
| 262,952 | | | | Intel Corp. | | | 4,351,856 |
| 368,400 | | | | Texas Instruments, Inc. | | | 7,846,920 |
| 87,924 | | | | Xilinx, Inc. | | | 1,798,925 |
| | | | | | | |
| | | | | | | 14,458,795 |
| | | | | | | |
Software: 4.7% | | | |
| 190,462 | | | | CA, Inc. | | | 3,319,753 |
| 184,200 | | @, L | | Compuware Corp. | | | 1,263,612 |
| 126,004 | | | | Fidelity National Information Services, Inc. | | | 2,515,040 |
| 41,100 | | @ | | Fiserv, Inc. | | | 1,878,270 |
| 29,800 | | @ | | Intuit, Inc. | | | 839,168 |
| 765,316 | | | | Microsoft Corp. | | | 18,191,556 |
| 502,526 | | @ | | Oracle Corp. | | | 10,764,107 |
| | | | | | | |
| | | | | | | 38,771,506 |
| | | | | | | |
Telecommunications: 6.2% | | | |
| 581,356 | | | | AT&T, Inc. | | | 14,440,883 |
| 822,570 | | @ | | Cisco Systems, Inc. | | | 15,332,705 |
| 53,740 | | | | Corning, Inc. | | | 863,064 |
| 15,350 | | | | Embarq Corp. | | | 645,621 |
| 28,735 | | | | Harris Corp. | | | 814,925 |
| 182,816 | | | | Qualcomm, Inc. | | | 8,263,283 |
| 92,500 | | L | | Qwest Communications International, Inc. | | | 383,875 |
| 353,871 | | @ | | Sprint Nextel Corp. | | | 1,702,120 |
| 287,316 | | | | Verizon Communications, Inc. | | | 8,829,221 |
| | | | | | | |
| | | | | | | 51,275,697 |
| | | | | | | |
Textiles: 0.0% | | | |
| 19,000 | | | | Cintas Corp. | | | 433,960 |
| | | | | | | |
| | | | | | | 433,960 |
| | | | | | | |
Transportation: 1.4% | | | |
| 7,700 | | | | CH Robinson Worldwide, Inc. | | | 401,555 |
| 102,100 | | | | CSX Corp. | | | 3,535,723 |
See Accompanying Notes to Financial Statements
23
| | |
| ING INDEX PLUS LARGECAP PORTFOLIO | | PORTFOLIO OF INVESTMENTS ASOF JUNE 30, 2009 (UNAUDITED) (CONTINUED) |
| | | | | | | |
| Shares | | | | | | Value |
| | | | | | | |
Transportation: (continued) | | | |
| 54,305 | | | | Union Pacific Corp. | | $ | 2,827,118 |
| 92,400 | | | | United Parcel Service, Inc. - Class B | | | 4,619,076 |
| | | | | | | |
| | | | | | | 11,383,472 |
| | | | | | | |
| | | | Total Common Stock
(Cost $823,286,164) | | | 805,492,672 |
| | | | | | | |
REAL ESTATE INVESTMENT TRUSTS: 1.1% | | | |
Apartments: 0.3% | | | |
| 82,439 | | | | Equity Residential | | | 1,832,619 |
| | | | | | | |
| | | | | | | 1,832,619 |
| | | | | | | |
Regional Malls: 0.6% | | | |
| 96,334 | | | | Simon Property Group, Inc. | | | 4,954,458 |
| | | | | | | |
| | | | | | | 4,954,458 |
| | | | | | | |
Storage: 0.2% | | | |
| 27,100 | | | | Public Storage, Inc. | | | 1,774,508 |
| | | | | | | |
| | | | | | | 1,774,508 |
| | | | | | | |
| | | | Total Real Estate Investment Trusts
(Cost $7,980,183) | | | 8,561,585 |
| | | | | | | |
| | | | Total Long-Term Investments
(Cost $831,266,347) | | | 814,054,257 |
| | | | | | | |
SHORT-TERM INVESTMENTS: 1.9% |
Affiliated Mutual Fund: 0.7% | | | |
| 5,860,000 | | S | | ING Institutional Prime Money Market Fund - Class I | | | 5,860,000 |
| | | | | | | |
| | | | Total Mutual Fund
(Cost $5,860,000) | | | 5,860,000 |
| | | | | | | |
| | | | | | | | | | |
| | | |
Principal
Amount | | | | | | | Value | |
| Securities Lending Collateralcc: 1.2% | |
| $ | 10,363,915 | | Bank of New York Mellon Corp. Institutional Cash Reserves | | | | | $ | 10,042,154 | |
| | | | | | | | | | |
| | | Total Securities Lending Collateral
(Cost $10,363,915) | | | | | | 10,042,154 | |
| | | | | | | | | | |
| | | Total Short-Term Investments
(Cost $16,223,915) | | | | | | 15,902,154 | |
| | | | | | | | | | |
| | | Total Investments in Securities
(Cost $847,490,262)* | | 101.1 | % | | $ | 829,956,411 | |
| | | Other Assets and Liabilities - Net | | (1.1 | ) | | | (9,221,790 | ) |
| | | | | | | | | | |
| | | Net Assets | | 100.0 | % | | $ | 820,734,621 | |
| | | | | | | | | | |
| @ | Non-income producing security |
| cc | Securities purchased with cash collateral for securities loaned. |
| S | All or a portion of this security is segregated to cover collateral requirements for applicable futures, options, swaps, foreign forward currency contracts and/or when-issued or delayed-delivery securities. |
| L | Loaned security, a portion or all of the security is on loan at June 30, 2009. |
| * | Cost for federal income tax purposes is $904,934,333. |
| | | | |
Net unrealized depreciation consists of: | |
Gross Unrealized Appreciation | | $ | 57,796,741 | |
Gross Unrealized Depreciation | | | (132,774,663 | ) |
| | | | |
Net Unrealized Depreciation | | $ | (74,977,922 | ) |
| | | | |
Fair Value Measurements*
The following is a summary of the inputs used as of June 30, 2009 in determining the Portfolio’s investments at fair value for purposes of SFAS 157:
| | | | | | | | | | |
| | | Quoted Prices in Active Markets for Identical Investments (Level 1) | | | Significant Other Observable Inputs (Level 2) | | Significant Unobservable Inputs (Level 3) |
Common Stock** | | $ | 805,492,672 | | | $ | — | | $ | — |
Real Estate Investment Trusts | | | 8,561,585 | | | | — | | | — |
Short-Term Investments | | | 5,860,000 | | | | 10,042,154 | | | — |
| | | | | | | | | | |
Total | | $ | 819,914,257 | | | $ | 10,042,154 | | $ | — |
| | | | | | | | | | |
Other
Financial Instruments*** | | | (122,845 | ) | | | — | | | — |
| | | | | | | | | | |
Total | | $ | (122,845 | ) | | $ | — | | $ | — |
| | | | | | | | | | |
“Fair value” for purposes of SFAS 157 is different from “fair value” as used in the 1940 Act. The former generally implies market value, and can include market quotations as a source of value, and the latter refers to determinations of value in absence of available market quotations.
| * | See NOTE 2, “Significant Accounting Policies” in the Notes to Financial Statements for additional information. |
| ** | For further breakdown of Common Stock by industry type, please refer to the Portfolio of Investments. |
| *** | Other financial instruments may include open forward foreign currency contracts, futures, swaps, and written options. Forward foreign currency contracts and futures are reported at their unrealized gain/loss at period end. Swaps and written options are reported at their market value at period end. |
ING Index Plus LargeCap Portfolio Open Futures Contracts on June 30, 2009:
| | | | | | | | |
Contract Description | | Number of Contracts | | Expiration Date | | Unrealized Depreciation | |
Long Contracts | | | | | | | | |
S&P 500 | | 35 | | 09/17/09 | | $ | (122,845 | ) |
| | | | | | | | |
| | | | | | $ | (122,845 | ) |
| | | | | | | | |
For the six months ended June 30, 2009, net realized gain (loss) on futures and the net change in unrealized gain (loss) on futures can be found on the Portfolio’s Statement of Operations. For additional information on the reason(s) why the Portfolio may enter into futures contracts and the risks associated with futures contracts, please refer to NOTE 2 in the accompanying Notes to Financial Statements.
See Accompanying Notes to Financial Statements
24
| | |
| ING INDEX PLUS MIDCAP PORTFOLIO | | PORTFOLIO OF INVESTMENTS ASOF JUNE 30, 2009 (UNAUDITED) |
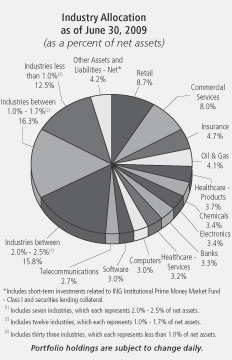
| | | | | | | |
| Shares | | | | | | Value |
| | | | | | | |
COMMON STOCK: 89.8% | | | |
Advertising: 0.2% | | | |
| 142,742 | | | | Harte-Hanks, Inc. | | $ | 1,320,364 |
| | | | | | | |
| | | | | | | 1,320,364 |
| | | | | | | |
Aerospace/Defense: 0.6% | | | |
| 36,431 | | @ | | Alliant Techsystems, Inc. | | | 3,000,457 |
| 18,380 | | @ | | BE Aerospace, Inc. | | | 263,937 |
| | | | | | | |
| | | | | | | 3,264,394 |
| | | | | | | |
Apparel: 0.4% | | | |
| 101,515 | | @ | | Timberland Co. | | | 1,347,104 |
| 9,585 | | @, L | | Under Armour, Inc. | | | 214,512 |
| 30,560 | | @ | | Warnaco Group, Inc. | | | 990,144 |
| | | | | | | |
| | | | | | | 2,551,760 |
| | | | | | | |
Auto Manufacturers: 0.1% | | | |
| 40,100 | | | | Oshkosh Truck Corp. | | | 583,054 |
| | | | | | | |
| | | | | | | 583,054 |
| | | | | | | |
Auto Parts & Equipment: 0.4% | | | |
| 62,870 | | | | BorgWarner, Inc. | | | 2,147,011 |
| | | | | | | |
| | | | | | | 2,147,011 |
| | | | | | | |
Banks: 3.3% | | | |
| 216,000 | | | | Associated Banc-Corp. | | | 2,700,000 |
| 134,665 | | | | Bancorpsouth, Inc. | | | 2,764,672 |
| 39,525 | | | | Bank of Hawaii Corp. | | | 1,416,181 |
| 51,442 | | | | Commerce Bancshares, Inc. | | | 1,637,399 |
| 31,500 | | | | Cullen/Frost Bankers, Inc. | | | 1,452,780 |
| 152,182 | | | | FirstMerit Corp. | | | 2,584,050 |
| 75,000 | | | | Fulton Financial Corp. | | | 390,750 |
| 157,000 | | L | | International Bancshares Corp. | | | 1,618,670 |
| 103,700 | | | | Trustmark Corp. | | | 2,003,484 |
| | | | | | | |
| Shares | | | | | | Value |
| | | | | | | |
Banks: (continued) | �� | | |
| 39,600 | | L | | Westamerica Bancorp. | | $ | 1,964,556 |
| 19,320 | | L | | Wilmington Trust Corp. | | | 263,911 |
| | | | | | | |
| | | | | | | 18,796,453 |
| | | | | | | |
Beverages: 0.4% | | | |
| 49,460 | | @ | | Hansen Natural Corp. | | | 1,524,357 |
| 38,803 | | | | PepsiAmericas, Inc. | | | 1,040,308 |
| | | | | | | |
| | | | | | | 2,564,665 |
| | | | | | | |
Biotechnology: 0.9% | | | |
| 15,150 | | @ | | Charles River Laboratories International, Inc. | | | 511,313 |
| 22,445 | | @ | | OSI Pharmaceuticals, Inc. | | | 633,622 |
| 118,650 | | @ | | Vertex Pharmaceuticals, Inc. | | | 4,228,686 |
| | | | | | | |
| | | | | | | 5,373,621 |
| | | | | | | |
Building Materials: 0.4% | | | |
| 8,153 | | | | Lennox International, Inc. | | | 261,793 |
| 203,432 | | | | Louisiana-Pacific Corp. | | | 695,737 |
| 13,600 | | | | Martin Marietta Materials, Inc. | | | 1,072,768 |
| | | | | | | |
| | | | | | | 2,030,298 |
| | | | | | | |
Chemicals: 3.4% | | | |
| 85,493 | | | | Airgas, Inc. | | | 3,465,031 |
| 12,058 | | | | Albemarle Corp. | | | 308,323 |
| 57,800 | | | | Ashland, Inc. | | | 1,621,290 |
| 154,588 | | | | Cabot Corp. | | | 1,944,717 |
| 54,917 | | | | FMC Corp. | | | 2,597,574 |
| 54,415 | | | | Lubrizol Corp. | | | 2,574,374 |
| 50,189 | | | | Minerals Technologies, Inc. | | | 1,807,808 |
| 24,500 | | | | Olin Corp. | | | 291,305 |
| 112,017 | | | | Terra Industries, Inc. | | | 2,713,052 |
| 88,276 | | | | Valspar Corp. | | | 1,988,858 |
| | | | | | | |
| | | | | | | 19,312,332 |
| | | | | | | |
Coal: 0.4% | | | |
| 109,675 | | | | Arch Coal, Inc. | | | 1,685,705 |
| 50,900 | | @, L | | Patriot Coal Corp. | | | 324,742 |
| | | | | | | |
| | | | | | | 2,010,447 |
| | | | | | | |
Commercial Services: 8.0% | | | |
| 26,000 | | L | | Aaron Rents, Inc. | | | 775,320 |
| 83,273 | | @, L | | Alliance Data Systems Corp. | | | 3,430,015 |
| 34,050 | | @ | | Brink’s Home Security Holdings, Inc. | | | 963,956 |
| 92,190 | | @ | | Career Education Corp. | | | 2,294,609 |
| 166,900 | | @ | | Corinthian Colleges, Inc. | | | 2,825,617 |
| 36,478 | | @ | | Corrections Corp. of America | | | 619,761 |
| 23,168 | | | | Deluxe Corp. | | | 296,782 |
| 58,853 | | @ | | FTI Consulting, Inc. | | | 2,985,024 |
| 121,050 | | @, S | | Gartner, Inc. | | | 1,847,223 |
| 110,780 | | | | Global Payments, Inc. | | | 4,149,819 |
| 107,400 | | @ | | Hewitt Associates, Inc. | | | 3,198,372 |
| 21,358 | | @ | | ITT Educational Services, Inc. | | | 2,149,896 |
| 62,300 | | | | Kelly Services, Inc. | | | 682,185 |
| 66,500 | | | | Lender Processing Services, Inc. | | | 1,846,705 |
| 80,606 | | | | Manpower, Inc. | | | 3,412,858 |
| 185,552 | | @ | | MPS Group, Inc. | | | 1,417,617 |
| 52,269 | | @ | | Navigant Consulting, Inc. | | | 675,315 |
| 128,801 | | | | Pharmaceutical Product Development, Inc. | | | 2,990,759 |
| 121,600 | | @ | | Rent-A-Center, Inc. | | | 2,168,128 |
| 226,400 | | @ | | SAIC, Inc. | | | 4,199,720 |
| 201,000 | | | | Service Corp. International | | | 1,101,480 |
See Accompanying Notes to Financial Statements
25
| | |
| ING INDEX PLUS MIDCAP PORTFOLIO | | PORTFOLIO OF INVESTMENTS ASOF JUNE 30, 2009 (UNAUDITED) (CONTINUED) |
| | | | | | | |
| Shares | | | | | | Value |
| | | | | | | |
Commercial Services: (continued) | | | |
| 5,600 | | L | | Strayer Education, Inc. | | $ | 1,221,416 |
| 12,900 | | | | Watson Wyatt Worldwide, Inc. | | | 484,137 |
| | | | | | | |
| | | | | | | 45,736,714 |
| | | | | | | |
Computers: 3.0% | | | |
| 97,050 | | | | Diebold, Inc. | | | 2,558,238 |
| 79,380 | | @, S | | DST Systems, Inc. | | | 2,933,091 |
| 112,050 | | | | Imation Corp. | | | 852,701 |
| 43,100 | | | | Jack Henry & Associates, Inc. | | | 894,325 |
| 126,268 | | @ | | Micros Systems, Inc. | | | 3,197,106 |
| 283,025 | | @ | | NCR Corp. | | | 3,348,186 |
| 70,350 | | @, L | | Palm, Inc. | | | 1,165,700 |
| 107,154 | | @ | | Synopsys, Inc. | | | 2,090,575 |
| | | | | | | |
| | | | | | | 17,039,922 |
| | | | | | | |
Cosmetics/Personal Care: 0.0% | | | |
| 9,142 | | | | Alberto-Culver Co. | | | 232,481 |
| | | | | | | |
| | | | | | | 232,481 |
| | | | | | | |
Distribution/Wholesale: 1.7% | | | |
| 34,700 | | @ | | Fossil, Inc. | | | 835,576 |
| 244,044 | | @ | | Ingram Micro, Inc. | | | 4,270,770 |
| 112,700 | | @ | | LKQ Corp. | | | 1,853,915 |
| 89,278 | | @ | | Tech Data Corp. | | | 2,920,283 |
| | | | | | | |
| | | | | | | 9,880,544 |
| | | | | | | |
Diversified Financial Services: 1.4% | | | |
| 9,850 | | @ | | Affiliated Managers Group, Inc. | | | 573,172 |
| 129,300 | | @, L | | AmeriCredit Corp. | | | 1,752,015 |
| 24,544 | | | | Eaton Vance Corp. | | | 656,552 |
| 175,984 | | | | Jefferies Group, Inc. | | | 3,753,739 |
| 37,621 | | | | Waddell & Reed Financial, Inc. | | | 992,066 |
| | | | | | | |
| | | | | | | 7,727,544 |
| | | | | | | |
Electric: 2.4% | | | |
| 27,800 | | | | Alliant Energy Corp. | | | 726,414 |
| 91,600 | | | | DPL, Inc. | | | 2,122,372 |
| 155,700 | | | | Hawaiian Electric Industries | | | 2,967,642 |
| 65,943 | | | | MDU Resources Group, Inc. | | | 1,250,939 |
| 121,900 | | | | NSTAR | | | 3,914,209 |
| 20,637 | | | | NV Energy, Inc. | | | 222,673 |
| 74,519 | | | | OGE Energy Corp. | | | 2,110,378 |
| 45,100 | | | | PNM Resources, Inc. | | | 483,021 |
| | | | | | | |
| | | | | | | 13,797,648 |
| | | | | | | |
Electrical Components & Equipment: 1.3% | | | |
| 57,942 | | | | Ametek, Inc. | | | 2,003,634 |
| 51,700 | | @ | | Energizer Holdings, Inc. | | | 2,700,808 |
| 79,670 | | | | Hubbell, Inc. | | | 2,554,220 |
| | | | | | | |
| | | | | | | 7,258,662 |
| | | | | | | |
Electronics: 3.4% | | | |
| 138,750 | | @ | | Arrow Electronics, Inc. | | | 2,947,050 |
| 173,937 | | @ | | Avnet, Inc. | | | 3,657,895 |
| 31,065 | | | | Gentex Corp. | | | 360,354 |
| 10,814 | | @ | | Itron, Inc. | | | 595,527 |
| 40,425 | | @, @@ | | Mettler Toledo International, Inc. | | | 3,118,789 |
| 68,207 | �� | @ | | Thomas & Betts Corp. | | | 1,968,454 |
| 35,150 | | @ | | Trimble Navigation Ltd. | | | 689,995 |
| 61,359 | | @ | | Varian, Inc. | | | 2,419,385 |
| | | | | | | |
| Shares | | | | | | Value |
| | | | | | | |
Electronics: (continued) | | | |
| 263,000 | | @ | | Vishay Intertechnology, Inc. | | $ | 1,785,770 |
| 84,300 | | | | Woodward Governor Co. | | | 1,669,140 |
| | | | | | | |
| | | | | | | 19,212,359 |
| | | | | | | |
Engineering & Construction: 2.5% | | | |
| 72,600 | | @ | | Aecom Technology Corp. | | | 2,323,200 |
| 116,081 | | @ | | Dycom Industries, Inc. | | | 1,285,017 |
| 49,530 | | | | Granite Construction, Inc. | | | 1,648,358 |
| 148,060 | | | | KBR, Inc. | | | 2,730,226 |
| 92,022 | | @ | | Shaw Group, Inc. | | | 2,522,323 |
| 74,970 | | @ | | URS Corp. | | | 3,712,514 |
| | | | | | | |
| | | | | | | 14,221,638 |
| | | | | | | |
Entertainment: 0.1% | | | |
| 20,352 | | @ | | DreamWorks Animation SKG, Inc. | | | 561,512 |
| | | | | | | |
| | | | | | | 561,512 |
| | | | | | | |
Environmental Control: 0.6% | | | |
| 8,204 | | @ | | Clean Harbors, Inc. | | | 442,934 |
| 104,518 | | @ | | Waste Connections, Inc. | | | 2,708,061 |
| | | | | | | |
| | | | | | | 3,150,995 |
| | | | | | | |
Food: 1.2% | | | |
| 15,141 | | | | Corn Products International, Inc. | | | 405,627 |
| 30,666 | | | | Lancaster Colony Corp. | | | 1,351,451 |
| 47,993 | | @ | | Ralcorp Holdings, Inc. | | | 2,923,734 |
| 61,615 | | | | Ruddick Corp. | | | 1,443,639 |
| 51,850 | | @, L | | Smithfield Foods, Inc. | | | 724,345 |
| | | | | | | |
| | | | | | | 6,848,796 |
| | | | | | | |
Gas: 2.1% | | | |
| 116,100 | | | | AGL Resources, Inc. | | | 3,691,980 |
| 38,856 | | | | Energen Corp. | | | 1,550,354 |
| 26,000 | | | | National Fuel Gas Co. | | | 938,080 |
| 158,666 | | | | UGI Corp. | | | 4,044,396 |
| 37,500 | | | | Vectren Corp. | | | 878,625 |
| 34,200 | | | | WGL Holdings, Inc. | | | 1,095,084 |
| | | | | | | |
| | | | | | | 12,198,519 |
| | | | | | | |
Hand/Machine Tools: 0.2% | | | |
| 12,142 | | | | Kennametal, Inc. | | | 232,884 |
| 25,170 | | | | Lincoln Electric Holdings, Inc. | | | 907,127 |
| | | | | | | |
| | | | | | | 1,140,011 |
| | | | | | | |
Healthcare - Products: 3.7% | | | |
| 129,983 | | @ | | Affymetrix, Inc. | | | 770,799 |
| 15,737 | | | | Beckman Coulter, Inc. | | | 899,212 |
| 14,331 | | @ | | Edwards Lifesciences Corp. | | | 974,938 |
| 49,091 | | @ | | Gen-Probe, Inc. | | | 2,109,931 |
| 76,427 | | @ | | Henry Schein, Inc. | | | 3,664,675 |
| 92,519 | | | | Hill-Rom Holdings, Inc. | | | 1,500,658 |
| 213,006 | | @ | | Hologic, Inc. | | | 3,031,075 |
| 5,828 | | @, L | | Idexx Laboratories, Inc. | | | 269,254 |
| 59,810 | | @ | | Kinetic Concepts, Inc. | | | 1,629,823 |
| 51,247 | | @ | | Resmed, Inc. | | | 2,087,290 |
| 115,900 | | | | Steris Corp. | | | 3,022,672 |
| 4,200 | | | | Techne Corp. | | | 268,002 |
| 32,200 | | @ | | Thoratec Corp. | | | 862,316 |
| | | | | | | |
| | | | | | | 21,090,645 |
| | | | | | | |
Healthcare - Services: 3.2% | | | |
| 143,662 | | @ | | Community Health Systems, Inc. | | | 3,627,466 |
| 9,950 | | @ | | Covance, Inc. | | | 489,540 |
See Accompanying Notes to Financial Statements
26
| | |
| ING INDEX PLUS MIDCAP PORTFOLIO | | PORTFOLIO OF INVESTMENTS ASOF JUNE 30, 2009 (UNAUDITED) (CONTINUED) |
| | | | | | | |
| Shares | | | | | | Value |
| | | | | | | |
Healthcare - Services: (continued) | | | |
| 357,133 | | @ | | Health Management Associates, Inc. | | $ | 1,764,237 |
| 136,250 | | @ | | Health Net, Inc. | | | 2,118,688 |
| 61,500 | | @ | | Kindred Healthcare, Inc. | | | 760,755 |
| 101,100 | | @ | | LifePoint Hospitals, Inc. | | | 2,653,875 |
| 112,085 | | @ | | Lincare Holdings, Inc. | | | 2,636,239 |
| 65,100 | | | | Universal Health Services, Inc. | | | 3,180,135 |
| 50,220 | | @, L | | WellCare Health Plans, Inc. | | | 928,568 |
| | | | | | | |
| | | | | | | 18,159,503 |
| | | | | | | |
Home Builders: 1.7% | | | |
| 58,990 | | | | MDC Holdings, Inc. | | | 1,776,189 |
| 6,230 | | @ | | NVR, Inc. | | | 3,129,890 |
| 46,250 | | | | Ryland Group, Inc. | | | 775,150 |
| 69,541 | | | | Thor Industries, Inc. | | | 1,277,468 |
| 155,440 | | @ | | Toll Brothers, Inc. | | | 2,637,817 |
| | | | | | | |
| | | | | | | 9,596,514 |
| | | | | | | |
Household Products/Wares: 0.8% | | | |
| 59,951 | | | | Church & Dwight Co., Inc. | | | 3,255,939 |
| 52,487 | | | | Tupperware Corp. | | | 1,365,712 |
| | | | | | | |
| | | | | | | 4,621,651 |
| | | | | | | |
Insurance: 4.7% | | | |
| 147,836 | | | | American Financial Group, Inc. | | | 3,190,301 |
| 59,207 | | | | Arthur J. Gallagher & Co. | | | 1,263,477 |
| 11,979 | | | | Brown & Brown, Inc. | | | 238,741 |
| 73,494 | | @@ | | Everest Re Group Ltd. | | | 5,259,966 |
| 170,934 | | | | Fidelity National Title Group, Inc. | | | 2,312,737 |
| 107,250 | | | | First American Corp. | | | 2,778,848 |
| 32,855 | | | | Hanover Insurance Group, Inc. | | | 1,252,104 |
| 76,207 | | | | HCC Insurance Holdings, Inc. | | | 1,829,730 |
| 155,290 | | | | Horace Mann Educators Corp. | | | 1,548,241 |
| 71,506 | | | | Old Republic International Corp. | | | 704,334 |
| 15,987 | | | | Protective Life Corp. | | | 182,891 |
| 55,915 | | | | Reinsurance Group of America, Inc. | | | 1,951,993 |
| 59,000 | | | | Stancorp Financial Group, Inc. | | | 1,692,120 |
| 142,191 | | | | Unitrin, Inc. | | | 1,709,136 |
| 42,753 | | | | WR Berkley Corp. | | | 917,907 |
| | | | | | | |
| | | | | | | 26,832,526 |
| | | | | | | |
Internet: 2.1% | | | |
| 21,992 | | @ | | Avocent Corp. | | | 307,008 |
| 27,505 | | @ | | Digital River, Inc. | | | 998,982 |
| 29,100 | | @ | | Equinix, Inc. | | | 2,116,734 |
| 57,150 | | @ | | F5 Networks, Inc. | | | 1,976,819 |
| 22,900 | | @, L | | NetFlix, Inc. | | | 946,686 |
| 38,650 | | @, L | | Priceline.com, Inc. | | | 4,311,408 |
| 135,070 | | @ | | Valueclick, Inc. | | | 1,420,936 |
| | | | | | | |
| | | | | | | 12,078,573 |
| | | | | | | |
Investment Companies: 0.0% | | | |
| 23,519 | | | | Apollo Investment Corp. | | | 141,114 |
| | | | | | | |
| | | | | | | 141,114 |
| | | | | | | |
Iron/Steel: 1.5% | | | |
| 142,882 | | | | Cliffs Natural Resources, Inc. | | | 3,496,323 |
| 92,300 | | | | Reliance Steel & Aluminum Co. | | | 3,543,397 |
| 109,012 | | | | Steel Dynamics, Inc. | | | 1,605,747 |
| | | | | | | |
| | | | | | | 8,645,467 |
| | | | | | | |
| | | | | | | |
| Shares | | | | | | Value |
| | | | | | | |
Machinery - Construction & Mining: 1.0% | | | |
| 36,800 | | | | Bucyrus International, Inc. | | $ | 1,051,008 |
| 109,643 | | | | Joy Global, Inc. | | | 3,916,448 |
| 58,224 | | @ | | Terex Corp. | | | 702,764 |
| | | | | | | |
| | | | | | | 5,670,220 |
| | | | | | | |
Machinery - Diversified: 2.0% | | | |
| 42,684 | | @ | | AGCO Corp. | | | 1,240,824 |
| 15,350 | | | | Graco, Inc. | | | 338,007 |
| 103,589 | | | | IDEX Corp. | | | 2,545,182 |
| 22,427 | | | | Nordson Corp. | | | 867,028 |
| 94,785 | | | | Roper Industries, Inc. | | | 4,294,708 |
| 64,995 | | | | Wabtec Corp. | | | 2,090,889 |
| | | | | | | |
| | | | | | | 11,376,638 |
| | | | | | | |
Media: 0.1% | | | |
| 12,100 | | L | | Factset Research Systems, Inc. | | | 603,427 |
| | | | | | | |
| | | | | | | 603,427 |
| | | | | | | |
Metal Fabricate/Hardware: 0.6% | | | |
| 65,200 | | | | Timken Co. | | | 1,113,616 |
| 13,400 | | | | Valmont Industries, Inc. | | | 965,872 |
| 109,012 | | | | Worthington Industries | | | 1,394,263 |
| | | | | | | |
| | | | | | | 3,473,751 |
| | | | | | | |
Miscellaneous Manufacturing: 2.5% | | | |
| 8,097 | | | | Aptargroup, Inc. | | | 273,436 |
| 67,428 | | | | Brink’s Co. | | | 1,957,435 |
| 79,200 | | | | Carlisle Cos., Inc. | | | 1,903,968 |
| 48,471 | | | | Crane Co. | | | 1,081,388 |
| 74,289 | | | | Donaldson Co., Inc. | | | 2,573,371 |
| 123,986 | | | | Federal Signal Corp. | | | 948,493 |
| 89,638 | | | | Harsco Corp. | | | 2,536,755 |
| 34,362 | | | | Pentair, Inc. | | | 880,354 |
| 23,178 | | | | SPX Corp. | | | 1,135,027 |
| 24,600 | | | | Teleflex, Inc. | | | 1,102,818 |
| | | | | | | |
| | | | | | | 14,393,045 |
| | | | | | | |
Office Furnishings: 0.4% | | | |
| 103,838 | | | | Herman Miller, Inc. | | | 1,592,875 |
| 25,837 | | L | | HNI, Corp. | | | 466,616 |
| | | | | | | |
| | | | | | | 2,059,491 |
| | | | | | | |
Oil & Gas: 4.1% | | | |
| 52,800 | | @ | | Bill Barrett Corp. | | | 1,449,888 |
| 39,700 | | | | Cimarex Energy Co. | | | 1,125,098 |
| 42,644 | | @ | | Comstock Resources, Inc. | | | 1,409,384 |
| 93,600 | | @ | | Encore Acquisition Co. | | | 2,887,560 |
| 53,950 | | @ | | Forest Oil Corp. | | | 804,934 |
| 203,950 | | | | Frontier Oil Corp. | | | 2,673,785 |
| 99,512 | | | | Helmerich & Payne, Inc. | | | 3,071,935 |
| 99,240 | | @ | | Newfield Exploration Co. | | | 3,242,171 |
| 198,700 | | | | Patterson-UTI Energy, Inc. | | | 2,555,282 |
| 62,273 | | @ | | Plains Exploration & Production Co. | | | 1,703,789 |
| 63,500 | | @ | | Pride International, Inc. | | | 1,591,310 |
| 127,790 | | @, L | | Quicksilver Resources, Inc. | | | 1,187,169 |
| | | | | | | |
| | | | | | | 23,702,305 |
| | | | | | | |
Oil & Gas Services: 0.7% | | | |
| 85,200 | | @ | | Exterran Holdings, Inc. | | | 1,366,608 |
| 48,301 | | @ | | Helix Energy Solutions Group, Inc. | | | 525,032 |
| 32,571 | | @ | | Oceaneering International, Inc. | | | 1,472,209 |
| 41,670 | | @ | | Superior Energy Services | | | 719,641 |
| | | | | | | |
| | | | | | | 4,083,490 |
| | | | | | | |
See Accompanying Notes to Financial Statements
27
| | |
| ING INDEX PLUS MIDCAP PORTFOLIO | | PORTFOLIO OF INVESTMENTS ASOF JUNE 30, 2009 (UNAUDITED) (CONTINUED) |
| | | | | | | |
| Shares | | | | | | Value |
| | | | | | | |
Packaging & Containers: 0.8% | | | |
| 69,600 | | | | Packaging Corp. of America | | $ | 1,127,520 |
| 118,948 | | | | Sonoco Products Co. | | | 2,848,805 |
| 36,496 | | | | Temple-Inland, Inc. | | | 478,828 |
| | | | | | | |
| | | | | | | 4,455,153 |
| | | | | | | |
Pharmaceuticals: 2.2% | | | |
| 173,340 | | @ | | Endo Pharmaceuticals Holdings, Inc. | | | 3,106,253 |
| 16,209 | | | | Medicis Pharmaceutical Corp. | | | 264,531 |
| 116,300 | | | | Omnicare, Inc. | | | 2,995,888 |
| 35,350 | | | | Perrigo Co. | | | 982,023 |
| 131,310 | | @ | | Sepracor, Inc. | | | 2,274,289 |
| 123,200 | | @, L | | Valeant Pharmaceuticals International | | | 3,168,704 |
| | | | | | | |
| | | | | | | 12,791,688 |
| | | | | | | |
Pipelines: 0.3% | | | |
| 60,341 | | | | Oneok, Inc. | | | 1,779,456 |
| | | | | | | |
| | | | | | | 1,779,456 |
| | | | | | | |
Retail: 8.7% | | | |
| 35,500 | | @ | | 99 Cents Only Stores | | | 482,090 |
| 96,300 | | | | Advance Auto Parts, Inc. | | | 3,995,487 |
| 82,125 | | @ | | Aeropostale, Inc. | | | 2,814,424 |
| 35,800 | | | | American Eagle Outfitters | | | 507,286 |
| 85,000 | | | | Barnes & Noble, Inc. | | | 1,753,550 |
| 53,040 | | @ | | BJ’s Wholesale Club, Inc. | | | 1,709,479 |
| 23,373 | | | | Bob Evans Farms, Inc. | | | 671,740 |
| 121,099 | | | | Brinker International, Inc. | | | 2,062,316 |
| 90,559 | | @, L | | Carmax, Inc. | | | 1,331,217 |
| 117,184 | | @ | | Cheesecake Factory | | | 2,027,283 |
| 170,100 | | @, S | | Chico’s FAS, Inc. | | | 1,655,073 |
| 24,660 | | @, L | | Chipotle Mexican Grill, Inc. | | | 1,972,800 |
| 128,300 | | @ | | Coldwater Creek, Inc. | | | 777,498 |
| 46,640 | | @ | | Collective Brands, Inc. | | | 679,545 |
| 21,314 | | @ | | Copart, Inc. | | | 738,956 |
| 67,400 | | @ | | Dick’s Sporting Goods, Inc. | | | 1,159,280 |
| 93,592 | | @ | | Dollar Tree, Inc. | | | 3,940,223 |
| 154,500 | | | | Foot Locker, Inc. | | | 1,617,615 |
| 40,160 | | | | Guess ?, Inc. | | | 1,035,325 |
| 64,042 | | | | MSC Industrial Direct Co. | | | 2,272,210 |
| 35,900 | | @, L | | Panera Bread Co. | | | 1,789,974 |
| 161,833 | | | | Petsmart, Inc. | | | 3,472,936 |
| 60,432 | | | | Phillips-Van Heusen | | | 1,733,794 |
| 102,376 | | | | Regis Corp. | | | 1,782,366 |
| 148,158 | | | | Ross Stores, Inc. | | | 5,718,899 |
| 21,230 | | @ | | Urban Outfitters, Inc. | | | 443,070 |
| 111,100 | | | | Williams-Sonoma, Inc. | | | 1,318,757 |
| | | | | | | |
| | | | | | | 49,463,193 |
| | | | | | | |
Savings & Loans: 1.5% | | | |
| 155,513 | | | | First Niagara Financial Group, Inc. | | | 1,775,958 |
| 403,000 | | | | New York Community Bancorp., Inc. | | | 4,308,067 |
| 220,900 | | | | NewAlliance Bancshares, Inc. | | | 2,540,350 |
| | | | | | | |
| | | | | | | 8,624,375 |
| | | | | | | |
Semiconductors: 1.2% | | | |
| 36,300 | | @, L | | Cree, Inc. | | | 1,066,857 |
| 191,600 | | @ | | Integrated Device Technology, Inc. | | | 1,157,264 |
| 68,292 | | | | Intersil Corp. | | | 858,430 |
| 45,593 | | @ | | Lam Research Corp. | | | 1,185,418 |
| | | | | | | |
| Shares | | | | | | Value |
| | | | | | | |
Semiconductors: (continued) | | | |
| 100,258 | | @ | | Semtech Corp. | | $ | 1,595,105 |
| 27,400 | | @ | | Silicon Laboratories, Inc. | | | 1,039,556 |
| | | | | | | |
| | | | | | | 6,902,630 |
| | | | | | | |
Software: 3.0% | | | |
| 122,661 | | | | Acxiom Corp. | | | 1,083,097 |
| 10,715 | | @, L | | Advent Software, Inc. | | | 351,345 |
| 56,100 | | @ | | Ansys, Inc. | | | 1,748,076 |
| 180,700 | | | | Broadridge Financial Solutions ADR | | | 2,996,006 |
| 28,350 | | @, L | | Cerner Corp. | | | 1,765,922 |
| 113,100 | | | | Fair Isaac Corp. | | | 1,748,526 |
| 76,600 | | @ | | Metavante Technologies, inc. | | | 1,980,876 |
| 120,100 | | @ | | Parametric Technology Corp. | | | 1,403,969 |
| 117,125 | | @ | | Sybase, Inc. | | | 3,670,698 |
| 52,900 | | @ | | Wind River Systems, Inc. | | | 606,234 |
| | | | | | | |
| | | | | | | 17,354,749 |
| | | | | | | |
Telecommunications: 2.7% | | | |
| 488,616 | | @ | | 3Com Corp. | | | 2,301,381 |
| 82,482 | | @ | | ADC Telecommunications, Inc. | | | 656,557 |
| 12,942 | | | | Adtran, Inc. | | | 277,865 |
| 182,500 | | @ | | Cincinnati Bell, Inc. | | | 518,300 |
| 127,211 | | @ | | CommScope, Inc. | | | 3,340,561 |
| 105,530 | | @ | | NeuStar, Inc. | | | 2,338,545 |
| 120,194 | | | | Plantronics, Inc. | | | 2,272,869 |
| 49,100 | | @ | | Polycom, Inc. | | | 995,257 |
| 62,640 | | @ | | Syniverse Holdings, Inc. | | | 1,004,119 |
| 68,100 | | S | | Telephone & Data Systems, Inc. | | | 1,927,230 |
| | | | | | | |
| | | | | | | 15,632,684 |
| | | | | | | |
Textiles: 0.1% | | | |
| 10,008 | | @ | | Mohawk Industries, Inc. | | | 357,085 |
| | | | | | | |
| | | | | | | 357,085 |
| | | | | | | |
Toys/Games/Hobbies: 0.4% | | | |
| 59,900 | | @ | | Marvel Entertainment, Inc. | | | 2,131,841 |
| | | | | | | |
| | | | | | | 2,131,841 |
| | | | | | | |
Transportation: 1.1% | | | |
| 9,588 | | | | Con-way, Inc. | | | 338,552 |
| 28,832 | | | | JB Hunt Transport Services, Inc. | | | 880,241 |
| 16,434 | | @ | | Kansas City Southern | | | 264,752 |
| 45,953 | | | | Landstar System, Inc. | | | 1,650,172 |
| 75,904 | | | | Tidewater, Inc. | | | 3,254,004 |
| | | | | | | |
| | | | | | | 6,387,721 |
| | | | | | | |
Trucking & Leasing: 0.0% | | | |
| 7,838 | | S | | GATX Corp. | | | 201,593 |
| | | | | | | |
| | | | | | | 201,593 |
| | | | | | | |
Water: 0.3% | | | |
| 87,000 | | | | Aqua America, Inc. | | | 1,557,300 |
| | | | | | | |
| | | | | | | 1,557,300 |
| | | | | | | |
| | | | Total Common Stock
(Cost $552,480,284) | | | 513,129,572 |
| | | | | | | |
REAL ESTATE INVESTMENT TRUSTS: 6.0% | | | |
Apartments: 1.1% | | | |
| 46,700 | | | | BRE Properties, Inc. | | | 1,109,592 |
| 79,087 | | | | Camden Property Trust | | | 2,182,801 |
| 272,100 | | | | UDR, Inc. | | | 2,810,793 |
| | | | | | | |
| | | | | | | 6,103,186 |
| | | | | | | |
See Accompanying Notes to Financial Statements
28
| | |
| ING INDEX PLUS MIDCAP PORTFOLIO | | PORTFOLIO OF INVESTMENTS ASOF JUNE 30, 2009 (UNAUDITED) (CONTINUED) |
| | | | | | | |
Shares | | | | | | Value |
| | | | | | | |
Diversified: 0.9% | | | |
| 144,172 | | L | | Cousins Properties, Inc. | | $ | 1,225,462 |
| 101,931 | | | | Duke Realty Corp. | | | 893,935 |
| 147,600 | | | | Liberty Property Trust | | | 3,400,704 |
| | | | | | | |
| | | | | | | 5,520,101 |
| | | | | | | |
Forest Products & Paper: 0.7% | | | |
| 104,900 | | | | Rayonier, Inc. | | | 3,813,115 |
| | | | | | | |
| | | | | | | 3,813,115 |
| | | | | | | |
Health Care: 0.6% | | | |
| 140,600 | | | | Nationwide Health Properties, Inc. | | | 3,619,044 |
| | | | | | | |
| | | | | | | 3,619,044 |
| | | | | | | |
Hotels: 0.4% | | | |
| 194,180 | | @ | | Hospitality Properties Trust | | | 2,308,800 |
| | | | | | | |
| | | | | | | 2,308,800 |
| | | | | | | |
Office Property: 1.6% | | | |
| 8,251 | | | | Alexandria Real Estate Equities, Inc. | | | 295,303 |
| 57,500 | | | | Corporate Office Properties Trust SBI MD | | | 1,686,475 |
| 74,102 | | | | Highwoods Properties, Inc. | | | 1,657,662 |
| 132,150 | | | | Mack-Cali Realty Corp. | | | 3,013,020 |
| 101,700 | | | | SL Green Realty Corp. | | | 2,332,998 |
| | | | | | | |
| | | | | | | 8,985,458 |
| | | | | | | |
Regional Malls: 0.1% | | | |
| 51,244 | | L | | Macerich Co. | | | 902,407 |
| | | | | | | |
| | | | | | | 902,407 |
| | | | | | | |
Shopping Centers: 0.4% | | | |
| 13,000 | | | | Federal Realty Investment Trust | | | 669,760 |
| 11,800 | | | | Regency Centers Corp. | | | 411,938 |
| 98,600 | | | | Weingarten Realty Investors | | | 1,430,686 |
| | | | | | | |
| | | | | | | 2,512,384 |
| | | | | | | |
Single Tenant: 0.1% | | | |
| 17,900 | | | | Realty Income Corp. | | | 392,368 |
| | | | | | | |
| | | | | | | 392,368 |
| | | | | | | |
Warehouse/Industrial: 0.1% | | | |
| 20,170 | | | | AMB Property Corp. | | | 379,398 |
| | | | | | | |
| | | | | | | 379,398 |
| | | | | | | |
| | | | Total Real Estate Investment Trusts
(Cost $39,628,313) | | | 34,536,261 |
| | | | | | | |
| | | | Total Long-Term Investments
(Cost $592,108,597) | | | 547,665,833 |
| | | | | | | |
SHORT-TERM INVESTMENTS: 8.5% | | | |
Affiliated Mutual Fund: 3.3% | | | |
| 18,796,000 | | S | | ING Institutional Prime Money Market Fund - Class I | | | 18,796,000 |
| | | | | | | |
| | | | Total Mutual Fund
(Cost $18,796,000) | | | 18,796,000 |
| | | | | | | |
| | | | | | | | | | |
Principal
Amount | | | Value | |
| Securities Lending Collateralcc: 5.2% | |
| $ | 30,175,543 | | Bank of New York Mellon Corp. Institutional Cash Reserves | | | | | $ | 29,605,305 | |
| | | | | | | | | | |
| | | Total Securities Lending Collateral
(Cost $30,175,543) | | | | | | 29,605,305 | |
| | | | | | | | | | |
| | | Total Short-Term Investments
(Cost $48,971,543) | | | | | | 48,401,305 | |
| | | | | | | | | | |
| | | Total Investments in Securities
(Cost $641,080,140)* | | 104.3 | % | | $ | 596,067,138 | |
| | | Other Assets and Liabilities - Net | | (4.3 | ) | | | (24,560,114 | ) |
| | | | | | | | | | |
| | | Net Assets | | 100.0 | % | | $ | 571,507,024 | |
| | | | | | | | | | |
| @ | Non-income producing security |
| ADR | American Depositary Receipt |
| cc | Securities purchased with cash collateral for securities loaned. |
| S | All or a portion of this security is segregated to cover collateral requirements for applicable futures, options, swaps, foreign forward currency contracts and/or when-issued or delayed-delivery securities. |
| L | Loaned security, a portion or all of the security is on loan at June 30, 2009. |
| * | Cost for federal income tax purposes is $659,420,829. |
| | | | |
Net unrealized depreciation consists of: | | | | |
Gross Unrealized Appreciation | | $ | 37,919,919 | |
Gross Unrealized Depreciation | | | (101,273,610 | ) |
| | | | |
Net Unrealized Depreciation | | $ | (63,353,691 | ) |
| | | | |
Fair Value Measurements*
The following is a summary of the inputs used as of June 30, 2009 in determining the Portfolio’s investments at fair value for purposes of SFAS 157:
| | | | | | | | | | |
| | | Quoted Prices in Active Markets for Identical
Investments (Level 1) | | | Significant Other Observable Inputs
(Level 2) | | Significant Unobservable Inputs
(Level 3) |
Common Stock** | | $ | 513,129,572 | | | $ | — | | $ | — |
Real Estate Investment Trusts | | | 34,536,261 | | | | — | | | — |
Short-Term Investments | | | 18,796,000 | | | | 29,605,305 | | | — |
| | | | | | | | | | |
Total | | $ | 566,461,833 | | | $ | 29,605,305 | | $ | — |
| | | | | | | | | | |
Other
Financial Instruments*** | | | (437,860 | ) | | | — | | | — |
| | | | | | | | | | |
Total | | $ | (437,860 | ) | | $ | — | | $ | — |
| | | | | | | | | | |
See Accompanying Notes to Financial Statements
29
| | |
| ING INDEX PLUS MIDCAP PORTFOLIO | | PORTFOLIO OF INVESTMENTS ASOF JUNE 30, 2009 (UNAUDITED) (CONTINUED) |
“Fair value” for purposes of SFAS 157 is different from “fair value” as used in the 1940 Act. The former generally implies market value, and can include market quotations as a source of value, and the latter refers to determinations of value in absence of available market quotations.
| * | See NOTE 2, “Significant Accounting Policies” in the Notes to Financial Statements for additional information. |
| ** | For further breakdown of Common Stock by industry type, please refer to the Portfolio of Investments. |
| *** | Other financial instruments may include open forward foreign currency contracts, futures, swaps, and written options. Forward foreign currency contracts and futures are reported at their unrealized gain/loss at period end. Swaps and written options are reported at their market value at period end. |
ING Index Plus MidCap Portfolio Open Futures Contracts on June 30, 2009:
| | | | | | | | |
Contract Description | | Number of Contracts | | Expiration Date | | Unrealized Depreciation | |
Long Contracts | | | | | | | | |
S&P MidCap 400 Index | | 87 | | 09/17/09 | | $ | (437,860 | ) |
| | | | | | | | |
| | | | | | $ | (437,860 | ) |
| | | | | | | | |
For the six months ended June 30, 2009, net realized gain (loss) on futures and the net change in unrealized gain (loss) on futures can be found on the Portfolio’s Statement of Operations. For additional information on the reason(s) why the Portfolio may enter into futures contracts and the risks associated with futures contracts, please refer to NOTE 2 in the accompanying Notes to Financial Statements.
See Accompanying Notes to Financial Statements
30
| | |
| ING INDEX PLUS SMALLCAP PORTFOLIO | | PORTFOLIO OF INVESTMENTS ASOF JUNE 30, 2009 (UNAUDITED) |
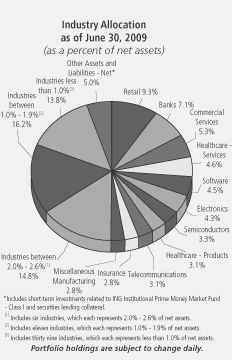
| | | | | | | |
| Shares | | | | | | Value |
| | | | | | | |
COMMON STOCK: 90.0% |
Advertising: 0.1% |
| 29,514 | | @ | | inVentiv Health, Inc. | | $ | 399,324 |
| | | | | | | |
| | | | | | | 399,324 |
| | | | | | | |
Aerospace/Defense: 1.7% |
| 15,984 | | @ | | AAR Corp. | | | 256,543 |
| 8,504 | | @ | | Aerovironment, Inc. | | | 262,433 |
| 33,463 | | | | Cubic Corp. | | | 1,197,641 |
| 16,600 | | | | Curtiss-Wright Corp. | | | 493,518 |
| 11,150 | | @ | | Esterline Technologies Corp. | | | 301,831 |
| 12,628 | | @ | | Moog, Inc. | | | 325,929 |
| 8,587 | | | | National Presto Industries, Inc. | | | 653,471 |
| 33,663 | | @ | | Orbital Sciences Corp. | | | 510,668 |
| 14,090 | | @ | | Teledyne Technologies, Inc. | | | 461,448 |
| 8,118 | | | | Triumph Group, Inc. | | | 324,720 |
| | | | | | | |
| | | | | | | 4,788,202 |
| | | | | | | |
Agriculture: 0.3% |
| 85,700 | | @ | | Alliance One International, Inc. | | | 325,660 |
| 17,711 | | | | Andersons, Inc. | | | 530,267 |
| | | | | | | |
| | | | | | | 855,927 |
| | | | | | | |
Airlines: 0.4% |
| 101,289 | | | | Skywest, Inc. | | | 1,033,148 |
| | | | | | | |
| | | | | | | 1,033,148 |
| | | | | | | |
Apparel: 1.8% |
| 78,116 | | @ | | Carter’s, Inc. | | | 1,922,435 |
| 51,408 | | @ | | CROCS, Inc. | | | 174,787 |
| 10,340 | | @ | | Deckers Outdoor Corp. | | | 726,592 |
| 59,815 | | @, S | | Iconix Brand Group, Inc. | | | 919,955 |
| 2,496 | | @ | | Maidenform Brands, Inc. | | | 28,629 |
| 15,438 | | | | Oxford Industries, Inc. | | | 179,853 |
| | | | | | | |
| Shares | | | | | | Value |
| | | | | | | |
Apparel: (continued) |
| 932 | | @ | | Skechers USA, Inc. | | $ | 9,106 |
| 22,877 | | @, L | | True Religion Apparel, Inc. | | | 510,157 |
| 12,367 | | @, L | | Volcom, Inc. | | | 154,588 |
| 16,843 | | | | Wolverine World Wide, Inc. | | | 371,557 |
| | | | | | | |
| | | | | | | 4,997,659 |
| | | | | | | |
Auto Manufacturers: 0.0% |
| 29,628 | | L | | Wabash National Corp. | | | 20,740 |
| | | | | | | |
| | | | | | | 20,740 |
| | | | | | | |
Auto Parts & Equipment: 0.4% |
| 37,415 | | | | Spartan Motors, Inc. | | | 423,912 |
| 59,432 | | | | Superior Industries International | | | 837,991 |
| | | | | | | |
| | | | | | | 1,261,903 |
| | | | | | | |
Banks: 7.1% |
| 49,858 | | | | Bank Mutual Corp. | | | 434,762 |
| 31,800 | | | | Bank of the Ozarks, Inc. | | | 687,834 |
| 107,050 | | L | | Cascade Bancorp. | | | 150,941 |
| 37,755 | | | | Central Pacific Financial Corp. | | | 141,581 |
| 557 | | | | Columbia Banking System, Inc. | | | 5,698 |
| 32,181 | | | | Community Bank System, Inc. | | | 468,555 |
| 37,713 | | @@, L | | First Bancorp. Puerto Rico | | | 148,966 |
| 39,382 | | | | First Financial Bancorp. | | | 296,153 |
| 33,750 | | L | | First Financial Bankshares, Inc. | | | 1,699,650 |
| 150,085 | | | | First Midwest Bancorp., Inc. | | | 1,097,121 |
| 7,621 | | L | | Frontier Financial Corp. | | | 9,221 |
| 57,356 | | | | Glacier Bancorp., Inc. | | | 847,148 |
| 33,019 | | | | Hancock Holding Co. | | | 1,072,787 |
| 2,365 | | | | Home Bancshares, Inc. | | | 45,030 |
| 49,570 | | | | Independent Bank Corp. | | | 976,529 |
| 169,200 | | | | National Penn Bancshares, Inc. | | | 780,012 |
| 14,800 | | | | NBT Bancorp., Inc. | | | 321,308 |
| 85,743 | | L | | Old National Bancorp. | | | 841,996 |
| 54,540 | | | | Prosperity Bancshares, Inc. | | | 1,626,928 |
| 84,000 | | | | S&T Bancorp, Inc. | | | 1,021,440 |
| 7,656 | | @ | | Signature Bank | | | 207,631 |
| 20,673 | | | | Simmons First National Corp. | | | 552,383 |
| 58,301 | | | | Sterling Bancorp. | | | 486,813 |
| 165,800 | | | | Sterling Bancshares, Inc. | | | 1,049,514 |
| 222,274 | | | | Susquehanna Bancshares, Inc. | | | 1,086,920 |
| 18,278 | | | | Tompkins Financial Corp. | | | 876,430 |
| 92,370 | | | | Trustco Bank Corp. | | | 545,907 |
| 1,264 | | | | UCBH Holdings, Inc. | | | 1,593 |
| 45,891 | | | | UMB Financial Corp. | | | 1,744,317 |
| 10,080 | | | | Umpqua Holdings Corp. | | | 78,221 |
| 18,000 | | L | | United Bankshares, Inc. | | | 351,720 |
| 39,700 | | | | Wilshire Bancorp., Inc. | | | 228,275 |
| 8,893 | | | | Wintrust Financial Corp. | | | 142,999 |
| | | | | | | |
| | | | | | | 20,026,383 |
| | | | | | | |
Beverages: 0.5% |
| 22,950 | | @, L | | Green Mountain Coffee Roasters, Inc. | | | 1,356,804 |
| 8,100 | | @ | | Peet’s Coffee & Tea, Inc. | | | 204,120 |
| | | | | | | |
| | | | | | | 1,560,924 |
| | | | | | | |
Biotechnology: 1.3% |
| 32,700 | | @ | | Arqule, Inc. | | | 200,778 |
| 83,950 | | @ | | Cubist Pharmaceuticals, Inc. | | | 1,538,804 |
| 17,620 | | @ | | Enzo Biochem, Inc. | | | 78,057 |
See Accompanying Notes to Financial Statements
31
| | |
| ING INDEX PLUS SMALLCAP PORTFOLIO | | PORTFOLIO OF INVESTMENTS ASOF JUNE 30, 2009 (UNAUDITED) (CONTINUED) |
| | | | | | | |
| Shares | | | | | | Value |
| | | | | | | |
Biotechnology: (continued) |
| 50,450 | | @ | | Martek Biosciences Corp. | | $ | 1,067,018 |
| 48,170 | | @ | | Regeneron Pharmaceuticals, Inc. | | | 863,206 |
| | | | | | | |
| | | | | | | 3,747,863 |
| | | | | | | |
Building Materials: 1.3% |
| 60,410 | | | | Apogee Enterprises, Inc. | | | 743,043 |
| 37,900 | | | | Eagle Materials, Inc. | | | 956,596 |
| 69,539 | | | | Gibraltar Industries, Inc. | | | 477,733 |
| 50,190 | | @, L | | NCI Building Systems, Inc. | | | 132,502 |
| 1,306 | | | | Simpson Manufacturing Co., Inc. | | | 28,236 |
| 12,780 | | L | | Texas Industries, Inc. | | | 400,781 |
| 25,400 | | | | Universal Forest Products, Inc. | | | 840,486 |
| | | | | | | |
| | | | | | | 3,579,377 |
| | | | | | | |
Chemicals: 2.5% |
| 9,905 | | | | American Vanguard Corp. | | | 111,927 |
| 23,808 | | | | Arch Chemicals, Inc. | | | 585,439 |
| 44,933 | | | | Balchem Corp. | | | 1,101,757 |
| 35,462 | | | | HB Fuller Co. | | | 665,622 |
| 14,330 | | | | NewMarket Corp. | | | 964,839 |
| 40,830 | | @ | | OM Group, Inc. | | | 1,184,887 |
| 142,224 | | @ | | PolyOne Corp. | | | 385,427 |
| 31,700 | | | | Quaker Chemical Corp. | | | 421,293 |
| 73,670 | | | | Schulman A, Inc. | | | 1,113,154 |
| 5,050 | | | | Stepan Co. | | | 223,008 |
| 15,692 | | | | Zep, Inc. | | | 189,089 |
| | | | | | | |
| | | | | | | 6,946,442 |
| | | | | | | |
Commercial Services: 5.3% |
| 11,523 | | | | ABM Industries, Inc. | | | 208,221 |
| 40,610 | | | | Administaff, Inc. | | | 944,995 |
| 13,800 | | @ | | American Public Education, Inc. | | | 546,618 |
| 28,130 | | @ | | AMN Healthcare Services, Inc. | | | 179,469 |
| 16,319 | | | | Arbitron, Inc. | | | 259,309 |
| 19,172 | | @, L | | Bankrate, Inc. | | | 483,901 |
| 16,400 | | @, L | | Capella Education Co. | | | 983,180 |
| 22,615 | | | | CDI Corp. | | | 252,157 |
| 29,834 | | | | Chemed Corp. | | | 1,177,846 |
| 8,868 | | @ | | Coinstar, Inc. | | | 236,776 |
| 13,793 | | @ | | Consolidated Graphics, Inc. | | | 240,274 |
| 8,700 | | @ | | Corvel Corp. | | | 198,099 |
| 42,200 | | @ | | Forrester Research, Inc. | | | 1,036,010 |
| 44,300 | | @ | | Geo Group, Inc. | | | 823,094 |
| 12,500 | | | | Healthcare Services Group | | | 223,500 |
| 78,900 | | | | Heartland Payment Systems, Inc. | | | 755,073 |
| 17,487 | | | | Hillenbrand, Inc. | | | 290,984 |
| 10,299 | | @ | | HMS Holdings Corp. | | | 419,375 |
| 58,551 | | @ | | Kendle International, Inc. | | | 716,664 |
| 52,333 | | @ | | Live Nation, Inc. | | | 254,338 |
| 121,350 | | @ | | On Assignment, Inc. | | | 474,479 |
| 18,098 | | @ | | Parexel International Corp. | | | 260,249 |
| 15,166 | | @, L | | Pre-Paid Legal Services, Inc. | | | 661,086 |
| 22,895 | | @ | | Spherion Corp. | | | 94,327 |
| 30,100 | | @ | | TeleTech Holdings, Inc. | | | 456,015 |
| 36,000 | | @ | | Ticketmaster | | | 231,120 |
| 48,030 | | @ | | TrueBlue, Inc. | | | 403,452 |
| 19,114 | | @ | | Universal Technical Institute, Inc. | | | 285,372 |
| 42,225 | | | | Viad Corp. | | | 727,115 |
| 46,128 | | @ | | Wright Express Corp. | | | 1,174,880 |
| | | | | | | |
| | | | | | | 14,997,978 |
| | | | | | | |
Computers: 2.6% |
| 44,121 | | @ | | CACI International, Inc. | | | 1,884,408 |
| 187,594 | | @ | | Ciber, Inc. | | | 581,541 |
| | | | | | | |
| Shares | | | | | | Value |
| | | | | | | |
Computers: (continued) |
| 21,592 | | @, L | | Hutchinson Technology, Inc. | | $ | 42,104 |
| 78,037 | | @ | | Insight Enterprises, Inc. | | | 753,837 |
| 56,200 | | @ | | Manhattan Associates, Inc. | | | 1,023,964 |
| 25,460 | | @ | | Mercury Computer Systems, Inc. | | | 235,505 |
| 11,720 | | | | MTS Systems Corp. | | | 242,018 |
| 75,770 | | @ | | Radisys Corp. | | | 682,688 |
| 49,164 | | @ | | SYKES Enterprises, Inc. | | | 889,377 |
| 29,745 | | @, L | | Synaptics, Inc. | | | 1,149,644 |
| | | | | | | |
| | | | | | | 7,485,086 |
| | | | | | | |
Cosmetics/Personal Care: 0.2% |
| 8,260 | | @, L | | Chattem, Inc. | | | 562,506 |
| | | | | | | |
| | | | | | | 562,506 |
| | | | | | | |
Distribution/Wholesale: 1.3% |
| 97,550 | | @ | | Brightpoint, Inc. | | | 611,639 |
| 41,190 | | @ | | Scansource, Inc. | | | 1,009,979 |
| 54,738 | | @ | | School Specialty, Inc. | | | 1,106,255 |
| 20,330 | | | | Watsco, Inc. | | | 994,747 |
| | | | | | | |
| | | | | | | 3,722,620 |
| | | | | | | |
Diversified Financial Services: 2.0% |
| 3,485 | | | | Financial Federal Corp. | | | 71,617 |
| 9,250 | | L | | Greenhill & Co., Inc. | | | 667,943 |
| 37,229 | | @ | | Investment Technology Group, Inc. | | | 759,099 |
| 3,670 | | @ | | LaBranche & Co., Inc. | | | 15,781 |
| 84,480 | | | | National Financial Partners Corp. | | | 618,394 |
| 62,643 | | | | OptionsXpress Holdings, Inc. | | | 972,846 |
| 11,180 | | @, L | | Portfolio Recovery Associates, Inc. | | | 433,001 |
| 17,250 | | @ | | Stifel Financial Corp. | | | 829,553 |
| 27,055 | | | | SWS Group, Inc. | | | 377,958 |
| 7,206 | | @ | | TradeStation Group, Inc. | | | 60,963 |
| 42,888 | | @, L | | World Acceptance, Corp. | | | 853,900 |
| | | | | | | |
| | | | | | | 5,661,055 |
| | | | | | | |
Electric: 1.0% |
| 12,200 | | | | Avista Corp. | | | 217,282 |
| 15,800 | | | | Central Vermont Public Service Corp. | | | 285,980 |
| 32,881 | | | | CH Energy Group, Inc. | | | 1,535,543 |
| 33,086 | | | | Unisource Energy Corp. | | | 878,102 |
| | | | | | | |
| | | | | | | 2,916,907 |
| | | | | | | |
Electrical Components & Equipment: 0.2% |
| 32,157 | | | | Belden CDT, Inc. | | | 537,022 |
| | | | | | | |
| | | | | | | 537,022 |
| | | | | | | |
Electronics: 4.3% |
| 7,900 | | L | | American Science & Engineering, Inc. | | | 546,048 |
| 2,200 | | @ | | Axsys Technologies, Inc. | | | 118,008 |
| 6,994 | | | | Badger Meter, Inc. | | | 286,754 |
| 12,245 | | | | Bel Fuse, Inc. | | | 196,410 |
| 125,130 | | @ | | Benchmark Electronics, Inc. | | | 1,801,872 |
| 72,880 | | | | Brady Corp. | | | 1,830,746 |
| 82,382 | | @ | | Checkpoint Systems, Inc. | | | 1,292,574 |
| 108,321 | | | | CTS Corp. | | | 709,503 |
| 1,033 | | @ | | Cymer, Inc. | | | 30,711 |
| 19,900 | | L | | Daktronics, Inc. | | | 153,230 |
| 20,517 | | @ | | Dionex Corp. | | | 1,252,153 |
| 12,915 | | @ | | FEI Co. | | | 295,754 |
| 6,086 | | @ | | LoJack Corp. | | | 25,500 |
See Accompanying Notes to Financial Statements
32
| | |
| ING INDEX PLUS SMALLCAP PORTFOLIO | | PORTFOLIO OF INVESTMENTS ASOF JUNE 30, 2009 (UNAUDITED) (CONTINUED) |
| | | | | | | |
| Shares | | | | | | Value |
| | | | | | | |
Electronics: (continued) |
| 75,193 | | | | Methode Electronics, Inc. | | $ | 527,855 |
| 65,900 | | @ | | Newport Corp. | | | 381,561 |
| 10,840 | | | | Park Electrochemical Corp. | | | 233,385 |
| 31,220 | | @ | | Plexus Corp. | | | 638,761 |
| 3,608 | | @ | | Rogers Corp. | | | 72,990 |
| 75,612 | | @ | | TTM Technologies, Inc. | | | 601,872 |
| 48,600 | | | | Watts Water Technologies, Inc. | | | 1,046,844 |
| | | | | | | |
| | | | | | | 12,042,531 |
| | | | | | | |
Energy - Alternate Sources: 0.0% |
| 22,791 | | @ | | Headwaters, Inc. | | | 76,578 |
| | | | | | | |
| | | | | | | 76,578 |
| | | | | | | |
Engineering & Construction: 0.9% |
| 97,492 | | @ | | EMCOR Group, Inc. | | | 1,961,539 |
| 18,889 | | @ | | Insituform Technologies, Inc. | | | 320,546 |
| 11,900 | | @ | | Stanley, Inc. | | | 391,272 |
| | | | | | | |
| | | | | | | 2,673,357 |
| | | | | | | |
Entertainment: 0.3% |
| 48,761 | | @ | | Pinnacle Entertainment, Inc. | | | 452,990 |
| 64,900 | | @ | | Shuffle Master, Inc. | | | 428,989 |
| | | | | | | |
| | | | | | | 881,979 |
| | | | | | | |
Environmental Control: 0.6% |
| 43,931 | | @ | | Calgon Carbon Corp. | | | 610,202 |
| 41,832 | | @ | | Darling International, Inc. | | | 276,091 |
| 26,994 | | @ | | Tetra Tech, Inc. | | | 773,378 |
| | | | | | | |
| | | | | | | 1,659,671 |
| | | | | | | |
Food: 1.9% |
| 10,396 | | L | | Cal-Maine Foods, Inc. | | | 259,484 |
| 28,978 | | | | Diamond Foods, Inc. | | | 808,486 |
| 940 | | @ | | Hain Celestial Group, Inc. | | | 14,673 |
| 31,800 | | | | J&J Snack Foods Corp. | | | 1,141,620 |
| 6,031 | | | | Lance, Inc. | | | 139,497 |
| 15,890 | | | | Nash Finch Co. | | | 429,983 |
| 16,300 | | | | Sanderson Farms, Inc. | | | 733,500 |
| 12,943 | | | | Spartan Stores, Inc. | | | 160,623 |
| 34,023 | | @ | | TreeHouse Foods, Inc. | | | 978,842 |
| 24,378 | | @ | | United Natural Foods, Inc. | | | 639,923 |
| | | | | | | |
| | | | | | | 5,306,631 |
| | | | | | | |
Forest Products & Paper: 0.4% |
| 35,823 | | @ | | Buckeye Technologies, Inc. | | | 160,845 |
| 8,800 | | @ | | Clearwater Paper Corp. | | | 222,552 |
| 31,200 | | | | Schweitzer-Mauduit International, Inc. | | | 848,952 |
| | | | | | | |
| | | | | | | 1,232,349 |
| | | | | | | |
Gas: 2.5% |
| 106,389 | | S | | Atmos Energy Corp. | | | 2,663,966 |
| 1,137 | | | | Laclede Group, Inc. | | | 37,669 |
| 55,156 | | | | New Jersey Resources Corp. | | | 2,042,978 |
| 5,200 | | | | Northwest Natural Gas Co. | | | 230,464 |
| 35,087 | | | | Piedmont Natural Gas Co. | | | 845,948 |
| 18,090 | | | | South Jersey Industries, Inc. | | | 631,160 |
| 27,200 | | | | Southwest Gas Corp. | | | 604,112 |
| | | | | | | |
| | | | | | | 7,056,297 |
| | | | | | | |
Hand/Machine Tools: 0.2% |
| 9,328 | | | | Baldor Electric Co. | | | 221,913 |
| 11,482 | | | | Regal-Beloit Corp. | | | 456,065 |
| | | | | | | |
| | | | | | | 677,978 |
| | | | | | | |
| | | | | | | |
| Shares | | | | | | Value |
| | | | | | | |
Healthcare - Products: 3.1% |
| 4,457 | | @ | | Abaxism, Inc. | | $ | 91,547 |
| 55,000 | | @ | | Align Technology, Inc. | | | 583,000 |
| 102,467 | | @ | | American Medical Systems Holdings, Inc. | | | 1,618,979 |
| 20,136 | | | | Cooper Cos., Inc. | | | 497,963 |
| 49,640 | | @ | | Cyberonics | | | 825,513 |
| 16,350 | | @ | | Haemonetics Corp. | | | 931,950 |
| 8,035 | | @ | | ICU Medical, Inc. | | | 330,640 |
| 49,400 | | | | Invacare Corp. | | | 871,910 |
| 43,970 | | @ | | Kensey Nash Corp. | | | 1,152,454 |
| 7,910 | | | | Meridian Bioscience, Inc. | | | 178,608 |
| 17,654 | | @ | | Merit Medical Systems, Inc. | | | 287,760 |
| 59,900 | | @ | | PSS World Medical, Inc. | | | 1,108,748 |
| 6,760 | | | | West Pharmaceutical Services, Inc. | | | 235,586 |
| | | | | | | |
| | | | | | | 8,714,658 |
| | | | | | | |
Healthcare - Services: 4.6% |
| 4,964 | | @ | | Air Methods Corp. | | | 135,815 |
| 22,011 | | @, L | | Amedisys, Inc. | | | 726,803 |
| 60,698 | | @ | | AMERIGROUP Corp. | | | 1,629,741 |
| 48,015 | | @ | | Amsurg Corp. | | | 1,029,442 |
| 47,376 | | @ | | Centene Corp. | | | 946,572 |
| 7,900 | | @ | | Genoptix, Inc. | | | 252,721 |
| 33,813 | | @ | | Gentiva Health Services, Inc. | | | 556,562 |
| 62,570 | | @ | | Healthspring, Inc. | | | 679,510 |
| 47,260 | | @ | | Healthways, Inc. | | | 635,647 |
| 7,000 | | @ | | IPC The Hospitalist Co., Inc. | | | 186,830 |
| 20,200 | | @ | | LHC Group, Inc. | | | 448,642 |
| 49,250 | | @ | | Magellan Health Services, Inc. | | | 1,616,385 |
| 58,843 | | @ | | Mednax, Inc. | | | 2,479,056 |
| 26,259 | | @, L | | Molina Healthcare, Inc. | | | 628,115 |
| 48,135 | | @ | | Odyssey HealthCare, Inc. | | | 494,828 |
| 18,800 | | @ | | RehabCare Group, Inc. | | | 449,884 |
| 4,255 | | @ | | Res-Care, Inc. | | | 60,847 |
| | | | | | | |
| | | | | | | 12,957,400 |
| | | | | | | |
Home Builders: 0.5% |
| 34,200 | | | | M/I Homes, Inc. | | | 334,818 |
| 38,900 | | @ | | Meritage Homes Corp. | | | 733,654 |
| 134,364 | | @ | | Standard-Pacific Corp. | | | 272,759 |
| | | | | | | |
| | | | | | | 1,341,231 |
| | | | | | | |
Home Furnishings: 0.4% |
| 8,931 | | @ | | DTS, Inc. | | | 241,762 |
| 75,475 | | | | La-Z-Boy, Inc. | | | 356,242 |
| 25,730 | | @ | | Universal Electronics, Inc. | | | 518,974 |
| | | | | | | |
| | | | | | | 1,116,978 |
| | | | | | | |
Household Products/Wares: 0.4% |
| 69,174 | | @ | | Central Garden & Pet Co. | | | 681,364 |
| 25,400 | | @ | | Helen of Troy Ltd. | | | 426,466 |
| | | | | | | |
| | | | | | | 1,107,830 |
| | | | | | | |
Housewares: 0.4% |
| 37,952 | | L | | Toro Co. | | | 1,134,765 |
| | | | | | | |
| | | | | | | 1,134,765 |
| | | | | | | |
Insurance: 2.8% |
| 1,502 | | | | American Physicians Capital, Inc. | | | 58,818 |
| 39,255 | | @ | | Amerisafe, Inc. | | | 610,808 |
| 70,440 | | | | Delphi Financial Group | | | 1,368,649 |
| 13,634 | | | | Employers Holdings, Inc. | | | 184,741 |
| 28,665 | | | | Infinity Property & Casualty Corp. | | | 1,045,126 |
See Accompanying Notes to Financial Statements
33
| | |
| ING INDEX PLUS SMALLCAP PORTFOLIO | | PORTFOLIO OF INVESTMENTS ASOF JUNE 30, 2009 (UNAUDITED) (CONTINUED) |
| | | | | | | |
| Shares | | | | | | Value |
| | | | | | | |
Insurance: (continued) |
| 17,400 | | @ | | Navigators Group, Inc. | | $ | 773,082 |
| 44,092 | | @ | | ProAssurance Corp. | | | 2,037,491 |
| 1,280 | | | | RLI Corp. | | | 57,344 |
| 14,897 | | | | Safety Insurance Group, Inc. | | | 455,252 |
| 34,508 | | | | Selective Insurance Group | | | 440,667 |
| 10,325 | | | | Stewart Information Services Corp. | | | 147,131 |
| 35,260 | | | | Tower Group, Inc. | | | 873,743 |
| 372 | | L | | Zenith National Insurance Corp. | | | 8,087 |
| | | | | | | |
| | | | | | | 8,060,939 |
| | | | | | | |
Internet: 2.6% |
| 39,560 | | @ | | Blue Coat Systems, Inc. | | | 654,322 |
| 11,350 | | @, L | | Blue Nile, Inc. | | | 487,937 |
| 11,314 | | @ | | comScore, Inc. | | | 150,702 |
| 40,212 | | @ | | Cybersource Corp. | | | 615,244 |
| 27,823 | | @ | | DealerTrack Holdings, Inc. | | | 472,991 |
| 53,328 | | @ | | eResearch Technology, Inc. | | | 331,167 |
| 67,940 | | @ | | j2 Global Communications, Inc. | | | 1,532,726 |
| 12,073 | | @ | | Knot, Inc. | | | 95,135 |
| 29,750 | | | | Nutri/System, Inc. | | | 431,375 |
| 62,540 | | @ | | Perficient, Inc. | | | 437,155 |
| 53,344 | | @ | | Stamps.com, Inc. | | | 452,357 |
| 142,081 | | | | United Online, Inc. | | | 924,947 |
| 39,661 | | @ | | Websense, Inc. | | | 707,552 |
| | | | | | | |
| | | | | | | 7,293,610 |
| | | | | | | |
Leisure Time: 0.3% |
| 1,111 | | | | Brunswick Corp. | | | 4,800 |
| 29,300 | | @ | | Interval Leisure Group, Inc. | | | 273,076 |
| 18,428 | | L | | Polaris Industries, Inc. | | | 591,907 |
| | | | | | | |
| | | | | | | 869,783 |
| | | | | | | |
Lodging: 0.0% |
| 12,877 | | | | Marcus Corp. | | | 135,466 |
| | | | | | | |
| | | | | | | 135,466 |
| | | | | | | |
Machinery - Diversified: 1.8% |
| 18,515 | | | | Albany International Corp. | | | 210,701 |
| 61,292 | | | | Applied Industrial Technologies, Inc. | | | 1,207,452 |
| 17,200 | | | | Briggs & Stratton Corp. | | | 229,448 |
| 24,950 | | | | Cognex Corp. | | | 352,544 |
| 71,671 | | @ | | Gardner Denver, Inc. | | | 1,803,959 |
| 44,422 | | @ | | Intermec, Inc. | | | 573,044 |
| 4,784 | | L | | Lindsay Manufacturing Co. | | | 158,350 |
| 22,082 | | | | Robbins & Myers, Inc. | | | 425,079 |
| | | | | | | |
| | | | | | | 4,960,577 |
| | | | | | | |
Metal Fabricate/Hardware: 0.6% |
| 4,400 | | | | Kaydon Corp. | | | 143,264 |
| 14,791 | | | | Lawson Products | | | 210,180 |
| 64,555 | | | | Mueller Industries, Inc. | | | 1,342,744 |
| 516 | | @ | | RTI International Metals, Inc. | | | 9,118 |
| | | | | | | |
| | | | | | | 1,705,306 |
| | | | | | | |
Mining: 0.2% |
| 16,160 | | | | Amcol International Corp. | | | 348,733 |
| 13,828 | | @ | | Brush Engineered Materials, Inc. | | | 231,619 |
| 1,007 | | @, L | | Century Aluminum Co. | | | 6,274 |
| | | | | | | |
| | | | | | | 586,626 |
| | | | | | | |
| | | | | | | |
| Shares | | | | | | Value |
| | | | | | | |
Miscellaneous Manufacturing: 2.8% |
| 95,700 | | | | Actuant Corp. | | $ | 1,167,540 |
| 32,075 | | | | Acuity Brands, Inc. | | | 899,704 |
| 1,039 | | | | AO Smith Corp. | | | 33,840 |
| 13,589 | | @ | | AZZ, Inc. | | | 467,597 |
| 42,676 | | @ | | Ceradyne, Inc. | | | 753,658 |
| 24,942 | | | | Clarcor, Inc. | | | 728,057 |
| 50,024 | | @ | | EnPro Industries, Inc. | | | 900,932 |
| 25,199 | | @ | | ESCO Technologies, Inc. | | | 1,128,915 |
| 42,861 | | @ | | Griffon Corp. | | | 356,604 |
| 25,350 | | | | John Bean Technologies Corp. | | | 317,382 |
| 19,452 | | | | Myers Industries, Inc. | | | 161,841 |
| 11,322 | | | | Standex International Corp. | | | 131,335 |
| 18,251 | | L | | Sturm Ruger & Co., Inc. | | | 227,042 |
| 40,400 | | | | Tredegar Corp. | | | 538,128 |
| | | | | | | |
| | | | | | | 7,812,575 |
| | | | | | | |
Office Furnishings: 0.1% |
| 52,288 | | | | Interface, Inc. | | | 324,186 |
| | | | | | | |
| | | | | | | 324,186 |
| | | | | | | |
Oil & Gas: 1.4% |
| 69,940 | | @ | | Atwood Oceanics, Inc. | | | 1,742,205 |
| 38,317 | | | | Holly Corp. | | | 688,940 |
| 15,630 | | | | Penn Virginia Corp. | | | 255,863 |
| 5,780 | | @ | | Petroleum Development Corp. | | | 90,688 |
| 623 | | @ | | Petroquest Energy, Inc. | | | 2,299 |
| 16,748 | | @ | | Pioneer Drilling Co. | | | 80,223 |
| 24,347 | | | | St. Mary Land & Exploration Co. | | | 508,122 |
| 76,141 | | @ | | Stone Energy Corp. | | | 564,966 |
| 356 | | @ | | Swift Energy Co. | | | 5,927 |
| | | | | | | |
| | | | | | | 3,939,233 |
| | | | | | | |
Oil & Gas Services: 2.6% |
| 29,442 | | @ | | Basic Energy Services, Inc. | | | 201,089 |
| 13,537 | | L | | CARBO Ceramics, Inc. | | | 462,965 |
| 24,539 | | @ | | Dril-Quip, Inc. | | | 934,936 |
| 15,360 | | | | Gulf Island Fabrication, Inc. | | | 243,149 |
| 35,571 | | @ | | Hornbeck Offshore Services, Inc. | | | 760,864 |
| 21,585 | | @, L | | ION Geophysical Corp. | | | 55,473 |
| 8,873 | | | | Lufkin Industries, Inc. | | | 373,110 |
| 47,100 | | @ | | Matrix Service Co. | | | 540,708 |
| 11,506 | | @ | | NATCO Group, Inc. | | | 378,778 |
| 47,454 | | @ | | Oil States International, Inc. | | | 1,148,861 |
| 24,024 | | @ | | SEACOR Holdings, Inc. | | | 1,807,566 |
| 46,703 | | @ | | Tetra Technologies, Inc. | | | 371,756 |
| | | | | | | |
| | | | | | | 7,279,255 |
| | | | | | | |
Packaging & Containers: 0.7% |
| 49,275 | | | | Rock-Tenn Co. | | | 1,880,334 |
| | | | | | | |
| | | | | | | 1,880,334 |
| | | | | | | |
Pharmaceuticals: 1.1% |
| 32,380 | | @ | | Catalyst Health Solutions, Inc. | | | 807,557 |
| 30,226 | | @ | | Par Pharmaceutical Cos., Inc. | | | 457,924 |
| 50,050 | | @ | | PharMerica Corp. | | | 982,482 |
| 21,580 | | @ | | Salix Pharmaceuticals Ltd. | | | 212,995 |
| 91,720 | | @ | | Viropharma, Inc. | | | 543,900 |
| | | | | | | |
| | | | | | | 3,004,858 |
| | | | | | | |
Real Estate: 0.1% |
| 30,310 | | @, L | | Forestar Real Estate Group, Inc. | | | 360,083 |
| | | | | | | |
| | | | | | | 360,083 |
| | | | | | | |
See Accompanying Notes to Financial Statements
34
| | |
| ING INDEX PLUS SMALLCAP PORTFOLIO | | PORTFOLIO OF INVESTMENTS ASOF JUNE 30, 2009 (UNAUDITED) (CONTINUED) |
| | | | | | | |
| Shares | | | | | | Value |
| | | | | | | |
Retail: 9.3% |
| 11,372 | | | | Big 5 Sporting Goods Corp. | | $ | 125,774 |
| 36,096 | | | | Buckle, Inc. | | | 1,146,770 |
| 14,373 | | @, L | | Buffalo Wild Wings, Inc. | | | 467,410 |
| 53,000 | | @ | | Cabela’s, Inc. | | | 651,900 |
| 51,200 | | @ | | California Pizza Kitchen, Inc. | | | 680,448 |
| 28,888 | | | | Casey’s General Stores, Inc. | | | 742,133 |
| 41,770 | | | | Cash America International, Inc. | | | 977,000 |
| 72,039 | | | | Cato Corp. | | | 1,256,360 |
| 25,180 | | @ | | CEC Entertainment, Inc. | | | 742,306 |
| 32,070 | | @ | | Charlotte Russe Holding, Inc. | | | 413,062 |
| 39,500 | | @ | | Childrens Place Retail Stores, Inc. | | | 1,043,985 |
| 2,402 | | | | Christopher & Banks Corp. | | | 16,117 |
| 19,755 | | | | Cracker Barrel Old Country Store | | | 551,165 |
| 11,990 | | L | | DineEquity, Inc. | | | 373,968 |
| 79,230 | | @, L | | Dress Barn, Inc. | | | 1,132,989 |
| 49,670 | | | | Finish Line | | | 368,551 |
| 50,220 | | @ | | First Cash Financial Services, Inc. | | | 879,854 |
| 83,587 | | | | Fred’s, Inc. | | | 1,053,196 |
| 7,153 | | @ | | Genesco, Inc. | | | 134,262 |
| 19,000 | | | | Group 1 Automotive, Inc. | | | 494,380 |
| 44,309 | | @ | | Gymboree Corp. | | | 1,572,083 |
| 19,430 | | | | Haverty Furniture Cos., Inc. | | | 177,785 |
| 25,250 | | @, L | | Hibbett Sporting Goods, Inc. | | | 454,500 |
| 51,350 | | @ | | HOT Topic, Inc. | | | 375,369 |
| 33,730 | | @ | | HSN, Inc. | | | 356,526 |
| 17,122 | | @ | | Jack in the Box, Inc. | | | 384,389 |
| 30,620 | | @ | | Jo-Ann Stores, Inc. | | | 632,915 |
| 20,622 | | @ | | JoS. A Bank Clothiers, Inc. | | | 710,634 |
| 5,179 | | L | | Landry’s Restaurants, Inc. | | | 44,539 |
| 51,500 | | @, L | | MarineMax, Inc. | | | 177,160 |
| 35,247 | | | | Men’s Wearhouse, Inc. | | | 676,037 |
| 3,099 | | | | OfficeMax, Inc. | | | 19,462 |
| 33,788 | | @ | | PetMed Express, Inc. | | | 507,834 |
| 32,481 | | @, L | | PF Chang’s China Bistro, Inc. | | | 1,041,341 |
| 1,362 | | @, L | | Red Robin Gourmet Burgers, Inc. | | | 25,538 |
| 28,092 | | @ | | Ruby Tuesday, Inc. | | | 187,093 |
| 79,907 | | | | Stage Stores, Inc. | | | 886,968 |
| 52,231 | | @ | | Steak N Shake Co. | | | 456,499 |
| 55,370 | | @ | | Stein Mart, Inc. | | | 490,578 |
| 21,781 | | @ | | Texas Roadhouse, Inc. | | | 237,631 |
| 48,030 | | @ | | Tractor Supply Co. | | | 1,984,600 |
| 7,884 | | @ | | Tuesday Morning Corp. | | | 26,569 |
| 37,290 | | | | World Fuel Services Corp. | | | 1,537,467 |
| 8,228 | | @, L | | Zale Corp. | | | 28,304 |
| 3,720 | | @ | | Zumiez, Inc. | | | 29,797 |
| | | | | | | |
| | | | | | | 26,273,248 |
| | | | | | | |
Savings & Loans: 0.0% |
| 2,832 | | | | Brookline Bancorp., Inc. | | | 26,394 |
| 410 | | | | Dime Community Bancshares | | | 3,735 |
| | | | | | | |
| | | | | | | 30,129 |
| | | | | | | |
Semiconductors: 3.3% |
| 989 | | @ | | Cabot Microelectronics Corp. | | | 27,979 |
| 175,504 | | @ | | Cypress Semiconductor Corp. | | | 1,614,637 |
| 18,570 | | @ | | Diodes, Inc. | | | 290,435 |
| 35,843 | | @ | | DSP Group, Inc. | | | 242,299 |
| 11,900 | | @ | | Hittite Microwave Corp. | | | 413,525 |
| 48,100 | | @ | | Kopin Corp. | | | 176,527 |
| 12,234 | | @ | | Kulicke & Soffa Industries, Inc. | | | 41,963 |
| 91,034 | | @ | | Microsemi Corp. | | | 1,256,269 |
| | | | | | | |
| Shares | | | | | | Value |
| | | | | | | |
Semiconductors: (continued) |
| 54,160 | | @ | | MKS Instruments, Inc. | | $ | 714,370 |
| 28,100 | | @ | | Rudolph Technologies, Inc. | | | 155,112 |
| 147,480 | | @ | | Skyworks Solutions, Inc. | | | 1,442,354 |
| 6,580 | | @, L | | Supertex, Inc. | | | 165,224 |
| 54,479 | | @ | | Triquint Semiconductor, Inc. | | | 289,283 |
| 29,000 | | @ | | Ultratech, Inc. | | | 356,990 |
| 61,560 | | @ | | Varian Semiconductor Equipment Associates, Inc. | | | 1,476,824 |
| 61,015 | | @ | | Veeco Instruments, Inc. | | | 707,164 |
| | | | | | | |
| | | | | | | 9,370,955 |
| | | | | | | |
Software: 4.5% |
| 12,400 | | @ | | Avid Technology, Inc. | | | 166,284 |
| 30,954 | | | | Blackbaud, Inc. | | | 481,335 |
| 36,900 | | @ | | Commvault Systems, Inc. | | | 611,802 |
| 32,828 | | @ | | Concur Technologies, Inc. | | | 1,020,294 |
| 57,356 | | @ | | CSG Systems International | | | 759,393 |
| 7,479 | | @ | | Digi International, Inc. | | | 72,920 |
| 4,964 | | @ | | Ebix, Inc. | | | 155,472 |
| 73,854 | | @ | | Eclipsys Corp. | | | 1,313,124 |
| 120,850 | | @ | | Epicor Software Corp. | | | 640,505 |
| 81,330 | | @ | | Informatica Corp. | | | 1,398,063 |
| 35,700 | | @ | | JDA Software Group, Inc. | | | 534,072 |
| 51,213 | | @ | | Phase Forward, Inc. | | | 773,828 |
| 37,419 | | @ | | Progress Software Corp. | | | 792,160 |
| 8,362 | | L | | Quality Systems, Inc. | | | 476,300 |
| 27,530 | | @ | | Smith Micro Software, Inc. | | | 270,345 |
| 22,611 | | @ | | SPSS, Inc. | | | 754,529 |
| 40,250 | | @ | | SYNNEX Corp. | | | 1,005,848 |
| 73,760 | | @, L | | Take-Two Interactive Software, Inc. | | | 698,507 |
| 25,650 | | @ | | Taleo Corp. | | | 468,626 |
| 14,532 | | @ | | Tyler Technologies, Inc. | | | 226,990 |
| | | | | | | |
| | | | | | | 12,620,397 |
| | | | | | | |
Storage/Warehousing: 0.0% |
| 2,313 | | @ | | Mobile Mini, Inc. | | | 33,932 |
| | | | | | | |
| | | | | | | 33,932 |
| | | | | | | |
Telecommunications: 3.1% |
| 18,605 | | @ | | Anixter International, Inc. | | | 699,362 |
| 17,400 | | | | Applied Signal Technology, Inc. | | | 443,874 |
| 125,131 | | @ | | Arris Group, Inc. | | | 1,521,593 |
| 28,277 | | S | | Black Box Corp. | | | 946,431 |
| 21,900 | | @ | | Cbeyond, Inc. | | | 314,265 |
| 42,340 | | @ | | Comtech Telecommunications | | | 1,349,799 |
| 59,798 | | | | Fairpoint Communications, Inc. | | | 35,879 |
| 24,600 | | @ | | General Communication, Inc. | | | 170,478 |
| 123,599 | | @ | | Harmonic, Inc. | | | 727,998 |
| 24,700 | | | | Iowa Telecommunications Services, Inc. | | | 308,997 |
| 36,150 | | @ | | Netgear, Inc. | | | 520,922 |
| 15,200 | | @ | | Neutral Tandem, Inc. | | | 448,704 |
| 49,029 | | @ | | Novatel Wireless, Inc. | | | 442,242 |
| 55,566 | | @ | | Symmetricom, Inc. | | | 320,616 |
| 34,049 | | @ | | Tekelec | | | 573,045 |
| | | | | | | |
| | | | | | | 8,824,205 |
| | | | | | | |
Textiles: 0.6% |
| 54,456 | | | | G&K Services, Inc. | | | 1,151,744 |
| 13,323 | | | | Unifirst Corp. | | | 495,216 |
| | | | | | | |
| | | | | | | 1,646,960 |
| | | | | | | |
See Accompanying Notes to Financial Statements
35
| | |
| ING INDEX PLUS SMALLCAP PORTFOLIO | | PORTFOLIO OF INVESTMENTS ASOF JUNE 30, 2009 (UNAUDITED) (CONTINUED) |
| | | | | | | |
| Shares | | | | | | Value |
| | | | | | | |
Toys/Games/Hobbies: 0.0% |
| 2,993 | | @ | | Jakks Pacific, Inc. | | $ | 38,400 |
| | | | | | | |
| | | | | | | 38,400 |
| | | | | | | |
Transportation: 1.6% |
| 8,687 | | @ | | Bristow Group, Inc. | | | 257,396 |
| 71,857 | | | | Heartland Express, Inc. | | | 1,057,735 |
| 51,447 | | @ | | HUB Group, Inc. | | | 1,061,866 |
| 32,576 | | @ | | Kirby Corp. | | | 1,035,591 |
| 12,200 | | | | Knight Transportation, Inc. | | | 201,910 |
| 24,680 | | @ | | Old Dominion Freight Line | | | 828,508 |
| | | | | | | |
| | | | | | | 4,443,006 |
| | | | | | | |
| | | | Total Common Stock
(Cost $292,898,935) | | | 254,575,362 |
| | | | | | | |
REAL ESTATE INVESTMENT TRUSTS: 5.0% |
Apartments: 0.7% |
| 18,930 | | | | Home Properties, Inc. | | | 645,513 |
| 29,350 | | | | Mid-America Apartment Communities, Inc. | | | 1,077,439 |
| 15,100 | | | | Post Properties, Inc. | | | 202,944 |
| | | | | | | |
| | | | | | | 1,925,896 |
| | | | | | | |
Diversified: 0.8% |
| 63,539 | | | | Colonial Properties Trust | | | 470,189 |
| 37,560 | | | | Entertainment Properties Trust | | | 773,736 |
| 117,026 | | | | Lexington Realty Trust | | | 397,888 |
| 13,615 | | | | PS Business Parks, Inc. | | | 659,511 |
| | | | | | | |
| | | | | | | 2,301,324 |
| | | | | | | |
Health Care: 0.6% |
| 72,280 | | | | Medical Properties Trust, Inc. | | | 438,740 |
| 72,780 | | | | Senior Housing Properties Trust | | | 1,187,770 |
| | | | | | | |
| | | | | | | 1,626,510 |
| | | | | | | |
Hotels: 0.7% |
| 170,770 | | @ | | DiamondRock Hospitality Co. | | | 1,069,020 |
| 79,725 | | | | LaSalle Hotel Properties | | | 983,807 |
| | | | | | | |
| | | | | | | 2,052,827 |
| | | | | | | |
Office Property: 0.9% |
| 115,057 | | | | BioMed Realty Trust, Inc. | | | 1,177,033 |
| 20,400 | | | | Franklin Street Properties Corp. | | | 270,300 |
| 24,643 | | | | Kilroy Realty Corp. | | | 506,167 |
| 37,460 | | | | Parkway Properties, Inc. | | | 486,980 |
| | | | | | | |
| | | | | | | 2,440,480 |
| | | | | | | |
Regional Malls: 0.1% |
| 71,010 | | L | | Pennsylvania Real Estate Investment Trust | | | 355,050 |
| | | | | | | |
| | | | | | | 355,050 |
| | | | | | | |
Shopping Centers: 0.5% |
| 7,311 | | | | Acadia Realty Trust | | | 95,409 |
| 65,350 | | @ | | Cedar Shopping Centers, Inc. | | | 295,382 |
| 13,550 | | | | Inland Real Estate Corp. | | | 94,850 |
| 142,610 | | | | Kite Realty Group Trust | | | 416,421 |
| 16,450 | | | | Tanger Factory Outlet Centers, Inc. | | | 533,474 |
| | | | | | | |
| | | | | | | 1,435,536 |
| | | | | | | |
Single Tenant: 0.3% |
| 40,120 | | | | National Retail Properties, Inc. | | | 696,082 |
| | | | | | | |
| | | | | | | 696,082 |
| | | | | | | |
| | | | | | | |
| Shares | | | | | | Value |
| | | | | | | |
Storage: 0.3% |
| 23,648 | | @ | | Extra Space Storage, Inc. | | $ | 197,461 |
| 25,071 | | | | Sovran Self Storage, Inc. | | | 616,747 |
| | | | | | | |
| | | | | | | 814,208 |
| | | | | | | |
Warehouse/Industrial: 0.1% |
| 9,750 | | | | EastGroup Properties, Inc. | | | 321,945 |
| | | | | | | |
| | | | | | | 321,945 |
| | | | | | | |
| | | | Total Real Estate Investment Trusts
(Cost $20,972,491) | | | 13,969,858 |
| | | | | | | |
| | | | Total Long-Term Investments
(Cost $313,871,426) | | | 268,545,220 |
| | | | | | | |
SHORT-TERM INVESTMENTS: 10.3% |
Affiliated Mutual Fund: 4.2% |
| 11,876,000 | | S | | ING Institutional Prime Money Market Fund - Class I | | | 11,876,000 |
| | | | | | | |
| | | | Total Mutual Fund
(Cost $11,876,000) | | | 11,876,000 |
| | | | | | | |
| | | | | | | | | | |
| | | |
Principal
Amount | | | | | | | Value | |
| Securities Lending Collateralcc: 6.1% | |
| $ | 17,674,474 | | Bank of New York Mellon Corp. Institutional Cash Reserves | | | | | $ | 17,388,621 | |
| | | | | | | | | | |
| | | Total Securities Lending Collateral
(Cost $17,674,474) | | | | | | 17,388,621 | |
| | | | | | | | | | |
| | | Total Short-Term Investments
(Cost $29,550,474) | | | | | | 29,264,621 | |
| | | | | | | | | | |
| | | Total Investments in Securities
(Cost $343,421,900)* | | 105.3 | % | | $ | 297,809,841 | |
| | | Other Assets and Liabilities - Net | | (5.3 | ) | | | (15,007,788 | ) |
| | | | | | | | | | |
| | | Net Assets | | 100.0 | % | | $ | 282,802,053 | |
| | | | | | | | | | |
| @ | Non-income producing security |
| cc | Securities purchased with cash collateral for securities loaned. |
| S | All or a portion of this security is segregated to cover collateral requirements for applicable futures, options, swaps, foreign forward currency contracts and/or when-issued or delayed-delivery securities. |
| L | Loaned security, a portion or all of the security is on loan at June 30, 2009. |
| * | Cost for federal income tax purposes is $355,166,193. |
| | | | |
Net unrealized depreciation consists of: | |
Gross Unrealized Appreciation | | $ | 16,650,658 | |
Gross Unrealized Depreciation | | | (74,007,010 | ) |
| | | | |
Net Unrealized Depreciation | | $ | (57,356,352 | ) |
| | | | |
See Accompanying Notes to Financial Statements
36
| | |
| ING INDEX PLUS SMALLCAP PORTFOLIO | | PORTFOLIO OF INVESTMENTS ASOF JUNE 30, 2009 (UNAUDITED) (CONTINUED) |
Fair Value Measurements*
The following is a summary of the inputs used as of June 30, 2009 in determining the Portfolio’s investments at fair value for purposes of SFAS 157:
| | | | | | | | | | |
| | | Quoted Prices in Active Markets for Identical Investments (Level 1) | | | Significant Other Observable Inputs
(Level 2) | | Significant Unobservable Inputs
(Level 3) |
Common Stock** | | $ | 254,575,362 | | | $ | — | | $ | — |
Real Estate Investment Trusts | | | 13,969,858 | | | | — | | | — |
Short-Term Investments | | | 11,876,000 | | | | 17,388,621 | | | — |
| | | | | | | | | | |
Total | | $ | 280,421,220 | | | $ | 17,388,621 | | $ | — |
| | | | | | | | | | |
Other Financial Instruments** | | | (217,709 | ) | | | — | | | — |
| | | | | | | | | | |
Total | | $ | (217,709 | ) | | $ | — | | $ | — |
| | | | | | | | | | |
“Fair value” for purposes of SFAS 157 is different from “fair value” as used in the 1940 Act. The former generally implies market value, and can include market quotations as a source of value, and the latter refers to determinations of value in absence of available market quotations.
| * | See NOTE 2, “Significant Accounting Policies” in the Notes to Financial Statements for additional information. |
| ** | For further breakdown of Common Stock by industry type, please refer to the Portfolio of Investments. |
| *** | Other financial instruments may include open forward foreign currency contracts, futures, swaps, and written options. Forward foreign currency contracts and futures are reported at their unrealized gain/loss at period end. Swaps and written options are reported at their market value at period end. |
ING Index Plus SmallCap Portfolio Open Futures Contracts on June 30, 2009:
| | | | | | | | |
Contract Description | | Number of Contracts | | Expiration Date | | Unrealized Depreciation | |
Long Contracts | | | | | | | | |
Russell 2000 Mini Index | | 275 | | 09/18/09 | | $ | (217,709 | ) |
| | | | | | | | |
| | | | | | $ | (217,709 | ) |
| | | | | | | | |
For the six months ended June 30, 2009, net realized gain (loss) on futures and the net change in unrealized gain (loss) on futures can be found on the Portfolio’s Statement of Operations. For additional information on the reason(s) why the Portfolio may enter into futures contracts and the risks associated with futures contracts, please refer to NOTE 2 in the accompanying Notes to Financial Statements.
See Accompanying Notes to Financial Statements
37
Investment Adviser
ING Investments, LLC
7337 East Doubletree Ranch Road
Scottsdale, Arizona 85258
Administrator
ING Funds Services, LLC
7337 East Doubletree Ranch Road
Scottsdale, Arizona 85258
Distributor
ING Funds Distributor, LLC
7337 East Doubletree Ranch Road
Scottsdale, Arizona 85258
Transfer Agent
PNC Global Investment Servicing (U.S.) Inc.
301 Bellevue Parkway
Wilmington, Delaware 19809
Custodian
The Bank of New York Mellon
One Wall Street
New York, New York 10286
Legal Counsel
Goodwin Procter LLP
Exchange Place
53 State Street
Boston, Massachusetts 02109
Before investing, carefully consider the investment objectives, risks, charges and expenses of the variable universal life insurance policy or variable annuity contract and the underlying variable investment options. This and other information is contained in the prospectus for the variable universal life policy or variable annuity contract and the underlying variable investment options. Obtain these prospectuses from your agent/registered representative and read them carefully before investing.
| | | | |
 | | VSAR-AIP | | (0609-082809) |

Semi-Annual Report
June 30, 2009
Classes ADV, I, S, and S2
ING Variable Products Index Funds
Domestic Equity Index Portfolios
| n | ING Russell™ Large Cap Index Portfolio |
| n | ING Russell™ Large Cap Growth Index Portfolio |
| n | ING Russell™ Large Cap Value Index Portfolio |
| n | ING Russell™ Mid Cap Index Portfolio |
| n | ING Russell™ Mid Cap Growth Index Portfolio |
| n | ING Russell™ Small Cap Index Portfolio |
Fixed-Income Index Portfolio
| n | ING U.S. Bond Index Portfolio (formerly, ING Lehman Brothers U.S. Aggregate Bond Index® Portfolio) |
International/Global Equity Index Portfolios
| n | ING Hang Seng Index Portfolio |
| n | ING International Index Portfolio |
| n | ING Russell™ Global Large Cap Index 75% Portfolio (formerly, ING Russell™ Global Large Cap Index 85% Portfolio) |
| n | ING WisdomTreeSM Global High-Yielding Equity Index Portfolio |
| | |
 | | E-Delivery Sign-up – details inside |
This report is submitted for general information to shareholders of the ING Funds. It is not authorized for distribution to prospective shareholders unless accompanied or preceded by a prospectus which includes details regarding the funds’ investment objectives, risks, charges, expenses and other information. This information should be read carefully.
MUTUAL FUNDS 
| |
TABLE OF CONTENTS
| | | | |
| | | |
| | Go Paperless with E-Delivery! | | |
Sign up now for on-line prospectuses, fund reports, and proxy statements. In less than five minutes, you can help reduce paper mail and lower fund costs. Just go to www.ingfunds.com, click on the E-Delivery icon from the home page, follow the directions and complete the quick 5 Steps to Enroll. You will be notified by e-mail when these communications become available on the internet. Documents that are not available on the internet will continue to be sent by mail. |
PROXY VOTING INFORMATION
A description of the policies and procedures that the Portfolios use to determine how to vote proxies related to portfolio securities is available: (1) without charge, upon request by calling Shareholder Services toll-free at (800) 992-0180; (2) on the ING Funds’ website at www.ingfunds.com; and (3) on the U.S. Securities and Exchange Commission’s (“SEC”) website at www.sec.gov. Information regarding how the Portfolios voted proxies related to portfolio securities during the most recent 12-month period ended June 30 is available without charge on the ING Funds’ website at www.ingfunds.com and on the SEC’s website at www.sec.gov.
QUARTERLY PORTFOLIO HOLDINGS
The Portfolios file their complete schedule of portfolio holdings with the SEC for the first and third quarters of each fiscal year on Form N-Q. The Portfolios’ Forms N-Q are available on the SEC’s website at www.sec.gov. The Portfolios’ Forms N-Q may be reviewed and copied at the SEC’s Public Reference Room in Washington, DC, and information on the operation of the Public Reference Room may be obtained by calling (800) SEC-0330; and is available upon request from the Portfolios by calling Shareholder Services toll-free at (800) 992-0180.
PRESIDENT’S LETTER

Dear Shareholder,
As we enter the third quarter of 2009, we look forward hopefully to the end of the recession, at least in the United States. While recent economic news can best be characterized as less bad (as opposed to good), there is a chance that recovery could begin sometime in the third quarter.
Could this be the hour before the dawn? The financial markets seem to have factored in expectations of recovery, as evidenced by recent gains. The stock market, as measured by the S&P 500® Index(1), has advanced into the mid-900 range, a substantial climb from its mid-600s low in early March. The Dow Jones Industrial Average(2) recently broke through 9,000 to reach its highest level since January of this year. As investors become less risk-averse, they are shifting back into stocks.
Should you be doing the same? The answer depends on several important factors unique to your situation: your long-term investment goals, your tolerance for risk and
your current portfolio allocation. If you made any changes to your portfolio allocation over the past year or so — perhaps in an effort to avoid losses during a time of high uncertainty or to feel more comfortable with your investments — your portfolio now may be out of alignment with your long-term goals. On the other hand, your current portfolio may now be better suited to your tolerance for risk. You may still want to reallocate your portfolio, but you should first rethink your goals in the context of the volatility you are willing to bear. This is particularly important in that the market may continue to experience periods of volatility as economic conditions stabilize and recover.
As always, we encourage you to discuss these matters thoroughly with your financial advisor before making any changes to your portfolio. Thank you for your continued confidence in ING Funds. We look forward to serving your investment needs in the future.
Sincerely,

Shaun Mathews
President & Chief Executive Officer
ING Funds
June 30, 2009
The views expressed in the President’s Letter reflect those of the President as of the date of the letter. Any such views are subject to change at any time based upon market or other conditions and ING Funds disclaims any responsibility to update such views. These views may not be relied on as investment advice and because investment decisions for an ING Fund are based on numerous factors, may not be relied on as an indication of investment intent on behalf of any ING Fund. Reference to specific company securities should not be construed as recommendations or investment advice. Consider the fund’s investment objectives, risks, and charges and expenses carefully before investing. The prospectus contains this information and other information about the fund.
International investing poses special risks including currency fluctuation, economic and political risks not found in investments that are solely domestic.
| (1) | | The S&P 500® Index is an unmanaged index that measures the performance of securities of approximately 500 of the largest companies in the United States. |
| (2) | | The Dow Jones Industrial Average is a widely followed measurement of the stock market. The average is comprised of 30 stocks that represent leading companies in major industries. |
1
MARKET PERSPECTIVE: SIX MONTHS ENDED JUNE 30, 2009
Many were hopeful as the year started that the newly elected U.S. president’s promised $1 trillion stimulus package, a federal funds rate now reduced to 0%-0.25%, and record low mortgage rates would help to put a base under slumping economies and markets. But global equities in the form of the MSCI World® Index,(1) measured in local currencies, including net reinvested dividends (“MSCI” for regions discussed below), soon resumed their slide and by March 9, 2009, the index had dropped nearly 22% for the year to date, to the previous cycle lows of late 2002. Abruptly however, markets recovered, surging by 34%, to record a gain of 4.8% for the six-month period ended June 30, 2009. Markets generally wavered somewhat at the end of the period, as the World Bank raised its estimate for the drop in global gross domestic product (“GDP”) for 2009. In currencies, the dollar was initially strong but then fell back, gaining 0.3% on the euro, 5.7% against the yen, but losing 12.4% against the pound.
While credit markets had improved since the dark days of late 2008, most banks had tightened lending standards despite large capital infusions under the Troubled Asset Relief Program (“TARP”). The problem remained the enormous volumes of distressed loans and toxic assets of indeterminate value on bank balance sheets. The Administration soon announced a Public-Private Investment Program to buy these assets up. The Federal Reserve would also expand its purchases of agency mortgage-backed securities and buy up to $300 billion in longer dated Treasuries to push mortgage interest rates lower. Another $750 billion beyond TARP would be made available. A $75 billion plan would cut mortgage payments for struggling homeowners. Much of this was set out in the president’s first budget, which projected a $1.75 trillion deficit!
While policy initiatives helped on balance, the reasons for the collective resurgence of equities after March 9, 2009 are hard to pin down. Troubled Citigroup’s claim on March 10 that the year 2009 had been profitable so far was one catalyst. More generally, the economic reports from which markets seemed to be taking heart were only improving weakly and erratically. Nonetheless they were soon being referred to as “green shoots”.
In housing, the Standard & Poor’s (“S&P”)/Case-Shiller National U.S. Home Price Index(2) of house prices in 20 cities sank a record 19% year-over-year in January. But from there the declines moderated to 18.1% in the most recent report. By the end of June 2009, sales of existing homes had risen for two months
and the proportion of distressed sales was down to about one-third, from nearly half earlier in the year.
A flimsier (but welcome) green shoot emerged in the final employment report, where May payrolls fell by the smallest number in eight months, even as the rate increased to 9.4%, a 25-year record. The fall in the 2009 first quarter GDP was revised down to 5.5% annualized, having first been reported near the 2008 fourth quarter’s decades high 6.3%.
Consumer demand was weak, evidenced by the largest annual drop in the consumer price index, 1.3%, since 1950. But the government’s stimulus plan boosted incomes by 1.4% in May 2009, sending the savings rate to 6.9%, the most in 15 years. Still, retail sales were reported higher, the first increase in three months.
U.S. fixed income markets at first sight had an undistinguished first half. The Barclays Capital U.S. Aggregate Bond Index(3) of investment grade bonds returned 1.90%. But within this figure improved risk appetite propelled the index of investment grade corporate bonds to an 8.32% gain amid surging new issuances. Conversely, the Treasury index lost 4.30%, weighed by concerns about massive government borrowing, and the excess yield on 10-year Treasuries over 2-year issues briefly reached a record 275 basis points (“bp”). The star performers however, were high yield bonds, represented by the Barclays Capital High Yield Bond—2% Issuer Constrained Index(4), which returned a remarkable 30.92%. By contrast, the yield on the 90-day Treasury Bills remained in the range of 6bp to 31bp throughout the period.
U.S. equities, represented by the S&P 500® Index,(5) including dividends, returned 3.2% in the first six months of 2009. As with stock markets generally, March 9, 2009, marked the low point for the index, closing at September 1996 levels. Profits for S&P 500® Index companies would be certain to suffer their eighth straight quarter of decline, but from March 9, 2009, investors only had eyes for green shoots and from there the market returned 36.9%, led by the financials component which soared 93.1%. The index broke through its 200-day moving average on June 1, 2009, but then drifted back, finally returning the last of the month’s gains on June 30, 2009, as a reading of consumer confidence disappointed.
In international markets, the MSCI Japan® Index(6) rose 9.2% for the six months through June 30, 2009. The slump in exports stabilized during the period and despite two consecutive quarterly falls in GDP of 3.8%, there were hopes that stimulus packages in China and
2
MARKET PERSPECTIVE: SIX MONTHS ENDED JUNE 30, 2009
in Japan itself would speed a recovery. The MSCI Europe ex UK® Index(7) added 3.8%. Despite a bigger than expected drop in GDP of 2.5% in the first quarter and the first annual decline in consumer prices for 48 years, confidence proved resilient. The European Central Bank cut rates to 1% and finally embarked on a program to lend unlimited amounts to banks for one year at this interest rate. The MSCI UK® Index(8) lost 1.3%. The Bank of England reduced rates three times, to 0.5%, the lowest since it was founded in 1694, as the UK suffered the largest annual fall in GDP, 4.9%, since records began in 1948.
(1) The MSCI World® Index is an unmanaged index that measures the performance of over 1,400 securities listed on exchanges in the U.S., Europe, Canada, Australia, New Zealand and the Far East.
(2) The S&P/Case-Shiller National U.S. Home Price Index tracks the value of single-family housing within the United States. The index is a composite of single-family home price indices for the nine U.S. Census divisions and is calculated quarterly.
(3) The Barclays Capital U.S. Aggregate Bond Index is an unmanaged index of publicly issued investment grade U.S. Government, mortgage-backed, asset-backed and corporate debt securities.
(4) The Barclays Capital High Yield Bond—2% Issuer Constrained Composite Index is an unmanaged index that measures the performance of non-investment grade fixed-income securities.
(5) The S&P 500® Index is an unmanaged index that measures the performance of securities of approximately 500 of the largest companies in the United States.
(6) The MSCI Japan® Index is a free float-adjusted market capitalization index that is designed to measure developed market equity performance in Japan.
(7) The MSCI Europe ex UK® Index is a free float-adjusted market capitalization index that is designed to measure developed market equity performance in Europe, excluding the UK.
(8) The MSCI UK® Index is a free float-adjusted market capitalization index that is designed to measure developed market equity performance in the UK.
Parentheses denote a negative number.
All indices are unmanaged and investors cannot invest directly in an index.
Past performance does not guarantee future results. The performance quoted represents past performance. Investment return and principal value of an investment will fluctuate, and shares, when redeemed, may be worth more or less than their original cost. The Portfolios’ performance is subject to change since the period’s end and may be lower or higher than the performance data shown. Please call (800) 992-0180 or log on to www.ingfunds.com to obtain performance data current to the most recent month end.
Market Perspective reflects the views of ING’s Chief Investment Risk Officer only through the end of the period, and is subject to change based on market and other conditions.
3
SHAREHOLDER EXPENSE EXAMPLES (UNAUDITED)
As a shareholder of a Portfolio, you incur two types of costs: (1) transaction costs, including redemption fees and exchange fees; and (2) ongoing costs, including management fees, distribution and/or service (12b-1) fees, and other Portfolio expenses. These Examples are intended to help you understand your ongoing costs (in dollars) of investing in a Portfolio and to compare these costs with the ongoing costs of investing in other mutual funds.
The Examples are based on an investment of $1,000 invested at the beginning of the period and held for the entire period from January 1, 2009 to June 30, 2009. The Portfolios’ expenses are shown without the imposition of any charges which are, or may be, imposed under your annuity contract. Expenses would have been higher if such charges were included.
Actual Expenses
The first section of the table shown, “Actual Portfolio Return,” provides information about actual account values and actual expenses. You may use the information in this section, together with the amount you invested, to estimate the expenses that you paid over the period. Simply divide your account value by $1,000 (for example, an $8,600 account value divided by $1,000 = 8.6), then multiply the result by the number in the first section under the heading entitled “Expenses Paid During the Period” to estimate the expenses you paid on your account during this period.
Hypothetical Example for Comparison Purposes
The second section of the table shown, “Hypothetical (5% return before expenses),” provides information about hypothetical account values and hypothetical expenses based on a Portfolio’s actual expense ratio and an assumed rate of return of 5% per year before expenses, which is not a Portfolio’s actual return. The hypothetical account values and expenses may not be used to estimate the actual ending account balance or expenses you paid for the period. You may use this information to compare the ongoing costs of investing in a Portfolio and other mutual funds. To do so, compare this 5% hypothetical example with the 5% hypothetical examples that appear in the shareholder reports of the other mutual funds.
Please note that the expenses shown in the table are meant to highlight your ongoing costs only and do not reflect any transactional costs, such as redemption fees or exchange fees. Therefore, the hypothetical lines of the table are useful in comparing ongoing costs only, and will not help you determine the relative total costs of owning different mutual funds. In addition, if these transactional costs were included, your costs would have been higher.
| | | | | | | | | | | | | | | | | | | | | | | | |
| | | Actual Portfolio Return | | Hypothetical (5% return before expenses) |
| | | Beginning
Account
Value
January 1, 2009 | | Ending Account Value June 30, 2009 | | Annualized Expense Ratio | | | Expenses Paid During the Period Ended June 30, 2009* | | Beginning
Account
Value
January 1, 2009 | | Ending Account Value June 30, 2009 | | Annualized Expense Ratio | | | Expenses Paid During the Period Ended June 30, 2009* |
ING Russell™ Large Cap Index Portfolio | | | | | | | | | | | | |
Class ADV | | $ | 1,000.00 | | $ | 1,018.10 | | 0.87 | % | | $ | 4.35 | | $ | 1,000.00 | | $ | 1,020.48 | | 0.87 | % | | $ | 4.36 |
Class I | | | 1,000.00 | | | 1,020.90 | | 0.37 | | | | 1.85 | | | 1,000.00 | | | 1,022.96 | | 0.37 | | | | 1.86 |
Class S | | | 1,000.00 | | | 1,019.40 | | 0.62 | | | | 3.10 | | | 1,000.00 | | | 1,021.72 | | 0.62 | | | | 3.11 |
Class S2(1) | | | 1,000.00 | | | 1,244.60 | | 0.78 | | | | 2.97 | | | 1,000.00 | | | 1,020.93 | | 0.78 | | | | 3.91 |
ING Russell™ Large Cap Growth Index Portfolio | | | | | | | | | | | | |
Class ADV(2) | | $ | 1,000.00 | | $ | 1,053.00 | | 1.29 | % | | $ | 2.21 | | $ | 1,000.00 | | $ | 1,018.40 | | 1.29 | % | | $ | 6.46 |
Class I(2) | | | 1,000.00 | | | 1,054.00 | | 0.79 | | | | 1.36 | | | 1,000.00 | | | 1,020.88 | | 0.79 | | | | 3.96 |
Class S(2) | | | 1,000.00 | | | 1,053.00 | | 1.04 | | | | 1.78 | | | 1,000.00 | | | 1,019.64 | | 1.04 | | | | 5.21 |
Class S2(2) | | | 1,000.00 | | | 1,053.00 | | 1.19 | | | | 2.04 | | | 1,000.00 | | | 1,018.89 | | 1.19 | | | | 5.96 |
ING Russell™ Large Cap Value Index Portfolio | | | | | | | | | | | | |
Class ADV(2) | | $ | 1,000.00 | | $ | 1,051.00 | | 1.00 | % | | $ | 1.71 | | $ | 1,000.00 | | $ | 1,019.84 | | 1.00 | % | | $ | 5.01 |
Class I(2) | | | 1,000.00 | | | 1,052.00 | | 0.50 | | | | 0.86 | | | 1,000.00 | | | 1,022.32 | | 0.50 | | | | 2.51 |
Class S(2) | | | 1,000.00 | | | 1,052.00 | | 0.75 | | | | 1.29 | | | 1,000.00 | | | 1,021.08 | | 0.75 | | | | 3.76 |
Class S2(2) | | | 1,000.00 | | | 1,052.00 | | 0.90 | | | | 1.54 | | | 1,000.00 | | | 1,020.33 | | 0.90 | | | | 4.51 |
ING Russell™ Mid Cap Index Portfolio | | | | | | | | | | | | |
Class ADV | | $ | 1,000.00 | | $ | 1,095.00 | | 0.93 | % | | $ | 4.83 | | $ | 1,000.00 | | $ | 1,020.18 | | 0.93 | % | | $ | 4.66 |
Class I | | | 1,000.00 | | | 1,099.50 | | 0.43 | | | | 2.24 | | | 1,000.00 | | | 1,022.66 | | 0.43 | | | | 2.16 |
Class S | | | 1,000.00 | | | 1,096.70 | | 0.68 | | | | 3.54 | | | 1,000.00 | | | 1,021.42 | | 0.68 | | | | 3.41 |
Class S2(1) | | | 1,000.00 | | | 1,315.20 | | 0.83 | | | | 3.26 | | | 1,000.00 | | | 1,020.68 | | 0.83 | | | | 4.16 |
| * | | Expenses are equal to each Portfolio’s respective annualized expense ratios multiplied by the average account value over the period, multiplied by 181/365 to reflect the most recent fiscal half-year. |
| (1) | | Commencement of operations was February 27, 2009. Expenses paid for the Actual Portfolio Return reflect the 124-day period ended June 30, 2009. |
| (2) | | Commencement of operations was May 1, 2009. Expenses paid for the Actual Portfolio Return reflect the 61-day period ended June 30, 2009. |
4
SHAREHOLDER EXPENSE EXAMPLES (UNAUDITED) (CONTINUED)
| | | | | | | | | | | | | | | | | | | | | | | | |
| | | Actual Portfolio Return | | Hypothetical (5% return before expenses) |
| | | Beginning
Account
Value
January 1, 2009 | | Ending
Account Value
June 30, 2009 | | Annualized Expense Ratio | | | Expenses Paid During the Period Ended June 30, 2009* | | Beginning
Account
Value
January 1, 2009 | | Ending
Account Value
June 30, 2009 | | Annualized Expense Ratio | | | Expenses Paid During the Period Ended June 30, 2009* |
ING Russell™ Mid Cap Growth Index Portfolio | | | | | | | | | | | | |
Class ADV(2) | | $ | 1,000.00 | | $ | 1,049.00 | | 1.00 | % | | $ | 1.71 | | $ | 1,000.00 | | $ | 1,019.84 | | 1.00 | % | | $ | 5.01 |
Class I(2) | | | 1,000.00 | | | 1,050.00 | | 0.50 | | | | 0.86 | | | 1,000.00 | | | 1,022.32 | | 0.50 | | | | 2.51 |
Class S(2) | | | 1,000.00 | | | 1,050.00 | | 0.75 | | | | 1.28 | | | 1,000.00 | | | 1,021.08 | | 0.75 | | | | 3.76 |
Class S2(2) | | | 1,000.00 | | | 1,049.00 | | 0.90 | | | | 1.54 | | | 1,000.00 | | | 1,020.33 | | 0.90 | | | | 4.51 |
ING Russell™ Small Cap Index Portfolio | | | | | | | | | | | | |
Class ADV | | $ | 1,000.00 | | $ | 1,022.00 | | 0.95 | % | | $ | 4.76 | | $ | 1,000.00 | | $ | 1,020.08 | | 0.95 | % | | $ | 4.76 |
Class I | | | 1,000.00 | | | 1,023.20 | | 0.45 | | | | 2.26 | | | 1,000.00 | | | 1,022.56 | | 0.45 | | | | 2.26 |
Class S | | | 1,000.00 | | | 1,022.00 | | 0.70 | | | | 3.51 | | | 1,000.00 | | | 1,021.32 | | 0.70 | | | | 3.51 |
Class S2(1) | | | 1,000.00 | | | 1,306.80 | | 0.85 | | | | 3.33 | | | 1,000.00 | | | 1,020.58 | | 0.85 | | | | 4.26 |
ING U.S. Bond Index Portfolio | | | | | | | | | | | | |
Class ADV | | $ | 1,000.00 | | $ | 1,016.70 | | 0.95 | % | | $ | 4.75 | | $ | 1,000.00 | | $ | 1,020.08 | | 0.95 | % | | $ | 4.76 |
Class I | | | 1,000.00 | | | 1,019.50 | | 0.45 | | | | 2.25 | | | 1,000.00 | | | 1,022.56 | | 0.45 | | | | 2.26 |
Class S | | | 1,000.00 | | | 1,018.00 | | 0.70 | | | | 3.50 | | | 1,000.00 | | | 1,021.32 | | 0.70 | | | | 3.51 |
Class S2(1) | | | 1,000.00 | | | 1,027.50 | | 0.85 | | | | 2.93 | | | 1,000.00 | | | 1,020.58 | | 0.85 | | | | 4.26 |
ING Hang Seng Index Portfolio | | | | | | | | | | | | |
Class ADV(3) | | $ | 1,000.00 | | $ | 1,108.00 | | 1.75 | % | | $ | 2.93 | | $ | 1,000.00 | | $ | 1,016.12 | | 1.75 | % | | $ | 8.75 |
Class I(3) | | | 1,000.00 | | | 1,109.00 | | 1.25 | | | | 2.09 | | | 1,000.00 | | | 1,018.60 | | 1.25 | | | | 6.26 |
Class S(2) | | | 1,000.00 | | | 1,109.00 | | 1.50 | | | | 2.64 | | | 1,000.00 | | | 1,017.36 | | 1.50 | | | | 7.50 |
Class S2(3) | | | 1,000.00 | | | 1,109.00 | | 1.65 | | | | 2.76 | | | 1,000.00 | | | 1,016.61 | | 1.65 | | | | 8.25 |
ING International Index Portfolio | | | | | | | | | | | | |
Class ADV | | $ | 1,000.00 | | $ | 1,052.90 | | 1.00 | % | | $ | 5.09 | | $ | 1,000.00 | | $ | 1,019.84 | | 1.00 | % | | $ | 5.01 |
Class I | | | 1,000.00 | | | 1,057.70 | | 0.50 | | | | 2.55 | | | 1,000.00 | | | 1,022.32 | | 0.50 | | | | 2.51 |
Class S | | | 1,000.00 | | | 1,056.20 | | 0.75 | | | | 3.82 | | | 1,000.00 | | | 1,021.08 | | 0.75 | | | | 3.76 |
Class S2(1) | | | 1,000.00 | | | 1,344.60 | | 0.90 | | | | 3.58 | | | 1,000.00 | | | 1,020.33 | | 0.90 | | | | 4.51 |
ING Russell™ Global LargeCap Index 75% Portfolio | | | | | | | | | | | | |
Class ADV | | $ | 1,000.00 | | $ | 1,054.50 | | 1.10 | % | | $ | 5.60 | | $ | 1,000.00 | | $ | 1,019.34 | | 1.10 | % | | $ | 5.51 |
Class I | | | 1,000.00 | | | 1,056.90 | | 0.60 | | | | 3.06 | | | 1,000.00 | | | 1,021.82 | | 0.60 | | | | 3.01 |
Class S | | | 1,000.00 | | | 1,056.90 | | 0.85 | | | | 4.33 | | | 1,000.00 | | | 1,020.58 | | 0.85 | | | | 4.26 |
ING WisdomTreeSM Global High-Yielding Equity Index Portfolio | | | | | | | | | | | | |
Class ADV | | $ | 1,000.00 | | $ | 1,030.10 | | 1.24 | % | | $ | 6.24 | | $ | 1,000.00 | | $ | 1,018.65 | | 1.24 | % | | $ | 6.21 |
Class I | | | 1,000.00 | | | 993.50 | | 0.74 | | | | 3.66 | | | 1,000.00 | | | 1,021.12 | | 0.74 | | | | 3.71 |
Class S | | | 1,000.00 | | | 1,028.40 | | 0.94 | | | | 4.73 | | | 1,000.00 | | | 1,020.13 | | 0.94 | | | | 4.71 |
| * | | Expenses are equal to each Portfolio’s respective annualized expense ratios multiplied by the average account value over the period, multiplied by 181/365 to reflect the most recent fiscal half-year. |
| (1) | | Commencement of operations was February 27, 2009. Expenses paid for the Actual Portfolio Return reflect the 124-day period ended June 30, 2009. |
| (2) | | Commencement of operations was May 1, 2009. Expenses paid for the Actual Portfolio Return reflect the 61-day period ended June 30, 2009. |
| (3) | | Commencement of operations was May 4, 2009. Expenses paid for the Actual Portfolio Return reflect the 58-day period ended June 30, 2009. |
5
SHAREHOLDER EXPENSE EXAMPLES (UNAUDITED) (CONTINUED)
Effective May 1, 2009, the contractual obligations for ING WisdomTreeSM Global High-Yielding Equity Index Portfolio have changed. If these changes had been in place during the entire six-month period, actual and hypothetical ending account balances annualized expense ratio and expenses paid would have been as follows:
| | | | | | | | | | | | |
ING WisdomTreeSM Global High-Yielding Equity Index Portfolio | | Beginning
Account
Value
January 1, 2009 | | Ending Account Value June 30, 2009 | | Annualized Expense Ratio (adjusted for contractual changes) | | | Expenses Paid During the Six Months Ended June 30, 2009** |
Actual Fund Return |
Class ADV | | $ | 1,000.00 | | $ | 1,030.10 | | 1.34 | % | | $ | 6.74 |
Class I | | | 1,000.00 | | | 993.50 | | 0.84 | | | | 4.15 |
Class S | | | 1,000.00 | | | 1,028.40 | | 1.09 | | | | 5.48 |
Hypothetical (5% return before expenses) |
Class ADV | | $ | 1,000.00 | | $ | 1,018.15 | | 1.34 | % | | $ | 6.71 |
Class I | | | 1,000.00 | | | 1,020.63 | | 0.84 | | | | 4.21 |
Class S | | | 1,000.00 | | | 1,019.39 | | 1.09 | | | | 5.46 |
| ** | | Expenses are equal to each Fund’s respective annualized expense ratios, adjusted for contractual changes, multiplied by the average account value over the period, multiplied by 181/365 to reflect the most recent fiscal half-year. |
6
STATEMENTS OF ASSETS AND LIABILITIESASOF JUNE 30, 2009 (UNAUDITED)
| | | | | | | | | | | | | | |
| | | ING RussellTM Large Cap Index Portfolio | | | ING RussellTM Large Cap Growth Index Portfolio | | ING RussellTM Large Cap Value Index Portfolio | | ING RussellTM Mid Cap Index
Portfolio | |
ASSETS: | | | | | | | | | | | | | | |
Investments in securities at value+* | | $ | 1,384,426,962 | | | $ | 11,303,112 | | $ | 78,861,860 | | $ | 345,818,703 | |
Short-term investments** | | | — | | | | — | | | — | | | 10,725,208 | |
Short-term investments in affiliates*** | | | 96,354,000 | | | | 821,000 | | | 2,069,000 | | | 90,590,000 | |
Cash | | | 916,602 | | | | 3,616 | | | 19,001 | | | 201,944 | |
Cash collateral for futures | | | 4,345,712 | | | | 19,418 | | | 189,675 | | | 936,809 | |
Receivables: | | | | | | | | | | | | | | |
Investment securities sold | | | 15,938,316 | | | | 2,112,668 | | | 15,532,784 | | | 25,890,075 | |
Fund shares sold | | | 225,070 | | | | 15 | | | 3,577 | | | 150,248 | |
Dividends and interest | | | 1,822,969 | | | | 14,507 | | | 108,151 | | | 389,569 | |
Prepaid expenses | | | 12,393 | | | | 15,825 | | | 15,825 | | | 2,413 | |
Reimbursement due from manager | | | 22,421 | | | | — | | | — | | | — | |
| | | | | | | | | | | | | | |
Total assets | | | 1,504,064,445 | | | | 14,290,161 | | | 96,799,873 | | | 474,704,969 | |
| | | | | | | | | | | | | | |
LIABILITIES: | | | | | | | | | | | | | | |
Payable for investment securities purchased | | | 68,344,558 | | | | 2,718,147 | | | 15,737,347 | | | 107,430,148 | |
Payable for fund shares redeemed | | | 13,782 | | | | 4,734 | | | 2 | | | 2,039,854 | |
Payable upon receipt of securities loaned | | | — | | | | — | | | — | | | 10,778,976 | |
Payable to affiliates | | | 417,985 | | | | 4,348 | | | 30,229 | | | 104,866 | |
Payable for directors fees | | | 521 | | | | 257 | | | 337 | | | 47 | |
Other accrued expenses and liabilities | | | 81,125 | | | | 20,999 | | | 21,704 | | | 31,160 | |
| | | | | | | | | | | | | | |
Total liabilities | | | 68,857,971 | | | | 2,748,485 | | | 15,789,619 | | | 120,385,051 | |
| | | | | | | | | | | | | | |
NET ASSETS | | $ | 1,435,206,474 | | | $ | 11,541,676 | | $ | 81,010,254 | | $ | 354,319,918 | |
| | | | | | | | | | | | | | |
NET ASSETS WERE COMPRISED OF: | | | | | | | | | | | | | | |
Paid-in capital | | $ | 1,706,575,221 | | | $ | 10,976,143 | | $ | 77,085,228 | | $ | 411,933,945 | |
Undistributed net investment income | | | 14,133,512 | | | | 29,320 | | | 325,501 | | | 1,572,227 | |
Accumulated net realized gain (loss) on investments and futures | | | (55,578,542 | ) | | | 82,632 | | | 765,006 | | | (17,781,815 | ) |
Net unrealized appreciation or depreciation on investments and futures | | | (229,923,717 | ) | | | 453,581 | | | 2,834,519 | | | (41,404,439 | ) |
| | | | | | | | | | | | | | |
NET ASSETS | | $ | 1,435,206,474 | | | $ | 11,541,676 | | $ | 81,010,254 | | $ | 354,319,918 | |
| | | | | | | | | | | | | | |
| | | | | | | | | | | | | | |
+ Including securities loaned at value | | $ | — | | | $ | — | | $ | — | | $ | 10,180,908 | |
* Cost of investments in securities | | $ | 1,613,504,008 | | | $ | 10,854,197 | | $ | 76,005,198 | | $ | 386,995,210 | |
** Cost of short-term investments | | $ | — | | | $ | — | | $ | — | | $ | 10,778,976 | |
*** Cost of short-term investments in affiliates | | $ | 96,354,000 | | | $ | 821,000 | | $ | 2,069,000 | | $ | 90,590,000 | |
See Accompanying Notes to Financial Statements
7
STATEMENTS OF ASSETS AND LIABILITIESASOF JUNE 30, 2009 (UNAUDITED) (CONTINUED)
| | | | | | | | | | | | |
| | | ING RussellTM Large Cap Index Portfolio | | ING RussellTM Large Cap Growth Index Portfolio | | ING RussellTM Large Cap Value Index Portfolio | | ING RussellTM Mid Cap Index Portfolio |
Class ADV: | | | | | | | | | | | | |
Net assets | | $ | 2,542,295 | | $ | 3,170 | | $ | 3,165 | | $ | 742,099 |
Shares authorized | | | 100,000,000 | | | 100,000,000 | | | 100,000,000 | | | 100,000,000 |
Par value | | $ | 0.001 | | $ | 0.001 | | $ | 0.001 | | $ | 0.001 |
Shares outstanding | | | 347,285 | | | 301 | | | 301 | | | 102,218 |
Net asset value and redemption price per share | | $ | 7.32 | | $ | 10.53 | | $ | 10.51 | | $ | 7.26 |
Class I: | | | | | | | | | | | | |
Net assets | | $ | 1,381,762,953 | | $ | 10,773,810 | | $ | 80,073,854 | | $ | 299,011,018 |
Shares authorized | | | 300,000,000 | | | 100,000,000 | | | 100,000,000 | | | 100,000,000 |
Par value | | $ | 0.001 | | $ | 0.001 | | $ | 0.001 | | $ | 0.001 |
Shares outstanding | | | 187,791,999 | | | 1,022,121 | | | 7,610,244 | | | 41,032,398 |
Net asset value and redemption price per share | | $ | 7.36 | | $ | 10.54 | | $ | 10.52 | | $ | 7.29 |
Class S: | | | | | | | | | | | | |
Net assets | | $ | 50,897,493 | | $ | 761,525 | | $ | 930,070 | | $ | 54,562,854 |
Shares authorized | | | 100,000,000 | | | 100,000,000 | | | 100,000,000 | | | 100,000,000 |
Par value | | $ | 0.001 | | $ | 0.001 | | $ | 0.001 | | $ | 0.001 |
Shares outstanding | | | 6,932,103 | | | 72,307 | | | 88,388 | | | 7,510,619 |
Net asset value and redemption price per share | | $ | 7.34 | | $ | 10.53 | | $ | 10.52 | | $ | 7.26 |
Class S2: | | | | | | | | | | | | |
Net assets | | $ | 3,733 | | $ | 3,171 | | $ | 3,165 | | $ | 3,947 |
Shares authorized | | | 100,000,000 | | | 100,000,000 | | | 100,000,000 | | | 100,000,000 |
Par value | | $ | 0.001 | | $ | 0.001 | | $ | 0.001 | | $ | 0.001 |
Shares outstanding | | | 509 | | | 301 | | | 301 | | | 543 |
Net asset value and redemption price per share | | $ | 7.33 | | $ | 10.53 | | $ | 10.51 | | $ | 7.26 |
See Accompanying Notes to Financial Statements
8
STATEMENTS OF ASSETS AND LIABILITIESASOF JUNE 30, 2009 (UNAUDITED)
| | | | | | | | | | | | | |
| | | ING RussellTM Mid Cap Growth Index Portfolio | | ING RussellTM Small Cap Index Portfolio | | | ING U.S. Bond Index Portfolio | | ING Hang Seng Index Portfolio |
ASSETS: | | | | | | | | | | | | | |
Investments in securities at value+* | | $ | 68,048,821 | | $ | 249,158,416 | | | $ | 1,093,849,074 | | $ | 9,182,648 |
Short-term investments** | | | — | | | 21,180,127 | | | | 59,929,380 | | | — |
Short-term investments in affiliates*** | | | 2,497,000 | | | 5,543,000 | | | | 160,786,392 | | | 1,021,000 |
Cash | | | 9,461 | | | 2,564,351 | | | | 109,322 | | | 360 |
Cash collateral for futures | | | 292,554 | | | 858,812 | | | | — | | | 4,920 |
Foreign currencies at value**** | | | — | | | — | | | | — | | | 239,229 |
Receivables: | | | | | | | | | | | | | |
Investment securities sold | | | 20,315,556 | | | 31,562,284 | | | | 24,701,808 | | | — |
Fund shares sold | | | 818,877 | | | 84,032 | | | | 513,411 | | | 807,760 |
Dividends and interest | | | 49,779 | | | 254,797 | | | | 7,685,278 | | | 33,960 |
Prepaid expenses | | | 15,825 | | | 3,320 | | | | 3,678 | | | 16,033 |
Reimbursement due from manager | | | — | | | 8,198 | | | | — | | | — |
| | | | | | | | | | | | | |
Total assets | | | 92,047,873 | | | 311,217,337 | | | | 1,347,578,343 | | | 11,305,910 |
| | | | | | | | | | | | | |
LIABILITIES: | | | | | | | | | | | | | |
Payable for investment securities purchased | | | 20,277,613 | | | 36,233,925 | | | | 213,408,293 | | | — |
Payable for fund shares redeemed | | | 10,353 | | | 1,272,644 | | | | 433,160 | | | — |
Payable upon receipt of securities loaned | | | — | | | 21,280,593 | | | | — | | | — |
Payable to affiliates | | | 26,440 | | | 111,384 | | | | 408,406 | | | 6,304 |
Payable for directors fees | | | 242 | | | 686 | | | | 568 | | | 85 |
Other accrued expenses and liabilities | | | 20,674 | | | 45,027 | | | | 9,072 | | | 22,429 |
Payable for licensing fees | | | — | | | — | | | | — | | | 463 |
| | | | | | | | | | | | | |
Total liabilities | | | 20,335,322 | | | 58,944,259 | | | | 214,259,499 | | | 29,281 |
| | | | | | | | | | | | | |
NET ASSETS | | $ | 71,712,551 | | $ | 252,273,078 | | | $ | 1,133,318,844 | | $ | 11,276,629 |
| | | | | | | | | | | | | |
NET ASSETS WERE COMPRISED OF: | | | | | | | | | | | | | |
Paid-in capital | | $ | 68,417,422 | | $ | 319,407,402 | | | $ | 1,111,974,758 | | $ | 10,659,782 |
Undistributed net investment income | | | 106,818 | | | 1,463,447 | | | | 6,797,914 | | | 56,197 |
Accumulated net realized gain (loss) on investments, foreign currency related transactions, and futures | | | 772,706 | | | (21,130,457 | ) | | | 1,506,198 | | | 19,053 |
Net unrealized appreciation or depreciation on investments, foreign currency related transactions, and futures | | | 2,415,605 | | | (47,467,314 | ) | | | 13,039,974 | | | 541,597 |
| | | | | | | | | | | | | |
NET ASSETS | | $ | 71,712,551 | | $ | 252,273,078 | | | $ | 1,133,318,844 | | $ | 11,276,629 |
| | | | | | | | | | | | | |
| | | | | | | | | | | | | |
+ Including securities loaned at value | | $ | — | | $ | 20,336,828 | | | $ | — | | $ | — |
* Cost of investments in securities | | $ | 65,566,069 | | $ | 296,587,765 | | | $ | 1,080,830,746 | | $ | 8,659,456 |
** Cost of short-term investments | | $ | — | | $ | 21,280,593 | | | $ | 59,907,734 | | $ | — |
*** Cost of short-term investments in affiliates | | $ | 2,497,000 | | $ | 5,543,000 | | | $ | 160,786,392 | | $ | 1,021,000 |
****Cost of foreign currencies | | $ | — | | $ | — | | | $ | — | | $ | 239,224 |
See Accompanying Notes to Financial Statements
9
STATEMENTS OF ASSETS AND LIABILITIESASOF JUNE 30, 2009 (UNAUDITED) (CONTINUED)
| | | | | | | | | | | | |
| | | ING RussellTM Mid Cap Growth Index Portfolio | | ING RussellTM Small Cap Index Portfolio | | ING U.S. Bond Index Portfolio | | ING Hang Seng Index Portfolio |
Class ADV: | | | | | | | | | | | | |
Net assets | | $ | 3,159 | | $ | 743,049 | | $ | 943,801 | | $ | 3,336 |
Shares authorized | | | 100,000,000 | | | 100,000,000 | | | 100,000,000 | | | 100,000,000 |
Par value | | $ | 0.001 | | $ | 0.001 | | $ | 0.001 | | $ | 0.001 |
Shares outstanding | | | 301 | | | 94,207 | | | 92,087 | | | 301 |
Net asset value and redemption price per share | | $ | 10.50 | | $ | 7.89 | | $ | 10.25 | | $ | 11.08 |
Class I: | | | | | | | | | | | | |
Net assets | | $ | 69,403,753 | | $ | 155,128,762 | | $ | 847,070,196 | | $ | 3,339 |
Shares authorized | | | 100,000,000 | | | 100,000,000 | | | 100,000,000 | | | 100,000,000 |
Par value | | $ | 0.001 | | $ | 0.001 | | $ | 0.001 | | $ | 0.001 |
Shares outstanding | | | 6,609,318 | | | 19,572,021 | | | 82,509,273 | | | 301 |
Net asset value and redemption price per share | | $ | 10.50 | | $ | 7.93 | | $ | 10.27 | | $ | 11.09 |
Class S: | | | | | | | | | | | | |
Net assets | | $ | 2,284,606 | | $ | 96,397,345 | | $ | 285,301,770 | | $ | 11,266,617 |
Shares authorized | | | 100,000,000 | | | 100,000,000 | | | 100,000,000 | | | 100,000,000 |
Par value | | $ | 0.001 | | $ | 0.001 | | $ | 0.001 | | $ | 0.001 |
Shares outstanding | | | 217,640 | | | 12,196,018 | | | 27,861,730 | | | 1,016,181 |
Net asset value and redemption price per share | | $ | 10.50 | | $ | 7.90 | | $ | 10.24 | | $ | 11.09 |
Class S2: | | | | | | | | | | | | |
Net assets | | $ | 21,033 | | $ | 3,922 | | $ | 3,077 | | $ | 3,337 |
Shares authorized | | | 100,000,000 | | | 100,000,000 | | | 100,000,000 | | | 100,000,000 |
Par value | | $ | 0.001 | | $ | 0.001 | | $ | 0.001 | | $ | 0.001 |
Shares outstanding | | | 2,004 | | | 498 | | | 301 | | | 301 |
Net asset value and redemption price per share | | $ | 10.50 | | $ | 7.88 | | $ | 10.22 | | $ | 11.09 |
See Accompanying Notes to Financial Statements
10
STATEMENTS OF ASSETS AND LIABILITIESASOF JUNE 30, 2009 (UNAUDITED)
| | | | | | | | | | | | |
| | | ING International Index Portfolio | | | ING RussellTM Global Large Cap Index 75% Portfolio | | | ING WisdomTreeSM Global High-Yielding Equity Index Portfolio | |
ASSETS: | | | | | | | | | | | | |
Investments in securities at value* | | $ | 499,615,049 | | | $ | 53,631,617 | | | $ | 166,948,716 | |
Short-term investments in affiliates** | | | 4,666,000 | | | | 562,000 | | | | — | |
Cash | | | 2,231 | | | | 42,055 | | | | 19,472 | |
Cash collateral for futures | | | 545,484 | | | | — | | | | — | |
Foreign currencies at value*** | | | 64,160,600 | | | | 35,232 | | | | 679,464 | |
Receivables: | | | | | | | | | | | | |
Investment securities sold | | | — | | | | 798,491 | | | | — | |
Fund shares sold | | | 1,592,613 | | | | 19,035 | | | | — | |
Dividends and interest | | | 1,316,571 | | | | 95,359 | | | | 774,701 | |
Prepaid expenses | | | 4,143 | | | | 13,942 | | | | 2,551 | |
Reimbursement due from manager | | | 29,427 | | | | — | | | | — | |
| | | | | | | | | | | | |
Total assets | | | 571,932,118 | | | | 55,197,731 | | | | 168,424,904 | |
| | | | | | | | | | | | |
LIABILITIES: | | | | | | | | | | | | |
Payable for investment securities purchased | | | 43,732,641 | | | | 1,225,797 | | | | 174,819 | |
Payable for fund shares redeemed | | | 332,637 | | | | — | | | | 593,088 | |
Payable to affiliates | | | 191,422 | | | | 66,539 | | | | 120,487 | |
Payable for directors fees | | | 742 | | | | 12,235 | | | | 4,185 | |
Other accrued expenses and liabilities | | | 129,107 | | | | 110,306 | | | | 157,613 | |
Payable for borrowings against line of credit | | | — | | | | — | | | | 120,000 | |
Payable for licensing fees | | | — | | | | — | | | | 75,077 | |
| | | | | | | | | | | | |
Total liabilities | | | 44,386,549 | | | | 1,414,877 | | | | 1,245,269 | |
| | | | | | | | | | | | |
NET ASSETS | | $ | 527,545,569 | | | $ | 53,782,854 | | | $ | 167,179,635 | |
| | | | | | | | | | | | |
NET ASSETS WERE COMPRISED OF: | | | | | | | | | | | | |
Paid-in capital | | $ | 647,007,308 | | | $ | 59,906,278 | | | $ | 244,866,159 | |
Undistributed net investment income | | | 5,976,122 | | | | 607,378 | | | | 4,158,152 | |
Accumulated net realized loss on investments, foreign currency related transactions, and futures | | | (13,264,011 | ) | | | (2,323,133 | ) | | | (44,248,964 | ) |
Net unrealized depreciation on investments, foreign currency related transactions, and futures | | | (112,173,850 | ) | | | (4,407,669 | ) | | | (37,595,712 | ) |
| | | | | | | | | | | | |
NET ASSETS | | $ | 527,545,569 | | | $ | 53,782,854 | | | $ | 167,179,635 | |
| | | | | | | | | | | | |
| | | | | | | | | | | | |
* Cost of investments in securities | | $ | 612,153,445 | | | $ | 58,042,919 | | | $ | 204,559,886 | |
** Cost of short-term investments in affiliates | | $ | 4,666,000 | | | $ | 562,000 | | | $ | — | |
*** Cost of foreign currencies | | $ | 63,533,440 | | | $ | 33,636 | | | $ | 677,877 | |
See Accompanying Notes to Financial Statements
11
STATEMENTS OF ASSETS AND LIABILITIESASOF JUNE 30, 2009 (UNAUDITED) (CONTINUED)
| | | | | | | | | |
| | | ING International Index Portfolio | | ING RussellTM Global Large Cap Index 75% Portfolio | | ING WisdomTreeSM Global High-Yielding Equity Index Portfolio |
Class ADV: | | | | | | | | | |
Net assets | | $ | 280,619 | | $ | 2,562 | | $ | 623 |
Shares authorized | | | 100,000,000 | | | 100,000,000 | | | 100,000,000 |
Par value | | $ | 0.001 | | $ | 0.001 | | $ | 0.001 |
Shares outstanding | | | 41,427 | | | 301 | | | 101 |
Net asset value and redemption price per share | | $ | 6.77 | | $ | 8.51 | | $ | 6.17 |
Class I: | | | | | | | | | |
Net assets | | $ | 507,572,971 | | $ | 2,570 | | $ | 6 |
Shares authorized | | | 100,000,000 | | | 100,000,000 | | | 100,000,000 |
Par value | | $ | 0.001 | | $ | 0.001 | | $ | 0.001 |
Shares outstanding | | | 74,810,169 | | | 301 | | | 1 |
Net asset value and redemption price per share | | $ | 6.78 | | $ | 8.54 | | $ | 6.15 |
Class S: | | | | | | | | | |
Net assets | | $ | 19,687,948 | | $ | 53,777,722 | | $ | 167,179,006 |
Shares authorized | | | 100,000,000 | | | 100,000,000 | | | 100,000,000 |
Par value | | $ | 0.001 | | $ | 0.001 | | $ | 0.001 |
Shares outstanding | | | 2,909,977 | | | 6,293,078 | | | 27,195,846 |
Net asset value and redemption price per share | | $ | 6.77 | | $ | 8.55 | | $ | 6.15 |
Class S2: | | | | | | | | | |
Net assets | | $ | 4,031 | | | n/a | | | n/a |
Shares authorized | | | 100,000,000 | | | n/a | | | n/a |
Par value | | $ | 0.001 | | | n/a | | | n/a |
Shares outstanding | | | 594 | | | n/a | | | n/a |
Net asset value and redemption price per share | | $ | 6.79 | | | n/a | | | n/a |
See Accompanying Notes to Financial Statements
12
STATEMENTS OF OPERATIONS (UNAUDITED)
| | | | | | | | | | | | | | | | |
| | | ING RussellTM Large Cap Index Portfolio Six Months Ended June 30, 2009 | | | ING RussellTM Large Cap Growth Index Portfolio May 1, 2009(2) to June 30, 2009 | | | ING RussellTM Large Cap Value Index Portfolio May 1, 2009(2) to June 30, 2009 | | | ING RussellTM Mid Cap Index Portfolio Six Months Ended June 30, 2009 | |
INVESTMENT INCOME: | | | | | | | | | | | | | | | | |
Dividends, net of foreign taxes withheld*(1) | | $ | 16,447,061 | | | $ | 43,002 | | | $ | 388,735 | | | $ | 1,891,403 | |
Interest | | | 215 | | | | — | | | | — | | | | 25 | |
Securities lending income | | | — | | | | — | | | | — | | | | 105,457 | |
| | | | | | | | | | | | | | | | |
Total investment income | | | 16,447,276 | | | | 43,002 | | | | 388,735 | | | | 1,996,885 | |
| | | | | | | | | | | | | | | | |
EXPENSES: | | | | | | | | | | | | | | | | |
Investment management fees | | | 1,523,632 | | | | 7,734 | | | | 56,929 | | | | 272,524 | |
Distribution and service fees: | | | | | | | | | | | | | | | | |
Class ADV | | | 3,440 | | | | 2 | | | | 2 | | | | 576 | |
Class S | | | 49,144 | | | | 166 | | | | 200 | | | | 46,687 | |
Class S2 | | | 6 | | | | 2 | | | | 2 | | | | 6 | |
Transfer agent fees | | | 1,113 | | | | 20 | | | | 22 | | | | 330 | |
Administrative service fees | | | 609,448 | | | | 1,719 | | | | 12,651 | | | | 87,910 | |
Shareholder reporting expense | | | 34,179 | | | | 362 | | | | 523 | | | | 3,009 | |
Registration fees | | | — | | | | 42 | | | | 42 | | | | — | |
Professional fees | | | 131,698 | | | | 1,046 | | | | 1,284 | | | | 17,246 | |
Custody and accounting expense | | | 52,747 | | | | 522 | | | | 682 | | | | 16,531 | |
Directors fees | | | 58,071 | | | | 257 | | | | 337 | | | | 5,234 | |
Offering expense | | | 2,980 | | | | 3,175 | | | | 3,175 | | | | 2,607 | |
Miscellaneous expense | | | 35,463 | | | | 451 | | | | 531 | | | | 8,252 | |
Interest expense | | | 125 | | | | — | | | | — | | | | 62 | |
| | | | | | | | | | | | | | | | |
Total expenses | | | 2,502,046 | | | | 15,498 | | | | 76,380 | | | | 460,974 | |
Net waived and reimbursed fees | | | (194,953 | ) | | | (1,816 | ) | | | (13,146 | ) | | | (36,316 | ) |
| | | | | | | | | | | | | | | | |
Net expenses | | | 2,307,093 | | | | 13,682 | | | | 63,234 | | | | 424,658 | |
| | | | | | | | | | | | | | | | |
Net investment income | | | 14,140,183 | | | | 29,320 | | | | 325,501 | | | | 1,572,227 | |
| | | | | | | | | | | | | | | | |
REALIZED AND UNREALIZED GAIN (LOSS) ON INVESTMENTS AND FUTURES: | | | | | | | | | | | | | | | | |
Net realized gain (loss) on: | | | | | | | | | | | | | | | | |
Investments | | | (29,502,887 | ) | | | 76,800 | | | | 726,958 | | | | (3,980,274 | ) |
Futures | | | 8,362,350 | | | | 5,832 | | | | 38,048 | | | | 508,973 | |
| | | | | | | | | | | | | | | | |
Net realized gain (loss) on investments and futures | | | (21,140,537 | ) | | | 82,632 | | | | 765,006 | | | | (3,471,301 | ) |
| | | | | | | | | | | | | | | | |
Net change in unrealized appreciation or depreciation on: | | | | | | | | | | | | | | | | |
Investments | | | 56,307,843 | | | | 448,915 | | | | 2,856,662 | | | | 22,719,618 | |
Futures | | | (1,903,082 | ) | | | 4,666 | | | | (22,143 | ) | | | (433,987 | ) |
| | | | | | | | | | | | | | | | |
Net change in unrealized appreciation or depreciation on investments and futures | | | 54,404,761 | | | | 453,581 | | | | 2,834,519 | | | | 22,285,631 | |
| | | | | | | | | | | | | | | | |
Net realized and unrealized gain on investments and futures | | | 33,264,224 | | | | 536,213 | | | | 3,599,525 | | | | 18,814,330 | |
| | | | | | | | | | | | | | | | |
Increase in net assets resulting from operations | | $ | 47,404,407 | | | $ | 565,533 | | | $ | 3,925,026 | | | $ | 20,386,557 | |
| | | | | | | | | | | | | | | | |
| | | | | | | | | | | | | | | | |
* Foreign taxes withheld | | $ | 7,716 | | | $ | 117 | | | $ | — | | | $ | 174 | |
(1) Dividends from affiliates | | $ | 70,511 | | | $ | 289 | | | $ | 1,465 | | | $ | 12,452 | |
(2) Commencement of operations | | | | | | | | | | | | | | | | |
See Accompanying Notes to Financial Statements
13
STATEMENTS OF OPERATIONS (UNAUDITED)
| | | | | | | | | | | | | | | |
| | | ING RussellTM Mid Cap Growth Index Portfolio May 1, 2009(2) to June 30, 2009 | | | ING RussellTM Small Cap Index Portfolio Six Months Ended June 30, 2009 | | | ING U.S. Bond Index Portfolio Six Months Ended June 30, 2009 | | ING Hang Seng Index Portfolio May 1, 2009(2) to June 30, 2009 | |
INVESTMENT INCOME: | | | | | | | | | | | | | | | |
Dividends, net of foreign taxes withheld*(1) | | $ | 160,972 | | | $ | 1,735,818 | | | $ | 128,365 | | $ | 71,974 | |
Interest | | | — | | | | 139 | | | | 11,391,341 | | | 1,424 | |
Securities lending income | | | — | | | | 214,437 | | | | — | | | — | |
| | | | | | | | | | | | | | | |
Total investment income | | | 160,972 | | | | 1,950,394 | | | | 11,519,706 | | | 73,398 | |
| | | | | | | | | | | | | | | |
EXPENSES: | | | | | | | | | | | | | | | |
Investment management fees | | | 48,781 | | | | 354,581 | | | | 1,002,281 | | | 6,951 | |
Distribution and service fees: | | | | | | | | | | | | | | | |
Class ADV | | | 2 | | | | 1,306 | | | | 996 | | | 2 | |
Class S | | | 348 | | | | 96,198 | | | | 310,656 | | | 2,752 | |
Class S2 | | | 10 | | | | 6 | | | | 5 | | | 2 | |
Transfer agent fees | | | 65 | | | | 444 | | | | 400 | | | 92 | |
Administrative service fees | | | 10,840 | | | | 107,448 | | | | 313,211 | | | 1,158 | |
Shareholder reporting expense | | | 250 | | | | 2,220 | | | | 1,729 | | | 534 | |
Registration fees | | | 58 | | | | — | | | | — | | | 85 | |
Professional fees | | | 709 | | | | 19,055 | | | | 20,409 | | | 1,967 | |
Custody and accounting expense | | | 572 | | | | 37,891 | | | | 23,062 | | | 1,162 | |
Directors fees | | | 242 | | | | 7,938 | | | | 15,698 | | | 85 | |
Offering expense | | | 3,175 | | | | 2,607 | | | | — | | | 2,967 | |
Miscellaneous expense | | | 460 | | | | 9,546 | | | | 9,333 | | | 298 | |
Interest expense | | | — | | | | 66 | | | | — | | | — | |
Licensing fees | | | — | | | | — | | | | — | | | 463 | |
| | | | | | | | | | | | | | | |
Total expenses | | | 65,512 | | | | 639,306 | | | | 1,697,780 | | | 18,518 | |
Net waived and reimbursed fees | | | (11,358 | ) | | | (57,999 | ) | | | 15,789 | | | (1,317 | ) |
| | | | | | | | | | | | | | | |
Net expenses | | | 54,154 | | | | 581,307 | | | | 1,713,569 | | | 17,201 | |
| | | | | | | | | | | | | | | |
Net investment income | | | 106,818 | | | | 1,369,087 | | | | 9,806,137 | | | 56,197 | |
| | | | | | | | | | | | | | | |
REALIZED AND UNREALIZED GAIN (LOSS) ON INVESTMENTS, FOREIGN CURRENCY RELATED TRANSACTIONS, AND FUTURES | | | | | | | | | | | | | | | |
Net realized gain (loss) on: | | | | | | | | | | | | | | | |
Investments | | | 670,098 | | | | (8,427,691 | ) | | | 131,083 | | | (29,331 | ) |
Foreign currency related transactions | | | — | | | | — | | | | — | | | (92 | ) |
Futures | | | 102,608 | | | | (524,142 | ) | | | — | | | 48,476 | |
| | | | | | | | | | | | | | | |
Net realized gain (loss) on investments, foreign currency related transactions, and futures | | | 772,706 | | | | (8,951,833 | ) | | | 131,083 | | | 19,053 | |
| | | | | | | | | | | | | | | |
Net change in unrealized appreciation or depreciation on: | | | | | | | | | | | | | | | |
Investments | | | 2,482,752 | | | | 15,595,437 | | | | 10,622,228 | | | 523,192 | |
Foreign currency related transactions | | | — | | | | — | | | | — | | | 6 | |
Futures | | | (67,147 | ) | | | (296,876 | ) | | | — | | | 18,399 | |
| | | | | | | | | | | | | | | |
Net change in unrealized appreciation or depreciation on investments, foreign currency related transactions, and futures | | | 2,415,605 | | | | 15,298,561 | | | | 10,622,228 | | | 541,597 | |
| | | | | | | | | | | | | | | |
Net realized and unrealized gain on investments, foreign currency related transactions, and futures | | | 3,188,311 | | | | 6,346,728 | | | | 10,753,311 | | | 560,650 | |
| | | | | | | | | | | | | | | |
Increase in net assets resulting from operations | | $ | 3,295,129 | | | $ | 7,715,815 | | | $ | 20,559,448 | | $ | 616,847 | |
| | | | | | | | | | | | | | | |
| | | | | | | | | | | | | | | |
* Foreign taxes withheld | | $ | — | | | $ | 350 | | | $ | — | | $ | 5,827 | |
(1) Dividends from affiliates | | $ | 1,550 | | | $ | 12,202 | | | $ | 128,365 | | $ | 500 | |
(2) Commencement of operations | | | | | | | | | | | | | | | |
See Accompanying Notes to Financial Statements
14
STATEMENTS OF OPERATIONSFORTHE SIX MONTHS ENDED JUNE 30, 2009 (UNAUDITED)
| | | | | | | | | | | | |
| | | ING International Index Portfolio | | | ING RussellTM Global Large Cap Index 75% Portfolio | | | ING WisdomTreeSM Global High-Yielding Equity Index Portfolio | |
INVESTMENT INCOME: | | | | | | | | | | | | |
Dividends, net of foreign taxes withheld*(1) | | $ | 6,636,790 | | | $ | 638,316 | | | $ | 4,625,040 | |
Interest | | | 90,603 | | | | 161,026 | | | | 230,213 | |
| | | | | | | | | | | | |
Total investment income | | | 6,727,393 | | | | 799,342 | | | | 4,855,253 | |
| | | | | | | | | | | | |
EXPENSES: | | | | | | | | | | | | |
Investment management fees | | | 560,166 | | | | 103,948 | | | | 342,395 | |
Distribution and service fees: | | | | | | | | | | | | |
Class ADV | | | 238 | | | | 6 | | | | — | |
Class S | | | 14,472 | | | | 56,488 | | | | 186,084 | |
Class S2 | | | 6 | | | | — | | | | — | |
Transfer agent fees | | | 385 | | | | 266 | | | | 610 | |
Administrative service fees | | | 147,410 | | | | 22,597 | | | | 74,433 | |
Shareholder reporting expense | | | 4,408 | | | | 3,695 | | | | 14,677 | |
Registration fees | | | — | | | | 181 | | | | — | |
Professional fees | | | 21,792 | | | | 18,265 | | | | 18,750 | |
Custody and accounting expense | | | 157,110 | | | | 58,683 | | | | 57,627 | |
Directors fees | | | 12,660 | | | | 933 | | | | 6,516 | |
Offering expense | | | 2,607 | | | | 30,251 | | | | 5,134 | |
Miscellaneous expense | | | 12,741 | | | | 3,253 | | | | 9,827 | |
Interest expense | | | 217 | | | | 118 | | | | 1,869 | |
Licensing fees | | | — | | | | — | | | | 138,941 | |
| | | | | | | | | | | | |
Total expenses | | | 934,212 | | | | 298,684 | | | | 856,863 | |
Net waived and reimbursed fees | | | (179,552 | ) | | | (106,369 | ) | | | (159,762 | ) |
| | | | | | | | | | | | |
Net expenses | | | 754,660 | | | | 192,315 | | | | 697,101 | |
| | | | | | | | | | | | |
Net investment income | | | 5,972,733 | | | | 607,027 | | | | 4,158,152 | |
| | | | | | | | | | | | |
REALIZED AND UNREALIZED GAIN (LOSS) ON INVESTMENTS, FOREIGN CURRENCY RELATED TRANSACTIONS, AND FUTURES | | | | | | | | | | | | |
Net realized gain (loss) on: | | | | | | | | | | | | |
Investments | | | (7,209,911 | ) | | | (1,710,299 | ) | | | (30,196,935 | ) |
Foreign currency related transactions | | | (40,243 | ) | | | 16,565 | | | | 2,996 | |
Futures | | | 1,359,002 | | | | — | | | | — | |
| | | | | | | | | | | | |
Net realized loss on investments, foreign currency related transactions, and futures | | | (5,891,152 | ) | | | (1,693,734 | ) | | | (30,193,939 | ) |
| | | | | | | | | | | | |
Net change in unrealized appreciation or depreciation on: | | | | | | | | | | | | |
Investments | | | 26,287,998 | | | | 4,331,405 | | | | 32,387,368 | |
Foreign currency related transactions | | | 653,139 | | | | 10,760 | | | | 35,271 | |
Futures | | | (709,949 | ) | | | — | | | | — | |
| | | | | | | | | | | | |
Net change in unrealized appreciation or depreciation on investments, foreign currency related transactions, and futures | | | 26,231,188 | | | | 4,342,165 | | | | 32,422,639 | |
| | | | | | | | | | | | |
Net realized and unrealized gain on investments, foreign currency related transactions, and futures | | | 20,340,036 | | | | 2,648,431 | | | | 2,228,700 | |
| | | | | | | | | | | | |
Increase in net assets resulting from operations | | $ | 26,312,769 | | | $ | 3,255,458 | | | $ | 6,386,852 | |
| | | | | | | | | | | | |
| | | | | | | | | | | | |
* Foreign taxes withheld | | $ | 748,497 | | | $ | 46,518 | | | $ | 402,644 | |
(1) Dividends from affiliates | | $ | 7,921 | | | $ | 257 | | | $ | — | |
See Accompanying Notes to Financial Statements
15
STATEMENTS OF CHANGES IN NET ASSETS (UNAUDITED)
| | | | | | | | | | | | |
| | | ING RussellTM Large Cap Index Portfolio | | | ING RussellTM Large Cap Growth Index Portfolio | |
| | | Six Months Ended
June 30, 2009 | | | March 10, 2008(1) to December 31, 2008 | | | May 1, 2009(1) to June 30, 2009 | |
FROM OPERATIONS: | | | | | | | | | | | | |
Net investment income | | $ | 14,140,183 | | | $ | 11,836,199 | | | $ | 29,320 | |
Net realized gain (loss) on investments and futures | | | (21,140,537 | ) | | | (34,438,773 | ) | | | 82,632 | |
Net change in unrealized appreciation or depreciation on investments and futures | | | 54,404,761 | | | | (284,328,478 | ) | | | 453,581 | |
| | | | | | | | | | | | |
Increase (decrease) in net assets resulting from operations | | | 47,404,407 | | | | (306,931,052 | ) | | | 565,533 | |
| | | | | | | | | | | | |
FROM DISTRIBUTIONS TO SHAREHOLDERS: | | | | | | | | | | | | |
Net investment income: | | | | | | | | | | | | |
Class ADV | | | — | | | | (10,253 | ) | | | — | |
Class I | | | (165,344 | ) | | | (11,412,515 | ) | | | — | |
Class S | | | — | | | | (278,152 | ) | | | — | |
| | | | | | | | | | | | |
Total distributions | | | (165,344 | ) | | | (11,700,920 | ) | | | — | |
| | | | | | | | | | | | |
FROM CAPITAL SHARE TRANSACTIONS: | | | | | | | | | | | | |
Net proceeds from sale of shares | | | 342,951,425 | | | | 1,509,643,001 | | | | 11,685,857 | |
Reinvestment of distributions | | | 165,344 | | | | 11,700,920 | | | | — | |
| | | | | | | | | | | | |
| | | 343,116,769 | | | | 1,521,343,921 | | | | 11,685,857 | |
Cost of shares redeemed | | | (42,788,248 | ) | | | (115,073,059 | ) | | | (709,714 | ) |
| | | | | | | | | | | | |
Net increase in net assets resulting from capital share transactions | | | 300,328,521 | | | | 1,406,270,862 | | | | 10,976,143 | |
| | | | | | | | | | | | |
Net increase in net assets | | | 347,567,584 | | | | 1,087,638,890 | | | | 11,541,676 | |
| | | | | | | | | | | | |
NET ASSETS: | | | | | | | | | | | | |
Beginning of period | | | 1,087,638,890 | | | | — | | | | — | |
| | | | | | | | | | | | |
End of period | | $ | 1,435,206,474 | | | $ | 1,087,638,890 | | | $ | 11,541,676 | |
| | | | | | | | | | | | |
Undistributed net investment income at end of period | | $ | 14,133,512 | | | $ | 158,673 | | | $ | 29,320 | |
| | | | | | | | | | | | |
| (1) | | Commencement of operations |
See Accompanying Notes to Financial Statements
16
STATEMENTS OF CHANGES IN NET ASSETS (UNAUDITED)
| | | | | | | | | | | | |
| | | ING RussellTM Large Cap Value Index Portfolio | | | ING RussellTM Mid Cap Index Portfolio | |
| | | May 1, 2009(1) to June 30, 2009 | | | Six Months Ended June 30, 2009 | | | March 10, 2008(1) to December 31, 2008 | |
FROM OPERATIONS: | | | | | | | | | | | | |
Net investment income | | $ | 325,501 | | | $ | 1,572,227 | | | $ | 1,841,648 | |
Net realized gain (loss) on investments and futures | | | 765,006 | | | | (3,471,301 | ) | | | (14,474,060 | ) |
Net change in unrealized appreciation or depreciation on investments and futures | | | 2,834,519 | | | | 22,285,631 | | | | (63,690,070 | ) |
| | | | | | | | | | | | |
Increase (decrease) in net assets resulting from operations | | | 3,925,026 | | | | 20,386,557 | | | | (76,322,482 | ) |
| | | | | | | | | | | | |
FROM DISTRIBUTIONS TO SHAREHOLDERS: | | | | | | | | | | | | |
Net investment income: | | | | | | | | | | | | |
Class ADV | | | — | | | | — | | | | (592 | ) |
Class I | | | — | | | | — | | | | (1,417,233 | ) |
Class S | | | — | | | | — | | | | (267,329 | ) |
Return of capital: | | | | | | | | | | | | |
Class ADV | | | — | | | | — | | | | (81 | ) |
Class I | | | — | | | | — | | | | (154,707 | ) |
Class S | | | — | | | | — | | | | (31,322 | ) |
| | | | | | | | | | | | |
Total distributions | | | — | | | | — | | | | (1,871,264 | ) |
| | | | | | | | | | | | |
FROM CAPITAL SHARE TRANSACTIONS: | | | | | | | | | | | | |
Net proceeds from sale of shares | | | 78,422,464 | | | | 210,196,442 | | | | 277,919,046 | |
Reinvestment of distributions | | | — | | | | — | | | | 1,871,264 | |
| | | | | | | | | | | | |
| | | 78,422,464 | | | | 210,196,442 | | | | 279,790,310 | |
Cost of shares redeemed | | | (1,337,236 | ) | | | (19,151,794 | ) | | | (58,707,851 | ) |
| | | | | | | | | | | | |
Net increase in net assets resulting from capital share transactions | | | 77,085,228 | | | | 191,044,648 | | | | 221,082,459 | |
| | | | | | | | | | | | |
Net increase in net assets | | | 81,010,254 | | | | 211,431,205 | | | | 142,888,713 | |
| | | | | | | | | | | | |
NET ASSETS: | | | | | | | | | | | | |
Beginning of period | | | — | | | | 142,888,713 | | | | — | |
| | | | | | | | | | | | |
End of period | | $ | 81,010,254 | | | $ | 354,319,918 | | | $ | 142,888,713 | |
| | | | | | | | | | | | |
Undistributed net investment income at end of period | | $ | 325,501 | | | $ | 1,572,227 | | | $ | — | |
| | | | | | | | | | | | |
| (1) | | Commencement of operations |
See Accompanying Notes to Financial Statements
17
STATEMENTS OF CHANGES IN NET ASSETS (UNAUDITED)
| | | | | | | | | | | | |
| | | ING RussellTM Mid Cap Growth Index Portfolio | | | ING RussellTM Small Cap Index Portfolio | |
| | | May 1, 2009(1) to June 30, 2009 | | | Six Months Ended June 30, 2009 | | | March 10, 2008(1) to December 31, 2008 | |
FROM OPERATIONS: | | | | | | | | | | | | |
Net investment income | | $ | 106,818 | | | $ | 1,369,087 | | | $ | 1,904,650 | |
Net realized gain (loss) on investments and futures | | | 772,706 | | | | (8,951,833 | ) | | | (12,272,289 | ) |
Net change in unrealized appreciation or depreciation on investments and futures | | | 2,415,605 | | | | 15,298,561 | | | | (62,765,875 | ) |
| | | | | | | | | | | | |
Increase (decrease) in net assets resulting from operations | | | 3,295,129 | | | | 7,715,815 | | | | (73,133,514 | ) |
| | | | | | | | | | | | |
FROM DISTRIBUTIONS TO SHAREHOLDERS: | | | | | | | | | | | | |
Net investment income: | | | | | | | | | | | | |
Class ADV | | | — | | | | — | | | | (4,703 | ) |
Class I | | | — | | | | — | | | | (1,144,504 | ) |
Class S | | | — | | | | — | | | | (575,955 | ) |
Return of capital: | | | | | | | | | | | | |
Class ADV | | | — | | | | — | | | | (606 | ) |
Class I | | | — | | | | — | | | | (138,724 | ) |
Class S | | | — | | | | — | | | | (77,527 | ) |
| | | | | | | | | | | | |
Total distributions | | | — | | | | — | | | | (1,942,019 | ) |
| | | | | | | | | | | | |
FROM CAPITAL SHARE TRANSACTIONS: | | | | | | | | | | | | |
Net proceeds from sale of shares | | | 69,267,761 | | | | 75,907,338 | | | | 352,853,424 | |
Reinvestment of distributions | | | — | | | | — | | | | 1,942,019 | |
| | | | | | | | | | | | |
| | | 69,267,761 | | | | 75,907,338 | | | | 354,795,443 | |
Cost of shares redeemed | | | (850,339 | ) | | | (39,389,899 | ) | | | (71,680,086 | ) |
| | | | | | | | | | | | |
Net increase in net assets resulting from capital share transactions | | | 68,417,422 | | | | 36,517,439 | | | | 283,115,357 | |
| | | | | | | | | | | | |
Net increase in net assets | | | 71,712,551 | | | | 44,233,254 | | | | 208,039,824 | |
| | | | | | | | | | | | |
NET ASSETS: | | | | | | | | | | | | |
Beginning of period | | | — | | | | 208,039,824 | | | | — | |
| | | | | | | | | | | | |
End of period | | $ | 71,712,551 | | | $ | 252,273,078 | | | $ | 208,039,824 | |
| | | | | | | | | | | | |
Undistributed net investment income at end of period | | $ | 106,818 | | | $ | 1,463,447 | | | $ | 94,360 | |
| | | | | | | | | | | | |
| (1) | | Commencement of operations |
See Accompanying Notes to Financial Statements
18
STATEMENTS OF CHANGES IN NET ASSETS (UNAUDITED)
| | | | | | | | | | | | |
| | | ING U.S. Bond Index Portfolio | | | ING Hang Seng Index Portfolio | |
| | | Six Months Ended June 30, 2009 | | | March 7, 2008(1) to December 31, 2008 | | | May 1, 2009(1) to June 30, 2009 | |
FROM OPERATIONS: | | | | | | | | | | | | |
Net investment income | | $ | 9,806,137 | | | $ | 3,765,904 | | | $ | 56,197 | |
Net realized gain on investments, foreign currency related transactions, and futures | | | 131,083 | | | | 1,887,738 | | | | 19,053 | |
Net change in unrealized appreciation or depreciation on investments, foreign currency related transactions, and futures | | | 10,622,228 | | | | 2,417,746 | | | | 541,597 | |
| | | | | | | | | | | | |
Increase in net assets resulting from operations | | | 20,559,448 | | | | 8,071,388 | | | | 616,847 | |
| | | | | | | | | | | | |
FROM DISTRIBUTIONS TO SHAREHOLDERS: | | | | | | | | | | | | |
Net investment income: | | | | | | | | | | | | |
Class ADV | | | (1,081 | ) | | | (1,025 | ) | | | — | |
Class I | | | (1,982,465 | ) | | | (1,581,897 | ) | | | — | |
Class S | | | (1,102,745 | ) | | | (2,140,124 | ) | | | — | |
Class S2 | | | (13 | ) | | | — | | | | — | |
Net realized gains: | | | | | | | | | | | | |
Class ADV | | | — | | | | (238 | ) | | | — | |
Class I | | | — | | | | (175,555 | ) | | | — | |
Class S | | | — | | | | (301,607 | ) | | | — | |
| | | | | | | | | | | | |
Total distributions | | | (3,086,304 | ) | | | (4,200,446 | ) | | | — | |
| | | | | | | | | | | | |
FROM CAPITAL SHARE TRANSACTIONS: | | | | | | | | | | | | |
Net proceeds from sale of shares | | | 979,912,946 | | | | 368,680,313 | | | | 10,945,842 | |
Reinvestment of distributions | | | 3,086,290 | | | | 3,769,800 | | | | — | |
| | | | | | | | | | | | |
| | | 982,999,236 | | | | 372,450,113 | | | | 10,945,842 | |
Cost of shares redeemed | | | (155,195,055 | ) | | | (88,279,536 | ) | | | (286,060 | ) |
| | | | | | | | | | | | |
Net increase in net assets resulting from capital share transactions | | | 827,804,181 | | | | 284,170,577 | | | | 10,659,782 | |
| | | | | | | | | | | | |
Net increase in net assets | | | 845,277,325 | | | | 288,041,519 | | | | 11,276,629 | |
| | | | | | | | | | | | |
NET ASSETS: | | | | | | | | | | | | |
Beginning of period | | | 288,041,519 | | | | — | | | | — | |
| | | | | | | | | | | | |
End of period | | $ | 1,133,318,844 | | | $ | 288,041,519 | | | $ | 11,276,629 | |
| | | | | | | | | | | | |
Undistributed net investment income at end of period | | $ | 6,797,914 | | | $ | 78,081 | | | $ | 56,197 | |
| | | | | | | | | | | | |
| (1) | | Commencement of operations |
See Accompanying Notes to Financial Statements
19
STATEMENTS OF CHANGES IN NET ASSETS (UNAUDITED)
| | | | | | | | | | | | | | | | |
| | | ING International Index Portfolio | | | ING RussellTM Global Large Cap Index 75% Portfolio | |
| | | Six Months Ended June 30, 2009 | | | March 10, 2008(1) to December 31, 2008 | | | Six Months Ended June 30, 2009 | | | Year Ended December 31, 2008 | |
FROM OPERATIONS: | | | | | | | | | | | | | | | | |
Net investment income | | $ | 5,972,733 | | | $ | 4,473,411 | | | $ | 607,027 | | | $ | 301,476 | |
Net realized loss on investments, foreign currency related transactions, and futures | | | (5,891,152 | ) | | | (7,659,203 | ) | | | (1,693,734 | ) | | | (486,608 | ) |
Net change in unrealized appreciation or depreciation on investments, foreign currency related transactions, and futures | | | 26,231,188 | | | | (138,405,038 | ) | | | 4,342,165 | | | | (8,749,834 | ) |
| | | | | | | | | | | | | | | | |
Increase (decrease) in net assets resulting from operations | | | 26,312,769 | | | | (141,590,830 | ) | | | 3,255,458 | | | | (8,934,966 | ) |
| | | | | | | | | | | | | | | | |
FROM DISTRIBUTIONS TO SHAREHOLDERS: | | | | | | | | | | | | | | | | |
Net investment income: | | | | | | | | | | | | | | | | |
Class ADV | | | — | | | | (25 | ) | | | — | | | | (26 | ) |
Class I | | | — | | | | (4,138,013 | ) | | | — | | | | (29 | ) |
Class S | | | — | | | | (113,042 | ) | | | — | | | | (478,786 | ) |
| | | | | | | | | | | | | | | | |
Total distributions | | | — | | | | (4,251,080 | ) | | | — | | | | (478,841 | ) |
| | | | | | | | | | | | | | | | |
FROM CAPITAL SHARE TRANSACTIONS: | | | | | | | | | | | | | | | | |
Net proceeds from sale of shares | | | 293,975,962 | | | | 429,531,847 | | | | 7,582,190 | | | | 54,016,909 | |
Reinvestment of distributions | | | — | | | | 4,251,055 | | | | — | | | | 41,786 | |
| | | | | | | | | | | | | | | | |
| | | 293,975,962 | | | | 433,782,902 | | | | 7,582,190 | | | | 54,058,695 | |
Cost of shares redeemed | | | (37,504,457 | ) | | | (43,179,697 | ) | | | (261,063 | ) | | | (1,438,619 | ) |
| | | | | | | | | | | | | | | | |
Net increase in net assets resulting from capital share transactions | | | 256,471,505 | | | | 390,603,205 | | | | 7,321,127 | | | | 52,620,076 | |
| | | | | | | | | | | | | | | | |
Net increase in net assets | | | 282,784,274 | | | | 244,761,295 | | | | 10,576,585 | | | | 43,206,269 | |
| | | | | | | | | | | | | | | | |
NET ASSETS: | | | | | | | | | | | | | | | | |
Beginning of period | | | 244,761,295 | | | | — | | | | 43,206,269 | | | | — | |
| | | | | | | | | | | | | | | | |
End of period | | $ | 527,545,569 | | | $ | 244,761,295 | | | $ | 53,782,854 | | | $ | 43,206,269 | |
| | | | | | | | | | | | | | | | |
Undistributed net investment income at end of period | | $ | 5,976,122 | | | $ | 3,389 | | | $ | 607,378 | | | $ | 351 | |
| | | | | | | | | | | | | | | | |
| (1) | | Commencement of operations |
See Accompanying Notes to Financial Statements
20
STATEMENTS OF CHANGES IN NET ASSETS (UNAUDITED)
| | | | | | | | |
| | | ING WisdomTreeSM Global
High-Yielding Equity Index Portfolio | |
| | | Six Months Ended June 30, 2009 | | | January 28, 2008(1) to December 31, 2008 | |
FROM OPERATIONS: | | | | | | | | |
Net investment income | | $ | 4,158,152 | | | $ | 5,000,691 | |
Net realized loss on investments and foreign currency related transactions | | | (30,193,939 | ) | | | (14,314,550 | ) |
Net change in unrealized appreciation or depreciation on investments and foreign currency related transactions | | | 32,422,639 | | | | (70,018,351 | ) |
| | | | | | | | |
Increase (decrease) in net assets resulting from operations | | | 6,386,852 | | | | (79,332,210 | ) |
| | | | | | | | |
FROM DISTRIBUTIONS TO SHAREHOLDERS: | | | | | | | | |
Net investment income: | | | | | | | | |
Class ADV | | | — | | | | (17 | ) |
Class S | | | — | | | | (4,806,407 | ) |
| | | | | | | | |
Total distributions | | | — | | | | (4,806,424 | ) |
| | | | | | | | |
FROM CAPITAL SHARE TRANSACTIONS: | | | | | | | | |
Net proceeds from sale of shares | | | 29,642,333 | | | | 252,565,746 | |
Reinvestment of distributions | | | — | | | | 4,806,407 | |
| | | | | | | | |
| | | 29,642,333 | | | | 257,372,153 | |
Cost of shares redeemed | | | (17,595,576 | ) | | | (24,487,493 | ) |
| | | | | | | | |
Net increase in net assets resulting from capital share transactions | | | 12,046,757 | | | | 232,884,660 | |
| | | | | | | | |
Net increase in net assets | | | 18,433,609 | | | | 148,746,026 | |
| | | | | | | | |
NET ASSETS: | | | | | | | | |
Beginning of period | | | 148,746,026 | | | | — | |
| | | | | | | | |
End of period | | $ | 167,179,635 | | | $ | 148,746,026 | |
| | | | | | | | |
Undistributed net investment income at end of period | | $ | 4,158,152 | | | $ | — | |
| | | | | | | | |
| (1) | | Commencement of operations |
See Accompanying Notes to Financial Statements
21
FINANCIAL HIGHLIGHTS (UNAUDITED)
Selected data for a share of beneficial interest outstanding throughout each year or period.
| | | | | | | | | | | | | | | | | | | | | | | | | | | | | | | | | | | | | |
| | | | | Income (loss)
from
investment
operations | | | | | | Less distributions | | | | | | | | | Ratios to average net assets | | Supplemental
data |
| | | | | | | | | | | | | | | | | | | | | | | | | | | | | | | | | | | | | |
| | | Net asset value, beginning of year or period | | Net investment income (loss) | | | Net realized and unrealized gain (loss) | | | Total from investment operations | | | From net investment income | | From net realized gains | | From return of capital | | Total distributions | | Net asset value, end of year or period | | Total return(1) | | | Expenses before reductions(2)(3) | | | Expenses net of fee waivers, if any(2)(3) | | Expenses net of all reductions(2)(3) | | Net investment income (loss)(2)(3) | | Net assets, end of year or period | | Portfolio turnover rate |
| | | | | | | | | | | | | | | | | | | | | | | | | | | | | | | | | | | | | |
Year or period ended | | ($) | | ($) | | | ($) | | | ($) | | | ($) | | ($) | | ($) | | ($) | | ($) | | (%) | | | (%) | | | (%) | | (%) | | (%) | | ($000's) | | (%) |
ING Russell™ Large Cap Index Portfolio | | | | | | | | | | | | | | | | | | | | | | | | | | | | | | | | | | | | | |
Class ADV | | | | | | | | | | | | | | | | | | | | | | | | | | | | | | | | | | | | | |
06-30-09 | | 7.19 | | 0.06 | · | | 0.07 | | | 0.13 | | | — | | — | | — | | — | | 7.32 | | 1.81 | | | 0.90 | | | 0.87+ | | 0.87+ | | 1.79+ | | 2,542 | | 3 |
03-10-08(4) - 12-31-08 | | 10.00 | | 0.13 | · | | (2.87 | ) | | (2.74 | ) | | 0.07 | | — | | — | | 0.07 | | 7.19 | | (27.42 | ) | | 0.89 | | | 0.87+ | | 0.87+ | | 1.98+ | | 1,135 | | 8 |
Class I | | | | | | | | | | | | | | | | | | | | | | | | | | | | | | | | | | | | | |
06-30-09 | | 7.21 | | 0.07 | | | 0.08 | | | 0.15 | | | — | | — | | — | | — | | 7.36 | | 2.09 | | | 0.40 | | | 0.37+ | | 0.37+ | | 2.33+ | | 1,381,763 | | 3 |
03-10-08(4) - 12-31-08 | | 10.00 | | 0.17 | · | | (2.88 | ) | | (2.71 | ) | | 0.08 | | — | | — | | 0.08 | | 7.21 | | (27.06 | ) | | 0.39 | | | 0.37+ | | 0.37+ | | 2.31+ | | 1,057,974 | | 8 |
Class S | | | | | | | | | | | | | | | | | | | | | | | | | | | | | | | | | | | | | |
06-30-09 | | 7.20 | | 0.06 | | | 0.08 | | | 0.14 | | | — | | — | | — | | — | | 7.34 | | 1.94 | | | 0.65 | | | 0.62+ | | 0.62+ | | 2.06+ | | 50,897 | | 3 |
03-10-08(4) - 12-31-08 | | 10.00 | | 0.14 | · | | (2.87 | ) | | (2.73 | ) | | 0.07 | | — | | — | | 0.07 | | 7.20 | | (27.23 | ) | | 0.64 | | | 0.62+ | | 0.62+ | | 2.19+ | | 28,529 | | 8 |
Class S2 | | | | | | | | | | | | | | | | | | | | | | | | | | | | | | | | | | | | | |
02-27-09(4) - 06-30-09 | | 5.89 | | 0.04 | | | 1.40 | | | 1.44 | | | — | | — | | — | | — | | 7.33 | | 24.46 | | | 0.90 | | | 0.77+ | | 0.77+ | | 1.65+ | | 4 | | 3 |
| | | | | | | | | | | | | | | | |
ING Russell™ Large Cap Growth Index Portfolio | | | | | | | | | | | | | | | | | | | | | | | | | | | | | | | | | | | | | |
Class ADV | | | | | | | | | | | | | | | | | | | | | | | | | | | | | | | | | | | | | |
05-01-09(4) - 06-30-09 | | 10.00 | | 0.02 | | | 0.51 | | | 0.53 | | | — | | — | | — | | — | | 10.53 | | 5.30 | | | 1.39 | | | 1.29+ | | 1.29+ | | 1.17+ | | 3 | | 24 |
Class I | | | | | | | | | | | | | | | | | | | | | | | | | | | | | | | | | | | | | |
05-01-09(4) - 06-30-09 | | 10.00 | | 0.03 | | | 0.51 | | | 0.54 | | | — | | — | | — | | — | | 10.54 | | 5.40 | | | 0.89 | | | 0.79+ | | 0.79+ | | 1.75+ | | 10,774 | | 24 |
Class S | | | | | | | | | | | | | | | | | | | | | | | | | | | | | | | | | | | | | |
05-01-09(4) - 06-30-09 | | 10.00 | | 0.01 | | | 0.52 | | | 0.53 | | | — | | — | | — | | — | | 10.53 | | 5.30 | | | 1.14 | | | 1.04+ | | 1.04+ | | 0.70+ | | 762 | | 24 |
Class S2 | | | | | | | | | | | | | | | | | | | | | | | | | | | | | | | | | | | | | |
05-01-09(4) - 06-30-09 | | 10.00 | | 0.02 | | | 0.51 | | | 0.53 | | | — | | — | | — | | — | | 10.53 | | 5.30 | | | 1.39 | | | 1.19+ | | 1.19+ | | 1.47+ | | 3 | | 24 |
| | | | | | | | | | | | | | | | |
ING Russell™ Large Cap Value Index Portfolio | | | | | | | | | | | | | | | | | | | | | | | | | | | | | | | | | | | | | |
Class ADV | | | | | | | | | | | | | | | | | | | | | | | | | | | | | | | | | | | | | |
05-01-09(4) - 06-30-09 | | 10.00 | | 0.04 | | | 0.47 | | | 0.51 | | | — | | — | | — | | — | | 10.51 | | 5.10 | | | 1.10 | | | 1.00+ | | 1.00+ | | 2.22+ | | 3 | | 20 |
Class I | | | | | | | | | | | | | | | | | | | | | | | | | | | | | | | | | | | | | |
05-01-09(4) - 06-30-09 | | 10.00 | | 0.04 | | | 0.48 | | | 0.52 | | | — | | — | | — | | — | | 10.52 | | 5.20 | | | 0.60 | | | 0.50+ | | 0.50+ | | 2.58+ | | 80,074 | | 20 |
Class S | | | | | | | | | | | | | | | | | | | | | | | | | | | | | | | | | | | | | |
05-01-09(4) - 06-30-09 | | 10.00 | | 0.02 | | | 0.50 | | | 0.52 | | | — | | — | | — | | — | | 10.52 | | 5.20 | | | 0.85 | | | 0.75+ | | 0.75+ | | 1.86+ | | 930 | | 20 |
Class S2 | | | | | | | | | | | | | | | | | | | | | | | | | | | | | | | | | | | | | |
05-01-09(4) - 06-30-09 | | 10.00 | | 0.04 | | | 0.47 | | | 0.51 | | | — | | — | | — | | — | | 10.51 | | 5.20 | | | 1.10 | | | 0.90+ | | 0.90+ | | 2.12+ | | 3 | | 20 |
| | | | | | | | | | | | | | | | |
ING Russell™ Mid Cap Index Portfolio | | | | | | | | | | | | | | | | | | | | | | | | | | | | | | | | | | | | | |
Class ADV | | | | | | | | | | | | | | | | | | | | | | | | | | | | | | | | | | | | | |
06-30-09 | | 6.63 | | 0.05 | · | | 0.58 | | | 0.63 | | | — | | — | | — | | — | | 7.26 | | 9.50 | | | 0.97 | | | 0.93+ | | 0.93+ | | 1.48+ | | 742 | | 15 |
03-10-08(4) - 12-31-08 | | 10.00 | | 0.08 | · | | (3.37 | ) | | (3.29 | ) | | 0.07 | | — | | 0.01 | | 0.08 | | 6.63 | | (32.92 | ) | | 1.24 | | | 1.15+ | | 1.15+ | | 1.23+ | | 61 | | 30 |
See Accompanying Notes to Financial Statements
22
FINANCIAL HIGHLIGHTS (UNAUDITED) (CONTINUED)
Selected data for a share of beneficial interest outstanding throughout each year or period.
| | | | | | | | | | | | | | | | | | | | | | | | | | | | | | | | | | | | | |
| | | | | Income (loss)
from
investment
operations | | | | | | Less distributions | | | | | | | | | Ratios to average net assets | | Supplemental
data |
| | | | | | | | | | | | | | | | | | | | | | | | | | | | | | | | | | | | | |
| | | Net asset value, beginning of year or period | | Net investment income (loss) | | | Net realized and unrealized gain (loss) | | | Total from investment operations | | | From net investment income | | From net realized gains | | From return of capital | | Total distributions | | Net asset value, end of year or period | | Total return(1) | | | Expenses before reductions(2)(3) | | | Expenses net of fee waivers, if any(2)(3) | | Expenses net of all reductions(2)(3) | | Net investment income (loss)(2)(3) | | Net assets, end of year or period | | Portfolio turnover rate |
| | | | | | | | | | | | | | | | | | | | | | | | | | | | | | | | | | | | | |
Year or period ended | | ($) | | ($) | | | ($) | | | ($) | | | ($) | | ($) | | ($) | | ($) | | ($) | | (%) | | | (%) | | | (%) | | (%) | | (%) | | ($000's) | | (%) |
ING Russell™ Mid Cap Index Portfolio (Continued) | | | | | | | | | | | | | | | | | | | | | | | | | | | | | | | | | | | | | |
Class I | | | | | | | | | | | | | | | | | | | | | | | | | | | | | | | | | | | | | |
06-30-09 | | 6.63 | | 0.06 | · | | 0.60 | | | 0.66 | | | — | | — | | — | | — | | 7.29 | | 9.95 | | | 0.47 | | | 0.43+ | | 0.43+ | | 1.84+ | | 299,011 | | 15 |
03-10-08(4) - 12-31-08 | | 10.00 | | 0.13 | · | | (3.41 | ) | | (3.28 | ) | | 0.08 | | — | | 0.01 | | 0.09 | | 6.63 | | (32.74 | ) | | 0.51 | | | 0.43+ | | 0.43+ | | 1.74+ | | 117,525 | | 30 |
Class S | | | | | | | | | | | | | | | | | | | | | | | | | | | | | | | | | | | | | |
06-30-09 | | 6.62 | | 0.04 | | | 0.60 | | | 0.64 | | | — | | — | | — | | — | | 7.26 | | 9.67 | | | 0.72 | | | 0.68+ | | 0.68+ | | 1.62+ | | 54,563 | | 15 |
03-10-08(4) - 12-31-08 | | 10.00 | | 0.12 | · | | (3.41 | ) | | (3.29 | ) | | 0.08 | | — | | 0.01 | | 0.09 | | 6.62 | | (32.90 | ) | | 0.76 | | | 0.68+ | | 0.68+ | | 1.85+ | | 25,303 | | 30 |
Class S2 | | | | | | | | | | | | | | | | | | | | | | | | | | | | | | | | | | | | | |
02-27-09(4) - 06-30-09 | | 5.52 | | 0.03 | | | 1.71 | | | 1.74 | | | — | | — | | — | | — | | 7.26 | | 31.52 | | | 0.97 | | | 0.83+ | | 0.83+ | | 1.42+ | | 4 | | 15 |
| | | | | | | | | | | | | | | | |
ING Russell™ Mid Cap Growth Index Portfolio | | | | | | | | | | | | | | | | | | | | | | | | | | | | | | | | | | | | | |
Class ADV | | | | | | | | | | | | | | | | | | | | | | | | | | | | | | | | | | | | | |
05-01-09(4) - 06-30-09 | | 10.00 | | 0.01 | | | 0.49 | | | 0.50 | | | — | | — | | — | | — | | 10.50 | | 4.90 | | | 1.10 | | | 1.00+ | | 1.00+ | | 0.64+ | | 3 | | 30 |
Class I | | | | | | | | | | | | | | | | | | | | | | | | | | | | | | | | | | | | | |
05-01-09(4) - 06-30-09 | | 10.00 | | 0.02 | | | 0.48 | | | 0.50 | | | — | | — | | — | | — | | 10.50 | | 5.00 | | | 0.60 | | | 0.50+ | | 0.50+ | | 0.99+ | | 69,404 | | 30 |
Class S | | | | | | | | | | | | | | | | | | | | | | | | | | | | | | | | | | | | | |
05-01-09(4) - 06-30-09 | | 10.00 | | 0.00 | ** | | 0.50 | | | 0.50 | | | — | | — | | — | | — | | 10.50 | | 5.00 | | | 0.85 | | | 0.75+ | | 0.75+ | | 0.60+ | | 2,285 | | 30 |
Class S2 | | | | | | | | | | | | | | | | | | | | | | | | | | | | | | | | | | | | | |
05-01-09(4) - 06-30-09 | | 10.00 | | 0.00 | ** | | 0.50 | | | 0.50 | | | — | | — | | — | | — | | 10.50 | | 4.90 | | | 1.10 | | | 0.90+ | | 0.90+ | | 0.39+ | | 21 | | 30 |
| | | | | | | | | | | | | | | | |
ING Russell™ Small Cap Index Portfolio | | | | | | | | | | | | | | | | | | | | | | | | | | | | | | | | | | | | | |
Class ADV | | | | | | | | | | | | | | | | | | | | | | | | | | | | | | | | | | | | | |
06-30-09 | | 7.72 | | 0.02 | | | 0.15 | | | 0.17 | | | — | | — | | — | | — | | 7.89 | | 2.20 | | | 1.00 | | | 0.95+ | | 0.95+ | | 0.91+ | | 743 | | 17 |
03-10-08(4) - 12-31-08 | | 10.00 | | 0.11 | · | | (2.32 | ) | | (2.21 | ) | | 0.06 | | — | | 0.01 | | 0.07 | | 7.72 | | (22.02 | ) | | 1.27 | | | 1.17+ | | 1.17+ | | 1.74+ | | 571 | | 35 |
Class I | | | | | | | | | | | | | | | | | | | | | | | | | | | | | | | | | | | | | |
06-30-09 | | 7.75 | | 0.05 | | | 0.13 | | | 0.18 | | | — | | — | | — | | — | | 7.93 | | 2.32 | | | 0.50 | | | 0.45+ | | 0.45+ | | 1.37+ | | 155,129 | | 17 |
03-10-08(4) - 12-31-08 | | 10.00 | | 0.12 | · | | (2.29 | ) | | (2.17 | ) | | 0.07 | | — | | 0.01 | | 0.08 | | 7.75 | | (21.68 | ) | | 0.53 | | | 0.45+ | | 0.45+ | | 1.49+ | | 132,762 | | 35 |
Class S | | | | | | | | | | | | | | | | | | | | | | | | | | | | | | | | | | | | | |
06-30-09 | | 7.73 | | 0.03 | | | 0.14 | | | 0.17 | | | — | | — | | — | | — | | 7.90 | | 2.20 | | | 0.75 | | | 0.70+ | | 0.70+ | | 1.11+ | | 96,397 | | 17 |
03-10-08(4) - 12-31-08 | | 10.00 | | 0.12 | · | | (2.32 | ) | | (2.20 | ) | | 0.06 | | — | | 0.01 | | 0.07 | | 7.73 | | (21.95 | ) | | 0.78 | | | 0.70+ | | 0.70+ | | 1.71+ | | 74,707 | | 35 |
Class S2 | | | | | | | | | | | | | | | | | | | | | | | | | | | | | | | | | | | | | |
02-27-09(4) - 06-30-09 | | 6.03 | | 0.02 | | | 1.83 | | | 1.85 | | | — | | — | | — | | — | | 7.88 | | 30.68 | | | 1.00 | | | 0.85+ | | 0.85+ | | 0.99+ | | 4 | | 17 |
| | | | | | | | | | | | | | | | |
ING U.S. Bond Index Portfolio | | | | | | | | | | | | | | | | | | | | | | | | | | | | | | | | | | | | | |
Class ADV | | | | | | | | | | | | | | | | | | | | | | | | | | | | | | | | | | | | | |
06-30-09 | | 10.12 | | 0.14 | · | | 0.03 | | | 0.17 | | | 0.04 | | — | | — | | 0.04 | | 10.25 | | 1.67 | | | 0.94 | | | 0.95+ | | 0.95+ | | 2.77+ | | 944 | | 167 |
03-10-08(4) - 12-31-08 | | 10.00 | | 0.25 | | | 0.07 | | | 0.32 | | | 0.18 | | 0.02 | | — | | 0.20 | | 10.12 | | 3.26 | | | 1.01 | | | 0.95+ | | 0.95+ | | 2.95+ | | 143 | | 360 |
See Accompanying Notes to Financial Statements
23
FINANCIAL HIGHLIGHTS (UNAUDITED) (CONTINUED)
| | | | | | | | | | | | | | | | | | | | | | | | | | | | | | | | | | | | | | | | |
| | | | | Income (loss)
from
investment
operations | | | | | | Less distributions | | | | | | | | | Ratios to average net assets | | | Supplemental
data |
| | | | | | | | | | | | | | | | | | | | | | | | | | | | | | | | | | | | | | | | |
| | | Net asset value, beginning of year or period | | Net investment income (loss) | | | Net realized and unrealized gain (loss) | | | Total from investment operations | | | From net investment income | | From net realized gains | | From return of capital | | Total distributions | | Net asset value, end of year or period | | Total return(1) | | | Expenses before reductions(2)(3) | | | Expenses net of fee waivers, if any(2)(3) | | | Expenses net of all reductions(2)(3) | | | Net investment income (loss)(2)(3) | | | Net assets, end of year or period | | Portfolio turnover rate |
| | | | | | | | | | | | | | | | | | | | | | | | | | | | | | | | | | | | | | | | |
Year or period ended | | ($) | | ($) | | | ($) | | | ($) | | | ($) | | ($) | | ($) | | ($) | | ($) | | (%) | | | (%) | | | (%) | | | (%) | | | (%) | | | ($000’s) | | (%) |
ING U.S. Bond Index Portfolio (Continued) | | | | | | | | | | | | | | | | | | | | | | | | | | | | | | | | | | | | | | | | |
Class I | | | | | | | | | | | | | | | | | | | | | | | | | | | | | | | | | | | | | | | | |
06-30-09 | | 10.12 | | 0.16 | · | | 0.04 | | | 0.20 | | | 0.05 | | — | | — | | 0.05 | | 10.27 | | 1.95 | | | 0.44 | | | 0.45 | + | | 0.45+ | | | 3.26+ | | | 847,070 | | 167 |
03-07-08(4) - 12-31-08 | | 10.00 | | 0.28 | · | | 0.08 | | | 0.36 | | | 0.22 | | 0.02 | | — | | 0.24 | | 10.12 | | 3.61 | | | 0.51 | | | 0.45 | + | | 0.45+ | | | 3.42+ | | | 107,276 | | 360 |
Class S | | | | | | | | | | | | | | | | | | | | | | | | | | | | | | | | | | | | | | | | |
06-30-09 | | 10.10 | | 0.15 | · | | 0.03 | | | 0.18 | | | 0.04 | | — | | — | | 0.04 | | 10.24 | | 1.80 | | | 0.69 | | | 0.70 | + | | 0.70+ | | | 2.93+ | | | 285,302 | | 167 |
03-10-08(4) - 12-31-08 | | 10.00 | | 0.27 | · | | 0.06 | | | 0.33 | | | 0.21 | | 0.02 | | — | | 0.23 | | 10.10 | | 3.29 | | | 0.76 | | | 0.70 | + | | 0.70+ | | | 3.42+ | | | 180,622 | | 360 |
Class S2 | | | | | | | | | | | | | | | | | | | | | | | | | | | | | | | | | | | | | | | | |
02-27-09(4) - 06-30-09 | | 9.99 | | 0.09 | | | 0.18 | | | 0.27 | | | 0.04 | | — | | — | | 0.04 | | 10.22 | | 2.75 | | | 0.94 | | | 0.85 | + | | 0.85+ | | | 2.79+ | | | 3 | | 167 |
| | | | | | | | | | | | | | | | |
ING Hang Seng Index Portfolio | | | | | | | | | | | | | | | | | | | | | | | | | | | | | | | | | | | | | | | | |
Class ADV | | | | | | | | | | | | | | | | | | | | | | | | | | | | | | | | | | | | | | | | |
05-04-09(4) - 06-30-09 | | 10.00 | | 0.08 | | | 1.00 | | | 1.08 | | | — | | — | | — | | — | | 11.08 | | 10.80 | | | 1.86 | | | 1.75 | + | | 1.75+ | | | 5.09+ | | | 3 | | 20 |
Class I | | | | | | | | | | | | | | | | | | | | | | | | | | | | | | | | | | | | | | | | |
05-04-09(4) - 06-30-09 | | 10.00 | | 0.11 | · | | 0.98 | | | 1.09 | | | — | | — | | — | | — | | 11.09 | | 10.90 | | | 1.36 | | | 1.25 | + | | 1.25+ | | | 6.34+ | | | 3 | | 20 |
Class S | | | | | | | | | | | | | | | | | | | | | | | | | | | | | | | | | | | | | | | | |
05-01-09(4) - 06-30-09 | | 10.00 | | 0.09 | · | | 1.00 | | | 1.09 | | | — | | — | | — | | — | | 11.09 | | 10.90 | | | 1.61 | | | 1.50 | + | | 1.50+ | | | 4.77+ | | | 11,267 | | 20 |
Class S2 | | | | | | | | | | | | | | | | | | | | | | | | | | | | | | | | | | | | | | | | |
05-04-09(4) - 06-30-09 | | 10.00 | | 0.09 | | | 1.00 | | | 1.09 | | | — | | — | | — | | — | | 11.09 | | 10.90 | | | 1.86 | | | 1.65 | + | | 1.65+ | | | 5.19+ | | | 3 | | 20 |
ING International Index Portfolio | | | | | | | | | | | | | | | | | | | | | | | | | | | | | | | | | | | | | | | | |
Class ADV | | | | | | | | | | | | | | | | | | | | | | | | | | | | | | | | | | | | | | | | |
06-30-09 | | 6.43 | | 0.15 | · | | 0.19 | | | 0.34 | | | — | | — | | — | | — | | 6.77 | | 5.29 | | | 1.12 | | | 1.00 | + | | 1.00+ | | | 4.58+ | | | 281 | | 3 |
03-10-08(4) - 12-31-08 | | 10.00 | | 0.20 | · | | (3.69 | ) | | (3.49 | ) | | 0.08 | | — | | — | | 0.08 | | 6.43 | | (34.85 | ) | | 1.17 | | | 1.00 | + | | 1.00+ | | | 2.87+ | | | 2 | | 22 |
Class I | | | | | | | | | | | | | | | | | | | | | | | | | | | | | | | | | | | | | | | | |
06-30-09 | | 6.41 | | 0.12 | · | | 0.25 | | | 0.37 | | | — | | — | | — | | — | | 6.78 | | 5.77 | | | 0.62 | | | 0.50 | + | | 0.50+ | | | 4.06+ | | | 507,573 | | 3 |
03-10-08(4) - 12-31-08 | | 10.00 | | 0.17 | · | | (3.65 | ) | | (3.48 | ) | | 0.11 | | — | | — | | 0.11 | | 6.41 | | (34.73 | ) | | 0.67 | | | 0.50 | + | | 0.50+ | | | 2.56+ | | | 237,777 | | 22 |
Class S | | | | | | | | | | | | | | | | | | | | | | | | | | | | | | | | | | | | | | | | |
06-30-09 | | 6.41 | | 0.12 | · | | 0.24 | | | 0.36 | | | — | | — | | — | | — | | 6.77 | | 5.62 | | | 0.87 | | | 0.75 | + | | 0.75+ | | | 3.88+ | | | 19,688 | | 3 |
03-10-08(4) - 12-31-08 | | 10.00 | | 0.12 | · | | (3.60 | ) | | (3.48 | ) | | 0.11 | | — | | — | | 0.11 | | 6.41 | | (34.79 | ) | | 0.92 | | | 0.75 | + | | 0.75+ | | | 1.93+ | | | 6,983 | | 22 |
Class S2 | | | | | | | | | | | | | | | | | | | | | | | | | | | | | | | | | | | | | | | | |
02-27-09(4) - 06-30-09 | | 5.05 | | 0.09 | | | 1.65 | | | 1.74 | | | — | | — | | — | | — | | 6.79 | | 34.46 | | | 1.12 | | | 0.90 | + | | 0.90+ | | | 4.68+ | | | 4 | | 3 |
ING RussellTM Global Large Cap Index 75% Portfolio | | | | | | | | | | | | | | | | | | | | | | | | | | | | | | | | | | | | | | | | |
Class ADV | | | | | | | | | | | | | | | | | | | | | | | | | | | | | | | | | | | | | | | | |
06-30-09 | | 8.07 | | 0.10 | | | 0.34 | | | 0.44 | | | — | | — | | — | | — | | 8.51 | | 5.45 | | | 1.54 | | | 1.10 | + | | 1.10 | + | | 2.44 | + | | 3 | | 34 |
09-17-08(4) - 12-31-08 | | 10.00 | | 0.05 | | | (1.89 | ) | | (1.84 | ) | | 0.09 | | — | | — | | 0.09 | | 8.07 | | (18.43 | ) | | 2.19 | | | 1.10 | | | 1.10 | | | 2.12 | | | 2 | | 12 |
Class I | | | | | | | | | | | | | | | | | | | | | | | | | | | | | | | | | | | | | | | | |
06-30-09 | | 8.08 | | 0.11 | | | 0.35 | | | 0.46 | | | — | | — | | — | | — | | 8.54 | | 5.69 | | | 1.03 | | | 0.60 | + | | 0.60 | + | | 2.86 | + | | 3 | | 34 |
09-17-08(4) - 12-31-08 | | 10.00 | | 0.06 | | | (1.88 | ) | | (1.82 | ) | | 0.10 | | — | | — | | 0.10 | | 8.08 | | (18.22 | ) | | 1.69 | | | 0.60 | | | 0.60 | | | 2.61 | | | 2 | | 12 |
See Accompanying Notes to Financial Statements
24
FINANCIAL HIGHLIGHTS (UNAUDITED) (CONTINUED)
| | | | | | | | | | | | | | | | | | | | | | | | | | | | | | | | | | | | | | | | | |
| | | | | Income
(loss) from
investment
operations | | | | | | Less distributions | | | | | | | | | Ratios to average net assets | | | Supplemental
data |
| | | | | | | | | | | | | | | | | | | | | | | | | | | | | | | | | | | | | | | | | |
| | | Net asset value, beginning of year or period | | Net investment income (loss) | | | Net realized and unrealized gain (loss) | | | Total from investment operations | | | From net investment income | | From net realized gains | | From return of capital | | Total distributions | | Net asset value, end of year or period | | Total return(1) | | | Expenses before reductions(2)(3) | | | Expenses net of fee waivers, if any(2)(3) | | | Expenses net of all reductions(2)(3) | | | Net investment income (loss)(2)(3) | | | Net assets, end of year or period | | | Portfolio turnover rate |
| | | | | | | | | | | | | | | | | | | | | | | | | | | | | | | | | | | | | | | | | |
Year or period ended | | ($) | | ($) | | | ($) | | | ($) | | | ($) | | ($) | | ($) | | ($) | | ($) | | (%) | | | (%) | | | (%) | | | (%) | | | (%) | | | ($000’s) | | | (%) |
ING RussellTM Global Large Cap Index 75% Portfolio (Continued) | | | | | | | | | | | | | | | | | | | | | | | | | | | | | | | | | | | | | | | | | |
Class S | | | | | | | | | | | | | | | | | | | | | | | | | | | | | | | | | | | | | | | | | |
06-30-09 | | 8.09 | | 0.10 | | | 0.36 | | | 0.46 | | | — | | — | | — | | — | | 8.55 | | 5.69 | | | 1.32 | | | 0.85 | + | | 0.85 | + | | 2.69 | + | | 53,778 | | | 34 |
09-17-08(4) - 12-31-08 | | 10.00 | | 0.06 | | | (1.88 | ) | | (1.82 | ) | | 0.09 | | — | | — | | 0.09 | | 8.09 | | (18.18 | ) | | 1.94 | | | 0.85 | | | 0.85 | | | 2.45 | | | 43,201 | | | 12 |
| | | | | | | | | | | | | | | | |
ING WisdomTreeSM Global High-Yielding Equity Index Portfolio | | | | | | | | | | | | | | | | | | | | | | | | | | | | | | | | | | | | | | | | | |
Class ADV | | | | | | | | | | | | | | | | | | | | | | | | | | | | | | | | | | | | | | | | | |
06-30-09 | | 5.99 | | 0.14 | | | 0.04 | | | 0.18 | | | — | | — | | — | | — | | 6.17 | | 3.01 | | | 1.41 | | | 1.24 | + | | 1.24 | + | | 5.33 | + | | 1 | | | 6 |
01-28-08(4) - 12-31-08 | | 10.00 | | 0.34 | · | | (4.18 | ) | | (3.84 | ) | | 0.17 | | — | | — | | 0.17 | | 5.99 | | (38.33 | ) | | 1.66 | | | 1.20 | + | | 1.20 | + | | 4.28 | + | | 1 | | | 128 |
Class I | | | | | | | | | | | | | | | | | | | | | | | | | | | | | | | | | | | | | | | | | |
06-30-09 | | 5.97 | | 0.18 | | | 0.00 | ** | | 0.18 | | | — | | — | | — | | — | | 6.15 | | 3.02 | | | 0.91 | | | 0.74 | + | | 0.74 | + | | 5.85 | + | | 0 | * | | 6 |
01-28-08(4) - 12-31-08 | | 10.00 | | 0.41 | · | | (4.23 | ) | | (3.82 | ) | | 0.21 | | — | | — | | 0.21 | | 5.97 | | (38.10 | ) | | 1.16 | | | 0.70 | + | | 0.70 | + | | 4.92 | + | | 0 | * | | 128 |
Class S | | | | | | | | | | | | | | | | | | | | | | | | | | | | | | | | | | | | | | | | | |
06-30-09 | | 5.98 | | 0.15 | | | 0.02 | | | 0.17 | | | — | | — | | — | | — | | 6.15 | | 2.84 | | | 1.15 | | | 0.94 | + | | 0.94 | + | | 5.59 | + | | 167,179 | | | 6 |
01-28-08(4) - 12-31-08 | | 10.00 | | 0.31 | · | | (4.13 | ) | | (3.82 | ) | | 0.20 | | — | | — | | 0.20 | | 5.98 | | (38.10 | ) | | 1.41 | | | 0.89 | + | | 0.89 | + | | 4.23 | + | | 148,745 | | | 128 |
| (1) | | Total return is calculated assuming reinvestment of all dividends and capital gain distributions at net asset value and does not reflect the effect of insurance contract charges. Total return for periods less than one year is not annualized. |
| (2) | | Annualized for periods less than one year. |
| (3) | | Expense ratios reflect operating expenses of a Portfolio. Expenses before reductions do not reflect amounts reimbursed by the Investment Adviser and/or Distributor or reductions from brokerage commission recapture arrangements or other expense offset arrangements and do not represent the amount paid by a Portfolio during periods when reimbursements or reductions occur. Expenses net of fee waivers reflect expenses after reimbursement by the Investment Adviser and/or Distributor but prior to reductions from brokerage commission recapture arrangements or other expense offset arrangements. Expenses net of all reductions represent the net expenses paid by a Portfolio. Net investment income (loss) is net of all such additions or reductions. |
| (4) | | Commencement of operations. |
| · | | Calculated using average number of shares outstanding throughout the period. |
| + | | Impact of waiving the advisory fee for the ING Institutional Prime Money Market Fund holding has less than 0.005% impact on the expense ratios and net investment income or loss ratio. |
| * | | Amount is less than $500. |
| ** | | Amount is less than $0.005. |
See Accompanying Notes to Financial Statements
25
NOTES TO FINANCIAL STATEMENTSASOF JUNE 30, 2009 (UNAUDITED)
NOTE 1 — ORGANIZATION
Organization. ING Variable Portfolios, Inc. (the “Company” or “Registrant”) is registered under the Investment Company Act of 1940, as amended (“1940 Act” or “Act”) as an open-end diversified management investment company.
The Company was incorporated under the laws of Maryland on June 4, 1996. There are nineteen active separate investment series that comprise the Company. The eleven portfolios (each a “Portfolio”, collectively the “Portfolios”) that are in this report are:
ING RussellTM Large Cap Index Portfolio (“RussellTM Large Cap Index”), ING RussellTM Large Cap Growth Index Portfolio (“RussellTM Large Cap Growth Index”), ING RussellTM Large Cap Value Index Portfolio (“RussellTM Large Cap Value Index”), ING RussellTM Mid Cap Index Portfolio (“RussellTM Mid Cap Index”), ING RussellTM Mid Cap Growth Index Portfolio (“RussellTM Mid Cap Growth Index”), ING RussellTM Small Cap Index Portfolio (“RussellTM Small Cap Index”), ING U.S. Bond Index Portfolio (“U.S. Bond Index”) formerly, Lehman Brothers U.S. Aggregate Bond Index® Portfolio, ING Hang Seng Index Portfolio (“Hang Seng Index”), ING International Index Portfolio (“International Index”), ING RussellTM Global Large Cap Index 75% Portfolio (“RussellTM Global Large Cap Index 75%”) formerly, ING RussellTM Global Large Cap Index 85% Portfolio, and ING WisdomTreeSM Global High-Yielding Equity Index Portfolio (“WisdomTreeSM Index”).
The following is a brief description of each Portfolio’s investment objective:
| • | | RussellTM Large Cap Index seeks investment results (before fees and expenses) that correspond to the total return of the Russell Top 200® Index; |
| • | | RussellTM Large Cap Growth Index seeks investment results (before fees and expenses) that correspond to the total return of the Russell Top 200® Growth Index; |
| • | | RussellTM Large Cap Value Index seeks investment results (before fees and expenses) that correspond to the total return of the Russell Top 200® Value Index; |
| • | | RussellTM Mid Cap Index seeks investment results (before fees and expenses) that correspond to the total return of the Russell Midcap® Index; |
| • | | RussellTM Mid Cap Growth Index Seeks investment results (before fees and expenses) that correspond to the total return of the Russell Midcap® Growth Index; |
| • | | RussellTM Small Cap Index seeks investment results (before fees and expenses) that correspond to the total return of the Russell 2000® Index; |
| • | | U.S. Bond Index seeks investment results (before fees and expenses) that correspond to the total return of the Barclays Capital U.S. Aggregate Bond Index; |
| • | | Hang Seng Index seeks investment results (before fees and expenses) that correspond to the total return of the Hang Seng Index; |
| • | | International Index seeks investment results (before fees and expenses) that correspond to the total return of a widely accepted international index; |
| • | | RussellTM Global Large Cap Index 75% seeks to maximize total return, consisting of capital appreciation and current income, over the long term by allocating its assets among stock, bonds, short-term instruments and other investments; and |
| • | | WisdomTreeSM Index seeks investment returns that closely correspond to the price and yield performance (before fees and expenses) of the WisdomTreeSM Global High-Yielding Equity Index. |
Each Portfolio, except RussellTM Global Large Cap Index 75% and WisdomTreeSM Index, offers Class I, Class S, Service 2 Class (“Class S2”) and Adviser (“ADV”) Class shares; RussellTM Global Large Cap Index 75% and WisdomTreeSM Index are not authorized to offer Class S2. The four classes differ principally in applicable distribution and service fees. Shareholders of each class also bear certain expenses that pertain to that particular class. All shareholders bear the common expenses of the Portfolios and earn income and realized gains/losses from the Portfolios pro rata based on the average daily net assets of each class, without discrimination between share classes. Common expenses of the Portfolios (including custodial asset-based fees, legal and audit fees, printing and mailing expenses, transfer agency out-of-pocket expenses, and fees and expenses of the independent trustees) are allocated to each Portfolio in proportion to its average net assets. Expenses directly attributable to a particular portfolio (including advisory, administration, custodial transaction-based, registration, other professional, distribution and/or service fees, certain taxes, and offering costs) are charged directly to that Portfolio. Differences in per share dividend rates generally result from differences in separate class expenses, including distribution and shareholder service fees, if applicable.
Shares of the Portfolios may be offered to separate accounts of insurance companies as investment options under variable annuity contracts and variable life insurance policies. Shares may also be offered to
26
NOTES TO FINANCIAL STATEMENTSASOF JUNE 30, 2009 (UNAUDITED) (CONTINUED)
NOTE 1 — ORGANIZATION (continued)
qualified pension and retirement plans outside the variable contract and to certain investment advisers and their affiliates. Class I shares may be made available to other investment companies, including series of the companies under fund-of-funds arrangements.
Participating insurance companies and other designated organizations are authorized to receive purchase orders on each Portfolio’s behalf.
ING Investments, LLC (“ING Investments” or the “Investment Adviser”), an Arizona limited liability company, serves as the investment adviser to the Portfolios. ING Investments has engaged ING Investment Management Co. (“ING IM”), a Connecticut corporation, to serve as the sub-adviser to each Portfolio, with the exception of U.S. Bond Index. ING Funds Distributor, LLC (“IFD” or the “Distributor”) is the principal underwriter of the Portfolios. ING Investments, ING IM and the Distributor are indirect, wholly-owned subsidiaries of ING Groep N.V. (“ING Groep”). ING Groep is a global financial institution of Dutch origin offering banking, investments, life insurance and retirement services.
On October 19, 2008, ING Groep announced that it reached an agreement with the Dutch government to strengthen its capital position. ING Groep issued non-voting core Tier-1 securities for a total consideration of EUR 10 billion to the Dutch State. The transaction boosts ING Bank’s core Tier-1 ratio, strengthens the insurance balance sheet and reduces ING Groep’s Debt/Equity ratio.
NOTE 2 — SIGNIFICANT ACCOUNTING POLICIES
The following significant accounting policies are consistently followed by the Portfolios in the preparation of their financial statements. Such policies are in conformity with U.S. generally accepted accounting principles for investment companies.
| A. | Security Valuation. Investments in equity securities traded on a national securities exchange are valued at the last reported sale price. Securities reported by NASDAQ are valued at the NASDAQ official closing prices. Securities traded on an exchange or NASDAQ for which there has been no sale and securities traded in the over-the-counter-market are valued at the mean between the last reported bid and ask prices. All investments quoted in foreign currencies will be valued daily in U.S. dollars on the basis of the foreign currency exchange rates prevailing at that time. Debt |
| | securities are valued at prices obtained from independent services or from one or more dealers making markets in the securities and may be adjusted based on the Portfolios’ valuation procedures. U.S. government obligations are valued by using market quotations or independent pricing services that use prices provided by market- makers or estimates of market values obtained from yield data relating to instruments or securities with similar characteristics. |
Investments in open-end mutual funds are valued at net asset value. Securities and assets for which market quotations are not readily available (which may include certain restricted securities, which are subject to limitations as to their sale) are valued at their fair values, as defined by the 1940 Act, and as determined in good faith by or under the supervision of the Portfolios’ Board of Directors (“Board”), in accordance with methods that are specifically authorized by the Board. Securities traded on exchanges, including foreign exchanges, which close earlier than the time that a Portfolio calculates its net asset value (“NAV”) may also be valued at their fair values, as defined by the 1940 Act, and as determined in good faith by or under the supervision of the Board, in accordance with methods that are specifically authorized by the Board. The valuation techniques applied in any specific instance are likely to vary from case to case. With respect to a restricted security, for example, consideration is generally given to the cost of the investment, the market value of any unrestricted securities of the same class at the time of valuation, the potential expiration of restrictions on the security, the existence of any registration rights, the costs to the Portfolios related to registration of the security, as well as factors relevant to the issuer itself. Consideration may also be given to the price and extent of any public trading in similar securities of the issuer or comparable companies’ securities. The value of a foreign security traded on an exchange outside the United States is generally based on its price on the principal foreign exchange where it trades as of the time a Portfolio determines its NAV or if the foreign exchange closes prior to the time a Portfolio determines its NAV, the most recent closing price of the foreign security on its principal exchange. Trading in certain non-U.S. securities may not take place on all days on which the New York Stock Exchange (“NYSE”) is open. Further, trading takes place in various foreign markets on days on which the NYSE
27
NOTES TO FINANCIAL STATEMENTSASOF JUNE 30, 2009 (UNAUDITED) (CONTINUED)
NOTE 2 — SIGNIFICANT ACCOUNTING POLICIES (continued)
is not open. Consequently, the calculation of a Portfolio’s NAV may not take place contemporaneously with the determination of the prices of securities held by a Portfolio in foreign securities markets. Further, the value of a Portfolio’s assets may be significantly affected by foreign trading on days when a shareholder cannot purchase or redeem shares of a Portfolio. In calculating a Portfolio’s NAV, foreign securities denominated in foreign currency are converted to U.S. dollar equivalents. If an event occurs after the time at which the market for foreign securities held by a Portfolio closes but before the time that a Portfolio’s NAV is calculated, such event may cause the closing price on the foreign exchange to not represent a readily available reliable market value quotation for such securities at the time a Portfolio determines its NAV. In such a case, a Portfolio will use the fair value of such securities as determined under a Portfolio’s valuation procedures. Events after the close of trading on a foreign market that could require a Portfolio to fair value some or all of its foreign securities include, among others, securities trading in the U.S. and other markets, corporate announcements, natural and other disasters, and political and other events. Among other elements of analysis in the determination of a security’s fair value, the Board has authorized the use of one or more independent research services to assist with such determinations. An independent research service may use statistical analyses and quantitative models to help determine fair value as of the time a Portfolio calculates its NAV. There can be no assurance that such models accurately reflect the behavior of the applicable markets or the effect of the behavior of such markets on the fair value of securities, or that such markets will continue to behave in a fashion that is consistent with such models. Unlike the closing price of a security on an exchange, fair value determinations employ elements of judgment. Consequently, the fair value assigned to a security may not represent the actual value that a Portfolio could obtain if it were to sell the security at the time of the close of the NYSE. Pursuant to procedures adopted by the Board, a Portfolio is not obligated to use the fair valuations suggested by any research service, and valuation recommendations provided by such research services may be overridden if other events
have occurred or if other fair valuations are determined in good faith to be more accurate. Unless an event is such that it causes a Portfolio to determine that the closing prices for one or more securities do not represent readily available reliable market value quotations at the time a Portfolio determines its NAV, events that occur between the time of the close of the foreign market on which they are traded and the close of regular trading on the NYSE will not be reflected in a Portfolio’s NAV. Investments in securities maturing in 60 days or less from date of acquisition are valued at amortized cost which approximates market value.
Effective for fiscal years beginning after November 15, 2007, Financial Accounting Standards Board (“FASB”) Statement of Financial Accounting Standards No. 157, “Fair Value Measurements”, establishes a hierarchy for measuring fair value of assets and liabilities. As required by the standard, each investment asset or liability of the Portfolios is assigned a level at measurement date based on the significance and source of the inputs to its valuation. Quoted prices in active markets for identical securities are classified as “Level 1”, inputs other than quoted prices for an asset or liability that are observable are classified as “Level 2” and unobservable inputs, including the sub-adviser’s judgment about the assumptions that a market participant would use in pricing an asset or liability are classified as “Level 3”. The inputs used for valuing securities are not necessarily an indication of the risks associated with investing in those securities. A table summarizing each Portfolios’ investments under these levels of classification is included following the Portfolios of Investments. For the six months ended June 30, 2009, there have been no significant changes to the fair valuation methodologies.
On April 9, 2009, the FASB issued FASB Staff Position No. FAS 157-4, Determining Fair Value When the Volume and Level of Activity for the Asset or Liability Have Significantly Decreased and Identifying Transactions That Are Not Orderly (“FSP 157-4”). FSP 157-4 requires enhanced disclosures about the inputs and valuation technique(s) used to measure fair value and a discussion of changes in valuation techniques and related inputs, if any, during the period. In addition, the three-level hierarchy disclosure and the level three roll-forward disclosure are to be expanded for each
28
NOTES TO FINANCIAL STATEMENTSASOF JUNE 30, 2009 (UNAUDITED) (CONTINUED)
NOTE 2 — SIGNIFICANT ACCOUNTING POLICIES (continued)
major category of equity and debt securities. There was no change to the financial position of the Portfolios and the results of their operations due to the adoption of FSP 157-4 and all disclosures have been made for the current period as part of the Notes to Financial Statements and Portfolio of Investments.
On March 19, 2008, the FASB issued Statement of Financial Accounting Standards No. 161 (“SFAS No. 161”), “Disclosure about Derivative Instruments and Hedging Activities.” This new accounting statement requires enhanced disclosures about an entity’s derivative and hedging activities. Entities are required to provide enhanced disclosures about (a) how and why an entity invests in derivatives, (b) how derivatives are accounted for under SFAS No. 133, and (c) how derivatives affect an entity’s financial position, financial performance, and cash flows. SFAS No. 161 also requires enhanced disclosures regarding credit-risk-related contingent features of derivative instruments. All changes to disclosures have been made in accordance with SFAS 161 and have been incorporated for the current period as part of the Notes to Financial Statements and Portfolio of Investments.
| B. | Security Transactions and Revenue Recognition. Securities transactions are accounted for on the trade date. Realized gains and losses are reported on the basis of identified cost of securities sold. Interest income is recorded on an accrual basis. Dividend income is recorded on the ex-dividend date, or for certain foreign securities, when the information becomes available to the Portfolios. Premium amortization and discount accretion are determined by the effective yield method. |
| C. | Foreign Currency Translation. The books and records of the Portfolios are maintained in U.S. dollars. Any foreign currency amounts are translated into U.S. dollars on the following basis: |
| | (1) | Market value of investment securities, other assets and liabilities — at the exchange rates prevailing at the end of the day. |
| | (2) | Purchases and sales of investment securities, income and expenses — at the rates of exchange prevailing on the respective dates of such transactions. |
Although the net assets and the market values are presented at the foreign exchange rates at the end of the day, the Portfolios do not isolate the portion of the results of operations resulting from changes in foreign exchange rates on investments from the fluctuations arising from changes in market prices of securities held. Such fluctuations are included with the net realized and unrealized gains or losses from investments. For securities, which are subject to foreign withholding tax upon disposition, liabilities are recorded on the Statements of Assets and Liabilities for the estimated tax withholding based on the securities’ current market value. Upon disposition, realized gains or losses on such securities are recorded net of foreign withholding tax.
Reported net realized foreign exchange gains or losses arise from sales of foreign currencies, currency gains or losses realized between the trade and settlement dates on securities transactions, the difference between the amounts of dividends, interest, and foreign withholding taxes recorded on a Portfolio’s books, and the U.S. dollar equivalent of the amounts actually received or paid. Net unrealized foreign exchange gains and losses arise from changes in the value of assets and liabilities other than investments in securities at fiscal year end, resulting from changes in the exchange rate. Foreign security and currency transactions may involve certain considerations and risks not typically associated with investing in U.S. companies and U.S. government securities. These risks include, but are not limited to, revaluation of currencies and future adverse political and economic developments, which could cause securities and their markets to be less liquid and prices more volatile than those of comparable U.S. companies and U.S. government securities.
| D. | Risk Exposures and the use of Derivative Instruments. Each Portfolio’s investment objectives permit it to enter into various types of derivatives contracts, including, but not limited to, futures contracts, forward foreign currency exchange contracts, credit default swaps, interest rate swaps, total return swaps, and purchased and written options. In doing so, the Portfolio will employ strategies in differing combinations to permit it to increase or decrease the level of risk, or change the level or types of exposure to market risk factors. This may allow the Portfolio to pursue its objectives more quickly, and efficiently than if it were to make direct purchases or sales of securities capable of affecting a similar response to market factors. |
29
NOTES TO FINANCIAL STATEMENTSASOF JUNE 30, 2009 (UNAUDITED) (CONTINUED)
NOTE 2 — SIGNIFICANT ACCOUNTING POLICIES (continued)
Market Risk Factors. In pursuit of its investment objectives, a Portfolio may seek to use derivatives to increase or decrease its exposure to the following market risk factors:
Credit Risk. Credit risk relates to the ability of the issuer to meet interest and principal payments, or both, as they come due. In general, lower-grade, higher-yield bonds are subject to credit risk to a greater extent than lower-yield, higher-quality bonds.
Equity Risk. Equity risk relates to the change in value of equity securities as they relate to increases or decreases in the general market.
Foreign Exchange Rate Risk. Foreign exchange rate risk relates to the change in U.S. dollar value of a security held that is denominated in a foreign currency. The U.S. dollar value of a foreign currency denominated security will decrease as the dollar appreciates against the currency, while the U.S. dollar value will increase as the dollar depreciates against the currency.
Interest Rate Risk. Interest rate risk refers to the fluctuations in value of fixed-income securities resulting from the inverse relationship between price and yield. For example, an increase in general interest rates will tend to reduce the market value of already issued fixed-income investments, and a decline in general interest rates will tend to increase their value. In addition, debt securities with longer maturities, which tend to have higher yields, are subject to potentially greater fluctuations in value from changes in interest rates than obligations with shorter maturities.
Risks of Investing in Derivatives. Each Portfolio’s use of derivatives can result in losses due to unanticipated changes in the market risk factors and the overall market. In instances where a Portfolio is using derivatives to decrease, or hedge, exposures to market risk factors for securities held by a Portfolio, there are also risks that those derivatives may not perform as expected resulting in losses for the combined or hedged positions.
The use of these strategies involves certain special risks, including a possible imperfect correlation, or even no correlation, between price movements of derivative instruments and price movements of related investments. While some strategies
involving derivative instruments can reduce the risk of loss, they can also reduce the opportunity for gain or even result in losses by offsetting favorable price movements in related investments or otherwise, due to the possible inability of a Portfolio to purchase or sell a portfolio security at a time that otherwise would be favorable or the possible need to sell a portfolio security at a disadvantageous time because the Portfolio is required to maintain asset coverage or offsetting positions in connection with transactions in derivative instruments. Additional associated risks from investing in derivatives also exist and potentially could have significant effects on the valuation of the derivative and a Portfolio. Associated risks are not the risks that a Portfolio is attempting to increase or decrease exposure to, per their investment objectives, but are the additional risks from investing in derivatives. Examples of these associated risks are liquidity risk, which is the risk that a Portfolio will not be able to sell the derivative in the open market in a timely manner, and counterparty credit risk, which is the risk that the counterparty will not fulfill its obligation to a Portfolio. Associated risks can be different for each type of derivative and are discussed by each derivative type in the following notes.
| E. | Futures Contracts. Each Portfolio may enter into futures contracts involving foreign currency, interest rates, securities and security indices. A futures contract is a commitment to buy or sell a specific amount of a financial instrument at a negotiated price on a stipulated future date. Each Portfolio may buy and sell futures contracts. Futures contracts traded on a commodities or futures exchange will be valued at the final settlement price or official closing price on the principal exchange as reported by such principal exchange at its trading session ending at, or most recently prior to, the time when the Portfolios assets are valued. |
Upon entering into a futures contract, each Portfolio is required to deposit either cash or securities (initial margin) in an amount equal to a certain percentage of the contract value. Subsequent payments (variation margin) are made or received by the Portfolio each day. The variation margin payments are equal to the daily changes in the contract value and are recorded as unrealized gains and losses. Open futures contracts are reported on a table following the each Portfolio of Investments. Securities held in collateralized accounts to cover initial margin requirements on
30
NOTES TO FINANCIAL STATEMENTSASOF JUNE 30, 2009 (UNAUDITED) (CONTINUED)
NOTE 2 — SIGNIFICANT ACCOUNTING POLICIES (continued)
open futures contracts are footnoted in the Portfolio of Investments. Cash collateral held by the broker to cover initial margin requirements on open futures contracts are noted in each Portfolio’s Statement of Assets and Liabilities. The net change in unrealized appreciation and depreciation is reported in each Portfolio’s Statement of Operations. Realized gains (losses) are reported in each Portfolio’s Statement of Operations at the closing or expiration of futures contracts.
Futures contracts are exposed to the market risk factor of the underlying financial instrument. During the six months ended June 30, 2009, each Portfolio has purchased futures contracts on various equity indexes to increase exposure to equity risk. Additional associated risks of entering into futures contracts include the possibility that there may be an illiquid market where each Portfolio is unable to liquidate the contract or enter into an offsetting position and, if used for hedging purposes, the risk that the price of the contract will correlate imperfectly with the prices of each Portfolio’s securities.
Each Portfolio invests in derivatives only if the expected risks and rewards are consistent with its investment objectives, and overall risk profile as described in the accompanying Notes to Financial Statements. For the six months ended June 30, 2009, the total number of open futures contracts as presented following each Portfolio of Investments is indicative of the volume of this derivative type.
| F. | Distributions to Shareholders. The Portfolios record distributions to their shareholders on the ex-dividend date. International Index, Russell™ Large Cap Index, Russell™ Mid Cap Index, Russell™ Small Cap Index and WisdomTreeSM Index declare and pay dividends semi-annually. RussellTM Large Cap Growth Index, RussellTM Large Cap Value Index, RussellTM Mid Cap Growth Index, Hang Seng Index and RussellTM Global Large Cap Index 75% declare and pay dividends annually. U.S. Bond Index declares and pays dividends quarterly. The Portfolios may make distributions on a more frequent basis to comply with the distribution requirements of the Internal Revenue Code. The characteristics of income and gains to be distributed are determined in accordance with income tax regulations, which may differ from U.S. generally accepted accounting principles for investment companies. |
| G. | Federal Income Taxes. It is the policy of the Portfolios to comply with subchapter M of the Internal Revenue Code and related excise tax provisions applicable to regulated investment companies and to distribute substantially all of their net investment income and any net realized capital gains to their shareholders. Therefore, no federal income tax provision is required. Management has considered the sustainability of the Portfolios’ tax position taken on federal income tax returns for all open tax years in making this determination. No capital gain distributions shall be made until any capital loss carryforwards have been fully utilized or expired. |
| H. | Use of Estimates. The preparation of financial statements in conformity with U.S. generally accepted accounting principles requires management to make estimates and assumptions that affect the reported amounts of assets and liabilities and disclosure of contingent assets and liabilities at the date of the financial statements and the reported amounts of increases and decreases in net assets from operations during the reporting period. Actual results could differ from those estimates. |
| I. | Securities Lending. Each Portfolio has the option to temporarily loan up to 33 1/3% of its total assets to brokers, dealers or other financial institutions in exchange for a negotiated lender’s fee. The borrower is required to fully collateralize the loans with cash or U.S. government securities. Generally, in the event of counterparty default, a Portfolio has the right to use collateral to offset losses incurred. There would be potential loss to a Portfolio in the event a Portfolio is delayed or prevented from exercising its right to dispose of the collateral. A Portfolio bears the risk of loss with respect to the investment of collateral. Engaging in securities lending could have a leveraging effect, which may intensify the credit, market and other risks associated with investing in a Portfolio. |
| J. | Illiquid and Restricted Securities. The Portfolios may not invest more than 15% of their net assets in illiquid securities. Illiquid securities are not readily marketable. Disposing of illiquid investments may involve time-consuming negotiation and legal expenses, and it may be difficult or impossible for the Portfolios to sell them promptly at an acceptable price. The Portfolios may also invest in restricted securities, which include those sold under Rule 144A of the |
31
NOTES TO FINANCIAL STATEMENTSASOF JUNE 30, 2009 (UNAUDITED) (CONTINUED)
NOTE 2 — SIGNIFICANT ACCOUNTING POLICIES (continued)
| | Securities Act of 1933 (“1933 Act”) or securities offered pursuant to Section 4(2) of the 1933 Act, and/or are subject to legal or contractual restrictions on resale and may not be publicly sold without registration under the 1933 Act. Certain restricted securities may be considered liquid pursuant to guidelines approved by the Board or may be deemed to be illiquid because they may not be readily marketable. Illiquid and restricted securities are valued using market quotations when readily available. In the absence of market quotations, the securities are valued based upon their fair value, as defined by the Act, determined under procedures approved by the Board. |
| K. | Organization Expenses and Offering Costs. Costs incurred with the organization of the Portfolios are expensed as incurred. Costs incurred with the offering of shares of the Portfolios are deferred and amortized over a period of twelve months. |
| L. | Indemnifications. In the normal course of business, the Company may enter into contracts that provide certain indemnifications. The Company’s maximum exposure under these arrangements is dependent on future claims that may be made against the Portfolios and, therefore, cannot be estimated; however, based on experience, the risk of loss from such claims is considered remote. |
NOTE 3 — INVESTMENT TRANSACTIONS
For the period ended June 30, 2009, the cost of purchases and the proceeds from the sales of securities, excluding short-term securities and U.S. government securities, were as follows:
| | | | | | |
| | | Purchases | | Sales |
RussellTM Large Cap Index | | $ | 362,999,823 | | $ | 38,525,339 |
RussellTM Large Cap Growth Index | | | 13,441,287 | | | 2,663,890 |
RussellTM Large Cap Value Index | | | 91,498,034 | | | 16,219,794 |
RussellTM Mid Cap Index | | | 220,831,311 | | | 28,752,946 |
RussellTM Mid Cap Growth Index | | | 85,250,212 | | | 20,354,241 |
RussellTM Small Cap Index | | | 78,002,178 | | | 35,636,092 |
U.S. Bond Index | | | 248,256,716 | | | 28,896,331 |
Hang Seng Index | | | 10,273,441 | | | 1,584,654 |
International Index | | | 254,851,256 | | | 7,781,460 |
RussellTM Global Large Cap Index 75% | | | 23,781,146 | | | 15,577,431 |
WisdomTreeSM Index | | | 109,366,697 | | | 90,527,672 |
U.S. government securities not included above were as follows:
| | | | | | |
| | | Purchases | | Sales |
U.S. Bond Index | | $ | 1,607,372,128 | | $ | 1,020,767,950 |
NOTE 4 — INVESTMENT MANAGEMENT, ADMINISTRATIVE AND LICENSING FEES
The Portfolios entered into investment management agreements (“Investment Management Agreements”) with the Investment Adviser. The Investment Management Agreements compensate the Investment Adviser with a fee, computed daily and payable monthly, based on the average daily net assets of each Portfolio, at the following annual rates:
| | |
RussellTM Large Cap Index | | 0.25% |
RussellTM Large Cap Growth Index(1) | | 0.45% |
RussellTM Large Cap Value Index(1) | | 0.45% |
RussellTM Mid Cap Index | | 0.31% |
RussellTM Mid Cap Growth Index(1) | | 0.45% |
RussellTM Small Cap Index | | 0.33% |
U.S. Bond Index | | 0.32% |
Hang Seng Index(1) | | 0.60% |
International Index | | 0.38% |
Russell Global Large Cap Index 75% | | 0.46% |
WisdomTreeSM Index | | 0.46% |
| (1) | | Pursuant to a side agreement dated May 1, 2009, ING Investments has agreed to waive 0.10% of each Portfolio’s advisory fee through May 1, 2011. This side agreement will only renew if ING Investments elects to renew it. |
The Investment Adviser entered into sub-advisory agreements with ING IM. ING IM acts as sub-adviser to all Portfolios except for U.S. Bond Index. Subject to such policies as the Board or the Investment Adviser may determine, ING IM manages the Portfolios’ assets in accordance with the Portfolios’ investment objectives, policies, and limitations.
Neuberger Berman Fixed Income LLC serves as sub-adviser to U.S. Bond Index pursuant to a Sub-Advisory Agreement effective May 4, 2009.
ING Portfolios are permitted to invest end-of-day cash balances into ING Institutional Prime Money Market Fund. Investment management fees paid by the Portfolios will be reduced by an amount equal to the management fees paid indirectly to ING Institutional Prime Money Market Fund with respect to assets invested by the Portfolios. For the period ended June 30, 2009, the Investment Adviser for RussellTM Large Cap Index, RussellTM Large Cap Growth Index, RussellTM Large Cap Value Index, RussellTM Mid Cap Index, RussellTM Mid Cap Growth Index, RussellTM Small Cap Index, U.S. Bond Index, Hang Seng Index, International Index, RussellTM Global Large Cap Index 75%, and WisdomTreeSM Index waived $18,080, $96, $494, $3,124, $516, $2,965, $31,624, $158, $2,150, $73, and $229 of such management fees, respectively. These fees are not subject to recoupment.
32
NOTES TO FINANCIAL STATEMENTSASOF JUNE 30, 2009 (UNAUDITED) (CONTINUED)
NOTE 4 — INVESTMENT MANAGEMENT, ADMINISTRATIVE AND LICENSING FEES (continued)
Pursuant to administration agreements, ING Funds Services, LLC (“IFS”), an indirect, wholly-owned subsidiary of ING Groep, acts as administrator and provides certain administrative and shareholder services necessary for Portfolio operations and is responsible for the supervision of other service providers. IFS is entitled to receive from each Portfolio a fee at an annual rate of 0.10% of daily net assets.
Russell Investment Group receives an annual licensing fee for the Russell Global Large Cap® Index, Russell Top 200® Index, Russell Top 200® Growth Index, Russell Top 200® Value Index, the Russell Midcap® Index, Russell Midcap® Growth Index and the Russell 2000® Index. WisdomTreeSM Index pays an annual licensing fee to WisdomTree Investments, Inc. Hang Seng Data Services Limited receives an estimated annual licensing fee for the Hang Seng Index.
In placing equity security transactions, the Investment Adviser or each sub-adviser is required to use its best efforts to choose a broker capable of providing brokerage services necessary to obtain the best execution for each transaction. Subject to this requirement, the Investment Adviser or each sub-adviser may allocate equity security transactions through certain designated broker-dealers. Some of these broker-dealers participate in commission recapture programs that have been established for the benefit of the Portfolios. Under these programs, the participating broker-dealers will return to a Portfolio a portion of the brokerage commissions (in the form of a credit to a Portfolio) paid to the broker-dealers to pay certain expenses of a Portfolio. These commission recapture payments benefit the Portfolios and not the Investment Adviser or each sub-adviser. Any amount credited to a Portfolio is reflected as brokerage commission recapture in the Statements of Operations.
NOTE 5 — DISTRIBUTION AND SERVICE FEES
ADV Class and Class S2 shares of the respective Portfolios are subject to a Shareholder Service and Distribution Plan (the “Plan”). Under the Plan, the Distributor is paid an annual shareholder service fee at the rate of 0.25% and an annual distribution fee at the rate of 0.25%(1) of the average daily net assets attributable to its ADV Class and Class S2 shares. The Distributor has contractually agreed to waive a portion of its fee equal to 0.10% of the average daily net assets attributable to the distribution fee paid by Class S2 of the respective Portfolios, so that the actual fee paid by a Portfolio is an annual rate of 0.15%. The expense waiver will continue through at least May 1, 2010.
Class S shares of the Portfolios have adopted Distribution Plans pursuant to Rule 12b-1 under the 1940 Act (the “12b-1 Plans”), whereby the Distributor is compensated by each Portfolio for expenses incurred in the distribution of each Portfolio’s shares (“Distribution Fees”). Pursuant to the 12b-1 Plans, the Distributor is entitled to a payment each month to compensate for expenses incurred in the distribution and promotion of each Portfolio’s shares, including expenses incurred in printing prospectuses and reports used for sales purposes, expenses incurred in preparing and printing
sales literature and other such distribution related expenses, including any distribution or shareholder servicing fees (“Service Fees”) paid to securities dealers who have executed a distribution agreement with the Distributor. Under the 12b-1 Plans, Class S shares of the Portfolios pay the Distributor a fee calculated at an annual rate of 0.25%(2) of average daily net assets.
| (1) | Effective May 1, 2009, IFD has agreed to waive 0.01% of the distribution fee for Class ADV shares of International Index through May 1, 2010. |
| (2) | Effective January 16, 2008, IFD has agreed to waive a portion of the service/distribution fees for Class S Shares of WisdomTreeSM Index so that the fees collected will not exceed 0.19% through May 1, 2009. |
NOTE 6 — OTHER TRANSACTIONS WITH AFFILIATED AND RELATED PARTIES
At June 30, 2009, the Portfolios had the following amounts recorded in payable to affiliates on the accompanying Statements of Assets and Liabilities (see Notes 4 and 5):
| | | | | | | | | | | | | | | |
Fund | | Accrued
Investment
Management
Fees | | Accrued
Administrative
Fees | | Accrued
Shareholder
Service and
Distribution
Fees | | Accrued
Recoupment | | Total |
Russell™ Large Cap Index | | $ | 289,025 | | $ | 117,571 | | $ | 11,389 | | $ | — | | $ | 417,985 |
Russell™ Large Cap Growth Index | | | 3,265 | | | 945 | | | 138 | | | — | | | 4,348 |
Russell™ Large Cap Value Index | | | 23,375 | | | 6,707 | | | 147 | | | — | | | 30,229 |
Russell™ Mid Cap Index | | | 70,474 | | | 22,927 | | | 11,465 | | | — | | | 104,866 |
Russell™ Mid Cap Growth Index | | | 20,327 | | | 5,850 | | | 263 | | | — | | | 26,440 |
Russell™ Small Cap Index | | | 70,012 | | | 21,430 | | | 19,942 | | | — | | | 111,384 |
U.S. Bond Index | | | 254,987 | | | 81,860 | | | 57,998 | | | 13,561 | | | 408,406 |
Hang Seng Index | | | 3,674 | | | 751 | | | 1,879 | | | — | | | 6,304 |
International Index | | | 148,514 | | | 39,229 | | | 3,679 | | | — | | | 191,422 |
Russell™ Global Large Cap Index 75% | | | 20,234 | | | 4,400 | | | 11,001 | | | 30,904 | | | 66,539 |
WisdomTreeSM Index | | | 71,858 | | | 13,894 | | | 34,735 | | | — | | | 120,487 |
33
NOTES TO FINANCIAL STATEMENTSASOF JUNE 30, 2009 (UNAUDITED) (CONTINUED)
NOTE 6 — OTHER TRANSACTIONS WITH AFFILIATED AND RELATED PARTIES (continued)
The Company has adopted a Deferred Compensation Plan (the “Policy”), which allows eligible non-affiliated directors as described in the Policy to defer the receipt of all or a portion of the directors’ fees payable. Deferred fees are invested in various funds advised by ING Investments until distribution in accordance with the Policy.
At June 30, 2009, the following ING Portfolios or indirect, wholly owned subsidiaries of ING Groep owned more than 5% of the following Portfolios:
| | |
ING Life Insurance & Annuity Company— | | Russell™ Mid Cap Index (8.10%) |
| | Russell™ Small Cap Index (9.80%) |
ING Lifestyle Aggressive Growth Portfolio— | | International Index (18.00%) |
| | Russell™ Large Cap Index (10.40%) |
| | Russell™ Large Cap Value Index (9.30%) |
| | Russell™ Mid Cap Index (12.20%) |
| | Russell™ Mid Cap Growth Index (13.90%) |
| | Russell™ Small Cap Index (6.10%) |
ING Lifestyle Conservative Portfolio— | | Russell™ Large Cap Growth Index (20.30%) |
ING Lifestyle Growth Portfolio— | | Russell™ Large Cap Index (34.30%) |
| | Russell™ Large Cap Value Index (40.00%) |
| | Russell™ Mid Cap Index (32.50%) |
| | Russell™ Mid Cap Growth Index (45.60%) |
| | Russell™ Small Cap Index (25.60%) |
| | U.S. Bond Index (29.30%) |
| | International Index (37.20%) |
ING Lifestyle Moderate Growth Portfolio— | | Russell™ Large Cap Index (30.20%) |
| | Russell™ Large Cap Value Index (34.00%) |
| | Russell™ Mid Cap Index (18.30%) |
| | Russell™ Mid Cap Growth Index (26.20%) |
| | Russell™ Small Cap Index (10.90%) |
| | U.S. Bond Index (21.00%) |
| | International Index (24.20%) |
ING Lifestyle Moderate Portfolio— | | Russell™ Large Cap Index (14.60%) |
| | Russell™ Large Cap Growth Index (72.90%) |
| | Russell™ Large Cap Value Index (13.60%) |
| | Russell™ Mid Cap Index (10.70%) |
| | Russell™ Mid Cap Growth Index (11.90%) |
| | Russell™ Small Cap Index (6.60%) |
| | U.S. Bond Index (11.70%) |
| | International Index (11.00%) |
ING USA Annuity and Life Insurance Company— | | Russell™ Large Cap Growth Index (5.20%) |
| | Russell™ Mid Cap Index (13.80%) |
| | Russell™ Small Cap Index (33.90%) |
| | U.S. Bond Index (24.20%) |
| | Hang Seng Index (72.50%) |
| | Wisdom TreeSM Index (97.60%) |
ING USA Life & Annuity Company— | | Russell™ Global Large Cap Index 75% (99.80%) |
Reliastar Life Insurance Company— | | Hang Seng Index (26.50%) |
Control is defined by the 1940 Act as the beneficial ownership, either directly or through one or more controlled companies, of more than 25% of the voting securities of a company. The 1940 Act defines affiliates as companies that are under common control. Therefore, because the Portfolios have a common owner that owns over 25% of the outstanding securities of the Portfolios, they may be deemed to be affiliates of each other. Investment activities of these shareholders could have a material impact on the Portfolios.
NOTE 7 — OTHER ACCRUED EXPENSES AND LIABILITIES
At June 30, 2009, the following portfolios had the following payables included in Other Accrued Expenses and Liabilities on the Statements of Assets and Liabilities that exceed 5% of total liabilities.
| | | | | |
Fund | | Accrued Expenses | | Amount |
Hang Seng Index | | Accrued Offering | | $ | 18,825 |
WisdomTreeSM Index | | Custody | | | 82,340 |
34
NOTES TO FINANCIAL STATEMENTSASOF JUNE 30, 2009 (UNAUDITED) (CONTINUED)
NOTE 8 — EXPENSE LIMITATION AGREEMENTS
ING Investments entered into written expense limitation agreements (“Expense Limitation Agreements”) with each of the following Portfolios whereby the Investment Adviser has agreed to limit expenses, excluding interest expense, taxes, brokerage commissions and extraordinary expenses (and acquired fund fees and expenses) to the levels listed below:
| | | | | | | | |
| | | Class ADV | | Class I | | Class S | | Class S2 |
Russell™ Large Cap Index | | 0.87% | | 0.37% | | 0.62% | | 0.77% |
Russell™ Mid Cap Index | | 0.93% | | 0.43% | | 0.68% | | 0.83% |
Russell™ Small Cap Index | | 0.95% | | 0.45% | | 0.70% | | 0.85% |
U.S. Bond Index | | 0.95% | | 0.45% | | 0.70% | | 0.85% |
International Index | | 1.00% | | 0.50% | | 0.75% | | 0.90% |
Russell™ Global Large Cap Index 75% | | 1.10% | | 0.60% | | 0.85% | | N/A |
WisdomTreeSM Index(1) | | 1.34% | | 0.84% | | 1.09% | | N/A |
| (1) | | Prior to May 1, 2009, the expense limits for the Portfolio were 1.20%, 0.70% and 0.89% for Classes ADV, I and S, respectively. |
The Investment Adviser may at a later date recoup from a Portfolio management fees waived and other expenses assumed by the Investment Adviser during the previous 36 months, but only if, after such recoupment, the Portfolio’s expense ratio does not exceed the percentage described above. Waived and reimbursed fees net of any recoupment by the Investment Adviser of such waived and reimbursed fees are reflected on the accompanying Statements of Operations. Amounts payable by the Investment Manager are reflected on the accompanying Statements of Assets and Liabilities for each Portfolio.
As of June 30, 2009, the amount of waived and reimbursed fees that are subject to recoupment by the Investment Adviser, and the related expiration dates are as follows:
| | | | | | | | | | | | |
| | | June 30, | | |
| | | 2010 | | 2011 | | 2012 | | Total |
Russell™ Large Cap Index | | $ | — | | $ | 31,695 | | $ | 214,721 | | $ | 246,416 |
Russell™ Mid Cap Index | | | — | | | 37,944 | | | 63,097 | | | 101,041 |
Russell™ Small Cap Index | | | — | | | 30,352 | | | 112,293 | | | 142,645 |
U.S. Bond Index | | | — | | | — | | | 8,367 | | | 8,367 |
International Index | | | — | | | 38,687 | | | 442,437 | | | 481,124 |
Russell™ Global Large Cap Index 75% | | | — | | | — | | | 228,181 | | | 228,181 |
WisdomTreeSM Index | | | — | | | 91,162 | | | 568,356 | | | 659,518 |
The Expense Limitation Agreements are contractual and shall renew automatically for one-year terms unless ING Investments provides written notice of the termination of an Expense Limitation Agreement within 90 days of the end of the then current term.
NOTE 9 — BORROWINGS
The Portfolios included in this report, in addition to certain other portfolios managed by the Investment Adviser, have entered into an unsecured committed revolving line of credit agreement with the Bank of New York Mellon (the “Credit Agreement”) for an aggregate amount of $100,000,000. The proceeds may be used to: (1) temporarily finance the purchase or sale of securities; and (2) finance the redemption of shares of an investor in the Portfolios to which a loan is made. The Portfolios to which the line of credit is available pay a commitment fee equal to 0.125% per annum on the daily unused portion of the committed line amount.
Generally, borrowings under the credit agreement accrue interest at the federal funds rate plus a specified margin. Repayments generally must be made within 60 days after the date of a revolving credit advance.
The following Portfolios utilized the line of credit during the six months ended June 30, 2009:
| | | | | | | | |
| | | Days Utilized | | Approximate Average Daily Balance | | Approximate Weighted Average Interest Rate | |
Russell™ Large Cap Index | | 4 | | $ | 970,000 | | 1.18 | % |
Russell™ Mid Cap Index | | 1 | | | 1,910,000 | | 1.18 | |
Russell™ Small Cap Index | | 3 | | | 650,000 | | 1.23 | |
International Index | | 3 | | | 2,260,000 | | 1.17 | |
Russell™ Global Large Cap Index 75% | | 6 | | | 610,000 | | 1.18 | |
WisdomTreeSM Index(1) | | 27 | | | 2,123,704 | | 1.19 | |
| (1) | | At June 30, 2009, WisdomTreeSM Index had an outstanding balance of $120,000. |
35
NOTES TO FINANCIAL STATEMENTSASOF JUNE 30, 2009 (UNAUDITED) (CONTINUED)
NOTE 10 — CAPITAL SHARES
Transactions in capital shares and dollars were as follows:
| | | | | | | | | | | | | | | | | | | | |
| | | Shares
sold | | Reinvestment
of
distributions | | Shares
redeemed | | | Net increase
(decrease) in
shares
outstanding | | | | Shares
sold | | Reinvestment
of
distributions | | Shares
redeemed | | | Net increase
(decrease) |
Year or period ended | | # | | # | | # | | | # | | | | ($) | | ($) | | ($) | | | ($) |
Russell™ Large Cap Index | | | | | | | | | | | | | | | | |
Class ADV | | | | | | | | | | | | | | | | | | | | |
06-30-09 | | 272,740 | | — | | (83,368 | ) | | 189,372 | | | | 1,906,919 | | — | | (555,497 | ) | | 1,351,422 |
12-31-08 | | 173,419 | | 1,477 | | (16,983 | ) | | 157,913 | | | | 1,601,543 | | 10,253 | | (129,180 | ) | | 1,482,616 |
Class I | | | | | | | | | | | | | | | | | | | | |
06-30-09 | | 45,827,400 | | 23,688 | | (4,848,893 | ) | | 41,002,195 | | | | 310,044,616 | | 165,344 | | (31,290,261 | ) | | 278,919,699 |
03-10-08(1) - 12-31-08 | | 156,568,086 | | 1,639,729 | | (11,418,011 | ) | | 146,789,804 | | | | 1,462,652,407 | | 11,412,515 | | (104,015,660 | ) | | 1,370,049,262 |
Class S | | | | | | | | | | | | | | | | | | | | |
06-30-09 | | 4,623,713 | | — | | (1,654,316 | ) | | 2,969,397 | | | | 30,996,890 | | — | | (10,942,490 | ) | | 20,054,400 |
03-10-08(1) - 12-31-08 | | 5,238,385 | | 40,022 | | (1,315,701 | ) | | 3,962,706 | | | | 45,389,051 | | 278,152 | | (10,928,219 | ) | | 34,738,984 |
Class S2 | | | | | | | | | | | | | | | | | | | | |
02-27-09(1) - 06-30-09 | | 509 | | — | | — | | | 509 | | | | 3,000 | | — | | — | | | 3,000 |
Russell™ Large Cap Growth Index | | | | | | | | | | | | | | | | |
Class ADV | | | | | | | | | | | | | | | | | | | | |
05-01-09(1) - 06-30-09 | | 301 | | — | | — | | | 301 | | | | 3,010 | | — | | — | | | 3,010 |
Class I | | | | | | | | | | | | | | | | | | | | |
05-01-09(1) - 06-30-09 | | 1,058,539 | | — | | (36,418 | ) | | 1,022,121 | | | | 10,602,818 | | — | | (375,415 | ) | | 10,227,403 |
Class S | | | | | | | | | | | | | | | | | | | | |
05-01-09(1) - 06-30-09 | | 103,761 | | — | | (31,454 | ) | | 72,307 | | | | 1,077,019 | | — | | (334,299 | ) | | 742,720 |
Class S2 | | | | | | | | | | | | | | | | | | | | |
05-01-09(1) - 06-30-09 | | 301 | | — | | — | | | 301 | | | | 3,010 | | — | | — | | | 3,010 |
Russell™ Large Cap Value Index | | | | | | | | | | | | | | | | |
Class ADV | | | | | | | | | | | | | | | | | | | | |
05-01-09(1) - 06-30-09 | | 301 | | — | | — | | | 301 | | | | 3,010 | | — | | — | | | 3,010 |
Class I | | | | | | | | | | | | | | | | | | | | |
05-01-09(1) - 06-30-09 | | 7,735,559 | | — | | (125,315 | ) | | 7,610,244 | | | | 77,460,202 | | — | | (1,314,437 | ) | | 76,145,765 |
Class S | | | | | | | | | | | | | | | | | | | | |
05-01-09(1) - 06-30-09 | | 90,577 | | — | | (2,189 | ) | | 88,388 | | | | 956,242 | | — | | (22,799 | ) | | 933,443 |
Class S2 | | | | | | | | | | | | | | | | | | | | |
05-01-09(1) - 06-30-09 | | 301 | | — | | — | | | 301 | | | | 3,010 | | — | | — | | | 3,010 |
Russell™ Mid Cap Index | | | | | | | | | | | | | | | | |
Class ADV | | | | | | | | | | | | | | | | | | | | |
06-30-09 | | 98,992 | | — | | (5,995 | ) | | 92,997 | | | | 694,487 | | — | | (38,875 | ) | | 655,612 |
12-31-08 | | 12,095 | | 107 | | (2,981 | ) | | 9,221 | | | | 119,229 | | 673 | | (28,046 | ) | | 91,856 |
Class I | | | | | | | | | | | | | | | | | | | | |
06-30-09 | | 25,606,597 | | — | | (2,289,899 | ) | | 23,316,698 | | | | 181,051,787 | | — | | (15,295,740 | ) | | 165,756,047 |
03-10-08(1) - 12-31-08 | | 23,565,313 | | 250,309 | | (6,099,922 | ) | | 17,715,700 | | | | 241,572,524 | | 1,571,940 | | (55,109,453 | ) | | 188,035,011 |
Class S | | | | | | | | | | | | | | | | | | | | |
06-30-09 | | 4,258,934 | | — | | (568,148 | ) | | 3,690,786 | | | | 28,447,168 | | — | | (3,817,179 | ) | | 24,629,989 |
03-10-08(1) - 12-31-08 | | 4,220,077 | | 47,556 | | (447,800 | ) | | 3,819,833 | | | | 36,227,293 | | 298,651 | | (3,570,352 | ) | | 32,955,592 |
Class S2 | | | | | | | | | | | | | | | | | | | | |
02-27-09(1) - 06-30-09 | | 543 | | — | | — | | | 543 | | | | 3,000 | | — | | — | | | 3,000 |
| (1) | | Commencement of operations. |
36
NOTES TO FINANCIAL STATEMENTSASOF JUNE 30, 2009 (UNAUDITED) (CONTINUED)
NOTE 10 — CAPITAL SHARES (continued)
| | | | | | | | | | | | | | | | | | | | |
| | | Shares
sold | | Reinvestment
of
distributions | | Shares
redeemed | | | Net increase
(decrease) in
shares
outstanding | | | | Shares
sold | | Reinvestment
of
distributions | | Shares
redeemed | | | Net increase
(decrease) |
Year or period ended | | # | | # | | # | | | # | | | | ($) | | ($) | | ($) | | | ($) |
Russell™ Mid Cap Growth Index | | | | | | | | | | | | | | | | |
Class ADV | | | | | | | | | | | | | | | | | | | | |
05-01-09(1) - 06-30-09 | | 301 | | — | | — | | | 301 | | | | 3,010 | | — | | — | | | 3,010 |
Class I | | | | | | | | | | | | | | | | | | | | |
05-01-09(1) - 06-30-09 | | 6,676,815 | | — | | (67,497 | ) | | 6,609,318 | | | | 66,798,279 | | — | | (679,813 | ) | | 66,118,466 |
Class S | | | | | | | | | | | | | | | | | | | | |
05-01-09(1) - 06-30-09 | | 233,957 | | — | | (16,317 | ) | | 217,640 | | | | 2,445,635 | | — | | (170,526 | ) | | 2,275,109 |
Class S2 | | | | | | | | | | | | | | | | | | | | |
05-01-09(1) - 06-30-09 | | 2,004 | | — | | — | | | 2,004 | | | | 20,837 | | — | | — | | | 20,837 |
Russell™ Small Cap Index | | | | | | | | | | | | | | | | |
Class ADV | | | | | | | | | | | | | | | | | | | | |
06-30-09 | | 75,050 | | — | | (54,806 | ) | | 20,244 | | | | 561,339 | | — | | (364,620 | ) | | 196,719 |
12-31-08 | | 76,560 | | 736 | | (3,333 | ) | | 73,963 | | | | 617,766 | | 5,309 | | (30,133 | ) | | 592,942 |
Class I | | | | | | | | | | | | | | | | | | | | |
06-30-09 | | 5,729,528 | | — | | (3,296,044 | ) | | 2,433,484 | | | | 41,525,725 | | — | | (24,900,307 | ) | | 16,625,418 |
03-10-08(1) - 12-31-08 | | 21,909,094 | | 177,487 | | (4,948,044 | ) | | 17,138,537 | | | | 231,680,241 | | 1,283,228 | | (53,769,012 | ) | | 179,194,457 |
Class S | | | | | | | | | | | | | | | | | | | | |
06-30-09 | | 4,577,538 | | — | | (2,040,496 | ) | | 2,537,042 | | | | 33,817,274 | | — | | (14,124,972 | ) | | 19,692,302 |
03-10-08(1) - 12-31-08 | | 11,631,264 | | 90,510 | | (2,062,798 | ) | | 9,658,976 | | | | 120,555,417 | | 653,482 | | (17,880,941 | ) | | 103,327,958 |
Class S2 | | | | | | | | | | | | | | | | | | | | |
02-27-09(1) - 06-30-09 | | 498 | | — | | — | | | 498 | | | | 3,000 | | — | | — | | | 3,000 |
U.S. Bond Index | | | | | | | | | | | | | | | | |
Class ADV | | | | | | | | | | | | | | | | | | | | |
06-30-09 | | 79,045 | | 107 | | (1,228 | ) | | 77,924 | | | | 800,701 | | 1,081 | | (12,409 | ) | | 789,373 |
12-31-08 | | 91,269 | | 122 | | (77,228 | ) | | 14,163 | | | | 905,986 | | 1,224 | | (785,857 | ) | | 121,353 |
Class I | | | | | | | | | | | | | | | | | | | | |
06-30-09 | | 83,654,452 | | 196,089 | | (11,938,196 | ) | | 71,912,345 | | | | 845,874,108 | | 1,982,465 | | (121,277,415 | ) | | 726,579,158 |
03-07-08(1) - 12-31-08 | | 15,032,466 | | 132,177 | | (4,567,715 | ) | | 10,596,928 | | | | 151,617,806 | | 1,326,845 | | (45,352,057 | ) | | 107,592,594 |
Class S | | | | | | | | | | | | | | | | | | | | |
06-30-09 | | 13,217,114 | | 109,291 | | (3,344,586 | ) | | 9,981,819 | | | | 133,235,137 | | 1,102,744 | | (33,905,231 | ) | | 100,432,650 |
03-10-08(1) - 12-31-08 | | 21,942,330 | | 244,538 | | (4,306,957 | ) | | 17,879,911 | | | | 216,156,521 | | 2,441,731 | | (42,141,622 | ) | | 176,456,630 |
Class S2 | | | | | | | | | | | | | | | | | | | | |
02-27-09(1) - 06-30-09 | | 301 | | — | | — | | | 301 | | | | 3,000 | | — | | — | | | 3,000 |
Hang Seng Index | | | | | | | | | | | | | | | | |
Class ADV | | | | | | | | | | | | | | | | | | | | |
05-04-09(1) - 06-30-09 | | 301 | | — | | — | | | 301 | | | | 3,010 | | — | | — | | | 3,010 |
Class I | | | | | | | | | | | | | | | | | | | | |
05-04-09(1) - 06-30-09 | | 301 | | — | | — | | | 301 | | | | 3,010 | | — | | — | | | 3,010 |
Class S | | | | | | | | | | | | | | | | | | | | |
05-01-09(1) - 06-30-09 | | 1,041,722 | | — | | (25,541 | ) | | 1,016,181 | | | | 10,936,812 | | — | | (286,060 | ) | | 10,650,752 |
Class S2 | | | | | | | | | | | | | | | | | | | | |
05-04-09(1) - 06-30-09 | | 301 | | — | | — | | | 301 | | | | 3,010 | | — | | — | | | 3,010 |
| (1) | | Commencement of operations. |
37
NOTES TO FINANCIAL STATEMENTSASOF JUNE 30, 2009 (UNAUDITED) (CONTINUED)
NOTE 10 — CAPITAL SHARES (continued)
| | | | | | | | | | | | | | | | | | | | | |
| | | Shares
sold | | Reinvestment
of
distributions | | | Shares
redeemed | | | Net increase
(decrease) in
shares
outstanding | | | | Shares
sold | | Reinvestment
of
distributions | | Shares
redeemed | | | Net increase
(decrease) |
Year or period ended | | # | | # | | | # | | | # | | | | ($) | | ($) | | ($) | | | ($) |
International Index | | | | | | | | | | | | | | | | | |
Class ADV | | | | | | | | | | | | | | | | | | | | | |
06-30-09 | | 42,785 | | — | | | (1,660 | ) | | 41,125 | | | | 259,786 | | — | | (11,229 | ) | | 248,557 |
12-31-08 | | 302 | | — | | | — | | | 302 | | | | 3,015 | | — | | — | | | 3,015 |
Class I | | | | | | | | | | | | | | | | | | | | | |
06-30-09 | | 43,830,416 | | — | | | (6,100,388 | ) | | 37,730,028 | | | | 279,263,846 | | — | | (34,802,925 | ) | | 244,460,921 |
03-10-08(1) - 12-31-08 | | 40,895,819 | | 661,024 | | | (4,476,702 | ) | | 37,080,141 | | | | 418,500,442 | | 4,138,013 | | (41,281,528 | ) | | 381,356,927 |
Class S | | | | | | | | | | | | | | | | | | | | | |
06-30-09 | | 2,296,730 | | — | | | (476,836 | ) | | 1,819,894 | | | | 14,449,330 | | — | | (2,690,303 | ) | | 11,759,027 |
03-10-08(1) - 12-31-08 | | 1,326,452 | | 18,087 | | | (254,456 | ) | | 1,090,083 | | | | 11,028,390 | | 113,042 | | (1,898,169 | ) | | 9,243,263 |
Class S2 | | | | | | | | | | | | | | | | | | | | | |
02-27-09(1) - 06-30-09 | | 594 | | — | | | — | | | 594 | | | | 3,000 | | — | | — | | | 3,000 |
Russell™ Global Large Cap Index 75% | | | | | | | | | | | |
Class ADV | | | | | | | | | | | | | | | | | | | | | |
06-30-09 | | — | | — | | | — | | | — | | | | — | | — | | — | | | — |
12-31-08 | | 301 | | — | | | — | | | 301 | | | | 3,011 | | — | | — | | | 3,011 |
Class I | | | | | | | | | | | | | | | | | | | | | |
06-30-09 | | — | | — | | | — | | | — | | | | — | | — | | — | | | — |
12-31-08 | | 301 | | — | | | — | | | 301 | | | | 3,010 | | — | | — | | | 3,010 |
Class S | | | | | | | | | | | | | | | | | | | | | |
06-30-09 | | 988,746 | | (1,545 | ) | | (30,970 | ) | | 956,231 | | | | 7,582,190 | | — | | (261,063 | ) | | 7,321,127 |
12-31-08 | | 5,514,975 | | 5,250 | | | (183,378 | ) | | 5,336,847 | | | | 54,010,888 | | 41,786 | | (1,438,619 | ) | | 52,614,055 |
WisdomTreeSM Index | | | | | | | | | | | | | | | | | |
Class ADV | | | | | | | | | | | | | | | | | | | | | |
06-30-09 | | — | | — | | | — | | | — | | | | — | | — | | — | | | — |
12-31-08 | | 101 | | — | | | — | | | 101 | | | | 1,010 | | — | | — | | | 1,010 |
Class I | | | | | | | | | | | | | | | | | | | | | |
06-30-09 | | — | | — | | | — | | | — | | | | — | | — | | — | | | — |
12-31-08 | | 2,500,001 | | — | | | (2,500,000 | ) | | 1 | | | | 25,001,982 | | — | | (14,684,999 | ) | | 10,316,983 |
Class S | | | | | | | | | | | | | | | | | | | | | |
06-30-09 | | 5,506,490 | | — | | | (3,182,243 | ) | | 2,324,247 | | | | 29,642,333 | | — | | (17,595,576 | ) | | 12,046,757 |
01-28-08(1) - 12-31-08 | | 25,374,339 | | 825,843 | | | (1,328,583 | ) | | 24,871,599 | | | | 227,562,754 | | 4,806,407 | | (9,802,494 | ) | | 222,566,667 |
| (1) | | Commencement of operations. |
NOTE 11 — SECURITIES LENDING
Under an agreement with The Bank of New York Mellon (“BNY”), the Portfolios can lend their securities to approved brokers, dealers and other financial institutions. Loans are collateralized by cash and U.S. government securities. The collateral is equal to at least 105% of the market value of non-U.S. securities loaned and 102% of the market value of U.S. securities loaned when the transaction is entered into and is adjusted daily for changes in the market values of the securities
on loan. The cash collateral received is invested in approved investments as defined in the Securities Lending Agreement with BNY (the “Agreement”). The Portfolios bear the risk of loss with respect to the investment of collateral. Currently, the cash collateral is invested in the Bank of New York Mellon Corp. Institutional Cash Reserves Fund (“BICR Fund”). BNY serves as investment manager, custodian and operational trustee of the BICR Fund. As of June 30, 2009 and throughout the period covered by this report,
38
NOTES TO FINANCIAL STATEMENTSASOF JUNE 30, 2009 (UNAUDITED) (CONTINUED)
NOTE 11 — SECURITIES LENDING (continued)
the BICR Fund held certain defaulted securities that had market values significantly below amortized cost. The Portfolios agreed to the terms of capital support extended by The Bank of New York Mellon Corporation (“BNYC”), an affiliated company of BNY, for the certain defaulted securities held by the BICR Fund. BNYC will support the value of these securities up to a certain amount and subject, in part, to the Portfolios’ continued lending of securities. The recorded value of each Portfolio’s investment in the BICR Fund includes the value of the underlying securities held by the BICR Fund and the estimated value of the support to be provided by BNYC. The investment in the BICR Fund is included in the Portfolio of Investments under Securities Lending Collateral and the unrealized loss on such investment is included in Net Unrealized Depreciation on the Statements of Assets and Liabilities.
Generally, in the event of counterparty default, the Portfolios have the right to use the collateral to offset losses incurred. The Agreement contains certain guarantees by BNY in the event of counterparty default and/or a borrower’s failure to return a loaned security; however, there would be a potential loss to the Portfolios in the event the Portfolios are delayed or prevented from exercising their right to dispose of the collateral. Engaging in securities lending could have a leveraging effect, which may intensify the credit, market and other risks associated with investing in the Portfolios. At June 30, 2009, the following Portfolios had securities on loan with the following market values:
| | | | | | |
| | | Value of
Securities
Loaned | | Cash
Collateral
Received* |
RussellTM Mid Cap Index | | $ | 10,180,908 | | $ | 10,778,976 |
RussellTM Small Cap Index | | | 20,336,828 | | | 21,280,593 |
| * | Cash collateral received was invested in the BICR Fund, the fair value of which is presented in the respective Portfolio’s Portfolio of Investments |
NOTE 12 — CONCENTRATION OF INVESTMENT RISKS
Foreign Securities (International Index). Investments in foreign securities may entail risks not present in domestic investments. Since securities in which the Portfolios may invest are denominated in foreign currencies, changes in the relationship of these foreign currencies to the U.S. dollar can significantly affect the value of the investments and earnings of the Portfolios. Foreign investments may also subject
the Portfolios to foreign government exchange restrictions, expropriation, taxation or other political, social or economic developments, as well as changes vis-a-vis the U.S. dollar from movements in currency, and changes in security value and interest rate, all of which could affect the market and/or credit risk of the Portfolios’ investments.
Emerging Markets Investments (Hang Seng Index and WisdomTreeSM Index). Because of less developed markets and economies and, in some countries, less mature governments and governmental institutions, the risks of investing in foreign securities can be intensified in the case of investments in issuers domiciled or doing substantial business in emerging market countries.
Index Strategy (All Portfolios). A Portfolio may use an indexing strategy that does not attempt to manage market volatility, use defensive strategies or reduce the effects of any long-term periods of poor stock performance. The correlation between a Portfolio and an index performance may be affected by the Portfolio’s expenses, and the timing of purchases and redemptions of a Portfolio’s shares.
Derivatives (All Portfolios). Generally, derivatives can be characterized as financial instruments whose performance is derived, at least in part, from the performance of an underlying asset or assets. Some derivatives are sophisticated instruments that typically involve a small investment of cash relative to the magnitude of risks assumed. These may include swap agreements, options, forwards and futures. Derivative securities are subject to market risk which could be significant for those that have a leveraging effect. Derivatives are also subject to credit risks related to the counterparty’s ability to perform and any deterioration in the counterparty’s creditworthiness could adversely affect the instrument. In addition, derivatives and their underlying securities may experience periods of illiquidity which could cause a Portfolio to hold a security it might otherwise sell or could force the sale of a security at inopportune times or for prices that do not reflect current market value. A risk of using derivatives is that a Portfolio’s adviser or sub-adviser might imperfectly judge the market’s direction.
NOTE 13 — FEDERAL INCOME TAXES
The amount of distributions from net investment income and net realized capital gains are determined in accordance with federal income tax regulations, which may differ from U.S. generally accepted accounting
39
NOTES TO FINANCIAL STATEMENTSASOF JUNE 30, 2009 (UNAUDITED) (CONTINUED)
NOTE 13 — FEDERAL INCOME TAXES (continued)
principles for Investment companies. These book/tax differences may be either temporary or permanent. Permanent differences are reclassified within the capital accounts based on their federal tax-basis treatment; temporary differences are not reclassified. Key differences include the treatment of short-term capital gains, foreign currency transactions, and wash
sale deferrals. Distributions in excess of net investment income and/or net realized capital gains for tax purposes are reported as return of capital.
Dividends paid by the Portfolios from net investment income and distributions of net realized short-term capital gains are, for federal income tax purposes, taxable as ordinary income to shareholders.
The tax composition of dividends and distributions to shareholders was as follows:
| | | | | | | | | |
| | | Six Months Ended
June 30, 2009 | | Year Ended
December 31, 2008 |
| | | Ordinary Income | | Ordinary Income | | Return of Capital |
RussellTM Large Cap Index | | $ | 165,344 | | $ | 11,700,920 | | $ | — |
RussellTM Mid Cap Index | | | — | | | 1,685,154 | | | 186,110 |
RussellTM Small Cap Index | | | — | | | 1,725,162 | | | 216,857 |
U.S. Bond Index | | | 3,086,304 | | | 4,200,446 | | | — |
International Index | | | — | | | 4,251,080 | | | — |
Russell Global Large Cap Index 75% | | | — | | | 478,841 | | | — |
WisdomTreeSM Index | | | — | | | 4,806,424 | | | — |
The tax-basis components of distributable earnings and the expiration dates of the capital loss carryforwards which may be used to offset future realized capital gains for federal income tax purposes as of December 31, 2008 were:
| | | | | | | | | | | | | | | | | | | | |
| | | Undistributed Ordinary Income | | Undistributed Long-Term Capital Gains | | Unrealized Appreciation/ (Depreciation) | | | Post-October Capital Loss Deferred | | | Capital Loss Carryforwards | | | Expiration Dates |
RussellTM Large Cap Index | | $ | 151,312 | | $ | — | | $ | (295,801,163 | ) | | $ | — | | | $ | (22,957,959 | ) | | 2016 |
RussellTM Mid Cap Index | | | — | | | — | | | (77,355,407 | ) | | | — | | | | (645,177 | ) | | 2016 |
RussellTM Small Cap Index | | | — | | | — | | | (65,758,273 | ) | | | — | | | | (9,091,866 | ) | | 2016 |
U.S. Bond Index | | | 2,278,506 | | | 5,794 | | | 1,586,642 | | | | — | | | | — | | | — |
International Index | | | — | | | — | | | (140,065,005 | ) | | | — | | | | (5,709,503 | ) | | 2016 |
Russell Global Large Cap Index 75% | | | — | | | — | | | (9,115,233 | ) | | | (82,265 | ) | | | (181,384 | ) | | 2016 |
WisdomTreeSM Index | | | — | | | — | | | (74,451,026 | ) | | | — | | | | (9,622,350 | ) | | 2016 |
The Portfolios’ major tax jurisdictions are federal and Arizona. The earliest tax year that remains subject to examination by these jurisdictions is 2008.
As of June 30, 2009, no provisions for income tax would be required in the Portfolios’ financial statements as a result of tax positions taken on federal income tax returns for open tax years. The Portfolios’ federal and state income and federal excise tax returns for tax years for which the applicable statutes of limitations have not expired are subject to examination by the Internal Revenue Service and state department of revenue.
NOTE 14 — SUBSEQUENT EVENTS
Dividends: Subsequent to June 30, 2009, the following Portfolio declared dividends and distributions of:
| | | | | | | | | | | | | |
| | | Per Share Amounts | | | | |
| | | Net
Investment Income | | Short-Term Capital Gains | | Long-Term Capital Gains | | Payable
Date | | Record
Date |
U.S. Bond Index | | | | | | | | | | | | | |
Class ADV | | $ | 0.0598 | | $ | 0.0220 | | $ | 0.0001 | | July 2, 2009 | | June 30, 2009 |
Class I | | $ | 0.0677 | | $ | 0.0220 | | $ | 0.0001 | | July 2, 2009 | | June 30, 2009 |
Class S | | $ | 0.0614 | | $ | 0.0220 | | $ | 0.0001 | | July 2, 2009 | | June 30, 2009 |
Class S2 | | $ | 0.0573 | | $ | 0.0220 | | $ | 0.0001 | | July 2, 2009 | | June 30, 2009 |
The Portfolios have evaluated events occurring after the balance sheet date (subsequent events) through August 26, 2009, the date the financial statements were available to be issued, to determine whether any subsequent events necessitated adjustment to or disclosure in the financial statements. Other than the above, no such subsequent events were identified.
40
| | |
ING RUSSELL™ LARGE CAP
INDEX PORTFOLIO | | PORTFOLIO OF INVESTMENTS AS OF JUNE 30, 2009 (UNAUDITED) |
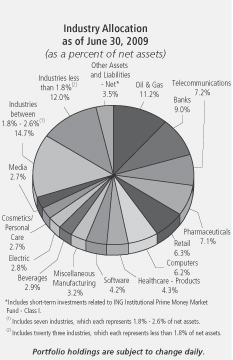
| | | | | | | |
| Shares | | | | | | Value |
| | | | | | | |
COMMON STOCK: 96.3% |
Advertising: 0.1% |
| 64,750 | | | | Omnicom Group | | $ | 2,044,805 |
| | | | | | | |
| | | | | | | 2,044,805 |
| | | | | | | |
Aerospace/Defense: 2.2% |
| 151,400 | | | | Boeing Co. | | | 6,434,500 |
| 72,050 | | | | General Dynamics Corp. | | | 3,990,850 |
| 66,350 | | | | Lockheed Martin Corp. | | | 5,351,128 |
| 67,450 | | | | Northrop Grumman Corp. | | | 3,081,116 |
| 82,150 | | | | Raytheon Co. | | | 3,649,925 |
| 174,400 | | | | United Technologies Corp. | | | 9,061,824 |
| | | | | | | |
| | | | | | | 31,569,343 |
| | | | | | | |
Agriculture: 2.1% |
| 431,050 | | | | Altria Group, Inc. | | | 7,064,910 |
| 133,850 | | | | Archer-Daniels-Midland Co. | | | 3,583,165 |
| 409,000 | | | | Philip Morris International, Inc. | | | 17,840,580 |
| 35,150 | | | | Reynolds American, Inc. | | | 1,357,493 |
| | | | | | | |
| | | | | | | 29,846,148 |
| | | | | | | |
Apparel: 0.3% |
| 75,300 | | | | Nike, Inc. | | | 3,899,034 |
| | | | | | | |
| | | | | | | 3,899,034 |
| | | | | | | |
Auto Manufacturers: 0.4% |
| 651,600 | | @ | | Ford Motor Co. | | | 3,955,212 |
| 75,750 | | | | Paccar, Inc. | | | 2,462,633 |
| | | | | | | |
| | | | | | | 6,417,845 |
| | | | | | | |
Auto Parts & Equipment: 0.2% |
| 123,900 | | | | Johnson Controls, Inc. | | | 2,691,108 |
| | | | | | | |
| | | | | | | 2,691,108 |
| | | | | | | |
| | | | | | | |
| Shares | | | | | | Value |
| | | | | | | |
Banks: 9.0% |
| 1,595,635 | | | | Bank of America Corp. | | $ | 21,062,382 |
| 249,250 | | | | Bank of New York Mellon Corp. | | | 7,305,518 |
| 134,900 | | | | BB&T Corp. | | | 2,965,102 |
| 94,200 | | | | Capital One Financial Corp. | | | 2,061,096 |
| 1,149,550 | | | | Citigroup, Inc. | | | 3,414,164 |
| 104,950 | | | | Goldman Sachs Group, Inc. | | | 15,473,828 |
| 783,785 | | | | JPMorgan Chase & Co. | | | 26,734,906 |
| 265,150 | | | | Morgan Stanley | | | 7,559,427 |
| 50,200 | | | | Northern Trust Corp. | | | 2,694,736 |
| 95,950 | | | | PNC Financial Services Group, Inc. | | | 3,723,820 |
| 102,950 | | | | State Street Corp. | | | 4,859,240 |
| 395,600 | | | | US Bancorp. | | | 7,089,152 |
| 991,671 | | | | Wells Fargo & Co. | | | 24,057,938 |
| | | | | | | |
| | | | | | | 129,001,309 |
| | | | | | | |
Beverages: 2.9% |
| 482,650 | | | | Coca-Cola Co. | | | 23,162,374 |
| 324,600 | | | | PepsiCo, Inc. | | | 17,840,016 |
| | | | | | | |
| | | | | | | 41,002,390 |
| | | | | | | |
Biotechnology: 2.1% |
| 211,100 | | @, S | | Amgen, Inc. | | | 11,175,634 |
| 60,200 | | @ | | Biogen Idec, Inc. | | | 2,718,030 |
| 95,950 | | @ | | Celgene Corp. | | | 4,590,248 |
| 56,250 | | @ | | Genzyme Corp. | | | 3,131,438 |
| 189,000 | | @ | | Gilead Sciences, Inc. | | | 8,852,760 |
| | | | | | | |
| | | | | | | 30,468,110 |
| | | | | | | |
Chemicals: 1.8% |
| 43,700 | | | | Air Products & Chemicals, Inc. | | | 2,822,583 |
| 232,000 | | | | Dow Chemical Co. | | | 3,744,480 |
| 188,350 | | | | EI Du Pont de Nemours & Co. | | | 4,825,527 |
| 113,800 | | | | Monsanto Co. | | | 8,459,892 |
| 33,000 | | | | Mosaic Co. | | | 1,461,900 |
| 64,100 | | | | Praxair, Inc. | | | 4,555,587 |
| | | | | | | |
| | | | | | | 25,869,969 |
| | | | | | | |
Coal: 0.1% |
| 55,750 | | | | Peabody Energy Corp. | | | 1,681,420 |
| | | | | | | |
| | | | | | | 1,681,420 |
| | | | | | | |
Commercial Services: 1.0% |
| 104,600 | | | | Automatic Data Processing, Inc. | | | 3,707,024 |
| 17,750 | | | | Mastercard, Inc. | | | 2,969,753 |
| 93,650 | | | | Visa, Inc. | | | 5,830,649 |
| 146,200 | | | | Western Union Co. | | | 2,397,680 |
| | | | | | | |
| | | | | | | 14,905,106 |
| | | | | | | |
Computers: 6.2% |
| 127,850 | | @@ | | Accenture Ltd. | | | 4,277,861 |
| 186,000 | | @ | | Apple, Inc. | | | 26,491,980 |
| 357,100 | | @ | | Dell, Inc. | | | 4,902,983 |
| 419,650 | | @ | | EMC Corp. | | | 5,497,415 |
| 498,600 | | | | Hewlett-Packard Co. | | | 19,270,890 |
| 275,550 | | | | International Business Machines Corp. | | | 28,772,931 |
| | | | | | | |
| | | | | | | 89,214,060 |
| | | | | | | |
Cosmetics/Personal Care: 2.7% |
| 104,150 | | | | Colgate-Palmolive Co. | | | 7,367,571 |
| 607,700 | | | | Procter & Gamble Co. | | | 31,053,470 |
| | | | | | | |
| | | | | | | 38,421,041 |
| | | | | | | |
See Accompanying Notes to Financial Statements
41
| | |
ING RUSSELL™ LARGE CAP
INDEX PORTFOLIO | | PORTFOLIO OF INVESTMENTS AS OF JUNE 30, 2009 (UNAUDITED) (CONTINUED) |
| | | | | | | |
| Shares | | | | | | Value |
| | | | | | | |
Diversified Financial Services: 1.1% |
| 211,600 | | | | American Express Co. | | $ | 4,917,584 |
| 4,150 | | | | Blackrock, Inc. | | | 727,993 |
| 197,900 | | | | Charles Schwab Corp. | | | 3,471,166 |
| 13,800 | | | | CME Group, Inc. | | | 4,293,318 |
| 31,450 | | | | Franklin Resources, Inc. | | | 2,264,715 |
| | | | | | | |
| | | | | | | 15,674,776 |
| | | | | | | |
Electric: 2.8% |
| 99,400 | | | | American Electric Power Co., Inc. | | | 2,871,666 |
| 123,050 | | | | Dominion Resources, Inc. | | | 4,112,331 |
| 268,350 | | | | Duke Energy Corp. | | | 3,915,227 |
| 40,900 | | | | Entergy Corp. | | | 3,170,568 |
| 137,300 | | | | Exelon Corp. | | | 7,031,133 |
| 63,600 | | | | FirstEnergy Corp. | | | 2,464,500 |
| 85,650 | | | | FPL Group, Inc. | | | 4,870,059 |
| 76,800 | | | | Pacific Gas & Electric Co. | | | 2,952,192 |
| 105,450 | | | | Public Service Enterprise Group, Inc. | | | 3,440,834 |
| 163,150 | | | | Southern Co. | | | 5,083,754 |
| | | | | | | |
| | | | | | | 39,912,264 |
| | | | | | | |
Electrical Components & Equipment: 0.4% |
| 156,700 | | | | Emerson Electric Co. | | | 5,077,080 |
| | | | | | | |
| | | | | | | 5,077,080 |
| | | | | | | |
Electronics: 0.2% |
| 87,200 | | @ | | Thermo Electron Corp. | | | 3,555,144 |
| | | | | | | |
| | | | | | | 3,555,144 |
| | | | | | | |
Energy - Alternate Sources: 0.1% |
| 10,700 | | @ | | First Solar, Inc. | | | 1,734,684 |
| | | | | | | |
| | | | | | | 1,734,684 |
| | | | | | | |
Environmental Control: 0.2% |
| 102,600 | | | | Waste Management, Inc. | | | 2,889,216 |
| | | | | | | |
| | | | | | | 2,889,216 |
| | | | | | | |
Food: 1.4% |
| 68,600 | | | | General Mills, Inc. | | | 3,842,972 |
| 53,000 | | | | Kellogg Co. | | | 2,468,210 |
| 307,050 | | | | Kraft Foods, Inc. | | | 7,780,647 |
| 136,050 | | | | Kroger Co. | | | 2,999,903 |
| 122,950 | | | | Sysco Corp. | | | 2,763,916 |
| | | | | | | |
| | | | | | | 19,855,648 |
| | | | | | | |
Healthcare - Products: 4.3% |
| 126,100 | | | | Baxter International, Inc. | | | 6,678,256 |
| 49,900 | | | | Becton Dickinson & Co. | | | 3,558,369 |
| 314,050 | | @ | | Boston Scientific Corp. | | | 3,184,467 |
| 574,500 | | | | Johnson & Johnson | | | 32,631,600 |
| 233,400 | | | | Medtronic, Inc. | | | 8,143,326 |
| 72,200 | | @ | | St. Jude Medical, Inc. | | | 2,967,420 |
| 70,550 | | | | Stryker Corp. | | | 2,803,657 |
| 44,850 | | @ | | Zimmer Holdings, Inc. | | | 1,910,610 |
| | | | | | | |
| | | | | | | 61,877,705 |
| | | | | | | |
Healthcare - Services: 1.0% |
| 93,150 | | | | Aetna, Inc. | | | 2,333,408 |
| 247,950 | | | | UnitedHealth Group, Inc. | | | 6,193,791 |
| 101,000 | | @ | | WellPoint, Inc. | | | 5,139,890 |
| | | | | | | |
| | | | | | | 13,667,089 |
| | | | | | | |
Household Products/Wares: 0.3% |
| 86,400 | | | | Kimberly-Clark Corp. | | | 4,529,952 |
| | | | | | | |
| | | | | | | 4,529,952 |
| | | | | | | |
| | | | | | | |
| Shares | | | | | | Value |
| | | | | | | |
Insurance: 1.6% |
| 97,500 | | | | Aflac, Inc. | | $ | 3,031,275 |
| 111,800 | | | | Allstate Corp. | | | 2,727,920 |
| 73,450 | | | | Chubb Corp. | | | 2,929,186 |
| 68,322 | | | | Loews Corp. | | | 1,872,023 |
| 120,300 | | | | Metlife, Inc. | | | 3,610,203 |
| 88,350 | | | | Prudential Financial, Inc. | | | 3,288,387 |
| 122,100 | | | | Travelers Cos., Inc. | | | 5,010,984 |
| | | | | | | |
| | | | | | | 22,469,978 |
| | | | | | | |
Internet: 2.6% |
| 68,500 | | @ | | Amazon.com, Inc. | | | 5,730,710 |
| 233,100 | | @ | | eBay, Inc. | | | 3,993,003 |
| 49,900 | | @ | | Google, Inc. - Class A | | | 21,037,341 |
| 171,200 | | @ | | Symantec Corp. | | | 2,663,872 |
| 247,650 | | @ | | Yahoo!, Inc. | | | 3,878,199 |
| | | | | | | |
| | | | | | | 37,303,125 |
| | | | | | | |
Iron/Steel: 0.2% |
| 65,500 | | | | Nucor Corp. | | | 2,910,165 |
| | | | | | | |
| | | | | | | 2,910,165 |
| | | | | | | |
Leisure Time: 0.2% |
| 91,400 | | | | Carnival Corp. | | | 2,355,378 |
| | | | | | | |
| | | | | | | 2,355,378 |
| | | | | | | |
Machinery - Construction & Mining: 0.3% |
| 125,450 | | | | Caterpillar, Inc. | | | 4,144,868 |
| | | | | | | |
| | | | | | | 4,144,868 |
| | | | | | | |
Machinery - Diversified: 0.2% |
| 88,100 | | | | Deere & Co. | | | 3,519,595 |
| | | | | | | |
| | | | | | | 3,519,595 |
| | | | | | | |
Media: 2.7% |
| 599,350 | | | | Comcast Corp. - Class A | | | 8,684,582 |
| 95,850 | | @ | | DIRECTV Group, Inc. | | | 2,368,454 |
| 108,000 | | @ | | Liberty Media Corp. - Entertainment | | | 2,889,000 |
| 474,650 | | | | News Corp. - Class A | | | 4,324,062 |
| 73,473 | | @ | | Time Warner Cable, Inc. | | | 2,326,890 |
| 249,450 | | | | Time Warner, Inc. | | | 6,283,646 |
| 113,150 | | @ | | Viacom - Class B | | | 2,568,505 |
| 387,100 | | | | Walt Disney Co. | | | 9,031,043 |
| | | | | | | |
| | | | | | | 38,476,182 |
| | | | | | | |
Mining: 0.8% |
| 203,150 | | | | Alcoa, Inc. | | | 2,098,540 |
| 85,850 | | | | Freeport-McMoRan Copper & Gold, Inc. | | | 4,301,944 |
| 99,850 | | | | Newmont Mining Corp. | | | 4,080,870 |
| 36,700 | | | | Southern Copper Corp. | | | 750,148 |
| | | | | | | |
| | | | | | | 11,231,502 |
| | | | | | | |
Miscellaneous Manufacturing: 3.2% |
| 144,800 | | | | 3M Co. | | | 8,702,480 |
| 53,900 | | | | Danaher Corp. | | | 3,327,786 |
| 2,207,850 | | | | General Electric Co. | | | 25,876,002 |
| 155,100 | | | | Honeywell International, Inc. | | | 4,870,140 |
| 93,550 | | | | Illinois Tool Works, Inc. | | | 3,493,157 |
| | | | | | | |
| | | | | | | 46,269,565 |
| | | | | | | |
Oil & Gas: 11.2% |
| 104,100 | | | | Anadarko Petroleum Corp. | | | 4,725,099 |
| 69,850 | | | | Apache Corp. | | | 5,039,678 |
| 130,500 | | | | Chesapeake Energy Corp. | | | 2,587,815 |
See Accompanying Notes to Financial Statements
42
| | |
ING RUSSELL™ LARGE CAP
INDEX PORTFOLIO | | PORTFOLIO OF INVESTMENTS AS OF JUNE 30, 2009 (UNAUDITED) (CONTINUED) |
| | | | | | | |
| Shares | | | | | | Value |
| | | | | | | |
Oil & Gas: (continued) |
| 417,900 | | | | Chevron Corp. | | $ | 27,685,875 |
| 308,900 | | | | ConocoPhillips | | | 12,992,334 |
| 92,500 | | | | Devon Energy Corp. | | | 5,041,250 |
| 52,150 | | | | EOG Resources, Inc. | | | 3,542,028 |
| 1,017,400 | | | | ExxonMobil Corp. | | | 71,126,434 |
| 60,550 | | | | Hess Corp. | | | 3,254,563 |
| 147,550 | | | | Marathon Oil Corp. | | | 4,445,682 |
| 169,050 | | | | Occidental Petroleum Corp. | | | 11,125,181 |
| 71,600 | | @ | | Southwestern Energy Co. | | | 2,781,660 |
| 107,700 | | | | Valero Energy Corp. | | | 1,819,053 |
| 120,850 | | | | XTO Energy, Inc. | | | 4,609,219 |
| | | | | | | |
| | | | | | | 160,775,871 |
| | | | | | | |
Oil & Gas Services: 1.6% |
| 64,600 | | | | Baker Hughes, Inc. | | | 2,354,024 |
| 187,050 | | | | Halliburton Co. | | | 3,871,935 |
| 87,150 | | @ | | National Oilwell Varco, Inc. | | | 2,846,319 |
| 249,450 | | | | Schlumberger Ltd. | | | 13,497,740 |
| | | | | | | |
| | | | | | | 22,570,018 |
| | | | | | | |
Pharmaceuticals: 7.1% |
| 322,200 | | | | Abbott Laboratories | | | 15,156,288 |
| 63,500 | | | | Allergan, Inc. | | | 3,021,330 |
| 413,000 | | | | Bristol-Myers Squibb Co. | | | 8,388,030 |
| 75,050 | | | | Cardinal Health, Inc. | | | 2,292,778 |
| 211,300 | | | | Eli Lilly & Co. | | | 7,319,432 |
| 51,700 | | @ | | Express Scripts, Inc. | | | 3,554,375 |
| 56,650 | | | | McKesson Corp. | | | 2,492,600 |
| 100,550 | | @ | | Medco Health Solutions, Inc. | | | 4,586,086 |
| 439,600 | | | | Merck & Co., Inc. | | | 12,291,216 |
| 1,406,850 | | | | Pfizer, Inc. | | | 21,102,750 |
| 340,300 | | | | Schering-Plough Corp. | | | 8,548,336 |
| 278,050 | | | | Wyeth | | | 12,620,690 |
| | | | | | | |
| | | | | | | 101,373,911 |
| | | | | | | |
Pipelines: 0.1% |
| 121,000 | | | | Williams Cos., Inc. | | | 1,888,810 |
| | | | | | | |
| | | | | | | 1,888,810 |
| | | | | | | |
Retail: 6.3% |
| 70,150 | | | | Best Buy Co., Inc. | | | 2,349,324 |
| 90,450 | | | | Costco Wholesale Corp. | | | 4,133,565 |
| 303,550 | | | | CVS Caremark Corp. | | | 9,674,139 |
| 100,600 | | | | Gap, Inc. | | | 1,649,840 |
| 353,700 | | | | Home Depot, Inc. | | | 8,357,931 |
| 63,500 | | @ | | Kohl’s Corp. | | | 2,714,625 |
| 307,350 | | | | Lowe’s Cos., Inc. | | | 5,965,664 |
| 230,000 | | | | McDonald’s Corp. | | | 13,222,700 |
| 149,150 | | | | Staples, Inc. | | | 3,008,356 |
| 153,400 | | @ | | Starbucks Corp. | | | 2,130,726 |
| 156,800 | | | | Target Corp. | | | 6,188,896 |
| 206,750 | | | | Walgreen Co. | | | 6,078,450 |
| 460,950 | | | | Wal-Mart Stores, Inc. | | | 22,328,418 |
| 96,200 | | | | Yum! Brands, Inc. | | | 3,207,308 |
| | | | | | | |
| | | | | | | 91,009,942 |
| | | | | | | |
Semiconductors: 2.1% |
| 277,200 | | | | Applied Materials, Inc. | | | 3,040,884 |
| 102,400 | | @ | | Broadcom Corp. | | | 2,538,496 |
| 1,164,400 | | | | Intel Corp. | | | 19,270,820 |
| 265,500 | | | | Texas Instruments, Inc. | | | 5,655,150 |
| | | | | | | |
| | | | | | | 30,505,350 |
| | | | | | | |
| | | | | | | |
| Shares | | | | | | Value |
| | | | | | | |
Software: 4.2% |
| 116,400 | | @ | | Activision Blizzard, Inc. | | $ | 1,470,132 |
| 109,150 | | @ | | Adobe Systems, Inc. | | | 3,088,945 |
| 1,606,900 | | | | Microsoft Corp. | | | 38,195,993 |
| 796,900 | | @ | | Oracle Corp. | | | 17,069,598 |
| 10,700 | | @ | | VMware, Inc. | | | 291,789 |
| | | | | | | |
| | | | | | | 60,116,457 |
| | | | | | | |
Telecommunications: 7.2% |
| 82,900 | | @ | | American Tower Corp. | | | 2,613,837 |
| 1,230,100 | | | | AT&T, Inc. | | | 30,555,684 |
| 1,202,600 | | @ | | Cisco Systems, Inc. | | | 22,416,464 |
| 323,950 | | | | Corning, Inc. | | | 5,202,637 |
| 109,100 | | @ | | Juniper Networks, Inc. | | | 2,574,760 |
| 478,000 | | | | Motorola, Inc. | | | 3,169,140 |
| 345,000 | | | | Qualcomm, Inc. | | | 15,594,000 |
| 583,200 | | @ | | Sprint Nextel Corp. | | | 2,805,192 |
| 592,250 | | | | Verizon Communications, Inc. | | | 18,199,843 |
| | | | | | | |
| | | | | | | 103,131,557 |
| | | | | | | |
Transportation: 1.8% |
| 54,750 | | | | Burlington Northern Santa Fe Corp. | | | 4,026,315 |
| 81,650 | | | | CSX Corp. | | | 2,827,540 |
| 64,950 | | | | FedEx Corp. | | | 3,612,519 |
| 76,500 | | | | Norfolk Southern Corp. | | | 2,881,755 |
| 105,050 | | | | Union Pacific Corp. | | | 5,468,903 |
| 144,150 | | | | United Parcel Service, Inc. - Class B | | | 7,206,059 |
| | | | | | | |
| | | | | | | 26,023,091 |
| | | | | | | |
| | | | Total Common Stock
(Cost $1,610,148,914) | | | 1,381,880,611 |
| | | | | | | |
REAL ESTATE INVESTMENT TRUSTS: 0.2% |
Regional Malls: 0.2% |
| 49,511 | | | | Simon Property Group, Inc. | | | 2,546,351 |
| | | | | | | |
| | | | Total Real Estate Investment Trusts (Cost $3,355,094) | | | 2,546,351 |
| | | | | | | |
| | | | Total Long-Term Investments
(Cost $1,613,504,008) | | | 1,384,426,962 |
| | | | | | | |
| | | | | | | | | | | |
SHORT-TERM INVESTMENTS: 6.7% | |
Affiliated Mutual Fund: 6.7% | |
| 96,354,000 | | S | | ING Institutional Prime Money Market Fund - Class I | | | | | | 96,354,000 | |
| | | | | | | | | | | |
| | | | Total Short-Term Investments
(Cost $96,354,000) | | | | | | 96,354,000 | |
| | | | | | | | | | | |
| | | | Total Investments in Securities
(Cost $1,709,858,008)* | | 103.2 | % | | $ | 1,480,780,962 | |
| | | | Other Assets and Liabilities - Net | | (3.2 | ) | | | (45,574,488 | ) |
| | | | | | | | | | | |
| | | | Net Assets | | 100.0 | % | | $ | 1,435,206,474 | |
| | | | | | | | | | | |
| @ | Non-income producing security |
| S | All or a portion of this security is segregated to cover collateral requirements for applicable futures, options, swaps, foreign forward currency contracts and/or when-issued or delayed-delivery securities. |
See Accompanying Notes to Financial Statements
43
| | |
ING RUSSELL™ LARGE CAP
INDEX PORTFOLIO | | PORTFOLIO OF INVESTMENTS AS OF JUNE 30, 2009 (UNAUDITED) (CONTINUED) |
| * | Cost for federal income tax purposes is $1,721,523,920. |
| | | | |
Net unrealized depreciation consists of: | |
Gross Unrealized Appreciation | | $ | 16,117,854 | |
Gross Unrealized Depreciation | | | (256,860,812 | ) |
| | | | |
Net Unrealized Depreciation | | $ | (240,742,958 | ) |
| | | | |
Fair Value Measurements*
The following is a summary of the inputs used as of June 30, 2009 in determining the Portfolio’s investments at fair value for purposes of SFAS 157:
| | | | | | | | | | |
| | | Quoted Prices in Active Markets for Identical Investments (Level 1) | | | Significant Other Observable Inputs (Level 2) | | Significant Unobservable Inputs (Level 3) |
Common Stock** | | $ | 1,381,880,611 | | | $ | — | | $ | — |
Real Estate Investment Trusts | | | 2,546,351 | | | | — | | | — |
Short-Term Investments | | | 96,354,000 | | | | — | | | — |
| | | | | | | | | | |
Total | | $ | 1,480,780,962 | | | $ | — | | $ | — |
| | | | | | | | | | |
Other Financial Instruments*** | | | (846,671 | ) | | | — | | | — |
| | | | | | | | | | |
Total | | $ | (846,671 | ) | | $ | — | | $ | — |
| | | | | | | | | | |
“Fair value” for purposes of SFAS 157 is different from “fair value” as used in the 1940 Act. The former generally implies market value, and can include market quotations as a source of value, and the latter refers to determinations of value in absence of available market quotations.
| * | See NOTE 2, “Significant Accounting Policies” in the Notes to Financial Statements for additional information. |
| ** | For further breakdown of Common Stock, by industry type, please refer to the Portfolio of Investments. |
| *** | Other financial instruments may include open forward foreign currency contracts, futures, swaps, and written options. Forward foreign currency contracts and futures are reported at their unrealized gain/loss at period end. Swaps and written options are reported at their market value at period end. |
ING Russell Large Cap Index Portfolio Open Futures Contracts on June 30, 2009:
| | | | | | | | |
Contract Description | | Number of Contracts | | Expiration Date | | Unrealized Depreciation | |
Long Contracts | | | | | | | | |
S&P 500 | | 211 | | 09/17/09 | | $ | (846,671 | ) |
| | | | | | | | |
| | | | | | $ | (846,671 | ) |
| | | | | | | | |
For the six months ended June 30, 2009, net realized gain (loss) on futures and the net change in unrealized gain (loss) on futures can be found on the Portfolio’s Statement of Operations. For additional information on the reason(s) why the Portfolio may enter into futures contracts and the risks associated with futures contracts, please refer to NOTE 2 in the accompanying Notes to Financial Statements.
See Accompanying Notes to Financial Statements
44
| | |
ING RUSSELL™ LARGE CAP GROWTH
INDEX PORTFOLIO | | PORTFOLIO OF INVESTMENTS AS OF JUNE 30, 2009 (UNAUDITED) |
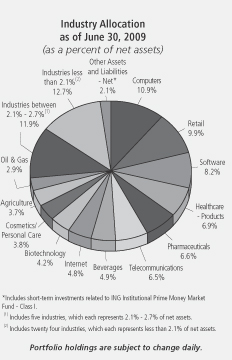
| | | | | | | |
| Shares | | | | | | Value |
| | | | | | | |
COMMON STOCK: 97.8% |
Advertising: 0.3% |
| 1,100 | | | | Omnicom Group | | $ | 34,738 |
| | | | | | | |
| | | | | | | 34,738 |
| | | | | | | |
Aerospace/Defense: 2.5% |
| 200 | | | | Boeing Co. | | | 8,500 |
| 100 | | | | General Dynamics Corp. | | | 5,539 |
| 1,100 | | | | Lockheed Martin Corp. | | | 88,715 |
| 100 | | | | Northrop Grumman Corp. | | | 4,568 |
| 1,000 | | | | Raytheon Co. | | | 44,430 |
| 2,540 | | | | United Technologies Corp. | | | 131,978 |
| | | | | | | |
| | | | | | | 283,730 |
| | | | | | | |
Agriculture: 3.7% |
| 6,800 | | | | Altria Group, Inc. | | | 111,452 |
| 1,200 | | | | Archer-Daniels-Midland Co. | | | 32,124 |
| 6,500 | | | | Philip Morris International, Inc. | | | 283,530 |
| | | | | | | |
| | | | | | | 427,106 |
| | | | | | | |
Apparel: 0.5% |
| 1,200 | | | | Nike, Inc. | | | 62,136 |
| | | | | | | |
| | | | | | | 62,136 |
| | | | | | | |
Auto Manufacturers: 0.3% |
| 1,100 | | | | Paccar, Inc. | | | 35,761 |
| | | | | | | |
| | | | | | | 35,761 |
| | | | | | | |
Auto Parts & Equipment: 0.2% |
| 1,100 | | | | Johnson Controls, Inc. | | | 23,892 |
| | | | | | | |
| | | | | | | 23,892 |
| | | | | | | |
Banks: 1.8% |
| 800 | | | | Bank of New York Mellon Corp. | | | 23,448 |
| 400 | | | | Capital One Financial Corp. | | | 8,752 |
| | | | | | | |
| Shares | | | | | | Value |
| | | | | | | |
Banks: (continued) |
| 60 | | | | Goldman Sachs Group, Inc. | | $ | 8,846 |
| 1,000 | | | | Morgan Stanley | | | 28,510 |
| 800 | | | | Northern Trust Corp. | | | 42,944 |
| 900 | | | | State Street Corp. | | | 42,480 |
| 2,300 | | | | Wells Fargo & Co. | | | 55,798 |
| | | | | | | |
| | | | | | | 210,778 |
| | | | | | | |
Beverages: 4.9% |
| 6,000 | | | | Coca-Cola Co. | | | 287,940 |
| 5,100 | | | | PepsiCo, Inc. | | | 280,296 |
| | | | | | | |
| | | | | | | 568,236 |
| | | | | | | |
Biotechnology: 4.2% |
| 3,300 | | @ | | Amgen, Inc. | | | 174,702 |
| 1,000 | | @ | | Biogen Idec, Inc. | | | 45,150 |
| 1,500 | | @ | | Celgene Corp. | | | 71,760 |
| 900 | | @ | | Genzyme Corp. | | | 50,103 |
| 3,000 | | @ | | Gilead Sciences, Inc. | | | 140,520 |
| | | | | | | |
| | | | | | | 482,235 |
| | | | | | | |
Chemicals: 2.4% |
| 270 | | | | Air Products & Chemicals, Inc. | | | 17,439 |
| 1,000 | | | | EI Du Pont de Nemours & Co. | | | 25,620 |
| 1,800 | | | | Monsanto Co. | | | 133,812 |
| 500 | | | | Mosaic Co. | | | 22,150 |
| 1,090 | | | | Praxair, Inc. | | | 77,466 |
| | | | | | | |
| | | | | | | 276,487 |
| | | | | | | |
Coal: 0.2% |
| 900 | | | | Peabody Energy Corp. | | | 27,144 |
| | | | | | | |
| | | | | | | 27,144 |
| | | | | | | |
Commercial Services: 2.1% |
| 1,600 | | | | Automatic Data Processing, Inc. | | | 56,704 |
| 300 | | | | Mastercard, Inc. | | | 50,193 |
| 1,500 | | | | Visa, Inc. | | | 93,390 |
| 2,300 | | | | Western Union Co. | | | 37,720 |
| | | | | | | |
| | | | | | | 238,007 |
| | | | | | | |
Computers: 10.9% |
| 2,000 | | @@ | | Accenture Ltd. | | | 66,920 |
| 2,900 | | @ | | Apple, Inc. | | | 413,047 |
| 5,600 | | @ | | Dell, Inc. | | | 76,888 |
| 700 | | @ | | EMC Corp. | | | 9,170 |
| 6,100 | | | | Hewlett-Packard Co. | | | 235,765 |
| 4,360 | | | | International Business Machines Corp. | | | 455,271 |
| | | | | | | |
| | | | | | | 1,257,061 |
| | | | | | | |
Cosmetics/Personal Care: 3.8% |
| 1,600 | | | | Colgate-Palmolive Co. | | | 113,184 |
| 6,300 | | | | Procter & Gamble Co. | | | 321,930 |
| | | | | | | |
| | | | | | | 435,114 |
| | | | | | | |
Diversified Financial Services: 0.9% |
| 600 | | | | American Express Co. | | | 13,944 |
| 40 | | S | | Blackrock, Inc. | | | 7,017 |
| 3,100 | | | | Charles Schwab Corp. | | | 54,374 |
| 40 | | | | CME Group, Inc. | | | 12,444 |
| 270 | | | | Franklin Resources, Inc. | | | 19,443 |
| | | | | | | |
| | | | | | | 107,222 |
| | | | | | | |
Electric: 0.2% |
| 200 | | | | Exelon Corp. | | | 10,242 |
| 200 | | | | FPL Group, Inc. | | | 11,372 |
| | | | | | | |
| | | | | | | 21,614 |
| | | | | | | |
See Accompanying Notes to Financial Statements
45
| | |
ING RUSSELL™ LARGE CAP GROWTH
INDEX PORTFOLIO | | PORTFOLIO OF INVESTMENTS AS OF JUNE 30, 2009 (UNAUDITED) (CONTINUED) |
| | | | | | | |
| Shares | | | | | | Value |
| | | | | | | |
Electrical Components & Equipment: 0.7% |
| 2,400 | | | | Emerson Electric Co. | | $ | 77,760 |
| | | | | | | |
| | | | | | | 77,760 |
| | | | | | | |
Electronics: 0.0% |
| 100 | | @ | | Thermo Electron Corp. | | | 4,077 |
| | | | | | | |
| | | | | | | 4,077 |
| | | | | | | |
Energy - Alternate Sources: 0.2% |
| 130 | | @ | | First Solar, Inc. | | | 21,076 |
| | | | | | | |
| | | | | | | 21,076 |
| | | | | | | |
Environmental Control: 0.4% |
| 1,500 | | | | Waste Management, Inc. | | | 42,240 |
| | | | | | | |
| | | | | | | 42,240 |
| | | | | | | |
Food: 1.3% |
| 500 | | S | | General Mills, Inc. | | | 28,010 |
| 900 | | | | Kellogg Co. | | | 41,913 |
| 1,800 | | | | Kroger Co. | | | 39,690 |
| 1,900 | | | | Sysco Corp. | | | 42,712 |
| | | | | | | |
| | | | | | | 152,325 |
| | | | | | | |
Healthcare - Products: 6.9% |
| 2,000 | | | | Baxter International, Inc. | | | 105,920 |
| 770 | | | | Becton Dickinson & Co. | | | 54,909 |
| 1,700 | | @ | | Boston Scientific Corp. | | | 17,238 |
| 7,000 | | | | Johnson & Johnson | | | 397,600 |
| 3,700 | | | | Medtronic, Inc. | | | 129,093 |
| 1,200 | | @ | | St. Jude Medical, Inc. | | | 49,320 |
| 1,100 | | | | Stryker Corp. | | | 43,714 |
| | | | | | | |
| | | | | | | 797,794 |
| | | | | | | |
Healthcare - Services: 0.1% |
| 300 | | | | Aetna, Inc. | | | 7,515 |
| 100 | | @ | | WellPoint, Inc. | | | 5,089 |
| | | | | | | |
| | | | | | | 12,604 |
| | | | | | | |
Household Products/Wares: 0.6% |
| 1,200 | | | | Kimberly-Clark Corp. | | | 62,916 |
| | | | | | | |
| | | | | | | 62,916 |
| | | | | | | |
Insurance: 0.6% |
| 1,500 | | | | Aflac, Inc. | | | 46,635 |
| 700 | | | | Prudential Financial, Inc. | | | 26,054 |
| | | | | | | |
| | | | | | | 72,689 |
| | | | | | | |
Internet: 4.8% |
| 1,100 | | @ | | Amazon.com, Inc. | | | 92,026 |
| 900 | | @ | | eBay, Inc. | | | 15,417 |
| 830 | | @ | | Google, Inc. - Class A | | | 349,920 |
| 2,700 | | @ | | Symantec Corp. | | | 42,012 |
| 3,700 | | @ | | Yahoo!, Inc. | | | 57,942 |
| | | | | | | |
| | | | | | | 557,317 |
| | | | | | | |
Leisure Time: 0.2% |
| 700 | | | | Carnival Corp. | | | 18,039 |
| | | | | | | |
| | | | | | | 18,039 |
| | | | | | | |
Machinery - Construction & Mining: 0.3% |
| 1,000 | | | | Caterpillar, Inc. | | | 33,040 |
| | | | | | | |
| | | | | | | 33,040 |
| | | | | | | |
| | | | | | | |
| Shares | | | | | | Value |
| | | | | | | |
Machinery - Diversified: 0.1% |
| 400 | | | | Deere & Co. | | $ | 15,980 |
| | | | | | | |
| | | | | | | 15,980 |
| | | | | | | |
Media: 0.4% |
| 700 | | | | Comcast Corp. - Class A | | | 10,143 |
| 1,500 | | @ | | DIRECTV Group, Inc. | | | 37,065 |
| | | | | | | |
| | | | | | | 47,208 |
| | | | | | | |
Mining: 1.1% |
| 1,500 | | | | Alcoa, Inc. | | | 15,495 |
| 800 | | | | Freeport-McMoRan Copper & Gold, Inc. | | | 40,088 |
| 1,500 | | | | Newmont Mining Corp. | | | 61,305 |
| 400 | | | | Southern Copper Corp. | | | 8,176 |
| | | | | | | |
| | | | | | | 125,064 |
| | | | | | | |
Miscellaneous Manufacturing: 2.2% |
| 2,300 | | | | 3M Co. | | | 138,230 |
| 570 | | | | Danaher Corp. | | | 35,192 |
| 2,400 | | | | Honeywell International, Inc. | | | 75,360 |
| | | | | | | |
| | | | | | | 248,782 |
| | | | | | | |
Oil & Gas: 2.9% |
| 4,170 | | | | ExxonMobil Corp. | | | 291,525 |
| 1,200 | | @ | | Southwestern Energy Co. | | | 46,620 |
| | | | | | | |
| | | | | | | 338,145 |
| | | | | | | |
Oil & Gas Services: 0.8% |
| 1,700 | | | | Schlumberger Ltd. | | | 91,987 |
| | | | | | | |
| | | | | | | 91,987 |
| | | | | | | |
Pharmaceuticals: 6.6% |
| 5,000 | | | | Abbott Laboratories | | | 235,200 |
| 1,000 | | | | Allergan, Inc. | | | 47,580 |
| 3,600 | | | | Bristol-Myers Squibb Co. | | | 73,116 |
| 1,700 | | | | Eli Lilly & Co. | | | 58,888 |
| 800 | | @ | | Express Scripts, Inc. | | | 55,000 |
| 500 | | | | McKesson Corp. | | | 22,000 |
| 1,500 | | @ | | Medco Health Solutions, Inc. | | | 68,415 |
| 1,300 | | | | Merck & Co., Inc. | | | 36,348 |
| 4,600 | | | | Schering-Plough Corp. | | | 115,552 |
| 1,000 | | | | Wyeth | | | 45,390 |
| | | | | | | |
| | | | | | | 757,489 |
| | | | | | | |
Retail: 9.9% |
| 1,100 | | | | Best Buy Co., Inc. | | | 36,839 |
| 1,500 | | | | Costco Wholesale Corp. | | | 68,550 |
| 1,500 | | | | CVS Caremark Corp. | | | 47,805 |
| 1,400 | | | | Gap, Inc. | | | 22,960 |
| 400 | | | | Home Depot, Inc. | | | 9,452 |
| 1,000 | | @ | | Kohl’s Corp. | | | 42,750 |
| 1,500 | | | | Lowe’s Cos., Inc. | | | 29,115 |
| 3,640 | | | | McDonald’s Corp. | | | 209,264 |
| 2,300 | | | | Staples, Inc. | | | 46,391 |
| 2,400 | | @ | | Starbucks Corp. | | | 33,336 |
| 2,500 | | | | Target Corp. | | | 98,675 |
| 3,300 | | | | Walgreen Co. | | | 97,020 |
| 7,300 | | | | Wal-Mart Stores, Inc. | | | 353,612 |
| 1,500 | | | | Yum! Brands, Inc. | | | 50,010 |
| | | | | | | |
| | | | | | | 1,145,779 |
| | | | | | | |
Semiconductors: 2.7% |
| 1,600 | | @ | | Broadcom Corp. | | | 39,664 |
| 11,300 | | | | Intel Corp. | | | 187,015 |
| 4,200 | | | | Texas Instruments, Inc. | | | 89,460 |
| | | | | | | |
| | | | | | | 316,139 |
| | | | | | | |
See Accompanying Notes to Financial Statements
46
| | |
ING RUSSELL™ LARGE CAP GROWTH
INDEX PORTFOLIO | | PORTFOLIO OF INVESTMENTS AS OF JUNE 30, 2009 (UNAUDITED) (CONTINUED) |
| | | | | | | |
| Shares | | | | | | Value |
| | | | | | | |
Software: 8.2% |
| 1,100 | | @ | | Activision Blizzard, Inc. | | $ | 13,893 |
| 1,700 | | @ | | Adobe Systems, Inc. | | | 48,110 |
| 25,350 | | | | Microsoft Corp. | | | 602,569 |
| 12,600 | | @ | | Oracle Corp. | | | 269,892 |
| 200 | | @ | | VMware, Inc. | | | 5,454 |
| | | | | | | |
| | | | | | | 939,918 |
| | | | | | | |
Telecommunications: 6.5% |
| 1,300 | | @ | | American Tower Corp. | | | 40,989 |
| 19,000 | | @ | | Cisco Systems, Inc. | | | 354,160 |
| 4,400 | | | | Corning, Inc. | | | 70,664 |
| 1,700 | | @ | | Juniper Networks, Inc. | | | 40,120 |
| 500 | | | | Motorola, Inc. | | | 3,315 |
| 5,400 | | | | Qualcomm, Inc. | | | 244,080 |
| | | | | | | |
| | | | | | | 753,328 |
| | | | | | | |
Transportation: 1.4% |
| 200 | | | | Norfolk Southern Corp. | | | 7,534 |
| 900 | | | | Union Pacific Corp. | | | 46,854 |
| 2,200 | | | | United Parcel Service, Inc. - Class B | | | 109,978 |
| | | | | | | |
| | | | | | | 164,366 |
| | | | | | | |
| | | | Total Common Stock
(Cost $10,839,622) | | | 11,287,323 |
| | | | | | | |
REAL ESTATE INVESTMENT TRUSTS: 0.1% |
Regional Malls: 0.1% |
| 307 | | | | Simon Property Group, Inc. | | | 15,789 |
| | | | | | | |
| | | | Total Real Estate Investment Trusts
(Cost $14,575) | | | 15,789 |
| | | | | | | |
| | | | Total Long-Term Investments
(Cost $10,854,197) | | | 11,303,112 |
| | | | | | | |
| | | | | | | | | | | |
SHORT-TERM INVESTMENTS: 7.1% | |
Affiliated Mutual Fund: 7.1% | |
| 821,000 | | S | | ING Institutional Prime Money Market Fund - Class I | | | | | | 821,000 | |
| | | | | | | | | | | |
| | | | Total Short-Term Investments
(Cost $821,000) | | | | | | 821,000 | |
| | | | | | | | | | | |
| | | | Total Investments in Securities
(Cost $11,675,197)* | | 105.0 | % | | $ | 12,124,112 | |
| | | | Other Assets and
Liabilities - Net | | (5.0 | ) | | | (582,436 | ) |
| | | | | | | | | | | |
| | | | Net Assets | | 100.0 | % | | $ | 11,541,676 | |
| | | | | | | | | | | |
| @ | Non-income producing security |
| S | All or a portion of this security is segregated to cover collateral requirements for applicable futures, options, swaps, foreign forward currency contracts and/or when-issued or delayed-delivery securities. |
| * | Cost for federal income tax purposes is $11,680,167. |
| | | | |
Net unrealized appreciation consists of: | | | | |
Gross Unrealized Appreciation | | $ | 555,566 | |
Gross Unrealized Depreciation | | | (111,621 | ) |
| | | | |
Net Unrealized Appreciation | | $ | 443,945 | |
| | | | |
Fair Value Measurements*
The following is a summary of the inputs used as of June 30, 2009 in determining the Portfolio’s investments at fair value for purposes of SFAS 157:
| | | | | | | | | |
| | | Quoted Prices in Active Markets for Identical Investments (Level 1) | | Significant Other Observable Inputs (Level 2) | | Significant Unobservable Inputs (Level 3) |
Common Stock** | | $ | 11,287,323 | | $ | — | | $ | — |
Real Estate Investment Trusts | | | 15,789 | | | — | | | — |
Short-Term Investments | | | 821,000 | | | — | | | — |
| | | | | | | | | |
Total | | $ | 12,124,112 | | $ | — | | $ | — |
| | | | | | | | | |
Other Financial Instruments*** | | | 4,666 | | | — | | | — |
| | | | | | | | | |
Total | | $ | 4,666 | | $ | — | | $ | — |
| | | | | | | | | |
“Fair value” for purposes of SFAS 157 is different from “fair value” as used in the 1940 Act. The former generally implies market value, and can include market quotations as a source of value, and the latter refers to determinations of value in absence of available market quotations.
| * | See NOTE 2, “Significant Accounting Policies” in the Notes to Financial Statements for additional information. |
| ** | For further breakdown of Common Stock, by industry type, please refer to the Portfolio of Investments. |
| *** | Other financial instruments may include open forward foreign currency contracts, futures, swaps, and written options. Forward foreign currency contracts and futures are reported at their unrealized gain/loss at period end. Swaps and written options are reported at their market value at period end. |
ING Russell™ Large Cap Growth Index Portfolio Open Futures Contracts on June 30, 2009:
| | | | | | | |
Contract Description | | Number of Contracts | | Expiration Date | | Unrealized Appreciation |
Long Contracts | | | | | | | |
S&P 500 E-Mini | | 5 | | 09/18/09 | | $ | 4,666 |
| | | | | | | |
| | | | | | $ | 4,666 |
| | | | | | | |
For the six months ended June 30, 2009, net realized gain (loss) on futures and the net change in unrealized gain (loss) on futures can be found on the Portfolio’s Statement of Operations. For additional information on the reason(s) why the Portfolio may enter into futures contracts and the risks associated with futures contracts, please refer to NOTE 2 in the accompanying Notes to Financial Statements.
See Accompanying Notes to Financial Statements
47
| | |
ING RUSSELL™ LARGE CAP VALUE
INDEX PORTFOLIO | | PORTFOLIO OF INVESTMENTS AS OF JUNE 30, 2009 (UNAUDITED) |

| | | | | | | |
| Shares | | | | | | Value |
| | | | | | | |
COMMON STOCK: 97.1% |
Aerospace/Defense: 2.0% |
| 16,300 | | | | Boeing Co. | | $ | 692,750 |
| 7,700 | | | | General Dynamics Corp. | | | 426,503 |
| 7,000 | | | | Northrop Grumman Corp. | | | 319,760 |
| 2,200 | | | | Raytheon Co. | | | 97,746 |
| 1,700 | | | | United Technologies Corp. | | | 88,332 |
| | | | | | | |
| | | | | | | 1,625,091 |
| | | | | | | |
Agriculture: 0.4% |
| 6,900 | | | | Archer-Daniels-Midland Co. | | | 184,713 |
| 4,100 | | | | Reynolds American, Inc. | | | 158,342 |
| | | | | | | |
| | | | | | | 343,055 |
| | | | | | | |
Auto Manufacturers: 0.6% |
| 76,600 | | @ | | Ford Motor Co. | | | 464,962 |
| 700 | | | | Paccar, Inc. | | | 22,757 |
| | | | | | | |
| | | | | | | 487,719 |
| | | | | | | |
Auto Parts & Equipment: 0.2% |
| 6,600 | | | | Johnson Controls, Inc. | | | 143,352 |
| | | | | | | |
| | | | | | | 143,352 |
| | | | | | | |
Banks: 16.8% |
| 187,600 | | | | Bank of America Corp. | | | 2,476,320 |
| 23,300 | | | | Bank of New York Mellon Corp. | | | 682,923 |
| 15,900 | | | | BB&T Corp. | | | 349,482 |
| 8,000 | | | | Capital One Financial Corp. | | | 175,040 |
| 135,100 | | | | Citigroup, Inc. | | | 401,247 |
| 11,600 | | | | Goldman Sachs Group, Inc. | | | 1,710,304 |
| 92,200 | | | | JPMorgan Chase & Co. | | | 3,144,942 |
| 23,900 | | | | Morgan Stanley | | | 681,389 |
| 11,300 | | | | PNC Financial Services Group, Inc. | | | 438,553 |
| 5,700 | | | | State Street Corp. | | | 269,040 |
| | | | | | | |
| Shares | | | | | | Value |
| | | | | | | |
Banks: (continued) |
| 46,500 | | | | US Bancorp. | | $ | 833,280 |
| 99,300 | | | | Wells Fargo & Co. | | | 2,409,018 |
| | | | | | | |
| | | | | | | 13,571,538 |
| | | | | | | |
Beverages: 0.7% |
| 12,100 | | | | Coca-Cola Co. | | | 580,679 |
| | | | | | | |
| | | | | | | 580,679 |
| | | | | | | |
Chemicals: 1.3% |
| 3,400 | | | | Air Products & Chemicals, Inc. | | | 219,606 |
| 27,300 | | | | Dow Chemical Co. | | | 440,622 |
| 14,800 | | | | EI Du Pont de Nemours & Co. | | | 379,176 |
| | | | | | | |
| | | | | | | 1,039,404 |
| | | | | | | |
Computers: 1.3% |
| 44,200 | | @ | | EMC Corp. | | | 579,020 |
| 13,300 | | | | Hewlett-Packard Co. | | | 514,045 |
| | | | | | | |
| | | | | | | 1,093,065 |
| | | | | | | |
Cosmetics/Personal Care: 1.6% |
| 24,600 | | | | Procter & Gamble Co. | | | 1,257,060 |
| | | | | | | |
| | | | | | | 1,257,060 |
| | | | | | | |
Diversified Financial Services: 1.4% |
| 20,300 | | | | American Express Co. | | | 471,772 |
| 300 | | | | Blackrock, Inc. | | | 52,626 |
| 1,500 | | | | CME Group, Inc. | | | 466,665 |
| 2,000 | | | | Franklin Resources, Inc. | | | 144,020 |
| | | | | | | |
| | | | | | | 1,135,083 |
| | | | | | | |
Electric: 5.6% |
| 11,700 | | | | American Electric Power Co., Inc. | | | 338,013 |
| 14,500 | | | | Dominion Resources, Inc. | | | 484,590 |
| 31,600 | | | | Duke Energy Corp. | | | 461,044 |
| 4,800 | | | | Entergy Corp. | | | 372,096 |
| 14,700 | | | | Exelon Corp. | | | 752,787 |
| 7,500 | | | | FirstEnergy Corp. | | | 290,625 |
| 8,800 | | | | FPL Group, Inc. | | | 500,368 |
| 9,000 | | | | Pacific Gas & Electric Co. | | | 345,960 |
| 12,400 | | | | Public Service Enterprise Group, Inc. | | | 404,612 |
| 19,200 | | S | | Southern Co. | | | 598,272 |
| | | | | | | |
| | | | | | | 4,548,367 |
| | | | | | | |
Electronics: 0.5% |
| 9,400 | | @ | | Thermo Electron Corp. | | | 383,238 |
| | | | | | | |
| | | | | | | 383,238 |
| | | | | | | |
Environmental Control: 0.0% |
| 1,200 | | | | Waste Management, Inc. | | | 33,792 |
| | | | | | | |
| | | | | | | 33,792 |
| | | | | | | |
Food: 1.5% |
| 4,700 | | | | General Mills, Inc. | | | 263,294 |
| 36,100 | | | | Kraft Foods, Inc. | | | 914,774 |
| 2,500 | | | | Kroger Co. | | | 55,125 |
| | | | | | | |
| | | | | | | 1,233,193 |
| | | | | | | |
Healthcare - Products: 1.6% |
| 23,800 | | @ | | Boston Scientific Corp. | | | 241,332 |
| 15,300 | | | | Johnson & Johnson | | | 869,040 |
| 5,300 | | @ | | Zimmer Holdings, Inc. | | | 225,780 |
| | | | | | | |
| | | | | | | 1,336,152 |
| | | | | | | |
See Accompanying Notes to Financial Statements
48
| | |
ING RUSSELL™ LARGE CAP VALUE
INDEX PORTFOLIO | | PORTFOLIO OF INVESTMENTS AS OF JUNE 30, 2009 (UNAUDITED) (CONTINUED) |
| | | | | | | |
| Shares | | | | | | Value |
| | | | | | | |
Healthcare - Services: 1.9% |
| 8,600 | | | | Aetna, Inc. | | $ | 215,430 |
| 29,200 | | | | UnitedHealth Group, Inc. | | | 729,416 |
| 11,000 | | @ | | WellPoint, Inc. | | | 559,790 |
| | | | | | | |
| | | | | | | 1,504,636 |
| | | | | | | |
Household Products/Wares: 0.1% |
| 1,300 | | | | Kimberly-Clark Corp. | | | 68,159 |
| | | | | | | |
| | | | | | | 68,159 |
| | | | | | | |
Insurance: 2.6% |
| 13,100 | | | | Allstate Corp. | | | 319,640 |
| 8,600 | | | | Chubb Corp. | | | 342,968 |
| 8,000 | | | | Loews Corp. | | | 219,200 |
| 14,100 | | | | Metlife, Inc. | | | 423,141 |
| 5,000 | | | | Prudential Financial, Inc. | | | 186,100 |
| 14,400 | | | | Travelers Cos., Inc. | | | 590,976 |
| | | | | | | |
| | | | | | | 2,082,025 |
| | | | | | | |
Internet: 0.5% |
| 21,000 | | @ | | eBay, Inc. | | | 359,730 |
| 1,900 | | @ | | Yahoo!, Inc. | | | 29,754 |
| | | | | | | |
| | | | | | | 389,484 |
| | | | | | | |
Iron/Steel: 0.4% |
| 7,700 | | | | Nucor Corp. | | | 342,111 |
| | | | | | | |
| | | | | | | 342,111 |
| | | | | | | |
Leisure Time: 0.2% |
| 5,900 | | | | Carnival Corp. | | | 152,043 |
| | | | | | | |
| | | | | | | 152,043 |
| | | | | | | |
Machinery - Construction & Mining: 0.3% |
| 7,400 | | | | Caterpillar, Inc. | | | 244,496 |
| | | | | | | |
| | | | | | | 244,496 |
| | | | | | | |
Machinery - Diversified: 0.4% |
| 7,800 | | | | Deere & Co. | | | 311,610 |
| | | | | | | |
| | | | | | | 311,610 |
| | | | | | | |
Media: 5.1% |
| 65,200 | | | | Comcast Corp. - Class A | | | 944,748 |
| 12,700 | | @ | | Liberty Media Corp. - Entertainment | | | 339,725 |
| 55,800 | | | | News Corp. - Class A | | | 508,338 |
| 8,600 | | @ | | Time Warner Cable, Inc. | | | 272,362 |
| 29,300 | | | | Time Warner, Inc. | | | 738,067 |
| 13,300 | | @ | | Viacom - Class B | | | 301,910 |
| 45,500 | | | | Walt Disney Co. | | | 1,061,515 |
| | | | | | | |
| | | | | | | 4,166,665 |
| | | | | | | |
Mining: 0.4% |
| 12,800 | | | | Alcoa, Inc. | | | 132,224 |
| 4,000 | | | | Freeport-McMoRan Copper & Gold, Inc. | | | 200,440 |
| 1,100 | | | | Southern Copper Corp. | | | 22,484 |
| | | | | | | |
| | | | | | | 355,148 |
| | | | | | | |
Miscellaneous Manufacturing: 4.4% |
| 2,400 | | | | Danaher Corp. | | | 148,176 |
| 259,600 | | | | General Electric Co. | | | 3,042,512 |
| 11,000 | | | | Illinois Tool Works, Inc. | | | 410,740 |
| | | | | | | |
| | | | | | | 3,601,428 |
| | | | | | | |
Oil & Gas: 20.3% |
| 12,200 | | | | Anadarko Petroleum Corp. | | | 553,758 |
| 8,200 | | | | Apache Corp. | | | 591,630 |
| | | | | | | |
| Shares | | | | | | Value |
| | | | | | | |
Oil & Gas: (continued) |
| 15,400 | | | | Chesapeake Energy Corp. | | $ | 305,382 |
| 49,100 | | | | Chevron Corp. | | | 3,252,875 |
| 36,300 | | | | ConocoPhillips | | | 1,526,778 |
| 10,900 | | | | Devon Energy Corp. | | | 594,050 |
| 6,100 | | | | EOG Resources, Inc. | | | 414,312 |
| 88,800 | | | | ExxonMobil Corp. | | | 6,208,008 |
| 7,100 | | | | Hess Corp. | | | 381,625 |
| 17,400 | | | | Marathon Oil Corp. | | | 524,262 |
| 19,900 | | | | Occidental Petroleum Corp. | | | 1,309,619 |
| 12,700 | | | | Valero Energy Corp. | | | 214,503 |
| 14,200 | | | | XTO Energy, Inc. | | | 541,588 |
| | | | | | | |
| | | | | | | 16,418,390 |
| | | | | | | |
Oil & Gas Services: 2.4% |
| 7,600 | | | | Baker Hughes, Inc. | | | 276,944 |
| 22,000 | | | | Halliburton Co. | | | 455,400 |
| 10,300 | | @ | | National Oilwell Varco, Inc. | | | 336,398 |
| 16,000 | | | | Schlumberger Ltd. | | | 865,760 |
| | | | | | | |
| | | | | | | 1,934,502 |
| | | | | | | |
Pharmaceuticals: 7.7% |
| 21,700 | | | | Bristol-Myers Squibb Co. | | | 440,727 |
| 8,800 | | | | Cardinal Health, Inc. | | | 268,840 |
| 11,800 | | | | Eli Lilly & Co. | | | 408,752 |
| 3,400 | | | | McKesson Corp. | | | 149,600 |
| 42,300 | | | | Merck & Co., Inc. | | | 1,182,708 |
| 165,400 | | | | Pfizer, Inc. | | | 2,481,000 |
| 6,200 | | | | Schering-Plough Corp. | | | 155,744 |
| 25,400 | | | | Wyeth | | | 1,152,906 |
| | | | | | | |
| | | | | | | 6,240,277 |
| | | | | | | |
Pipelines: 0.3% |
| 14,200 | | | | Williams Cos., Inc. | | | 221,662 |
| | | | | | | |
| | | | | | | 221,662 |
| | | | | | | |
Retail: 2.8% |
| 24,800 | | | | CVS Caremark Corp. | | | 790,376 |
| 1,400 | | | | Gap, Inc. | | | 22,960 |
| 38,800 | | | | Home Depot, Inc. | | | 916,844 |
| 500 | | @, S | | Kohl’s Corp. | | | 21,375 |
| 24,700 | | | | Lowe’s Cos., Inc. | | | 479,427 |
| | | | | | | |
| | | | | | | 2,230,982 |
| | | | | | | |
Semiconductors: 1.5% |
| 32,600 | | | | Applied Materials, Inc. | | | 357,622 |
| 52,400 | | | | Intel Corp. | | | 867,220 |
| | | | | | | |
| | | | | | | 1,224,842 |
| | | | | | | |
Software: 0.1% |
| 5,700 | | @ | | Activision Blizzard, Inc. | | | 71,991 |
| | | | | | | |
| | | | | | | 71,991 |
| | | | | | | |
Telecommunications: 8.0% |
| 144,600 | | | | AT&T, Inc. | | | 3,591,864 |
| 5,600 | | | | Corning, Inc. | | | 89,936 |
| 52,600 | | | | Motorola, Inc. | | | 348,738 |
| 68,600 | | @ | | Sprint Nextel Corp. | | | 329,966 |
| 69,600 | | | | Verizon Communications, Inc. | | | 2,138,808 |
| | | | | | | |
| | | | | | | 6,499,312 |
| | | | | | | |
Transportation: 2.2% |
| 6,400 | | | | Burlington Northern Santa Fe Corp. | | | 470,656 |
| 9,600 | | | | CSX Corp. | | | 332,448 |
| 7,600 | | | | FedEx Corp. | | | 422,712 |
See Accompanying Notes to Financial Statements
49
| | |
ING RUSSELL™ LARGE CAP VALUE
INDEX PORTFOLIO | | PORTFOLIO OF INVESTMENTS AS OF JUNE 30, 2009 (UNAUDITED) (CONTINUED) |
| | | | | | | |
| Shares | | | | | | Value |
| | | | | | | |
Transportation: (continued) |
| 7,800 | | | | Norfolk Southern Corp. | | $ | 293,826 |
| 5,800 | | | | Union Pacific Corp. | | | 301,948 |
| | | | | | | |
| | | | | | | 1,821,590 |
| | | | | | | |
| | | | Total Common Stock
(Cost $75,833,937) | | | 78,692,141 |
| | | | | | | |
REAL ESTATE INVESTMENT TRUSTS: 0.2% |
Regional Malls: 0.2% |
| 3,300 | | | | Simon Property Group, Inc. | | | 169,719 |
| | | | | | | |
| | | | Total Real Estate Investment Trusts
(Cost $171,261) | | | 169,719 |
| | | | | | | |
| | | | Total Long-Term Investments
(Cost $76,005,198) | | | 78,861,860 |
| | | | | | | |
| | | | | | | | | | |
SHORT-TERM INVESTMENTS: 2.6% |
Affiliated Mutual Fund: 2.6% |
| 2,069,000 | | S | | ING Institutional Prime Money Market Fund - Class I | | | | | | 2,069,000 |
| | | | | | | | | | |
| | | | Total Short-Term Investments
(Cost $2,069,000) | | | | | | 2,069,000 |
| | | | | | | | | | |
| | | | Total Investments in Securities
(Cost $78,074,198)* | | 99.9 | % | | $ | 80,930,860 |
| | | | Other Assets and Liabilities - Net | | 0.1 | | | | 79,394 |
| | | | | | | | | | |
| | | | Net Assets | | 100.0 | % | | $ | 81,010,254 |
| | | | | | | | | | |
| @ | Non-income producing security |
| S | All or a portion of this security is segregated to cover collateral requirements for applicable futures, options, swaps, foreign forward currency contracts and/or when-issued or delayed-delivery securities. |
| * | Cost for federal income tax purposes is $78,074,261. |
| | | | |
Net unrealized appreciation consists of: | |
Gross Unrealized Appreciation | | $ | 3,901,944 | |
Gross Unrealized Depreciation | | | (1,045,345 | ) |
| | | | |
Net Unrealized Appreciation | | $ | 2,856,599 | |
| | | | |
Fair Value Measurements*
The following is a summary of the inputs used as of June 30, 2009 in determining the Portfolio’s investments at fair value for purposes of SFAS 157:
| | | | | | | | | | |
| | | Quoted Prices in Active Markets for Identical Investments (Level 1) | | | Significant Other Observable Inputs (Level 2) | | Significant Unobservable Inputs (Level 3) |
Common Stock** | | $ | 78,692,141 | | | $ | — | | $ | — |
Real Estate Investment Trusts | | | 169,719 | | | | — | | | — |
Short-Term Investments | | | 2,069,000 | | | | — | | | — |
| | | | | | | | | | |
Total | | $ | 80,930,860 | | | $ | — | | $ | — |
| | | | | | | | | | |
Other Financial Instruments*** | | | (22,143 | ) | | | — | | | — |
| | | | | | | | | | |
Total | | $ | (22,143 | ) | | $ | — | | $ | — |
| | | | | | | | | | |
“Fair value” for purposes of SFAS 157 is different from “fair value” as used in the 1940 Act. The former generally implies market value, and can include market quotations as a source of value, and the latter refers to determinations of value in absence of available market quotations.
| * | See NOTE 2, “Significant Accounting Policies” in the Notes to Financial Statements for additional information. |
| ** | For further breakdown of Common Stock, by industry type, please refer to the Portfolio of Investments. |
| *** | Other financial instruments may include open forward foreign currency contracts, futures, swaps, and written options. Forward foreign currency contracts and futures are reported at their unrealized gain/loss at period end. Swaps and written options are reported at their market value at period end. |
ING Russell™ Large Cap Value Index Portfolio Open Futures Contracts on June 30, 2009:
| | | | | | | | |
Contract Description | | Number of Contracts | | Expiration Date | | Unrealized Depreciation | |
Long Contracts | | | | | | | | |
S&P 500 | | 9 | | 09/17/09 | | $ | (22,143 | ) |
| | | | | | | | |
| | | | | | $ | (22,143 | ) |
| | | | | | | | |
For the six months ended June 30, 2009, net realized gain (loss) on futures and the net change in unrealized gain (loss) on futures can be found on the Portfolio’s Statement of Operations. For additional information on the reason(s) why the Portfolio may enter into futures contracts and the risks associated with futures contracts, please refer to NOTE 2 in the accompanying Notes to Financial Statements.
See Accompanying Notes to Financial Statements
50
| | |
| ING RUSSELL™ MID CAP INDEX PORTFOLIO | | PORTFOLIO OF INVESTMENTS AS OF JUNE 30, 2009 (UNAUDITED) |
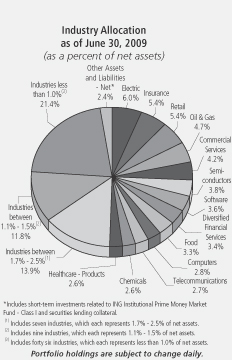
| | | | | | | |
| Shares | | | | | | Value |
| | | | | | | |
COMMON STOCK: 92.7% |
Advertising: 0.1% |
| 5,850 | | @ | | Clear Channel Outdoor Holdings, Inc. | | $ | 31,005 |
| 68,650 | | @ | | Interpublic Group of Cos., Inc. | | | 346,683 |
| 8,200 | | @, L | | Lamar Advertising Co. | | | 125,214 |
| | | | | | | |
| | | | | | | 502,902 |
| | | | | | | |
Aerospace/Defense: 1.1% |
| 4,700 | | @ | | Alliant Techsystems, Inc. | | | 387,092 |
| 13,650 | | @ | | BE Aerospace, Inc. | | | 196,014 |
| 17,750 | | | | Goodrich Corp. | | | 886,968 |
| 16,750 | | | | L-3 Communications Holdings, Inc. | | | 1,162,115 |
| 22,750 | | | | Rockwell Collins, Inc. | | | 949,358 |
| 15,050 | | @ | | Spirit Aerosystems Holdings, Inc. | | | 206,787 |
| 5,700 | | @ | | TransDigm Group, Inc. | | | 206,340 |
| | | | | | | |
| | | | | | | 3,994,674 |
| | | | | | | |
Agriculture: 0.8% |
| 17,550 | | L | | Bunge Ltd. | | | 1,057,388 |
| 24,150 | | | | Lorillard, Inc. | | | 1,636,646 |
| | | | | | | |
| | | | | | | 2,694,034 |
| | | | | | | |
Airlines: 0.5% |
| 40,800 | | @ | | AMR Corp. | | | 164,016 |
| 17,700 | | @ | | Continental Airlines, Inc. | | | 156,822 |
| 4,300 | | @@ | | Copa Holdings SA | | | 175,526 |
| 110,762 | | @ | | Delta Airlines, Inc. | | | 641,312 |
| 106,300 | | | | Southwest Airlines Co. | | | 715,399 |
| | | | | | | |
| | | | | | | 1,853,075 |
| | | | | | | |
| | | | | | | |
| Shares | | | | | | Value |
| | | | | | | |
Apparel: 0.7% |
| 45,600 | | | | Coach, Inc. | | $ | 1,225,728 |
| 13,600 | | @ | | Hanesbrands, Inc. | | | 204,136 |
| 7,900 | | | | Polo Ralph Lauren Corp. | | | 422,966 |
| 12,650 | | | | VF Corp. | | | 700,178 |
| | | | | | | |
| | | | | | | 2,553,008 |
| | | | | | | |
Auto Manufacturers: 0.1% |
| 9,000 | | @ | | Navistar International Corp. | | | 392,400 |
| 10,700 | | | | Oshkosh Truck Corp. | | | 155,578 |
| | | | | | | |
| | | | | | | 547,978 |
| | | | | | | |
Auto Parts & Equipment: 0.4% |
| 12,200 | | @@ | | Autoliv, Inc. | | | 350,994 |
| 16,750 | | | | BorgWarner, Inc. | | | 572,013 |
| 2,950 | | @, S | | Federal Mogul Corp. | | | 27,878 |
| 34,650 | | @ | | Goodyear Tire & Rubber Co. | | | 390,159 |
| 7,150 | | @ | | TRW Automotive Holdings Corp. | | | 80,795 |
| 9,200 | | | | WABCO Holdings, Inc. | | | 162,840 |
| | | | | | | |
| | | | | | | 1,584,679 |
| | | | | | | |
Banks: 2.1% |
| 18,350 | | | | Associated Banc-Corp. | | | 229,375 |
| 11,950 | | | | Bancorpsouth, Inc. | | | 245,334 |
| 6,900 | | | | Bank of Hawaii Corp. | | | 247,227 |
| 2,950 | | L | | BOK Financial Corp. | | | 111,127 |
| 32,750 | | | | CapitalSource, Inc. | | | 159,820 |
| 6,150 | | | | City National Corp. | | | 226,505 |
| 21,700 | | | | Comerica, Inc. | | | 458,955 |
| 8,662 | | | | Commerce Bancshares, Inc. | | | 275,711 |
| 7,400 | | | | Cullen/Frost Bankers, Inc. | | | 341,288 |
| 82,750 | | | | Fifth Third Bancorp. | | | 587,525 |
| 900 | | | | First Citizens BancShares, Inc. | | | 120,285 |
| 30,879 | | | | First Horizon National Corp. | | | 370,548 |
| 25,150 | | | | Fulton Financial Corp. | | | 131,032 |
| 62,300 | | | | Huntington Bancshares, Inc. | | | 260,414 |
| 74,050 | | | | Keycorp | | | 388,022 |
| 10,300 | | L | | M&T Bank Corp. | | | 524,579 |
| 38,250 | | | | Marshall & Ilsley Corp. | | | 183,600 |
| 40,400 | | @@, L | | Popular, Inc. | | | 88,880 |
| 165,750 | | | | Regions Financial Corp. | | | 669,630 |
| 48,900 | | | | SunTrust Bank | | | 804,405 |
| 37,400 | | | | Synovus Financial Corp. | | | 111,826 |
| 18,350 | | L | | TCF Financial Corp. | | | 245,340 |
| 20,364 | | L | | Valley National Bancorp. | | | 238,259 |
| 9,700 | | | | Whitney Holding Corp. | | | 88,852 |
| 9,950 | | | | Wilmington Trust Corp. | | | 135,917 |
| 16,550 | | L | | Zions Bancorp. | | | 191,318 |
| | | | | | | |
| | | | | | | 7,435,774 |
| | | | | | | |
Beverages: 1.4% |
| 12,912 | | | | Brown-Forman Corp. | | | 554,958 |
| 6,350 | | @, S | | Central European Distribution Corp. | | | 168,720 |
| 44,300 | | | | Coca-Cola Enterprises, Inc. | | | 737,595 |
| 27,250 | | @ | | Constellation Brands, Inc. | | | 345,530 |
| 36,450 | | @ | | Dr Pepper Snapple Group, Inc. | | | 772,376 |
| 4,300 | | @ | | Green Mountain Coffee Roasters, Inc. | | | 254,216 |
| 9,900 | | @ | | Hansen Natural Corp. | | | 305,118 |
| 18,350 | | | | Molson Coors Brewing Co. | | | 776,756 |
See Accompanying Notes to Financial Statements
51
| | |
| ING RUSSELL™ MID CAP INDEX PORTFOLIO | | PORTFOLIO OF INVESTMENTS AS OF JUNE 30, 2009 (UNAUDITED) (CONTINUED) |
| | | | | | | |
| Shares | | | | | | Value |
| | | | | | | |
Beverages: (continued) |
| 20,150 | | | | Pepsi Bottling Group, Inc. | | $ | 681,876 |
| 8,100 | | | | PepsiAmericas, Inc. | | | 217,161 |
| | | | | | | |
| | | | | | | 4,814,306 |
| | | | | | | |
Biotechnology: 1.7% |
| 1,000 | | @ | | Abraxis Bioscience, Inc. | | | 36,860 |
| 11,800 | | @ | | Alexion Pharmaceuticals, Inc. | | | 485,216 |
| 20,250 | | @, L | | Amylin Pharmaceuticals, Inc. | | | 273,375 |
| 2,800 | | @ | | Bio-Rad Laboratories, Inc. | | | 211,344 |
| 9,500 | | @ | | Charles River Laboratories International, Inc. | | | 320,625 |
| 16,600 | | @ | | Dendreon Corp. | | | 412,510 |
| 17,650 | | @ | | Illumina, Inc. | | | 687,291 |
| 25,061 | | @ | | Life Technologies Corp. | | | 1,045,545 |
| 8,000 | | @ | | Millipore Corp. | | | 561,680 |
| 13,700 | | @ | | Myriad Genetics, Inc. | | | 488,405 |
| 8,300 | | @ | | OSI Pharmaceuticals, Inc. | | | 234,309 |
| 3,300 | | @ | | United Therapeutics Corp. | | | 274,989 |
| 24,800 | | @ | | Vertex Pharmaceuticals, Inc. | | | 883,872 |
| | | | | | | |
| | | | | | | 5,916,021 |
| | | | | | | |
Building Materials: 0.5% |
| 2,900 | | @ | | Armstrong World Industries, Inc. | | | 47,821 |
| 6,250 | | | | Eagle Materials, Inc. | | | 157,750 |
| 6,650 | | | | Lennox International, Inc. | | | 213,532 |
| 6,350 | | | | Martin Marietta Materials, Inc. | | | 500,888 |
| 51,500 | | | | Masco Corp. | | | 493,370 |
| 12,300 | | @ | | Owens Corning, Inc. | | | 157,194 |
| 5,850 | | @ | | USG Corp. | | | 58,910 |
| | | | | | | |
| | | | | | | 1,629,465 |
| | | | | | | |
Chemicals: 2.6% |
| 11,650 | | | | Airgas, Inc. | | | 472,175 |
| 13,100 | | | | Albemarle Corp. | | | 334,967 |
| 10,600 | | | | Ashland, Inc. | | | 297,330 |
| 9,400 | | | | Cabot Corp. | | | 118,252 |
| 20,550 | | | | Celanese Corp. | | | 488,063 |
| 6,900 | | | | CF Industries Holdings, Inc. | | | 511,566 |
| 6,800 | | | | Cytec Industries, Inc. | | | 126,616 |
| 10,400 | | | | Eastman Chemical Co. | | | 394,160 |
| 33,950 | | | | Ecolab, Inc. | | | 1,323,711 |
| 10,400 | | | | FMC Corp. | | | 491,920 |
| 23,250 | | | | Huntsman Corp. | | | 116,948 |
| 11,300 | | | | International Flavors & Fragrances, Inc. | | | 369,736 |
| 5,900 | | @ | | Intrepid Potash, Inc. | | | 165,672 |
| 9,700 | | | | Lubrizol Corp. | | | 458,907 |
| 23,650 | | | | PPG Industries, Inc. | | | 1,038,235 |
| 18,450 | | | | RPM International, Inc. | | | 259,038 |
| 14,250 | | | | Sherwin-Williams Co. | | | 765,938 |
| 17,550 | | | | Sigma-Aldrich Corp. | | | 869,778 |
| 14,350 | | | | Terra Industries, Inc. | | | 347,557 |
| 800 | | | | Valhi, Inc. | | | 5,944 |
| 14,350 | | | | Valspar Corp. | | | 323,306 |
| | | | | | | |
| | | | | | | 9,279,819 |
| | | | | | | |
Coal: 0.6% |
| 10,200 | | @ | | Alpha Natural Resources, Inc. | | | 267,954 |
| 20,700 | | | | Arch Coal, Inc. | | | 318,159 |
| 25,950 | | | | Consol Energy, Inc. | | | 881,262 |
| 6,450 | | | | Foundation Coal Holdings, Inc. | | | 181,310 |
| | | | | | | |
| Shares | | | | | | Value |
| | | | | | | |
Coal: (continued) |
| 12,300 | | | | Massey Energy Co. | | $ | 240,342 |
| 7,600 | | | | Walter Industries, Inc. | | | 275,424 |
| | | | | | | |
| | | | | | | 2,164,451 |
| | | | | | | |
Commercial Services: 4.2% |
| 6,900 | | | | Aaron Rents, Inc. | | | 205,758 |
| 8,350 | | @, L | | Alliance Data Systems Corp. | | | 343,937 |
| 19,050 | | @ | | Apollo Group, Inc. - Class A | | | 1,354,836 |
| 6,550 | | @ | | Brink’s Home Security Holdings, Inc. | | | 185,431 |
| 10,500 | | @ | | Career Education Corp. | | | 261,345 |
| 14,050 | | @ | | Convergys Corp. | | | 130,384 |
| 16,550 | | @ | | Corrections Corp. of America | | | 281,185 |
| 8,900 | | | | DeVry, Inc. | | | 445,356 |
| 18,150 | | | | Equifax, Inc. | | | 473,715 |
| 7,350 | | @ | | FTI Consulting, Inc. | | | 372,792 |
| 9,000 | | @, @@ | | Genpact Ltd. | | | 105,750 |
| 11,500 | | | | Global Payments, Inc. | | | 430,790 |
| 48,700 | | | | H&R Block, Inc. | | | 839,101 |
| 26,850 | | @, L | | Hertz Global Holdings, Inc. | | | 214,532 |
| 11,950 | | @ | | Hewitt Associates, Inc. | | | 355,871 |
| 8,900 | | | | Hillenbrand, Inc. | | | 148,096 |
| 5,200 | | | | Interactive Data Corp. | | | 120,328 |
| 25,850 | | @ | | Iron Mountain, Inc. | | | 743,188 |
| 5,450 | | @ | | ITT Educational Services, Inc. | | | 548,597 |
| 13,700 | | | | Lender Processing Services, Inc. | | | 380,449 |
| 11,200 | | | | Manpower, Inc. | | | 474,208 |
| 18,050 | | @ | | Monster Worldwide, Inc. | | | 213,171 |
| 26,950 | | | | Moody’s Corp. | | | 710,133 |
| 2,800 | | @, L | | Morningstar, Inc. | | | 115,444 |
| 46,200 | | | | Paychex, Inc. | | | 1,164,240 |
| 15,050 | | | | Pharmaceutical Product Development, Inc. | | | 349,461 |
| 28,350 | | @ | | Quanta Services, Inc. | | | 655,736 |
| 21,900 | | | | Robert Half International, Inc. | | | 517,278 |
| 29,450 | | | | RR Donnelley & Sons Co. | | | 342,209 |
| 29,800 | | @ | | SAIC, Inc. | | | 552,790 |
| 17,350 | | | | SEI Investments Co. | | | 312,994 |
| 36,000 | | | | Service Corp. International | | | 197,280 |
| 2,000 | | L | | Strayer Education, Inc. | | | 436,220 |
| 23,250 | | | | Total System Services, Inc. | | | 311,318 |
| 920 | | | | Washington Post | | | 324,006 |
| 4,800 | | | | Weight Watchers International, Inc. | | | 123,696 |
| | | | | | | |
| | | | | | | 14,741,625 |
| | | | | | | |
Computers: 2.8% |
| 13,100 | | @ | | Affiliated Computer Services, Inc. | | | 581,902 |
| 55,500 | | @ | | Brocade Communications Systems, Inc. | | | 434,010 |
| 37,850 | | @ | | Cadence Design Systems, Inc. | | | 223,315 |
| 41,900 | | @ | | Cognizant Technology Solutions Corp. | | | 1,118,730 |
| 21,700 | | @ | | Computer Sciences Corp. | | | 961,310 |
| 9,500 | | | | Diebold, Inc. | | | 250,420 |
| 5,550 | | @ | | DST Systems, Inc. | | | 205,073 |
| 6,850 | | @ | | IHS, Inc. | | | 341,610 |
| 11,200 | | @ | | Lexmark International, Inc. | | | 177,520 |
| 11,500 | | @ | | Micros Systems, Inc. | | | 291,180 |
| 22,800 | | @ | | NCR Corp. | | | 269,724 |
| 47,750 | | @ | | NetApp, Inc. | | | 941,630 |
| 32,600 | | @ | | Sandisk Corp. | | | 478,894 |
See Accompanying Notes to Financial Statements
52
| | |
| ING RUSSELL™ MID CAP INDEX PORTFOLIO | | PORTFOLIO OF INVESTMENTS AS OF JUNE 30, 2009 (UNAUDITED) (CONTINUED) |
| | | | | | | |
| Shares | | | | | | Value |
| | | | | | | |
Computers: (continued) |
| 70,550 | | | | Seagate Technology, Inc. | | $ | 737,953 |
| 107,350 | | @ | | Sun Microsystems, Inc. | | | 989,767 |
| 20,700 | | @ | | Synopsys, Inc. | | | 403,857 |
| 24,750 | | @ | | Teradata Corp. | | | 579,893 |
| 32,000 | | @ | | Western Digital Corp. | | | 848,000 |
| | | | | | | |
| | | | | | | 9,834,788 |
| | | | | | | |
Cosmetics/Personal Care: 0.7% |
| 12,250 | | | | Alberto-Culver Co. | | | 311,518 |
| 61,250 | | | | Avon Products, Inc. | | | 1,579,025 |
| 15,950 | | | | Estee Lauder Cos., Inc. | | | 521,087 |
| | | | | | | |
| | | | | | | 2,411,630 |
| | | | | | | |
Distribution/Wholesale: 0.9% |
| 18,950 | | L | | Fastenal Co. | | | 628,572 |
| 22,850 | | | | Genuine Parts Co. | | | 766,846 |
| 23,200 | | @ | | Ingram Micro, Inc. | | | 406,000 |
| 20,150 | | @ | | LKQ Corp. | | | 331,468 |
| 7,200 | | @ | | Tech Data Corp. | | | 235,512 |
| 6,050 | | @ | | Wesco International, Inc. | | | 151,492 |
| 8,800 | | | | WW Grainger, Inc. | | | 720,544 |
| | | | | | | |
| | | | | | | 3,240,434 |
| | | | | | | |
Diversified Financial Services: 3.4% |
| 5,950 | | @ | | Affiliated Managers Group, Inc. | | | 346,231 |
| 12,850 | | @, L | | AmeriCredit Corp. | | | 174,118 |
| 31,400 | | | | Ameriprise Financial, Inc. | | | 762,078 |
| 55,800 | | | | CIT Group, Inc. | | | 119,970 |
| 69,150 | | | | Discover Financial Services | | | 710,171 |
| 16,750 | | | | Eaton Vance Corp. | | | 448,063 |
| 12,650 | | | | Federated Investors, Inc. | | | 304,739 |
| 27,250 | | L | | GLG Partners, Inc. | | | 111,453 |
| 2,900 | | | | Greenhill & Co., Inc. | | | 209,409 |
| 5,800 | | @ | | Interactive Brokers Group, Inc. | | | 90,074 |
| 10,400 | | @ | | IntercontinentalExchange, Inc. | | | 1,188,096 |
| 59,600 | | | | Invesco Ltd. | | | 1,062,072 |
| 6,250 | | @ | | Investment Technology Group, Inc. | | | 127,438 |
| 23,150 | | | | Janus Capital Group, Inc. | | | 263,910 |
| 16,650 | | | | Jefferies Group, Inc. | | | 355,145 |
| 11,000 | | @@ | | Lazard Ltd. | | | 296,120 |
| 20,150 | | | | Legg Mason, Inc. | | | 491,257 |
| 19,450 | | @ | | Nasdaq Stock Market, Inc. | | | 414,480 |
| 37,300 | | | | NYSE Euronext | | | 1,016,425 |
| 14,100 | | | | Raymond James Financial, Inc. | | | 242,661 |
| 67,100 | | @ | | SLM Corp. | | | 689,117 |
| 600 | | | | Student Loan Corp. | | | 22,320 |
| 36,650 | | | | T. Rowe Price Group, Inc. | | | 1,527,206 |
| 37,550 | | @ | | TD Ameritrade Holding Corp. | | | 658,627 |
| 12,350 | | | | Waddell & Reed Financial, Inc. | | | 325,670 |
| | | | | | | |
| | | | | | | 11,956,850 |
| | | | | | | |
Electric: 6.0% |
| 95,600 | | @ | | AES Corp. | | | 1,109,916 |
| 24,300 | | | | Allegheny Energy, Inc. | | | 623,295 |
| 15,900 | | | | Alliant Energy Corp. | | | 415,467 |
| 30,650 | | | | Ameren Corp. | | | 762,879 |
| 48,000 | | @ | | Calpine Corp. | | | 535,200 |
| 32,550 | | | | CMS Energy Corp. | | | 393,204 |
| 39,350 | | | | Consolidated Edison, Inc. | | | 1,472,477 |
| 26,150 | | | | Constellation Energy Group, Inc. | | | 695,067 |
| 16,650 | | | | DPL, Inc. | | | 385,781 |
| 23,550 | | | | DTE Energy Co. | | | 753,600 |
| | | | | | | |
| Shares | | | | | | Value |
| | | | | | | |
Electric: (continued) |
| 71,450 | | @ | | Dynegy, Inc. - Class A | | $ | 162,192 |
| 46,700 | | | | Edison International | | | 1,469,182 |
| 19,350 | | | | Great Plains Energy, Inc. | | | 300,893 |
| 13,150 | | | | Hawaiian Electric Industries | | | 250,639 |
| 11,000 | | | | Integrys Energy Group, Inc. | | | 329,890 |
| 7,100 | | | | ITC Holdings Corp. | | | 322,056 |
| 26,350 | | | | MDU Resources Group, Inc. | | | 499,860 |
| 20,650 | | @ | | Mirant Corp. | | | 325,031 |
| 25,100 | | | | Northeast Utilities | | | 559,981 |
| 38,050 | | @ | | NRG Energy, Inc. | | | 987,778 |
| 15,350 | | | | NSTAR | | | 492,889 |
| 33,600 | | | | NV Energy, Inc. | | | 362,544 |
| 13,800 | | | | OGE Energy Corp. | | | 390,816 |
| 2,800 | | | | Ormat Technologies, Inc. | | | 112,868 |
| 31,550 | | | | Pepco Holdings, Inc. | | | 424,032 |
| 14,550 | | | | Pinnacle West Capital Corp. | | | 438,683 |
| 54,000 | | | | PPL Corp. | | | 1,779,840 |
| 40,000 | | | | Progress Energy, Inc. | | | 1,513,200 |
| 50,250 | | @ | | RRI Energy, Inc. | | | 251,753 |
| 17,450 | | | | SCANA Corp. | | | 566,602 |
| 30,550 | | | | TECO Energy, Inc. | | | 364,462 |
| 15,600 | | | | Westar Energy, Inc. | | | 292,812 |
| 16,750 | | | | Wisconsin Energy Corp. | | | 681,893 |
| 65,350 | | | | Xcel Energy, Inc. | | | 1,203,094 |
| | | | | | | |
| | | | | | | 21,229,876 |
| | | | | | | |
Electrical Components & Equipment: 0.6% |
| 15,450 | | | | Ametek, Inc. | | | 534,261 |
| 9,900 | | @ | | Energizer Holdings, Inc. | | | 517,176 |
| 7,500 | | @ | | General Cable Corp. | | | 281,850 |
| 8,100 | | | | Hubbell, Inc. | | | 259,686 |
| 18,850 | | | | Molex, Inc. | | | 293,118 |
| 13,800 | | @, L | | Sunpower Corp. - Class A | | | 367,632 |
| | | | | | | |
| | | | | | | 2,253,723 |
| | | | | | | |
Electronics: 1.9% |
| 49,200 | | @ | | Agilent Technologies, Inc. | | | 999,252 |
| 24,550 | | | | Amphenol Corp. | | | 776,762 |
| 17,150 | | @ | | Arrow Electronics, Inc. | | | 364,266 |
| 21,700 | | @ | | Avnet, Inc. | | | 456,351 |
| 7,050 | | | | AVX Corp. | | | 70,007 |
| 7,500 | | @ | | Dolby Laboratories, Inc. | | | 279,600 |
| 21,550 | | @ | | Flir Systems, Inc. | | | 486,168 |
| 16,150 | | @@, L | | Garmin Ltd. | | | 384,693 |
| 19,700 | | S | | Gentex Corp. | | | 228,520 |
| 5,700 | | @ | | Itron, Inc. | | | 313,899 |
| 26,950 | | | | Jabil Circuit, Inc. | | | 199,969 |
| 4,800 | | @, @@ | | Mettler Toledo International, Inc. | | | 370,320 |
| 8,100 | | | | National Instruments Corp. | | | 182,736 |
| 16,750 | | | | PerkinElmer, Inc. | | | 291,450 |
| 7,600 | | @ | | Thomas & Betts Corp. | | | 219,336 |
| 17,150 | | @ | | Trimble Navigation Ltd. | | | 336,655 |
| 26,750 | | @ | | Vishay Intertechnology, Inc. | | | 181,633 |
| 13,850 | | @ | | Waters Corp. | | | 712,860 |
| | | | | | | |
| | | | | | | 6,854,477 |
| | | | | | | |
Energy - Alternate Sources: 0.1% |
| 18,550 | | @ | | Covanta Holding Corp. | | | 314,608 |
| | | | | | | |
| | | | | | | 314,608 |
| | | | | | | |
Engineering & Construction: 1.3% |
| 13,550 | | @ | | Aecom Technology Corp. | | | 433,600 |
| 25,850 | | | | Fluor Corp. | | | 1,325,847 |
See Accompanying Notes to Financial Statements
53
| | |
| ING RUSSELL™ MID CAP INDEX PORTFOLIO | | PORTFOLIO OF INVESTMENTS AS OF JUNE 30, 2009 (UNAUDITED) (CONTINUED) |
| | | | | | | |
| Shares | | | | | | Value |
| | | | | | | |
Engineering & Construction: (continued) |
| 17,750 | | @ | | Jacobs Engineering Group, Inc. | | $ | 747,098 |
| 23,000 | | | | KBR, Inc. | | | 424,120 |
| 32,750 | | @ | | McDermott International, Inc. | | | 665,153 |
| 11,950 | | @ | | Shaw Group, Inc. | | | 327,550 |
| 11,950 | | @ | | URS Corp. | | | 591,764 |
| | | | | | | |
| | | | | | | 4,515,132 |
| | | | | | | |
Entertainment: 0.5% |
| 10,400 | | @ | | DreamWorks Animation SKG, Inc. | | | 286,936 |
| 42,500 | | | | International Game Technology | | | 675,750 |
| 4,300 | | | | International Speedway Corp. | | | 110,123 |
| 9,600 | | @ | | Penn National Gaming, Inc. | | | 279,456 |
| 11,500 | | | | Regal Entertainment Group | | | 152,835 |
| 9,200 | | @ | | Scientific Games Corp. | | | 145,084 |
| 6,400 | | @ | | Warner Music Group Corp. | | | 37,440 |
| | | | | | | |
| | | | | | | 1,687,624 |
| | | | | | | |
Environmental Control: 0.7% |
| 19,800 | | | | Nalco Holding Co. | | | 333,432 |
| 46,210 | | | | Republic Services, Inc. | | | 1,127,986 |
| 12,150 | | @ | | Stericycle, Inc. | | | 626,090 |
| 11,500 | | @ | | Waste Connections, Inc. | | | 297,965 |
| | | | | | | |
| | | | | | | 2,385,473 |
| | | | | | | |
Food: 3.3% |
| 28,200 | | | | Campbell Soup Co. | | | 829,644 |
| 64,200 | | | | ConAgra Foods, Inc. | | | 1,223,652 |
| 10,700 | | | | Corn Products International, Inc. | | | 286,653 |
| 25,850 | | @ | | Dean Foods Co. | | | 496,062 |
| 28,350 | | | | Del Monte Foods Co. | | | 265,923 |
| 11,100 | | | | Flowers Foods, Inc. | | | 242,424 |
| 22,100 | | | | Hershey Co. | | | 795,600 |
| 45,100 | | | | HJ Heinz Co. | | | 1,610,070 |
| 10,000 | | | | Hormel Foods Corp. | | | 345,400 |
| 16,950 | | | | JM Smucker Co. | | | 824,787 |
| 18,650 | | | | McCormick & Co., Inc. | | | 606,685 |
| 8,100 | | @ | | Ralcorp Holdings, Inc. | | | 493,452 |
| 61,100 | | | | Safeway, Inc. | | | 1,244,607 |
| 99,850 | | | | Sara Lee Corp. | | | 974,536 |
| 17,450 | | @, L | | Smithfield Foods, Inc. | | | 243,777 |
| 32,950 | | | | Supervalu, Inc. | | | 426,703 |
| 43,300 | | | | Tyson Foods, Inc. | | | 546,013 |
| 15,650 | | L | | Whole Foods Market, Inc. | | | 297,037 |
| | | | | | | |
| | | | | | | 11,753,025 |
| | | | | | | |
Forest Products & Paper: 0.6% |
| 62,050 | | | | International Paper Co. | | | 938,817 |
| 24,550 | | | | MeadWestvaco Corp. | | | 402,866 |
| 30,350 | | | | Weyerhaeuser Co. | | | 923,551 |
| | | | | | | |
| | | | | | | 2,265,234 |
| | | | | | | |
Gas: 1.5% |
| 11,100 | | | | AGL Resources, Inc. | | | 352,980 |
| 13,200 | | | | Atmos Energy Corp. | | | 330,528 |
| 50,100 | | | | CenterPoint Energy, Inc. | | | 555,108 |
| 10,300 | | | | Energen Corp. | | | 410,970 |
| 10,200 | | | | National Fuel Gas Co. | | | 368,016 |
| 39,350 | | | | NiSource, Inc. | | | 458,821 |
| 35,050 | | | | Sempra Energy | | | 1,739,532 |
| 15,950 | | | | Southern Union Co. | | | 293,321 |
| 15,550 | | | | UGI Corp. | | | 396,370 |
| 11,600 | | | | Vectren Corp. | | | 271,788 |
| | | | | | | |
| | | | | | | 5,177,434 |
| | | | | | | |
| | | | | | | |
| Shares | | | | | | Value |
| | | | | | | |
Hand/Machine Tools: 0.4% |
| 8,600 | | | | Black & Decker Corp. | | $ | 246,476 |
| 10,500 | | | | Kennametal, Inc. | | | 201,390 |
| 6,150 | | | | Lincoln Electric Holdings, Inc. | | | 221,646 |
| 8,300 | | | | Snap-On, Inc. | | | 238,542 |
| 11,300 | | | | Stanley Works | | | 382,392 |
| | | | | | | |
| | | | | | | 1,290,446 |
| | | | | | | |
Healthcare - Products: 2.6% |
| 10,400 | | | | Beckman Coulter, Inc. | | | 594,256 |
| 6,450 | | | | Cooper Cos., Inc. | | | 159,509 |
| 14,250 | | | | CR Bard, Inc. | | | 1,060,913 |
| 21,300 | | | | Densply International, Inc. | | | 650,076 |
| 8,000 | | @ | | Edwards Lifesciences Corp. | | | 544,240 |
| 7,500 | | @ | | Gen-Probe, Inc. | | | 322,350 |
| 12,900 | | @ | | Henry Schein, Inc. | | | 618,555 |
| 9,000 | | | | Hill-Rom Holdings, Inc. | | | 145,980 |
| 36,850 | | @ | | Hologic, Inc. | | | 524,376 |
| 23,050 | | @ | | Hospira, Inc. | | | 887,886 |
| 8,500 | | @ | | Idexx Laboratories, Inc. | | | 392,700 |
| 5,450 | | @, L | | Intuitive Surgical, Inc. | | | 891,947 |
| 11,300 | | @ | | Inverness Medical Innovations, Inc. | | | 402,054 |
| 8,800 | | @ | | Kinetic Concepts, Inc. | | | 239,800 |
| 14,450 | | @ | | Patterson Cos., Inc. | | | 313,565 |
| 10,800 | | @ | | Resmed, Inc. | | | 439,884 |
| 5,350 | | | | Techne Corp. | | | 341,384 |
| 17,950 | | @ | | Varian Medical Systems, Inc. | | | 630,763 |
| | | | | | | |
| | | | | | | 9,160,238 |
| | | | | | | |
Healthcare - Services: 2.1% |
| 5,600 | | L | | Brookdale Senior Living, Inc. | | | 54,544 |
| 39,100 | | | | Cigna Corp. | | | 941,919 |
| 13,250 | | @ | | Community Health Systems, Inc. | | | 334,563 |
| 9,200 | | @ | | Covance, Inc. | | | 452,640 |
| 21,300 | | @ | | Coventry Health Care, Inc. | | | 398,523 |
| 14,850 | | @ | | DaVita, Inc. | | | 734,481 |
| 35,450 | | @ | | Health Management Associates, Inc. | | | 175,123 |
| 14,850 | | @ | | Health Net, Inc. | | | 230,918 |
| 24,300 | | @ | | Humana, Inc. | | | 783,918 |
| 15,500 | | @ | | Laboratory Corp. of America Holdings | | | 1,050,745 |
| 7,800 | | @ | | LifePoint Hospitals, Inc. | | | 204,750 |
| 9,900 | | @ | | Lincare Holdings, Inc. | | | 232,848 |
| 6,550 | | @ | | Mednax, Inc. | | | 275,952 |
| 22,250 | | | | Quest Diagnostics | | | 1,255,568 |
| 68,850 | | @ | | Tenet Healthcare Corp. | | | 194,157 |
| 6,550 | | | | Universal Health Services, Inc. | | | 319,968 |
| | | | | | | |
| | | | | | | 7,640,617 |
| | | | | | | |
Holding Companies - Diversified: 0.2% |
| 26,850 | | @ | | Leucadia National Corp. | | | 566,267 |
| | | | | | | |
| | | | | | | 566,267 |
| | | | | | | |
Home Builders: 0.6% |
| 17,850 | | | | Centex Corp. | | | 151,011 |
| 39,800 | | | | D.R. Horton, Inc. | | | 372,528 |
| 11,000 | | | | KB Home | | | 150,480 |
| 19,550 | | | | Lennar Corp. | | | 189,440 |
| 5,400 | | | | MDC Holdings, Inc. | | | 162,594 |
| 820 | | @ | | NVR, Inc. | | | 411,960 |
| 30,650 | | | | Pulte Homes, Inc. | | | 270,640 |
See Accompanying Notes to Financial Statements
54
| | |
| ING RUSSELL™ MID CAP INDEX PORTFOLIO | | PORTFOLIO OF INVESTMENTS AS OF JUNE 30, 2009 (UNAUDITED) (CONTINUED) |
| | | | | | | |
| Shares | | | | | | Value |
| | | | | | | |
Home Builders: (continued) |
| 5,100 | | | | Thor Industries, Inc. | | $ | 93,687 |
| 19,550 | | @ | | Toll Brothers, Inc. | | | 331,764 |
| | | | | | | |
| | | | | | | 2,134,104 |
| | | | | | | |
Home Furnishings: 0.2% |
| 8,400 | | | | Harman International Industries, Inc. | | | 157,920 |
| 10,600 | | | | Whirlpool Corp. | | | 451,136 |
| | | | | | | |
| | | | | | | 609,056 |
| | | | | | | |
Household Products/Wares: 0.9% |
| 16,150 | | | | Avery Dennison Corp. | | | 414,732 |
| 10,050 | | | | Church & Dwight Co., Inc. | | | 545,816 |
| 19,950 | | | | Clorox Co. | | | 1,113,809 |
| 21,600 | | | | Fortune Brands, Inc. | | | 750,384 |
| 12,600 | | @ | | Jarden Corp. | | | 236,250 |
| 6,450 | | | | Scotts Miracle-Gro Co. | | | 226,073 |
| | | | | | | |
| | | | | | | 3,287,064 |
| | | | | | | |
Housewares: 0.2% |
| 39,800 | | | | Newell Rubbermaid, Inc. | | | 414,318 |
| 5,100 | | L | | Toro Co. | | | 152,490 |
| | | | | | | |
| | | | | | | 566,808 |
| | | | | | | |
Insurance: 5.4% |
| 726 | | @ | | Alleghany Corp. | | | 196,746 |
| 7,150 | | | | Allied World Assurance Holdings Ltd. | | | 291,935 |
| 12,300 | | | | American Financial Group, Inc. | | | 265,434 |
| 347,000 | | | | American International Group, Inc. | | | 402,520 |
| 2,300 | | | | American National Insurance | | | 173,834 |
| 39,700 | | | | AON Corp. | | | 1,503,439 |
| 7,550 | | @, @@ | | Arch Capital Group Ltd. | | | 442,279 |
| 14,400 | | | | Arthur J. Gallagher & Co. | | | 307,296 |
| 11,900 | | @@ | | Aspen Insurance Holdings Ltd. | | | 265,846 |
| 16,850 | | | | Assurant, Inc. | | | 405,917 |
| 20,400 | | @@ | | Axis Capital Holdings Ltd. | | | 534,072 |
| 16,750 | | | | Brown & Brown, Inc. | | | 333,828 |
| 20,750 | | | | Cincinnati Financial Corp. | | | 463,763 |
| 3,850 | | | | CNA Financial Corp. | | | 59,560 |
| 7,100 | | @@ | | Endurance Specialty Holdings Ltd. | | | 208,030 |
| 4,200 | | | | Erie Indemnity Co. | | | 150,192 |
| 8,800 | | @@ | | Everest Re Group Ltd. | | | 629,816 |
| 33,650 | | | | Fidelity National Title Group, Inc. | | | 455,285 |
| 13,400 | | | | First American Corp. | | | 347,194 |
| 62,100 | | | | Genworth Financial, Inc. | | | 434,079 |
| 7,300 | | | | Hanover Insurance Group, Inc. | | | 278,203 |
| 46,700 | | | | Hartford Financial Services Group, Inc. | | | 554,329 |
| 16,050 | | | | HCC Insurance Holdings, Inc. | | | 385,361 |
| 36,750 | | | | Lincoln National Corp. | | | 632,468 |
| 1,380 | | @ | | Markel Corp. | | | 388,746 |
| 74,950 | | | | Marsh & McLennan Cos., Inc. | | | 1,508,744 |
| 18,850 | | @, L | | MBIA, Inc. | | | 81,621 |
| 3,850 | | | | Mercury General Corp. | | | 128,706 |
| 2,400 | | | | Odyssey Re Holdings Corp. | | | 95,952 |
| 34,500 | | | | Old Republic International Corp. | | | 339,825 |
| 3,350 | | | | OneBeacon Insurance Group Ltd. | | | 39,162 |
| | | | | | | |
| Shares | | | | | | Value |
| | | | | | | |
Insurance: (continued) |
| 8,100 | | @@ | | PartnerRe Ltd. | | $ | 526,095 |
| 44,550 | | | | Principal Financial Group, Inc. | | | 839,322 |
| 97,700 | | @ | | Progressive Corp. | | | 1,476,247 |
| 12,300 | | | | Protective Life Corp. | | | 140,712 |
| 10,400 | | | | Reinsurance Group of America, Inc. | | | 363,064 |
| 8,900 | | @@ | | RenaissanceRe Holdings Ltd. | | | 414,206 |
| 7,050 | | | | Stancorp Financial Group, Inc. | | | 202,194 |
| 11,900 | | | | Torchmark Corp. | | | 440,776 |
| 3,950 | | | | Transatlantic Holdings, Inc. | | | 171,154 |
| 6,050 | | | | Unitrin, Inc. | | | 72,721 |
| 47,550 | | | | UnumProvident Corp. | | | 754,143 |
| 5,700 | | | | Validus Holdings Ltd. | | | 125,286 |
| 200 | | | | Wesco Financial Corp. | | | 58,200 |
| 1,130 | | | | White Mountains Insurance Group Ltd. | | | 258,668 |
| 19,300 | | | | WR Berkley Corp. | | | 414,371 |
| 49,100 | | @@ | | XL Capital, Ltd. | | | 562,686 |
| | | | | | | |
| | | | | | | 19,124,027 |
| | | | | | | |
Internet: 1.5% |
| 24,800 | | @ | | Akamai Technologies, Inc. | | | 475,664 |
| 14,854 | | @, L | | Emdeon Corp. | | | 194,587 |
| 5,400 | | @ | | Equinix, Inc. | | | 392,796 |
| 26,350 | | @ | | Expedia, Inc. | | | 398,149 |
| 11,250 | | @ | | F5 Networks, Inc. | | | 389,138 |
| 15,650 | | @ | | IAC/InterActiveCorp | | | 251,183 |
| 85,600 | | @ | | Liberty Media Corp. - Interactive - Class A | | | 428,856 |
| 22,300 | | @ | | McAfee, Inc. | | | 940,837 |
| 6,100 | | @ | | NetFlix, Inc. | | | 252,174 |
| 5,950 | | @ | | Priceline.com, Inc. | | | 663,723 |
| 4,350 | | @, @@ | | Sohucom, Inc. | | | 273,311 |
| 27,650 | | @ | | VeriSign, Inc. | | | 510,972 |
| 1,200 | | @ | | WebMD Health Corp. | | | 35,904 |
| | | | | | | |
| | | | | | | 5,207,294 |
| | | | | | | |
Iron/Steel: 0.8% |
| 15,650 | | | | AK Steel Holding Corp. | | | 300,324 |
| 14,050 | | | | Allegheny Technologies, Inc. | | | 490,767 |
| 6,350 | | | | Carpenter Technology Corp. | | | 132,144 |
| 18,750 | | | | Cliffs Natural Resources, Inc. | | | 458,813 |
| 9,000 | | | | Reliance Steel & Aluminum Co. | | | 345,510 |
| 3,050 | | | | Schnitzer Steel Industries, Inc. | | | 161,223 |
| 26,150 | | | | Steel Dynamics, Inc. | | | 385,190 |
| 20,600 | | | | United States Steel Corp. | | | 736,244 |
| | | | | | | |
| | | | | | | 3,010,215 |
| | | | | | | |
Leisure Time: 0.3% |
| 33,600 | | | | Harley-Davidson, Inc. | | | 544,656 |
| 18,750 | | | | Royal Caribbean Cruises Ltd. | | | 253,875 |
| 6,300 | | @ | | WMS Industries, Inc. | | | 198,513 |
| | | | | | | |
| | | | | | | 997,044 |
| | | | | | | |
Lodging: 0.8% |
| 7,900 | | L | | Boyd Gaming Corp. | | | 67,150 |
| 4,100 | | | | Choice Hotels International, Inc. | | | 109,101 |
| 43,000 | | @ | | Las Vegas Sands Corp. | | | 337,980 |
| 42,713 | | | | Marriott International, Inc. | | | 942,676 |
| 28,050 | | @ | | MGM Mirage | | | 179,240 |
| 26,750 | | | | Starwood Hotels & Resorts Worldwide, Inc. | | | 593,850 |
See Accompanying Notes to Financial Statements
55
| | |
| ING RUSSELL™ MID CAP INDEX PORTFOLIO | | PORTFOLIO OF INVESTMENTS AS OF JUNE 30, 2009 (UNAUDITED) (CONTINUED) |
| | | | | | | |
| Shares | | | | | | Value |
| | | | | | | |
Lodging: (continued) |
| 25,550 | | | | Wyndham Worldwide Corp. | | $ | 309,666 |
| 9,600 | | @, L | | Wynn Resorts Ltd. | | | 338,880 |
| | | | | | | |
| | | | | | | 2,878,543 |
| | | | | | | |
Machinery - Construction & Mining: 0.3% |
| 10,800 | | | | Bucyrus International, Inc. | | | 308,448 |
| 14,650 | | | | Joy Global, Inc. | | | 523,298 |
| 15,150 | | @ | | Terex Corp. | | | 182,861 |
| | | | | | | |
| | | | | | | 1,014,607 |
| | | | | | | |
Machinery - Diversified: 1.2% |
| 13,300 | | @ | | AGCO Corp. | | | 386,631 |
| 29,000 | | | | Cummins, Inc. | | | 1,021,090 |
| 8,000 | | | | Flowserve Corp. | | | 558,480 |
| 7,400 | | @ | | Gardner Denver, Inc. | | | 186,258 |
| 8,600 | | | | Graco, Inc. | | | 189,372 |
| 11,550 | | | | IDEX Corp. | | | 283,784 |
| 18,650 | | | | Manitowoc Co., Inc. | | | 98,099 |
| 20,300 | | | | Rockwell Automation, Inc. | | | 652,036 |
| 13,000 | | | | Roper Industries, Inc. | | | 589,030 |
| 6,800 | | | | Wabtec Corp. | | | 218,756 |
| 8,500 | | @ | | Zebra Technologies Corp. | | | 201,110 |
| | | | | | | |
| | | | | | | 4,384,646 |
| | | | | | | |
Media: 1.7% |
| 33,700 | | | | Cablevision Systems Corp. | | | 654,117 |
| 87,100 | | | | CBS Corp. - Class B | | | 602,732 |
| 4,900 | | @, @@, L | | Central European Media Enterprises Ltd. | | | 96,481 |
| 4,900 | | @, @@ | | CTC Media, Inc. | | | 57,918 |
| 40,400 | | @ | | Discovery Communications, Inc. - Class C | | | 829,412 |
| 28,800 | | @ | | Dish Network Corp. | | | 466,848 |
| 5,950 | | L | | Factset Research Systems, Inc. | | | 296,727 |
| 33,250 | | | | Gannett Co., Inc. | | | 118,703 |
| 5,950 | | | | John Wiley & Sons, Inc. | | | 197,838 |
| 38,200 | | @ | | Liberty Global, Inc. | | | 606,998 |
| 11,550 | | @ | | Liberty Media Corp. - Capital Shares A | | | 156,618 |
| 45,150 | | | | McGraw-Hill Cos., Inc. | | | 1,359,467 |
| 4,850 | | | | Meredith Corp. | | | 123,918 |
| 14,900 | | L | | New York Times Co. | | | 82,099 |
| 12,550 | | | | Scripps Networks Interactive - Class A | | | 349,267 |
| | | | | | | |
| | | | | | | 5,999,143 |
| | | | | | | |
Metal Fabricate/Hardware: 0.6% |
| 16,150 | | | | Commercial Metals Co. | | | 258,885 |
| 20,050 | | | | Precision Castparts Corp. | | | 1,464,252 |
| 13,850 | | | | Timken Co. | | | 236,558 |
| 3,000 | | | | Valmont Industries, Inc. | | | 216,240 |
| | | | | | | |
| | | | | | | 2,175,935 |
| | | | | | | |
Mining: 0.4% |
| 4,700 | | | | Compass Minerals International, Inc. | | | 258,077 |
| 5,200 | | | | Royal Gold, Inc. | | | 216,840 |
| 12,250 | | | | Titanium Metals Corp. | | | 112,578 |
| 15,900 | | | | Vulcan Materials Co. | | | 685,290 |
| | | | | | | |
| | | | | | | 1,272,785 |
| | | | | | | |
| | | | | | | |
| Shares | | | | | | Value |
| | | | | | | |
Miscellaneous Manufacturing: 2.5% |
| 9,700 | | | | Aptargroup, Inc. | | $ | 327,569 |
| 6,550 | | | | Brink’s Co. | | | 190,147 |
| 8,800 | | | | Carlisle Cos., Inc. | | | 211,552 |
| 23,850 | | | | Cooper Industries Ltd. | | | 740,543 |
| 7,100 | | | | Crane Co. | | | 158,401 |
| 11,100 | | | | Donaldson Co., Inc. | | | 384,504 |
| 26,650 | | | | Dover Corp. | | | 881,849 |
| 23,750 | | | | Eaton Corp. | | | 1,059,488 |
| 11,550 | | | | Harsco Corp. | | | 326,865 |
| 26,150 | | | | ITT Corp. | | | 1,163,675 |
| 22,450 | | | | Leggett & Platt, Inc. | | | 341,914 |
| 16,850 | | | | Pall Corp. | | | 447,536 |
| 23,000 | | | | Parker Hannifin Corp. | | | 988,080 |
| 14,150 | | | | Pentair, Inc. | | | 362,523 |
| 7,000 | | | | SPX Corp. | | | 342,790 |
| 5,750 | | | | Teleflex, Inc. | | | 257,773 |
| 41,550 | | | | Textron, Inc. | | | 401,373 |
| 11,300 | | | | Trinity Industries, Inc. | | | 153,906 |
| | | | | | | |
| | | | | | | 8,740,488 |
| | | | | | | |
Office/Business Equipment: 0.4% |
| 29,650 | | | | Pitney Bowes, Inc. | | | 650,225 |
| 124,050 | | | | Xerox Corp. | | | 803,844 |
| | | | | | | |
| | | | | | | 1,454,069 |
| | | | | | | |
Oil & Gas: 4.7% |
| 8,000 | | @ | | Atwood Oceanics, Inc. | | | 199,280 |
| 14,850 | | | | Cabot Oil & Gas Corp. | | | 455,004 |
| 11,950 | | | | Cimarex Energy Co. | | | 338,663 |
| 3,550 | | @ | | CNX Gas Corp. | | | 93,259 |
| 6,700 | | @ | | Comstock Resources, Inc. | | | 221,435 |
| 10,900 | | @ | | Concho Resources, Inc. | | | 312,721 |
| 4,400 | | @, L | | Continental Resources, Inc. | | | 122,100 |
| 35,750 | | @ | | Denbury Resources, Inc. | | | 526,598 |
| 9,900 | | L | | Diamond Offshore Drilling | | | 822,195 |
| 7,600 | | @ | | Encore Acquisition Co. | | | 234,460 |
| 20,350 | | | | ENSCO International, Inc. | | | 709,605 |
| 18,750 | | | | EQT Corp. | | | 654,563 |
| 20,000 | | @ | | EXCO Resources, Inc. | | | 258,400 |
| 16,000 | | @ | | Forest Oil Corp. | | | 238,720 |
| 15,050 | | | | Frontier Oil Corp. | | | 197,306 |
| 15,150 | | | | Helmerich & Payne, Inc. | | | 467,681 |
| 6,150 | | | | Holly Corp. | | | 110,577 |
| 12,950 | | @ | | Mariner Energy, Inc. | | | 152,163 |
| 27,350 | | | | Murphy Oil Corp. | | | 1,485,652 |
| 40,600 | | @, @@ | | Nabors Industries Ltd. | | | 632,548 |
| 19,050 | | @ | | Newfield Exploration Co. | | | 622,364 |
| 24,850 | | | | Noble Energy, Inc. | | | 1,465,405 |
| 22,000 | | | | Patterson-UTI Energy, Inc. | | | 282,920 |
| 39,500 | | @ | | PetroHawk Energy Corp. | | | 880,850 |
| 16,350 | | | | Pioneer Natural Resources Co. | | | 416,925 |
| 17,250 | | @ | | Plains Exploration & Production Co. | | | 471,960 |
| 24,900 | | @ | | Pride International, Inc. | | | 623,994 |
| 24,950 | | | | Questar Corp. | | | 774,947 |
| 16,850 | | @, L | | Quicksilver Resources, Inc. | | | 156,537 |
| 22,500 | | | | Range Resources Corp. | | | 931,725 |
| 16,250 | | | | Rowan Cos., Inc. | | | 313,950 |
| 17,850 | | @ | | SandRidge Energy, Inc. | | | 152,082 |
| 9,000 | | | | St. Mary Land & Exploration Co. | | | 187,830 |
| 16,750 | | | | Sunoco, Inc. | | | 388,600 |
| 19,850 | | | | Tesoro Corp. | | | 252,691 |
See Accompanying Notes to Financial Statements
56
| | |
| ING RUSSELL™ MID CAP INDEX PORTFOLIO | | PORTFOLIO OF INVESTMENTS AS OF JUNE 30, 2009 (UNAUDITED) (CONTINUED) |
| | | | | | | |
| Shares | | | | | | Value |
| | | | | | | |
Oil & Gas: (continued) |
| 5,850 | | @ | | Unit Corp. | | $ | 161,285 |
| 7,250 | | @ | | Whiting Petroleum Corp. | | | 254,910 |
| | | | | | | |
| | | | | | | 16,571,905 |
| | | | | | | |
Oil & Gas Services: 1.3% |
| 41,900 | | | | BJ Services Co. | | | 571,097 |
| 31,100 | | @ | | Cameron International Corp. | | | 880,130 |
| 11,850 | | @ | | Dresser-Rand Group, Inc. | | | 309,285 |
| 9,000 | | @ | | Exterran Holdings, Inc. | | | 144,360 |
| 17,750 | | @ | | FMC Technologies, Inc. | | | 667,045 |
| 14,100 | | @ | | Helix Energy Solutions Group, Inc. | | | 153,267 |
| 7,800 | | @ | | Oceaneering International, Inc. | | | 352,560 |
| 7,150 | | @ | | Oil States International, Inc. | | | 173,102 |
| 2,900 | | @ | | SEACOR Holdings, Inc. | | | 218,196 |
| 31,450 | | | | Smith International, Inc. | | | 809,838 |
| 11,200 | | @ | | Superior Energy Services | | | 193,424 |
| | | | | | | |
| | | | | | | 4,472,304 |
| | | | | | | |
Packaging & Containers: 1.1% |
| 13,450 | | | | Ball Corp. | | | 607,402 |
| 14,350 | | | | Bemis Co. | | | 361,620 |
| 22,950 | | @ | | Crown Holdings, Inc. | | | 554,013 |
| 4,800 | | | | Greif, Inc. - Class A | | | 212,256 |
| 24,150 | | @ | | Owens-Illinois, Inc. | | | 676,442 |
| 14,750 | | | | Packaging Corp. of America | | | 238,950 |
| 18,950 | | @ | | Pactiv Corp. | | | 411,215 |
| 22,750 | | | | Sealed Air Corp. | | | 419,738 |
| 14,350 | | | | Sonoco Products Co. | | | 343,683 |
| 15,250 | | | | Temple-Inland, Inc. | | | 200,080 |
| | | | | | | |
| | | | | | | 4,025,399 |
| | | | | | | |
Pharmaceuticals: 1.9% |
| 43,300 | | | | AmerisourceBergen Corp. | | | 768,142 |
| 14,350 | | @ | | BioMarin Pharmaceuticals, Inc. | | | 224,004 |
| 10,600 | | @ | | Cephalon, Inc. | | | 600,490 |
| 16,850 | | @ | | Endo Pharmaceuticals Holdings, Inc. | | | 301,952 |
| 43,300 | | @ | | Forest Laboratories, Inc. | | | 1,087,263 |
| 8,800 | | @@ | | Herbalife Ltd. | | | 277,552 |
| 35,550 | | @ | | King Pharmaceuticals, Inc. | | | 342,347 |
| 5,000 | | @ | | Mead Johnson Nutrition Co. | | | 158,850 |
| 43,800 | | @, L | | Mylan Laboratories | | | 571,590 |
| 7,700 | | @ | | NBTY, Inc. | | | 216,524 |
| 16,950 | | | | Omnicare, Inc. | | | 436,632 |
| 11,400 | | | | Perrigo Co. | | | 316,692 |
| 15,650 | | @ | | Sepracor, Inc. | | | 271,058 |
| 9,800 | | @ | | Valeant Pharmaceuticals International | | | 252,056 |
| 12,150 | | @ | | VCA Antech, Inc. | | | 324,405 |
| 12,900 | | @ | | Warner Chilcott Ltd. | | | 169,635 |
| 15,150 | | @ | | Watson Pharmaceuticals, Inc. | | | 510,404 |
| | | | | | | |
| | | | | | | 6,829,596 |
| | | | | | | |
Pipelines: 0.8% |
| 100,600 | | | | El Paso Corp. | | | 928,538 |
| 15,150 | | | | Oneok, Inc. | | | 446,774 |
| 92,500 | | | | Spectra Energy Corp. | | | 1,565,100 |
| | | | | | | |
| | | | | | | 2,940,412 |
| | | | | | | |
Real Estate: 0.3% |
| 31,350 | | @ | | CB Richard Ellis Group, Inc. | | | 293,436 |
| 15,700 | | | | Forest City Enterprises, Inc. | | | 103,620 |
| | | | | | | |
| Shares | | | | | | Value |
| | | | | | | |
Real Estate: (continued) |
| 5,000 | | | | Jones Lang LaSalle, Inc. | | $ | 163,650 |
| 13,300 | | @ | | St. Joe Co. | | | 352,317 |
| | | | | | | |
| | | | | | | 913,023 |
| | | | | | | |
Retail: 5.4% |
| 12,550 | | L | | Abercrombie & Fitch Co. | | | 318,645 |
| 13,700 | | | | Advance Auto Parts, Inc. | | | 568,413 |
| 9,700 | | @ | | Aeropostale, Inc. | | | 332,419 |
| 24,450 | | | | American Eagle Outfitters | | | 346,457 |
| 10,450 | | @, L | | Autonation, Inc. | | | 181,308 |
| 4,650 | | @ | | Autozone, Inc. | | | 702,662 |
| 5,300 | | | | Barnes & Noble, Inc. | | | 109,339 |
| 37,450 | | @ | | Bed Bath & Beyond, Inc. | | | 1,151,588 |
| 11,800 | | @ | | Big Lots, Inc. | | | 248,154 |
| 7,900 | | @ | | BJ’s Wholesale Club, Inc. | | | 254,617 |
| 14,650 | | | | Brinker International, Inc. | | | 249,490 |
| 15,300 | | | | Burger King Holdings, Inc. | | | 264,231 |
| 31,600 | | @, L | | Carmax, Inc. | | | 464,520 |
| 25,400 | | @ | | Chico’s FAS, Inc. | | | 247,142 |
| 4,600 | | @, L | | Chipotle Mexican Grill, Inc. | | | 368,000 |
| 9,600 | | @ | | Copart, Inc. | | | 332,832 |
| 19,650 | | | | Darden Restaurants, Inc. | | | 648,057 |
| 12,350 | | @ | | Dick’s Sporting Goods, Inc. | | | 212,420 |
| 12,900 | | @ | | Dollar Tree, Inc. | | | 543,090 |
| 20,150 | | | | Family Dollar Stores, Inc. | | | 570,245 |
| 22,300 | | | | Foot Locker, Inc. | | | 233,481 |
| 23,650 | | @ | | GameStop Corp. | | | 520,537 |
| 8,400 | | | | Guess ?, Inc. | | | 216,552 |
| 31,900 | | | | JC Penney Co., Inc. | | | 915,849 |
| 38,050 | | | | Limited Brands, Inc. | | | 455,459 |
| 60,350 | | | | Macy’s, Inc. | | | 709,716 |
| 6,150 | | | | MSC Industrial Direct Co. | | | 218,202 |
| 23,650 | | | | Nordstrom, Inc. | | | 470,399 |
| 39,450 | | @ | | Office Depot, Inc. | | | 179,892 |
| 19,450 | | @ | | O’Reilly Automotive, Inc. | | | 740,656 |
| 3,950 | | @ | | Panera Bread Co. | | | 196,947 |
| 5,450 | | L | | Penske Auto Group, Inc. | | | 90,688 |
| 18,050 | | | | Petsmart, Inc. | | | 387,353 |
| 7,400 | | | | Phillips-Van Heusen | | | 212,306 |
| 17,950 | | | | RadioShack Corp. | | | 250,582 |
| 83,950 | | @ | | Rite Aid Corp. | | | 126,765 |
| 18,150 | | | | Ross Stores, Inc. | | | 700,590 |
| 7,100 | | @, L | | Sears Holding Corp. | | | 472,292 |
| 12,250 | | @@, L | | Signet Jewelers Ltd. | | | 255,045 |
| 17,750 | | | | Tiffany & Co. | | | 450,140 |
| 25,950 | | @@ | | Tim Hortons, Inc. | | | 636,813 |
| 59,250 | | | | TJX Cos., Inc. | | | 1,863,903 |
| 18,450 | | @ | | Urban Outfitters, Inc. | | | 385,052 |
| 52,400 | | | | Wendy’s/Arby’s Group, Inc. - Class A | | | 209,600 |
| 13,500 | | | | Williams-Sonoma, Inc. | | | 160,245 |
| | | | | | | |
| | | | | | | 19,172,693 |
| | | | | | | |
Savings & Loans: 0.8% |
| 2,850 | | | | Capitol Federal Financial | | | 109,241 |
| 21,500 | | | | First Niagara Financial Group, Inc. | | | 245,530 |
| 67,100 | | | | Hudson City Bancorp., Inc. | | | 891,759 |
| 49,500 | | L | | New York Community Bancorp., Inc. | | | 529,155 |
| 49,550 | | | | People’s United Financial, Inc. | | | 745,232 |
| 11,850 | | | | TFS Financial Corp. | | | 125,847 |
| 12,650 | | | | Washington Federal, Inc. | | | 164,450 |
| | | | | | | |
| | | | | | | 2,811,214 |
| | | | | | | |
See Accompanying Notes to Financial Statements
57
| | |
| ING RUSSELL™ MID CAP INDEX PORTFOLIO | | PORTFOLIO OF INVESTMENTS AS OF JUNE 30, 2009 (UNAUDITED) (CONTINUED) |
| | | | | | | |
| Shares | | | | | | Value |
| | | | | | | |
Semiconductors: 3.8% |
| 80,200 | | @, L | | Advanced Micro Devices, Inc. | | $ | 310,374 |
| 42,100 | | | | Altera Corp. | | | 685,388 |
| 41,800 | | | | Analog Devices, Inc. | | | 1,035,804 |
| 64,700 | | @ | | Atmel Corp. | | | 241,331 |
| 12,800 | | @, L | | Cree, Inc. | | | 376,192 |
| 20,600 | | @ | | Cypress Semiconductor Corp. | | | 189,520 |
| 17,750 | | @ | | Fairchild Semiconductor International, Inc. | | | 124,073 |
| 23,750 | | @ | | Integrated Device Technology, Inc. | | | 143,450 |
| 10,300 | | @ | | International Rectifier Corp. | | | 152,543 |
| 17,550 | | | | Intersil Corp. | | | 220,604 |
| 24,400 | | | | KLA-Tencor Corp. | | | 616,100 |
| 18,150 | | @ | | Lam Research Corp. | | | 471,900 |
| 31,900 | | | | Linear Technology Corp. | | | 744,865 |
| 93,150 | | @ | | LSI Logic Corp. | | | 424,764 |
| 14,500 | | @ | | Macrovision Solutions Corp. | | | 316,245 |
| 73,850 | | @, @@ | | Marvell Technology Group Ltd. | | | 859,614 |
| 43,700 | | | | Maxim Integrated Products | | | 685,653 |
| 32,050 | | @ | | MEMC Electronic Materials, Inc. | | | 570,811 |
| 26,250 | | | | Microchip Technology, Inc. | | | 591,938 |
| 121,500 | | @ | | Micron Technology, Inc. | | | 614,790 |
| 32,950 | | | | National Semiconductor Corp. | | | 413,523 |
| 14,050 | | @ | | Novellus Systems, Inc. | | | 234,635 |
| 78,350 | | @ | | Nvidia Corp. | | | 884,572 |
| 60,300 | | @ | | ON Semiconductor Corp. | | | 413,658 |
| 32,000 | | @ | | PMC - Sierra, Inc. | | | 254,720 |
| 17,050 | | @ | | QLogic Corp. | | | 216,194 |
| 14,950 | | @ | | Rambus, Inc. | | | 231,576 |
| 6,450 | | @ | | Silicon Laboratories, Inc. | | | 244,713 |
| 24,850 | | @ | | Teradyne, Inc. | | | 170,471 |
| 10,500 | | @ | | Varian Semiconductor Equipment Associates, Inc. | | | 251,895 |
| 39,300 | | | | Xilinx, Inc. | | | 804,078 |
| | | | | | | |
| | | | | | | 13,495,994 |
| | | | | | | |
Software: 3.6% |
| 9,000 | | @ | | Allscripts Healthcare Solutions, Inc. | | | 142,740 |
| 12,550 | | @ | | Ansys, Inc. | | | 391,058 |
| 32,700 | | @ | | Autodesk, Inc. | | | 620,646 |
| 26,550 | | @ | | BMC Software, Inc. | | | 897,125 |
| 20,150 | | | | Broadridge Financial Solutions ADR | | | 334,087 |
| 56,300 | | | | CA, Inc. | | | 981,309 |
| 9,600 | | @, L | | Cerner Corp. | | | 597,984 |
| 25,950 | | @ | | Citrix Systems, Inc. | | | 827,546 |
| 34,700 | | @ | | Compuware Corp. | | | 238,042 |
| 7,600 | | | | Dun & Bradstreet Corp. | | | 617,196 |
| 46,300 | | @ | | Electronic Arts, Inc. | | | 1,005,636 |
| 27,450 | | | | Fidelity National Information Services, Inc. | | | 547,902 |
| 22,350 | | @ | | Fiserv, Inc. | | | 1,021,395 |
| 26,050 | | | | IMS Health, Inc. | | | 330,835 |
| 46,350 | | @ | | Intuit, Inc. | | | 1,305,216 |
| 12,800 | | @ | | Metavante Technologies, inc. | | | 331,008 |
| 14,350 | | @ | | MSCI, Inc. - Class A | | | 350,714 |
| 49,400 | | @ | | Novell, Inc. | | | 223,782 |
| 31,150 | | @ | | Nuance Communications, Inc. | | | 376,604 |
| 27,150 | | @ | | Red Hat, Inc. | | | 546,530 |
| 15,550 | | @ | | Salesforce.com, Inc. | | | 593,544 |
| 11,900 | | @ | | Sybase, Inc. | | | 372,946 |
| | | | | | | |
| | | | | | | 12,653,845 |
| | | | | | | |
| | | | | | | |
| Shares | | | | | | Value |
| | | | | | | |
Telecommunications: 2.7% |
| 27,750 | | @, @@ | | Amdocs Ltd. | | $ | 595,238 |
| 14,450 | | L | | CenturyTel, Inc. | | | 443,615 |
| 13,050 | | @, L | | Ciena Corp. | | | 135,068 |
| 9,200 | | @, L | | Clearwire Corp. | | | 50,876 |
| 11,900 | | @ | | CommScope, Inc. | | | 312,494 |
| 41,700 | | @ | | Crown Castle International Corp. | | | 1,001,634 |
| 5,450 | | @ | | EchoStar Holding Corp. | | | 86,873 |
| 20,500 | | | | Embarq Corp. | | | 862,230 |
| 44,800 | | | | Frontier Communications Corp. | | | 319,872 |
| 18,950 | | | | Harris Corp. | | | 537,422 |
| 30,250 | | @ | | JDS Uniphase Corp. | | | 173,030 |
| 8,500 | | @ | | Leap Wireless International, Inc. | | | 279,905 |
| 233,550 | | @ | | Level 3 Communications, Inc. | | | 352,661 |
| 36,350 | | @ | | MetroPCS Communications, Inc. | | | 483,819 |
| 10,400 | | @ | | NeuStar, Inc. | | | 230,464 |
| 23,800 | | @ | | NII Holdings, Inc. | | | 453,866 |
| 211,300 | | | | Qwest Communications International, Inc. | | | 876,895 |
| 16,700 | | @ | | SBA Communications Corp. | | | 409,818 |
| 13,050 | | | | Telephone & Data Systems, Inc. | | | 369,315 |
| 56,850 | | @ | | Tellabs, Inc. | | | 325,751 |
| 21,400 | | @ | | TW Telecom, Inc. | | | 219,778 |
| 2,200 | | @ | | US Cellular Corp. | | | 84,590 |
| 41,400 | | | | Virgin Media, Inc. | | | 387,090 |
| 62,700 | | | | Windstream Corp. | | | 524,172 |
| | | | | | | |
| | | | | | | 9,516,476 |
| | | | | | | |
Textiles: 0.2% |
| 18,850 | | | | Cintas Corp. | | | 430,534 |
| 8,000 | | @ | | Mohawk Industries, Inc. | | | 285,440 |
| | | | | | | |
| | | | | | | 715,974 |
| | | | | | | |
Toys/Games/Hobbies: 0.4% |
| 17,950 | | | | Hasbro, Inc. | | | 435,108 |
| 7,000 | | @ | | Marvel Entertainment, Inc. | | | 249,130 |
| 51,450 | | | | Mattel, Inc. | | | 825,773 |
| | | | | | | |
| | | | | | | 1,510,011 |
| | | | | | | |
Transportation: 1.4% |
| 5,850 | | | | Alexander & Baldwin, Inc. | | | 137,124 |
| 24,350 | | | | CH Robinson Worldwide, Inc. | | | 1,269,853 |
| 6,650 | | | | Con-way, Inc. | | | 234,812 |
| 30,450 | | | | Expeditors International Washington, Inc. | | | 1,015,203 |
| 7,350 | | @@, L | | Frontline Ltd. | | | 179,046 |
| 12,500 | | | | JB Hunt Transport Services, Inc. | | | 381,625 |
| 13,100 | | @ | | Kansas City Southern | | | 211,041 |
| 7,700 | | @ | | Kirby Corp. | | | 244,783 |
| 7,400 | | | | Landstar System, Inc. | | | 265,734 |
| 3,350 | | | | Overseas Shipholding Group | | | 114,034 |
| 8,000 | | | | Ryder System, Inc. | | | 223,360 |
| 6,050 | | @@ | | Teekay Shipping Corp. | | | 127,232 |
| 7,400 | | | | Tidewater, Inc. | | | 317,238 |
| 14,350 | | @@ | | UTI Worldwide, Inc. | | | 163,590 |
| | | | | | | |
| | | | | | | 4,884,675 |
| | | | | | | |
Trucking & Leasing: 0.0% |
| 6,750 | | | | GATX Corp. | | | 173,610 |
| | | | | | | |
| | | | | | | 173,610 |
| | | | | | | |
See Accompanying Notes to Financial Statements
58
| | |
| ING RUSSELL™ MID CAP INDEX PORTFOLIO | | PORTFOLIO OF INVESTMENTS AS OF JUNE 30, 2009 (UNAUDITED) (CONTINUED) |
| | | | | | | |
| Shares | | | | | | Value |
| | | | | | | |
Water: 0.1% |
| 9,100 | | | | American Water Works Co., Inc. | | $ | 173,901 |
| 19,450 | | | | Aqua America, Inc. | | | 348,155 |
| | | | | | | |
| | | | | | | 522,056 |
| | | | | | | |
| | | | Total Common Stock
(Cost $365,157,779) | | | 328,314,702 |
| | | | | | | |
REAL ESTATE INVESTMENT TRUSTS: 4.9% |
Apartments: 0.7% |
| 16,812 | | | | Apartment Investment & Management Co. | | | 148,786 |
| 11,440 | | | | AvalonBay Communities, Inc. | | | 639,954 |
| 7,400 | | | | BRE Properties, Inc. | | | 175,824 |
| 9,600 | | | | Camden Property Trust | | | 264,960 |
| 39,250 | | | | Equity Residential | | | 872,528 |
| 3,950 | | | | Essex Property Trust, Inc. | | | 245,809 |
| 21,568 | | | | UDR, Inc. | | | 222,797 |
| | | | | | | |
| | | | | | | 2,570,658 |
| | | | | | | |
Diversified: 0.6% |
| 10,900 | | | | Digital Realty Trust, Inc. | | | 390,765 |
| 32,150 | | | | Duke Realty Corp. | | | 281,956 |
| 15,100 | | | | Liberty Property Trust | | | 347,904 |
| 21,906 | | | | Vornado Realty Trust | | | 986,427 |
| | | | | | | |
| | | | | | | 2,007,052 |
| | | | | | | |
Forest Products & Paper: 0.3% |
| 23,350 | | L | | Plum Creek Timber Co., Inc. | | | 695,363 |
| 11,300 | | | | Rayonier, Inc. | | | 410,755 |
| | | | | | | |
| | | | | | | 1,106,118 |
| | | | | | | |
Health Care: 0.8% |
| 39,450 | | | | HCP, Inc. | | | 835,946 |
| 15,950 | | | | Health Care Real Estate Investment Trust, Inc. | | | 543,895 |
| 14,750 | | | | Nationwide Health Properties, Inc. | | | 379,665 |
| 17,300 | | | | Senior Housing Properties Trust | | | 282,336 |
| 22,450 | | | | Ventas, Inc. | | | 670,357 |
| | | | | | | |
| | | | | | | 2,712,199 |
| | | | | | | |
Hotels: 0.2% |
| 13,500 | | @ | | Hospitality Properties Trust | | | 160,515 |
| 86,450 | | @ | | Host Hotels & Resorts, Inc. | | | 725,316 |
| | | | | | | |
| | | | | | | 885,831 |
| | | | | | | |
Mortgage: 0.4% |
| 78,050 | | | | Annaly Capital Management, Inc. | | | 1,181,677 |
| 96,200 | | | | Chimera Investment Corp. | | | 335,738 |
| | | | | | | |
| | | | | | | 1,517,415 |
| | | | | | | |
Office Property: 0.6% |
| 5,700 | | | | Alexandria Real Estate Equities, Inc. | | | 204,003 |
| 17,350 | | | | Boston Properties, Inc. | | | 827,595 |
| 18,450 | | | | Brandywine Realty Trust | | | 137,453 |
| 8,200 | | | | Corporate Office Properties Trust SBI MD | | | 240,506 |
| 17,350 | | | | Douglas Emmett, Inc. | | | 155,977 |
| 32,050 | | | | HRPT Properties Trust | | | 130,123 |
| 11,200 | | | | Mack-Cali Realty Corp. | | | 255,360 |
| 11,000 | | | | SL Green Realty Corp. | | | 252,340 |
| | | | | | | |
| | | | | | | 2,203,357 |
| | | | | | | |
| | | | | | | |
| Shares | | | | | | Value |
| | | | | | | |
Regional Malls: 0.1% |
| 11,441 | | L | | Macerich Co. | | $ | 201,476 |
| 7,600 | | | | Taubman Centers, Inc. | | | 204,136 |
| | | | | | | |
| | | | | | | 405,612 |
| | | | | | | |
Shopping Centers: 0.4% |
| 8,500 | | | | Federal Realty Investment Trust | | | 437,920 |
| 54,050 | | | | Kimco Realty Corp. | | | 543,203 |
| 11,500 | | | | Regency Centers Corp. | | | 401,465 |
| 15,000 | | | | Weingarten Realty Investors | | | 217,650 |
| | | | | | | |
| | | | | | | 1,600,238 |
| | | | | | | |
Single Tenant: 0.1% |
| 15,000 | | | | Realty Income Corp. | | | 328,800 |
| | | | | | | |
| | | | | | | 328,800 |
| | | | | | | |
Storage: 0.4% |
| 19,250 | | | | Public Storage, Inc. | | | 1,260,490 |
| | | | | | | |
| | | | | | | 1,260,490 |
| | | | | | | |
Warehouse/Industrial: 0.3% |
| 20,950 | | | | AMB Property Corp. | | | 394,070 |
| 63,500 | | | | Prologis | | | 511,810 |
| | | | | | | |
| | | | | | | 905,880 |
| | | | | | | |
| | | | Total Real Estate Investment Trusts
(Cost $21,837,431) | | | 17,503,650 |
| | | | | | | |
RIGHTS: 0.0% |
Pharmaceuticals: 0.0% |
| 1,300 | | @@ | | Fresenius Kabi Pharmaceuticals Holding, Inc. | | | 351 |
| | | | | | | |
| | | | Total Rights
(Cost $—) | | | 351 |
| | | | | | | |
| | | | Total Long-Term Investments
(Cost $386,995,210) | | | 345,818,703 |
| | | | | | | |
SHORT-TERM INVESTMENTS: 28.6% |
Affiliated Mutual Fund: 25.6% |
| 90,590,000 | | S | | ING Institutional Prime Money Market Fund - Class I | | | 90,590,000 |
| | | | | | | |
| | | | Total Mutual Fund
(Cost $90,590,000) | | | 90,590,000 |
| | | | | | | |
| | | | | | | | | | | | |
Principal
Amount | | | | | | | | | Value | |
| Securities Lending Collateralcc: 3.0% | |
| $ | 10,778,976 | | | | Bank of New York Mellon Corp. Institutional Cash Reserves | | | | | $ | 10,725,208 | |
| | | | | | | | | | | | |
| | | | | Total Securities Lending Collateral (Cost $10,778,976) | | | | | | 10,725,208 | |
| | | | | | | | | | | | |
| | | | | Total Short-Term Investments (Cost $101,368,976) | | | | | | 101,315,208 | |
| | | | | | | | | | | | |
| | | | | Total Investments in Securities (Cost $488,364,186)* | | 126.2 | % | | $ | 447,133,911 | |
| | | | | Other Assets and Liabilities - Net | | (26.2 | ) | | | (92,813,993 | ) |
| | | | | | | | | | | | |
| | | | | Net Assets | | 100.0 | % | | $ | 354,319,918 | |
| | | | | | | | | | | | |
See Accompanying Notes to Financial Statements
59
| | |
| ING RUSSELL™ MID CAP INDEX PORTFOLIO | | PORTFOLIO OF INVESTMENTS AS OF JUNE 30, 2009 (UNAUDITED) (CONTINUED) |
| @ | Non-income producing security |
| ADR | American Depositary Receipt |
| cc | Securities purchased with cash collateral for securities loaned. |
| S | All or a portion of this security is segregated to cover collateral requirements for applicable futures, options, swaps, foreign forward currency contracts and/or when-issued or delayed-delivery securities. |
| L | Loaned security, a portion or all of the security is on loan at June 30, 2009. |
| * | Cost for federal income tax purposes is $500,517,179. |
| | | | |
Net unrealized depreciation consists of: | | | | |
Gross Unrealized Appreciation | | $ | 4,819,050 | |
Gross Unrealized Depreciation | | | (58,202,318 | ) |
| | | | |
Net Unrealized Depreciation | | $ | (53,383,268 | ) |
| | | | |
Fair Value Measurements*
The following is a summary of the inputs used as of June 30, 2009 in determining the Portfolio’s investments at fair value for purposes of SFAS 157:
| | | | | | | | | | |
| | | Quoted Prices in Active Markets
for Identical Investments (Level 1) | | | Significant Other Observable Inputs (Level 2) | | Significant Unobservable Inputs (Level 3) |
Common Stock** | | $ | 328,314,702 | | | $ | — | | $ | — |
Real Estate Investment Trusts | | | 17,503,650 | | | | — | | | — |
Rights | | | 351 | | | | — | | | — |
Short-Term Investments | | | 90,590,000 | | | | 10,725,208 | | | — |
| | | | | | | | | | |
Total | | $ | 436,408,703 | | | $ | 10,725,208 | | $ | — |
| | | | | | | | | | |
Other Financial Instruments*** | | | (174,164 | ) | | | — | | | — |
| | | | | | | | | | |
Total | | $ | (174,164 | ) | | $ | — | | $ | — |
| | | | | | | | | | |
“Fair value” for purposes of SFAS 157 is different from “fair value” as used in the 1940 Act. The former generally implies market value, and can include market quotations as a source of value, and the latter refers to determinations of value in absence of available market quotations.
| * | See NOTE 2, “Significant Accounting Policies” in the Notes to Financial Statements for additional information. |
| ** | For further breakdown of Common Stock, by industry type, please refer to the Portfolio of Investments. |
| *** | Other financial instruments may include open forward foreign currency contracts, futures, swaps, and written options. Forward foreign currency contracts and futures are reported at their unrealized gain/loss at period end. Swaps and written options are reported at their market value at period end. |
ING Russell Mid Cap Index Portfolio Open Futures Contracts on June 30, 2009:
| | | | | | | | |
Contract Description | | Number of Contracts | | Expiration Date | | Unrealized Depreciation | |
Long Contracts | | | | | | | | |
S&P Mid 400 E-Mini | | 172 | | 09/18/09 | | $ | (174,164 | ) |
| | | | | | | | |
| | | | | | $ | (174,164 | ) |
| | | | | | | | |
For the six months ended June 30, 2009, net realized gain (loss) on futures and the net change in unrealized gain (loss) on futures can be found on the Portfolio’s Statement of Operations. For additional information on the reason(s) why the Portfolio may enter into futures contracts and the risks associated with futures contracts, please refer to NOTE 2 in the accompanying Notes to Financial Statements.
See Accompanying Notes to Financial Statements
60
| | |
ING RUSSELL™ MID CAP GROWTH
INDEX PORTFOLIO | | PORTFOLIO OF INVESTMENTS AS OF JUNE 30, 2009 (UNAUDITED) |
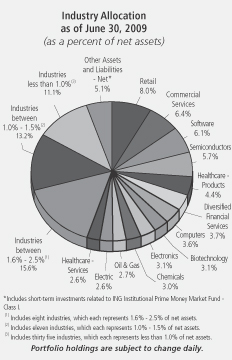
| | | | | | | |
| Shares | | | | | | Value |
| | | | | | | |
COMMON STOCK: 93.2% | | | |
Aerospace/Defense: 1.4% | | | |
| 1,900 | | @ | | Alliant Techsystems, Inc. | | $ | 156,484 |
| 2,600 | | @ | | BE Aerospace, Inc. | | | 37,336 |
| 7,000 | | | | Goodrich Corp. | | | 349,790 |
| 9,000 | | | | Rockwell Collins, Inc. | | | 375,570 |
| 1,900 | | @ | | Spirit Aerosystems Holdings, Inc. | | | 26,106 |
| 2,200 | | @ | | TransDigm Group, Inc. | | | 79,640 |
| | | | | | | |
| | | | | | | 1,024,926 |
| | | | | | | |
Agriculture: 0.8% | | | |
| 8,400 | | | | Lorillard, Inc. | | | 569,268 |
| | | | | | | |
| | | | | | | 569,268 |
| | | | | | | |
Airlines: 0.8% | | | |
| 16,100 | | @ | | AMR Corp. | | | 64,722 |
| 7,000 | | @ | | Continental Airlines, Inc. | | | 62,020 |
| 1,700 | | @@ | | Copa Holdings SA | | | 69,394 |
| 43,700 | | @ | | Delta Airlines, Inc. | | | 253,023 |
| 13,100 | | | | Southwest Airlines Co. | | | 88,163 |
| | | | | | | |
| | | | | | | 537,322 |
| | | | | | | |
Apparel: 1.1% | | | |
| 18,000 | | | | Coach, Inc. | | | 483,840 |
| 5,400 | | @ | | Hanesbrands, Inc. | | | 81,054 |
| 2,900 | | | | Polo Ralph Lauren Corp. | | | 155,266 |
| 1,100 | | | | VF Corp. | | | 60,885 |
| | | | | | | |
| | | | | | | 781,045 |
| | | | | | | |
Auto Manufacturers: 0.2% | | | |
| 3,600 | | @ | | Navistar International Corp. | | | 156,960 |
| | | | | | | |
| | | | | | | 156,960 |
| | | | | | | |
| | | | | | | |
| Shares | | | | | | Value |
| | | | | | | |
Auto Parts & Equipment: 0.6% | | | |
| 6,100 | | | | BorgWarner, Inc. | | $ | 208,315 |
| 400 | | @ | | Federal Mogul Corp. | | | 3,780 |
| 13,700 | | @ | | Goodyear Tire & Rubber Co. | | | 154,262 |
| 700 | | @ | | TRW Automotive Holdings Corp. | | | 7,910 |
| 3,200 | | | | WABCO Holdings, Inc. | | | 56,640 |
| | | | | | | |
| | | | | | | 430,907 |
| | | | | | | |
Banks: 0.1% | | | |
| 400 | | | | BOK Financial Corp. | | | 15,068 |
| 2,100 | | | | CapitalSource, Inc. | | | 10,248 |
| 1,200 | | | | Commerce Bancshares, Inc. | | | 38,196 |
| | | | | | | |
| | | | | | | 63,512 |
| | | | | | | |
Beverages: 1.2% | | | |
| 4,200 | | | | Brown-Forman Corp. | | | 180,516 |
| 14,900 | | | | Coca-Cola Enterprises, Inc. | | | 248,085 |
| 1,700 | | @ | | Green Mountain Coffee Roasters, Inc. | | | 100,504 |
| 3,900 | | @ | | Hansen Natural Corp. | | | 120,198 |
| 400 | | | | Molson Coors Brewing Co. | | | 16,932 |
| 6,400 | | | | Pepsi Bottling Group, Inc. | | | 216,576 |
| | | | | | | |
| | | | | | | 882,811 |
| | | | | | | |
Biotechnology: 3.1% | | | |
| 400 | | @ | | Abraxis Bioscience, Inc. | | | 14,744 |
| 4,600 | | @ | | Alexion Pharmaceuticals, Inc. | | | 189,152 |
| 8,000 | | @ | | Amylin Pharmaceuticals, Inc. | | | 108,000 |
| 1,100 | | @ | | Bio-Rad Laboratories, Inc. | | | 83,028 |
| 2,500 | | @ | | Charles River Laboratories International, Inc. | | | 84,375 |
| 6,500 | | @ | | Dendreon Corp. | | | 161,525 |
| 7,000 | | @ | | Illumina, Inc. | | | 272,580 |
| 8,800 | | @ | | Life Technologies Corp. | | | 367,136 |
| 3,100 | | @ | | Millipore Corp. | | | 217,651 |
| 5,400 | | @ | | Myriad Genetics, Inc. | | | 192,510 |
| 3,300 | | @ | | OSI Pharmaceuticals, Inc. | | | 93,159 |
| 1,300 | | @ | | United Therapeutics Corp. | | | 108,329 |
| 9,800 | | @ | | Vertex Pharmaceuticals, Inc. | | | 349,272 |
| | | | | | | |
| | | | | | | 2,241,461 |
| | | | | | | |
Building Materials: 0.5% | | | |
| 500 | | @ | | Armstrong World Industries, Inc. | | | 8,245 |
| 2,500 | | | | Eagle Materials, Inc. | | | 63,100 |
| 2,600 | | | | Lennox International, Inc. | | | 83,486 |
| 1,000 | | | | Martin Marietta Materials, Inc. | | | 78,880 |
| 9,600 | | | | Masco Corp. | | | 91,968 |
| 2,100 | | @ | | Owens Corning, Inc. | | | 26,838 |
| | | | | | | |
| | | | | | | 352,517 |
| | | | | | | |
Chemicals: 3.0% | | | |
| 300 | | | | Albemarle Corp. | | | 7,671 |
| 300 | | | | Ashland, Inc. | | | 8,415 |
| 8,100 | | | | Celanese Corp. | | | 192,375 |
| 2,300 | | | | CF Industries Holdings, Inc. | | | 170,522 |
| 13,400 | | | | Ecolab, Inc. | | | 522,466 |
| 3,500 | | S | | FMC Corp. | | | 165,550 |
| 4,200 | | | | International Flavors & Fragrances, Inc. | | | 137,424 |
| 2,200 | | @ | | Intrepid Potash, Inc. | | | 61,776 |
| 3,300 | | | | Lubrizol Corp. | | | 156,123 |
| 3,800 | | | | RPM International, Inc. | | | 53,352 |
| 4,800 | | | | Sherwin-Williams Co. | | | 258,000 |
| 6,900 | | | | Sigma-Aldrich Corp. | | | 341,964 |
See Accompanying Notes to Financial Statements
61
| | |
ING RUSSELL™ MID CAP GROWTH
INDEX PORTFOLIO | | PORTFOLIO OF INVESTMENTS AS OF JUNE 30, 2009 (UNAUDITED) (CONTINUED) |
| | | | | | | |
| Shares | | | | | | Value |
| | | | | | | |
Chemicals: (continued) | | | |
| 3,900 | | | | Terra Industries, Inc. | | $ | 94,458 |
| 100 | | | | Valhi, Inc. | | | 743 |
| | | | | | | |
| | | | | | | 2,170,839 |
| | | | | | | |
Coal: 1.0% | | | |
| 4,000 | | @ | | Alpha Natural Resources, Inc. | | | 105,080 |
| 10,200 | | | | Consol Energy, Inc. | | | 346,392 |
| 2,500 | | | | Foundation Coal Holdings, Inc. | | | 70,275 |
| 3,900 | | | | Massey Energy Co. | | | 76,206 |
| 3,000 | | | | Walter Industries, Inc. | | | 108,720 |
| | | | | | | |
| | | | | | | 706,673 |
| | | | | | | |
Commercial Services: 6.4% | | | |
| 2,700 | | | | Aaron Rents, Inc. | | | 80,514 |
| 3,300 | | @ | | Alliance Data Systems Corp. | | | 135,927 |
| 7,500 | | @ | | Apollo Group, Inc. - Class A | | | 533,400 |
| 2,600 | | @ | | Brink’s Home Security Holdings, Inc. | | | 73,606 |
| 3,800 | | @ | | Career Education Corp. | | | 94,582 |
| 700 | | @ | | Convergys Corp. | | | 6,496 |
| 700 | | @ | | Corrections Corp. of America | | | 11,893 |
| 3,500 | | | | DeVry, Inc. | | | 175,140 |
| 5,600 | | | | Equifax, Inc. | | | 146,160 |
| 2,900 | | @ | | FTI Consulting, Inc. | | | 147,088 |
| 3,500 | | @, @@ | | Genpact Ltd. | | | 41,125 |
| 4,500 | | | | Global Payments, Inc. | | | 168,570 |
| 19,200 | | | | H&R Block, Inc. | | | 330,816 |
| 4,700 | | @ | | Hewitt Associates, Inc. | | | 139,966 |
| 1,300 | | S | | Hillenbrand, Inc. | | | 21,632 |
| 1,000 | | | | Interactive Data Corp. | | | 23,140 |
| 10,200 | | @ | | Iron Mountain, Inc. | | | 293,250 |
| 2,200 | | @ | | ITT Educational Services, Inc. | | | 221,452 |
| 5,400 | | | | Lender Processing Services, Inc. | | | 149,958 |
| 4,200 | | @ | | Monster Worldwide, Inc. | | | 49,602 |
| 10,600 | | | | Moody’s Corp. | | | 279,310 |
| 1,100 | | @ | | Morningstar, Inc. | | | 45,353 |
| 18,200 | | | | Paychex, Inc. | | | 458,640 |
| 5,900 | | | | Pharmaceutical Product Development, Inc. | | | 136,998 |
| 8,600 | | | | Robert Half International, Inc. | | | 203,132 |
| 3,000 | | | | RR Donnelley & Sons Co. | | | 34,860 |
| 8,700 | | @ | | SAIC, Inc. | | | 161,385 |
| 6,800 | | | | SEI Investments Co. | | | 122,672 |
| 800 | | | | Strayer Education, Inc. | | | 174,488 |
| 6,600 | | | | Total System Services, Inc. | | | 88,374 |
| 200 | | | | Weight Watchers International, Inc. | | | 5,154 |
| | | | | | | |
| | | | | | | 4,554,683 |
| | | | | | | |
Computers: 3.6% | | | |
| 3,100 | | @ | | Affiliated Computer Services, Inc. | | | 137,702 |
| 7,700 | | @ | | Brocade Communications Systems, Inc. | | | 60,214 |
| 14,900 | | @ | | Cadence Design Systems, Inc. | | | 87,910 |
| 16,500 | | @ | | Cognizant Technology Solutions Corp. | | | 440,550 |
| 3,300 | | | | Diebold, Inc. | | | 86,988 |
| 1,900 | | @ | | DST Systems, Inc. | | | 70,205 |
| 2,700 | | @ | | IHS, Inc. | | | 134,649 |
| 4,600 | | @ | | Micros Systems, Inc. | | | 116,472 |
| 9,000 | | @ | | NCR Corp. | | | 106,470 |
| 18,800 | | @ | | NetApp, Inc. | | | 370,736 |
| 6,200 | | @ | | Sandisk Corp. | | | 91,078 |
| | | | | | | |
| Shares | | | | | | Value |
| | | | | | | |
Computers: (continued) | | | |
| 25,100 | | | | Seagate Technology, Inc. | | $ | 262,546 |
| 5,100 | | @ | | Synopsys, Inc. | | | 99,501 |
| 8,000 | | @ | | Teradata Corp. | | | 187,440 |
| 11,400 | | @ | | Western Digital Corp. | | | 302,100 |
| | | | | | | |
| | | | | | | 2,554,561 |
| | | | | | | |
Cosmetics/Personal Care: 1.3% | | | |
| 4,100 | | | | Alberto-Culver Co. | | | 104,263 |
| 24,200 | | | | Avon Products, Inc. | | | 623,875 |
| 6,300 | | | | Estee Lauder Cos., Inc. | | | 205,821 |
| | | | | | | |
| | | | | | | 933,959 |
| | | | | | | |
Distribution/Wholesale: 1.0% | | | |
| 7,500 | | | | Fastenal Co. | | | 248,775 |
| 7,900 | | @ | | LKQ Corp. | | | 129,955 |
| 1,300 | | @ | | Wesco International, Inc. | | | 32,552 |
| 3,500 | | | | WW Grainger, Inc. | | | 286,580 |
| | | | | | | |
| | | | | | | 697,862 |
| | | | | | | |
Diversified Financial Services: 3.7% | | | |
| 2,300 | | @ | | Affiliated Managers Group, Inc. | | | 133,837 |
| 1,500 | | @ | | AmeriCredit Corp. | | | 20,325 |
| 1,000 | | | | Ameriprise Financial, Inc. | | | 24,270 |
| 2,100 | | | | CIT Group, Inc. | | | 4,515 |
| 6,600 | | | | Eaton Vance Corp. | | | 176,550 |
| 4,700 | | | | Federated Investors, Inc. | | | 113,223 |
| 10,800 | | | | GLG Partners, Inc. | | | 44,172 |
| 1,200 | | | | Greenhill & Co., Inc. | | | 86,652 |
| 4,100 | | @ | | IntercontinentalExchange, Inc. | | | 468,384 |
| 1,900 | | | | Invesco Ltd. | | | 33,858 |
| 200 | | @ | | Investment Technology Group, Inc. | | | 4,078 |
| 7,900 | | | | Janus Capital Group, Inc. | | | 90,060 |
| 5,000 | | | | Jefferies Group, Inc. | | | 106,650 |
| 4,300 | | @@ | | Lazard Ltd. | | | 115,756 |
| 3,400 | | @ | | Nasdaq Stock Market, Inc. | | | 72,454 |
| 3,800 | | | | NYSE Euronext | | | 103,550 |
| 5,700 | | @ | | SLM Corp. | | | 58,539 |
| 14,500 | | | | T. Rowe Price Group, Inc. | | | 604,215 |
| 14,800 | | @ | | TD Ameritrade Holding Corp. | | | 259,592 |
| 4,900 | | | | Waddell & Reed Financial, Inc. | | | 129,213 |
| | | | | | | |
| | | | | | | 2,649,893 |
| | | | | | | |
Electric: 2.6% | | | |
| 30,400 | | @ | | AES Corp. | | | 352,944 |
| 5,900 | | | | Allegheny Energy, Inc. | | | 151,335 |
| 10,200 | | @ | | Calpine Corp. | | | 113,730 |
| 8,700 | | | | Constellation Energy Group, Inc. | | | 231,246 |
| 800 | | | | DPL, Inc. | | | 18,536 |
| 1,000 | | | | Integrys Energy Group, Inc. | | | 29,990 |
| 2,800 | | | | ITC Holdings Corp. | | | 127,008 |
| 5,700 | | | | NV Energy, Inc. | | | 61,503 |
| 1,100 | | | | Ormat Technologies, Inc. | | | 44,341 |
| 21,300 | | | | PPL Corp. | | | 702,048 |
| | | | | | | |
| | | | | | | 1,832,681 |
| | | | | | | |
Electrical Components & Equipment: 0.8% | | | |
| 6,100 | | | | Ametek, Inc. | | | 210,938 |
| 3,300 | | @ | | Energizer Holdings, Inc. | | | 172,392 |
| 400 | | | | Hubbell, Inc. | | | 12,824 |
| 600 | | | | Molex, Inc. | | | 9,330 |
| 5,500 | | @ | | Sunpower Corp. - Class A | | | 146,520 |
| | | | | | | |
| | | | | | | 552,004 |
| | | | | | | |
See Accompanying Notes to Financial Statements
62
| | |
ING RUSSELL™ MID CAP GROWTH
INDEX PORTFOLIO | | PORTFOLIO OF INVESTMENTS AS OF JUNE 30, 2009 (UNAUDITED) (CONTINUED) |
| | | | | | | |
| Shares | | | | | | Value |
| | | | | | | |
Electronics: 3.1% | | | |
| 19,400 | | @ | | Agilent Technologies, Inc. | | $ | 394,014 |
| 9,700 | | | | Amphenol Corp. | | | 306,908 |
| 2,800 | | @ | | Arrow Electronics, Inc. | | | 59,472 |
| 2,900 | | @ | | Avnet, Inc. | | | 60,987 |
| 600 | | | | AVX Corp. | | | 5,958 |
| 3,000 | | @ | | Dolby Laboratories, Inc. | | | 111,840 |
| 8,500 | | @ | | Flir Systems, Inc. | | | 191,760 |
| 5,200 | | @@ | | Garmin Ltd. | | | 123,864 |
| 7,800 | | | | Gentex Corp. | | | 90,480 |
| 2,100 | | @ | | Itron, Inc. | | | 115,647 |
| 5,300 | | | | Jabil Circuit, Inc. | | | 39,326 |
| 1,900 | | @, @@ | | Mettler Toledo International, Inc. | | | 146,585 |
| 3,200 | | | | National Instruments Corp. | | | 72,192 |
| 1,400 | | | | PerkinElmer, Inc. | | | 24,360 |
| 900 | | @ | | Thomas & Betts Corp. | | | 25,974 |
| 6,800 | | @ | | Trimble Navigation Ltd. | | | 133,484 |
| 2,200 | | @ | | Vishay Intertechnology, Inc. | | | 14,938 |
| 5,500 | | @ | | Waters Corp. | | | 283,085 |
| | | | | | | |
| | | | | | | 2,200,874 |
| | | | | | | |
Engineering & Construction: 1.9% | | | |
| 5,300 | | @ | | Aecom Technology Corp. | | | 169,600 |
| 10,200 | | | | Fluor Corp. | | | 523,158 |
| 7,000 | | @ | | Jacobs Engineering Group, Inc. | | | 294,630 |
| 12,900 | | @ | | McDermott International, Inc. | | | 261,999 |
| 3,800 | | @ | | Shaw Group, Inc. | | | 104,158 |
| 600 | | @ | | URS Corp. | | | 29,712 |
| | | | | | | |
| | | | | | | 1,383,257 |
| | | | | | | |
Entertainment: 0.4% | | | |
| 13,900 | | | | International Game Technology | | | 221,010 |
| 2,300 | | | | Regal Entertainment Group | | | 30,567 |
| 3,600 | | @ | | Scientific Games Corp. | | | 56,772 |
| 200 | | @ | | Warner Music Group Corp. | | | 1,170 |
| | | | | | | |
| | | | | | | 309,519 |
| | | | | | | |
Environmental Control: 0.8% | | | |
| 7,800 | | | | Nalco Holding Co. | | | 131,352 |
| 5,800 | | | | Republic Services, Inc. | | | 141,578 |
| 4,800 | | @ | | Stericycle, Inc. | | | 247,344 |
| 3,300 | | @ | | Waste Connections, Inc. | | | 85,503 |
| | | | | | | |
| | | | | | | 605,777 |
| | | | | | | |
Food: 2.3% | | | |
| 7,600 | | | | Campbell Soup Co. | | | 223,592 |
| 10,200 | | @ | | Dean Foods Co. | | | 195,738 |
| 3,600 | | | | Flowers Foods, Inc. | | | 78,624 |
| 5,100 | | | | Hershey Co. | | | 183,600 |
| 14,400 | | | | HJ Heinz Co. | | | 514,080 |
| 400 | | | | Hormel Foods Corp. | | | 13,816 |
| 7,400 | | | | McCormick & Co., Inc. | | | 240,722 |
| 9,800 | | | | Sara Lee Corp. | | | 95,648 |
| 500 | | @ | | Smithfield Foods, Inc. | | | 6,985 |
| 5,200 | | | | Whole Foods Market, Inc. | | | 98,696 |
| | | | | | | |
| | | | | | | 1,651,501 |
| | | | | | | |
Gas: 0.3% | | | |
| 16,600 | | | | CenterPoint Energy, Inc. | | | 183,928 |
| | | | | | | |
| | | | | | | 183,928 |
| | | | | | | |
Hand/Machine Tools: 0.0% | | | |
| 900 | | | | Snap-On, Inc. | | | 25,866 |
| | | | | | | |
| | | | | | | 25,866 |
| | | | | | | |
| | | | | | | |
| Shares | | | | | | Value |
| | | | | | | |
Healthcare - Products: 4.4% | | | |
| 4,100 | | | | Beckman Coulter, Inc. | | $ | 234,274 |
| 5,600 | | | | CR Bard, Inc. | | | 416,920 |
| 8,400 | | | | Densply International, Inc. | | | 256,368 |
| 3,200 | | @ | | Edwards Lifesciences Corp. | | | 217,696 |
| 2,900 | | @ | | Gen-Probe, Inc. | | | 124,642 |
| 5,100 | | @ | | Henry Schein, Inc. | | | 244,545 |
| 1,400 | | | | Hill-Rom Holdings, Inc. | | | 22,708 |
| 1,400 | | @ | | Hologic, Inc. | | | 19,922 |
| 9,100 | | @ | | Hospira, Inc. | | | 350,532 |
| 3,300 | | @ | | Idexx Laboratories, Inc. | | | 152,460 |
| 2,100 | | @ | | Intuitive Surgical, Inc. | | | 343,686 |
| 2,100 | | @ | | Inverness Medical Innovations, Inc. | | | 74,718 |
| 1,200 | | @ | | Kinetic Concepts, Inc. | | | 32,700 |
| 5,700 | | @ | | Patterson Cos., Inc. | | | 123,690 |
| 4,300 | | @ | | Resmed, Inc. | | | 175,139 |
| 2,100 | | | | Techne Corp. | | | 134,001 |
| 7,100 | | @ | | Varian Medical Systems, Inc. | | | 249,494 |
| | | | | | | |
| | | | | | | 3,173,495 |
| | | | | | | |
Healthcare - Services: 2.6% | | | |
| 1,000 | | | | Cigna Corp. | | | 24,090 |
| 2,600 | | @ | | Community Health Systems, Inc. | | | 65,650 |
| 3,600 | | @ | | Covance, Inc. | | | 177,120 |
| 2,400 | | @ | | Coventry Health Care, Inc. | | | 44,904 |
| 5,900 | | @ | | DaVita, Inc. | | | 291,814 |
| 14,000 | | @ | | Health Management Associates, Inc. | | | 69,160 |
| 3,500 | | @ | | Humana, Inc. | | | 112,910 |
| 6,100 | | @ | | Laboratory Corp. of America Holdings | | | 413,519 |
| 3,100 | | @ | | Lincare Holdings, Inc. | | | 72,912 |
| 800 | | @ | | Mednax, Inc. | | | 33,704 |
| 8,800 | | | | Quest Diagnostics | | | 496,584 |
| 18,400 | | @ | | Tenet Healthcare Corp. | | | 51,888 |
| 200 | | | | Universal Health Services, Inc. | | | 9,770 |
| | | | | | | |
| | | | | | | 1,864,025 |
| | | | | | | |
Holding Companies - Diversified: 0.1% | | | |
| 3,900 | | @ | | Leucadia National Corp. | | | 82,251 |
| | | | | | | |
| | | | | | | 82,251 |
| | | | | | | |
Home Builders: 0.2% | | | |
| 300 | | | | KB Home | | | 4,104 |
| 800 | | | | MDC Holdings, Inc. | | | 24,088 |
| 100 | | @ | | NVR, Inc. | | | 50,239 |
| 2,000 | | | | Pulte Homes, Inc. | | | 17,660 |
| 1,000 | | | | Thor Industries, Inc. | | | 18,370 |
| | | | | | | |
| | | | | | | 114,461 |
| | | | | | | |
Home Furnishings: 0.1% | | | |
| 1,800 | | | | Harman International Industries, Inc. | | | 33,840 |
| | | | | | | |
| | | | | | | 33,840 |
| | | | | | | |
Household Products/Wares: 1.0% | | | |
| 1,200 | | | | Avery Dennison Corp. | | | 30,816 |
| 4,000 | | | | Church & Dwight Co., Inc. | | | 217,240 |
| 7,000 | | | | Clorox Co. | | | 390,810 |
| 2,500 | | | | Scotts Miracle-Gro Co. | | | 87,625 |
| | | | | | | |
| | | | | | | 726,491 |
| | | | | | | |
Housewares: 0.1% | | | |
| 2,500 | | | | Newell Rubbermaid, Inc. | | | 26,025 |
| 2,000 | | | | Toro Co. | | | 59,800 |
| | | | | | | |
| | | | | | | 85,825 |
| | | | | | | |
See Accompanying Notes to Financial Statements
63
| | |
ING RUSSELL™ MID CAP GROWTH
INDEX PORTFOLIO | | PORTFOLIO OF INVESTMENTS AS OF JUNE 30, 2009 (UNAUDITED) (CONTINUED) |
| | | | | | | |
| Shares | | | | | | Value |
| | | | | | | |
Insurance: 1.6% | | | |
| 51,900 | | | | American International Group, Inc. | | $ | 60,204 |
| 5,300 | | | | Arthur J. Gallagher & Co. | | | 113,102 |
| 2,300 | | @@ | | Axis Capital Holdings Ltd. | | | 60,214 |
| 4,900 | | | | Brown & Brown, Inc. | | | 97,657 |
| 700 | | | | CNA Financial Corp. | | | 10,829 |
| 900 | | @@ | | Endurance Specialty Holdings Ltd. | | | 26,370 |
| 1,200 | | | | Erie Indemnity Co. | | | 42,912 |
| 2,000 | | | | Fidelity National Title Group, Inc. | | | 27,060 |
| 10,400 | | | | Genworth Financial, Inc. | | | 72,696 |
| 200 | | | | Hanover Insurance Group, Inc. | | | 7,622 |
| 4,500 | | | | Lincoln National Corp. | | | 77,445 |
| 2,200 | | | | Marsh & McLennan Cos., Inc. | | | 44,286 |
| 200 | | | | Odyssey Re Holdings Corp. | | | 7,996 |
| 17,600 | | | | Principal Financial Group, Inc. | | | 331,584 |
| 3,900 | | @ | | Progressive Corp. | | | 58,929 |
| 300 | | | | Reinsurance Group of America, Inc. | | | 10,473 |
| 800 | | | | Validus Holdings Ltd. | | | 17,584 |
| 2,500 | | | | WR Berkley Corp. | | | 53,675 |
| | | | | | | |
| | | | | | | 1,120,638 |
| | | | | | | |
Internet: 2.5% | | | |
| 9,800 | | @ | | Akamai Technologies, Inc. | | | 187,964 |
| 5,900 | | @ | | Emdeon Corp. | | | 77,290 |
| 2,100 | | @ | | Equinix, Inc. | | | 152,754 |
| 9,500 | | @ | | Expedia, Inc. | | | 143,545 |
| 4,400 | | @ | | F5 Networks, Inc. | | | 152,196 |
| 2,700 | | @ | | IAC/InterActiveCorp | | | 43,335 |
| 8,800 | | @ | | McAfee, Inc. | | | 371,272 |
| 2,400 | | @ | | NetFlix, Inc. | | | 99,216 |
| 2,400 | | @ | | Priceline.com, Inc. | | | 267,720 |
| 1,700 | | @, @@ | | Sohucom, Inc. | | | 106,811 |
| 10,900 | | @ | | VeriSign, Inc. | | | 201,432 |
| 500 | | @ | | WebMD Health Corp. | | | 14,960 |
| | | | | | | |
| | | | | | | 1,818,495 |
| | | | | | | |
Iron/Steel: 0.1% | | | |
| 700 | | | | Cliffs Natural Resources, Inc. | | | 17,129 |
| 1,000 | | | | Schnitzer Steel Industries, Inc. | | | 52,860 |
| | | | | | | |
| | | | | | | 69,989 |
| | | | | | | |
Leisure Time: 0.2% | | | |
| 2,300 | | | | Royal Caribbean Cruises Ltd. | | | 31,142 |
| 2,500 | | @ | | WMS Industries, Inc. | | | 78,775 |
| | | | | | | |
| | | | | | | 109,917 |
| | | | | | | |
Lodging: 0.6% | | | |
| 500 | | | | Choice Hotels International, Inc. | | | 13,305 |
| 12,800 | | @ | | Las Vegas Sands Corp. | | | 100,608 |
| 7,954 | | | | Marriott International, Inc. | | | 175,545 |
| 5,100 | | @ | | MGM Mirage | | | 32,589 |
| 1,700 | | | | Starwood Hotels & Resorts Worldwide, Inc. | | | 37,740 |
| 4,500 | | | | Wyndham Worldwide Corp. | | | 54,540 |
| | | | | | | |
| | | | | | | 414,327 |
| | | | | | | |
Machinery - Construction & Mining: 0.3% | | | |
| 1,000 | | | | Bucyrus International, Inc. | | | 28,560 |
| 5,100 | | | | Joy Global, Inc. | | | 182,172 |
| | | | | | | |
| | | | | | | 210,732 |
| | | | | | | |
| | | | | | | |
| Shares | | | | | | Value |
| | | | | | | |
Machinery - Diversified: 1.2% | | | |
| 3,800 | | | | Cummins, Inc. | | $ | 133,798 |
| 3,200 | | | | Flowserve Corp. | | | 223,392 |
| 1,500 | | | | Graco, Inc. | | | 33,030 |
| 2,700 | | | | IDEX Corp. | | | 66,339 |
| 800 | | | | Rockwell Automation, Inc. | | | 25,696 |
| 4,400 | | | | Roper Industries, Inc. | | | 199,364 |
| 2,700 | | | | Wabtec Corp. | | | 86,859 |
| 3,100 | | @ | | Zebra Technologies Corp. | | | 73,346 |
| | | | | | | |
| | | | | | | 841,824 |
| | | | | | | |
Media: 1.6% | | | |
| 1,900 | | @, @@ | | CTC Media, Inc. | | | 22,458 |
| 14,800 | | @ | | Discovery Communications, Inc. - Class C | | | 303,844 |
| 2,400 | | | | Factset Research Systems, Inc. | | | 119,688 |
| 2,300 | | | | John Wiley & Sons, Inc. | | | 76,475 |
| 17,800 | | | | McGraw-Hill Cos., Inc. | | | 535,958 |
| 400 | | | | New York Times Co. | | | 2,204 |
| 3,000 | | | | Scripps Networks Interactive -
Class A | | | 83,490 |
| | | | | | | |
| | | | | | | 1,144,117 |
| | | | | | | |
Metal Fabricate/Hardware: 0.9% | | | |
| 7,900 | | | | Precision Castparts Corp. | | | 576,937 |
| 1,200 | | | | Valmont Industries, Inc. | | | 86,496 |
| | | | | | | |
| | | | | | | 663,433 |
| | | | | | | |
Mining: 0.1% | | | |
| 1,000 | | | | Compass Minerals International, Inc. | | | 54,910 |
| 600 | | | | Royal Gold, Inc. | | | 25,020 |
| | | | | | | |
| | | | | | | 79,930 |
| | | | | | | |
Miscellaneous Manufacturing: 1.5% | | | |
| 2,600 | | | | Brink’s Co. | | | 75,478 |
| 900 | | | | Carlisle Cos., Inc. | | | 21,636 |
| 2,300 | | | | Cooper Industries Ltd. | | | 71,415 |
| 1,400 | | | | Crane Co. | | | 31,234 |
| 4,400 | | | | Donaldson Co., Inc. | | | 152,416 |
| 7,500 | | | | Dover Corp. | | | 248,175 |
| 3,300 | | | | Harsco Corp. | | | 93,390 |
| 1,000 | | | | ITT Corp. | | | 44,500 |
| 5,500 | | | | Leggett & Platt, Inc. | | | 83,765 |
| 6,700 | | | | Pall Corp. | | | 177,952 |
| 1,500 | | | | Pentair, Inc. | | | 38,430 |
| 1,000 | | | | Teleflex, Inc. | | | 44,830 |
| | | | | | | |
| | | | | | | 1,083,221 |
| | | | | | | |
Oil & Gas: 2.7% | | | |
| 2,700 | | @ | | Atwood Oceanics, Inc. | | | 67,257 |
| 1,400 | | @ | | CNX Gas Corp. | | | 36,778 |
| 200 | | @ | | Comstock Resources, Inc. | | | 6,610 |
| 800 | | @ | | Continental Resources, Inc. | | | 22,200 |
| 3,900 | | | | Diamond Offshore Drilling | | | 323,895 |
| 2,300 | | | | ENSCO International, Inc. | | | 80,201 |
| 7,400 | | | | EQT Corp. | | | 258,334 |
| 7,000 | | @ | | EXCO Resources, Inc. | | | 90,440 |
| 2,300 | | @ | | Forest Oil Corp. | | | 34,316 |
| 4,700 | | | | Frontier Oil Corp. | | | 61,617 |
| 1,900 | | | | Helmerich & Payne, Inc. | | | 58,653 |
| 2,400 | | | | Holly Corp. | | | 43,152 |
| 4,500 | | @ | | Mariner Energy, Inc. | | | 52,875 |
| 1,300 | | | | Patterson-UTI Energy, Inc. | | | 16,718 |
See Accompanying Notes to Financial Statements
64
| | |
ING RUSSELL™ MID CAP GROWTH
INDEX PORTFOLIO | | PORTFOLIO OF INVESTMENTS AS OF JUNE 30, 2009 (UNAUDITED) (CONTINUED) |
| | | | | | | |
| Shares | | | | | | Value |
| | | | | | | |
Oil & Gas: (continued) | | | |
| 15,600 | | @ | | PetroHawk Energy Corp. | | $ | 347,880 |
| 3,700 | | @ | | Plains Exploration & Production Co. | | | 101,232 |
| 4,600 | | @ | | Pride International, Inc. | | | 115,276 |
| 6,600 | | @ | | Quicksilver Resources, Inc. | | | 61,314 |
| 1,300 | | | | Range Resources Corp. | | | 53,833 |
| 1,100 | | | | Rowan Cos., Inc. | | | 21,252 |
| 900 | | | | St. Mary Land & Exploration Co. | | | 18,783 |
| 3,200 | | | | Tesoro Corp. | | | 40,736 |
| | | | | | | |
| | | | | | | 1,913,352 |
| | | | | | | |
Oil & Gas Services: 1.5% | | | |
| 12,300 | | @ | | Cameron International Corp. | | | 348,090 |
| 4,700 | | @ | | Dresser-Rand Group, Inc. | | | 122,670 |
| 1,600 | | @ | | Exterran Holdings, Inc. | | | 25,664 |
| 7,000 | | @ | | FMC Technologies, Inc. | | | 263,060 |
| 3,100 | | @ | | Oceaneering International, Inc. | | | 140,120 |
| 7,400 | | | | Smith International, Inc. | | | 190,550 |
| | | | | | | |
| | | | | | | 1,090,154 |
| | | | | | | |
Packaging & Containers: 1.0% | | | |
| 3,500 | | | | Ball Corp. | | | 158,060 |
| 9,100 | | @ | | Crown Holdings, Inc. | | | 219,674 |
| 7,800 | | @ | | Owens-Illinois, Inc. | | | 218,478 |
| 600 | | | | Packaging Corp. of America | | | 9,720 |
| 6,100 | | @ | | Pactiv Corp. | | | 132,370 |
| | | | | | | |
| | | | | | | 738,302 |
| | | | | | | |
Pharmaceuticals: 2.2% | | | |
| 15,000 | | | | AmerisourceBergen Corp. | | | 266,100 |
| 5,700 | | @ | | BioMarin Pharmaceuticals, Inc. | | | 88,977 |
| 4,200 | | @ | | Cephalon, Inc. | | | 237,930 |
| 3,500 | | @@ | | Herbalife Ltd. | | | 110,390 |
| 1,000 | | @ | | Mead Johnson Nutrition Co. | | | 31,770 |
| 12,300 | | @ | | Mylan Laboratories | | | 160,515 |
| 2,100 | | @ | | NBTY, Inc. | | | 59,052 |
| 2,800 | | | | Omnicare, Inc. | | | 72,128 |
| 4,500 | | | | Perrigo Co. | | | 125,010 |
| 6,200 | | @ | | Sepracor, Inc. | | | 107,384 |
| 3,900 | | @ | | Valeant Pharmaceuticals International | | | 100,308 |
| 4,800 | | @ | | VCA Antech, Inc. | | | 128,160 |
| 4,700 | | @ | | Warner Chilcott Ltd. | | | 61,805 |
| | | | | | | |
| | | | | | | 1,549,529 |
| | | | | | | |
Pipelines: 0.1% | | | |
| 11,000 | | | | El Paso Corp. | | | 101,530 |
| | | | | | | |
| | | | | | | 101,530 |
| | | | | | | |
Real Estate: 0.4% | | | |
| 12,400 | | @ | | CB Richard Ellis Group, Inc. | | | 116,064 |
| 5,200 | | @ | | St. Joe Co. | | | 137,748 |
| | | | | | | |
| | | | | | | 253,812 |
| | | | | | | |
Retail: 8.0% | | | |
| 2,500 | | | | Abercrombie & Fitch Co. | | | 63,475 |
| 5,400 | | | | Advance Auto Parts, Inc. | | | 224,046 |
| 3,800 | | @ | | Aeropostale, Inc. | | | 130,226 |
| 9,700 | | | | American Eagle Outfitters | | | 137,449 |
| 400 | | @ | | Autonation, Inc. | | | 6,940 |
| 1,800 | | @ | | Autozone, Inc. | | | 271,998 |
| 400 | | | | Barnes & Noble, Inc. | | | 8,252 |
| 14,800 | | @, S | | Bed Bath & Beyond, Inc. | | | 455,100 |
| 500 | | @ | | Big Lots, Inc. | | | 10,515 |
| 500 | | @ | | BJ’s Wholesale Club, Inc. | | | 16,115 |
| | | | | | | |
| Shares | | | | | | Value |
Retail: (continued) | | | |
| 5,800 | | | | Brinker International, Inc. | | $ | 98,774 |
| 6,000 | | | | Burger King Holdings, Inc. | | | 103,620 |
| 8,900 | | @ | | Carmax, Inc. | | | 130,830 |
| 9,400 | | @ | | Chico’s FAS, Inc. | | | 91,462 |
| 1,800 | | @ | | Chipotle Mexican Grill, Inc. | | | 144,000 |
| 3,800 | | @ | | Copart, Inc. | | | 131,746 |
| 7,800 | | | | Darden Restaurants, Inc. | | | 257,244 |
| 4,900 | | @ | | Dick’s Sporting Goods, Inc. | | | 84,280 |
| 5,100 | | @ | | Dollar Tree, Inc. | | | 214,710 |
| 7,900 | | | | Family Dollar Stores, Inc. | | | 223,570 |
| 3,900 | | | | Foot Locker, Inc. | | | 40,833 |
| 8,200 | | @ | | GameStop Corp. | | | 180,482 |
| 3,300 | | | | Guess ?, Inc. | | | 85,074 |
| 10,100 | | | | Limited Brands, Inc. | | | 120,897 |
| 2,400 | | | | MSC Industrial Direct Co. | | | 85,152 |
| 9,300 | | | | Nordstrom, Inc. | | | 184,977 |
| 2,800 | | @ | | Office Depot, Inc. | | | 12,768 |
| 7,700 | | @ | | O’Reilly Automotive, Inc. | | | 293,216 |
| 1,600 | | @ | | Panera Bread Co. | | | 79,776 |
| 800 | | | | Penske Auto Group, Inc. | | | 13,312 |
| 7,100 | | | | Petsmart, Inc. | | | 152,366 |
| 1,900 | | | | Phillips-Van Heusen | | | 54,511 |
| 900 | | | | RadioShack Corp. | | | 12,564 |
| 7,200 | | | | Ross Stores, Inc. | | | 277,920 |
| 6,400 | | | | Tiffany & Co. | | | 162,304 |
| 10,200 | | @@ | | Tim Hortons, Inc. | | | 250,308 |
| 23,400 | | | | TJX Cos., Inc. | | | 736,164 |
| 7,300 | | @ | | Urban Outfitters, Inc. | | | 152,351 |
| 8,300 | | | | Wendy’s/Arby’s Group, Inc. - Class A | | | 33,200 |
| 2,200 | | | | Williams-Sonoma, Inc. | | | 26,114 |
| | | | | | | |
| | | | | | | 5,758,641 |
| | | | | | | |
Savings & Loans: 0.3% | | | |
| 1,100 | | | | Capitol Federal Financial | | | 42,163 |
| 14,700 | | | | Hudson City Bancorp., Inc. | | | 195,363 |
| 500 | | | | TFS Financial Corp. | | | 5,310 |
| | | | | | | |
| | | | | | | 242,836 |
| | | | | | | |
Semiconductors: 5.7% | | | |
| 16,600 | | @ | | Advanced Micro Devices, Inc. | | | 64,242 |
| 16,600 | | | | Altera Corp. | | | 270,248 |
| 16,500 | | | | Analog Devices, Inc. | | | 408,870 |
| 5,000 | | @ | | Cree, Inc. | | | 146,950 |
| 7,400 | | @ | | Cypress Semiconductor Corp. | | | 68,080 |
| 2,000 | | @ | | Integrated Device Technology, Inc. | | | 12,080 |
| 1,800 | | @ | | International Rectifier Corp. | | | 26,658 |
| 3,400 | | | | Intersil Corp. | | | 42,738 |
| 7,100 | | @ | | Lam Research Corp. | | | 184,600 |
| 12,600 | | | | Linear Technology Corp. | | | 294,210 |
| 4,000 | | @ | | Macrovision Solutions Corp. | | | 87,240 |
| 26,200 | | @, @@ | | Marvell Technology Group Ltd. | | | 304,968 |
| 14,500 | | | | Maxim Integrated Products | | | 227,505 |
| 12,600 | | @ | | MEMC Electronic Materials, Inc. | | | 224,406 |
| 9,400 | | | | Microchip Technology, Inc. | | | 211,970 |
| 8,400 | | @ | | Micron Technology, Inc. | | | 42,504 |
| 13,000 | | | | National Semiconductor Corp. | | | 163,150 |
| 3,300 | | @ | | Novellus Systems, Inc. | | | 55,110 |
| 30,900 | | @ | | Nvidia Corp. | | | 348,861 |
| 23,800 | | @ | | ON Semiconductor Corp. | | | 163,268 |
| 6,700 | | @ | | QLogic Corp. | | | 84,956 |
| 5,900 | | @ | | Rambus, Inc. | | | 91,391 |
See Accompanying Notes to Financial Statements
65
| | |
ING RUSSELL™ MID CAP GROWTH
INDEX PORTFOLIO | | PORTFOLIO OF INVESTMENTS AS OF JUNE 30, 2009 (UNAUDITED) (CONTINUED) |
| | | | | | | |
| Shares | | | | | | Value |
| | | | | | | |
Semiconductors: (continued) | | | |
| 2,500 | | @ | | Silicon Laboratories, Inc. | | $ | 94,850 |
| 9,800 | | @ | | Teradyne, Inc. | | | 67,228 |
| 4,100 | | @ | | Varian Semiconductor Equipment Associates, Inc. | | | 98,359 |
| 15,500 | | | | Xilinx, Inc. | | | 317,130 |
| | | | | | | |
| | | | | | | 4,101,572 |
| | | | | | | |
Software: 6.1% | | | |
| 3,500 | | @ | | Allscripts Healthcare Solutions, Inc. | | | 55,510 |
| 5,000 | | @ | | Ansys, Inc. | | | 155,800 |
| 8,700 | | @ | | Autodesk, Inc. | | | 165,126 |
| 10,500 | | @ | | BMC Software, Inc. | | | 354,795 |
| 4,900 | | | | Broadridge Financial Solutions ADR | | | 81,242 |
| 17,200 | | | | CA, Inc. | | | 299,796 |
| 3,800 | | @ | | Cerner Corp. | | | 236,702 |
| 10,200 | | @ | | Citrix Systems, Inc. | | | 325,278 |
| 3,000 | | | | Dun & Bradstreet Corp. | | | 243,630 |
| 18,300 | | @ | | Electronic Arts, Inc. | | | 397,476 |
| 4,100 | | | | Fidelity National Information Services, Inc. | | | 81,836 |
| 8,800 | | @ | | Fiserv, Inc. | | | 402,160 |
| 2,300 | | | | IMS Health, Inc. | | | 29,210 |
| 18,300 | | @ | | Intuit, Inc. | | | 515,328 |
| 5,100 | | @ | | Metavante Technologies, inc. | | | 131,886 |
| 5,700 | | @ | | MSCI, Inc. - Class A | | | 139,308 |
| 8,900 | | @ | | Novell, Inc. | | | 40,317 |
| 11,200 | | @ | | Nuance Communications, Inc. | | | 135,408 |
| 10,700 | | @ | | Red Hat, Inc. | | | 215,391 |
| 6,100 | | @ | | Salesforce.com, Inc. | | | 232,837 |
| 4,700 | | @ | | Sybase, Inc. | | | 147,298 |
| | | | | | | |
| | | | | | | 4,386,334 |
| | | | | | | |
Telecommunications: 1.6% | | | |
| 1,600 | | @, @@ | | Amdocs Ltd. | | | 34,320 |
| 600 | | @ | | Ciena Corp. | | | 6,210 |
| 5,900 | | @ | | Crown Castle International Corp. | | | 141,718 |
| 7,700 | | | | Frontier Communications Corp. | | | 54,978 |
| 5,900 | | | | Harris Corp. | | | 167,324 |
| 6,200 | | @ | | JDS Uniphase Corp. | | | 35,464 |
| 2,600 | | @ | | Leap Wireless International, Inc. | | | 85,618 |
| 14,300 | | @ | | MetroPCS Communications, Inc. | | | 190,333 |
| 4,100 | | @ | | NeuStar, Inc. | | | 90,856 |
| 500 | | @ | | NII Holdings, Inc. | | | 9,535 |
| 6,600 | | @ | | SBA Communications Corp. | | | 161,964 |
| 8,400 | | @ | | TW Telecom, Inc. | | | 86,268 |
| 11,500 | | | | Windstream Corp. | | | 96,140 |
| | | | | | | |
| | | | | | | 1,160,728 |
| | | | | | | |
Textiles: 0.0% | | | |
| 1,300 | | | | Cintas Corp. | | | 29,692 |
| | | | | | | |
| | | | | | | 29,692 |
| | | | | | | |
Toys/Games/Hobbies: 0.6% | | | |
| 4,200 | | | | Hasbro, Inc. | | | 101,808 |
| 2,800 | | @ | | Marvel Entertainment, Inc. | | | 99,652 |
| 15,700 | | | | Mattel, Inc. | | | 251,985 |
| | | | | | | |
| | | | | | | 453,445 |
| | | | | | | |
Transportation: 1.9% | | | |
| 9,600 | | | | CH Robinson Worldwide, Inc. | | | 500,640 |
| 900 | | | | Con-way, Inc. | | | 31,779 |
| | | | | | | |
| Shares | | | | | | Value |
| | | | | | | |
Transportation: (continued) | | | |
| 12,000 | | | | Expeditors International Washington, Inc. | | $ | 400,080 |
| 4,900 | | | | JB Hunt Transport Services, Inc. | | | 149,597 |
| 2,400 | | @ | | Kansas City Southern | | | 38,664 |
| 600 | | @ | | Kirby Corp. | | | 19,074 |
| 2,900 | | | | Landstar System, Inc. | | | 104,139 |
| 1,000 | | @@ | | Teekay Shipping Corp. | | | 21,030 |
| 5,200 | | @@ | | UTI Worldwide, Inc. | | | 59,280 |
| | | | | | | |
| | | | | | | 1,324,283 |
| | | | | | | |
Trucking & Leasing: 0.0% | | | |
| 1,200 | | | | GATX Corp. | | | 30,864 |
| | | | | | | |
| | | | | | | 30,864 |
| | | | | | | |
Water: 0.0% | | | |
| 500 | | | | American Water Works Co., Inc. | | | 9,555 |
| | | | | | | |
| | | | | | | 9,555 |
| | | | | | | |
| | | | Total Common Stock
(Cost $64,355,848) | | | 66,836,246 |
| | | | | | | |
REAL ESTATE INVESTMENT TRUSTS: 1.7% | | | |
Diversified: 0.2% | | | |
| 4,300 | | | | Digital Realty Trust, Inc. | | | 154,155 |
| | | | | | | |
| | | | | | | 154,155 |
| | | | | | | |
Forest Products & Paper: 0.3% | | | |
| 3,300 | | | | Plum Creek Timber Co., Inc. | | | 98,274 |
| 2,000 | | | | Rayonier, Inc. | | | 72,700 |
| | | | | | | |
| | | | | | | 170,974 |
| | | | | | | |
Health Care: 0.5% | | | |
| 6,000 | | | | HCP, Inc. | | | 127,140 |
| 3,200 | | | | Health Care Real Estate Investment Trust, Inc. | | | 109,120 |
| 4,400 | | | | Nationwide Health Properties, Inc. | | | 113,256 |
| | | | | | | |
| | | | | | | 349,516 |
| | | | | | | |
Office Property: 0.0% | | | |
| 500 | | S | | Alexandria Real Estate Equities, Inc. | | | 17,895 |
| | | | | | | |
| | | | | | | 17,895 |
| | | | | | | |
Regional Malls: 0.0% | | | |
| 101 | | | | Macerich Co. | | | 1,779 |
| | | | | | | |
| | | | | | | 1,779 |
| | | | | | | |
Shopping Centers: 0.0% | | | |
| 400 | | | | Federal Realty Investment Trust | | | 20,608 |
| | | | | | | |
| | | | | | | 20,608 |
| | | | | | | |
Storage: 0.7% | | | |
| 7,600 | | | | Public Storage, Inc. | | | 497,648 |
| | | | | | | |
| | | | | | | 497,648 |
| | | | | | | |
| | | | Total Real Estate Investment Trusts
(Cost $1,210,221) | | | 1,212,575 |
| | | | | | | |
| | | | Total Long-Term Investments
(Cost $65,566,069) | | | 68,048,821 |
| | | | | | | |
See Accompanying Notes to Financial Statements
66
| | |
ING RUSSELL™ MID CAP GROWTH
INDEX PORTFOLIO | | PORTFOLIO OF INVESTMENTS AS OF JUNE 30, 2009 (UNAUDITED) (CONTINUED) |
| | | | | | | | | | |
SHORT-TERM INVESTMENTS: 3.5% | | | | | | |
Affiliated Mutual Fund: 3.5% | | | | | | |
| 2,497,000 | | S | | ING Institutional Prime Money Market Fund - Class I | | | | | $ | 2,497,000 |
| | | | | | | | | | |
| | | | Total Short-Term Investments
(Cost $2,497,000) | | | | | | 2,497,000 |
| | | | | | | | | | |
| | | | Total Investments in Securities
(Cost $68,063,069)* | | 98.4 | % | | $ | 70,545,821 |
| | | | Other Assets and Liabilities – Net | | 1.6 | | | | 1,166,730 |
| | | | | | | | | | |
| | | | Net Assets | | 100.0 | % | | $ | 71,712,551 |
| | | | | | | | | | |
| @ | Non-income producing security |
| ADR | American Depositary Receipt |
| S | All or a portion of this security is segregated to cover collateral requirements for applicable futures, options, swaps, foreign forward currency contracts and/or when-issued or delayed-delivery securities. |
| * | Cost for federal income tax purposes is $68,066,127. |
| | | | |
Net unrealized appreciation consists of: | | | | |
Gross Unrealized Appreciation | | $ | 3,566,138 | |
Gross Unrealized Depreciation | | | (1,086,444 | ) |
| | | | |
Net Unrealized Appreciation | | $ | 2,479,694 | |
| | | | |
Fair Value Measurements*
The following is a summary of the inputs used as of June 30, 2009 in determining the Portfolio’s investments at fair value for purposes of SFAS 157:
| | | | | | | | | | |
| | | Quoted Prices in Active Markets for Identical Investments (Level 1) | | | Significant Other Observable Inputs (Level 2) | | Significant Unobservable Inputs (Level 3) |
Common Stock** | | $ | 66,836,246 | | | $ | — | | $ | — |
Real Estate Investment Trusts | | | 1,212,575 | | | | — | | | — |
Short-Term Investments | | | 2,497,000 | | | | — | | | — |
| | | | | | | | | | |
Total | | $ | 70,545,821 | | | $ | — | | $ | — |
| | | | | | | | | | |
Other Financial
Instruments*** | | | (67,147 | ) | | | — | | | — |
| | | | | | | | | | |
Total | | $ | (67,147 | ) | | $ | — | | $ | — |
| | | | | | | | | | |
“Fair value” for purposes of SFAS 157 is different from “fair value” as used in the 1940 Act. The former generally implies market value, and can include market quotations as a source of value, and the latter refers to determinations of value in absence of available market quotations.
| * | See NOTE 2, “Significant Accounting Policies” in the Notes to Financial Statements for additional information. |
| ** | For further breakdown of Common Stock, by industry type, please refer to the Portfolio of Investments. |
| *** | Other financial instruments may include open forward foreign currency contracts, futures, swaps, and written options. Forward foreign currency contracts and futures are reported at their unrealized gain/loss at period end. Swaps and written options are reported at their market value at period end. |
ING RussellTM Mid Cap Growth Index Portfolio Open Futures Contracts on June 30, 2009:
| | | | | | | | |
Contract Description | | Number of Contracts | | Expiration Date | | Unrealized Depreciation | |
Long Contracts | | | | | | | | |
S&P Mid 400 E-Mini | | 49 | | 09/18/09 | | $ | (67,147 | ) |
| | | | | | | | |
| | | | | | $ | (67,147 | ) |
| | | | | | | | |
For the six months ended June 30, 2009, net realized gain (loss) on futures and the net change in unrealized gain (loss) on futures can be found on the Portfolio’s Statement of Operations. For additional information on the reason(s) why the Portfolio may enter into futures contracts and the risks associated with futures contracts, please refer to NOTE 2 in the accompanying Notes to Financial Statements.
See Accompanying Notes to Financial Statements
67
| | |
ING RUSSELL™ SMALL CAP
INDEX PORTFOLIO | | PORTFOLIO OF INVESTMENTS AS OF JUNE 30, 2009 (UNAUDITED) |
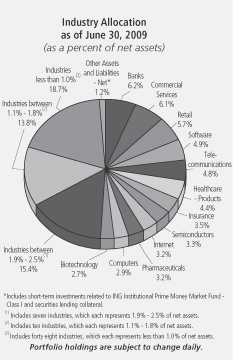
| | | | | | | |
| Shares | | | | | | Value |
| | | | | | | |
COMMON STOCK: 93.8% |
Advertising: 0.1% |
| 18,000 | | | | Harte-Hanks, Inc. | | $ | 166,500 |
| 11,400 | | @ | | inVentiv Health, Inc. | | | 154,242 |
| 10,100 | | | | Marchex, Inc. | | | 34,037 |
| | | | | | | |
| | | | | | | 354,779 |
| | | | | | | |
Aerospace/Defense: 1.3% |
| 11,550 | | @ | | AAR Corp. | | | 185,378 |
| 5,050 | | @ | | Aerovironment, Inc. | | | 155,843 |
| 3,800 | | @ | | Argon ST, Inc. | | | 78,166 |
| 5,950 | | | | Cubic Corp. | | | 212,951 |
| 15,900 | | | | Curtiss-Wright Corp. | | | 472,707 |
| 3,700 | | | | Ducommun, Inc. | | | 69,523 |
| 9,750 | | @ | | Esterline Technologies Corp. | | | 263,933 |
| 25,650 | | @ | | Gencorp, Inc. | | | 48,992 |
| 7,050 | | | | Heico Corp. | | | 255,633 |
| 5,450 | | @ | | Herley Industries, Inc. | | | 59,787 |
| 9,150 | | | | Kaman Corp. | | | 152,805 |
| 13,900 | | @ | | Moog, Inc. | | | 358,759 |
| 1,950 | | | | National Presto Industries, Inc. | | | 148,395 |
| 20,550 | | @ | | Orbital Sciences Corp. | | | 311,744 |
| 12,900 | | @ | | Teledyne Technologies, Inc. | | | 422,475 |
| 5,500 | | | | Triumph Group, Inc. | | | 220,000 |
| | | | | | | |
| | | | | | | 3,417,091 |
| | | | | | | |
Agriculture: 0.4% |
| 8,200 | | @, @@ | | Agfeed Industries, Inc. | | | 48,626 |
| 2,500 | | | | Alico, Inc. | | | 75,050 |
| 26,700 | | @ | | Alliance One International, Inc. | | | 101,460 |
| 7,500 | | | | Andersons, Inc. | | | 224,550 |
| 4,050 | | @ | | Tejon Ranch Co. | | | 107,285 |
| 9,050 | | | | Universal Corp. | | | 299,646 |
| | | | | | | |
| Shares | | | | | | Value |
| | | | | | | |
Agriculture: (continued) |
| 9,235 | | | | Vector Group Ltd. | | $ | 131,968 |
| | | | | | | |
| | | | | | | 988,585 |
| | | | | | | |
Airlines: 0.6% |
| 43,300 | | @ | | Airtran Holdings, Inc. | | | 268,027 |
| 13,350 | | @ | | Alaska Air Group, Inc. | | | 243,771 |
| 4,800 | | @, L | | Allegiant Travel Co. | | | 190,272 |
| 12,900 | | @ | | Hawaiian Holdings, Inc. | | | 77,658 |
| 68,300 | | @ | | JetBlue Airways Corp. | | | 291,641 |
| 13,550 | | @ | | Republic Airways Holdings, Inc. | | | 88,482 |
| 19,000 | | | | Skywest, Inc. | | | 193,800 |
| 50,350 | | @, L | | UAL Corp. | | | 160,617 |
| 43,100 | | @, L | | US Airways Group, Inc. | | | 104,733 |
| | | | | | | |
| | | | | | | 1,619,001 |
| | | | | | | |
Apparel: 1.6% |
| 10,550 | | @, L | | American Apparel, Inc. | | | 38,402 |
| 19,550 | | @ | | Carter’s, Inc. | | | 481,126 |
| 4,900 | | | | Cherokee, Inc. | | | 97,118 |
| 3,950 | | L | | Columbia Sportswear Co. | | | 122,134 |
| 27,050 | | @ | | CROCS, Inc. | | | 91,970 |
| 4,250 | | @ | | Deckers Outdoor Corp. | | | 298,648 |
| 5,350 | | @ | | G-III Apparel Group Ltd. | | | 61,472 |
| 18,300 | | @ | | Iconix Brand Group, Inc. | | | 281,454 |
| 26,100 | | | | Jones Apparel Group, Inc. | | | 280,053 |
| 11,400 | | | | K-Swiss, Inc. | | | 96,900 |
| 6,850 | | @ | | Maidenform Brands, Inc. | | | 78,570 |
| 10,500 | | | | Oxford Industries, Inc. | | | 122,325 |
| 9,500 | | @ | | Perry Ellis International, Inc. | | | 69,160 |
| 37,700 | | @ | | Quiksilver, Inc. | | | 69,745 |
| 10,400 | | @ | | Skechers USA, Inc. | | | 101,608 |
| 6,750 | | @ | | Steven Madden Ltd. | | | 171,788 |
| 13,800 | | @ | | Timberland Co. | | | 183,126 |
| 7,150 | | @ | | True Religion Apparel, Inc. | | | 159,445 |
| 10,400 | | @, L | | Under Armour, Inc. | | | 232,752 |
| 5,950 | | @, L | | Volcom, Inc. | | | 74,375 |
| 14,850 | | @ | | Warnaco Group, Inc. | | | 481,140 |
| 3,950 | | | | Weyco Group, Inc. | | | 91,206 |
| 16,300 | | | | Wolverine World Wide, Inc. | | | 359,578 |
| | | | | | | |
| | | | | | | 4,044,095 |
| | | | | | | |
Auto Manufacturers: 0.1% |
| 23,150 | | @ | | Force Protection, Inc. | | | 204,646 |
| | | | | | | |
| | | | | | | 204,646 |
| | | | | | | |
Auto Parts & Equipment: 0.6% |
| 19,600 | | | | American Axle & Manufacturing Holdings, Inc. | | | 67,424 |
| 8,750 | | @ | | Amerigon, Inc. | | | 53,375 |
| 25,450 | | | | ArvinMeritor, Inc. | | | 111,726 |
| 6,950 | | @ | | ATC Technology Corp. | | | 100,775 |
| 15,800 | | | | Cooper Tire & Rubber Co. | | | 156,736 |
| 45,900 | | @ | | Dana Holding Corp. | | | 58,752 |
| 7,500 | | @ | | Dorman Products, Inc. | | | 103,725 |
| 23,250 | | @ | | Exide Technologies | | | 86,723 |
| 3,850 | | @, L | | Fuel Systems Solutions, Inc. | | | 77,732 |
| 9,150 | | | | Modine Manufacturing Co. | | | 43,920 |
| 11,000 | | | | Spartan Motors, Inc. | | | 124,630 |
| 8,100 | | @ | | Standard Motor Products, Inc. | | | 66,987 |
| 9,600 | | | | Superior Industries International | | | 135,360 |
| 21,600 | | @ | | Tenneco, Inc. | | | 228,960 |
| 10,075 | | | | Titan International, Inc. | | | 75,260 |
| 6,150 | | @, @@ | | Wonder Auto Technology, Inc. | | | 62,300 |
| | | | | | | |
| | | | | | | 1,554,385 |
| | | | | | | |
See Accompanying Notes to Financial Statements
68
| | |
ING RUSSELL™ SMALL CAP
INDEX PORTFOLIO | | PORTFOLIO OF INVESTMENTS AS OF JUNE 30, 2009 (UNAUDITED) (CONTINUED) |
| | | | | | | |
| Shares | | | | | | Value |
| | | | | | | |
Banks: 6.2% |
| 7,500 | | | | 1st Source Corp. | | $ | 129,525 |
| 1,600 | | | | Alliance Financial Corp. | | | 45,376 |
| 4,550 | | | | Arrow Financial Corp. | | | 122,850 |
| 2,850 | | | | Bancfirst Corp. | | | 98,553 |
| 5,950 | | @@ | | Banco Latinoamericano de Exportaciones SA | | | 73,959 |
| 7,800 | | @ | | Bancorp, Inc. | | | 46,800 |
| 14,950 | | | | Bank Mutual Corp. | | | 130,364 |
| 2,500 | | | | Bank of Kentucky Financial Corp. | | | 70,000 |
| 4,950 | | | | Bank of the Ozarks, Inc. | | | 107,069 |
| 24,600 | | L | | Boston Private Financial Holdings, Inc. | | | 110,208 |
| 2,200 | | | | Bridge Bancorp, Inc. | | | 59,884 |
| 4,150 | | | | Camden National Corp. | | | 141,225 |
| 5,600 | | L | | Capital City Bank Group, Inc. | | | 94,360 |
| 9,850 | | | | Cardinal Financial Corp. | | | 77,126 |
| 2,900 | | | | Cass Information Systems, Inc. | | | 94,946 |
| 14,950 | | L | | Cathay General Bancorp. | | | 142,175 |
| 6,600 | | | | Center Bancorp, Inc. | | | 53,790 |
| 9,400 | | L | | Centerstate Banks of Florida, Inc. | | | 69,748 |
| 9,750 | | L | | Central Pacific Financial Corp. | | | 36,563 |
| 4,700 | | | | Century Bancorp, Inc. | | | 86,668 |
| 7,900 | | | | Chemical Financial Corp. | | | 157,289 |
| 3,100 | | | | Citizens & Northern Corp. | | | 63,767 |
| 6,150 | | L | | City Holding Co. | | | 186,714 |
| 3,900 | | | | CNB Financial Corp. | | | 55,263 |
| 9,750 | | L | | CoBiz Financial, Inc. | | | 62,498 |
| 99,950 | | L | | Colonial BancGroup, Inc. | | | 61,969 |
| 7,050 | | | | Columbia Banking System, Inc. | | | 72,122 |
| 9,250 | | | | Community Bank System, Inc. | | | 134,680 |
| 5,600 | | | | Community Trust Bancorp., Inc. | | | 149,800 |
| 18,900 | | L | | CVB Financial Corp. | | | 112,833 |
| 22,250 | | | | East-West Bancorp., Inc. | | | 144,403 |
| 6,500 | | | | Enterprise Financial Services Corp. | | | 59,085 |
| 6,350 | | | | First Bancorp. | | | 99,568 |
| 24,750 | | @@, L | | First Bancorp. Puerto Rico | | | 97,763 |
| 10,450 | | L | | First Busey Corp. | | | 76,808 |
| 24,200 | | | | First Commonwealth Financial Corp. | | | 153,428 |
| 3,950 | | | | First Community Bancshares, Inc. | | | 50,718 |
| 7,250 | | | | First Financial Bancorp. | | | 54,520 |
| 6,800 | | L | | First Financial Bankshares, Inc. | | | 342,448 |
| 4,900 | | | | First Financial Corp. | | | 154,742 |
| 9,050 | | | | First Merchants Corp. | | | 72,672 |
| 19,650 | | | | First Midwest Bancorp., Inc. | | | 143,642 |
| 5,500 | | | | First of Long Island Corp. | | | 127,270 |
| 7,250 | | L | | First South Bancorp, Inc. | | | 84,100 |
| 26,334 | | | | FirstMerit Corp. | | | 447,151 |
| 30,156 | | | | FNB Corp. | | | 186,666 |
| 17,150 | | | | Glacier Bancorp., Inc. | | | 253,306 |
| 3,800 | | | | Great Southern Bancorp., Inc. | | | 78,090 |
| 38,600 | | @ | | Guaranty Bancorp | | | 73,726 |
| 5,700 | | | | Hampton Roads Bankshares, Inc. | | | 47,025 |
| 9,350 | | | | Hancock Holding Co. | | | 303,782 |
| 12,350 | | | | Harleysville National Corp. | | | 58,045 |
| 3,100 | | L | | Heartland Financial USA, Inc. | | | 44,268 |
| 5,966 | | | | Home Bancshares, Inc. | | | 113,593 |
| 4,950 | | | | IBERIABANK Corp. | | | 195,080 |
| 5,950 | | | | Independent Bank Corp. | | | 117,215 |
| | | | | | | |
| Shares | | | | | | Value |
| | | | | | | |
Banks: (continued) |
| 17,250 | | L | | International Bancshares Corp. | | $ | 177,848 |
| 8,300 | | L | | Lakeland Bancorp, Inc. | | | 74,617 |
| 5,700 | | | | Lakeland Financial Corp. | | | 108,300 |
| 10,200 | | L | | MB Financial Corp. | | | 103,938 |
| 3,100 | | | | Merchants Bancshares, Inc. | | | 68,789 |
| 3,300 | | @ | | Metro Bancorp, Inc. | | | 63,558 |
| 12,350 | | | | Nara Bancorp., Inc. | | | 63,973 |
| 10,300 | | | | National Bankshares, Inc. | | | 247,200 |
| 29,100 | | L | | National Penn Bancshares, Inc. | | | 134,151 |
| 8,100 | | | | NBT Bancorp., Inc. | | | 175,851 |
| 24,500 | | L | | Old National Bancorp. | | | 240,590 |
| 12,400 | | @@ | | Oriental Financial Group | | | 120,280 |
| 8,402 | | | | Orrstown Financial Services, Inc. | | | 312,890 |
| 14,850 | | L | | Pacific Capital Bancorp. | | | 31,779 |
| 8,100 | | | | PacWest Bancorp | | | 106,596 |
| 2,900 | | L | | Park National Corp. | | | 163,792 |
| 7,050 | | | | Peoples Bancorp., Inc. | | | 120,203 |
| 7,600 | | @, L | | Pinnacle Financial Partners, Inc. | | | 101,232 |
| 10,100 | | | | PrivateBancorp, Inc. | | | 224,624 |
| 13,400 | | | | Prosperity Bancshares, Inc. | | | 399,722 |
| 7,250 | | L | | Renasant Corp. | | | 108,895 |
| 4,550 | | | | Republic Bancorp., Inc. | | | 102,785 |
| 7,700 | | | | S&T Bancorp, Inc. | | | 93,632 |
| 8,600 | | L | | Sandy Spring Bancorp, Inc. | | | 126,420 |
| 4,900 | | | | SCBT Financial Corp. | | | 116,081 |
| 5,100 | | L | | Sierra Bancorp. | | | 64,413 |
| 11,450 | | @ | | Signature Bank | | | 310,524 |
| 3,350 | | | | Simmons First National Corp. | | | 89,512 |
| 9,150 | | | | Smithtown Bancorp., Inc. | | | 117,029 |
| 34,400 | | | | South Financial Group, Inc. | | | 40,936 |
| 10,300 | | | | Southwest Bancorp., Inc. | | | 100,528 |
| 8,800 | | | | StellarOne Corp. | | | 113,960 |
| 30,650 | | | | Sterling Bancshares, Inc. | | | 194,015 |
| 16,450 | | L | | Sterling Financial Corp. | | | 47,870 |
| 4,650 | | | | Suffolk Bancorp | | | 119,226 |
| 28,050 | | | | Susquehanna Bancshares, Inc. | | | 137,165 |
| 12,200 | | @, L | | SVB Financial Group | | | 332,084 |
| 6,150 | | L | | SY Bancorp., Inc. | | | 148,646 |
| 8,000 | | @ | | Texas Capital Bancshares, Inc. | | | 123,760 |
| 1,550 | | | | Tompkins Financial Corp. | | | 74,323 |
| 5,200 | | | | Tower Bancorp, Inc. | | | 182,780 |
| 9,150 | | | | TowneBank | | | 128,100 |
| 5,100 | | | | Trico Bancshares | | | 79,050 |
| 24,500 | | | | Trustco Bank Corp. | | | 144,795 |
| 18,350 | | L | | Trustmark Corp. | | | 354,522 |
| 38,000 | | | | UCBH Holdings, Inc. | | | 47,880 |
| 10,500 | | | | UMB Financial Corp. | | | 399,105 |
| 21,500 | | | | Umpqua Holdings Corp. | | | 166,840 |
| 13,900 | | L | | United Bankshares, Inc. | | | 271,606 |
| 14,474 | | L | | United Community Banks, Inc. | | | 86,699 |
| 28,674 | | | | United Security Bancshares | | | 627,961 |
| 2,700 | | | | Univest Corp. of Pennsylvania | | | 54,702 |
| 5,800 | | | | Washington Trust Bancorp, Inc. | | | 103,414 |
| 15,400 | | | | Webster Financial Corp. | | | 123,970 |
| 8,950 | | | | WesBanco, Inc. | | | 130,133 |
| 11,900 | | L | | West Bancorporation, Inc. | | | 59,500 |
| 9,250 | | L | | Westamerica Bancorp. | | | 458,893 |
| 14,700 | | @ | | Western Alliance Bancorp. | | | 100,548 |
| 15,750 | | | | Wilshire Bancorp., Inc. | | | 90,563 |
| 8,150 | | L | | Wintrust Financial Corp. | | | 131,052 |
| | | | | | | |
| | | | | | | 15,771,088 |
| | | | | | | |
Beverages: 0.2% |
| 2,900 | | @, L | | Boston Beer Co., Inc. | | | 85,811 |
| 4,150 | | | | Farmer Bros Co. | | | 94,952 |
See Accompanying Notes to Financial Statements
69
| | |
ING RUSSELL™ SMALL CAP
INDEX PORTFOLIO | | PORTFOLIO OF INVESTMENTS AS OF JUNE 30, 2009 (UNAUDITED) (CONTINUED) |
| | | | | | | |
| Shares | | | | | | Value |
| | | | | | | |
Beverages: (continued) |
| 21,600 | | @ | | Heckmann Corp. | | $ | 81,000 |
| 6,150 | | @ | | Peet’s Coffee & Tea, Inc. | | | 154,980 |
| | | | | | | |
| | | | | | | 416,743 |
| | | | | | | |
Biotechnology: 2.7% |
| 12,550 | | @ | | Acorda Therapeutics, Inc. | | | 353,785 |
| 5,500 | | @ | | Affymax, Inc. | | | 101,365 |
| 11,700 | | @ | | Alnylam Pharmaceuticals, Inc. | | | 260,559 |
| 6,000 | | @, L | | AMAG Pharmaceuticals, Inc. | | | 328,020 |
| 22,250 | | @, @@, L | | American Oriental Bioengineering, Inc. | | | 117,703 |
| 24,400 | | @ | | Arena Pharmaceuticals, Inc. | | | 121,756 |
| 7,500 | | @ | | Arqule, Inc. | | | 46,050 |
| 9,100 | | @ | | BioCryst Pharmaceuticals, Inc. | | | 36,673 |
| 18,450 | | @ | | Cambrex Corp. | | | 76,014 |
| 27,750 | | @ | | Celera Corp. | | | 211,733 |
| 152,800 | | @ | | Cell Therapeutics, Inc. | | | 262,816 |
| 3,950 | | @, L | | Clinical Data, Inc. | | | 43,529 |
| 5,100 | | @ | | Cougar Biotechnology, Inc. | | | 219,096 |
| 17,650 | | @ | | Cubist Pharmaceuticals, Inc. | | | 323,525 |
| 54,100 | | @, L | | Discovery Laboratories, Inc. | | | 55,723 |
| 6,800 | | @ | | Emergent Biosolutions, Inc. | | | 97,444 |
| 15,350 | | @, L | | Enzon Pharmaceuticals, Inc. | | | 120,805 |
| 36,050 | | @ | | Exelixis, Inc. | | | 175,564 |
| 9,740 | | @ | | Facet Biotech Corp. | | | 90,485 |
| 28,900 | | @, L | | Geron Corp. | | | 221,663 |
| 5,700 | | @, L | | GTx, Inc. | | | 52,611 |
| 19,150 | | @ | | Halozyme Therapeutics, Inc. | | | 133,476 |
| 55,700 | | @ | | Human Genome Sciences, Inc. | | | 159,302 |
| 10,450 | | @, L | | Idera Pharmaceuticals, Inc. | | | 61,237 |
| 12,800 | | @ | | Immunogen, Inc. | | | 110,208 |
| 31,700 | | @, L | | Immunomedics, Inc. | | | 80,518 |
| 27,200 | | @ | | Incyte Corp. | | | 89,488 |
| 5,900 | | @ | | Insmed, Inc. | | | 5,900 |
| 12,700 | | @, L | | InterMune, Inc. | | | 193,040 |
| 36,900 | | @ | | Ligand Pharmaceuticals, Inc. | | | 105,534 |
| 10,100 | | @ | | Martek Biosciences Corp. | | | 213,615 |
| 12,700 | | @ | | Maxygen, Inc. | | | 85,344 |
| 19,300 | | @ | | Medicines Co. | | | 161,927 |
| 9,200 | | @ | | Micromet, Inc. | | | 45,816 |
| 12,150 | | @, L | | Molecular Insight Pharmaceuticals, Inc. | | | 62,816 |
| 10,300 | | @, L | | Momenta Pharmaceuticals, Inc. | | | 123,909 |
| 25,850 | | @, L | | Novavax, Inc. | | | 84,788 |
| 16,300 | | @ | | NPS Pharmaceuticals, Inc. | | | 75,958 |
| 39,450 | | | | PDL BioPharma, Inc. | | | 311,655 |
| 10,300 | | @, @@ | | Protalix BioTherapeutics, Inc. | | | 46,556 |
| 20,650 | | @ | | Regeneron Pharmaceuticals, Inc. | | | 370,048 |
| 19,000 | | @ | | Repligen Corp. | | | 104,500 |
| 19,250 | | @ | | RTI Biologics, Inc. | | | 82,583 |
| 22,750 | | @ | | Sangamo Biosciences, Inc. | | | 112,385 |
| 24,300 | | @ | | Seattle Genetics, Inc. | | | 236,196 |
| 25,000 | | @, L | | Sequenom, Inc. | | | 97,750 |
| 43,700 | | @ | | StemCells, Inc. | | | 74,290 |
| 30,700 | | @ | | SuperGen, Inc. | | | 61,707 |
| 22,650 | | @ | | Zymogenetics, Inc. | | | 104,190 |
| | | | | | | |
| | | | | | | 6,711,655 |
| | | | | | | |
| | | | | | | |
| Shares | | | | | | Value |
| | | | | | | |
Building Materials: 0.6% |
| 2,250 | | | | AAON, Inc. | | $ | 44,820 |
| 9,050 | | | | Apogee Enterprises, Inc. | | | 111,315 |
| 3,200 | | @ | | Broadwind Energy, Inc. | | | 36,224 |
| 13,100 | | | | Comfort Systems USA, Inc. | | | 134,275 |
| 3,600 | | @ | | Drew Industries, Inc. | | | 43,812 |
| 8,400 | | | | Gibraltar Industries, Inc. | | | 57,708 |
| 10,500 | | @ | | Interline Brands, Inc. | | | 143,640 |
| 48,400 | | | | Louisiana-Pacific Corp. | | | 165,528 |
| 8,900 | | | | LSI Industries, Inc. | | | 48,505 |
| 9,950 | | | | Quanex Building Products Corp. | | | 111,639 |
| 11,750 | | | | Simpson Manufacturing Co., Inc. | | | 254,035 |
| 6,950 | | L | | Texas Industries, Inc. | | | 217,952 |
| 4,450 | | @, L | | Trex Co., Inc. | | | 59,497 |
| 4,750 | | | | Universal Forest Products, Inc. | | | 157,178 |
| | | | | | | |
| | | | | | | 1,586,128 |
| | | | | | | |
Chemicals: 1.7% |
| 12,400 | | | | Aceto Corp. | | | 82,708 |
| 8,500 | | | | American Vanguard Corp. | | | 96,050 |
| 5,800 | | | | Arch Chemicals, Inc. | | | 142,622 |
| 3,950 | | | | Balchem Corp. | | | 96,854 |
| 28,350 | | | | Ferro Corp. | | | 77,963 |
| 6,300 | | | | Hawkins, Inc. | | | 142,254 |
| 12,900 | | | | HB Fuller Co. | | | 242,133 |
| 6,000 | | | | Innophos Holdings, Inc. | | | 101,340 |
| 11,400 | | @@ | | Innospec, Inc. | | | 122,550 |
| 13,200 | | @ | | Landec Corp. | | | 89,628 |
| 6,450 | | | | Minerals Technologies, Inc. | | | 232,329 |
| 4,550 | | | | NewMarket Corp. | | | 306,352 |
| 25,050 | | | | Olin Corp. | | | 297,845 |
| 11,750 | | @ | | OM Group, Inc. | | | 340,985 |
| 39,350 | | @ | | PolyOne Corp. | | | 106,639 |
| 13,500 | | @ | | Rockwood Holdings, Inc. | | | 197,640 |
| 10,100 | | | | Schulman A, Inc. | | | 152,611 |
| 16,600 | | | | Sensient Technologies Corp. | | | 374,662 |
| 11,000 | | @, @@, L | | ShengdaTech, Inc. | | | 41,470 |
| 31,500 | | @ | | Solutia, Inc. | | | 181,440 |
| 9,750 | | | | Spartech Corp. | | | 89,603 |
| 1,550 | | | | Stepan Co. | | | 68,448 |
| 12,050 | | @ | | Symyx Technologies | | | 70,493 |
| 5,950 | | | | Westlake Chemical Corp. | | | 121,321 |
| 24,200 | | @ | | WR Grace & Co. | | | 299,354 |
| 9,050 | | | | Zep, Inc. | | | 109,053 |
| 7,350 | | @, L | | Zoltek Cos., Inc. | | | 71,442 |
| | | | | | | |
| | | | | | | 4,255,789 |
| | | | | | | |
Coal: 0.2% |
| 41,650 | | @, L | | International Coal Group, Inc. | | | 119,119 |
| 9,800 | | @ | | James River Coal Co. | | | 148,274 |
| 19,900 | | @ | | Patriot Coal Corp. | | | 126,962 |
| | | | | | | |
| | | | | | | 394,355 |
| | | | | | | |
Commercial Services: 6.1% |
| 13,900 | | | | ABM Industries, Inc. | | | 251,173 |
| 7,250 | | | | Administaff, Inc. | | | 168,708 |
| 16,850 | | | | Advance America Cash Advance Centers, Inc. | | | 74,646 |
| 6,400 | | @ | | Advisory Board Co. | | | 164,480 |
| 8,300 | | @ | | Albany Molecular Research, Inc. | | | 69,637 |
| 5,950 | | @ | | American Public Education, Inc. | | | 235,680 |
| 10,400 | | @ | | AMN Healthcare Services, Inc. | | | 66,352 |
See Accompanying Notes to Financial Statements
70
| | |
ING RUSSELL™ SMALL CAP
INDEX PORTFOLIO | | PORTFOLIO OF INVESTMENTS AS OF JUNE 30, 2009 (UNAUDITED) (CONTINUED) |
| | | | | | | |
| Shares | | | | | | Value |
| | | | | | | |
Commercial Services: (continued) |
| 9,350 | | | | Arbitron, Inc. | | $ | 148,572 |
| 8,500 | | @ | | Asset Acceptance Capital Corp. | | | 65,365 |
| 30,800 | | @ | | Avis Budget Group, Inc. | | | 174,020 |
| 4,450 | | @ | | Bankrate, Inc. | | | 112,318 |
| 2,600 | | @ | | Bridgepoint Education, Inc. | | | 44,200 |
| 5,200 | | @ | | Capella Education Co. | | | 311,740 |
| 17,750 | | @ | | CBIZ, Inc. | | | 126,380 |
| 11,250 | | @ | | Cenveo, Inc. | | | 47,588 |
| 7,700 | | | | Chemed Corp. | | | 303,996 |
| 8,800 | | @ | | Coinstar, Inc. | | | 234,960 |
| 4,550 | | @ | | Consolidated Graphics, Inc. | | | 79,261 |
| 27,850 | | @, L | | Corinthian Colleges, Inc. | | | 471,501 |
| 2,800 | | @ | | Cornell Cos., Inc. | | | 45,388 |
| 10,100 | | | | Corporate Executive Board Co. | | | 209,676 |
| 3,550 | | @ | | Corvel Corp. | | | 80,834 |
| 6,300 | | @ | | CoStar Group, Inc. | | | 251,181 |
| 3,850 | | @ | | CRA International, Inc. | | | 106,876 |
| 10,900 | | @ | | Cross Country Healthcare, Inc. | | | 74,883 |
| 16,600 | | | | Deluxe Corp. | | | 212,646 |
| 7,900 | | @ | | Dollar Financial Corp. | | | 108,941 |
| 7,300 | | @ | | Dollar Thrifty Automotive Group | | | 101,835 |
| 6,850 | | @ | | DynCorp International, Inc. | | | 115,012 |
| 7,050 | | | | Electro Rent Corp. | | | 66,905 |
| 4,750 | | @ | | Emergency Medical Services Corp. | | | 174,895 |
| 16,950 | | @ | | Euronet Worldwide, Inc. | | | 328,661 |
| 7,500 | | @ | | ExlService Holdings, Inc. | | | 84,075 |
| 7,250 | | @ | | First Advantage Corp. | | | 110,273 |
| 7,050 | | @ | | Forrester Research, Inc. | | | 173,078 |
| 19,200 | | @ | | Gartner, Inc. | | | 292,992 |
| 17,350 | | @ | | Geo Group, Inc. | | | 322,363 |
| 13,200 | | @ | | Global Cash Access, Inc. | | | 105,072 |
| 3,900 | | @ | | Grand Canyon Education, Inc. | | | 65,442 |
| 19,300 | | | | Great Lakes Dredge & Dock Corp. | | | 92,254 |
| 9,550 | | @ | | H&E Equipment Services, Inc. | | | 89,293 |
| 18,250 | | @ | | Hackett Group, Inc. | | | 42,523 |
| 14,450 | | | | Healthcare Services Group | | | 258,366 |
| 10,900 | | | | Heartland Payment Systems, Inc. | | | 104,313 |
| 6,450 | | | | Heidrick & Struggles International, Inc. | | | 117,713 |
| 9,950 | | @ | | Hill International, Inc. | | | 42,785 |
| 8,200 | | @ | | HMS Holdings Corp. | | | 333,904 |
| 6,950 | | @ | | Huron Consulting Group, Inc. | | | 321,299 |
| 2,700 | | @, L | | ICF International, Inc. | | | 74,493 |
| 12,850 | | | | Jackson Hewitt Tax Service, Inc. | | | 80,441 |
| 7,050 | | @, L | | K12, Inc. | | | 151,928 |
| 9,050 | | | | Kelly Services, Inc. | | | 99,098 |
| 6,550 | | @ | | Kendle International, Inc. | | | 80,172 |
| 6,550 | | @ | | Kenexa Corp. | | | 75,784 |
| 12,050 | | @ | | Kforce, Inc. | | | 99,654 |
| 15,900 | | @ | | Korn/Ferry International | | | 169,176 |
| 3,450 | | | | Landauer, Inc. | | | 211,623 |
| 3,500 | | @, L | | Lincoln Educational Services Corp. | | | 73,255 |
| 26,400 | | @ | | Live Nation, Inc. | | | 128,304 |
| 6,450 | | | | MAXIMUS, Inc. | | | 266,063 |
| 7,700 | | | | McGrath Rentcorp | | | 146,762 |
| 38,800 | | @ | | MoneyGram International, Inc. | | | 69,064 |
| 6,650 | | | | Monro Muffler, Inc. | | | 170,972 |
| 29,900 | | @ | | MPS Group, Inc. | | | 228,436 |
| 5,550 | | | | Multi-Color Corp. | | | 68,043 |
| 16,000 | | @ | | Navigant Consulting, Inc. | | | 206,720 |
| 14,150 | | @, @@ | | Net 1 UEPS Technologies, Inc. | | | 192,299 |
| | | | | | | |
| Shares | | | | | | Value |
| | | | | | | |
Commercial Services: (continued) |
| 18,300 | | @ | | On Assignment, Inc. | | $ | 71,553 |
| 17,300 | | @ | | Parexel International Corp. | | | 248,774 |
| 12,750 | | @ | | PHH Corp. | | | 231,795 |
| 1,850 | | @, L | | Pre-Paid Legal Services, Inc. | | | 80,642 |
| 20,800 | | @ | | Rent-A-Center, Inc. | | | 370,864 |
| 14,550 | | @ | | Resources Connection, Inc. | | | 249,824 |
| 8,200 | | @ | | Riskmetrics Group, Inc. | | | 144,812 |
| 12,550 | | | | Rollins, Inc. | | | 217,241 |
| 15,150 | | @, L | | RSC Holdings, Inc. | | | 101,808 |
| 22,800 | | | | Sotheby’s | | | 321,708 |
| 14,350 | | @ | | Spherion Corp. | | | 59,122 |
| 4,450 | | @ | | Standard Parking Corp. | | | 72,491 |
| 6,150 | | @, @@ | | Steiner Leisure Ltd. | | | 187,760 |
| 20,900 | | | | Stewart Enterprises, Inc. | | | 100,738 |
| 10,750 | | @, L | | SuccessFactors, Inc. | | | 98,685 |
| 5,950 | | @ | | Team, Inc. | | | 93,237 |
| 12,400 | | @ | | TeleTech Holdings, Inc. | | | 187,860 |
| 13,000 | | @ | | Ticketmaster | | | 83,460 |
| 9,250 | | @ | | TNS, Inc. | | | 173,438 |
| 13,500 | | @ | | TrueBlue, Inc. | | | 113,400 |
| 13,600 | | @ | | United Rentals, Inc. | | | 88,264 |
| 9,950 | | @ | | Universal Technical Institute, Inc. | | | 148,554 |
| 31,350 | | @ | | Valassis Communications, Inc. | | | 191,549 |
| 6,650 | | | | Viad Corp. | | | 114,513 |
| 14,150 | | @ | | Vistaprint Ltd. | | | 603,498 |
| 14,550 | | | | Watson Wyatt Worldwide, Inc. | | | 546,062 |
| 13,100 | | @ | | Wright Express Corp. | | | 333,657 |
| | | | | | | |
| | | | | | | 15,411,651 |
| | | | | | | |
Computers: 2.9% | | | |
| 6,350 | | @ | | 3D Systems Corp. | | | 45,784 |
| 10,300 | | @ | | 3PAR, Inc. | | | 127,720 |
| 14,650 | | | | Agilysys, Inc. | | | 68,562 |
| 9,950 | | @ | | CACI International, Inc. | | | 424,965 |
| 22,150 | | @ | | Ciber, Inc. | | | 68,665 |
| 14,000 | | @, @@ | | Cogo Group, Inc. | | | 83,580 |
| 8,000 | | @ | | Compellent Technologies, Inc. | | | 122,000 |
| 9,500 | | @ | | Cray, Inc. | | | 74,860 |
| 15,200 | | @ | | Data Domain, Inc. | | | 506,920 |
| 11,000 | | @, L | | Echelon Corp. | | | 93,280 |
| 17,850 | | @ | | Electronics for Imaging | | | 190,281 |
| 9,350 | | | | iGate Corp. | | | 61,897 |
| 10,200 | | | | Imation Corp. | | | 77,622 |
| 13,500 | | @ | | Immersion Corp. | | | 66,690 |
| 14,700 | | @ | | Insight Enterprises, Inc. | | | 142,002 |
| 8,000 | | @ | | Integral Systems, Inc. | | | 66,560 |
| 14,650 | | @ | | Isilon Systems, Inc. | | | 62,116 |
| 26,750 | | | | Jack Henry & Associates, Inc. | | | 555,063 |
| 19,900 | | @ | | LivePerson, Inc. | | | 79,600 |
| 8,500 | | @ | | Manhattan Associates, Inc. | | | 154,870 |
| 6,200 | | @ | | Maxwell Technologies, Inc. | | | 85,746 |
| 30,000 | | @ | | Mentor Graphics Corp. | | | 164,100 |
| 9,150 | | @ | | Mercury Computer Systems, Inc. | | | 84,638 |
| 4,050 | | | | MTS Systems Corp. | | | 83,633 |
| 2,650 | | @ | | NCI, Inc. | | | 80,613 |
| 15,800 | | @ | | Netezza Corp. | | | 131,456 |
| 9,950 | | @ | | Netscout Systems, Inc. | | | 93,331 |
| 45,800 | | @, L | | Palm, Inc. | | | 758,906 |
| 30,950 | | @ | | Perot Systems Corp. | | | 443,514 |
| 84,200 | | @ | | Quantum Corp. | | | 69,886 |
| 10,600 | | @ | | Radiant Systems, Inc. | | | 87,980 |
See Accompanying Notes to Financial Statements
71
| | |
ING RUSSELL™ SMALL CAP
INDEX PORTFOLIO | | PORTFOLIO OF INVESTMENTS AS OF JUNE 30, 2009 (UNAUDITED) (CONTINUED) |
| | | | | | | |
| Shares | | | | | | Value |
| | | | | | | |
Computers: (continued) |
| 9,350 | | @ | | Radisys Corp. | | $ | 84,244 |
| 20,800 | | @ | | Riverbed Technolgoy, Inc. | | | 482,352 |
| 16,750 | | @ | | Silicon Graphics International Corp. | | | 76,045 |
| 15,700 | | @ | | SRA International, Inc. | | | 275,692 |
| 8,400 | | @, L | | STEC, Inc. | | | 194,796 |
| 6,450 | | @, L | | Stratasys, Inc. | | | 70,886 |
| 10,700 | | @ | | Super Micro Computer, Inc. | | | 81,962 |
| 10,900 | | @ | | SYKES Enterprises, Inc. | | | 197,181 |
| 11,150 | | @, L | | Synaptics, Inc. | | | 430,948 |
| 4,350 | | | | Syntel, Inc. | | | 136,764 |
| 101,300 | | @ | | Unisys Corp. | | | 152,963 |
| | | | | | | |
| | | | | | | 7,340,673 |
| | | | | | | |
Cosmetics/Personal Care: 0.3% | | | |
| 19,100 | | @ | | Bare Escentuals, Inc. | | | 169,417 |
| 6,350 | | @, L | | Chattem, Inc. | | | 432,435 |
| 8,850 | | @ | | Elizabeth Arden, Inc. | | | 77,261 |
| 7,800 | | @ | | Revlon, Inc. | | | 42,432 |
| | | | | | | |
| | | | | | | 721,545 |
| | | | | | | |
Distribution/Wholesale: 1.3% | | | |
| 13,100 | | @ | | Beacon Roofing Supply, Inc. | | | 189,426 |
| 8,950 | | @, L | | BMP Sunstone Corp. | | | 42,423 |
| 16,600 | | @ | | Brightpoint, Inc. | | | 104,082 |
| 8,300 | | @ | | Chindex International, Inc. | | | 102,671 |
| 4,650 | | @ | | Core-Mark Holding Co., Inc. | | | 121,179 |
| 4,350 | | @ | | FGX Internationall Holdings Ltd. | | | 49,503 |
| 15,150 | | @ | | Fossil, Inc. | | | 364,812 |
| 6,550 | | | | Houston Wire & Cable Co. | | | 78,011 |
| 4,050 | | @ | | MWI Veterinary Supply, Inc. | | | 141,183 |
| 13,850 | | | | Owens & Minor, Inc. | | | 606,907 |
| 15,150 | | L | | Pool Corp. | | | 250,884 |
| 8,500 | | @ | | Rentrak Corp. | | | 139,655 |
| 7,700 | | @ | | Scansource, Inc. | | | 188,804 |
| 5,300 | | @ | | School Specialty, Inc. | | | 107,113 |
| 5,200 | | @ | | Titan Machinery, Inc. | | | 65,988 |
| 5,900 | | @ | | United Stationers, Inc. | | | 205,792 |
| 8,400 | | | | Watsco, Inc. | | | 411,012 |
| | | | | | | |
| | | | | | | 3,169,445 |
| | | | | | | |
Diversified Financial Services: 2.1% | | | |
| 18,550 | | | | BGC Partners, Inc. | | | 70,305 |
| 20,700 | | @ | | Broadpoint Gleacher Securities, Inc. | | | 115,506 |
| 5,950 | | | | Calamos Asset Management, Inc. | | | 83,955 |
| 5,500 | | L | | Cohen & Steers, Inc. | | | 82,225 |
| 2,800 | | @ | | Credit Acceptance Corp. | | | 61,180 |
| 2,650 | | @ | | Diamond Hill Investment Group, Inc. | | | 106,477 |
| 6,150 | | | | Duff & Phelps Corp. | | | 109,347 |
| 150,200 | | @ | | E*Trade Financial Corp. | | | 192,256 |
| 5,950 | | @ | | Encore Capital Group, Inc. | | | 78,838 |
| 3,300 | | | | Evercore Partners, Inc. | | | 64,812 |
| 8,400 | | @ | | FBR Capital Markets Corp. | | | 39,480 |
| 12,950 | | @ | | FCStone Group, Inc. | | | 51,153 |
| 7,450 | | | | Financial Federal Corp. | | | 153,098 |
| 36,900 | | @, L | | First Marblehead Corp. | | | 74,538 |
| 3,200 | | | | GAMCO Investors, Inc. | | | 155,200 |
| 21,000 | | | | GFI Group, Inc. | | | 141,540 |
| 4,900 | | @ | | International Assets Holding Corp. | | | 72,863 |
| 7,700 | | | | JMP Group, Inc. | | | 59,213 |
| | | | | | | |
| Shares | | | | | | Value |
| | | | | | | |
Diversified Financial Services: (continued) | | | |
| 10,700 | | @, L | | KBW, Inc. | | $ | 307,732 |
| 31,600 | | @ | | Knight Capital Group, Inc. | | | 538,780 |
| 21,450 | | @ | | LaBranche & Co., Inc. | | | 92,235 |
| 13,100 | | @ | | MarketAxess Holdings, Inc. | | | 124,843 |
| 31,200 | | @, @@ | | MF Global Ltd. | | | 185,016 |
| 15,850 | | | | National Financial Partners Corp. | | | 116,022 |
| 6,650 | | @ | | Nelnet, Inc. | | | 90,374 |
| 13,450 | | @ | | Ocwen Financial Corp. | | | 174,447 |
| 4,500 | | @@ | | Oppenheimer Holdings, Inc. | | | 95,265 |
| 14,650 | | | | OptionsXpress Holdings, Inc. | | | 227,515 |
| 7,900 | | @, L | | Penson Worldwide, Inc. | | | 70,705 |
| 5,800 | | @ | | Piper Jaffray Cos. | | | 253,286 |
| 4,450 | | @, L | | Portfolio Recovery Associates, Inc. | | | 172,349 |
| 11,150 | | | | Sanders Morris Harris Group, Inc. | | | 61,325 |
| 8,950 | | @ | | Stifel Financial Corp. | | | 430,406 |
| 8,850 | | | | SWS Group, Inc. | | | 123,635 |
| 13,450 | | @ | | Thomas Weisel Partners Group, Inc. | | | 80,969 |
| 13,100 | | @ | | TradeStation Group, Inc. | | | 110,826 |
| 2,900 | | | | Westwood Holdings Group, Inc. | | | 121,249 |
| 5,400 | | @, L | | World Acceptance, Corp. | | | 107,514 |
| | | | | | | |
| | | | | | | 5,196,479 |
| | | | | | | |
Electric: 1.8% | | | |
| 9,100 | | | | Allete, Inc. | | | 261,625 |
| 17,250 | | | | Avista Corp. | | | 307,223 |
| 12,450 | | | | Black Hills Corp. | | | 286,226 |
| 5,000 | | | | Central Vermont Public Service Corp. | | | 90,500 |
| 4,650 | | | | CH Energy Group, Inc. | | | 217,155 |
| 19,650 | | | | Cleco Corp. | | | 440,553 |
| 16,700 | | @ | | El Paso Electric Co. | | | 233,132 |
| 10,600 | | | | Empire District Electric Co. | | | 175,112 |
| 4,300 | | @, L | | Enernoc, Inc. | | | 93,181 |
| 14,950 | | | | Idacorp, Inc. | | | 390,793 |
| 7,050 | | | | MGE Energy, Inc. | | | 236,528 |
| 12,050 | | | | NorthWestern Corp. | | | 274,258 |
| 9,950 | | | | Otter Tail Corp. | | | 217,308 |
| 5,600 | | @ | | Pike Electric Corp. | | | 67,480 |
| 26,400 | | | | PNM Resources, Inc. | | | 282,744 |
| 21,700 | | | | Portland General Electric Co. | | | 422,716 |
| 9,150 | | | | UIL Holdings Corp. | | | 205,418 |
| 12,050 | | | | Unisource Energy Corp. | | | 319,807 |
| 6,200 | | | | Unitil Corp. | | | 127,844 |
| | | | | | | |
| | | | | | | 4,649,603 |
| | | | | | | |
Electrical Components & Equipment: 1.1% | | | |
| 14,600 | | @, L | | Advanced Battery Technologies, Inc. | | | 58,692 |
| 10,500 | | @ | | Advanced Energy Industries, Inc. | | | 94,395 |
| 13,900 | | @, L | | American Superconductor Corp. | | | 364,875 |
| 12,800 | | | | Belden CDT, Inc. | | | 213,760 |
| 15,900 | | @, @@, L | | China BAK Battery, Inc. | | | 46,905 |
| 6,650 | | L | | Encore Wire Corp. | | | 141,978 |
| 15,300 | | @ | | Ener1, Inc. | | | 83,538 |
| 15,600 | | @, L | | Energy Conversion Devices, Inc. | | | 220,740 |
See Accompanying Notes to Financial Statements
72
| | |
ING RUSSELL™ SMALL CAP
INDEX PORTFOLIO | | PORTFOLIO OF INVESTMENTS AS OF JUNE 30, 2009 (UNAUDITED) (CONTINUED) |
| | | | | | | |
| Shares | | | | | | Value |
| | | | | | | |
Electrical Components & Equipment: (continued) |
| 11,500 | | @ | | EnerSys | | $ | 209,185 |
| 60,850 | | @, L | | Evergreen Solar, Inc. | | | 132,045 |
| 11,750 | | @, @@ | | Fushi Copperweld, Inc. | | | 97,173 |
| 38,750 | | @ | | GrafTech International Ltd. | | | 438,263 |
| 3,200 | | | | Graham Corp. | | | 42,560 |
| 2,000 | | @, @@ | | Harbin Electric, Inc. | | | 31,280 |
| 7,400 | | | | Insteel Industries, Inc. | | | 60,976 |
| 7,600 | | @ | | Littelfuse, Inc. | | | 151,696 |
| 2,700 | | @ | | Powell Industries, Inc. | | | 100,089 |
| 31,750 | | @ | | Power-One, Inc. | | | 47,308 |
| 10,200 | | @, L | | Universal Display Corp. | | | 99,756 |
| 19,850 | | @, L | | Valence Technology, Inc. | | | 35,532 |
| 10,100 | | | | Vicor Corp. | | | 72,922 |
| | | | | | | |
| | | | | | | 2,743,668 |
| | | | | | | |
Electronics: 2.5% | | | |
| 2,900 | | | | American Science & Engineering, Inc. | | | 200,448 |
| 4,550 | | | | Analogic Corp. | | | 168,123 |
| 3,550 | | @ | | Axsys Technologies, Inc. | | | 190,422 |
| 4,800 | | L | | Badger Meter, Inc. | | | 196,800 |
| 4,650 | | | | Bel Fuse, Inc. | | | 74,586 |
| 21,900 | | @ | | Benchmark Electronics, Inc. | | | 315,360 |
| 16,600 | | | | Brady Corp. | | | 416,992 |
| 12,900 | | @ | | Checkpoint Systems, Inc. | | | 202,401 |
| 10,650 | | @, @@, L | | China Security & Surveillance Technology, Inc. | | | 80,301 |
| 12,050 | | @ | | Cogent, Inc. | | | 129,297 |
| 7,700 | | @ | | Coherent, Inc. | | | 159,236 |
| 10,600 | | @ | | Cymer, Inc. | | | 315,138 |
| 11,100 | | | | Daktronics, Inc. | | | 85,470 |
| 5,600 | | @ | | Dionex Corp. | | | 341,768 |
| 8,400 | | @ | | Electro Scientific Industries, Inc. | | | 93,912 |
| 6,350 | | @ | | Faro Technologies, Inc. | | | 98,616 |
| 12,700 | | @ | | FEI Co. | | | 290,830 |
| 8,100 | | @ | | II-VI, Inc. | | | 179,577 |
| 16,450 | | @ | | L-1 Identity Solutions, Inc. | | | 127,323 |
| 10,600 | | | | Methode Electronics, Inc. | | | 74,412 |
| 24,850 | | @, L | | Microvision, Inc. | | | 76,290 |
| 2,900 | | @ | | Multi-Fineline Electronix, Inc. | | | 62,060 |
| 8,000 | | @ | | Newport Corp. | | | 46,320 |
| 2,100 | | @ | | NVE Corp. | | | 102,060 |
| 6,450 | | @ | | OSI Systems, Inc. | | | 134,483 |
| 5,600 | | | | Park Electrochemical Corp. | | | 120,568 |
| 13,900 | | @ | | Plexus Corp. | | | 284,394 |
| 10,200 | | @ | | Rofin-Sinar Technologies, Inc. | | | 204,102 |
| 5,300 | | @ | | Rogers Corp. | | | 107,219 |
| 10,900 | | @ | | Stoneridge, Inc. | | | 52,320 |
| 22,550 | | @ | | Taser International, Inc. | | | 102,828 |
| 13,000 | | | | Technitrol, Inc. | | | 84,110 |
| 13,500 | | @ | | TTM Technologies, Inc. | | | 107,460 |
| 10,200 | | @ | | Varian, Inc. | | | 402,186 |
| 9,150 | | | | Watts Water Technologies, Inc. | | | 197,091 |
| 19,450 | | | | Woodward Governor Co. | | | 385,110 |
| | | | | | | |
| | | | | | | 6,209,613 |
| | | | | | | |
Energy - Alternate Sources: 0.2% | | | |
| 7,000 | | @ | | Ascent Solar Technologies, Inc. | | | 54,740 |
| 11,450 | | @, L | | Clean Energy Fuels Corp. | | | 98,585 |
| | | | | | | |
| Shares | | | | | | Value |
| | | | | | | |
Energy - Alternate Sources: (continued) | | | |
| 7,500 | | @ | | Comverge, Inc. | | $ | 90,750 |
| 54,400 | | @ | | Evergreen Energy, Inc. | | | 53,312 |
| 26,100 | | @ | | FuelCell Energy, Inc. | | | 109,098 |
| 16,400 | | @ | | GT Solar International, Inc. | | | 87,248 |
| 22,800 | | @ | | Headwaters, Inc. | | | 76,608 |
| 26,200 | | @ | | Syntroleum Corp. | | | 57,902 |
| | | | | | | |
| | | | | | | 628,243 |
| | | | | | | |
Engineering & Construction: 0.9% | | | |
| 12,350 | | @ | | Dycom Industries, Inc. | | | 136,715 |
| 19,300 | | @ | | EMCOR Group, Inc. | | | 388,316 |
| 21,000 | | @ | | ENGlobal Corp. | | | 103,320 |
| 5,600 | | @ | | Exponent, Inc. | | | 137,256 |
| 10,800 | | | | Granite Construction, Inc. | | | 359,424 |
| 10,900 | | @ | | Insituform Technologies, Inc. | | | 184,973 |
| 4,550 | | @ | | Layne Christensen Co. | | | 93,048 |
| 3,450 | | @ | | Michael Baker Corp. | | | 146,142 |
| 9,800 | | @ | | MYR Group, Inc./Delaware | | | 198,156 |
| 7,900 | | @ | | Orion Marine Group, Inc. | | | 150,100 |
| 4,950 | | @ | | Stanley, Inc. | | | 162,756 |
| 3,650 | | @ | | Sterling Construction Co., Inc. | | | 55,699 |
| 15,150 | | @ | | Tutor Perini Corp. | | | 263,004 |
| | | | | | | |
| | | | | | | 2,378,909 |
| | | | | | | |
Entertainment: 0.8% | | | |
| 5,100 | | @ | | Ascent Media Corp. | | | 135,558 |
| 18,100 | | @ | | Bally Technologies, Inc. | | | 541,552 |
| 5,800 | | @ | | Carmike Cinemas, Inc. | | | 48,604 |
| 3,450 | | | | Churchill Downs, Inc. | | | 116,127 |
| 10,700 | | | | Cinemark Holdings, Inc. | | | 121,124 |
| 13,100 | | | | Dover Downs Gaming & Entertainment, Inc. | | | 60,915 |
| 10,100 | | @, L | | Isle of Capri Casinos, Inc. | | | 134,532 |
| 13,550 | | | | National CineMedia, Inc. | | | 186,448 |
| 16,300 | | @ | | Pinnacle Entertainment, Inc. | | | 151,427 |
| 18,300 | | @ | | Shuffle Master, Inc. | | | 120,963 |
| 5,700 | | | | Speedway Motorsports, Inc. | | | 78,432 |
| 8,300 | | @ | | Vail Resorts, Inc. | | | 222,606 |
| | | | | | | |
| | | | | | | 1,918,288 |
| | | | | | | |
Environmental Control: 0.9% | | | |
| 5,200 | | | | American Ecology Corp. | | | 93,184 |
| 16,100 | | @ | | Calgon Carbon Corp. | | | 223,629 |
| 7,050 | | @ | | Clean Harbors, Inc. | | | 380,630 |
| 26,700 | | @ | | Darling International, Inc. | | | 176,220 |
| 9,500 | | @, L | | Energy Recovery, Inc. | | | 67,260 |
| 23,400 | | | | Energy Solutions, Inc. | | | 215,280 |
| 6,250 | | @, L | | Fuel Tech, Inc. | | | 60,625 |
| 20,350 | | @, L | | Metalico, Inc. | | | 94,831 |
| 7,050 | | | | Met-Pro Corp. | | | 76,281 |
| 11,000 | | | | Mine Safety Appliances Co. | | | 265,100 |
| 20,850 | | @ | | Tetra Tech, Inc. | | | 597,353 |
| 14,250 | | @, @@ | | Waste Services, Inc. | | | 73,815 |
| | | | | | | |
| | | | | | | 2,324,208 |
| | | | | | | |
Food: 2.0% | | | |
| 3,550 | | @ | | American Dairy, Inc. | | | 140,793 |
| 7,300 | | @ | | American Italian Pasta Co. | | | 212,722 |
| 400 | | | | Arden Group, Inc. | | | 50,040 |
| 10,500 | | | | B&G Foods, Inc. | | | 88,305 |
| 5,800 | | L | | Calavo Growers, Inc. | | | 115,014 |
| 4,050 | | L | | Cal-Maine Foods, Inc. | | | 101,088 |
| 16,400 | | @, L | | Chiquita Brands International, Inc. | | | 168,264 |
See Accompanying Notes to Financial Statements
73
| | |
ING RUSSELL™ SMALL CAP
INDEX PORTFOLIO | | PORTFOLIO OF INVESTMENTS AS OF JUNE 30, 2009 (UNAUDITED) (CONTINUED) |
| | | | | | | |
| Shares | | | | | | Value |
| | | | | | | |
Food: (continued) | | | |
| 4,850 | | | | Diamond Foods, Inc. | | $ | 135,315 |
| 14,450 | | @, @@ | | Fresh Del Monte Produce, Inc. | | | 234,957 |
| 9,950 | | @, L | | Great Atlantic & Pacific Tea Co. | | | 42,288 |
| 11,550 | | @ | | Hain Celestial Group, Inc. | | | 180,296 |
| 5,950 | | @ | | HQ Sustainable Maritime Industries, Inc. | | | 54,443 |
| 7,950 | | | | Imperial Sugar Co. | | | 96,275 |
| 5,100 | | | | Ingles Markets, Inc. | | | 77,724 |
| 5,950 | | | | J&J Snack Foods Corp. | | | 213,605 |
| 6,650 | | | | Lancaster Colony Corp. | | | 293,066 |
| 10,250 | | | | Lance, Inc. | | | 237,083 |
| 3,550 | | @, L | | Lifeway Foods, Inc. | | | 45,795 |
| 3,100 | | @ | | M&F Worldwide Corp. | | | 62,000 |
| 4,250 | | | | Nash Finch Co. | | | 115,005 |
| 14,550 | | | | Ruddick Corp. | | | 340,907 |
| 6,550 | | | | Sanderson Farms, Inc. | | | 294,750 |
| 40 | | | | Seaboard Corp. | | | 44,880 |
| 2,800 | | @ | | Seneca Foods Corp. | | | 93,576 |
| 17,250 | | @ | | Smart Balance, Inc. | | | 117,473 |
| 7,300 | | | | Spartan Stores, Inc. | | | 90,593 |
| 7,146 | | L | | Tootsie Roll Industries, Inc. | | | 162,143 |
| 10,550 | | @ | | TreeHouse Foods, Inc. | | | 303,524 |
| 13,900 | | @ | | United Natural Foods, Inc. | | | 364,875 |
| 1,800 | | | | Village Super Market | | | 53,550 |
| 4,150 | | | | Weis Markets, Inc. | | | 139,108 |
| 18,450 | | @ | | Winn-Dixie Stores, Inc. | | | 231,363 |
| 6,250 | | @, @@ | | Zhongpin, Inc. | | | 64,750 |
| | | | | | | |
| | | | | | | 4,965,570 |
| | | | | | | |
Forest Products & Paper: 0.4% | | | |
| 12,600 | | @ | | Buckeye Technologies, Inc. | | | 56,574 |
| 3,978 | | @ | | Clearwater Paper Corp. | | | 100,604 |
| 3,800 | | | | Deltic Timber Corp. | | | 134,786 |
| 15,700 | | @, @@ | | Domtar Corp. | | | 260,306 |
| 14,550 | | | | Glatfelter | | | 129,495 |
| 8,650 | | | | Neenah Paper, Inc. | | | 76,207 |
| 1,600 | | @ | | Orchids Paper Products Co. | | | 32,880 |
| 4,750 | | | | Schweitzer-Mauduit International, Inc. | | | 129,248 |
| 13,200 | | | | Wausau Paper Corp. | | | 88,704 |
| | | | | | | |
| | | | | | | 1,008,804 |
| | | | | | | |
Gas: 1.5% | | | |
| 2,400 | | | | Chesapeake Utilities Corp. | | | 78,072 |
| 8,100 | | | | Laclede Group, Inc. | | | 268,353 |
| 14,550 | | | | New Jersey Resources Corp. | | | 538,932 |
| 15,050 | | | | Nicor, Inc. | | | 521,031 |
| 9,750 | | | | Northwest Natural Gas Co. | | | 432,120 |
| 24,500 | | | | Piedmont Natural Gas Co. | | | 590,695 |
| 10,600 | | | | South Jersey Industries, Inc. | | | 369,834 |
| 14,650 | | | | Southwest Gas Corp. | | | 325,377 |
| 17,800 | | | | WGL Holdings, Inc. | | | 569,956 |
| | | | | | | |
| | | | | | | 3,694,370 |
| | | | | | | |
Hand/Machine Tools: 0.4% | | | |
| 15,050 | | | | Baldor Electric Co. | | | 358,040 |
| 8,200 | | | | Franklin Electric Co., Inc. | | | 212,544 |
| 650 | | @ | | K-Tron International, Inc. | | | 51,792 |
| 10,600 | | | | Regal-Beloit Corp. | | | 421,032 |
| | | | | | | |
| | | | | | | 1,043,408 |
| | | | | | | |
Healthcare - Products: 4.4% | | | |
| 7,350 | | @ | | Abaxism, Inc. | | | 150,969 |
| 9,750 | | @ | | Abiomed, Inc. | | | 85,995 |
| | | | | | | |
| Shares | | | | | | Value |
| | | | | | | |
Healthcare - Products: (continued) | | | |
| 11,850 | | @ | | Accuray, Inc. | | $ | 79,040 |
| 25,350 | | @ | | Affymetrix, Inc. | | | 150,326 |
| 18,900 | | @ | | Align Technology, Inc. | | | 200,340 |
| 18,100 | | @ | | Alphatec Holdings, Inc. | | | 60,092 |
| 22,500 | | @ | | American Medical Systems Holdings, Inc. | | | 355,500 |
| 8,400 | | @ | | Angiodynamics, Inc. | | | 111,468 |
| 750 | | | | Atrion Corp. | | | 100,568 |
| 16,200 | | @ | | ATS Medical, Inc. | | | 53,298 |
| 6,672 | | @ | | BioMimetic Therapeutics, Inc. | | | 61,649 |
| 2,600 | | @ | | Bovie Medical Corp. | | | 22,646 |
| 16,000 | | @ | | Bruker BioSciences Corp. | | | 148,160 |
| 21,750 | | @ | | Cardiac Science Corp. | | | 87,435 |
| 8,250 | | @ | | CardioNet, Inc. | | | 134,640 |
| 18,100 | | @ | | Cepheid, Inc. | | | 170,502 |
| 10,100 | | @ | | Conceptus, Inc. | | | 170,690 |
| 5,800 | | @ | | Conmed Corp. | | | 90,016 |
| 12,350 | | @ | | CryoLife, Inc. | | | 68,419 |
| 7,500 | | @ | | Cutera, Inc. | | | 64,650 |
| 7,250 | | @ | | Cyberonics | | | 120,568 |
| 6,750 | | @ | | Cynosure, Inc. | | | 51,638 |
| 13,300 | | @ | | DexCom, Inc. | | | 82,327 |
| 8,800 | | @ | | Electro-Optical Sciences, Inc. | | | 68,552 |
| 21,250 | | @ | | ev3, Inc. | | | 227,800 |
| 3,450 | | @ | | Exactech, Inc. | | | 50,025 |
| 4,900 | | @ | | Genomic Health, Inc. | | | 84,917 |
| 7,400 | | @ | | Greatbatch, Inc. | | | 167,314 |
| 8,600 | | @ | | Haemonetics Corp. | | | 490,200 |
| 10,550 | | @ | | Hanger Orthopedic Group, Inc. | | | 143,375 |
| 10,550 | | @ | | Hansen Medical, Inc. | | | 52,117 |
| 5,800 | | @ | | HeartWare International, Inc. | | | 161,878 |
| 4,200 | | @ | | ICU Medical, Inc. | | | 172,830 |
| 23,500 | | @ | | Immucor, Inc. | | | 323,360 |
| 10,300 | | @, L | | Insulet Corp. | | | 79,310 |
| 4,300 | | @ | | Integra LifeSciences Holdings Corp. | | | 113,993 |
| 13,350 | | | | Invacare Corp. | | | 235,628 |
| 5,300 | | @ | | IRIS International, Inc. | | | 62,540 |
| 4,350 | | @ | | Kensey Nash Corp. | | | 114,014 |
| 11,700 | | @ | | LCA-Vision, Inc. | | | 49,374 |
| 12,600 | | @ | | Luminex Corp. | | | 233,604 |
| 7,800 | | @ | | MAKO Surgical Corp. | | | 70,356 |
| 16,400 | | @ | | Masimo Corp. | | | 395,404 |
| 8,400 | | @ | | Medical Action Industries, Inc. | | | 96,180 |
| 14,000 | | | | Meridian Bioscience, Inc. | | | 316,120 |
| 7,500 | | @ | | Merit Medical Systems, Inc. | | | 122,250 |
| 8,350 | | @ | | Micrus Endovascular Corp. | | | 75,484 |
| 9,350 | | @ | | Natus Medical, Inc. | | | 107,899 |
| 12,700 | | @, L | | NuVasive, Inc. | | | 566,420 |
| 9,750 | | @, L | | NxStage Medical, Inc. | | | 57,525 |
| 20,150 | | @ | | OraSure Technologies, Inc. | | | 49,771 |
| 5,200 | | @, @@ | | Orthofix International NV | | | 130,052 |
| 23,900 | | @ | | Orthovita, Inc. | | | 123,085 |
| 7,100 | | @ | | Palomar Medical Technologies, Inc. | | | 104,086 |
| 21,600 | | @ | | PSS World Medical, Inc. | | | 399,816 |
| 10,100 | | @ | | Quidel Corp. | | | 147,056 |
| 12,300 | | @ | | Rockwell Medical Technologies, Inc. | | | 92,865 |
| 5,500 | | @ | | Sirona Dental Systems, Inc. | | | 109,945 |
| 4,550 | | @ | | Somanetics Corp. | | | 75,121 |
| 5,800 | | @ | | SonoSite, Inc. | | | 116,348 |
| 11,650 | | @ | | Spectranetics Corp. | | | 57,435 |
See Accompanying Notes to Financial Statements
74
| | |
ING RUSSELL™ SMALL CAP
INDEX PORTFOLIO | | PORTFOLIO OF INVESTMENTS AS OF JUNE 30, 2009 (UNAUDITED) (CONTINUED) |
| | | | | | | |
| Shares | | | | | | Value |
| | | | | | | |
Healthcare - Products: (continued) | | | |
| 11,950 | | @, L | | Stereotaxis, Inc. | | $ | 46,366 |
| 20,050 | | | | Steris Corp. | | | 522,904 |
| 4,900 | | @, L | | SurModics, Inc. | | | 110,887 |
| 14,000 | | @ | | Symmetry Medical, Inc. | | | 130,480 |
| 2,300 | | @ | | Synovis Life Technologies, Inc. | | | 47,771 |
| 18,400 | | @ | | Thoratec Corp. | | | 492,752 |
| 20,450 | | @ | | TomoTherapy, Inc. | | | 56,238 |
| 6,650 | | @ | | Trans1, Inc. | | | 41,430 |
| 4,900 | | @ | | Vital Images, Inc. | | | 55,615 |
| 15,500 | | @ | | Volcano Corp. | | | 216,690 |
| 10,600 | | | | West Pharmaceutical Services, Inc. | | | 369,410 |
| 10,200 | | @ | | Wright Medical Group, Inc. | | | 165,852 |
| 7,050 | | @ | | Zoll Medical Corp. | | | 136,347 |
| | | | | | | |
| | | | | | | 11,057,727 |
| | | | | | | |
Healthcare - Services: 2.3% | | | |
| 4,650 | | @ | | Air Methods Corp. | | | 127,224 |
| 9,950 | | @ | | Alliance Imaging, Inc. | | | 72,934 |
| 3,700 | | @, L | | Almost Family, Inc. | | | 96,607 |
| 8,950 | | @, L | | Amedisys, Inc. | | | 295,529 |
| 4,300 | | @ | | America Service Group, Inc. | | | 69,101 |
| 18,000 | | @ | | AMERIGROUP Corp. | | | 483,300 |
| 9,850 | | @ | | Amsurg Corp. | | | 211,184 |
| 4,270 | | @ | | Assisted Living Concepts, Inc. | | | 62,129 |
| 5,500 | | @ | | Bio-Reference Labs, Inc. | | | 173,855 |
| 17,000 | | @, @@ | | Buoni Poliennali | | | 100,640 |
| 13,800 | | @ | | Capital Senior Living Corp. | | | 62,790 |
| 14,650 | | @ | | Centene Corp. | | | 292,707 |
| 5,800 | | @ | | Emeritus Corp. | | | 76,618 |
| 4,200 | | | | Ensign Group, Inc. | | | 59,766 |
| 5,950 | | @ | | Genoptix, Inc. | | | 190,341 |
| 8,400 | | @ | | Gentiva Health Services, Inc. | | | 138,264 |
| 28,250 | | @ | | Healthsouth Corp. | | | 407,930 |
| 18,000 | | @ | | Healthspring, Inc. | | | 195,480 |
| 12,250 | | @ | | Healthways, Inc. | | | 164,763 |
| 5,900 | | @ | | IPC The Hospitalist Co., Inc. | | | 157,471 |
| 12,500 | | @ | | Kindred Healthcare, Inc. | | | 154,625 |
| 5,750 | | @ | | LHC Group, Inc. | | | 127,708 |
| 13,150 | | @ | | Magellan Health Services, Inc. | | | 431,583 |
| 7,650 | | @ | | Medcath Corp. | | | 89,964 |
| 6,150 | | @ | | Molina Healthcare, Inc. | | | 147,108 |
| 3,100 | | | | National Healthcare Corp. | | | 117,614 |
| 13,600 | | @ | | Novamed, Inc. | | | 53,720 |
| 8,650 | | @ | | Odyssey HealthCare, Inc. | | | 88,922 |
| 19,800 | | @ | | Psychiatric Solutions, Inc. | | | 450,252 |
| 5,650 | | @ | | RehabCare Group, Inc. | | | 135,205 |
| 8,400 | | @ | | Res-Care, Inc. | | | 120,120 |
| 7,500 | | @ | | Skilled Healthcare Group, Inc. | | | 56,250 |
| 13,200 | | @ | | Sun Healthcare Group, Inc. | | | 111,408 |
| 25,050 | | @, L | | Sunrise Senior Living, Inc. | | | 41,333 |
| 5,900 | | @ | | Triple-S Management Corp. | | | 91,981 |
| 13,900 | | @ | | WellCare Health Plans, Inc. | | | 257,011 |
| | | | | | | |
| | | | | | | 5,913,437 |
| | | | | | | |
Holding Companies - Diversified: 0.0% |
| 8,600 | | | | Compass Diversified Trust | | | 69,574 |
| | | | | | | |
| | | | | | | 69,574 |
| | | | | | | |
Home Builders: 0.4% |
| 24,950 | | @, L | | Beazer Homes USA, Inc. | | | 45,659 |
| 4,350 | | @ | | Cavco Industries, Inc. | | | 110,186 |
| | | | | | | |
| Shares | | | | | | Value |
| | | | | | | |
Home Builders: (continued) | | | |
| 4,500 | | @, @@ | | China Housing & Land Development, Inc. | | $ | 25,920 |
| 23,050 | | @, L | | Hovnanian Enterprises, Inc. | | | 54,398 |
| 3,450 | | | | M/I Homes, Inc. | | | 33,776 |
| 10,550 | | @ | | Meritage Homes Corp. | | | 198,973 |
| 14,250 | | | | Ryland Group, Inc. | | | 238,830 |
| 4,050 | | | | Skyline Corp. | | | 88,088 |
| 40,200 | | @ | | Standard-Pacific Corp. | | | 81,606 |
| 10,400 | | L | | Winnebago Industries | | | 77,272 |
| | | | | | | |
| | | | | | | 954,708 |
| | | | | | | |
Home Furnishings: 0.6% |
| 5,300 | | L | | American Woodmark Corp. | | | 126,935 |
| 4,900 | | @ | | DTS, Inc. | | | 132,643 |
| 7,900 | | | | Ethan Allen Interiors, Inc. | | | 81,844 |
| 15,150 | | | | Furniture Brands International, Inc. | | | 45,905 |
| 6,650 | | | | Hooker Furniture Corp. | | | 76,342 |
| 10,750 | | | | Kimball International, Inc. | | | 67,080 |
| 19,900 | | | | La-Z-Boy, Inc. | | | 93,928 |
| 24,750 | | | | Tempur-Pedic International, Inc. | | | 323,483 |
| 33,050 | | @ | | Tivo, Inc. | | | 346,364 |
| 5,450 | | @ | | Universal Electronics, Inc. | | | 109,927 |
| | | | | | | |
| | | | | | | 1,404,451 |
| | | | | | | |
Household Products/Wares: 0.7% |
| 26,600 | | @ | | ACCO Brands Corp. | | | 75,012 |
| 16,700 | | | | American Greetings Corp. | | | 195,056 |
| 1,650 | | | | Blyth, Inc. | | | 54,104 |
| 22,150 | | @ | | Central Garden & Pet Co. | | | 218,178 |
| 4,000 | | | | CSS Industries, Inc. | | | 81,520 |
| 11,000 | | | | Ennis, Inc. | | | 137,060 |
| 10,100 | | @ | | Helen of Troy Ltd. | | | 169,579 |
| 10,900 | | @ | | Prestige Brands Holdings, Inc. | | | 67,035 |
| 14,200 | | | | Standard Register Co. | | | 46,292 |
| 21,000 | | | | Tupperware Corp. | | | 546,420 |
| 5,500 | | | | WD-40 Co. | | | 159,500 |
| | | | | | | |
| | | | | | | 1,749,756 |
| | | | | | | |
Insurance: 3.5% |
| 101,100 | | L | | AMBAC Financial Group, Inc. | | | 93,012 |
| 18,050 | | | | American Equity Investment Life Holding Co. | | | 100,719 |
| 3,450 | | | | American Physicians Capital, Inc. | | | 135,102 |
| 6,200 | | @ | | American Physicians Service Group, Inc. | | | 140,678 |
| 6,600 | | @ | | Amerisafe, Inc. | | | 102,696 |
| 9,250 | | | | Amtrust Financial Services, Inc. | | | 105,450 |
| 10,700 | | @, @@ | | Argo Group International Holdings Ltd. | | | 301,954 |
| 20,350 | | @@, L | | Assured Guaranty Ltd. | | | 251,933 |
| 4,900 | | | | Baldwin & Lyons, Inc. | | | 96,530 |
| 10,200 | | @, L | | Citizens, Inc. | | | 62,016 |
| 6,650 | | @ | | CNA Surety Corp. | | | 89,709 |
| 50,200 | | @ | | Conseco, Inc. | | | 118,974 |
| 8,400 | | @ | | Crawford & Co. | | | 40,320 |
| 13,200 | | | | Delphi Financial Group | | | 256,476 |
| 9,500 | | @ | | eHealth, Inc. | | | 167,770 |
| 20,250 | | | | Employers Holdings, Inc. | | | 274,388 |
| 2,050 | | @ | | Enstar Group Ltd. | | | 120,643 |
| 7,050 | | | | FBL Financial Group, Inc. | | | 58,233 |
See Accompanying Notes to Financial Statements
75
| | |
ING RUSSELL™ SMALL CAP
INDEX PORTFOLIO | | PORTFOLIO OF INVESTMENTS AS OF JUNE 30, 2009 (UNAUDITED) (CONTINUED) |
| | | | | | | |
| Shares | | | | | | Value |
| | | | | | | |
Insurance: (continued) | | | |
| 18,000 | | @ | | First Acceptance Corp. | | $ | 38,340 |
| 8,100 | | | | First Mercury Financial Corp. | | | 111,537 |
| 9,950 | | | | Flagstone Reinsurance Holdings Ltd. | | | 102,485 |
| 2,750 | | @ | | Fpic Insurance Group, Inc. | | | 84,205 |
| 10,300 | | @, @@ | | Greenlight Capital Re Ltd. | | | 178,293 |
| 5,250 | | | | Harleysville Group, Inc. | | | 148,155 |
| 12,950 | | | | Horace Mann Educators Corp. | | | 129,112 |
| 5,800 | | | | Infinity Property & Casualty Corp. | | | 211,468 |
| 17,200 | | @@ | | IPC Holdings Ltd. | | | 470,248 |
| 2,401 | | | | Kansas City Life Insurance Co. | | | 64,611 |
| 2,925 | | L | | Life Partners Holdings, Inc. | | | 41,477 |
| 19,700 | | @@ | | Maiden Holdings Ltd. | | | 129,232 |
| 17,450 | | @@ | | Max Re Capital Ltd. | | | 322,127 |
| 20,150 | | | | Meadowbrook Insurance Group, Inc. | | | 131,580 |
| 3,200 | | | | Mercer Insurance Group, Inc. | | | 50,880 |
| 42,200 | | | | MGIC Investment Corp. | | | 185,680 |
| 30,550 | | @@ | | Montpelier Re Holdings Ltd. | | | 406,010 |
| 3,950 | | | | National Interstate Corp. | | | 59,961 |
| 850 | | | | National Western Life Insurance Co. | | | 99,238 |
| 5,050 | | @ | | Navigators Group, Inc. | | | 224,372 |
| 41,950 | | | | Phoenix Cos., Inc. | | | 70,057 |
| 15,700 | | @@ | | Platinum Underwriters Holdings Ltd. | | | 448,863 |
| 14,250 | | @ | | PMA Capital Corp. | | | 64,838 |
| 36,900 | | L | | PMI Group, Inc. | | | 73,062 |
| 8,850 | | | | Presidential Life Corp. | | | 66,995 |
| 10,400 | | @ | | ProAssurance Corp. | | | 480,584 |
| 31,500 | | | | Radian Group, Inc. | | | 85,680 |
| 5,600 | | | | RLI Corp. | | | 250,880 |
| 4,450 | | | | Safety Insurance Group, Inc. | | | 135,992 |
| 11,500 | | @ | | SeaBright Insurance Holdings, Inc. | | | 116,495 |
| 18,600 | | | | Selective Insurance Group | | | 237,522 |
| 4,900 | | | | State Auto Financial Corp. | | | 85,750 |
| 7,200 | | | | Stewart Information Services Corp. | | | 102,600 |
| 12,654 | | | | Tower Group, Inc. | | | 313,566 |
| 18,496 | | @, @@ | | United America Indemnity Ltd. | | | 88,596 |
| 7,850 | | | | United Fire & Casualty Co. | | | 134,628 |
| 12,350 | | @ | | Universal American Financial Corp. | | | 107,692 |
| 12,700 | | | | Zenith National Insurance Corp. | | | 276,098 |
| | | | | | | |
| | | | | | | 8,845,512 |
| | | | | | | |
Internet: 3.2% |
| 2,300 | | @ | | AboveNet, Inc. | | | 186,254 |
| 42,800 | | @ | | Art Technology Group, Inc. | | | 162,640 |
| 10,900 | | @, @@ | | AsiaInfo Holdings, Inc. | | | 187,589 |
| 13,100 | | @ | | Avocent Corp. | | | 182,876 |
| 12,400 | | @ | | Blue Coat Systems, Inc. | | | 205,096 |
| 4,250 | | @, L | | Blue Nile, Inc. | | | 182,708 |
| 15,900 | | @ | | Cogent Communications Group, Inc. | | | 129,585 |
| 8,150 | | @ | | comScore, Inc. | | | 108,558 |
| 6,750 | | @, L | | Constant Contact, Inc. | | | 133,920 |
| 24,200 | | @ | | Cybersource Corp. | | | 370,260 |
| 13,600 | | @ | | DealerTrack Holdings, Inc. | | | 231,200 |
| 12,850 | | @ | | Digital River, Inc. | | | 466,712 |
| | | | | | | |
| Shares | | | | | | Value |
| | | | | | | |
Internet: (continued) |
| 49,850 | | @ | | Drugstore.Com | | $ | 90,727 |
| 30,400 | | @ | | Earthlink, Inc. | | | 225,264 |
| 14,550 | | @ | | eResearch Technology, Inc. | | | 90,356 |
| 5,672 | | @, @@ | | Global Sources Ltd. | | | 40,895 |
| 7,500 | | @ | | GSI Commerce, Inc. | | | 106,875 |
| 6,150 | | @ | | i2 Technologies, Inc. | | | 77,183 |
| 10,250 | | @ | | Infospace, Inc. | | | 67,958 |
| 21,550 | | @ | | Internap Network Services Corp. | | | 75,210 |
| 7,900 | | @ | | Internet Brands, Inc. | | | 55,300 |
| 8,500 | | @ | | Internet Capital Group, Inc. | | | 57,205 |
| 15,800 | | @ | | j2 Global Communications, Inc. | | | 356,448 |
| 7,750 | | @ | | Keynote Systems, Inc. | | | 59,210 |
| 10,000 | | @ | | Knot, Inc. | | | 78,800 |
| 9,950 | | @ | | Limelight Networks, Inc. | | | 43,780 |
| 6,450 | | @ | | Liquidity Services, Inc. | | | 63,597 |
| 8,850 | | @, L | | LoopNet, Inc. | | | 68,588 |
| 8,400 | | @, @@, L | | Mercadolibre, Inc. | | | 225,792 |
| 17,850 | | @ | | Moduslink Global Solutions, Inc. | | | 122,451 |
| 43,000 | | @ | | Move, Inc. | | | 92,880 |
| 12,400 | | @ | | NIC, Inc. | | | 83,948 |
| 10,250 | | L | | Nutri/System, Inc. | | | 148,625 |
| 15,600 | | @ | | Online Resources Corp. | | | 97,344 |
| 1,600 | | @ | | OpenTable, Inc. | | | 48,272 |
| 26,700 | | @ | | Openwave Systems, Inc. | | | 59,808 |
| 4,800 | | @, L | | Overstock.com, Inc. | | | 57,408 |
| 13,350 | | @ | | PC-Tel, Inc. | | | 71,423 |
| 11,750 | | @ | | Perficient, Inc. | | | 82,133 |
| 19,350 | | @, L | | Rackspace Hosting, Inc. | | | 268,191 |
| 26,400 | | @ | | RealNetworks, Inc. | | | 78,936 |
| 17,050 | | @ | | S1 Corp. | | | 117,645 |
| 29,800 | | @ | | Sapient Corp. | | | 187,442 |
| 4,950 | | @ | | Shutterfly, Inc. | | | 69,053 |
| 18,300 | | @ | | SonicWALL, Inc. | | | 100,284 |
| 6,950 | | @ | | Sourcefire, Inc. | | | 86,111 |
| 7,400 | | @ | | Stamps.com, Inc. | | | 62,752 |
| 13,500 | | @ | | SumTotal Systems, Inc. | | | 64,935 |
| 29,700 | | @ | | support.com, Inc. | | | 64,746 |
| 2,686 | | @ | | TechTarget, Inc. | | | 10,744 |
| 18,450 | | @ | | TeleCommunication Systems, Inc. | | | 131,180 |
| 16,850 | | @ | | Terremark Worldwide, Inc. | | | 97,393 |
| 63,050 | | @ | | TIBCO Software, Inc. | | | 452,069 |
| 20,643 | | | | United Online, Inc. | | | 134,386 |
| 26,500 | | @ | | Valueclick, Inc. | | | 278,780 |
| 8,200 | | @ | | Vasco Data Security Intl. | | | 59,942 |
| 9,200 | | @ | | Vignette Corp. | | | 120,980 |
| 4,900 | | @ | | Vocus, Inc. | | | 96,824 |
| 10,600 | | @ | | Web.com Group, Inc. | | | 59,678 |
| 12,900 | | @ | | Websense, Inc. | | | 230,136 |
| | | | | | | |
| | | | | | | 7,967,085 |
| | | | | | | |
Investment Companies: 0.8% |
| 57,100 | | | | Allied Capital Corp. | | | 198,708 |
| 60,800 | | | | American Capital Ltd. | | | 195,168 |
| 46,550 | | | | Apollo Investment Corp. | | | 279,300 |
| 28,200 | | | | Ares Capital Corp. | | | 227,292 |
| 7,500 | | | | BlackRock Kelso Capital Corp. | | | 46,725 |
| 950 | | | | Capital Southwest Corp. | | | 68,733 |
| 7,500 | | | | Fifth Street Finance Corp | | | 75,300 |
See Accompanying Notes to Financial Statements
76
| | |
ING RUSSELL™ SMALL CAP
INDEX PORTFOLIO | | PORTFOLIO OF INVESTMENTS AS OF JUNE 30, 2009 (UNAUDITED) (CONTINUED) |
| | | | | | | |
| Shares | | | | | | Value |
| | | | | | | |
Investment Companies: (continued) |
| 9,900 | | | | Gladstone Capital Corp. | | $ | 74,547 |
| 12,750 | | @, L | | Harris & Harris Group, Inc. | | | 74,333 |
| 15,175 | | | | Hercules Technology Growth Capital, Inc. | | | 126,863 |
| 9,100 | | | | Kohlberg Capital Corp. | | | 57,512 |
| 21,800 | | | | MCG Capital Corp. | | | 52,974 |
| 8,800 | | | | MVC Capital, Inc. | | | 74,448 |
| 16,750 | | | | NGP Capital Resources Co. | | | 98,323 |
| 9,000 | | | | PennantPark Investment Corp. | | | 63,900 |
| 10,800 | | | | Prospect Capital Corp. | | | 99,360 |
| 44 | | @ | | Teton Advisors, Inc. | | | — |
| 19,600 | | | | Triangle Capital Corp. | | | 214,032 |
| | | | | | | |
| | | | | | | 2,027,518 |
| | | | | | | |
Iron/Steel: 0.0% |
| 2,500 | | @ | | Universal Stainless & Alloy | | | 40,675 |
| | | | | | | |
| | | | | | | 40,675 |
| | | | | | | |
Leisure Time: 0.5% |
| 8,000 | | | | Ambassadors Group, Inc. | | | 110,160 |
| 33,450 | | | | Brunswick Corp. | | | 144,504 |
| 21,600 | | | | Callaway Golf Co. | | | 109,512 |
| 12,600 | | @ | | Interval Leisure Group, Inc. | | | 117,432 |
| 11,400 | | @ | | Life Time Fitness, Inc. | | | 228,114 |
| 9,450 | | | | Marine Products Corp. | | | 35,438 |
| 10,500 | | L | | Polaris Industries, Inc. | | | 337,260 |
| 16,300 | | @ | | Town Sports International Holdings, Inc. | | | 61,125 |
| 11,200 | | @, @@ | | Universal Travel Group | | | 125,328 |
| | | | | | | |
| | | | | | | 1,268,873 |
| | | | | | | |
Lodging: 0.2% |
| 7,050 | | | | Ameristar Casinos, Inc. | | | 134,162 |
| 10,300 | | @, L | | Gaylord Entertainment Co. | | | 130,913 |
| 7,900 | | | | Marcus Corp. | | | 83,108 |
| 17,700 | | @@ | | Orient-Express Hotels Ltd. | | | 150,273 |
| | | | | | | |
| | | | | | | 498,456 |
| | | | | | | |
Machinery - Construction & Mining: 0.1% |
| 6,650 | | @ | | Astec Industries, Inc. | | | 197,439 |
| | | | | | | |
| | | | | | | 197,439 |
| | | | | | | |
Machinery - Diversified: 1.2% |
| 7,600 | | | | Albany International Corp. | | | 86,488 |
| 8,400 | | @ | | Altra Holdings, Inc. | | | 62,916 |
| 14,550 | | | | Applied Industrial Technologies, Inc. | | | 286,635 |
| 15,800 | | | | Briggs & Stratton Corp. | | | 210,772 |
| 3,650 | | | | Cascade Corp. | | | 57,415 |
| 9,350 | | @ | | Chart Industries, Inc. | | | 169,983 |
| 13,500 | | | | Cognex Corp. | | | 190,755 |
| 4,800 | | @ | | Columbus McKinnon Corp. | | | 60,720 |
| 4,450 | | | | Gorman-Rupp Co. | | | 89,757 |
| 20,350 | | @ | | Intermec, Inc. | | | 262,515 |
| 7,200 | | @ | | Intevac, Inc. | | | 62,712 |
| 7,050 | | @ | | iRobot Corp. | | | 91,509 |
| 7,250 | | @ | | Kadant, Inc. | | | 81,853 |
| 3,950 | | L | | Lindsay Manufacturing Co. | | | 130,745 |
| 5,476 | | @ | | Middleby Corp. | | | 240,506 |
| 2,500 | | | | Nacco Industries, Inc. | | | 71,800 |
| 11,400 | | | | Nordson Corp. | | | 440,724 |
| 22,150 | | @, L | | Raser Technologies, Inc. | | | 62,020 |
| 8,850 | | | | Robbins & Myers, Inc. | | | 170,363 |
| | | | | | | |
| Shares | | | | | | Value |
| | | | | | | |
Machinery - Diversified: (continued) |
| 8,400 | | | | Sauer-Danfoss, Inc. | | $ | 51,492 |
| 7,600 | | @ | | Tecumseh Products Co. | | | 73,796 |
| 5,950 | | | | Tennant Co. | | | 109,421 |
| | | | | | | |
| | | | | | | 3,064,897 |
| | | | | | | |
Media: 0.5% |
| 9,700 | | @ | | Acacia Research - Acacia Technologies | | | 76,339 |
| 51,250 | | | | Belo Corp. | | | 91,738 |
| 17,050 | | @ | | CKX, Inc. | | | 120,885 |
| 4,250 | | | | Courier Corp. | | | 64,855 |
| 7,250 | | @ | | DG FastChannel, Inc. | | | 132,675 |
| 9,850 | | @ | | Dolan Media Co. | | | 125,982 |
| 4,950 | | @ | | Fisher Communications, Inc. | | | 63,311 |
| 20,250 | | @, L | | Martha Stewart Living Omnimedia | | | 61,965 |
| 20,550 | | @ | | Mediacom Communications Corp. | | | 105,011 |
| 18,600 | | @ | | Playboy Enterprises, Inc. | | | 46,686 |
| 8,500 | | | | Scholastic Corp. | | | 168,215 |
| 26,650 | | | | Sinclair Broadcast Group, Inc. | | | 51,701 |
| 10,100 | | | | World Wrestling Entertainment, Inc. | | | 126,856 |
| | | | | | | |
| | | | | | | 1,236,219 |
| | | | | | | |
Metal Fabricate/Hardware: 0.9% |
| 4,900 | | | | AM Castle & Co. | | | 59,192 |
| 2,700 | | | | Ampco-Pittsburgh Corp. | | | 63,315 |
| 7,250 | | | | CIRCOR International, Inc. | | | 171,173 |
| 3,400 | | | | Dynamic Materials Corp. | | | 65,552 |
| 16,300 | | @ | | Furmanite Corp. | | | 72,698 |
| 4,050 | | @ | | Haynes International, Inc. | | | 95,985 |
| 8,950 | | | | Kaydon Corp. | | | 291,412 |
| 6,800 | | @ | | Ladish Co., Inc. | | | 88,196 |
| 3,400 | | | | Lawson Products | | | 48,314 |
| 3,550 | | @ | | LB Foster Co. | | | 106,749 |
| 12,700 | | | | Mueller Industries, Inc. | | | 264,160 |
| 34,500 | | | | Mueller Water Products, Inc. | | | 129,030 |
| 3,100 | | @ | | Northwest Pipe Co. | | | 107,756 |
| 2,500 | | | | Olympic Steel, Inc. | | | 61,175 |
| 7,700 | | @ | | RBC Bearings, Inc. | | | 157,465 |
| 7,600 | | @ | | RTI International Metals, Inc. | | | 134,292 |
| 3,200 | | | | Sun Hydraulics Corp. | | | 51,744 |
| 21,100 | | | | Worthington Industries | | | 269,869 |
| | | | | | | |
| | | | | | | 2,238,077 |
| | | | | | | |
Mining: 0.7% |
| 19,550 | | @, L | | Allied Nevada Gold Corp. | | | 157,573 |
| 8,400 | | | | Amcol International Corp. | | | 181,272 |
| 6,900 | | @ | | Brush Engineered Materials, Inc. | | | 115,575 |
| 8,200 | | @ | | Century Aluminum Co. | | | 51,086 |
| 21,070 | | @, L | | Coeur d’Alene Mines Corp. | | | 259,161 |
| 28,050 | | @, L | | General Moly, Inc. | | | 62,271 |
| 53,600 | | @, L | | Hecla Mining Co. | | | 143,648 |
| 16,400 | | @ | | Horsehead Holding Corp. | | | 122,180 |
| 5,800 | | | | Kaiser Aluminum Corp. | | | 208,278 |
| 11,800 | | @, @@ | | Paramount Gold and Silver Corp. | | | 17,936 |
| 16,300 | | @ | | Stillwater Mining Co | | | 93,073 |
| 23,500 | | @ | | Uranium Energy Corp. | | | 68,150 |
| 30,000 | | @ | | US Gold Corp. | | | 79,200 |
| 36,450 | | @, L | | USEC, Inc. | | | 193,914 |
| | | | | | | |
| | | | | | | 1,753,317 |
| | | | | | | |
See Accompanying Notes to Financial Statements
77
| | |
ING RUSSELL™ SMALL CAP
INDEX PORTFOLIO | | PORTFOLIO OF INVESTMENTS AS OF JUNE 30, 2009 (UNAUDITED) (CONTINUED) |
| | | | | | | |
| Shares | | | | | | Value |
| | | | | | | |
Miscellaneous Manufacturing: 2.1% |
| 19,650 | | | | Actuant Corp. | | $ | 239,730 |
| 13,500 | | | | Acuity Brands, Inc. | | | 378,675 |
| 3,200 | | | | Ameron International Corp. | | | 214,528 |
| 6,950 | | | | AO Smith Corp. | | | 226,362 |
| 3,950 | | @ | | AZZ, Inc. | | | 135,920 |
| 17,250 | | | | Barnes Group, Inc. | | | 205,103 |
| 12,800 | | @ | | Blount International, Inc. | | | 110,208 |
| 9,350 | | @ | | Ceradyne, Inc. | | | 165,121 |
| 7,700 | | @, @@, L | | China Fire & Security Group, Inc. | | | 93,709 |
| 16,700 | | | | Clarcor, Inc. | | | 487,473 |
| 7,500 | | @ | | Colfax Corp. | | | 57,900 |
| 75,600 | | | | Eastman Kodak Co. | | | 223,776 |
| 4,550 | | @ | | EnPro Industries, Inc. | | | 81,946 |
| 8,950 | | @ | | ESCO Technologies, Inc. | | | 400,960 |
| 18,900 | | | | Federal Signal Corp. | | | 144,585 |
| 3,450 | | | | Freightcar America, Inc. | | | 57,995 |
| 2,300 | | @ | | GenTek, Inc. | | | 51,359 |
| 10,300 | | @ | | Griffon Corp. | | | 85,696 |
| 32,700 | | @ | | Hexcel Corp. | | | 311,631 |
| 7,800 | | | | John Bean Technologies Corp. | | | 97,656 |
| 7,050 | | | | Koppers Holdings, Inc. | | | 185,909 |
| 5,600 | | @ | | LSB Industries, Inc. | | | 90,552 |
| 9,950 | | | | Matthews International Corp. - Class A | | | 309,644 |
| 6,350 | | @ | | Metabolix, Inc. | | | 52,197 |
| 5,200 | | | | Movado Group, Inc. | | | 54,808 |
| 9,150 | | | | Myers Industries, Inc. | | | 76,128 |
| 5,800 | | | | NL Industries, Inc. | | | 42,804 |
| 4,600 | | @, L | | PMFG, Inc. | | | 40,526 |
| 8,600 | | @ | | Polypore International, Inc. | | | 95,632 |
| 5,500 | | | | Raven Industries, Inc. | | | 140,800 |
| 20,550 | | @ | | Smith & Wesson Holding Corp. | | | 116,724 |
| 6,750 | | | | Standex International Corp. | | | 78,300 |
| 6,700 | | | | Sturm Ruger & Co., Inc. | | | 83,348 |
| 9,050 | | | | Tredegar Corp. | | | 120,546 |
| | | | | | | |
| | | | | | | 5,258,251 |
| | | | | | | |
Office Furnishings: 0.3% |
| 19,000 | | | | Herman Miller, Inc. | | | 291,460 |
| 12,250 | | L | | HNI, Corp. | | | 221,235 |
| 13,200 | | | | Interface, Inc. | | | 81,840 |
| 18,900 | | | | Knoll, Inc. | | | 143,262 |
| 10,800 | | | | Steelcase, Inc. | | | 62,856 |
| | | | | | | |
| | | | | | | 800,653 |
| | | | | | | |
Oil & Gas: 2.5% |
| 2,250 | | | | APCO Argentina, Inc. | | | 43,268 |
| 12,350 | | @ | | Arena Resources, Inc. | | | 393,348 |
| 9,850 | | L | | Atlas America, Inc. | | | 176,020 |
| 10,450 | | @, L | | ATP Oil & Gas Corp. | | | 72,732 |
| 16,700 | | | | Berry Petroleum Co. | | | 310,453 |
| 12,150 | | @ | | Bill Barrett Corp. | | | 333,639 |
| 22,950 | | @, L | | BPZ Energy, Inc. | | | 112,226 |
| 25,450 | | @ | | Brigham Exploration Co. | | | 88,821 |
| 8,950 | | @ | | Carrizo Oil & Gas, Inc. | | | 153,493 |
| 23,750 | | @, L | | Cheniere Energy, Inc. | | | 69,825 |
| 4,900 | | @ | | Contango Oil & Gas Co. | | | 208,201 |
| 9,550 | | @ | | CVR Energy, Inc. | | | 70,002 |
| 6,550 | | | | Delek US Holdings, Inc. | | | 55,544 |
| 49,500 | | @, L | | Delta Petroleum Corp. | | | 95,535 |
| | | | | | | |
| Shares | | | | | | Value |
| | | | | | | |
Oil & Gas: (continued) |
| 44,750 | | @ | | Endeavour International Corp. | | $ | 60,860 |
| 24,900 | | @ | | FX Energy, Inc. | | | 94,371 |
| 8,550 | | @, L | | GMX Resources, Inc. | | | 90,972 |
| 7,950 | | @ | | Goodrich Petroleum Corp. | | | 195,491 |
| 77,700 | | @, @@ | | Gran Tierra Energy, Inc. | | | 268,065 |
| 10,500 | | @ | | Gulfport Energy Corp. | | | 71,925 |
| 17,700 | | @ | | Harvest Natural Resources, Inc. | | | 78,057 |
| 11,200 | | @ | | Hercules Offshore, Inc. | | | 44,464 |
| 18,600 | | @, L | | McMoRan Exploration Co. | | | 110,856 |
| 9,050 | | @, L | | Northern Oil And Gas, Inc. | | | 57,649 |
| 77,350 | | @, @@, L | | Oilsands Quest, Inc. | | | 74,256 |
| 2,900 | | | | Panhandle Oil and Gas, Inc. | | | 56,927 |
| 29,300 | | @ | | Parallel Petroleum Corp. | | | 56,842 |
| 41,150 | | @ | | Parker Drilling Co. | | | 178,591 |
| 13,600 | | | | Penn Virginia Corp. | | | 222,632 |
| 4,900 | | @ | | Petroleum Development Corp. | | | 76,881 |
| 15,750 | | @, L | | Petroquest Energy, Inc. | | | 58,118 |
| 18,600 | | @ | | Pioneer Drilling Co. | | | 89,094 |
| 14,450 | | @ | | Rex Energy Corp. | | | 82,365 |
| 17,200 | | @ | | Rosetta Resources, Inc. | | | 150,500 |
| 10,210 | | @ | | Stone Energy Corp. | | | 75,758 |
| 10,400 | | @ | | Swift Energy Co. | | | 173,160 |
| 7,750 | | @ | | Toreador Resources Corp. | | | 51,925 |
| 23,250 | | @ | | Vaalco Energy, Inc. | | | 98,348 |
| 10,700 | | @ | | Venoco, Inc. | | | 82,069 |
| 5,800 | | | | W&T Offshore, Inc. | | | 56,492 |
| 27,000 | | @ | | Warren Resources, Inc. | | | 66,150 |
| 9,850 | | L | | Western Refining, Inc. | | | 69,541 |
| 118,862 | | @ | | Zion Oil & Gas, Inc. | | | 1,262,134 |
| | | | | | | |
| | | | | | | 6,237,600 |
| | | | | | | |
Oil & Gas Services: 1.2% |
| 30,500 | | @ | | Allis-Chalmers Energy, Inc. | | | 70,455 |
| 12,350 | | @ | | Basic Energy Services, Inc. | | | 84,351 |
| 43,700 | | @ | | Boots & Coots, Inc. | | | 60,743 |
| 14,400 | | @ | | Cal Dive International, Inc. | | | 124,272 |
| 6,750 | | L | | CARBO Ceramics, Inc. | | | 230,850 |
| 15,800 | | @ | | Complete Production Services, Inc. | | | 100,488 |
| 3,100 | | @ | | Dawson Geophysical Co. | | | 92,535 |
| 10,400 | | @ | | Dril-Quip, Inc. | | | 396,240 |
| 18,100 | | @ | | Global Industries Ltd. | | | 102,446 |
| 3,950 | | | | Gulf Island Fabrication, Inc. | | | 62,529 |
| 8,500 | | @ | | Hornbeck Offshore Services, Inc. | | | 181,815 |
| 22,350 | | @, L | | ION Geophysical Corp. | | | 57,440 |
| 20,600 | | @ | | Key Energy Services, Inc. | | | 118,656 |
| 5,300 | | | | Lufkin Industries, Inc. | | | 222,865 |
| 9,900 | | @ | | Matrix Service Co. | | | 113,652 |
| 6,950 | | @ | | NATCO Group, Inc. | | | 228,794 |
| 4,100 | | @ | | Natural Gas Services Group, Inc. | | | 54,530 |
| 24,750 | | @ | | Newpark Resources | | | 70,538 |
| 2,400 | | @ | | OYO Geospace Corp. | | | 61,584 |
| 10,300 | | | | RPC, Inc. | | | 86,005 |
| 6,850 | | @ | | Superior Well Services, Inc. | | | 40,758 |
| 6,300 | | @ | | T-3 Energy Services, Inc. | | | 75,033 |
| 18,500 | | @ | | Tetra Technologies, Inc. | | | 147,260 |
| 5,950 | | @ | | Union Drilling, Inc. | | | 39,389 |
See Accompanying Notes to Financial Statements
78
| | |
ING RUSSELL™ SMALL CAP
INDEX PORTFOLIO | | PORTFOLIO OF INVESTMENTS AS OF JUNE 30, 2009 (UNAUDITED) (CONTINUED) |
| | | | | | | |
| Shares | | | | | | Value |
| | | | | | | |
Oil & Gas Services: (continued) |
| 8,900 | | @ | | Willbros Group, Inc. | | $ | 111,339 |
| | | | | | | |
| | | | | | | 2,934,567 |
| | | | | | | |
Packaging & Containers: 0.4% |
| 2,700 | | @ | | AEP Industries, Inc. | | | 71,253 |
| 4,900 | | @ | | Bway Holding Co. | | | 85,897 |
| 37,100 | | @ | | Graphic Packaging Holding Co. | | | 67,893 |
| 12,250 | | | | Rock-Tenn Co. | | | 467,460 |
| 9,000 | | | | Silgan Holdings, Inc. | | | 441,270 |
| | | | | | | |
| | | | | | | 1,133,773 |
| | | | | | | |
Pharmaceuticals: 3.2% |
| 31,100 | | @ | | Adolor, Corp. | | | 54,736 |
| 30,000 | | @ | | Alkermes, Inc. | | | 324,600 |
| 20,450 | | @ | | Allos Therapeutics, Inc. | | | 169,531 |
| 4,250 | | @, L | | Amicus Therapeutics, Inc. | | | 48,663 |
| 4,900 | | @ | | Ardea Biosciences, Inc. | | | 77,126 |
| 10,800 | | @ | | Array Biopharma, Inc. | | | 33,912 |
| 14,000 | | @ | | Auxilium Pharmaceuticals, Inc. | | | 439,320 |
| 8,950 | | @, L | | Cadence Pharmaceuticals, Inc. | | | 89,411 |
| 11,400 | | @ | | Catalyst Health Solutions, Inc. | | | 284,316 |
| 3,950 | | @, @@, L | | China Sky One Medical, Inc. | | | 53,246 |
| 16,000 | | @ | | Cypress Bioscience, Inc. | | | 150,720 |
| 30,400 | | @ | | Depomed, Inc. | | | 98,800 |
| 29,100 | | @ | | Durect Corp. | | | 69,258 |
| 18,800 | | @ | | Dyax Corp. | | | 40,232 |
| 5,600 | | @ | | Hemispherx Biopharma, Inc. | | | 14,224 |
| 9,650 | | @ | | I-Flow Corp. | | | 66,971 |
| 6,100 | | @ | | Impax Laboratories, Inc. | | | 44,896 |
| 14,400 | | @ | | Inspire Pharmaceuticals, Inc. | | | 80,064 |
| 29,300 | | @ | | Isis Pharmaceuticals, Inc. | | | 483,450 |
| 6,500 | | @ | | ISTA Pharmaceuticals, Inc. | | | 27,300 |
| 22,000 | | @, L | | KV Pharmaceutical Co. | | | 70,620 |
| 19,000 | | @, L | | MannKind Corp. | | | 157,890 |
| 39,350 | | @ | | Medarex, Inc. | | | 328,573 |
| 22,800 | | | | Medicis Pharmaceutical Corp. | | | 372,096 |
| 9,350 | | @ | | Medivation, Inc. | | | 209,534 |
| 16,250 | | @ | | Myriad Pharmaceuticals, Inc. | | | 75,563 |
| 22,150 | | @ | | Nabi Biopharmaceuticals | | | 53,603 |
| 27,500 | | @ | | Nektar Therapeutics | | | 178,200 |
| 4,900 | | @ | | Neogen Corp. | | | 142,002 |
| 15,450 | | @ | | Neurocrine Biosciences, Inc. | | | 49,904 |
| 7,650 | | @ | | Noven Pharmaceuticals, Inc. | | | 109,395 |
| 10,250 | | @ | | Obagi Medical Products, Inc. | | | 74,723 |
| 19,200 | | @ | | Onyx Pharmaceuticals, Inc. | | | 542,592 |
| 9,500 | | @, L | | Optimer Pharmaceuticals, Inc. | | | 142,215 |
| 12,700 | | @ | | Orexigen Therapeutics, Inc. | | | 65,151 |
| 6,250 | | @, L | | Osiris Therapeutics, Inc. | | | 83,938 |
| 14,000 | | @ | | Pain Therapeutics, Inc. | | | 75,180 |
| 11,400 | | @ | | Par Pharmaceutical Cos., Inc. | | | 172,710 |
| 6,950 | | @ | | Pharmasset, Inc. | | | 78,188 |
| 10,400 | | @ | | PharMerica Corp. | | | 204,152 |
| 9,600 | | @ | | Poniard Pharmaceuticals, Inc. | | | 57,312 |
| 9,350 | | @ | | Pozen, Inc. | | | 71,808 |
| 11,450 | | @ | | Progenics Pharmaceuticals, Inc. | | | 58,968 |
| | | | | | | |
| Shares | | | | | | Value |
| | | | | | | |
Pharmaceuticals: (continued) |
| 18,800 | | @ | | Questcor Pharmaceuticals, Inc. | | $ | 94,000 |
| 12,150 | | @ | | Rigel Pharmaceuticals, Inc. | | | 147,258 |
| 13,200 | | @ | | Salix Pharmaceuticals Ltd. | | | 130,284 |
| 19,600 | | @ | | Santarus, Inc. | | | 55,272 |
| 20,650 | | @, L | | Savient Pharmaceuticals, Inc. | | | 286,209 |
| 8,100 | | @ | | Schiff Nutrition International, Inc. | | | 41,229 |
| 13,000 | | @ | | SIGA Technologies, Inc. | | | 109,720 |
| 13,200 | | @ | | Spectrum Pharmaceuticals, Inc. | | | 100,980 |
| 6,200 | | @, L | | Synutra International, Inc. | | | 68,200 |
| 17,350 | | @ | | Theravance, Inc. | | | 254,004 |
| 3,100 | | @, L | | USANA Health Sciences, Inc. | | | 92,163 |
| 8,700 | | @ | | Vanda Pharmaceuticals, Inc. | | | 102,399 |
| 23,500 | | @ | | Viropharma, Inc. | | | 139,355 |
| 18,800 | | @ | | Vivus, Inc. | | | 114,304 |
| 9,150 | | @ | | Xenoport, Inc. | | | 212,006 |
| | | | | | | |
| | | | | | | 7,972,476 |
| | | | | | | |
Pipelines: 0.0% |
| 20,050 | | | | Crosstex Energy, Inc. | | | 83,408 |
| | | | | | | |
| | | | | | | 83,408 |
| | | | | | | |
Real Estate: 0.2% |
| 2,900 | | @ | | Avatar Holdings, Inc. | | | 52,693 |
| 1,550 | | | | Consolidated-Tomoka Land Co. | | | 54,374 |
| 13,500 | | @ | | Forestar Real Estate Group, Inc. | | | 160,380 |
| 16,550 | | @ | | Hilltop Holdings, Inc. | | | 196,449 |
| | | | | | | |
| | | | | | | 463,896 |
| | | | | | | |
Retail: 5.7% |
| 17,350 | | @ | | 99 Cents Only Stores | | | 235,613 |
| 13,600 | | @ | | AFC Enterprises | | | 91,800 |
| 3,800 | | @ | | America’s Car-Mart, Inc. | | | 77,900 |
| 17,200 | | @ | | AnnTaylor Stores Corp. | | | 137,256 |
| 10,100 | | | | Asbury Automotive Group, Inc. | | | 103,424 |
| 12,050 | | | | Bebe Stores, Inc. | | | 82,904 |
| 7,100 | | | | Big 5 Sporting Goods Corp. | | | 78,526 |
| 5,400 | | @ | | BJ’s Restaurants, Inc. | | | 91,098 |
| 10,100 | | | | Bob Evans Farms, Inc. | | | 290,274 |
| 49,250 | | @ | | Borders Group, Inc. | | | 181,240 |
| 10,800 | | | | Brown Shoe Co., Inc. | | | 78,192 |
| 7,400 | | | | Buckle, Inc. | | | 235,098 |
| 5,950 | | @, L | | Buffalo Wild Wings, Inc. | | | 193,494 |
| 10,200 | | @ | | Cabela’s, Inc. | | | 125,460 |
| 5,950 | | @ | | California Pizza Kitchen, Inc. | | | 79,076 |
| 16,600 | | | | Casey’s General Stores, Inc. | | | 426,454 |
| 9,750 | | | | Cash America International, Inc. | | | 228,053 |
| 10,200 | | | | Cato Corp. | | | 177,888 |
| 6,950 | | @ | | CEC Entertainment, Inc. | | | 204,886 |
| 5,750 | | @ | | Charlotte Russe Holding, Inc. | | | 74,060 |
| 43,000 | | @ | | Charming Shoppes, Inc. | | | 159,960 |
| 22,950 | | @ | | Cheesecake Factory | | | 397,035 |
| 7,700 | | @ | | Childrens Place Retail Stores, Inc. | | | 203,511 |
| 8,950 | | | | Christopher & Banks Corp. | | | 60,055 |
| 5,300 | | @ | | Citi Trends, Inc. | | | 137,164 |
| 14,450 | | | | CKE Restaurants, Inc. | | | 122,536 |
| 25,050 | | @ | | Coldwater Creek, Inc. | | | 151,803 |
| 21,800 | | @ | | Collective Brands, Inc. | | | 317,626 |
| 4,650 | | @ | | Conn’s, Inc. | | | 58,125 |
| 7,350 | | | | Cracker Barrel Old Country Store | | | 205,065 |
| 38,950 | | @ | | Denny’s Corp. | | | 83,743 |
| 19,550 | | | | Dillard’s, Inc. | | | 179,860 |
| 5,650 | | L | | DineEquity, Inc. | | | 176,224 |
| 13,900 | | @ | | Domino’s Pizza, Inc. | | | 104,111 |
See Accompanying Notes to Financial Statements
79
| | |
ING RUSSELL™ SMALL CAP
INDEX PORTFOLIO | | PORTFOLIO OF INVESTMENTS AS OF JUNE 30, 2009 (UNAUDITED) (CONTINUED) |
| | | | | | | |
| Shares | | | | | | Value |
| | | | | | | |
Retail: (continued) |
| 12,700 | | @, L | | Dress Barn, Inc. | | $ | 181,610 |
| 3,900 | | @ | | DSW, Inc. | | | 38,415 |
| 14,650 | | @ | | Ezcorp, Inc. | | | 157,927 |
| 14,679 | | | | Finish Line | | | 108,918 |
| 7,250 | | @ | | First Cash Financial Services, Inc. | | | 127,020 |
| 11,400 | | | | Fred’s, Inc. | | | 143,640 |
| 4,050 | | @, @@, L | | Fuqi International, Inc. | | | 83,876 |
| 6,450 | | @ | | Genesco, Inc. | | | 121,067 |
| 6,550 | | L | | Group 1 Automotive, Inc. | | | 170,431 |
| 9,050 | | @ | | Gymboree Corp. | | | 321,094 |
| 6,750 | | @ | | hhgregg, Inc. | | | 102,330 |
| 8,950 | | @, L | | Hibbett Sporting Goods, Inc. | | | 161,100 |
| 16,700 | | @ | | HOT Topic, Inc. | | | 122,077 |
| 13,100 | | @ | | HSN, Inc. | | | 138,467 |
| 15,450 | | @ | | J Crew Group, Inc. | | | 417,459 |
| 19,650 | | @ | | Jack in the Box, Inc. | | | 441,143 |
| 8,000 | | @ | | Jo-Ann Stores, Inc. | | | 165,360 |
| 7,350 | | @, L | | JoS. A Bank Clothiers, Inc. | | | 253,281 |
| 7,750 | | | | Kenneth Cole Productions, Inc. | | | 54,483 |
| 7,500 | | @ | | Kirkland’s, Inc. | | | 90,075 |
| 17,050 | | @ | | Krispy Kreme Doughnuts, Inc. | | | 51,150 |
| 5,600 | | L | | Landry’s Restaurants, Inc. | | | 48,160 |
| 21,300 | | | | Liz Claiborne, Inc. | | | 61,344 |
| 13,350 | | @, @@ | | Lululemon Athletica, Inc. | | | 173,951 |
| 4,900 | | @ | | Lumber Liquidators, Inc. | | | 77,224 |
| 7,800 | | @ | | McCormick & Schmick’s Seafood Restaurants, Inc. | | | 59,358 |
| 16,600 | | | | Men’s Wearhouse, Inc. | | | 318,388 |
| 12,250 | | @ | | New York & Co., Inc. | | | 37,853 |
| 17,050 | | | | Nu Skin Enterprises, Inc. | | | 260,865 |
| 11,800 | | @ | | O’Charleys, Inc. | | | 109,150 |
| 19,700 | | | | OfficeMax, Inc. | | | 123,716 |
| 25,650 | | @ | | Pacific Sunwear of California | | | 86,441 |
| 9,100 | | @ | | Pantry, Inc. | | | 151,060 |
| 7,700 | | @ | | Papa John’s International, Inc. | | | 190,883 |
| 12,450 | | @ | | PC Mall, Inc. | | | 84,162 |
| 15,000 | | | | PEP Boys-Manny Moe & Jack | | | 152,100 |
| 8,500 | | @ | | PetMed Express, Inc. | | | 127,755 |
| 7,050 | | @, L | | PF Chang’s China Bistro, Inc. | | | 226,023 |
| 30,100 | | @ | | Pier 1 Imports, Inc. | | | 60,200 |
| 5,950 | | | | Pricesmart, Inc. | | | 99,663 |
| 5,500 | | @, L | | Red Robin Gourmet Burgers, Inc. | | | 103,125 |
| 13,150 | | | | Regis Corp. | | | 228,942 |
| 6,800 | | @ | | Rex Stores Corp. | | | 68,408 |
| 13,600 | | @ | | Ruby Tuesday, Inc. | | | 90,576 |
| 10,450 | | @ | | Rush Enterprises, Inc. -
Class A | | | 121,743 |
| 29,500 | | @ | | Saks, Inc. | | | 130,685 |
| 27,450 | | @ | | Sally Beauty Holdings, Inc. | | | 174,582 |
| 12,250 | | L | | Sonic Automotive, Inc. | | | 124,460 |
| 17,350 | | @ | | Sonic Corp. | | | 174,021 |
| 12,150 | | | | Stage Stores, Inc. | | | 134,865 |
| 7,400 | | @ | | Stein Mart, Inc. | | | 65,564 |
| 5,500 | | @ | | Steinway Musical Instruments | | | 58,850 |
| 4,700 | | @ | | Systemax, Inc. | | | 55,977 |
| 18,800 | | L | | Talbots, Inc. | | | 101,520 |
| 16,700 | | @ | | Texas Roadhouse, Inc. | | | 182,197 |
| | | | | | | |
| Shares | | | | | | Value |
| | | | | | | |
Retail: (continued) |
| 10,800 | | @ | | Tractor Supply Co. | | $ | 446,256 |
| 11,500 | | @ | | Tween Brands, Inc. | | | 76,820 |
| 9,250 | | @ | | Ulta Salon Cosmetics & Fragrance, Inc. | | | 102,860 |
| 29,200 | | @ | | Wet Seal, Inc. | | | 89,644 |
| 9,450 | | | | World Fuel Services Corp. | | | 389,624 |
| 16,350 | | @, L | | Zale Corp. | | | 56,244 |
| 7,700 | | @ | | Zumiez, Inc. | | | 61,677 |
| | | | | | | |
| | | | | | | 14,487,373 |
| | | | | | | |
Savings & Loans: 1.1% |
| 17,500 | | | | Astoria Financial Corp. | | | 150,150 |
| 10,600 | | @ | | Beneficial Mutual Bancorp, Inc. | | | 101,760 |
| 20,900 | | | | Brookline Bancorp., Inc. | | | 194,788 |
| 8,700 | | | | Danvers Bancorp, Inc. | | | 117,015 |
| 8,500 | | | | Dime Community Bancshares | | | 77,435 |
| 5,500 | | | | ESB Financial Corp. | | | 72,160 |
| 8,650 | | | | ESSA Bancorp, Inc. | | | 118,246 |
| 10,000 | | | | First Financial Northwest, Inc. | | | 78,200 |
| 13,800 | | @ | | Investors Bancorp, Inc. | | | 126,408 |
| 2,350 | | | | NASB Financial, Inc. | | | 67,210 |
| 35,200 | | | | NewAlliance Bancshares, Inc. | | | 404,800 |
| 8,350 | | | | Northfield Bancorp, Inc. | | | 97,027 |
| 8,350 | | | | Northwest Bancorp, Inc. | | | 157,481 |
| 5,250 | | | | OceanFirst Financial Corp. | | | 62,843 |
| 4,900 | | @, L | | Oritani Financial Corp. | | | 67,179 |
| 19,000 | | | | Provident Financial Services, Inc. | | | 172,900 |
| 6,550 | | | | Provident New York Bancorp | | | 53,186 |
| 5,226 | | | | Rockville Financial, Inc. | | | 57,225 |
| 7,650 | | | | Roma Financial Corp. | | | 97,461 |
| 9,500 | | | | United Financial Bancorp, Inc. | | | 131,290 |
| 5,350 | | | | ViewPoint Financial Group | | | 81,481 |
| 11,650 | | | | Westfield Financial, Inc. | | | 105,549 |
| 2,900 | | | | WSFS Financial Corp. | | | 79,199 |
| | | | | | | |
| | | | | | | 2,670,993 |
| | | | | | | |
Semiconductors: 3.3% |
| 8,500 | | @ | | Actel Corp. | | | 91,205 |
| 19,000 | | @ | | Advanced Analogic Technologies, Inc. | | | 87,210 |
| 39,250 | | @ | | Amkor Technology, Inc. | | | 185,653 |
| 26,250 | | @ | | Anadigics, Inc. | | | 109,988 |
| 22,000 | | @ | | Applied Micro Circuits Corp. | | | 178,860 |
| 9,750 | | @ | | ATMI, Inc. | | | 151,418 |
| 24,850 | | @ | | Brooks Automation, Inc. | | | 111,328 |
| 7,700 | | @ | | Cabot Microelectronics Corp. | | | 217,833 |
| 11,750 | | @ | | Cavium Networks, Inc. | | | 197,518 |
| 10,700 | | @ | | Ceva, Inc. | | | 92,876 |
| 25,250 | | @ | | Cirrus Logic, Inc. | | | 113,625 |
| 7,700 | | | | Cohu, Inc. | | | 69,146 |
| 24,712 | | @, @@ | | CSR PLC | | | 142,852 |
| 11,600 | | @ | | Diodes, Inc. | | | 181,424 |
| 9,050 | | @ | | DSP Group, Inc. | | | 61,178 |
| 41,150 | | @, L | | Emcore Corp. | | | 51,849 |
| 27,850 | | @ | | Emulex Corp. | | | 272,373 |
| 48,400 | | @ | | Entegris, Inc. | | | 131,648 |
| 16,300 | | @ | | Exar Corp. | | | 117,197 |
| 15,250 | | @ | | Formfactor, Inc. | | | 262,910 |
| 6,750 | | @ | | Hittite Microwave Corp. | | | 234,563 |
| 10,100 | | @ | | Intellon Corp. | | | 42,925 |
| 9,050 | | | | IXYS Corp. | | | 91,586 |
| 27,450 | | @ | | Kopin Corp. | | | 100,742 |
See Accompanying Notes to Financial Statements
80
| | |
ING RUSSELL™ SMALL CAP
INDEX PORTFOLIO | | PORTFOLIO OF INVESTMENTS AS OF JUNE 30, 2009 (UNAUDITED) (CONTINUED) |
| | | | | | | |
| Shares | | | | | | Value |
| | | | | | | |
Semiconductors: (continued) |
| 21,300 | | @ | | Kulicke & Soffa Industries, Inc. | | $ | 73,059 |
| 42,600 | | @ | | Lattice Semiconductor Corp. | | | 80,088 |
| 18,900 | | | | Micrel, Inc. | | | 138,348 |
| 25,850 | | @ | | Microsemi Corp. | | | 356,730 |
| 27,550 | | @ | | Microtune, Inc. | | | 64,467 |
| 22,650 | | @ | | MIPS Technologies, Inc. | | | 67,950 |
| 17,850 | | @ | | MKS Instruments, Inc. | | | 235,442 |
| 10,450 | | @ | | Monolithic Power Systems, Inc. | | | 234,185 |
| 6,550 | | @ | | Netlogic Microsystems, Inc. | | | 238,813 |
| 16,600 | | @ | | Omnivision Technologies, Inc. | | | 172,474 |
| 6,050 | | @ | | Pericom Semiconductor Corp. | | | 50,941 |
| 12,300 | | @ | | Photronics, Inc. | | | 49,815 |
| 15,250 | | @ | | PLX Technology, Inc. | | | 57,493 |
| 10,100 | | | | Power Integrations, Inc. | | | 240,279 |
| 10,300 | | @ | | Rubicon Technology, Inc. | | | 147,084 |
| 11,900 | | @ | | Rudolph Technologies, Inc. | | | 65,688 |
| 21,100 | | @ | | Semtech Corp. | | | 335,701 |
| 9,000 | | @, L | | Sigma Designs, Inc. | | | 144,360 |
| 30,150 | | @ | | Silicon Image, Inc. | | | 69,345 |
| 56,700 | | @ | | Skyworks Solutions, Inc. | | | 554,526 |
| 6,150 | | @ | | Standard Microsystems Corp. | | | 125,768 |
| 4,450 | | @ | | Supertex, Inc. | | | 111,740 |
| 8,500 | | @ | | Techwell, Inc. | | | 72,250 |
| 18,300 | | @ | | Tessera Technologies, Inc. | | | 462,807 |
| 46,950 | | @ | | Triquint Semiconductor, Inc. | | | 249,305 |
| 8,650 | | @ | | Ultratech, Inc. | | | 106,482 |
| 13,400 | | @ | | Veeco Instruments, Inc. | | | 155,306 |
| 7,250 | | @ | | Volterra Semiconductor Corp. | | | 95,265 |
| 18,450 | | @ | | Zoran Corp. | | | 201,105 |
| | | | | | | |
| | | | | | | 8,254,723 |
| | | | | | | |
Software: 4.9% |
| 19,750 | | @ | | Accelrys, Inc. | | | 116,723 |
| 11,000 | | @ | | ACI Worldwide, Inc. | | | 153,560 |
| 25,350 | | @ | | Actuate Corp. | | | 121,173 |
| 18,350 | | | | Acxiom Corp. | | | 162,031 |
| 5,500 | | @ | | Advent Software, Inc. | | | 180,345 |
| 14,550 | | @ | | American Reprographics Co. | | | 121,056 |
| 17,250 | | | | American Software, Inc. | | | 99,360 |
| 5,200 | | @ | | ArcSight, Inc. | | | 92,404 |
| 28,450 | | @ | | Ariba, Inc. | | | 279,948 |
| 10,650 | | @, L | | Athenahealth, Inc. | | | 394,157 |
| 8,450 | | @ | | Avid Technology, Inc. | | | 113,315 |
| 14,450 | | | | Blackbaud, Inc. | | | 224,698 |
| 11,550 | | @ | | Blackboard, Inc. | | | 333,333 |
| 5,950 | | @ | | Bottomline Technologies, Inc. | | | 53,610 |
| 15,242 | | | | Bowne & Co., Inc. | | | 99,225 |
| 22,150 | | @ | | Callidus Software, Inc. | | | 63,128 |
| 13,500 | | @ | | Commvault Systems, Inc. | | | 223,830 |
| 3,600 | | | | Computer Programs & Systems, Inc. | | | 137,916 |
| 14,550 | | @ | | Concur Technologies, Inc. | | | 452,214 |
| 12,350 | | @ | | CSG Systems International | | | 163,514 |
| 6,950 | | @ | | DemandTec, Inc. | | | 61,160 |
| 10,500 | | @ | | Digi International, Inc. | | | 102,375 |
| 13,650 | | @ | | DivX, Inc. | | | 74,939 |
| 5,800 | | @ | | Double-Take Software, Inc. | | | 50,170 |
| 2,800 | | @ | | Ebix, Inc. | | | 87,696 |
| 16,600 | | @ | | Eclipsys Corp. | | | 295,148 |
| 14,350 | | @ | | Epicor Software Corp. | | | 76,055 |
| 12,350 | | @ | | EPIQ Systems, Inc. | | | 189,573 |
| 17,650 | | | | Fair Isaac Corp. | | | 272,869 |
| 15,800 | | @ | | FalconStor Software, Inc. | | | 75,050 |
| | | | | | | |
| Shares | | | | | | Value |
| | | | | | | |
Software: (continued) |
| 15,350 | | @ | | infoGROUP, Inc. | | $ | 87,649 |
| 27,450 | | @ | | Informatica Corp. | | | 471,866 |
| 9,950 | | @ | | Innerworkings, Inc. | | | 47,263 |
| 5,950 | | @ | | Interactive Intelligence, Inc. | | | 72,947 |
| 9,150 | | @ | | JDA Software Group, Inc. | | | 136,884 |
| 41,050 | | @ | | Lawson Software, Inc. | | | 229,059 |
| 7,250 | | @ | | Mantech International Corp. | | | 312,040 |
| 11,900 | | @ | | MedAssets, Inc. | | | 231,455 |
| 2,300 | | @ | | MicroStrategy, Inc. | | | 115,506 |
| 11,000 | | @ | | Monotype Imaging Holdings, Inc. | | | 74,910 |
| 12,450 | | @ | | MSCSoftware Corp. | | | 82,917 |
| 6,050 | | @, L | | NetSuite, Inc. | | | 71,451 |
| 12,450 | | @ | | Omnicell, Inc. | | | 133,838 |
| 21,600 | | @ | | Omniture, Inc. | | | 271,296 |
| 39,600 | | @ | | Parametric Technology Corp. | | | 462,924 |
| 7,050 | | | | Pegasystems, Inc. | | | 185,979 |
| 14,300 | | @ | | Phase Forward, Inc. | | | 216,073 |
| 13,900 | | @ | | Progress Software Corp. | | | 294,263 |
| 5,300 | | @ | | PROS Holdings, Inc. | | | 43,036 |
| 7,000 | | | | Quality Systems, Inc. | | | 398,720 |
| 25,050 | | @ | | Quest Software, Inc. | | | 349,197 |
| 4,250 | | L | | Renaissance Learning, Inc. | | | 39,143 |
| 7,050 | | @ | | RightNow Technologies, Inc. | | | 83,190 |
| 2,200 | | @ | | Rosetta Stone, Inc. | | | 60,368 |
| 6,750 | | | | Schawk, Inc. | | | 50,693 |
| 10,100 | | @ | | Seachange Intl., Inc. | | | 81,103 |
| 8,400 | | @ | | Smith Micro Software, Inc. | | | 82,488 |
| 13,700 | | @ | | SolarWinds, Inc. | | | 225,913 |
| 21,550 | | @ | | Solera Holdings, Inc. | | | 547,370 |
| 6,150 | | @ | | SPSS, Inc. | | | 205,226 |
| 7,100 | | @ | | Synchronoss Technologies, Inc. | | | 87,117 |
| 5,950 | | @ | | SYNNEX Corp. | | | 148,691 |
| 26,300 | | @ | | Take-Two Interactive Software, Inc. | | | 249,061 |
| 10,300 | | @ | | Taleo Corp. | | | 188,181 |
| 21,300 | | @ | | THQ, Inc. | | | 152,508 |
| 24,950 | | @ | | Trident Microsystems, Inc. | | | 43,413 |
| 15,050 | | @ | | Tyler Technologies, Inc. | | | 235,081 |
| 8,500 | | @ | | Ultimate Software Group, Inc. | | | 206,040 |
| 24,000 | | @ | | Verifone Holdings, Inc. | | | 180,240 |
| 22,950 | | @ | | Wind River Systems, Inc. | | | 263,007 |
| | | | | | | |
| | | | | | | 12,288,681 |
| | | | | | | |
Storage/Warehousing: 0.0% |
| 8,850 | | @ | | Mobile Mini, Inc. | | | 129,830 |
| | | | | | | |
| | | | | | | 129,830 |
| | | | | | | |
Telecommunications: 4.8% |
| 126,950 | | @ | | 3Com Corp. | | | 597,936 |
| 10,250 | | @ | | Acme Packet, Inc. | | | 103,730 |
| 29,000 | | @ | | Adaptec, Inc. | | | 76,850 |
| 27,400 | | @ | | ADC Telecommunications, Inc. | | | 218,104 |
| 19,000 | | | | Adtran, Inc. | | | 407,930 |
| 14,450 | | @ | | Airvana, Inc. | | | 92,047 |
| 16,000 | | | | Alaska Communications Systems Group, Inc. | | | 117,120 |
| 6,150 | | @ | | Anaren, Inc. | | | 108,732 |
| 9,950 | | @ | | Anixter International, Inc. | | | 374,021 |
| 3,950 | | | | Applied Signal Technology, Inc. | | | 100,765 |
| 40,600 | | @ | | Arris Group, Inc. | | | 493,696 |
| 18,900 | | @ | | Aruba Networks, Inc. | | | 165,186 |
| 20,350 | | @ | | Atheros Communications, Inc. | | | 391,534 |
| 4,150 | | | | Atlantic Tele-Network, Inc. | | | 163,054 |
| 12,800 | | @ | | BigBand Networks, Inc. | | | 66,176 |
See Accompanying Notes to Financial Statements
81
| | |
ING RUSSELL™ SMALL CAP
INDEX PORTFOLIO | | PORTFOLIO OF INVESTMENTS AS OF JUNE 30, 2009 (UNAUDITED) (CONTINUED) |
| | | | | | | |
| Shares | | | | | | Value |
| | | | | | | |
Telecommunications: (continued) |
| 4,900 | | | | Black Box Corp. | | $ | 164,003 |
| 8,700 | | @ | | Cbeyond, Inc. | | | 124,845 |
| 27,400 | | @ | | Centennial Communications Corp. | | | 229,064 |
| 70,250 | | @ | | Cincinnati Bell, Inc. | | | 199,510 |
| 8,400 | | @ | | Comtech Telecommunications | | | 267,792 |
| 7,700 | | | | Consolidated Communications Holdings, Inc. | | | 90,167 |
| 6,900 | | | | D & E Communications, Inc. | | | 70,587 |
| 5,400 | | @ | | DigitalGlobe, Inc. | | | 103,680 |
| 5,300 | | @ | | EMS Technologies, Inc. | | | 110,770 |
| 17,850 | | @ | | Extreme Networks | | | 35,700 |
| 14,200 | | @ | | General Communication, Inc. | | | 98,406 |
| 6,350 | | @, L | | GeoEye, Inc. | | | 149,606 |
| 8,650 | | @ | | Global Crossing Ltd. | | | 79,407 |
| 9,950 | | @ | | Globecomm Systems, Inc. | | | 71,541 |
| 32,200 | | @ | | Harmonic, Inc. | | | 189,658 |
| 20,850 | | @ | | Harris Stratex Networks, Inc. | | | 135,108 |
| 3,950 | | @ | | Hughes Communications, Inc. | | | 90,179 |
| 30,750 | | @ | | Infinera Corp. | | | 280,748 |
| 14,350 | | @ | | InterDigital, Inc. | | | 350,714 |
| 13,400 | | | | Iowa Telecommunications Services, Inc. | | | 167,634 |
| 5,000 | | @ | | iPCS, Inc. | | | 74,800 |
| 7,250 | | @ | | IPG Photonics Corp. | | | 79,533 |
| 7,900 | | @ | | Ixia | | | 53,246 |
| 9,350 | | @ | | Knology, Inc. | | | 80,691 |
| 4,150 | | @ | | Loral Space & Communications, Inc. | | | 106,863 |
| 16,200 | | @ | | Mastec, Inc. | | | 189,864 |
| 11,500 | | @ | | Netgear, Inc. | | | 165,715 |
| 10,350 | | @ | | Neutral Tandem, Inc. | | | 305,532 |
| 11,950 | | @ | | Novatel Wireless, Inc. | | | 107,789 |
| 9,200 | | | | NTELOS Holdings Corp. | | | 169,464 |
| 7,600 | | @ | | Oplink Communications, Inc. | | | 86,640 |
| 20,450 | | @ | | OpNext, Inc. | | | 43,763 |
| 46,750 | | @ | | PAETEC Holding Corp. | | | 126,225 |
| 16,400 | | | | Plantronics, Inc. | | | 310,124 |
| 27,450 | | @ | | Polycom, Inc. | | | 556,412 |
| 93,400 | | @ | | Powerwave Technologies, Inc. | | | 150,374 |
| 22,950 | | @ | | Premier Global Services, Inc. | | | 248,778 |
| 14,450 | | @ | | RCN Corp. | | | 86,267 |
| 83,500 | | @ | | RF Micro Devices, Inc. | | | 313,960 |
| 11,850 | | @ | | SAVVIS, Inc. | | | 135,801 |
| 8,250 | | | | Shenandoah Telecom Co. | | | 167,393 |
| 15,250 | | @ | | ShoreTel, Inc. | | | 122,000 |
| 57,850 | | @ | | Sonus Networks, Inc. | | | 93,139 |
| 12,450 | | @, L | | Starent Networks Corp. | | | 303,905 |
| 6,500 | | @ | | SureWest Communications | | | 68,055 |
| 8,450 | | @ | | Switch and Data, Inc. | | | 99,119 |
| 67,500 | | @ | | Sycamore Networks, Inc. | | | 211,275 |
| 7,700 | | @ | | Symmetricom, Inc. | | | 44,429 |
| 22,550 | | @ | | Syniverse Holdings, Inc. | | | 361,477 |
| 22,350 | | @ | | Tekelec | | | 376,151 |
| 10,200 | | @ | | USA Mobility, Inc. | | | 130,152 |
| 27,000 | | @, L | | Utstarcom, Inc. | | | 44,010 |
| 6,750 | | @ | | Viasat, Inc. | | | 173,070 |
| 11,800 | | @ | | Virgin Mobile USA, Inc. | | | 47,436 |
| | | | | | | |
| | | | | | | 12,119,452 |
| | | | | | | |
Textiles: 0.1% |
| 6,950 | | | | G&K Services, Inc. | | | 146,993 |
| 4,550 | | | | Unifirst Corp. | | | 169,124 |
| | | | | | | |
| | | | | | | 316,117 |
| | | | | | | |
| | | | | | | |
| Shares | | | | | | Value |
| | | | | | | |
Toys/Games/Hobbies: 0.1% |
| 9,750 | | @ | | Jakks Pacific, Inc. | | $ | 125,093 |
| 4,500 | | @ | | RC2 Corp. | | | 59,535 |
| | | | | | | |
| | | | | | | 184,628 |
| | | | | | | |
Transportation: 1.9% |
| 28,000 | | @ | | Air Transport Services Group, Inc. | | | 64,960 |
| 3,925 | | @, L | | American Commercial Lines, Inc. | | | 60,759 |
| 8,200 | | | | Arkansas Best Corp. | | | 216,070 |
| 3,650 | | @ | | Atlas Air Worldwide Holdings, Inc. | | | 84,644 |
| 7,750 | | @ | | Bristow Group, Inc. | | | 229,633 |
| 5,950 | | @ | | Celadon Group, Inc. | | | 49,921 |
| 20,200 | | | | DHT Maritime, Inc. | | | 105,242 |
| 6,150 | | @ | | Dynamex, Inc. | | | 94,649 |
| 21,750 | | L | | Eagle Bulk Shipping, Inc. | | | 102,008 |
| 9,150 | | | | Forward Air Corp. | | | 195,078 |
| 6,950 | | L | | Genco Shipping & Trading Ltd. | | | 150,954 |
| 18,138 | | | | General Maritime Corp. | | | 179,385 |
| 10,400 | | @ | | Genesee & Wyoming, Inc. | | | 275,704 |
| 10,600 | | @@ | | Golar LNG Ltd. | | | 90,630 |
| 8,000 | | @ | | Gulfmark Offshore, Inc. | | | 220,800 |
| 17,850 | | | | Heartland Express, Inc. | | | 262,752 |
| 17,050 | | L | | Horizon Lines, Inc. | | | 65,813 |
| 11,850 | | @ | | HUB Group, Inc. | | | 244,584 |
| 4,000 | | | | International Shipholding Corp. | | | 107,840 |
| 17,050 | | | | Knight Transportation, Inc. | | | 282,178 |
| 3,900 | | L | | Knightsbridge Tankers Ltd. | | | 53,196 |
| 5,600 | | @ | | Marten Transport Ltd. | | | 116,256 |
| 13,500 | | @@ | | Nordic American Tanker Shipping | | | 429,570 |
| 10,300 | | @ | | Old Dominion Freight Line | | | 345,771 |
| 4,450 | | @ | | PHI, Inc. | | | 76,273 |
| 3,400 | | @ | | Saia, Inc. | | | 61,234 |
| 14,250 | | @@ | | Ship Finance International Ltd. | | | 157,178 |
| 4,650 | | L | | Teekay Tankers Ltd. | | | 43,199 |
| 13,500 | | @ | | Ultrapetrol Bahamas Ltd. | | | 59,805 |
| 13,500 | | | | Werner Enterprises, Inc. | | | 244,620 |
| 30,050 | | @, L | | YRC Worldwide, Inc. | | | 51,987 |
| | | | | | | |
| | | | | | | 4,722,693 |
| | | | | | | |
Trucking & Leasing: 0.1% | | | |
| 14,850 | | | | Aircastle Ltd. | | | 109,148 |
| 2,900 | | @ | | Amerco, Inc. | | | 107,735 |
| 7,250 | | | | Greenbrier Cos., Inc. | | | 52,128 |
| 4,800 | | | | TAL International Group, Inc. | | | 52,320 |
| 5,800 | | @@ | | Textainer Group Holdings Ltd. | | | 66,642 |
| | | | | | | |
| | | | | | | 387,973 |
| | | | | | | |
Water: 0.4% | | | |
| 5,550 | | | | American States Water Co. | | | 192,252 |
| 6,150 | | | | California Water Service Group | | | 226,566 |
| 4,000 | | L | | Consolidated Water Co., Ltd. | | | 63,400 |
| 9,600 | | | | Middlesex Water Co. | | | 138,720 |
| 6,700 | | @ | | Pico Holdings, Inc. | | | 192,290 |
| 4,450 | | | | SJW Corp. | | | 101,015 |
| 13,200 | | L | | Southwest Water Co. | | | 72,864 |
| | | | | | | |
| | | | | | | 987,107 |
| | | | | | | |
| | | | Total Common Stock
(Cost $279,090,153) | | | 236,444,732 |
| | | | | | | |
REAL ESTATE INVESTMENT TRUSTS: 5.0% | | | |
Apartments: 0.6% | | | |
| 15,139 | | | | American Campus Communities, Inc. | | | 335,783 |
See Accompanying Notes to Financial Statements
82
| | |
ING RUSSELL™ SMALL CAP
INDEX PORTFOLIO | | PORTFOLIO OF INVESTMENTS AS OF JUNE 30, 2009 (UNAUDITED) (CONTINUED) |
| | | | | | | |
| Shares | | | | | | Value |
| | | | | | | |
Apartments: (continued) | | | |
| 14,200 | | | | Associated Estates Realty Corp. | | $ | 84,632 |
| 17,000 | | | | Education Realty Trust, Inc. | | | 72,930 |
| 11,050 | | | | Home Properties, Inc. | | | 376,805 |
| 8,500 | | | | Mid-America Apartment Communities, Inc. | | | 312,035 |
| 15,600 | | | | Post Properties, Inc. | | | 209,664 |
| | | | | | | |
| | | | | | | 1,391,849 |
| | | | | | | |
Diversified: 0.9% | | | |
| 45,700 | | | | Capital Lease Funding, Inc. | | | 126,132 |
| 18,250 | | | | Colonial Properties Trust | | | 135,050 |
| 11,578 | | | | Cousins Properties, Inc. | | | 98,413 |
| 9,200 | | @ | | DuPont Fabros Technology, Inc. | | | 86,664 |
| 10,400 | | | | Entertainment Properties Trust | | | 214,240 |
| 6,700 | | | | Gladstone Commercial Corp. | | | 86,832 |
| 20,350 | | | | Investors Real Estate Trust | | | 180,912 |
| 21,532 | | | | Lexington Realty Trust | | | 73,209 |
| 13,500 | | | | Mission West Properties | | | 92,205 |
| 13,900 | | | | Potlatch Corp. | | | 337,631 |
| 5,300 | | | | PS Business Parks, Inc. | | | 256,732 |
| 17,900 | | | | Washington Real Estate Investment Trust | | | 400,423 |
| 8,300 | | | | Winthrop Realty Trust | | | 74,119 |
| | | | | | | |
| | | | | | | 2,162,562 |
| | | | | | | |
Health Care: 0.5% | | | |
| 8,700 | | | | Care Investment Trust, Inc. | | | 45,240 |
| 24,150 | | | | Cogdell Spencer, Inc. | | | 103,604 |
| 16,600 | | | | Healthcare Realty Trust, Inc. | | | 279,378 |
| 8,100 | | | | LTC Properties, Inc. | | | 165,645 |
| 27,000 | | | | Medical Properties Trust, Inc. | | | 163,890 |
| 4,950 | | | | National Health Investors, Inc. | | | 132,215 |
| 21,100 | | | | Omega Healthcare Investors, Inc. | | | 327,472 |
| 4,550 | | | | Universal Health Realty Income Trust | | | 143,416 |
| | | | | | | |
| | | | | | | 1,360,860 |
| | | | | | | |
Hotels: 0.3% | | | |
| 43,450 | | @ | | Ashford Hospitality Trust, Inc. | | | 122,095 |
| 32,400 | | @ | | DiamondRock Hospitality Co. | | | 202,824 |
| 34,050 | | @ | | FelCor Lodging Trust, Inc. | | | 83,763 |
| 14,150 | | | | LaSalle Hotel Properties | | | 174,611 |
| 68,050 | | @ | | Strategic Hotel Capital, Inc. | | | 75,536 |
| 18,134 | | @ | | Sunstone Hotel Investors, Inc. | | | 97,017 |
| | | | | | | |
| | | | | | | 755,846 |
| | | | | | | |
Manufactured Homes: 0.1% | | | |
| 7,250 | | | | Equity Lifestyle Properties, Inc. | | | 269,555 |
| 6,950 | | | | Sun Communities, Inc. | | | 95,771 |
| | | | | | | |
| | | | | | | 365,326 |
| | | | | | | |
Mortgage: 0.9% | | | |
| 4,550 | | | | American Capital Agency Corp. | | | 104,514 |
| 33,150 | | | | Anworth Mortgage Asset Corp. | | | 239,012 |
| 20,900 | | | | Capstead Mortgage Corp. | | | 265,639 |
| 5,400 | | | | Dynex Capital, Inc. | | | 44,280 |
| 43,335 | | @, L | | Gramercy Capital Corp. | | | 69,769 |
| 12,050 | | | | Hatteras Financial Corp. | | | 344,510 |
| 31,900 | | @ | | iStar Financial, Inc. | | | 90,596 |
| 73,750 | | | | MFA Mortgage Investments, Inc. | | | 510,350 |
| 20,198 | | L | | Northstar Realty Finance Corp. | | | 57,160 |
| 23,900 | | | | Redwood Trust, Inc. | | | 352,764 |
| | | | | | | |
| Shares | | | | | | Value |
| | | | | | | |
Mortgage: (continued) | | | |
| 6,100 | | @ | | Walter Investment Management Corp. | | $ | 81,008 |
| | | | | | | |
| | | | | | | 2,159,602 |
| | | | | | | |
Office Property: 0.4% | | | |
| 28,050 | | | | BioMed Realty Trust, Inc. | | | 286,952 |
| 16,700 | | | | Franklin Street Properties Corp. | | | 221,275 |
| 18,650 | | | | Highwoods Properties, Inc. | | | 417,201 |
| 5,900 | | | | Kilroy Realty Corp. | | | 121,186 |
| 4,050 | | | | Parkway Properties, Inc. | | | 52,650 |
| | | | | | | |
| | | | | | | 1,099,264 |
| | | | | | | |
Regional Malls: 0.1% | | | |
| 16,500 | | | | CBL & Associates Properties, Inc. | | | 88,935 |
| 22,550 | | | | Glimcher Realty Trust | | | 65,395 |
| 12,900 | | L | | Pennsylvania Real Estate Investment Trust | | | 64,500 |
| | | | | | | |
| | | | | | | 218,830 |
| | | | | | | |
Shopping Centers: 0.5% | | | |
| 10,416 | | | | Acadia Realty Trust | | | 135,929 |
| 18,350 | | @ | | Cedar Shopping Centers, Inc. | | | 82,942 |
| 33,700 | | | | Developers Diversified Realty Corp. | | | 164,456 |
| 11,800 | | L | | Equity One, Inc. | | | 156,468 |
| 19,000 | | | | Inland Real Estate Corp. | | | 133,000 |
| 8,950 | | | | Ramco-Gershenson Properties | | | 89,590 |
| 3,550 | | | | Saul Centers, Inc. | | | 104,974 |
| 10,200 | | | | Tanger Factory Outlet Centers, Inc. | | | 330,786 |
| 3,950 | | | | Urstadt Biddle Properties, Inc. | | | 55,616 |
| | | | | | | |
| | | | | | | 1,253,761 |
| | | | | | | |
Single Tenant: 0.3% | | | |
| 750 | | @ | | Alexander’s, Inc. | | | 202,200 |
| 6,150 | | | | Getty Realty Corp. | | | 116,051 |
| 27,300 | | | | National Retail Properties, Inc. | | | 473,655 |
| | | | | | | |
| | | | | | | 791,906 |
| | | | | | | |
Storage: 0.2% | | | |
| 24,200 | | @ | | Extra Space Storage, Inc. | | | 202,070 |
| 7,250 | | | | Sovran Self Storage, Inc. | | | 178,350 |
| 21,050 | | | | U-Store-It Trust | | | 103,145 |
| | | | | | | |
| | | | | | | 483,565 |
| | | | | | | |
Warehouse/Industrial: 0.2% | | | |
| 56,600 | | | | DCT Industrial Trust, Inc. | | | 230,928 |
| 7,700 | | | | EastGroup Properties, Inc. | | | 254,254 |
| 21,600 | | @, L | | First Industrial Realty Trust, Inc. | | | 93,960 |
| 5,100 | | | | First Potomac Realty Trust | | | 49,725 |
| | | | | | | |
| | | | | | | 628,867 |
| | | | | | | |
| | | | Total Real Estate Investment Trusts (Cost $17,449,422) | | | 12,672,238 |
| | | | | | | |
RIGHTS: 0.0% | | | |
Home Furnishings: 0.0% | | | |
| 19,550 | | | | Sealy Corp. | | | 41,446 |
| | | | | | | |
| | | | Total Rights
(Cost $48,190) | | | 41,446 |
| | | | | | | |
| | | | Total Long-Term Investments
(Cost $296,587,765) | | | 249,158,416 |
| | | | | | | |
See Accompanying Notes to Financial Statements
83
| | |
ING RUSSELL™ SMALL CAP
INDEX PORTFOLIO | | PORTFOLIO OF INVESTMENTS AS OF JUNE 30, 2009 (UNAUDITED) (CONTINUED) |
| | | | | | | | | | | | |
| Shares | | | | | | | | | Value | |
| | | | | | | | | | | | |
| SHORT-TERM INVESTMENTS: 10.6% | | | | | | | |
| Money Market: 2.2% | | | | | | | |
| | 5,543,000 | | S | | ING Institutional Prime Money Market Fund - Class I | | | | | $ | 5,543,000 | |
| | | | | | | | | | | | |
| | | | | Total Money Market
(Cost $5,543,000) | | | | | | 5,543,000 | |
| | | | | | | | | | | | |
| | | | |
Principal
Amount | | | | | | | | | Value | |
| Securities Lending Collateralcc: 8.4% | | | | | | | |
| $ | 21,280,593 | | | | Bank of New York Mellon Corp. Institutional Cash Reserves | | | | | | 21,180,127 | |
| | | | | | | | | | | | |
| | | | | Total Securities Lending Collateral
(Cost $21,280,593) | | | | | | 21,180,127 | |
| | | | | | | | | | | | |
| | | | | Total Short-Term Investments
(Cost $26,823,593) | | | | | | 26,723,127 | |
| | | | | | | | | | | | |
| | | | | Total Investments in Securities
(Cost $323,411,358)* | | 109.4 | % | | $ | 275,881,543 | |
| | | | | Other Assets and Liabilities - Net | | (9.4 | ) | | | (23,608,465 | ) |
| | | | | | | | | | | | |
| | | | | Net Assets | | 100.0 | % | | $ | 252,273,078 | |
| | | | | | | | | | | | |
| @ | Non-income producing security |
| cc | Securities purchased with cash collateral for securities loaned. |
| S | All or a portion of this security is segregated to cover collateral requirements for applicable futures, options, swaps, foreign forward currency contracts and/or when-issued or delayed-delivery securities. |
| L | Loaned security, a portion or all of the security is on loan at June 30, 2009. |
| * | Cost for federal income tax purposes is $325,944,965. |
| | | | |
Net unrealized depreciation consists of: | | | | |
Gross Unrealized Appreciation | | $ | 12,625,357 | |
Gross Unrealized Depreciation | | | (62,688,779 | ) |
| | | | |
Net Unrealized Depreciation | | $ | (50,063,422 | ) |
| | | | |
Fair Value Measurements*
The following is a summary of the inputs used as of June 30, 2009 in determining the Portfolio’s investments at fair value for purposes of SFAS 157:
| | | | | | | | | |
| | | Quoted Prices in Active Markets for Identical Investments (Level 1) | | Significant Other Observable Inputs (Level 2) | | Significant Unobservable Inputs (Level 3) |
Common Stock | | | | | | | | | |
Advertising | | $ | 354,779 | | $ | — | | $ | — |
Aerospace/Defense | | | 3,417,091 | | | — | | | — |
Agriculture | | | 988,585 | | | — | | | — |
Airlines | | | 1,619,001 | | | — | | | — |
Apparel | | | 4,044,095 | | | — | | | — |
Auto Manufacturers | | | 204,646 | | | — | | | — |
| | | | | | | | | |
| | | Quoted Prices in Active Markets for Identical Investments (Level 1) | | Significant Other Observable Inputs (Level 2) | | Significant Unobservable Inputs (Level 3) |
Auto Parts & Equipment | | $ | 1,554,385 | | $ | — | | $ | — |
Banks | | | 15,771,088 | | | — | | | — |
Beverages | | | 416,743 | | | — | | | — |
Biotechnology | | | 6,711,655 | | | — | | | — |
Building Materials | | | 1,586,128 | | | — | | | — |
Chemicals | | | 4,255,789 | | | — | | | — |
Coal | | | 394,355 | | | — | | | — |
Commercial Services | | | 15,411,651 | | | — | | | — |
Computers | | | 7,340,673 | | | — | | | — |
Cosmetics/Personal Care | | | 721,545 | | | — | | | — |
Distribution/Wholesale | | | 3,169,445 | | | — | | | — |
Diversified Financial Services | | | 5,196,479 | | | — | | | — |
Electric | | | 4,649,603 | | | — | | | — |
Electrical Components & Equipment | | | 2,743,668 | | | — | | | — |
Electronics | | | 6,209,613 | | | — | | | — |
Energy — Alternate Sources | | | 628,243 | | | — | | | — |
Engineering & Construction | | | 2,378,909 | | | — | | | — |
Entertainment | | | 1,918,288 | | | — | | | — |
Environmental Control | | | 2,324,208 | | | — | | | — |
Food | | | 4,965,570 | | | — | | | — |
Forest Products & Paper | | | 1,008,804 | | | — | | | — |
Gas | | | 3,694,370 | | | — | | | — |
Hand/Machine Tools | | | 1,043,408 | | | — | | | — |
Healthcare — Products | | | 11,057,727 | | | — | | | — |
Healthcare — Services | | | 5,913,437 | | | — | | | — |
Holding Companies — Diversified | | | 69,574 | | | — | | | — |
Home Builders | | | 954,708 | | | — | | | — |
Home Furnishings | | | 1,404,451 | | | — | | | — |
Household Products/Wares | | | 1,749,756 | | | — | | | — |
Insurance | | | 8,845,512 | | | — | | | — |
Internet | | | 7,967,085 | | | — | | | — |
Investment Companies | | | 2,027,518 | | | — | | | — |
Iron/Steel | | | 40,675 | | | — | | | — |
Leisure Time | | | 1,268,873 | | | — | | | — |
Lodging | | | 498,456 | | | — | | | — |
Machinery — Construction & Mining | | | 197,439 | | | — | | | — |
Machinery — Diversified | | | 3,064,897 | | | — | | | — |
Media | | | 1,236,219 | | | — | | | — |
Metal Fabricate/Hardware | | | 2,238,077 | | | — | | | — |
Mining | | | 1,753,317 | | | — | | | — |
Miscellaneous Manufacturing | | | 5,258,251 | | | — | | | — |
Office Furnishings | | | 800,653 | | | — | | | — |
Oil & Gas | | | 6,237,600 | | | — | | | — |
Oil & Gas Services | | | 2,934,567 | | | — | | | — |
Packaging & Containers | | | 1,133,773 | | | — | | | — |
Pharmaceuticals | | | 7,972,476 | | | — | | | — |
See Accompanying Notes to Financial Statements
84
| | |
ING RUSSELL™ SMALL CAP
INDEX PORTFOLIO | | PORTFOLIO OF INVESTMENTS AS OF JUNE 30, 2009 (UNAUDITED) (CONTINUED) |
| | | | | | | | | |
| | | Quoted Prices in Active Markets for Identical Investments (Level 1) | | Significant Other Observable Inputs (Level 2) | | Significant Unobservable Inputs (Level 3) |
Pipelines | | $ | 83,408 | | $ | — | | $ | — |
Real Estate | | | 463,896 | | | — | | | — |
Retail | | | 14,487,373 | | | — | | | — |
Savings & Loans | | | 2,670,993 | | | — | | | — |
Semiconductors | | | 8,111,871 | | | 142,852 | | | — |
Software | | | 12,288,681 | | | — | | | — |
Storage/Warehousing | | | 129,830 | | | — | | | — |
Telecommunications | | | 12,119,452 | | | — | | | — |
Textiles | | | 316,117 | | | — | | | — |
Toys/Games/Hobbies | | | 184,628 | | | — | | | — |
Transportation | | | 4,722,693 | | | — | | | — |
Trucking & Leasing | | | 387,973 | | | — | | | — |
Water | | | 987,107 | | | — | | | — |
| | | | | | | | | |
Total Common Stock | | | 236,301,880 | | | 142,852 | | | — |
Real Estate Investment Trusts | | | 12,672,238 | | | — | | | — |
Rights | | | 41,446 | | | — | | | — |
Short-Term Investments | | | 5,543,000 | | | 21,180,127 | | | — |
| | | | | | | | | |
Total | | $ | 254,558,564 | | $ | 21,322,979 | | $ | — |
| | | | | | | | | |
Other Financial Instruments** | | | 62,501 | | | — | | | — |
| | | | | | | | | |
Total | | $ | 62,501 | | $ | — | | $ | — |
| | | | | | | | | |
“Fair value” for purposes of SFAS 157 is different from “fair value” as used in the 1940 Act. The former generally implies market value, and can include market quotations as a source of value, and the latter refers to determinations of value in absence of available market quotations.
| * | See NOTE 2, “Significant Accounting Policies” in the Notes to Financial Statements for additional information. |
| ** | Other financial instruments may include open forward foreign currency contracts, futures, swaps, and written options. Forward foreign currency contracts and futures are reported at their unrealized gain/loss at period end. Swaps and written options are reported at their market value at period end. |
ING Russell Small Cap Index Portfolio Open Futures Contracts on June 30, 2009:
| | | | | | | |
Contract Description | | Number of Contracts | | Expiration Date | | Unrealized Appreciation |
Long Contracts | | | | | | | |
Russell 2000 Mini Index | | 34 | | 09/18/09 | | $ | 62,501 |
| | | | | | | |
| | | | | | $ | 62,501 |
| | | | | | | |
For the six months ended June 30, 2009, net realized gain (loss) on futures and the net change in unrealized gain (loss) on futures can be found on the Portfolio’s Statement of Operations. For additional information on the reason(s) why the Portfolio may enter into futures contracts and the risks associated with futures contracts, please refer to NOTE 2 in the accompanying Notes to Financial Statements.
See Accompanying Notes to Financial Statements
85
| | |
| ING U.S. BOND INDEX PORTFOLIO | | PORTFOLIO OF INVESTMENTS AS OF JUNE 30, 2009 (UNAUDITED) |
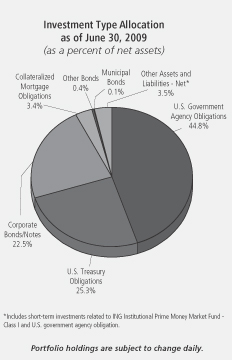
| | | | | | | | |
Principal
Amount | | | | | | Value |
| | | | | | | | |
| CORPORATE BONDS/NOTES: 22.5% |
| Aerospace/Defense: 0.5% | | | |
| $ | 1,560,000 | | #, C | | BAE Systems Holdings, Inc.,
6.375%, due 06/01/19 | | $ | 1,597,847 |
| | 1,150,000 | | C | | Boeing Co.,
5.000%, due 03/15/14 | | | 1,212,013 |
| | 600,000 | | C | | Northrop Grumman Corp.,
7.125%, due 02/15/11 | | | 644,264 |
| | 1,620,000 | | C | | United Technologies Corp.,
4.875%, due 05/01/15 | | | 1,724,845 |
| | | | | | | | |
| | | | | | | | 5,178,969 |
| | | | | | | | |
| Agriculture: 0.2% | | | |
| | 1,335,000 | | | | Altria Group, Inc.,
9.950%, due 11/10/38 | | | 1,545,082 |
| | 955,000 | | | | Philip Morris International, Inc.,
4.875%, due 05/16/13 | | | 1,003,046 |
| | | | | | | | |
| | | | | | | | 2,548,128 |
| | | | | | | | |
| Airlines: 0.2% | | | |
| | 1,547,391 | | C | | Delta Airlines, Inc.,
6.821%, due 08/10/22 | | | 1,284,334 |
| | 99,687 | | C | | Northwest Airlines, Inc.,
7.027%, due 11/01/19 | | | 77,257 |
| | 1,545,061 | | C | | Southwest Airlines Co. 2007-1
Pass-through Trust,
6.150%, due 08/01/22 | | | 1,452,357 |
| | | | | | | | |
| | | | | | | | 2,813,948 |
| | | | | | | | |
| Auto Manufacturers: 0.2% | | | |
| | 1,755,000 | | | | Daimler Finance NA, LLC,
6.500%, due 11/15/13 | | | 1,785,697 |
| | | | | | | | |
| | | | | | | | 1,785,697 |
| | | | | | | | |
| | | | | | | | |
Principal
Amount | | | | | | Value |
| | | | | | | | |
| Banks: 4.5% | | | |
| $ | 210,000 | | | | Bank of America Corp.,
5.375%, due 06/15/14 | | $ | 199,341 |
| | 2,525,000 | | | | Bank of America Corp.,
5.650%, due 05/01/18 | | | 2,234,900 |
| | 2,000,000 | | | | Bank of America Corp.,
7.625%, due 06/01/19 | | | 2,012,378 |
| | 1,205,000 | | @@ | | Barclays Bank PLC,
6.750%, due 05/22/19 | | | 1,197,213 |
| | 1,330,000 | | | | Citigroup, Inc.,
5.000%, due 09/15/14 | | | 1,116,185 |
| | 4,600,000 | | | | Citigroup, Inc.,
5.500%, due 04/11/13 | | | 4,314,906 |
| | 2,185,000 | | | | Citigroup, Inc.,
5.875%, due 05/29/37 | | | 1,712,393 |
| | 1,500,000 | | @@ | | Deutsche Bank AG/London,
5.375%, due 10/12/12 | | | 1,593,312 |
| | 2,410,000 | | | | Goldman Sachs Group, Inc.,
3.250%, due 06/15/12 | | | 2,495,854 |
| | 4,450,000 | | | | Goldman Sachs Group, Inc.,
4.750%, due 07/15/13 | | | 4,459,977 |
| | 2,150,000 | | | | Goldman Sachs Group, Inc.,
6.150%, due 04/01/18 | | | 2,096,671 |
| | 275,000 | | C | | Goldman Sachs Group, Inc.,
6.450%, due 05/01/36 | | | 233,884 |
| | 1,350,000 | | @@ | | HSBC Holdings PLC,
6.500%, due 09/15/37 | | | 1,310,002 |
| | 1,015,000 | | | | JPMorgan Chase & Co.,
2.125%, due 12/26/12 | | | 1,010,707 |
| | 3,215,000 | | | | JPMorgan Chase & Co.,
3.125%, due 12/01/11 | | | 3,327,689 |
| | 4,450,000 | | | | JPMorgan Chase & Co.,
5.375%, due 10/01/12 | | | 4,663,831 |
| | 4,715,000 | | @@ | | KFW,
3.250%, due 02/15/11 | | | 4,868,011 |
| | 1,250,000 | | C | | Morgan Stanley,
5.375%, due 10/15/15 | | | 1,226,421 |
| | 4,450,000 | | C | | Morgan Stanley,
6.625%, due 04/01/18 | | | 4,443,503 |
| | 2,040,000 | | | | State Street Corp.,
4.300%, due 05/30/14 | | | 2,019,033 |
| | 4,200,000 | | | | Wachovia Corp.,
5.700%, due 08/01/13 | | | 4,380,541 |
| | | | | | | | |
| | | | | | | | 50,916,752 |
| | | | | | | | |
| Beverages: 0.5% | | | |
| | 2,175,000 | | #, C | | Anheuser-Busch InBev Worldwide, Inc.,
7.750%, due 01/15/19 | | | 2,382,760 |
| | 2,400,000 | | C | | Coca-Cola Enterprises, Inc.,
4.250%, due 03/01/15 | | | 2,430,137 |
| | 515,000 | | @@, #, C | | SABMiller PLC,
5.700%, due 01/15/14 | | | 502,296 |
| | | | | | | | |
| | | | | | | | 5,315,193 |
| | | | | | | | |
See Accompanying Notes to Financial Statements
86
| | |
| ING U.S. BOND INDEX PORTFOLIO | | PORTFOLIO OF INVESTMENTS AS OF JUNE 30, 2009 (UNAUDITED) (CONTINUED) |
| | | | | | | | |
Principal
Amount | | | | | | Value |
| | | | | | | | |
| Chemicals: 0.2% | | | |
| $ | 1,655,000 | | C | | Dow Chemical Co.,
8.550%, due 05/15/19 | | $ | 1,660,675 |
| | 1,075,000 | | C | | EI Du Pont de Nemours & Co.,
5.000%, due 01/15/13 | | | 1,131,057 |
| | | | | | | | |
| | | | | | | | 2,791,732 |
| | | | | | | | |
| Commercial Services: 0.2% | | | |
| | 2,715,000 | | # | | Erac USA Finance Co.,
7.000%, due 10/15/37 | | | 2,164,927 |
| | | | | | | | |
| | | | | | | | 2,164,927 |
| | | | | | | | |
| Computers: 0.1% | | | |
| | 800,000 | | C | | Hewlett-Packard Co.,
4.500%, due 03/01/13 | | | 832,426 |
| | | | | | | | |
| | | | | | | | 832,426 |
| | | | | | | | |
| Cosmetics/Personal Care: 0.0% | | | |
| | 240,000 | | C | | Procter & Gamble Co.,
5.550%, due 03/05/37 | | | 243,906 |
| | | | | | | | |
| | | | | | | | 243,906 |
| | | | | | | | |
| Diversified Financial Services: 2.3% | | | |
| | 2,425,000 | | | | American Express Co.,
7.000%, due 03/19/18 | | | 2,358,533 |
| | 1,925,000 | | | | Bear Stearns Cos., Inc.,
5.350%, due 02/01/12 | | | 2,019,787 |
| | 2,420,000 | | | | Caterpillar Financial Services,
7.150%, due 02/15/19 | | | 2,594,852 |
| | 1,550,000 | | @@, C | | ConocoPhillips Canada Funding Co. I,
5.625%, due 10/15/16 | | | 1,653,073 |
| | 2,500,000 | | | | Credit Suisse First Boston USA, Inc.,
5.125%, due 01/15/14 | | | 2,548,075 |
| | 6,200,000 | | | | General Electric Capital Corp.,
5.250%, due 10/19/12 | | | 6,378,238 |
| | 3,015,000 | | C | | General Electric Capital Corp.,
6.750%, due 03/15/32 | | | 2,713,991 |
| | 1,475,000 | | | | HSBC Finance Corp.,
5.000%, due 06/30/15 | | | 1,376,134 |
| | 1,375,000 | | | | International Lease Finance Corp.,
5.625%, due 09/20/13 | | | 1,039,664 |
| | 600,000 | | C | | JPMorgan Chase Capital XV,
5.875%, due 03/15/35 | | | 481,411 |
| | 2,000,000 | | | | Merrill Lynch & Co., Inc.,
5.450%, due 02/05/13 | | | 1,948,150 |
| | 1,810,000 | | C | | Merrill Lynch & Co., Inc.,
6.220%, due 09/15/26 | | | 1,491,833 |
| | | | | | | | |
| | | | | | | | 26,603,741 |
| | | | | | | | |
| Electric: 2.0% | | | |
| | 710,000 | | C | | Alabama Power Co.,
5.800%, due 11/15/13 | | | 769,976 |
| | 295,000 | | C | | Consolidated Edison Co. of New York, Inc.,
7.125%, due 12/01/18 | | | 335,709 |
| | 790,000 | | C | | Dominion Resources, Inc.,
5.950%, due 06/15/35 | | | 756,019 |
| | | | | | | | |
Principal
Amount | | | | | | Value |
| | | | | | | | |
| Electric: (continued) |
| $ | 1,000,000 | | C | | Duke Energy Corp.,
6.300%, due 02/01/14 | | $ | 1,080,714 |
| | 1,350,000 | | C | | Exelon Generation Co., LLC,
6.200%, due 10/01/17 | | | 1,345,888 |
| | 3,475,000 | | C | | FirstEnergy Corp.,
6.450%, due 11/15/11 | | | 3,629,043 |
| | 325,000 | | C | | Florida Power & Light Co.,
5.550%, due 11/01/17 | | | 346,213 |
| | 160,000 | | C | | Georgia Power Co.,
6.000%, due 11/01/13 | | | 174,670 |
| | 980,000 | | C | | Midamerican Energy Co.,
4.650%, due 10/01/14 | | | 1,019,965 |
| | 1,700,000 | | C | | Midamerican Energy Holdings Co.,
6.125%, due 04/01/36 | | | 1,685,888 |
| | 2,355,000 | | C | | Oncor Electric Delivery Co.,
5.950%, due 09/01/13 | | | 2,452,735 |
| | 1,690,000 | | C | | Pacific Gas & Electric Co.,
6.050%, due 03/01/34 | | | 1,758,957 |
| | 1,160,000 | | C | | PPL Energy Supply, LLC,
6.300%, due 07/15/13 | | | 1,217,231 |
| | 1,775,000 | | C | | Progress Energy, Inc.,
7.100%, due 03/01/11 | | | 1,888,552 |
| | 730,000 | | C | | Southern California Edison Co.,
5.500%, due 08/15/18 | | | 775,832 |
| | 3,345,000 | | C | | Virginia Electric and Power Co.,
5.000%, due 06/30/19 | | | 3,380,082 |
| | | | | | | | |
| | | | | | | | 22,617,474 |
| | | | | | | | |
| Electronics: 0.0% | | | |
| | 350,000 | | @@, C | | Koninklijke Philips Electronics NV,
5.750%, due 03/11/18 | | | 353,395 |
| | | | | | | | |
| | | | | | | | 353,395 |
| | | | | | | | |
| Food: 0.5% | | | |
| | 1,085,000 | | | | Kellogg Co.,
4.450%, due 05/30/16 | | | 1,087,512 |
| | 1,600,000 | | | | Kraft Foods, Inc.,
6.500%, due 08/11/17 | | | 1,687,819 |
| | 725,000 | | C | | Kroger Co.,
5.500%, due 02/01/13 | | | 749,591 |
| | 1,710,000 | | C | | Safeway, Inc.,
6.250%, due 03/15/14 | | | 1,836,945 |
| | | | | | | | |
| | | | | | | | 5,361,867 |
| | | | | | | | |
| Healthcare - Services: 0.4% | | | |
| | 1,560,000 | | #, C | | Roche Holdings, Inc.,
6.000%, due 03/01/19 | | | 1,666,462 |
| | 1,425,000 | | C | | UnitedHealth Group, Inc.,
6.000%, due 02/15/18 | | | 1,369,861 |
| | 1,105,000 | | C | | WellPoint, Inc.,
5.850%, due 01/15/36 | | | 972,514 |
| | | | | | | | |
| | | | | | | | 4,008,837 |
| | | | | | | | |
| Household Products/Wares: 0.0% | | | |
| | 150,000 | | C | | Clorox Co.,
5.450%, due 10/15/12 | | | 158,956 |
| | | | | | | | |
| | | | | | | | 158,956 |
| | | | | | | | |
See Accompanying Notes to Financial Statements
87
| | |
| ING U.S. BOND INDEX PORTFOLIO | | PORTFOLIO OF INVESTMENTS AS OF JUNE 30, 2009 (UNAUDITED) (CONTINUED) |
| | | | | | | | |
Principal
Amount | | | | | | Value |
| | | | | | | | |
| Insurance: 0.3% | | | |
| $ | 110,000 | | C | | Genworth Financial, Inc.,
6.515%, due 05/22/18 | | $ | 73,637 |
| | 75,000 | | C | | Hartford Financial Services Group, Inc.,
5.250%, due 10/15/11 | | | 72,525 |
| | 75,000 | | C | | Metlife, Inc.,
5.000%, due 06/15/15 | | | 71,547 |
| | 1,695,000 | | C | | Metlife, Inc.,
6.750%, due 06/01/16 | | | 1,727,966 |
| | 265,000 | | | | Prudential Financial, Inc.,
5.700%, due 12/14/36 | | | 199,403 |
| | 1,275,000 | | | | Prudential Financial, Inc.,
6.200%, due 01/15/15 | | | 1,247,862 |
| | 215,000 | | C | | Travelers Cos., Inc.,
6.250%, due 06/15/37 | | | 223,410 |
| | | | | | | | |
| | | | | | | | 3,616,350 |
| | | | | | | | |
| Iron/Steel: 0.2% | | | |
| | 2,010,000 | | @@, C | | ArcelorMittal,
6.125%, due 06/01/18 | | | 1,761,642 |
| | | | | | | | |
| | | | | | | | 1,761,642 |
| | | | | | | | |
| Media: 1.5% | | | |
| | 1,440,000 | | @@, #, C | | British Sky Broadcasting,
9.500%, due 11/15/18 | | | 1,723,890 |
| | 2,505,000 | | C | | Comcast Corp.,
6.300%, due 11/15/17 | | | 2,655,530 |
| | 975,000 | | C | | Comcast Corp.,
6.500%, due 11/15/35 | | | 988,735 |
| | 1,900,000 | | C | | COX Communications, Inc.,
5.450%, due 12/15/14 | | | 1,888,298 |
| | 1,750,000 | | C | | News America, Inc.,
6.150%, due 03/01/37 | | | 1,488,713 |
| | 2,275,000 | | C | | Time Warner Cable, Inc.,
5.850%, due 05/01/17 | | | 2,275,344 |
| | 2,030,000 | | C | | Time Warner Cable, Inc.,
6.550%, due 05/01/37 | | | 1,952,541 |
| | 1,325,000 | | C | | Time Warner, Inc.,
5.875%, due 11/15/16 | | | 1,307,725 |
| | 925,000 | | C | | Time Warner, Inc.,
6.500%, due 11/15/36 | | | 812,415 |
| | 1,600,000 | | C | | Viacom, Inc.,
5.750%, due 04/30/11 | | | 1,638,722 |
| | | | | | | | |
| | | | | | | | 16,731,913 |
| | | | | | | | |
| Mining: 0.3% | | | |
| | 255,000 | | C | | Alcoa, Inc.,
5.550%, due 02/01/17 | | | 215,678 |
| | 1,380,000 | | @@, C | | Barrick Gold Corp.,
6.950%, due 04/01/19 | | | 1,548,395 |
| | 2,110,000 | | @@, C | | Rio Tinto Finance USA Ltd.,
6.500%, due 07/15/18 | | | 2,114,796 |
| | | | | | | | |
| | | | | | | | 3,878,869 |
| | | | | | | | |
| Miscellaneous Manufacturing: 0.4% | | | |
| | 525,000 | | C | | Eaton Corp.,
4.900%, due 05/15/13 | | | 528,709 |
| | 2,550,000 | | C | | Honeywell International, Inc.,
3.875%, due 02/15/14 | | | 2,608,308 |
| | | | | | | | |
Principal
Amount | | | | | | Value |
| | | | | | | | |
| Miscellaneous Manufacturing: (continued) | | | |
| $ | 895,000 | | @@, C | | Ingersoll-Rand Global Holding Co., Ltd.,
6.000%, due 08/15/13 | | $ | 900,261 |
| | 345,000 | | C | | Parker Hannifin Corp.,
5.500%, due 05/15/18 | | | 353,418 |
| | 200,000 | | @@, #, C | | Siemens Financieringsmaatschappij NV,
6.125%, due 08/17/26 | | | 203,969 |
| | | | | | | | |
| | | | | | | | 4,594,665 |
| | | | | | | | |
| Multi-National: 0.8% | | | |
| | 6,040,000 | | @@ | | European Investment Bank,
2.625%, due 05/16/11 | | | 6,198,345 |
| | 2,620,000 | | @@ | | European Investment Bank,
3.125%, due 06/04/14 | | | 2,628,497 |
| | | | | | | | |
| | | | | | | | 8,826,842 |
| | | | | | | | |
| Office/Business Equipment: 0.3% | | | |
| | 3,625,000 | | C | | Xerox Corp.,
5.500%, due 05/15/12 | | | 3,617,442 |
| | | | | | | | |
| | | | | | | | 3,617,442 |
| | | | | | | | |
| Oil & Gas: 1.3% | | | |
| | 2,160,000 | | C | | Anadarko Petroleum Corp.,
5.950%, due 09/15/16 | | | 2,134,184 |
| | 1,370,000 | | @@, C | | Canadian Natural Resources Ltd.,
6.250%, due 03/15/38 | | | 1,372,028 |
| | 1,450,000 | | C | | ConocoPhillips,
5.750%, due 02/01/19 | | | 1,526,780 |
| | 1,750,000 | | C | | Devon Energy Corp.,
5.625%, due 01/15/14 | | | 1,845,506 |
| | 55,000 | | @@, C | | EnCana Corp.,
6.625%, due 08/15/37 | | | 57,129 |
| | 2,000,000 | | C | | Hess Corp.,
8.125%, due 02/15/19 | | | 2,280,804 |
| | 1,550,000 | | C | | Marathon Oil Corp.,
6.000%, due 10/01/17 | | | 1,580,797 |
| | 715,000 | | @@, C | | Nexen, Inc.,
6.400%, due 05/15/37 | | | 658,727 |
| | 1,450,000 | | @@, C | | Suncor Energy, Inc.,
6.500%, due 06/15/38 | | | 1,369,374 |
| | 1,375,000 | | C | | Valero Energy Corp.,
6.625%, due 06/15/37 | | | 1,176,424 |
| | 1,091,000 | | C | | XTO Energy, Inc., 6.100%, due 04/01/36 | | | 1,060,774 |
| | | | | | | | |
| | | | | | | | 15,062,527 |
| | | | | | | | |
| Oil & Gas Services: 0.1% |
| | 965,000 | | @@, C | | Weatherford International Ltd.,
7.000%, due 03/15/38 | | | 931,950 |
| | | | | | | | |
| | | | | | | | 931,950 |
| | | | | | | | |
| Pharmaceuticals: 0.8% |
| | 1,725,000 | | @@, C | | AstraZeneca PLC, 5.400%, due 09/15/12 | | | 1,872,667 |
| | 250,000 | | C | | Bristol-Myers Squibb Co., 5.250%, due 08/15/13 | | | 266,252 |
| | 2,825,000 | | C | | Express Scripts, Inc., 5.250%, due 06/15/12 | | | 2,920,643 |
See Accompanying Notes to Financial Statements
88
| | |
| ING U.S. BOND INDEX PORTFOLIO | | PORTFOLIO OF INVESTMENTS AS OF JUNE 30, 2009 (UNAUDITED) (CONTINUED) |
| | | | | | | | |
Principal
Amount | | | | | | Value |
| | | | | | | | |
| Pharmaceuticals: (continued) |
| $ | 2,585,000 | | C | | Pfizer, Inc., 5.350%, due 03/15/15 | | $ | 2,781,258 |
| | 690,000 | | C | | Wyeth,
5.950%, due 04/01/37 | | | 716,283 |
| | | | | | | | |
| | | | | | | | 8,557,103 |
| | | | | | | | |
| Pipelines: 0.9% |
| | 1,900,000 | | #, C | | DCP Midstream LLC,
6.750%, due 09/15/37 | | | 1,582,835 |
| | 1,800,000 | | C | | Enterprise Products Operating L.P.,
6.300%, due 09/15/17 | | | 1,811,795 |
| | 475,000 | | C | | Enterprise Products Operating L.P.,
6.500%, due 01/31/19 | | | 483,598 |
| | 1,425,000 | | C | | Kinder Morgan Energy Partners LP,
6.950%, due 01/15/38 | | | 1,384,573 |
| | 1,981,000 | | #, C | | NGPL PipeCo, LLC, 6.514%, due 12/15/12 | | | 2,078,059 |
| | 1,325,000 | | C | | ONEOK Partners L.P., 6.850%, due 10/15/37 | | | 1,263,285 |
| | 1,105,000 | | C | | TEPPCO Partners L.P., 7.550%, due 04/15/38 | | | 1,150,827 |
| | | | | | | | |
| | | | | | | | 9,754,972 |
| | | | | | | | |
| Real Estate: 0.3% |
| | 1,600,000 | | C | | Simon Property Group LP, 5.250%, due 12/01/16 | | | 1,423,362 |
| | 2,175,000 | | #, C | | WEA Finance LLC, 7.500%, due 06/02/14 | | | 2,158,751 |
| | | | | | | | |
| | | | | | | | 3,582,113 |
| | | | | | | | |
| Retail: 0.4% |
| | 940,000 | | C | | CVS Caremark Corp., 6.250%, due 06/01/27 | | | 956,705 |
| | 1,225,000 | | C | | Home Depot, Inc., 5.875%, due 12/16/36 | | | 1,084,208 |
| | 1,550,000 | | C | | Target Corp., 6.500%, due 10/15/37 | | | 1,573,000 |
| | 55,000 | | | | Wal-Mart Stores, Inc., 4.500%, due 07/01/15 | | | 57,417 |
| | 855,000 | | | | Wal-Mart Stores, Inc., 6.500%, due 08/15/37 | | | 958,657 |
| | | | | | | | |
| | | | | | | | 4,629,987 |
| | | | | | | | |
| Software: 0.1% |
| | 1,670,000 | | | | Oracle Corp., 6.125%, due 07/08/39 | | | 1,658,878 |
| | | | | | | | |
| | | | | | | | 1,658,878 |
| | | | | | | | |
| Telecommunications: 2.6% |
| | 2,025,000 | | C | | AT&T, Inc., 6.500%, due 09/01/37 | | | 2,014,930 |
| | 1,080,000 | | @@,
C | | British Telecommunications PLC,
9.625%, due 12/15/30 | | | 1,200,221 |
| | 885,000 | | C | | Cisco Systems, Inc., 5.900%, due 02/15/39 | | | 874,561 |
| | 1,135,000 | | @@ | | Deutsche Telekom
International Finance BV,
8.750%, due 06/15/30 | | | 1,332,223 |
| | | | | | | | |
Principal
Amount | | | | | | Value |
| | | | | | | | |
| Telecommunications: (continued) |
| $ | 710,000 | | C | | Embarq Corp., 7.082%, due 06/01/16 | | $ | 694,310 |
| | 2,075,000 | | @@, C | | France Telecom SA, 4.375%, due 07/08/14 | | | 2,093,474 |
| | 1,875,000 | | @@, C | | France Telecom SA, 7.750%, due 03/01/11 | | | 2,028,668 |
| | 175,000 | | C | | Motorola, Inc., 6.000%, due 11/15/17 | | | 142,846 |
| | 4,030,000 | | C | | New Cingular Wireless Services, Inc.,
7.875%, due 03/01/11 | | | 4,347,915 |
| | 2,000,000 | | C | | Qwest Corp., 8.875%, due 03/15/12 | | | 2,025,000 |
| | 2,220,000 | | @@, C | | Rogers Cable, Inc., 5.500%, due 03/15/14 | | | 2,304,906 |
| | 1,385,000 | | @@, C | | Telecom Italia Capital SA, 5.250%, due 10/01/15 | | | 1,338,741 |
| | 1,325,000 | | @@, C | | Telefonica Europe BV, 8.250%, due 09/15/30 | | | 1,644,966 |
| | 500,000 | | C | | Verizon Communications, Inc.,
5.350%, due 02/15/11 | | | 521,540 |
| | 2,475,000 | | C | | Verizon Communications, Inc.,
6.350%, due 04/01/19 | | | 2,579,396 |
| | 825,000 | | C | | Verizon Communications, Inc.,
7.750%, due 12/01/30 | | | 923,874 |
| | 170,000 | | #, C | | Verizon Wireless, 8.500%, due 11/15/18 | | | 203,507 |
| | 1,000,000 | | #, C | | Verizon Wireless Capital LLC, 5.550%, due 02/01/14 | | | 1,062,699 |
| | 2,025,000 | | @@, C | | Vodafone Group PLC, 5.625%, due 02/27/17 | | | 2,059,911 |
| | | | | | | | |
| | | | | | | | 29,393,688 |
| | | | | | | | |
| Transportation: 0.4% |
| | 300,000 | | @@, C | | Canadian National Railway Co.,
6.375%, due 11/15/37 | | | 329,724 |
| | 800,000 | | C | | FedEx Corp., 7.375%, due 01/15/14 | | | 864,830 |
| | 2,335,000 | | C | | Norfolk Southern Corp., 5.900%, due 06/15/19 | | | 2,424,447 |
| | 1,380,000 | | C | | United Parcel Service, 3.875%, due 04/01/14 | | | 1,424,563 |
| | | | | | | | |
| | | | | | | | 5,043,564 |
| | | | | | | | |
| | | | | Total Corporate Bonds/Notes (Cost $244,617,960) | | | 255,338,453 |
| | | | | | | | |
| U.S. GOVERNMENT AGENCY OBLIGATIONS: 44.8% |
| Federal Home Loan Mortgage Corporation##: 12.8% |
| | 20,310,000 | | | | 1.625%, due 07/27/11 | | | 20,432,124 |
| | 1,405,000 | | | | 1.750%, due 06/15/12 | | | 1,400,896 |
| | 11,445,000 | | | | 2.125%, due 03/23/12 | | | 11,556,108 |
| | 7,750,000 | | | | 2.500%, due 01/07/14 | | | 7,682,676 |
| | 3,060,000 | | | | 3.750%, due 03/27/19 | | | 3,012,965 |
| | 1,025,000 | | | | 4.125%, due 07/14/11 | | | 1,026,308 |
| | 2,057,536 | | | | 4.500%, due 11/15/12 - 04/01/23 | | | 2,203,842 |
| | 435,538 | | | | 4.981%, due 08/01/38 | | | 452,232 |
See Accompanying Notes to Financial Statements
89
| | |
| ING U.S. BOND INDEX PORTFOLIO | | PORTFOLIO OF INVESTMENTS AS OF JUNE 30, 2009 (UNAUDITED) (CONTINUED) |
| | | | | | | | |
Principal
Amount | | | | | | Value |
| | | | | | | | |
| Federal Home Loan Mortgage Corporation##: (continued) |
| $ | 7,660,000 | | W | | 5.000%, due 07/15/35 | | $ | 7,790,457 |
| | 22,331,117 | | | | 5.000%, due 03/01/34 - 10/01/35 | | | 22,806,109 |
| | 222,378 | | | | 5.095%, due 08/01/36 | | | 231,115 |
| | 395,000 | | | | 5.375%, due 05/18/16 | | | 439,596 |
| | 9,575,000 | | W | | 5.500%, due 07/15/34 | | | 9,884,694 |
| | 28,393,436 | | | | 5.500%, due 09/01/34 - 07/01/36 | | | 29,382,266 |
| | 370,000 | | | | 5.550%, due 10/04/16 | | | 395,512 |
| | 95,000 | | | | 5.625%, due 06/11/21 | | | 99,987 |
| | 1,710,319 | | | | 5.692%, due 05/01/37 | | | 1,795,295 |
| | 14,290,227 | | | | 6.000%, due 04/01/36 - 12/01/38 | | | 14,934,065 |
| | 7,092,186 | | | | 6.500%, due 07/15/34 - 12/01/38 | | | 7,541,739 |
| | 1,865,000 | | | | 6.750%, due 03/15/31 | | | 2,319,252 |
| | | | | | | | |
| | | | | | | | 145,387,238 |
| | | | | | | | |
| Federal National Mortgage Association##: 29.1% |
| | 5,610,000 | | | | 1.875%, due 04/20/12 | | | 5,636,648 |
| | 3,050,000 | | | | 2.750%, due 03/13/14 | | | 3,046,807 |
| | 2,650,000 | | | | 3.250%, due 04/09/13 | | | 2,753,914 |
| | 2,865,000 | | W | | 4.000%, due 07/17/18 | | | 2,865,894 |
| | 2,449,592 | | | | 4.000%, due 11/01/20 - 03/01/24 | | | 2,454,788 |
| | 4,585,000 | | | | 4.375%, due 10/15/15 | | | 4,852,429 |
| | 29,805,000 | | W | | 4.500%, due 07/25/18 - 07/15/35 | | | 29,892,213 |
| | 24,569,269 | | | | 4.500%, due 02/01/23 - 04/01/39 | | | 24,802,917 |
| | 6,115,000 | | | | 4.625%, due 10/15/13 - 10/15/14 | | | 6,606,968 |
| | 155,000 | | | | 4.750%, due 04/19/10 | | | 160,039 |
| | 406,458 | | | | 4.797%, due 12/01/35 | | | 413,783 |
| | 406,638 | | | | 4.822%, due 09/01/35 | | | 417,926 |
| | 15,040,000 | | W | | 5.000%, due 07/18/21 - 07/01/37 | | | 15,409,603 |
| | 185,000 | | | | 5.000%, due 04/26/17 | | | 188,095 |
| | 41,646,984 | | | | 5.000%, due 03/15/16 - 12/01/36 | | | 42,723,085 |
| | 8,025,000 | | | | 5.375%, due 06/12/17 | | | 8,968,162 |
| | 946,264 | | | | 5.460%, due 12/01/36 | | | 990,900 |
| | 1,162,173 | | | | 5.488%, due 11/01/36 | | | 1,218,514 |
| | 30,779,148 | | W | | 5.500%, due 07/01/22 - 07/15/34 | | | 32,013,751 |
| | 52,660,672 | | | | 5.500%, due 04/01/21 - 03/01/37 | | | 54,605,634 |
| | 92,287 | | | | 5.706%, due 10/01/37 | | | 95,490 |
| | 2,726,040 | | | | 5.806%, due 06/01/37 | | | 2,865,198 |
| | 20,340,904 | | W | | 6.000%, due 03/01/36 - 11/01/37 | | | 21,268,984 |
| | 36,594,641 | | | | 6.000%, due 08/01/21 - 05/01/38 | | | 38,306,897 |
| | 308,216 | | | | 6.029%, due 09/01/37 | | | 321,789 |
| | 20,000 | | | | 6.210%, due 08/06/38 | | | 22,859 |
| | 6,165,000 | | W | | 6.500%, due 07/15/33 | | | 6,566,687 |
| | 13,011,412 | | | | 6.500%, due 04/01/30 - 09/01/38 | | | 13,879,883 |
| | 840,000 | | | | 6.625%, due 11/15/30 | | | 1,031,998 |
| | 4,768,819 | | | | 7.000%, due 10/01/34 - 02/01/39 | | | 5,182,615 |
| | 380,000 | | | | 7.125%, due 01/15/30 | | | 491,595 |
| | | | | | | | |
| | | | | | | | 330,056,065 |
| | | | | | | | |
| Government National Mortgage Association: 2.9% |
| | 8,360,000 | | W | | 5.000%, due 07/15/33 | | | 8,523,279 |
| | 217,252 | | | | 5.000%, due 10/15/37 | | | 222,080 |
| | 9,500,000 | | W | | 5.500%, due 07/15/33 | | | 9,810,232 |
| | 5,320,197 | | | | 5.500%, due 09/15/33 - 01/15/39 | | | 5,505,662 |
| | 7,686,746 | | | | 6.000%, due 07/15/33 - 05/15/38 | | | 8,009,792 |
| | 129,132 | | | | 7.000%, due 12/15/37 | | | 138,680 |
| | | | | | | | |
| | | | | | | | 32,209,725 |
| | | | | | | | |
| Other U.S. Agency Obligations: 0.0% |
| | 75,000 | | | | Federal Farm Credit Bank, 5.125%, due 08/25/16 | | | 81,844 |
| | | | | | | | |
Principal
Amount | | | | | | Value |
| | | | | | | | |
| Other U.S. Agency Obligations: (continued) |
| $ | 10,000 | | | | Tennessee Valley Authority, 6.150%, due 01/15/38 | | $ | 10,982 |
| | | | | | | | |
| | | | | | | | 92,826 |
| | | | | | | | |
| | | | | Total U.S. Government Agency Obligations
(Cost $504,008,513) | | | 507,745,854 |
| | | | | | | | |
| U.S. TREASURY OBLIGATIONS: 25.3% |
| U.S. Treasury Bonds: 11.7% |
| | 6,995,000 | | | | 3.500%, due 02/15/18 | | | 7,031,619 |
| | 29,835,000 | | | | 3.875%, due 09/15/10 | | | 31,014,437 |
| | 14,075,000 | | | | 4.250%, due 11/15/13 - 11/15/17 | | | 15,091,131 |
| | 12,715,000 | | | | 4.375%, due 02/15/38 | | | 12,844,146 |
| | 19,040,000 | | | | 4.500%, due 11/15/15 - 02/15/36 | | | 20,310,961 |
| | 15,085,000 | | | | 5.125%, due 05/15/16 | | | 16,923,499 |
| | 985,000 | | | | 5.375%, due 02/15/31 | | | 1,130,904 |
| | 8,385,000 | | | | 6.000%, due 02/15/26 | | | 10,115,723 |
| | 6,730,000 | | | | 6.875%, due 08/15/25 | | | 8,819,456 |
| | 5,740,000 | | | | 7.125%, due 02/15/23 | | | 7,502,364 |
| | 1,290,000 | | | | 8.125%, due 08/15/19 | | | 1,769,115 |
| | 65,000 | | | | 8.125%, due 08/15/21 | | | 90,218 |
| | | | | | | | |
| | | | | | | | 132,643,573 |
| | | | | | | | |
| U.S. Treasury Notes: 13.6% |
| | 29,475,000 | | | | 1.125%, due 01/15/12 | | | 29,295,409 |
| | 5,680,000 | | | | 1.375%, due 05/15/12 | | | 5,649,603 |
| | 9,575,000 | | | | 1.500%, due 12/31/13 | | | 9,225,666 |
| | 46,760,000 | | | | 1.750%, due 03/31/10 - 11/15/11 | | | 47,243,485 |
| | 9,850,000 | | | | 2.375%, due 03/31/16 | | | 9,393,668 |
| | 13,180,000 | | | | 2.750%, due 02/28/13 | | | 13,559,966 |
| | 790,000 | | | | 3.125%, due 08/31/13 | | | 818,761 |
| | 11,330,000 | | | | 3.500%, due 05/31/13 | | | 11,940,766 |
| | 9,350,000 | | | | 4.000%, due 08/15/18 | | | 9,701,364 |
| | 15,680,000 | | | | 4.750%, due 01/31/12 - 05/31/12 | | | 17,086,673 |
| | | | | | | | |
| | | | | | | | 153,915,361 |
| | | | | | | | |
| | | | | Total U.S. Treasury Obligations
(Cost $289,321,176) | | | 286,558,934 |
| | | | | | | | |
| COLLATERALIZED MORTGAGE OBLIGATIONS: 3.4% |
| | 1,000,000 | | C | | Banc of America Commercial Mortgage, Inc., 5.414%, due 09/10/47 | | | 799,982 |
| | 1,100,000 | | C | | Banc of America Commercial Mortgage, Inc., 5.449%, due 01/15/49 | | | 854,973 |
| | 2,240,000 | | C | | Banc of America Commercial Mortgage, Inc., 5.634%, due 07/10/46 | | | 1,773,642 |
| | 450,000 | | C | | Banc of America Commercial Mortgage, Inc., 5.837%, due 06/10/49 | | | 319,741 |
| | 1,500,000 | | C | | Banc of America Commercial Mortgage, Inc., 5.889%, due 07/10/44 | | | 1,195,233 |
| | 1,200,000 | | C | | Citigroup Commercial Mortgage Trust,
4.380%, due 10/15/41 | | | 1,102,545 |
| | 3,250,000 | | C | | Citigroup/Deutsche Bank Commercial Mortgage Trust, 5.886%, due 11/15/44 | | | 2,599,859 |
See Accompanying Notes to Financial Statements
90
| | |
| ING U.S. BOND INDEX PORTFOLIO | | PORTFOLIO OF INVESTMENTS AS OF JUNE 30, 2009 (UNAUDITED) (CONTINUED) |
| | | | | | | | |
Principal
Amount | | | | | | Value |
| | | | | | | | |
| COLLATERALIZED MORTGAGE OBLIGATIONS: (continued) |
| $ | 2,500,000 | | C | | Commercial Mortgage Pass-through Certificates, 5.306%, due 12/10/46 | | $ | 1,829,570 |
| | 2,825,000 | | C | | Continental Airlines, Inc., 5.983%, due 04/19/22 | | | 2,330,625 |
| | 287,506 | | C | | Credit Suisse Mortgage Capital Certificates, 5.250%, due 03/15/39 | | | 290,216 |
| | 2,000,000 | | C | | Credit Suisse Mortgage Capital Certificates, 5.311%, due 12/15/39 | | | 1,376,512 |
| | 1,650,000 | | C | | Credit Suisse Mortgage Capital Certificates, 5.448%, due 01/15/49 | | | 1,523,504 |
| | 1,750,000 | | C | | Credit Suisse Mortgage Capital Certificates, 5.912%, due 06/15/39 | | | 1,196,300 |
| | 1,400,000 | | C | | Credit Suisse Mortgage Capital Certificates, 6.004%, due 09/15/39 | | | 958,846 |
| | 3,170,000 | | C | | CW Capital Cobalt Ltd., 6.015%, due 05/15/46 | | | 2,185,918 |
| | 3,000,000 | | C | | GE Capital Commercial Mortgage Corp.,
5.513%, due 11/10/45 | | | 2,532,186 |
| | 3,000,000 | | C | | Greenwich Capital Commercial Funding Corp., 5.381%, due 03/10/39 | | | 2,821,315 |
| | 1,500,000 | | C | | Greenwich Capital Commercial Funding Corp., 6.115%, due 07/10/38 | | | 1,234,520 |
| | 500,000 | | C | | JPMorgan Chase Commercial Mortgage Securities Corp., 4.871%, due 10/15/42 | | | 458,032 |
| | 1,155,000 | | C | | JPMorgan Chase Commercial Mortgage Securities Corp., 5.038%, due 03/15/46 | | | 1,008,955 |
| | 487,653 | | C | | JPMorgan Chase Commercial Mortgage Securities Corp., 5.284%, due 05/15/47 | | | 451,852 |
| | 500,000 | | C | | JPMorgan Chase Commercial Mortgage Securities Corp., 5.434%, due 01/15/49 | | | 424,944 |
| | 1,775,000 | | C | | JPMorgan Chase Commercial Mortgage Securities Corp., 5.440%, due 06/12/47 | | | 1,341,439 |
| | 500,000 | | C | | JPMorgan Chase Commercial Mortgage Securities Corp., 5.827%, due 02/15/51 | | | 444,553 |
| | 2,000,000 | | C | | JPMorgan Chase Commercial Mortgage Securities Corp., 5.935%, due 02/12/49 | | | 1,517,934 |
| | 1,255,000 | | C | | JPMorgan Chase Commercial Mortgage Securities Corp., 6.125%, due 02/12/51 | | | 1,088,027 |
| | 3,000,000 | | C | | LB-UBS Commercial Mortgage Trust,
5.858%, due 07/15/40 | | | 2,186,470 |
| | 229,072 | | C | | Merrill Lynch/Countrywide Commercial Mortgage Trust, 5.773%, due 06/12/46 | | | 231,634 |
| | | | | | | | |
Principal
Amount | | | | | | Value |
| | | | | | | | |
| COLLATERALIZED MORTGAGE OBLIGATIONS: (continued) |
| $ | 410,000 | | C | | Merrill Lynch/Countrywide Commercial Mortgage Trust, 6.156%, due 08/12/49 | | $ | 284,371 |
| | 1,460,000 | | C | | Morgan Stanley Capital I, 5.811%, due 04/12/49 | | | 1,047,360 |
| | 167,426 | | C | | Salomon Brothers Mortgage Securities VII, Inc., 4.467%, due 03/18/36 | | | 165,988 |
| | 1,500,000 | | C | | Wachovia Bank Commercial Mortgage Trust, 5.509%, due 04/15/47 | | | 999,266 |
| | | | | | | | |
| | | | | Total Collateralized Mortgage Obligations
(Cost $37,204,036) | | | 38,576,312 |
| | | | | | | | |
| MUNICIPAL BONDS: 0.1% |
| California: 0.1% |
| | 1,315,000 | | | | State of California, 7.550%, due 04/01/39 | | | 1,201,805 |
| | | | | | | | |
| | | | | Total Municipal Bonds
(Cost $1,333,065) | | | 1,201,805 |
| | | | | | | | |
| OTHER BONDS: 0.4% |
| Foreign Government Bonds: 0.4% |
| | 2,050,000 | | | | Mexico Government International Bond, 6.375%, due 01/16/13 | | | 2,224,250 |
| | 780,000 | | | | Province of Ontario Canada, 3.125%, due 09/08/10 | | | 796,534 |
| | 465,000 | | | | Province of Quebec Canada, 7.125%, due 02/09/24 | | | 529,124 |
| | 850,000 | | | | Republic of Italy, 3.500%, due 07/15/11 | | | 877,808 |
| | | | | | | | |
| | | | | Total Other Bonds
(Cost $4,345,996) | | | 4,427,716 |
| | | | | | | | |
| | | | | Total Long-Term Investments
(Cost $1,080,830,746) | | | 1,093,849,074 |
| | | | | | | | |
| | | |
| Shares | | | | | | Value |
| SHORT-TERM INVESTMENTS: 19.5% |
| Affiliated Mutual Fund: 14.2% |
| | 160,786,392 | | | | ING Institutional Prime Money Market Fund - Class I | | $ | 160,786,392 |
| | | | | | | | |
| | | | | Total Mutual Fund
(Cost $160,786,392) | | | 160,786,392 |
| | | | | | | | |
See Accompanying Notes to Financial Statements
91
| | |
| ING U.S. BOND INDEX PORTFOLIO | | PORTFOLIO OF INVESTMENTS AS OF JUNE 30, 2009 (UNAUDITED) (CONTINUED) |
| | | | | | | | | | | | |
Principal
Amount | | | | | | | | | Value | |
| U.S. Government Agency Obligations: 5.3% | |
| $ | 60,000,000 | | Z | | Federal Home Loan
Bank,
0.240%, due 12/21/09 | | | | | $ | 59,929,380 | |
| | | | | | | | | | | | |
| | | | | Total U.S. Government Agency Obligations
(Cost $59,907,734) | | | | | | 59,929,380 | |
| | | | | | | | | | | | |
| | | | | Total Short-Term Investments
(Cost $220,694,126) | | | | | | 220,715,772 | |
| | | | | | | | | | | | |
| | | | | Total Investments in Securities
(Cost $1,301,524,872)* | | 116.0 | % | | $ | 1,314,564,846 | |
| | | | | Other Assets and Liabilities - Net | | (16.0 | ) | | | (181,246,002 | ) |
| | | | | | | | | | | | |
| | | | | Net Assets | | 100.0 | % | | $ | 1,133,318,844 | |
| | | | | | | | | | | | |
| # | Securities with purchases pursuant to Rule 144A or section 4(2), under the Securities Act of 1933 and may not be resold subject to that rule except to qualified institutional buyers. Unless otherwise noted, these securities have been determined to be liquid under the guidelines established by the Funds’ Board of Directors/Trustees. |
| C | Bond may be called prior to maturity date. |
| ## | On September 7, 2008, the Federal Housing Finance Agency placed the Federal National Mortgage Association and the Federal Home Loan Mortgage Corporation into conservatorship and the U.S. Treasury guaranteed the debt issued by those organizations. |
| W | Settlement is on a when-issued or delayed-delivery basis. |
| Z | Indicates Zero Coupon Bond; rate shown reflects current effective yield. |
| * | Cost for federal income tax purposes is $1,304,017,507. |
| | | | |
Net unrealized appreciation consists of: | | | | |
Gross Unrealized Appreciation | | $ | 18,439,261 | |
Gross Unrealized Depreciation | | | (7,891,922 | ) |
| | | | |
Net Unrealized Appreciation | | $ | 10,547,339 | |
| | | | |
Fair Value Measurements*
The following is a summary of the inputs used as of June 30, 2009 in determining the Portfolio’s investments at fair value for purposes of SFAS 157:
| | | | | | | | | |
| | | Quoted Prices in
Active Markets
for Identical
Investments
(Level 1) | | Significant
Other
Observable
Inputs
(Level 2) | | Significant
Unobservable
Inputs
(Level 3) |
Corporate Bonds/Notes | | $ | — | | $ | 255,338,453 | | $ | — |
U.S. Government Agency Obligations | | | — | | | 507,745,854 | | | — |
U.S. Treasury Obligations | | | — | | | 286,558,934 | | | — |
Collateralized Mortgage Obligations | | | — | | | 38,576,312 | | | — |
Municipal Bonds | | | — | | | 1,201,805 | | | — |
Other Bonds | | | — | | | 4,427,716 | | | — |
Short-Term Investments | | | 160,786,392 | | | 59,929,380 | | | — |
| | | | | | | | | |
Total | | $ | 160,786,392 | | $ | 1,153,778,454 | | $ | — |
| | | | | | | | | |
Other Financial Instruments** | | | — | | | — | | | — |
| | | | | | | | | |
Total | | $ | — | | $ | — | | $ | — |
| | | | | | | | | |
“Fair value” for purposes of SFAS 157 is different from “fair value” as used in the 1940 Act. The former generally implies market value, and can include market quotations as a source of value, and the latter refers to determinations of value in absence of available market quotations.
| * | See NOTE 2, “Significant Accounting Policies” in the Notes to Financial Statements for additional information. |
| ** | Other financial instruments may include open forward foreign currency contracts, futures, swaps, and written options. Forward foreign currency contracts and futures are reported at their unrealized gain/loss at period end. Swaps and written options are reported at their market value at period end. |
See Accompanying Notes to Financial Statements
92
| | |
| ING HANG SENG INDEX PORTFOLIO | | PORTFOLIO OF INVESTMENTS AS OF JUNE 30, 2009 (UNAUDITED) |
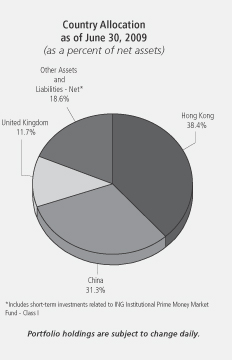
| | | | | | | |
| Shares | | | | | | Value |
| | | | | | | |
| | | | | | | |
COMMON STOCK: 81.4% | | | |
China: 31.3% | | | |
| 58,000 | | | | Aluminum Corp. of China Ltd. | | $ | 54,279 |
| 1,038,000 | | S | | Bank of China Ltd. | | | 491,538 |
| 210,000 | | | | Bank of Communications Co. Ltd. | | | 233,633 |
| 1,023,000 | | | | China Construction Bank | | | 788,263 |
| 113,000 | | | | China Life Insurance Co., Ltd. | | | 415,298 |
| 256,000 | | | | China Petroleum & Chemical Corp. | | | 193,823 |
| 51,500 | | | | China Shenhua Energy Co., Ltd. | | | 188,149 |
| 32,000 | | @ | | Foxconn International Holdings Ltd. | | | 20,805 |
| 693,000 | | | | Industrial and Commercial Bank of China Ltd. | | | 480,032 |
| 318,000 | | | | PetroChina Co., Ltd. | | | 351,409 |
| 21,500 | | | | Ping An Insurance Group Co. of China Ltd. | | | 144,309 |
| 15,000 | | | | Tencent Holdings Ltd. | | | 174,039 |
| | | | | | | |
| | | | | | | 3,535,577 |
| | | | | | | |
Hong Kong: 38.4% | | | |
| 28,000 | | | | Bank of East Asia Ltd. | | | 84,857 |
| 56,500 | | | | BOC Hong Kong Holdings Ltd. | | | 98,305 |
| 18,000 | | | | Cathay Pacific Airways Ltd. | | | 24,694 |
| 21,000 | | | | Cheung Kong Holdings Ltd. | | | 240,117 |
| 18,000 | | | | China Merchants Holdings International Co., Ltd. | | | 51,555 |
| 91,500 | | | | China Mobile Ltd. | | | 916,135 |
| 62,000 | | | | China Overseas Land & Investment Ltd. | | | 143,095 |
| 18,000 | | | | China Resources Enterprise | | | 35,911 |
| 22,300 | | | | China Resources Power Holdings Co. | | | 49,323 |
| 108,000 | | | | China Unicom Ltd. | | | 143,600 |
| 17,000 | | @ | | Citic Pacific Ltd. | | | 35,012 |
| 27,500 | | | | CLP Holdings Ltd. | | | 182,220 |
| | | | | | | |
| Shares | | | | | | Value |
| | | | | | | |
Hong Kong: (continued) | | | |
| 271,000 | | | | CNOOC Ltd. | | $ | 333,832 |
| 18,000 | | | | Cosco Pacific Ltd. | | | 20,155 |
| 17,900 | | S | | Esprit Holdings Ltd. | | | 99,449 |
| 32,000 | | | | Hang Lung Properties Ltd. | | | 105,377 |
| 11,700 | | | | Hang Seng Bank Ltd. | | | 163,755 |
| 16,000 | | | | Henderson Land Development Co., Ltd. | | | 91,300 |
| 60,000 | | | | Hong Kong & China Gas | | | 125,951 |
| 16,400 | | | | Hong Kong Exchanges and Clearing Ltd. | | | 253,487 |
| 21,000 | | | | HongKong Electric Holdings | | | 116,658 |
| 32,000 | | | | Hutchison Whampoa Ltd. | | | 208,165 |
| 40,000 | | | | Li & Fung Ltd. | | | 106,801 |
| 21,500 | | | | MTR Corp. | | | 64,229 |
| 38,000 | | | | New World Development Ltd. | | | 68,401 |
| 36,000 | | | | Sino Land Co. | | | 59,265 |
| 23,000 | | | | Sun Hung Kai Properties Ltd. | | | 285,609 |
| 13,500 | | | | Swire Pacific Ltd. | | | 135,512 |
| 21,000 | | | | Wharf Holdings Ltd. | | | 88,542 |
| | | | | | | |
| | | | | | | 4,331,312 |
| | | | | | | |
United Kingdom: 11.7% | | | |
| 157,600 | | | | HSBC Holdings PLC - Hong Kong | | | 1,314,980 |
| | | | | | | |
| | | | | | | 1,314,980 |
| | | | | | | |
| | | | Total Common Stock
(Cost $8,659,456) | | | 9,181,869 |
| | | | | | | |
RIGHTS: 0.0% | | | |
Hong Kong: 0.0% | | | |
| 1,830 | | | | China Resources Power Holdings Co. | | | 779 |
| | | | | | | |
| | | | Total Rights
(Cost $—) | | | 779 |
| | | | | | | |
| | | | Total Long-Term Investments
(Cost $8,659,456) | | | 9,182,648 |
| | | | | | | |
| | | | | | | | | | |
SHORT-TERM INVESTMENTS: 9.1% | | | | | | |
Affiliated Mutual Fund: 9.1% | | | | | | |
| 1,021,000 | | S | | ING Institutional Prime Money Market Fund - Class I | | | | | | 1,021,000 |
| | | | | | | | | | |
| | | | Total Short-Term Investments (Cost $1,021,000) | | | | | | 1,021,000 |
| | | | | | | | | | |
| | | | Total Investments in Securities
(Cost $9,680,456)* | | 90.5 | % | | $ | 10,203,648 |
| | | | Other Assets and Liabilities - Net | | 9.5 | | | | 1,072,981 |
| | | | | | | | | | |
| | | | Net Assets | | 100.0 | % | | $ | 11,276,629 |
| | | | | | | | | | |
| @ | Non-income producing security |
| S | All or a portion of this security is segregated to cover collateral requirements for applicable futures, options, swaps, foreign forward currency contracts and/or when-issued or delayed-delivery securities. |
| * | Cost for federal income tax purposes is $9,740,966. |
| | | | |
Net unrealized appreciation consists of: | | | | |
Gross Unrealized Appreciation | | $ | 581,300 | |
Gross Unrealized Depreciation | | | (118,618 | ) |
| | | | |
Net Unrealized Appreciation | | $ | 462,682 | |
| | | | |
See Accompanying Notes to Financial Statements
93
| | |
| ING HANG SENG INDEX PORTFOLIO | | PORTFOLIO OF INVESTMENTS AS OF JUNE 30, 2009 (UNAUDITED) (CONTINUED) |
| | | |
Industry | | Percentage of
Net Assets | |
Airlines | | 0.2 | % |
Banks | | 32.4 | |
Coal | | 1.7 | |
Commercial Services | | 0.2 | |
Distribution/Wholesale | | 0.9 | |
Diversified Financial Services | | 2.2 | |
Electric | | 3.1 | |
Gas | | 1.1 | |
Holding Companies - Diversified | | 4.6 | |
Insurance | | 5.0 | |
Internet | | 1.5 | |
Iron/Steel | | 0.3 | |
Mining | | 0.5 | |
Oil & Gas | | 7.8 | |
Real Estate | | 8.8 | |
Retail | | 0.9 | |
Telecommunications | | 9.6 | |
Transportation | | 0.6 | |
Short-Term Investments | | 9.1 | |
Other Assets and Liabilities - Net | | 9.5 | |
| | | |
Net Assets | | 100.0 | % |
| | | |
Fair Value Measurements*
The following is a summary of the inputs used as of June 30, 2009 in determining the Portfolio’s investments at fair value for purposes of SFAS 157:
| | | | | | | | | |
| | | Quoted Prices in Active Markets for Identical Investments (Level 1) | | Significant Other Observable Inputs (Level 2)† | | Significant Unobservable Inputs (Level 3) |
Common Stock** | | $ | — | | $ | 9,181,869 | | $ | — |
Rights | | | 779 | | | — | | | — |
Short-Term Investments | | | 1,021,000 | | | — | | | — |
| | | | | | | | | |
Total | | $ | 1,021,779 | | $ | 9,181,869 | | $ | — |
| | | | | | | | | |
Other Financial Instruments*** | | | 18,399 | | | — | | | — |
| | | | | | | | | |
Total | | $ | 18,399 | | $ | — | | $ | — |
| | | | | | | | | |
“Fair value” for purposes of SFAS 157 is different from “fair value” as used in the 1940 Act. The former generally implies market value, and can include market quotations as a source of value, and the latter refers to determinations of value in absence of available market quotations.
| * | See NOTE 2, “Significant Accounting Policies” in the Notes to Financial Statements for additional information. |
| ** | For further breakdown of Common Stock, by industry type, please refer to the Portfolio of Investments. |
| *** | Other financial instruments may include open forward foreign currency contracts, futures, swaps, and written options. Forward foreign currency contracts and futures are reported at their unrealized gain/loss at period end. Swaps and written options are reported at their market value at period end. |
| † | The earlier close of the foreign markets gives rise to the possibility that significant events, including broad market moves, may have occurred in the interim and may materially affect the value of those securities. To account for this, the Portfolio may frequently value many of its foreign equity securities using fair value prices based on third party vendor modeling tools to the extent available. Accordingly, a significant portion of the Portfolio’s investments are categorized as Level 2 investments. |
ING Hang Seng Index Portfolio Open Futures Contracts on June 30, 2009:
| | | | | | | |
Contract Description | | Number of Contracts | | Expiration Date | | Unrealized Appreciation |
Long Contracts | | | | | | | |
Hang Seng Index | | 8 | | 07/30/09 | | $ | 18,399 |
| | | | | | | |
| | | | | | $ | 18,399 |
| | | | | | | |
For the six months ended June 30, 2009, net realized gain (loss) on futures and the net change in unrealized gain (loss) on futures can be found on the Portfolio’s Statement of Operations. For additional information on the reason(s) why the Portfolio may enter into futures contracts and the risks associated with futures contracts, please refer to NOTE 2 in the accompanying Notes to Financial Statements.
See Accompanying Notes to Financial Statements
94
| | |
| ING INTERNATIONAL INDEX PORTFOLIO | | PORTFOLIO OF INVESTMENTS AS OF JUNE 30, 2009 (UNAUDITED) |
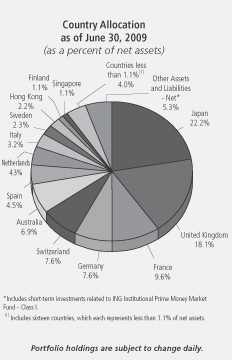
| | | | | | | |
| Shares | | | | | | Value |
| | | | | | | |
COMMON STOCK: 93.5% |
Australia: 6.5% |
| 15,267 | | | | AGL Energy Ltd. | | $ | 165,212 |
| 248,256 | | | | Alumina Ltd. | | | 285,352 |
| 32,958 | | | | Amcor Ltd. | | | 132,526 |
| 130,936 | | | | AMP Ltd. | | | 513,004 |
| 40,350 | | @ | | Arrow Energy NL | | | 114,604 |
| 9,683 | | | | ASX Ltd. | | | 287,697 |
| 141,969 | | | | Australia & New Zealand Banking Group Ltd. | | | 1,881,442 |
| 46,860 | | | | AXA Asia Pacific Holdings Ltd. | | | 146,374 |
| 219,793 | | | | BHP Billiton Ltd. | | | 6,021,427 |
| 115,766 | | | | BlueScope Steel Ltd. | | | 234,739 |
| 31,114 | | | | Boral Ltd. | | | 101,511 |
| 100,606 | | | | Brambles Ltd. | | | 481,669 |
| 34,581 | | | | Coca-Cola Amatil Ltd. | | | 239,659 |
| 2,714 | | | | Cochlear Ltd. | | | 125,979 |
| 94,160 | | | | Commonwealth Bank of Australia | | | 2,951,531 |
| 33,192 | | | | Computershare Ltd. | | | 240,575 |
| 22,311 | | | | Crown Ltd. | | | 130,028 |
| 37,347 | | | | CSL Ltd. | | | 965,652 |
| 47,410 | | @ | | Fortescue Metals Group Ltd. | | | 143,696 |
| 135,391 | | | | Foster’s Group Ltd. | | | 560,981 |
| 92,323 | | | | Goodman Fielder Ltd. | | | 96,851 |
| 120,832 | | | | Incitec Pivot Ltd. | | | 229,955 |
| 141,872 | | | | Insurance Australia Group | | | 400,588 |
| 113,095 | | | | John Fairfax Holdings Ltd. | | | 110,825 |
| 6,178 | | | | Leighton Holdings Ltd. | | | 116,527 |
| 21,583 | | | | Lend Lease Corp., Ltd. | | | 121,459 |
| 15,774 | | | | Lion Nathan Ltd. | | | 146,923 |
| 38,611 | | | | Macquarie Airports Management Ltd. | | | 71,780 |
| 20,526 | | | | Macquarie Group Ltd. | | | 642,600 |
| | | | | | | |
| Shares | | | | | | Value |
| | | | | | | |
Australia: (continued) |
| 108,627 | | | | Macquarie Infrastructure Group | | $ | 124,874 |
| 37,651 | | | | Metcash Ltd. | | | 130,688 |
| 116,949 | | | | National Australia Bank Ltd. | | | 2,106,978 |
| 29,438 | | | | Newcrest Mining Ltd. | | | 719,502 |
| 115,071 | | | | OneSteel Ltd. | | | 237,850 |
| 17,705 | | | | Orica Ltd. | | | 308,146 |
| 59,097 | | | | Origin Energy Ltd. | | | 695,832 |
| 44,156 | | @ | | Paladin Resources Ltd. | | | 173,603 |
| 4,133 | | | | Perpetual Trustees Australia Ltd. | | | 94,776 |
| 64,735 | | | | QBE Insurance Group Ltd. | | | 1,035,894 |
| 18,569 | | | | Rio Tinto Ltd. | | | 775,652 |
| 41,696 | | | | Santos Ltd. | | | 488,536 |
| 12,870 | | | | Sims Group Ltd. | | | 267,990 |
| 14,389 | | | | Sonic Healthcare Ltd. | | | 142,726 |
| 57,597 | | | | Suncorp-Metway Ltd. | | | 309,671 |
| 48,094 | | | | TABCORP Holdings Ltd. | | | 276,787 |
| 51,055 | | | | Tattersall’s Ltd. | | | 104,605 |
| 286,509 | | | | Telstra Corp., Ltd. | | | 781,832 |
| 52,054 | | | | Toll Holdings Ltd. | | | 261,225 |
| 53,768 | | | | Transurban Group | | | 180,659 |
| 62,922 | | | | Wesfarmers Ltd. | | | 1,145,658 |
| 6,578 | | | | Wesfarmers Ltd. - Price Protected Shares | | | 124,317 |
| 183,746 | | S | | Westpac Banking Corp. | | | 2,989,490 |
| 30,204 | | | | Woodside Petroleum Ltd. | | | 1,043,430 |
| 81,700 | | | | Woolworths Ltd. | | | 1,733,344 |
| 12,931 | | | | WorleyParsons Ltd. | | | 246,444 |
| | | | | | | |
| | | | | | | 34,161,675 |
| | | | | | | |
Austria: 0.2% |
| 7,801 | | | | Erste Bank der Oesterreichischen Sparkassen AG | | | 211,784 |
| 3,675 | | | | Oesterreichische Elektrizitaetswirtschafts AG | | | 187,480 |
| 8,146 | | | | OMV AG | | | 306,248 |
| 2,171 | | | | Raiffeisen International Bank Holding AG | | | 75,788 |
| 16,996 | | | | Telekom Austria AG | | | 266,084 |
| 3,627 | | | | Voestalpine AG | | | 99,902 |
| | | | | | | |
| | | | | | | 1,147,286 |
| | | | | | | |
Belgium: 0.8% |
| 44,674 | | | | Anheuser-Busch InBev NV | | | 1,619,860 |
| 8,834 | | | | Belgacom SA | | | 282,500 |
| 556 | | | | Colruyt SA | | | 127,020 |
| 5,190 | | S | | Delhaize Group | | | 365,399 |
| 18,126 | | | | Dexia | | | 138,373 |
| 150,003 | | | | Fortis | | | 513,619 |
| 3,247 | | | | Groupe Bruxelles Lambert SA | | | 238,024 |
| 6,573 | | | | KBC Groep NV | | | 120,873 |
| 1,741 | | | | Mobistar SA | | | 107,498 |
| 1,687 | | | | Nationale A Portefeuille | | | 81,648 |
| 4,408 | | | | Solvay SA | | | 372,902 |
| 5,119 | | | | UCB SA | | | 164,389 |
| 11,423 | | | | Umicore | | | 260,390 |
| | | | | | | |
| | | | | | | 4,392,495 |
| | | | | | | |
Bermuda: 0.1% |
| 20,022 | | | | SeaDrill Ltd. ADR | | | 288,349 |
| | | | | | | |
| | | | | | | 288,349 |
| | | | | | | |
China: 0.0% |
| 174,000 | | @ | | Foxconn International Holdings Ltd. | | | 113,127 |
| | | | | | | |
| | | | | | | 113,127 |
| | | | | | | |
See Accompanying Notes to Financial Statements
95
| | |
| ING INTERNATIONAL INDEX PORTFOLIO | | PORTFOLIO OF INVESTMENTS AS OF JUNE 30, 2009 (UNAUDITED) (CONTINUED) |
| | | | | | | |
| Shares | | | | | | Value |
| | | | | | | |
Cyprus: 0.0% |
| 16,837 | | | | Bank of Cyprus Public Co., Ltd. | | $ | 95,120 |
| | | | | | | |
| | | | | | | 95,120 |
| | | | | | | |
Denmark: 0.9% |
| 39 | | | | AP Moller - Maersk A/S - Class A | | | 228,566 |
| 84 | | | | AP Moller - Maersk A/S - Class B | | | 503,290 |
| 6,658 | | | | Carlsberg A/S | | | 427,114 |
| 22,300 | | | | Danske Bank A/S | | | 384,711 |
| 9,117 | | | | DSV A/S | | | 113,082 |
| 28,717 | | | | Novo-Nordisk A/S | | | 1,564,078 |
| 3,050 | | | | Novozymes A/S | | | 248,129 |
| 775 | | @ | | Topdanmark A/S | | | 90,520 |
| 1,700 | | | | TrygVesta A/S | | | 100,277 |
| 13,365 | | @ | | Vestas Wind Systems A/S | | | 959,135 |
| | | | | | | |
| | | | | | | 4,618,902 |
| | | | | | | |
Finland: 1.1% |
| 6,926 | | | | Elisa OYJ | | | 114,137 |
| 28,786 | | | | Fortum OYJ | | | 656,128 |
| 5,799 | | | | Kone OYJ | | | 178,074 |
| 5,395 | | | | Metso OYJ | | | 100,994 |
| 242,996 | | | | Nokia OYJ | | | 3,559,204 |
| 4,726 | | | | Nokian Renkaat OYJ | | | 88,932 |
| 14,544 | | | | OKO Bank | | | 116,527 |
| 28,239 | | | | Sampo OYJ | | | 533,942 |
| 23,709 | | | | Stora Enso OYJ (Euro Denominated Security) | | | 125,410 |
| 38,338 | | | | UPM-Kymmene OYJ | | | 334,571 |
| 3,477 | | | | Wartsila OYJ | | | 112,270 |
| | | | | | | |
| | | | | | | 5,920,189 |
| | | | | | | |
France: 9.5% |
| 9,892 | | | | Accor SA | | | 394,121 |
| 1,286 | | | | ADP | | | 94,547 |
| 6,677 | | | | Air France-KLM | | | 85,635 |
| 17,452 | | | | Air Liquide | | | 1,601,328 |
| 117,397 | | @ | | Alcatel SA | | | 294,402 |
| 14,171 | | | | Alstom | | | 841,428 |
| 105,990 | | | | AXA SA | | | 2,006,071 |
| 55,341 | | | | BNP Paribas | | | 3,608,933 |
| 16,197 | | | | Bouygues SA | | | 612,540 |
| 6,810 | | | | Capgemini SA | | | 252,035 |
| 40,867 | | | | Carrefour SA | | | 1,752,580 |
| 2,147 | | | | Casino Guichard Perrachon SA | | | 145,407 |
| 2,311 | | | | Christian Dior SA | | | 173,115 |
| 22,756 | | | | Cie de Saint-Gobain | | | 765,689 |
| 13,659 | | | | Cie Generale D’Optique Essilor International SA | | | 653,188 |
| 2,879 | | | | CNP Assurances | | | 275,463 |
| 5,091 | | @ | | Compagnie Generale de Geophysique SA | | | 92,161 |
| 9,505 | | | | Compagnie Generale des Etablissements Michelin | | | 544,369 |
| 57,923 | | | | Credit Agricole SA | | | 726,254 |
| 5,345 | | | | Dassault Systemes SA | | | 236,706 |
| 2,114 | | | | Eiffage SA | | | 123,541 |
| 13,623 | | | | Electricite de France | | | 665,187 |
| 6,339 | | @ | | Eutelsat Communications | | | 164,074 |
| 117,093 | | | | France Telecom SA | | | 2,664,297 |
| 77,186 | | | | Gaz de France | | | 2,889,252 |
| 34,469 | | | | Groupe Danone | | | 1,709,143 |
| 3,480 | | | | Hermes International | | | 484,517 |
| 12,567 | | | | Lafarge SA | | | 855,032 |
| | | | | | | |
| Shares | | | | | | Value |
| | | | | | | |
France: (continued) |
| 5,169 | | | | Lagardere SCA | | $ | 172,331 |
| 16,183 | | | | L’Oreal SA | | | 1,214,759 |
| 17,514 | | | | LVMH Moet Hennessy Louis Vuitton SA | | | 1,343,216 |
| 51,737 | | | | Natixis | | | 100,697 |
| 1,248 | | | | Neopost SA | | | 112,378 |
| 8,437 | | | | PagesJaunes Groupe SA | | | 82,253 |
| 12,650 | | | | Pernod-Ricard SA | | | 799,778 |
| 11,134 | | | | Peugeot SA | | | 293,930 |
| 5,827 | | | | PPR | | | 477,682 |
| 6,006 | | | | Publicis Groupe | | | 183,872 |
| 12,598 | | | | Renault SA | | | 465,453 |
| 9,018 | | | | Safran SA | | | 119,443 |
| 67,623 | | | | Sanofi-Aventis | | | 3,995,835 |
| 15,866 | | S | | Schneider Electric SA | | | 1,214,356 |
| 8,191 | | | | Scor SA | | | 168,296 |
| 1,884 | | | | Societe BIC SA | | | 108,481 |
| 30,342 | | | | Societe Generale | | | 1,665,497 |
| 7,510 | | | | Sodexho Alliance SA | | | 386,675 |
| 10,041 | | | | Suez Environnement SA | | | 175,962 |
| 8,210 | | | | Technip SA | | | 404,838 |
| 5,845 | | S | | Thales SA | | | 262,407 |
| 136,269 | | | | Total SA | | | 7,385,881 |
| 3,573 | | | | Vallourec | | | 436,722 |
| 25,339 | | | | Veolia Environnement | | | 749,191 |
| 27,261 | | | | Vinci SA | | | 1,230,133 |
| 79,675 | | | | Vivendi | | | 1,912,514 |
| | | | | | | |
| | | | | | | 50,173,595 |
| | | | | | | |
Germany: 7.3% |
| 8,939 | | | | Adidas AG | | | 340,643 |
| 30,080 | | | | Allianz AG | | | 2,774,660 |
| 62,505 | | | | BASF AG | | | 2,490,312 |
| 49,076 | | | | Bayer AG | | | 2,637,357 |
| 22,135 | | | | Bayerische Motoren Werke AG | | | 836,152 |
| 2,433 | | | | Beiersdorf AG | | | 114,610 |
| 4,399 | | | | Celesio AG | | | 101,051 |
| 44,632 | | | | Commerzbank AG | | | 278,223 |
| 58,973 | | | | DaimlerChrysler AG | | | 2,141,650 |
| 35,516 | | | | Deutsche Bank AG | | | 2,159,052 |
| 12,807 | | | | Deutsche Boerse AG | | | 996,705 |
| 8,791 | | | | Deutsche Lufthansa AG | | | 110,403 |
| 54,769 | | | | Deutsche Post AG | | | 715,119 |
| 179,787 | | | | Deutsche Telekom AG | | | 2,125,544 |
| 125,618 | | | | E.ON AG | | | 4,459,185 |
| 2,507 | | | | Fresenius AG | | | 117,311 |
| 11,733 | | | | Fresenius Medical Care AG & Co. KGaA | | | 527,240 |
| 6,297 | | | | GEA Group AG | | | 95,622 |
| 3,139 | | | | Hannover Rueckversicheru - Reg | | | 116,041 |
| 9,075 | | | | Henkel KGaA | | | 244,808 |
| 9,158 | | | | K+S AG | | | 516,569 |
| 9,886 | | | | Linde AG | | | 812,167 |
| 4,941 | | | | MAN AG | | | 304,018 |
| 3,451 | | S | | Merck KGaA | | | 351,160 |
| 7,037 | | | | Metro AG | | | 336,215 |
| 12,944 | | | | Muenchener Rueckversicherungs AG | | | 1,748,808 |
| 28,563 | | S | | RWE AG | | | 2,252,469 |
| 1,625 | | | | Salzgitter AG | | | 143,229 |
| 58,387 | | | | SAP AG | | | 2,354,072 |
| 52,591 | | | | Siemens AG | | | 3,636,806 |
| 6,686 | | | | Solarworld AG | | | 158,233 |
| 22,351 | | | | ThyssenKrupp AG | | | 556,820 |
See Accompanying Notes to Financial Statements
96
| | |
| ING INTERNATIONAL INDEX PORTFOLIO | | PORTFOLIO OF INVESTMENTS AS OF JUNE 30, 2009 (UNAUDITED) (CONTINUED) |
| | | | | | | |
| Shares | | | | | | Value |
| | | | | | | |
Germany: (continued) |
| 6,867 | | | | TUI AG | | $ | 50,701 |
| 5,905 | | | | Volkswagen AG | | | 2,000,525 |
| | | | | | | |
| | | | | | | 38,603,480 |
| | | | | | | |
Greece: 0.4% |
| 15,572 | | | | Alpha Bank AE | | | 170,484 |
| 7,988 | | | | Coca-Cola Hellenic Bottling Co. SA | | | 164,640 |
| 12,660 | | | | EFG Eurobank Ergasias SA | | | 133,165 |
| 11,716 | | | | Hellenic Telecommunications Organization SA | | | 179,164 |
| 22,259 | | @ | | Marfin Investment Group SA | | | 95,522 |
| 30,318 | | | | National Bank of Greece SA | | | 841,062 |
| 15,977 | | | | OPAP SA | | | 426,029 |
| 13,897 | | | | Piraeus Bank SA | | | 138,359 |
| 5,331 | | | | Public Power Corp. | | | 109,999 |
| | | | | | | |
| | | | | | | 2,258,424 |
| | | | | | | |
Hong Kong: 2.1% |
| 92,760 | | | | Bank of East Asia Ltd. | | | 281,118 |
| 185,500 | | | | BOC Hong Kong Holdings Ltd. | | | 322,753 |
| 77,000 | | | | Cathay Pacific Airways Ltd. | | | 105,633 |
| 87,000 | | | | Cheung Kong Holdings Ltd. | | | 994,768 |
| 22,000 | | | | Cheung Kong Infrastructure Holdings Ltd. | | | 77,070 |
| 134,000 | | | | CLP Holdings Ltd. | | | 887,907 |
| 78,200 | | | | Esprit Holdings Ltd. | | | 434,466 |
| 41,000 | | | | Hang Lung Group Ltd. | | | 191,855 |
| 92,000 | | | | Hang Lung Properties Ltd. | | | 302,959 |
| 47,500 | | | | Hang Seng Bank Ltd. | | | 664,818 |
| 49,000 | | | | Henderson Land Development Co., Ltd. | | | 279,605 |
| 232,700 | | | | Hong Kong & China Gas | | | 488,480 |
| 65,500 | | | | Hong Kong Exchanges and Clearing Ltd. | | | 1,012,400 |
| 95,500 | | | | HongKong Electric Holdings | | | 530,515 |
| 34,000 | | | | Hopewell Holdings | | | 106,165 |
| 132,000 | | | | Hutchison Whampoa Ltd. | | | 858,679 |
| 33,500 | | | | Kerry Properties Ltd. | | | 145,926 |
| 116,000 | | | | Li & Fung Ltd. | | | 309,723 |
| 123,100 | | @ | | Mongolia Energy Corp., Ltd. | | | 45,048 |
| 67,000 | | | | MTR Corp. | | | 200,154 |
| 161,000 | | | | New World Development Ltd. | | | 289,804 |
| 105,000 | | | | Noble Group Ltd. | | | 130,869 |
| 71,000 | | | | NWS Holdings Ltd. | | | 127,844 |
| 74,000 | | | | Sino Land Co. | | | 121,823 |
| 91,000 | | | | Sun Hung Kai Properties Ltd. | | | 1,130,020 |
| 57,000 | | | | Swire Pacific Ltd. | | | 572,162 |
| 21,000 | | | | Television Broadcasts Ltd. | | | 84,104 |
| 53,000 | | | | Wharf Holdings Ltd. | | | 223,462 |
| 50,000 | | | | Wheelock & Co., Ltd. | | | 128,500 |
| 11,000 | | | | Wing Hang Bank Ltd. | | | 96,019 |
| 42,500 | | | | Yue Yuen Industrial Holdings | | | 99,976 |
| | | | | | | |
| | | | | | | 11,244,625 |
| | | | | | | |
Ireland: 0.3% | | | |
| 20,010 | | X | | Anglo Irish Bank Corp. PLC | | | — |
| 44,211 | | | | CRH PLC | | | 1,016,157 |
| 19,059 | | @ | | Elan Corp. PLC | | | 125,145 |
| 4,354 | | | | Kerry Group PLC | | | 99,242 |
| 33,300 | | @ | | Ryanair Holdings PLC | | | 153,918 |
| | | | | | | |
| | | | | | | 1,394,462 |
| | | | | | | |
| | | | | | | |
| Shares | | | | | | Value |
| | | | | | | |
Italy: 3.2% | | | |
| 49,220 | | | | AEM S.p.A. | | $ | 89,953 |
| 18,626 | | | | Alleanza Assicurazioni S.p.A. | | | 128,006 |
| 68,111 | | | | Assicurazioni Generali S.p.A. | | | 1,418,554 |
| 15,152 | | | | Autostrade S.p.A. | | | 306,899 |
| 159,334 | | | | Banca Monte dei Paschi di Siena S.p.A. | | | 257,535 |
| 13,946 | | | | Banca Popolare di Milano Scrl | | | 83,217 |
| 41,970 | | | | Banche Popolari Unite Scpa | | | 546,923 |
| 24,447 | | | | Banco Popolare Scarl | | | 182,818 |
| 303,170 | | | | Enel S.p.A. | | | 1,480,057 |
| 166,141 | | S | | ENI S.p.A. | | | 3,940,391 |
| 5,559 | | | | Exor S.p.A. | | | 80,013 |
| 51,360 | | | | Fiat S.p.A | | | 517,887 |
| 23,735 | | | | Finmeccanica S.p.A. | | | 334,712 |
| 35,613 | | | | Intesa Sanpaolo S.p.A. - RNC | | | 88,047 |
| 534,053 | | | | Intesa Sanpaolo S.p.A. | | | 1,725,807 |
| 2,908 | | | | Lottomatica S.p.A. | | | 56,151 |
| 29,782 | | | | Mediaset S.p.A. | | | 167,205 |
| 33,363 | | | | Mediobanca S.p.A. | | | 397,568 |
| 70,059 | | | | Parmalat S.p.A | | | 169,214 |
| 13,072 | | | | Saipem S.p.A. | | | 319,371 |
| 88,843 | | | | Snam Rete Gas S.p.A. | | | 390,268 |
| 749,805 | | | | Telecom Italia S.p.A. | | | 1,039,594 |
| 413,735 | | | | Telecom Italia S.p.A. RNC | | | 407,577 |
| 73,273 | | | | Terna S.p.A | | | 244,374 |
| 923,591 | | | | UniCredito Italiano S.p.A. | | | 2,336,040 |
| | | | | | | |
| | | | | | | 16,708,181 |
| | | | | | | |
Japan: 22.1% | | | |
| 24,000 | | | | 77 Bank Ltd. | | | 139,734 |
| 30 | | | | Acom Co., Ltd. | | | 748 |
| 7,400 | | | | Advantest Corp. | | | 134,756 |
| 31,600 | | | | Aeon Co., Ltd. | | | 311,796 |
| 23,267 | | | | Aioi Insurance Co., Ltd. | | | 106,048 |
| 11,300 | | | | Aisin Seiki Co., Ltd. | | | 244,118 |
| 33,000 | | | | Ajinomoto Co., Inc. | | | 261,051 |
| 37,000 | | | | All Nippon Airways Co., Ltd. | | | 129,282 |
| 28,000 | | | | Amada Co., Ltd. | | | 173,522 |
| 25,900 | | | | Asahi Breweries Ltd. | | | 371,140 |
| 70,000 | | | | Asahi Glass Co., Ltd. | | | 560,700 |
| 91,000 | | | | Asahi Kasei Corp. | | | 461,712 |
| 14,000 | | | | Asics Corp. | | | 127,696 |
| 30,600 | | | | Astellas Pharma, Inc. | | | 1,080,552 |
| 19,000 | | | | Bank of Kyoto Ltd. | | | 176,106 |
| 81,000 | | | | Bank of Yokohama Ltd. | | | 433,559 |
| 4,300 | | | | Benesse Corp. | | | 172,422 |
| 43,600 | | | | Bridgestone Corp. | | | 682,970 |
| 68,900 | | | | Canon, Inc. | | | 2,250,550 |
| 12,600 | | | | Casio Computer Co., Ltd. | | | 112,856 |
| 103 | | | | Central Japan Railway Co. | | | 633,191 |
| 31,000 | | | | Chiba Bank Ltd. | | | 202,317 |
| 42,900 | | | | Chubu Electric Power Co., Inc. | | | 990,723 |
| 18,400 | | | | Chugai Pharmaceutical Co., Ltd. | | | 350,131 |
| 9,000 | | | | Chugoku Bank Ltd. | | | 124,780 |
| 13,844 | | | | Chugoku Electric Power Co., Inc. | | | 289,050 |
| 15,900 | | | | Citizen Watch Co., Ltd. | | | 81,422 |
| 9,500 | | | | Credit Saison Co., Ltd. | | | 120,505 |
| 41,000 | | | | Dai Nippon Printing Co., Ltd. | | | 561,367 |
| 13,000 | | | | Daihatsu Motor Co., Ltd. | | | 120,837 |
| 43,500 | | | | Daiichi Sankyo Co., Ltd. | | | 776,451 |
| 16,300 | | | | Daikin Industries Ltd. | | | 524,591 |
| 4,700 | | | | Daito Trust Construction Co., Ltd. | | | 221,616 |
| 28,000 | | | | Daiwa House Industry Co., Ltd. | | | 301,085 |
See Accompanying Notes to Financial Statements
97
| | |
| ING INTERNATIONAL INDEX PORTFOLIO | | PORTFOLIO OF INVESTMENTS AS OF JUNE 30, 2009 (UNAUDITED) (CONTINUED) |
| | | | | | | |
| Shares | | | | | | Value |
| | | | | | | |
Japan: (continued) | | | |
| 72,000 | | | | Daiwa Securities Group, Inc. | | $ | 427,838 |
| 32,300 | | | | Denso Corp. | | | 827,935 |
| 12,600 | | | | Dentsu, Inc. | | | 264,405 |
| 24,000 | | | | Dowa Holdings Co., Ltd. | | | 99,618 |
| 21,900 | | | | East Japan Railway Co. | | | 1,318,509 |
| 16,300 | | | | Eisai Co., Ltd. | | | 578,735 |
| 5,700 | | | | Electric Power Development Co. | | | 161,732 |
| 6,000 | | @ | | Elpida Memory, Inc. | | | 64,618 |
| 2,800 | | | | FamilyMart Co., Ltd. | | | 87,982 |
| 12,500 | | | | Fanuc Ltd. | | | 1,001,704 |
| 2,800 | | | | Fast Retailing Co., Ltd. | | | 364,909 |
| 28,000 | | | | Fuji Heavy Industries Ltd. | | | 113,123 |
| 31,400 | | | | Fuji Photo Film Co., Ltd. | | | 999,299 |
| 124,000 | | | | Fujitsu Ltd. | | | 673,597 |
| 44,000 | | | | Fukuoka Financial Group, Inc. | | | 196,778 |
| 37,000 | | | | Furukawa Electric Co., Ltd. | | | 166,451 |
| 19,000 | | | | GS Yuasa Corp. | | | 166,724 |
| 21,000 | | | | Gunma Bank Ltd. | | | 116,746 |
| 22,000 | | | | Hachijuni Bank Ltd. | | | 124,303 |
| 73,000 | | | | Hankyu Hanshin Holdings, Inc. | | | 341,753 |
| 2,600 | | | | Hirose Electric Co., Ltd. | | | 277,387 |
| 36,000 | | | | Hiroshima Bank Ltd. | | | 150,052 |
| 3,200 | | | | Hisamitsu Pharmaceutical Co., Inc. | | | 99,419 |
| 6,000 | | | | Hitachi Construction Machinery Co., Ltd. | | | 97,507 |
| 236,000 | | | | Hitachi Ltd. | | | 734,436 |
| 9,000 | | | | Hitachi Metals Ltd. | | | 76,607 |
| 8,100 | | | | Hokkaido Electric Power Co., Inc. | | | 151,662 |
| 74,000 | | | | Hokugin Financial Group, Inc. | | | 185,488 |
| 8,100 | | | | Hokuriku Electric Power Co. | | | 185,256 |
| 110,800 | | | | Honda Motor Co., Ltd. | | | 3,048,202 |
| 23,700 | | | | Hoya Corp. | | | 474,756 |
| 5,700 | | | | Ibiden Co., Ltd. | | | 159,827 |
| 28 | | S | | Inpex Holdings, Inc. | | | 223,249 |
| 19,100 | | | | Isetan Mitsukoshi Holdings Ltd. | | | 194,332 |
| 81,000 | | | | Ishikawajima - Harima Heavy Industries Co., Ltd. | | | 139,920 |
| 47,000 | | | | Isuzu Motors Ltd. | | | 75,403 |
| 100,000 | | | | Itochu Corp. | | | 693,921 |
| 11,000 | | | | Iyo Bank Ltd. | | | 112,123 |
| 58,000 | | @ | | Japan Airlines Corp. | | | 111,918 |
| 19,000 | | | | Japan Steel Works Ltd. | | | 234,156 |
| 303 | | | | Japan Tobacco, Inc. | | | 947,127 |
| 33,100 | | | | JFE Holdings, Inc. | | | 1,112,071 |
| 8,000 | | | | JGC Corp. | | | 128,767 |
| 37,000 | | | | Joyo Bank Ltd. | | | 188,785 |
| 13,500 | | | | JS Group Corp. | | | 208,347 |
| 11,700 | | | | JSR Corp. | | | 200,405 |
| 106 | | | | Jupiter Telecommunications Co. | | | 80,404 |
| 18,000 | | | | Kamigumi Co., Ltd. | | | 152,127 |
| 48,000 | | | | Kansai Electric Power Co., Inc. | | | 1,058,806 |
| 38,000 | | | | Kao Corp. | | | 826,894 |
| 89,000 | | | | Kawasaki Heavy Industries Ltd. | | | 245,158 |
| 24,000 | | | | Kawasaki Kisen Kaisha Ltd. | | | 98,449 |
| 181 | | | | KDDI Corp. | | | 960,394 |
| 28,000 | | | | Keihin Electric Express Railway Co., Ltd. | | | 217,120 |
| 33,000 | | | | Keio Corp. | | | 191,685 |
| 23,000 | | | | Keisei Electric Railway Co., Ltd. | | | 137,125 |
| 2,770 | | | | Keyence Corp. | | | 564,329 |
| 81,000 | | | | Kintetsu Corp. | | | 357,042 |
| 55,000 | | | | Kirin Brewery Co., Ltd. | | | 767,336 |
| 220,000 | | | | Kobe Steel Ltd. | | | 409,731 |
| | | | | | | |
| Shares | | | | | | Value |
| | | | | | | |
Japan: (continued) | | | |
| 61,000 | | | | Komatsu Ltd. | | $ | 941,813 |
| 18,500 | | | | Konica Minolta Holdings, Inc. | | | 193,296 |
| 13,200 | | | | Koyo Seiko Co., Ltd. | | | 133,404 |
| 60,000 | | | | Kubota Corp. | | | 494,098 |
| 18,000 | | | | Kuraray Co., Ltd. | | | 199,544 |
| 5,000 | | | | Kurita Water Industries Ltd. | | | 161,478 |
| 9,900 | | | | Kyocera Corp. | | | 743,234 |
| 9,000 | | | | Kyowa Hakko Kogyo Co., Ltd. | | | 101,538 |
| 23,500 | | | | Kyushu Electric Power Co., Inc. | | | 505,757 |
| 5,000 | | | | Lawson, Inc. | | | 220,080 |
| 5,800 | | | | Makita Corp. | | | 140,352 |
| 112,000 | | | | Marubeni Corp. | | | 495,352 |
| 132,000 | | | | Matsushita Electric Industrial Co., Ltd. | | | 1,778,381 |
| 20,000 | | | | Matsushita Electric Works Ltd. | | | 189,032 |
| 34,000 | | | | Mazda Motor Corp. | | | 86,955 |
| 4,900 | | | | MEIJI Holdings Co. Ltd. | | | 197,353 |
| 29,000 | | | | Minebea Co., Ltd. | | | 123,417 |
| 60,500 | | | | Mitsubishi Chemical Holdings Corp. | | | 255,900 |
| 86,400 | | | | Mitsubishi Corp. | | | 1,594,358 |
| 129,000 | | | | Mitsubishi Electric Corp. | | | 815,297 |
| 82,000 | | | | Mitsubishi Estate Co., Ltd. | | | 1,361,337 |
| 28,000 | | | | Mitsubishi Gas Chemical Co., Inc. | | | 152,666 |
| 220,000 | | | | Mitsubishi Heavy Industries Ltd. | | | 910,429 |
| 59,000 | | | | Mitsubishi Materials Corp. | | | 183,689 |
| 202,255 | | @ | | Mitsubishi Motors Corp. | | | 379,056 |
| 47,000 | | | | Mitsubishi Rayon Co., Ltd. | | | 136,577 |
| 617,600 | | | | Mitsubishi UFJ Financial Group, Inc. | | | 3,813,554 |
| 113,000 | | | | Mitsui & Co., Ltd. | | | 1,339,013 |
| 33,000 | | | | Mitsui Chemicals, Inc. | | | 105,195 |
| 53,000 | | S | | Mitsui Engineering & Shipbuilding Co., Ltd. | | | 124,494 |
| 55,000 | | | | Mitsui Fudosan Co., Ltd. | | | 953,929 |
| 74,000 | | | | Mitsui OSK Lines Ltd. | | | 478,213 |
| 23,700 | | | | Mitsui Sumitomo Insurance Group Holdings, Inc. | | | 620,010 |
| 47,000 | | | | Mitsui Trust Holdings, Inc. | | | 179,084 |
| 4,700 | | | | Mitsumi Electric Co., Ltd. | | | 100,400 |
| 617,700 | | | | Mizuho Financial Group, Inc. | | | 1,435,125 |
| 112,000 | | | | Mizuho Trust & Banking Co., Ltd. | | | 144,797 |
| 14,800 | | | | Murata Manufacturing Co., Ltd. | | | 631,655 |
| 14,000 | | | | Namco Bandai Holdings, Inc. | | | 153,548 |
| 95,000 | | | | NEC Corp. | | | 371,600 |
| 17,000 | | | | NGK Insulators Ltd. | | | 346,490 |
| 8,100 | | | | Nidec Corp. | | | 493,042 |
| 11,000 | | | | Nikon Corp. | | | 190,306 |
| 6,400 | | | | Nintendo Co., Ltd. | | | 1,771,232 |
| 19,000 | | | | Nippon Electric Glass Co., Ltd. | | | 212,410 |
| 39,000 | | | | Nippon Express Co., Ltd. | | | 177,049 |
| 53,500 | | | | Nippon Mining Holdings, Inc. | | | 276,461 |
| 84,000 | | | | Nippon Oil Corp. | | | 494,635 |
| 4,900 | | | | Nippon Paper Group, Inc. | | | 126,759 |
| 36,000 | | | | Nippon Sheet Glass Co., Ltd. | | | 104,899 |
| 324,000 | | | | Nippon Steel Corp. | | | 1,240,406 |
| 36,800 | | | | Nippon Telegraph & Telephone Corp. | | | 1,498,695 |
| 47,000 | | | | Nippon Yusen KK | | | 202,391 |
| 23,340 | | | | Nipponkoa Insurance Co., Ltd. | | | 135,788 |
| 61,000 | | | | Nishi-Nippon City Bank Ltd. | | | 154,107 |
| 153,200 | | | | Nissan Motor Co., Ltd. | | | 929,754 |
| 13,500 | | | | Nisshin Seifun Group, Inc. | | | 160,396 |
| 9,000 | | | | Nisshinbo Industries, Inc. | | | 101,530 |
| 3,700 | | | | Nissin Food Products Co., Ltd. | | | 111,882 |
See Accompanying Notes to Financial Statements
98
| | |
| ING INTERNATIONAL INDEX PORTFOLIO | | PORTFOLIO OF INVESTMENTS AS OF JUNE 30, 2009 (UNAUDITED) (CONTINUED) |
| | | | | | | |
| Shares | | | | | | Value |
| | | | | | | |
Japan: (continued) | | | |
| 2,000 | | | | Nitori Co., Ltd. | | $ | 141,631 |
| 10,500 | | S | | Nitto Denko Corp. | | | 320,130 |
| 157,800 | | | | Nomura Holdings, Inc. | | | 1,331,965 |
| 6,300 | | | | Nomura Research Institute Ltd. | | | 139,654 |
| 23,000 | | | | NSK Ltd. | | | 116,430 |
| 47 | | | | NTT Data Corp. | | | 151,712 |
| 1,005 | | | | NTT DoCoMo, Inc. | | | 1,469,951 |
| 38,000 | | | | Obayashi Corp. | | | 186,014 |
| 38,000 | | | | Odakyu Electric Railway Co., Ltd. | | | 324,867 |
| 36,000 | | | | OJI Paper Co., Ltd. | | | 154,673 |
| 16,000 | | | | Olympus Corp. | | | 376,790 |
| 17,900 | | | | Omron Corp. | | | 259,339 |
| 3,800 | | | | Ono Pharmaceutical Co., Ltd. | | | 168,565 |
| 3,300 | | | | Oracle Corp. Japan | | | 121,020 |
| 3,400 | | | | Oriental Land Co., Ltd. | | | 227,965 |
| 5,300 | | | | ORIX Corp. | | | 315,457 |
| 136,000 | | | | Osaka Gas Co., Ltd. | | | 433,500 |
| 442 | | | | Rakuten, Inc. | | | 266,340 |
| 34,500 | | | | Resona Holdings, Inc. | | | 483,598 |
| 47,000 | | | | Ricoh Co., Ltd. | | | 605,463 |
| 3,200 | | | | Rinnai Corp. | | | 141,431 |
| 4,800 | | | | Rohm Co., Ltd. | | | 350,102 |
| 4,800 | | | | Sankyo Co., Ltd. | | | 256,049 |
| 89,000 | | @ | | Sanyo Electric Co., Ltd. | | | 230,504 |
| 13,100 | | | | Secom Co., Ltd. | | | 531,673 |
| 12,900 | | | | Sega Sammy Holdings, Inc. | | | 163,500 |
| 6,800 | | | | Seiko Epson Corp. | | | 110,974 |
| 28,000 | | S | | Sekisui House Ltd. | | | 283,583 |
| 53,800 | | | | Seven & I Holdings Co., Ltd. | | | 1,261,750 |
| 63,000 | | | | Sharp Corp. | | | 653,577 |
| 9,500 | | | | Shikoku Electric Power Co. | | | 283,334 |
| 1,400 | | | | Shimamura Co., Ltd. | | | 111,473 |
| 3,900 | | | | Shimano, Inc. | | | 149,841 |
| 37,000 | | | | Shimizu Corp. | | | 160,595 |
| 27,100 | | | | Shin-Etsu Chemical Co., Ltd. | | | 1,256,869 |
| 51,000 | | | | Shinko Securities Co., Ltd. | | | 159,604 |
| 19,000 | | | | Shionogi & Co., Ltd. | | | 367,099 |
| 10,000 | | | | Shiseido Co., Ltd. | | | 163,597 |
| 49,000 | | | | Shizuoka Bank Ltd. | | | 484,941 |
| 10,000 | | | | Showa Shell Sekiyu KK | | | 105,812 |
| 2,800 | | | | SMC Corp. | | | 300,648 |
| 47,700 | | | | Softbank Corp. | | | 929,241 |
| 1,121 | | | | Softbank Investment Corp. | | | 227,656 |
| 63,100 | | | | Sojitz Corp. | | | 138,378 |
| 44,000 | | | | Sompo Japan Insurance, Inc. | | | 293,200 |
| 65,100 | | | | Sony Corp. | | | 1,698,395 |
| 44 | | | | Sony Financial Holdings, Inc. | | | 121,315 |
| 3,800 | | | | Square Enix Co., Ltd. | | | 89,245 |
| 6,300 | | | | Stanley Electric Co., Ltd. | | | 127,750 |
| 7,000 | | | | Sumco Corp. | | | 99,450 |
| 111,000 | | | | Sumitomo Chemical Co., Ltd. | | | 499,183 |
| 73,100 | | S | | Sumitomo Corp. | | | 743,039 |
| 53,400 | | | | Sumitomo Electric Industries Ltd. | | | 598,711 |
| 31,000 | | | | Sumitomo Heavy Industries | | | 137,906 |
| 195,000 | | | | Sumitomo Metal Industries Ltd. | | | 518,364 |
| 28,000 | | S | | Sumitomo Metal Mining Co., Ltd. | | | 393,340 |
| 43,500 | | | | Sumitomo Mitsui Financial Group, Inc. | | | 1,760,241 |
| 24,000 | | S | | Sumitomo Realty & Development Co., Ltd. | | | 438,209 |
| 73,000 | | | | Sumitomo Trust & Banking Co., Ltd. | | | 391,710 |
| 16,000 | | | | Suruga Bank Ltd. | | | 153,079 |
| 4,900 | | | | Suzuken Co., Ltd. | | | 141,954 |
| | | | | | | |
| Shares | | | | | | Value |
| | | | | | | |
Japan: (continued) | | | |
| 21,000 | | | | Suzuki Motor Corp. | | $ | 470,879 |
| 14,700 | | | | T&D Holdings, Inc. | | | 419,993 |
| 12,000 | | | | Taisho Pharmaceutical Co., Ltd. | | | 227,117 |
| 23,000 | | | | Taiyo Nippon Sanso Corp. | | | 219,850 |
| 18,000 | | | | Takashimaya Co., Ltd. | | | 141,683 |
| 51,700 | | | | Takeda Pharmaceutical Co., Ltd. | | | 2,010,092 |
| 8,000 | | | | Tanabe Seiyaku Co., Ltd. | | | 91,909 |
| 7,100 | | | | TDK Corp. | | | 333,304 |
| 49,000 | | | | Teijin Ltd. | | | 157,499 |
| 10,700 | | | | Terumo Corp. | | | 471,732 |
| 8,400 | | | | THK Co., Ltd. | | | 125,223 |
| 34,000 | | | | Tobu Railway Co., Ltd. | | | 199,572 |
| 5,900 | | | | Toho Co., Ltd. | | | 95,972 |
| 26,800 | | | | Tohoku Electric Power Co., Inc. | | | 559,830 |
| 47,200 | | | | Tokio Marine Holdings, Inc. | | | 1,295,951 |
| 83,900 | | | | Tokyo Electric Power Co., Inc. | | | 2,157,179 |
| 10,400 | | | | Tokyo Electron Ltd. | | | 501,903 |
| 102,000 | | | | Tokyo Gas Co., Ltd. | | | 364,388 |
| 29,000 | | | | Tokyo Tatemono Co., Ltd. | | | 161,497 |
| 67,000 | | | | Tokyu Corp. | | | 337,989 |
| 31,000 | | | | Tokyu Land Corp. | | | 140,839 |
| 17,000 | | | | TonenGeneral Sekiyu KK | | | 173,026 |
| 40,000 | | | | Toppan Printing Co., Ltd. | | | 403,002 |
| 114,000 | | | | Toray Industries, Inc. | | | 580,277 |
| 199,000 | | S | | Toshiba Corp. | | | 720,966 |
| 36,000 | | | | Tosoh Corp. | | | 101,831 |
| 8,500 | | | | Toyo Seikan Kaisha Ltd. | | | 179,838 |
| 3,000 | | | | Toyo Suisan Kaisha Ltd. | | | 61,810 |
| 11,200 | | | | Toyota Industries Corp. | | | 278,380 |
| 176,300 | | | | Toyota Motor Corp. | | | 6,667,202 |
| 11,000 | | | | Toyota Tsusho Corp. | | | 162,917 |
| 3,500 | | | | Trend Micro, Inc. | | | 111,761 |
| 3,800 | | | | Tsumura & Co. | | | 118,581 |
| 51,000 | | | | Ube Industries Ltd. | | | 142,323 |
| 3,700 | | | | Uni-Charm Corp. | | | 282,662 |
| 8,000 | | | | Ushio, Inc. | | | 127,618 |
| 1,820 | | | | USS Co., Ltd. | | | 93,745 |
| 113 | | | | West Japan Railway Co. | | | 373,694 |
| 1,089 | | | | Yahoo! Japan Corp. | | | 346,351 |
| 6,110 | | | | Yamada Denki Co., Ltd. | | | 355,469 |
| 7,000 | | | | Yamaguchi Financial Group, Inc. | | | 92,321 |
| 9,800 | | | | Yamaha Corp. | | | 122,146 |
| 13,300 | | | | Yamaha Motor Co., Ltd. | | | 147,746 |
| 24,000 | | | | Yamato Holdings Co., Ltd. | | | 319,101 |
| 19,000 | | | | Yaskawa Electric Corp. | | | 126,173 |
| 22,200 | | | | Yokogawa Electric Corp. | | | 149,606 |
| | | | | | | |
| | | | | | | 116,622,441 |
| | | | | | | |
Kazakhstan: 0.0% | | | |
| 13,213 | | | | Eurasian Natural Resources Corp. | | | 142,982 |
| | | | | | | |
| | | | | | | 142,982 |
| | | | | | | |
Luxembourg: 0.5% | | | |
| 54,692 | | | | ArcelorMittal | | | 1,809,932 |
| 16,158 | | | | SES SA | | | 308,974 |
| 32,100 | | | | Tenaris SA | | | 437,908 |
| | | | | | | |
| | | | | | | 2,556,814 |
| | | | | | | |
Malaysia: 0.0% | | | |
| 237,000 | | @ | | Genting International PLC | | | 110,945 |
| | | | | | | |
| | | | | | | 110,945 |
| | | | | | | |
See Accompanying Notes to Financial Statements
99
| | |
| ING INTERNATIONAL INDEX PORTFOLIO | | PORTFOLIO OF INVESTMENTS AS OF JUNE 30, 2009 (UNAUDITED) (CONTINUED) |
| | | | | | | |
| Shares | | | | | | Value |
| | | | | | | |
Mauritius: 0.0% | | | |
| 279,800 | | | | Golden Agri-Resources Ltd. | | $ | 72,928 |
| | | | | | | |
| | | | | | | 72,928 |
| | | | | | | |
Mexico: 0.0% | | | |
| 13,100 | | | | Fresnillo PLC | | | 112,484 |
| | | | | | | |
| | | | | | | 112,484 |
| | | | | | | |
Netherlands: 4.3% | | | |
| 88,989 | | | | Aegon NV | | | 550,936 |
| 16,126 | | | | Akzo Nobel NV | | | 712,820 |
| 26,944 | | | | ASML Holding NV | | | 584,012 |
| 26,630 | | | | European Aeronautic Defence and Space Co. NV | | | 432,486 |
| 1,986 | | | | Fugro NV | | | 82,707 |
| 3,824 | | | | Heineken Holding NV | | | 122,181 |
| 16,078 | | | | Heineken NV | | | 599,204 |
| 111,828 | | ** | | ING Groep NV | | | 1,132,938 |
| 77,799 | | | | Koninklijke Ahold NV | | | 896,907 |
| 5,814 | | | | Koninklijke DSM NV | | | 182,831 |
| 69,513 | | | | Koninklijke Philips Electronics NV | | | 1,283,425 |
| 7,545 | | @ | | Qiagen NV | | | 139,799 |
| 3,420 | | | | Randstad Holdings NV | | | 95,043 |
| 40,464 | | | | Reed Elsevier NV | | | 447,424 |
| 231,996 | | | | Royal Dutch Shell PLC - Class A | | | 5,819,453 |
| 177,759 | | | | Royal Dutch Shell PLC - Class B | | | 4,475,153 |
| 110,057 | | | | Royal KPN NV | | | 1,518,541 |
| 5,905 | | | | SBM Offshore NV | | | 101,400 |
| 24,023 | | | | TNT NV | | | 469,553 |
| 110,126 | | | | Unilever NV | | | 2,663,526 |
| 13,523 | | | | Wolters Kluwer NV | | | 237,235 |
| | | | | | | |
| | | | | | | 22,547,574 |
| | | | | | | |
New Zealand: 0.1% | | | |
| 25,716 | | | | Fletcher Building Ltd. | | | 109,091 |
| 77,238 | | | | Telecom Corp. of New Zealand Ltd. | | | 135,580 |
| | | | | | | |
| | | | | | | 244,671 |
| | | | | | | |
Norway: 0.5% | | | |
| 37,600 | | | | DnB NOR ASA | | | 287,301 |
| 28,500 | | S | | Norsk Hydro ASA | | | 146,849 |
| 35,900 | | | | Orkla ASA | | | 261,047 |
| 6,550 | | @ | | Renewable Energy Corp. A/S | | | 51,144 |
| 72,100 | | | | Statoil ASA | | | 1,424,204 |
| 43,400 | | | | Telenor ASA | | | 334,912 |
| 9,565 | | | | Yara International ASA | | | 269,285 |
| | | | | | | |
| | | | | | | 2,774,742 |
| | | | | | | |
Portugal: 0.2% | | | |
| 110,394 | | | | Banco Comercial Portugues SA | | | 112,402 |
| 25,039 | | | | Banco Espirito Santo SA | | | 135,025 |
| 14,669 | | | | Brisa-Auto Estradas de Portugal SA | | | 105,448 |
| 15,488 | | | | Cimpor Cimentos de Portugal SG | | | 113,143 |
| 122,716 | | | | Energias de Portugal SA | | | 482,062 |
| 29,789 | | | | Portugal Telecom SGPS SA | | | 292,204 |
| | | | | | | |
| | | | | | | 1,240,284 |
| | | | | | | |
Singapore: 1.1% | | | |
| 133,000 | | | | CapitaLand Ltd. | | | 338,159 |
| 28,000 | | | | City Developments Ltd. | | | 165,004 |
| 95,000 | | | | DBS Group Holdings Ltd. | | | 770,179 |
| 48,000 | | X | | Fraser and Neave Ltd. | | | 128,583 |
| 10,000 | | | | Jardine Cycle & Carriage Ltd. | | | 131,991 |
| 74,000 | | | | Keppel Corp., Ltd. | | | 350,769 |
| | | | | | | |
| Shares | | | | | | Value |
| | | | | | | |
Singapore: (continued) | | | |
| 94,000 | | | | Olam International Ltd. | | $ | 156,753 |
| 174,608 | | | | Oversea-Chinese Banking Corp. | | | 801,661 |
| 51,000 | | | | SembCorp Industries Ltd. | | | 105,758 |
| 50,000 | | | | SembCorp Marine Ltd. | | | 92,160 |
| 23,000 | | | | Singapore Airlines Ltd. | | | 210,570 |
| 53,000 | | | | Singapore Exchange Ltd. | | | 258,092 |
| 134,000 | | | | Singapore Press Holdings Ltd. | | | 291,595 |
| 534,000 | | | | Singapore Telecommunications Ltd. | | | 1,101,719 |
| 90,000 | | | | United Overseas Bank Ltd. | | | 908,171 |
| 57,000 | | | | Wilmar International Ltd. | | | 196,602 |
| | | | | | | |
| | | | | | | 6,007,766 |
| | | | | | | |
Spain: 4.5% | | | |
| 9,129 | | | | Abertis Infraestructuras SA | | | 172,398 |
| 1,178 | | | | Acciona SA | | | 145,465 |
| 7,043 | | | | Acerinox SA | | | 130,844 |
| 11,059 | | | | ACS Actividades de Construccion y Servicios SA | | | 561,386 |
| 239,885 | | | | Banco Bilbao Vizcaya Argentaria SA | | | 3,020,522 |
| 30,129 | | | | Banco De Sabadell SA | | | 188,443 |
| 12,406 | | | | Banco de Valencia SA | | | 120,622 |
| 37,657 | | | | Banco Popular Espanol SA | | | 329,495 |
| 533,135 | | | | Banco Santander Central Hispano SA | | | 6,444,642 |
| 25,223 | | | | Bankinter SA | | | 299,233 |
| 28,021 | | | | Corp. Mapfre SA | | | 91,549 |
| 33,651 | | | | Criteria Caixacorp SA | | | 155,965 |
| 13,536 | | @ | | EDP Renovaveis SA | | | 138,865 |
| 8,377 | | | | Enagas | | | 165,317 |
| 2,990 | | | | Fomento de Construcciones y Contratas SA | | | 123,028 |
| 12,913 | | | | Gamesa Corp. Tecnologica SA | | | 246,189 |
| 9,384 | | | | Gas Natural SDG SA | | | 171,370 |
| 5,655 | | | | Grifols SA | | | 100,313 |
| 3,351 | | | | Grupo Ferrovial | | | 108,011 |
| 53,928 | | @ | | Iberdrola Renovables | | | 247,236 |
| 239,724 | | | | Iberdrola SA | | | 1,954,856 |
| 26,624 | | | | Iberia Lineas Aereas de Espana | | | 56,633 |
| 12,966 | | S | | Inditex SA | | | 624,017 |
| 5,314 | | | | Indra Sistemas SA | | | 115,334 |
| 5,954 | | | | Red Electrica de Espana | | | 269,894 |
| 48,634 | | | | Repsol YPF SA | | | 1,088,670 |
| 276,463 | | | | Telefonica SA | | | 6,278,385 |
| 7,799 | | | | Zardoya-Otis SA | | | 163,279 |
| | | | | | | |
| | | | | | | 23,511,961 |
| | | | | | | |
Sweden: 2.3% | | | |
| 14,125 | | | | Alfa Laval AB | | | 135,368 |
| 12,400 | | | | Assa Abloy AB | | | 173,387 |
| 50,400 | | | | Atlas Copco AB - Class A | | | 507,488 |
| 33,200 | | | | Atlas Copco AB - Class B | | | 301,615 |
| 10,800 | | | | Electrolux AB | | | 151,088 |
| 7,774 | | | | Getinge AB | | | 102,058 |
| 30,375 | | | | Hennes & Mauritz AB | | | 1,516,754 |
| 3,100 | | | | Holmen AB | | | 67,880 |
| 25,644 | | | | Investor AB | | | 396,522 |
| 9,000 | | @ | | Lundin Petroleum AB | | | 69,976 |
| 3,084 | | @ | | Millicom International Cellular SA | | | 173,968 |
| 217,570 | | | | Nordea Bank AB | | | 1,729,110 |
| 64,400 | | | | Sandvik AB | | | 479,991 |
| 16,300 | | | | Scania AB - B Shares | | | 162,180 |
| 10,600 | | | | Securitas AB | | | 90,269 |
| 103,300 | | | | Skandinaviska Enskilda Banken AB | | | 456,880 |
| 11,400 | | | | Skanska AB | | | 127,905 |
See Accompanying Notes to Financial Statements
100
| | |
| ING INTERNATIONAL INDEX PORTFOLIO | | PORTFOLIO OF INVESTMENTS AS OF JUNE 30, 2009 (UNAUDITED) (CONTINUED) |
| | | | | | | |
| Shares | | | | | | Value |
| | | | | | | |
Sweden: (continued) | | | |
| 15,400 | | | | SKF AB - B Shares | | $ | 190,341 |
| 10,000 | | | | SSAB Svenskt Staal AB - Class A | | | 116,796 |
| 8,400 | | | | SSAB Svenskt Staal AB - Class B | | | 90,696 |
| 44,400 | | | | Svenska Cellulosa AB - B Shares | | | 467,462 |
| 33,100 | | | | Svenska Handelsbanken AB | | | 627,683 |
| 13,990 | | | | Swedbank AB | | | 81,787 |
| 11,000 | | | | Swedish Match AB | | | 179,200 |
| 10,922 | | | | Tele2 AB - B Shares | | | 110,614 |
| 203,600 | | | | Telefonaktiebolaget LM Ericsson | | | 2,005,751 |
| 143,000 | | | | TeliaSonera AB | | | 752,638 |
| 116,500 | | | | Volvo AB | | | 721,075 |
| | | | | | | |
| | | | | | | 11,986,482 |
| | | | | | | |
Switzerland: 7.6% | | | |
| 150,039 | | @ | | ABB Ltd. | | | 2,369,218 |
| 3,761 | | @ | | Actelion Ltd. - Reg | | | 197,130 |
| 4,516 | | | | Adecco SA | | | 188,756 |
| 2,990 | | @ | | Aryzta AG | | | 96,440 |
| 2,195 | | | | Baloise Holding AG | | | 163,228 |
| 33,342 | | | | Compagnie Financiere Richemont SA | | | 695,124 |
| 71,650 | | | | Credit Suisse Group | | | 3,282,716 |
| 1,513 | | | | Geberit AG - Reg | | | 186,416 |
| 524 | | | | Givaudan | | | 321,656 |
| 14,932 | | | | Holcim Ltd. | | | 850,141 |
| 14,710 | | | | Julius Baer Holding AG - Reg | | | 572,104 |
| 2,320 | | | | Kuehne & Nagel International AG | | | 182,237 |
| 6,795 | | @ | | Logitech International SA | | | 94,451 |
| 2,581 | | | | Lonza Group AG | | | 256,752 |
| 232,234 | | S | | Nestle SA | | | 8,768,795 |
| 5,672 | | | | Nobel Biocare Holding AG | | | 124,125 |
| 134,812 | | | | Novartis AG | | | 5,487,825 |
| 1,801 | | | | Pargesa Holding SA | | | 112,475 |
| 45,664 | | | | Roche Holding AG | | | 6,221,821 |
| 2,674 | | S | | Schindler Holding AG | | | 166,345 |
| 289 | | | | SGS SA | | | 358,963 |
| 2,105 | | | | Sonova Holding AG - Reg | | | 171,404 |
| 25,415 | | | | STMicroelectronics NV | | | 191,590 |
| 1,100 | | | | Swatch Group AG - BR | | | 177,037 |
| 2,736 | | | | Swatch Group AG - Reg | | | 89,857 |
| 1,292 | | @ | | Swiss Life Holding | | | 111,823 |
| 20,842 | | | | Swiss Reinsurance | | | 692,527 |
| 979 | | | | Swisscom AG | | | 301,259 |
| 6,220 | | | | Syngenta AG | | | 1,447,182 |
| 4,242 | | | | Synthes, Inc. | | | 410,180 |
| 195,107 | | @ | | UBS AG - Reg | | | 2,395,605 |
| 124,292 | | | | Xstrata PLC | | | 1,350,837 |
| 9,870 | | | | Zurich Financial Services AG | | | 1,744,555 |
| | | | | | | |
| | | | | | | 39,780,574 |
| | | | | | | |
United Kingdom: 17.9% | | | |
| 32,588 | | | | 3i Group PLC | | | 130,372 |
| 13,946 | | | | Admiral Group PLC | | | 199,984 |
| 9,116 | | | | Amec PLC | | | 98,231 |
| 89,982 | | | | Anglo American PLC | | | 2,630,990 |
| 13,797 | | | | Antofagasta PLC | | | 133,954 |
| 15,398 | | | | Associated British Foods PLC | | | 193,988 |
| 95,085 | | | | AstraZeneca PLC | | | 4,192,529 |
| 8,438 | | @ | | Autonomy Corp. PLC | | | 199,936 |
| 183,306 | | | | Aviva PLC | | | 1,032,081 |
| 224,337 | | | | BAE Systems PLC | | | 1,253,599 |
| 21,040 | | | | Balfour Beatty PLC | | | 107,215 |
| 538,394 | | | | Barclays PLC | | | 2,501,941 |
| 7,889 | | @ | | Berkeley Group Holdings PLC | | | 104,581 |
| | | | | | | |
| Shares | | | | | | Value |
| | | | | | | |
United Kingdom: (continued) | | | |
| 222,920 | | | | BG Group PLC | | $ | 3,753,899 |
| 147,500 | | | | BHP Billiton PLC | | | 3,324,445 |
| 1,157,960 | | | | BP PLC | | | 9,149,970 |
| 32,574 | | | | British Airways PLC | | | 67,118 |
| 124,361 | | | | British American Tobacco PLC | | | 3,432,879 |
| 74,481 | | | | British Sky Broadcasting PLC | | | 559,108 |
| 452,348 | | | | BT Group PLC | | | 757,907 |
| 11,645 | | | | Bunzl PLC | | | 96,568 |
| 19,704 | | | | Burberry Group PLC | | | 137,321 |
| 106,909 | | | | Cable & Wireless PLC | | | 234,656 |
| 82,652 | | | | Cadbury PLC | | | 706,483 |
| 5,216 | | @ | | Cairn Energy PLC | | | 201,679 |
| 38,354 | | | | Capita Group PLC | | | 452,223 |
| 11,606 | | | | Carnival PLC | | | 309,110 |
| 324,329 | | | | Centrica PLC | | | 1,192,568 |
| 79,917 | | | | Cobham PLC | | | 227,619 |
| 111,822 | | | | Compass Group PLC | | | 631,201 |
| 160,098 | | | | Diageo PLC | | | 2,299,505 |
| 11,935 | | | | Drax Group PLC | | | 86,393 |
| 61,820 | | | | Experian Group Ltd. | | | 463,606 |
| 20,735 | | | | Firstgroup PLC | | | 122,441 |
| 191,783 | | | | Friends Provident Group PLC | | | 207,393 |
| 337,657 | | | | GlaxoSmithKline PLC | | | 5,964,136 |
| 37,354 | | | | Group 4 Securicor PLC | | | 128,658 |
| 40,506 | | S | | Home Retail Group | | | 173,877 |
| 1,093,463 | | | | HSBC Holdings PLC | | | 9,109,822 |
| 27,233 | | | | ICAP PLC | | | 202,831 |
| 65,174 | | | | Imperial Tobacco Group PLC | | | 1,696,318 |
| 11,533 | | | | Intercontinental Hotels Group PLC | | | 118,721 |
| 103,356 | | | | International Power PLC | | | 405,963 |
| 27,264 | | | | Invensys PLC | | | 100,669 |
| 18,501 | | | | Investec PLC | | | 99,668 |
| 50,372 | | | | J Sainsbury PLC | | | 260,133 |
| 8,116 | | S | | Johnson Matthey PLC | | | 154,118 |
| 8,972 | | | | Kazakhmys PLC | | | 93,566 |
| 165,541 | | | | Kingfisher PLC | | | 485,674 |
| 34,338 | | | | Ladbrokes PLC | | | 104,059 |
| 297,039 | | | | Legal & General Group PLC | | | 277,835 |
| 1,029,454 | | | | Lloyds TSB Group PLC | | | 1,186,744 |
| 6,446 | | | | Lonmin PLC | | | 124,940 |
| 84,246 | | | | Man Group PLC | | | 386,174 |
| 78,516 | | | | Marks & Spencer Group PLC | | | 395,926 |
| 166,138 | | | | National Grid PLC | | | 1,499,180 |
| 11,303 | | | | Next PLC | | | 273,853 |
| 274,082 | | | | Old Mutual PLC | | | 366,028 |
| 57,307 | | | | Pearson PLC | | | 577,098 |
| 160,021 | | | | Prudential PLC | | | 1,093,817 |
| 4,459 | | | | Randgold Resources Ltd. | | | 287,360 |
| 39,287 | | | | Reckitt Benckiser PLC | | | 1,794,154 |
| 71,569 | | | | Reed Elsevier PLC | | | 534,667 |
| 25,424 | | | | Rexam PLC | | | 119,497 |
| 60,848 | | | | Rio Tinto PLC | | | 2,107,251 |
| 122,486 | | @ | | Rolls-Royce Group PLC | | | 732,340 |
| 5,328,265 | | @ | | Rolls-Royce Group PLC - C Shares Entitlement | | | 8,766 |
| 215,696 | | | | Royal & Sun Alliance Insurance Group | | | 428,298 |
| 1,103,237 | | | | Royal Bank of Scotland Group PLC | | | 701,211 |
| 59,392 | | S | | SABMiller PLC | | | 1,212,660 |
| 85,625 | | | | Sage Group PLC | | | 251,580 |
| 56,060 | | | | Scottish & Southern Energy PLC | | | 1,054,725 |
| 22,522 | | | | Serco Group PLC | | | 156,728 |
| 8,463 | | | | Severn Trent PLC | | | 152,614 |
See Accompanying Notes to Financial Statements
101
| | |
| ING INTERNATIONAL INDEX PORTFOLIO | | PORTFOLIO OF INVESTMENTS AS OF JUNE 30, 2009 (UNAUDITED) (CONTINUED) |
| | | | | | | |
| Shares | | | | | | Value |
| | | | | | | |
United Kingdom: (continued) | | | |
| 35,939 | | S | | Shire PLC | | $ | 496,023 |
| 62,666 | | | | Smith & Nephew PLC | | | 465,241 |
| 12,852 | | | | Smiths Group PLC | | | 148,708 |
| 114,930 | | | | Standard Chartered PLC | | | 2,161,029 |
| 101,032 | | | | Standard Life PLC | | | 310,318 |
| 521,574 | | | | Tesco PLC | | | 3,045,912 |
| 7,056 | | | | Thomson Reuters PLC | | | 201,811 |
| 56,134 | | | | Tomkins PLC | | | 136,927 |
| 25,124 | | | | TUI Travel PLC | | | 96,041 |
| 43,851 | | | | Tullow Oil PLC | | | 679,163 |
| 88,360 | | | | Unilever PLC | | | 2,076,643 |
| 33,843 | | | | United Utilities Group PLC | | | 277,515 |
| 6,425 | | | | Vedanta Resources PLC | | | 136,784 |
| 3,350,975 | | | | Vodafone Group PLC | | | 6,517,440 |
| 6,883 | | | | Whitbread PLC | | | 92,840 |
| 149,060 | | | | WM Morrison Supermarkets PLC | | | 582,197 |
| 17,581 | | @ | | Wolseley PLC | | | 336,558 |
| 75,983 | | | | WPP PLC | | | 505,286 |
| | | | | | | |
| | | | | | | 94,281,588 |
| | | | | | | |
| | | | Total Common Stock (Cost $602,790,981) | | | 493,114,146 |
| | | | | | | |
REAL ESTATE INVESTMENT TRUSTS: 0.8% |
Australia: 0.4% |
| 70,963 | | | | CFS Retail Property Trust | | | 94,011 |
| 339,844 | | | | Dexus Property Group | | | 204,469 |
| 651,321 | | | | GPT Group | | | 254,876 |
| 59,677 | | S | | Mirvac Group | | | 51,712 |
| 95,518 | | | | Stockland | | | 246,392 |
| 132,413 | | | | Westfield Group | | | 1,211,885 |
| | | | | | | |
| | | | | | | 2,063,345 |
| | | | | | | |
France: 0.1% |
| 4,870 | | @ | | Unibail | | | 728,135 |
| | | | | | | |
| | | | | | | 728,135 |
| | | | | | | |
Hong Kong: 0.1% |
| 94,500 | | | | Link Real Estate Investment Trust | | | 200,842 |
| | | | | | | |
| | | | | | | 200,842 |
| | | | | | | |
Japan: 0.1% |
| 30 | | | | Japan Real Estate Investment Corp. | | | 248,848 |
| 32 | | | | Nippon Building Fund, Inc. | | | 273,535 |
| | | | | | | |
| | | | | | | 522,383 |
| | | | | | | |
Netherlands: 0.0% |
| 1,920 | | | | Corio NV | | | 93,638 |
| | | | | | | |
| | | | | | | 93,638 |
| | | | | | | |
United Kingdom: 0.1% |
| 27,652 | | | | British Land Co. PLC | | | 174,120 |
| 38,397 | | | | Hammerson PLC | | | 194,702 |
| 17,952 | | | | Land Securities Group PLC | | | 139,604 |
| 1,860 | | @ | | Liberty International PLC | | | 12,193 |
| 230,550 | | | | Segro PLC | | | 92,195 |
| | | | | | | |
| | | | | | | 612,814 |
| | | | | | | |
| | | | Total Real Estate Investment Trusts
(Cost $5,737,157) | | | 4,221,157 |
| | | | | | | |
| | | | | | | |
| Shares | | | | | | Value |
| | | | | | | |
PREFERRED STOCK: 0.3% |
Germany: 0.3% |
| 4,574 | | | | Fresenius AG | | $ | 247,340 |
| 15,391 | | | | Henkel KGaA - Vorzug | | | 480,648 |
| 4,413 | | | | Porsche AG | | | 297,044 |
| 1,650 | | | | RWE AG | | | 110,232 |
| 8,991 | | | | Volkswagen AG | | | 628,918 |
| | | | | | | |
| | | | Total Preferred Stock
(Cost $2,541,358) | | | 1,764,182 |
| | | | | | | |
RIGHTS: 0.1% |
Australia: 0.0% |
| 19,912 | | | | Mirvac Group | | | 1,284 |
| 8,786 | | | | Rio Tinto Ltd. | | | 169,277 |
| | | | | | | |
| | | | | | | 170,561 |
| | | | | | | |
Belgium: 0.0% |
| 59,263 | | | | Fortis | | | — |
| | | | | | | |
| | | | | | | — |
| | | | | | | |
France: 0.0% |
| 1,935 | | | | Casino Guichard Perrachon SA | | | 7,465 |
| | | | | | | |
| | | | | | | 7,465 |
| | | | | | | |
Italy: 0.0% |
| 37,830 | | | | Unione di Banche Italiane SCPA | | | 2,585 |
| | | | | | | |
| | | | | | | 2,585 |
| | | | | | | |
Norway: 0.0% |
| 2,034 | | | | Renewable Energy Corp. A/S | | | 7,275 |
| | | | | | | |
| | | | | | | 7,275 |
| | | | | | | |
Singapore: 0.0% |
| 42,805 | | | | Golden Agri-Resources Ltd. | | | 5,912 |
| | | | | | | |
| | | | | | | 5,912 |
| | | | | | | |
Spain: 0.0% |
| 7,029 | | | | Zardoya-Otis SA | | | 7,149 |
| | | | | | | |
| | | | | | | 7,149 |
| | | | | | | |
United Kingdom: 0.1% |
| 12,570 | | | | HSBC Bank PLC | | | — |
| 27,220 | | | | Rio Tinto PLC | | | 312,580 |
| | | | | | | |
| | | | | | | 312,580 |
| | | | | | | |
| | | | Total Rights (Cost $1,083,949) | | | 513,527 |
| | | | | | | |
WARRANTS: 0.0% |
Italy: 0.0% |
| 26,395 | | | | Unione di Banche Italiane SCPA | | | 2,037 |
| | | | | | | |
| | | | Total Warrants (Cost $—) | | | 2,037 |
| | | | | | | |
| | | | Total Long-Term Investments
(Cost $612,153,445) | | | 499,615,049 |
| | | | | | | |
See Accompanying Notes to Financial Statements
102
| | |
| ING INTERNATIONAL INDEX PORTFOLIO | | PORTFOLIO OF INVESTMENTS AS OF JUNE 30, 2009 (UNAUDITED) (CONTINUED) |
| | | | | | | | | | |
| Shares | | | | | | | | | Value |
SHORT-TERM INVESTMENTS: 0.9% |
Affiliated Mutual Fund: 0.9% |
| 4,666,000 | | S | | ING Institutional Prime Money Market Fund - Class I | | | | | $ | 4,666,000 |
| | | | | | | | | | |
| | | | Total Short-Term Investments
(Cost $4,666,000) | | | | | | 4,666,000 |
| | | | | | | | | | |
| | | | Total Investments in Securities
(Cost $616,819,445)* | | 95.6 | % | | $ | 504,281,049 |
| | | | Other Assets and Liabilities - Net | | 4.4 | | | | 23,264,520 |
| | | | | | | | | | |
| | | | Net Assets | | 100.0 | % | | $ | 527,545,569 |
| | | | | | | | | | |
| @ | Non-income producing security |
| ADR | American Depositary Receipt |
| S | All or a portion of this security is segregated to cover collateral requirements for applicable futures, options, swaps, foreign forward currency contracts and/or when-issued or delayed-delivery securities. |
| ** | Investment in affiliate |
| X | Fair value determined by ING Funds Valuation Committee appointed by the Funds’ Board of Directors/Trustees. |
| * | Cost for federal income tax purposes is $619,858,539. |
| | | | |
Net unrealized depreciation consists of: | |
Gross Unrealized Appreciation | | $ | 3,337,014 | |
Gross Unrealized Depreciation | | | (118,914,504 | ) |
| | | | |
Net Unrealized Depreciation | | $ | (115,577,490 | ) |
| | | | |
| | | |
Industry | | Percentage of Net Assets | |
Advertising | | 0.1 | % |
Aerospace/Defense | | 0.6 | |
Agriculture | | 1.2 | |
Airlines | | 0.2 | |
Apparel | | 0.3 | |
Auto Manufacturers | | 3.8 | |
Auto Parts & Equipment | | 0.7 | |
Banks | | 14.7 | |
Beverages | | 1.8 | |
Biotechnology | | 0.2 | |
Building Materials | | 1.1 | |
Chemicals | | 3.0 | |
Commercial Services | | 1.0 | |
Computers | | 0.4 | |
Cosmetics/Personal Care | | 0.5 | |
Distribution/Wholesale | | 1.1 | |
Diversified | | 0.4 | |
Diversified Financial Services | | 1.2 | |
Electric | | 5.0 | |
Electrical Components & Equipment | | 0.9 | |
| | | |
Industry | | Percentage of Net Assets | |
Electronics | | 1.4 | % |
Energy - Alternate Sources | | 0.1 | |
Engineering & Construction | | 1.3 | |
Entertainment | | 0.3 | |
Environmental Control | | 0.0 | |
Food | | 5.2 | |
Food Service | | 0.2 | |
Forest Products & Paper | | 0.2 | |
Gas | | 0.6 | |
Hand/Machine Tools | | 0.2 | |
Healthcare - Products | | 0.5 | |
Healthcare - Services | | 0.1 | |
Holding Companies - Diversified | | 0.8 | |
Home Builders | | 0.1 | |
Home Furnishings | | 0.8 | |
Household Products/Wares | | 0.5 | |
Insurance | | 4.3 | |
Internet | | 0.2 | |
Investment Companies | | 0.2 | |
Iron/Steel | | 1.3 | |
Leisure Time | | 0.2 | |
Lodging | | 0.2 | |
Machinery - Construction & Mining | | 0.4 | |
Machinery - Diversified | | 0.9 | |
Media | | 1.1 | |
Metal Fabricate/Hardware | | 0.3 | |
Mining | | 3.9 | |
Miscellaneous Manufacturing | | 1.2 | |
Office Property | | 0.1 | |
Office/Business Equipment | | 0.6 | |
Oil & Gas | | 8.0 | |
Oil & Gas Services | | 0.2 | |
Packaging & Containers | | 0.1 | |
Pharmaceuticals | | 6.7 | |
Real Estate | | 1.4 | |
Retail | | 1.9 | |
Semiconductors | | 0.4 | |
Shipbuilding | | 0.0 | |
Shopping Centers | | 0.3 | |
Software | | 0.6 | |
Telecommunications | | 7.2 | |
Textiles | | 0.2 | |
Toys/Games/Hobbies | | 0.4 | |
Transportation | | 1.6 | |
Venture Capital | | 0.0 | |
Water | | 0.3 | |
Short-Term Investments | | 0.9 | |
Other Assets and Liabilities - Net | | 4.4 | |
| | | |
Net Assets | | 100.0 | % |
| | | |
See Accompanying Notes to Financial Statements
103
| | |
| ING INTERNATIONAL INDEX PORTFOLIO | | PORTFOLIO OF INVESTMENTS AS OF JUNE 30, 2009 (UNAUDITED) (CONTINUED) |
Fair Value Measurements*
The following is a summary of the inputs used as of June 30, 2009 in determining the Portfolio’s investments at fair value for purposes of SFAS 157:
| | | | | | | | | | |
| | | Quoted Prices in Active Markets for Identical Investments
(Level 1) | | | Significant Other Observable Inputs
(Level 2)+ | | Significant Unobservable Inputs
(Level 3) |
Common Stock | | | | | | | | | | |
Australia | | $ | — | | | $ | 34,161,675 | | $ | — |
Austria | | | — | | | | 1,147,286 | | | — |
Belgium | | | — | | | | 4,392,495 | | | — |
Bermuda | | | — | | | | 288,349 | | | — |
China | | | — | | | | 113,127 | | | — |
Cyprus | | | — | | | | 95,120 | | | — |
Denmark | | | — | | | | 4,618,902 | | | — |
Finland | | | — | | | | 5,920,189 | | | — |
France | | | — | | | | 50,173,595 | | | — |
Germany | | | — | | | | 38,603,480 | | | — |
Greece | | | — | | | | 2,258,424 | | | — |
Hong Kong | | | — | | | | 11,244,625 | | | — |
Ireland | | | — | | | | 1,394,462 | | | — |
Italy | | | 80,013 | | | | 16,628,168 | | | — |
Japan | | | 197,353 | | | | 116,425,088 | | | — |
Kazakhstan | | | — | | | | 142,982 | | | — |
Luxembourg | | | — | | | | 2,556,814 | | | — |
Malaysia | | | — | | | | 110,945 | | | — |
Mauritius | | | — | | | | 72,928 | | | — |
Mexico | | | — | | | | 112,484 | | | — |
Netherlands | | | — | | | | 22,547,574 | | | — |
New Zealand | | | — | | | | 244,671 | | | — |
Norway | | | — | | | | 2,774,742 | | | — |
Portugal | | | — | | | | 1,240,284 | | | — |
Singapore | | | — | | | | 6,007,766 | | | — |
Spain | | | — | | | | 23,511,961 | | | — |
Sweden | | | — | | | | 11,986,482 | | | — |
Switzerland | | | — | | | | 39,780,574 | | | — |
United Kingdom | | | 2,107,251 | | | | 92,174,337 | | | — |
| | | | | | | | | | |
Total Common Stock | | | 2,384,617 | | | | 490,729,529 | | | — |
| | | | | | | | | | |
Real Estate Investment Trusts | | | — | | | | 4,221,157 | | | — |
Preferred Stock | | | — | | | | 1,764,182 | | | — |
Rights | | | 337,054 | | | | 176,473 | | | — |
Warrants | | | — | | | | 2,037 | | | — |
Short-Term Investments | | | 4,666,000 | | | | — | | | — |
| | | | | | | | | | |
Total | | $ | 7,387,671 | | | $ | 496,893,378 | | $ | — |
| | | | | | | | | | |
Other Financial Instruments** | | | (518,629 | ) | | | — | | | — |
| | | | | | | | | | |
Total | | $ | (518,629 | ) | | $ | — | | $ | — |
| | | | | | | | | | |
“Fair value” for purposes of SFAS 157 is different from “fair value” as used in the 1940 Act. The former generally implies market value, and can include market quotations as a source of value, and the latter refers to determinations of value in absence of available market quotations.
| * | See NOTE 2, “Significant Accounting Policies” in the Notes to Financial Statements for additional information. |
| ** | Other financial instruments may include open forward foreign currency contracts, futures, swaps, and written options. Forward foreign currency contracts and futures are reported at their unrealized gain/loss at period end. Swaps and written options are reported at their market value at period end. |
| + | The earlier close of the foreign markets gives rise to the possibility that significant events, including broad market moves, may have occurred in the interim and may materially affect the value of those securities. To account for this, the Portfolio may frequently value many of its foreign equity securities using fair value prices based on third party vendor modeling tools to the extent available. Accordingly, a significant portion of the Portfolio’s investments are categorized as Level 2 investments. |
ING International Index Portfolio Open Futures Contracts on June 30, 2009:
| | | | | | | | |
Contract Description | | Number of Contracts | | Expiration Date | | Unrealized Appreciation/ (Depreciation) | |
Long Contracts | | | | | | | | |
CAC40 10 Euro | | 17 | | 07/17/09 | | $ | (44,388 | ) |
DAX Index | | 7 | | 09/18/09 | | | (51,425 | ) |
Dow Jones Euro STOXX 50 | | 210 | | 09/18/09 | | | (230,737 | ) |
FTSE 100 Index | | 78 | | 09/18/09 | | | (193,866 | ) |
FTSE/MIB Index | | 3 | | 09/18/09 | | | (16,070 | ) |
Hang Seng Index | | 4 | | 07/30/09 | | | 8,909 | |
IBEX 35 Index | | 6 | | 07/17/09 | | | 15,204 | |
OMXS30 Index | | 95 | | 07/17/09 | | | 4,589 | |
S&P ASX 200 Index (SPI) | | 24 | | 09/17/09 | | | (27,600 | ) |
Tokyo Price Index (TOPIX) | | 45 | | 09/10/09 | | | 16,755 | |
| | | | | | | | |
| | | | | | $ | (518,629 | ) |
| | | | | | | | |
For the six months ended June 30, 2009, net realized gain (loss) on futures and the net change in unrealized gain (loss) on futures can be found on the Portfolio’s Statement of Operations. For additional information on the reason(s) why the Portfolio may enter into futures contracts and the risks associated with futures contracts, please refer to NOTE 2 in the accompanying Notes to Financial Statements.
See Accompanying Notes to Financial Statements
104
| | |
ING RUSSELL™ GLOBAL LARGECAP INDEX
75% PORTFOLIO | | PORTFOLIO OF INVESTMENTS AS OF JUNE 30, 2009 (UNAUDITED) |
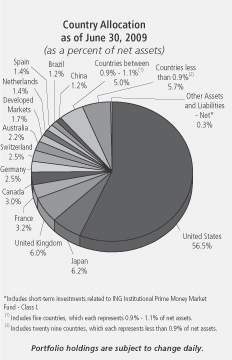
| | | | | | | |
| Shares | | | | | | Value |
| | | | | | | |
COMMON STOCK: 71.1% |
Australia: 2.1% |
| 1,453 | | | | AGL Energy Ltd. | | $ | 15,724 |
| 3,263 | | | | Amcor Ltd. | | | 13,121 |
| 5,974 | | | | AMP Ltd. | | | 23,406 |
| 2,311 | | | | Aquarius Platinum Ltd. | | | 8,933 |
| 646 | | | | ASX Ltd. | | | 19,194 |
| 4,668 | | | | Australia & New Zealand Banking Group Ltd. | | | 61,863 |
| 6,433 | | | | BHP Billiton Ltd. | | | 176,238 |
| 1,312 | | | | Billabong International Ltd. | | | 9,221 |
| 2,788 | | | | Boral Ltd. | | | 9,096 |
| 2,749 | | | | Brambles Ltd. | | | 13,161 |
| 2,475 | | | | Commonwealth Bank of Australia | | | 77,581 |
| 1,612 | | | | Crown Ltd. | | | 9,395 |
| 1,144 | | | | CSL Ltd. | | | 29,580 |
| 4,200 | | @ | | Fortescue Metals Group Ltd. | | | 12,730 |
| 6,072 | | | | Foster’s Group Ltd. | | | 25,159 |
| 3,938 | | | | Incitec Pivot Ltd. | | | 7,494 |
| 4,259 | | | | Insurance Australia Group | | | 12,026 |
| 624 | | | | Leighton Holdings Ltd. | | | 11,770 |
| 4,773 | | | | Macquarie Airports Management Ltd. | | | 8,873 |
| 493 | | | | Macquarie Group Ltd. | | | 15,434 |
| 7,702 | | | | Macquarie Infrastructure Group | | | 8,854 |
| 3,423 | | | | National Australia Bank Ltd. | | | 61,670 |
| 888 | | | | Newcrest Mining Ltd. | | | 21,704 |
| 4,079 | | | | OneSteel Ltd. | | | 8,431 |
| 1,064 | | | | Orica Ltd. | | | 18,518 |
| 2,025 | | | | Origin Energy Ltd. | | | 23,843 |
| 10,496 | | | | Oxiana Ltd. | | | 7,695 |
| 2,060 | | @ | | Paladin Resources Ltd. | | | 8,099 |
| 4,023 | | | | Qantas Airways Ltd. | | | 6,514 |
| 2,281 | | | | QBE Insurance Group Ltd. | | | 36,501 |
| | | | | | | |
| Shares | | | | | | Value |
| | | | | | | |
Australia: (continued) |
| 483 | | | | Rio Tinto Ltd. | | $ | 20,176 |
| 1,865 | | | | Santos Ltd. | | | 21,851 |
| 680 | | | | Sims Group Ltd. | | | 14,160 |
| 1,004 | | | | Sonic Healthcare Ltd. | | | 9,959 |
| 4,691 | | | | Suncorp-Metway Ltd. | | | 25,221 |
| 2,565 | | | | TABCORP Holdings Ltd. | | | 14,762 |
| 8,723 | | | | Telstra Corp., Ltd. | | | 23,804 |
| 3,478 | | | | Toll Holdings Ltd. | | | 17,454 |
| 3,990 | | | | Transurban Group | | | 13,406 |
| 1,578 | | | | Wesfarmers Ltd. | | | 28,732 |
| 5,529 | | | | Westpac Banking Corp. | | | 89,955 |
| 798 | | | | Woodside Petroleum Ltd. | | | 27,568 |
| 2,701 | | | | Woolworths Ltd. | | | 57,304 |
| 671 | | | | WorleyParsons Ltd. | | | 12,788 |
| | | | | | | |
| | | | | | | 1,138,968 |
| | | | | | | |
Austria: 0.2% |
| 416 | | | | Andritz AG | | | 17,542 |
| 740 | | | | Erste Bank der Oesterreichischen Sparkassen AG | | | 20,090 |
| 621 | | | | Evn AG | | | 10,332 |
| 687 | | | | OMV AG | | | 25,828 |
| 225 | | | | Raiffeisen International Bank Holding AG | | | 7,855 |
| | | | | | | |
| | | | | | | 81,647 |
| | | | | | | |
Barbados: 0.1% |
| 200 | | | | Everest Re Group Ltd. | | | 14,314 |
| 950 | | @ | | Nabors Industries Ltd. | | | 14,801 |
| | | | | | | |
| | | | | | | 29,115 |
| | | | | | | |
Belgium: 0.3% |
| 1,163 | | | | Anheuser-Busch InBev NV | | | 42,170 |
| 688 | | | | Belgacom SA | | | 22,001 |
| 366 | | | | Delhaize Group | | | 25,768 |
| 1,114 | | | | Dexia | | | 8,504 |
| 4,374 | | | | Fortis | | | 14,977 |
| 229 | | | | Kbc Ancora | | | 2,361 |
| 461 | | | | KBC Groep NV | | | 8,477 |
| 355 | | | | UCB SA | | | 11,400 |
| 603 | | | | Umicore | | | 13,746 |
| | | | | | | |
| | | | | | | 149,404 |
| | | | | | | |
Bermuda: 0.3% |
| 1,050 | | | | Accenture Ltd. | | | 35,133 |
| 200 | | @ | | Arch Capital Group Ltd. | | | 11,716 |
| 200 | | @ | | Central European Media Enterprises Ltd. | | | 3,938 |
| 1,250 | | | | Ingersoll-Rand Co. | | | 26,125 |
| 300 | | | | Lazard Ltd. | | | 8,076 |
| 900 | | @ | | Marvell Technology Group Ltd. | | | 10,476 |
| 200 | | | | PartnerRe Ltd. | | | 12,990 |
| 200 | | | | RenaissanceRe Holdings Ltd. | | | 9,308 |
| 900 | | | | SeaDrill Ltd. ADR | | | 12,961 |
| 1,150 | | @ | | Tyco Electronics Ltd. | | | 21,379 |
| 1,000 | | | | Tyco International Ltd. | | | 25,980 |
| | | | | | | |
| | | | | | | 178,082 |
| | | | | | | |
Brazil: 0.5% |
| 1,850 | | | | Banco Bradesco S.A. | | | 22,376 |
| 2,300 | | | | Banco do Brasil SA | | | 24,825 |
| 4,600 | | | | BM&F BOVESPA SA | | | 27,466 |
| 900 | | | | Centrais Eletricas Brasileiras SA | | | 13,090 |
| 1,000 | | | | Cia Siderurgica Nacional SA | | | 22,261 |
See Accompanying Notes to Financial Statements
105
| | |
ING RUSSELL™ GLOBAL LARGECAP INDEX
75% PORTFOLIO | | PORTFOLIO OF INVESTMENTS AS OF JUNE 30, 2009 (UNAUDITED) (CONTINUED) |
| | | | | | | |
| Shares | | | | | | Value |
| | | | | | | |
Brazil: (continued) |
| 2,500 | | | | CIA Vale do Rio Doce | | $ | 43,914 |
| 800 | | | | CPFL Energia SA | | | 12,962 |
| 86 | | | | Investimentos Itau SA | | | 379 |
| 600 | | | | Perdigao SA | | | 11,366 |
| 4,600 | | | | Petroleo Brasileiro SA | | | 94,254 |
| | | | | | | |
| | | | | | | 272,893 |
| | | | | | | |
Canada: 3.0% |
| 200 | | | | Agrium, Inc. | | | 7,987 |
| 964 | | | | ARC Energy Trust | | | 14,761 |
| 839 | | | | Bank of Montreal | | | 35,359 |
| 1,800 | | | | Bank of Nova Scotia | | | 67,193 |
| 1,550 | | | | Barrick Gold Corp. | | | 52,171 |
| 750 | | | | BCE, Inc. | | | 15,475 |
| 2,600 | | | | Bombardier, Inc. - Class B | | | 7,712 |
| 750 | | | | Bonavista Energy Trust | | | 11,632 |
| 1,150 | | | | Brookfield Asset Management, Inc. - Class A | | | 19,675 |
| 850 | | | | Brookfield Properties Co. | | | 6,723 |
| 1,000 | | @ | | Cameco Corp. | | | 25,654 |
| 700 | | | | Canadian Imperial Bank of Commerce | | | 35,092 |
| 700 | | | | Canadian National Railway Co. | | | 30,073 |
| 1,100 | | | | Canadian Natural Resources Ltd. | | | 57,868 |
| 500 | | | | Canadian Utilities Ltd. | | | 16,313 |
| 1,750 | | @ | | CGI Group, Inc. - Class A | | | 15,557 |
| 600 | | | | Crescent Point Energy Trust | | | 17,704 |
| 354 | | @ | | Domtar Corp. | | | 5,869 |
| 714 | | | | Enbridge, Inc. | | | 24,775 |
| 1,550 | | | | EnCana Corp. | | | 76,850 |
| 600 | | | | Enerplus Resources Fund | | | 12,963 |
| 1,150 | | | | Ensign Energy Services, Inc. | | | 16,808 |
| 750 | | | | Finning International, Inc. | | | 10,833 |
| 200 | | | | First Quantum Minerals Ltd. | | | 9,672 |
| 500 | | @ | | Gildan Activewear, Inc. | | | 7,407 |
| 1,200 | | | | GoldCorp, Inc. | | | 41,711 |
| 850 | | | | Great-West Lifeco, Inc. | | | 16,662 |
| 1,297 | | | | Harvest Energy Trust | | | 7,058 |
| 800 | | | | Husky Energy, Inc. | | | 22,374 |
| 700 | | | | Imperial Oil Ltd. | | | 27,154 |
| 600 | | | | Industrial Alliance Insurance | | | 13,283 |
| 200 | | | | Inmet Mining Corp. | | | 7,337 |
| 1,650 | | @ | | Ivanhoe Mines Ltd. | | | 9,150 |
| 1,350 | | | | Kinross Gold Corp. | | | 24,606 |
| 3,180 | | | | Manulife Financial Corp. | | | 55,199 |
| 851 | | | | Nexen, Inc. | | | 18,488 |
| 1,540 | | | | Pengrowth Energy Trust | | | 12,154 |
| 1,197 | | | | Penn West Energy Trust | | | 15,241 |
| 1,000 | | | | Petro-Canada | | | 38,619 |
| 650 | | | | Potash Corp. of Saskatchewan | | | 60,627 |
| 950 | | | | Power Corp. of Canada | | | 21,922 |
| 2,115 | | | | Provident Energy Trust | | | 10,583 |
| 800 | | @ | | Research In Motion Ltd. | | | 56,866 |
| 950 | | | | Ritchie Brothers Auctioneers, Inc. | | | 22,297 |
| 1,100 | | | | Rogers Communications, Inc. - Class B (Canadian Denominated Security) | | | 28,277 |
| 2,440 | | | | Royal Bank of Canada | | | 99,790 |
| 600 | | | | Saputo, Inc. | | | 12,519 |
| 950 | | | | Shaw Communications, Inc. - Class B | | | 15,992 |
| 2,300 | | | | Sherritt International Corp. | | | 10,362 |
| 650 | | | | Shoppers Drug Mart Corp. | | | 27,936 |
| 950 | | | | Sun Life Financial, Inc. | | | 25,646 |
| 1,550 | | | | Suncor Energy, Inc. | | | 47,134 |
| 1,450 | | | | Talisman Energy, Inc. | | | 20,831 |
| | | | | | | |
| Shares | | | | | | Value |
| | | | | | | |
Canada: (continued) |
| 500 | | | | Teck Cominco Ltd. - Class A | | $ | 8,619 |
| 1,223 | | | | Teck Cominco Ltd. - Class B | | | 19,504 |
| 500 | | | | TELUS Corp. | | | 13,261 |
| 800 | | | | Tim Hortons, Inc. | | | 19,632 |
| 1,552 | | | | Toronto Dominion Bank | | | 80,179 |
| 300 | | | | Transalta Corp. | | | 5,754 |
| 1,100 | | | | TransCanada Corp. | | | 29,620 |
| 500 | | | | TSX Group, Inc. | | | 14,547 |
| 5,000 | | @ | | UTS Energy Corp. | | | 6,749 |
| 1,850 | | | | Yamana Gold, Inc. (Canadian Denominated Security) | | | 16,446 |
| | | | | | | |
| | | | | | | 1,586,255 |
| | | | | | | |
Chile: 0.0% |
| 2,390 | | @ | | S.A.C.I. Falabella, SA | | | 9,448 |
| | | | | | | |
| | | | | | | 9,448 |
| | | | | | | |
China: 1.2% |
| 12,000 | | | | Aluminum Corp. of China Ltd. | | | 11,230 |
| 6,000 | | | | Angang New Steel Co., Ltd. | | | 9,880 |
| 62,000 | | | | Bank of China Ltd. | | | 29,360 |
| 18,000 | | | | Beijing Capital International Airport Co., Ltd. | | | 12,532 |
| 9,000 | | | | China Coal Energy Co. - Shares H | | | 10,554 |
| 112,000 | | | | China Construction Bank | | | 86,301 |
| 12,500 | | | | China COSCO Holdings Co., Ltd. | | | 14,761 |
| 12,000 | | | | China Life Insurance Co., Ltd. | | | 44,102 |
| 10,000 | | | | China Oilfield Services Ltd. | | | 10,775 |
| 32,000 | | | | China Petroleum & Chemical Corp. | | | 24,228 |
| 8,000 | | | | China Shenhua Energy Co., Ltd. | | | 29,227 |
| 6,000 | | | | China Shipping Development Co., Ltd. | | | 7,673 |
| 42,000 | | | | China Telecom Corp., Ltd. | | | 20,846 |
| 24,000 | | | | Datang International Power Generation Co., Ltd. | | | 14,504 |
| 14,000 | | | | Fujian Zijin Mining Industry Co., Ltd. | | | 12,599 |
| 28,000 | | | | Huaneng Power International, Inc. | | | 19,620 |
| 100,000 | | | | Industrial and Commercial Bank of China Ltd. | | | 69,269 |
| 12,000 | | | | Jiangxi Copper Co., Ltd. | | | 19,497 |
| 12,500 | | | | Parkson Retail Group Ltd. | | | 17,804 |
| 32,000 | | | | PetroChina Co., Ltd. | | | 35,362 |
| 24,000 | | @ | | PICC Property & Casualty Insurance | | | 16,439 |
| 3,000 | | | | Ping An Insurance Group Co. of China Ltd. | | | 20,136 |
| 300 | | @ | | Suntech Power Holdings Co., Ltd. ADR | | | 5,358 |
| 2,000 | | | | Tencent Holdings Ltd. | | | 23,205 |
| 12,000 | | | | Tingyi Cayman Islands Holding Corp. | | | 19,754 |
| 42,000 | | | | Want Want China Holdings Ltd. | | | 23,669 |
| 14,000 | | | | Yanzhou Coal Mining Co., Ltd. | | | 19,198 |
| | | | | | | |
| | | | | | | 627,883 |
| | | | | | | |
Czech Republic: 0.0% |
| 339 | | | | CEZ A/S | | | 15,152 |
| | | | | | | |
| | | | | | | 15,152 |
| | | | | | | |
Denmark: 0.3% |
| 4 | | | | AP Moller - Maersk A/S - Class A | | | 23,443 |
| 150 | | | | Coloplast A/S | | | 10,313 |
| 250 | | | | D/S Norden | | | 8,562 |
| 1,200 | | | | DSV A/S | | | 14,884 |
| 225 | | @ | | Genmab A/S | | | 7,778 |
| 700 | | | | Novo-Nordisk A/S | | | 38,126 |
| 200 | | | | Novozymes A/S | | | 16,271 |
See Accompanying Notes to Financial Statements
106
| | |
ING RUSSELL™ GLOBAL LARGECAP INDEX
75% PORTFOLIO | | PORTFOLIO OF INVESTMENTS AS OF JUNE 30, 2009 (UNAUDITED) (CONTINUED) |
| | | | | | | |
| Shares | | | | | | Value |
| | | | | | | |
Denmark: (continued) |
| 300 | | | | TDC A/S | | $ | 10,406 |
| 400 | | @ | | Vestas Wind Systems A/S | | | 28,706 |
| 300 | | @ | | William Demant Holding | | | 15,536 |
| | | | | | | |
| | | | | | | 174,025 |
| | | | | | | |
Finland: 0.5% |
| 1,117 | | | | Elisa OYJ | | | 18,408 |
| 914 | | | | Fortum OYJ | | | 20,833 |
| 782 | | | | Kone OYJ | | | 24,013 |
| 573 | | | | Metso OYJ | | | 10,727 |
| 852 | | | | Neste Oil OYJ | | | 11,856 |
| 6,724 | | | | Nokia OYJ | | | 98,488 |
| 958 | | | | Orion OYJ | | | 15,025 |
| 758 | | | | Rautaruukki OYJ | | | 15,204 |
| 1,425 | | | | Sampo OYJ | | | 26,944 |
| 2,480 | | | | UPM-Kymmene OYJ | | | 21,643 |
| 458 | | | | Wartsila OYJ | | | 14,788 |
| | | | | | | |
| | | | | | | 277,929 |
| | | | | | | |
France: 3.1% |
| 502 | | | | Accor SA | | | 20,001 |
| 707 | | | | Air France-KLM | | | 9,068 |
| 366 | | | | Air Liquide | | | 33,583 |
| 4,816 | | @ | | Alcatel SA | | | 12,077 |
| 341 | | | | Alstom | | | 20,247 |
| 3,100 | | | | AXA SA | | | 58,674 |
| 1,578 | | | | BNP Paribas | | | 102,906 |
| 332 | | | | Bourbon SA | | | 13,079 |
| 830 | | | | Bouygues SA | | | 31,389 |
| 524 | | | | Capgemini SA | | | 19,393 |
| 947 | | | | Carrefour SA | | | 40,612 |
| 257 | | | | Casino Guichard Perrachon SA | | | 17,406 |
| 200 | | | | Christian Dior SA | | | 14,982 |
| 998 | | | | Cie de Saint-Gobain | | | 33,580 |
| 520 | | | | Cie Generale D’Optique Essilor International SA | | | 24,867 |
| 550 | | @ | | Compagnie Generale de Geophysique SA | | | 9,957 |
| 419 | | | | Compagnie Generale des Etablissements Michelin | | | 23,997 |
| 1,566 | | | | Credit Agricole SA | | | 19,635 |
| 389 | | | | Dassault Systemes SA | | | 17,227 |
| 499 | | | | Electricite de France | | | 24,365 |
| 864 | | @ | | Eutelsat Communications | | | 22,363 |
| 3,557 | | | | France Telecom SA | | | 80,928 |
| 2,252 | | | | Gaz de France | | | 84,298 |
| 1,182 | | | | Groupe Danone | | | 58,609 |
| 173 | | | | Hermes International | | | 24,087 |
| 322 | | | | Lafarge SA | | | 21,908 |
| 126 | | @ | | Lafarge SA | | | 8,249 |
| 327 | | | | L’Oreal SA | | | 24,546 |
| 471 | | | | LVMH Moet Hennessy Louis Vuitton SA | | | 36,123 |
| 3,329 | | | | Natixis | | | 6,479 |
| 192 | | | | Neopost SA | | | 17,289 |
| 201 | | | | Nexans SA | | | 10,736 |
| 385 | | | | Pernod-Ricard SA | | | 24,341 |
| 246 | | | | PPR | | | 20,166 |
| 272 | | | | Remy Cointreau SA | | | 9,876 |
| 385 | | | | Renault SA | | | 14,224 |
| 951 | | | | Rhodia SA | | | 7,228 |
| 1,225 | | | | Safran SA | | | 16,225 |
| 1,870 | | | | Sanofi-Aventis | | | 110,498 |
| 415 | | | | Schneider Electric SA | | | 31,763 |
| | | | | | | |
| Shares | | | | | | Value |
| | | | | | | |
France: (continued) |
| 1,028 | | | | Societe Generale | | $ | 56,428 |
| 367 | | | | Sodexho Alliance SA | | | 18,896 |
| 1,020 | | | | Suez Environnement SA | | | 17,875 |
| 357 | | | | Thales SA | | | 16,027 |
| 3,976 | | | | Total SA | | | 215,502 |
| 314 | | | | Valeo SA | | | 5,799 |
| 923 | | | | Veolia Environnement | | | 27,290 |
| 696 | | | | Vinci SA | | | 31,407 |
| 2,399 | | | | Vivendi | | | 57,585 |
| 210 | | | | Wendel Investissement | | | 6,811 |
| 290 | | | | Zodiac SA | | | 9,460 |
| | | | | | | |
| | | | | | | 1,640,061 |
| | | | | | | |
Germany: 2.4% |
| 775 | | | | Adidas AG | | | 29,533 |
| 840 | | | | Allianz AG | | | 77,484 |
| 94 | | | | AMB Generali Holding AG | | | 7,518 |
| 145 | | | | Axel Springer AG | | | 14,361 |
| 1,819 | | | | BASF AG | | | 72,472 |
| 1,433 | | | | Bayer AG | | | 77,010 |
| 896 | | | | Bayerische Motoren Werke AG | | | 33,847 |
| 366 | | | | Celesio AG | | | 8,408 |
| 1,088 | | | | Commerzbank AG | | | 6,782 |
| 1,719 | | | | DaimlerChrysler AG | | | 62,427 |
| 294 | | | | Deutsche Bank AG | | | 17,934 |
| 1,182 | | | | Deutsche Bank AG | | | 71,855 |
| 308 | | | | Deutsche Boerse AG | | | 23,970 |
| 1,736 | | | | Deutsche Post AG | | | 22,667 |
| 5,570 | | | | Deutsche Telekom AG | | | 65,852 |
| 3,256 | | | | E.ON AG | | | 115,581 |
| 200 | | | | EnBW Energie Baden-Wuerttemberg AG | | | 9,816 |
| 560 | | | | Fresenius Medical Care AG & Co. KGaA | | | 25,164 |
| 617 | | | | Henkel KGaA | | | 16,644 |
| 242 | | | | Hochtief AG | | | 12,221 |
| 2,534 | | @ | | Infineon Technologies AG | | | 9,227 |
| 341 | | | | K+S AG | | | 19,235 |
| 271 | | | | Linde AG | | | 22,264 |
| 349 | | | | MAN AG | | | 21,474 |
| 153 | | | | Merck KGaA | | | 15,569 |
| 266 | | | | MTU Aero Engines Holding AG | | | 9,720 |
| 333 | | | | Muenchener Rueckversicherungs AG | | | 44,990 |
| 607 | | | | Rhoen Klinikum AG | | | 13,419 |
| 717 | | | | RWE AG | | | 56,542 |
| 202 | | | | Salzgitter AG | | | 17,804 |
| 1,522 | | | | SAP AG | | | 61,365 |
| 1,552 | | | | Siemens AG | | | 107,325 |
| 345 | | | | Solarworld AG | | | 8,165 |
| 1,327 | | | | ThyssenKrupp AG | | | 33,059 |
| 174 | | | | Volkswagen AG | | | 58,949 |
| 81 | | | | Wacker Chemie AG | | | 9,354 |
| | | | | | | |
| | | | | | | 1,280,007 |
| | | | | | | |
Greece: 0.1% |
| 950 | | @ | | Emporiki Bank of Greece SA | | | 7,175 |
| 1,488 | | | | Intralot SA - Integrated Lottery Systems & Services | | | 9,089 |
| 1,181 | | | | National Bank of Greece SA | | | 32,763 |
| 1,168 | | | | Piraeus Bank SA | | | 11,629 |
| 744 | | | | Public Power Corp. | | | 15,352 |
| | | | | | | |
| | | | | | | 76,008 |
| | | | | | | |
See Accompanying Notes to Financial Statements
107
| | |
ING RUSSELL™ GLOBAL LARGECAP INDEX
75% PORTFOLIO | | PORTFOLIO OF INVESTMENTS AS OF JUNE 30, 2009 (UNAUDITED) (CONTINUED) |
| | | | | | | |
| Shares | | | | | | Value |
| | | | | | | |
Guernsey: 0.0% |
| 850 | | @ | | Amdocs Ltd. | | $ | 18,233 |
| | | | | | | |
| | | | | | | 18,233 |
| | | | | | | |
Hong Kong: 1.1% |
| 10,000 | | | | Agile Property Holdings Ltd. | | | 14,247 |
| 2,000 | | | | Cheung Kong Holdings Ltd. | | | 22,868 |
| 8,000 | | | | China Everbright Ltd. | | | 19,548 |
| 2,000 | | | | China Merchants Holdings International Co., Ltd. | | | 5,728 |
| 9,500 | | | | China Mobile Ltd. | | | 95,118 |
| 8,320 | | | | China Overseas Land & Investment Ltd. | | | 19,202 |
| 6,000 | | | | China Resources Enterprise | | | 11,970 |
| 4,000 | | | | China Resources Land Ltd. | | | 8,811 |
| 6,000 | | | | China Resources Power Holdings Co. | | | 13,271 |
| 14,294 | | | | China Unicom Ltd. | | | 19,006 |
| 4,000 | | @ | | Citic Pacific Ltd. | | | 8,238 |
| 3,500 | | | | CLP Holdings Ltd. | | | 23,192 |
| 28,000 | | | | CNOOC Ltd. | | | 34,492 |
| 10,000 | | | | Cosco Pacific Ltd. | | | 11,197 |
| 2,700 | | | | Dairy Farm International Holdings Ltd. | | | 17,423 |
| 3,600 | | | | Esprit Holdings Ltd. | | | 20,001 |
| 1,800 | | | | Hang Seng Bank Ltd. | | | 25,193 |
| 12,000 | | | | Hong Kong & China Gas | | | 25,190 |
| 2,000 | | | | Hong Kong Exchanges and Clearing Ltd. | | | 30,913 |
| 4,000 | | | | HongKong Electric Holdings | | | 22,221 |
| 4,200 | | | | Hongkong Land Holdings Ltd. | | | 14,868 |
| 400 | | | | Hopewell Highway Infrastructure Ltd. | | | 224 |
| 4,500 | | | | Hopewell Holdings | | | 14,051 |
| 3,000 | | | | Hutchison Whampoa Ltd. | | | 19,515 |
| 5,000 | | | | Hysan Development Co., Ltd. | | | 12,803 |
| 500 | | | | Jardine Strategic Holdings Ltd. | | | 7,353 |
| 4,000 | | | | Li & Fung Ltd. | | | 10,680 |
| 30,000 | | | | PCCW Ltd. | | | 7,812 |
| 2,000 | | | | Sun Hung Kai Properties Ltd. | | | 24,836 |
| 7,000 | | | | Wharf Holdings Ltd. | | | 29,514 |
| | | | | | | |
| | | | | | | 589,485 |
| | | | | | | |
Hungary: 0.1% | | | |
| 200 | | | | Mol Magyar Olaj- es Gazipari Rt | | | 12,375 |
| 600 | | @ | | OTP Bank Nyrt | | | 10,848 |
| 100 | | | | Richter Gedeon Nyrt | | | 17,986 |
| | | | | | | |
| | | | | | | 41,209 |
| | | | | | | |
Indonesia: 0.1% | | | |
| 32,500 | | | | Bank Rakyat Indonesia | | | 19,926 |
| 43,500 | | | | Bumi Resources Tbk PT | | | 7,858 |
| 51,000 | | | | Perusahaan Gas Negara PT | | | 15,634 |
| 34,000 | | | | Telekomunikasi Indonesia Tbk PT | | | 25,170 |
| | | | | | | |
| | | | | | | 68,588 |
| | | | | | | |
Ireland: 0.2% | | | |
| 2,861 | | | | Bank of Ireland - London Exchange | | | 6,784 |
| 1,000 | | | | Covidien PLC | | | 37,440 |
| 1,577 | | | | CRH PLC | | | 36,246 |
| 2,089 | | | | Irish Life & Permanent PLC | | | 10,597 |
| | | | | | | |
| | | | | | | 91,067 |
| | | | | | | |
Israel: 0.2% | | | |
| 500 | | @ | | Check Point Software Technologies | | | 11,735 |
| 1,536 | | | | Teva Phaemaceutical Industries Ltd. | | | 75,672 |
| | | | | | | |
| | | | | | | 87,407 |
| | | | | | | |
| | | | | | | |
| Shares | | | | | | Value |
| | | | | | | |
Italy: 1.1% | | | |
| 941 | | | | ACEA S.p.A. | | $ | 11,491 |
| 6,193 | | | | AEM S.p.A. | | | 11,318 |
| 2,045 | | | | Alleanza Assicurazioni S.p.A. | | | 14,054 |
| 1,765 | | | | Assicurazioni Generali S.p.A. | | | 36,760 |
| 1,450 | | | | Banca Popolare dell’Emilia Romagna Scrl | | | 19,222 |
| 1,950 | | | | Banca Popolare di Sondrio Scarl | | | 16,350 |
| 1,047 | | | | Banche Popolari Unite Scpa | | | 13,644 |
| 1,878 | | | | Bulgari S.p.A. | | | 10,062 |
| 470 | | | | Credito Bergamasco S.p.A | | | 16,582 |
| 13,606 | | | | Enel S.p.A. | | | 66,424 |
| 4 | | | | Eni Certificate S.p.A. | | | — |
| 3,941 | | | | ENI S.p.A. | | | 93,469 |
| 1,899 | | | | Fiat S.p.A | | | 19,148 |
| 947 | | | | Finmeccanica S.p.A. | | | 13,355 |
| 626 | | | | Fondiaria-Sai S.p.A. | | | 10,105 |
| 18,318 | | | | Intesa Sanpaolo S.p.A. | | | 59,195 |
| 775 | | | | Luxottica Group S.p.A. | | | 16,123 |
| 8,008 | | | | Parmalat S.p.A | | | 19,342 |
| 662 | | | | Saipem S.p.A. | | | 16,174 |
| 2,209 | | | | Snam Rete Gas S.p.A. | | | 9,704 |
| 16,352 | | | | Telecom Italia S.p.A. | | | 22,672 |
| 22,191 | | | | Telecom Italia S.p.A. RNC | | | 21,861 |
| 24,747 | | | | UniCredito Italiano S.p.A. | | | 62,593 |
| | | | | | | |
| | | | | | | 579,648 |
| | | | | | | |
Japan: 6.2% | | | |
| 700 | | | | Advantest Corp. | | | 12,747 |
| 2,400 | | | | Aeon Co., Ltd. | | | 23,681 |
| 1,000 | | | | Ajinomoto Co., Inc. | | | 7,911 |
| 3,000 | | | | All Nippon Airways Co., Ltd. | | | 10,482 |
| 2,000 | | | | Amada Co., Ltd. | | | 12,394 |
| 1,600 | | | | Asahi Breweries Ltd. | | | 22,928 |
| 1,000 | | | | Asics Corp. | | | 9,121 |
| 1,000 | | | | Astellas Pharma, Inc. | | | 35,312 |
| 100 | | | | Benesse Corp. | | | 4,010 |
| 1,200 | | | | Bridgestone Corp. | | | 18,797 |
| 1,800 | | | | Canon, Inc. | | | 58,795 |
| 1,000 | | | | Casio Computer Co., Ltd. | | | 8,957 |
| 5 | | | | Central Japan Railway Co. | | | 30,737 |
| 1,100 | | | | Chubu Electric Power Co., Inc. | | | 25,403 |
| 700 | | | | Chugai Pharmaceutical Co., Ltd. | | | 13,320 |
| 700 | | | | Chugoku Electric Power Co., Inc. | | | 14,615 |
| 2,000 | | | | Citizen Watch Co., Ltd. | | | 10,242 |
| 1,000 | | | | Dai Nippon Printing Co., Ltd. | | | 13,692 |
| 1,200 | | | | Daiichi Sankyo Co., Ltd. | | | 21,419 |
| 300 | | | | Daito Trust Construction Co., Ltd. | | | 14,146 |
| 2,000 | | | | Daiwa Securities Group, Inc. | | | 11,884 |
| 1,000 | | | | Denso Corp. | | | 25,633 |
| 700 | | | | East Japan Railway Co. | | | 42,144 |
| 600 | | | | Eisai Co., Ltd. | | | 21,303 |
| 300 | | | | Fanuc Ltd. | | | 24,041 |
| 100 | | | | Fast Retailing Co., Ltd. | | | 13,032 |
| 700 | | | | Fuji Photo Film Co., Ltd. | | | 22,277 |
| 3,400 | | | | Fujitsu Ltd. | | | 18,470 |
| 3,000 | | | | Furukawa Electric Co., Ltd. | | | 13,496 |
| 700 | | | | Hitachi Construction Machinery Co., Ltd. | | | 11,376 |
| 3,000 | | | | Hitachi Ltd. | | | 9,336 |
| 2,000 | | | | Hitachi Metals Ltd. | | | 17,024 |
| 700 | | | | Hokkaido Electric Power Co., Inc. | | | 13,107 |
| 700 | | | | Hokuriku Electric Power Co. | | | 16,010 |
| 2,800 | | | | Honda Motor Co., Ltd. | | | 77,030 |
| 900 | | | | Hoya Corp. | | | 18,029 |
| 600 | | | | Ibiden Co., Ltd. | | | 16,824 |
See Accompanying Notes to Financial Statements
108
| | |
ING RUSSELL™ GLOBAL LARGECAP INDEX
75% PORTFOLIO | | PORTFOLIO OF INVESTMENTS AS OF JUNE 30, 2009 (UNAUDITED) (CONTINUED) |
| | | | | | | |
| Shares | | | | | | Value |
| | | | | | | |
Japan: (continued) | | | |
| 12,000 | | | | Ishikawajima - Harima Heavy Industries Co., Ltd. | | $ | 20,729 |
| 6,000 | | | | Isuzu Motors Ltd. | | | 9,626 |
| 2,000 | | | | Itochu Corp. | | | 13,878 |
| 2,000 | | | | J Front Retailing Co., Ltd. | | | 9,543 |
| 8,000 | | @ | | Japan Airlines Corp. | | | 15,437 |
| 200 | | | | Japan Petroleum Exploration Co. | | | 11,070 |
| 11 | | | | Japan Tobacco, Inc. | | | 34,384 |
| 1,100 | | | | JFE Holdings, Inc. | | | 36,957 |
| 1,600 | | | | JSR Corp. | | | 27,406 |
| 3,000 | | | | Kajima Corp. | | | 9,339 |
| 1,400 | | | | Kansai Electric Power Co., Inc. | | | 30,882 |
| 1,000 | | | | Kao Corp. | | | 21,760 |
| 8,000 | | | | Kawasaki Heavy Industries Ltd. | | | 22,037 |
| 7 | | | | KDDI Corp. | | | 37,142 |
| 2,000 | | | | Keio Corp. | | | 11,617 |
| 110 | | | | Keyence Corp. | | | 22,410 |
| 5,000 | | | | Kintetsu Corp. | | | 22,040 |
| 2,000 | | | | Kirin Brewery Co., Ltd. | | | 27,903 |
| 1,700 | | | | Komatsu Ltd. | | | 26,247 |
| 1,000 | | | | Konica Minolta Holdings, Inc. | | | 10,448 |
| 2,000 | | | | Kubota Corp. | | | 16,470 |
| 1,500 | | | | Kuraray Co., Ltd. | | | 16,629 |
| 500 | | | | Kurita Water Industries Ltd. | | | 16,148 |
| 500 | | | | Kyocera Corp. | | | 37,537 |
| 1,000 | | | | Kyowa Hakko Kogyo Co., Ltd. | | | 11,282 |
| 700 | | | | Kyushu Electric Power Co., Inc. | | | 15,065 |
| 300 | | | | Lawson, Inc. | | | 13,205 |
| 800 | | | | Makita Corp. | | | 19,359 |
| 5,000 | | | | Marubeni Corp. | | | 22,114 |
| 3,000 | | | | Matsushita Electric Industrial Co., Ltd. | | | 40,418 |
| 4,000 | | | | Mitsubishi Chemical Holdings Corp. | | | 16,919 |
| 2,000 | | | | Mitsubishi Corp. | | | 36,906 |
| 3,000 | | | | Mitsubishi Electric Corp. | | | 18,960 |
| 2,000 | | | | Mitsubishi Estate Co., Ltd. | | | 33,203 |
| 7,000 | | | | Mitsubishi Heavy Industries Ltd. | | | 28,968 |
| 16,700 | | | | Mitsubishi UFJ Financial Group, Inc. | | | 103,119 |
| 3,000 | | | | Mitsui & Co., Ltd. | | | 35,549 |
| 7,000 | | | | Mitsui Engineering & Shipbuilding Co., Ltd. | | | 16,443 |
| 1,000 | | | | Mitsui Fudosan Co., Ltd. | | | 17,344 |
| 2,000 | | | | Mitsui OSK Lines Ltd. | | | 12,925 |
| 800 | | | | Mitsui Sumitomo Insurance Group Holdings, Inc. | | | 20,929 |
| 20,700 | | | | Mizuho Financial Group, Inc. | | | 48,093 |
| 500 | | | | Murata Manufacturing Co., Ltd. | | | 21,340 |
| 4,200 | | | | Nagoya Railroad Co., Ltd. | | | 13,457 |
| 1,400 | | | | Namco Bandai Holdings, Inc. | | | 15,355 |
| 1,000 | | | | NGK Insulators Ltd. | | | 20,382 |
| 200 | | | | Nintendo Co., Ltd. | | | 55,351 |
| 1,000 | | | | Nippon Electric Glass Co., Ltd. | | | 11,179 |
| 3,000 | | | | Nippon Express Co., Ltd. | | | 13,619 |
| 700 | | | | Nippon Paper Group, Inc. | | | 18,108 |
| 3,000 | | | | Nippon Sheet Glass Co., Ltd. | | | 8,742 |
| 7,000 | | | | Nippon Steel Corp. | | | 26,799 |
| 1,400 | | | | Nippon Telegraph & Telephone Corp. | | | 57,016 |
| 5,000 | | | | Nissan Motor Co., Ltd. | | | 30,344 |
| 500 | | | | Nissin Food Products Co., Ltd. | | | 15,119 |
| 3,400 | | | | Nomura Holdings, Inc. | | | 28,699 |
| 700 | | | | Nomura Research Institute Ltd. | | | 15,517 |
| 6 | | | | NTT Data Corp. | | | 19,367 |
| 34 | | | | NTT DoCoMo, Inc. | | | 49,730 |
| 2,000 | | | | OJI Paper Co., Ltd. | | | 8,593 |
| | | | | | | |
| Shares | | | | | | Value |
| | | | | | | |
Japan: (continued) | | | |
| 300 | | | | Ono Pharmaceutical Co., Ltd. | | $ | 13,308 |
| 200 | | | | Oriental Land Co., Ltd. | | | 13,410 |
| 180 | | | | ORIX Corp. | | | 10,714 |
| 5,000 | | | | Osaka Gas Co., Ltd. | | | 15,938 |
| 1,800 | | | | Resona Holdings, Inc. | | | 25,231 |
| 1,000 | | | | Ricoh Co., Ltd. | | | 12,882 |
| 8,000 | | @ | | Sanyo Electric Co., Ltd. | | | 20,719 |
| 300 | | | | Secom Co., Ltd. | | | 12,176 |
| 600 | | | | Seiko Epson Corp. | | | 9,792 |
| 1,500 | | | | Seven & I Holdings Co., Ltd. | | | 35,179 |
| 600 | | | | Shikoku Electric Power Co. | | | 17,895 |
| 700 | | | | Shin-Etsu Chemical Co., Ltd. | | | 32,465 |
| 1,000 | | | | Shionogi & Co., Ltd. | | | 19,321 |
| 1,000 | | | | Shiseido Co., Ltd. | | | 16,360 |
| 1,500 | | | | Softbank Corp. | | | 29,221 |
| 118 | | | | Softbank Investment Corp. | | | 23,964 |
| 7,300 | | | | Sojitz Corp. | | | 16,009 |
| 2,000 | | | | Sompo Japan Insurance, Inc. | | | 13,327 |
| 1,600 | | | | Sony Corp. | | | 41,742 |
| 7 | | | | Sony Financial Holdings, Inc. | | | 19,300 |
| 700 | | | | Stanley Electric Co., Ltd. | | | 14,194 |
| 2,100 | | | | Sumitomo Corp. | | | 21,346 |
| 8,000 | | | | Sumitomo Metal Industries Ltd. | | | 21,266 |
| 1,500 | | | | Sumitomo Mitsui Financial Group, Inc. | | | 60,698 |
| 1,000 | | | | Sumitomo Realty & Development Co., Ltd. | | | 18,259 |
| 4,000 | | | | Sumitomo Trust & Banking Co., Ltd. | | | 21,464 |
| 450 | | | | T&D Holdings, Inc. | | | 12,857 |
| 1,600 | | | | Takeda Pharmaceutical Co., Ltd. | | | 62,208 |
| 300 | | | | TDK Corp. | | | 14,083 |
| 300 | | | | Terumo Corp. | | | 13,226 |
| 2,000 | | | | Tobu Railway Co., Ltd. | | | 11,740 |
| 600 | | | | Toho Co., Ltd. | | | 9,760 |
| 2,000 | | | | Toho Gas Co., Ltd. | | | 8,122 |
| 900 | | | | Tohoku Electric Power Co., Inc. | | | 18,800 |
| 1,400 | | | | Tokio Marine Holdings, Inc. | | | 38,439 |
| 1,900 | | | | Tokyo Electric Power Co., Inc. | | | 48,851 |
| 5,000 | | | | Tokyo Gas Co., Ltd. | | | 17,862 |
| 3,000 | | | | Tokyu Corp. | | | 15,134 |
| 2,000 | | | | Tokyu Land Corp. | | | 9,086 |
| 7,000 | | | | Toshiba Corp. | | | 25,361 |
| 700 | | | | Toyo Seikan Kaisha Ltd. | | | 14,810 |
| 900 | | | | Toyota Boshoku Corp. | | | 13,416 |
| 3,900 | | | | Toyota Motor Corp. | | | 147,488 |
| 800 | | | | Toyota Tsusho Corp. | | | 11,849 |
| 500 | | | | Trend Micro, Inc. | | | 15,966 |
| 8 | | | | West Japan Railway Co. | | | 26,456 |
| 260 | | | | Yamada Denki Co., Ltd. | | | 15,126 |
| 1,200 | | | | Yamaha Motor Co., Ltd. | | | 13,330 |
| 1,000 | | | | Yamato Holdings Co., Ltd. | | | 13,296 |
| | | | | | | |
| | | | | | | 3,320,328 |
| | | | | | | |
Luxembourg: 0.1% | | | |
| 1,497 | | | | ArcelorMittal | | | 49,540 |
| 200 | | @ | | Millicom International Cellular SA | | | 11,252 |
| 132 | | @ | | Reinet Investments SA | | | 1,740 |
| 1,150 | | | | Tenaris SA | | | 15,688 |
| | | | | | | |
| | | | | | | 78,220 |
| | | | | | | |
Malaysia: 0.1% | | | |
| 15,800 | | | | Astro All Asia Networks PLC | | | 14,517 |
| 9,100 | | | | Malayan Banking BHD | | | 15,237 |
| 21,500 | | | | Resorts World BHD | | | 16,466 |
See Accompanying Notes to Financial Statements
109
| | |
ING RUSSELL™ GLOBAL LARGECAP INDEX
75% PORTFOLIO | | PORTFOLIO OF INVESTMENTS AS OF JUNE 30, 2009 (UNAUDITED) (CONTINUED) |
| | | | | | | |
| Shares | | | | | | Value |
| | | | | | | |
Malaysia: (continued) | | | |
| 11,275 | | @ | | TM International Bhd | | $ | 7,587 |
| | | | | | | |
| | | | | | | 53,807 |
| | | | | | | |
Mauritius: 0.0% | | | |
| 35,120 | | | | Golden Agri-Resources Ltd. | | | 9,154 |
| | | | | | | |
| | | | | | | 9,154 |
| | | | | | | |
Mexico: 0.3% | | | |
| 39,210 | | | | America Movil SA de CV - Series L | | | 76,078 |
| 14,872 | | @ | | Cemex SAB de C.V. | | | 13,903 |
| 5,050 | | | | Fomento Economico Mexicano SA de CV ADR | | | 16,287 |
| 5,535 | | | | Grupo Financiero Inbursa SA | | | 14,707 |
| 12,862 | | | | Grupo Mexico SA de CV | | | 14,065 |
| 3,500 | | | | Grupo Modelo SA | | | 12,503 |
| 4,250 | | | | Grupo Televisa SA | | | 14,443 |
| 5,200 | | | | Wal-Mart de Mexico SA de CV | | | 15,420 |
| | | | | | | |
| | | | | | | 177,406 |
| | | | | | | |
Morocco: 0.0% | | | |
| 795 | | | | Douja Promotion Groupe Addoha SA | | | 14,699 |
| | | | | | | |
| | | | | | | 14,699 |
| | | | | | | |
Netherlands: 1.4% | | | |
| 2,379 | | | | Aegon NV | | | 14,729 |
| 520 | | | | Akzo Nobel NV | | | 22,986 |
| 1,000 | | | | ASML Holding NV | | | 21,675 |
| 600 | | | | Chicago Bridge & Iron Co. NV | | | 7,440 |
| 1,105 | | | | European Aeronautic Defence and Space Co. NV | | | 17,946 |
| 698 | | | | Heineken NV | | | 26,013 |
| 345 | | | | Hunter Douglas NV | | | 14,154 |
| 3,225 | | ** | | ING Groep NV | | | 32,673 |
| 2,359 | | | | Koninklijke Ahold NV | | | 27,196 |
| 1,204 | | | | Koninklijke BAM Groep NV | | | 9,806 |
| 1,734 | | | | Koninklijke Philips Electronics NV | | | 32,015 |
| 693 | | @ | | Qiagen NV | | | 12,840 |
| 1,620 | | | | Reed Elsevier NV | | | 17,913 |
| 6,745 | | | | Royal Dutch Shell PLC - Class A | | | 169,193 |
| 5,548 | | | | Royal Dutch Shell PLC - Class B | | | 139,673 |
| 3,003 | | | | Royal KPN NV | | | 41,435 |
| 937 | | | | SBM Offshore NV | | | 16,090 |
| 1,177 | | | | SNS Reaal | | | 6,602 |
| 1,360 | | | | TNT NV | | | 26,583 |
| 3,323 | | | | Unilever NV | | | 80,371 |
| 222 | | | | Van Lanschot NV | | | 11,693 |
| | | | | | | |
| | | | | | | 749,026 |
| | | | | | | |
Norway: 0.2% | | | |
| 1,350 | | | | Acergy SA | | | 13,324 |
| 950 | | | | Aker Kvaerner ASA | | | 7,891 |
| 1,200 | | @ | | Petroleum Geo-Services ASA | | | 7,483 |
| 950 | | @ | | Renewable Energy Corp. A/S | | | 7,418 |
| 2,050 | | | | Statoil ASA | | | 40,494 |
| 4,700 | | | | Storebrand ASA | | | 20,557 |
| 950 | | @ | | Subsea 7, Inc. | | | 9,746 |
| | | | | | | |
| | | | | | | 106,913 |
| | | | | | | |
Philippines: 0.1% | | | |
| 410 | | | | Philippine Long Distance Telephone Co. | | | 20,330 |
| 2,600 | | | | SM Investments Corp. | | | 16,436 |
| | | | | | | |
| | | | | | | 36,766 |
| | | | | | | |
| | | | | | | |
| Shares | | | | | | Value |
| | | | | | | |
Poland: 0.1% | | | |
| 302 | | | | Bank Pekao SA | | $ | 10,900 |
| 210 | | | | Bank Zachodni WBK SA | | | 5,956 |
| 3,400 | | @ | | Getin Holding SA | | | 6,749 |
| 1,450 | | @ | | Globe Trade Centre SA | | | 10,081 |
| 665 | | | | KGHM Polska Miedz SA | | | 17,105 |
| 950 | | | | Polski Koncern Naftowy SA | | | 7,909 |
| 2,217 | | | | Telekomunikacja Polska SA | | | 10,740 |
| | | | | | | |
| | | | | | | 69,440 |
| | | | | | | |
Portugal: 0.1% | | | |
| 6,762 | | | | Energias de Portugal SA | | | 26,563 |
| | | | | | | |
| | | | | | | 26,563 |
| | | | | | | |
Russia: 0.3% | | | |
| 700 | | | | Lukoil-Spon ADR | | | 31,140 |
| 4,944 | | | | OAO Gazprom ADR | | | 100,394 |
| 3,000 | | | | Surgutneftegaz ADR | | | 20,885 |
| | | | | | | |
| | | | | | | 152,419 |
| | | | | | | |
Singapore: 0.4% | | | |
| 2,000 | | | | City Developments Ltd. | | | 11,786 |
| 14,000 | | | | Cosco Corp. Singapore Ltd. | | | 11,990 |
| 3,000 | | | | DBS Group Holdings Ltd. | | | 24,321 |
| 6,000 | | X | | Fraser and Neave Ltd. | | | 16,073 |
| 1,000 | | | | Great Eastern Holdings Ltd. | | | 7,269 |
| 1,000 | | | | Jardine Cycle & Carriage Ltd. | | | 13,199 |
| 2,000 | | | | Keppel Corp., Ltd. | | | 9,480 |
| 5,500 | | | | Oversea-Chinese Banking Corp. | | | 25,252 |
| 5,000 | | | | Singapore Exchange Ltd. | | | 24,348 |
| 7,000 | | | | Singapore Press Holdings Ltd. | | | 15,233 |
| 14,000 | | | | Singapore Telecommunications Ltd. | | | 28,884 |
| 2,000 | | | | United Overseas Bank Ltd. | | | 20,182 |
| 5,000 | | | | Wilmar International Ltd. | | | 17,246 |
| | | | | | | |
| | | | | | | 225,263 |
| | | | | | | |
South Africa: 0.6% | | | |
| 910 | | | | ABSA Group Ltd. | | | 12,985 |
| 3,455 | | | | African Bank Investments Ltd. | | | 12,449 |
| 201 | | | | Anglo Platinum Ltd. | | | 14,239 |
| 600 | | | | Anglogold Ashanti Ltd. ADR | | | 21,989 |
| 1,695 | | | | Barloworld Ltd. | | | 8,536 |
| 1,244 | | | | Exxaro Resources Ltd. | | | 12,221 |
| 9,587 | | | | FirstRand Ltd. | | | 17,500 |
| 1,158 | | | | Impala Platinum Holdings Ltd. | | | 25,624 |
| 1,800 | | | | MTN Group Ltd. | | | 27,645 |
| 950 | | | | Naspers Ltd. | | | 25,020 |
| 1,285 | | | | Nedcor Ltd. | | | 16,361 |
| 946 | | | | Remgro Ltd. | | | 9,102 |
| 4,905 | | | | RMB Holdings Ltd. | | | 14,907 |
| 7,396 | | | | Sanlam Ltd. | | | 16,583 |
| 800 | | | | Sasol Ltd. | | | 27,988 |
| 2,936 | | | | Shoprite Holdings Ltd. | | | 20,939 |
| 2,323 | | | | Standard Bank Group Ltd. | | | 26,724 |
| 7,450 | | @ | | Steinhoff International Holdings Ltd. | | | 12,938 |
| 764 | | @ | | Vodacom Group Pty Ltd. | | | 5,667 |
| | | | | | | |
| | | | | | | 329,417 |
| | | | | | | |
South Korea: 1.0% | | | |
| 140 | | | | CJ CheilJedang Corp. | | | 16,352 |
| 206 | | | | Daelim Industrial Co. | | | 9,913 |
| 1,750 | | | | Daewoo Engineering & Construction Co., Ltd. | | | 17,610 |
| 560 | | | | Daewoo Securities Co. Ltd. | | | 8,279 |
See Accompanying Notes to Financial Statements
110
| | |
ING RUSSELL™ GLOBAL LARGECAP INDEX
75% PORTFOLIO | | PORTFOLIO OF INVESTMENTS AS OF JUNE 30, 2009 (UNAUDITED) (CONTINUED) |
| | | | | | | |
| Shares | | | | | | Value |
| | | | | | | |
South Korea: (continued) | | | |
| 600 | | | | Daewoo Shipbuilder & Marine Engine Co., Ltd. | | $ | 9,344 |
| 204 | | | | Hanjin Heavy Industries & Construction | | | 5,276 |
| 29 | | | | Hite Brewery Co., Ltd. | | | 3,565 |
| 950 | | @ | | Hynix Semiconductor, Inc. | | | 10,094 |
| 70 | | | | Hyundai Mipo Dockyard Co., Ltd. | | | 6,898 |
| 1,300 | | @ | | Industrial Bank of Korea | | | 11,082 |
| 801 | | @ | | KB Financial Group, Inc. | | | 26,704 |
| 93 | | @ | | Korea Express Co., Ltd. | | | 5,948 |
| 470 | | | | Korea Investment Holdings Co., Ltd. | | | 13,434 |
| 1,061 | | | | KT Corp. | | | 30,609 |
| 253 | | | | KT&G Corp. | | | 14,276 |
| 158 | | | | LG Chem Ltd. | | | 17,219 |
| 750 | | | | LG Display Co., Ltd. | | | 18,702 |
| 28 | | @ | | LG Hausys Ltd. | | | 2,550 |
| 3,875 | | | | Macquarie Korea Infrastructure Fund | | | 15,008 |
| 188 | | | | Mirae Asset Securities Co., Ltd. | | | 10,183 |
| 220 | | | | Posco | | | 73,135 |
| 520 | | | | Samsung Card Co. | | | 18,265 |
| 255 | | | | Samsung Electronics Co., Ltd. | | | 117,903 |
| 750 | | | | Samsung Heavy Industries Co., Ltd. | | | 16,940 |
| 200 | | | | Samsung SDI Co., Ltd. | | | 16,173 |
| 958 | | @ | | Shinhan Financial Group Ltd. | | | 24,152 |
| 114 | | | | SK Telecom Co., Ltd. | | | 15,540 |
| 250 | | | | S-Oil Corp. | | | 11,136 |
| 990 | | @ | | Woori Finance Holdings Co. Ltd. | | | 7,851 |
| | | | | | | |
| | | | | | | 554,141 |
| | | | | | | |
Spain: 1.4% | | | |
| 1,387 | | | | Abertis Infraestructuras SA | | | 26,193 |
| 162 | | | | Acciona SA | | | 20,005 |
| 334 | | | | ACS Actividades de Construccion y Servicios SA | | | 16,955 |
| 7,136 | | | | Banco Bilbao Vizcaya Argentaria SA | | | 89,853 |
| 4,264 | | | | Banco De Sabadell SA | | | 26,669 |
| 13,335 | | | | Banco Santander Central Hispano SA | | | 161,196 |
| 1,387 | | | | Bankinter SA | | | 16,455 |
| 406 | | | | Corporacion Financiera Alba SA | | | 19,579 |
| 3,694 | | | | Criteria Caixacorp SA | | | 17,121 |
| 387 | | | | Endesa SA | | | 9,295 |
| 2,327 | | | | Faes Farma SA | | | 14,116 |
| 581 | | | | Gamesa Corp. Tecnologica SA | | | 11,077 |
| 757 | | | | Grifols SA | | | 13,428 |
| 3,845 | | @ | | Iberdrola Renovables | | | 17,628 |
| 6,388 | | | | Iberdrola SA | | | 52,092 |
| 613 | | | | Inditex SA | | | 29,502 |
| 1,649 | | | | Repsol YPF SA | | | 36,913 |
| 8,293 | | | | Telefonica SA | | | 188,331 |
| | | | | | | |
| | | | | | | 766,408 |
| | | | | | | |
Sweden: 0.8% | | | |
| 1,600 | | | | Atlas Copco AB - Class A | | | 16,111 |
| 1,400 | | | | Atlas Copco AB - Class B | | | 12,719 |
| 950 | | | | Hennes & Mauritz AB | | | 47,438 |
| 1,000 | | | | Hexagon AB | | | 9,036 |
| 3,350 | | | | Husqvarna AB - B Shares | | | 18,287 |
| 1,800 | | @ | | Lundin Petroleum AB | | | 13,995 |
| 1,133 | | | | Meda AB | | | 7,807 |
| 6,020 | | | | Nordea Bank AB | | | 47,843 |
| 2,494 | | | | Sandvik AB | | | 18,588 |
| 1,800 | | | | Scania AB - B Shares | | | 17,909 |
| 2,400 | | | | Securitas AB | | | 20,438 |
| 3,400 | | | | Skandinaviska Enskilda Banken AB | | | 15,038 |
| | | | | | | |
| Shares | | | | | | Value |
| | | | | | | |
Sweden: (continued) | | | |
| 1,800 | | | | Svenska Cellulosa AB - B Shares | | $ | 18,951 |
| �� 1,200 | | | | Svenska Handelsbanken AB | | | 22,756 |
| 600 | | | | Swedish Match AB | | | 9,775 |
| 1,200 | | | | Tele2 AB - B Shares | | | 12,153 |
| 1,950 | | | | Telefonaktiebolaget LM Ericsson - Class A | | | 19,072 |
| 5,000 | | | | Telefonaktiebolaget LM Ericsson - Class B | | | 49,257 |
| 2,500 | | | | TeliaSonera AB | | | 13,158 |
| 3,000 | | | | Volvo AB | | | 18,581 |
| 300 | | @ | | Vostok Gas Ltd. | | | — |
| 920 | | @ | | West Siberian Resources Ltd. GDR | | | 10,481 |
| | | | | | | |
| | | | | | | 419,393 |
| | | | | | | |
Switzerland: 2.5% | | | |
| 4,808 | | @ | | ABB Ltd. | | | 75,922 |
| 550 | | | | ACE Ltd. | | | 24,327 |
| 263 | | @ | | Actelion Ltd. - Reg | | | 13,785 |
| 551 | | | | Adecco SA | | | 23,030 |
| 100 | | | | Alcon, Inc. | | | 11,612 |
| 200 | | @ | | Aryzta AG | | | 6,408 |
| 150 | | | | Basler Kantonalbank | | | 15,881 |
| 1,149 | | | | Compagnie Financiere Richemont SA | | | 23,955 |
| 1,925 | | | | Credit Suisse Group | | | 88,196 |
| 501 | | | | Holcim Ltd. | | | 28,524 |
| 539 | | | | Julius Baer Holding AG - Reg | | | 20,963 |
| 928 | | @ | | Logitech International SA | | | 12,899 |
| 190 | | | | Lonza Group AG | | | 18,901 |
| 100 | | @ | | Mettler Toledo International, Inc. | | | 7,715 |
| 6,766 | | | | Nestle SA | | | 255,474 |
| 612 | | | | Nobel Biocare Holding AG | | | 13,393 |
| 4,306 | | | | Novartis AG | | | 175,285 |
| 237 | | @ | | PSP Swiss Property AG | | | 11,323 |
| 1,377 | | | | Roche Holding AG - Genusschein | | | 187,619 |
| 100 | | | | Roche Holding AG - Bearer | | | 14,253 |
| 1,737 | | | | STMicroelectronics NV | | | 13,094 |
| 46 | | | | Straumann Holding AG | | | 8,394 |
| 117 | | | | Swatch Group AG - BR | | | 18,830 |
| 609 | | | | Swiss Reinsurance | | | 20,236 |
| 52 | | | | Swisscom AG | | | 16,002 |
| 202 | | | | Syngenta AG | | | 46,999 |
| 164 | | | | Synthes, Inc. | | | 15,858 |
| 5,531 | | @ | | UBS AG - Reg | | | 67,912 |
| 91 | | | | Valiant Holding | | | 16,810 |
| 3,361 | | | | Xstrata PLC | | | 36,528 |
| 208 | | | | Zurich Financial Services AG | | | 36,765 |
| | | | | | | |
| | | | | | | 1,326,893 |
| | | | | | | |
Taiwan: 0.9% | | | |
| 34,000 | | | | Advanced Semiconductor Engineering, Inc. | | | 19,664 |
| 20,000 | | | | AU Optronics Corp. | | | 19,306 |
| 8,000 | | | | Cathay Financial Holding Co., Ltd. | | | 11,761 |
| 23,000 | | | | China Steel Corp. | | | 19,700 |
| 9,921 | | | | Chunghwa Telecom Co., Ltd. | | | 19,789 |
| 17,000 | | | | Far EasTone Telecommunications Co., Ltd. | | | 19,879 |
| 16,000 | | | | Formosa Chemicals & Fibre Co. | | | 24,015 |
| 6,000 | | | | Formosa Petrochemical Corp. | | | 14,259 |
| 9,000 | | | | Formosa Plastics Corp. | | | 16,009 |
| 2,000 | | | | High Tech Computer Corp. | | | 28,104 |
| 11,500 | | | | HON HAI Precision Industry Co., Ltd. | | | 35,267 |
| 2,000 | | | | MediaTek, Inc. | | | 23,745 |
See Accompanying Notes to Financial Statements
111
| | |
ING RUSSELL™ GLOBAL LARGECAP INDEX
75% PORTFOLIO | | PORTFOLIO OF INVESTMENTS AS OF JUNE 30, 2009 (UNAUDITED) (CONTINUED) |
| | | | | | | |
| Shares | | | | | | Value |
| | | | | | | |
Taiwan: (continued) | | | |
| 38,000 | | | | Mega Financial Holdings Co., Ltd. | | $ | 17,374 |
| 19,000 | | | | Nan Ya Plastics Corp. | | | 24,595 |
| 8,000 | | | | Novatek Microelectronics Corp., Ltd. | | | 19,008 |
| 15,000 | | | | Siliconware Precision Industries Co. | | | 17,355 |
| 44,000 | | | | Sinopac Financial Holdings, Co. | | | 15,332 |
| 27,000 | | | | Taiwan Cooperative Bank | | | 15,488 |
| 47,000 | | | | Taiwan Semiconductor Manufacturing Co., Ltd. | | | 77,136 |
| 15,000 | | | | Uni-President Enterprises Corp. | | | 15,407 |
| 20,000 | | | | Yuanta Financial Holding Co., Ltd. | | | 13,369 |
| | | | | | | |
| | | | | | | 466,562 |
| | | | | | | |
Thailand: 0.1% | | | |
| 4,500 | | | | Advanced Info Service PCL | | | 11,916 |
| 1,500 | | | | Banpu Public Co., Ltd. | | | 14,664 |
| 2,700 | | | | PTT PLC | | | 18,468 |
| 7,100 | | | | Siam Commercial Bank PCL | | | 15,187 |
| | | | | | | |
| | | | | | | 60,235 |
| | | | | | | |
Turkey: 0.1% | | | |
| 3,489 | | | | Akbank TAS | | | 15,461 |
| 2,509 | | | | Eregli Demir ve Celik Fabrikalari TAS | | | 7,152 |
| 4,803 | | | | Haci Omer Sabanci Holding A/S | | | 12,748 |
| 4,655 | | @ | | KOC Holding A/S | | | 7,956 |
| 5,649 | | @ | | Turkiye Garanti Bankasi A/S | | | 15,028 |
| 2,381 | | | | Turkiye Halk Bankasi | | | 9,326 |
| 5,600 | | @ | | Turkiye Vakiflar Bankasi Tao | | | 8,358 |
| | | | | | | |
| | | | | | | 76,029 |
| | | | | | | |
United Kingdom: 5.9% | | | |
| 1,780 | | | | Amec PLC | | | 19,181 |
| 2,496 | | | | Anglo American PLC | | | 72,981 |
| 1,167 | | | | Antofagasta PLC | | | 11,330 |
| 7,305 | | | | ARM Holdings PLC | | | 14,416 |
| 1,686 | | | | Associated British Foods PLC | | | 21,241 |
| 2,537 | | | | AstraZeneca PLC | | | 111,863 |
| 343 | | @ | | Autonomy Corp. PLC | | | 8,127 |
| 5,246 | | | | Aviva PLC | | | 29,537 |
| 6,240 | | | | BAE Systems PLC | | | 34,869 |
| 15,333 | | | | Barclays PLC | | | 71,253 |
| 5,829 | | | | BG Group PLC | | | 98,158 |
| 3,899 | | | | BHP Billiton PLC | | | 87,878 |
| 34,378 | | | | BP PLC | | | 271,648 |
| 3,685 | | | | British American Tobacco PLC | | | 101,721 |
| 3,286 | | | | British Sky Broadcasting PLC | | | 24,667 |
| 14,524 | | | | BT Group PLC | | | 24,335 |
| 1,549 | | | | Bunzl PLC | | | 12,845 |
| 2,514 | | | | Burberry Group PLC | | | 17,521 |
| 4,863 | | | | Cable & Wireless PLC | | | 10,674 |
| 2,534 | | | | Cadbury PLC | | | 21,660 |
| 621 | | @ | | Cairn Energy PLC | | | 24,011 |
| 1,803 | | | | Capita Group PLC | | | 21,259 |
| 457 | | | | Carnival PLC | | | 12,172 |
| 9,647 | | | | Centrica PLC | | | 35,472 |
| 3,455 | | | | Cobham PLC | | | 9,841 |
| 4,408 | | | | Compass Group PLC | | | 24,882 |
| 5,338 | | | | Diageo PLC | | | 76,670 |
| 2,939 | | | | Experian Group Ltd. | | | 22,040 |
| 2,255 | | | | Firstgroup PLC | | | 13,316 |
| 9,477 | | | | GlaxoSmithKline PLC | | | 167,395 |
| 7,678 | | | | Group 4 Securicor PLC | | | 26,445 |
| 12,964 | | | | Hays PLC | | | 18,328 |
| 31,635 | | | | HSBC Holdings PLC | | | 263,556 |
| | | | | | | |
| Shares | | | | | | Value |
| | | | | | | |
United Kingdom: (continued) | | | |
| 1,767 | | | | ICAP PLC | | $ | 13,161 |
| 1,768 | | | | Imperial Tobacco Group PLC | | | 46,017 |
| 32,652 | | | | Inchcape PLC | | | 10,224 |
| 2,044 | | | | Inmarsat PLC | | | 18,385 |
| 1,125 | | | | Intercontinental Hotels Group PLC | | | 11,581 |
| 2,901 | | | | International Power PLC | | | 11,395 |
| 4,679 | | | | Invensys PLC | | | 17,277 |
| 2,442 | | | | Investec PLC | | | 13,155 |
| 2,839 | | | | J Sainsbury PLC | | | 14,661 |
| 1,116 | | | | Johnson Matthey PLC | | | 21,192 |
| 1,271 | | | | Kazakhmys PLC | | | 13,255 |
| 5,882 | | | | Kingfisher PLC | | | 17,257 |
| 4,831 | | | | Ladbrokes PLC | | | 14,640 |
| 14,276 | | | | Legal & General Group PLC | | | 13,353 |
| 16,822 | | | | Lloyds TSB Group PLC | | | 19,392 |
| 8,499 | | | | LogicaCMG PLC | | | 11,072 |
| 411 | | | | Lonmin PLC | | | 7,966 |
| 2,800 | | | | Man Group PLC | | | 12,835 |
| 2,994 | | | | Marks & Spencer Group PLC | | | 15,098 |
| 1,817 | | | | Mitchells & Butlers PLC | | | 7,430 |
| 4,247 | | | | National Grid PLC | | | 38,324 |
| 2,791 | | | | Northumbrian Water Group PLC | | | 11,387 |
| 10,311 | | | | Old Mutual PLC | | | 13,770 |
| 1,938 | | | | Pearson PLC | | | 19,516 |
| 1,446 | | | | Pennon Group PLC | | | 11,509 |
| 2,120 | | | | Persimmon PLC | | | 12,235 |
| 4,154 | | | | Prudential PLC | | | 28,395 |
| 4,698 | | | | QinetiQ PLC | | | 11,113 |
| 187 | | | | Randgold Resources Ltd. | | | 12,051 |
| 1,057 | | | | Reckitt Benckiser PLC | | | 48,271 |
| 3,032 | | | | Reed Elsevier PLC | | | 22,651 |
| 10,196 | | | | Rentokil Initial PLC | | | 15,061 |
| 2,243 | | | | Rio Tinto PLC | | | 77,678 |
| 3,466 | | @ | | Rolls-Royce Group PLC | | | 20,723 |
| 475,932 | | @ | | Rolls-Royce Group PLC - C Shares Entitlement | | | 783 |
| 6,349 | | | | Royal & Sun Alliance Insurance Group | | | 12,607 |
| 33,232 | | | | Royal Bank of Scotland Group PLC | | | 21,122 |
| 1,464 | | | | SABMiller PLC | | | 29,892 |
| 6,355 | | | | Sage Group PLC | | | 18,672 |
| 627 | | | | Schroders PLC | | | 8,484 |
| 1,487 | | | | Scottish & Southern Energy PLC | | | 27,977 |
| 581 | | | | Severn Trent PLC | | | 10,477 |
| 1,224 | | | | Shire PLC | | | 16,893 |
| 1,889 | | | | Smith & Nephew PLC | | | 14,024 |
| 1,105 | | | | Smiths Group PLC | | | 12,786 |
| 2,832 | | | | Stagecoach Group PLC | | | 5,923 |
| 2,802 | | | | Standard Chartered PLC | | | 52,686 |
| 4,836 | | | | Standard Life PLC | | | 14,854 |
| 1,584 | | | | Tate & Lyle PLC | | | 8,319 |
| 16,036 | | | | Tesco PLC | | | 93,648 |
| 727 | | | | Thomson Reuters PLC | | | 20,793 |
| 1,817 | | | | Tullow Oil PLC | | | 28,142 |
| 2,332 | | | | Unilever PLC | | | 54,807 |
| 2,963 | | | | United Utilities Group PLC | | | 24,297 |
| 683 | | | | Vedanta Resources PLC | | | 14,541 |
| 95,797 | | | | Vodafone Group PLC | | | 186,319 |
| 650 | | | | Willis Group Holdings Ltd. | | | 16,725 |
| 6,505 | | | | WM Morrison Supermarkets PLC | | | 25,407 |
| 987 | | @ | | Wolseley PLC | | | 18,894 |
| 3,541 | | | | WPP PLC | | | 23,548 |
| | | | | | | |
| | | | | | | 3,195,942 |
| | | | | | | |
See Accompanying Notes to Financial Statements
112
| | |
ING RUSSELL™ GLOBAL LARGECAP INDEX
75% PORTFOLIO | | PORTFOLIO OF INVESTMENTS AS OF JUNE 30, 2009 (UNAUDITED) (CONTINUED) |
| | | | | | | |
| Shares | | | | | | Value |
| | | | | | | |
United States: 31.6% | | | |
| 1,530 | | | | 3M Co. | | $ | 91,953 |
| 2,960 | | | | Abbott Laboratories | | | 139,238 |
| 1,450 | | @ | | Activision Blizzard, Inc. | | | 18,314 |
| 700 | | @ | | Adobe Systems, Inc. | | | 19,810 |
| 700 | | @ | | Aecom Technology Corp. | | | 22,400 |
| 2,300 | | @ | | AES Corp. | | | 26,703 |
| 1,000 | | | | Aetna, Inc. | | | 25,050 |
| 300 | | @ | | Affiliated Computer Services, Inc. | | | 13,326 |
| 800 | | | | Aflac, Inc. | | | 24,872 |
| 600 | | @ | | Agilent Technologies, Inc. | | | 12,186 |
| 200 | | | | Air Products & Chemicals, Inc. | | | 12,918 |
| 500 | | | | AK Steel Holding Corp. | | | 9,595 |
| 550 | | @ | | Akamai Technologies, Inc. | | | 10,549 |
| 750 | | | | Alberto-Culver Co. | | | 19,073 |
| 2,400 | | | | Alcoa, Inc. | | | 24,792 |
| 300 | | | | Allegheny Energy, Inc. | | | 7,695 |
| 500 | | | | Allegheny Technologies, Inc. | | | 17,465 |
| 700 | | | | Allergan, Inc. | | | 33,306 |
| 300 | | @ | | Alliance Data Systems Corp. | | | 12,357 |
| 100 | | @ | | Alliant Techsystems, Inc. | | | 8,236 |
| 300 | | | | Allied World Assurance Holdings Ltd. | | | 12,249 |
| 1,000 | | | | Allstate Corp. | | | 24,400 |
| 200 | | @ | | Alpha Natural Resources, Inc. | | | 5,254 |
| 950 | | | | Altera Corp. | | | 15,466 |
| 3,920 | | | | Altria Group, Inc. | | | 64,249 |
| 650 | | @ | | Amazon.com, Inc. | | | 54,379 |
| 500 | | | | Ameren Corp. | | | 12,445 |
| 650 | | | | American Electric Power Co., Inc. | | | 18,779 |
| 1,800 | | | | American Express Co. | | | 41,832 |
| 650 | | @ | | American Tower Corp. | | | 20,495 |
| 1,300 | | | | AmerisourceBergen Corp. | | | 23,062 |
| 2,100 | | @ | | Amgen, Inc. | | | 111,174 |
| 1,100 | | | | Anadarko Petroleum Corp. | | | 49,929 |
| 750 | | | | Analog Devices, Inc. | | | 18,585 |
| 650 | | | | AON Corp. | | | 24,616 |
| 650 | | | | Apache Corp. | | | 46,898 |
| 200 | | @ | | Apollo Group, Inc. - Class A | | | 14,224 |
| 1,550 | | @ | | Apple, Inc. | | | 220,767 |
| 2,100 | | | | Applied Materials, Inc. | | | 23,037 |
| 300 | | | | Aptargroup, Inc. | | | 10,131 |
| 850 | | | | Aqua America, Inc. | | | 15,215 |
| 500 | | | | Arch Coal, Inc. | | | 7,685 |
| 1,100 | | | | Archer-Daniels-Midland Co. | | | 29,447 |
| 650 | | | | Arthur J. Gallagher & Co. | | | 13,871 |
| 300 | | | | Assurant, Inc. | | | 7,227 |
| 10,470 | | | | AT&T, Inc. | | | 260,075 |
| 3,500 | | @ | | Atmel Corp. | | | 13,055 |
| 600 | | @ | | Autodesk, Inc. | | | 11,388 |
| 1,100 | | | | Automatic Data Processing, Inc. | | | 38,984 |
| 100 | | @ | | Autozone, Inc. | | | 15,111 |
| 500 | | | | Avery Dennison Corp. | | | 12,840 |
| 600 | | @ | | Avnet, Inc. | | | 12,618 |
| 850 | | | | Avon Products, Inc. | | | 21,913 |
| 800 | | | | Baker Hughes, Inc. | | | 29,152 |
| 300 | | | | Ball Corp. | | | 13,548 |
| 13,442 | | | | Bank of America Corp. | | | 177,434 |
| 200 | | | | Bank of Hawaii Corp. | | | 7,166 |
| 2,070 | | | | Bank of New York Mellon Corp. | | | 60,672 |
| 1,380 | | | | Baxter International, Inc. | | | 73,085 |
| 750 | | | | BB&T Corp. | | | 16,485 |
| 750 | | @ | | BE Aerospace, Inc. | | | 10,770 |
| 300 | | | | Becton Dickinson & Co. | | | 21,393 |
| 650 | | @ | | Bed Bath & Beyond, Inc. | | | 19,988 |
| | | | | | | |
| Shares | | | | | | Value |
| | | | | | | |
United States: (continued) | | | |
| 500 | | | | Bemis Co. | | $ | 12,600 |
| 1,000 | | | | Best Buy Co., Inc. | | | 33,490 |
| 500 | | @ | | Big Lots, Inc. | | | 10,515 |
| 300 | | @ | | Biogen Idec, Inc. | | | 13,545 |
| 300 | | @ | | BJ’s Wholesale Club, Inc. | | | 9,669 |
| 800 | | @ | | BMC Software, Inc. | | | 27,032 |
| 1,550 | | | | Boeing Co. | | | 65,875 |
| 200 | | | | BOK Financial Corp. | | | 7,534 |
| 2,800 | | @ | | Boston Scientific Corp. | | | 28,392 |
| 3,600 | | | | Bristol-Myers Squibb Co. | | | 73,116 |
| 1,050 | | @ | | Broadcom Corp. | | | 26,030 |
| 950 | | | | Broadridge Financial Solutions ADR | | | 15,751 |
| 900 | | @ | | Brocade Communications Systems, Inc. | | | 7,038 |
| 850 | | | | Brown & Brown, Inc. | | | 16,941 |
| 150 | | | | Brown-Forman Corp. | | | 6,447 |
| 300 | | | | Bucyrus International, Inc. | | | 8,568 |
| 300 | | | | Bunge Ltd. | | | 18,075 |
| 650 | | | | Burlington Northern Santa Fe Corp. | | | 47,801 |
| 1,150 | | | | CA, Inc. | | | 20,045 |
| 500 | | | | Cabot Corp. | | | 6,290 |
| 1,250 | | @ | | Calpine Corp. | | | 13,938 |
| 650 | | | | Campbell Soup Co. | | | 19,123 |
| 800 | | | | Capital One Financial Corp. | | | 17,504 |
| 1,050 | | | | CapitalSource, Inc. | | | 5,124 |
| 300 | | | | Capitol Federal Financial | | | 11,499 |
| 500 | | | | Cardinal Health, Inc. | | | 15,275 |
| 600 | | @ | | Career Education Corp. | | | 14,934 |
| 500 | | | | Carlisle Cos., Inc. | | | 12,020 |
| 950 | | @ | | Carmax, Inc. | | | 13,965 |
| 650 | | | | Carnival Corp. | | | 16,751 |
| 1,200 | | | | Caterpillar, Inc. | | | 39,648 |
| 950 | | @ | | CB Richard Ellis Group, Inc. | | | 8,892 |
| 1,750 | | | | CBS Corp. - Class B | | | 12,110 |
| 700 | | @ | | Celgene Corp. | | | 33,488 |
| 850 | | | | Centex Corp. | | | 7,191 |
| 200 | | @ | | Cephalon, Inc. | | | 11,330 |
| 200 | | @ | | Cerner Corp. | | | 12,458 |
| 500 | | | | CH Robinson Worldwide, Inc. | | | 26,075 |
| 1,550 | | | | Charles Schwab Corp. | | | 27,187 |
| 1,250 | | | | Chesapeake Energy Corp. | | | 24,788 |
| 3,720 | | | | Chevron Corp. | | | 246,450 |
| 100 | | @ | | Chipotle Mexican Grill, Inc. | | | 8,000 |
| 800 | | | | Chubb Corp. | | | 31,904 |
| 800 | | | | Cincinnati Financial Corp. | | | 17,880 |
| 11,040 | | @ | | Cisco Systems, Inc. | | | 205,786 |
| 1,550 | | | | CIT Group, Inc. | | | 3,333 |
| 10,480 | | | | Citigroup, Inc. | | | 31,126 |
| 200 | | | | City National Corp. | | | 7,366 |
| 200 | | | | Cliffs Natural Resources, Inc. | | | 4,894 |
| 200 | | | | Clorox Co. | | | 11,166 |
| 100 | | | | CME Group, Inc. | | | 31,111 |
| 450 | | | | Coach, Inc. | | | 12,096 |
| 4,290 | | | | Coca-Cola Co. | | | 205,877 |
| 650 | | @ | | Cognizant Technology Solutions Corp. | | | 17,355 |
| 1,060 | | | | Colgate-Palmolive Co. | | | 74,984 |
| 5,620 | | | | Comcast Corp. - Class A | | | 81,434 |
| 315 | | | | Commerce Bancshares, Inc. | | | 10,026 |
| 750 | | | | Commercial Metals Co. | | | 12,023 |
| 650 | | @ | | Computer Sciences Corp. | | | 28,795 |
| 1,250 | | | | ConAgra Foods, Inc. | | | 23,825 |
| 2,960 | | | | ConocoPhillips | | | 124,498 |
| 500 | | | | Consol Energy, Inc. | | | 16,980 |
| 800 | | | | Consolidated Edison, Inc. | | | 29,936 |
See Accompanying Notes to Financial Statements
113
| | |
ING RUSSELL™ GLOBAL LARGECAP INDEX
75% PORTFOLIO | | PORTFOLIO OF INVESTMENTS AS OF JUNE 30, 2009 (UNAUDITED) (CONTINUED) |
| | | | | | | |
| Shares | | | | | | Value |
| | | | | | | |
United States: (continued) | | | |
| 500 | | | | Constellation Energy Group, Inc. | | $ | 13,290 |
| 1,250 | | @ | | Continental Airlines, Inc. | | | 11,075 |
| 1,250 | | @ | | Convergys Corp. | | | 11,600 |
| 300 | | | | Con-way, Inc. | | | 10,593 |
| 800 | | | | Cooper Industries Ltd. | | | 24,840 |
| 500 | | | | Corn Products International, Inc. | | | 13,395 |
| 2,750 | | | | Corning, Inc. | | | 44,165 |
| 500 | | | | Corporate Executive Board Co. | | | 10,380 |
| 700 | | | | Costco Wholesale Corp. | | | 31,990 |
| 100 | | @ | | Covance, Inc. | | | 4,920 |
| 200 | | | | CR Bard, Inc. | | | 14,890 |
| 950 | | @ | | Crown Castle International Corp. | | | 22,819 |
| 650 | | @ | | Crown Holdings, Inc. | | | 15,691 |
| 700 | | | | CSX Corp. | | | 24,241 |
| 200 | | | | Cullen/Frost Bankers, Inc. | | | 9,224 |
| 500 | | | | Cummins, Inc. | | | 17,605 |
| 2,810 | | | | CVS Caremark Corp. | | | 89,555 |
| 1,250 | | | | D.R. Horton, Inc. | | | 11,700 |
| 300 | | | | Danaher Corp. | | | 18,522 |
| 200 | | @ | | DaVita, Inc. | | | 9,892 |
| 800 | | | | Deere & Co. | | | 31,960 |
| 3,200 | | @ | | Dell, Inc. | | | 43,936 |
| 2,575 | | @ | | Delta Airlines, Inc. | | | 14,909 |
| 950 | | @ | | Denbury Resources, Inc. | | | 13,994 |
| 1,010 | | | | Devon Energy Corp. | | | 55,045 |
| 200 | | | | DeVry, Inc. | | | 10,008 |
| 650 | | | | Diebold, Inc. | | | 17,134 |
| 1,150 | | @ | | DIRECTV Group, Inc. | | | 28,417 |
| 1,450 | | | | Discover Financial Services | | | 14,892 |
| 300 | | @ | | Discovery Communications, Inc. - Class C | | | 6,159 |
| 850 | | @ | | Dish Network Corp. | | | 13,779 |
| 1,100 | | | | Dominion Resources, Inc. | | | 36,762 |
| 300 | | | | Donaldson Co., Inc. | | | 10,392 |
| 800 | | | | Dover Corp. | | | 26,472 |
| 1,550 | | | | Dow Chemical Co. | | | 25,017 |
| 550 | | @ | | Dr Pepper Snapple Group, Inc. | | | 11,655 |
| 650 | | @ | | DreamWorks Animation SKG, Inc. | | | 17,934 |
| 300 | | | | DTE Energy Co. | | | 9,600 |
| 1,900 | | | | Duke Energy Corp. | | | 27,721 |
| 200 | | | | Dun & Bradstreet Corp. | | | 16,242 |
| 300 | | | | Eastman Chemical Co. | | | 11,370 |
| 500 | | | | Eaton Corp. | | | 22,305 |
| 500 | | | | Eaton Vance Corp. | | | 13,375 |
| 2,350 | | @ | | eBay, Inc. | | | 40,256 |
| 650 | | | | Ecolab, Inc. | | | 25,344 |
| 800 | | | | Edison International | | | 25,168 |
| 200 | | @ | | Edwards Lifesciences Corp. | | | 13,606 |
| 1,550 | | | | EI Du Pont de Nemours & Co. | | | 39,711 |
| 1,450 | | | | El Paso Corp. | | | 13,384 |
| 850 | | @ | | Electronic Arts, Inc. | | | 18,462 |
| 1,900 | | | | Eli Lilly & Co. | | | 65,816 |
| 250 | | | | Embarq Corp. | | | 10,515 |
| 3,650 | | @ | | EMC Corp. | | | 47,815 |
| 1,400 | | | | Emerson Electric Co. | | | 45,360 |
| 200 | | @ | | Energizer Holdings, Inc. | | | 10,448 |
| 200 | | | | Entergy Corp. | | | 15,504 |
| 650 | | | | EOG Resources, Inc. | | | 44,148 |
| 300 | | | | EQT Corp. | | | 10,473 |
| 650 | | | | Equifax, Inc. | | | 16,965 |
| 300 | | | | Erie Indemnity Co. | | | 10,728 |
| 500 | | | | Estee Lauder Cos., Inc. | | | 16,335 |
| 1,400 | | | | Exelon Corp. | | | 71,694 |
| | | | | | | |
| Shares | | | | | | Value |
| | | | | | | |
United States: (continued) | | | |
| 650 | | | | Expeditors International Washington, Inc. | | $ | 21,671 |
| 200 | | @ | | Express Scripts, Inc. | | | 13,750 |
| 8,960 | | | | ExxonMobil Corp. | | | 626,394 |
| 500 | | | | Family Dollar Stores, Inc. | | | 14,150 |
| 700 | | | | FedEx Corp. | | | 38,934 |
| 950 | | | | Fidelity National Information Services, Inc. | | | 18,962 |
| 950 | | | | Fidelity National Title Group, Inc. | | | 12,854 |
| 1,150 | | | | Fifth Third Bancorp. | | | 8,165 |
| 500 | | | | First American Corp. | | | 12,955 |
| 100 | | @ | | First Solar, Inc. | | | 16,212 |
| 650 | | | | FirstEnergy Corp. | | | 25,188 |
| 500 | | @ | | Fiserv, Inc. | | | 22,850 |
| 800 | | @ | | Flir Systems, Inc. | | | 18,048 |
| 600 | | | | Fluor Corp. | | | 30,774 |
| 200 | | | | FMC Corp. | | | 9,460 |
| 300 | | @ | | FMC Technologies, Inc. | | | 11,274 |
| 5,650 | | @ | | Ford Motor Co. | | | 34,296 |
| 500 | | | | Forest City Enterprises, Inc. | | | 3,300 |
| 900 | | @ | | Forest Laboratories, Inc. | | | 22,599 |
| 300 | | | | Fortune Brands, Inc. | | | 10,422 |
| 500 | | @ | | Foster Wheeler AG | | | 11,875 |
| 700 | | | | FPL Group, Inc. | | | 39,802 |
| 200 | | | | Franklin Resources, Inc. | | | 14,402 |
| 800 | | | | Freeport-McMoRan Copper & Gold, Inc. | | | 40,088 |
| 750 | | | | Frontier Oil Corp. | | | 9,833 |
| 1,150 | | | | Fulton Financial Corp. | | | 5,992 |
| 1,150 | | | | Gap, Inc. | | | 18,860 |
| 700 | | | | General Dynamics Corp. | | | 38,773 |
| 18,990 | | | | General Electric Co. | | | 222,563 |
| 700 | | | | General Mills, Inc. | | | 39,214 |
| 200 | | @ | | Gen-Probe, Inc. | | | 8,596 |
| 300 | | | | Genuine Parts Co. | | | 10,068 |
| 1,350 | | | | Genworth Financial, Inc. | | | 9,437 |
| 650 | | @ | | Genzyme Corp. | | | 36,186 |
| 1,800 | | @ | | Gilead Sciences, Inc. | | | 84,312 |
| 500 | | | | Global Payments, Inc. | | | 18,730 |
| 940 | | | | Goldman Sachs Group, Inc. | | | 138,594 |
| 850 | | @ | | Goodyear Tire & Rubber Co. | | | 9,571 |
| 490 | | @ | | Google, Inc. - Class A | | | 206,579 |
| 500 | | | | Graco, Inc. | | | 11,010 |
| 850 | | | | Great Plains Energy, Inc. | | | 13,218 |
| 200 | | | | Greif, Inc. - Class A | | | 8,844 |
| 300 | | | | Guess ?, Inc. | | | 7,734 |
| 600 | | | | H&R Block, Inc. | | | 10,338 |
| 1,650 | | | | Halliburton Co. | | | 34,155 |
| 500 | | @ | | Hansen Natural Corp. | | | 15,410 |
| 500 | | | | Harley-Davidson, Inc. | | | 8,105 |
| 500 | | | | Harris Corp. | | | 14,180 |
| 500 | | | | Hartford Financial Services Group, Inc. | | | 5,935 |
| 500 | | | | Hasbro, Inc. | | | 12,120 |
| 750 | | | | Hawaiian Electric Industries | | | 14,295 |
| 800 | | | | HCC Insurance Holdings, Inc. | | | 19,208 |
| 750 | | @ | | Health Net, Inc. | | | 11,663 |
| 200 | | @ | | Henry Schein, Inc. | | | 9,590 |
| 500 | | | | Hershey Co. | | | 18,000 |
| 1,650 | | @ | | Hertz Global Holdings, Inc. | | | 13,184 |
| 300 | | | | Hess Corp. | | | 16,125 |
| 4,630 | | | | Hewlett-Packard Co. | | | 178,950 |
| 700 | | | | HJ Heinz Co. | | | 24,990 |
| 600 | | @ | | Hologic, Inc. | | | 8,538 |
| 3,400 | | | | Home Depot, Inc. | | | 80,342 |
See Accompanying Notes to Financial Statements
114
| | |
ING RUSSELL™ GLOBAL LARGECAP INDEX
75% PORTFOLIO | | PORTFOLIO OF INVESTMENTS AS OF JUNE 30, 2009 (UNAUDITED) (CONTINUED) |
| | | | | | | |
| Shares | | | | | | Value |
| | | | | | | |
United States: (continued) | | | |
| 1,400 | | | | Honeywell International, Inc. | | $ | 43,960 |
| 650 | | @ | | Hospira, Inc. | | | 25,038 |
| 950 | | | | Hudson City Bancorp., Inc. | | | 12,626 |
| 650 | | @ | | Humana, Inc. | | | 20,969 |
| 1,650 | | | | Huntington Bancshares, Inc. | | | 6,897 |
| 800 | | | | Illinois Tool Works, Inc. | | | 29,872 |
| 1,150 | | @ | | Ingram Micro, Inc. | | | 20,125 |
| 200 | | | | Integrys Energy Group, Inc. | | | 5,998 |
| 11,160 | | | | Intel Corp. | | | 184,698 |
| 200 | | @ | | IntercontinentalExchange, Inc. | | | 22,848 |
| 2,410 | | | | International Business Machines Corp. | | | 251,652 |
| 500 | | | | International Flavors & Fragrances, Inc. | | | 16,360 |
| 1,050 | | | | International Paper Co. | | | 15,887 |
| 500 | | | | International Speedway Corp. | | | 12,805 |
| 750 | | | | Intersil Corp. | | | 9,428 |
| 650 | | @ | | Intuit, Inc. | | | 18,304 |
| 100 | | @ | | Intuitive Surgical, Inc. | | | 16,366 |
| 950 | | | | Invesco Ltd. | | | 16,929 |
| 300 | | | | ITT Corp. | | | 13,350 |
| 1,450 | | | | Jabil Circuit, Inc. | | | 10,759 |
| 500 | | @ | | Jacobs Engineering Group, Inc. | | | 21,045 |
| 750 | | | | Janus Capital Group, Inc. | | | 8,550 |
| 300 | | | | JB Hunt Transport Services, Inc. | | | 9,159 |
| 850 | | | | Jefferies Group, Inc. | | | 18,131 |
| 500 | | | | JM Smucker Co. | | | 24,330 |
| 500 | | | | John Wiley & Sons, Inc. | | | 16,625 |
| 5,100 | | | | Johnson & Johnson | | | 289,680 |
| 1,150 | | | | Johnson Controls, Inc. | | | 24,978 |
| 200 | | | | Joy Global, Inc. | | | 7,144 |
| 7,050 | | | | JPMorgan Chase & Co. | | | 240,476 |
| 850 | | @ | | Juniper Networks, Inc. | | | 20,060 |
| 500 | | | | Kellogg Co. | | | 23,285 |
| 700 | | | | Kimberly-Clark Corp. | | | 36,701 |
| 600 | | | | KLA-Tencor Corp. | | | 15,150 |
| 700 | | @ | | Kohl’s Corp. | | | 29,925 |
| 2,780 | | | | Kraft Foods, Inc. | | | 70,445 |
| 1,100 | | | | Kroger Co. | | | 24,255 |
| 200 | | | | L-3 Communications Holdings, Inc. | | | 13,876 |
| 200 | | @ | | Laboratory Corp. of America Holdings | | | 13,558 |
| 500 | | @ | | Lam Research Corp. | | | 13,000 |
| 200 | | | | Landstar System, Inc. | | | 7,182 |
| 300 | | @ | | Leap Wireless International, Inc. | | | 9,879 |
| 750 | | | | Leggett & Platt, Inc. | | | 11,423 |
| 500 | | | | Lender Processing Services, Inc. | | | 13,885 |
| 950 | | | | Lennar Corp. | | | 9,206 |
| 5,100 | | @ | | Level 3 Communications, Inc. | | | 7,701 |
| 950 | | @ | | Liberty Media Corp. - Entertainment | | | 25,413 |
| 132 | | @ | | Life Technologies Corp. | | | 5,507 |
| 500 | | @ | | LifePoint Hospitals, Inc. | | | 13,125 |
| 850 | | | | Limited Brands, Inc. | | | 10,175 |
| 650 | | @ | | Lincare Holdings, Inc. | | | 15,288 |
| 700 | | | | Lincoln National Corp. | | | 12,047 |
| 650 | | | | Linear Technology Corp. | | | 15,178 |
| 1,250 | | @ | | LKQ Corp. | | | 20,563 |
| 690 | | | | Lockheed Martin Corp. | | | 55,649 |
| 700 | | | | Loews Corp. | | | 19,180 |
| 300 | | | | Lorillard, Inc. | | | 20,331 |
| 3,300 | | | | Lowe’s Cos., Inc. | | | 64,053 |
| 300 | | | | Lubrizol Corp. | | | 14,193 |
| 200 | | | | M&T Bank Corp. | | | 10,186 |
| 1,200 | | | | Marathon Oil Corp. | | | 36,156 |
| 600 | | @ | | Mariner Energy, Inc. | | | 7,050 |
| 1,154 | | | | Marriott International, Inc. | | | 25,469 |
| | | | | | | |
| Shares | | | | | | Value |
| | | | | | | |
United States: (continued) | | | |
| 1,250 | | | | Marsh & McLennan Cos., Inc. | | $ | 25,163 |
| 1,150 | | | | Masco Corp. | | | 11,017 |
| 200 | | | | Mastercard, Inc. | | | 33,462 |
| 1,250 | | | | Mattel, Inc. | | | 20,063 |
| 450 | | @ | | McAfee, Inc. | | | 18,986 |
| 300 | | | | McCormick & Co., Inc. | | | 9,759 |
| 750 | | @ | | McDermott International, Inc. | | | 15,233 |
| 2,070 | | | | McDonald’s Corp. | | | 119,004 |
| 750 | | | | McGraw-Hill Cos., Inc. | | | 22,583 |
| 500 | | | | McKesson Corp. | | | 22,000 |
| 750 | | | | MDU Resources Group, Inc. | | | 14,228 |
| 800 | | @ | | Medco Health Solutions, Inc. | | | 36,488 |
| 2,070 | | | | Medtronic, Inc. | | | 72,222 |
| 600 | | @ | | MEMC Electronic Materials, Inc. | | | 10,686 |
| 3,920 | | | | Merck & Co., Inc. | | | 109,603 |
| 300 | | | | Mercury General Corp. | | | 10,029 |
| 1,100 | | | | Metlife, Inc. | | | 33,011 |
| 750 | | | | Microchip Technology, Inc. | | | 16,913 |
| 14,010 | | | | Microsoft Corp. | | | 332,962 |
| 200 | | @ | | Mohawk Industries, Inc. | | | 7,136 |
| 200 | | | | Molson Coors Brewing Co. | | | 8,466 |
| 1,060 | | | | Monsanto Co. | | | 78,800 |
| 850 | | @ | | Monster Worldwide, Inc. | | | 10,039 |
| 2,300 | | | | Morgan Stanley | | | 65,573 |
| 500 | | | | Mosaic Co. | | | 22,150 |
| 3,750 | | | | Motorola, Inc. | | | 24,863 |
| 300 | | | | Murphy Oil Corp. | | | 16,296 |
| 700 | | @ | | National Oilwell Varco, Inc. | | | 22,862 |
| 950 | | | | National Semiconductor Corp. | | | 11,923 |
| 850 | | @ | | NetApp, Inc. | | | 16,762 |
| 950 | | | | New York Community Bancorp., Inc. | | | 10,156 |
| 800 | | | | Newmont Mining Corp. | | | 32,696 |
| 4,450 | | | | News Corp. - Class A | | | 40,540 |
| 500 | | @ | | NII Holdings, Inc. | | | 9,535 |
| 700 | | | | Nike, Inc. | | | 36,246 |
| 1,450 | | | | NiSource, Inc. | | | 16,907 |
| 750 | | | | Noble Corp. | | | 22,688 |
| 550 | | | | Noble Energy, Inc. | | | 32,434 |
| 800 | | | | Norfolk Southern Corp. | | | 30,136 |
| 500 | | | | Northeast Utilities | | | 11,155 |
| 200 | | | | Northern Trust Corp. | | | 10,736 |
| 700 | | | | Northrop Grumman Corp. | | | 31,976 |
| 750 | | @ | | Novellus Systems, Inc. | | | 12,525 |
| 800 | | @ | | NRG Energy, Inc. | | | 20,768 |
| 650 | | | | NSTAR | | | 20,872 |
| 750 | | @ | | Nuance Communications, Inc. | | | 9,068 |
| 600 | | | | Nucor Corp. | | | 26,658 |
| 1,750 | | @ | | Nvidia Corp. | | | 19,758 |
| 650 | | | | NYSE Euronext | | | 17,713 |
| 1,650 | | | | Occidental Petroleum Corp. | | | 108,587 |
| 200 | | @ | | Oceaneering International, Inc. | | | 9,040 |
| 300 | | | | Omnicare, Inc. | | | 7,728 |
| 700 | | | | Omnicom Group | | | 22,106 |
| 1,950 | | @ | | ON Semiconductor Corp. | | | 13,377 |
| 850 | | | | OneBeacon Insurance Group Ltd. | | | 9,937 |
| 7,270 | | @ | | Oracle Corp. | | | 155,723 |
| 800 | | | | Paccar, Inc. | | | 26,008 |
| 650 | | | | Pacific Gas & Electric Co. | | | 24,986 |
| 300 | | | | Pall Corp. | | | 7,968 |
| 200 | | @ | | Panera Bread Co. | | | 9,972 |
| 500 | | | | Parker Hannifin Corp. | | | 21,480 |
| 800 | | | | Paychex, Inc. | | | 20,160 |
| 500 | | | | Peabody Energy Corp. | | | 15,080 |
See Accompanying Notes to Financial Statements
115
| | |
ING RUSSELL™ GLOBAL LARGECAP INDEX
75% PORTFOLIO | | PORTFOLIO OF INVESTMENTS AS OF JUNE 30, 2009 (UNAUDITED) (CONTINUED) |
| | | | | | | |
| Shares | | | | | | Value |
| | | | | | | |
United States: (continued) | | | |
| 750 | | | | People’s United Financial, Inc. | | $ | 11,280 |
| 300 | | | | Pepsi Bottling Group, Inc. | | | 10,152 |
| 2,980 | | | | PepsiCo, Inc. | | | 163,781 |
| 600 | | | | PerkinElmer, Inc. | | | 10,440 |
| 300 | | | | Perrigo Co. | | | 8,334 |
| 750 | | @ | | PetroHawk Energy Corp. | | | 16,725 |
| 600 | | | | Petsmart, Inc. | | | 12,876 |
| 12,820 | | | | Pfizer, Inc. | | | 192,300 |
| 300 | | | | Pharmaceutical Product Development, Inc. | | | 6,966 |
| 3,670 | | | | Philip Morris International, Inc. | | | 160,085 |
| 300 | | | | Pinnacle West Capital Corp. | | | 9,045 |
| 650 | | | | Pitney Bowes, Inc. | | | 14,255 |
| 850 | | | | PNC Financial Services Group, Inc. | | | 32,989 |
| 300 | | | | PPG Industries, Inc. | | | 13,170 |
| 650 | | | | PPL Corp. | | | 21,424 |
| 550 | | | | Praxair, Inc. | | | 39,089 |
| 300 | | | | Precision Castparts Corp. | | | 21,909 |
| 850 | | | | Principal Financial Group, Inc. | | | 16,014 |
| 5,270 | | | | Procter & Gamble Co. | | | 269,297 |
| 300 | | | | Progress Energy, Inc. | | | 11,349 |
| 1,550 | | @ | | Progressive Corp. | | | 23,421 |
| 800 | | | | Prudential Financial, Inc. | | | 29,776 |
| 1,100 | | | | Public Service Enterprise Group, Inc. | | | 35,893 |
| 950 | | | | Pulte Homes, Inc. | | | 8,389 |
| 600 | | @ | | QLogic Corp. | | | 7,608 |
| 3,180 | | | | Qualcomm, Inc. | | | 143,736 |
| 300 | | | | Quest Diagnostics | | | 16,929 |
| 500 | | | | Questar Corp. | | | 15,530 |
| 3,900 | | | | Qwest Communications International, Inc. | | | 16,185 |
| 300 | | | | Range Resources Corp. | | | 12,423 |
| 700 | | | | Raytheon Co. | | | 31,101 |
| 1,750 | | | | Regions Financial Corp. | | | 7,070 |
| 300 | | | | Reinsurance Group of America, Inc. | | | 10,473 |
| 1,200 | | | | Republic Services, Inc. | | | 29,292 |
| 500 | | | | Reynolds American, Inc. | | | 19,310 |
| 500 | | | | Rockwell Collins, Inc. | | | 20,865 |
| 500 | | | | Ross Stores, Inc. | | | 19,300 |
| 600 | | | | Royal Caribbean Cruises Ltd. | | | 8,124 |
| 950 | | | | RPM International, Inc. | | | 13,338 |
| 200 | | | | Ryder System, Inc. | | | 5,584 |
| 1,200 | | | | Safeway, Inc. | | | 24,444 |
| 850 | | @ | | SAIC, Inc. | | | 15,768 |
| 700 | | @ | | Sandisk Corp. | | | 10,283 |
| 850 | | @ | | SandRidge Energy, Inc. | | | 7,242 |
| 1,950 | | | | Sara Lee Corp. | | | 19,032 |
| 2,950 | | | | Schering-Plough Corp. | | | 74,104 |
| 2,270 | | | | Schlumberger Ltd. | | | 122,830 |
| 300 | | | | Scripps Networks Interactive - Class A | | | 8,349 |
| 850 | | | | Sealed Air Corp. | | | 15,683 |
| 200 | | | | Sempra Energy | | | 9,926 |
| 1,950 | | | | Service Corp. International | | | 10,686 |
| 300 | | @ | | Shaw Group, Inc. | | | 8,223 |
| 200 | | | | Sherwin-Williams Co. | | | 10,750 |
| 300 | | | | Sigma-Aldrich Corp. | | | 14,868 |
| 700 | | | | Smith International, Inc. | | | 18,025 |
| 600 | | | | Sonoco Products Co. | | | 14,370 |
| 1,650 | | | | Southern Co. | | | 51,414 |
| 850 | | | | Southern Copper Corp. | | | 17,374 |
| 1,650 | | | | Southwest Airlines Co. | | | 11,105 |
| 800 | | @ | | Southwestern Energy Co. | | | 31,080 |
| 1,650 | | | | Spectra Energy Corp. | | | 27,918 |
| | | | | | | |
| Shares | | | | | | Value |
| | | | | | | |
United States: (continued) | | | |
| 5,000 | | @ | | Sprint Nextel Corp. | | $ | 24,050 |
| 300 | | @ | | St. Joe Co. | | | 7,947 |
| 650 | | @ | | St. Jude Medical, Inc. | | | 26,715 |
| 1,050 | | | | Staples, Inc. | | | 21,179 |
| 1,550 | | @ | | Starbucks Corp. | | | 21,530 |
| 800 | | | | State Street Corp. | | | 37,760 |
| 850 | | | | Steel Dynamics, Inc. | | | 12,521 |
| 200 | | @ | | Stericycle, Inc. | | | 10,306 |
| 100 | | | | Strayer Education, Inc. | | | 21,811 |
| 650 | | | | Stryker Corp. | | | 25,831 |
| 2,100 | | @ | | Sun Microsystems, Inc. | | | 19,362 |
| 500 | | | | Sunoco, Inc. | | | 11,600 |
| 650 | | | | SunTrust Bank | | | 10,693 |
| 850 | | | | Supervalu, Inc. | | | 11,008 |
| 1,650 | | @ | | Symantec Corp. | | | 25,674 |
| 1,450 | | | | Synovus Financial Corp. | | | 4,336 |
| 1,100 | | | | Sysco Corp. | | | 24,728 |
| 500 | | | | T. Rowe Price Group, Inc. | | | 20,835 |
| 1,600 | | | | Target Corp. | | | 63,152 |
| 850 | | | | TCF Financial Corp. | | | 11,365 |
| 500 | | @ | | Terex Corp. | | | 6,035 |
| 850 | | | | Tesoro Corp. | | | 10,821 |
| 2,300 | | | | Texas Instruments, Inc. | | | 48,990 |
| 800 | | @ | | Thermo Electron Corp. | | | 32,616 |
| 796 | | @ | | Time Warner Cable, Inc. | | | 25,209 |
| 2,473 | | | | Time Warner, Inc. | | | 62,295 |
| 650 | | | | TJX Cos., Inc. | | | 20,449 |
| 600 | | @ | | Toll Brothers, Inc. | | | 10,182 |
| 300 | | | | Torchmark Corp. | | | 11,112 |
| 200 | | | | Transatlantic Holdings, Inc. | | | 8,666 |
| 650 | | @ | | Transocean, Ltd. | | | 48,289 |
| 1,200 | | | | Travelers Cos., Inc. | | | 49,248 |
| 500 | | | | Trinity Industries, Inc. | | | 6,810 |
| 300 | | @ | | Ultra Petroleum Corp. | | | 11,700 |
| 800 | | | | Union Pacific Corp. | | | 41,648 |
| 1,530 | | | | United Parcel Service, Inc. - Class B | | | 76,485 |
| 200 | | | | United States Steel Corp. | | | 7,148 |
| 1,970 | | | | United Technologies Corp. | | | 102,361 |
| 2,300 | | | | UnitedHealth Group, Inc. | | | 57,454 |
| 200 | | | | Universal Health Services, Inc. | | | 9,770 |
| 1,250 | | | | UnumProvident Corp. | | | 19,825 |
| 500 | | @ | | Urban Outfitters, Inc. | | | 10,435 |
| 3,330 | | | | US Bancorp. | | | 59,674 |
| 1,250 | | | | Valero Energy Corp. | | | 21,113 |
| 787 | | | | Valley National Bancorp. | | | 9,208 |
| 200 | | @ | | Varian Medical Systems, Inc. | | | 7,028 |
| 350 | | @ | | Varian Semiconductor Equipment Associates, Inc. | | | 8,397 |
| 600 | | @ | | VeriSign, Inc. | | | 11,088 |
| 5,400 | | | | Verizon Communications, Inc. | | | 165,942 |
| 500 | | @ | | Vertex Pharmaceuticals, Inc. | | | 17,820 |
| 200 | | | | VF Corp. | | | 11,070 |
| 1,050 | | @ | | Viacom - Class B | | | 23,835 |
| 900 | | | | Visa, Inc. | | | 56,034 |
| 200 | | | | Vulcan Materials Co. | | | 8,620 |
| 300 | | | | WABCO Holdings, Inc. | | | 5,310 |
| 1,650 | | | | Walgreen Co. | | | 48,510 |
| 4,090 | | | | Wal-Mart Stores, Inc. | | | 198,120 |
| 3,820 | | | | Walt Disney Co. | | | 89,121 |
| 200 | | | | Walter Industries, Inc. | | | 7,248 |
| 750 | | | | Washington Federal, Inc. | | | 9,750 |
| 1,100 | | | | Waste Management, Inc. | | | 30,976 |
| 1,250 | | @ | | Weatherford International Ltd. | | | 24,450 |
See Accompanying Notes to Financial Statements
116
| | |
ING RUSSELL™ GLOBAL LARGECAP INDEX
75% PORTFOLIO | | PORTFOLIO OF INVESTMENTS AS OF JUNE 30, 2009 (UNAUDITED) (CONTINUED) |
| | | | | | | |
| Shares | | | | | | Value |
| | | | | | | |
United States: (continued) | | | |
| 600 | | | | Webster Financial Corp. | | $ | 4,830 |
| 1,000 | | @ | | WellPoint, Inc. | | | 50,890 |
| 8,816 | | | | Wells Fargo & Co. | | | 213,876 |
| 1,250 | | | | Western Union Co. | | | 20,500 |
| 800 | | | | Weyerhaeuser Co. | | | 24,344 |
| 1,550 | | | | Williams Cos., Inc. | | | 24,196 |
| 500 | | | | Wisconsin Energy Corp. | | | 20,355 |
| 200 | | | | WW Grainger, Inc. | | | 16,376 |
| 2,540 | | | | Wyeth | | | 115,291 |
| 850 | | | | Wyndham Worldwide Corp. | | | 10,302 |
| 1,450 | | | | Xcel Energy, Inc. | | | 26,695 |
| 2,500 | | | | Xerox Corp. | | | 16,200 |
| 850 | | | | Xilinx, Inc. | | | 17,391 |
| 1,100 | | | | XTO Energy, Inc. | | | 41,954 |
| 2,000 | | @ | | Yahoo!, Inc. | | | 31,320 |
| 800 | | | | Yum! Brands, Inc. | | | 26,672 |
| 650 | | @ | | Zimmer Holdings, Inc. | | | 27,690 |
| | | | | | | |
| | | | | | | 17,007,226 |
| | | | | | | |
| | | | Total Common Stock
(Cost $42,752,355) | | | 38,234,764 |
| | | | | | | |
REAL ESTATE INVESTMENT TRUSTS: 0.7% | | | |
Australia: 0.1% | | | |
| 9,031 | | | | CFS Retail Property Trust | | | 11,964 |
| 9,709 | | | | Stockland | | | 25,045 |
| 3,814 | | | | Westfield Group | | | 34,907 |
| | | | | | | |
| | | | | | | 71,916 |
| | | | | | | |
France: 0.1% | | | |
| 138 | | @ | | Unibail | | | 20,633 |
| | | | | | | |
| | | | | | | 20,633 |
| | | | | | | |
Hong Kong: 0.0% | | | |
| 9,500 | | | | Link Real Estate Investment Trust | | | 20,190 |
| | | | | | | |
| | | | | | | 20,190 |
| | | | | | | |
Netherlands: 0.0% | | | |
| 247 | | | | Wereldhave NV | | | 18,413 |
| | | | | | | |
| | | | | | | 18,413 |
| | | | | | | |
United Kingdom: 0.1% | | | |
| 3,683 | | | | British Land Co. PLC | | | 23,191 |
| 889 | | | | Land Securities Group PLC | | | 6,913 |
| 2,131 | | @ | | Liberty International PLC | | | 13,970 |
| | | | | | | |
| | | | | | | 44,074 |
| | | | | | | |
United States: 0.4% | | | |
| 1,150 | | | | Annaly Capital Management, Inc. | | | 17,411 |
| 620 | | | | Apartment Investment & Management Co. | | | 5,487 |
| 103 | | | | AvalonBay Communities, Inc. | | | 5,762 |
| 200 | | | | Boston Properties, Inc. | | | 9,540 |
| 300 | | | | BRE Properties, Inc. | | | 7,128 |
| 300 | | | | Camden Property Trust | | | 8,280 |
| 750 | | | | Douglas Emmett, Inc. | | | 6,743 |
| 650 | | | | Equity Residential | | | 14,450 |
| 100 | | | | Essex Property Trust, Inc. | | | 6,223 |
| 200 | | | | Federal Realty Investment Trust | | | 10,304 |
| 500 | | | | HCP, Inc. | | | 10,595 |
| 200 | | | | Health Care Real Estate Investment Trust, Inc. | | | 6,820 |
| 1,950 | | | | HRPT Properties Trust | | | 7,917 |
| 300 | | | | Liberty Property Trust | | | 6,912 |
| | | | | | | |
| Shares | | | | | | Value |
| | | | | | | |
United States: (continued) | | | |
| 300 | | | | Mack-Cali Realty Corp. | | $ | 6,840 |
| 300 | | | | Plum Creek Timber Co., Inc. | | | 8,934 |
| 200 | | | | Public Storage, Inc. | | | 13,096 |
| 311 | | | | Simon Property Group, Inc. | | | 15,995 |
| 640 | | | | UDR, Inc. | | | 6,611 |
| 300 | | | | Ventas, Inc. | | | 8,958 |
| 205 | | | | Vornado Realty Trust | | | 9,231 |
| 73 | | @ | | Walter Investment Management Corp. | | | 969 |
| 500 | | | | Weingarten Realty Investors | | | 7,255 |
| | | | | | | |
| | | | | | | 201,461 |
| | | | | | | |
| | | | Total Real Estate Investment Trusts
(Cost $547,886) | | | 376,687 |
| | | | | | | |
EXCHANGE-TRADED FUNDS: 27.1% | | | |
Developed Markets: 1.7% | | | |
| 20,400 | | | | iShares MSCI EAFE Index Fund | | | 934,524 |
| | | | | | | |
| | | | | | | 934,524 |
| | | | | | | |
Emerging Markets: 0.9% | | | |
| 14,100 | | | | iShares MSCI Emerging Markets Index Fund | | | 454,443 |
| | | | | | | |
| | | | | | | 454,443 |
| | | | | | | |
United States: 24.5% | | | |
| 115,500 | | | | iShares Lehman Aggregate Bond Fund | | | 11,798,325 |
| 15,000 | | | | iShares S&P 500 Index Fund | | | 1,383,900 |
| | | | | | | |
| | | | | | | 13,182,225 |
| | | | | | | |
| | | | Total Exchange-Traded Funds
(Cost $14,289,359) | | | 14,571,192 |
| | | | | | | |
PREFERRED STOCK: 0.8% | | | |
Australia: 0.0% | | | |
| 226 | | | | Insurance Australia Group | | | 18,302 |
| | | | | | | |
| | | | | | | 18,302 |
| | | | | | | |
Brazil: 0.7% | | | |
| 2,100 | | | | Banco Bradesco S.A. | | | 30,865 |
| 3,000 | | | | Banco Itau Holding Financeira SA | | | 47,293 |
| 200 | | | | Cia de Bebidas das Americas | | | 12,918 |
| 1,412 | | | | CIA Energetica de Minas Gerais | | | 18,952 |
| 3,250 | | | | Cia Vale do Rio Doce | | | 49,923 |
| 1,850 | | | | Gerdau SA | | | 19,402 |
| 5,175 | | | | Investimentos Itau SA | | | 22,792 |
| 1,150 | | | | Metalurgica Gerdau SA | | | 15,059 |
| 6,820 | | | | Petroleo Brasileiro SA | | | 113,324 |
| 850 | | | | Usinas Siderurgicas de Minas Gerais SA | | | 18,197 |
| | | | | | | |
| | | | | | | 348,725 |
| | | | | | | |
Germany: 0.1% | | | |
| 304 | | | | Fresenius AG | | | 16,439 |
| 624 | | | | Henkel KGaA - Vorzug | | | 19,487 |
| 140 | | | | Porsche AG | | | 9,424 |
| 221 | | | | Volkswagen AG | | | 15,459 |
| | | | | | | |
| | | | | | | 60,809 |
| | | | | | | |
| | | | Total Preferred Stock
(Cost $429,645) | | | 427,836 |
| | | | | | | |
RIGHTS: 0.0% | | | |
Australia: 0.0% | | | |
| 2,623 | | | | Asciano Rights | | | 520 |
| 253 | | | | Rio Tinto Ltd. | | | 4,874 |
| | | | | | | |
| | | | | | | 5,394 |
| | | | | | | |
See Accompanying Notes to Financial Statements
117
| | |
ING RUSSELL™ GLOBAL LARGECAP INDEX
75% PORTFOLIO | | PORTFOLIO OF INVESTMENTS AS OF JUNE 30, 2009 (UNAUDITED) (CONTINUED) |
| | | | | | | |
| Shares | | | | | | Value |
| | | | | | | |
Belgium: 0.0% | | | |
| 3,682 | | | | Fortis | | $ | — |
| | | | | | | |
| | | | | | | — |
| | | | | | | |
France: 0.0% | | | |
| 332 | | | | Bourbon SA | | | 1,301 |
| 257 | | | | Casino Guichard Perrachon SA | | | 991 |
| | | | | | | |
| | | | | | | 2,292 |
| | | | | | | |
Hong Kong: 0.0% | | | |
| 600 | | | | China Resources Power Holdings Co. | | | 255 |
| | | | | | | |
| | | | | | | 255 |
| | | | | | | |
Italy: 0.0% | | | |
| 1,047 | | | | Unione di Banche Italiane SCPA | | | 72 |
| | | | | | | |
| | | | | | | 72 |
| | | | | | | |
Norway: 0.0% | | | |
| 327 | | | | Renewable Energy Corp. A/S | | | 1,170 |
| | | | | | | |
| | | | | | | 1,170 |
| | | | | | | |
Singapore: 0.0% | | | |
| 10,560 | | | | Golden Agri-Resources Ltd. | | | 1,458 |
| | | | | | | |
| | | | | | | 1,458 |
| | | | | | | |
United Kingdom: 0.0% | | | |
| 907 | | | | Rio Tinto PLC | | | 10,416 |
| | | | | | | |
| | | | | | | 10,416 |
| | | | | | | |
| | | | Total Rights
(Cost $23,674) | | | 21,057 |
| | | | | | | |
WARRANTS: 0.0% | | | |
Italy: 0.0% | | | |
| 1,047 | | | | Unione di Banche Italiane SCPA | | | 81 |
| | | | | | | |
| | | | Total Warrants
(Cost $—) | | | 81 |
| | | | | | | |
| | | | Total Long-Term Investments
(Cost $58,042,919) | | | 53,631,617 |
| | | | | | | |
| | | | | | | | | |
SHORT-TERM INVESTMENTS: 1.1% | | | | | |
Money Market: 1.1% | | | | | |
| 562,000 | | ING Institutional Prime Money Market Fund - Class I | | | | | | 562,000 | |
| | | | | | | | | |
| | Total Short-Term Investments
(Cost $562,000) | | | | | | 562,000 | |
| | | | | | | | | |
| | Total Investments in Securities
(Cost $58,604,919)* | | 100.8 | % | | $ | 54,193,617 | |
| | Other Assets and
Liabilities - Net | | (0.8 | ) | | | (410,763 | ) |
| | | | | | | | | |
| | Net Assets | | 100.0 | % | | $ | 53,782,854 | |
| | | | | | | | | |
| @ | Non-income producing security |
| ADR | American Depositary Receipt |
| GDR | Global Depositary Receipt |
| ** | Investment in affiliate |
| X | Fair value determined by ING Funds Valuation Committee appointed by the Funds’ Board of Directors/Trustees. |
| * | Cost for federal income tax purposes is $59,693,741. |
| | | | |
Net unrealized depreciation consists of: | | | | |
Gross Unrealized Appreciation | | $ | 1,629,192 | |
Gross Unrealized Depreciation | | | (7,129,316 | ) |
| | | | |
Net Unrealized Depreciation | | $ | (5,500,124 | ) |
| | | | |
| | | |
Industry | | Percentage of Net Assets | |
Advertising | | 0.0 | % |
Aerospace/Defense | | 1.0 | |
Agriculture | | 1.0 | |
Airlines | | 0.1 | |
Apartments | | 0.1 | |
Apparel | | 0.3 | |
Auto Manufacturers | | 1.1 | |
Auto Parts & Equipment | | 0.3 | |
Banks | | 8.2 | |
Beverages | | 1.4 | |
Biotechnology | | 0.7 | |
Building Materials | | 0.3 | |
Chemicals | | 1.7 | |
Coal | | 0.3 | |
Commercial Services | | 1.3 | |
Computers | | 2.1 | |
Cosmetics/Personal Care | | 0.9 | |
Distribution/Wholesale | | 0.5 | |
Diversified | | 0.2 | |
Diversified Financial Services | | 1.4 | |
Electric | | 3.0 | |
Electrical Components & Equipment | | 0.4 | |
Electronics | | 0.8 | |
Energy - Alternate Sources | | 0.1 | |
Engineering & Construction | | 0.8 | |
Entertainment | | 0.2 | |
Environmental Control | | 0.2 | |
Food | | 2.5 | |
Food Service | | 0.1 | |
Forest Products & Paper | | 0.2 | |
Gas | | 0.3 | |
Hand/Machine Tools | | 0.1 | |
Health Care | | 0.1 | |
Healthcare - Products | | 1.6 | |
Healthcare - Services | | 0.6 | |
Holding Companies - Diversified | | 0.4 | |
Home Builders | | 0.1 | |
Home Furnishings | | 0.2 | |
Household Products/Wares | | 0.3 | |
Housewares | | 0.0 | |
Insurance | | 2.9 | |
Internet | | 0.9 | |
Investment Companies | | 0.1 | |
Iron/Steel | | 0.9 | |
Leisure Time | | 0.1 | |
Lodging | | 0.2 | |
Machinery - Construction & Mining | | 0.2 | |
Machinery - Diversified | | 0.5 | |
Media | | 1.4 | |
See Accompanying Notes to Financial Statements
118
| | |
ING RUSSELL™ GLOBAL LARGECAP INDEX
75% PORTFOLIO | | PORTFOLIO OF INVESTMENTS AS OF JUNE 30, 2009 (UNAUDITED) (CONTINUED) |
| | | |
Industry | | Percentage of Net Assets | |
Metal Fabricate/Hardware | | 0.2 | % |
Mining | | 2.2 | |
Miscellaneous Manufacturing | | 1.5 | |
Mortgage | | 0.0 | |
Office Property | | 0.1 | |
Office/Business Equipment | | 0.2 | |
Oil & Gas | | 7.4 | |
Oil & Gas Services | | 0.7 | |
Packaging & Containers | | 0.2 | |
Pharmaceuticals | | 4.0 | |
Pipelines | | 0.2 | |
Real Estate | | 0.6 | |
Regional Malls | | 0.0 | |
Retail | | 2.8 | |
Savings & Loans | | 0.1 | |
Semiconductors | | 1.6 | |
Shipbuilding | | 0.1 | |
Shopping Centers | | 0.2 | |
Software | | 1.6 | |
Storage | | 0.0 | |
Telecommunications | | 5.0 | |
Textiles | | 0.0 | |
Toys/Games/Hobbies | | 0.2 | |
Transportation | | 1.4 | |
Water | | 0.2 | |
Other Long-Term Investments | | 27.1 | |
Short-Term Investments | | 1.1 | |
Other Assets and Liabilities - Net | | (0.8 | ) |
| | | |
Net Assets | | 100.0 | % |
| | | |
Fair Value Measurements*
The following is a summary of the inputs used as of June 30, 2009 in determining the Portfolio’s investments at fair value for purposes of SFAS 157:
| | | | | | | | | |
| | | Quoted Prices in Active Markets for Identical Investments
(Level 1) | | Significant Other Observable Inputs
(Level 2)† | | Significant Unobservable Inputs
(Level 3) |
Common Stock | | | | | | | | | |
Australia | | $ | — | | $ | 1,138,968 | | $ | — |
Austria | | | — | | | 81,647 | | | — |
Barbados | | | 29,115 | | | — | | | — |
Belgium | | | — | | | 149,404 | | | — |
Bermuda | | | 165,121 | | | 12,961 | | | — |
Brazil | | | 272,514 | | | 379 | | | — |
Canada | | | 1,586,255 | | | — | | | — |
Chile | | | 9,448 | | | — | | | — |
China | | | 5,358 | | | 622,525 | | | — |
Czech Republic | | | — | | | 15,152 | | | — |
Denmark | | | — | | | 174,025 | | | — |
Finland | | | — | | | 277,929 | | | — |
France | | | 8,249 | | | 1,631,812 | | | — |
Germany | | | 17,934 | | | 1,262,073 | | | — |
Greece | | | — | | | 76,008 | | | — |
Guernsey | | | 18,233 | | | — | | | — |
Hong Kong | | | 14,868 | | | 574,617 | | | — |
Hungary | | | — | | | 41,209 | | | — |
Indonesia | | | — | | | 68,588 | | | — |
Ireland | | | 37,440 | | | 53,627 | | | — |
Israel | | | 11,735 | | | 75,672 | | | — |
| | | | | | | | | |
| | | Quoted Prices in Active Markets for Identical Investments
(Level 1) | | Significant Other Observable Inputs
(Level 2)† | | Significant Unobservable Inputs
(Level 3) |
Italy | | $ | — | | $ | 579,648 | | $ | — |
Japan | | | — | | | 3,320,328 | | | — |
Luxembourg | | | 11,252 | | | 66,968 | | | — |
Malaysia | | | — | | | 53,807 | | | — |
Mauritius | | | — | | | 9,154 | | | — |
Mexico | | | 177,406 | | | — | | | — |
Morocco | | | — | | | 14,699 | | | — |
Netherlands | | | 7,440 | | | 741,586 | | | — |
Norway | | | — | | | 106,913 | | | — |
Philippines | | | — | | | 36,766 | | | — |
Poland | | | — | | | 69,440 | | | — |
Portugal | | | — | | | 26,563 | | | — |
Russia | | | — | | | 152,419 | | | — |
Singapore | | | 16,073 | | | 209,190 | | | — |
South Africa | | | 5,667 | | | 323,750 | | | — |
South Korea | | | 75,685 | | | 478,456 | | | — |
Spain | | | — | | | 766,408 | | | — |
Sweden | | | — | | | 419,393 | | | — |
Switzerland | | | 43,654 | | | 1,283,239 | | | — |
Taiwan | | | — | | | 466,562 | | | — |
Thailand | | | — | | | 60,235 | | | — |
Turkey | | | — | | | 76,029 | | | — |
United Kingdom | | | 94,403 | | | 3,101,539 | | | — |
United States | | | 17,007,226 | | | — | | | — |
| | | | | | | | | |
Total Common Stock | | | 19,615,076 | | | 18,619,688 | | | — |
| | | | | | | | | |
Real Estate Investment Trusts | | | 201,461 | | | 175,226 | | | — |
Exchange-Traded Funds | | | 14,571,192 | | | — | | | — |
Preferred Stock | | | 112,275 | | | 315,561 | | | — |
Rights | | | 12,904 | | | 8,153 | | | — |
Warrants | | | — | | | 81 | | | — |
Short-Term Investments | | | 562,000 | | | — | | | — |
| | | | | | | | | |
Total | | $ | 35,074,908 | | $ | 19,118,709 | | $ | — |
| | | | | | | | | |
Other Financial Instruments** | | | — | | | — | | | — |
| | | | | | | | | |
Total | | $ | — | | $ | — | | $ | — |
| | | | | | | | | |
“Fair value” for purposes of SFAS 157 is different from “fair value” as used in the 1940 Act. The former generally implies market value, and can include market quotations as a source of value, and the latter refers to determinations of value in absence of available market quotations.
| * | See NOTE 2, “Significant Accounting Policies” in the Notes to Financial Statements for additional information. |
| ** | Other financial instruments may include open forward foreign currency contracts, futures, swaps, and written options. Forward foreign currency contracts and futures are reported at their unrealized gain/loss at period end. Swaps and written options are reported at their market value at period end. |
| † | The earlier close of the foreign markets gives rise to the possibility that significant events, including broad market moves, may have occurred in the interim and may materially affect the value of those securities. To account for this, the Portfolio may frequently value many of its foreign equity securities using fair value prices based on third party vendor modeling tools to the extent available. Accordingly, a significant portion of the Portfolio’s investments are categorized as Level 2 investments. |
See Accompanying Notes to Financial Statements
119
| | |
ING WISDOMTREESM GLOBAL HIGH-YIELDING EQUITY INDEX PORTFOLIO | | PORTFOLIO OF INVESTMENTS AS OF JUNE 30, 2009 (UNAUDITED) |
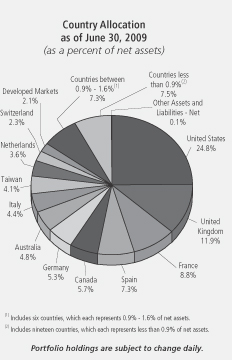
| | | | | | | |
| Shares | | | | | | Value |
| | | | | | | |
COMMON STOCK: 94.5% | | | |
Australia: 4.8% | | | |
| 38,822 | | | | Amcor Ltd. | | $ | 156,105 |
| 72,678 | | | | AMP Ltd. | | | 284,750 |
| 59,081 | | | | Australia & New Zealand Banking Group Ltd. | | | 782,970 |
| 33,130 | | | | Brambles Ltd. | | | 158,616 |
| 37,624 | | | | Commonwealth Bank of Australia | | | 1,179,358 |
| 23,035 | | | | Crown Ltd. | | | 134,247 |
| 55,028 | | | | Foster’s Group Ltd. | | | 228,004 |
| 123,528 | | | | John Fairfax Holdings Ltd. | | | 121,049 |
| 8,145 | | | | Leighton Holdings Ltd. | | | 153,627 |
| 6,917 | | | | Macquarie Group Ltd. | | | 216,548 |
| 54,750 | | | | National Australia Bank Ltd. | | | 986,388 |
| 7,924 | | | | Orica Ltd. | | | 137,913 |
| 115,585 | | | | Qantas Airways Ltd. | | | 187,167 |
| 26,377 | | | | QBE Insurance Group Ltd. | | | 422,087 |
| 46,300 | | | | Suncorp-Metway Ltd. | | | 248,933 |
| 380,112 | | | | Telstra Corp., Ltd. | | | 1,037,258 |
| 29,883 | | | | Wesfarmers Ltd. | | | 544,097 |
| 63,749 | | | | Westpac Banking Corp. | | | 1,037,176 |
| | | | | | | |
| | | | | | | 8,016,293 |
| | | | | | | |
Austria: 0.3% | | | |
| 1,347 | | | | Bank of Austria - Escrow | | | — |
| 14,655 | | | | Telekom Austria AG | | | 229,434 |
| 8,973 | | | | Voestalpine AG | | | 247,152 |
| | | | | | | |
| | | | | | | 476,586 |
| | | | | | | |
Belgium: 0.3% | | | |
| 12,333 | | | | Belgacom SA | | | 394,393 |
| 1,931 | | | | Solvay SA | | | 163,356 |
| | | | | | | |
| | | | | | | 557,749 |
| | | | | | | |
| | | | | | | |
| Shares | | | | | | Value |
| | | | | | | |
Brazil: 1.6% | | | |
| 55,700 | | | | Banco do Brasil SA | | $ | 601,202 |
| 17,100 | | | | Centrais Eletricas Brasileiras SA | | | 248,711 |
| 9,600 | | | | Cia de Concessoes Rodoviarias | | | 151,631 |
| 11,222 | | | | Cia Energetica de Minas Gerais | | | 115,799 |
| 18,200 | | | | Cia Siderurgica Nacional SA | | | 405,146 |
| 15,200 | | | | CPFL Energia SA | | | 246,287 |
| 13,700 | | | | Light SA | | | 188,353 |
| 8,800 | | | | Natura Cosmeticos SA | | | 114,968 |
| 14,300 | | | | Redecard SA | | | 218,933 |
| 9,500 | | | | Souza Cruz SA | | | 272,128 |
| 18,700 | | | | Tractebel Energia SA | | | 178,459 |
| | | | | | | |
| | | | | | | 2,741,617 |
| | | | | | | |
Canada: 5.6% | | | |
| 13,700 | | | | ARC Energy Trust | | | 209,773 |
| 13,464 | | | | Bank of Montreal | | | 567,429 |
| 21,100 | | | | Bank of Nova Scotia | | | 787,656 |
| 14,600 | | | | BCE, Inc. | | | 301,251 |
| 5,200 | | | | Bell Aliant Regional Communications Income Fund | | | 117,801 |
| 7,200 | | | | Bonavista Energy Trust | | | 111,669 |
| 10,600 | | | | Canadian Imperial Bank of Commerce | | | 531,390 |
| 16,500 | | | | Canadian Oil Sands Trust | | | 394,213 |
| 8,500 | | @ | | CI Financial Corp. | | | 139,870 |
| 4,700 | | | | Crescent Point Energy Trust | | | 138,679 |
| 10,100 | | | | Enerplus Resources Fund | | | 218,212 |
| 23,650 | | | | Great-West Lifeco, Inc. | | | 463,586 |
| 17,700 | | | | Husky Energy, Inc. | | | 495,019 |
| 5,950 | | | | IGM Financial, Inc. | | | 210,500 |
| 30,100 | | | | Manulife Financial Corp. | | | 522,477 |
| 3,200 | | | | National Bank of Canada | | | 147,874 |
| 21,900 | | | | Pengrowth Energy Trust | | | 172,843 |
| 35,500 | | | | Penn West Energy Trust | | | 452,010 |
| 9,800 | | | | Power Corp. of Canada | | | 226,138 |
| 16,300 | | | | Power Financial Corp. | | | 387,478 |
| 25,200 | | | | Royal Bank of Canada | | | 1,030,619 |
| 12,000 | | | | Sun Life Financial, Inc. | | | 323,948 |
| 3,150 | | | | TELUS Corp. | | | 83,547 |
| 13,600 | | | | Toronto Dominion Bank | | | 702,596 |
| 13,650 | | | | TransCanada Corp. | | | 367,552 |
| 51,200 | | @ | | Yellow Pages Income Fund | | | 235,498 |
| | | | | | | |
| | | | | | | 9,339,628 |
| | | | | | | |
Chile: 0.3% | | | |
| 2,707,956 | | | | Banco de Chile | | | 191,702 |
| 5,973,050 | | | | Banco Santander Chile SA | | | 267,709 |
| | | | | | | |
| | | | | | | 459,411 |
| | | | | | | |
Czech Republic: 0.6% | | | |
| 12,228 | | | | CEZ A/S | | | 546,548 |
| 1,000 | | | | Komercni Banka A/S | | | 137,769 |
| 15,600 | | | | Telefonica O2 Czech Republic A/S | | | 355,284 |
| | | | | | | |
| | | | | | | 1,039,601 |
| | | | | | | |
Finland: 0.8% | | | |
| 22,361 | | | | Fortum OYJ | | | 509,681 |
| 5,377 | | | | Metso OYJ | | | 100,657 |
| 9,782 | | | | Neste Oil OYJ | | | 136,125 |
| 6,867 | | | | Rautaruukki OYJ | | | 137,734 |
| 13,872 | | | | Sampo OYJ | | | 262,291 |
| 17,111 | | | | UPM-Kymmene OYJ | | | 149,326 |
| | | | | | | |
| | | | | | | 1,295,814 |
| | | | | | | |
See Accompanying Notes to Financial Statements
120
| | |
ING WISDOMTREESM GLOBAL HIGH-YIELDING EQUITY INDEX PORTFOLIO | | PORTFOLIO OF INVESTMENTS AS OF JUNE 30, 2009 (UNAUDITED) (CONTINUED) |
| | | | | | | |
| Shares | | | | | | Value |
| | | | | | | |
France: 8.2% | | | |
| 7,905 | | | | Accor SA | | $ | 314,954 |
| 920 | | | | BNP Paribas | | | 59,996 |
| 7,584 | | | | Bouygues SA | | | 286,812 |
| 2,429 | | | | Casino Guichard Perrachon SA | | | 164,506 |
| 13,667 | | | | Cie de Saint-Gobain | | | 459,864 |
| 3,215 | | | | CNP Assurances | | | 307,612 |
| 94 | | | | Compagnie Generale des Etablissements Michelin | | | 5,384 |
| 41,921 | | | | Credit Agricole SA | | | 525,617 |
| 86,387 | | | | France Telecom SA | | | 1,965,622 |
| 44,530 | | | | Gaz de France | | | 1,666,862 |
| 6,831 | | | | Legrand SA | | | 149,481 |
| 1,030 | | | | Neopost SA | | | 92,748 |
| 15,306 | | | | PagesJaunes Groupe SA | | | 149,220 |
| 3,853 | | | | PPR | | | 315,859 |
| 11,337 | | | | Safran SA | | | 150,158 |
| 23,961 | | | | Sanofi-Aventis | | | 1,415,853 |
| 7,113 | | | | Schneider Electric SA | | | 544,416 |
| 10,197 | | | | Suez Environnement SA | | | 178,696 |
| 53,728 | | | | Total SA | | | 2,912,098 |
| 1,759 | | | | Vallourec | | | 215,000 |
| 12,177 | | | | Veolia Environnement | | | 360,034 |
| 10,788 | | | | Vinci SA | | | 486,801 |
| 37,881 | | | | Vivendi | | | 909,293 |
| | | | | | | |
| | | | | | | 13,636,886 |
| | | | | | | |
Germany: 5.3% | | | |
| 10,099 | | | | Allianz AG | | | 931,559 |
| 24,074 | | | | BASF AG | | | 959,151 |
| 18,907 | | | | Deutsche Lufthansa AG | | | 237,447 |
| 34,699 | | | | Deutsche Post AG | | | 453,065 |
| 157,282 | | | | Deutsche Telekom AG | | | 1,859,477 |
| 45,773 | | | | E.ON AG | | | 1,624,849 |
| 3,562 | | | | K+S AG | | | 200,919 |
| 3,494 | | | | MAN AG | | | 214,984 |
| 4,894 | | | | Muenchener Rueckversicherungs AG | | | 661,207 |
| 15,886 | | | | RWE AG | | | 1,252,765 |
| 15,571 | | | | ThyssenKrupp AG | | | 387,913 |
| | | | | | | |
| | | | | | | 8,783,336 |
| | | | | | | |
Greece: 0.3% | | | |
| 13,050 | | | | Hellenic Telecommunications Organization SA | | | 199,564 |
| 14,196 | | | | OPAP SA | | | 378,538 |
| | | | | | | |
| | | | | | | 578,102 |
| | | | | | | |
Hong Kong: 0.8% | | | |
| 54,000 | | | | CLP Holdings Ltd. | | | 357,813 |
| 46,100 | | | | Hang Seng Bank Ltd. | | | 645,223 |
| 55,000 | | | | HongKong Electric Holdings | | | 305,532 |
| | | | | | | |
| | | | | | | 1,308,568 |
| | | | | | | |
Hungary: 0.1% | | | |
| 35,377 | | | | Magyar Telekom Telecommunications PLC | | | 104,468 |
| | | | | | | |
| | | | | | | 104,468 |
| | | | | | | |
Israel: 0.3% | | | |
| 85,210 | | | | Bezeq Israeli Telecommunication Corp., Ltd. | | | 157,286 |
| 38,300 | | | | Israel Chemicals Ltd. | | | 375,832 |
| | | | | | | |
| | | | | | | 533,118 |
| | | | | | | |
| | | | | | | |
| Shares | | | | | | Value |
| | | | | | | |
Italy: 4.4% | | | |
| 98,696 | | | | AEM S.p.A. | | $ | 180,373 |
| 21,632 | | | | Alleanza Assicurazioni S.p.A. | | | 148,665 |
| 12,231 | | | | Autostrade S.p.A. | | | 247,735 |
| 11,063 | | | | Banche Popolari Unite Scpa | | | 144,165 |
| 113,200 | | | | Edison S.p.A. | | | 162,975 |
| 321,422 | | | | Enel S.p.A. | | | 1,569,162 |
| 115,617 | | | | ENI S.p.A. | | | 2,742,105 |
| 52,639 | | | | Mediaset S.p.A. | | | 295,530 |
| 26,581 | | | | Mediobanca S.p.A. | | | 316,750 |
| 37,642 | | | | Parmalat S.p.A | | | 90,917 |
| 88,571 | | | | Snam Rete Gas S.p.A. | | | 389,074 |
| 354,444 | | | | Telecom Italia S.p.A. | | | 491,432 |
| 352,666 | | | | Telecom Italia S.p.A. RNC | | | 347,417 |
| 50,014 | | | | Terna S.p.A | | | 166,802 |
| | | | | | | |
| | | | | | | 7,293,102 |
| | | | | | | |
Japan: 0.9% | | | |
| 12,200 | | | | Daiichi Sankyo Co., Ltd. | | | 217,763 |
| 5,200 | | | | Eisai Co., Ltd. | | | 184,627 |
| 25,000 | | | | Mitsui OSK Lines Ltd. | | | 161,559 |
| 197,700 | | | | Mizuho Financial Group, Inc. | | | 459,324 |
| 13,600 | | | | Takeda Pharmaceutical Co., Ltd. | | | 528,767 |
| | | | | | | |
| | | | | | | 1,552,040 |
| | | | | | | |
Malaysia: 0.8% | | | |
| 9,300 | | | | British American Tobacco Malaysia Bhd | | | 118,314 |
| 17,300 | | | | Digi.com BHD | | | 109,156 |
| 32,700 | | | | Kuala Lumpur Kepong Bhd | | | 110,450 |
| 66,200 | | | | Petronas Gas BHD | | | 184,468 |
| 107,280 | | | | Public Bank BHD | | | 275,972 |
| 140,900 | | | | Sime Darby Bhd | | | 277,957 |
| 173,100 | | | | Telekom Malaysia BHD | | | 144,012 |
| 252,100 | | | | YTL Power International | | | 154,745 |
| | | | | | | |
| | | | | | | 1,375,074 |
| | | | | | | |
Netherlands: 3.6% | | | |
| 5,565 | | | | Akzo Nobel NV | | | 245,991 |
| 5,586 | | | | Koninklijke DSM NV | | | 175,661 |
| 20,730 | | | | Koninklijke Philips Electronics NV | | | 382,740 |
| 15,637 | | | | Reed Elsevier NV | | | 172,904 |
| 77,745 | | | | Royal Dutch Shell PLC - Class A | | | 1,950,177 |
| 69,175 | | | | Royal Dutch Shell PLC - Class B | | | 1,741,508 |
| 39,861 | | | | Royal KPN NV | | | 549,993 |
| 29,781 | | | | Unilever NV | | | 720,288 |
| 6,166 | | | | Wolters Kluwer NV | | | 108,171 |
| | | | | | | |
| | | | | | | 6,047,433 |
| | | | | | | |
New Zealand: 0.1% | | | |
| 106,090 | | | | Telecom Corp. of New Zealand Ltd. | | | 186,225 |
| | | | | | | |
| | | | | | | 186,225 |
| | | | | | | |
Norway: 1.0% | | | |
| 4,415 | | | | Fred Olsen Energy ASA | | | 150,761 |
| 23,700 | | | | Orkla ASA | | | 172,335 |
| 67,450 | | | | Statoil ASA | | | 1,332,351 |
| | | | | | | |
| | | | | | | 1,655,447 |
| | | | | | | |
Philippines: 0.2% | | | |
| 7,380 | | | | Philippine Long Distance Telephone Co. | | | 365,943 |
| | | | | | | |
| | | | | | | 365,943 |
| | | | | | | |
See Accompanying Notes to Financial Statements
121
| | |
ING WISDOMTREESM GLOBAL HIGH-YIELDING EQUITY INDEX PORTFOLIO | | PORTFOLIO OF INVESTMENTS AS OF JUNE 30, 2009 (UNAUDITED) (CONTINUED) |
| | | | | | | |
| Shares | | | | | | Value |
| | | | | | | |
Poland: 0.2% | | | |
| 134,556 | | | | Polish Oil & Gas | | $ | 172,228 |
| 46,668 | | | | Telekomunikacja Polska SA | | | 226,069 |
| | | | | | | |
| | | | | | | 398,297 |
| | | | | | | |
Portugal: 0.5% | | | |
| 21,096 | | | | Cimpor Cimentos de Portugal SG | | | 154,111 |
| 73,766 | | | | Energias de Portugal SA | | | 289,773 |
| 35,560 | | | | Portugal Telecom SGPS SA | | | 348,813 |
| | | | | | | |
| | | | | | | 792,697 |
| | | | | | | |
Russia: 0.4% | | | |
| 23,300 | | | | Mechel OAO ADR | | | 194,555 |
| 11,900 | | @ | | Novolipetsk Steel GDR | | | 245,023 |
| 15,000 | | @ | | OAO Gazprom ADR | | | 240,750 |
| | | | | | | |
| | | | | | | 680,328 |
| | | | | | | |
Singapore: 1.0% | | | |
| 43,000 | | | | DBS Group Holdings Ltd. | | | 348,607 |
| 39,000 | | | | Keppel Corp., Ltd. | | | 184,865 |
| 44,300 | | | | Singapore Airlines Ltd. | | | 405,575 |
| 30,000 | | | | Singapore Exchange Ltd. | | | 146,090 |
| 19,000 | | | | Singapore Petroleum Co., Ltd. | | | 81,119 |
| 60,000 | | | | Singapore Press Holdings Ltd. | | | 130,565 |
| 110,000 | | | | Singapore Technologies Engineering Ltd. | | | 185,349 |
| 25,000 | | | | United Overseas Bank Ltd. | | | 252,270 |
| | | | | | | |
| | | | | | | 1,734,440 |
| | | | | | | |
South Africa: 1.6% | | | |
| 16,724 | | | | ABSA Group Ltd. | | | 238,645 |
| 40,074 | | | | African Bank Investments Ltd. | | | 144,390 |
| 15,571 | | @ | | ArcelorMittal South Africa Ltd. | | | 193,012 |
| 157,148 | | | | FirstRand Ltd. | | | 286,862 |
| 21,073 | | | | Impala Platinum Holdings Ltd. | | | 466,291 |
| 16,300 | | | | Kumba Iron Ore Ltd. | | | 382,929 |
| 14,036 | | | | Nedcor Ltd. | | | 178,709 |
| 61,248 | | | | Sanlam Ltd. | | | 137,325 |
| 28,473 | | | | Standard Bank Group Ltd. | | | 327,560 |
| 53,688 | | | | Telkom SA Ltd. | | | 264,521 |
| | | | | | | |
| | | | | | | 2,620,244 |
| | | | | | | |
South Korea: 0.3% | | | |
| 2,056 | | | | SK Telecom Co., Ltd. | | | 280,263 |
| 5,367 | | | | S-Oil Corp. | | | 239,074 |
| | | | | | | |
| | | | | | | 519,337 |
| | | | | | | |
Spain: 7.3% | | | |
| 11,212 | | | | Abertis Infraestructuras SA | | | 211,735 |
| 7,491 | | | | ACS Actividades de Construccion y Servicios SA | | | 380,264 |
| 91,906 | | | | Banco Bilbao Vizcaya Argentaria SA | | | 1,157,238 |
| 29,775 | | | | Banco De Sabadell SA | | | 186,229 |
| 18,133 | | | | Banco Espanol de Credito SA (Banesto) | | | 187,324 |
| 38,554 | | | | Banco Popular Espanol SA | | | 337,343 |
| 233,773 | | | | Banco Santander Central Hispano SA | | | 2,825,895 |
| 8,653 | | | | Banco Santander SA | | | 104,433 |
| 2,970 | | | | Bolsas y Mercados Espanoles | | | 88,189 |
| 68,735 | | | | Corp. Mapfre SA | | | 224,568 |
| 94,623 | | | | Criteria Caixacorp SA | | | 438,558 |
| 4,249 | | | | Fomento de Construcciones y Contratas SA | | | 174,832 |
| 17,709 | | | | Gas Natural SDG SA | | | 323,401 |
| 18,520 | | | | Gestevision Telecinco SA | | | 173,441 |
| | | | | | | |
| Shares | | | | | | Value |
| | | | | | | |
Spain: (continued) | | | |
| 5,364 | | | | Grupo Ferrovial | | $ | 172,896 |
| 107,280 | | | | Iberdrola SA | | | 874,827 |
| 12,384 | | | | Inditex SA | | | 596,007 |
| 31,935 | | | | Repsol YPF SA | | | 714,864 |
| 118,236 | | | | Telefonica SA | | | 2,685,101 |
| 31,604 | | | | Union Fenosa SA | | | 343,643 |
| | | | | | | |
| | | | | | | 12,200,788 |
| | | | | | | |
Sweden: 1.2% | | | |
| 14,875 | | | | Hennes & Mauritz AB | | | 742,773 |
| 33,600 | | | | Sandvik AB | | | 250,430 |
| 16,000 | | | | Skanska AB | | | 179,515 |
| 13,000 | | | | Svenska Handelsbanken AB | | | 246,522 |
| 9,900 | | | | Tele2 AB - B Shares | | | 100,263 |
| 81,100 | | | | TeliaSonera AB | | | 426,846 |
| | | | | | | |
| | | | | | | 1,946,349 |
| | | | | | | |
Switzerland: 2.3% | | | |
| 1,061 | | | | Baloise Holding AG | | | 78,900 |
| 16,517 | | | | Compagnie Financiere Richemont SA | | | 344,351 |
| 1,146 | | @ | | EMS-Chemie Holding AG | | | 108,563 |
| 5,945 | | | | Holcim Ltd. | | | 338,474 |
| 44,517 | | | | Novartis AG | | | 1,812,164 |
| 25,466 | | @ | | STMicroelectronics NV | | | 191,814 |
| 1,087 | | | | Swisscom AG | | | 334,493 |
| 3,400 | | | | Zurich Financial Services AG | | | 600,961 |
| | | | | | | |
| | | | | | | 3,809,720 |
| | | | | | | |
Taiwan: 4.1% | | | |
| 240,000 | | | | Advanced Semiconductor Engineering, Inc. | | | 138,805 |
| 285,000 | | | | AU Optronics Corp. | | | 275,116 |
| 594,950 | | | | China Steel Corp. | | | 509,576 |
| 269,139 | | | | Chunghwa Telecom Co., Ltd. | | | 536,839 |
| 170,860 | | | | Compal Electronics, Inc. | | | 138,184 |
| 71,580 | | | | Delta Electronics, Inc. | | | 161,988 |
| 118,000 | | | | Far Eastern Textile Co., Ltd. | | | 135,923 |
| 88,159 | | | | Far EasTone Telecommunications Co., Ltd. | | | 103,086 |
| 254,000 | | | | First Financial Holding Co., Ltd. | | | 150,740 |
| 291,500 | | | | Formosa Chemicals & Fibre Co. | | | 437,532 |
| 306,000 | | | | Formosa Petrochemical Corp. | | | 727,219 |
| 240,000 | | | | Formosa Plastics Corp. | | | 426,898 |
| 21,000 | | | | High Tech Computer Corp. | | | 295,092 |
| 25,150 | | | | MediaTek, Inc. | | | 298,592 |
| 470,000 | | | | Mega Financial Holdings Co., Ltd. | | | 214,893 |
| 455,000 | | | | Nan Ya Plastics Corp. | | | 588,992 |
| 122,000 | | | | Quanta Computer, Inc. | | | 196,044 |
| 170,560 | | | | Siliconware Precision Industries Co. | | | 197,343 |
| 72,000 | | | | Taiwan Mobile Co., Ltd. | | | 122,717 |
| 621,321 | | | | Taiwan Semiconductor Manufacturing Co., Ltd. | | | 1,019,713 |
| 388,000 | | | | United Microelectronics Corp. | | | 130,733 |
| | | | | | | |
| | | | | | | 6,806,025 |
| | | | | | | |
Thailand: 0.3% | | | |
| 96,900 | | | | Advanced Info Service PCL | | | 256,597 |
| 73,100 | | | | PTT Chemical PCL | | | 111,342 |
| 41,000 | | | | Siam Cement PCL | | | 186,020 |
| | | | | | | |
| | | | | | | 553,959 |
| | | | | | | |
Turkey: 0.6% | | | |
| 18,048 | | | | Tupras Turkiye Petrol Rafine | | | 219,005 |
| 139,400 | | | | Turk Telekomunikasyon AS | | | 434,154 |
See Accompanying Notes to Financial Statements
122
| | |
ING WISDOMTREESM GLOBAL HIGH-YIELDING EQUITY INDEX PORTFOLIO | | PORTFOLIO OF INVESTMENTS AS OF JUNE 30, 2009 (UNAUDITED) (CONTINUED) |
| | | | | | | |
| Shares | | | | | | Value |
| | | | | | | |
Turkey: (continued) | | | |
| 58,489 | | | | Turkcell Iletisim Hizmet AS | | $ | 323,367 |
| | | | | | | |
| | | | | | | 976,526 |
| | | | | | | |
United Kingdom: 11.6% | | | |
| 5,483 | | | | Admiral Group PLC | | | 78,626 |
| 29,265 | | | | Antofagasta PLC | | | 284,131 |
| 27,850 | | | | AstraZeneca PLC | | | 1,227,974 |
| 63,084 | | | | Aviva PLC | | | 355,186 |
| 65,406 | | | | BAE Systems PLC | | | 365,490 |
| 503,613 | | | | BP PLC | | | 3,979,452 |
| 37,034 | | | | British American Tobacco PLC | | | 1,022,292 |
| 423,168 | | | | BT Group PLC | | | 709,016 |
| 73,891 | | | | Cable & Wireless PLC | | | 162,184 |
| 108,893 | | | | Centrica PLC | | | 400,403 |
| 39,496 | | | | Diageo PLC | | | 567,285 |
| 19,017 | | | | Drax Group PLC | | | 137,657 |
| 103,684 | | | | GlaxoSmithKline PLC | | | 1,831,401 |
| 311,565 | | | | HSBC Holdings PLC | | | 2,595,700 |
| 42,485 | | | | International Power PLC | | | 166,873 |
| 31,196 | | | | J Sainsbury PLC | | | 161,104 |
| 158,551 | | | | Legal & General Group PLC | | | 148,300 |
| 51,700 | | | | Man Group PLC | | | 236,987 |
| 46,724 | | | | Marks & Spencer Group PLC | | | 235,611 |
| 62,962 | | | | National Grid PLC | | | 568,150 |
| 25,422 | | | | Pearson PLC | | | 256,007 |
| 49,065 | | | | Prudential PLC | | | 335,382 |
| 111,943 | | | | Royal & Sun Alliance Insurance Group | | | 222,280 |
| 18,409 | | | | Scottish & Southern Energy PLC | | | 346,351 |
| 12,390 | | | | Smiths Group PLC | | | 143,362 |
| 60,283 | | | | Standard Life PLC | | | 185,158 |
| 29,547 | | | | United Utilities Group PLC | | | 242,288 |
| 1,268,952 | | | | Vodafone Group PLC | | | 2,468,034 |
| | | | | | | |
| | | | | | | 19,432,684 |
| | | | | | | |
United States: 22.8% | | | |
| 21,300 | | | | Alcoa, Inc. | | | 220,029 |
| 15,100 | | | | Allstate Corp. | | | 368,440 |
| 61,350 | | | | Altria Group, Inc. | | | 1,005,527 |
| 8,850 | | | | Ameren Corp. | | | 220,277 |
| 10,100 | | | | American Electric Power Co., Inc. | | | 291,789 |
| 152,150 | | | | AT&T, Inc. | | | 3,779,406 |
| 226,380 | | | | Bank of America Corp. | | | 2,988,216 |
| 19,550 | | | | BB&T Corp. | | | 429,709 |
| 47,200 | | | | Bristol-Myers Squibb Co. | | | 958,632 |
| 12,600 | | | | Caterpillar, Inc. | | | 416,304 |
| 25,700 | | | | CBS Corp. - Class B | | | 177,844 |
| 14,200 | | | | CenterPoint Energy, Inc. | | | 157,336 |
| 5,900 | | | | Comerica, Inc. | | | 124,785 |
| 7,450 | | | | Consolidated Edison, Inc. | | | 278,779 |
| 4,300 | | | | Constellation Energy Group, Inc. | | | 114,294 |
| 3,400 | | | | Diamond Offshore Drilling | | | 282,370 |
| 11,900 | | | | Dominion Resources, Inc. | | | 397,698 |
| 31,850 | | | | Dow Chemical Co. | | | 514,059 |
| 5,900 | | | | DTE Energy Co. | | | 188,800 |
| 33,150 | | | | Duke Energy Corp. | | | 483,659 |
| 3,600 | | | | Eaton Corp. | | | 160,596 |
| 6,700 | | | | Edison International | | | 210,782 |
| 25,250 | | | | EI Du Pont de Nemours & Co. | | | 646,905 |
| 26,450 | | | | Eli Lilly & Co. | | | 916,228 |
| 3,900 | | | | Embarq Corp. | | | 164,034 |
| 11,200 | | | | Exelon Corp. | | | 573,552 |
| 7,700 | | | | FirstEnergy Corp. | | | 298,375 |
| 31,850 | | | | Frontier Communications Corp. | | | 227,409 |
| | | | | | | |
| Shares | | | | | | Value |
| | | | | | | |
United States: (continued) | | | |
| 407,750 | | | | General Electric Co. | | $ | 4,778,830 |
| 6,150 | | | | Genuine Parts Co. | | | 206,394 |
| 9,700 | | | | Hartford Financial Services Group, Inc. | | | 115,139 |
| 6,400 | | | | HJ Heinz Co. | | | 228,480 |
| 3,150 | | | | Integrys Energy Group, Inc. | | | 94,469 |
| 8,250 | | | | International Paper Co. | | | 124,823 |
| 8,500 | | | | Kimberly-Clark Corp. | | | 445,655 |
| 27,950 | | | | Kraft Foods, Inc. | | | 708,253 |
| 9,900 | | | | Lincoln National Corp. | | | 170,379 |
| 3,200 | | | | Lorillard, Inc. | | | 216,864 |
| 3,500 | | | | M&T Bank Corp. | | | 178,255 |
| 8,700 | | | | Marsh & McLennan Cos., Inc. | | | 175,131 |
| 12,000 | | | | Masco Corp. | | | 114,960 |
| 50,800 | | | | Merck & Co., Inc. | | | 1,420,368 |
| 5,300 | | | | Microchip Technology, Inc. | | | 119,515 |
| 13,950 | | | | New York Community Bancorp., Inc. | | | 149,126 |
| 6,650 | | | | Pacific Gas & Electric Co. | | | 255,626 |
| 8,450 | | | | Paychex, Inc. | | | 212,940 |
| 7,200 | | | | Pepco Holdings, Inc. | | | 96,768 |
| 200,200 | | | | Pfizer, Inc. | | | 3,003,000 |
| 39,800 | | | | Philip Morris International, Inc. | | | 1,736,076 |
| 7,200 | | | | Pitney Bowes, Inc. | | | 157,896 |
| 5,000 | | | | PPG Industries, Inc. | | | 219,500 |
| 7,000 | | | | Progress Energy, Inc. | | | 264,810 |
| 64,400 | | | | Qwest Communications International, Inc. | | | 267,260 |
| 51,950 | | | | Regions Financial Corp. | | | 209,878 |
| 10,400 | | | | Reynolds American, Inc. | | | 401,648 |
| 18,000 | | | | Sara Lee Corp. | | | 175,680 |
| 17,850 | | | | Southern Co. | | | 556,206 |
| 19,300 | | | | Southern Copper Corp. | | | 394,492 |
| 16,000 | | | | Spectra Energy Corp. | | | 270,720 |
| 13,150 | | | | SunTrust Bank | | | 216,318 |
| 7,100 | | | | TECO Energy, Inc. | | | 84,703 |
| 9,100 | | | | Textron, Inc. | | | 87,906 |
| 51,400 | | | | US Bancorp. | | | 921,088 |
| 67,000 | | | | Verizon Communications, Inc. | | | 2,058,910 |
| 6,250 | | | | Weyerhaeuser Co. | | | 190,188 |
| 31,650 | | | | Windstream Corp. | | | 264,594 |
| 12,950 | | | | Xcel Energy, Inc. | | | 238,410 |
| | | | | | | |
| | | | | | | 38,127,092 |
| | | | | | | |
| | | | Total Common Stock
(Cost $ 194,504,957) | | | 157,944,927 |
| | | | | | | |
REAL ESTATE INVESTMENT TRUSTS: 2.1% | | | |
Canada: 0.1% | | | |
| 10,881 | | | | RioCan Real Estate Investment Trust | | | 142,941 |
| | | | | | | |
| | | | | | | 142,941 |
| | | | | | | |
France: 0.6% | | | |
| 2,067 | | | | Fonciere Des Regions | | | 155,848 |
| 3,524 | | | | Gecina SA | | | 218,637 |
| 1,341 | | | | ICADE | | | 110,339 |
| 6,883 | | | | Klepierre | | | 178,371 |
| 2,175 | | @ | | Unibail | | | 325,194 |
| | | | | | | |
| | | | | | | 988,389 |
| | | | | | | |
United Kingdom: 0.3% | | | |
| 18,900 | | | | British Land Co. PLC | | | 119,010 |
| 25,570 | | | | Land Securities Group PLC | | | 198,846 |
| 559,390 | | | | Segro PLC | | | 223,694 |
| | | | | | | |
| | | | | | | 541,550 |
| | | | | | | |
See Accompanying Notes to Financial Statements
123
| | |
ING WISDOMTREESM GLOBAL HIGH-YIELDING EQUITY INDEX PORTFOLIO | | PORTFOLIO OF INVESTMENTS AS OF JUNE 30, 2009 (UNAUDITED) (CONTINUED) |
| | | | | | | |
| Shares | | | | | | Value |
| | | | | | | |
United States: 1.1% | | | |
| 4,400 | | | | Boston Properties, Inc. | | $ | 209,880 |
| 12,700 | | | | Equity Residential | | | 282,321 |
| 9,600 | | | | HCP, Inc. | | | 203,424 |
| 4,400 | | | | Health Care Real Estate Investment Trust, Inc. | | | 150,040 |
| 23,800 | | | | Kimco Realty Corp. | | | 239,190 |
| 5,200 | | | | Plum Creek Timber Co., Inc. | | | 154,856 |
| 20,900 | | | | Prologis | | | 168,454 |
| 54 | | | | Simon Property Group, Inc. | | | 2,777 |
| 5,700 | | | | Ventas, Inc. | | | 170,202 |
| 6,072 | | | | Vornado Realty Trust | | | 273,422 |
| | | | | | | |
| | | | | | | 1,854,566 |
| | | | | | | |
| | | | Total Real Estate Investment Trusts
(Cost $ 4,468,508) | | | 3,527,446 |
| | | | | | | |
EXCHANGE-TRADED FUNDS: 3.3% | | | |
Developed Markets: 2.1% | | | |
| 75,313 | | | | iShares MSCI EAFE Index Fund | | | 3,450,089 |
| | | | | | | |
| | | | | | | 3,450,089 |
| | | | | | | |
Emerging Markets: 0.3% | | | |
| 18,367 | | | | iShares MSCI Emerging Markets Index Fund | | | 591,968 |
| | | | | | | |
| | | | | | | 591,968 |
| | | | | | | |
United States: 0.9% | | | |
| 32,806 | | | | iShares S&P 500 Value Index Fund | | | 1,432,310 |
| | | | | | | |
| | | | | | | 1,432,310 |
| | | | | | | |
| | | | Total Exchange-Traded Funds
(Cost $ 5,586,421) | | | 5,474,367 |
| | | | | | | |
RIGHTS: 0.0% | | | |
Italy: 0.0% | | | |
| 11,063 | | | | Unione di Banche Italiane SCPA | | | 756 |
| | | | | | | |
| | | | Total Rights
(Cost $—) | | | 756 |
| | | | | | | |
| | | | | | | | | | |
WARRANTS: 0.0% | | | | |
Italy: 0.0% | | | | |
| 15,815 | | | | Unione di Banche Italiane SCPA | | | | 1,220 |
| | | | | | | | | | |
| | | | Total Warrants
(Cost $—) | | | | | | 1,220 |
| | | | | | | | | | |
| | | | Total Investments in Securities
(Cost $ 204,559,886)* | | 99.9 | % | | $ | 166,948,716 |
| | | | Other Assets and
Liabilities - Net | | 0.1 | | | | 230,919 |
| | | | | | | | | | |
| | | | Net Assets | | 100.0 | % | | $ | 167,179,635 |
| | | | | | | | | | |
| @ | Non-income producing security |
| ADR | American Depositary Receipt |
| GDR | Global Depositary Receipt |
| * | Cost for federal income tax purposes is $208,800,030. |
| | | | |
Net unrealized depreciation consists of: | | | | |
Gross Unrealized Appreciation | | $ | 1,122,826 | |
Gross Unrealized Depreciation | | | (42,974,140 | ) |
| | | | |
Net Unrealized Depreciation | | $ | (41,851,314 | ) |
| | | | |
| | | |
Industry | | Percentage of
Net Assets | |
Aerospace/Defense | | 0.3 | % |
Agriculture | | 2.9 | |
Airlines | | 0.5 | |
Apartments | | 0.2 | |
Apparel | | 0.1 | |
Auto Parts & Equipment | | 0.0 | |
Banks | | 15.3 | |
Beverages | | 0.5 | |
Building Materials | | 0.7 | |
Chemicals | | 3.1 | |
Commercial Services | | 0.6 | |
Computers | | 0.4 | |
Cosmetics/Personal Care | | 0.1 | |
Distribution/Wholesale | | 0.1 | |
Diversified | | 1.0 | |
Diversified Financial Services | | 1.4 | |
Electric | | 10.0 | |
Electrical Components & Equipment | | 0.5 | |
Electronics | | 0.4 | |
Engineering & Construction | | 1.2 | |
Entertainment | | 0.2 | |
Food | | 1.4 | |
Forest Products & Paper | | 0.4 | |
Gas | | 0.9 | |
Hand/Machine Tools | | 0.1 | |
Health Care | | 0.3 | |
Holding Companies - Diversified | | 0.4 | |
Household Products/Wares | | 0.3 | |
Insurance | | 4.9 | |
Investment Companies | | 0.1 | |
Iron/Steel | | 1.6 | |
Lodging | | 0.3 | |
Machinery - Construction & Mining | | 0.2 | |
Machinery - Diversified | | 0.2 | |
Media | | 1.6 | |
Metal Fabricate/Hardware | | 0.1 | |
Mining | | 0.9 | |
Miscellaneous Manufacturing | | 3.1 | |
Office Property | | 0.2 | |
Office/Business Equipment | | 0.1 | |
Oil & Gas | | 11.8 | |
Oil & Gas Services | | 0.1 | |
Packaging & Containers | | 0.1 | |
Pharmaceuticals | | 8.1 | |
Pipelines | | 0.4 | |
Regional Malls | | 0.0 | |
Retail | | 1.7 | |
Savings & Loans | | 0.1 | |
Semiconductors | | 1.2 | |
Shopping Centers | | 0.2 | |
Telecommunications | | 15.3 | |
Transportation | | 0.4 | |
Warehouse/Industrial | | 0.1 | |
Water | | 0.5 | |
Other Long-Term Investments | | 3.3 | |
Other Assets and Liabilities - Net | | 0.1 | |
| | | |
Net Assets | | 100.0 | % |
| | | |
See Accompanying Notes to Financial Statements
124
| | |
ING WISDOMTREESM GLOBAL HIGH-YIELDING EQUITY INDEX PORTFOLIO | | PORTFOLIO OF INVESTMENTS AS OF JUNE 30, 2009 (UNAUDITED) (CONTINUED) |
Fair Value Measurements*
The following is a summary of the inputs used as of June 30, 2009 in determining the Portfolio’s investments at fair value for purposes of SFAS 157:
| | | | | | | | | |
| | | Quoted Prices
in Active
Markets for
Identical
Investments
(Level 1) | | Significant
Other
Observable
Inputs
(Level 2)† | | Significant
Unobservable
Inputs
(Level 3) |
Common Stock | | | | | | | | | |
Australia | | $ | — | | $ | 8,016,293 | | $ | — |
Austria | | | — | | | 476,586 | | | — |
Belgium | | | — | | | 557,749 | | | — |
Brazil | | | 2,741,617 | | | — | | | — |
Canada | | | 9,339,628 | | | — | | | — |
Chile | | | 459,411 | | | — | | | — |
Czech Republic | | | — | | | 1,039,601 | | | — |
Finland | | | — | | | 1,295,814 | | | — |
France | | | — | | | 13,636,886 | | | — |
Germany | | | — | | | 8,783,336 | | | — |
Greece | | | — | | | 578,102 | | | — |
Hong Kong | | | — | | | 1,308,568 | | | — |
Hungary | | | — | | | 104,468 | | | — |
Israel | | | — | | | 533,118 | | | — |
Italy | | | — | | | 7,293,102 | | | — |
Japan | | | — | | | 1,552,040 | | | — |
Malaysia | | | — | | | 1,375,074 | | | — |
Netherlands | | | — | | | 6,047,433 | | | — |
New Zealand | | | — | | | 186,225 | | | — |
Norway | | | — | | | 1,655,447 | | | — |
Philippines | | | — | | | 365,943 | | | — |
Poland | | | — | | | 398,297 | | | — |
Portugal | | | — | | | 792,697 | | | — |
Russia | | | 435,305 | | | 245,023 | | | — |
Singapore | | | — | | | 1,734,440 | | | — |
South Africa | | | — | | | 2,620,244 | | | — |
South Korea | | | — | | | 519,337 | | | — |
Spain | | | — | | | 12,200,788 | | | — |
Sweden | | | — | | | 1,946,349 | | | — |
Switzerland | | | — | | | 3,809,720 | | | — |
Taiwan | | | — | | | 6,806,025 | | | — |
Thailand | | | — | | | 553,959 | | | — |
Turkey | | | — | | | 976,526 | | | — |
United Kingdom | | | — | | | 19,432,684 | | | — |
United States | | | 38,127,092 | | | — | | | — |
| | | | | | | | | |
Total Common Stock | | | 51,103,053 | | | 106,841,874 | | | — |
| | | | | | | | | |
| | | | | | | | | |
| | | Quoted Prices
in Active
Markets for
Identical
Investments
(Level 1) | | Significant
Other
Observable
Inputs
(Level 2)† | | Significant
Unobservable
Inputs
(Level 3) |
Real Estate Investment Trusts | | $ | 1,997,507 | | $ | 1,529,939 | | $ | — |
Exchange-Traded Funds | | | 5,474,367 | | | — | | | — |
Rights | | | 756 | | | — | | | — |
Warrants | | | — | | | 1,220 | | | — |
| | | | | | | | | |
Total | | $ | 58,575,683 | | $ | 108,373,033 | | $ | — |
| | | | | | | | | |
Other Financial Instruments** | | | — | | | — | | | — |
| | | | | | | | | |
Total | | $ | — | | $ | — | | $ | — |
| | | | | | | | | |
“Fair value” for purposes of SFAS 157 is different from “fair value” as used in the 1940 Act. The former generally implies market value, and can include market quotations as a source of value, and the latter refers to determinations of value in absence of available market quotations.
| * | See NOTE 2, “Significant Accounting Policies” in the Notes to Financial Statements for additional information. |
| ** | Other financial instruments may include open forward foreign currency contracts, futures, swaps, and written options. Forward foreign currency contracts and futures are reported at their unrealized gain/loss at period end. Swaps and written options are reported at their market value at period end. |
| † | The earlier close of the foreign markets gives rise to the possibility that significant events, including broad market moves, may have occurred in the interim and may materially affect the value of those securities. To account for this, the Portfolio may frequently value many of its foreign equity securities using fair value prices based on third party vendor modeling tools to the extent available. Accordingly, a significant portion of the Portfolio’s investments are categorized as Level 2 investments. |
See Accompanying Notes to Financial Statements
125
ADVISORY CONTRACT APPROVAL DISCUSSION (UNAUDITED)
ING Hang Seng Index Portfolio, ING RussellTM Large Cap Growth Index Portfolio, ING RussellTM Large Cap Value Index Portfolio and ING RussellTM Mid Cap Growth Index Portfolio
BOARD CONSIDERATIONS IN APPROVING THE INVESTMENT ADVISORY AND SUB-ADVISORY AGREEMENTS
Section 15 of The Investment Company Act of 1940, as amended (the “1940 Act”) provides, in substance, that, each new investment advisory agreement and sub-advisory agreement for a mutual fund must be approved by the board of directors of the fund, including a majority of the directors who have no direct or indirect interest in the agreement and who are not “interested persons” of the fund. Consistent with this requirement of the 1940 Act, the board of directors (the “Board”) of ING Variable Portfolios, Inc. (the “Company”) has established a process for considering the advisory and sub-advisory arrangements for any new series of the Company prior to the commencement of its operations.
Overview of the Review Process
At meetings held on February 6, 2009 and March 19, 2009, the Board of the Company, including all of the independent directors who are not “interested persons” of the Company (the “Independent Directors”), authorized the establishment of the following new mutual funds to operate within the ING complex of mutual funds (the “ING Funds”): ING RussellTM Large Cap Growth Index Portfolio, ING RussellTM Large Cap Value Index Portfolio, ING RussellTM Mid Cap Growth Index Portfolio and ING Hang Seng Index Portfolio (the “New Funds”). In connection with the establishment of the New Funds, the Board, including all of the Independent Directors, also voted to approve (i) investment advisory agreements (the “Advisory Agreements”) for each New Fund with ING Investments, LLC (the “Adviser”) and (ii) a sub-advisory agreement (the “IIM Agreement”) between the Adviser and ING Investment Management Co. (“IIM”) with respect to each New Fund (IIM being referred to as the “Sub-Adviser” and the IIM Agreements being referred to as the “Sub-Advisory Agreements”). Prior to voting such approvals, the Board received the affirmative recommendation of the Contracts Committee of the Board, which is a Committee of the Board comprised of all of the Independent Directors and exclusively of the Independent Directors.
The Contracts Committee recommended approval of the Advisory and Sub-Advisory Agreements after completing an extensive review of information received from the Adviser and the Sub-Adviser in connection with the establishment of the New Funds and as part of the annual contract approval process for other ING Funds advised and sub-advised by the Adviser and IIM, respectively. Such information included the following: (1) comparative data regarding management fees, including data regarding the fees charged by the Adviser and the Sub-Adviser for managing other mutual funds and institutional accounts using investment strategies and techniques similar to those to be used in managing the New Funds; (2) comparative data regarding the proposed expense ratio of each New Fund and the expense ratio of a selected peer group of similar funds (the “Selected Peer Group”); (3) copies of each form of advisory agreement and sub-advisory agreement; (4) copies of the codes of ethics of the Adviser and of the Sub-Adviser, together with information relating to the manner in which each code is administered; (5) financial statements of the Adviser and of the Sub-Adviser; (6) profitability analyses for the Adviser and its affiliated companies with respect to each New Fund; (7) descriptions of the qualifications of the investment personnel expected to be responsible for managing each New Fund and their responsibilities with respect to managing other accounts or mutual funds; (8) descriptions of the services expected to be provided to the New Funds, including the investment strategies and techniques used by the Sub-Adviser in managing the New Funds; (9) data relating to brokerage practices, including practices with respect to the acquisition of research through “soft dollar” benefits received in connection with the New Funds’ brokerage; (10) descriptions of the business continuity and disaster recovery plans of the Adviser and the Sub-Adviser; (11) descriptions of various compliance programs of the Adviser and the Sub-Adviser, including the Adviser’s programs for monitoring and enforcing compliance with the ING Funds’ policies with respect to market-timing, late trading and selective portfolio disclosure; and (12) other information relevant to an evaluation of the nature, extent and quality of the services expected to be provided by the Adviser and the Sub-Adviser in response to a series of detailed questions presented by Goodwin Procter LLP, independent legal counsel (“Counsel”) on behalf of the Independent Directors. The Contracts Committee relied upon this information in evaluating the qualifications of the Adviser and the Sub-Adviser to manage the New Funds.
126
ADVISORY CONTRACT APPROVAL DISCUSSION (UNAUDITED) (CONTINUED)
In addition, the Contracts Committee considered information relating specifically to the investment objectives and investment policies of each New Fund and the ability of the Adviser and Sub-Adviser to pursue the New Fund’s investment objective by implementing these investment policies. For each New Fund, the Board considered, among other things, the Sub-Adviser’s experience with the management of other index-based mutual funds and similar products, the unique characteristics of the index that each New Fund is proposed to track and whether the Sub-Adviser proposes to use a replication or optimization strategy to manage the New Funds. Prior to voting to recommend approval of the Advisory and Sub-Advisory Agreements for each New Fund, the Contracts Committee and/or the Board received presentations from the Adviser and the Sub-Adviser regarding the investment strategies to be used in pursuing the New Fund’s investment objective.
The Independent Directors were assisted by Counsel throughout this process. The Independent Directors relied upon the advice of Counsel and their own business judgment in determining the material factors to be considered in evaluating the Advisory and Sub-Advisory Agreements and the weight to be given to each such factor. The conclusions reached by the Independent Directors were based on a comprehensive evaluation of all of the information provided and was not the result of any one factor. Moreover, each Independent Director may have afforded different weight to the various factors in reaching his or her conclusions with respect to each Advisory and Sub-Advisory Agreement.
Nature, Extent and Quality of Services
In considering whether to approve the Advisory and Sub-Advisory Agreements, the Board evaluated the nature, extent and quality of services that will be provided to the New Funds by the Adviser and the Sub-Adviser. Specifically, the Board considered the quantity and quality of the resources available to provide such services and the qualifications of the individuals that will be responsible for performing various investment services for the New Funds. The Board also considered the quality of the compliance programs of the Adviser and of the Sub-Adviser, including the manner in which the Adviser and the Sub-Adviser will monitor for compliance with the investment policies and restrictions of the New Funds, the Codes of Ethics of the Adviser and the Sub-Adviser with respect to personal trading by employees with
access to portfolio information, and other compliance related matters. The Board also considered the actions taken by the Adviser and the Sub-Adviser to establish and maintain effective disaster recovery and business continuity plans.
The Board noted that, in connection with its annual contract review process, it had considered a variety of other matters bearing on the nature, extent and quality of the services provided to all of the ING Funds, including the actions taken by the Adviser and its affiliated companies to administer the ING Funds’ policies and procedures for voting proxies, valuing the Funds’ assets, selective disclosure of portfolio holdings and preventing late-trading and frequent trading of Fund shares. With respect to these and related compliance matters, the Board had also considered the responsiveness of the Adviser and its affiliated companies over the course of the past several years to the inquiries of various regulatory authorities, including the U.S. Securities and Exchange Commission. The Board also took into account the efforts of the Adviser and its affiliated companies to reduce the expenses of the ING Funds, including fees and expenses for transfer agency, custody and audit services. The Board specifically noted that the Adviser and its affiliated companies have significantly reduced the brokerage costs of the ING Funds and their portfolio turnover rates, as well as the quantity of research acquired through the use of soft dollars from the ING Funds’ brokerage. The Board also noted the efforts of the Adviser to optimize the number of ING Funds and to standardize the asset management characteristics and policies across the ING mutual fund platform. Consideration was also given to the benefits that shareholders of the New Funds may realize because the New Funds are part of a larger ING family of mutual funds, including, in most cases, the ability of shareholders to exchange or transfer investments within the same class of shares among a wide variety of mutual funds without incurring additional sales charges.
The Board concluded that the nature, extent and quality of advisory and related services to be provided by the Adviser and the Sub-Adviser for each New Fund, taken as a whole, can be expected to be consistent with the terms of the respective Advisory and Sub-Advisory Agreements and that the fees to be paid for such service are fair and reasonable.
The Board noted that the New Funds have no prior performance record. Based on this information, the
127
ADVISORY CONTRACT APPROVAL DISCUSSION (UNAUDITED) (CONTINUED)
Board concluded that the Sub-Adviser can be expected to achieve satisfactory performance in managing the portfolios of the New Funds.
Management Fees, Sub-Advisory Fees and Expenses
Consideration was given to the proposed contractual investment advisory fee rates, inclusive of administrative fee rates, payable by the New Funds to the Adviser and its affiliated companies (referred to collectively as “management fees”) and the contractual sub-advisory fee rates payable by the Adviser to the Sub-Adviser for sub-advisory services. As part of its review, the Board considered each New Fund’s proposed management fee and total expense ratio, as compared to its proposed Selected Peer Group. In addition, the Directors received information regarding the fees charged by the Sub-Adviser to similarly-managed institutional accounts and other mutual funds, if any, and the comparability (or lack thereof) of the services provided by the Sub-Adviser in managing such accounts and other mutual funds to the services to be provided in managing the New Funds. The Board evaluated the reasonableness of the total fees received by the Adviser and its affiliate in the aggregate under the Advisory and Sub-Advisory Agreements. After reviewing the foregoing information, and in light of the nature, extent and quality of the services provided by the Adviser and the Sub-Adviser, the Board concluded with respect to each New Fund that the management fee to be charged to each New Fund for advisory, sub-advisory and related services is fair and reasonable and that the total expense ratio of each New Fund is reasonable.
Profitability
The Board considered information relating to the revenues, expenses, and profits expected to be realized by the Adviser and its affiliated companies attributable to performing advisory, sub-advisory and administrative services for the Funds. With respect to the Adviser and its affiliated companies, such information was prepared in accordance with a methodology approved by the Contracts Committee. The Board considered the profitability of the Adviser and its affiliated companies attributable to managing and operating each New Fund both with and without the profitability of the distributor of the New Funds and both before and after giving effect to any expenses expected to be incurred by the Adviser or any affiliated company in making revenue sharing or other payments to third parties,
including affiliated insurance companies, for distribution and administrative services. The Board considered the total profits derived by the Adviser and its affiliate in the aggregate attributable to managing and operating each New Fund. The Board also considered other direct or indirect benefits that the Adviser and the Sub-Adviser, and any affiliated companies thereof, will derive from their relationships with the New Funds, including the receipt by ING U.S. Financial Services, an affiliate of the Adviser, of fees relating to the offering of bundled financial products, such as annuity contracts, and the receipt by the Sub-Adviser of “soft dollar” benefits from the New Funds’ brokerage. The Board concluded that, in light of the nature, extent and quality of the services provided, the profits expected to be realized by the Adviser and its affiliated companies, taken as a whole, with respect to providing advisory, sub-advisory and administrative services for each New Fund are reasonable.
In considering the reasonableness of the management fee of each New Fund, the Board considered the extent to which economies of scale can be expected to be realized by the New Fund’s Adviser and its affiliated companies, on the one hand, and by the New Fund, on the other hand, as the assets of the New Fund increase. The Board recognized the inherent difficulties in measuring precisely the impact of any economies of scale being realized by the Adviser and its affiliated companies with respect to their management of any one or more New Funds. The Board also reviewed information regarding the projected expense ratio of each New Fund in light of projected changes in the assets of the New Fund, noting that, as the assets of a New Fund increase, the fixed expenses of the New Fund, as a percentage of the total assets of the New Fund, can be expected to decrease. The Board considered such expense information in light of projections provided by the Adviser with respect to the future growth of assets of the New Funds. Based upon the foregoing, the Board concluded that the fee schedules for each New Fund can be expected to result in an equitable sharing among the New Fund, the Adviser and the Sub-Adviser of the benefits from economies of scale as assets grow.
BOARD CONSIDERATIONS IN APPROVING THE SUB-ADVISORY AGREEMENT FOR THE ING U.S. BOND INDEX PORTFOLIO
Section 15 of The Investment Company Act of 1940, as amended (the “1940 Act”) provides, in substance, that, each new investment advisory agreement and
128
ADVISORY CONTRACT APPROVAL DISCUSSION (UNAUDITED) (CONTINUED)
sub-advisory agreement for a mutual fund must be approved by the board of directors of the fund, including a majority of the directors who have no direct or indirect interest in the agreement and who are not “interested persons” of the fund. Consistent with this requirement of the 1940 Act, the board of directors (the “Board”) of ING Variable Portfolios, Inc. (the “Company”) has established a process for considering the advisory and sub-advisory arrangements for any series of the Company.
Overview of the Review Process
On February 6, 2009, the Board of the Company, including all of the directors who are not “interested persons” of the Company (the “Independent Directors”), voted to approve a new sub-advisory agreement (the “Sub-Advisory Agreement”) between ING Investments, LLC (the “Adviser”) and Lehman Brothers Asset Management, LLC (“LBAM” or “Sub-Adviser”) with respect to the ING U.S. Bond Index Portfolio (the “Portfolio”) as a result of the expected termination of the current sub-advisory agreement in connection with the proposed acquisition of LBAM (the “Proposed Transaction”) by a new entity (“Newco”) to be formed by certain members of senior management of the Investment Management Division (“IMD”) of Lehman Brothers Holdings Inc. (“LBHI”). In considering the Sub-Advisory Agreement, the Board noted that following the Proposed Transaction LBAM will continue to serve as sub-adviser to the Portfolio. The Board further noted that LBAM has provided assurances to the Board that following the Proposed Transaction the Portfolio will receive the same level of services as are currently provided by LBAM. Additionally, the Board noted the following: (1) that the investment management processes and techniques to be used by LBAM in pursuing the Portfolio’s investment objective will be identical to those currently in place, (2) that the professional personnel, including the portfolio managers, involved in managing the Portfolio will be identical to those persons currently involved in the management of the Portfolio, (3) that the sub-advisory fee rates payable by the Adviser to LBAM will remain the same, and (4) that no material changes to LBAM’s compliance program are expected in connection with the Proposed Transaction.
In determining whether to approve the Sub-Advisory Agreement, the Board considered: a presentation from LBAM regarding the Proposed Transaction (the “Presentation”) and LBAM’s written response (the “Response”) to a series of detailed questions presented
by Goodwin Procter LLP, independent legal counsel on behalf of the Independent Directors (“Counsel”). The Presentation and Response included, among other things, the following: (1) information from LBAM regarding the expected ownership structure of Newco (and thus of LBAM), (2) assurances from LBAM that the Proposed Transaction will not impact the Portfolio or the sub-advisory services currently provided to the Portfolio, (3) comparative data regarding the fees charged by LBAM for managing other mutual funds and institutional accounts using investment strategies and techniques similar to those used in managing the Portfolio; (4) a copy of the form of sub-advisory agreement; (5) a pro forma balance sheet of the Sub-Adviser immediately following the Proposed Transaction; (6) assurances from LBAM that the professional personnel to be responsible for managing the Portfolio will be identical to the professional personnel currently responsible for managing the Portfolio; (7) a description of LBAM’s current business continuity and disaster recovery plan and assurances that such plan is expected to remain in place; (8) a copy of the current code of ethics of the Sub-Adviser, together with assurances that if material changes were made to such code of ethics, the Sub-Adviser would notify the Adviser and the Board and would provide a copy of such revised code; and (9) a description of LBAM’s compliance program and assurances that no material changes are currently expected to be made to such compliance program.
The Independent Directors were assisted by Counsel, throughout this process. The Independent Directors relied upon the advice of such counsel and their own business judgment in determining the material factors to be considered in evaluating the Sub-Advisory Agreement and the weight to be given to each such factor. The conclusions reached by the Independent Directors were based on a comprehensive evaluation of all of the information provided and was not the result of any one factor. Moreover, each Independent Director may have afforded different weight to the various factors in reaching his or her conclusions with respect to the Sub-Advisory Agreement.
The Board’s consideration of whether to approve the Sub-Advisory Agreement took into account several factors including, but not limited to, the following:
THE NATURE, EXTENT AND QUALITY OF THE SUB-ADVISORY SERVICES TO BE PROVIDED. The Board considered that the sub-advisory services to be provided under the Sub-Advisory Agreement will be identical to the sub-advisory services currently rendered to the
129
ADVISORY CONTRACT APPROVAL DISCUSSION (UNAUDITED) (CONTINUED)
Portfolio. The Board also considered that LBAM’s compliance program, including the manner in which LBAM will monitor for compliance with the investment policies and restrictions of the Portfolio and the Code of Ethics of the Sub-Adviser with respect to personal trading by employees with access to portfolio information, is not expected to undergo any material changes as a result of the Proposed Transaction. The Board also considered that LBAM’s business continuity plan and disaster recovery plan is expected to remain in place following the Proposed Transaction. The Board concluded that the nature, extent and quality of sub-advisory services to be provided by LBAM for the Portfolio, taken as a whole, can be expected to be consistent with the terms of the Sub-Advisory Agreement and that the fees to be paid for such services are fair and reasonable.
THE INVESTMENT PERFORMANCE. The Board considered the investment performance achieved by LBAM in managing the Portfolio and in managing similar funds. Based on this information, the Board concluded that LBAM can be expected to achieve satisfactory performance in managing the assets of the Portfolio.
THE COST OF SUB-ADVISORY SERVICES PROVIDED. Consideration was given to the proposed contractual sub-advisory fee rates payable by the Adviser to LBAM for sub-advisory services which rates are identical to the fee rates currently in place with respect to the Portfolio. As part of its review, the Board received information regarding the fees charged by LBAM to similarly-managed institutional accounts and other mutual funds, if any, and the comparability (or lack thereof) of the services provided by LBAM in managing such accounts and other mutual funds to the services provided in managing the Portfolio. Further, the Board received assurances from LBAM and the Adviser that there would be no change to the existing fee structure of the Portfolio as a result of the Proposed Transaction. The Board evaluated the reasonableness of the total fees to be received by LBAM under the Sub-Advisory Agreement. After reviewing the foregoing information, and in light of the nature, extent and quality of the services to be provided by LBAM, the Board concluded that the fees to be charged to the Portfolio for sub-advisory services are fair and reasonable.
PROFITABILITY AND ECONOMIES OF SCALE. The Board did not consider the profitability of LBAM, an unaffiliated sub-adviser, to be a material factor because the Board believes that the Adviser negotiates
sub-advisory fees with unaffiliated sub-advisers on an arm’s-length basis. In considering the reasonableness of the sub-advisory fee rates payable by the Adviser to LBAM for sub-advisory services, the Board noted that the sub-advisory fee schedule for the Portfolio includes breakpoints such that, as the assets of the Portfolio increase, the Portfolio’s sub-advisory fee will decrease as a percentage of the Portfolio’s total assets.
OTHER CONSIDERATIONS. In approving the Sub-Advisory Agreement, the Board considered such other factors as it deemed appropriate, including its receipt of assurances from LBAM that any future modifications to the ownership structure of Newco (and thus of LBAM) would be immaterial and thus would not result in any further change of control of LBAM.
Based on these conclusions and other factors, the Board voted to approve the Sub-Advisory Agreement.
BOARD CONSIDERATIONS IN APPROVING THE INVESTMENT ADVISORY AND SUB-ADVISORY AGREEMENTS FOR THE ING RUSSELL GLOBAL LARGE CAP INDEX 75% PORTFOLIO
Section 15 of The Investment Company Act of 1940, as amended (the “1940 Act”) provides, in substance, that, each new investment advisory agreement and sub-advisory agreement for a mutual fund must be approved by the board of directors of the fund, including a majority of the directors who have no direct or indirect interest in the agreement and who are not “interested persons” of the fund. Consistent with this requirement of the 1940 Act, the board of directors (the “Board”) of ING Variable Portfolios, Inc. (the “Company”) has established a process for considering the advisory and sub-advisory arrangements for any new series of the Company prior to the commencement of its operations.
Overview of the Review Process
At meetings held on March 13, 2008 and June 4, 2008, the Board of the Company, including all of the independent directors who are not “interested persons” of the Company (the “Independent Directors”), authorized the establishment of the ING Russell Global Large Cap Index 75% Portfolio (the “Russell Portfolio”), as a portfolio series of the Company, to operate within the ING complex of mutual funds (the “ING Funds”).
At the meeting held June 4, 2008, in connection with the establishment of the Russell Portfolio, the Board,
130
ADVISORY CONTRACT APPROVAL DISCUSSION (UNAUDITED) (CONTINUED)
including all of the Independent Directors, voted to approve (i) an investment advisory agreement (the “Advisory Agreement”) for the Russell Portfolio with ING Investments, LLC (the “Adviser”), (ii) a sub-advisory agreement (the “Sub-Advisory Agreement” and collectively with the Advisory Agreement, the “Agreements”) between the Adviser and ING Investment Management Co. (“IIM” or “Sub-Adviser”) with respect to the Russell Portfolio. Prior to voting such approvals, the Board received the affirmative recommendation of the Contracts Committee of the Board, which is a Committee of the Board comprised of all of the Independent Directors and exclusively of the Independent Directors.
The Contracts Committee recommended approval of each of the Agreements after completing an extensive review of information received from the Adviser and the Sub-Adviser in connection with the establishment of the Russell Portfolio and as part of the annual contract approval process for other ING Funds advised and sub-advised by the Adviser and the Sub-Adviser, respectively. Such information included the following: (1) comparative data regarding management fees, including data regarding the fees charged by the Adviser and the Sub-Adviser for managing other mutual funds and institutional accounts using investment strategies and techniques similar to those to be used in managing the Russell Portfolio; (2) comparative data regarding the proposed expense ratio of the Russell Portfolio and the expense ratio of a selected peer group of similar funds (the “Selected Peer Group”); (3) copies of the form of advisory agreement and the form of sub-advisory agreement; (4) copies of the codes of ethics of the Adviser and of the Sub-Adviser, together with information relating to the manner in which each code is administered; (5) financial statements of the Adviser and of the Sub-Adviser; (6) profitability analyses for the Adviser and its affiliated companies with respect to the Russell Portfolio; (7) descriptions of the qualifications of the investment personnel expected to be responsible for managing the Russell Portfolio and their responsibilities with respect to managing other accounts or mutual funds; (8) descriptions of the services expected to be provided to the Russell Portfolio, including the investment strategies and techniques used by the Sub-Adviser in managing the Russell Portfolio; (9) data relating to brokerage practices, including practices with respect to the acquisition of research through “soft dollar” benefits received in connection with the Russell Portfolio’s brokerage; (10) descriptions of the business continuity and disaster recovery plans of the Adviser
and the Sub-Adviser; (11) descriptions of various compliance programs of the Adviser and the Sub-Adviser, including the Adviser’s programs for monitoring and enforcing compliance with the ING Funds’ policies with respect to market-timing, late trading and selective portfolio disclosure; and (12) other information relevant to an evaluation of the nature, extent and quality of the services expected to be provided by the Adviser and the Sub-Adviser in response to a series of detailed questions presented by independent legal counsel on behalf of the Independent Directors. The Contracts Committee relied upon this information in evaluating the qualifications of the Adviser and Sub-Adviser to manage the Russell Portfolio.
In addition, the Contracts Committee considered information relating specifically to the investment objective and investment policies of the Russell Portfolio and the ability of the Adviser and Sub-Adviser to pursue the Russell Portfolio’s investment objective by implementing these investment policies. Prior to voting to recommend approval of the Advisory Agreement and the Sub-Advisory Agreement for the Russell Portfolio, the Contracts Committee and/or the Board received presentations from the Adviser and the Sub-Adviser regarding the investment strategies to be used in pursuing the Russell Portfolio’s investment objective.
The Independent Directors were assisted by Goodwin Procter LLP, their independent legal counsel, throughout this process. The Independent Directors relied upon the advice of such counsel and their own business judgment in determining the material factors to be considered in evaluating the Advisory Agreement and the Sub-Advisory Agreement and the weight to be given to each such factor. The conclusions reached by the Independent Directors were based on a comprehensive evaluation of all of the information provided and was not the result of any one factor. Moreover, each Independent Director may have afforded different weight to the various factors in reaching his or her conclusions with respect to the Advisory Agreement and the Sub-Advisory Agreement.
Nature, Extent and Quality of Services
In considering whether to approve the Advisory Agreement and the Sub-Advisory Agreement, the Board evaluated the nature, extent and quality of services that will be provided to the Russell Portfolio by the Adviser and the Sub-Adviser. Specifically, the Board considered the quantity and quality of the resources
131
ADVISORY CONTRACT APPROVAL DISCUSSION (UNAUDITED) (CONTINUED)
available to provide such services and the qualifications of the individuals that will be responsible for performing various investment services for the Russell Portfolio. The Board also considered the quality of the compliance programs of the Adviser and of the Sub-Adviser, including the manner in which the Adviser and the Sub-Adviser will monitor for compliance with the investment policies and restrictions of the Russell Portfolio, the Codes of Ethics of the Adviser and of the Sub-Adviser with respect to personal trading by employees with access to portfolio information, and other compliance related matters. The Board also considered the actions taken by the Adviser and the Sub-Adviser to establish and maintain effective disaster recovery and business continuity plans.
The Board noted that, in connection with its annual contract review process, it had considered a variety of other matters bearing on the nature, extent and quality of the services provided to all of the ING Funds, including the actions taken by the Adviser and its affiliated companies to administer the ING Funds’ policies and procedures for valuing the Funds’ assets, selective disclosure of portfolio holdings and preventing late-trading and frequent trading of Fund shares. With respect to these and related compliance matters, the Board had also considered the responsiveness of the Adviser and its affiliated companies over the course of the past several years to the inquiries of various regulatory authorities, including the U.S. Securities and Exchange Commission. The Board also took into account the efforts of the Adviser and its affiliated companies to reduce the expenses of the ING Funds, including fees and expenses for transfer agency, custody and audit services. The Board specifically noted that the Adviser and its affiliated companies have significantly reduced the brokerage costs of the ING Funds and their portfolio turnover rates, as well as the quantity of research acquired through the use of soft dollars from the ING Funds’ brokerage. The Board also noted the efforts of the Adviser to optimize the number of mutual funds in the ING complex of funds and to standardize the asset management characteristics and policies across the ING mutual fund platform. Consideration was also given to the benefits that shareholders of the Russell Portfolio may realize because the Russell Portfolio is part of a larger ING family of mutual funds, including, in most cases, the ability of shareholders to exchange or transfer investments within the same class of shares among a wide variety of mutual funds without incurring additional sales charges.
The Board concluded that the nature, extent and quality of advisory and related services to be provided by the Adviser and the Sub-Adviser for the Russell Portfolio, taken as a whole, can be expected to be consistent with the terms of the Advisory Agreement and Sub-Advisory Agreement and that the fees to be paid for such services are fair and reasonable.
The Board noted that the Russell Portfolio has no prior performance record. The Board considered the performance achieved by the Sub-Adviser in operating a “model portfolio” using substantially the same investment strategies as the Sub-Adviser will use in managing the Russell Portfolio. Based on this information, the Board concluded that the Sub-Adviser can be expected to achieve satisfactory performance in managing the portfolio of the Russell Portfolio.
Management Fee, Sub-Advisory Fee and Expenses
Consideration was given to the proposed contractual investment advisory fee rates, inclusive of administrative fee rates, payable by the Russell Portfolio to the Adviser and its affiliated companies (referred to collectively as “management fees”) and the contractual sub-advisory fee rates payable by the Adviser to the Sub-Adviser for sub-advisory services. As part of its review, the Board considered the Russell Portfolio’s proposed management fee and total expense ratio, as compared to its proposed Selected Peer Group. In addition, the Directors received information regarding the fees charged by the Sub-Adviser to similarly-managed institutional accounts and other mutual funds, if any, and the comparability (or lack thereof) of the services provided by the Sub-Adviser in managing such accounts and other mutual funds to the services to be provided in managing the Russell Portfolio. The Board evaluated the reasonableness of the total fees to be received by the Adviser and its affiliate in the aggregate under the Advisory Agreement and Sub-Advisory Agreement. After reviewing the foregoing information, and in light of the nature, extent and quality of the services to be provided by the Adviser and the Sub-Adviser, the Board concluded that the management fee to be charged to the Russell Portfolio for advisory, sub-advisory and related services is fair and reasonable and that the total expense ratio of the Russell Portfolio is reasonable.
Profitability
The Board considered information relating to the revenues, expenses, and profits expected to be realized
132
ADVISORY CONTRACT APPROVAL DISCUSSION (UNAUDITED) (CONTINUED)
by the Adviser and its affiliated companies attributable to performing advisory, sub-advisory and administrative services for the Funds. With respect to the Adviser and its affiliated companies, such information was prepared in accordance with a methodology approved by the Contracts Committee. The Board considered the expected profitability of the Adviser and its affiliated companies attributable to managing and operating the Russell Portfolio both with and without the profitability of the distributor of the Russell Portfolio and both before and after giving effect to any expenses expected to be incurred by the Adviser or any affiliated company in making revenue sharing or other payments to third parties, including affiliated insurance companies, for distribution and administrative services. The Board considered the total profits to be derived by the Adviser and the affiliated Sub-Adviser in the aggregate attributable to managing and operating the Russell Portfolio. The Board also considered other direct or indirect benefits that the Adviser and Sub-Adviser, and any affiliated companies thereof, will derive from their relationships with the Russell Portfolio, including the receipt by ING U.S. Financial Services, an affiliate of the Adviser, of fees relating to the offering of bundled financial products, such as annuity contracts, and the receipt by the Sub-Adviser of “soft dollar” benefits from the Russell Portfolio’s brokerage. The Board concluded that, in light of the nature, extent and quality of the services to be provided, the profits expected to be realized by the Adviser and its affiliated companies, taken as a whole, with respect to providing
advisory, sub-advisory and administrative services for the Russell Portfolio are reasonable.
In considering the reasonableness of the management fee of the Russell Portfolio, the Board considered the extent to which economies of scale can be expected to be realized by the Russell Portfolio’s Adviser and its affiliated companies, on the one hand, and by the Russell Portfolio, on the other hand, as the assets of the Russell Portfolio increase. The Board recognized the inherent difficulties in measuring precisely the impact of any economies of scale being realized by the Adviser and its affiliated companies with respect to their management of any one or more other new funds, along with the Russell Portfolio. The Board also reviewed information regarding the projected expense ratio of the Russell Portfolio in light of projected changes in the assets of the Russell Portfolio, noting that, as the assets of the Russell Portfolio increase, the fixed expenses of the Russell Portfolio, as a percentage of the total assets of the Russell Portfolio, can be expected to decrease. The Board considered such expense information in light of projections provided by the Adviser with respect to the future growth of assets of the Russell Portfolio. Based upon the foregoing, the Board concluded that the fee schedule for the Russell Portfolio can be expected to result in an equitable sharing among the Russell Portfolio, the Adviser and the Sub-Adviser of the benefits from economies of scale as assets grow.
133
Investment Adviser
ING Investments, LLC
7337 East Doubletree Ranch Road
Scottsdale, Arizona 85258
Administrator
ING Funds Services, LLC
7337 East Doubletree Ranch Road
Scottsdale, Arizona 85258
Distributor
ING Funds Distributor, LLC
7337 East Doubletree Ranch Road
Scottsdale, Arizona 85258
Transfer Agent
PNC Global Investment Servicing (U.S.) Inc.
301 Bellevue Parkway
Wilmington, Delaware 19809
Custodian
The Bank of New York Mellon
One Wall Street
New York, New York 10286
Legal Counsel
Goodwin Procter LLP
Exchange Place
53 State Street
Boston, Massachusetts 02109
Before investing, carefully consider the investment objectives, risks, charges and expenses of the variable annuity contract and the underlying variable investment options. This and other information is contained in the prospectus for the variable annuity contract and the underlying variable investment options. Obtain these prospectuses from your agent/registered representative and read them carefully before investing.
| | | | |
 | | VPSAR-AVIPALL | | (0609-082809) |

Semi-Annual Report
June 30, 2009
Class S
ING Variable Portfolios, Inc.
| n | ING Global Equity Option Portfolio |
| | |
 | | E-Delivery Sign-up – details inside |
This report is submitted for general information to shareholders of the ING Funds. It is not authorized for distribution to prospective shareholders unless accompanied or preceded by a prospectus which includes details regarding the funds’ investment objectives, risks, charges, expenses and other information. This information should be read carefully.
MUTUAL FUNDS 
| |
TABLE OF CONTENTS
| | | | |
| | | |
| | Go Paperless with E-Delivery! | | |
Sign up now for on-line prospectuses, fund reports, and proxy statements. In less than five minutes, you can help reduce paper mail and lower fund costs. Just go to www.ingfunds.com, click on the E-Delivery icon from the home page, follow the directions and complete the quick 5 Steps to Enroll. You will be notified by e-mail when these communications become available on the internet. Documents that are not available on the internet will continue to be sent by mail. |
PROXY VOTING INFORMATION
A description of the policies and procedures that the Portfolio uses to determine how to vote proxies related to portfolio securities is available: (1) without charge, upon request, by calling Shareholder Services toll-free at (800) 992-0180; (2) on the ING Funds’ website at www.ingfunds.com; and (3) on the U.S. Securities and Exchange Commission’s (“SEC”) website at www.sec.gov. Information regarding how the Portfolio voted proxies related to portfolio securities during the most recent 12-month period ended June 30 is available without charge on the ING Funds’ website at www.ingfunds.com and on the SEC’s website at www.sec.gov.
QUARTERLY PORTFOLIO HOLDINGS
The Portfolio files its complete schedule of portfolio holdings with the SEC for the first and third quarters of each fiscal year on Form N-Q. The Portfolio’s Forms N-Q are available on the SEC’s website at www.sec.gov. The Portfolio’s Forms N-Q may be reviewed and copied at the SEC’s Public Reference Room in Washington, DC, and information on the operation of the Public Reference Room may be obtained by calling (800) SEC-0330; and is available upon request from the Portfolio by calling Shareholder Services toll-free at (800) 992-0180.
PRESIDENT’S LETTER

Dear Shareholder,
As we enter the third quarter of 2009, we look forward hopefully to the end of the recession, at least in the United States. While recent economic news can best be characterized as less bad (as opposed to good), there is a chance that recovery could begin sometime in the third quarter.
Could this be the hour before the dawn? The financial markets seem to have factored in expectations of recovery, as evidenced by recent gains. The stock market, as measured by the S&P 500® Index(1), has advanced into the mid-900 range, a substantial climb from its mid-600s low in early March. The Dow Jones Industrial Average(2) recently broke through 9,000 to reach its highest level since January of this year. As investors become less risk-averse, they are shifting back into stocks.
Should you be doing the same? The answer depends on several important factors unique to your situation: your long-term investment goals, your tolerance for risk and
your current portfolio allocation. If you made any changes to your portfolio allocation over the past year or so — perhaps in an effort to avoid losses during a time of high uncertainty or to feel more comfortable with your investments — your portfolio now may be out of alignment with your long-term goals. On the other hand, your current portfolio may now be better suited to your tolerance for risk. You may still want to reallocate your portfolio, but you should first rethink your goals in the context of the volatility you are willing to bear. This is particularly important in that the market may continue to experience periods of volatility as economic conditions stabilize and recover.
As always, we encourage you to discuss these matters thoroughly with your financial advisor before making any changes to your portfolio. Thank you for your continued confidence in ING Funds. We look forward to serving your investment needs in the future.
Sincerely,

Shaun Mathews
President & Chief Executive Officer
ING Funds
June 30, 2009
The views expressed in the President’s Letter reflect those of the President as of the date of the letter. Any such views are subject to change at any time based upon market or other conditions and ING Funds disclaim any responsibility to update such views. These views may not be relied on as investment advice and because investment decisions for an ING Fund are based on numerous factors, may not be relied on as an indication of investment intent on behalf of any ING Fund. Reference to specific company securities should not be construed as recommendations or investment advice. Consider the fund’s investment objectives, risks, and charges and expenses carefully before investing. The prospectus contains this information and other information about the fund.
International investing poses special risks including currency fluctuation, economic and political risks not found in investments that are solely domestic.
| (1) | | The S&P 500® Index is an unmanaged index that measures the performance of securities of approximately 500 of the largest companies in the United States. |
| (2) | | The Dow Jones Industrial Average is a widely followed measurement of the stock market. The average is comprised of 30 stocks that represent leading companies in major industries. |
1
MARKET PERSPECTIVE: SIX MONTHS ENDED JUNE 30, 2009
Many were hopeful as the year started that the newly elected U.S. president’s promised $1 trillion stimulus package, a federal funds rate now reduced to 0% - 0.25%, and record low mortgage rates would help to put a base under slumping economies and markets. But global equities in the form of the MSCI World® Index,(1) measured in local currencies, including net reinvested dividends (“MSCI” for regions discussed below), soon resumed their slide and by March 9, 2009, the index had dropped nearly 22% for the year to date, to the previous cycle lows of late 2002. Abruptly however, markets recovered, surging by 34%, to record a gain of 4.8% for the six-month period ended June 30, 2009. Markets generally wavered somewhat at the end of the period, as the World Bank raised its estimate for the drop in global gross domestic product (“GDP”) for 2009. In currencies, the dollar was initially strong but then fell back, gaining 0.3% on the euro, 5.7% against the yen, but losing 12.4% against the pound.
While credit markets had improved since the dark days of late 2008, most banks had tightened lending standards despite large capital infusions under the Troubled Asset Relief Program (“TARP”). The problem remained the enormous volumes of distressed loans and toxic assets of indeterminate value on bank balance sheets. The Administration soon announced a Public-Private Investment Program to buy these assets up. The Federal Reserve would also expand its purchases of agency mortgage-backed securities and buy up to $300 billion in longer dated Treasuries to push mortgage interest rates lower. Another $750 billion beyond TARP would be made available. A $75 billion plan would cut mortgage payments for struggling homeowners. Much of this was set out in the president’s first budget, which projected a $1.75 trillion deficit!
While policy initiatives helped on balance, the reasons for the collective resurgence of equities after March 9, 2009 are hard to pin down. Troubled Citigroup’s claim on March 10 that the year 2009 had been profitable so far was one catalyst. More generally, the economic reports from which markets seemed to be taking heart were only improving weakly and erratically. Nonetheless they were soon being referred to as “green shoots”.
In housing, the Standard & Poor’s (“S&P”)/Case-Shiller National U.S. Home Price Index(2) of house prices in 20 cities sank a record 19% year-over-year in January. But from there the declines moderated to 18.1% in the most recent report. By the end of June 2009, sales of existing homes had risen for two months
and the proportion of distressed sales was down to about one-third, from nearly half earlier in the year.
A flimsier (but welcome) green shoot emerged in the final employment report, where May payrolls fell by the smallest number in eight months, even as the rate increased to 9.4%, a 25-year record. The fall in the 2009 first quarter GDP was revised down to 5.5% annualized, having first been reported near the 2008 fourth quarter’s decades high 6.3%.
Consumer demand was weak, evidenced by the largest annual drop in the consumer price index, 1.3%, since 1950. But the government’s stimulus plan boosted incomes by 1.4% in May 2009, sending the savings rate to 6.9%, the most in 15 years. Still, retail sales were reported higher, the first increase in three months.
U.S. fixed income markets at first sight had an undistinguished first half. The Barclays Capital U.S. Aggregate Bond Index(3) of investment grade bonds returned 1.90%. But within this figure improved risk appetite propelled the index of investment grade corporate bonds to an 8.32% gain amid surging new issuances. Conversely, the Treasury index lost 4.30%, weighed by concerns about massive government borrowing, and the excess yield on 10-year Treasuries over 2-year issues briefly reached a record 275 basis points (“bp”). The star performers however, were high yield bonds, represented by the Barclays Capital High Yield Bond - 2% Issuer Constrained Index(4), which returned a remarkable 30.92%. By contrast, the yield on the 90-day Treasury Bills remained in the range of 6bp to 31bp throughout the period.
U.S. equities, represented by the S&P 500® Index,(5) including dividends, returned 3.2% in the first six months of 2009. As with stock markets generally, March 9, 2009, marked the low point for the index, closing at September 1996 levels. Profits for S&P 500® Index companies would be certain to suffer their eighth straight quarter of decline, but from March 9, 2009, investors only had eyes for green shoots and from there the market returned 36.9%, led by the financials component which soared 93.1%. The index broke through its 200-day moving average on June 1, 2009, but then drifted back, finally returning the last of the month’s gains on June 30, 2009, as a reading of consumer confidence disappointed.
In international markets, the MSCI Japan® Index(6) rose 9.2% for the six months through June 30, 2009. The slump in exports stabilized during the period and despite two consecutive quarterly falls in GDP of 3.8%, there were hopes that stimulus packages in China and
2
MARKET PERSPECTIVE: SIX MONTHS ENDED JUNE 30, 2009
in Japan itself would speed a recovery. The MSCI Europe ex UK® Index(7) added 3.8%. Despite a bigger than expected drop in GDP of 2.5% in the first quarter and the first annual decline in consumer prices for 48 years, confidence proved resilient. The European Central Bank cut rates to 1% and finally embarked on a program to lend unlimited amounts to banks for one year at this interest rate. The MSCI UK® Index(8) lost 1.3%. The Bank of England reduced rates three times, to 0.5%, the lowest since it was founded in 1694, as the UK suffered the largest annual fall in GDP, 4.9%, since records began in 1948.
(1) The MSCI World® Index is an unmanaged index that measures the performance of over 1,400 securities listed on exchanges in the U.S., Europe, Canada, Australia, New Zealand and the Far East.
(2) The S&P/Case-Shiller National U.S. Home Price Index tracks the value of single-family housing within the United States. The index is a composite of single-family home price indices for the nine U.S. Census divisions and is calculated quarterly.
(3) The Barclays Capital U.S. Aggregate Bond Index is an unmanaged index of publicly issued investment grade U.S. Government, mortgage-backed, asset-backed and corporate debt securities.
(4) The Barclays Capital High Yield Bond — 2% Issuer Constrained Composite Index is an unmanaged index that measures the performance of non-investment grade fixed-income securities.
(5) The S&P 500® Index is an unmanaged index that measures the performance of securities of approximately 500 of the largest companies in the United States.
(6) The MSCI Japan® Index is a free float-adjusted market capitalization index that is designed to measure developed market equity performance in Japan.
(7) The MSCI Europe ex UK® Index is a free float-adjusted market capitalization index that is designed to measure developed market equity performance in Europe, excluding the UK.
(8) The MSCI UK® Index is a free float-adjusted market capitalization index that is designed to measure developed market equity performance in the UK.
Parenthesis denote a negative number.
All indices are unmanaged and investors cannot invest directly in an index.
Past performance does not guarantee future results. The performance quoted represents past performance. Investment return and principal value of an investment will fluctuate, and shares, when redeemed, may be worth more or less than their original cost. The Portfolio’s performance is subject to change since the period’s end and may be lower or higher than the performance data shown. Please call (800) 992-0180 or log on to www.ingfunds.com to obtain performance data current to the most recent month end.
Market Perspective reflects the views of ING’s Chief Investment Risk Officer only through the end of the period, and is subject to change based on market and other conditions.
3
SHAREHOLDER EXPENSE EXAMPLES (UNAUDITED)
As a shareholder of the Portfolio, you incur two types of costs: (1) transaction costs, including redemption fees and exchange fees; and (2) ongoing costs, including management fees, distribution and/or service (12b-1) fees, and other Portfolio expenses. These Examples are intended to help you understand your ongoing costs (in dollars) of investing in the Portfolio and to compare these costs with the ongoing costs of investing in other mutual funds.
The Examples are based on an investment of $1,000 invested at the beginning of the period and held for the
entire period from January 1, 2009 to June 30, 2009. The Portfolio’s expenses are shown without the imposition of any charges which are, or may be, imposed under your annuity contract. Expenses would have been higher if such charges were included.
Actual Expenses
The first section of the table shown, “Actual Portfolio Return,” provides information about actual account values and actual expenses. You may use the information in this section, together with the amount you invested, to estimate the expenses that you paid over the period. Simply divide your account value by $1,000 (for example, an $8,600 account value divided by $1,000 = 8.6), then multiply the result by the number in the first section under the heading entitled “Expenses Paid During the Period” to estimate the expenses you paid on your account during this period.
Hypothetical Example for Comparison Purposes
The second section of the table shown, “Hypothetical (5% return before expenses),” provides information about hypothetical account values and hypothetical expenses based on the Portfolio’s actual expense ratio and an assumed rate of return of 5% per year before expenses, which is not the Portfolio’s actual return. The hypothetical account values and expenses may not be used to estimate the actual ending account balance or expenses you paid for the period. You may use this information to compare the ongoing costs of investing in the Portfolio and other mutual funds. To do so, compare this 5% hypothetical example with the 5% hypothetical examples that appear in the shareholder reports of the other mutual funds.
Please note that the expenses shown in the table are meant to highlight your ongoing costs only and do not reflect any transactional costs, such as redemption fees or exchange fees. Therefore, the hypothetical lines of the table are useful in comparing ongoing costs only, and will not help you determine the relative total costs of owning different mutual funds. In addition, if these transactional costs were included, your costs would have been higher.
| | | | | | | | | | | | | | | | | | | | | | | | |
| | | Actual Portfolio Return | | Hypothetical (5% return before expenses) |
| | | Beginning
Account
Value
January 1, 2009 | | Ending
Account Value
June 30, 2009 | | Annualized Expense Ratio* | | | Expenses Paid
During the
Period Ended
June 30, 2009** | | Beginning
Account
Value
January 1, 2009 | | Ending
Account Value
June 30, 2009 | | Annualized Expense Ratio* | | | Expenses Paid
During the
Period Ended
June 30, 2009** |
ING Global Equity Option Portfolio |
Class S | | $ | 1,000.00 | | $ | 1,062.10 | | 0.50 | % | | $ | 2.56 | | $ | 1,000.00 | | $ | 1,022.32 | | 0.50 | % | | $ | 2.51 |
| * | | The annualized expense ratio does not include expenses of Underlying Funds. |
| ** | | Expenses are equal to the Portfolio’s respective annualized expense ratios multiplied by the average account value over the period, multiplied by 181/365 to reflect the most recent fiscal half-year. |
4
STATEMENT OF ASSETS AND LIABILITIESASOF JUNE 30, 2009 (UNAUDITED)
| | | | |
ASSETS: | | | | |
Investments in affiliated underlying funds* | | $ | 10,114,294 | |
Cash | | | 261,870 | |
Receivables: | | | | |
Investments in affiliated underlying funds sold | | | 130,013 | |
Dividends and interest | | | 12 | |
Prepaid expenses | | | 3,099 | |
Reimbursement due from manager | | | 6,392 | |
| | | | |
Total assets | | | 10,515,680 | |
| | | | |
LIABILITIES: | | | | |
Payable for investments in affiliated underlying funds purchased | | | 113,741 | |
Payable for fund shares redeemed | | | 4,034 | |
Payable to affiliates | | | 3,779 | |
Payable for directors fees | | | 534 | |
Other accrued expenses and liabilities | | | 14,707 | |
Written options^ | | | 126,703 | |
| | | | |
Total liabilities | | | 263,498 | |
| | | | |
NET ASSETS | | $ | 10,252,182 | |
| | | | |
NET ASSETS WERE COMPRISED OF: | | | | |
Paid-in capital | | $ | 10,732,141 | |
Accumulated net investment loss | | | (7,081 | ) |
Accumulated net realized loss on investments and written options | | | (811,056 | ) |
Net unrealized appreciation on investments and written options | | | 338,178 | |
| | | | |
NET ASSETS | | $ | 10,252,182 | |
| | | | |
| | | | |
* Cost of investments in affiliated underlying funds | | $ | 9,779,426 | |
^ Premiums received on written options | | $ | 130,013 | |
| | | | |
Class S: | | | | |
Net assets | | $ | 10,252,182 | |
Shares authorized | | | 100,000,000 | |
Par value | | $ | 0.001 | |
Shares outstanding | | | 1,270,263 | |
Net asset value and redemption price per share | | $ | 8.07 | |
See Accompanying Notes to Financial Statements
5
STATEMENT OF OPERATIONSFORTHE SIX MONTHS ENDED JUNE 30, 2009 (UNAUDITED)
| | | | |
INVESTMENT INCOME: | | | | |
Dividends from affiliated underlying funds | | $ | 14,018 | |
Interest | | | 65 | |
| | | | |
Total investment income | | | 14,083 | |
| | | | |
EXPENSES: | | | | |
Investment management fees | | | 4,228 | |
Distribution and service fees | | | 10,569 | |
Transfer agent fees | | | 67 | |
Administrative service fees | | | 4,228 | |
Shareholder reporting expense | | | 3,322 | |
Professional fees | | | 16,458 | |
Custody and accounting expense | | | 1,150 | |
Directors fees | | | 860 | |
Offering expense | | | 6,943 | |
Miscellaneous expense | | | 2,447 | |
| | | | |
Total expenses | | | 50,272 | |
Net waived and reimbursed fees | | | (29,108 | ) |
| | | | |
Net expenses | | | 21,164 | |
| | | | |
Net investment loss | | | (7,081 | ) |
| | | | |
REALIZED AND UNREALIZED GAIN (LOSS) ON AFFILIATED UNDERLYING FUNDS AND WRITTEN OPTIONS: | | | | |
Net realized loss on: | | | | |
Sale of affiliated underlying funds | | | (428,095 | ) |
Written options | | | (375,251 | ) |
| | | | |
Net realized loss on affiliated underlying funds and written options | | | (803,346 | ) |
| | | | |
Net change in unrealized appreciation or depreciation on: | | | | |
Affiliated underlying funds | | | 1,605,902 | |
Written options | | | (32,722 | ) |
| | | | |
Net change in unrealized appreciation or depreciation on affiliated underlying funds and written options | | | 1,573,180 | |
| | | | |
Net realized and unrealized gain on affiliated underlying funds and written options | | | 769,834 | |
| | | | |
Increase in net assets resulting from operations | | $ | 762,753 | |
| | | | |
See Accompanying Notes to Financial Statements
6
STATEMENT OF CHANGES IN NET ASSETS (UNAUDITED)
| | | | | | | | |
| | | Six Months Ended June 30, 2009 | | | September 17, 2008(1) to December 31, 2008 | |
FROM OPERATIONS: | | | | | | | | |
Net investment income (loss) | | $ | (7,081 | ) | | $ | 67,790 | |
Net realized gain (loss) on affiliated underlying funds and written options | | | (803,346 | ) | | | 223,055 | |
Net change in unrealized appreciation or depreciation on affiliated underlying funds and written options | | | 1,573,180 | | | | (1,235,002 | ) |
| | | | | | | | |
Increase (decrease) in net assets resulting from operations | | | 762,753 | | | | (944,157 | ) |
| | | | | | | | |
FROM DISTRIBUTIONS TO SHAREHOLDERS: | | | | | | | | |
Net investment income | | | — | | | | (71,893 | ) |
Net realized gains | | | (229,697 | ) | | | — | |
| | | | | | | | |
Total distributions | | | (229,697 | ) | | | (71,893 | ) |
| | | | | | | | |
FROM CAPITAL SHARE TRANSACTIONS: | | | | | | | | |
Net proceeds from sale of shares | | | 3,871,652 | | | | 6,959,779 | |
Reinvestment of distributions | | | 89,947 | | | | 69,693 | |
| | | | | | | | |
| | | 3,961,599 | | | | 7,029,472 | |
Cost of shares redeemed | | | (179,875 | ) | | | (76,020 | ) |
| | | | | | | | |
Net increase in net assets resulting from capital share transactions | | | 3,781,724 | | | | 6,953,452 | |
| | | | | | | | |
Net increase in net assets | | | 4,314,780 | | | | 5,937,402 | |
| | | | | | | | |
NET ASSETS: | | | | | | | | |
Beginning of period | | | 5,937,402 | | | | — | |
| | | | | | | | |
End of period | | $ | 10,252,182 | | | $ | 5,937,402 | |
| | | | | | | | |
Accumulated net investment loss at end of period | | $ | (7,081 | ) | | $ | — | |
| | | | | | | | |
| (1) | | Commencement of operations |
See Accompanying Notes to Financial Statements
7
FINANCIAL HIGHLIGHTS (UNAUDITED)
Selected data for a share of beneficial interest outstanding throughout each year or period.
| | | | | | | | | | | | | | | | | | | | | | | | | | | | | | | | | | | | | |
| | | | | Income (loss)
from
investment
operations | | | | | | Less distributions | | | | | | | | | Ratios to average net assets | | | Supplemental
data |
| | | | | | | | | | | | | | | | | | | | | | | | | | | | | | | | | | | | | | |
| | | Net asset value, beginning of year or period | | Net investment income (loss) | | | Net realized and unrealized gain (loss) | | | Total from investment operations | | | From net investment income | | From net realized gains | | From return of capital | | Total distributions | | Net asset value, end of year or period | | Total return(1) | | | Expenses before reductions/additions(2)(3) | | Expenses net of fee waivers and/or recoupments, if any(2)(3)(4) | | Expenses net of all reductions/additions(2)(3)(4) | | Net investment income (loss)(2)(3)(4) | | | Net assets, end of year or period | | Portfolio turnover rate |
| | | | | | | | | | | | | | | | | | | | | | | | | | | | | | | | | | | | | |
Year or period ended | | ($) | | ($) | | | ($) | | | ($) | | | ($) | | ($) | | ($) | | ($) | | ($) | | (%) | | | (%) | | (%) | | (%) | | (%) | | | ($000's) | | (%) |
ING Global Equity Option Portfolio | | | | | | | | | | | | | | | | | | | | | | | | | | | | | | | | | | | | | |
Class S | | | | | | | | | | | | | | | | | | | | | | | | | | | | | | | | | | | | | |
06-30-09 | | 7.79 | | (0.01 | ) | | 0.48 | | | 0.47 | | | — | | 0.19 | | — | | 0.19 | | 8.07 | | 6.21 | | | 1.19 | | 0.50 | | 0.50 | | (0.17 | ) | | 10,252 | | 13 |
09-17-08(5) - 12-31-08 | | 10.00 | | 0.12 | Ÿ | | (2.24 | ) | | (2.12 | ) | | 0.09 | | — | | — | | 0.09 | | 7.79 | | (21.15 | ) | | 1.25 | | 0.50 | | 0.50 | | 5.09 | | | 5,937 | | 1 |
| (1) | | Total return is calculated assuming reinvestment of dividends and capital gain distributions at net asset value and does not reflect the effect of insurance contract charges. Total return for less than one year is not annualized. |
| (2) | | Annualized for periods less than one year. |
| (3) | | Expense ratios do not include expenses of Underlying Funds and do not include fees and expenses charged under the variable annuity contract or variable life insurance policy. |
| (4) | | Expense ratios reflect operating expenses of a Portfolio. Expenses before reductions do not reflect amounts reimbursed by the Investment Adviser and/or Distributor or reductions from brokerage commission recapture arrangements or other expense offset arrangements and do not represent the amount paid by the Portfolio during periods when reimbursements or reductions occur. Expenses net of fee waivers reflect expenses after reimbursement by the Investment Adviser and/or Distributor but prior to reductions from brokerage commission recapture arrangements or other expense offset arrangements. Expenses net of all reductions represent the net expenses paid by the Portfolio. Net investment income (loss) is net of all such additions or reductions. |
| (5) | | Commencement of operations. |
| Ÿ | | Calculated using average number of shares outstanding throughout the period. |
See Accompanying Notes to Financial Statements
8
NOTES TO FINANCIAL STATEMENTSASOF JUNE 30, 2009 (UNAUDITED)
NOTE 1 — ORGANIZATION
Organization. ING Variable Portfolios, Inc. (the “Company” or the “Registrant”) is registered under the Investment Company Act of 1940, as amended (“1940 Act” or “Act”), as an open-end management investment company. The Registrant is a company incorporated under the laws of Maryland on June 4, 1996 and has nineteen active separate investment series. The Portfolio included in this report is ING Global Equity Option Portfolio (“Global Equity Option” or the “Portfolio”) which is a diversified series of the Company.
The Portfolio offers Class S shares.
Shares of the Portfolio may be offered to separate accounts of insurance companies as investment options under variable annuity contracts and variable life insurance policies. Shares may also be offered to qualified pension and retirement plans outside the variable contract and to certain investment advisers and their affiliates.
Participating insurance companies and other designated organizations are authorized to receive purchase orders on the Portfolio’s behalf. ING Investments, LLC (“ING Investments” or the “Investment Adviser”), an Arizona limited liability company, serves as the investment adviser to the Portfolio. ING Investments has engaged ING Investment Management Co. (“ING IM”), a Connecticut corporation, to serve as the sub-adviser to the Portfolio. ING Funds Distributor, LLC (“IFD” or the “Distributor”) is the principal underwriter of the Portfolio. ING Investments, ING IM and the Distributor are indirect, wholly-owned subsidiaries of ING Groep N.V. (“ING Groep”). ING Groep is a global financial institution of Dutch origin offering banking, investments, life insurance and retirement services.
On October 19, 2008, ING Groep announced that it reached an agreement with the Dutch government to strengthen its capital position. ING Groep issued non-voting core Tier-1 securities for a total consideration of EUR 10 billion to the Dutch State. The transaction boosts ING Bank’s core Tier-1 ratio, strengthens the insurance balance sheet and reduces ING Groep’s Debt/Equity ratio.
The Portfolio seeks long-term growth of capital by investing in other ING Funds (“Underlying Funds”) and uses an asset allocation strategy to determine how much to invest in the Underlying Funds. The Underlying Funds, in turn, invest in equity securities located in a number of different countries, one of which is the United States.
NOTE 2 — SIGNIFICANT ACCOUNTING POLICIES
The following significant accounting policies are consistently followed by the Portfolio in the preparation of its financial statements. Such policies are in conformity with U.S. generally accepted accounting principles for investment companies.
| A. | Security Valuation. The valuation of the Portfolio’s investments in its Underlying Funds is based on the net asset values of the Underlying Funds each business day. |
Effective for fiscal years beginning after November 15, 2007, Financial Accounting Standards Board (“FASB”) Statement of Financial Accounting Standards No. 157, “Fair Value Measurements”, establishes a hierarchy for measuring fair value of assets and liabilities. As required by the standard, each investment asset or liability of the Funds is assigned a level at measurement date based on the significance and source of the inputs to its valuation. Quoted prices in active markets for identical securities are classified as “Level 1”, inputs other than quoted prices for an asset or liability that are observable are classified as “Level 2” and unobservable inputs, including the Sub-Adviser’s judgment about the assumptions that a market participant would use in pricing an asset or liability are classified as “Level 3”. The inputs used for valuing securities are not necessarily an indication of the risks associated with investing in the those securities. A table summarizing the Portfolio’s investments under these levels of classification is included following the Portfolio of the Investments.
On April 9, 2009, the FASB issued FASB Staff Position No. FAS 157-4, Determining Fair Value When the Volume and Level of Activity for the Asset or Liability Have Significantly Decreased and Identifying Transactions That Are Not Orderly (“FSP 157-4”). FSP 157-4 requires enhanced disclosures about the inputs and valuation technique(s) used to measure fair value and a discussion of changes in valuation techniques and related inputs, if any, during the period. In addition, the three-level hierarchy disclosure and the level three roll-forward disclosure are to be expanded for each major category of equity and debt securities. There was no change to the financial position of the Portfolios and the results of their operations due to the adoption of FSP 157-4 and all disclosures have been made for the current period as part of the
9
NOTES TO FINANCIAL STATEMENTSASOF JUNE 30, 2009 (UNAUDITED) (CONTINUED)
NOTE 2 — SIGNIFICANT ACCOUNTING POLICIES
(continued)
Notes to Financial Statements and Portfolio of Investments.
The Portfolio classifies its investments in the Underlying Funds as Level 1, without consideration as to the classification level of the specific investments held by the Underlying Funds.
On March 19, 2008, the FASB issued Statement of Financial Accounting Standards No. 161 (“SFAS No. 161”), “Disclosure about Derivative Instruments and Hedging Activities.” This new accounting statement requires enhanced disclosures about an entity’s derivative and hedging activities. Entities are required to provide enhanced disclosures about (a) how and why an entity invests in derivatives, (b) how derivatives are accounted for under SFAS No. 133, and (c) how derivatives affect an entity’s financial position, financial performance, and cash flows. SFAS No. 161 also requires enhanced disclosures regarding credit-risk-related contingent features of derivative instruments. All changes to disclosures have been made in accordance with SFAS 161 and have been incorporated for the current period as part of the Notes to Financial Statements and Portfolio of Investments.
| B. | Risk Exposures and the use of Derivative Instruments. The Portfolio’s investment objectives permit it to enter into various types of derivatives contracts, including, but not limited to, futures contracts, forward foreign currency exchange contracts, credit default swaps, interest rate swaps, total return swaps, and purchased and written options. In doing so, the Portfolio will employ strategies in differing combinations to permit it to increase or decrease the level of risk, or change the level or types of exposure to market risk factors. This may allow the Portfolio to pursue its objectives more quickly, and efficiently than if it were to make direct purchases or sales of securities capable of affecting a similar response to market factors. |
Market Risk Factors. In pursuit of its investment objectives, the Portfolio may seek to use derivatives to increase or decrease its exposure to the following market risk factors:
Credit Risk. Credit risk relates to the ability of the issuer to meet interest and principal payments, or both, as they come due. In general, lower-grade,
higher-yield bonds are subject to credit risk to a greater extent than lower-yield, higher-quality bonds.
Equity Risk. Equity risk relates to the change in value of equity securities as they relate to increases or decreases in the general market.
Foreign Exchange Rate Risk. Foreign exchange rate risk relates to the change in U.S. dollar value of a security held that is denominated in a foreign currency. The U.S. dollar value of a foreign currency denominated security will decrease as the dollar appreciates against the currency, while the U.S. dollar value will increase as the dollar depreciates against the currency.
Interest Rate Risk. Interest rate risk refers to the fluctuations in value of fixed-income securities resulting from the inverse relationship between price and yield. For example, an increase in general interest rates will tend to reduce the market value of already issued fixed-income investments, and a decline in general interest rates will tend to increase their value. In addition, debt securities with longer maturities, which tend to have higher yields, are subject to potentially greater fluctuations in value from changes in interest rates than obligations with shorter maturities.
Risks of Investing in Derivatives. The Portfolio’s use of derivatives can result in losses due to unanticipated changes in the market risk factors and the overall market. In instances where a Portfolio is using derivatives to decrease, or hedge, exposures to market risk factors for securities held by a Portfolio, there are also risks that those derivatives may not perform as expected resulting in losses for the combined or hedged positions.
The use of these strategies involves certain special risks, including a possible imperfect correlation, or even no correlation, between price movements of derivative instruments and price movements of related investments. While some strategies involving derivative instruments can reduce the risk of loss, they can also reduce the opportunity for gain or even result in losses by offsetting favorable price movements in related investments or otherwise, due to the possible inability of a Portfolio to purchase or sell a portfolio security at a time that otherwise would be favorable or the possible need to sell a portfolio security at a disadvantageous time because the Portfolio is required to maintain asset coverage or offsetting
10
NOTES TO FINANCIAL STATEMENTSASOF JUNE 30, 2009 (UNAUDITED) (CONTINUED)
NOTE 2 — SIGNIFICANT ACCOUNTING POLICIES (continued)
positions in connection with transactions in derivative instruments. Additional associated risks from investing in derivatives also exist and potentially could have significant effects on the valuation of the derivative and a Portfolio. Associated risks are not the risks that a Portfolio is attempting to increase or decrease exposure to, per their investment objectives, but are the additional risks from investing in derivatives. Examples of these associated risks are liquidity risk, which is the risk that a Portfolio will not be able to sell the derivative in the open market in a timely manner, and counterparty credit risk, which is the risk that the counterparty will not fulfill its obligation to a Portfolio. Associated risks can be different for each type of derivative and are discussed by each derivative type in the following notes.
| C. | Security Transactions and Revenue Recognition. Security transactions are accounted for on trade date. Dividend income received from the affiliated funds is recognized on the ex-dividend date and is recorded as income distributions in the Statement of Operations. Capital gain distributions received from the affiliated funds are recognized on ex-dividend date and are recorded on the Statement of Operations as such. Costs used in determining realized gains and losses on the sales of investment securities are on the basis of specific identification. |
| D. | Distributions to Shareholders. The Portfolio records distributions to its shareholders on the ex-dividend date. The Portfolio distributes dividends and capital gains, if any, annually. The Portfolio may make distributions on a more frequent basis to comply with the distribution requirements of the Internal Revenue Code. The characteristics of income and gains to be distributed are determined in accordance with income tax regulations, which may differ from U.S. generally accepted accounting principles for investment companies. |
| E. | Federal Income Taxes. It is the policy of the Portfolio to comply with subchapter M of the Internal Revenue Code and related excise tax provisions applicable to regulated investment companies and to distribute substantially all of its net investment income and any net realized capital gains to its shareholders. Therefore, no federal income tax provision is required. Management has considered |
| | the sustainability of the Portfolio’s tax position taken on federal income tax returns for all open tax years in making this determination. No capital gain distributions shall be made until any capital loss carryforwards have been fully utilized or expired. |
| F. | Use of Estimates. The preparation of financial statements in conformity with U.S. generally accepted accounting principles requires management to make estimates and assumptions that affect the reported amounts of assets and liabilities and disclosure of contingent assets and liabilities at the date of the financial statements and the reported amounts of increases and decreases in net assets from operations during the reporting period. Actual results could differ from those estimates. |
| G. | Options Contracts. The Portfolio may purchase put and call options and may write (sell) put options and covered call options. The Portfolio may engage in option transactions as a hedge against adverse movements in the value of portfolio holdings or to generate gains from options premiums. Option contracts are valued daily and unrealized gains or losses are recorded based upon the last sales price on the principal exchange on which the options are traded. The Portfolio will realize a gain or loss upon the expiration or closing of the option contract. When an option is exercised, the proceeds on sale of the underlying security for a written call option, the purchase cost of the security for a written put option, or the cost of the security for a purchased put or call option is adjusted by the amount of premium received or paid. Realized and unrealized gains or losses on option contracts are reflected in the accompanying financial statements. The risk in writing a call option is that the Portfolio gives up the opportunity for profit if the market price of the security increases and the option is exercised. The risk in writing a put option is that the Portfolio may incur a loss if the market price of the security decreases and the option is exercised. The risk in buying an option is that the Portfolio pays a premium whether or not the option is exercised. Risks may also arise from an illiquid secondary market or from the inability of counterparties to meet the terms of the contract. |
The Portfolio has written call options on various indices to decrease exposure to equity risk. A written call option becomes more valuable as the
11
NOTES TO FINANCIAL STATEMENTSASOF JUNE 30, 2009 (UNAUDITED) (CONTINUED)
NOTE 2 — SIGNIFICANT ACCOUNTING POLICIES (continued)
price of the underlying financial instrument depreciates relative to the strike price.
The risk in writing a call option is that the Portfolio gives up the opportunity for profit if the market price of the underlying financial instrument increases and the option is exercised. Additional associated risks to the Portfolio include counterparty credit risk for over-the-counter options and liquidity risk.
The Portfolio invests in derivatives only if the expected risks and rewards are consistent with its investment objectives, and overall risk profile as described in the accompanying Notes to Financial Statements. For the six months ended June 30, 2009, the total number of open option contracts as presented following the Portfolio of Investments is indicative of the volume of this derivative type.
| H. | Organization Expenses and Offering Costs. Costs incurred with the organization of the Portfolio were expensed as incurred. Costs incurred with the offering of shares of the Portfolio are deferred and amortized over a twelve-month period on a straight-line basis starting at the commencement of operations. |
| I. | Indemnifications. In the normal course of business, the Company may enter into contracts that provide certain indemnifications. The Company’s maximum exposure under these arrangements is dependent on future claims that may be made against the Portfolio and, therefore, cannot be estimated; however, based on experience, the risk of loss from such claims is considered remote. |
NOTE 3 — INVESTMENT MANAGEMENT AND ADMINISTRATIVE FEES
The Portfolio entered into an investment management agreement (“Investment Management Agreement”) with ING Investments, an indirect, wholly-owned subsidiary of ING Groep. The Investment Management Agreement compensates the Investment Adviser with a fee, computed daily and payable monthly, in an amount equal to 0.10% of the Portfolio’s average daily net assets.
The Investment Adviser entered into a sub-advisory agreement with ING IM. ING IM acts as sub-adviser to the Portfolio. Subject to such policies as the Board or
the Investment Adviser may determine, ING IM manages the Portfolio’s assets in accordance with the Portfolio’s investment objectives, policies, and limitations.
ING Funds Services, LLC (the “Administrator”), an indirect, wholly-owned subsidiary of ING Groep, acts as administrator and provides certain administrative and shareholder services necessary for the Portfolio’s operations and is responsible for the supervision of other service providers. The Administrator receives compensation in the amount equal to 0.10% of the Portfolio’s average daily net assets.
NOTE 4 — INVESTMENTS IN AFFILIATED UNDERLYING FUNDS
For the six months ended June 30, 2009, the cost of purchases and the proceeds from the sales of the Underlying Funds were $4,109,099 and $1,063,923, respectively.
NOTE 5 — DISTRIBUTION AND SERVICE FEES
Class S shares of the Portfolio have adopted a Distribution Plan pursuant to Rule 12b-1 under the 1940 Act (the “12b-1 Plan”), whereby the Distributor is compensated by the Portfolio for expenses incurred in the distribution of the Portfolio’s shares (“Distribution Fees”). Pursuant to the 12b-1 Plan, the Distributor is entitled to a payment each month to compensate for expenses incurred in the distribution and promotion of the Portfolio’s shares, including expenses incurred in printing prospectuses and reports used for sales purposes, expenses incurred in preparing and printing sales literature and other such distribution related expenses, including any distribution or shareholder servicing fees (“Service Fees”) paid to securities dealers who have executed a distribution agreement with the Distributor. Under the 12b-1 Plan, Class S shares of the Portfolio pay the Distributor a fee calculated at an annual rate of 0.25% of average daily net assets.
NOTE 6 — OTHER TRANSACTIONS WITH AFFILIATES AND RELATED PARTIES
At June 30, 2009, the Portfolio had the following amounts recorded in payable to affiliates on the accompanying Statement of Assets and Liabilities:
| | | | | | | | | | |
Accrued
Investment
Management
Fees | | Accrued Administrative Fees | | Accrued Shareholder Service and Distribution Fees | | Total |
| $ | 840 | | $ | 840 | | $ | 2,099 | | $ | 3,779 |
12
NOTES TO FINANCIAL STATEMENTSASOF JUNE 30, 2009 (UNAUDITED) (CONTINUED)
NOTE 6 — OTHER TRANSACTIONS WITH AFFILIATES AND RELATED PARTIES (continued)
At June 30, 2009, the following indirect, wholly-owned subsidiary of ING Groep owned more than 5% of the Portfolio:
ING USA Annuity and Life Insurance Company — 99.90%.
Control is defined by the 1940 Act as the beneficial ownership, either directly or through one or more controlled companies, of more than 25% of the voting securities of a company. The 1940 Act defines affiliates as companies that are under common control. Investment activities of these shareholders could have a material impact on the Portfolio.
The Registrant has adopted a Deferred Compensation Plan (the “Policy”), which allows eligible non-affiliated directors as described in the Policy to defer the receipt of all or a portion of the directors’ fees payable. Deferred fees are invested in various funds advised by ING Investments until distribution in accordance with the Policy.
NOTE 7 — EXPENSE LIMITATION AGREEMENT
The Investment Adviser has agreed to limit expenses, excluding interest, taxes, brokerage commissions, extraordinary expenses and acquired fund fees and expenses to the level listed below:
| (1) | The operating expense limit applies only at the Portfolio level and does not limit fees payable by the underlying investment companies in which the Portfolio invests. The amount of the fees and expenses of an Underlying Fund borne by the Portfolio will vary based on the Portfolio’s allocation of assets to, and the net expenses of, a particular Underlying Fund. |
The Investment Adviser may at a later date recoup from the Portfolio management fees waived and other expenses assumed by the Investment Adviser during the previous 36 months, but only if, after such recoupment, the Portfolio’s expense ratio does not exceed the percentage described above. Waived and reimbursed fees net of any recoupment by the Investment Adviser of such waived and reimbursed fees are reflected on the accompanying Statement of Operations for the Portfolio. Outstanding reimbursement balances due to the Portfolio, if any, under its respective expense limitation agreements are reflected in Reimbursement Due from Investment Adviser on the accompanying Statement of Assets and Liabilities.
As of June 30, 2009, the amounts of waived and reimbursed fees that are subject to possible recoupment by the Investment Adviser, and the related expiration dates are as follows:
| | | | | | | | | | |
| June 30, | | Total |
2010 | | 2011 | | 2012 | |
| $ | — | | $ | — | | $ | 39,164 | | $ | 39,164 |
The expense limitation agreement is contractual and shall renew automatically for one-year terms unless the Investment Adviser provides written termination of the expense limitation agreement within 90 days of the end of the then current term.
NOTE 8 — WRITTEN OPTIONS
Transactions in written options for the period ended June 30, 2009 were as follows:
| | | | | | | |
| | | Number of
Contracts | | | Premium | |
Balance at 12/31/08 | | 24,011 | | | $ | 135,450 | |
Options Written | | 308,078 | | | | 1,068,268 | |
Options Terminated in Closing Purchase Transactions | | (165,398 | ) | | | (666,492 | ) |
Options Expired | | (119,547 | ) | | | (407,213 | ) |
| | | | | | | |
Balance at 06/30/09 | | 47,144 | | | $ | 130,013 | |
| | | | | | | |
NOTE 9 — LINE OF CREDIT
The Portfolios included in this report, in addition to certain other Portfolios’ managed by the Investment Adviser, have entered into an unsecured committed revolving line of credit agreement (the “Credit Agreement”) with The Bank of New York Mellon for an aggregate amount of $100,000,000. The proceeds may be used to: (1) temporarily finance the purchase or sale of securities; and (2) finance the redemption of shares of an investor in the Portfolios to which a loan is made. The Portfolios to which the line of credit is available pay a commitment fee equal to 0.125% per annum on the daily unused portion of the committed line amount.
Generally, borrowings under the credit agreement accrue interest at the federal funds rate plus a specified margin. For the six months ended June 30, 2009, the Portfolio did not have any loans outstanding under the line of credit.
13
NOTES TO FINANCIAL STATEMENTSASOF JUNE 30, 2009 (UNAUDITED) (CONTINUED)
NOTE 10 — CAPITAL SHARES
Transactions in capital shares and dollars were as follows:
| | | | | | | | | | | | | | | | | | | | |
| | | Shares
sold | | Reinvestment
of
distributions | | Shares
redeemed | | | Net increase
(decrease) in
shares
outstanding | | | | Shares
sold | | Reinvestment
of
distributions | | Shares
redeemed | | | Net increase
(decrease) |
Year or period ended | | # | | # | | # | | | # | | | | ($) | | ($) | | ($) | | | ($) |
Global Equity Option | | | | | | | | | | | | | | | | | | | | |
Class S | | | | | | | | | | | | | | | | | | | | |
06-30-09 | | 519,951 | | 12,241 | | (24,373 | ) | | 507,819 | | | | 3,871,652 | | 89,947 | | (179,875 | ) | | 3,781,724 |
09-17-08(1)-12-31-08 | | 763,230 | | 8,948 | | (9,734 | ) | | 762,444 | | | | 6,959,779 | | 69,693 | | (76,020 | ) | | 6,953,452 |
| (1) | | Commencement of operations. |
NOTE 11 — FEDERAL INCOME TAXES
The amount of distributions from net investment income and net realized capital gains are determined in accordance with federal income tax regulations, which may differ from U.S. generally accepted accounting principles for investment companies. These book/tax differences may be either temporary or permanent. Permanent differences are reclassified within the capital accounts based on their federal tax-basis treatment; temporary differences are not reclassified. Key differences include the treatment of short-term capital gains, foreign currency transactions, and wash sale deferrals. Distributions in excess of net investment income and/or net realized capital gains for tax purposes are reported as return of capital.
Dividends paid by the Portfolio from net investment income and distributions of net realized short-term capital gains are, for federal income tax purposes, taxable as ordinary income to shareholders.
The Portfolio paid an ordinary income dividend of $71,893 for the period ended December 31, 2008 and a short-term capital gain distribution of $229,697 for the six months ended June 30, 2009.
The tax-basis components of distributable earnings as of December 31, 2008 were:
| | | | | |
Undistributed
Ordinary
Income | | Unrealized
Appreciation/
(Depreciation) | |
| $ | 229,628 | | $ | (1,242,643 | ) |
The Portfolio’s major tax jurisdictions are federal and Arizona. The earliest tax year that remains subject to examination by these jurisdictions is 2008.
As of June 30, 2009, no provisions for income tax would be required in the Portfolio’s financial statements as a result of tax positions taken on federal income tax returns for open tax years. The Portfolio’s federal and
state income and federal excise tax returns for tax years for which the applicable statutes of limitations have not expired are subject to examination by the Internal Revenue Service and state department of revenue.
NOTE 12 — CONCENTRATION OF INVESTMENT RISKS
The Portfolio is also affected by other kinds of risks, depending on the types of securities held or strategies used by an Underlying Fund.
Investment by Funds-of-Funds. Each of the Underlying Funds’ shares may be purchased by other investment companies. In some cases, an Underlying Fund may experience large inflows or redemptions due to allocations or rebalancing. While it is impossible to predict the overall impact of these transactions over time, there could be adverse effects on portfolio management. The Investment Adviser will monitor transactions by each Underlying Fund and will attempt to minimize any adverse effects on the Underlying Funds and the Fund as a result of these transactions. So long as an Underlying Fund accepts investments by other investment companies, it will not purchase securities of other investment companies, except to the extent permitted by the 1940 Act or under the terms of an exemptive order granted by the SEC.
Asset Allocation. Although asset allocation seeks to optimize returns given various levels of risk tolerance, you still may lose money and experience volatility. Market and asset class performance may differ in the future from the historical performance and the assumptions used to form the asset allocations for the Portfolio. Furthermore, the Investment Adviser’s allocation of the Portfolio’s assets may not anticipate market trends successfully. Assets will be allocated among Underlying Funds and markets based on judgments made by the Investment Adviser. There is a risk that the Portfolio may allocate assets to an asset
14
NOTES TO FINANCIAL STATEMENTSASOF JUNE 30, 2009 (UNAUDITED) (CONTINUED)
class or market that underperforms other Underlying Funds. For example, the Portfolio may be underweighted in assets or a market that is experiencing significant returns or overweighted in assets or a market with significant declines.
Foreign Securities. Investments in foreign securities may entail risks not present in domestic investments. Since securities in which an Underlying Fund may invest are denominated in foreign currencies, changes in the relationship of these foreign currencies to the U.S. dollar can significantly affect the value of the investments and earnings of the Underlying Funds. Foreign investments may also subject the Underlying Funds to foreign government exchange restrictions, expropriation, taxation or other political, social or economic developments, as well as changes vis-a-vis the U.S. dollar from movements in currency, and changes in security value and interest rate, all of which could affect the market and/or credit risk of the Underlying Funds’ investments.
Emerging Markets Investments. Because of less developed markets and economies and, in some countries, less mature governments and governmental institutions, the risks of investing in foreign securities can be intensified in the case of investments in issuers domiciled or doing substantial business in emerging market countries.
NOTE 13— SUBSEQUENT EVENTS
On July 21, 2009, the Board approved a proposal to liquidate the Portfolio. The proposed liquidation is subject to shareholder approval. If shareholder approval is obtained, it is expected that the liquidation will take place during the fourth quarter of 2009.
The Portfolios have evaluated events occurring after the balance sheet date (subsequent events) through August 27, 2009, the date the financial statements were available to be issued, to determine whether any subsequent events necessitated adjustment to or disclosure in the financial statements. No such subsequent events were identified.
15
| | |
| GLOBAL EQUITY OPTION PORTFOLIO | | PORTFOLIO ASSET ALLOCATION ASOF JUNE 30, 2009 (UNAUDITED) |
The following table illustrates the asset allocation of the Underlying Funds as of June 30, 2009 (as a percent of net assets).
Asset Allocation
as of June 30, 2009
(as a percent of net assets)
| | |
| Underlying Affiliated Funds | | |
ING Growth and Income Portfolio — Class I | | 49.6% |
ING International Growth Opportunities Portfolio — Class I | | 15.2% |
ING International Value Portfolio — Class I | | 24.0% |
ING MidCap Opportunities Portfolio — Class I | | 5.0% |
ING Small Company Portfolio — Class I | | 4.9% |
Other assets and liabilities — Net | | 1.3% |
| | |
| | 100.0% |
| | |
Portfolio holdings are subject to change.
16
| | |
| ING GLOBAL EQUITY OPTION PORTFOLIO | | PORTFOLIO OF INVESTMENTS ASOF JUNE 30, 2009 (UNAUDITED) |
| | | | | | | | |
| Shares | | | | | | | Value |
AFFILIATED INVESTMENT COMPANIES: 98.7% |
| 312,930 | | ING Growth and Income Portfolio - Class I | | | | | $ | 5,081,983 |
| 366,464 | | ING International Growth Opportunities Portfolio - Class I | | | | | | 1,557,473 |
| 334,176 | | ING International Value Portfolio - Class I | | | | | | 2,462,874 |
| 71,562 | | ING MidCap Opportunities Portfolio - Class I | | | | | | 508,089 |
| 42,130 | | ING Small Company Portfolio - Class I | | | | | | 503,875 |
| | | | | | | | |
| | Total Investments in Affiliated Investment Companies
(Cost $9,779,426)* | | 98.7 | % | | $ | 10,114,294 |
| | Other Assets and Liabilities - Net | | 1.3 | | | | 137,888 |
| | | | | | | | |
| | Net Assets | | 100.0 | % | | $ | 10,252,182 |
| | | | | | | | |
| * | Cost for federal income tax purposes is $10,166,989. |
| | | | |
Net unrealized depreciation consists of: | | | | |
Gross Unrealized Appreciation | | $ | 359,540 | |
Gross Unrealized Depreciation | | | (412,235 | ) |
| | | | |
Net Unrealized Depreciation | | $ | (52,695 | ) |
| | | | |
Fair Value Measurements*
The following is a summary of the inputs used as of June 30, 2009 in determining the Portfolio’s investments at fair value for purposes of SFAS 157:
| | | | | | | | | | |
| | | Quoted Prices in Active Markets for Identical Investments (Level 1) | | Significant Other Observable Inputs (Level 2) | | | Significant Unobservable Inputs (Level 3) |
Affiliated Investment Companies | | $ | 10,114,294 | | | — | | | | — |
| | | | | | | | | | |
Total | | $ | 10,114,294 | | $ | — | | | $ | — |
| | | | | | | | | | |
Other Financial Instruments** | | | — | | | (126,703 | ) | | | — |
| | | | | | | | | | |
Total | | $ | — | | $ | (126,703 | ) | | $ | — |
| | | | | | | | | | |
“Fair value” for purposes of SFAS 157 is different from “fair value” as used in the 1940 Act. The former generally implies market value, and can include market quotations as a source of value, and the latter refers to determinations of value in absence of available market quotations.
| * | See NOTE 2, “Significant Accounting Policies” in the Notes to Financial Statements for additional information. |
| ** | Other financial instruments may include open forward foreign currency contracts, futures, swaps, and written options. Forward foreign currency contracts and futures are reported at their unrealized gain/loss at period end. Swaps and written options are reported at their market value at period end. |
Written OTC Call Options
| | | | | | | | | | | | | | | | | |
# of
Contracts | | Counterparty | | Description | | Expiration Date | | Strike Price/Rate | | | | Premiums Received | | Value | |
| 43,477 | | Goldman Sachs | | iShares MSCI EAFE Index Fund | | 07/27/09 | | 46.00 | | USD | | $ | 53,477 | | $ | (51,638 | ) |
| 477 | | Goldman Sachs | | Russell 2000 Index | | 07/27/09 | | 513.22 | | USD | | | 7,293 | | | (6,397 | ) |
| 442 | | Goldman Sachs | | S&P 400 MidCap Index | | 07/27/09 | | 576.73 | | USD | | | 7,138 | | | (7,659 | ) |
| 2,748 | | Goldman Sachs | | S&P 500 Index | | 07/27/09 | | 918.90 | | USD | | | 62,105 | | | (61,009 | ) |
| | | | | | | | | | | | | | | | | |
| | | | | | | | | | | | $ | 130,013 | | $ | (126,703 | ) |
| | | | | | | | | | | | | | | | | |
| | | | Total Premiums Received: | | $130,013 | | | | | | | | | | | |
| | | | Total Liabilities for Call Options Written: | | $126,703 | | | | | | | | | | | |
For the six months ended June 30, 2009, net realized gain (loss) on written options and the net change in unrealized gain (loss) on written options can be found on the Portfolio’s Statement of Operations. For additional information on the reason(s) why the Portfolio may enter into written options and the risks associated with this type of derivative, please refer to NOTE 2 in the accompanying Notes to Financial Statements.
See Accompanying Notes to Financial Statements
17
Investment Adviser
ING Investments, LLC
7337 East Doubletree Ranch Road
Scottsdale, Arizona 85258
Distributor
ING Funds Distributor, LLC
7337 East Doubletree Ranch Road
Scottsdale, Arizona 85258
Administrator
ING Funds Services, LLC
7337 East Doubletree Ranch Road
Scottsdale, Arizona 85258
Transfer Agent
PNC Global Investment Servicing (U.S.) Inc.
301 Bellevue Parkway
Wilmington, Delaware 19809
Custodian
The Bank of New York Mellon
One Wall Street
New York, New York 10286
Legal Counsel
Goodwin Procter LLP
Exchange Place
53 State Street
Boston, Massachusetts 02109
Before investing, carefully consider the investment objectives, risks, charges and expenses of the variable universal life insurance policy or variable annuity contract and the underlying variable investment options. This and other information is contained in the prospectus for the variable universal life policy or variable annuity contract and the underlying variable investment options. Obtain these prospectuses from your agent/registered representative and read them carefully before investing.
| | | | |
 | | VPSAR-AFOFGEOS | | (0609-082809) |
Not required for semi-annual filing.
ITEM 3. | AUDIT COMMITTEE FINANCIAL EXPERT. |
Not required for semi-annual filing.
ITEM 4. | PRINCIPAL ACCOUNTANT FEES AND SERVICES. |
Not required for semi-annual filing.
ITEM 5. | AUDIT COMMITTEE OF LISTED REGISTRANTS. |
Not required for semi-annual filing.
ITEM 6. | SCHEDULE OF INVESTMENTS. |
Schedule is included as part of the report to shareholders filed under Item 1 of this Form.
ITEM 7. | DISCLOSURE OF PROXY VOTING POLICIES AND PROCEDURES FOR CLOSED-END MANAGEMENT INVESTMENT COMPANIES. |
Not applicable.
ITEM 8. | PORTFOLIO MANAGERS OF CLOSED-END MANAGEMENT INVESTMENT COMPANIES. |
Not applicable.
ITEM 9. | PURCHASES OF EQUITY SECURITIES BY CLOSED-END MANAGEMENT INVESTMENT COMPANY AND AFFILIATED PURCHASERS. |
Not applicable.
ITEM 10. | SUBMISSION OF MATTERS TO A VOTE OF SECURITY HOLDERS. |
The Board has a Nominating Committee for the purpose of considering and presenting to the Board candidates it proposes for nomination to fill Independent Trustee vacancies on the Board. The Committee currently consists of all Independent Trustees of the Board (6 individuals). The Nominating Committee operates pursuant to a Charter approved by the Board. The primary purpose of the Nominating Committee is to consider and present to the Board the candidates it proposes for nomination to fill vacancies on the Board. In evaluating candidates, the Nominating Committee may consider a variety of factors, but it has not at this time set any specific minimum qualifications that must be met. Specific qualifications of candidates for Board membership will be based on the needs of the Board at the time of nomination.
The Nominating Committee is willing to consider nominations received from shareholders and shall assess shareholder nominees in the same manner as it reviews its own nominees. A shareholder nominee for director should be submitted in writing to the Fund’s Secretary. Any such shareholder nomination should include at a minimum the following information as to each individual proposed for nomination as trustee: such individual’s written consent to be named in the proxy statement as a nominee (if nominated) and to serve as a trustee (if elected), and all information relating to such individual that is required to be disclosed in the solicitation of proxies for election of trustees, or is otherwise required, in each case under applicable federal securities laws, rules and regulations.
The Secretary shall submit all nominations received in a timely manner to the Nominating Committee. To be timely, any such submission must be delivered to the Fund’s Secretary not earlier than the 90th day prior to such meeting and not later than the close of business on the later of the 60th day prior to such meeting or the 10th day following the day on which public announcement of the date of the meeting is first made, by either disclosure in a press release or in a document publicly filed by the Fund with the Securities and Exchange Commission.
ITEM 11. | CONTROLS AND PROCEDURES. |
(a) | | Based on our evaluation conducted within 90 days of the filing date, hereof, the design and operation of the registrant’s disclosure controls and procedures are effective to ensure that material information relating to the registrant is made known to the certifying officers by others within the appropriate entities, particularly during the period in which Forms N-CSR are being prepared, and the registrant’s disclosure controls and procedures allow timely preparation and review of the information for the registrant’s Form N-CSR and the officer certifications of such Form N-CSR. |
| | |
(b) | | There were no significant changes in the registrant’s internal controls that occurred during the second fiscal quarter of the period covered by this report that has materially affected, or is reasonably likely to materially affect, the registrant’s internal control over financial reporting. |
(a)(1) | | The Code of Ethics is not required for the semi-annual filing. |
| | |
(a)(2) | | A separate certification for each principal executive officer and principal financial officer of the registrant as required by Rule 30a-2 under the Act (17 CFR 270.30a-2) is attached hereto as EX-99.CERT. |
| | |
(a)(3) | | Not required for semi-annual filing. |
| | |
(b) | | The officer certifications required by Section 906 of the Sarbanes-Oxley Act of 2002 are attached hereto as EX-99.906CERT |
SIGNATURES
Pursuant to the requirements of the Securities Exchange Act of 1934 and the Investment Company Act of 1940, the registrant has duly caused this report to be signed on its behalf by the undersigned, thereunto duly authorized.
(Registrant): ING Variable Portfolios, Inc. |
| |
| |
By | /s/ | Shaun P. Mathews | |
| | Shaun P. Mathews | |
| | President and Chief Executive Officer |
|
Date: | September 3, 2009 | |
|
Pursuant to the requirements of the Securities Exchange Act of 1934 and the Investment Company Act of 1940, this report has been signed below by the following persons on behalf of the registrant and in the capacities and on the dates indicated. |
| |
| |
By | /s/ | Shaun P. Mathews | |
| | Shaun P. Mathews | |
| | President and Chief Executive Officer |
| |
Date: | September 3, 2009 | |
| |
| |
By | /s/ | Todd Modic | |
| | Todd Modic | |
| | Senior Vice President and Chief Financial Officer |
| |
| |
Date: | September 3, 2009 | |
| | | | | | |