As filed with the Securities and Exchange Commission on April 17, 2019
Securities Act File No.
SECURITIES AND EXCHANGE COMMISSION
WASHINGTON, D.C. 20549
Form N-14
REGISTRATION STATEMENT UNDER THE SECURITIES ACT OF 1933 X
Pre-Effective Amendment No. ¨
Post-Effective Amendment No. ¨
Voya Variable Portfolios, Inc.
(Exact Name of Registrant as Specified in Charter)
7337 East Doubletree Ranch Road, Scottsdale, Suite 100, Arizona 85258-2034
(Address of Principal Executive Offices) (Zip Code)
1-800-992-0180
(Registrant’s Area Code and Telephone Number)
Huey P. Falgout, Jr.
Voya Investment Management
7337 East Doubletree Ranch Road, Suite 100
Scottsdale, AZ 85258-2034
(Name and Address of Agent for Service)
With copies to:
Elizabeth J. Reza
Ropes & Gray LLP
Prudential Tower
800 Boylston Street
Boston, Massachusetts 02199-3600
Approximate Date of Proposed Public Offering:
As soon as practicable after this Registration Statement becomes effective.
It is proposed that this filing will become effective on May 22, 2019, pursuant to Rule 488 under the Securities Act of 1933, as amended.
No filing fee is required because an indefinite number of shares have previously been registered pursuant to Rule 24f-2 under the Investment Company Act of 1940, as amended.
Title of Securities Being Registered: Class ADV, Class I, Class S, and Class S2 shares of Voya Global Equity Portfolio
7337 East Doubletree Ranch Road, Suite 100
Scottsdale, AZ 85258-2034
1-800-366-0066

President
7337 East Doubletree Ranch Road, Suite 100
Scottsdale, AZ 85258-2034
(800) 366-0066
| 1. | To approve an Agreement and Plan of Reorganization by and between Templeton Portfolio and Voya Global Equity Portfolio (“Global Equity Portfolio”), providing for the reorganization of Templeton Portfolio with and into Global Equity Portfolio (the “Reorganization”); and |
| 2. | To transact such other business, not currently contemplated, that may properly come before the Special Meeting, or any adjournments or postponements thereof, in the discretion of the proxies or their substitutes. |

Secretary
June 7, 2019
Scheduled for July 30, 2019
| ACQUISITION OF THE ASSETS OF: | BY AND IN EXCHANGE FOR SHARES OF: |
| VY® Templeton Global Growth Portfolio | Voya Global Equity Portfolio |
| (A series of Voya Investors Trust) | (A series of Voya Variable Portfolios, Inc.) |
| 7337 East Doubletree Ranch Road, Suite 100 Scottsdale, AZ 85258-2034 | 7337 East Doubletree Ranch Road, Suite 100 Scottsdale, AZ 85258-2034 |
| (800) 366-0066 | (800) 992-0180 |
for the Shareholder Meeting to be Held on July 30, 2019
| By Phone: | 1-800-366-0066 |
| By Mail: | Voya Investment Management 7337 East Doubletree Ranch Road, Suite 100 Scottsdale, AZ 85258-2034 |
| By Internet: | www.voyainvestments.com/literature |
| 1. | The Statement of Additional Information dated June 7, 2019 relating to this Proxy Statement/Prospectus (File No. [File No. generated with N-14 Filing]); |
| 2. | The Prospectus and Statement of Additional Information dated May 1, 2019 for Templeton Portfolio (File No. 811-05629); and |
| 3. | The Prospectus and Statement of Additional Information dated May 1, 2019 for Global Equity Portfolio (File No. 811-07651). |
| In Person: | Public Reference Section 100 F Street, N.E. Washington, D.C. 20549(202) 551-8090 |
| By Mail: | U.S. Securities and Exchange Commission Public Reference Section 100 F Street, N.E. Washington, D.C. 20549(Duplication Fee Required) |
| By Email: | publicinfo@sec.gov (Duplication Fee Required) |
| By Internet: | www.sec.gov |
| • | By Internet. The web address and instructions for voting can be found on the enclosed Proxy Ballot or Voting Instruction Card. You will be required to provide your control number located on the Proxy Ballot or Voting Instruction Card. |
| • | By Telephone. The toll-free number for telephone voting can be found on the enclosed Proxy Ballot or Voting Instruction Card. You will be required to provide your control number located on the Proxy Ballot or Voting Instruction Card. |
| • | By Mail. Mark the enclosed Proxy Ballot or Voting Instruction Card, sign and date it, and return it in the postage-paid envelope we provided. Both joint owners must sign the Proxy Ballot or Voting Instruction Card. |
| • | In Person at the Special Meeting. You can vote your shares in person at the Special Meeting. If you expect to attend the Special Meeting in person, please call Shareholder Services toll-free at 1-800-366-0066. |
| • | the transfer of all of the assets of Templeton Portfolio to Global Equity Portfolio in exchange for shares of beneficial interest of Global Equity Portfolio; |
| • | the assumption by Global Equity Portfolio of all the liabilities of Templeton Portfolio; |
| • | the distribution of shares of Global Equity Portfolio to the shareholders of Templeton Portfolio; and |
| • | the complete liquidation of Templeton Portfolio. |
| • | The Portfolios have different investment objectives. The investment objective of Templeton Portfolio is to seek capital appreciation, with current income as an incidental consideration. The investment objective of Global Equity Portfolio is to seek long-term capital growth and current income. |
| • | The Portfolios have different principal investment strategies. Each Portfolio’s investment process results in a large cap value orientation for the overall portfolio. Additionally, although the benchmark index for each Portfolio is the MSCI World IndexSM (the “Index”), Templeton Portfolio will likely deviate more meaningfully from the Index than will Global Equity Portfolio at the sector and country level, leading to a higher tracking error compared to Global Equity Portfolio. |
| • | Voya Investments, LLC (“Voya Investments” or the “Adviser”) serves as the investment adviser to each Portfolio. Templeton Global Advisors Limited serves as the sub-adviser to Templeton Portfolio. Voya Investment Management Co. LLC serves as the sub-adviser to Global Equity Portfolio. |
| • | Each Portfolio is distributed by Voya Investments Distributor, LLC (the “Distributor”). |
| • | The shareholders of Templeton Portfolio are expected to benefit from lower gross and net expense ratios and expense limitation agreements between the Adviser and Global Equity Portfolio, which contractually obligates the Adviser to limit total net expenses of Global Equity Portfolio though May 1, 2021 at a rate that is lower than the current net expenses of Templeton Portfolio. In addition, the Portfolios’ shareholders have the potential to benefit from efficiencies resulting from the combined larger and more scalable fund. |
| • | The Reorganization will not affect a shareholder’s right to purchase, redeem, or exchange shares of the Portfolios. In addition, the Reorganization will not affect how shareholders purchase or sell their shares. |
| • | The Reorganization is intended to qualify for federal income tax purposes as a tax-free reorganization pursuant to Section 368(a) of the Internal Revenue Code of 1986, as amended (the “Code”); accordingly, pursuant to this treatment, neither Templeton Portfolio nor its shareholders, nor Global Equity Portfolio nor its shareholders are expected to recognize any gain or loss for federal income tax purposes from the Reorganization. |
| Templeton Portfolio | Global Equity Portfolio | |
| Investment Objective | The Portfolio seeks capital appreciation. Current income is only an incidental consideration. | The Portfolio seeks long-term capital growth and current income. |
| Annual Portfolio Operating Expenses Expenses you pay each year as a % of the value of your investment |
| Templeton Portfolio | Global Equity Portfolio | Global Equity Portfolio Pro Forma | ||
| Class ADV | ||||
| Management Fees | % | 0.96 | 0.55 | 0.55 |
| Distribution and/or Shareholder Services (12b-1) Fees | % | 0.60 | 0.50 | 0.50 |
| Other Expenses | % | 0.01 | 0.07 | 0.07 |
| Acquired Fund Fees and Expenses | % | None | 0.011 | 0.011 |
| Total Annual Portfolio Operating Expenses | % | 1.57 | 1.13 | 1.13 |
| Waivers and Reimbursements | % | (0.14)2 | (0.02)3 | (0.02)3 |
| Total Annual Portfolio Operating Expenses after Waivers and Reimbursements | % | 1.43 | 1.11 | 1.11 |
| Class I | ||||
| Management Fees | % | 0.96 | 0.55 | 0.55 |
| Distribution and/or Shareholder Services (12b-1) Fees | % | None | None | None |
| Other Expenses | % | 0.01 | 0.07 | 0.07 |
| Acquired Fund Fees and Expenses | % | None | 0.011 | 0.011 |
| Templeton Portfolio | Global Equity Portfolio | Global Equity Portfolio Pro Forma | ||
| Total Annual Portfolio Operating Expenses | % | 0.97 | 0.63 | 0.63 |
| Waivers and Reimbursements | % | (0.14)2 | (0.02)3 | (0.02)3 |
| Total Annual Portfolio Operating Expenses after Waivers and Reimbursements | % | 0.83 | 0.61 | 0.61 |
| Class S | ||||
| Management Fees | % | 0.96 | 0.55 | 0.55 |
| Distribution and/or Shareholder Services (12b-1) Fees | % | 0.25 | 0.25 | 0.25 |
| Other Expenses | % | 0.01 | 0.07 | 0.07 |
| Acquired Fund Fees and Expenses | % | None | 0.011 | 0.011 |
| Total Annual Portfolio Operating Expenses | % | 1.22 | 0.88 | 0.88 |
| Waivers and Reimbursements | % | (0.14)2 | (0.02)3 | (0.02)3 |
| Total Annual Portfolio Operating Expenses after Waivers and Reimbursements | % | 1.08 | 0.86 | 0.86 |
| Class S2 | ||||
| Management Fees | % | 0.96 | 0.55 | 0.55 |
| Distribution and/or Shareholder Services (12b-1) Fees | % | 0.40 | 0.40 | 0.40 |
| Other Expenses | % | 0.01 | 0.07 | 0.07 |
| Acquired Fund Fees and Expenses | % | None | 0.011 | 0.011 |
| Total Annual Portfolio Operating Expenses | % | 1.37 | 1.03 | 1.03 |
| Waivers and Reimbursements | % | (0.14)2 | (0.02)3 | (0.02)3 |
| Total Annual Portfolio Operating Expenses after Waivers and Reimbursements | % | 1.23 | 1.01 | 1.01 |
| 1. | Total Annual Operating Expenses may be higher than the Portfolio’s ratio of operating expenses to average net assets shown in the Financial Highlights, which reflects the operating expenses of the Portfolio and does not include Acquired Fund Fees and Expenses. |
| 2. | The Adviser is contractually obligated to limit expenses to 1.45%, 0.85%, 1.10%, and 1.25% for Class ADV, Class I, Class S, and Class S2 shares, respectively, through May 1, 2021. The limitation does not extend to interest, taxes, investment-related costs, leverage expenses, extraordinary expenses, and Acquired Fund Fees and Expenses. This limitation is subject to possible recoupment by the Adviser within 36 months of the waiver or reimbursement. The Adviser is contractually obligated to waive 0.018% of the management fee through May 1, 2021. Termination or modification of these obligations requires approval by the Portfolio’s board. |
| 3. | The Adviser is contractually obligated to limit expenses to 1.34%, 0.84%, 1.09%, and 1.24% for Class ADV, Class I, Class S, and Class S2, respectively, through May 1, 2021. This limitation is subject to possible recoupment by the Adviser within 36 months of waiver or reimbursement. In addition, the Adviser is contractually obligated to further limit expenses to 1.10%, 0.60%, 0.85%, and 1.00% for Class ADV, Class I, Class S, and Class S2, respectively, through May 1, 2021. The limitations do not extend to interest, taxes, investment-related costs, leverage expenses, extraordinary expenses, and Acquired Fund Fees and Expenses. Termination or modification of these obligations requires approval by the Board. |
| Templeton Portfolio | Global Equity Portfolio | Global Equity Portfolio Pro Forma | |||||||||||
| Class | 1 Yr | 3 Yrs | 5 Yrs | 10 Yrs | 1 Yr | 3 Yrs | 5 Yrs | 10 Yrs | 1 Yr | 3 Yrs | 5 Yrs | 10 Yrs | |
| Class ADV | $ | 146 | 482 | 842 | 1,856 | 113 | 357 | 620 | 1,373 | 113 | 357 | 620 | 1,373 |
| Class I | $ | 85 | 295 | 523 | 1,177 | 62 | 200 | 349 | 784 | 62 | 200 | 349 | 784 |
| Class S | $ | 110 | 373 | 657 | 1,465 | 88 | 279 | 486 | 1,082 | 88 | 279 | 486 | 1,082 |
| Class S2 | $ | 125 | 420 | 737 | 1,634 | 103 | 326 | 567 | 1,258 | 103 | 326 | 567 | 1,258 |
| Templeton Portfolio | Global Equity Portfolio | |
| Investment Strategies | Under normal market conditions, the Portfolio invests primarily in equity securities of companies located in a number of different countries anywhere in the world, including emerging markets. Common stocks, preferred stocks, and convertible securities are examples of equity securities in which the Portfolio may invest. Convertible securities have characteristics of both debt instruments (which is generally the form in which they are first issued) and equity securities (which is what they can be converted into). The Portfolio also invests in depositary receipts. The Portfolio may invest up to 25% of its total assets in debt instruments of companies and governments located anywhere in the world. The Portfolio may invest up to 15% of its net assets in equity-linked notes for hedging and investment purposes. The Portfolio may use various derivative strategies, such as option or swap agreements, among others, to seek to protect its assets, implement a cash or tax management strategy, or enhance its returns. The Portfolio may invest up to 5% of its total assets in options and swap agreements. With derivatives, the sub-adviser (“Sub-Adviser”) attempts to predict whether an underlying investment will increase or decrease in value at some future time. The Sub-Adviser considers various factors, such as availability and cost, in deciding whether to use a particular instrument or strategy. The Portfolio may invest in real estate-related securities including real estate investment trusts. The Portfolio may invest in other investment companies, including exchange-traded funds, to the extent permitted under the Investment Company Act of 1940, as amended, and the rules, regulations, and exemptive orders thereunder (“1940 Act”). When choosing equity investments for the Portfolio, the Sub-Adviser applies a “bottom up,” value-oriented, long-term approach, focusing on the market price of a company's securities relative to the Sub-Adviser's evaluation of the company's long-term earnings, asset value, and cash flow potential. The Sub-Adviser also considers a company's price/earnings ratio, price/cash flow ratio, profit margins, and liquidation value. The Sub-Adviser may sell securities for a variety of reasons, such as to secure gains, limit losses, or redeploy assets into opportunities believed to be more promising, among others. The Portfolio may lend portfolio securities on a short-term or long-term basis, up to 33 1⁄3% of its total assets. | Under normal market conditions, the Portfolio invests at least 80% of its net assets (plus borrowings for investment purposes) in a portfolio of equity securities. The Portfolio will provide 60 days’ prior notice of any change in this investment policy. The Portfolio invests primarily in equity securities included in the MSCI World IndexSM (“Index”). The Portfolio invests in securities of issuers in a number of different countries, including the United States. The sub-adviser (“Sub-Adviser”) seeks to maximize total return to the extent consistent with maintaining lower volatility than the Index. Volatility generally measures how much a fund’s returns have varied over a specified time frame. The Portfolio may invest in derivative instruments including, but not limited to, index futures. The Portfolio typically uses derivatives as a substitute for purchasing securities included in the Index or for the purpose of maintaining equity market exposure on its cash balance. The Portfolio may also invest in real estate-related securities, including real estate investment trusts. The Portfolio may invest in other investment companies, including exchange-traded funds, to the extent permitted under the Investment Company Act of 1940, as amended, and the rules, regulations, and exemptive orders thereunder (“1940 Act”). The Sub-Adviser uses an internally developed quantitative computer model to create a target universe of global securities with above average dividend yields compared to the Index, which the Sub-Adviser believes exhibit stable and growing dividend yields within each geographic region and industry sector. The model also seeks to exclude from the target universe securities issued by companies that the Sub-Adviser believes exhibit characteristics that indicate they are at risk of reducing or eliminating the dividends paid on their securities. Once the Sub-Adviser creates this target universe, the Sub-Adviser seeks to identify the most attractive securities within various geographic regions and sectors by ranking each security relative to other securities within its region or sector, as applicable, using proprietary fundamental sector-specific models. The Sub-Adviser then uses optimization techniques to seek to achieve the Portfolio’s target dividend yield, manage target beta, determine active weights, and neutralize region and sector exposures in order to create a portfolio that the Sub-Adviser believes will provide the potential for maximum total return consistent with maintaining lower volatility than the Index. Under certain market conditions, the Portfolio will likely earn a lower level of total return than it would in the absence of its strategy of maintaining a relatively low level of volatility. The Sub-Adviser will rebalance the Portfolio on a quarterly basis in accordance with its target parameters. The rebalancing techniques may result in higher portfolio turnover compared to a “buy and hold” strategy. The Portfolio may lend portfolio securities on a short-term or long-term basis, up to 33 1⁄3% of its total assets. |
| Risks | Templeton Portfolio | Global Equity Portfolio |
| Company: The price of a company’s stock could decline or underperform for many reasons including, among others, poor management, financial problems, reduced demand for company goods or services, regulatory fines and judgments, or business challenges. If a company declares bankruptcy or becomes insolvent, its stock could become worthless. | ✓ | ✓ |
| Convertible Securities: Convertible securities are securities that are convertible into or exercisable for common stocks at a stated price or rate. Convertible securities are subject to the usual risks associated with debt instruments, such as interest rate and credit risk. In addition, because convertible securities react to changes in the value of the stocks into which they convert, they are subject to market risk. | ✓ | |
| Credit: The price of a bond or other debt instrument is likely to fall if the issuer’s actual or perceived financial health deteriorates, whether because of broad economic or issuer-specific reasons. In certain cases, the issuer could be late in paying interest or principal, or could fail to pay its financial obligations altogether. | ✓ | |
| Currency: To the extent that a Portfolio invests directly or indirectly in foreign (non-U.S.) currencies or in securities denominated in, or that trade in, foreign (non-U.S.) currencies, it is subject to the risk that those foreign (non-U.S.) currencies will decline in value relative to the U.S. dollar or, in the case of hedging positions, that the U.S. dollar will decline in value relative to the currency being hedged by a Portfolio through foreign currency exchange transactions. | ✓ | ✓ |
| Derivative Instruments: Derivative instruments are subject to a number of risks, including the risk of changes in the market price of the underlying securities, credit risk with respect to the counterparty, risk of loss due to changes in market interest rates and liquidity and volatility risk. The amounts required to purchase certain derivatives may be small relative to the magnitude of exposure assumed by a Portfolio. Therefore, the purchase of certain derivatives may have an economic leveraging effect on a Portfolio and exaggerate any increase or decrease in the net asset value. Derivatives may not perform as expected, so a Portfolio may not realize the intended benefits. When used for hedging purposes, the change in value of a derivative may not correlate as expected with the currency, security or other risk being hedged. When used as an alternative or substitute for direct cash investments, the return provided by the derivative may not provide the same return as direct cash investment. In addition, given their complexity, derivatives expose a Portfolio to the risk of improper valuation. | ✓ | ✓ |
| Dividend: Companies that issue dividend yielding equity securities are not required to continue to pay dividends on such securities. Therefore, there is the possibility that such companies could reduce or eliminate the payment of dividends in the future. As a result, the Portfolio’s ability to execute its investment strategy may be limited. | ✓ | |
| Foreign Investments: Investing in foreign (non-U.S.) securities may result in the Portfolio experiencing more rapid and extreme changes in value than a fund that invests exclusively in securities of U.S. companies due to: smaller markets; differing reporting, accounting, and auditing standards; nationalization, expropriation, or confiscatory taxation; foreign currency fluctuations, currency blockage, or replacement; potential for default on sovereign debt; or political changes or diplomatic developments, which may include the imposition of economic sanctions or other measures by the United States or other governments and supranational organizations. Markets and economies throughout the world are becoming increasingly interconnected, and conditions or events in one market, country or region may adversely impact investments or issuers in another market, country or region. | ✓ |
| Risks | Templeton Portfolio | Global Equity Portfolio |
| Foreign Investments/Developing and Emerging Markets: Investing in foreign (non-U.S.) securities may result in the Portfolio experiencing more rapid and extreme changes in value than a fund that invests exclusively in securities of U.S. companies due to: smaller markets; differing reporting, accounting, and auditing standards; nationalization, expropriation, or confiscatory taxation; foreign currency fluctuations, currency blockage, or replacement; potential for default on sovereign debt; or political changes or diplomatic developments, which may include the imposition of economic sanctions or other measures by the United States or other governments and supranational organizations. Markets and economies throughout the world are becoming increasingly interconnected, and conditions or events in one market, country or region may adversely impact investments or issuers in another market, country or region. Foreign investment risks may be greater in developing and emerging markets than in developed markets. | ✓ | |
| Growth Investing: Prices of growth stocks are more sensitive to investor perceptions of the issuing company’s growth potential and may fall quickly and significantly if investors suspect that actual growth may be less than expected. There is a risk that funds that invest in growth-oriented stocks may underperform other funds that invest more broadly. Growth stocks tend to be more volatile than value stocks, and may underperform the market as a whole over any given time period. | ✓ | |
| Interest Rate: With bonds and other fixed rate debt instruments, a rise in market interest rates generally causes values to fall; conversely, values generally rise as market interest rates fall. The higher the credit quality of the instrument, and the longer its maturity or duration, the more sensitive it is likely to be to interest rate risk. In the case of inverse securities, the interest rate paid by the securities is a floating rate, which generally will decrease when the market rate of interest to which the inverse security is indexed increases and will increase when the market rate of interest to which the inverse security is indexed decreases. As of the date of this Prospectus, the United States experiences a low interest rate environment, which may increase the Portfolio’s exposure to risks associated with rising market interest rates. Rising market interest rates could have unpredictable effects on the markets and may expose fixed-income and related markets to heightened volatility. To the extent that the Portfolio invests in fixed-income securities, an increase in market interest rates may lead to increased redemptions and increased portfolio turnover, which could reduce liquidity for certain investments, adversely affect values, and increase costs. Increased redemptions may cause the Portfolio to liquidate portfolio positions when it may not be advantageous to do so and may lower returns. If dealer capacity in fixed-income markets is insufficient for market conditions, it may further inhibit liquidity and increase volatility in the fixed-income markets. Further, recent and potential future changes in government policy may affect interest rates. | ✓ | |
| Investment Model: A manager’s proprietary model may not adequately allow for existing or unforeseen market factors or the interplay between such factors. Volatility management techniques may not always be successful in reducing volatility, may not protect against market declines, and may limit the Portfolio’s participation in market gains, negatively impacting performance even during periods when the market is rising. During sudden or significant market rallies, such underperformance may be significant. Moreover, volatility management strategies may increase portfolio transaction costs, which may increase losses or reduce gains. The Portfolio’s volatility may not be lower than that of the Index during all market cycles due to market factors. Portfolios that are actively managed, in whole or in part, according to a quantitative investment model can perform differently from the market as a whole based on the investment model and the factors used in the analysis, the weight placed on each factor, and changes from the factors’ historical trends. Mistakes in the construction and implementation of the investment models (including, for example, data problems and/or software issues) may create errors or limitations that might go undetected or are discovered only after the errors or limitations have negatively impacted performance. There is no guarantee that the use of these investment models will result in effective investment decisions for a Portfolio. | ✓ | |
| Liquidity: If a security is illiquid, a Portfolio might be unable to sell the security at a time when a Portfolio’s manager might wish to sell, or at all. Further, the lack of an established secondary market may make it more difficult to value illiquid securities, exposing a Portfolio to the risk that the price at which it sells illiquid securities will be less than the price at which they were valued when held by a Portfolio. The prices of illiquid securities may be more volatile than more liquid investments. The risks associated with illiquid securities may be greater in times of financial stress. A Portfolio could lose money if it cannot sell a security at the time and price that would be most beneficial to a Portfolio. | ✓ | ✓ |
| Risks | Templeton Portfolio | Global Equity Portfolio |
| Market: Stock prices may be volatile or have reduced liquidity in response to real or perceived impacts of factors including, but not limited to, economic conditions, changes in market interest rates, and political events. Stock markets tend to be cyclical, with periods when stock prices generally rise and periods when stock prices generally decline. Any given stock market segment may remain out of favor with investors for a short or long period of time, and stocks as an asset class may underperform bonds or other asset classes during some periods. Additionally, legislative, regulatory or tax policies or developments in these areas may adversely impact the investment techniques available to a manager, add to costs and impair the ability of a Portfolio to achieve its investment objectives. | ✓ | ✓ |
| Market Capitalization: Stocks fall into three broad market capitalization categories - large, mid, and small. Investing primarily in one category carries the risk that, due to current market conditions, that category may be out of favor with investors. If valuations of large-capitalization companies appear to be greatly out of proportion to the valuations of mid- or small-capitalization companies, investors may migrate to the stocks of mid- and small-sized companies causing a fund that invests in these companies to increase in value more rapidly than a fund that invests in larger companies. Investing in mid- and small-capitalization companies may be subject to special risks associated with narrower product lines, more limited financial resources, smaller management groups, more limited publicly available information, and a more limited trading market for their stocks as compared with larger companies. As a result, stocks of mid- and small-capitalization companies may be more volatile and may decline significantly in market downturns. | ✓ | ✓ |
| Other Investment Companies: The main risk of investing in other investment companies, including exchange-traded funds (“ETFs”), is the risk that the value of the securities underlying an investment company might decrease. Shares of investment companies that are listed on an exchange may trade at a discount or premium from their net asset value. You will pay a proportionate share of the expenses of those other investment companies (including management fees, administration fees, and custodial fees) in addition to the expenses of a Portfolio. The investment policies of the other investment companies may not be the same as those of a Portfolio; as a result, an investment in the other investment companies may be subject to additional or different risks than those to which a Portfolio is typically subject. | ✓ | ✓ |
| Prepayment and Extension: Many types of debt instruments are subject to prepayment and extension risk. Prepayment risk is the risk that the issuer of a debt instrument will pay back the principal earlier than expected. This may occur when interest rates decline. Prepayment may expose the Portfolio to a lower rate of return upon reinvestment of principal. Also, if a debt instrument subject to prepayment has been purchased at a premium, the value of the premium would be lost in the event of prepayment. Extension risk is the risk that the issuer of a debt instrument will pay back the principal later than expected. This may occur when interest rates rise. This may negatively affect performance, as the value of the debt instrument decreases when principal payments are made later than expected. Additionally, the Portfolio may be prevented from investing proceeds it would have received at a given time at the higher prevailing interest rates. | ✓ | |
| Real Estate Companies and Real Estate Investment Trusts (“REITs”): Investing in real estate companies and REITs may subject a Portfolio to risks similar to those associated with the direct ownership of real estate, including losses from casualty or condemnation, changes in local and general economic conditions, supply and demand, market interest rates, zoning laws, regulatory limitations on rents, property taxes, and operating expenses in addition to terrorist attacks, war, or other acts that destroy real property. Investments in REITs are affected by the management skill and creditworthiness of the REIT. A Portfolio will indirectly bear its proportionate share of expenses, including management fees, paid by each REIT in which it invests. | ✓ | ✓ |
| Securities Lending: Securities lending involves two primary risks: “investment risk” and “borrower default risk.” When lending securities, a Portfolio will receive cash or U.S. government securities as collateral. Investment risk is the risk that a Portfolio will lose money from the investment of the cash collateral received from the borrower. Borrower default risk is the risk that a Portfolio will lose money due to the failure of a borrower to return a borrowed security. Securities lending may result in leverage. The use of leverage may exaggerate any increase or decrease in the net asset value, causing a Portfolio to be more volatile. The use of leverage may increase expenses and increase the impact of a Portfolio’s other risks. | ✓ | ✓ |
| Risks | Templeton Portfolio | Global Equity Portfolio |
| Sovereign Debt: These securities are issued or guaranteed by foreign government entities. Investments in sovereign debt are subject to the risk that a government entity may delay payment, restructure its debt, or refuse to pay interest or repay principal on its sovereign debt. Some of these reasons may include cash flow problems, insufficient foreign currency reserves, political considerations, social changes, the relative size of its debt position to its economy or its failure to put in place economic reforms required by the International Monetary Fund or other multilateral agencies. If a government entity defaults, it may ask for more time in which to pay or for further loans. There is no legal process for collecting sovereign debts that a government does not pay or bankruptcy proceeding by which all or part of sovereign debt that a government entity has not repaid may be collected. | ✓ | |
| U.S. Government Securities and Obligations: U.S. government securities are obligations of, or guaranteed by, the U.S. government, its agencies or government-sponsored enterprises. U.S. government securities are subject to market and interest rate risk, and may be subject to varying degrees of credit risk. | ✓ | |
| Value Investing: Securities that appear to be undervalued may never appreciate to the extent expected. Further, because the prices of value-oriented securities tend to correlate more closely with economic cycles than growth-oriented securities, they generally are more sensitive to changing economic conditions, such as changes in market interest rates, corporate earnings and industrial production. The manager may be wrong in its assessment of a company’s value and the securities the Portfolio holds may not reach their full values. A particular risk of the Portfolio’s value approach is that some holdings may not recover and provide the capital growth anticipated or a security judged to be undervalued may actually be appropriately priced. The market may not favor value-oriented securities and may not favor equities at all. During those periods, the Portfolio’s relative performance may suffer. There is a risk that funds that invest in value-oriented stocks may underperform other funds that invest more broadly. | ✓ |
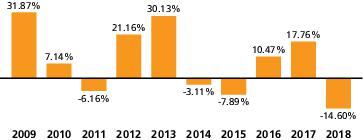
(as of December 31 of each year)
| Bar Chart Graphic | CUSIP/Fund ID |
| 2009 | 31.87% |
| 2010 | 7.14% |
| 2011 | -6.16% |
| 2012 | 21.16% |
| 2013 | 30.13% |
| 2014 | -3.11% |
| 2015 | -7.89% |
| 2016 | 10.47% |
| 2017 | 17.76% |
| 2018 | -14.60% |
(for the periods ended December 31, 2018)
| 1 Yr | 5 Yrs | 10 Yrs | Since Inception | Inception Date | ||
| Class ADV | % | -14.60 | -0.17 | 7.56 | N/A | 12/29/06 |
| MSCI World IndexSM1 | % | -8.71 | 4.56 | 9.67 | N/A | |
| Class I | % | -14.13 | 0.42 | 8.26 | N/A | 04/28/06 |
| MSCI World IndexSM1 | % | -8.71 | 4.56 | 9.67 | N/A | |
| Class S | % | -14.35 | 0.18 | 7.99 | N/A | 10/21/92 |
| MSCI World IndexSM1 | % | -8.71 | 4.56 | 9.67 | N/A | |
| Class S2 | % | -14.49 | 0.01 | 7.82 | N/A | 09/09/02 |
| MSCI World IndexSM1 | % | -8.71 | 4.56 | 9.67 | N/A |
| 1 | The index returns include the reinvestment of dividends and distributions net of withholding taxes, but do not reflect fees, brokerage commissions, or other expenses. |
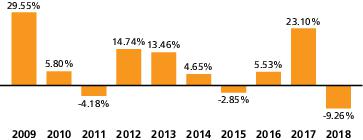
(as of December 31 of each year)
| Bar Chart Graphic | CUSIP/Fund ID |
| 2009 | 29.55% |
| 2010 | 5.80% |
| 2011 | -4.18% |
| 2012 | 14.74% |
| 2013 | 13.46% |
| 2014 | 4.65% |
| 2015 | -2.85% |
| 2016 | 5.53% |
| 2017 | 23.10% |
| 2018 | -9.26% |
(for the periods ended December 31, 2018)
| 1 Yr | 5 Yrs | 10 Yrs | Since Inception | Inception Date | ||
| Class ADV | % | -9.26 | 3.69 | 7.44 | N/A | 01/28/08 |
| MSCI World IndexSM1 | % | -8.71 | 4.56 | 9.67 | N/A | |
| Class I | % | -8.85 | 4.15 | 7.80 | N/A | 03/05/15 |
| MSCI World IndexSM1 | % | -8.71 | 4.56 | 9.67 | N/A | |
| Class S | % | -9.11 | 3.95 | 7.70 | N/A | 01/28/08 |
| MSCI World IndexSM1 | % | -8.71 | 4.56 | 9.67 | N/A | |
| Class S2 | % | -9.27 | N/A | N/A | 2.49 | 03/05/15 |
| MSCI World IndexSM1 | % | -8.71 | N/A | N/A | 3.75 |
| 1 | The index returns include the reinvestment of dividends and distributions net of withholding taxes, but do not reflect fees, brokerage commissions, or other expenses. |
| Templeton Portfolio | Global Equity Portfolio | |
| Investment Adviser | Voya Investments, LLC (the “Adviser”) | Adviser |
| Management Fee (as a percentage of average daily net assets) | 0.960% on the first $250 million of average daily net assets; 0.860% on next $250 million of average daily net assets; and 0.760% on assets in excess of $500 million | 0.560% on first $500 million of average daily net assets; 0.530% on next $500 million of average daily net assets; and 0.510% on assets in excess of $1 billion |
| Sub-Adviser | Templeton Global Advisors Limited (“Templeton Global Advisors)” | Voya Investment Management Co. LLC (“Voya IM”) |
| Templeton Portfolio | Global Equity Portfolio | |
| Sub-Advisory Fee (as a percentage of average daily net assets) | The Adviser paid Templeton Global Advisors aggregate sub-advisory fees of $165,787,860 which represented approximately 0.3319% of the Portfolio’s average daily net assets for the fiscal year ended December 31, 2018. The accrued sub-advisory fees paid and percentage reflect the fee schedules in effect during that period. | 0.210% on all assets |
| Portfolio Managers | Heather Arnold, CFA (since 04/15) Norman J. Boersma, CFA (since 03/11) Peter Moeschter, CFA (since 02/19) | Vincent Costa, CFA (since 04/12) Peg DiOrio, CFA (02/19) Steve Wetter (since 05/18) Kai Yee Wong (since 05/18) |
| Distributor | Voya Investments Distributor, LLC (the “Distributor”) | Distributor |
| Templeton Portfolio | Global Equity Portfolio |
| Shareholders may elect Trustees by the vote of a plurality of votes cast at any shareholder meeting called for that purpose, to the extent required by the 1940 Act. | At any meeting of shareholders duly called for the purpose and only as required by the 1940 Act, shareholders may elect Directors by the vote of a plurality of the votes cast at the meeting, provided a quorum is present. |
| A Trustee may be removed at any time by written instrument signed by at least two-thirds of the number of Trustees prior to such removal, specifying the date when such removal shall become effective. Trustees may also be removed at any meeting of shareholders of the Trust by a vote of two-thirds of the outstanding shares or by a written declaration executed, without a meeting, by the holders of not less than two-thirds of the outstanding shares. | At any meeting of shareholders duly called for the purpose, shareholders have the power to remove Directors by the vote of a majority of all the votes entitled to be cast generally for the election of Directors. Directors of a Maryland corporation do not have the power to remove Directors. |
| The Trust or any series or class thereof may be terminated by the affirmative vote of a majority of the Trustees. | In general, the Board may approve the liquidation of any series of the Corporation without the approval of shareholders. The dissolution of the Corporation must be advised by the Board of Directors and approved by the shareholders entitled to cast a majority of the votes entitled to be cast on the matter. At such time as no shares are outstanding, the dissolution of the Corporation may be approved by a majority of the entire Board of Directors. |
| A majority of the Trustees have the power to amend the Declaration of Trust, except that no amendment to the Declaration of Trust that would materially adversely affect the rights of shareholders may be made without the approval of a majority of shares outstanding and entitled to vote. | In general, amendments to the charter of the Corporation must be advised by the Directors and approved by the affirmative vote of the shareholders entitled to cast a majority of all the votes entitled to be cast on the matter, except that no action affecting the validity or assessability of such shares shall be taken without the unanimous approval of the outstanding shares affected thereby. Under Maryland law, a majority of the entire Board of Directors may approve certain limited amendments to the charter without action by the shareholders. |
| Templeton Portfolio | Global Equity Portfolio | Adjustments | Global Equity Portfolio Pro Forma | ||
| Class ADV | |||||
| Net Assets | $ | 1 | |||
| Shares Outstanding | 2 | ||||
| Net Asset Value Per Share | $ | - | |||
| Class I | |||||
| Net Assets | $ | 1 | |||
| Shares Outstanding | 2 | ||||
| Net Asset Value Per Share | $ | ||||
| Class S | |||||
| Net Assets | $ | 1 | |||
| Shares Outstanding | 2 | ||||
| Net Asset Value Per Share | $ | ||||
| Class S2 | |||||
| Net Assets | $ | 1 | |||
| Shares Outstanding | 2 | ||||
| Net Asset Value Per Share | $ |
| 1. | Reflects adjustment for estimated one-time merger and consolidation expenses. |
| 2. | Reflects new shares issued, net of retired shares of Templeton Portfolio. (Calculation: Net Assets ÷ NAV per share). |
| • | The view of the Adviser that Templeton Portfolio has faced performance challenges and has limited prospects for future sales and long-term viability. |
| • | The Adviser’s recommendation that the Board select Global Equity Portfolio as the acquiring fund for Templeton Portfolio, based on its consideration of other possible merger candidates within the Voya fund family, the similarities and differences in the investment objectives, and differences in investment strategies of Global Equity Portfolio and Templeton Portfolio. |
| • | The Adviser’s representation that the Reorganization was intended to enhance the efficiency and reduce the complexity of the Voya family of funds. |
| • | Information regarding the performance of Global Equity Portfolio, as compared to the performance of Templeton Portfolio in the year-to-date, one-year, three-year and five-year periods, the performance of Templeton Portfolio as compared to its Morningstar, Inc. (“Morningstar”) peer group, and the performance of Global Equity Portfolio as compared to its Morningstar peer group. The Adviser’s representations that, beginning May 1, 2018, Global Equity Portfolio has been managed under Voya’s Global High Dividend Low Volatility (“HDLV”) strategy and that since this strategy change Global Equity has outperformed Templeton Portfolio. The Adviser’s representation that performance returns for Global Equity for the period prior to May 1, 2018 are reflective of prior strategies of the Portfolio. |
| • | Information concerning the differences in fee structures of Global Equity Portfolio and Templeton Portfolio and the anticipated expenses of Global Equity Portfolio following the Reorganization, including the lower gross and net expense ratio that current shareholders of Templeton Portfolio are expected to experience as a result of the Reorganization, as shareholders of Global Equity Portfolio the benefits shareholders of Templeton Portfolio would receive due to the existing management fee breakpoints for Global Equity Portfolio, and the Adviser’s undertaking to lower the Templeton Portfolio’s expense limits, commencing with Voya IM’s appointment as sub-adviser to Templeton Portfolio, to align them with Global Equity Portfolio’s expense limits. |
| • | Representations from the Portfolios’ Chief Investment Risk Officer regarding the track record of Global Equity Portfolio’s current HDLV strategy. |
| • | The similarities and differences in the Portfolios’ investment strategies and investment objectives, including the similarities in the Portfolios’ large cap value orientation. |
| • | Information regarding the combined asset size of the two Portfolios, which would be likely to result in a reduction in expenses for the benefit of shareholders and provide greater scale and potential to maintain long-term scale benefits for shareholders, as well as the net revenue benefits for the Adviser and its affiliates that would result from the Reorganization. |
| • | The Adviser’s representations that direct or indirect transition costs relating to the Reorganization will be borne by Templeton Portfolio and/or its shareholders, the Adviser’s agreement to bear all the proxy costs relating to the Reorganization, and the fact that implicit transaction costs are uncertain and will be borne by Templeton Portfolio. |
| • | The Board’s determination that the Reorganization will not dilute the interests of the shareholders of Templeton Portfolio |
| • | The fact that the Reorganization is intended to qualify for federal income tax purposes as a tax-free reorganization. |
| Class | Shares Outstanding |
| ADV | [ ] |
| I | [ ] |
| S | [ ] |
| S2 | [ ] |
| Total |
Scottsdale, AZ 85258-2034
7337 East Doubletree Ranch Road
Suite 100
Scottsdale, Arizona 85258-2034
Attn: Huey P. Falgout, Jr.
Prudential Tower, 800 Boylston Street
Boston, MA 02199-3600
Attn: Elizabeth Reza
7337 East Doubletree Ranch Road
Suite 100
Scottsdale, Arizona 85258-2034
Attn: Huey P. Falgout, Jr.
Prudential Tower, 800 Boylston Street
Boston, MA 02199-3600
Attn: Elizabeth Reza
| • | Exchange-traded securities are valued at the mean of the closing bid and ask. |
| • | Debt obligations are valued using an evaluated price provided by an independent pricing service. Evaluated prices provided by the pricing service may be determined without exclusive reliance on quoted prices, and may reflect factors such as institution-size trading in similar groups of securities, developments related to specific securities, benchmark yield, quality, type of issue, coupon rate, maturity individual trading characteristics and other market data. |
| • | Securities traded in the over-the-counter market are valued based on prices provided by independent pricing services or market makers. |
| • | Options not listed on an exchange are valued by an independent source using an industry accepted model, such as Black-Scholes. |
| • | Centrally cleared swap agreements are valued using a price provided by the central counterparty clearinghouse. |
| • | Over-the-counter swap agreements are valued using a price provided by an independent pricing service. |
| • | Forward foreign currency exchange contracts are valued utilizing current and forward rates obtained from an independent pricing service. Such prices from the third party pricing service are for specific settlement periods and Global Portfolio’s forward foreign currency exchange contracts are valued at an interpolated rate between the closest preceding and subsequent period reported by the independent pricing service. |
| • | Securities for which market prices are not provided by any of the above methods may be valued based upon quotes furnished by brokers. |
| • | Rebalancing to facilitate fund-of-fund arrangements or Global Equity Portfolio’s systematic exchange privileges; and |
| • | Purchases or sales initiated by certain other funds in the Voya family of funds. |
| Income (loss) from investment operations | Less distributions | Ratios to average net assets | Supplemental data | |||||||||||||||||||||||||||||||
| Net asset value, beginning of year or period | Net investment income (loss) | Net realized and unrealized gain (loss) | Total from investment operations | From net investment income | From net realized gains | From return of capital | Total distributions | Payments from distribution settlement/affiliate | Net asset value, end of year or period | Total Return(1) | Expenses before reductions/additions(2)(3)(4) | Expenses, net of fee waivers and/or recoupments, if any(2)(3)(4) | Expenses, net of all reductions/additions(2)(3)(4) | Net investment income (loss)(2)(3) | Net assets, end of year or period | Portfolio turnover rate | ||||||||||||||||||
| Year or Period ended | ($) | ($) | ($) | ($) | ($) | ($) | ($) | ($) | ($) | ($) | (%) | (%) | (%) | (%) | (%) | ($000's) | (%) | |||||||||||||||||
| Voya Global Equity Portfolio | ||||||||||||||||||||||||||||||||||
| Class ADV | ||||||||||||||||||||||||||||||||||
| 12-31-18 | 11.02 | 0.23• | (1.21) | (0.98) | 0.40 | 0.01 | — | 0.41 | — | 9.63 | (9.26)(a) | 1.12 | 1.11 | 1.11 | 2.12 | 15,225 | 147 | |||||||||||||||||
| 12-31-17 | 9.12 | 0.14• | 1.95 | 2.09 | 0.19 | — | — | 0.19 | — | 11.02 | 23.10 | 1.10 | 1.10 | 1.10 | 1.43 | 19,605 | 60 | |||||||||||||||||
| 12-31-16 | 8.85 | 0.16• | 0.31 | 0.47 | 0.20 | — | — | 0.20 | — | 9.12 | 5.53 | 1.10 | 1.10 | 1.10 | 1.87 | 19,883 | 101 | |||||||||||||||||
| 12-31-15 | 9.11 | 0.21• | (0.47) | (0.26) | — | — | — | — | — | 8.85 | (2.85)(b) | 1.11 | 1.11 | 1.11 | 2.26 | 23,880 | 83 | |||||||||||||||||
| 12-31-14 | 8.94 | 0.19 | 0.22 | 0.41 | 0.24 | — | — | 0.24 | — | 9.11 | 4.65 | 1.12 | 1.12 | 1.12 | 2.03 | 1,279 | 88 | |||||||||||||||||
| Class I | ||||||||||||||||||||||||||||||||||
| 12-31-18 | 11.13 | 0.29• | (1.22) | (0.93) | 0.57 | 0.01 | — | 0.58 | — | 9.62 | (8.85)(a) | 0.62 | 0.61 | 0.61 | 2.63 | 132,480 | 147 | |||||||||||||||||
| 12-31-17 | 9.21 | 0.20• | 1.96 | 2.16 | 0.24 | — | — | 0.24 | — | 11.13 | 23.73 | 0.60 | 0.60 | 0.60 | 1.91 | 162,746 | 60 | |||||||||||||||||
| 12-31-16 | 8.94 | 0.21• | 0.31 | 0.52 | 0.25 | — | — | 0.25 | — | 9.21 | 6.00 | 0.60 | 0.60 | 0.60 | 2.36 | 150,824 | 101 | |||||||||||||||||
| 03-05-15(5) - 12-31-15 | 9.63 | 0.22• | (0.85) | (0.63) | 0.06 | — | — | 0.06 | — | 8.94 | (6.64)(b) | 0.61 | 0.61 | 0.61 | 2.78 | 165,749 | 83 | |||||||||||||||||
| Class S | ||||||||||||||||||||||||||||||||||
| 12-31-18 | 11.12 | 0.26• | (1.23) | (0.97) | 0.48 | 0.01 | — | 0.49 | — | 9.66 | (9.11)(a) | 0.87 | 0.86 | 0.86 | 2.37 | 375,359 | 147 | |||||||||||||||||
| 12-31-17 | 9.20 | 0.17• | 1.96 | 2.13 | 0.21 | — | — | 0.21 | — | 11.12 | 23.44 | 0.85 | 0.85 | 0.85 | 1.67 | 480,936 | 60 | |||||||||||||||||
| 12-31-16 | 8.93 | 0.19• | 0.31 | 0.50 | 0.23 | — | — | 0.23 | — | 9.20 | 5.76 | 0.85 | 0.85 | 0.85 | 2.11 | 485,551 | 101 | |||||||||||||||||
| 12-31-15 | 9.20 | 0.22• | (0.44) | (0.22) | 0.05 | — | — | 0.05 | — | 8.93 | (2.47)(b) | 0.86 | 0.86 | 0.86 | 2.38 | 558,519 | 83 | |||||||||||||||||
| 12-31-14 | 9.03 | 0.21• | 0.22 | 0.43 | 0.26 | — | — | 0.26 | — | 9.20 | 4.87 | 0.87 | 0.87 | 0.87 | 2.28 | 168,482 | 88 | |||||||||||||||||
| Class S2 | ||||||||||||||||||||||||||||||||||
| 12-31-18 | 10.95 | 0.23• | (1.20) | (0.97) | 0.43 | 0.01 | — | 0.44 | — | 9.54 | (9.27)(a) | 1.02 | 1.01 | 1.01 | 2.17 | 273 | 147 | |||||||||||||||||
| 12-31-17 | 9.07 | 0.15• | 1.94 | 2.09 | 0.21 | — | — | 0.21 | — | 10.95 | 23.29 | 1.00 | 1.00 | 1.00 | 1.46 | 422 | 60 | |||||||||||||||||
| 12-31-16 | 8.80 | 0.18 | 0.30 | 0.48 | 0.21 | — | — | 0.21 | — | 9.07 | 5.64 | 1.03 | 1.00 | 1.00 | 1.98 | 278 | 101 | |||||||||||||||||
| 03-05-15(5) - 12-31-15 | 9.52 | 0.14• | (0.80) | (0.66) | 0.06 | — | — | 0.06 | — | 8.80 | (7.04)(b) | 1.11 | 1.01 | 1.01 | 1.86 | 288 | 83 | |||||||||||||||||
| (1) | Total return is calculated assuming reinvestment of all dividends, capital gain distributions, and return of capital distributions, if any, at net asset value and does not reflect the effect of insurance contract charges. Total return for periods less than one year is not annualized. |
| (2) | Annualized for periods less than one year. |
| (3) | Ratios reflect operating expenses of the Portfolio. Expenses before reductions/additions do not reflect amounts reimbursed or recouped by the Investment Adviser and/or Distributor or reductions from brokerage service arrangements or other expense offset arrangements and do not represent the amount paid by the Portfolio during periods when reimbursements or reductions occur. Expenses net of fee waivers reflect expenses after reimbursement by the Investment Adviser and/or Distributor or recoupment of previously reimbursed fees by the Investment Adviser, but prior to reductions from brokerage service arrangements or other expense offset arrangements. Expenses net of all reductions/additions represent the net expenses paid by the Portfolio. Net investment income (loss) is net of all such additions or reductions. |
| (4) | Ratios do not include fees and expenses charged under the variable annuity contract or variable life insurance policy. |
| (5) | Commencement of operations. |
| (a) | Excluding amounts related to a transition cost reimbursement recorded in the year ended December 31, 2018, the Portfolio’s total return would have been (9.37)%, (8.96)%, (9.22)%, and (9.38)% for Classes ADV, I, S, and S2, respectively. |
| (b) | Excluding amounts related to a foreign currency settlement recorded in the fiscal year ended December 31, 2015, the Portfolio’s total return would have been (2.96)%, (6.85)%, (2.69)%, and (7.14)% for Class ADV, Class I, Class S, and Class S2, respectively. |
| • | Calculated using average number of shares outstanding throughout the year or period. |
| Name and Address of Shareholder | Percent of Class of Shares and Type of Ownership | Percentage of Fund | Percentage of Combined Fund After the Reorganization* |
| Name and Address of Shareholder | Percent of Class of Shares and Type of Ownership | Percentage of Fund | Percentage of Combined Fund After the Reorganization* |
| * | On a pro forma basis, assuming that the value of the shareholder’s interest in the Portfolio on the date of consummation of the Reorganization is the same as on May 3, 2019. |
PART B
Voya Variable Portfolios, Inc.
Statement of Additional Information
June 7, 2019
Acquisition of the Assets and Liabilities of: VY® Templeton Global Growth Portfolio (A Series of Voya Investors Trust) 7337 East Doubletree Ranch Road, Suite 100 Scottsdale, Arizona 85258-2034 | By and in Exchange for Shares of: Voya Global Equity Portfolio (A Series of Voya Variable Portfolios, Inc.) 7337 East Doubletree Ranch Road, Suite 100 Scottsdale, Arizona 85258-2034 |
This Statement of Additional Information of Voya Global Equity Portfolio (“SAI”) is available to the shareholders of VY® Templeton Global Growth Portfolio (“Templeton Portfolio”), a series of Voya Variable Portfolios, Inc., in connection with a proposed transaction whereby all of the assets and liabilities of Templeton Portfolio will be transferred to Voya Global Equity Portfolio (“Global Equity Portfolio,” together with Templeton Portfolio, the “Portfolios”, and each a “Portfolio”), a series of Voya Variable Portfolios, Inc., in exchange for shares of Templeton Portfolio.
This SAI consists of: (i) this cover page; (ii) the Portfolio Managers’ Report for Voya Global Equity Portfolio; (iii) the accompanying pro forma financial statements; and (iv) the following documents, each of which was filed electronically with the U.S. Securities and Exchange Commission and is incorporated by reference herein:
| 1. | The SAI for Templeton Portfolio, dated May 1, 2019, as filed on [] (File No: 811-05629) and the SAI for Global Equity Portfolio dated May 1, 2019, as filed on [] (File No: 811-07651). |
| 2. | The Financial Statements of Templeton Portfolio included in the Annual Report dated December 31, 2018, as filed on March 11, 2019, and the Financial Statements of Global Equity Portfolio included in the Annual Report dated December 31, 2018, as filed on March 11, 2019. |
This SAI is not a prospectus. A Proxy Statement/Prospectus dated June 7, 2019, relating to the Reorganization of Templeton Portfolio may be obtained, without charge, by writing to Voya Investment Management at 7337 East Doubletree Ranch Road, Suite 100, Scottsdale, Arizona 85258-2034 or calling 1-800-366-0066. This SAI should be read in conjunction with the Proxy Statement/Prospectus.
| 1 |
Voya Global Equity Portfolio
Set forth below is an excerpt from Global Equity Portfolio’s annual report dated December 31, 2018.
Market Perspective: Year Ended December 31, 2018
In our semi-annual report we described the market turmoil in early 2018. Global equities, in the form of the MSCI World IndexSM (the “Index”) measured in local currencies, including net reinvested dividends, suffered its first monthly loss in February after 15 consecutive monthly gains. Another loss followed in March and by the end of June the Index was up a slim 1.29% in 2018. The next four months saw the Index gain 5.6%, led by the U.S., with sentiment resilient in the face of the worries that had set them back. However, in October the clouds gathered again, markets retreated, and after a small reprieve in November, losses accelerated to leave the Index down 7.38% for the fiscal year. (The Index returned -8.71% for the year ended December 31, 2018, measured in U.S. dollars.)
It had been the prospect of an imminent rise in U.S. interest rates that had roiled markets in February. Then, in March, the White House announced tariffs of 25% on imported steel and 10% on aluminum, which would take effect at the beginning of June.
Concerns about a trade war and rising U.S. interest rates continued throughout the period. After months of threats, the trade war risk was ratcheted up on September 17th when the President announced tariffs of 10% on Chinese imports, including day-to-day consumer goods, valued at some $200 billion. The rate would increase to 25% at the beginning of 2019. The next day, China replied with 5% to 10% tariffs of its own on $60 billion of U.S. exports. In early December, after a face-to-face meeting between President Trump and his Chinese counterpart Xi Jinping, new tariffs were postponed for 90 days while the sides, evidently far apart, held negotiations.
Interest rate concerns were rooted in the ever-strengthening labor market. The Federal Open Market Committee (“FOMC”) was already committed to policy “normalization”, i.e. a retreat from historically low short-term rates. There was nothing in successive employment reports likely to divert them. The December report announced an unemployment rate of 3.67%, the lowest since 1969.
The latest wage growth figure of 3.1% year-over-year was the highest since 2009, but it did not seem like an inflationary threat. The measure preferred by the U.S. Federal Reserve Board (“Fed”): core Personal Consumption Expenditures inflation, hovered around the target level of 2.0% without breaking through. But as September ended, the 10-year Treasury yield, unable earlier in 2018 to hold a level above 3%, had done so for nine straight days.
Perhaps it was the speed of rising Treasury yields: 2.88% to 3.23% in 22 days to October 5, which shook investors’ confidence, and Fed Chairman Powell’s remark on October 4 that the federal funds rate was “a long way from neutral”. In December, the FOMC raised rates for the fourth time this year, from 2.25% to 2.50%. Markets had hoped that Powell might then signal a pause, to evaluate further data. Instead, he signaled two more increases in 2019.
As 2018 ended, the 10-year Treasury yield was back down to 2.69%. But it provided little comfort. Commentators increasingly fretted that the best days of global growth and corporate profits were over, and a full-blown trade war would only weaken both. Growth in Europe and China was declining. The price of oil was down about 40% since early October. In the U.S., the boost from tax cuts and increased government spending that had helped propel annualized GDP growth to 4.2% in the second quarter and 3.4% in the third, would fade. The housing market had been weakening for months. For corporations, costs were rising and the strong dollar was depressing overseas earnings. With part of the government shut down through Congressional gridlock, the White House, within a final barrage of tweets, declared, “The only problem our economy has is the Fed.” Happy New Year.
In U.S. fixed income markets, the Treasury yield curve rose and flattened over the fiscal year. The Bloomberg Barclays U.S. Aggregate Bond Index (“Barclays Aggregate”) gained just 0.01%; the Bloomberg Barclays U.S. Corporate Investment Grade Bond sub-index lost 2.51%, amid heavy issuance of BBB paper, while the Bloomberg Barclays High Yield Bond — 2% Issuer Constrained Composite Index (not a part of the Barclays Aggregate) fell 2.08%. The Bloomberg Barclays Short Treasury Index was among the best performers, gaining 1.88%.
U.S. equities, represented by the S&P 500® Index including dividends, fell 4.38% after the worst December since 1931. The earnings per share of constituent companies grew by about 25% year-over-year in the first three quarters of 2018, the most since 2010, but estimates for 2019 were sharply lower. Health care was the top performer, up 6.47%. Energy was the weakest sector, down 18.10%, as oil prices tumbled.
In currencies, the dollar rose 5.47% against the euro and 5.52% against the pound but lost 2.67% against the yen. From mid-April, after sustained weakness, the dollar powered ahead, as strong U.S. economic data increasingly left the rest of the world behind, only to drift lower in the fraught final days.
| 2 |
International markets were also shaken by the concerns described above. MSCI Japan® Index slumped 15.15% for the year. This market is sensitive to slowing global growth, particularly in China and its own vulnerability to a trade war. MSCI Europe ex UK® Index dropped 11.31%. To add to the dampening effects of faltering economic indicators and threats to global trade, the election of a high-spending populist government in Italy posed a new challenge to the euro itself. MSCI UK® Index fell 8.82%. Pessimism about an increasingly likely no-deal Brexit and global growth hit financials, while weakness in one heavily-weighted consumer staples constituent contributed about 30% of the over- all loss.
All indices are unmanaged and investors cannot invest directly in an index. Past
performance does not guarantee future results. The performance quoted
represents past performance.
Investment return and principal value of an investment will fluctuate, and shares, when redeemed, may be worth more or less than their original cost. Each Portfolio’s performance is subject to change since the period’s end and may be lower or higher than the performance data shown. Please call (800) 992-0180 or log on to www.voyainvestments.com to obtain performance data current to the most recent month end.
Market Perspective reflects the views of Voya Investment Management’s Chief Investment Risk Officer only through the end of the period, and is subject to change based on market and other conditions.
Benchmark Descriptions
| Index | Description |
| Bloomberg Barclays High Yield Bond — 2% Issuer Constrained Composite Index | An index that includes all fixed-income securities having a maximum quality rating of Ba1, a minimum amount outstanding of $150 million, and at least one year to maturity. |
| Bloomberg Barclays U.S. Aggregate Bond Index | An index of publicly issued investment grade U.S. government, mortgage-backed, asset-backed and corporate debt securities. |
| Bloomberg Barclays U.S. Corporate Investment Grade Bond Index | An index consisting of publicly issued, fixed rate, nonconvertible, investment grade debt securities. |
| Bloomberg Barclays Short Treasury Index | The index measures the performance of U.S. Treasury securities that have a remaining maturity between one and twelve months. |
| iMoneyNet Government Institutional Index | The average return for a category of money market funds that includes all government institutional funds: Treasury Institutional, Treasury and Repo Institutional and Government and Agencies Institutional. |
| MSCI All Country World IndexSM | A free-float adjusted market capitalization index that is designed to measure equity performance in the global developed and emerging markets. |
| MSCI Europe, Australasia and Far East® (“MSCI EAFE”) Index | An index that measures the performance of securities listed on exchanges in Europe, Australasia and the Far East. It includes the reinvestment of dividends net of withholding taxes, but does not reflect fees, brokerage commissions or other expenses of investing. |
| MSCI Europe ex UK® Index | A free float-adjusted market capitalization index that is designed to measure developed market equity performance in Europe, excluding the UK. |
| MSCI Japan® Index | A free float-adjusted market capitalization index that is designed to measure developed market equity performance in Japan. |
| MSCI UK® Index | A free float-adjusted market capitalization index that is designed to measure developed market equity performance in the UK. |
| MSCI World IndexSM | An index that measures the performance of over 1,600 securities listed on exchanges in the U.S., Europe, Canada, Australia, New Zealand and the Far East. |
| Russell 2000® Index | An index that measures the performance of securities of small U.S. companies. |
| Russell 3000® Index | An index that measures the performance of the largest 3000 U.S. companies representing approximately 98% of the investable U.S. equity market. |
| S&P 500® Index | An index that measures the performance of securities of approximately 500 large-capitalization companies whose securities are traded on major U.S. stock markets. |
| S&P Target Risk® Growth Index | Seeks to measure the performance of an asset allocation strategy targeted to a growth focused risk profile. |
| 3 |
| * | The S&P 500® Index is a product of S&P Dow Jones Indices LLC, a division of S&P Global, or its affiliates (“SPDJI”), and has been licensed for use by Voya Financial. Standard & Poor’s® and S&P® are registered trademarks of Standard & Poor’s Financial Services LLC, a division of S&P Global (“S&P”); Dow Jones® is a registered trademark of Dow Jones Trademark Holdings LLC (“Dow Jones”). Voya Financial Product(s) is/are not sponsored, endorsed, sold or promoted by SPDJI, Dow Jones, S&P or their respective affiliates, and none of such parties make any representation regarding the advisability of investing in such product(s) nor do they have any liability for any errors, omissions, or interruptions of the S&P 500® Index. |
Portfolio Manager’s Report
Voya Global Equity Portfolio* (the “Portfolio”) seeks long-term capital growth and current income. The Portfolio is managed by Steve Wetter, Kai Yee Wong, and Vincent Costa, CFA, Portfolio Managers** of Voya Investment Management Co. LLC — the Sub-Adviser.
Performance: For the year ended December 31, 2018, the Portfolio’s Class S shares provided a total return of -9.11% compared to the MSCI World IndexSM (“MSCI World”) and the MSCI All Country World IndexSM***, which returned -8.71% and -9.42% respectively, for the same period.
Portfolio Specifics****: For year ended December 31, 2018, the Portfolio outperformed its benchmark, the MSCI World IndexSM, before deducting fees and operating expenses, but lagged net of those costs.
December 31, 2017 – April 30, 2018: Prior to the investment strategy change, the Portfolio underperformed the MSCI World IndexSM. The Portfolio underperformed due to unfavorable stock selection and sector allocation. Stock selection in information technology, industrials and consumer staples detracted. By contrast, consumer discretionary had the largest positive impact on performance.
May 1, 2018 – December 31, 2018: In terms of the Portfolio’s outperformance since the change of its principal investment strategy on May 1, 2018, low beta was a significant tailwind, dividend yield outperformed and the stock ranking model underperformed. Additionally, the Portfolio’s exposures to stock-specific risk negatively affected relative performance. On the regional level, stock selection was strongest within North America and weakest within Europe. On the sector level, portfolio holdings within the utilities and financials sectors had the largest positive impact on performance. At the individual stock level, overweight positions in Eli Lilly and Company, AES Corporation and Pfizer Inc. were among the key contributors for the period. By contrast, stock selection within the consumer staples and information technology sectors had the largest negative impact on returns. Key detractors for the period include overweight positions in Royal Mail plc and Convestro AG, and an underweight position in Microsoft Corporation.
Current Strategy and Outlook: This is an actively managed, quantitative global equity strategy designed to generate higher dividend income and total returns, with lower volatility and better downside capture, than the MSCI World. The investment process first seeks to create a universe of sustainable dividend-paying stocks and utilizes fundamentally driven sector-specific alpha models to identify the most attractive stocks within each region-sector. The managers then seek to optimize the Portfolio’s potential to achieve its dividend, alpha and volatility objectives.
* On March 15, 2018, the Portfolio’s Board of Directors approved changes with respect to the Portfolio’s principal investment strategies, primary benchmark and portfolio managers.
** Effective May 1, 2018, Martin Jansen, Christopher F. Corapi, and Maya Venkatraman were removed as portfolio managers of the Portfolio and Steve Wetter and Kai Yee Wong were added as portfolio managers of the Portfolio. Effective June 30, 2018, James Ying was removed as a portfolio manager of the Portfolio.
*** Effective May 1, 2018, the Fund changed its primary benchmark from the MSCI All Country World IndexSM to the MSCI World IndexSM because the MSCI World IndexSM is considered by the Sub-Adviser to be a more appropriate benchmark reflecting the types of securities in which the Portfolio now invests.
**** Beginning April 16, 2018 through the close of business on April 27, 2018, the Portfolio was in a transition period and may have held a large portion of the Portfolio’s assets in temporary investments.
Portfolio holdings and characteristics are subject to change and may not be representative of current holdings and characteristics. Portfolio holdings are subject to change daily. The outlook for this Portfolio may differ from that presented for other Voya mutual funds. The Portfolio’s performance returns shown reflect applicable fee waivers and/or expense limits in effect during this period. Absent such fee waivers/expense limitations, if any, performance would have been lower. Performance for the different classes of shares will vary based on differences in fees with each class.
| 4 |
| Geographic Diversification as of December 31, 2018 | |||
| (as a percentage of net assets) | |||
| United States | 58.5% | ||
| Japan | 9.4% | ||
| United Kingdom | 5.5% | ||
| Canada | 3.7% | ||
| Netherlands | 3.5% | ||
| France | 3.4% | ||
| Switzerland | 2.6% | ||
| Germany | 2.0% | ||
| Australia | 1.7% | ||
| Hong Kong | 1.5% | ||
| Countries between 0.2%-1.1%^ | 6.3% | ||
| Assets in Excess of Other Liabilities* | 1.9% | ||
| Net Assets | 100.0% | ||
| * Includes short-term investments. | |||
| ^ Includes 11 countries, which each represents 0.2%-1.1% of net assets. | |||
| Portfolio holdings are subject to change daily. | |||
| Top Ten Holdings as of December 31, 2018 | |||
| (as a percentage of net assets) | |||
| Apple, Inc. | 1.7% | ||
| Johnson & Johnson | 1.5% | ||
| Pfizer, Inc. | 1.3% | ||
| Royal Dutch Shell PLC - Class A | 1.2% | ||
| Intel Corp. | 1.1% | ||
| Bank of America Corp. | 1.1% | ||
| Cisco Systems, Inc. | 1.1% | ||
| Roche Holding AG | 1.1% | ||
| Chevron Corp. | 1.0% | ||
| AbbVie, Inc. | 1.0% | ||
| Portfolio holdings are subject to change daily. | |||
| 5 |
PRO FORMA FINANCIAL STATEMENTS
In connection with a proposed transaction whereby all of the assets and liabilities of Templeton Portfolio will be transferred to Global Equity Portfolio, in exchange for shares of Global Equity Portfolio, shown below are financial statements for each Portfolio and Pro Forma Financial Statements for the combined Portfolio, assuming the Reorganization is consummated, as of December 31, 2018. The first table presents Statements of Assets and Liabilities for each Portfolio and estimated pro forma figures for the combined Portfolio. The second table presents Statements of Operations for each Portfolio and estimated pro forma figures for the combined Portfolio. The third table presents Portfolio of Investments for each Portfolio and estimated pro forma figures for the combined Portfolio. The tables are followed by the Notes to the Pro Forma Financial Statements.
| 6 |
STATEMENTS OF ASSETS AND LIABILITIES as of December 31, 2018 (unaudited)
| Voya Global Equity | ||||||||||||||||
| VY® Templeton Global | Voya Global Equity | Pro Forma | Portfolio Pro Forma | |||||||||||||
| Growth Portfolio | Portfolio | Adjustments | Combined | |||||||||||||
| ASSETS: | ||||||||||||||||
| Investments in securities at value +* | $ | 130,286,875 | $ | 549,612,967 | $ | 679,899,842 | ||||||||||
| Short-term investments at value** | 2,838,740 | 10,232,651 | 13,071,391 | |||||||||||||
| Foreign currencies at value*** | 25 | 2,250 | 2,275 | |||||||||||||
| Cash | - | 273,096 | 273,096 | |||||||||||||
| Receivables: | ||||||||||||||||
| Investment securities sold | 61,132 | 82,397 | 143,529 | |||||||||||||
| Fund shares sold | 1,301,768 | 2,103,727 | 3,405,495 | |||||||||||||
| Dividends | 245,954 | 1,534,539 | 1,780,493 | |||||||||||||
| Interest | 238,534 | - | 238,534 | |||||||||||||
| Foreign tax reclaims | - | 1,358,413 | 1,358,413 | |||||||||||||
| Prepaid expenses | - | 3,271 | 3,271 | |||||||||||||
| Reimbursement due from manager | 12,628 | 6,615 | 115,500 | (B) | 134,743 | |||||||||||
| Other assets | 15,122 | 48,077 | 63,199 | |||||||||||||
| Total assets | 135,000,778 | 565,258,003 | 115,500 | 700,374,281 | ||||||||||||
| LIABILITIES: | ||||||||||||||||
| Payable for investment securities purchased | 34,486 | 82,496 | 116,982 | |||||||||||||
| Payable for fund shares redeemed | - | 33,815 | 33,815 | |||||||||||||
| Payable upon receipt of securities loaned | 2,248,904 | 9,339,651 | 11,588,555 | |||||||||||||
| Payable for unified fees | 112,100 | - | (112,100 | )(A) | - | |||||||||||
| Payable for investment management fees | - | 268,231 | 112,100 | (A) | 380,331 | |||||||||||
| Payable for distribution and shareholder service fees | 29,207 | 104,863 | 134,070 | |||||||||||||
| Payable to directors/trustees under the deferred compensation plan (Note X) | 15,122 | 48,077 | 63,199 | |||||||||||||
| Payable for directors fees | - | 3,256 | 3,256 | |||||||||||||
| Other accrued expenses and liabilities | - | 207,473 | 250,500 | (B) | 457,973 | |||||||||||
| Total liabilities | 2,439,819 | 10,087,862 | 250,500 | 12,778,181 | ||||||||||||
| NET ASSETS | $ | 132,560,959 | $ | 555,170,141 | $ | (135,000 | ) | $ | 687,596,100 | |||||||
| NET ASSETS WERE COMPRISED OF: | ||||||||||||||||
| Paid-in capital | $ | 130,624,735 | $ | 578,092,980 | $ | 708,717,715 | ||||||||||
| Total distributable earnings (loss) | 1,936,224 | (22,922,839 | ) | (135,000 | )(B) | (21,121,615 | ) | |||||||||
| NET ASSETS | $ | 132,560,959 | $ | 555,170,141 | $ | (135,000 | ) | $ | 687,596,100 | |||||||
| + Including securities loaned at value | $ | 2,146,920 | $ | 8,876,184 | $ | 11,023,104 | ||||||||||
| * Cost of investments in securities | $ | 147,191,178 | $ | 600,932,815 | $ | 748,123,993 | ||||||||||
| ** Cost of short-term investments | $ | 2,838,716 | $ | 10,232,651 | $ | 13,071,367 | ||||||||||
| *** Cost of foreign currencies | $ | 25 | $ | 2,285 | $ | 2,310 | ||||||||||
| Class ADV: | ||||||||||||||||
| Net Assets | $ | 6,309 | $ | 15,225,167 | $ | (6.00 | ) | $ | 15,231,470 | |||||||
| Shares authorized | unlimited | 100,000,000 | 100,000,000 | |||||||||||||
| Par value | $ | 0.001 | $ | 0.001 | $ | 0.001 | ||||||||||
| Shares outstanding | 764 | 1,580,986 | (109 | )(C) | 1,581,641 | |||||||||||
| Net asset value and redemption price per share | $ | 8.26 | $ | 9.63 | $ | 9.63 | ||||||||||
| Class I: | ||||||||||||||||
| Net Assets | $ | 519,900 | $ | 132,479,869 | $ | (529.00 | ) | $ | 132,999,240 | |||||||
| Shares authorized | unlimited | 100,000,000 | 100,000,000 | |||||||||||||
| Par value | $ | 0.001 | $ | 0.001 | $ | 0.001 | ||||||||||
| Shares outstanding | 60,493 | 13,768,494 | (6,504 | )(C) | 13,822,483 | |||||||||||
| Net asset value and redemption price per share | $ | 8.59 | $ | 9.62 | $ | 9.62 | ||||||||||
| Class S: | ||||||||||||||||
| Net Assets | $ | 129, 827,833 | $ | 375,359,003 | $ | (132,217.00 | ) | $ | 505,054,619 | |||||||
| Shares authorized | unlimited | 300,000,000 | unlimited | |||||||||||||
| Par value | $ | 0.001 | $ | 0.001 | $ | 0.001 | ||||||||||
| Shares outstanding | 14,956,087 | 38,848,979 | (1,530,040 | )(C) | 52,275,026 | |||||||||||
| Net asset value and redemption price per share | $ | 8.68 | $ | 9.66 | $ | 9.66 | ||||||||||
| Class S2: | ||||||||||||||||
| Net assets | $ | 2,206,917 | $ | 272,728 | $ | (2,248.00 | ) | $ | 2,477,397 | |||||||
| Shares authorized | unlimited | 100,000,000 | unlimited | |||||||||||||
| Par value | $ | 0.001 | $ | 0.001 | $ | 0.001 | ||||||||||
| Shares outstanding | 257,069 | 28,574 | (25,972 | )(C) | 259,671 | |||||||||||
| Net asset value and redemption price per share | $ | 8.58 | $ | 9.54 | $ | 9.54 | ||||||||||
| Class T: | ||||||||||||||||
| Net assets | n/a | $ | 31,833,374 | $ | 31,833,374 | |||||||||||
| Shares authorized | n/a | 100,000,000 | unlimited | |||||||||||||
| Par value | n/a | $ | 0.001 | $ | 0.001 | |||||||||||
| Shares outstanding | n/a | 3,318,015 | 3,318,015 | |||||||||||||
| Net asset value and redemption price per share | n/a | $ | 9.59 | $ | 9.59 | |||||||||||
| (A) | Reflects adjustments related to portfolio transitioning |
| (B) | Reflects adjustment for estimated one time merger expenses and transition costs (See Note X in Notes to Unaudited Pro Forma Financial Statements). |
| (C) | Reflects new shares issued, net of retired shares of Voya Global Equity Portfolio. (Calculation: Net Assets ÷ NAV per share) |
See accompanying Notes to Pro Forma Financial Statements (Unaudited)
| 7 |
STATEMENTS OF OPERATIONS for the year ended December 31, 2018 (Unaudited)
| VY® Templeton | Voya Global Equity | |||||||||||||||
| Global Growth | Voya Global | Pro Forma | Portfolio Pro Forma | |||||||||||||
| Portfolio | Equity Portfolio | Adjustments | Combined | |||||||||||||
| INVESTMENT INCOME: | ||||||||||||||||
| Dividends, net of foreign taxes withheld* | $ | 4,274,378 | $ | 20,897,253 | $ | - | $ | 25,171,631 | ||||||||
| Interest, net of foreign taxes withheld* | 121,516 | 5,649 | - | 127,165 | ||||||||||||
| Securities lending income, net | 61,380 | 120,718 | - | 182,098 | ||||||||||||
| Other | 1,158 | 37,381 | - | 38,539 | ||||||||||||
| Total investment income | 4,458,432 | 21,061,001 | - | 25,519,433 | ||||||||||||
| EXPENSES: | ||||||||||||||||
| Investment management fees | - | 3,601,340 | 711,275 | (A) | 4,312,615 | |||||||||||
| Unified fees | 1,590,773 | - | (1,590,773 | )(A) | - | |||||||||||
| Distribution and shareholder service fees: | ||||||||||||||||
| Class ADV | 43 | 90,890 | - | 90,933 | ||||||||||||
| Class S | 402,253 | 1,106,699 | (1,463,489 | )(A) | 45,463 | |||||||||||
| Class S2 | 10,739 | 1,361 | 0 | (A) | 12,100 | |||||||||||
| Transfer agent fees | - | 1,400 | 277 | (A) | 1,677 | |||||||||||
| Shareholder reporting expense | - | 59,904 | 11,831 | (A) | 71,735 | |||||||||||
| Professional fees | - | 55,240 | 10,910 | (A) | 66,150 | |||||||||||
| Custody and accounting expense | - | 183,424 | 36,227 | (A) | 219,651 | |||||||||||
| Directors/Trustee fees and expenses | 9,718 | 26,048 | 42,215 | (A) | 77,981 | |||||||||||
| Miscellaneous expense | - | 37,138 | 7,335 | (A) | 44,473 | |||||||||||
| Interest expense | - | 2,997 | 592 | (A) | 3,589 | |||||||||||
| Merger and transition expenses | - | 62,000 | 250,500 | (B) | 312,500 | |||||||||||
| Total expenses | 2,013,526 | 5,506,633 | (2,233,601 | ) | 5,224,558 | |||||||||||
| Net waived and reimbursed fees | (221,468 | ) | (139,305 | ) | 271,936 | (A) | (88,837 | ) | ||||||||
| Brokerage commission recapture | (747 | ) | - | 747 | (B) | - | ||||||||||
| Net expenses | 1,791,311 | 5,367,328 | (1,960,918 | ) | 5,135,721 | |||||||||||
| Net investment income | 2,667,121 | 15,693,673 | 1,960,918 | 20,383,712 | ||||||||||||
| REALIZED AND UNREALIZED GAIN (LOSS): | ||||||||||||||||
| Net realized gain (loss) on: | ||||||||||||||||
| Investments | 17,266,496 | 97,493,352 | - | 114,759,848 | ||||||||||||
| Forward foreign currency transactions | 34,087 | - | - | 34,087 | ||||||||||||
| Foreign currency related transactions | (61,980 | ) | (61,052 | ) | - | (123,032 | ) | |||||||||
| Futures | - | 1,119,873 | - | 1,119,873 | ||||||||||||
| Net realized gain | 17,238,603 | 98,552,173 | - | 115,790,776 | ||||||||||||
| Net change in unrealized appreciation or depreciation on: | ||||||||||||||||
| Investments | (42,562,880 | ) | (168,199,118 | ) | - | (210,761,998 | ) | |||||||||
| Foreign currency related transactions | 5,916 | (54,155 | ) | (48,239 | ) | |||||||||||
| Futures | - | (1,063,402 | ) | - | (1,063,402 | ) | ||||||||||
| Net change in unrealized appreciation or depreciation | (42,556,964 | ) | (169,316,675 | ) | - | (211,873,639 | ) | |||||||||
| Net realized and unrealized gain | (25,318,361 | ) | (70,764,502 | ) | - | (96,082,863 | ) | |||||||||
| Decrease in net assets resulting from operations | $ | (22,651,240 | ) | $ | (55,070,829 | ) | $ | 1,960,918 | $ | (75,699,151 | ) | |||||
| * Foreign taxes withheld | $ | 436,922 | $ | 1,209,677 | $ | - | $ | 1,646,599 | ||||||||
| (A) | Reflects adjustment in expenses due to effects of new contractual rates. |
| (B) | Reflects adjustments related to portfolio transitioning |
See accompanying Notes to Pro Forma Financial Statements (Unaudited)
| 8 |
PORTFOLIO OF INVESTMENTS
as of December 31, 2018 (Unaudited)
| VY® Templeton Global | Voya Global Equity | VY® Templeton Global | Voya Global | Pro-forma | ||||||||||||||||||||||||||||||
| Growth Portfolio | Portfolio | Pro-forma | Growth Portfolio | Equity Portfolio | adjustments | Pro-forma | ||||||||||||||||||||||||||||
| Shares | Shares | Shares | Value | Value | Value | Value | ||||||||||||||||||||||||||||
| COMMON STOCK: 98.2% | ||||||||||||||||||||||||||||||||||
| Australia: | 0.4 | % | ||||||||||||||||||||||||||||||||
| - | 237,870 | 237,870 | AGL Energy Ltd. | - | 3,454,398 | - | 3,454,398 | |||||||||||||||||||||||||||
| - | 699,105 | 699,105 | Aurizon Holdings Ltd. | - | 2,109,199 | - | 2,109,199 | |||||||||||||||||||||||||||
| - | 94,917 | 94,917 | Computershare Ltd. | - | 1,150,324 | - | 1,150,324 | |||||||||||||||||||||||||||
| - | 101,668 | 101,668 | Newcrest Mining Ltd. | - | 1,562,542 | - | 1,562,542 | |||||||||||||||||||||||||||
| - | 83,607 | 83,607 | Sonic Healthcare Ltd. | - | 1,304,278 | - | 1,304,278 | |||||||||||||||||||||||||||
| - | 9,580,741 | - | 2,866,820 | |||||||||||||||||||||||||||||||
| Belgium: | 0.5 | % | ||||||||||||||||||||||||||||||||
| - | 44,075 | 44,075 | UCB S.A. | - | 3,599,900 | - | 3,599,900 | |||||||||||||||||||||||||||
| - | 6,527,766 | - | 3,599,900 | |||||||||||||||||||||||||||||||
| Canada: | 3.5 | % | ||||||||||||||||||||||||||||||||
| - | 46,170 | 46,170 | Bank of Montreal | - | 3,016,336 | - | 3,016,336 | |||||||||||||||||||||||||||
| - | 56,076 | 56,076 | Bank of Nova Scotia | - | 2,795,174 | - | 2,795,174 | |||||||||||||||||||||||||||
| - | 62,096 | 62,096 | BCE, Inc. | - | 2,453,001 | - | 2,453,001 | |||||||||||||||||||||||||||
| 50,350 | - | 50,350 | (1) | Barrick Gold Corp. | 681,739 | - | - | 681,739 | ||||||||||||||||||||||||||
| - | 45,516 | 45,516 | (1) | Canadian Imperial Bank of Commerce - XTSE | - | 3,390,028 | - | 3,390,028 | ||||||||||||||||||||||||||
| - | 98,321 | 98,321 | CI Financial Corp. | - | 1,244,497 | - | 1,244,497 | |||||||||||||||||||||||||||
| - | 94,322 | 94,322 | Empire Co. Ltd. | - | 1,991,872 | - | 1,991,872 | |||||||||||||||||||||||||||
| - | 66,825 | 66,825 | Great-West Lifeco, Inc. | - | 1,379,379 | - | 1,379,379 | |||||||||||||||||||||||||||
| 99,100 | - | 99,100 | Husky Energy, Inc. | 1,024,246 | - | - | 1,024,246 | |||||||||||||||||||||||||||
| - | 26,284 | 26,284 | Industrial Alliance Insurance & Financial Services, Inc. | - | 838,847 | - | 838,847 | |||||||||||||||||||||||||||
| - | 68,786 | 68,786 | (1), # | National Bank Of Canada | - | 2,824,096 | - | 2,824,096 | ||||||||||||||||||||||||||
| - | 20,467 | 20,467 | TELUS Corp. | - | 678,385 | - | 678,385 | |||||||||||||||||||||||||||
| 95,893 | - | 95,893 | Wheaton Precious Metals Corp. | 1,871,923 | - | - | 1,871,922 | |||||||||||||||||||||||||||
| 3,577,908 | 20,611,615 | - | 24,189,522 | |||||||||||||||||||||||||||||||
| China: | 1.7 | % | ||||||||||||||||||||||||||||||||
| 10,340 | - | 10,340 | (2) | Baidu, Inc. | 1,639,924 | - | - | 1,639,924 | ||||||||||||||||||||||||||
| - | 703,500 | 703,500 | BOC Hong Kong Holdings Ltd. | - | 2,611,200 | - | 2,611,200 | |||||||||||||||||||||||||||
| 973,000 | - | 973,000 | China Life Insurance Co., Ltd. - H Shares | 2,057,647 | - | - | 2,057,646 | |||||||||||||||||||||||||||
| 184,000 | - | 184,000 | China Mobile Ltd. | 1,780,494 | - | - | 1,780,494 | |||||||||||||||||||||||||||
| 11,144 | - | 11,144 | China Telecom Corp., Ltd. | 565,335 | - | - | 565,335 | |||||||||||||||||||||||||||
| 2,726,000 | - | 2,726,000 | China Telecom Corp., Ltd. - H Shares | 1,396,712 | - | - | 1,396,712 | |||||||||||||||||||||||||||
| 1,368,100 | - | 1,368,100 | Kunlun Energy Co. Ltd. | 1,453,586 | - | - | 1,453,586 | |||||||||||||||||||||||||||
| 8,893,698 | 3,425,964 | - | 11,504,897 | |||||||||||||||||||||||||||||||
| Denmark: | 1.1 | % | ||||||||||||||||||||||||||||||||
| 1,123 | - | 1,123 | AP Moller - Maersk A/S - Class B | 1,412,658 | - | - | 1,412,658 | |||||||||||||||||||||||||||
| - | 86,068 | 86,068 | Novo Nordisk A/S | - | 3,952,852 | - | 3,952,852 | |||||||||||||||||||||||||||
| 25,642 | - | 25,642 | Vestas Wind Systems A/S | 1,941,065 | - | - | 1,941,065 | |||||||||||||||||||||||||||
| 3,353,723 | 4,275,365 | - | 7,306,575 | |||||||||||||||||||||||||||||||
| Finland: | 0.9 | % | ||||||||||||||||||||||||||||||||
| - | 33,378 | 33,378 | Nokian Renkaat OYJ | - | 1,025,163 | - | 1,025,163 | |||||||||||||||||||||||||||
| - | 43,256 | 43,256 | Orion Oyj | - | 1,504,832 | - | 1,504,832 | |||||||||||||||||||||||||||
| - | 77,437 | 77,437 | Sampo OYJ | - | 3,431,985 | - | 3,431,985 | |||||||||||||||||||||||||||
| - | 5,961,980 | - | 5,961,980 | |||||||||||||||||||||||||||||||
| France: | 4.1 | % | ||||||||||||||||||||||||||||||||
| - | 10,584 | 10,584 | Arkema SA | - | 908,618 | - | 908,618 | |||||||||||||||||||||||||||
| 63,537 | 171,656 | 235,193 | AXA S.A. | 1,371,251 | 3,704,668 | - | 5,075,919 | |||||||||||||||||||||||||||
| 41,078 | - | 41,078 | BNP Paribas | 1,855,115 | - | - | 1,855,115 | |||||||||||||||||||||||||||
| - | 74,787 | 74,787 | Bouygues SA | - | 2,685,516 | - | 2,685,516 | |||||||||||||||||||||||||||
| - | 20,500 | 20,500 | Cie Generale des Etablissements Michelin SCA | - | 2,017,755 | - | 2,017,755 | |||||||||||||||||||||||||||
| 24,898 | - | 24,898 | Cie de Saint-Gobain | 826,527 | - | - | 826,527 | |||||||||||||||||||||||||||
| 124,193 | 143,096 | 267,289 | Credit Agricole SA | 1,336,620 | 1,540,062 | - | 2,876,682 | |||||||||||||||||||||||||||
| - | 79,234 | 79,234 | Edenred | - | 2,918,108 | - | 2,918,108 | |||||||||||||||||||||||||||
| - | 204,340 | 204,340 | Orange SA | - | 3,311,491 | - | 3,311,491 | |||||||||||||||||||||||||||
| 9 |
| 29,360 | - | 29,360 | Sanofi | 2,546,980 | - | - | 2,546,980 | |||||||||||||||||||||||||||
| - | 63,570 | 63,570 | Societe Generale | - | 2,015,460 | - | 2,015,460 | |||||||||||||||||||||||||||
| 110,391 | - | 110,391 | Veolia Environnement | 2,260,723 | - | - | 2,260,723 | |||||||||||||||||||||||||||
| 10,197,216 | 19,101,678 | - | 28,390,276 | |||||||||||||||||||||||||||||||
| Germany: | 2.8 | % | ||||||||||||||||||||||||||||||||
| - | 5,750 | 5,750 | Allianz SE | - | 1,155,494 | - | 1,155,494 | |||||||||||||||||||||||||||
| 30,327 | - | 30,327 | Bayer AG | 2,109,208 | - | - | 2,109,208 | |||||||||||||||||||||||||||
| - | 40,184 | 40,184 | Covestro AG | - | 1,990,094 | - | 1,990,094 | |||||||||||||||||||||||||||
| - | 51,093 | 51,093 | Deutsche Lufthansa AG | - | 1,153,863 | - | 1,153,863 | |||||||||||||||||||||||||||
| - | 93,651 | 93,651 | Deutsche Post AG | - | 2,557,538 | - | 2,557,538 | |||||||||||||||||||||||||||
| 154,231 | - | 154,231 | E.ON AG | 1,522,466 | - | - | 1,522,466 | |||||||||||||||||||||||||||
| - | 89,894 | 89,894 | Evonik Industries AG | - | 2,243,862 | - | 2,243,862 | |||||||||||||||||||||||||||
| 21,590 | - | 21,590 | Merck KGaA | 2,222,317 | - | - | 2,222,317 | |||||||||||||||||||||||||||
| 19,972 | - | 19,972 | Siemens AG | 2,228,909 | - | - | 2,228,909 | |||||||||||||||||||||||||||
| - | 155,754 | 155,754 | TUI AG | - | 2,238,611 | - | 2,238,611 | |||||||||||||||||||||||||||
| 8,082,900 | 11,339,462 | - | 19,422,362 | |||||||||||||||||||||||||||||||
| Hong Kong: | 1.5 | % | ||||||||||||||||||||||||||||||||
| 186,000 | 145,500 | 331,500 | CK Hutchison Holdings Ltd. | 1,785,268 | 1,396,540 | - | 3,181,807 | |||||||||||||||||||||||||||
| - | 253,000 | 253,000 | CLP Holdings Ltd. | - | 2,859,127 | - | 2,859,127 | |||||||||||||||||||||||||||
| - | 1,429,000 | 1,429,000 | HKT Trust / HKT Ltd. | - | 2,058,518 | - | 2,058,518 | |||||||||||||||||||||||||||
| - | 655,000 | 655,000 | NWS Holdings Ltd. | - | 1,344,958 | - | 1,344,958 | |||||||||||||||||||||||||||
| - | 1,369,000 | 1,369,000 | PCCW Ltd. | - | 788,299 | - | 788,299 | |||||||||||||||||||||||||||
| 290,200 | - | 290,200 | Value Partners Group Ltd. | 201,501 | - | - | 201,501 | |||||||||||||||||||||||||||
| 1,986,769 | 8,447,442 | - | 10,434,210 | |||||||||||||||||||||||||||||||
| Indonesia: | 0.1 | % | ||||||||||||||||||||||||||||||||
| 1,312,500 | - | 1,312,500 | Matahari Department Store Tbk PT | 510,842 | - | - | 510,842 | |||||||||||||||||||||||||||
| 510,842 | - | - | 510,842 | |||||||||||||||||||||||||||||||
| Ireland: | 0.1 | % | ||||||||||||||||||||||||||||||||
| 104,786 | - | 104,786 | Bank of Ireland Group PLC | 582,792 | - | - | 582,792 | |||||||||||||||||||||||||||
| 582,792 | - | - | 582,792 | |||||||||||||||||||||||||||||||
| Israel: | 0.6 | % | ||||||||||||||||||||||||||||||||
| - | 301,795 | 301,795 | Bank Leumi Le-Israel BM | - | 1,824,355 | - | 1,824,355 | |||||||||||||||||||||||||||
| 134,401 | - | 134,401 | Teva Pharmaceutical Industries Ltd. ADR | 2,072,463 | - | - | 2,072,463 | |||||||||||||||||||||||||||
| 2,072,463 | 1,824,355 | - | 3,896,818 | |||||||||||||||||||||||||||||||
| Italy: | 0.4 | % | ||||||||||||||||||||||||||||||||
| 190,871 | - | 190,871 | ENI S.p.A. | 3,015,231 | - | - | 3,015,231 | |||||||||||||||||||||||||||
| 3,015,231 | - | - | 3,015,231 | |||||||||||||||||||||||||||||||
| Japan: | 8.9 | % | ||||||||||||||||||||||||||||||||
| - | 250,800 | 250,800 | Astellas Pharma, Inc. | - | 3,204,379 | - | 3,204,379 | |||||||||||||||||||||||||||
| - | 93,200 | 93,200 | Canon, Inc. | - | 2,564,463 | - | 2,564,463 | |||||||||||||||||||||||||||
| - | 13,000 | 13,000 | Central Japan Railway Co. | - | 2,742,836 | - | 2,742,836 | |||||||||||||||||||||||||||
| - | 74,500 | 74,500 | Fuji Film Holdings Corp. | - | 2,887,957 | - | 2,887,957 | |||||||||||||||||||||||||||
| - | 99,300 | 99,300 | Japan Airlines Co. Ltd. | - | 3,519,299 | - | 3,519,299 | |||||||||||||||||||||||||||
| - | 99,500 | 99,500 | Japan Tobacco, Inc. | - | 2,364,229 | - | 2,364,229 | |||||||||||||||||||||||||||
| - | 54,500 | 54,500 | Kamigumi Co., Ltd. | - | 1,115,002 | - | 1,115,002 | |||||||||||||||||||||||||||
| - | 81,800 | 81,800 | Kyushu Railway Co. | - | 2,767,521 | - | 2,767,521 | |||||||||||||||||||||||||||
| - | 29,900 | 29,900 | Medipal Holdings Corp. | - | 639,686 | - | 639,686 | |||||||||||||||||||||||||||
| - | 21,300 | 21,300 | MEIJI Holdings Co., Ltd. | - | 1,735,896 | - | 1,735,896 | |||||||||||||||||||||||||||
| - | 20,600 | 20,600 | Mitsubishi Corp. | - | 564,781 | - | 564,781 | |||||||||||||||||||||||||||
| - | 230,400 | 230,400 | Mitsui & Co., Ltd. | - | 3,539,707 | - | 3,539,707 | |||||||||||||||||||||||||||
| 68,100 | - | 68,100 | Mitsui Fudosan Co., Ltd. | 1,512,631 | - | - | 1,512,631 | |||||||||||||||||||||||||||
| - | 50,600 | 50,600 | Nippon Telegraph &Telephone Corp. | - | 2,064,446 | - | 2,064,446 | |||||||||||||||||||||||||||
| - | 26,800 | 26,800 | Nomura Research Institute Ltd. | - | 993,815 | - | 993,815 | |||||||||||||||||||||||||||
| - | 144,000 | 144,000 | NTT DoCoMo, Inc. | - | 3,235,569 | - | 3,235,569 | |||||||||||||||||||||||||||
| - | 24,700 | 24,700 | Obic Co., Ltd. | - | 1,906,556 | - | 1,906,556 | |||||||||||||||||||||||||||
| - | 23,400 | 23,400 | Oracle Corp. Japan | - | 1,485,382 | - | 1,485,382 | |||||||||||||||||||||||||||
| - | 165,000 | 165,000 | ORIX Corp. | - | 2,410,967 | - | 2,410,967 | |||||||||||||||||||||||||||
| 180,400 | - | 180,400 | Panasonic Corp. | 1,620,610 | - | - | 1,620,610 | |||||||||||||||||||||||||||
| - | 52,700 | 52,700 | Sankyo Co., Ltd. | - | 2,004,204 | - | 2,004,204 | |||||||||||||||||||||||||||
| - | 233,200 | 233,200 | Sekisui House Ltd. | - | 3,424,561 | - | 3,424,561 | |||||||||||||||||||||||||||
| 30,100 | - | 30,100 | Seven & I Holdings Co., Ltd. | 1,307,999 | - | - | 1,307,999 | |||||||||||||||||||||||||||
| - | 229,700 | 229,700 | Sumitomo Corp. | - | 3,259,160 | - | 3,259,160 | |||||||||||||||||||||||||||
| - | 55,200 | 55,200 | Sundrug Co., Ltd. | - | 1,643,809 | - | 1,643,809 |
| 10 |
| 30,700 | - | 30,700 | Suntory Beverage & Food Ltd. | 1,386,185 | - | - | 1,386,185 | |||||||||||||||||||||||||||
| - | 15,600 | 15,600 | Suzuken Co., Ltd. | - | 794,393 | - | 794,393 | |||||||||||||||||||||||||||
| 25,200 | - | 25,200 | Taiheiyo Cement Corp. | 775,535 | - | - | 775,535 | |||||||||||||||||||||||||||
| 61,540 | - | 61,540 | (1) | Takeda Pharmaceutical Co., Ltd. | 2,085,866 | - | - | 2,085,867 | ||||||||||||||||||||||||||
| - | 908 | 908 | United Urban Investment Corp. | - | 1,406,242 | - | 1,406,242 | |||||||||||||||||||||||||||
| 8,688,826 | 52,274,860 | - | 60,963,687 | |||||||||||||||||||||||||||||||
| Luxembourg: | 0.6 | % | ||||||||||||||||||||||||||||||||
| 163,620 | - | 163,620 | SES S.A. - Luxembourg | 3,132,691 | - | - | 3,132,691 | |||||||||||||||||||||||||||
| - | 16,822 | 16,822 | RTL Group SA | - | 901,501 | - | 901,501 | |||||||||||||||||||||||||||
| 3,132,691 | 901,501 | - | 4,034,192 | |||||||||||||||||||||||||||||||
| Netherlands: | 3.8 | % | ||||||||||||||||||||||||||||||||
| 289,086 | - | 289,086 | Aegon NV | 1,353,977 | - | - | 1,353,977 | |||||||||||||||||||||||||||
| 16,864 | - | 16,864 | Akzo Nobel NV | 1,358,127 | - | - | 1,358,127 | |||||||||||||||||||||||||||
| - | 241,259 | 241,259 | ING Groep NV | - | 2,595,129 | - | 2,595,129 | |||||||||||||||||||||||||||
| - | 140,632 | 140,632 | Koninklijke Ahold Delhaize NV | - | 3,552,677 | - | 3,552,677 | |||||||||||||||||||||||||||
| - | 37,384 | 37,384 | LyondellBasell Industries NV - Class A | - | 3,108,853 | - | 3,108,853 | |||||||||||||||||||||||||||
| - | 92,134 | 92,134 | NN Group NV | - | 3,663,122 | - | 3,663,122 | |||||||||||||||||||||||||||
| - | 228,446 | 228,446 | Royal Dutch Shell PLC - Class A | - | 6,723,815 | - | 6,723,815 | |||||||||||||||||||||||||||
| 119,125 | - | 119,125 | Royal Dutch Shell PLC - Class B | 3,561,540 | - | - | 3,561,539 | |||||||||||||||||||||||||||
| 6,273,644 | 19,643,596 | - | 25,917,239 | |||||||||||||||||||||||||||||||
| New Zealand: | 0.3 | % | ||||||||||||||||||||||||||||||||
| - | 647,397 | 647,397 | Spark New Zealand Ltd. | - | 1,805,863 | - | 1,805,863 | |||||||||||||||||||||||||||
| - | 1,805,863 | - | 1,805,863 | |||||||||||||||||||||||||||||||
| Panama: | 0.3 | % | ||||||||||||||||||||||||||||||||
| - | 26,076 | 26,076 | Copa Holdings S.A.- Class A | - | 2,052,442 | - | 2,052,442 | |||||||||||||||||||||||||||
| - | 2,052,442 | - | 2,052,442 | |||||||||||||||||||||||||||||||
| Singapore: | 1.1 | % | ||||||||||||||||||||||||||||||||
| - | 685,800 | 685,800 | ComfortDelgro Corp., Ltd. | - | 1,083,252 | - | 1,083,252 | |||||||||||||||||||||||||||
| - | 272,100 | 272,100 | SATS Ltd | - | 931,961 | - | 931,961 | |||||||||||||||||||||||||||
| - | 664,000 | 664,000 | Singapore Technologies Engineering Ltd. | - | 1,702,159 | - | 1,702,159 | |||||||||||||||||||||||||||
| 1,443,900 | - | 1,443,900 | Singapore Telecommunications Ltd. | 3,107,611 | - | - | 3,107,611 | |||||||||||||||||||||||||||
| - | 629,700 | 629,700 | Yangzijiang Shipbuilding Holdings Ltd. | - | 578,595 | - | 578,595 | |||||||||||||||||||||||||||
| 3,107,611 | 4,295,967 | - | 7,403,578 | |||||||||||||||||||||||||||||||
| South Korea: | 0.7 | % | ||||||||||||||||||||||||||||||||
| 43,400 | - | 43,400 | KB Financial Group, Inc. | 1,810,510 | - | - | 1,810,510 | |||||||||||||||||||||||||||
| 77,612 | - | 77,612 | Samsung Electronics Co., Ltd. | 2,701,807 | - | - | 2,701,807 | |||||||||||||||||||||||||||
| 4,512,317 | - | - | 4,512,317 | |||||||||||||||||||||||||||||||
| Spain: | 0.8 | % | ||||||||||||||||||||||||||||||||
| - | - | - | Banco Bilbao Vizcaya Argentaria SA | - | - | - | - | |||||||||||||||||||||||||||
| - | 121,068 | 121,068 | (1) | Endesa S.A. | - | 2,791,912 | - | 2,791,912 | ||||||||||||||||||||||||||
| - | 70,743 | 70,743 | Red Electrica Corp. SA | - | 1,577,586 | - | 1,577,586 | |||||||||||||||||||||||||||
| 162,342 | - | 162,342 | Telefonica S.A. | 1,366,499 | - | - | 1,366,499 | |||||||||||||||||||||||||||
| 1,366,499 | 4,369,498 | - | 5,735,997 | |||||||||||||||||||||||||||||||
| Sweden: | 0.6 | % | ||||||||||||||||||||||||||||||||
| 140,262 | - | 140,262 | Getinge AB | 1,268,339 | - | - | 1,268,339 | |||||||||||||||||||||||||||
| - | 64,158 | 64,158 | Swedish Match AB | - | 2,525,736 | - | 2,525,736 | |||||||||||||||||||||||||||
| 1,268,339 | 2,525,736 | - | 3,794,075 | |||||||||||||||||||||||||||||||
| Switzerland: | 2.8 | % | ||||||||||||||||||||||||||||||||
| - | 7,554 | 7,554 | Kuehne & Nagel International AG | - | 972,401 | - | 972,401 | |||||||||||||||||||||||||||
| - | 42,757 | 42,757 | Nestle SA | - | 3,470,277 | - | 3,470,277 | |||||||||||||||||||||||||||
| 5,538 | - | 5,538 | Novartis AG | 474,298 | - | - | 474,298 | |||||||||||||||||||||||||||
| 10,912 | 23,909 | 34,821 | Roche Holding AG | 2,709,000 | 5,935,621 | - | 8,644,622 | |||||||||||||||||||||||||||
| 151,970 | - | 151,970 | UBS Group AG | 1,895,559 | - | - | 1,895,559 | |||||||||||||||||||||||||||
| - | 13,160 | 13,160 | Zurich Insurance Group AG | - | 3,922,849 | - | 3,922,849 | |||||||||||||||||||||||||||
| 5,078,857 | 14,301,148 | - | 19,380,006 | |||||||||||||||||||||||||||||||
| Thailand: | 0.3 | % | ||||||||||||||||||||||||||||||||
| 276,600 | - | 276,600 | Bangkok Bank PCL | 1,726,281 | - | - | 1,726,281 | |||||||||||||||||||||||||||
| 92,400 | - | 92,400 | Bangkok Bank PCL - Foreign Reg | 588,129 | - | - | 588,129 | |||||||||||||||||||||||||||
| 2,314,410 | - | - | 2,314,410 |
| 11 |
| United Kingdom: | 6.1 | % | ||||||||||||||||||||||||||||||||
| - | 343,314 | 343,314 | Aviva PLC | - | 1,643,101 | - | 1,643,101 | |||||||||||||||||||||||||||
| 482,898 | - | 482,898 | BP PLC | 3,052,730 | - | - | 3,052,730 | |||||||||||||||||||||||||||
| - | 827,610 | 827,610 | Direct Line Insurance Group PLC | - | 3,364,189 | - | 3,364,189 | |||||||||||||||||||||||||||
| - | 241,221 | 241,221 | GlaxoSmithKline PLC | - | 4,597,195 | - | 4,597,195 | |||||||||||||||||||||||||||
| 273,510 | - | 273,510 | HSBC Holdings PLC (HKD) | 2,256,839 | - | - | 2,256,839 | |||||||||||||||||||||||||||
| - | 94,333 | 94,333 | Imperial Brands PLC | - | 2,863,170 | - | 2,863,170 | |||||||||||||||||||||||||||
| - | 127,415 | 127,415 | International Consolidated Airlines Group SA | - | 1,010,115 | - | 1,010,115 | |||||||||||||||||||||||||||
| 572,200 | - | 572,200 | Kingfisher PLC | 1,504,481 | - | - | 1,504,481 | |||||||||||||||||||||||||||
| - | 1,161,436 | 1,161,436 | Legal & General Group PLC | - | 3,422,019 | - | 3,422,019 | |||||||||||||||||||||||||||
| - | 4,571,500 | 4,571,500 | Lloyds Banking Group Plc | - | 3,013,446 | - | 3,013,446 | |||||||||||||||||||||||||||
| - | 828,935 | 828,935 | Marks & Spencer Group PLC | - | 2,599,870 | - | 2,599,870 | |||||||||||||||||||||||||||
| 331,668 | - | 331,668 | Man Group PLC | 561,947 | - | - | 561,947 | |||||||||||||||||||||||||||
| - | 53,073 | 53,073 | Pearson PLC | - | 635,809 | - | 635,809 | |||||||||||||||||||||||||||
| - | 116,460 | 116,460 | Persimmon PLC | - | 2,867,921 | - | 2,867,921 | |||||||||||||||||||||||||||
| - | 515,995 | 515,995 | Royal Mail PLC | - | 1,790,960 | - | 1,790,960 | |||||||||||||||||||||||||||
| 330,085 | - | 330,085 | Standard Chartered PLC | 2,565,310 | - | - | 2,565,310 | |||||||||||||||||||||||||||
| - | 1,039,206 | 1,039,206 | Taylor Wimpey PLC | - | 1,807,032 | - | 1,807,032 | |||||||||||||||||||||||||||
| 857,575 | 390,098 | 1,247,673 | Vodafone Group PLC | 1,667,374 | 758,464 | - | 2,425,838 | |||||||||||||||||||||||||||
| 11,608,681 | 30,373,291 | - | 41,981,972 | |||||||||||||||||||||||||||||||
| United States: | 53.2 | % | ||||||||||||||||||||||||||||||||
| - | 57,952 | 57,952 | AbbVie, Inc. | - | 5,342,595 | - | 5,342,595 | |||||||||||||||||||||||||||
| - | 9,533 | 9,533 | Accenture PLC | - | 1,344,248 | - | 1,344,248 | |||||||||||||||||||||||||||
| 2,952 | - | 2,952 | Advance Auto Parts, Inc. | 464,822 | - | - | 464,822 | |||||||||||||||||||||||||||
| - | 207,009 | 207,009 | AES Corp. | - | 2,993,350 | - | 2,993,350 | |||||||||||||||||||||||||||
| - | 92,900 | 92,900 | Aflac, Inc. | - | 4,232,524 | - | 4,232,524 | |||||||||||||||||||||||||||
| - | 173,368 | 173,368 | AGNC Investment Corp. | - | 3,040,875 | - | 3,040,875 | |||||||||||||||||||||||||||
| - | 20,748 | 20,748 | Air Products & Chemicals, Inc. | - | 3,320,717 | - | 3,320,717 | |||||||||||||||||||||||||||
| 19,051 | - | 19,051 | Allergan PLC | 2,546,357 | - | - | 2,546,357 | |||||||||||||||||||||||||||
| - | 15,376 | 15,376 | Allison Transmission Holdings, Inc. | - | 675,160 | - | 675,160 | |||||||||||||||||||||||||||
| - | 23,703 | 23,703 | Allstate Corp. | - | 1,958,579 | - | 1,958,579 | |||||||||||||||||||||||||||
| 17,033 | - | 17,033 | Ally Financial, Inc. | 385,968 | - | - | 385,968 | |||||||||||||||||||||||||||
| 1,391 | - | 1,391 | (2) | Alphabet, Inc. - Class A | 1,453,539 | - | - | 1,453,539 | ||||||||||||||||||||||||||
| - | 87,246 | 87,246 | Altria Group, Inc. | - | 4,309,080 | - | 4,309,080 | |||||||||||||||||||||||||||
| - | 36,263 | 36,263 | Ameren Corp. | - | 2,365,435 | - | 2,365,435 | |||||||||||||||||||||||||||
| 23,230 | - | 23,230 | AmerisourceBergen Corp. | 1,728,312 | - | - | 1,728,312 | |||||||||||||||||||||||||||
| - | 19,143 | 19,143 | Amgen, Inc. | - | 3,726,568 | - | 3,726,568 | |||||||||||||||||||||||||||
| - | 43,367 | 43,367 | Amphenol Corp. | - | 3,513,594 | - | 3,513,594 | |||||||||||||||||||||||||||
| - | 349,038 | 349,038 | Annaly Capital Management, Inc. | - | 3,427,553 | - | 3,427,553 | |||||||||||||||||||||||||||
| 56,110 | - | 56,110 | Apache Corp. | 1,472,888 | - | - | 1,472,888 | |||||||||||||||||||||||||||
| - | 195,425 | 195,425 | Apple Hospitality REIT, Inc. | - | 2,786,761 | - | 2,786,761 | |||||||||||||||||||||||||||
| - | 58,693 | 58,693 | Apple, Inc. | - | 9,258,234 | - | 9,258,234 | |||||||||||||||||||||||||||
| - | 185,252 | 185,252 | AT&T, Inc. | - | 5,287,092 | - | 5,287,092 | |||||||||||||||||||||||||||
| - | 256,012 | 256,012 | Bank of America Corp. | - | 6,308,136 | - | 6,308,136 | |||||||||||||||||||||||||||
| - | 12,618 | 12,618 | Boeing Co. | - | 4,069,305 | - | 4,069,305 | |||||||||||||||||||||||||||
| - | 61,958 | 61,958 | Booz Allen Hamilton Holding Corp. | - | 2,792,447 | - | 2,792,447 | |||||||||||||||||||||||||||
| - | 81,216 | 81,216 | Bristol-Myers Squibb Co. | - | 4,221,608 | - | 4,221,608 | |||||||||||||||||||||||||||
| - | 27,744 | 27,744 | Broadridge Financial Solutions, Inc. ADR | - | 2,670,360 | - | 2,670,360 | |||||||||||||||||||||||||||
| - | 50,702 | 50,702 | Bruker Corp. | - | 1,509,399 | - | 1,509,399 | |||||||||||||||||||||||||||
| - | 6,248 | 6,248 | Camden Property Trust | - | 550,136 | - | 550,136 | |||||||||||||||||||||||||||
| 27,060 | - | 27,060 | Capital One Financial Corp. | 2,045,465 | - | - | 2,045,465 | |||||||||||||||||||||||||||
| 28,610 | - | 28,610 | Cardinal Health, Inc. | 1,276,006 | - | - | 1,276,006 | |||||||||||||||||||||||||||
| - | 29,161 | 29,161 | Carnival Corp. | - | 1,437,637 | - | 1,437,637 | |||||||||||||||||||||||||||
| 15,300 | - | 15,300 | (2) | Celgene Corp. | 980,577 | - | - | 980,577 | ||||||||||||||||||||||||||
| - | 126,359 | 126,359 | Centerpoint Energy, Inc. | - | 3,567,115 | - | 3,567,115 | |||||||||||||||||||||||||||
| - | 81,043 | 81,043 | CenturyLink, Inc. | - | 1,227,801 | - | 1,227,801 | |||||||||||||||||||||||||||
| - | 49,537 | 49,537 | Chevron Corp. | - | 5,389,130 | - | 5,389,130 | |||||||||||||||||||||||||||
| - | 177,137 | 177,137 | Chimera Investment Corp. | - | 3,156,581 | - | 3,156,581 | |||||||||||||||||||||||||||
| - | 137,237 | 137,237 | Cisco Systems, Inc. | - | 5,946,479 | - | 5,946,479 | |||||||||||||||||||||||||||
| 53,690 | - | 53,690 | Citigroup, Inc. | 2,795,101 | - | - | 2,795,101 | |||||||||||||||||||||||||||
| - | 30,428 | 30,428 | Citrix Systems, Inc. | - | 3,117,653 | - | 3,117,653 | |||||||||||||||||||||||||||
| 63,720 | - | 63,720 | Comcast Corp. - Class A | 2,169,666 | - | - | 2,169,666 | |||||||||||||||||||||||||||
| - | 30,052 | 30,052 | Comerica, Inc. | - | 2,064,272 | - | 2,064,272 | |||||||||||||||||||||||||||
| 53,700 | - | 53,700 | (2) | CommScope Holding Co., Inc. | 880,143 | - | - | 880,143 | ||||||||||||||||||||||||||
| - | 45,730 | 45,730 | Conagra Brands, Inc. | - | 976,793 | - | 976,793 | |||||||||||||||||||||||||||
| 202,100 | - | 202,100 | Coty, Inc - Class A | 1,325,776 | - | - | 1,325,776 | |||||||||||||||||||||||||||
| - | 36,825 | 36,825 | Darden Restaurants, Inc. | - | 3,677,345 | - | 3,677,345 | |||||||||||||||||||||||||||
| - | 17,190 | 17,190 | DXC Technology Co. | - | 913,992 | - | 913,992 |
| 12 |
| - | 23,536 | 23,536 | Eaton Corp. PLC | - | 1,615,982 | - | 1,615,982 | |||||||||||||||||||||||||||
| 12,230 | 45,831 | 58,061 | Eli Lilly & Co. | 1,415,256 | 5,303,563 | - | 6,718,819 | |||||||||||||||||||||||||||
| - | 12,337 | 12,337 | Everest Re Group Ltd. | - | 2,686,505 | - | 2,686,505 | |||||||||||||||||||||||||||
| - | 12,137 | 12,137 | Exelon Corp. | - | 547,379 | �� | - | 547,379 | ||||||||||||||||||||||||||
| - | 27,710 | 27,710 | Expedia Group, Inc. | - | 3,121,532 | - | 3,121,532 | |||||||||||||||||||||||||||
| - | 44,942 | 44,942 | Expeditors International Washington, Inc. | - | 3,060,101 | - | 3,060,101 | |||||||||||||||||||||||||||
| 23,500 | 63,021 | 86,521 | Exxon Mobil Corp. | 1,602,465 | 4,297,402 | - | 5,899,867 | |||||||||||||||||||||||||||
| - | 90,202 | 90,202 | General Mills, Inc. | - | 3,512,466 | - | 3,512,466 | |||||||||||||||||||||||||||
| 39,750 | - | 39,750 | Gilead Sciences, Inc. | 2,486,363 | - | - | 2,486,363 | |||||||||||||||||||||||||||
| - | 133,648 | 133,648 | H&R Block, Inc. | - | 3,390,650 | - | 3,390,650 | |||||||||||||||||||||||||||
| - | 14,654 | 14,654 | Home Depot, Inc. | - | 2,517,850 | - | 2,517,850 | |||||||||||||||||||||||||||
| - | 32,618 | 32,618 | Honeywell International, Inc. | - | 4,309,490 | - | 4,309,490 | |||||||||||||||||||||||||||
| - | 135,985 | 135,985 | Intel Corp. | - | 6,381,776 | - | 6,381,776 | |||||||||||||||||||||||||||
| - | 38,224 | 38,224 | InterDigital, Inc. | - | 2,539,220 | - | 2,539,220 | |||||||||||||||||||||||||||
| - | 39,659 | 39,659 | International Business Machines Corp. | - | 4,508,039 | - | 4,508,039 | |||||||||||||||||||||||||||
| - | 44,124 | 44,124 | j2 Global, Inc. | - | 3,061,323 | - | 3,061,323 | |||||||||||||||||||||||||||
| - | 26,807 | 26,807 | Jabil, Inc. | - | 664,546 | - | 664,546 | |||||||||||||||||||||||||||
| - | 18,879 | 18,879 | JM Smucker Co. | - | 1,764,998 | - | 1,764,998 | |||||||||||||||||||||||||||
| - | 65,704 | 65,704 | Johnson & Johnson | - | 8,479,101 | - | 8,479,101 | |||||||||||||||||||||||||||
| 13,210 | - | 13,210 | JPMorgan Chase & Co. | 1,289,560 | - | - | 1,289,560 | |||||||||||||||||||||||||||
| 32,300 | - | 32,300 | Kellogg Co. | 1,841,423 | - | - | 1,841,423 | |||||||||||||||||||||||||||
| - | 26,824 | 26,824 | Kimberly-Clark Corp. | - | 3,056,327 | - | 3,056,327 | |||||||||||||||||||||||||||
| - | 34,767 | 34,767 | KLA-Tencor Corp. | - | 3,111,299 | - | 3,111,299 | |||||||||||||||||||||||||||
| - | 47,501 | 47,501 | Kohl's Corp. | - | 3,151,216 | - | 3,151,216 | |||||||||||||||||||||||||||
| 56,500 | - | 56,500 | Kroger Co. | 1,553,750 | - | - | 1,553,750 | |||||||||||||||||||||||||||
| - | 23,699 | 23,699 | Lear Corp. | - | 2,911,659 | - | 2,911,659 | |||||||||||||||||||||||||||
| - | 13,398 | 13,398 | Marriott International, Inc. | - | 1,454,487 | - | 1,454,487 | |||||||||||||||||||||||||||
| 118,900 | - | 118,900 | (1), (2) Mattel, Inc. | 1,187,811 | - | - | 1,187,811 | |||||||||||||||||||||||||||
| - | 59,349 | 59,349 | Maxim Integrated Products | - | 3,017,897 | - | 3,017,897 | |||||||||||||||||||||||||||
| - | 44,513 | 44,513 | Maximus, Inc. | - | 2,897,351 | - | 2,897,351 | |||||||||||||||||||||||||||
| - | 28,810 | 28,810 | McDonald's Corp. | - | 5,115,792 | - | 5,115,792 | |||||||||||||||||||||||||||
| - | 68,594 | 68,594 | MDU Resources Group, Inc. | - | 1,635,281 | - | 1,635,281 | |||||||||||||||||||||||||||
| - | 7,296 | 7,296 | Merck & Co., Inc. | - | 557,487 | - | 557,487 | |||||||||||||||||||||||||||
| - | 288,965 | 288,965 | MFA Financial, Inc. | - | 1,930,286 | - | 1,930,286 | |||||||||||||||||||||||||||
| - | 44,716 | 44,716 | Microsoft Corp. | - | 4,541,804 | - | 4,541,804 | |||||||||||||||||||||||||||
| - | 58,051 | 58,051 | Molson Coors Brewing Co. | - | 3,260,144 | - | 3,260,144 | |||||||||||||||||||||||||||
| - | 26,489 | 26,489 | Motorola Solutions, Inc. | - | 3,047,295 | - | 3,047,295 | |||||||||||||||||||||||||||
| 42,870 | - | 42,870 | (2) Navistar International Corp. | 1,112,477 | - | - | 1,112,477 | |||||||||||||||||||||||||||
| - | 113,599 | 113,599 | New Residential Investment Corp. | - | 1,614,242 | - | 1,614,242 | |||||||||||||||||||||||||||
| - | 88,696 | 88,696 | Newmont Mining Corp. | - | 3,073,316 | - | 3,073,316 | |||||||||||||||||||||||||||
| - | 32,699 | 32,699 | OGE Energy Corp. | - | 1,281,474 | - | 1,281,474 | |||||||||||||||||||||||||||
| - | 49,442 | 49,442 | Omnicom Group | - | 3,621,132 | - | 3,621,132 | |||||||||||||||||||||||||||
| - | 20,516 | 20,516 | Oneok, Inc. | - | 1,106,838 | - | 1,106,838 | |||||||||||||||||||||||||||
| 76,170 | 115,610 | 191,780 | Oracle Corp. | 3,439,075 | 5,219,792 | - | 8,658,868 | |||||||||||||||||||||||||||
| - | 54,115 | 54,115 | Paychex, Inc. | - | 3,525,592 | - | 3,525,592 | |||||||||||||||||||||||||||
| - | 49,297 | 49,297 | PBF Energy, Inc. | - | 1,610,533 | - | 1,610,533 | |||||||||||||||||||||||||||
| - | 45,329 | 45,329 | PepsiCo, Inc. | - | 5,007,948 | - | 5,007,948 | |||||||||||||||||||||||||||
| 26,740 | - | 26,740 | Perrigo Co. PLC | 1,036,175 | - | - | 1,036,175 | |||||||||||||||||||||||||||
| - | 153,815 | 153,815 | Perspecta, Inc. | - | 2,648,694 | - | 2,648,694 | |||||||||||||||||||||||||||
| - | 162,600 | 162,600 | Pfizer, Inc. | - | 7,097,490 | - | 7,097,490 | |||||||||||||||||||||||||||
| - | 64,250 | 64,250 | Philip Morris International, Inc. | - | 4,289,330 | - | 4,289,330 | |||||||||||||||||||||||||||
| - | 36,263 | 36,263 | Phillips 66 | - | 3,124,057 | - | 3,124,057 | |||||||||||||||||||||||||||
| - | 14,080 | 14,080 | Pinnacle West Capital Corp. | - | 1,199,616 | - | 1,199,616 | |||||||||||||||||||||||||||
| - | 146,547 | 146,547 | Plains GP Holdings L.P. | - | 2,945,595 | - | 2,945,595 | |||||||||||||||||||||||||||
| - | 40,189 | 40,189 | Procter & Gamble Co. | - | 3,694,173 | - | 3,694,173 | |||||||||||||||||||||||||||
| - | 37,527 | 37,527 | Quest Diagnostics, Inc. | - | 3,124,873 | - | 3,124,873 | |||||||||||||||||||||||||||
| - | 47,386 | 47,386 | Republic Services, Inc. | - | 3,416,057 | - | 3,416,057 | |||||||||||||||||||||||||||
| - | 26,326 | 26,326 | Royal Gold, Inc. | - | 2,254,822 | - | 2,254,822 | |||||||||||||||||||||||||||
| - | 129,422 | 129,422 | Sabre Corp. | - | 2,800,692 | - | 2,800,692 | |||||||||||||||||||||||||||
| - | 72,555 | 72,555 | Service Corp. International | - | 2,921,064 | - | 2,921,064 | |||||||||||||||||||||||||||
| - | 158,695 | 158,695 | Starwood Property Trust, Inc. | - | 3,127,878 | - | 3,127,878 | |||||||||||||||||||||||||||
| - | 33,366 | 33,366 | T. Rowe Price Group, Inc. | - | 3,080,349 | - | 3,080,349 | |||||||||||||||||||||||||||
| - | 75,456 | 75,456 | Targa Resources Corp. | - | 2,717,925 | - | 2,717,925 | |||||||||||||||||||||||||||
| - | 65,802 | 65,802 | Telephone & Data Systems, Inc. | - | 2,141,197 | - | 2,141,197 | |||||||||||||||||||||||||||
| - | 47,854 | 47,854 | Texas Instruments, Inc. | - | 4,522,203 | - | 4,522,203 | |||||||||||||||||||||||||||
| - | 40,002 | 40,002 | Total System Services, Inc. | - | 3,251,763 | - | 3,251,763 | |||||||||||||||||||||||||||
| - | 124,414 | 124,414 | Two Harbors Investment Corp. | - | 1,597,476 | - | 1,597,476 | |||||||||||||||||||||||||||
| - | 49,442 | 49,442 | Tyson Foods, Inc. | - | 2,640,203 | - | 2,640,203 | |||||||||||||||||||||||||||
| 17,840 | - | 17,840 | United Parcel Service, Inc. - Class B | 1,739,935 | - | - | 1,739,935 | |||||||||||||||||||||||||||
| - | 54,866 | 54,866 | Unum Group | - | 1,611,963 | - | 1,611,963 |
| 13 |
| - | 41,310 | 41,310 | Valero Energy Corp. | - | 3,097,011 | - | 3,097,011 | |||||||||||||||||||||||||||
| 35,600 | 44,445 | 80,045 | Walgreens Boots Alliance, Inc. | 2,432,548 | 3,036,927 | - | 5,469,475 | |||||||||||||||||||||||||||
| - | 18,879 | 18,879 | Walt Disney Co. | - | 2,070,082 | - | 2,070,082 | |||||||||||||||||||||||||||
| - | 46,357 | 46,357 | Waste Management, Inc. | - | 4,125,309 | - | 4,125,309 | |||||||||||||||||||||||||||
| - | 102,527 | 102,527 | Wells Fargo & Co. | - | 4,724,444 | - | 4,724,444 | |||||||||||||||||||||||||||
| - | 51,325 | 51,325 | Western Digital Corp. | - | 1,897,485 | - | 1,897,485 | |||||||||||||||||||||||||||
| - | 187,201 | 187,201 | Western Union Co. | - | 3,193,649 | - | 3,193,649 | |||||||||||||||||||||||||||
| 40,661,458 | 325,041,996 | - | 365,703,455 | |||||||||||||||||||||||||||||||
| Total Common Stock | ||||||||||||||||||||||||||||||||||
| (Cost $147,191,178, $595,436,589 and $742,627,767 Pro Forma Combined) | 130,286,875 | 544,617,123 | - | 674,903,997 | ||||||||||||||||||||||||||||||
| EXCHANGE-TRADED FUNDS: 0.7% | ||||||||||||||||||||||||||||||||||
| Exchange-Traded Funds: | 0.7 | % | ||||||||||||||||||||||||||||||||
| - | 27,963 | 27,963 | iShares MSCI EAFE ETF | - | 1,643,665 | - | 1,643,665 | |||||||||||||||||||||||||||
| - | 13,413 | 13,413 | SPDR S&P 500 ETF Trust | - | 3,352,177 | - | 3,352,177 | |||||||||||||||||||||||||||
| - | 4,995,842 | - | 4,995,842 | |||||||||||||||||||||||||||||||
| Total Exchange-Traded Funds | ||||||||||||||||||||||||||||||||||
| (Cost $5,496,226) | - | 4,995,842 | - | 4,995,842 | ||||||||||||||||||||||||||||||
| Total Long-Term Investments | ||||||||||||||||||||||||||||||||||
| (Cost $147,191,178, $600,932,815 and $748,123,993 Pro Forma Combined) | 130,286,875 | 549,612,965 | - | 679,899,839 | ||||||||||||||||||||||||||||||
| SHORT-TERM INVESTMENTS: 1.9% | ||||||||||||||||||||||||||||||||||
| Money Market: | 0.2 | % | ||||||||||||||||||||||||||||||||
| 189,836 | - | 189,836 | (4) | BlackRock Liquidity Funds, FedFund, Institutional Class | 189,836 | - | - | 189,836 | ||||||||||||||||||||||||||
| - | 893,000 | 893,000 | (4) | Goldman Sachs Financial Square Government Fund - Institutional Shares | - | 893,000 | - | 893,000 | ||||||||||||||||||||||||||
| 189,836 | 893,000 | - | 1,082,836 | |||||||||||||||||||||||||||||||
| U.S. Government Agency Obligations: | 0.1 | % | ||||||||||||||||||||||||||||||||
| 400,000 | - | 400,000 | Federal Home Loan Bank Discount Notes | 400,000 | - | - | 400,000 | |||||||||||||||||||||||||||
| Securities Lending Collateral (3): | 1.7 | % | ||||||||||||||||||||||||||||||||
| - | 463,855 | 463,855 | Mizuho Securities USA LLC, Repurchase Agreement dated 12/31/18, 2.92%, due 01/02/19 (Repurchase Amount $463,929, collateralized by various U.S. Government Securities, 1.875%-2.625%, Market Value plus accrued interest $473,132, due 02/29/24-09/09/49) | - | 463,855 | - | 463,855 | |||||||||||||||||||||||||||
| 248,904 | - | 248,904 | BNP Paribas S.A., Repurchase Agreement dated 12/31/18, 2.95%, due 01/02/19 (Repurchase Amount $248,944, collateralized by various U.S. Government Securities, 0.000%- 8.125%, Market Value plus accrued interest $253,882, due 01/10/19-09/09/49) | 248,904 | - | - | 248,904 | |||||||||||||||||||||||||||
| 1,000,000 | 2,218,949 | 3,218,949 | RBC Dominion Securities Inc, Repurchase Agreement dated 12/31/18, 3.02%, due 01/02/19 (Repurchase Amount $3,219,481 collateralized by various U.S. Government Agency Obligations, 3.000%-7.000%, Market Value plus accrued interest $3,283,328, due 10/01/25-10/20/48) | 1,000,000 | 2,218,949 | - | 3,218,949 | |||||||||||||||||||||||||||
| - | 2,218,949 | 2,218,949 | Daiwa Capital Markets, Repurchase Agreement dated 12/31/18, 3.05%, due 01/02/19 (Repurchase Amount $2,219,320, collateralized by various U.S. Government Agency Obligations, 2.000%-6.500%, Market Value plus accrued interest $2,263,328, due 01/25/19-02/01/49) | - | 2,218,949 | - | 2,218,949 | |||||||||||||||||||||||||||
| 1,000,000 | 2,218,949 | 3,218,949 | Cantor Fitzgerald Securities, Repurchase Agreement dated 12/31/18, 3.35%, due 01/02/19 (Repurchase Amount $3,219,540, collateralized by various U.S. Government/U.S. Government Agency Obligations, 0.000%-10.000%, Market Value plus accrued interest $3,283,328, due 01/25/19-10/20/68) | 1,000,000 | 2,218,949 | - | 3,218,949 | |||||||||||||||||||||||||||
| - | 2,218,949 | 2,218,949 | State of Wisconsin Investment Board, Repurchase Agreement dated 12/31/18, 3.37%, due 01/02/19 (Repurchase Amount $2,219,359, collateralized by various U.S. Government Securities, 0.125%-3.875%, Market Value plus accrued interest $2,263,363, due 07/15/20-02/15/47) | - | 2,218,949 | - | 2,218,949 | |||||||||||||||||||||||||||
| 2,248,904 | 9,339,651 | - | 11,588,555 | |||||||||||||||||||||||||||||||
| Total Short-Term Investments | ||||||||||||||||||||||||||||||||||
| (Cost $2,838,716, $10,232,651 and $13,071,367 Pro Forma Combined) | 2,838,740 | 10,232,651 | - | 13,071,391 | ||||||||||||||||||||||||||||||
| 14 |
| Total Investments in Securities | ||||||||||||||||||||||||||||||||||
| (Cost $150,029,894, $611,165,466, $761,195,360 Pro Forma Combined) | 100.8 | % | $ | 133,125,615 | $ | 559,845,616 | $ | - | $ | 692,971,230 | ||||||||||||||||||||||||
| Other Assets and Liabilities - Net | (0.8 | ) | (564,656 | ) | (4,675,475 | ) | (135,000 | )(A) | (5,375,130 | ) | ||||||||||||||||||||||||
| Net Assets | 100.0 | % | $ | 132,560,959 | $ | 555,170,141 | $ | (135,000 | ) | $ | 687,596,100 |
| † | Unless otherwise indicated, principal amount is shown in USD. | |
| # | Securities with purchases pursuant to Rule 144A or section 4(2), under the Securities Act of 1933 and may not be resold subject to that rule except to qualified institutional buyers. | |
| ADR | American Depositary Receipt | |
| (1) | Loaned security, a portion or all of the security is on loan at December 31, 2018. | |
| (2) | Non-income producing security | |
| (3) | Represents securities purchased with cash collateral for securities on loan. | |
| (4) | Rate shown is the 7-day yield as of December 31, 2018. | |
| (5) | Securities with purchases pursuant to Rule 144A or section 4(a)(2), under the Securities Act of 1933 and may not be resold subject to that rule except to qualified institutional buyers. | |
| (A) | Reflects adjustments related to portfolio consolidation. | |
| (1) | Collateral received from brokers for securities lending was invested into these short-term investments. |
| * | Cost for federal income tax purposes is: | $ | - | $ | - | $ | - | $ | - | |||||||||
| Net unrealized appreciation consists of: | ||||||||||||||||||
| Gross Unrealized Appreciation | $ | 0 | $ | 0 | $ | - | $ | - | ||||||||||
| Gross Unrealized Depreciation | 0 | 0 | - | 0 | ||||||||||||||
| Net Unrealized Appreciation | $ | - | $ | - | $ | - | $ | - |
| 15 |
Fair Value Measurements^
The following is a summary of the fair valuations according to the inputs used as of December 31, 2018 in valuing the assets and liabilities:
| VY® Templeton Global | Voya Global | Pro-forma | ||||||||||||||
| Growth Portfolio | Equity Portfolio | adjustments | Pro-forma | |||||||||||||
| Asset Table | ||||||||||||||||
| Investments, at value | ||||||||||||||||
| Level 1 - Quoted Prices | $ | 48,706,924 | $ | 356,703,749 | $ | - | $ | 405,410,673 | ||||||||
| Level 2 - Other Significant Observable Inputs | 84,418,691 | 203,141,868 | - | 287,560,559 | ||||||||||||
| Level 3 - Significant Unobservable Inputs | - | - | - | - | ||||||||||||
| Total Investments, at value | $ | 133,125,615 | $ | 559,845,618 | $ | - | $ | 692,971,232 | ||||||||
^ See Note 2, “Security Valuation” in the Notes to Unaudited Pro Forma Financial Statements for additional information.
include market quotations as a source of value, and the latter refers to determinations of actual value in absense of available markets quotations.
| 16 |
NOTES TO PRO FORMA FINANCIAL STATEMENTS (UNAUDITED)
Note 1 – Basis of Combination:
The Board of Directors/Trustees (the “Board”) of VY® Templeton Global Growth Portfolio (“Templeton Portfolio”) and Voya Global Equity Portfolio (“Global Equity Portfolio”) (each a “Portfolio” and collectively, the “Portfolios”), approved an Agreement and Plan of Reorganization dated November 16, 2018 (the “Plan”) whereby, subject to approval by the shareholders of Templeton Portfolio, Global Equity Portfolio will acquire all of the assets of Templeton Portfolio, subject to the liabilities of such Portfolio, in exchange for Global Equity Portfolio issuing shares of such fund to shareholders of Templeton Portfolio in a number equal in value to net assets of Templeton Portfolio (the “Merger”).
The Merger will be accounted for as a tax-free merger of investment companies with Global Equity Portfolio remaining as both the tax and accounting survivor. The unaudited pro forma combined financial statements are presented for the information of the reader and may not necessarily be representative of what the actual combined financial statements would have been had the reorganization(s) occurred at December 31, 2018. The unaudited pro forma Portfolio of Investments and Statement of Assets and Liabilities reflect the financial position of Templeton Portfolio and Global Equity Portfolio at December 31, 2018. The unaudited pro forma Statement of Operations reflects the results of operations of Templeton Portfolio and Global Equity Portfolio for the twelve-months ended December 31, 2018. These statements have been derived from the Portfolios’ respective books and records utilized in calculating daily net asset value at the date indicated above for Templeton Portfolio and Global Equity Portfolio under U.S. generally accepted accounting principles for investment companies. The unaudited pro forma Portfolio of Investments reflects the pro forma combined portfolio holdings of Templeton Portfolio and Global Equity Portfolio as of December 31, 2018.
The unaudited pro forma Portfolio of Investments, and Statement of Assets and Liabilities and Statement of Operations should be read in conjunction with the historical financial statements of each Portfolio, which are incorporated by reference in the Statement of Additional Information.
Note 2 – Security Valuation:
Each Portfolio is open for business every day the New York Stock Exchange (“NYSE”) opens for regular trading (each such day, a “Business Day”). The net asset value (“NAV”) per share for each class of each Portfolio is determined each Business Day as of the close of the regular trading session (“Market Close”), as determined by the Consolidated Tape Association (“CTA”), the central distributor of transaction prices for exchange-traded securities (normally 4:00 p.m. Eastern time unless otherwise designated by the CTA). The data reflected on the consolidated tape provided by the CTA is generated by various market centers, including all securities exchanges, electronic communications networks, and third-market broker-dealers. The NAV per share of each class of each Portfolio is calculated by taking the value of the Portfolio’s assets attributable to that class, subtracting the Portfolio’s liabilities attributable to that class, and dividing by the number of shares of that class that are outstanding. On days when a Portfolio is closed for business, Portfolio shares will not be priced and a Portfolio does not transact purchase and redemption orders. To the extent a Portfolio’s assets are traded in other markets on days when a Portfolio does not price its shares, the value of a Portfolio’s assets will likely change and you will not be able to purchase or redeem shares of a Portfolio.
Assets for which market quotations are readily available are valued at market value. A security listed or traded on an exchange is valued at its last sales price or official closing price as of the close of the regular trading session on the exchange where the security is principally traded or, if such price is not available, at the last sale price as of the Market Close for such security provided by the CTA. Bank loans are valued at the average of the averages of the bid and ask prices provided to an independent loan pricing service by brokers. Futures contracts are valued at the final settlement price set by an exchange on which they are principally traded. Listed options are valued at the mean between the last bid and ask prices from the exchange on which they are principally traded. Investments in open-end registered investment companies that do not trade on an exchange are valued at the end of day NAV per share. Investments in registered investment companies that trade on an exchange are valued at the last sales price or official closing price as of the close of the regular trading session on the exchange where the security is principally traded.
When a market quotation is not readily available or is deemed unreliable, each Portfolio will determine a fair value for the relevant asset in accordance with procedures adopted by the Board. Such procedures provide, for example, that: (a) Exchange-traded securities are valued at the mean of the closing bid and ask; (b) Debt obligations are valued using an evaluated price provided by an independent pricing service. Evaluated prices provided by the pricing service may be determined without exclusive reliance on quoted prices, and may reflect factors such as institution-size trading in similar groups of securities, developments related to specific securities, benchmark yield, quality, type of issue, coupon rate, maturity, individual trading characteristics and other market data; (c) Securities traded in the over-the-counter market are valued based on prices provided by independent pricing services or market makers; (d) Options not listed on an exchange are valued by an independent source using an industry accepted model, such as Black-Scholes; (e) Centrally cleared swap agreements are valued using a price provided by the central counterparty clearinghouse; (f) Over-the-counter swap agreements are valued using a price provided by an independent pricing service; (g) Forward foreign currency exchange contracts are valued utilizing
| 17 |
current and forward rates obtained from an independent pricing service. Such prices from the third party pricing service are for specific settlement periods and each Portfolio’s forward foreign currency exchange contracts are valued at an interpolated rate between the closest preceding and subsequent period reported by the independent pricing service and (h) Securities for which market prices are not provided by any of the above methods may be valued based upon quotes furnished by brokers.
The prospectuses of the open-end registered investment companies in which each Portfolio may invest explain the circumstances under which they will use fair value pricing and the effects of using fair value pricing.
Foreign securities’ (including foreign exchange contracts) prices are converted into U.S. dollar amounts using the applicable exchange rates as of Market Close. If market quotations are available and believed to be reliable for foreign exchange-traded equity securities, the securities will be valued at the market quotations. Because trading hours for certain foreign securities end before Market Close, closing market quotations may become unreliable. An independent pricing service determines the degree of certainty, based on historical data, that the closing price in the principal market where a foreign security trades is not the current value as of Market Close. Foreign securities’ prices meeting the approved degree of certainty that the price is not reflective of current value will be valued by the independent pricing service using pricing models designed to estimate likely changes in the values of those securities between the times in which the trading in those securities is substantially completed and Market Close. Multiple factors may be considered by the independent pricing service in determining the value of such securities and may include information relating to sector indices, American Depositary Receipts and domestic and foreign index futures.
All other assets for which market quotations are not readily available or became unreliable (or if the above fair valuation methods are unavailable or determined to be unreliable) are valued at fair value as determined in good faith by or under the supervision of the Board following procedures approved by the Board. The Board has delegated to Voya Investments, LLC (“Adviser”) responsibility for overseeing the implementation of the Portfolios’ valuation procedures; a “Pricing Committee” comprised of employees of the Adviser or its affiliates has responsibility for applying the fair valuation methods set forth in the procedures and, if a fair valuation cannot be determined pursuant to the fair valuation methods, determining the fair value of assets held by the Portfolios. Issuer specific events, transaction price, position size, nature and duration of restrictions on disposition of the security, market trends, bid/ask quotes of brokers and other market data may be reviewed in the course of making a good faith determination of a security’s fair value. Valuations change in response to many factors including the historical and prospective earnings of the issuer, the value of the issuer’s assets, general economic conditions, interest rates, investor perceptions and market liquidity. Because of the inherent uncertainties of fair valuation, the values used to determine each Portfolio’s NAV may materially differ from the value received upon actual sale of those investments. Thus, fair valuation may have an unintended dilutive or accretive effect on the value of shareholders’ investments in each Portfolio.
Each investment asset or liability of the Portfolios is assigned a level at measurement date based on the significance and source of the inputs to its valuation. Quoted prices in active markets for identical securities are classified as “Level 1,” inputs other than quoted prices for an asset or liability that are observable are classified as “Level 2” and significant unobservable inputs, including the Sub-Adviser’s or Pricing Committee’s judgment about the assumptions that a market participant would use in pricing an asset or liability are classified as “Level 3.” The inputs used for valuing securities are not necessarily an indication of the risks associated with investing in those securities. Short-term securities of sufficient credit quality are generally considered to be Level 2 securities under applicable accounting rules. A table summarizing the Portfolios’ investments under these levels of classification is included following the Portfolio of Investments.
U.S. GAAP requires a reconciliation of the beginning to ending balances for reported fair values that presents changes attributable to total realized and unrealized gains or losses, purchases and sales, and transfers in or out of the Level 3 category during the period. The beginning of period timing recognition is used for the transfers between levels of a Portfolio’s assets and liabilities. A reconciliation of Level 3 investments is presented only when a Portfolio has a significant amount of Level 3 investments.
Note 3 – Capital Shares:
The unaudited pro forma NAV per share assumes additional shares of common Global Equity Portfolio issued in connection with the proposed acquisition of Templeton Portfolio by Global Equity Portfolio as of December 31, 2018. The number of additional shares issued was calculated by dividing the net assets of each class of Templeton Portfolio by the respective class NAV per share of Global Equity Portfolio.
Note 4 – Merger and Transition Costs:
The Adviser (or an affiliate) will bear the costs associated with obtaining shareholder approval, including, but not limited to, vote solicitation and SEC filings. Merger costs to be incurred by the Adviser are estimated at approximately $115,500. These costs represent the estimated expenses of the Portfolio carrying out its obligations under the Plan and consist of management’s estimate of legal fees, accounting fees, printing costs and mailing charges related to the proposed merger. Actual results could differ from these estimates.
| 18 |
The explicit transition costs are estimated to be $135,000 and will be paid by Templeton Portfolio. All the other costs of transitioning the Portfolios are considered implicit costs. These include spread costs, market impact costs, and opportunity costs. Quantifying implicit costs is difficult and involves some degree of subjective determinations. These implicit costs will be borne by the Portfolios.
Note 5 – Use of Estimates in Preparation of Pro Forma Financial Statements:
Management of the Portfolios has made certain estimates and assumptions relating to the reporting of assets, liabilities, income, and expenses to prepare these financial statements in conformity with U.S. generally accepted accounting principles for investment companies.
Note 6 – Federal Income Taxes:
It is the policy of the Portfolios to comply with subchapter M of the Internal Revenue Code and related excise tax provisions applicable to regulated investment companies and to distribute substantially all of their net investment income and any net realized capital gains to their shareholders. Therefore, no federal income tax provision is required. No capital gain distributions shall be made until any capital loss carryforwards have been fully utilized or expired. A portion of the amount of these capital loss carryforwards may be limited in the future.
| 19 |

INVESTMENT MANAGEMENT 7337 EAST DOUBLETREE RANCH ROAD SUITE 100 SCOTTSDALE, ARIZONA 85258-2034 3 EASY WAYS TO VOTE YOUR PROXY VOTE BY PHONE: Call toll-free 1-877-907-7646 and follow the recorded instructions. VOTE ON THE INTERNET: Log on to PROXYVOTE.COM and follow the on-line directions. VOTE BY MAIL: Check the appropriate box on the Proxy Ballot below, sign and date the Proxy Ballot and return in the envelope provided. If you vote via phone or the Internet, YOU DO NOT NEED TO RETURN YOUR PROXY BALLOT. PROXY FOR A SPECIAL MEETING OF SHAREHOLDERS TO BE HELD ON JULY 30, 2019. TO VOTE, MARK BLOCKS BELOW IN BLUE OR BLACK INK AS FOLLOWS: E69238-S83587 KEEP THIS PORTION FOR YOUR RECORDS DETACH AND RETURN THIS PORTION ONLY THE BOARD OF DIRECTORS/TRUSTEES RECOMMENDS A VOTE "FOR" THE FOLLOWING PROPOSAL: FOR AGAINST ABSTAIN 1. To approve an Agreement and Plan of Reorganization by and between VY® Templeton Global Growth Portfolio ("Templeton Portfolio") and Voya Global Equity Portfolio (“Global Equity Portfolio”), providing for the reorganization of Templeton Portfolio with and into Global Equity Portfolio(the “Reorganization”); and 2. To transact such other business, not currently contemplated, that may properly come before the Special Meeting, or any adjournments or postponements thereof, in the discretion of the proxies or their substitutes. TO AVOID THE ADDITIONAL EXPENSE OF FURTHER SOLICITATION, WE STRONGLY URGE YOU TO REVIEW, COMPLETE AND RETURN YOUR PROXY BALLOT AS SOON AS POSSIBLE. YOUR VOTE IS IMPORTANT REGARDLESS OF THE NUMBER OF SHARES OWNED. IF YOU VOTE VIA PHONE OR THE INTERNET, YOU DO NOT NEED TO RETURN YOUR PROXY BALLOT. PLEASE VOTE, DATE AND SIGN THIS PROXY AND RETURN IT PROMPTLY IN THE ENCLOSED ENVELOPE. This Proxy Ballot must be signed exactly as your name(s) appear(s) hereon. If as an attorney, executor, guardian or in some representative capacity or as an officer of a corporation, please add title(s) as such. Joint owners must each sign. Signature [PLEASE SIGN WITHIN BOX] Date Signature [Joint Owners] Date

IMPORTANT NOTICE REGARDING THE AVAILABILITY OF PROXY MATERIALS FOR THE SPECIAL MEETING TO BE HELD ONJULY 30, 2019: THE PROXY STATEMENT/PROSPECTUS FOR THE SPECIAL MEETING AND THE NOTICE OF THE MEETING ARE AVAILABLEAT WWW.PROXYVOTE.COM/VOYA. E69239-S83587 VY® TEMPLETON GLOBAL GROWTH PORTFOLIO THIS PROXY IS SOLICITED ON BEHALF OF THE BOARD OF DIRECTORS/TRUSTEES The undersigned hereby appoints HUEY P. FALGOUT, JR., THERESA K. KELETY AND TODD MODIC, or any one or all of them, proxies, with full power of substitution, to vote all shares of the VY® Templeton Global Growth Portfolio ("Templeton Portfolio"), which the undersigned is entitled to vote at the Special Meeting of Shareholders of the Portfolio to be held at the offices of the Portfolio at 7337 East Doubletree Ranch Road, Suite 100,Scottsdale, AZ 85258-2034, on JULY 30, 2019, at 1:00 PM, local time, and at any adjournment(s) or postponement(s) thereof. This proxy will be voted as instructed. IF NO SPECIFICATION IS MADE, THE PROXY WILL BE VOTED "FOR" THE PROPOSAL. PLEASE SIGN AND DATE ON THE REVERSE SIDE.
Voya Variable Portfolios, Inc.
(“Registrant”)
PART C:
OTHER INFORMATION
ITEM 15. INDEMNIFICATION
Article 10, Section (iv) of Voya Variable Portfolios, Inc.’s Articles of Incorporation, as amended, provides the following:
(iv) The Corporation shall indemnify its officers, directors, employees, and agents and any person who serves at the request of the Corporation as a director, officer, employee, or agent of another corporation, partnership, joint venture, trust, or other enterprise as follows:
(a) Every person who is or has been a director, officer, employee, or agent of the Corporation and persons who serve at the Corporation’s request as director, officer, employee, or agent of another corporation, partnership, joint venture, trust, or other enterprise, shall be indemnified by the Corporation to the fullest extent permitted by law against liability and against all expenses reasonably incurred or paid by him/her in connection with any debt, claim, action, demand, suit, proceeding, judgment, decree, liability, or obligation of any kind in which he/she becomes involved as a party or otherwise by virtue of his/her being or having been a Director, officer, employee, or agent of the Corporation or of another corporation, partnership, joint venture, trust, or other enterprise at the request of the Corporation, and against amounts paid or incurred by him/her in the settlement thereof.
(b) The words “claim,” “action,” “suit,” or “proceeding” shall apply to all claims, actions, suits, or proceedings (civil, criminal, administrative, legislative, investigative, or other, including appeals), actual or threatened, and the words “liability” and “expenses” shall include, without limitation, attorneys’ fees, costs, judgments, amounts paid in settlement, fines, penalties, and other liabilities.
(c) No indemnification shall be provided hereunder to a director, officer, employee, or agent against any liability to the Corporation or its shareholders by reason of willful misfeasance, bad faith, gross negligence, or reckless disregard of the duties involved in the conduct of his office.
(d) The rights of indemnification provided herein may be insured against by policies maintained by the Corporation, shall be several, shall not affect any other rights to which any director, officer, employee or agent may now or hereafter be entitled, shall continue as to a person who has ceased to be such director, officer, employee, or agent, and shall inure to the benefit of the heirs, executors and administrators of such a person.
(e) In the absence of a final decision on the merits by a court or other body before which such proceeding was brought, an indemnification payment will not be made, except as provided in subparagraph (f) of this paragraph (iv), unless in the absence of such a decision, a reasonable determination based upon a factual review has been made:
(1) By a majority vote of a quorum of non-party directors who are “not interested persons” of the Corporation (as defined in the 1940 Act); or
(2) By independent legal counsel in a written opinion that the indemnitee was not liable for an act of willful misfeasance, bad faith, gross negligence, or reckless disregard of duties.
(f) The Corporation further undertakes that advancement of expenses incurred in the defense of a proceeding (upon undertaking for repayment unless it is ultimately determined that indemnification is appropriate) against an officer, director or controlling person of the Corporation will not be made absent the fulfillment of at least one of the following conditions:
(1) The indemnity provides security for his undertaking;
(2) The Corporation is insured against losses arising by reason of any lawful advances; or
(3) A majority of a quorum of non-party directors who are “not interested" persons or independent legal counsel in a written opinion makes a factual determination that there is a reason to believe the indemnity will be entitled to indemnification.
| 1 |
(g) Neither the amendment nor repeal of this paragraph (iv) of Article 9, nor the adoption of any amendment of any other provision of the Charter or Bylaws of the Corporation inconsistent with this paragraph (iv) of Article 10 shall apply to or affect in any respect the applicability of the preceding provisions with respect to any act or failure to act which occurred prior to such amendment, repeal or adoption.
In addition, Voya Variable Portfolios, Inc.’s officers and directors are currently covered under a directors and officers errors and omissions liability insurance policy issued by ICI Mutual Insurance Company, which expires March 31, 2018.
Insofar as indemnification for liabilities arising under the Securities Act of 1933, as amended (the “1933 Act”) may be permitted to directors, officers, and controlling persons of Voya Variable Portfolios, Inc. pursuant to the foregoing provisions or otherwise, Voya Variable Portfolios, Inc. has been advised that in the opinion of the Securities and Exchange Commission such indemnification is against public policy as expressed in the 1933 Act and is therefore, unenforceable. In the event that a claim for indemnification against such liabilities (other than the payment by Voya Variable Portfolios, Inc. of expenses incurred or paid by a director, officer, or controlling person of Voya Variable Portfolios, Inc. in connection with the successful defense of any action, suit or proceeding) is asserted by such director, officer, or controlling person in connection with the shares being registered, Voya Variable Portfolios, Inc. will, unless in the opinion of its counsel the matter has been settled by controlling precedent, submit to a court of appropriate jurisdiction the question whether such indemnification by it is against public policy, as expressed in the Act and be governed by final adjudication of such issue.
Pursuant to Indemnification Agreements between the Company and each Independent Director, the Company indemnifies each Independent Director against any liabilities resulting from the Independent Director’s serving in such capacity, provided that the Independent Director has not engaged in certain disabling conduct.
ITEM 16. EXHIBITS
| 1. | a. | Articles of Amendment and Restatement dated May 1, 2002 – Filed as an Exhibit to Post-Effective Amendment No. 22 to the Registrant’s Form N-1A Registration Statement on April 30, 2004 and incorporated herein by reference. |
| b. | Articles Supplementary dated August 12, 2002 – Filed as an Exhibit to Post-Effective Amendment No. 22 to the Registrant’s Form N-1A Registration Statement on April 30, 2004 and incorporated herein by reference. |
| c. | Articles Supplementary effective April 29, 2005 (issuance of Class ADV shares) – Filed as an Exhibit to Post-Effective Amendment No. 25 to the Registrant’s Form N-1A Registration Statement on April 28, 2005 and incorporated herein by reference. |
| d. | Articles of Amendment dated February 17, 2004 (name change from ING VP Technology Portfolio to ING VP Global Science and Technology Portfolio) – Filed as an Exhibit to Post-Effective Amendment No. 23 to the Registrant’s Form N-1A Registration Statement on February 11, 2005 and incorporated herein by reference. |
| e. | Articles of Amendment dated April 30, 2004 (redesignation of Class R shares to Class I shares) – Filed as an Exhibit to Post-Effective Amendment No. 23 to the Registrant’s Form N-1A Registration Statement on February 11, 2005 and incorporated herein by reference. |
| f. | Articles of Amendment dated November 29, 2007 (dissolve ING VP International Equity Portfolio) – Filed as an Exhibit to Post-Effective Amendment No. 34 to the Registrant’s Form N-1A Registration Statement on January 25, 2008 and incorporated herein by reference. |
| g. | Articles Supplementary dated November 30, 2007 (establishment of new series – ING WisdomTreeSM Global High-Yielding Equity Index Portfolio) – Filed as an Exhibit to Post-Effective Amendment No. 34 to the Registrant’s Form N-1A Registration Statement on January 25, 2008 and incorporated herein by reference. |
| 2 |
| h. | Articles Supplementary dated February 15, 2008 (establishment of new series – ING International Index Portfolio, ING Lehman Brother Aggregate Bond Index® Portfolio, ING MorningTMStar U.S. Growth Index Portfolio, ING RussellTM Large Cap Index Portfolio, ING RussellTM Mid Cap Index Portfolio, and ING RussellTM Small Cap Index Portfolio) – Filed as an Exhibit to Post-Effective Amendment No. 37 to the Registrant’s Form N-1A Registration Statement on February 29, 2008 and incorporated herein by reference. |
| i. | Articles of Amendment effective March 7, 2008 (name change from ING Lehman Brothers Aggregate Bond Index® Portfolio to ING Lehman Brothers U.S. Aggregate Bond Index Portfolio) – Filed as an Exhibit to Post-Effective Amendment No. 39 to the Registrant’s Form N-1A Registration Statement on April 25, 2008 and incorporated herein by reference. |
| j. | Articles of Amendment effective April 28, 2008 (name change from ING VP Global Science and Technology Portfolio to ING BlackRock Global Science and Technology Portfolio; ING VP Growth Portfolio to ING Opportunistic LargeCap Growth Portfolio; and ING VP Value Opportunity Portfolio to ING Opportunistic LargeCap Value Portfolio) – Filed as an Exhibit to Post-Effective Amendment No. 42 to the Registrant’s Form N-1A Registration Statement on August 19, 2008 and incorporated herein by reference. |
| k. | Articles Supplementary dated June 6, 2008 (establishment of new series – ING Russell Global LargeCap Index 85% Portfolio) – Filed as an Exhibit to Post-Effective Amendment No. 42 to the Registrant’s Form N-1A Registration Statement on August 19, 2008 and incorporated herein by reference. |
| l. | Articles of Amendment dated July 9, 2008 (establishment of new series – ING Global Equity Option Portfolio) – Filed as an Exhibit to Post-Effective Amendment No. 42 to the Registrant’s Form N-1A Registration Statement on August 19, 2008 and incorporated herein by reference. |
| m. | Articles Supplementary dated October 15, 2008 (establishment of new series – ING U.S. Government Money Market Portfolio) – Filed as an Exhibit to Post-Effective Amendment No. 44 to the Registrant’s Form N-1A Registration Statement on October 30, 2008 and incorporated herein by reference. |
| n. | Articles Supplementary effective January 23, 2009 (issuance of Service 2 Class shares) – Filed as an Exhibit to Post-Effective Amendment No. 49 to the Registrant’s Form N-1A Registration Statement on February 20, 2009 and incorporated herein by reference. |
| o. | Articles Supplementary dated February 12, 2009 (issuance of ING Russell Large Cap Index Portfolio – Class I shares) – Filed as an Exhibit to Post-Effective Amendment No. 51 to the Registrant’s Form N-1A Registration Statement on April 30, 2009 and incorporated herein by reference. |
| p. | Articles Supplementary dated March 18, 2009 (issuance of ING Hang Seng Index Portfolio, ING Russell Large Cap Growth Index Portfolio, ING Russell Large Cap Value Index Portfolio, ING Russell Large Cap Value Index Portfolio, and ING Russell Mid Cap Growth Index Portfolio – Class ADV, Class I, Class S, and Class S2 shares) – Filed as an Exhibit to Post-Effective Amendment No. 51 to the Registrant’s Form N-1A Registration Statement on April 30, 2009 and incorporated herein by reference. |
| q. | Articles of Amendment effective May 1, 2009 (name change from ING BlackRock Global Science and Technology Portfolio to ING BlackRock Science and Technology Opportunities Portfolio; ING Lehman Brothers U.S. Aggregate Bond Index Portfolio to ING U.S. Bond Index Portfolio; ING Opportunistic LargeCap Value Portfolio to ING Opportunistic LargeCap Portfolio; ING Russell Global Large Cap Index 85% Portfolio to ING Russell Global Large Cap Index 75% Portfolio; ING VP Index Plus LargeCap Portfolio to ING Index Plus LargeCap Portfolio; ING VP Index Plus MidCap Portfolio to ING Index Plus MidCap Portfolio; ING VP Index Plus SmallCap to ING Index Plus SmallCap; and ING VP Small Company Portfolio to ING Small Company Portfolio) – Filed as an Exhibit to Post-Effective Amendment No. 51 to the Registrant’s Form N-1A Registration Statement on April 30, 2009 and incorporated herein by reference. |
| r. | Articles Supplementary dated June 22, 2009 (issuance of ING Dow Jones Euro STOXX 50® Index Portfolio, ING FTSE 100 Index® Portfolio, ING Japan Equity Index Portfolio, and ING NASDAQ 100 Index® Portfolio) – Filed as an Exhibit to Post-Effective Amendment No. 53 to the Registrant’s Form N-1A Registration Statement on July 31, 2009 and incorporated herein by reference. |
| 3 |
| s. | Articles Supplementary dated July 31, 2009 (increase authorized shares of ING International Index Portfolio and ING Russell Large Cap Index Portfolio) – Filed as an Exhibit to Post-Effective Amendment No. 54 to the Registrant’s Form N-1A Registration Statement on February 10, 2010 and incorporated herein by reference. |
| t. | Articles Supplementary dated August 5, 2009 (increase authorized shares of ING Dow Jones Euro STOXX 50® Index Portfolio, ING Russell Mid Cap Index Portfolio, and ING U.S. Bond Index Portfolio) – Filed as an Exhibit to Post-Effective Amendment No. 54 to the Registrant’s Form N-1A Registration Statement on February 10, 2010 and incorporated herein by reference. |
| u. | Articles of Amendment dated September 21, 2009 (dissolution of ING Opportunistic LargeCap Growth Portfolio) – Filed as an Exhibit to Post-Effective Amendment No. 54 to the Registrant’s Form N-1A Registration Statement on February 10, 2010 and incorporated herein by reference. |
| v. | Plan of Liquidation and Dissolution of Series effective October 23, 2009 (liquidation and dissolution of ING Global Equity Option Portfolio) – Filed as an Exhibit to Post-Effective Amendment No. 54 to the Registrant’s Form N-1A Registration Statement on February 10, 2010 and incorporated herein by reference. |
| w. | Articles of Amendment, effective October 30, 2009, (name change from ING Nasdaq 100 Index Portfolio to ING NASDAQ 100® Index Portfolio) – Filed as an Exhibit to Post-Effective Amendment No. 54 to the Registrant’s Form N-1A Registration Statement on February 10, 2010 and incorporated herein by reference. |
| x. | Articles of Amendment, effective April 30, 2010, (name change from ING Dow Jones Euro STOXX 50® Index Portfolio to ING Euro STOXX 50® Index Portfolio, and ING Japan Equity Index Portfolio to ING Japan TOPIX Index® Portfolio) – Filed as an Exhibit to Post-Effective Amendment No. 55 to the Registrant’s Form N-1A Registration Statement on April 28, 2010 and incorporated herein by reference. |
| y. | Articles of Amendment dated July 20, 2010 (dissolution of Class S2 shares of ING Hang Seng Index Portfolio, ING Russell Large Cap Growth Index Portfolio, and ING Russell Large Cap Value Index Portfolio) – Filed as an Exhibit to Post-Effective Amendment No. 58 to the Registrant’s Form N-1A Registration Statement on February 25, 2011 and incorporated herein by reference. |
| z. | Articles of Amendment dated August 10, 2010 (dissolution of ING Global Equity Option Portfolio) – Filed as an Exhibit to Post-Effective Amendment No. 58 to the Registrant’s Form N-1A Registration Statement on February 25, 2011 and incorporated herein by reference. |
| aa. | Articles of Amendment dated September 8, 2010 (dissolution of ING Opportunistic LargeCap Portfolio) – Filed as an Exhibit to Post-Effective Amendment No. 58 to the Registrant’s Form N-1A Registration Statement on February 25, 2011 and incorporated herein by reference. |
| bb. | Articles of Amendment dated January 6, 2011 (dissolution of ING U.S. Government Money Market Portfolio) – Filed as an Exhibit to Post-Effective Amendment No. 58 to the Registrant’s Form N-1A Registration Statement on February 25, 2011 and incorporated herein by reference. |
| cc. | Articles Supplementary dated January 26, 2011 (issuance of Class ADV and Class I shares of ING Australia Index Portfolio) – Filed as an Exhibit to Post-Effective Amendment No. 58 to the Registrant’s Form N-1A Registration Statement on February 25, 2011 and incorporated herein by reference. |
| dd. | Articles Supplementary dated October 19, 2011 (issuance of ING Emerging Markets Index Portfolio) – Filed as an Exhibit to Post-Effective Amendment No. 63 to the Registrant’s Form N-1A Registration Statement on November 28, 2011 and incorporated herein by reference. |
| ee. | Articles of Amendment dated April 13, 2011 (dissolution of ING NASDAQ 100 Index Portfolio) – Filed as an Exhibit to Post-Effective Amendment No. 65 to the Registrant’s Form N-1A Registration Statement on April 26, 2012 and incorporated herein by reference. |
| 4 |
| ff. | Articles Supplementary dated December 11, 2008 (classification and designation of Class I shares of ING Russell Large Cap Index Portfolio) – Filed as an Exhibit to Post-Effective Amendment No. 70 to the Registrant’s Form N-1A Registration Statement on February 11, 2014 and incorporated herein by reference. |
| gg. | Articles of Amendment dated June 19, 2009 (dissolution of ING Morningstar U.S. Growth Index Portfolio) – Filed as an Exhibit to Post-Effective Amendment No. 70 to the Registrant’s Form N-1A Registration Statement on February 11, 2014 and incorporated herein by reference. |
| hh. | Plan of Liquidation and Dissolution of Series effective April 7, 2010 with respect to ING RussellTM Global Large Cap Index 75% Portfolio – Filed as an Exhibit to Post-Effective Amendment No. 70 to the Registrant’s Form N-1A Registration Statement on February 11, 2014 and incorporated herein by reference. |
| ii. | Articles of Amendment dated October 17, 2012 (dissolution of ING WisdomTree Global High-Yielding Equity Index Portfolio Class I shares) – Filed as an Exhibit to Post-Effective Amendment No. 70 to the Registrant’s Form N-1A Registration Statement on February 11, 2014 and incorporated herein by reference. |
| jj. | Articles of Amendment dated April 22, 2013 (dissolution of ING BlackRock Science and Technology Opportunities Portfolio) – Filed as an Exhibit to Post-Effective Amendment No. 70 to the Registrant’s Form N-1A Registration Statement on February 11, 2014 and incorporated herein by reference. |
| kk. | Articles of Amendment effective July 12, 2013 (name change from ING WisdomTree Global High-Yielding Equity Index Portfolio to ING Global Value Advantage Portfolio) – Filed as an Exhibit to Post-Effective Amendment No. 70 to the Registrant’s Form N-1A Registration Statement on February 11, 2014 and incorporated herein by reference. |
| ll. | Articles Supplementary dated August 7, 2013 (increase number of authorized shares of ING U.S. Bond Index Portfolio for Class I) – Filed as an Exhibit to Post-Effective Amendment No. 70 to the Registrant’s Form N-1A Registration Statement on February 11, 2014 and incorporated herein by reference. |
| mm. | Articles Supplementary dated April 7, 2014 (classification and designation of Class I shares for Voya Global Value Advantage Portfolio and authorizing the increase in number of authorized shares of Class ADV shares of Voya International Index Portfolio) – Filed as an Exhibit to Post-Effective Amendment No. 71 to the Registrant’s Form N-1A Registration Statement on April 28, 2014 and incorporated herein by reference. |
| nn. | Articles of Amendment effective May 1, 2014 (change of names of Registrant and Series) – Filed as an Exhibit to Post-Effective Amendment No. 71 to the Registrant’s Form N-1A Registration Statement on April 28, 2014 and incorporated herein by reference. |
| oo. | Articles Supplementary dated September 23, 2014 (classification and designation of Class T shares for Voya Global Value Advantage Portfolio) – Filed as an Exhibit to Post-Effective Amendment No. 74 to the Registrant’s Form N-1A Registration Statement on November 13, 2014 and incorporated herein by reference. |
| pp. | Articles Supplementary dated November 21, 2014 (increase number of authorized shares of Voya Global Value Advantage Portfolio for Class S) – Filed as an Exhibit to Post-Effective Amendment No. 76 to the Registrant’s Form N-1A Registration Statement on February 11, 2015 and incorporated herein by reference. |
| qq. | Articles Supplementary dated June 26, 2015 (increase number of authorized shares of Voya Global Value Advantage Portfolio for Class S) – Filed as an Exhibit to Post-Effective Amendment No. 79 to the Registrant’s Form N-1A Registration Statement on September 21, 2015 and incorporated herein by reference. |
| 5 |
| rr. | Articles Supplementary dated October 15, 2015 (classification and designation of class R6 shares of Voya Small Company Portfolio) – Filed as an Exhibit to Post-Effective Amendment No. 80 to the Registrant’s Form N-1A Registration Statement on November 19, 2015 and incorporated herein by reference. |
| ss. | Articles of Amendment effective May 1, 2016 (name change from Voya Global Value Advantage Portfolio to Voya Global Equity Portfolio) – Filed as an Exhibit to Post-Effective Amendment No. 83 to the Registrant’s Form N-1A Registration Statement on April 27, 2016 and incorporated herein by reference. |
| tt. | Articles Supplementary dated April 6, 2017 (classification and designation of class P2 shares of Voya Emerging Markets Index Portfolio, Voya International Index Portfolio, Voya Russell Mid Cap Index Portfolio, Voya Russell Small Cap Index Portfolio, and Voya U.S. Bond Index Portfolio) – Filed as an Exhibit to Post-Effective Amendment No. 86 to the Registrant’s Form N-1A Registration Statement on April 27, 2017 and incorporated herein by reference. |
| uu. | Articles Supplementary dated February 1, 2018 (increasing the number of authorized class P2 shares for Voya U.S. Bond Index Portfolio) – Filed as an Exhibit to Post-Effective Amendment No. 89 to the Registrant’s Form N-1A Registration Statement on April 26, 2018 and incorporated herein by reference. |
| 2. | a. | Second Amended and Restated Bylaws – Filed as an Exhibit to the Post-Effective Amendment No. 27 to the Registrant’s Form N-1A Registration Statement on April 27, 2006 and incorporated herein by reference. |
| i. | Amendment adopted on March 11, 2010, to the Second Amended and Restated By-Laws of Voya Variable Portfolios, Inc. – Filed as an Exhibit to Post-Effective Amendment No. 58 to the Registrant’s Form N-1A Registration Statement on February 25, 2011 and incorporated herein by reference. |
| 3. | Not Applicable. |
| 4. | Agreement and Plan of Reorganization between Voya Multi-Manager Large Cap Core Portfolio, a series of Voya Investors Trust, and Voya Index Plus LargeCap Portfolio, a series of Voya Variable Portfolios, Inc.– Attached as Appendix A to the Proxy Statement/Prospectus. |
| 5. | Instruments Defining Rights of Holders – Filed as an Exhibit to Pre-Effective Amendment No. 1 to the Registrant’s Form N-1A Registration Statement on June 4, 1996 and incorporated herein by reference. |
| 6. | a. | Amended and Restated Investment Management Agreement between Voya Investments, LLC and Voya Variable Portfolios, Inc. dated November 18, 2014 as amended and restated May 1, 2015 – Filed as an Exhibit to Post-Effective Amendment No. 79 to the Registrant’s Form N-1A Registration Statement on September 21, 2015 and incorporated herein by reference. |
| i. | Waiver Letter dated May 1, 2018 to the Amended and Restated Investment Management Agreement between Voya Investments, LLC and Voya Variable Portfolios, Inc., dated November 18, 2014, as amended and restated on May 1, 2015 with respect to Voya RussellTM Large Cap Growth Index Portfolio, Voya RussellTM Large Cap Value Index Portfolio, and Voya RussellTM Mid Cap Growth Index Portfolio – Filed as an Exhibit to Post-Effective Amendment No. 89 to the Registrant’s Form N-1A Registration Statement on April 26, 2018 and incorporated herein by reference. |
| ii. | Waiver Letter dated May 1, 2018 to the Amended and Restated Investment Management Agreement between Voya Investments, LLC and Voya Variable Portfolios, Inc., dated November 18, 2014, as amended and restated on May 1, 2015 with respect to Voya Australia Index Portfolio, Voya Euro STOXX 50® Portfolio, Voya FTSE 100 Index® Portfolio, and Voya Japan TOPIX Index® Portfolio – Filed as an Exhibit to Post-Effective Amendment No. 89 to the Registrant’s Form N-1A Registration Statement on April 26, 2018 and incorporated herein by reference. |
| iii. | Side Letter Agreement dated May 1, 2018 to the Amended and Restated Investment Management Agreement between Voya Investments, LLC and Voya Variable Portfolios, Inc., dated November 18, 2014, as amended and restated on May 1, 2015 with respect to Voya Russell™ Large Cap Growth Index Portfolio and Voya Russell™ Large Cap Value Index Portfolio – Filed as an Exhibit to Post-Effective Amendment No. 89 to the Registrant’s Form N-1A Registration Statement on April 26, 2018 and incorporated herein by reference. |
| 6 |
| iv. | Waiver Letter dated May 1, 2018 to the Amended and Restated Investment Management Agreement between Voya Investments, LLC and Voya Variable Portfolios, Inc., dated November 18, 2014, as amended and restated on May 1, 2015 with respect to Voya Emerging Markets Index Portfolio – Filed as an Exhibit to Post-Effective Amendment No. 89 to the Registrant’s Form N-1A Registration Statement on April 26, 2018 and incorporated herein by reference. |
| v. | Waiver Letter dated May 1, 2018 to the Amended and Restated Investment Management Agreement between Voya Investments, LLC and Voya Variable Portfolios, Inc., dated November 18, 2014, as amended and restated on May 1, 2015 with respect to Voya Hang Seng Index Portfolio – Filed as an Exhibit to Post-Effective Amendment No. 89 to the Registrant’s Form N-1A Registration Statement on April 26, 2018 and incorporated herein by reference. |
| b. | Sub-Advisory Agreement between Voya Investments, LLC and Voya Investment Management Co. LLC dated November 18, 2014 – Filed as an Exhibit to Post-Effective Amendment No. 77 to the Registrant’s Form N-1A Registration Statement on April 28, 2015 and incorporated herein by reference. |
| i. | Waiver Letter dated May 1, 2018 to the Sub-Advisory Agreement between Voya Investments, LLC and Voya Investment Management Co. LLC dated November 18, 2014 with respect to Voya Australia Index Portfolio, Voya Emerging Markets Index Portfolio, Voya Euro STOXX 50® Portfolio, Voya FTSE 100 Index® Portfolio, and Voya Japan TOPIX Index® Portfolio – Filed as an Exhibit to Post-Effective Amendment No. 89 to the Registrant’s Form N-1A Registration Statement on April 26, 2018 and incorporated herein by reference. |
| c. | Expense Limitation Agreement between Voya Investments, LLC and Voya Variable Portfolios, Inc. dated January 1, 2016 – Filed as an Exhibit to Post-Effective Amendment No. 83 to the Registrant’s Form N-1A Registration Statement on April 28, 2016 and incorporated herein by reference. |
| i. | Amended Schedule A effective May 1, 2018 to the Expense Limitation Agreement between Voya Investments, LLC and Voya Variable Portfolios, Inc. dated January 1, 2016 – Filed as an Exhibit to Post-Effective Amendment No. 89 to the Registrant’s Form N-1A Registration Statement on April 26, 2018 and incorporated herein by reference. |
| ii. | Side Letter Agreement dated January 1, 2018 (Voya Russell™ Large Cap Index Portfolio, Voya Russell™ Mid Cap Growth Index Portfolio and Voya Russell™ Mid Cap Index Portfolio) to the Expense Limitation Agreement between Voya Investments, LLC and Voya Variable Portfolios, Inc. dated January 1, 2016 – Filed as an Exhibit to Post-Effective Amendment No. 89 to the Registrant’s Form N-1A Registration Statement on April 26, 2018 and incorporated herein by reference. |
| iii. | Side Letter Agreement dated May 1, 2018 (Voya International Index Portfolio) to the Expense Limitation Agreement between Voya Investments, LLC and Voya Variable Portfolios, Inc. dated January 1, 2016 – Filed as an Exhibit to Post-Effective Amendment No. 89 to the Registrant’s Form N-1A Registration Statement on April 26, 2018 and incorporated herein by reference. |
| iv. | Side Letter Agreement dated May 1, 2018 (Voya Global Equity Portfolio) to the Expense Limitation Agreement between Voya Investments, LLC and Voya Variable Portfolios, Inc. dated January 1, 2016 – Filed as an Exhibit to Post-Effective Amendment No. 89 to the Registrant’s Form N-1A Registration Statement on April 26, 2018 and incorporated herein by reference. |
| 7. | Distribution Agreement between Voya Variable Portfolios, Inc. and Voya Investments Distributor, LLC dated November 18, 2014 – Filed as an Exhibit to Post-Effective Amendment No. 76 to the Registrant’s Form N-1A Registration Statement on February 11, 2014 and incorporated herein by reference. |
| 7 |
| 8. | Directors' Deferred Compensation Plan, effective September 15, 2005 – Filed as an Exhibit to Post-Effective Amendment No. 42 to the Registrant’s Form N-1A Registration Statement on August 19, 2008 and incorporated herein by reference. |
| 9. | a. | Custody Agreement with The Bank of New York Mellon dated January 6, 2003 – Filed as an Exhibit to Post-Effective Amendment No. 22 to the Registrant’s Form N-1A Registration Statement on April 30, 2004 and incorporated herein by reference. |
| i. | Amended Exhibit A dated July 14, 2017 to the Custody Agreement with The Bank of New York Mellon dated January 6, 2003 – Filed as an Exhibit to Post-Effective Amendment No. 89 to the Registrant’s Form N-1A Registration Statement on April 26, 2018 and incorporated herein by reference. |
| b. | Foreign Custody Manager Agreement with The Bank of New York Mellon dated January 6, 2003 – Filed as an Exhibit to Post-Effective Amendment No. 22 to the Registrant’s Form N-1A Registration Statement on April 30, 2004 and incorporated herein by reference. |
| i. | Amended Exhibit A dated July 14, 2017 to the Foreign Custody Manager Agreement with The Bank of New York Mellon dated January 6, 2003 – Filed as an Exhibit to Post-Effective Amendment No. 89 to the Registrant’s Form N-1A Registration Statement on April 26, 2018 and incorporated herein by reference. |
| ii. | Amended Schedule 2, effective June 4, 2008, to the Foreign Custody Manager Agreement with the Bank of New York Mellon dated January 6, 2003 – Filed as an Exhibit to Post-Effective Amendment No. 42 to the Registrant’s Form N-1A Registration Statement on August 19, 2008 and incorporated herein by reference. |
| c. | Securities Lending Agreement and Guaranty with The Bank of New York Mellon dated August 7, 2003 – Filed as an Exhibit to Post-Effective Amendment No. 22 to the Registrant’s Form N-1A Registration Statement on April 30, 2004 and incorporated herein by reference. |
| i. | Amended Exhibit A dated July 14, 2017 to the Securities Lending Agreement and Guaranty with The Bank of New York Mellon dated August 7, 2003 – Filed as an Exhibit to Post-Effective Amendment No. 89 to the Registrant’s Form N-1A Registration Statement on April 26, 2018 and incorporated herein by reference. |
| ii. | Amendment, effective October 1, 2011, to Securities Lending Agreement and Guaranty with The Bank of New York Mellon dated August 7, 2003 – Filed as an Exhibit to Post-Effective Amendment No. 63 to the Registrant’s Form N-1A Registration Statement on November 28, 2011 and incorporated herein by reference. |
| 10. | a. | Fourth Amended and Restated Shareholder Services and Distribution Plan for Class S shares effective November 16, 2017 – Filed as an Exhibit to Post-Effective Amendment No. 89 to the Registrant’s Form N-1A Registration Statement on April 26, 2018 and incorporated herein by reference. |
| b. | Third Amended and Restated Shareholder Service and Distribution Plan for Class ADV shares effective November 16, 2017 – Filed as an Exhibit to Post-Effective Amendment No. 89 to the Registrant’s Form N-1A Registration Statement on April 26, 2018 and incorporated herein by reference. |
| i. | Waiver Letter dated May 1, 2018 to the Third Amended and Restated Shareholder Service and Distribution Plan for Class ADV shares effective November 16, 2017 with respect to Voya International Index Portfolio – Filed as an Exhibit to Post-Effective Amendment No. 89 to the Registrant’s Form N-1A Registration Statement on April 26, 2018 and incorporated herein by reference. |
| c. | Fourth Amended and Restated Shareholder Services and Distribution Plan for Class S2 shares between Voya Variable Portfolios, Inc. and Voya Investments Distributor, LLC effective November 16, 2017 – Filed as an Exhibit to Post-Effective Amendment No. 89 to the Registrant’s Form N-1A Registration Statement on April 26, 2018 and incorporated herein by reference. |
| 8 |
| d. | Amended and Restated Shareholder Servicing Plan for Class T shares between Voya Variable Portfolios, Inc. and Voya Investments Distributor, LLC effective November 16, 2017 – Filed as an Exhibit to Post-Effective Amendment No. 89 to the Registrant’s Form N-1A Registration Statement on April 26, 2018 and incorporated herein by reference. |
| e. | Amended and Restated Distribution Plan for Class T shares between Voya Variable Portfolios, Inc. and Voya Investments Distributor, LLC effective November 16, 2017 – Filed as an Exhibit to Post-Effective Amendment No. 89 to the Registrant’s Form N-1A Registration Statement on April 26, 2018 and incorporated herein by reference. |
| i. | Waiver Letter dated May 1, 2018 to the Amended and Restated Distribution Plan for Class T shares between Voya Variable Portfolios, Inc. and Voya Investments Distributor, LLC effective November 16, 2017 – Filed as an Exhibit to Post-Effective Amendment No. 89 to the Registrant’s Form N-1A Registration Statement on April 26, 2018 and incorporated herein by reference. |
| f. | Third Amended and Restated Multi-Class Plan pursuant to Rule 18f-3 for Voya Variable Portfolios, Inc., effective March 9, 2017 – Filed as an Exhibit to Post-Effective Amendment No. 89 to the Registrant’s Form N-1A Registration Statement on April 26, 2018 and incorporated herein by reference. |
| 11. | Opinion and Consent of Counsel – Filed herein. |
| 12. | Opinion and Consent of Counsel Supporting Tax Matters and Consequences – To be filed by subsequent post-effective amendment. |
| 13. | a. | License Agreement between Aetna Services, Inc. and Aetna Variable Portfolios, Inc. dated June 19, 1996 – Filed as an Exhibit to Post-Effective Amendment No. 1 to the Registrant’s Form N-1A Registration Statement on March 7, 1997 and incorporated herein by reference. |
| b. | Fund Accounting Agreement with The Bank of New York Mellon dated January 6, 2003 – Filed as an Exhibit to Post-Effective Amendment No. 22 to the Registrant’s Form N-1A Registration Statement on April 30, 2004 and incorporated herein by reference. |
| i. | Amended Exhibit A dated July 14, 2017 to the Fund Accounting Agreement with The Bank of New York Mellon dated January 6, 2003 – Filed as an Exhibit to Post-Effective Amendment No. 89 to the Registrant’s Form N-1A Registration Statement on April 26, 2018 and incorporated herein by reference. |
| ii. | Investment Company Reporting Modernization Services Amendment to Fund Accounting Agreement dated February 1, 2018, to the Fund Accounting Agreement with The Bank of New York Mellon dated January 6, 2003 – Filed as an Exhibit to Post-Effective Amendment No. 89 to the Registrant’s Form N-1A Registration Statement on April 26, 2018 and incorporated herein by reference. |
| c. | Allocation Agreement (Investment Company Blanket Bond) dated September 24, 2003 – Filed as an Exhibit to Post-Effective Amendment No. 22 to the Registrant’s Form N-1A Registration Statement on April 30, 2004 and incorporated herein by reference. |
| i. | Amended Schedule A dated April 2007 to the Allocation Agreement dated September 24, 2003 – Filed as an Exhibit to Post-Effective Amendment No. 55 to the Registrant’s Form N-1A Registration Statement on April 28, 2010 and incorporated herein by reference. |
| d. | Allocation Agreement (Directors and Officers Liability) dated September 26, 2002 – Filed as an Exhibit to Post-Effective Amendment No. 29 to the Registrant’s Form N-1A Registration Statement on April 27, 2007 and incorporated herein by reference. |
| i. | Amended Schedule A dated April 2007 to the Allocation Agreement (Directors and Officers Liability) dated September 26, 2002 – Filed as an Exhibit to Post-Effective Amendment No. 39 to the Registrant’s Form N-1A Registration Statement on April 25, 2008 and incorporated herein by reference. |
| 9 |
| e. | Transfer Agency Services Agreement with BNY Mellon Investment Servicing (U.S.) Inc. (formerly, PNC Global Investment Servicing (U.S.) Inc.) dated February 25, 2009 – Filed as an Exhibit to Post-Effective Amendment No. 51 to the Registrant’s Form N-1A Registration Statement on April 30, 2009 and incorporated herein by reference. |
| i. | Amendment, effective February 8, 2011, to the Transfer Agency Services Agreement with BNY Mellon Investment Servicing (U.S.) Inc. dated February 25, 2009 – Filed as an Exhibit to Post-Effective Amendment No. 60 to the Registrant’s Form N-1A Registration Statement on April 25, 2011 and incorporated herein by reference. |
| ii. | Amended Exhibit A dated January 20, 2017 to the Transfer Agency Services Agreement dated February 25, 2009 – Filed as an Exhibit to Post-Effective Amendment No. 89 to the Registrant’s Form N-1A Registration Statement on April 26, 2018 and incorporated herein by reference. |
| 14. | Consent of independent registered public accounting firm – Filed herein. |
| 15. | Not applicable. |
| 16. | Powers of Attorney – Filed herein. |
| 17. | Not applicable. |
ITEM 17. UNDERTAKINGS
| 1. | The undersigned registrant agrees that prior to any public reoffering of the securities registered through the use of a prospectus which is a part of this registration statement by any person or party who is deemed to be an underwriter within the meaning of Rule 145(c) under the Securities Act (17 CFR 230.145(c)), the reoffering prospectus will contain the information called for by the applicable registration form for reofferings by persons who may be deemed underwriters, in addition to the information called for by the other items of the applicable form. |
| 2. | The undersigned registrant agrees that every prospectus that is filed under paragraph (1) above will be filed as a part of an amendment to the registration statement and will not be used until the amendment is effective, and that, in determining any liability under the 1933 Act, each post-effective amendment shall be deemed to be a new registration statement for the securities offered therein, and the offering of the securities at that time shall be deemed to be the initial bona fide offering of them. |
| 3. | The undersigned registrant undertakes to file a post-effective amendment to this registration statement upon the closing of the reorganization described in this registration statement that contains an opinion of counsel supporting the tax matters. |
| 10 |
SIGNATURES
Pursuant to the requirements of the Securities Act of 1933, as amended (the “1933 Act”), the Registrant has duly caused this Registration Statement on Form N-14 to be signed on its behalf by the undersigned, thereunto duly authorized, in the city of Scottsdale and State of Arizona on the 17th day of April, 2019.
| Voya Variable Portfolios, Inc. | |||
| By: | /s/ Huey P. Falgout, Jr. | ||
| Huey P. Falgout, Jr. | |||
| Secretary | |||
Pursuant to the requirements of the 1933 Act, this Registration Statement has been signed below by the following persons in the capacities and on the date indicated.
| Signature | Title | Date | ||
| Michael Bell* | Chief Executive Officer | April 17, 2019 | ||
| Todd Modic* | Senior Vice President Chief/Principal Financial Officer | April 17, 2019 | ||
| Dina Santoro* | Interested Director and President | April 17, 2019 | ||
| Colleen D. Baldwin* | Director | April 17, 2019 | ||
| John V. Boyer* | Director | April 17, 2019 | ||
| Patricia W. Chadwick* | Director | April 17, 2019 | ||
| Martin J. Gavin* | Director | April 17, 2019 | ||
| Russell H. Jones* | Director | April 17, 2019 | ||
| Joseph E. Obermeyer* | Director | April 17, 2019 | ||
| Sheryl K. Pressler* | Director | April 17, 2019 | ||
| Christopher P. Sullivan* | Director | April 17, 2019 | ||
| Roger B. Vincent* | Director | April 17, 2019 | ||
| *By: | /s/ Huey P. Falgout, Jr. | |
| Huey P. Falgout, Jr. | ||
| as Attorney-in-Fact** |
| ** | Powers of Attorney for Michael Bell, Todd Modic and each Trustee - Filed herein. |
EXHIBIT INDEX
| EXHIBIT NUMBER | EXHIBIT DESCRIPTION |
| (11) | Opinion and Consent of Counsel |
| (14) | Consent of Independent Registered Public Accounting Firm |
| (16) | Powers of Attorney |