UNITED STATES
SECURITIES AND EXCHANGE COMMISSION
WASHINGTON, D.C. 20549
FORM N-CSR
CERTIFIED SHAREHOLDER REPORT OF REGISTERED MANAGEMENT
INVESTMENT COMPANIES
Investment Company Act file number 811-07657
Oppenheimer Developing Markets Fund
(Exact name of registrant as specified in charter)
6803 South Tucson Way, Centennial, Colorado 80112-3924
(Address of principal executive offices) (Zip code)
Cynthia Lo Bessette
OFI Global Asset Management, Inc.
225 Liberty Street, New York, New York 10281-1008
(Name and address of agent for service)
Registrant’s telephone number, including area code: (303) 768-3200
Date of fiscal year end: August 31
Date of reporting period: 2/28/2018
Item 1. Reports to Stockholders.
Table of Contents
Class A Shares
AVERAGE ANNUAL TOTAL RETURNS AT 2/28/18
| | | | | | | | | | | | |
| | | Class A Shares of the Fund | | | |
| | | | | Without Sales Charge | | With Sales Charge | | | | MSCI Emerging
Markets Index | |
| 6-Month | | | | 8.33% | | 2.10% | | | | | 10.58% | |
| 1-Year | | | | 29.90 | | 22.43 | | | | | 30.51 | |
| 5-Year | | | | 5.42 | | 4.17 | | | | | 5.02 | |
| 10-Year | | | | 5.23 | | 4.60 | | | | | 2.65 | |
Performance data quoted represents past performance, which does not guarantee future results. The investment return and principal value of an investment in the Fund will fluctuate so that an investor’s shares, when redeemed, may be worth more or less than their original cost. Fund returns include changes in share price, reinvested distributions, and a 5.75% maximum applicable sales charge except where “without sales charge” is indicated. Current performance may be lower or higher than the performance quoted. Returns do not consider capital gains or income taxes on an individual’s investment. Returns for periods of less than one year are cumulative and not annualized. For performance data current to the most recent month-end, visit oppenheimerfunds.com or call 1.800.CALL OPP (225.5677). See Fund prospectuses and summary prospectuses for more information on share classes and sales charges.
|
| 2 OPPENHEIMER DEVELOPING MARKETS FUND |
Fund Performance Discussion
The Fund’s Class A shares (without sales charge) returned 8.33% during the six-month reporting period ended February 28, 2018. In comparison, the Fund underperformed the MSCI Emerging Markets Index (the “Index”), which returned 10.58%. On a sector basis, the Fund’s underperformance versus the Index stemmed largely from stock selection in the Consumer Staples, Consumer Discretionary and Financials sectors. An underweight position in the Energy sector also detracted from performance. The Fund outperformed the Index in the Information Technology sector due to stock selection. An overweight position in Health Care and underweight position in Telecommunication Services also benefitted. In terms of countries, stock selection in Russia, South Africa and Brazil detracted from performance. Positive stock selection in South Korea and Taiwan, along with an overweight position in France contributed to the Fund’s performance.
MARKET OVERVIEW
Emerging markets (EM) ended 2017 up a cumulative 77% off their lows in 2016 as measured by the MSCI EM Index, significantly outperforming their developed market counterparts. Volatility returned to close the reporting period, as concerns over rising interest rates and inflation resulted in the first market correction since 2016 in February 2018. However, we continue to believe that EM equities have the potential to further outperform U.S. equities as business cycles are less advanced in much of the developing world. Unlike 2016 and 2017, where momentum styles outperformed, we believe this is the point in the EM equity market cycle where fundamental stock pickers can generate meaningful alpha as focus turns to companies that have the ability to generate sustainable corporate earnings growth.
FUND REVIEW
Top contributors to performance this reporting period included Tencent Holdings Ltd., Taiwan Semiconductor Manufacturing Co., Ltd. and FirstRand Limited.
Tencent Holdings, a Chinese Internet company and one of the Fund’s largest positions, had a period of strong share price appreciation. The company is a dominant player in the Chinese consumer market, including gaming, messaging, payments and content. These businesses are seeing strong momentum and improving monetization. Advertising, a traditional source of revenue for most Internet companies, has only recently started to make a significant contribution and we expect that revenue stream will continue to grow at a strong pace. While the company continues to invest and refine existing business segments, it is also investing in new opportunities,
|
| 3 OPPENHEIMER DEVELOPING MARKETS FUND |
including an international expansion and Artificial Intelligence.
Taiwan Semiconductor Manufacturing (“TSMC”), a manufacturer and marketer of integrated circuits, exhibited strong performance this reporting period. More recently, the stock saw a pull-back in its share price that is attributed to profit taking and several analysts downgrading the stock towards month end. We believe that TSMC’s significant spending on capital expenditure and Research and Development over the last few years has given them market share dominance that will remain unrivaled in the near term. In the long term, we expect TSMC to be a cornerstone of the next wave of the technology industry’s innovation boom—Artificial Intelligence, Big Data, Autonomous Driving, etc.
FirstRand is one of the largest banks in South Africa. The South African banking sector is an attractive one, given its concentration. Among the top banks, FirstRand is well-regarded for its industry leading return on equity, conservative provisioning, and entrepreneurial and innovative culture. Despite a challenging economic environment, FirstRand has been able to deliver solid results. Over the long term, the bank has a major growth opportunity through diversification into asset management and insurance.
Detractors from performance this reporting period included Steinhoff International Holdings NV, Magnit PJSC and Ctrip.com International Ltd.
Steinhoff International, the world’s second-largest household products and furniture retailer has been transforming itself into a vertically integrated, diversified global mass market retailer through acquisitions. The company doubled its sales over the last couple of years, which increased corporate structure complexities attributable to a growing number of businesses globally and its decentralized operating approach. Concerns around unresolved legal and tax disputes along with recently reported accounting irregularities resulted in the resignation of the CEO and the Chairman of the Board, and delays in reporting fiscal year 2017 results. These events created a panic in the markets and resulted in a significant correction in the share price. An external auditor, PWC, has been appointed to conduct an accounting review. We will continue to monitor the situation closely and evaluate as new information becomes publicly available.
Magnit, a leading Russian food retailer, has been operating in a challenging environment. The relatively weak Russian economy has resulted in lower disposable income levels that have affected Magnit’s core consumer base. This, along with an increasingly intense competitive landscape and a major refurbishment program, led to weak operating results. We believe that fundamentals should begin to improve in 2018 as refurbished stores help drive sales growth and the consumer environment begins to improve.
Ctrip.com is a Chinese online travel aggregator. Over the long term, we expect the
|
| 4 OPPENHEIMER DEVELOPING MARKETS FUND |
company to benefit from significant growth in both domestic and international travel on the back of rising disposable income. We believe China will be one of the largest sources of global travel growth over the next decade and Ctrip.com is well positioned to benefit, especially given the increasing penetration of online bookings. The stock has come under some pressure recently due to the negative impact on earnings of the requirement to unbundle its services. We do not believe that this affects Ctrip’s long-term opportunities.
STRATEGY & OUTLOOK
We continue to believe that EM should be an increasingly core allocation for global investors. EM now represents a meaningful portion of global GDP and is the largest
contributor to global growth. Most investors are still under-allocated to the asset class and, especially for those who invest through passive vehicles, to the areas of EM that exhibit the most attractive growth characteristics.
Our approach to investing and the positioning of the portfolio remain unchanged. We are long-term investors in extraordinary companies that have massive competitive advantages and real options that manifest themselves over many years. We have exposure to sectors and industries where we see dynamic change and real value being extracted including ecommerce, cloud computing, Internet services, healthcare, travel and education.
| | |
 | | 
Justin Leverenz, CFA Portfolio Manager |
|
| 5 OPPENHEIMER DEVELOPING MARKETS FUND |
Top Holdings and Allocations
TOP TEN COMMON STOCK HOLDINGS
| | | | |
| Taiwan Semiconductor Manufacturing Co. Ltd. | | | 5.9 | % |
| Alibaba Group Holding Ltd., Sponsored ADR | | | 5.7 | |
| Tencent Holdings Ltd. | | | 5.1 | |
| Housing Development Finance Corp. Ltd. | | | 3.4 | |
| Novatek PJSC, Sponsored GDR | | | 3.1 | |
| Glencore plc | | | 3.0 | |
| Kering SA | | | 2.5 | |
| AIA Group Ltd. | | | 2.3 | |
| Kotak Mahindra Bank Ltd. | | | 2.1 | |
| FirstRand Ltd. | | | 2.1 | |
Portfolio holdings and allocations are subject to change. Percentages are as of February 28, 2018, and are based on net assets. For more current Fund holdings, please visit oppenheimerfunds.com.
TOP TEN GEOGRAPHICAL HOLDINGS
| | | | |
| China | | | 23.2 | % |
| India | | | 11.6 | |
| Russia | | | 7.7 | |
| South Korea | | | 7.2 | |
| Brazil | | | 6.3 | |
| Taiwan | | | 6.2 | |
| Mexico | | | 4.7 | |
| France | | | 4.7 | |
| Hong Kong | | | 4.2 | |
| South Africa | | | 3.8 | |
Portfolio holdings and allocation are subject to change. Percentages are as of February 28, 2018, and are based on total market value of investments.
REGIONAL ALLOCATION
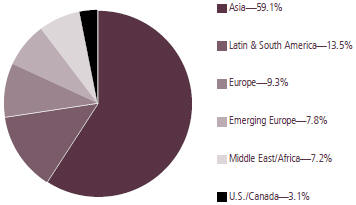
Portfolio holdings and allocations are subject to change. Percentages are as of February 28, 2018, and are based on the total market value of investments.
|
| 6 OPPENHEIMER DEVELOPING MARKETS FUND |
Share Class Performance
AVERAGE ANNUAL TOTAL RETURNS WITHOUT SALES CHARGE AS OF 2/28/18
| | | | | | | | | | | | |
| | | Inception Date | | 6-Month | | 1-Year | | 5-Year | | 10-Year | | |
| Class A (ODMAX) | | 11/18/96 | | 8.33% | | 29.90% | | 5.42% | | 5.23% | | |
| Class B (ODVBX) | | 11/18/96 | | 7.93 | | 28.92 | | 4.61 | | 4.71 | | |
| Class C (ODVCX) | | 11/18/96 | | 7.92 | | 28.92 | | 4.64 | | 4.47 | | |
| Class I (ODVIX) | | 12/29/11 | | 8.56 | | 30.44 | | 5.89 | | 8.31* | | |
| Class R (ODVNX) | | 3/1/01 | | 8.20 | | 29.57 | | 5.15 | | 4.90 | | |
| Class Y (ODVYX) | | 9/7/05 | | 8.44 | | 30.21 | | 5.70 | | 5.52 | | |
| | |
| AVERAGE ANNUAL TOTAL RETURNS WITH SALES CHARGE AS OF 2/28/18 | | | | |
| | | Inception Date | | 6-Month | | 1-Year | | 5-Year | | 10-Year | | |
| Class A (ODMAX) | | 11/18/96 | | 2.10% | | 22.43% | | 4.17% | | 4.60% | | |
| Class B (ODVBX) | | 11/18/96 | | 2.93 | | 23.92 | | 4.27 | | 4.71 | | |
| Class C (ODVCX) | | 11/18/96 | | 6.92 | | 27.92 | | 4.64 | | 4.47 | | |
| Class I (ODVIX) | | 12/29/11 | | 8.56 | | 30.44 | | 5.89 | | 8.31* | | |
| Class R (ODVNX) | | 3/1/01 | | 8.20 | | 29.57 | | 5.15 | | 4.90 | | |
| Class Y (ODVYX) | | 9/7/05 | | 8.44 | | 30.21 | | 5.70 | | 5.52 | | |
*Shows performance since inception.
Performance data quoted represents past performance, which does not guarantee future results. The investment return and principal value of an investment in the Fund will fluctuate so that an investor’s shares, when redeemed, may be worth more or less than their original cost. Current performance may be lower or higher than the performance quoted. Returns do not consider capital gains or income taxes on an individual’s investment. For performance data current to the most recent month-end, visit oppenheimerfunds.com or call 1.800. CALL OPP (225.5677). Fund returns include changes in share price, reinvested distributions, and the applicable sales charge: for Class A shares, the current maximum initial sales charge of 5.75%; for Class B shares, the contingent deferred sales charge of 5% (1-year) and 2% (5-year); and for Class C shares, the contingent deferred sales charge of 1% for the 1-year period. There is no sales charge for Class I, Class R and Class Y shares. Because Class B shares convert to Class A shares 72 months after purchase, the 10-year return for Class B shares uses Class A performance for the period after conversion. Returns for periods of less than one year are cumulative and not annualized. See Fund prospectuses and summary prospectuses for more information on share classes and sales charges.
The Fund’s performance is compared to the performance of the MSCI Emerging Markets Index, which is designed to measure equity market performance of emerging markets. The Index is unmanaged and cannot be purchased directly by investors. While index comparisons may be useful to provide a benchmark for the Fund’s performance, it must be noted that the Fund’s investments are not limited to the investments comprising the Index. Index performance includes reinvestment of income, but does not reflect transaction costs, fees, expenses or taxes. Index performance is shown for illustrative purposes only as a benchmark for the Fund’s
|
| 7 OPPENHEIMER DEVELOPING MARKETS FUND |
performance, and does not predict or depict performance of the Fund. The Fund’s performance reflects the effects of the Fund’s business and operating expenses.
The views in the Fund Performance Discussion represent the opinions of this Fund’s portfolio managers and are not intended as investment advice or to predict or depict the performance of any investment. These views are as of the close of business on February 28, 2018, and are subject to change based on subsequent developments. The Fund’s portfolio and strategies are subject to change.
Before investing in any of the Oppenheimer funds, investors should carefully consider a fund’s investment objectives, risks, charges and expenses. Fund prospectuses and summary prospectuses contain this and other information about the funds, and may be obtained by asking your financial advisor, visiting oppenheimerfunds.com, or calling 1.800.CALL OPP (225.5677). Read prospectuses and summary prospectuses carefully before investing.
Shares of Oppenheimer funds are not deposits or obligations of any bank, are not guaranteed by any bank, are not insured by the FDIC or any other agency, and involve investment risks, including the possible loss of the principal amount invested.
|
| 8 OPPENHEIMER DEVELOPING MARKETS FUND |
Fund Expenses
Fund Expenses. As a shareholder of the Fund, you incur two types of costs: (1) transaction costs, which may include sales charges (loads) on purchase payments and/or contingent deferred sales charges on redemptions; and (2) ongoing costs, including management fees; distribution and service fees; and other Fund expenses. These examples are intended to help you understand your ongoing costs (in dollars) of investing in the Fund and to compare these costs with the ongoing costs of investing in other mutual funds.
The examples are based on an investment of $1,000.00 invested at the beginning of the period and held for the entire 6-month period ended February 28, 2018.
Actual Expenses. The first section of the table provides information about actual account values and actual expenses. You may use the information in this section for the class of shares you hold, together with the amount you invested, to estimate the expense that you paid over the period. Simply divide your account value by $1,000.00 (for example, an $8,600.00 account value divided by $1,000.00 = 8.60), then multiply the result by the number in the first section under the heading entitled “Expenses Paid During 6 Months Ended February 28, 2018” to estimate the expenses you paid on your account during this period.
Hypothetical Example for Comparison Purposes. The second section of the table provides information about hypothetical account values and hypothetical expenses based on the Fund’s actual expense ratio for each class of shares, and an assumed rate of return of 5% per year for each class before expenses, which is not the Fund’s actual return. The hypothetical account values and expenses may not be used to estimate the actual ending account balance or expenses you paid for the period. You may use this information to compare the ongoing costs of investing in the Fund and other funds. To do so, compare this 5% hypothetical example for the class of shares you hold with the 5% hypothetical examples that appear in the shareholder reports of the other funds.
Please note that the expenses shown in the table are meant to highlight your ongoing costs only and do not reflect any transactional costs, such as front-end or contingent deferred sales charges (loads). Therefore, the “hypothetical” section of the table is useful in comparing ongoing costs only, and will not help you determine the relative total costs of owning different funds. In addition, if these transactional costs were included, your costs would have been higher.
|
| 9 OPPENHEIMER DEVELOPING MARKETS FUND |
| | | | | | | | |
| Actual | | Beginning Account Value September 1, 2017 | | Ending Account Value February 28, 2018 | | Expenses Paid During 6 Months Ended
February 28, 2018 | | |
| Class A | | $ 1,000.00 | | $ 1,083.30 | | $ 6.63 | | |
| Class B | | 1,000.00 | | 1,079.30 | | 10.62 | | |
| Class C | | 1,000.00 | | 1,079.20 | | 10.57 | | |
| Class I | | 1,000.00 | | 1,085.60 | | 4.46 | | |
| Class R | | 1,000.00 | | 1,082.00 | | 7.98 | | |
| Class Y | | 1,000.00 | | 1,084.40 | | 5.39 | | |
| | | | |
Hypothetical (5% return before expenses) | | | | | | | | |
| Class A | | 1,000.00 | | 1,018.45 | | 6.43 | | |
| Class B | | 1,000.00 | | 1,014.63 | | 10.29 | | |
| Class C | | 1,000.00 | | 1,014.68 | | 10.24 | | |
| Class I | | 1,000.00 | | 1,020.53 | | 4.32 | | |
| Class R | | 1,000.00 | | 1,017.16 | | 7.73 | | |
| Class Y | | 1,000.00 | | 1,019.64 | | 5.22 | | |
Expenses are equal to the Fund’s annualized expense ratio for that class, multiplied by the average account value over the period, multiplied by 181/365 (to reflect the one-half year period). Those annualized expense ratios, excluding indirect expenses from affiliated funds, based on the 6-month period ended February 28, 2018 are as follows:
| | | | |
| Class | | Expense Ratios | |
| Class A | | | 1.28% | |
| Class B | | | 2.05 | |
| Class C | | | 2.04 | |
| Class I | | | 0.86 | |
| Class R | | | 1.54 | |
| Class Y | | | 1.04 | |
The expense ratios reflect voluntary and/or contractual waivers and/or reimbursements of expenses by the Fund’s Manager and Transfer Agent. Some of these undertakings may be modified or terminated at any time, as indicated in the Fund’s prospectus. The “Consolidated Financial Highlights” tables in the Fund’s financial statements, included in this report, also show the gross expense ratios, without such waivers or reimbursements and reduction to custodian expenses, if applicable.
|
| 10 OPPENHEIMER DEVELOPING MARKETS FUND |
CONSOLIDATED
STATEMENT OF INVESTMENTS February 28, 2018 Unaudited
| | | | | | | | |
| | | Shares | | | Value | |
| Common Stocks—94.0% | |
| Consumer Discretionary—13.5% | |
| Automobiles—0.4% | |
| Astra International Tbk PT | | | 276,210,000 | | | $ | 161,459,660 | |
| | | | | | | | | |
| Diversified Consumer Services—0.8% | | | | | |
| New Oriental Education & Technology Group, Inc., Sponsored ADR | | | 3,469,934 | | | | 317,117,268 | |
| | | | | | | | | |
| Hotels, Restaurants & Leisure—3.4% | | | | | | | | |
| China Lodging Group Ltd., Sponsored ADR1 | | | 4,955,078 | | | | 752,676,348 | |
| Genting Bhd | | | 128,800,600 | | | | 290,064,574 | |
| Genting Malaysia Bhd | | | 55,921,800 | | | | 74,961,895 | |
| Jollibee Foods Corp. | | | 42,919,773 | | | | 245,430,437 | |
| | | | | | | 1,363,133,254 | |
| | | | | | | | | |
| Internet & Catalog Retail—1.7% | | | | | | | | |
| Ctrip.com International Ltd., ADR2 | | | 15,209,288 | | | | 699,323,062 | |
| | | | | | | | | |
| Media—1.4% | | | | | | | | |
| Zee Entertainment Enterprises Ltd.1 | | | 65,300,739 | | | | 563,744,456 | |
| | | | | | | | | |
| Multiline Retail—0.1% | | | | | | | | |
| SACI Falabella | | | 3,198,204 | | | | 32,354,049 | |
| | | | | | | | | |
| Specialty Retail—0.1% | | | | | | | | |
| Steinhoff International Holdings NV | | | 115,822,130 | | | | 56,390,379 | |
| | | | | | | | | |
| Textiles, Apparel & Luxury Goods—5.6% | | | | | |
| Kering SA | | | 2,172,211 | | | | 1,020,895,126 | |
| LVMH Moet Hennessy Louis Vuitton SE | | | 2,836,629 | | | | 847,520,503 | |
| PRADA SpA | | | 103,822,310 | | | | 425,915,190 | |
| | | | | | | 2,294,330,819 | |
| | | | | | | | | |
| Consumer Staples—10.6% | |
| Beverages—3.7% | | | | | | | | |
| Anadolu Efes Biracilik Ve Malt Sanayii AS1 | | | 38,338,430 | | | | 258,670,431 | |
| Fomento Economico Mexicano SAB de CV | | | 56,526,271 | | | | 523,322,263 | |
| | | | | | | | |
| | | Shares | | | Value | |
| Beverages (Continued) | | | | | | | | |
| Fomento Economico Mexicano SAB de CV, Sponsored ADR | | | 2,871,795 | | | $ | 265,066,678 | |
| Kweichow Moutai Co. Ltd., Cl. A3 | | | 4,173,500 | | | | 476,390,373 | |
| | | | | | | 1,523,449,745 | |
| | | | | | | | | |
| Food & Staples Retailing—3.8% | | | | | | | | |
| Atacadao Distribuicao Comercio e Industria Ltda2 | | | 87,998,100 | | | | 402,467,518 | |
| BIM Birlesik Magazalar AS | | | 8,586,833 | | | | 169,486,630 | |
| Jeronimo Martins SGPS SA | | | 5,854,209 | | | | 121,384,245 | |
| Magnit PJSC1 | | | 5,391,140 | | | | 456,340,771 | |
| Shoprite Holdings Ltd. | | | 17,900,129 | | | | 391,982,251 | |
| | | | | | | 1,541,661,415 | |
| | | | | | | | | |
| Food Products—0.6% | | | | | | | | |
| Vietnam Dairy Products JSC | | | 6,936,900 | | | | 59,216,570 | |
| Want Want China Holdings Ltd. | | | 202,972,000 | | | | 170,094,162 | |
| | | | | | | 229,310,732 | |
| | | | | | | | | |
| Household Products—0.3% | | | | | | | | |
| Kimberly-Clark de Mexico SAB de CV, Cl. A | | | 64,523,358 | | | | 117,575,646 | |
| | | | | | | | | |
| Personal Products—2.2% | | | | | | | | |
| Amorepacific Corp. | | | 842,194 | | | | 217,860,510 | |
| AMOREPACIFIC Group | | | 584,127 | | | | 67,636,084 | |
| LG Household & Health Care Ltd. | | | 576,294 | | | | 584,147,330 | |
| Natura Cosmeticos SA | | | 2,900,500 | | | | 30,667,457 | |
| | | | | | | 900,311,381 | |
| | | | | | | | | |
| Energy—3.7% | | | | | | | | |
| Oil, Gas & Consumable Fuels—3.7% | | | | | | | | |
| LUKOIL PJSC, ADR | | | 1,971,709 | | | | 132,021,723 | |
| Novatek PJSC, Sponsored GDR | | | 9,051,322 | | | | 1,232,947,957 | |
| Reliance Industries Ltd. | | | 8,585,792 | | | | 125,122,135 | |
| | | | | | | 1,490,091,815 | |
|
| 11 OPPENHEIMER DEVELOPING MARKETS FUND |
CONSOLIDATED
STATEMENT OF INVESTMENTS Unaudited / Continued
| | | | | | | | |
| | | Shares | | | Value | |
| Financials—23.7% | | | | | | | | |
| Capital Markets—0.4% | | | | | | | | |
| China International Capital Corp. Ltd., Cl. H1,4 | | | 76,004,400 | | | $ | 147,008,538 | |
| | | | | | | | | |
| Commercial Banks—11.3% | | | | | | | | |
| Banco de Chile | | | 398,614,258 | | | | 67,626,130 | |
| Bank Central Asia Tbk PT | | | 60,828,300 | | | | 102,183,442 | |
| Bank Mandiri Persero Tbk PT | | | 485,357,000 | | | | 291,960,655 | |
| Bank Rakyat Indonesia Persero Tbk PT | | | 400,938,500 | | | | 109,722,180 | |
| Commercial International Bank Egypt SAE | | | 36,688,828 | | | | 160,383,778 | |
| Credicorp Ltd. | | | 1,821,051 | | | | 394,166,489 | |
| FirstRand Ltd. | | | 136,752,054 | | | | 848,958,606 | |
| Grupo Aval Acciones y Valores SA, ADR1 | | | 27,098,977 | | | | 232,509,223 | |
| Grupo Financiero Inbursa SAB de CV, Cl. O | | | 196,222,147 | | | | 313,528,237 | |
| Itau Unibanco Holding SA, ADR | | | 21,852,957 | | | | 340,250,540 | |
| Kotak Mahindra Bank Ltd. | | | 51,699,397 | | | | 857,769,317 | |
| Sberbank of Russia PJSC | | | 103,571,448 | | | | 497,261,540 | |
| Sberbank of Russia PJSC, Sponsored ADR | | | 15,450,251 | | | | 313,129,186 | |
| Zenith Bank plc | | | 880,413,018 | | | | 77,919,760 | |
| | | | | | | 4,607,369,083 | |
| | | | | | | | | |
| Consumer Finance—0.6% | | | | | | | | |
| Cholamandalam Investment & Finance Co. Ltd. | | | 5,404,828 | | | | 121,585,654 | |
| Prosegur Cash SA4 | | | 33,981,331 | | | | 106,813,747 | |
| | | | | | | 228,399,401 | |
| | | | | | | | | |
| Diversified Financial Services—3.4% | | | | | | | | |
| Ayala Corp. | | | 6,274,170 | | | | 126,765,005 | |
| B3 SA-Brasil Bolsa Balcao | | | 97,663,248 | | | | 770,621,951 | |
| Grupo de Inversiones Suramericana SA | | | 13,206,870 | | | | 177,079,472 | |
| | | | | | | | |
| | | Shares | | | Value | |
| Diversified Financial Services (Continued) | |
| Hong Kong Exchanges & Clearing Ltd. | | | 3,842,091 | | | $ | 137,780,359 | |
| Moscow Exchange (The) | | | 78,565,160 | | | | 155,782,849 | |
| | | | | | | 1,368,029,636 | |
| | | | | | | | | |
| Insurance—2.7% | | | | | | | | |
| AIA Group Ltd. | | | 111,038,600 | | | | 922,002,167 | |
| Sul America SA1 | | | 28,530,606 | | | | 187,603,079 | |
| | | | | | | 1,109,605,246 | |
| | | | | | | | | |
| Real Estate Management & Development—1.9% | |
| Ayala Land, Inc. | | | 311,907,400 | | | | 245,404,262 | |
| Emaar Properties PJSC | | | 120,133,735 | | | | 200,900,899 | |
| Hang Lung Group Ltd. | | | 7,993,000 | | | | 26,998,439 | |
| SM Prime Holdings, Inc. | | | 468,681,972 | | | | 316,623,362 | |
| | | | | | | 789,926,962 | |
| | | | | | | | | |
| Thrifts & Mortgage Finance—3.4% | | | | | | | | |
| Housing Development Finance Corp. Ltd. | | | 49,795,081 | | | | 1,361,241,876 | |
| | | | | | | | | |
| Health Care—7.7% | | | | | | | | |
| Biotechnology—1.0% | | | | | |
| 3SBio, Inc.2,4 | | | 39,915,500 | | | | 75,206,583 | |
| Biocon Ltd. | | | 25,845,152 | | | | 248,098,466 | |
| Celltrion Healthcare Co. Ltd.2 | | | 287,325 | | | | 31,408,424 | |
| Wuxi Biologics Cayman, Inc.2,4 | | | 8,005,000 | | | | 55,125,290 | |
| | | | | | | 409,838,763 | |
| | | | | | | | | |
| Health Care Providers & Services—3.0% | |
| Apollo Hospitals Enterprise Ltd.1 | | | 11,818,039 | | | | 217,746,609 | |
| Mediclinic International plc | | | 27,148,324 | | | | 220,597,240 | |
| Sinopharm Group Co. Ltd., Cl. H1 | | | 172,897,200 | | | | 761,664,891 | |
| | | | | | | 1,200,008,740 | |
| | | | | | | | | |
| Life Sciences Tools & Services—0.8% | |
| Samsung Biologics Co. Ltd.2,4 | | | 817,281 | | | | 336,731,281 | |
| | | | | | | | | |
| Pharmaceuticals—2.9% | | | | | | | | |
| Celltrion, Inc.2 | | | 101,398 | | | | 32,445,419 | |
| Dr. Reddy’s Laboratories Ltd. | | | 5,286,227 | | | | 181,080,472 | |
|
| 12 OPPENHEIMER DEVELOPING MARKETS FUND |
| | | | | | | | |
| | | Shares | | | Value | |
| Pharmaceuticals (Continued) | | | | | | | | |
| Hutchison China MediTech Ltd., ADR2 | | | 1,391,800 | | | $ | 46,841,029 | |
| Jiangsu Hengrui Medicine Co. Ltd., Cl. A3,5 | | | 44,928,094 | | | | 508,889,346 | |
| Jiangsu Hengrui Medicine Co. Ltd., Cl. A5 | | | 34,687,247 | | | | 393,049,002 | |
| | | | | | | 1,162,305,268 | |
| | | | | | | | | |
| Industrials—4.8% | | | | | | | | |
| Air Freight & Couriers—0.5% | | | | | |
| ZTO Express Cayman, Inc., ADR2 | | | 13,587,367 | | | | 215,631,514 | |
| | | | | | | | | |
| Industrial Conglomerates—2.5% | | | | | | | | |
| Jardine Strategic Holdings Ltd. | | | 13,430,343 | | | | 532,909,590 | |
| SM Investments Corp. | | | 26,481,047 | | | | 475,529,141 | |
| | | | | | | 1,008,438,731 | |
| | | | | | | | | |
| Transportation Infrastructure—1.8% | | | | | | | | |
| DP World Ltd. | | | 21,923,826 | | | | 536,435,288 | |
| Grupo Aeroportuario del Sureste SAB de CV, Cl. B | | | 10,834,018 | | | | 191,976,777 | |
| | | | | | | 728,412,065 | |
| | | | | | | | | |
| Information Technology—23.2% | | | | | | | | |
Electronic Equipment, Instruments, & Components—0.3% | | | | | |
| Largan Precision Co. Ltd. | | | 659,000 | | | | 80,962,884 | |
| Sunny Optical Technology Group Co. Ltd. | | | 1,677,000 | | | | 27,844,161 | |
| | | | | | | 108,807,045 | |
| | | | | | | | | |
| Internet Software & Services—13.4% | | | | | | | | |
| Alibaba Group Holding Ltd., Sponsored ADR2 | | | 12,493,024 | | | | 2,325,451,487 | |
| MercadoLibre, Inc. | | | 63,600 | | | | 24,674,892 | |
| NAVER Corp. | | | 1,134,867 | | | | 837,113,529 | |
| Tencent Holdings Ltd. | | | 37,530,410 | | | | 2,058,309,027 | |
| Yandex NV, Cl. A2 | | | 5,153,320 | | | | 211,749,919 | |
| | | | | | | 5,457,298,854 | |
| | | | | | | | | |
| IT Services—1.6% | | | | | | | | |
| Infosys Ltd. | | | 16,090,885 | | | | 287,893,610 | |
| | | | | | | | |
| | | Shares | | | Value | |
| IT Services (Continued) | | | | | | | | |
| Tata Consultancy Services Ltd. | | | 7,996,009 | | | $ | 369,193,489 | |
| | | | | | | 657,087,099 | |
| | | | | | | | | |
| Semiconductors & Semiconductor Equipment—5.9% | | | | | | | | |
| Taiwan Semiconductor Manufacturing Co. Ltd. | | | 292,178,429 | | | | 2,399,564,969 | |
| | | | | | | | | |
| Technology Hardware, Storage & Peripherals—2.0% | | | | | | | | |
| Samsung Electronics Co. Ltd. | | | 367,582 | | | | 796,667,688 | |
| | | | | | | | | |
| Materials—6.4% | | | | | | | | |
| Construction Materials—1.2% | | | | | |
| Indocement Tunggal Prakarsa Tbk PT | | | 125,325,579 | | | | 199,650,069 | |
| UltraTech Cement Ltd. | | | 4,616,337 | | | | 292,974,609 | |
| | | | | | | 492,624,678 | |
| | | | | | | | | |
| Metals & Mining—5.2% | | | | | | | | |
| Glencore plc2 | | | 231,424,959 | | | | 1,218,725,551 | |
| Grupo Mexico SAB de CV | | | 142,946,675 | | | | 487,973,547 | |
| Polyus PJSC, GDR4 | | | 2,440,700 | | | | 98,116,140 | |
| Vale SA, Cl. B, Sponsored ADR | | | 23,319,410 | | | | 320,175,498 | |
| | | | | | | 2,124,990,736 | |
| | | | | | | | | |
| Telecommunication Services—0.4% | | | | | | | | |
| Wireless Telecommunication Services—0.4% | | | | | |
| China Mobile Ltd. | | | 17,229,000 | | | | 160,283,997 | |
Total Common Stocks (Cost $25,181,956,308) | | | | | | | 38,160,525,851 | |
| | | | | | | |
| Preferred Stocks—1.6% | | | | | | | | |
| Lojas Americanas SA, Preference | | | 90,987,400 | | | | 473,025,751 | |
| Xiaoju Kuaizhi, Inc., Series A, Preference2,6,7 | | | 2,615,945 | | | | 118,345,352 | |
| Xiaoju Kuaizhi, Inc., Series B, Preference2 | | | 981,699 | | | | 44,412,063 | |
|
| 13 OPPENHEIMER DEVELOPING MARKETS FUND |
CONSOLIDATED
STATEMENT OF INVESTMENTS Unaudited / Continued
| | | | | | | | |
| | | Shares | | | Value | |
| Preferred Stocks (Continued) | |
| Zee Entertainment Enterprises Ltd., 6% Cum. Non-Cv.1 | | | 189,591,305 | | | $ | 29,102,413 | |
Total Preferred Stocks (Cost $446,229,902) | | | | | | | 664,885,579 | |
| | | | | | | | | |
| Investment Company—3.1% | |
| Oppenheimer Institutional Government Money Market Fund, Cl. E, 1.31%1,8 (Cost $1,249,164,003) | | | 1,249,164,003 | | | | 1,249,164,003 | |
| | | | | | | | | |
Total Investments, at Value (Cost $26,877,350,213) | | | 98.7% | | | | 40,074,575,433 | |
| Net Other Assets (Liabilities) | | | 1.3 | | | | 508,545,953 | |
Net Assets | | | 100.0% | | | $ | 40,583,121,386 | |
| | | | | | | | |
Footnotes to Consolidated Statement of Investments
1. Is or was an affiliate, as defined in the Investment Company Act of 1940, as amended, at or during the reporting period, by virtue of the Fund owning at least 5% of the voting securities of the issuer or as a result of the Fund and the issuer having the same investment adviser. Transactions during the reporting period in which the issuer was an affiliate are as follows:
| | | | | | | | | | | | | | | | |
| | | Shares
August 31, 2017 | | Gross
Additions | | Gross
Reductions | | Shares February 28, 2018 |
| Anadolu Efes Biracilik Ve Malt Sanayii AS | | | 28,384,566 | | | | 9,953,864 | | | | — | | | | 38,338,430 | |
| Apollo Hospitals Enterprise Ltd. | | | 11,818,039 | | | | — | | | | — | | | | 11,818,039 | |
| China International Capital Corp. Ltd., Cl. H | | | 65,584,400 | | | | 10,420,000 | | | | — | | | | 76,004,400 | |
| China Lodging Group Ltd., Sponsored ADR | | | 5,043,822 | | | | — | | | | 88,744 | | | | 4,955,078 | |
| Estacio Participacoes SA | | | 33,782,450 | | | | — | | | | 33,782,450 | | | | — | |
| Grupo Aval Acciones y Valores SA, ADR | | | 27,098,977 | | | | — | | | | — | | | | 27,098,977 | |
| Magnit PJSC | | | 5,666,724 | | | | — | | | | 275,584 | | | | 5,391,140 | |
| Oppenheimer Institutional Government Money Market Fund, Cl. E | | | 1,429,129,947 | | | | 3,368,971,141 | | | | 3,548,937,085 | | | | 1,249,164,003 | |
| Sinopharm Group Co. Ltd., Cl. H | | | 132,490,800 | | | | 40,406,400 | | | | — | | | | 172,897,200 | |
| Sul America SAa | | | 32,132,706 | | | | — | | | | 3,602,100 | | | | 28,530,606 | |
| Zee Entertainment Enterprises Ltd. | | | 65,300,739 | | | | — | | | | — | | | | 65,300,739 | |
| Zee Entertainment Enterprises Ltd., 6% Cum. Non-Cv. | | | 189,591,305 | | | | — | | | | — | | | | 189,591,305 | |
|
| 14 OPPENHEIMER DEVELOPING MARKETS FUND |
Footnotes to Consolidated Statement of Investments (Continued)
| | | | | | | | | | | | | | | | |
| | | Value | | Income | | Realized
Gain (Loss) | | Change in
Unrealized Gain
(Loss) |
Anadolu Efes Biracilik Ve Malt Sanayii AS | | $ | 258,670,431 | | | $ | — | | | $ | — | | | $ | 16,171,833 | |
Apollo Hospitals Enterprise Ltd. | | | 217,746,609 | | | | 1,107,206 | | | | — | | | | 17,366,094 | |
China International Capital Corp. Ltd., Cl. H | | | 147,008,538 | | | | — | | | | — | | | | 7,756,159 | |
China Lodging Group Ltd., Sponsored ADR | | | 752,676,348 | | | | 3,072,148 | | | | 5,228,182 | | | | 185,474,407 | |
Estacio Participacoes SA | | | — | | | | — | | | | 195,416,371 | | | | (139,764,260 | ) |
Grupo Aval Acciones y Valores SA, ADR | | | 232,509,223 | | | | 5,398,719 | | | | — | | | | (11,110,580 | ) |
Magnit PJSC | | | 456,340,771 | | | | 10,227,551 | | | | (11,367,791 | ) | | | (537,706,332 | ) |
Oppenheimer Institutional Government Money Market Fund, Cl. E | | | 1,249,164,003 | | | | 7,157,112 | | | | — | | | | — | |
Sinopharm Group Co. Ltd., Cl. H | | | 761,664,891 | | | | — | | | | — | | | | (19,597,155 | ) |
Sul America SAa | | | —b | | | | 3,027,938 | | | | (2,706,297 | ) | | | 30,450,091 | |
Zee Entertainment Enterprises Ltd. | | | 563,744,456 | | | | — | | | | — | | | | 33,284,745 | |
Zee Entertainment Enterprises Ltd., 6% Cum. Non-Cv. | | | 29,102,413 | | | | — | | | | — | | | | 541,935 | |
| | | | |
Total | | $ | 4,668,627,683 | | | $ | 29,990,674 | | | $ | 186,570,465 | | | $ | (417,133,063 | ) |
| | | | |
a. No longer an affiliate at period end.
b. The security is no longer an affiliate. Therefore, the value has been excluded from this table.
2. Non-income producing security.
3. All or a portion of this security is owned by the subsidiary. See Note 2 of the accompanying Consolidated Notes.
4. Represents securities sold under Rule 144A, which are exempt from registration under the Securities Act of 1933, as amended. These securities have been determined to be liquid under guidelines established by the Board of Trustees. These securities amount to $819,001,579 or 2.02% of the Fund’s net assets at period end.
5. The Fund holds securities which have been issued by the same entity and that trade on separate exchanges.
6. Restricted security. The aggregate value of restricted securities at period end was $118,345,352, which represents 0.29% of the Fund’s net assets. See Note 4 of the accompanying Consolidated Notes. Information concerning restricted securities is as follows:
| | | | | | | | | | | | | | | | |
| Security | | Acquisition
Dates | | | Cost | | | Value | | | Unrealized
Appreciation/
(Depreciation) | |
Xiaoju Kuaizhi, Inc., Series A, Preference | | | 4/22/16 | | | $ | 99,999,991 | | | $ | 118,345,352 | | | $ | 18,345,361 | |
7. The value of this security was determined using significant unobservable inputs. See Note 3 of the accompanying
Consolidated Notes.
8. Rate shown is the 7-day yield at period end.
Distribution of investments representing geographic holdings, as a percentage of total investments at value, is as follows:
| | | | | | | | |
| Geographic Holdings | | Value | | | Percent | |
China | | $ | 9,306,822,464 | | | | 23.2% | |
India | | | 4,655,553,107 | | | | 11.6 | |
Russia | | | 3,097,350,084 | | | | 7.7 | |
South Korea | | | 2,904,010,264 | | | | 7.2 | |
|
| 15 OPPENHEIMER DEVELOPING MARKETS FUND |
CONSOLIDATED
STATEMENT OF INVESTMENTS Unaudited / Continued
Footnotes to Consolidated Statement of Investments (Continued)
| | | | | | | | |
| Geographic Holdings (Continued) | | Value | | | Percent | |
Brazil | | $ | 2,524,811,795 | | | | 6.3% | |
Taiwan | | | 2,480,527,853 | | | | 6.2 | |
Mexico | | | 1,899,443,148 | | | | 4.7 | |
France | | | 1,868,415,629 | | | | 4.7 | |
Hong Kong | | | 1,666,531,585 | | | | 4.2 | |
South Africa | | | 1,517,928,477 | | | | 3.8 | |
Philippines | | | 1,409,752,207 | | | | 3.5 | |
United States | | | 1,249,164,003 | | | | 3.1 | |
Switzerland | | | 1,218,725,551 | | | | 3.0 | |
Indonesia | | | 864,976,006 | | | | 2.2 | |
United Arab Emirates | | | 737,336,186 | | | | 1.8 | |
Turkey | | | 428,157,061 | | | | 1.1 | |
Italy | | | 425,915,190 | | | | 1.1 | |
Colombia | | | 409,588,694 | | | | 1.0 | |
Peru | | | 394,166,489 | | | | 1.0 | |
Malaysia | | | 365,026,469 | | | | 0.9 | |
Egypt | | | 160,383,778 | | | | 0.4 | |
Portugal | | | 121,384,245 | | | | 0.3 | |
Spain | | | 106,813,747 | | | | 0.3 | |
Chile | | | 99,980,179 | | | | 0.3 | |
Nigeria | | | 77,919,760 | | | | 0.2 | |
Vietnam | | | 59,216,570 | | | | 0.1 | |
Argentina | | | 24,674,892 | | | | 0.1 | |
| | | | |
Total | | $ | 40,074,575,433 | | | | 100.0% | |
| | | | |
See accompanying Notes to Consolidated Financial Statements.
|
| 16 OPPENHEIMER DEVELOPING MARKETS FUND |
CONSOLIDATED STATEMENT OF
ASSETS AND LIABILITIES February 28, 2018 Unaudited
| | | | |
| | | | | |
| Assets | | | | |
| Investments, at value—see accompanying consolidated statement of investments: | | | | |
| Unaffiliated companies (cost $23,168,100,599) | | $ | 35,405,947,750 | |
| Affiliated companies (cost $3,709,249,614) | | | 4,668,627,683 | |
| | | | |
| | | | 40,074,575,433 | |
| Cash | | | 88,991,666 | |
| Cash—foreign currencies (cost $405,930,842) | | | 426,967,200 | |
| Receivables and other assets: | | | | |
| Investments sold | | | 335,457,518 | |
| Shares of beneficial interest sold | | | 47,951,625 | |
| Dividends | | | 30,820,924 | |
| Other | | | 1,848,328 | |
| | | | |
| Total assets | | | 41,006,612,694 | |
| | | | | |
| Liabilities | | | | |
| Payables and other liabilities: | | | | |
| Investments purchased | | | 332,237,175 | |
| Shares of beneficial interest redeemed | | | 75,031,970 | |
| Foreign capital gains tax | | | 5,863,725 | |
| Trustees’ compensation | | | 1,843,496 | |
| Distribution and service plan fees | | | 1,558,226 | |
| Shareholder communications | | | 33,125 | |
| Other | | | 6,923,591 | |
| | | | |
| Total liabilities | | | 423,491,308 | |
| | | | | |
Net Assets | | $ | 40,583,121,386 | |
| | | | |
| | | | | |
| Composition of Net Assets | | | | |
| Paid-in capital | | $ | 28,744,733,878 | |
| Accumulated net investment loss | | | (145,035,676 | ) |
| Accumulated net realized loss on investments and foreign currency transactions | | | (1,228,812,259 | ) |
| Net unrealized appreciation on investments and translation of assets and liabilities denominated in foreign currencies | | | 13,212,235,443 | |
| | | | |
Net Assets | | $ | 40,583,121,386 | |
| | | | |
|
| 17 OPPENHEIMER DEVELOPING MARKETS FUND |
CONSOLIDATED STATEMENT OF
ASSETS AND LIABILITIES Unaudited / Continued
| | | | |
| | | | | |
| Net Asset Value Per Share | | | | |
| |
| Class A Shares: | | | | |
| |
| Net asset value and redemption price per share (based on net assets of $6,325,233,050 and 141,160,977 shares of beneficial interest outstanding) | | $ | 44.81 | |
| |
| Maximum offering price per share (net asset value plus sales charge of 5.75% of offering price) | | $ | 47.54 | |
| |
| |
| Class B Shares: | | | | |
| |
| Net asset value, redemption price (excludes applicable contingent deferred sales charge) and offering price per share (based on net assets of $8,703,244 and 202,982 shares of beneficial interest outstanding) | | $ | 42.88 | |
| |
| |
| Class C Shares: | | | | |
| |
| Net asset value, redemption price (excludes applicable contingent deferred sales charge) and offering price per share (based on net assets of $969,139,024 and 23,152,554 shares of beneficial interest outstanding) | | $ | 41.86 | |
| |
| |
| Class I Shares: | | | | |
| |
| Net asset value, redemption price and offering price per share (based on net assets of $13,948,501,771 and 315,678,654 shares of beneficial interest outstanding) | | $ | 44.19 | |
| |
| |
| Class R Shares: | | | | |
| |
| Net asset value, redemption price (excludes applicable contingent deferred sales charge) and offering price per share (based on net assets of $686,654,501 and 15,948,456 shares of beneficial interest outstanding) | | $ | 43.05 | |
| |
| |
| Class Y Shares: | | | | |
| |
| Net asset value, redemption price and offering price per share (based on net assets of $18,644,889,796 and 421,992,472 shares of beneficial interest outstanding) | | $ | 44.18 | |
See accompanying Notes to Consolidated Financial Statements.
|
| 18 OPPENHEIMER DEVELOPING MARKETS FUND |
CONSOLIDATED STATEMENT OF
OPERATIONS For the Six Months Ended February 28, 2018 Unaudited
| | | | |
| | | | | |
| Investment Income | | | | |
| Dividends: | | | | |
| Unaffiliated companies (net of foreign withholding taxes of $12,514,095) | | $ | 131,036,470 | |
| Affiliated companies (net of foreign withholding taxes of $1,670,737) | | | 29,990,674 | |
| |
| Interest | | | 549,779 | |
| | | | |
| Total investment income | | | 161,576,923 | |
| | | | | |
| Expenses | | | | |
| Management fees | | | 149,451,824 | |
| |
| Distribution and service plan fees: | | | | |
| Class A | | | 7,830,060 | |
| Class B | | | 65,668 | |
| Class C | | | 4,849,844 | |
| Class R | | | 1,707,020 | |
| |
| Transfer and shareholder servicing agent fees: | | | | |
| Class A | | | 6,684,488 | |
| Class B | | | 14,058 | |
| Class C | | | 1,027,498 | |
| Class I | | | 1,899,968 | |
| Class R | | | 723,582 | |
| Class Y | | | 19,127,514 | |
| |
| Shareholder communications: | | | | |
| Class A | | | 31,125 | |
| Class B | | | 620 | |
| Class C | | | 5,858 | |
| Class I | | | 21,840 | |
| Class R | | | 897 | |
| Class Y | | | 63,562 | |
| |
| Custodian fees and expenses | | | 10,473,260 | |
| |
| Borrowing fees | | | 664,613 | |
| |
| Trustees’ compensation | | | 249,636 | |
| |
| Other | | | 929,179 | |
| | | | |
| Total expenses | | | 205,822,114 | |
| Less reduction to custodian expenses | | | (22,036) | |
| Less waivers and reimbursements of expenses | | | (1,948,748) | |
| | | | |
| Net expenses | | | 203,851,330 | |
|
| |
Net Investment Loss | | | (42,274,407) | |
|
| 19 OPPENHEIMER DEVELOPING MARKETS FUND |
CONSOLIDATED STATEMENT OF
OPERATIONS Unaudited / Continued
| | | | |
| | | | | |
| Realized and Unrealized Gain (Loss) | | | | |
Net realized gain on: | | | | |
Investment transactions in: | | | | |
Unaffiliated companies(net of foreign capital gains tax of $3,631,909) | | $ | 1,695,298,453 | |
Affiliated companies | | | 186,570,465 | |
Foreign currency transactions | | | 3,329,670 | |
| | | | |
Net realized gain | | | 1,885,198,588 | |
| |
Net change in unrealized appreciation/depreciation on: | | | | |
Investment transactions in: | | | | |
Unaffiliated companies | | | 1,710,765,392 | |
Affiliated companies | | | (417,133,063) | |
Translation of assets and liabilities denominated in foreign currencies | | | (1,203,218) | |
| | | | |
Net change in unrealized appreciation/depreciation | | | 1,292,429,111 | |
| | | | | |
Net Increase in Net Assets Resulting from Operations | | $ | 3,135,353,292 | |
| | | | |
See accompanying Notes to Consolidated Financial Statements.
|
| 20 OPPENHEIMER DEVELOPING MARKETS FUND |
CONSOLIDATED STATEMENTS OF CHANGES IN NET ASSETS
| | | | | | | | |
| | | Six Months Ended
February 28, 2018
(Unaudited) | | | Year Ended
August 31, 2017 | |
| | |
| Operations | | | | | | | | |
| Net investment income (loss) | | $ | (42,274,407) | | | $ | 198,965,592 | |
| |
| Net realized gain | | | 1,885,198,588 | | | | 1,014,422,004 | |
| |
| Net change in unrealized appreciation/depreciation | | | 1,292,429,111 | | | | 6,029,294,757 | |
| | | | |
| Net increase in net assets resulting from operations | | | 3,135,353,292 | | | | 7,242,682,353 | |
|
| | |
| Dividends and/or Distributions to Shareholders | | | | | | | | |
| Dividends from net investment income: | | | | | | | | |
| Class A | | | (18,919,281) | | | | (13,598,079) | |
| Class B | | | — | | | | — | |
| Class C | | | — | | | | — | |
| Class I | | | (92,634,631) | | | | (56,814,950) | |
| Class R | | | (743,812) | | | | (48,384) | |
| Class Y | | | (104,289,090) | | | | (67,374,668) | |
| | | | |
| | | (216,586,814) | | | | (137,836,081) | |
|
| | |
| Beneficial Interest Transactions | | | | | | | | |
| Net increase (decrease) in net assets resulting from beneficial interest transactions: | | | | | | | | |
| Class A | | | (513,095,203) | | | | (1,560,578,660) | |
| Class B | | | (11,015,596) | | | | (35,390,465) | |
| Class C | | | (78,560,500) | | | | (272,402,987) | |
| Class I | | | 1,456,834,870 | | | | 1,540,483,402 | |
| Class R | | | (47,449,042) | | | | (89,927,250) | |
| Class Y | | | (222,392,393) | | | | 675,219,548 | |
| | | | |
| | | 584,322,136 | | | | 257,403,588 | |
|
| | |
| Net Assets | | | | | | | | |
| Total increase | | | 3,503,088,614 | | | | 7,362,249,860 | |
| |
| Beginning of period | | | 37,080,032,772 | | | | 29,717,782,912 | |
| | | | |
| End of period (including accumulated net investment income (loss) of $(145,035,676) and $113,825,545, respectively) | | $ | 40,583,121,386 | | | $ | 37,080,032,772 | |
| | | | |
See accompanying Notes to Consolidated Financial Statements.
|
| 21 OPPENHEIMER DEVELOPING MARKETS FUND |
CONSOLIDATED FINANCIAL HIGHLIGHTS
| | | | | | | | | | | | | | |
| Class A | | Six Months
Ended
February 28,
2018
(Unaudited) | | Year Ended
August 31,
2017 | | Year Ended
August 31,
2016 | | Year Ended
August 31,
2015 | | Year Ended
August 29,
20141 | | Year Ended
August 30,
20131 | |
| |
| Per Share Operating Data | | | | |
| Net asset value, beginning of period | | $41.49 | | $33.45 | | $30.06 | | $41.30 | | $33.94 | | | $32.25 | |
| |
| Income (loss) from investment operations: | | | | | | | | | | | | | | |
| Net investment income (loss)2 | | (0.10) | | 0.13 | | 0.12 | | 0.17 | | 0.14 | | | 0.09 | |
| Net realized and unrealized gain (loss) | | 3.55 | | 7.98 | | 3.40 | | (10.71) | | 7.44 | | | 1.74 | |
| | | |
| Total from investment operations | | 3.45 | | 8.11 | | 3.52 | | (10.54) | | 7.58 | | | 1.83 | |
| |
| Dividends and/or distributions to shareholders: | | | | | | | | | | | | | | |
| Dividends from net investment income | | (0.13) | | (0.07) | | (0.13) | | (0.10) | | (0.04) | | | (0.14) | |
| Distributions from net realized gain | | 0.00 | | 0.00 | | 0.00 | | (0.60) | | (0.18) | | | 0.00 | |
| | | |
| Total dividends and/or distributions to shareholders | | (0.13) | | (0.07) | | (0.13) | | (0.70) | | (0.22) | | | (0.14) | |
| |
| Net asset value, end of period | | $44.81 | | $41.49 | | $33.45 | | $30.06 | | $41.30 | | | $33.94 | |
| | | |
|
| |
| Total Return, at Net Asset Value3 | | 8.33% | | 24.32% | | 11.74% | | (25.84)% | | 22.38% | | | 5.67% | |
|
| |
| Ratios/Supplemental Data | | | | | | | | | | | | | | |
| Net assets, end of period (in thousands) | | $6,325,233 | | $6,350,957 | | $6,574,857 | | $7,679,026 | | $12,573,313 | | | $12,371,560 | |
| |
| Average net assets (in thousands) | | $6,371,047 | | $6,236,473 | | $6,903,922 | | $10,303,699 | | $13,256,077 | | | $12,394,351 | |
| |
| Ratios to average net assets:4 | | | | | | | | | | | | | | |
| Net investment income (loss) | | (0.44)% | | 0.37% | | 0.38% | | 0.47% | | 0.36% | | | 0.27% | |
| Expenses excluding specific expenses listed below | | 1.29% | | 1.32% | | 1.32% | | 1.31% | | 1.32% | | | 1.36% | |
| Interest and fees from borrowings | | 0.00%5 | | 0.00%5 | | 0.00%5 | | 0.00%5 | | 0.00% | | | 0.00% | |
| | | |
| Total expenses6 | | 1.29% | | 1.32% | | 1.32% | | 1.31% | | 1.32% | | | 1.36% | |
| Expenses after payments, waivers and/or reimbursements and reduction to custodian expenses | | 1.28% | | 1.31% | | 1.32%7 | | 1.30% | | 1.31% | | | 1.35% | |
| |
| Portfolio turnover rate | | 20% | | 33% | | 18% | | 36% | | 26% | | | 29% | |
|
| 22 OPPENHEIMER DEVELOPING MARKETS FUND |
1. Represents the last business day of the Fund’s reporting period.
2. Per share amounts calculated based on the average shares outstanding during the period.
3. Assumes an initial investment on the business day before the first day of the fiscal period, with all dividends and distributions reinvested in additional shares on the reinvestment date, and redemption at the net asset value calculated on the last business day of the fiscal period. Sales charges are not reflected in the total returns. Total returns are not annualized for periods less than one full year. Returns do not reflect the deduction of taxes that a shareholder would pay on fund distributions or the redemption of fund shares.
4. Annualized for periods less than one full year.
5. Less than 0.005%.
6. Total expenses including indirect expenses from affiliated fund fees and expenses were as follows:
| | | | | | | | |
| Six Months Ended February 28, 2018 | | | 1.29 | % | | | | |
Year Ended August 31, 2017 | | | 1.32 | % | | | | |
| Year Ended August 31, 2016 | | | 1.32 | % | | | | |
Year Ended August 31, 2015 | | | 1.31 | % | | | | |
| Year Ended August 29, 2014 | | | 1.33 | % | | | | |
Year Ended August 30, 2013 | | | 1.37 | % | | | | |
7. Waiver was less than 0.005%.
See accompanying Notes to Consolidated Financial Statements.
|
| 23 OPPENHEIMER DEVELOPING MARKETS FUND |
CONSOLIDATED FINANCIAL HIGHLIGHTS Continued
| | | | | | | | | | | | | | |
| Class B | | Six Months
Ended
February 28,
2018
(Unaudited) | | Year Ended
August 31,
2017 | | Year Ended
August 31,
2016 | | Year Ended
August 31,
2015 | | Year Ended
August 29,
20141 | | Year Ended
August 30,
20131 | |
| |
| Per Share Operating Data | | | | |
| Net asset value, beginning of period | | $39.73 | | $32.21 | | $29.04 | | $40.11 | | $33.19 | | | $31.68 | |
| |
| Income (loss) from investment operations: | | | | | | | | | | | | | | |
| Net investment loss2 | | (0.24) | | (0.18) | | (0.13) | | (0.11) | | (0.16) | | | (0.22) | |
| Net realized and unrealized gain (loss) | | 3.39 | | 7.70 | | 3.30 | | (10.36) | | 7.26 | | | 1.73 | |
| | | |
| Total from investment operations | | 3.15 | | 7.52 | | 3.17 | | (10.47) | | 7.10 | | | 1.51 | |
| |
| Dividends and/or distributions to shareholders: | | | | | | | | | | | | | | |
| Dividends from net investment income | | 0.00 | | 0.00 | | 0.00 | | 0.00 | | 0.00 | | | 0.00 | |
| Distributions from net realized gain | | 0.00 | | 0.00 | | 0.00 | | (0.60) | | (0.18) | | | 0.00 | |
| | | |
| Total dividends and/or distributions to shareholders | | 0.00 | | 0.00 | | 0.00 | | (0.60) | | (0.18) | | | 0.00 | |
| |
| Net asset value, end of period | | $42.88 | | $39.73 | | $32.21 | | $29.04 | | $40.11 | | | $33.19 | |
| | | |
|
| |
| Total Return, at Net Asset Value3 | | 7.93% | | 23.35% | | 10.92% | | (26.40)% | | 21.44% | | | 4.77% | |
|
| |
| Ratios/Supplemental Data | | | | | | | | | | | | | | |
| Net assets, end of period (in thousands) | | $8,703 | | $18,614 | | $49,045 | | $83,559 | | $153,828 | | | $155,638 | |
| |
| Average net assets (in thousands) | | $13,195 | | $29,346 | | $61,716 | | $120,812 | | $156,760 | | | $177,608 | |
| |
| Ratios to average net assets:4 | | | | | | | | | | | | | | |
| Net investment loss | | (1.18)% | | (0.54)% | | (0.43)% | | (0.30)% | | (0.43)% | | | (0.64)% | |
| Expenses excluding specific expenses listed below | | 2.06% | | 2.08% | | 2.08% | | 2.06% | | 2.09% | | | 2.23% | |
| Interest and fees from borrowings | | 0.00%5 | | 0.00%5 | | 0.00%5 | | 0.00%5 | | 0.00% | | | 0.00% | |
| | | |
| Total expenses6 | | 2.06% | | 2.08% | | 2.08% | | 2.06% | | 2.09% | | | 2.23% | |
| Expenses after payments, waivers and/or reimbursements and reduction to custodian expenses | | 2.05% | | 2.07% | | 2.08%7 | | 2.05% | | 2.08% | | | 2.22% | |
| |
| Portfolio turnover rate | | 20% | | 33% | | 18% | | 36% | | 26% | | | 29% | |
|
| 24 OPPENHEIMER DEVELOPING MARKETS FUND |
1. Represents the last business day of the Fund’s reporting period.
2. Per share amounts calculated based on the average shares outstanding during the period.
3. Assumes an initial investment on the business day before the first day of the fiscal period, with all dividends and distributions reinvested in additional shares on the reinvestment date, and redemption at the net asset value calculated on the last business day of the fiscal period. Sales charges are not reflected in the total returns. Total returns are not annualized for periods less than one full year. Returns do not reflect the deduction of taxes that a shareholder would pay on fund distributions or the redemption of fund shares.
4. Annualized for periods less than one full year.
5. Less than 0.005%.
6. Total expenses including indirect expenses from affiliated fund fees and expenses were as follows:
| | | | | | | | |
| Six Months Ended February 28, 2018 | | | 2.06 | % | | | | |
Year Ended August 31, 2017 | | | 2.08 | % | | | | |
| Year Ended August 31, 2016 | | | 2.08 | % | | | | |
Year Ended August 31, 2015 | | | 2.06 | % | | | | |
| Year Ended August 29, 2014 | | | 2.10 | % | | | | |
Year Ended August 30, 2013 | | | 2.24 | % | | | | |
7. Waiver was less than 0.005%.
See accompanying Notes to Consolidated Financial Statements.
|
| 25 OPPENHEIMER DEVELOPING MARKETS FUND |
CONSOLIDATED FINANCIAL HIGHLIGHTS Continued
| | | | | | | | | | | | | | |
| Class C | | Six Months
Ended
February 28,
2018
(Unaudited) | | Year Ended
August 31,
2017 | | Year Ended
August 31,
2016 | | Year Ended
August 31,
2015 | | Year Ended
August 29,
20141 | | Year Ended
August 30,
20131 | |
| |
| Per Share Operating Data | | | | |
| Net asset value, beginning of period | | $38.79 | | $31.44 | | $28.35 | | $39.17 | | $32.40 | | | $30.87 | |
| |
| Income (loss) from investment operations: | | | | | | | | | | | | | | |
| Net investment loss2 | | (0.24) | | (0.13) | | (0.11) | | (0.10) | | (0.13) | | | (0.15) | |
| Net realized and unrealized gain (loss) | | 3.31 | | 7.48 | | 3.20 | | (10.12) | | 7.08 | | | 1.68 | |
| | | |
| Total from investment operations | | 3.07 | | 7.35 | | 3.09 | | (10.22) | | 6.95 | | | 1.53 | |
| |
| Dividends and/or distributions to shareholders: | | | | | | | | | | | | | | |
| Dividends from net investment income | | 0.00 | | 0.00 | | 0.00 | | 0.00 | | 0.00 | | | 0.00 | |
| Distributions from net realized gain | | 0.00 | | 0.00 | | 0.00 | | (0.60) | | (0.18) | | | 0.00 | |
| | | |
| Total dividends and/or distributions to shareholders | | 0.00 | | 0.00 | | 0.00 | | (0.60) | | (0.18) | | | 0.00 | |
| |
| Net asset value, end of period | | $41.86 | | $38.79 | | $31.44 | | $28.35 | | $39.17 | | | $32.40 | |
| | | |
|
| |
| Total Return, at Net Asset Value3 | | 7.92% | | 23.38% | | 10.90% | | (26.39)% | | 21.50% | | | 4.96% | |
|
| |
| Ratios/Supplemental Data | | | | | | | | | | | | | | |
| Net assets, end of period (in thousands) | | $969,139 | | $973,031 | | $1,046,894 | | $1,311,171 | | $2,190,364 | | | $2,112,136 | |
| |
| Average net assets (in thousands) | | $979,335 | | $964,547 | | $1,114,383 | | $1,785,113 | | $2,180,118 | | | $2,231,136 | |
| |
| Ratios to average net assets:4 | | | | | | | | | | | | | | |
| Net investment loss | | (1.20)% | | (0.39)% | | (0.39)% | | (0.29)% | | (0.37)% | | | (0.44)% | |
| Expenses excluding specific expenses listed below | | 2.05% | | 2.07% | | 2.07% | | 2.06% | | 2.04% | | | 2.06% | |
| Interest and fees from borrowings | | 0.00%5 | | 0.00%5 | | 0.00%5 | | 0.00%5 | | 0.00% | | | 0.00% | |
| | | |
| Total expenses6 | | 2.05% | | 2.07% | | 2.07% | | 2.06% | | 2.04% | | | 2.06% | |
| Expenses after payments, waivers and/or reimbursements and reduction to custodian expenses | | 2.04% | | 2.06% | | 2.07%7 | | 2.05% | | 2.03% | | | 2.05% | |
| |
| Portfolio turnover rate | | 20% | | 33% | | 18% | | 36% | | 26% | | | 29% | |
|
| 26 OPPENHEIMER DEVELOPING MARKETS FUND |
1. Represents the last business day of the Fund’s reporting period.
2. Per share amounts calculated based on the average shares outstanding during the period.
3. Assumes an initial investment on the business day before the first day of the fiscal period, with all dividends and distributions reinvested in additional shares on the reinvestment date, and redemption at the net asset value calculated on the last business day of the fiscal period. Sales charges are not reflected in the total returns. Total returns are not annualized for periods less than one full year. Returns do not reflect the deduction of taxes that a shareholder would pay on fund distributions or the redemption of fund shares.
4. Annualized for periods less than one full year.
5. Less than 0.005%.
6. Total expenses including indirect expenses from affiliated fund fees and expenses were as follows:
| | | | | | | | |
| Six Months Ended February 28, 2018 | | | 2.05 | % | | | | |
Year Ended August 31, 2017 | | | 2.07 | % | | | | |
| Year Ended August 31, 2016 | | | 2.07 | % | | | | |
Year Ended August 31, 2015 | | | 2.06 | % | | | | |
| Year Ended August 29, 2014 | | | 2.05 | % | | | | |
Year Ended August 30, 2013 | | | 2.07 | % | | | | |
7. Waiver was less than 0.005%.
See accompanying Notes to Consolidated Financial Statements.
|
| 27 OPPENHEIMER DEVELOPING MARKETS FUND |
CONSOLIDATED FINANCIAL HIGHLIGHTS Continued
| | | | | | | | | | | | | | |
| Class I | | Six Months
Ended
February 28,
2018
(Unaudited) | | Year Ended
August 31,
2017 | | Year Ended
August 31,
2016 | | Year Ended
August 31,
2015 | | Year Ended
August 29,
20141 | | Year Ended
August 30,
20131 | |
| |
| Per Share Operating Data | | | | |
| Net asset value, beginning of period | | $41.01 | | $33.09 | | $29.77 | | $40.94 | | $33.65 | | | $31.97 | |
| |
| Income (loss) from investment operations: | | | | | | | | | | | | | | |
| Net investment income (loss)2 | | (0.01) | | 0.31 | | 0.26 | | 0.34 | | 0.33 | | | 0.30 | |
| Net realized and unrealized gain (loss) | | 3.50 | | 7.84 | | 3.36 | | (10.61) | | 7.35 | | | 1.68 | |
| | | |
| Total from investment operations | | 3.49 | | 8.15 | | 3.62 | | (10.27) | | 7.68 | | | 1.98 | |
| |
| Dividends and/or distributions to shareholders: | | | | | | | | | | | | | | |
| Dividends from net investment income | | (0.31) | | (0.23) | | (0.30) | | (0.30) | | (0.21) | | | (0.30) | |
| Distributions from net realized gain | | 0.00 | | 0.00 | | 0.00 | | (0.60) | | (0.18) | | | 0.00 | |
| | | |
| Total dividends and/or distributions to shareholders | | (0.31) | | (0.23) | | (0.30) | | (0.90) | | (0.39) | | | (0.30) | |
| |
| Net asset value, end of period | | $44.19 | | $41.01 | | $33.09 | | $29.77 | | $40.94 | | | $33.65 | |
| | | |
|
| |
| Total Return, at Net Asset Value3 | | 8.56% | | 24.84% | | 12.22% | | (25.50)% | | 22.95% | | | 6.19% | |
|
| |
| Ratios/Supplemental Data | | | | | | | | | | | | | | |
| Net assets, end of period (in thousands) | | $13,948,502 | | $11,559,582 | | $7,861,500 | | $6,201,064 | | $7,445,448 | | | $2,353,100 | |
| |
| Average net assets (in thousands) | | $12,802,872 | | $9,305,452 | | $6,593,711 | | $6,961,648 | | $3,901,775 | | | $1,440,608 | |
| |
| Ratios to average net assets:4 | | | | | | | | | | | | | | |
| Net investment income (loss) | | (0.03)% | | 0.87% | | 0.87% | | 0.95% | | 0.87% | | | 0.87% | |
| Expenses excluding specific expenses listed below | | 0.86% | | 0.88% | | 0.88% | | 0.87% | | 0.86% | | | 0.88% | |
| Interest and fees from borrowings | | 0.00%5 | | 0.00%5 | | 0.00%5 | | 0.00%5 | | 0.00% | | | 0.00% | |
| | | |
| Total expenses6 | | 0.86% | | 0.88% | | 0.88% | | 0.87% | | 0.86% | | | 0.88% | |
| Expenses after payments, waivers and/or reimbursements and reduction to custodian expenses | | 0.86%7 | | 0.88%7 | | 0.88%7 | | 0.86% | | 0.85% | | | 0.87% | |
| |
| Portfolio turnover rate | | 20% | | 33% | | 18% | | 36% | | 26% | | | 29% | |
|
| 28 OPPENHEIMER DEVELOPING MARKETS FUND |
1. Represents the last business day of the Fund’s reporting period.
2. Per share amounts calculated based on the average shares outstanding during the period.
3. Assumes an initial investment on the business day before the first day of the fiscal period, with all dividends and distributions reinvested in additional shares on the reinvestment date, and redemption at the net asset value calculated on the last business day of the fiscal period. Sales charges are not reflected in the total returns. Total returns are not annualized for periods less than one full year. Returns do not reflect the deduction of taxes that a shareholder would pay on fund distributions or the redemption of fund shares.
4. Annualized for periods less than one full year.
5. Less than 0.005%.
6. Total expenses including indirect expenses from affiliated fund fees and expenses were as follows:
| | | | | | | | |
| Six Months Ended February 28, 2018 | | | 0.86 | % | | | | |
Year Ended August 31, 2017 | | | 0.88 | % | | | | |
| Year Ended August 31, 2016 | | | 0.88 | % | | | | |
Year Ended August 31, 2015 | | | 0.87 | % | | | | |
| Year Ended August 29, 2014 | | | 0.87 | % | | | | |
Year Ended August 30, 2013 | | | 0.89 | % | | | | |
7. Waiver was less than 0.005%.
See accompanying Notes to Consolidated Financial Statements.
|
| 29 OPPENHEIMER DEVELOPING MARKETS FUND |
CONSOLIDATED FINANCIAL HIGHLIGHTS Continued
| | | | | | | | | | | | | | |
| Class R | | Six Months
Ended
February 28,
2018
(Unaudited) | | Year Ended
August 31,
2017 | | Year Ended
August 31,
2016 | | Year Ended
August 31,
2015 | | Year Ended
August 29,
20141 | | Year Ended
August 30,
20131 | |
| |
| Per Share Operating Data | | | | |
| Net asset value, beginning of period | | $39.84 | | $32.13 | | $28.88 | | $39.74 | | $32.72 | | | $31.11 | |
| |
| Income (loss) from investment operations: | | | | | | | | | | | | | | |
| Net investment income (loss)2 | | (0.14) | | 0.05 | | 0.04 | | 0.08 | | 0.04 | | | (0.03) | |
| Net realized and unrealized gain (loss) | | 3.40 | | 7.66 | | 3.27 | | (10.30) | | 7.16 | | | 1.69 | |
| | | |
| Total from investment operations | | 3.26 | | 7.71 | | 3.31 | | (10.22) | | 7.20 | | | 1.66 | |
| |
| Dividends and/or distributions to shareholders: | | | | | | | | | | | | | | |
| Dividends from net investment income | | (0.05) | | (0.00)3 | | (0.06) | | (0.04) | | 0.00 | | | (0.05) | |
| Distributions from net realized gain | | 0.00 | | 0.00 | | 0.00 | | (0.60) | | (0.18) | | | 0.00 | |
| | | |
| Total dividends and/or distributions to shareholders | | (0.05) | | (0.00) | | (0.06) | | (0.64) | | (0.18) | | | (0.05) | |
| |
| Net asset value, end of period | | $43.05 | | $39.84 | | $32.13 | | $28.88 | | $39.74 | | | $32.72 | |
| | | |
|
| |
| Total Return, at Net Asset Value4 | | 8.20% | | 24.01% | | 11.47% | | (26.03)% | | 22.05% | | | 5.33% | |
|
| |
| Ratios/Supplemental Data | | | | | | | | | | | | | | |
| Net assets, end of period (in thousands) | | $686,654 | | $680,861 | | $634,007 | | $657,581 | | $972,479 | | | $856,074 | |
| |
| Average net assets (in thousands) | | $689,701 | | $626,788 | | $627,034 | | $832,613 | | $922,384 | | | $869,931 | |
| |
| Ratios to average net assets:5 | | | | | | | | | | | | | | |
| Net investment income (loss) | | (0.69)% | | 0.14% | | 0.14% | | 0.23% | | 0.10% | | | (0.09)% | |
| Expenses excluding specific expenses listed below | | 1.55% | | 1.57% | | 1.57% | | 1.56% | | 1.64% | | | 1.84% | |
| Interest and fees from borrowings | | 0.00%6 | | 0.00%6 | | 0.00%6 | | 0.00%6 | | 0.00% | | | 0.00% | |
| | | |
| Total expenses7 | | 1.55% | | 1.57% | | 1.57% | | 1.56% | | 1.64% | | | 1.84% | |
| Expenses after payments, waivers and/or reimbursements and reduction to custodian expenses | | 1.54% | | 1.56% | | 1.57%8 | | 1.55% | | 1.58% | | | 1.70% | |
| |
| Portfolio turnover rate | | 20% | | 33% | | 18% | | 36% | | 26% | | | 29% | |
|
| 30 OPPENHEIMER DEVELOPING MARKETS FUND |
1. Represents the last business day of the Fund’s reporting period.
2. Per share amounts calculated based on the average shares outstanding during the period.
3. Less than $0.005 per share.
4. Assumes an initial investment on the business day before the first day of the fiscal period, with all dividends and distributions reinvested in additional shares on the reinvestment date, and redemption at the net asset value calculated on the last business day of the fiscal period. Sales charges are not reflected in the total returns. Total returns are not annualized for periods less than one full year. Returns do not reflect the deduction of taxes that a shareholder would pay on fund distributions or the redemption of fund shares.
5. Annualized for periods less than one full year.
6. Less than 0.005%.
7. Total expenses including indirect expenses from affiliated fund fees and expenses were as follows:
| | | | | | | | |
| Six Months Ended February 28, 2018 | | | 1.55 | % | | | | |
Year Ended August 31, 2017 | | | 1.57 | % | | | | |
| Year Ended August 31, 2016 | | | 1.57 | % | | | | |
Year Ended August 31, 2015 | | | 1.56 | % | | | | |
| Year Ended August 29, 2014 | | | 1.65 | % | | | | |
Year Ended August 30, 2013 | | | 1.85 | % | | | | |
8. Waiver was less than 0.005%.
See accompanying Notes to Consolidated Financial Statements.
|
| 31 OPPENHEIMER DEVELOPING MARKETS FUND |
CONSOLIDATED FINANCIAL HIGHLIGHTS Continued
| | | | | | | | | | | | | | |
| Class Y | | Six Months
Ended
February 28,
2018
(Unaudited) | | Year Ended
August 31,
2017 | | Year Ended
August 31,
2016 | | Year Ended
August 31,
2015 | | Year Ended
August 29,
20141 | | Year Ended
August 30,
20131 | |
| |
| Per Share Operating Data | | | | |
| Net asset value, beginning of period | | $40.98 | | $33.06 | | $29.73 | | $40.88 | | $33.62 | | | $31.94 | |
| |
| Income (loss) from investment operations: | | | | | | | | | | | | | | |
| Net investment income (loss)2 | | (0.04) | | 0.24 | | 0.19 | | 0.26 | | 0.25 | | | 0.22 | |
| Net realized and unrealized gain (loss) | | 3.49 | | 7.85 | | 3.36 | | (10.59) | | 7.35 | | | 1.71 | |
| | | |
| Total from investment operations | | 3.45 | | 8.09 | | 3.55 | | (10.33) | | 7.60 | | | 1.93 | |
| |
| Dividends and/or distributions to shareholders: | | | | | | | | | | | | | | |
| Dividends from net investment income | | (0.25) | | (0.17) | | (0.22) | | (0.22) | | (0.16) | | | (0.25) | |
| Distributions from net realized gain | | 0.00 | | 0.00 | | 0.00 | | (0.60) | | (0.18) | | | 0.00 | |
| | | |
| Total dividends and/or distributions to shareholders | | (0.25) | | (0.17) | | (0.22) | | (0.82) | | (0.34) | | | (0.25) | |
| |
| Net asset value, end of period | | $44.18 | | $40.98 | | $33.06 | | $29.73 | | $40.88 | | | $33.62 | |
| | | |
|
| |
| Total Return, at Net Asset Value3 | | 8.44% | | 24.61% | | 12.04% | | (25.66)% | | 22.72% | | | 6.04% | |
|
| |
| Ratios/Supplemental Data | | | | | | | | | | | | | | |
| Net assets, end of period (in thousands) | | $18,644,890 | | $17,496,988 | | $13,551,480 | | $15,358,492 | | $21,476,284 | | | $15,733,385 | |
| |
| Average net assets (in thousands) | | $18,248,080 | | $14,523,085 | | $13,507,017 | | $19,567,341 | | $19,215,510 | | | $14,400,407 | |
| |
| Ratios to average net assets:4 | | | | | | | | | | | | | | |
| Net investment income (loss) | | (0.20)% | | 0.67% | | 0.62% | | 0.74% | | 0.67% | | | 0.64% | |
| Expenses excluding specific expenses listed below | | 1.05% | | 1.07% | | 1.07% | | 1.06% | | 1.04% | | | 1.02% | |
| Interest and fees from borrowings | | 0.00%5 | | 0.00%5 | | 0.00%5 | | 0.00%5 | | 0.00% | | | 0.00% | |
| | | |
| Total expenses6 | | 1.05% | | 1.07% | | 1.07% | | 1.06% | | 1.04% | | | 1.02% | |
| Expenses after payments, waivers and/or reimbursements and reduction to custodian expenses | | 1.04% | | 1.06% | | 1.07%7 | | 1.05% | | 1.03% | | | 1.01% | |
| |
Portfolio turnover rate | | 20% | | 33% | | 18% | | 36% | | 26% | | | 29% | |
|
| 32 OPPENHEIMER DEVELOPING MARKETS FUND |
1. Represents the last business day of the Fund’s reporting period.
2. Per share amounts calculated based on the average shares outstanding during the period.
3. Assumes an initial investment on the business day before the first day of the fiscal period, with all dividends and distributions reinvested in additional shares on the reinvestment date, and redemption at the net asset value calculated on the last business day of the fiscal period. Sales charges are not reflected in the total returns. Total returns are not annualized for periods less than one full year. Returns do not reflect the deduction of taxes that a shareholder would pay on fund distributions or the redemption of fund shares.
4. Annualized for periods less than one full year.
5. Less than 0.005%.
6. Total expenses including indirect expenses from affiliated fund fees and expenses were as follows:
| | | | | | | | |
| Six Months Ended February 28, 2018 | | | 1.05 | % | | | | |
Year Ended August 31, 2017 | | | 1.07 | % | | | | |
| Year Ended August 31, 2016 | | | 1.07 | % | | | | |
Year Ended August 31, 2015 | | | 1.06 | % | | | | |
| Year Ended August 29, 2014 | | | 1.05 | % | | | | |
Year Ended August 30, 2013 | | | 1.03 | % | | | | |
7. Waiver was less than 0.005%.
See accompanying Notes to Consolidated Financial Statements.
|
| 33 OPPENHEIMER DEVELOPING MARKETS FUND |
NOTES TO
CONSOLIDATED FINANCIAL STATEMENTS February 28, 2018 Unaudited
1. Organization
Oppenheimer Developing Markets Fund (the “Fund”) is a diversified open-end management investment company registered under the Investment Company Act of 1940 (“1940 Act”), as amended. The Fund’s investment objective is to seek capital appreciation. The Fund’s investment adviser is OFI Global Asset Management, Inc. (“OFI Global” or the “Manager”), a wholly-owned subsidiary of OppenheimerFunds, Inc. (“OFI” or the “Sub-Adviser”). The Manager has entered into a sub-advisory agreement with OFI.
The Fund offers Class A, Class C, Class I, Class R and Class Y shares, and previously offered Class B shares for new purchase through June 29, 2012. Subsequent to that date, no new purchases of Class B shares are permitted, however reinvestment of dividend and/or capital gain distributions and exchanges of Class B shares into and from other Oppenheimer funds are allowed. Class A shares are sold at their offering price, which is normally net asset value plus a front-end sales charge. Class C and Class R shares are sold, and Class B shares were sold, without a front-end sales charge but may be subject to a contingent deferred sales charge (“CDSC”). Class R shares are sold only through retirement plans. Retirement plans that offer Class R shares may impose charges on those accounts. Class I and Class Y shares are sold to certain institutional investors or intermediaries without either a front-end sales charge or a CDSC, however, the intermediaries may impose charges on their accountholders who beneficially own Class I and Class Y shares. All classes of shares have identical rights and voting privileges with respect to the Fund in general and exclusive voting rights on matters that affect that class alone. Earnings, net assets and net asset value per share may differ due to each class having its own expenses, such as transfer and shareholder servicing agent fees and shareholder communications, directly attributable to that class. Class A, B, C and R shares have separate distribution and/or service plans under which they pay fees. Class I and Class Y shares do not pay such fees. Class B shares will automatically convert to Class A shares 72 months after the date of purchase.
The following is a summary of significant accounting policies followed in the Fund’s preparation of financial statements in accordance with accounting principles generally accepted in the United States (“U.S. GAAP”).
2. Significant Accounting Policies
Security Valuation. All investments in securities are recorded at their estimated fair value, as described in Note 3.
Basis for Consolidation. The Fund has established a private vehicle, OFI Global China Fund, LLC, which is wholly-owned and controlled by the Fund (the “Subsidiary”) organized under laws of Delaware. The Fund and Subsidiary are both managed by the Manager. The Fund may invest up to 10% of its total net assets in the Subsidiary. The Subsidiary invests significantly in class A-shares of Chinese companies (“China A Shares”). The Fund applies its investment restrictions and compliance policies and procedures, on a look-through basis, to the Subsidiary.
The financial statements have been consolidated and include accounts of the Fund and the Subsidiary. Accordingly, all inter-company transactions and balances have been eliminated.
|
| 34 OPPENHEIMER DEVELOPING MARKETS FUND |
2. Significant Accounting Policies (Continued)
At period end, the Fund owned 44,635,168 shares with net assets of $1,411,930,967 in the Subsidiary.
Other financial information at period end:
| | | | |
| Total market value of investments | | $ | 985,279,719 | |
| Net assets | | $ | 1,411,930,967 | |
| Net income (loss) | | $ | (62,348) | |
| Net realized gain (loss) | | $ | 141,762,095 | |
| Net change in unrealized appreciation (depreciation) | | $ | 205,594,680 | |
Foreign Currency Translation. The books and records of the Fund are maintained in U.S. dollars. Any foreign currency amounts are translated into U.S. dollars on the following basis:
(1) Value of investment securities, other assets and liabilities — at the exchange rates prevailing at Market Close as described in Note 3.
(2) Purchases and sales of investment securities, income and expenses — at the rates of exchange prevailing on the respective dates of such transactions.
Although the net assets and the values are presented at the foreign exchange rates at Market Close, the Fund does not isolate the portion of the results of operations resulting from changes in foreign exchange rates on investments from the fluctuations arising from changes in prices of securities held. Such fluctuations are included with the net realized and unrealized gains or losses from investments shown in the Consolidated Statement of Operations.
For securities, which are subject to foreign withholding tax upon disposition, realized gains or losses on such securities are recorded net of foreign withholding tax.
Reported net realized foreign exchange gains or losses arise from sales of foreign currencies, currency gains or losses realized between the trade and settlement dates on securities transactions, the difference between the amounts of dividends, interest, and foreign withholding tax reclaims recorded on the Fund’s books, and the U.S. dollar equivalent of the amounts actually received or paid. Net unrealized foreign exchange gains and losses arise from changes in the value of assets and liabilities other than investments in securities, resulting from changes in the exchange rate.
Allocation of Income, Expenses, Gains and Losses. Income, expenses (other than those attributable to a specific class), gains and losses are allocated on a daily basis to each class of shares based upon the relative proportion of net assets represented by such class. Operating expenses directly attributable to a specific class are charged against the operations of that class.
Dividends and Distributions to Shareholders. Dividends and distributions to shareholders, which are determined in accordance with income tax regulations and may differ from U.S. GAAP, are recorded on the ex-dividend date. Income and capital gain distributions, if any, are declared and paid annually or at other times as determined necessary by the Manager.
|
| 35 OPPENHEIMER DEVELOPING MARKETS FUND |
NOTES TO
CONSOLIDATED FINANCIAL STATEMENTS Unaudited / Continued
2. Significant Accounting Policies (Continued)
The tax character of distributions is determined as of the Fund’s fiscal year end. Therefore, a portion of the Fund’s distributions made to shareholders prior to the Fund’s fiscal year end may ultimately be categorized as a tax return of capital.
Investment Income. Dividend income is recorded on the ex-dividend date or upon ex-dividend notification in the case of certain foreign dividends where the ex-dividend date may have passed. Non-cash dividends included in dividend income, if any, are recorded at the fair value of the securities received. Withholding taxes on foreign dividends, if any, and capital gains taxes on foreign investments, if any, have been provided for in accordance with the Fund’s understanding of the applicable tax rules and regulations. Interest income, if any, is recognized on an accrual basis. Discount and premium, which are included in interest income on the Consolidated Statement of Operations, are amortized or accreted daily.
Custodian Fees. “Custodian fees and expenses” in the Consolidated Statement of Operations may include interest expense incurred by the Fund on any cash overdrafts of its custodian account during the period. Such cash overdrafts may result from the effects of failed trades in portfolio securities and from cash outflows resulting from unanticipated shareholder redemption activity. The Fund pays interest to its custodian on such cash overdrafts, to the extent they are not offset by positive cash balances maintained by the Fund, at a rate equal to the Federal Funds Rate plus 2.00%. The “Reduction to custodian expenses” line item, if applicable, represents earnings on cash balances maintained by the Fund during the period. Such interest expense and other custodian fees may be paid with these earnings.
Security Transactions. Security transactions are recorded on the trade date. Realized gains and losses on securities sold are determined on the basis of identified cost.
Indemnifications. The Fund’s organizational documents provide current and former Trustees and officers with a limited indemnification against liabilities arising in connection with the performance of their duties to the Fund. In the normal course of business, the Fund may also enter into contracts that provide general indemnifications. The Fund’s maximum exposure under these arrangements is unknown as this would be dependent on future claims that may be made against the Fund. The risk of material loss from such claims is considered remote.
Federal Taxes. The Fund intends to comply with provisions of the Internal Revenue Code applicable to regulated investment companies and to distribute substantially all of its investment company taxable income to shareholders. Therefore, no federal income or excise tax provision is required. The Fund files income tax returns in U.S. federal and applicable state jurisdictions. The statute of limitations on the Fund’s tax return filings generally remains open for the three preceding fiscal reporting period ends. The Fund has analyzed its tax positions for the fiscal year ended August 31, 2017, including open tax years, and does not believe there are any uncertain tax positions requiring recognition in the Fund’s financial statements.
|
| 36 OPPENHEIMER DEVELOPING MARKETS FUND |
2. Significant Accounting Policies (Continued)
During the fiscal year ended August 31, 2017, the Fund utilized $1,062,933,759 of capital loss carryforward to offset capital gains realized in that fiscal year. Details of the fiscal year ended August 31, 2017 capital loss carryforwards are included in the table below. Capital loss carryforwards with no expiration, if any, must be utilized prior to those with expiration dates. Capital losses with no expiration will be carried forward to future years if not offset by gains.
| | | | |
| Expiring | | | |
| No expiration | | $ | 3,071,789,154 | |
At period end, it is estimated that the capital loss carryforwards would be $1,186,590,566, which will not expire. The estimated capital loss carryforward represents the carryforward as of the end of the last fiscal year, increased or decreased by capital losses or gains realized in the first six months of the current fiscal year. During the reporting period, it is estimated that the Fund will utilize $1,885,198,588 of capital loss carryforward to offset realized capital gains.
Net investment income (loss) and net realized gain (loss) may differ for financial statement and tax purposes. The character of dividends and distributions made during the fiscal year from net investment income or net realized gains are determined in accordance with federal income tax requirements, which may differ from the character of net investment income or net realized gains presented in those financial statements in accordance with U.S. GAAP. Also, due to timing of dividends and distributions, the fiscal year in which amounts are distributed may differ from the fiscal year in which the income or net realized gain was recorded by the Fund.
The aggregate cost of securities and other investments and the composition of unrealized appreciation and depreciation of securities and other investments for federal income tax purposes at period end are noted in the following table. The primary difference between book and tax appreciation or depreciation of securities and other investments, if applicable, is attributable to the tax deferral of losses or tax realization of financial statement unrealized gain or loss.
| | | | |
| Federal tax cost of securities | | $ | 26,906,018,104 | |
| Federal tax cost of other investments | | | 405,930,842 | |
| | | | |
| Total federal tax cost | | $ | 27,311,948,946 | |
| | | | |
| Gross unrealized appreciation | | $ | 15,515,476,408 | |
| Gross unrealized depreciation | | | (2,331,908,856) | |
| | | | |
| Net unrealized appreciation | | $ | 13,183,567,552 | |
| | | | |
Certain foreign countries impose a tax on capital gains which is accrued by the Fund based on unrealized appreciation, if any, on affected securities. The tax is paid when the gain is realized.
Use of Estimates. The preparation of financial statements in conformity with U.S. GAAP requires management to make estimates and assumptions that affect the reported amounts of assets and liabilities and disclosure of contingent assets and liabilities at the date of the financial statements and the reported amounts of increases and decreases in net assets from
|
| 37 OPPENHEIMER DEVELOPING MARKETS FUND |
NOTES TO
CONSOLIDATED FINANCIAL STATEMENTS Unaudited / Continued
2. Significant Accounting Policies (Continued)
operations during the reporting period. Actual results could differ from those estimates.
3. Securities Valuation
The Fund calculates the net asset value of its shares as of 4:00 P.M. Eastern time, on each day the New York Stock Exchange (the “Exchange”) is open for trading, except in the case of a scheduled early closing of the Exchange, in which case the Fund will calculate net asset value of the shares as of the scheduled early closing time of the Exchange.
The Fund’s Board has adopted procedures for the valuation of the Fund’s securities and has delegated the day-to-day responsibility for valuation determinations under those procedures to the Manager. The Manager has established a Valuation Committee which is responsible for determining a fair valuation for any security for which market quotations are not readily available. The Valuation Committee’s fair valuation determinations are subject to review, approval and ratification by the Fund’s Board at least quarterly or more frequently, if necessary.
Valuation Methods and Inputs
Securities are valued primarily using unadjusted quoted market prices, when available, as supplied by third party pricing services or broker-dealers.
The following methodologies are used to determine the market value or the fair value of the types of securities described below:
Equity securities traded on a securities exchange (including exchange-traded derivatives other than futures and futures options) are valued based on the official closing price on the principal exchange on which the security is traded, as identified by the Manager, prior to the time when the Fund’s assets are valued. If the official closing price is unavailable, the security is valued at the last sale price on the principal exchange on which it is traded, or if no sales occurred, the security is valued at the mean between the quoted bid and asked prices. Over-the-counter equity securities are valued at the last published sale price, or if no sales occurred, at the mean between the quoted bid and asked prices. Events occurring after the close of trading on foreign exchanges may result in adjustments to the valuation of foreign securities to more accurately reflect their fair value as of the time when the Fund’s assets are valued.
Shares of a registered investment company that are not traded on an exchange are valued at that investment company’s net asset value per share.
Securities for which market quotations are not readily available, or when a significant event has occurred that would materially affect the value of the security, are fair valued either (i) by a standardized fair valuation methodology applicable to the security type or the significant event as previously approved by the Valuation Committee and the Fund’s Board or (ii) as determined in good faith by the Manager’s Valuation Committee. The Valuation Committee considers all relevant facts that are reasonably available, through either public information or information available to the Manager, when determining the fair value of a security. Those standardized fair valuation methodologies include, but are not limited to, valuing securities at the last sale price or initially at cost and subsequently adjusting the value based on: changes
|
| 38 OPPENHEIMER DEVELOPING MARKETS FUND |
3. Securities Valuation (Continued)
in company specific fundamentals, changes in an appropriate securities index, or changes in the value of similar securities which may be further adjusted for any discounts related to security-specific resale restrictions. When possible, such methodologies use observable market inputs such as unadjusted quoted prices of similar securities, observable interest rates, currency rates and yield curves. The methodologies used for valuing securities are not necessarily an indication of the risks associated with investing in those securities nor can it be assured that the Fund can obtain the fair value assigned to a security if it were to sell the security.
To assess the continuing appropriateness of security valuations, the Manager regularly compares prior day prices and sale prices to the current day prices and challenges those prices exceeding certain tolerance levels with the third party pricing service or broker source. For those securities valued by fair valuations, whether through a standardized fair valuation methodology or a fair valuation determination, the Valuation Committee reviews and affirms the reasonableness of the valuations based on such methodologies and fair valuation determinations on a regular basis after considering all relevant information that is reasonably available.
Classifications
Each investment asset or liability of the Fund is assigned a level at measurement date based on the significance and source of the inputs to its valuation. Various data inputs may be used in determining the value of each of the Fund’s investments as of the reporting period end. These data inputs are categorized in the following hierarchy under applicable financial accounting standards:
1) Level 1-unadjusted quoted prices in active markets for identical assets or liabilities (including securities actively traded on a securities exchange)
2) Level 2-inputs other than unadjusted quoted prices that are observable for the asset or liability (such as unadjusted quoted prices for similar assets and market corroborated inputs such as interest rates, prepayment speeds, credit risks, etc.)
3) Level 3-significant unobservable inputs (including the Manager’s own judgments about assumptions that market participants would use in pricing the asset or liability).
The inputs used for valuing securities are not necessarily an indication of the risks associated with investing in those securities.
The Fund classifies each of its investments in investment companies which are publicly offered as Level 1. Investment companies that are not publicly offered, if any, are classified as Level 2 in the fair value hierarchy.
The table below categorizes amounts that are included in the Fund’s Consolidated Statement of Assets and Liabilities at period end based on valuation input level:
|
| 39 OPPENHEIMER DEVELOPING MARKETS FUND |
NOTES TO
CONSOLIDATED FINANCIAL STATEMENTS Unaudited / Continued
3. Securities Valuation (Continued)
| | | | | | | | | | | | | | | | |
| | | Level 1— Unadjusted Quoted Prices | | | Level 2— Other Significant
Observable Inputs | | | Level 3—
Significant
Unobservable
Inputs | | | Value | |
Assets Table | | | | | | | | | | | | | | | | |
Investments, at Value: | | | | | | | | | | | | | | | | |
Common Stocks | | | | | | | | | | | | | | | | |
Consumer Discretionary | | $ | 1,769,116,678 | | | $ | 3,718,736,269 | | | $ | — | | | $ | 5,487,852,947 | |
Consumer Staples | | | 1,795,440,333 | | | | 2,516,868,586 | | | | — | | | | 4,312,308,919 | |
Energy | | | — | | | | 1,490,091,815 | | | | — | | | | 1,490,091,815 | |
Financials | | | 2,483,385,121 | | | | 7,128,195,621 | | | | — | | | | 9,611,580,742 | |
Health Care | | | 46,841,029 | | | | 3,062,043,023 | | | | — | | | | 3,108,884,052 | |
Industrials | | | 407,608,291 | | | | 1,544,874,019 | | | | — | | | | 1,952,482,310 | |
Information Technology | | | 2,561,876,298 | | | | 6,857,549,357 | | | | — | | | | 9,419,425,655 | |
Materials | | | 808,149,045 | | | | 1,809,466,369 | | | | — | | | | 2,617,615,414 | |
Telecommunication Services | | | — | | | | 160,283,997 | | | | — | | | | 160,283,997 | |
Preferred Stocks | | | 502,128,164 | | | | 44,412,063 | | | | 118,345,352 | | | | 664,885,579 | |
Investment Company | | | 1,249,164,003 | | | | — | | | | — | | | | 1,249,164,003 | |
| | | | |
Total Assets | | $ | 11,623,708,962 | | | $ | 28,332,521,119 | | | $ | 118,345,352 | | | $ | 40,074,575,433 | |
| | | | |
Forward currency exchange contracts and futures contracts, if any, are reported at their unrealized appreciation/depreciation at measurement date, which represents the change in the contract’s value from trade date. All additional assets and liabilities included in the above table are reported at their market value at measurement date.
The table below shows the transfers between Level 1 and Level 2. The Fund’s policy is to recognize transfers in and transfers out as of the beginning of the reporting period.
| | | | | | | | |
| | | Transfers into
Level 1* | | | Transfers out of
Level 2* | |
Assets Table | | | | | | | | |
Investments, at Value: | | | | | | | | |
Common Stocks | | | | | | | | |
Consumer Staples | | $ | 1,053,881,514 | | | $ | (1,053,881,514) | |
| | | | |
Total Assets | | $ | 1,053,881,514 | | | $ | (1,053,881,514) | |
| | | | |
* Transfers from Level 2 to Level 1 are a result of the availability of quoted prices from an active market which were not available and have become available.
4. Investments and Risks
Risks of Foreign Investing. The Fund may invest in foreign securities which are subject to special risks. Securities traded in foreign markets may be less liquid and more volatile than those traded in U.S. markets. Foreign issuers are usually not subject to the same accounting and disclosure requirements that U.S. companies are subject to, which may make it difficult for the Fund to evaluate a foreign company’s operations or financial condition. A change in the value of a foreign currency against the U.S. dollar will result in a change in the U.S. dollar value of investments denominated in that foreign currency and in the value of any income
|
| 40 OPPENHEIMER DEVELOPING MARKETS FUND |
4. Investments and Risks (Continued)
or distributions the Fund may receive on those investments. The value of foreign investments may be affected by exchange control regulations, foreign taxes, higher transaction and other costs, delays in the settlement of transactions, changes in economic or monetary policy in the United States or abroad, expropriation or nationalization of a company’s assets, or other political and economic factors. In addition, due to the inter-relationship of global economies and financial markets, changes in political and economic factors in one country or region could adversely affect conditions in another country or region. Investments in foreign securities may also expose the Fund to time-zone arbitrage risk. Foreign securities may trade on weekends or other days when the Fund does not price its shares. At times, the Fund may emphasize investments in a particular country or region and may be subject to greater risks from adverse events that occur in that country or region. Foreign securities and foreign currencies held in foreign banks and securities depositories may be subject to limited or no regulatory oversight.
Investments in Affiliated Funds. The Fund is permitted to invest in other mutual funds advised by the Manager (“Affiliated Funds”). Affiliated Funds are open-end management investment companies registered under the 1940 Act, as amended. The Manager is the investment adviser of, and the Sub-Adviser provides investment and related advisory services to, the Affiliated Funds. When applicable, the Fund’s investments in Affiliated Funds are included in the Consolidated Statement of Investments. Shares of Affiliated Funds are valued at their net asset value per share. As a shareholder, the Fund is subject to its proportional share of the Affiliated Funds’ expenses, including their management fee. The Manager will waive fees and/or reimburse Fund expenses in an amount equal to the indirect management fees incurred through the Fund’s investment in the Affiliated Funds.
Each of the Affiliated Funds in which the Fund invests has its own investment risks, and those risks can affect the value of the Fund’s investments and therefore the value of the Fund’s shares. To the extent that the Fund invests more of its assets in one Affiliated Fund than in another, the Fund will have greater exposure to the risks of that Affiliated Fund.
Investments in Money Market Instruments. The Fund is permitted to invest its free cash balances in money market instruments to provide liquidity or for defensive purposes. The Fund may invest in money market instruments by investing in Class E shares of Oppenheimer Institutional Government Money Market Fund (“IGMMF”), which is an Affiliated Fund. IGMMF is regulated as a money market fund under the 1940 Act, as amended. The Fund may also invest in money market instruments directly or in other affiliated or unaffiliated money market funds.
Restricted Securities. At period end, investments in securities included issues that are restricted. A restricted security may have a contractual restriction on its resale and is valued under methods approved by the Board of Trustees as reflecting fair value. Securities that are restricted are marked with an applicable footnote on the Consolidated Statement of Investments. Restricted securities are reported on a schedule following the Consolidated Statement of Investments.
|
| 41 OPPENHEIMER DEVELOPING MARKETS FUND |
NOTES TO
CONSOLIDATED FINANCIAL STATEMENTS Unaudited / Continued
4. Investments and Risks (Continued)
Equity Security Risk. Stocks and other equity securities fluctuate in price. The value of the Fund’s portfolio may be affected by changes in the equity markets generally. Equity markets may experience significant short-term volatility and may fall sharply at times. Different markets may behave differently from each other and U.S. equity markets may move in the opposite direction from one or more foreign stock markets. Adverse events in any part of the equity or fixed-income markets may have unexpected negative effects on other market segments.
The prices of individual equity securities generally do not all move in the same direction at the same time and a variety of factors can affect the price of a particular company’s securities. These factors may include, but are not limited to, poor earnings reports, a loss of customers, litigation against the company, general unfavorable performance of the company’s sector or industry, or changes in government regulations affecting the company or its industry.
5. Market Risk Factors
The Fund’s investments in securities and/or financial derivatives may expose the Fund to various market risk factors:
Commodity Risk. Commodity risk relates to the change in value of commodities or commodity indexes as they relate to increases or decreases in the commodities market. Commodities are physical assets that have tangible properties. Examples of these types of assets are crude oil, heating oil, metals, livestock, and agricultural products.
Credit Risk. Credit risk relates to the ability of the issuer of debt to meet interest and principal payments, or both, as they come due. In general, lower-grade, higher-yield debt securities are subject to credit risk to a greater extent than lower-yield, higher-quality securities.
Equity Risk. Equity risk relates to the change in value of equity securities as they relate to increases or decreases in the general market.
Foreign Exchange Rate Risk. Foreign exchange rate risk relates to the change in the U.S. dollar value of a security held that is denominated in a foreign currency. The U.S. dollar value of a foreign currency denominated security will decrease as the dollar appreciates against the currency, while the U.S. dollar value will increase as the dollar depreciates against the currency.
Interest Rate Risk. Interest rate risk refers to the fluctuations in value of fixed-income securities resulting from the inverse relationship between price and yield. For example, an increase in general interest rates will tend to reduce the market value of already issued fixed-income investments, and a decline in general interest rates will tend to increase their value. In addition, debt securities with longer maturities, which tend to have higher yields, are subject to potentially greater fluctuations in value from changes in interest rates than obligations with shorter maturities.
Volatility Risk. Volatility risk refers to the magnitude of the movement, but not the direction of the movement, in a financial instrument’s price over a defined time period. Large increases or decreases in a financial instrument’s price over a relative time period typically indicate greater volatility risk, while small increases or decreases in its price
|
| 42 OPPENHEIMER DEVELOPING MARKETS FUND |
5. Market Risk Factors (Continued)
typically indicate lower volatility risk.
6. Shares of Beneficial Interest
The Fund has authorized an unlimited number of no par value shares of beneficial interest of each class. Transactions in shares of beneficial interest were as follows:
| | | | | | | | | | | | | | | | |
| | | Six Months Ended February 28, 2018 | | | Year Ended August 31, 2017 | |
| | | Shares | | | Amount | | | Shares | | | Amount | |
Class A | | | | | | | | | | | | | | | | |
Sold | | | 12,061,175 | | | $ | 527,852,747 | | | | 31,811,501 | | | $ | 1,136,025,673 | |
Dividends and/or distributions reinvested | | | 416,994 | | | | 17,622,161 | | | | 392,726 | | | | 12,555,449 | |
Redeemed | | | (24,381,490 | ) | | | (1,058,570,111 | ) | | | (75,677,894 | ) | | | (2,709,159,782 | ) |
| | | | |
Net decrease | | | (11,903,321 | ) | | $ | (513,095,203 | ) | | | (43,473,667 | ) | | $ | (1,560,578,660 | ) |
| | | | |
|
| |
Class B | | | | | | | | | | | | | | | | |
Sold | | | 253 | | | $ | 10,424 | | | | 3,352 | | | $ | 111,278 | |
Dividends and/or distributions reinvested | | | — | | | | — | | | | — | | | | — | |
Redeemed | | | (265,726 | ) | | | (11,026,020 | ) | | | (1,057,687 | ) | | | (35,501,743 | ) |
| | | | |
Net decrease | | | (265,473 | ) | | $ | (11,015,596 | ) | | | (1,054,335 | ) | | $ | (35,390,465 | ) |
| | | | |
|
| |
Class C | | | | | | | | | | | | | | | | |
Sold | | | 450,433 | | | $ | 18,322,948 | | | | 890,936 | | | $ | 30,264,316 | |
Dividends and/or distributions reinvested | | | — | | | | — | | | | — | | | | — | |
Redeemed | | | (2,384,635 | ) | | | (96,883,448 | ) | | | (9,106,138 | ) | | | (302,667,303 | ) |
| | | | |
Net decrease | | | (1,934,202 | ) | | $ | (78,560,500 | ) | | | (8,215,202 | ) | | $ | (272,402,987 | ) |
| | | | |
|
| |
Class I | | | | | | | | | | | | | | | | |
Sold | | | 67,829,590 | | | $ | 2,929,577,633 | | | | 108,245,273 | | | $ | 3,786,790,030 | |
Dividends and/or distributions reinvested | | | 1,705,746 | | | | 71,010,204 | | | | 1,264,418 | | | | 39,829,159 | |
Redeemed | | | (35,725,401 | ) | | | (1,543,752,967 | ) | | | (65,238,785 | ) | | | (2,286,135,787 | ) |
| | | | |
Net increase | | | 33,809,935 | | | $ | 1,456,834,870 | | | | 44,270,906 | | | $ | 1,540,483,402 | |
| | | | |
|
| |
Class R | | | | | | | | | | | | | | | | |
Sold | | | 1,279,287 | | | $ | 53,809,685 | | | | 2,754,602 | | | $ | 94,383,964 | |
Dividends and/or distributions reinvested | | | 17,434 | | | | 708,333 | | | | 1,493 | | | | 45,922 | |
Redeemed | | | (2,438,194 | ) | | | (101,967,060 | ) | | | (5,397,816 | ) | | | (184,357,136 | ) |
| | | | |
Net decrease | | | (1,141,473 | ) | | $ | (47,449,042 | ) | | | (2,641,721 | ) | | $ | (89,927,250 | ) |
| | | | |
|
| |
Class Y | | | | | | | | | | | | | | | | |
Sold | | | 57,787,217 | | | $ | 2,491,527,919 | | | | 140,285,900 | | | $ | 4,979,838,763 | |
Dividends and/or distributions reinvested | | | 2,294,025 | | | | 95,523,193 | | | | 1,955,138 | | | | 61,625,965 | |
Redeemed | | | (65,077,188 | ) | | | (2,809,443,505 | ) | | | (125,216,530 | ) | | | (4,366,245,180 | ) |
| | | | |
Net increase (decrease) | | | (4,995,946 | ) | | $ | (222,392,393 | ) | | | 17,024,508 | | | $ | 675,219,548 | |
| | | | |
|
| 43 OPPENHEIMER DEVELOPING MARKETS FUND |
NOTES TO
CONSOLIDATED FINANCIAL STATEMENTS Unaudited / Continued
7. Purchases and Sales of Securities
The aggregate cost of purchases and proceeds from sales of securities, other than short-term obligations and investments in IGMMF, for the reporting period were as follows:
| | | | | | | | |
| | | Purchases | | | Sales | |
Investment securities | | $ | 7,885,758,035 | | | $ | 7,356,523,304 | |
8. Fees and Other Transactions with Affiliates
Management Fees. Under the investment advisory agreement, the Fund pays the Manager a management fee based on the daily net assets of the Fund at an annual rate as shown in the following table:
| | | | |
| Fee Schedule | | | |
Up to $250 million | | | 1.00% | |
Next $250 million | | | 0.95 | |
Next $500 million | | | 0.90 | |
Next $6 billion | | | 0.85 | |
Next $3 billion | | | 0.80 | |
Next $20 billion | | | 0.75 | |
Next $15 billion | | | 0.74 | |
Over $45 billion | | | 0.73 | |
The Manager also provides investment management related services to the Subsidiary. The Subsidiary pays the Manager a monthly management fee at an annual rate according to the above schedule. The Subsidiary also pays certain other expenses including custody and directors’ fees.
The Fund’s effective management fee for the reporting period was 0.77% of average annual net assets before any Subsidiary management fees or any applicable waivers.
Sub-Adviser Fees. The Manager has retained the Sub-Adviser to provide the day-to-day portfolio management of the Fund and the Subsidiary. Under the Sub-Advisory Agreement, the Manager pays the Sub-Adviser an annual fee in monthly installments, equal to a percentage of the investment management fee collected by the Manager from the Fund and the Subsidiary, which shall be calculated after any investment management fee waivers. The fee paid to the Sub-Adviser is paid by the Manager, not by the Fund.
Transfer Agent Fees. OFI Global (the “Transfer Agent”) serves as the transfer and shareholder servicing agent for the Fund. The Fund pays the Transfer Agent a fee based on annual net assets, which shall be calculated after any applicable fee waivers. Fees incurred and average net assets for each class with respect to these services are detailed in the Consolidated Statement of Operations and Consolidated Financial Highlights, respectively.
Sub-Transfer Agent Fees. The Transfer Agent has retained Shareholder Services, Inc., a wholly-owned subsidiary of OFI (the “Sub-Transfer Agent”), to provide the day-to-day transfer agent and shareholder servicing of the Fund. Under the Sub-Transfer Agency Agreement, the Transfer Agent pays the Sub-Transfer Agent an annual fee in monthly installments, equal to a percentage of the transfer agent fee collected by the Transfer Agent from the Fund, which shall
|
| 44 OPPENHEIMER DEVELOPING MARKETS FUND |
8. Fees and Other Transactions with Affiliates (Continued)
be calculated after any applicable fee waivers. The fee paid to the Sub-Transfer Agent is paid by the Transfer Agent, not by the Fund.
Trustees’ Compensation. The Fund has adopted an unfunded retirement plan (the “Plan”) for the Fund’s Independent Trustees. Benefits are based on years of service and fees paid to each Trustee during their period of service. The Plan was frozen with respect to adding new participants effective December 31, 2006 (the “Freeze Date”) and existing Plan Participants as of the Freeze Date will continue to receive accrued benefits under the Plan. Active Independent Trustees as of the Freeze Date have each elected a distribution method with respect to their benefits under the Plan.
During the reporting period, the Fund’s projected benefit obligations, payments to retired Trustees and accumulated liability were as follows:
| | | | |
Projected Benefit Obligations Increased | | $ | — | |
Payments Made to Retired Trustees | | | 44,372 | |
Accumulated Liability as of February 28, 2018 | | | 382,631 | |
The Fund’s Board of Trustees (“Board”) has adopted a compensation deferral plan for Independent Trustees that enables Trustees to elect to defer receipt of all or a portion of the annual compensation they are entitled to receive from the Fund. For purposes of determining the amount owed to the Trustee under the plan, deferred amounts are treated as though equal dollar amounts had been invested in shares of the Fund or in other Oppenheimer funds selected by the Trustee. The Fund purchases shares of the funds selected for deferral by the Trustee in amounts equal to his or her deemed investment, resulting in a Fund asset equal to the deferred compensation liability. Such assets are included as a component of “Other” within the asset section of the Consolidated Statement of Assets and Liabilities. Deferral of Trustees’ fees under the plan will not affect the net assets of the Fund and will not materially affect the Fund’s assets, liabilities or net investment income per share. Amounts will be deferred until distributed in accordance with the compensation deferral plan.
Distribution and Service Plan (12b-1) Fees. Under its General Distributor’s Agreement with the Fund, OppenheimerFunds Distributor, Inc. (the “Distributor”) acts as the Fund’s principal underwriter in the continuous public offering of the Fund’s classes of shares.
Service Plan for Class A Shares. The Fund has adopted a Service Plan (the “Plan”) for Class A shares pursuant to Rule 12b-1 under the 1940 Act. Under the Plan, the Fund reimburses the Distributor for a portion of its costs incurred for services provided to accounts that hold Class A shares. Reimbursement is made periodically at an annual rate of up to 0.25% of the daily net assets of Class A shares of the Fund. The Distributor currently uses all of those fees to pay dealers, brokers, banks and other financial institutions periodically for providing personal service and maintenance of accounts of their customers that hold Class A shares. Any unreimbursed expenses the Distributor incurs with respect to Class A shares in any
|
| 45 OPPENHEIMER DEVELOPING MARKETS FUND |
NOTES TO
CONSOLIDATED FINANCIAL STATEMENTS Unaudited / Continued
8. Fees and Other Transactions with Affiliates (Continued)
fiscal year cannot be recovered in subsequent periods. Fees incurred by the Fund under the Plan are detailed in the Consolidated Statement of Operations.
Distribution and Service Plans for Class B, Class C and Class R Shares. The Fund has adopted Distribution and Service Plans (the “Plans”) for Class B, Class C and Class R shares pursuant to Rule 12b-1 under the 1940 Act to compensate the Distributor for distributing those share classes, maintaining accounts and providing shareholder services. Under the Plans, the Fund pays the Distributor an annual asset-based sales charge of 0.75% on Class B and Class C shares’ daily net assets and 0.25% on Class R shares’ daily net assets. The Fund also pays a service fee under the Plans at an annual rate of 0.25% of daily net assets. The Plans continue in effect from year to year only if the Fund’s Board of Trustees votes annually to approve their continuance at an in person meeting called for that purpose. Fees incurred by the Fund under the Plans are detailed in the Consolidated Statement of Operations.
Sales Charges. Front-end sales charges and CDSC do not represent expenses of the Fund. They are deducted from the proceeds of sales of Fund shares prior to investment or from redemption proceeds prior to remittance, as applicable. The sales charges retained by the Distributor from the sale of shares and the CDSC retained by the Distributor on the redemption of shares is shown in the following table for the period indicated.
| | | | | | | | | | | | | | | | | | | | |
| Six Months Ended | | Class A
Front-End
Sales Charges
Retained by
Distributor | | | Class A
Contingent
Deferred
Sales Charges
Retained by
Distributor | | | Class B
Contingent
Deferred
Sales Charges
Retained by
Distributor | | | Class C
Contingent
Deferred
Sales Charges
Retained by
Distributor | | | Class R
Contingent
Deferred
Sales Charges
Retained by
Distributor | |
February 28, 2018 | | | $89,035 | | | | $141 | | | | $6,619 | | | | $2,876 | | | | $— | |
Waivers and Reimbursements of Expenses. Effective for the period January 1, 2017 through December 31, 2017, the Transfer Agent voluntarily waived and/or reimbursed Fund expenses in an amount equal to 0.015% of average annual net assets for Classes A, B, C, R and Y.
During the reporting period, the Transfer Agent waived fees and/or reimbursed the Fund for transfer agent and shareholder servicing agent fees as follows:
| | | | |
Class A | | $ | 315,899 | |
Class B | | | 738 | |
Class C | | | 48,547 | |
Class R | | | 34,224 | |
Class Y | | | 897,460 | |
The Manager will waive fees and/or reimburse Fund expenses in an amount equal to the indirect management fees incurred through the Fund’s investment in IGMMF. During the reporting period, the Manager waived fees and/or reimbursed the Fund $651,880 for IGMMF management fees. This fee waiver and/or expense reimbursement may not be amended or
|
| 46 OPPENHEIMER DEVELOPING MARKETS FUND |
8. Fees and Other Transactions with Affiliates (Continued)
withdrawn for one year from the date of the Fund’s prospectus, unless approved by the Board.
9. Borrowings and Other Financing
Joint Credit Facility. A number of mutual funds managed by the Manager participate in a $1.875 billion revolving credit facility (the “Facility”) intended to provide short-term financing, if necessary, subject to certain restrictions in connection with atypical redemption activity. Expenses and fees related to the Facility are paid by the participating funds and are disclosed separately or as other expenses on the Consolidated Statement of Operations. The Fund did not utilize the Facility during the reporting period.
|
| 47 OPPENHEIMER DEVELOPING MARKETS FUND |
BOARD APPROVAL OF THE FUND’S INVESTMENT ADVISORY AND SUB-ADVISORY AGREEMENTS Unaudited
The Fund has entered into an investment advisory agreement with OFI Global Asset Management, Inc. (“OFI Global” or the “Adviser”), a wholly-owned subsidiary of OppenheimerFunds, Inc. (“OFI” or the “Sub-Adviser”) (“OFI Global” and “OFI” together the “Managers”) and OFI Global has entered into a sub-advisory agreement with OFI whereby OFI provides investment sub-advisory services to the Fund (collectively, the “Agreements”). Each year, the Board of Trustees (the “Board”), including a majority of the independent Trustees, is required to determine whether to approve the terms of the Agreements and the renewal thereof. The Investment Company Act of 1940, as amended, requires that the Board request and evaluate, and that the Managers provide, such information as may be reasonably necessary to evaluate the terms of the Agreements. The Board employs an independent consultant to prepare a report that provides information, including comparative information that the Board requests for that purpose. In addition to in-person meetings focused on this evaluation, the Board receives information throughout the year regarding Fund services, fees, expenses and performance.
The Managers and the independent consultant provided information to the Board on the following factors: (i) the nature, quality and extent of the Managers’ services, (ii) the comparative investment performance of the Fund and the Managers, (iii) the fees and expenses of the Fund, including comparative fee and expense information, (iv) the profitability of the Managers and their affiliates, including an analysis of the cost of providing services, (v) whether economies of scale are realized as the Fund grows and whether fee levels reflect these economies of scale for Fund investors and (vi) other benefits to the Managers from their relationship with the Fund. The Board was aware that there are alternatives to retaining the Managers.
Outlined below is a summary of the principal information considered by the Board as well as the Board’s conclusions.
Nature, Quality and Extent of Services. The Board considered information about the nature, quality and extent of the services provided to the Fund and information regarding the Managers’ key personnel who provide such services. The Managers’ duties include providing the Fund with the services of the portfolio manager and the Sub-Adviser’s investment team, who provide research, analysis and other advisory services in regard to the Fund’s investments; and securities trading services. OFI Global is responsible for oversight of third-party service providers; monitoring compliance with applicable Fund policies and procedures and adherence to the Fund’s investment restrictions; risk management; and oversight of the Sub-Adviser. OFI Global is also responsible for providing certain administrative services to the Fund. Those services include providing and supervising all administrative and clerical personnel who are necessary in order to provide effective corporate administration for the Fund; compiling and maintaining records with respect to the Fund’s operations; preparing and filing reports required by the U.S. Securities and Exchange Commission; preparing periodic reports regarding the operations of the Fund for its shareholders; preparing proxy materials for shareholder meetings; and preparing the registration statements required by federal and state securities laws for the sale of the Fund’s shares. OFI Global also provides the Fund with office space, facilities and equipment.
|
| 48 OPPENHEIMER DEVELOPING MARKETS FUND |
The Board also considered the quality of the services provided and the quality of the Managers’ resources that are available to the Fund. The Board took account of the fact that the Sub-Adviser has over fifty years of experience as an investment adviser and that its assets under management rank it among the top mutual fund managers in the United States. The Board evaluated the Managers’ advisory, administrative, accounting, legal, compliance and risk management services, among other services, and information the Board has received regarding the experience and professional qualifications of the Managers’ key personnel and the size and functions of its staff. In its evaluation of the quality of the portfolio management services provided, the Board considered the experience of Justin Leverenz, the portfolio manager for the Fund, and the Sub-Adviser’s investment team and analysts. The Board members also considered the totality of their experiences with the Managers as directors or trustees of the Fund and other funds advised by the Managers. The Board considered information regarding the quality of services provided by affiliates of the Managers, which the Board members have become knowledgeable about through their experiences with the Managers and in connection with the review or renewal of the Fund’s service agreements or service providers. The Board concluded, in light of the Managers’ experience, reputation, personnel, operations and resources that the Fund benefits from the services provided under the Agreements.
Investment Performance of the Managers and the Fund. Throughout the year, the Managers provided information on the investment performance of the Fund, the Adviser and the Sub-Adviser, including comparative performance information. The Board also reviewed information, prepared by the Managers and by the independent consultant, comparing the Fund’s historical performance to relevant benchmarks or market indices and to the performance of other retail funds in the diversified emerging markets category. The Board noted that the Fund’s one-year and three-year performance was below its category median although its five-year and ten-year performance was better than its category median.
Fees and Expenses of the Fund. The Board reviewed the fees paid to the Adviser and the other expenses borne by the Fund. The Board also considered the comparability of the fees charged and the services provided to the Fund to the fees and services for other clients or accounts advised by the Adviser. The independent consultant provided comparative data in regard to the fees and expenses of the Fund and other retail front-end load diversified emerging markets funds with comparable asset levels and distribution features. The Board noted that the Fund’s contractual management fee and total expenses were lower than its peer group median and category median.
Economies of Scale and Profits Realized by the Managers. The Board considered information regarding the Managers’ costs in serving as the Fund’s investment adviser and sub-adviser, including the costs associated with the personnel and systems necessary to manage the Fund, and information regarding the Managers’ profitability from their relationship with the Fund. The Board also considered that the Managers must be able to pay and retain experienced professional personnel at competitive rates to provide quality services to the Fund. The Board reviewed whether the Managers may realize economies of scale in managing and supporting the Fund. The Board noted that the Fund currently
|
| 49 OPPENHEIMER DEVELOPING MARKETS FUND |
BOARD APPROVAL OF THE FUND’S INVESTMENT ADVISORY AND SUB-ADVISORY AGREEMENTS Unaudited / Continued
has management fee breakpoints, which are intended to share with Fund shareholders economies of scale that may exist as the Fund’s assets grow.
Other Benefits to the Managers. In addition to considering the profits realized by the Managers, the Board considered information that was provided regarding the direct and indirect benefits the Managers receive as a result of their relationship with the Fund, including compensation paid to the Managers’ affiliates and research provided to the Adviser in connection with permissible brokerage arrangements (soft dollar arrangements).
Conclusions. These factors were also considered by the independent Trustees meeting separately from the full Board, assisted by experienced counsel to the Fund and to the independent Trustees. Fund counsel and the independent Trustees’ counsel are independent of the Managers within the meaning and intent of the Securities and Exchange Commission Rules.
Based on its review of the information it received and its evaluations described above, the Board, including a majority of the independent Trustees, decided to continue the Agreements through September 30, 2018. In arriving at its decision, the Board did not identify any factor or factors as being more important than others, but considered all of the above information, and considered the terms and conditions of the Agreements, including the management fees, in light of all the surrounding circumstances.
|
| 50 OPPENHEIMER DEVELOPING MARKETS FUND |
PORTFOLIO PROXY VOTING POLICIES AND GUIDELINES; UPDATES TO STATEMENT OF INVESTMENTS Unaudited
The Fund has adopted Portfolio Proxy Voting Policies and Guidelines under which the Fund votes proxies relating to securities (“portfolio proxies”) held by the Fund. A description of the Fund’s Portfolio Proxy Voting Policies and Guidelines is available (i) without charge, upon request, by calling the Fund toll-free at 1.800.CALL OPP (225.5677), (ii) on the Fund’s website at www.oppenheimerfunds.com, and (iii) on the SEC’s website at www.sec.gov. In addition, the Fund is required to file Form N-PX, with its complete proxy voting record for the 12 months ended June 30th, no later than August 31st of each year. The Fund’s voting record is available (i) without charge, upon request, by calling the Fund toll-free at 1.800.CALL OPP (225.5677), and (ii) in the Form N-PX filing on the SEC’s website at www.sec.gov.
The Fund files its complete schedule of portfolio holdings with the SEC for the first quarter and the third quarter of each fiscal year on Form N-Q. The Fund’s Form N-Q filings are available on the SEC’s website at www.sec.gov. Those forms may be reviewed and copied at the SEC’s Public Reference Room in Washington, D.C. Information on the operation of the Public Reference Room may be obtained by calling 1-800-SEC-0330.
Householding—Delivery of Shareholder Documents
This is to inform you about OppenheimerFunds’ “householding” policy. If more than one member of your household maintains an account in a particular fund, OppenheimerFunds will mail only one copy of the fund’s prospectus (or, if available, the fund’s summary prospectus), annual and semiannual report and privacy policy. The consolidation of these mailings, called householding, benefits your fund through reduced mailing expense, and benefits you by reducing the volume of mail you receive from OppenheimerFunds. Householding does not affect the delivery of your account statements.
Please note that we will continue to household these mailings for as long as you remain an OppenheimerFunds shareholder, unless you request otherwise. If you prefer to receive multiple copies of these materials, please call us at 1.800.CALL-OPP (225-5677). You may also notify us in writing or via email. We will begin sending you individual copies of the prospectus (or, if available, the summary prospectus), reports and privacy policy within 30 days of receiving your request to stop householding.
|
| 51 OPPENHEIMER DEVELOPING MARKETS FUND |
DISTRIBUTION SOURCES Unaudited
For any distribution that took place over the last six months of the Fund’s reporting period, the table below details on a per-share basis the percentage of the Fund’s total distribution payment amount that was derived from the following sources: net income, net profit from the sale of securities, and other capital sources. Other capital sources represent a return of capital. A return of capital may occur, for example, when some or all of the money that you invested in the Fund is paid back to you. A return of capital distribution does not necessarily reflect the Fund’s investment performance and should not be confused with “yield” or “income.” You should not draw any conclusions about each Fund’s investment performance from the amounts of these distributions. This information is based upon income and capital gains using generally accepted accounting principles as of the date of each distribution. Because the Fund is actively managed, the relative amount of the Fund’s total distributions derived from various sources over the calendar year may change. Please note that this information should not be used for tax reporting purposes as the tax character of distributable income may differ from the amounts used for this notification. You will receive IRS tax forms in the first quarter of each calendar year detailing the actual amount of the taxable and non-taxable portion of distributions paid to you during the tax year.
For the most current information, please go to oppenheimerfunds.com. Select your Fund, and scroll down to the `Dividends’ table under `Analytics’. The Fund’s latest distribution information will be followed by the sources of any distribution, updated daily.
| | | | | | | | | | | | | | | | |
| Fund Name | | Pay
Date | | | Net Income | | | Net Profit
from Sale | | | Other
Capital
Sources | |
| Oppenheimer Developing Markets Fund | | | 12/4/17 | | | | 87.2% | | | | 0.0% | | | | 12.8% | |
|
| 52 OPPENHEIMER DEVELOPING MARKETS FUND |
OPPENHEIMER DEVELOPING MARKETS FUND
| | |
| Trustees and Officers | | Brian F. Wruble, Chairman of the Board of Trustees and Trustee |
| | Beth Ann Brown, Trustee |
| | Edmund P. Giambastiani, Jr., Trustee |
| | Elizabeth Krentzman, Trustee |
| | Mary F. Miller, Trustee |
| | Joel W. Motley, Trustee |
| | Joanne Pace, Trustee |
| | Daniel Vandivort, Trustee |
| | Justin Leverenz, Vice President |
| | Arthur P. Steinmetz, Trustee, President and Principal Executive Officer |
| | Cynthia Lo Bessette, Secretary and Chief Legal Officer |
| | Jennifer Foxson, Vice President and Chief Business Officer |
| | Mary Ann Picciotto, Chief Compliance Officer and Chief Anti-Money |
| | Laundering Officer |
| | Brian S. Petersen, Treasurer and Principal Financial & Accounting Officer |
| |
| Manager | | OFI Global Asset Management, Inc. |
| |
| Sub-Adviser | | OppenheimerFunds, Inc. |
| |
| Distributor | | OppenheimerFunds Distributor, Inc. |
| |
| Transfer and Shareholder Servicing Agent | | OFI Global Asset Management, Inc. |
| |
| Sub-Transfer Agent | | Shareholder Services, Inc. |
| | DBA OppenheimerFunds Services |
| |
| Independent Registered | | KPMG LLP |
| Public Accounting Firm | | |
| |
| Legal Counsel | | Kramer Levin Naftalis & Frankel LLP |
| |
| | The financial statements included herein have been taken from the records of the Fund without examination of those records by the independent registered public accounting firm. |
© 2018 OppenheimerFunds, Inc. All rights reserved.
|
| 53 OPPENHEIMER DEVELOPING MARKETS FUND |
PRIVACY NOTICE
As an Oppenheimer fund shareholder, you are entitled to know how we protect your personal information and how we limit its disclosure.
Information Sources
We obtain non-public personal information about our shareholders from the following sources:
| ● | | Applications or other forms. |
| ● | | When you create a user ID and password for online account access. |
| ● | | When you enroll in eDocs Direct,SM our electronic document delivery service. |
| ● | | Your transactions with us, our affiliates or others. |
| ● | | Technologies on our website, including: “cookies” and web beacons, which are used to collect data on the pages you visit and the features you use. |
If you visit oppenheimerfunds.com and do not log on to the secure account information areas, we do not obtain any personal information about you. When you do log on to a secure area, we do obtain your user ID and password to identify you. We also use this information to provide you with products and services you have requested, to inform you about products and services that you may be interested in and assist you in other ways.
We do not collect personal information through our website unless you willingly provide it to us, either directly by email or in those areas of the website that request information. In order to update your personal information (including your mailing address, email address and phone number) you must first log on and visit your user profile.
If you have set your browser to warn you before accepting cookies, you will receive the warning message with each cookie. You can refuse cookies by turning them off in your browser. However, doing so may limit your access to certain sections of our website.
We use cookies to help us improve and manage our website. For example, cookies help us recognize new versus repeat visitors to the site, track the pages visited, and enable some special features on the website. This data helps us provide better service for our website visitors.
Protection of Information
We do not disclose any non-public personal information (such as names on a customer list) about current or former customers to anyone, except as permitted by law.
Disclosure of Information
Copies of confirmations, account statements and other documents reporting activity in your fund accounts are made available to your financial advisor (as designated by you). We may also use details about you and your investments to help us, our financial service affiliates, or firms that jointly market their financial products and services with ours, to better serve your investment needs or suggest educational material that may be of interest to you. If this requires us to provide you with an opportunity to “opt in” or “opt out” of such information sharing with a firm not affiliated with us, you will receive notification on how to do so, before any such sharing takes place.
Right of Refusal
We will not disclose your personal information to unaffiliated third parties (except as permitted by law), unless we first offer you a reasonable opportunity to refuse or “opt out” of such disclosure.
|
| 54 OPPENHEIMER DEVELOPING MARKETS FUND |
Internet Security and Encryption
In general, the email services provided by our website are encrypted and provide a secure and private means of communication with us. To protect your own privacy, confidential and/ or personal information should only be communicated via email when you are advised that you are using a secure website.
As a security measure, we do not include personal or account information in non-secure emails, and we advise you not to send such information to us in non-secure emails. Instead, you may take advantage of the secure features of our website to encrypt your email correspondence. To do this, you will need to use a browser that supports Secure Sockets Layer (SSL) protocol.
| ● | | All transactions conducted via our websites, including redemptions, exchanges and purchases, are secured by the highest encryption standards available. SSL is used to establish a secure connection between your PC and OppenheimerFunds’ server. It transmits information in an encrypted and scrambled format. |
| ● | | Encryption is achieved through an electronic scrambling technology that uses a “key” to code and then decode the data. Encryption acts like the cable converter box you may have on your television set. It scrambles data with a secret code so that no one can make sense of it while it is being transmitted. When the data reaches its destination, the same software unscrambles the data. |
| ● | | You can exit the secure area by closing your browser or, for added security, you can use the Log Out button before you close your browser. |
Other Security Measures
We maintain physical, electronic and procedural safeguards to protect your personal account information. Our employees and agents have access to that information only so that they may offer you products or provide services, for example, when responding to your account questions.
How You Can Help
You can also do your part to keep your account information private and to prevent unauthorized transactions. If you obtain a user ID and password for your account, safeguard that information. Strengthening your online credentials–your online security profile–typically your user name, password, and security questions and answers, can be one of your most important lines of defense on the Internet. For additional information on how you can help prevent identity theft, visit https://www. oppenheimerfunds.com/security.
Who We Are
This joint notice describes the privacy policies of the Oppenheimer funds, OppenheimerFunds, Inc., each of its investment adviser subsidiaries, OppenheimerFunds Distributor, Inc. and OFI Global Trust Co. It applies to all Oppenheimer fund accounts you presently have, or may open in the future, using your Social Security number—whether or not you remain a shareholder of our funds. This notice was last updated as of November 2017. In the event it is updated or changed, we will post an updated notice on our website at oppenheimerfunds.com. If you have any questions about this privacy policy, email us by clicking on the Contact Us section of our website at oppenheimerfunds.com, write to us at P.O. Box 5270, Denver, CO 80217-5270, or call us at 800 CALL OPP (225 5677).
|
| 55 OPPENHEIMER DEVELOPING MARKETS FUND |

OppenheimerFunds®
The Right Way
to Invest
Visit us at oppenheimerfunds.com for 24-hr access to
account information and transactions or call us at 800.CALL
OPP (800.225.5677) for 24-hr automated information and
automated transactions. Representatives also available
Mon–Fri 8am-8pm ET.
| | |
Visit Us oppenheimerfunds.com Call Us 800 225 5677 | | |
Follow Us 
| | Oppenheimer funds are distributed by OppenheimerFunds Distributor, Inc. 225 Liberty Street, New York, NY 10281-1008 © 2018 OppenheimerFunds Distributor, Inc. All rights reserved. RS0785.001.0218 April 24, 2018 |
Item 2. Code of Ethics.
Not applicable to semiannual reports.
Item 3. Audit Committee Financial Expert.
Not applicable to semiannual reports.
Item 4. Principal Accountant Fees and Services.
Not applicable to semiannual reports.
Item 5. Audit Committee of Listed Registrants
Not applicable.
Item 6. Schedule of Investments.
a) Not applicable. The complete schedule of investments is included in Item 1 of this Form N-CSR.
b) Not applicable.
Item 7. Disclosure of Proxy Voting Policies and Procedures for Closed-End Management Investment Companies.
Not applicable.
Item 8. Portfolio Managers of Closed-End Management Investment Companies.
Not applicable.
Item 9. Purchases of Equity Securities by Closed-End Management Investment Company and Affiliated Purchasers.
Not applicable.
Item 10. Submission of Matters to a Vote of Security Holders.
The Fund’s Governance Committee Provisions with Respect to Nominations of Directors/Trustees to the Respective Boards
None
Item 11. Controls and Procedures.
Based on their evaluation of the registrant’s disclosure controls and procedures (as defined in rule 30a-3(c) under the Investment Company Act of 1940 (17 CFR 270.30a-3(c)) as of 2/28/2018, the registrant’s principal executive officer and principal financial officer found the registrant’s disclosure controls and procedures to provide reasonable assurances that information required to be disclosed by the registrant in the reports that it files under the Securities Exchange Act of 1934 (a) is accumulated and communicated to registrant’s management, including its principal executive officer and principal financial officer, to allow timely decisions regarding required disclosure, and (b) is recorded, processed, summarized and reported, within the time
periods specified in the rules and forms adopted by the U.S. Securities and Exchange Commission.
There have been no changes in the registrant’s internal controls over financial reporting that occurred during the registrant’s second fiscal quarter of the period covered by this report that have materially affected, or are reasonably likely to materially affect, the registrant’s internal control over financial reporting.
Item 12. Disclosure of Securities Lending Activities for Closed-End Management Investment Companies.
Not applicable.
Item 13. Exhibits.
| (a) | (1) Exhibit attached hereto. |
(2) Exhibits attached hereto.
SIGNATURES
Pursuant to the requirements of the Securities Exchange Act of 1934 and the Investment Company Act of 1940, the registrant has duly caused this report to be signed on its behalf by the undersigned, thereunto duly authorized.
Oppenheimer Developing Markets Fund
| | |
| By: | | /s/ Arthur P. Steinmetz |
| | Arthur P. Steinmetz |
| | Principal Executive Officer |
| Date: | | 4/20/2018 |
Pursuant to the requirements of the Securities Exchange Act of 1934 and the Investment Company Act of 1940, this report has been signed below by the following persons on behalf of the registrant and in the capacities and on the dates indicated.
| | |
| By: | | /s/ Arthur P. Steinmetz |
| | Arthur P. Steinmetz |
| | Principal Executive Officer |
| Date: | | 4/20/2018 |
| | |
| By: | | /s/ Brian S. Petersen |
| | Brian S. Petersen |
| | Principal Financial Officer |
| Date: | | 4/20/2018 |