Table of Contents
UNITED STATES
SECURITIES AND EXCHANGE COMMISSION
FORM N-CSR
CERTIFIED SHAREHOLDER REPORT OF REGISTERED MANAGEMENT
INVESTMENT COMPANIES
| Investment Company Act file number | 811-07655 | |||
Driehaus Mutual Funds
25 East Erie Street
Chicago, IL 60611
(Address of principal executive offices) (Zip code)
Mary H. Weiss
25 East Erie Street
Chicago, IL 60611
(Name and address of agent for service)
| registrant’s telephone number, including area code: | 312-587-3800 | |||
Date of fiscal year end: December 31, 2003
Date of reporting period: December 31, 2003
Form N-CSR is to be used by management investment companies to file reports with the Commission not later than 10 days after the transmission to stockholders of any report that is required to be transmitted to stockholders under Rule 30e-1 under the Investment Company Act of 1940 (17 CFR 270.30e-1). The Commission may use the information provided on Form N-CSR in its regulatory, disclosure review, inspection, and policymaking roles.
A registrant is required to disclose the information specified by Form N-CSR, and the Commission will make this information public. A registrant is not required to respond to the collection of information contained in Form N-CSR unless the Form displays a currently valid Office of Management and Budget (“OMB”) control number. Please direct comments concerning the accuracy of the information collection burden estimate and any suggestions for reducing the burden to Secretary, Securities and Exchange Commission, 450 Fifth Street, NW, Washington, DC 20549-0609. The OMB has reviewed this collection of information under the clearance requirements of 44 U.S.C. § 3507.
Table of Contents
Item 1. Reports to Stockholders.
| Driehaus Mutual Funds Trustees & Officers Richard H. Driehaus Chairman of the Board & President Francis J. Harmon Trustee Robert F. Moyer Senior Vice President & Trustee A.R. Umans Trustee Daniel F. Zemanek Trustee Michelle L. Cahoon Treasurer Lisa M. King Secretary Valerie Baxendale Assistant Secretary Investment Adviser Driehaus Capital Management, Inc. 25 East Erie Street Chicago, IL 60611 Distributor Driehaus Securities Corporation 25 East Erie Street Chicago, IL 60611 Administrator & Transfer Agent PFPC Inc. 103 Bellevue Parkway Wilmington, DE 19809 Custodian JPMorgan Chase Bank 3 Chase MetroTech Center Brooklyn, NY 11245 | Annual Report to Shareholders December 31, 2003  Driehaus International Discovery Fund Driehaus Emerging Markets Growth Fund Distributed by: Driehaus Securities Corporation This report has been prepared for the shareholders of the Funds and is not an offering to sell or buy any Fund securities. Such offering is only made by the Funds’ prospectus. |
Table of Contents
| Driehaus International Discovery Fund | |||||
| Portfolio Managers’ Letter | 1 | ||||
| Performance Overview | 3 | ||||
| Schedule of Investments | 4 | ||||
| Driehaus Emerging Markets Growth Fund | |||||
| Portfolio Manager’s Letter | 12 | ||||
| Performance Overview | 14 | ||||
| Schedule of Investments | 15 | ||||
| Each Fund section includes: | |||||
| Schedule of Investments by Industry | |||||
| Statement of Assets and Liabilities | |||||
| Statement of Operations | |||||
| Statement of Changes in Net Assets | |||||
| Financial Highlights | |||||
| Notes to Financial Statements | 23 | ||||
| Report of Independent Auditors | 29 | ||||
| Interested and Independent Trustees of the Trust | 30 | ||||
| Officers of the Trust | 32 | ||||
| Shareholder Meeting Results | 33 | ||||
Proxy Voting Policies and Procedures
A description of the Funds’ policies and procedures with respect to the voting of proxies relating to the Funds’ portfolio securities is available without charge, upon request, by calling 1-800-560-6111. This information is also available on the Securities and Exchange Commission’s website at http://www.sec.gov.
Table of Contents
| Investment Philosophy: | ||
| The Adviser seeks to achieve superior investment returns primarily by investing in companies outside the U.S. that are currently demonstrating rapid growth in their sales and earnings and which, in our judgement, have the ability to continue or accelerate their growth rates in the future. The Adviser manages the portfolios actively (above average turnover) to insure that the Funds are fully invested, under appropriate market conditions, in companies that meet these criteria. Investors should note that investments in overseas markets can pose more risks than U.S. investments, and the Funds’ share prices are expected to be more volatile than those of U.S.-only funds. In addition, the Funds’ returns will fluctuate with changes in stock market conditions, currency values, interest rates, foreign government regulations, and economic and political conditions in countries in which the Funds invest. These risks are generally greater when investing in emerging markets. |
| Driehaus International Discovery Fund |
| Driehaus Emerging Markets Growth Fund |
Table of Contents
Dear Fellow Shareholders:
The past year was one of the best ever for the Driehaus International Discovery Fund, in terms of both absolute return and relative performance.
The Driehaus International Discovery Fund was the top-ranked fund out of 834 funds in the Lipper International Funds peer universe for the year ended December 31, 2003. For the two-year and three-year periods ended December 31, 2003, the fund ranked 15th out of 757 funds and 18th out of 650 funds, respectively. For the five-year period ended December 31, 2003, the fund was also the top-ranked fund (out of 483 funds). The fund was reclassified by Lipper Inc. from the Lipper International Small Cap Funds category to the Lipper International Funds category in December 2003, as the average market capitalization of the fund’s portfolio grew to exceed $1 billion (U.S.).
For the year ended December 31, 2003, the fund returned 62.40%. This compares with a return of 31.99% for the Morgan Stanley Capital International (MSCI) Europe, Australasia, Far East (EAFE®) Growth Index, and 41.41% for the MSCI All Country (AC) World Free Ex-U.S. Index for the same period.
Since the fund’s inception on December 31, 1998 through December 31, 2003, the Driehaus International Discovery Fund posted an annualized return of 27.51%. This compares with annualized returns of - -3.96% for the MSCI EAFE® Growth Index, and 1.55% for the MSCI AC World Free Ex-U.S. Index for the same period.1
The fund’s investors experienced a negative return for the first quarter, as international markets were hurt by economic concerns and much of the world awaited the looming U.S. intervention in Iraq. However, once the war began and tensions eased, the rest of the year provided long-awaited upside for international investors. As the second quarter began, the toppling of the Hussein regime in Iraq, continued positive economic news in the U.S. and abroad, and further declines in U.S. interest rates provided the fuel needed to spark and maintain a widespread international market rally, which continued through the end of the year and has yet to lose steam in 2004. With respect to currency fluctuation, the year was dominated by the strength of the euro versus the dollar.
Within this context we utilized several strategies. Within Europe, the strong euro tended to negatively impact European exporters, and led us to concentrate more on European companies that were locally-focused. We also looked for ideas to capitalize on the emerging market consumer theme, which is a secular trend that has continued for the past several years.
The fund’s emerging markets exposure contributed to the fund’s performance as did the fund’s exposure to the more mature economies. In particular, our weighting in the Asian emerging markets enhanced this past year’s results, and the overweighted position in South Korean stocks was one of the better country allocation decisions.
Within the more mature economies, both the Western European and North American regions were positive contributors to overall return. In Western Europe, the overweighting in Germany more than offset the slightly negative impact from an underweighted position in a strong U.K. market. In North America, overweighting Canadian stocks proved to be a sound strategy as Canada enjoyed a re-emergent bull market.
The technology industry provided the best returns for the fund by a significant margin over other industry sectors. Several technology groups, including diversified telecommunications, wireless, communication equipment, and the Internet were positive contributors to the fund’s return.
There were three technology company investments that materially added to the fund’s return. One of these companies, Netherlands-based Versatel Telecom International N.V., is a telecommunications network operator with activities in the Netherlands, northwest Germany and Belgium. Product offerings include Internet protocol virtual private networking (IP VPN), digital subscriber lines (DSL), as well as Internet, carrier preselect and wholesale services. Another holding, German Internet company freenet.de AG, offers Internet service provider (ISP) portal and voice telephony. It is the #2 ISP in Germany, with 3.8 million active customers. The company’s broadband service, launched in the second quarter of 2003, experienced better than expected subscriber growth. Rakuten Inc., based in Japan, is an Internet company that operates a business-to-consumer e-commerce and auction website. Increased broadband penetration in Japan has prompted more people to shop on-line.
1
Table of Contents
Overweighted allocations in both the consumer cyclical and media sectors were positive contributors to the fund’s return. In particular, the hotel, restaurant and leisure industry was one of the fund’s better performing groups. One company in the media sector, Canada-based Cinram International, was one of the strongest individual stocks in the fund. Cinram manufactures prerecorded multimedia products including video cassettes, audio cassettes, CD-ROMs and DVDs. Expanding home-based DVD libraries, as well as increasing penetration of DVD hardware, has driven demand for Cinram’s products. In addition, overweighting in the transportation group also was additive to the fund’s return. These industry allocations, along with the technology exposure mentioned above, more than offset the negative impact from underweighting the relatively strong financial and basic materials sectors.
Several significant events related to the fund’s management and structure occurred during 2003. In February, Ivo St. Kovachev joined us as a portfolio manager on the fund. Mr. St. Kovachev serves as the fund’s expert on European companies and markets, and he had been the portfolio manager of the Driehaus European Opportunity Fund. Prior to assuming portfolio management responsibilities, he had served the fund as a European sector analyst. Our portfolio management team now has over 50 years of combined investment experience, with each member focused on their individual geographic areas of expertise.
In May of 2003, the Board of Trustees of Driehaus Mutual Funds approved a plan of reorganization whereby the assets of the Driehaus International Growth Fund and the Driehaus European Opportunity Fund would be combined with those of the Driehaus International Discovery Fund. Following this combination in December 2003, the fund’s category was changed from the Lipper International Small Cap Funds peer universe to the Lipper International Funds peer universe.
We appreciate the commitment of our shareholders. Although several of the years prior to 2003 had been challenging for U.S. and international investors alike, the past year’s fund performance, as well as the enviable long-term record of the Driehaus International Discovery Fund, should reiterate the importance of adherence to an investment philosophy over the long term.
Sincerely,
 Emery R. Brewer Senior Portfolio Manager February 17, 2004 |  Eric J. Ritter, CFA Portfolio Manager February 17, 2004 |  Ivo St. Kovachev Portfolio Manager February 17, 2004 |
| 1 | During these periods, the Fund’s returns reflect fee waivers and/or reimbursements without which performance would have been lower. |
Performance is historical and does not represent future results.
2
Table of Contents
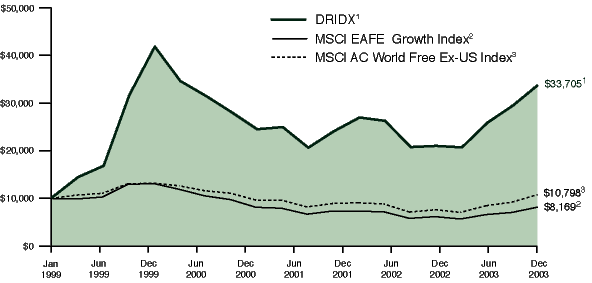
The performance summarized below is historical and does not represent future results. Investment returns and principal value vary, and you may have a gain or loss when you sell shares. Performance data presented measures the change in the value of an investment in the Fund, assuming reinvestment of all dividends and capital gains. Average annual total return reflects annualized change.
The table does not reflect the deduction of taxes that a shareholder would pay on Fund distributions or the redemption of Fund shares. The graph compares the results of a $10,000 investment in the Fund since December 31, 1998 (the date of the Fund’s inception), with all dividends and capital gains reinvested, with the indicated indexes (and dividends reinvested) for the same period.
| Since Inception | ||||||||||||||||||
| Average Annual Total Returns as of 12/31/03 | 1 Year | 3 Years | 5 Years | (12/31/98 - 12/31/03) | ||||||||||||||
Driehaus International Discovery Fund (DRIDX)1 | 62.40% | 6.60% | 27.51% | 27.51% | ||||||||||||||
MSCI EAFE® Growth Index2 | 31.99% | -5.80% | -3.96% | -3.96% | ||||||||||||||
MSCI AC World Free Ex-US Index3 | 41.41% | -0.96% | 1.55% | 1.55% | ||||||||||||||
| 1 | The returns for these periods reflect fee waivers and/or reimbursements without which performance would have been lower. |
| 2 | The Morgan Stanley Capital International Europe, Australasia and Far East Growth Index (MSCI EAFE® Growth Index) is a widely recognized benchmark of non-U.S. growth stock markets. It is an unmanaged index composed of a sample of companies with higher price-to-book ratios, representative of the market structure of 21 European and Pacific Basin countries. Data is in U.S. dollars. Source: Morgan Stanley Capital International Inc. |
| 3 | The Morgan Stanley Capital International All Country World Free Ex-US Index (MSCI AC World Free Ex-US Index) is a recognized benchmark of non-US stock markets. It is an unmanaged index composed of a sample of companies representative of the market structure of 48 countries. The MSCI AC World Free Ex-US Index, when including or excluding securities, takes into account any limitations that an international investor would experience when investing directly in such securities. Data is in U.S. dollars. Source: Morgan Stanley Capital International Inc. |
3
Table of Contents
| Number | Market | |||||||||
| of | Value | |||||||||
| Shares | (Note A) | |||||||||
| EQUITY SECURITIES — 94.0% | ||||||||||
EUROPE — 48.1% | ||||||||||
United Kingdom — 10.5% | ||||||||||
| Acambis PLC** | 118,072 | $ | 645,199 | |||||||
| Aggreko PLC | 416,139 | 1,150,954 | ||||||||
| Burberry Group PLC | 339,350 | 2,220,375 | ||||||||
| Carphone Warehouse PLC | 1,666,953 | 4,401,559 | ||||||||
| EasyJet PLC** | 1,087,542 | 5,704,332 | ||||||||
| Galen Holdings PLC | 115,930 | 1,476,597 | ||||||||
| Premier Oil PLC** | 479,022 | 3,901,737 | ||||||||
| Shire Pharmaceuticals Group PLC** | 162,652 | 1,579,611 | ||||||||
| William Hill PLC | 834,467 | 6,378,641 | ||||||||
| 27,459,005 | ||||||||||
Sweden — 6.6% | ||||||||||
| Autoliv, Inc. — ADR | 54,495 | 2,051,737 | ||||||||
| Capio AB** | 280,660 | 2,262,349 | ||||||||
| Micronic Laser Systems AB** | 211,035 | 2,449,018 | ||||||||
| Q-Med AB** | 159,000 | 3,767,668 | ||||||||
| Song Networks Holding AB** | 311,434 | 2,921,601 | ||||||||
| Tele2 AB — B** | 71,050 | 3,791,809 | ||||||||
| 17,244,182 | ||||||||||
Germany — 5.9% | ||||||||||
| AWD Holding AG | 49,579 | 1,738,517 | ||||||||
| Comdirect Bank AG** | 59,187 | 547,226 | ||||||||
| Freenet.de AG** | 54,464 | 3,882,827 | ||||||||
| ProSiebenSat.1 Media AG (Pref.) | 255,580 | 4,271,487 | ||||||||
| Puma AG | 20,189 | 3,565,161 | ||||||||
| Stada Arzneimittel AG | 20,646 | 1,280,740 | ||||||||
| 15,285,958 | ||||||||||
Switzerland — 4.7% | ||||||||||
| Actelion, Ltd.** | 37,655 | 4,064,639 | ||||||||
| Micronas Semiconductor Holding AG** | 77,975 | 3,338,408 | ||||||||
| SEZ Holding AG** | 14,385 | 494,330 | ||||||||
| Straumann AG | 27,659 | 4,249,210 | ||||||||
| 12,146,587 | ||||||||||
Greece — 3.7% | ||||||||||
| Alpha Bank AE | 186,770 | 5,649,274 | ||||||||
| Germanos SA | 159,577 | 3,993,451 | ||||||||
| 9,642,725 | ||||||||||
Netherlands — 3.5% | ||||||||||
| ASM International NV — ADR** | 127,817 | 2,587,016 | ||||||||
| Core Laboratories NV — ADR** | 79,266 | 1,322,950 | ||||||||
| Koninklijke Vopak NV | 220,392 | 4,142,080 | ||||||||
| Versatel Telecom International NV** | 466,925 | 1,018,895 | ||||||||
| 9,070,941 | ||||||||||
Luxembourg — 2.2% | ||||||||||
| Gemplus International SA** | 2,621,310 | 5,620,872 | ||||||||
Norway — 1.9% | ||||||||||
| DNB NOR ASA | 750,630 | 5,009,616 | ||||||||
Italy — 1.8% | ||||||||||
| E.Biscom** | 67,495 | 4,136,708 | ||||||||
| Snia SpA | 205,222 | 509,949 | ||||||||
| 4,646,657 | ||||||||||
Spain — 1.7% | ||||||||||
| Antena 3 Television SA** | 100,059 | 4,409,765 | ||||||||
Austria — 1.4% | ||||||||||
| Erste Bank der Oesterreichischen Sparkassen AG | 12,583 | 1,554,940 | ||||||||
| Wienerberger AG | 78,894 | 2,107,688 | ||||||||
| 3,662,628 | ||||||||||
Portugal — 1.2% | ||||||||||
| Jeronimo Martins SA** | 235,064 | 3,101,374 | ||||||||
Turkey — 1.1% | ||||||||||
| Ford Otomotiv Sanayi AS** | 445,364,000 | 2,979,660 | ||||||||
Belgium — 1.1% | ||||||||||
| Mobistar SA** | 49,710 | 2,790,231 | ||||||||
Finland — 0.5% | ||||||||||
| Elcoteq Network Corp. — A | 61,830 | 1,246,271 | ||||||||
France — 0.3% | ||||||||||
| Rodriguez Group | 16,232 | 907,010 | ||||||||
| Total Europe | 125,223,482 | |||||||||
| FAR EAST — 25.1% | ||||||||||
Japan — 5.2% | ||||||||||
| Fast Retailing Co., Ltd. | 50,600 | 3,073,677 | ||||||||
| Fuji Seal, Inc. | 92,300 | 3,634,469 | ||||||||
| Goodwill Group, Inc. | 874 | 1,932,798 | ||||||||
| USS Co., Ltd. | 24,885 | 1,760,085 | ||||||||
| Yokogawa Electric Corp. | 229,000 | 3,307,754 | ||||||||
| 13,708,783 | ||||||||||
Thailand — 3.1% | ||||||||||
| Kasikornbank Public Co., Ltd. — NVDR** | 1,573,700 | 2,581,627 | ||||||||
| PTT Exploration and Production Public Co., Ltd. (Foreign) | 101,600 | 687,206 | ||||||||
| Samart Corp. Public Co., Ltd. (Foreign)** | 12,129,300 | 3,428,561 | ||||||||
| Thai Olefins Public Co., Ltd. (Foreign)** | 747,000 | 1,376,263 | ||||||||
| 8,073,657 | ||||||||||
4
Table of Contents
| Number | Market | |||||||||
| of | Value | |||||||||
| Shares | (Note A) | |||||||||
China — 2.8% | ||||||||||
| China Petroleum and Chemical Corp. — H | 3,034,500 | $ | 1,358,247 | |||||||
| Global Bio-chem Technology Group Co., Ltd. | 6,318,000 | 3,906,229 | ||||||||
| Lianhua Supermarket Holdings, Ltd. — H** | 1,891,200 | 1,997,506 | ||||||||
| 7,261,982 | ||||||||||
South Korea — 2.8% | ||||||||||
| Hanjin Shipping Co., Ltd.** | 165,550 | 3,070,629 | ||||||||
| Hanmi Pharm Co., Ltd. | 86,016 | 2,295,685 | ||||||||
| Shinsegae Co., Ltd.** | 7,620 | 1,854,637 | ||||||||
| 7,220,951 | ||||||||||
Indonesia — 2.6% | ||||||||||
| PT Bank Rakyat Indonesia Tbk** | 36,802,500 | 5,461,932 | ||||||||
| PT Indonesian Satellite Corp. Tbk — ADR | 73,554 | 1,323,972 | ||||||||
| 6,785,904 | ||||||||||
India — 2.5% | ||||||||||
| ICICI Bank, Ltd. — ADR | 375,793 | 6,456,123 | ||||||||
Hong Kong — 2.1% | ||||||||||
| Brilliance China Automotive Holdings, Ltd. — ADR | 97,400 | 5,522,580 | ||||||||
Taiwan — 1.6% | ||||||||||
| Taishin Financial Holdings Co., Ltd. | 4,171,000 | 3,083,714 | ||||||||
| Topco Scientific Co., Ltd. | 410,000 | 1,105,007 | ||||||||
| 4,188,721 | ||||||||||
Australia — 1.5% | ||||||||||
| Alumina, Ltd. | 547,810 | 2,711,747 | ||||||||
| Metcash Trading, Ltd. | 531,555 | 1,081,349 | ||||||||
| 3,793,096 | ||||||||||
Malaysia — 0.9% | ||||||||||
| Malaysia International Shipping Corp. Berhad | 793,700 | 2,401,987 | ||||||||
| Total Far East | 65,413,784 | |||||||||
| NORTH AMERICA — 10.8% | ||||||||||
Canada — 8.0% | ||||||||||
| Aber Diamond Corp.** | 49,269 | 1,792,328 | ||||||||
| CHC Helicopter Corp. — A | 49,695 | 1,269,054 | ||||||||
| First Calgary Petroleums, Ltd.** | 554,725 | 3,348,311 | ||||||||
| Fording Canadian Coal Trust | 34,419 | 1,225,207 | ||||||||
| Nexen, Inc. | 72,413 | 2,629,227 | ||||||||
| Research in Motion, Ltd. — ADR** | 67,892 | 4,537,222 | ||||||||
| Telesystem International Wireless, Inc. — ADR** | 281,465 | 2,347,418 | ||||||||
| WestJet Airlines, Ltd.** | 163,061 | 3,589,929 | ||||||||
| 20,738,696 | ||||||||||
Mexico — 1.8% | ||||||||||
| America Movil SA de CV — L — ADR | 175,800 | 4,806,372 | ||||||||
Netherlands Antilles — 0.8% | ||||||||||
| Orthofix International NV — ADR** | 44,604 | 2,184,704 | ||||||||
Bermuda — 0.2% | ||||||||||
| Frontline, Ltd. | 19,800 | 513,393 | ||||||||
| Total North America | 28,243,165 | |||||||||
| SOUTH AMERICA — 5.6% | ||||||||||
Brazil — 5.6% | ||||||||||
| Aracruz Celulose SA — ADR | 97,250 | 3,407,640 | ||||||||
| Banco Bradesco SA (Pref.) | 670,075,910 | 3,530,383 | ||||||||
| Companhia Brasileira de Distribuicao Grupo Pao de Acucar — ADR | 73,300 | 1,843,495 | ||||||||
| Empresa Brasileira de Aeronautica SA — ADR | 23,200 | 812,696 | ||||||||
| Telesp Celular Participacoes SA — ADR** | 754,854 | 4,966,939 | ||||||||
| 14,561,153 | ||||||||||
| Total South America | 14,561,153 | |||||||||
| AFRICA — 3.3% | ||||||||||
South Africa — 3.3% | ||||||||||
| African Bank Investments, Ltd. | 212,840 | 301,005 | ||||||||
| MTN Group, Ltd.** | 1,358,898 | 5,791,857 | ||||||||
| Naspers, Ltd. — N | 418,747 | 2,604,700 | ||||||||
| 8,697,562 | ||||||||||
| Total Africa | 8,697,562 | |||||||||
5
Table of Contents
| Number | Market | |||||||||
| of | Value | |||||||||
| Shares | (Note A) | |||||||||
| MIDDLE EAST — 1.1% | ||||||||||
Israel — 1.1% | ||||||||||
| Makhteshim-Agan Industries, Ltd. | 746,943 | $ | 2,807,622 | |||||||
| Total Middle East | 2,807,622 | |||||||||
| Total Equity Securities (Cost $201,261,166) | 244,946,768 | |||||||||
| EQUITY CERTIFICATES— 3.0% (Note C) | ||||||||||
FAR EAST— 3.0% | ||||||||||
India — 3.0% | ||||||||||
| Bharti Tele-Ventures, Ltd.**† | 1,349,747 | 3,118,725 | ||||||||
| Hero Honda Motors, Ltd.† | 353,655 | 3,485,694 | ||||||||
| Moser Baer India, Ltd.† | 174,600 | 1,318,597 | ||||||||
| 7,923,016 | ||||||||||
| Total Equity Certificates (Cost $7,448,997) | 7,923,016 | |||||||||
| TOTAL INVESTMENTS (COST $208,710,163) | 97.0% | $ | 252,869,784 | |||||||
| Other Assets in Excess of Liabilities | 3.0% | 7,749,681 | ||||||||
| Net Assets | 100.0% | $ | 260,619,465 | |||||||
| The federal income tax basis and unrealized appreciation (depreciation) for all investments is as follows: | ||||||||||
| Basis | $ | 210,892,777 | ||||||||
| Gross Appreciation | $ | 44,562,852 | ||||||||
| Gross Depreciation | (2,585,845 | ) | ||||||||
| Net Appreciation | $ | 41,977,007 | ||||||||
** Non-income producing security
† Restricted security
ADR — American Depository Receipt
6
Table of Contents
| Percent of | ||||
| Industry | Net Assets | |||
| Airlines | 1.4% | |||
| Automobiles | 1.5% | |||
| Automotive Manufacturing | 2.1% | |||
| Auto Parts & Components | 0.8% | |||
| Banking | 10.3% | |||
| Biotechnology | 0.9% | |||
| Broadcast & Publishing Services | 2.1% | |||
| Building Materials | 0.8% | |||
| Business & Publishing Services | 2.8% | |||
| Chemicals | 2.2% | |||
| Clothing | 0.8% | |||
| Coal | 0.5% | |||
| Communications | 4.2% | |||
| Computer Manufacturers | 2.7% | |||
| Drugs | 0.5% | |||
| Electrical | 1.3% | |||
| Electronic Components | 2.4% | |||
| Energy Sources | 4.6% | |||
| Financial Services | 2.6% | |||
| Food & Household | 1.5% | |||
| Forest Products | 1.3% | |||
| Health Care | 6.4% | |||
| Health/ Multi-Industry | 1.4% | |||
| Investments | 0.9% | |||
| Leisure & Tourism | 2.4% | |||
| Maritime | 2.5% | |||
| Medical Supplies | 1.0% | |||
| Merchandising | 5.0% | |||
| Metals — Nonferrous | 1.7% | |||
| Miscellaneous Materials | 1.4% | |||
| Office/ Communications Equipment | 1.6% | |||
| Oil | 1.0% | |||
| Recreation | 1.4% | |||
| Recreational Vehicles | 1.3% | |||
| Retailing — Foods | 1.5% | |||
| Semiconductors/ Suppliers | 1.0% | |||
| Technology/ Multi-Industry | 1.5% | |||
| Telecommunications | 9.7% | |||
| Telephone Utilities | 3.9% | |||
| Transportation — Air | 3.0% | |||
| Transportation — Shipping | 0.2% | |||
| Wireless Service Provider | 0.9% | |||
| Other Assets in Excess of Liabilities | 3.0% | |||
| TOTAL | 100.0% | |||
7
Table of Contents
| ASSETS: | |||||||
| Investments, at market value (Cost $208,710,163) | $ | 252,869,784 | |||||
| Foreign currency (Cost $2,473,544) | 2,483,371 | ||||||
| Cash | 9,262,105 | ||||||
| Receivables: | |||||||
| Dividends | 285,683 | ||||||
| Interest | 1,125 | ||||||
| Investment securities sold | 8,974,402 | ||||||
| Fund shares sold | 758,117 | ||||||
| Prepaid expenses | 21,783 | ||||||
| TOTAL ASSETS | 274,656,370 | ||||||
| LIABILITIES: | |||||||
| Payables: | |||||||
| Investment securities purchased | 13,194,719 | ||||||
| Fund shares redeemed | 158,579 | ||||||
| Due to affiliates | 322,892 | ||||||
| Net unrealized depreciation on unsettled foreign currency forward contracts from transaction hedges | 66,896 | ||||||
| Foreign taxes | 1,410 | ||||||
| Accrued expenses | 292,409 | ||||||
| TOTAL LIABILITIES | 14,036,905 | ||||||
| NET ASSETS | $ | 260,619,465 | |||||
| SHARES OUTSTANDING | 8,900,264 | ||||||
| NET ASSET VALUE PER SHARE | $ | 29.28 | |||||
| NET ASSETS CONSISTED OF THE FOLLOWING AT DECEMBER 31, 2003: | |||||||
| Paid-in capital | $ | 209,909,649 | |||||
| Undistributed net investment loss | (186,998 | ) | |||||
| Undistributed net realized gain | 6,737,082 | ||||||
| Unrealized net foreign exchange gain | 111 | ||||||
| Unrealized net appreciation on investments | 44,159,621 | ||||||
| NET ASSETS | $ | 260,619,465 | |||||
8
Table of Contents
| INVESTMENT LOSS: | ||||||||
| Income: | ||||||||
| Dividends (Net of non-reclaimable taxes of $213,290) | $ | 1,080,025 | ||||||
| Interest | 4,089 | |||||||
| Other | 204 | |||||||
| Total income | 1,084,318 | |||||||
| Expenses: | ||||||||
| Investment advisory fee | 1,791,576 | |||||||
| Administration fee | 171,270 | |||||||
| Professional fees | 55,913 | |||||||
| Federal and state registration fees | 24,099 | |||||||
| Custodian fee | 209,645 | |||||||
| Transfer agent fees | 62,598 | |||||||
| Trustees’ fees | 12,508 | |||||||
| Miscellaneous | 83,883 | |||||||
| Total expenses | 2,411,492 | |||||||
| Fees paid indirectly | (2,936 | ) | ||||||
| Net expenses | 2,408,556 | |||||||
| Net investment loss | (1,324,238 | ) | ||||||
| NET REALIZED AND UNREALIZED GAIN (LOSS) ON INVESTMENTS: | ||||||||
| Net realized gain from security transactions | 39,552,917 | |||||||
| Net realized foreign exchange loss | (520,884 | ) | ||||||
| Net change in unrealized foreign exchange gain | (5,424 | ) | ||||||
| Net change in unrealized appreciation of investments | 36,761,238 | |||||||
| Net realized and unrealized gain on investments | 75,787,847 | |||||||
| NET INCREASE IN NET ASSETS RESULTING FROM OPERATIONS | $ | 74,463,609 | ||||||
9
Table of Contents
| For the year | For the year | ||||||||||
| ended | ended | ||||||||||
| December 31, 2003 | December 31, 2002 | ||||||||||
| INCREASE (DECREASE) IN NET ASSETS: | |||||||||||
| Operations: | |||||||||||
| Net investment loss | $ | (1,324,238 | ) | $ | (455,864 | ) | |||||
| Net realized and unrealized gain (loss) on investments | 75,787,847 | (10,939,637 | ) | ||||||||
| Net increase (decrease) in net assets resulting from operations | 74,463,609 | (11,395,501 | ) | ||||||||
| Distributions to shareholders: | |||||||||||
| Net investment income | — | — | |||||||||
| Capital gains | — | — | |||||||||
| Total distributions to shareholders | — | — | |||||||||
| Capital share transactions: | |||||||||||
| Proceeds from shares sold | 50,078,780 | 62,405,775 | |||||||||
| Reinvestment of distributions | — | — | |||||||||
| Cost of shares redeemed | (43,491,701 | ) | (27,744,689 | ) | |||||||
| Net assets acquired in tax-free reorganization | 111,456,128 | — | |||||||||
| Net increase in net assets derived from capital share transactions | 118,043,207 | 34,661,086 | |||||||||
| Total increase in net assets | 192,506,816 | 23,265,585 | |||||||||
| NET ASSETS: | |||||||||||
| Beginning of period | $ | 68,112,649 | $ | 44,847,064 | |||||||
| End of period | $ | 260,619,465 | $ | 68,112,649 | |||||||
| Capital share transactions are as follows: | |||||||||||
| Shares issued | 2,027,604 | 2,956,674 | |||||||||
| Shares reinvested | — | — | |||||||||
| Shares redeemed | (1,887,180 | ) | (1,345,593 | ) | |||||||
| Shares issued in tax-free reorganization | 4,981,747 | — | |||||||||
| Net increase from capital share transactions | 5,122,171 | 1,611,081 | |||||||||
10
Table of Contents
| For the year | For the year | For the year | For the year | For the year | ||||||||||||||||||
| ended | ended | ended | ended | ended | ||||||||||||||||||
| December 31, | December 31, | December 31, | December 31, | December 31, | ||||||||||||||||||
| 2003 | 2002 | 2001 | 2000 | 1999 | ||||||||||||||||||
| Net asset value, beginning of period | $ | 18.03 | $ | 20.70 | $ | 24.17 | $ | 28.25 | $ | 10.00 | ||||||||||||
| INCOME (LOSS) FROM INVESTMENT OPERATIONS: | ||||||||||||||||||||||
| Net investment loss | (0.15 | ) | (0.12 | ) | (0.24 | ) | (0.23 | ) | (0.17 | ) | ||||||||||||
| Net realized and unrealized gain (loss) on investments | 11.40 | (2.55 | ) | (3.23 | ) | (2.95 | ) | 21.14 | ||||||||||||||
| Total income (loss) from investment operations | 11.25 | (2.67 | ) | (3.47 | ) | (3.18 | ) | 20.97 | ||||||||||||||
| LESS DISTRIBUTIONS: | ||||||||||||||||||||||
| Dividends from net investment income | — | — | — | — | — | |||||||||||||||||
| Distributions from capital gains | — | — | — | (0.90 | ) | (2.72 | ) | |||||||||||||||
| Total distributions | — | — | — | (0.90 | ) | (2.72 | ) | |||||||||||||||
| Net asset value, end of period | $ | 29.28 | $ | 18.03 | $ | 20.70 | $ | 24.17 | $ | 28.25 | ||||||||||||
| Total Return | 62.40 | % | (12.90 | )% | (14.36 | )% | (11.29 | )% | 213.65 | % | ||||||||||||
| RATIOS/SUPPLEMENTAL DATA | ||||||||||||||||||||||
| Net assets, end of period (in 000’s) | $ | 260,619 | $ | 68,113 | $ | 44,847 | $ | 51,405 | $ | 26,242 | ||||||||||||
| Ratio of expenses before fees paid indirectly to average net assets | 2.02 | %† | 2.26 | %† | 2.34 | %† | 2.10 | %† | 2.43 | %† | ||||||||||||
| Ratio of net expenses to average net assets | 2.02 | %†# | 1.86 | %†# | 2.31 | %†# | 2.10 | %† | 2.43 | %† | ||||||||||||
| Ratio of net investment loss to average net assets | (1.11 | )%†# | (0.71 | )%†# | (1.12 | )%†# | (0.85 | )%† | (1.60 | )%† | ||||||||||||
| Portfolio turnover | 515.76 | % | 405.69 | % | 612.64 | % | 407.96 | % | 267.86 | % | ||||||||||||
| † | Such ratios are after administrative agent and transfer agent waivers and Adviser expense reimbursements, when applicable. PFPC, Inc., the administrative agent and transfer agent, waived a portion of its fees from December 31, 1998 through December 31, 2001. The Adviser agreed to absorb other operating expenses to the extent necessary to ensure that the total Fund operating expenses (other than interest, taxes, brokerage commissions and other portfolio transaction expenses, capital expenditures, and extraordinary expenses) would not exceed the Fund’s operating expense cap for the first fifty-four months of its operations. For the period December 31, 1998 through May 31, 1999, the Fund’s operating expense cap was 2.50% of average net assets. For the period June 1, 1999 through June 30, 2002, the operating expense cap was reduced to 2.40% of average net assets. For the period July 1, 2002 through June 30, 2003, the Fund was reimbursed for expenses exceeding the 2.40% expense cap after reduction of amounts received through commission recapture programs that were applied to Fund expenses. |
| # | Such ratios are net of fees paid indirectly (see Note B in the Notes to Financial Statements). |
11
Table of Contents
Dear Fellow Shareholders:
The Driehaus Emerging Markets Growth Fund posted strong results in 2003, in terms of relative performance and on an absolute return basis.
The fund ranked 23rd out of 177 funds in the Lipper Emerging Markets Funds peer universe for the year ended December 31, 2003. For the two-year and three-year periods ended December 31, 2003, the fund ranked 45th out of 159 funds and 39th out of 140 funds, respectively. For the five-year period ended December 31, 2003, the fund ranked 9th out of 112 similar funds.
For the year ended December 31, 2003, the Driehaus Emerging Markets Growth Fund returned 65.50%. This compares with a return of 56.28% for the Morgan Stanley Capital International (MSCI) Emerging Markets Free Index for the same period.
For the five-year period ended December 31, 2003, the Driehaus Emerging Markets Growth Fund returned 19.92% (annualized), which compares with a return of 10.62% for the MSCI Emerging Markets Free Index.
Since inception on December 31, 1997, the fund has returned 13.74% on an annualized basis, which compares with a return of 3.60% for the MSCI Emerging Markets Free Index.1
The first two months of 2003 were not promising for investors, with markets worldwide pressured by economic concerns and Mid-East tensions. However, the turnaround that began in March and continued throughout the year positively affected emerging and developed markets alike. In particular, the fund’s exposure to China’s bustling economy was a key contributor to 2003 performance. The fund invested in China through its H-share positions (China-based companies with Hong Kong-listed securities) and through holdings in companies domiciled outside of China but with considerable economic exposure to China. Among other emerging markets, the overweighted allocation to Mexico and Israel also benefited shareholders.
The technology sector was (on average) the fund’s largest weighting and made the most positive impact on the fund’s 2003 return versus all other industry sectors.
Within the technology sector, two areas were especially notable for their strong performance: the wireless telecommunications sector and the Internet sector. The overweighted Internet sector finally emerged from several years of dismal performance following the 1999 dot.com shake-out. In particular, the fund’s position in South Korea-based NeoWiz Corp. was the single biggest contributor to the fund’s return. NeoWiz, an Internet portal, benefited from increased penetration of broadband services in South Korea, which in turn increased people’s interest in going online and playing online games on their website.
The fund was also overweighted in the wireless telecommunications industry, which enhanced the fund’s performance. The leading stock in the fund in this industry was MTN Group Limited, a South African provider of cellular phone services in several African countries. MTN has a dominant market share in Nigeria, Uganda, Swaziland, Rwanda and Cameroon—all of which have wireless penetration rates of less than 10%.
Consumer cyclical stocks were significant contributors to the fund’s bottom line, and the specialty retail industry was especially strong. Consumerism is a secular trend among emerging economies and we have focused on this theme for the past several years. In addition, the health care sector, and the overweighted drug group in particular, enhanced the fund’s 2003 return. The construction materials industry was also a notable contributor to the fund’s return, especially among the emerging Asian countries. Anhui Conch Cement, a cement producer located in China but traded in Hong Kong, benefited from the construction boom in China, with capacity up 50%.
The oil and gas industry was the only sector that negatively impacted the fund’s return, due to an underweighting (on average) in a group that rallied on strong commodity prices rather than sustainable growth.
In terms of operational changes, the Board of Trustees of the Driehaus Mutual Funds approved a plan of reorganization whereby the assets of the Driehaus Asia Pacific Fund (which had been managed by Eric Ritter) would be combined with the assets of the Driehaus Emerging Markets Growth Fund. This combination was proposed in May of 2003 and was approved by the Asia Pacific Fund’s shareholders last September. I remain as manager of the Driehaus Emerging Markets Growth Fund.
12
Table of Contents
We at Driehaus Capital Management, Inc. appreciate the commitment of the fund’s shareholders. We remain committed to the core Driehaus growth investment philosophy which we believe is a rewarding strategy over the long term, especially as applied to the dynamic emerging market sector.
Sincerely,
Emery R. Brewer Portfolio Manager February 17, 2004 |
| 1 | During these periods, the Fund’s returns reflect fee waivers and/or reimbursements without which performance would have been lower. |
Performance is historical and does not represent future results.
13
Table of Contents
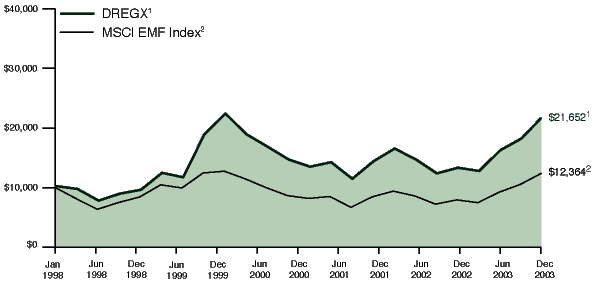
The performance summarized below is historical and does not represent future results. Investment returns and principal value vary, and you may have a gain or loss when you sell shares. Performance data presented measures the change in the value of an investment in the Fund, assuming reinvestment of all dividends and capital gains. Average annual total return reflects annualized change.
The table does not reflect the deduction of taxes that a shareholder would pay on Fund distributions or the redemption of Fund shares. The graph compares the results of a $10,000 investment in the Fund since December 31, 1997 (the date of the Fund’s inception), with all dividends and capital gains reinvested, with the indicated index (and dividends reinvested) for the same period.
| Since Inception | ||||||||||||||||||
| Average Annual Total Returns as of 12/31/03 | 1 Year | 3 Years | 5 Years | (12/31/97 - 12/31/03) | ||||||||||||||
Driehaus Emerging Markets Growth Fund (DREGX)1 | 65.50% | 14.44% | 19.92% | 13.74% | ||||||||||||||
MSCI EMF Index2 | 56.28% | 12.77% | 10.62% | 3.60% | ||||||||||||||
| 1 | The returns for these periods reflect fee waivers and/or reimbursements without which performance would have been lower. |
| 2 | The Morgan Stanley Capital International Emerging Markets Free Index (MSCI EMF Index) is a recognized benchmark of emerging markets stock markets. It is an unmanaged index of a sample of companies representative of the market structure of 26 emerging markets countries. This index, when including or excluding securities, takes into account any limitations that an international investor would experience when investing directly in such securities. Data is in U.S. dollars. Source: Morgan Stanley Capital International Inc. |
14
Table of Contents
| Number | Market | |||||||||
| of | Value | |||||||||
| Shares | (Note A) | |||||||||
| EQUITY SECURITIES — 90.7% | ||||||||||
FAR EAST — 46.6% | ||||||||||
South Korea — 13.7% | ||||||||||
| Amotech Co., Ltd.** | 34,760 | $ | 786,221 | |||||||
| Cheil Communications, Inc.** | 9,300 | 1,350,315 | ||||||||
| Hana Bank** | 38,800 | 716,408 | ||||||||
| Hana Tour Service, Inc. | 77,942 | 961,601 | ||||||||
| Hanjin Shipping Co., Ltd.** | 77,510 | 1,437,659 | ||||||||
| Hanmi Pharm Co., Ltd. | 44,415 | 1,185,394 | ||||||||
| Interflex Co., Ltd.** | 22,449 | 565,229 | ||||||||
| Kia Motors Corp.** | 106,880 | 977,752 | ||||||||
| Korea Information Service, Inc.** | 11,263 | 373,385 | ||||||||
| Korea Zinc Co., Ltd.** | 38,400 | 1,011,968 | ||||||||
| Samsung Electronics Co., Ltd. | 4,689 | 1,774,854 | ||||||||
| Samsung Heavy Industries Co., Ltd. | 158,630 | 877,358 | ||||||||
| Samsung SDI Co., Ltd. | 13,700 | 1,615,485 | ||||||||
| 13,633,629 | ||||||||||
Taiwan — 8.9% | ||||||||||
| ASE Test, Ltd.** | 10,842,000 | 1,964,015 | ||||||||
| Emerging Display Technologies | 1,044,000 | 1,426,851 | ||||||||
| ET Internet Technology Corp.** | 2,794,000 | 1,473,125 | ||||||||
| Siliconware Precision Industries Co. — ADR** | 200,352 | 1,031,813 | ||||||||
| Taishin Financial Holdings Co., Ltd. | 2,889,000 | 2,135,903 | ||||||||
| Topco Scientific Co., Ltd. | 339,000 | 913,652 | ||||||||
| 8,945,359 | ||||||||||
China — 8.6% | ||||||||||
| Anhui Conch Cement Co., Ltd. — H | 1,083,485 | 1,395,596 | ||||||||
| China Oilfield Services, Ltd. — H | 3,810,000 | 1,349,567 | ||||||||
| Ctrip.com International, Ltd. — ADR** | 5,000 | 170,050 | ||||||||
| Denway Motors, Ltd. | 1,354,000 | 1,438,830 | ||||||||
| Global Bio-chem Technology Group Co., Ltd. | 2,900,000 | 1,792,983 | ||||||||
| Lianhua Supermarket Holdings, Ltd. — H** | 1,008,000 | 1,064,661 | ||||||||
| Skyworth Digital Holdings, Ltd. | 5,428,000 | 1,363,362 | ||||||||
| 8,575,049 | ||||||||||
Thailand — 5.3% | ||||||||||
| Amata Corp. Public Co., Ltd. (Foreign) | 3,773,400 | 1,418,983 | ||||||||
| Bank of Ayudhya Public Co., Ltd. (Foreign)** | 2,832,000 | 1,007,791 | ||||||||
| PTT Exploration and Production Public Co., Ltd. (Foreign) | 251,000 | 1,697,722 | ||||||||
| Thai Olefins Public Co., Ltd. (Foreign)** | 515,300 | 949,382 | ||||||||
| Thai Olefins Public Co., Ltd. — NVDR** | 107,300 | 197,688 | ||||||||
| 5,271,566 | ||||||||||
India — 5.0% | ||||||||||
| Satyam Computer Services, Ltd. — ADR | 39,900 | 1,170,267 | ||||||||
| State Bank of India — GDR | 64,651 | 2,158,050 | ||||||||
| Tata Motors, Ltd. — GDR | 165,181 | 1,635,292 | ||||||||
| 4,963,609 | ||||||||||
Indonesia — 2.5% | ||||||||||
| PT Aneka Tambang Tbk | 2,425,000 | 554,245 | ||||||||
| PT Bank Rakyat Indonesia Tbk** | 8,196,000 | 1,216,385 | ||||||||
| PT Indocement Tunggal Prakarsa Tbk** | 2,877,000 | 725,868 | ||||||||
| 2,496,498 | ||||||||||
Philippines — 1.6% | ||||||||||
| Philippine Long Distance Telephone Co., — ADR** | 94,475 | 1,645,755 | ||||||||
Malaysia — 0.9% | ||||||||||
| Malaysia International Shipping Corp. Berhad | 299,848 | 907,435 | ||||||||
Hong Kong — 0.1% | ||||||||||
| Brilliance China Automotive Holdings, Ltd. | 180,000 | 99,116 | ||||||||
| Total Far East | 46,538,016 | |||||||||
15
Table of Contents
| Number | Market | |||||||||
| of | Value | |||||||||
| Shares | (Note A) | |||||||||
SOUTH AMERICA — 14.0% | ||||||||||
Brazil — 11.7% | ||||||||||
| Banco Bradesco SA | 315,600,000 | $ | 1,471,341 | |||||||
| Caemi Mineracao e Metalurgica SA (Pref.)** | 3,671,667 | 1,616,297 | ||||||||
| Celular CRT Participacoes SA — A (Pref.) | 6,351,000 | 1,329,637 | ||||||||
| Companhia Brasileira de Distribuicao Grupo Pao de Acucar — ADR | 10,200 | 256,530 | ||||||||
| Companhia Energetica de Minas Gerais (Pref.) | 83,600,000 | 1,528,562 | ||||||||
| Gerdau SA (Pref.) | 71,392 | 1,509,502 | ||||||||
| Perdigao SA (Pref.) | 197,000 | 1,686,620 | ||||||||
| Petroleo Brasileiro SA — ADR | 23,000 | 672,520 | ||||||||
| Telemig Celular Participacoes SA — ADR | 12,692 | 407,413 | ||||||||
| Telesp Celular Participacoes SA — ADR** | 112,642 | 741,184 | ||||||||
| Usinas Siderurgicas de Minas Gerais SA — A (Pref.) | 43,600 | 513,075 | ||||||||
| 11,732,681 | ||||||||||
Chile — 1.3% | ||||||||||
| Enersis SA — ADR | 131,700 | 969,312 | ||||||||
| SACI Falabella SA | 193,836 | 343,151 | ||||||||
| 1,312,463 | ||||||||||
Argentina — 1.0% | ||||||||||
| Telecom Argentina Stet France Telecom SA — ADR** | 111,200 | 973,000 | ||||||||
| Total South America | 14,018,144 | |||||||||
EUROPE — 9.5% | ||||||||||
Turkey — 3.5% | ||||||||||
| Dogan Yayin Holding AS** | 260,571,000 | 1,001,483 | ||||||||
| Ford Otomotiv Sanayi AS** | 246,446,000 | 1,648,820 | ||||||||
| Turkiye Is Bankasi — C** | 232,913,120 | 944,914 | ||||||||
| 3,595,217 | ||||||||||
Russia — 2.6% | ||||||||||
| JSC MMC Norilsk Nickel — ADR | 24,058 | 1,567,379 | ||||||||
| Tatneft — ADR | 44,000 | 1,003,200 | ||||||||
| 2,570,579 | ||||||||||
United Kingdom — 1.5% | ||||||||||
| BHP Billiton PLC | 167,400 | 1,462,401 | ||||||||
Luxembourg — 1.3% | ||||||||||
| Quilmes Industrial SA — ADR** | 77,400 | 1,265,490 | ||||||||
Poland — 0.6% | ||||||||||
| KGHM Polska Miedz SA — GDR** | 44,593 | 606,465 | ||||||||
| Total Europe | 9,500,152 | |||||||||
AFRICA — 8.2% | ||||||||||
South Africa — 8.2% | ||||||||||
| African Bank Investments, Ltd. | 1,246,108 | 1,762,286 | ||||||||
| Aspen Pharmacare Holdings, Ltd. | 461,904 | 858,069 | ||||||||
| Foschini, Ltd. | 579,205 | 1,705,075 | ||||||||
| JD Group, Ltd. | 181,513 | 1,142,104 | ||||||||
| MTN Group, Ltd.** | 523,110 | 2,229,584 | ||||||||
| Naspers, Ltd. — N | 83,339 | 518,387 | ||||||||
| 8,215,505 | ||||||||||
| Total Africa | 8,215,505 | |||||||||
NORTH AMERICA — 7.7% | ||||||||||
Mexico — 6.4% | ||||||||||
| America Movil SA de CV — L — ADR | 60,228 | 1,646,634 | ||||||||
| Grupo Aeroportuario del Sureste SA de CV — ADR | 75,070 | 1,321,232 | ||||||||
| Grupo Elektra SA de CV | 91,900 | 486,600 | ||||||||
| Grupo Elektra SA de CV — ADR | 49,800 | 1,051,776 | ||||||||
| Grupo Financiero Banorte SA de CV — O | 249,230 | 864,978 | ||||||||
| TV Azteca SA de CV — ADR | 110,400 | 1,004,640 | ||||||||
| 6,375,860 | ||||||||||
Canada — 1.0% | ||||||||||
| Telesystem International Wireless, Inc.** | 122,667 | 1,029,938 | ||||||||
United States — 0.3% | ||||||||||
| Pioneer Natural Resources Co.** | 10,248 | 327,219 | ||||||||
| Total North America | 7,733,017 | |||||||||
16
Table of Contents
| Number | Market | |||||||||
| of | Value | |||||||||
| Shares | (Note A) | |||||||||
MIDDLE EAST — 4.7% | ||||||||||
Israel — 4.7% | ||||||||||
| Agis Industries, Ltd. | 62,947 | $ | 2,038,079 | |||||||
| Makhteshim-Agan Industries, Ltd. | 542,431 | 2,038,899 | ||||||||
| Orbotech, Ltd. — ADR** | 27,143 | 649,261 | ||||||||
| 4,726,239 | ||||||||||
| Total Middle East | 4,726,239 | |||||||||
| Total Equity Securities (Cost $70,144,717) | 90,731,073 | |||||||||
| EQUITY CERTIFICATES — 5.0% (Note C) | ||||||||||
FAR EAST — 5.0% | ||||||||||
India — 5.0% | ||||||||||
| Bharti Tele-Ventures, Ltd.**† | 690,174 | 1,594,716 | ||||||||
| Hero Honda Motors, Ltd.† | 148,138 | 1,460,078 | ||||||||
| LIC Housing Finance, Ltd.† | 211,602 | 1,017,361 | ||||||||
| Moser Baer India, Ltd.† | 120,091 | 906,939 | ||||||||
| 4,979,094 | ||||||||||
| Total Equity Certificates (Cost $4,469,615) | 4,979,094 | |||||||||
RIGHTS — 0.4% | ||||||||||
FAR EAST — 0.4% | ||||||||||
Malaysia — 0.4% | ||||||||||
| Crest Petroleum Berhad — Rights** | 242,022 | 413,941 | ||||||||
| Total Rights (Cost $368,225) | 413,941 | |||||||||
| TOTAL INVESTMENTS | ||||||||||
| (COST $74,982,557) | 96.1% | $ | 96,124,108 | |||||||
| Other Assets in Excess of Liabilities | 3.9% | 3,861,499 | ||||||||
| Net Assets | 100.0% | $ | 99,985,607 | |||||||
| The federal income tax basis and unrealized appreciation (depreciation) for all investments is as follows: | ||||||||||
| Basis | $ | 76,282,446 | ||||||||
| Gross Appreciation | $ | 21,419,963 | ||||||||
| Gross Depreciation | (1,578,301 | ) | ||||||||
| Net Appreciation | $ | 19,841,662 | ||||||||
| ** | Non-income producing security |
| † | Restricted security |
ADR — American Depository Receipt
17
Table of Contents
| Percent of | ||||
| Industry | Net Assets | |||
| Automobiles | 4.2% | |||
| Banking | 9.6% | |||
| Basic Industries/ Multi-Industry | 0.5% | |||
| Beverages | 1.3% | |||
| Broadcast & Publishing Services | 2.9% | |||
| Building Materials | 2.1% | |||
| Business & Publishing Services | 0.4% | |||
| Chemicals | 3.5% | |||
| Communications | 1.0% | |||
| Computer Manufacturers | 0.9% | |||
| Computer Services | 1.2% | |||
| Electrical & Electronics | 2.0% | |||
| Electrical Utilities | 1.0% | |||
| Electronic Components | 2.7% | |||
| Electronic Instruments | 3.7% | |||
| Energy Sources | 4.6% | |||
| Financial Services | 2.6% | |||
| Food & Household | 1.8% | |||
| Food Processors | 1.7% | |||
| Health Care | 4.1% | |||
| Home Furnishings | 1.4% | |||
| Industrial Components | 0.9% | |||
| Insurance | 1.0% | |||
| Leisure | 1.0% | |||
| Maritime | 0.9% | |||
| Merchandising | 2.0% | |||
| Metals — Nonferrous | 2.5% | |||
| Metals — Steel | 0.5% | |||
| Miscellaneous Materials | 2.8% | |||
| Nonferrous Base Metals | 2.2% | |||
| Oil | 3.1% | |||
| Other Computers | 0.6% | |||
| Real Estate | 1.4% | |||
| Recreational Vehicles | 1.5% | |||
| Retailing — Foods | 1.3% | |||
| Retailing — Goods | 1.5% | |||
| Semiconductors/ Components | 0.6% | |||
| Steel | 1.5% | |||
| Technology/ Multi-Industry | 1.4% | |||
| Telecommunications | 2.8% | |||
| Telephone Utilities | 8.8% | |||
| Transportation — Air | 1.3% | |||
| Transportation — R & R | 1.6% | |||
| Transportation — Shipping | 1.5% | |||
| Travel Services | 0.2% | |||
| Other Assets in Excess of Liabilities | 3.9% | |||
| TOTAL | 100.0% | |||
18
Table of Contents
| ASSETS: | |||||||
| Investments, at market value (Cost $74,982,557) | $ | 96,124,108 | |||||
| Foreign currency (Cost $1,239,356) | 1,244,549 | ||||||
| Cash | 3,165,242 | ||||||
| Receivables: | |||||||
| Dividends | 256,467 | ||||||
| Interest | 266 | ||||||
| Investment securities sold | 3,186,309 | ||||||
| Fund shares sold | 274,237 | ||||||
| Prepaid expenses | 16,404 | ||||||
| TOTAL ASSETS | 104,267,582 | ||||||
| LIABILITIES: | |||||||
| Payables: | |||||||
| Investment securities purchased | 3,843,566 | ||||||
| Fund shares redeemed | 131,543 | ||||||
| Due to affiliates | 120,502 | ||||||
| Net unrealized depreciation on unsettled foreign currency forward contracts from transaction hedges | 14,675 | ||||||
| Foreign taxes | 1,732 | ||||||
| Accrued expenses | 169,957 | ||||||
| TOTAL LIABILITIES | 4,281,975 | ||||||
| NET ASSETS | $ | 99,985,607 | |||||
| SHARES OUTSTANDING | 4,927,160 | ||||||
| NET ASSET VALUE PER SHARE | $ | 20.29 | |||||
| NET ASSETS CONSISTED OF THE FOLLOWING AT DECEMBER 31, 2003: | |||||||
| Paid-in capital | $ | 79,208,253 | |||||
| Undistributed net investment loss | (385,726 | ) | |||||
| Undistributed net realized gain | 18,742 | ||||||
| Unrealized net foreign exchange gain | 2,787 | ||||||
| Unrealized net appreciation on investments | 21,141,551 | ||||||
| NET ASSETS | $ | 99,985,607 | |||||
19
Table of Contents
| INVESTMENT INCOME: | ||||||||
| Income: | ||||||||
| Dividends (Net of non-reclaimable taxes of $110,407) | $ | 1,225,068 | ||||||
| Other | 870 | |||||||
| Total income | 1,225,938 | |||||||
| Expenses: | ||||||||
| Investment advisory fee | 771,150 | |||||||
| Administration fee | 116,382 | |||||||
| Professional fees | 44,159 | |||||||
| Federal and state registration fees | 19,157 | |||||||
| Custodian fee | 181,079 | |||||||
| Transfer agent fees | 41,892 | |||||||
| Trustees’ fees | 8,236 | |||||||
| Miscellaneous | 59,434 | |||||||
| Total expenses | 1,241,489 | |||||||
| Fees paid indirectly | (3,778 | ) | ||||||
| Expense reimbursement from adviser | (34,039 | ) | ||||||
| Net expenses | 1,203,672 | |||||||
| Net investment income | 22,266 | |||||||
| NET REALIZED AND UNREALIZED GAIN (LOSS) ON INVESTMENTS: | ||||||||
| Net realized gain from security transactions | 12,912,793 | |||||||
| Net realized foreign exchange loss | (404,840 | ) | ||||||
| Net change in unrealized foreign exchange gain | (786 | ) | ||||||
| Net change in unrealized appreciation of investments | 17,283,622 | |||||||
| Net realized and unrealized gain on investments | 29,790,789 | |||||||
| NET INCREASE IN NET ASSETS RESULTING FROM OPERATIONS | $ | 29,813,055 | ||||||
20
Table of Contents
| For the year | For the year | ||||||||||
| ended | ended | ||||||||||
| December 31, 2003 | December 31, 2002 | ||||||||||
| INCREASE (DECREASE) IN NET ASSETS: | |||||||||||
| Operations: | |||||||||||
| Net investment income (loss) | $ | 22,266 | $ | (271,745 | ) | ||||||
| Net realized and unrealized gain (loss) on investments | 29,790,789 | (4,339,298 | ) | ||||||||
| Net increase (decrease) in net assets resulting from operations | 29,813,055 | (4,611,043 | ) | ||||||||
| Distributions to shareholders: | |||||||||||
| Net investment income | — | — | |||||||||
| Capital gains | — | — | |||||||||
| Total distributions to shareholders | — | — | |||||||||
| Capital share transactions: | |||||||||||
| Proceeds from shares sold | 31,203,662 | 33,884,082 | |||||||||
| Reinvestment of distributions | — | — | |||||||||
| Cost of shares redeemed | (15,962,222 | ) | (15,294,504 | ) | |||||||
| Net assets acquired in tax-free reorganization | 18,999,116 | — | |||||||||
| Net increase in net assets derived from capital share transactions | 34,240,556 | 18,589,578 | |||||||||
| Total increase in net assets | 64,053,611 | 13,978,535 | |||||||||
| NET ASSETS: | |||||||||||
| Beginning of period | $ | 35,931,996 | $ | 21,953,461 | |||||||
| End of period | $ | 99,985,607 | $ | 35,931,996 | |||||||
| Capital share transactions are as follows: | |||||||||||
| Shares issued | 1,837,706 | 2,384,517 | |||||||||
| Shares reinvested | — | — | |||||||||
| Shares redeemed | (1,069,642 | ) | (1,107,044 | ) | |||||||
| Shares issued in tax-free reorganization | 1,227,831 | — | |||||||||
| Net increase from capital share transactions | 1,995,895 | 1,277,473 | |||||||||
21
Table of Contents
| For the year | For the year | For the year | For the year | For the year | ||||||||||||||||||
| ended | ended | ended | ended | ended | ||||||||||||||||||
| December 31, | December 31, | December 31, | December 31, | December 31, | ||||||||||||||||||
| 2003 | 2002 | 2001 | 2000 | 1999 | ||||||||||||||||||
| Net asset value, beginning of period | $ | 12.26 | $ | 13.27 | $ | 13.57 | $ | 18.36 | $ | 8.73 | ||||||||||||
| INCOME (LOSS) FROM INVESTMENT OPERATIONS: | ||||||||||||||||||||||
| Net investment income (loss) | 0.00 | (0.09 | ) | (0.11 | ) | 0.10 | (0.14 | ) | ||||||||||||||
| Net realized and unrealized gain (loss) on investments | 8.03 | (0.92 | ) | (0.16 | ) | (4.28 | ) | 10.05 | ||||||||||||||
| Total income (loss) from investment operations | 8.03 | (1.01 | ) | (0.27 | ) | (4.18 | ) | 9.91 | ||||||||||||||
| LESS DISTRIBUTIONS: | ||||||||||||||||||||||
| Dividends from net investment income | — | — | (0.03 | ) | — | — | ||||||||||||||||
| Distributions from capital gains | — | — | — | (0.61 | ) | (0.28 | ) | |||||||||||||||
| Total distributions | — | — | (0.03 | ) | (0.61 | ) | (0.28 | ) | ||||||||||||||
| Net asset value, end of period | $ | 20.29 | $ | 12.26 | $ | 13.27 | $ | 13.57 | $ | 18.36 | ||||||||||||
| Total Return | 65.50 | % | (7.61 | )% | (1.98 | )% | (22.73 | )% | 114.16 | % | ||||||||||||
| RATIOS/SUPPLEMENTAL DATA | ||||||||||||||||||||||
| Net assets, end of period (in 000’s) | $ | 99,986 | $ | 35,932 | $ | 21,953 | $ | 24,158 | $ | 10,537 | ||||||||||||
| Ratio of expenses before fees paid indirectly to average net assets | 2.35 | %† | 2.50 | %† | 2.50 | %† | 2.50 | %† | 2.58 | %† | ||||||||||||
| Ratio of net expenses to average net assets | 2.34 | %†# | 2.16 | %†# | 2.49 | %†# | 2.50 | %† | 2.58 | %† | ||||||||||||
| Ratio of net investment income (loss) to average net assets | 0.04 | %†# | (0.76 | )%†# | (0.79 | )%†# | 0.78 | %† | (1.29 | )%† | ||||||||||||
| Portfolio turnover | 432.47 | % | 355.14 | % | 505.50 | % | 375.47 | % | 366.53 | % | ||||||||||||
| † | Such ratios are after administrative agent and transfer agent waivers and Adviser expense reimbursements, when applicable. PFPC, Inc., the administrative agent and transfer agent, waived a portion of its fees from December 31, 1997 through December 31, 2000. The Adviser agreed to absorb other operating expenses to the extent necessary to ensure that the total Fund operating expenses (other than interest, taxes, brokerage commissions and other portfolio transaction expenses, capital expenditures, and extraordinary expenses) would not exceed the Fund’s operating expense cap for the first sixty-six months of its operations. For the period December 31, 1997 through May 31, 1999, the Fund’s operating expense cap was 2.75% of average net assets. For the period June 1, 1999 through June 30, 2002, the operating expense cap was reduced to 2.50% of average net assets. For the period July 1, 2002 through June 30, 2003, the Fund was reimbursed for expenses exceeding the 2.50% expense cap after reduction of amounts received through commission recapture programs that were applied to Fund expenses. |
| # | Such ratios are net of fees paid indirectly (see Note B in the Notes to Financial Statements). |
22
Table of Contents
A. SUMMARY OF SIGNIFICANT ACCOUNTING POLICIES
Organization
The Driehaus Mutual Funds (the “Trust”) is a registered management investment company, organized as a Delaware statutory trust with two separate series (“Funds”). The Trust was organized under an Agreement and Declaration of Trust dated May 31, 1996 and may issue an unlimited number of full and fractional units of beneficial interest (shares) without par value. The two Funds included in the Trust are as follows:
| Fund | Commencement of Operations | |||
Driehaus International Discovery Fund | 12/31/98 | |||
Driehaus Emerging Markets Growth Fund | 12/31/97 | |||
The investment objective of the Funds is to maximize capital appreciation.
The Driehaus International Discovery Fund seeks to achieve its objective by generally investing in equity securities of small to mid-size foreign companies; however, the Fund may shift its focus toward large cap foreign stocks when market conditions suggest doing so will help the Fund achieve its objective.
The Driehaus Emerging Markets Growth Fund seeks to achieve its objective by investing primarily in the equity securities of emerging markets companies.
Immediately prior to the opening of business on September 29, 2003, the Driehaus International Discovery Fund (“Acquiring Fund”) acquired all the net assets of the Driehaus International Growth Fund and the Driehaus European Opportunity Fund (“Acquired Funds”) pursuant to a plan of reorganization approved by the shareholders of each of the Acquired Funds. The acquisition was accomplished by a tax-free exchange of 4,981,747 shares of the Acquiring Fund for 13,169,713 and 1,455,472 shares, respectively, of the Driehaus International Growth Fund and the Driehaus European Opportunity Fund outstanding at the end of business on September 26, 2003. The Driehaus International Growth Fund and the Driehaus European Opportunity Fund’s net assets at that date ($84,553,063 and $39,892,130, respectively), including $10,177,600 and $2,811,465, respectively, of net unrealized appreciation, were combined with those of the Driehaus International Discovery Fund. The aggregate net assets of the Driehaus International Discovery Fund immediately before the acquisition were $96,273,882. The combined net assets of the Driehaus International Discovery Fund immediately following the acquisition were $220,719,075.
Immediately prior to the opening of business on September 29, 2003, the Driehaus Emerging Markets Growth Fund (“Acquiring Fund”) acquired all the net assets of the Driehaus Asia Pacific Growth Fund (“Acquired Fund”) pursuant to a plan of reorganization approved by the shareholders of the Acquired Fund. The acquisition was accomplished by a tax-free exchange of 1,227,831 shares of the Acquiring Fund for 1,354,933 shares of the Driehaus Asia Pacific Growth Fund outstanding at the end of business on September 26, 2003. The Driehaus Asia Pacific Growth Fund’s net assets at that date ($20,422,298), including $1,423,182 of net unrealized appreciation, were combined with those of the Driehaus Emerging Markets Growth Fund. The aggregate net assets of the Driehaus Emerging Markets Growth Fund immediately before the acquisition were $50,277,767. The combined net assets of the Driehaus Emerging Markets Growth Fund immediately following the acquisition were $70,700,065.
Fiscal Year End
The fiscal year end for the Funds is December 31.
Securities Valuation and Transactions
Depending upon local convention or regulation, equity securities may be valued at the last sale price, last bid or asked price, or the mean between the last bid and asked prices as of, in each case, the close of the appropriate exchange or other designated time. In addition, if quotations are not readily available, or if the values have been materially affected by events occurring after the closing of a foreign market, assets may be valued at fair value as determined in good faith by or under the direction of the Trust’s Board of Trustees.
Securities transactions are accounted for on trade date. The cost of investments sold is determined by the use of specific identification method for both financial reporting and income tax purposes. Interest income is
23
Table of Contents
recorded on an accrual basis. Dividend income, net of non-reclaimable foreign taxes withheld, is recorded on the ex-dividend date.
The Funds determine income and expenses daily. This change in net asset value is allocated daily.
Federal Income Taxes
No provision is made for Federal income taxes since each Fund has elected to be taxed as a “regulated investment company” under Subchapter M of the Internal Revenue Code and has made and declared all the required distributions to its shareholders in amounts sufficient to relieve the Fund from all or substantially all Federal income and excise taxes under provisions of current Federal tax law.
The amount of dividends and distributions from net investment income and net realized capital gains are determined in accordance with Federal income tax regulations, which may differ from generally accepted accounting principles.
For the period ended December 31, 2003, reclassifications were recorded between undistributed net investment loss, undistributed net realized foreign exchange loss, undistributed net realized gain, and paid-in-capital in excess of par for any permanent book to tax differences.
At December 31, 2003, the Driehaus International Discovery Fund and the Driehaus Emerging Markets Growth Fund had accumulated capital loss carryforwards of $148,178,434 and $3,251,909, respectively, expiring between 2009 and 2010. To the extent that the Funds realize future net capital gains, those gains will be offset by any unused capital loss carryforward subject to the limitations described below. For the year ended December 31, 2003, the Driehaus International Discovery Fund and the Driehaus Emerging Markets Growth Fund realized no post-October capital losses and realized post-October currency losses of $183,093 and $151,485, respectively, which, for tax purposes, are deferred and will be recognized later this year.
Included in the capital loss carryforward amounts stated above are capital losses that the Driehaus International Discovery Fund inherited from its merger with the Driehaus International Growth Fund and the Driehaus European Opportunity Fund on September 29, 2003 of approximately $141,844,375 and $6,334,059, respectively, which may be applied against any realized net taxable capital gains in future years or until December 31, 2010. Section 382 of the Internal Revenue Code imposes certain limitations that will likely reduce the Fund’s ability to use the majority of these capital loss carryforwards.
Included in the capital loss carryforward amounts stated above are capital losses that the Driehaus Emerging Markets Growth Fund inherited from its merger with the Driehaus Asia Pacific Growth Fund on September 29, 2003 of approximately $3,251,909, which may be applied against any realized net taxable capital gains in future years or until December 31, 2010, subject to certain limitations imposed by Section 382 of the Internal Revenue Code.
Distributions to Shareholders
The Funds had no distributions during the years ended December 31, 2003 and 2002.
As of December 31, 2003, the components of net assets on a tax basis were as follows:
| Driehaus | Driehaus | ||||||||
| International | Emerging Markets | ||||||||
| Discovery Fund | Growth Fund | ||||||||
| Undistributed ordinary income | $ | 4,447,267 | $ | 52,677 | |||||
| Undistributed long-term capital gains | 2,331,264 | 612,252 | |||||||
| Accumulated earnings | 6,778,531 | 664,929 | |||||||
| Paid-in capital | 360,160,159 | 82,864,637 | |||||||
| Accumulated capital and other losses | (148,296,343 | ) | (3,388,408 | ) | |||||
| Unrealized appreciation/(depreciation) on foreign currency | 111 | 2,787 | |||||||
| Unrealized appreciation on investments | 41,977,007 | 19,841,662 | |||||||
| Net assets | $ | 260,619,465 | $ | 99,985,607 | |||||
The differences between book-basis and tax-basis unrealized appreciation is attributable primarily to the tax deferral of losses on wash sales and mark-to-market of passive foreign investment companies.
24
Table of Contents
Foreign Currency Translation
Foreign currency is translated into U.S. dollar values based upon the current rates of exchange on the date of the Funds’ valuations.
Net realized foreign exchange gains or losses which are reported by the Funds result from currency gains and losses on transaction hedges arising from changes in exchange rates between the trade and settlement dates on forward contracts underlying securities transactions, and the difference between the amounts accrued for dividends, interest, and foreign taxes and the amounts actually received or paid in U.S. dollars for these items. Net unrealized foreign exchange gains and losses result from changes in the U.S. dollar value of assets and liabilities (other than investments in securities), which are denominated in foreign currencies, as a result of changes in exchange rates.
Net realized foreign exchange gains or losses on portfolio hedges result from the use of forward contracts to hedge portfolio positions denominated or quoted in a particular currency in order to reduce or limit exposure in that currency. The Funds had no portfolio hedges during the year ended December 31, 2003.
The Funds do not isolate that portion of the results of operations which results from fluctuations in foreign exchange rates on investments held. These fluctuations are included with the net change in unrealized appreciation (depreciation) of investments.
Use of Estimates
The preparation of financial statements, in conformity with generally accepted accounting principles, requires management to make estimates and assumptions that affect the reported amount of assets and liabilities and disclosure of contingent assets and liabilities at the date of the financial statements and the reported amounts of net increases or decreases in net assets from operations during the reporting period. Actual results could differ from those estimates.
| B. | INVESTMENT ADVISORY FEES, TRANSACTIONS WITH AFFILIATES, AND ADMINISTRATIVE FEES |
Richard H. Driehaus, the Chairman of the Board and President of the Trust, is also the Chairman of the Board, sole director, and sole shareholder of Driehaus Capital Management, Inc. (“DCM”), a registered investment adviser, and of Driehaus Securities Corporation, a registered broker-dealer.
DCM serves as the Funds’ investment adviser. In return for its services to the Funds, DCM receives a monthly fee, computed and accrued daily at an annual rate of 1.5% of each Fund’s average daily net assets.
DCM agreed to absorb other operating expenses to the extent necessary to ensure that total operating expenses (other than interest, taxes, brokerage commissions and other portfolio transaction expenses, capital expenditures and extraordinary expenses) for the Driehaus International Discovery Fund and the Driehaus Emerging Markets Growth Fund would not exceed 2.40% and 2.50%, respectively, of the average net assets of each Fund on an annual basis, through June 30, 2003. For the period July 1, 2002 through June 30, 2003, the Funds were reimbursed for expenses exceeding their respective expense caps after reduction of amounts received through commission recapture programs that were applied to Fund operating expenses.
The amounts accrued and payable to DCM during the year ended December 31, 2003, are as follows:
| Advisory Fees | ||||||||
| Payable | ||||||||
| (included in Due | ||||||||
| Fund | Advisory Fees | to affiliates) | ||||||
Driehaus International Discovery Fund | $ | 1,791,576 | $ | 322,892 | ||||
Driehaus Emerging Markets Growth Fund | 771,150 | 120,502 | ||||||
The Funds direct certain portfolio trades, subject to obtaining the best price and execution, to brokers who have agreed to rebate to the Funds part of the commissions generated. Such rebates are currently used to offset a portion of the Funds’ operating expenses. For the year ended December 31, 2003, these arrangements
25
Table of Contents
reduced the expenses of the Driehaus International Discovery Fund and the Driehaus Emerging Markets Growth Fund by $2,936 (0.1%) and $3,778 (0.3%), respectively.
Driehaus Securities Corporation (“DSC”) is the Funds’ distributor.
DSC also acts as a broker for the Funds for domestically traded securities. For the year ended December 31, 2003, the Funds paid the following brokerage commissions:
| Total | Commissions | Shares Traded | ||||||||||
| Fund | Commissions | Paid to DSC | through DSC | |||||||||
Driehaus International Discovery Fund | $ | 2,699,657 | $ | 393,995 | 11,968,637 | |||||||
Driehaus Emerging Markets Growth Fund | 1,233,437 | 263,770 | 6,944,705 | |||||||||
A portion of these commissions are, in turn, paid by DSC to third parties for clearing and execution services.
Certain officers of the Trust are also officers of DCM and DSC. No such officers received compensation from the Funds.
PFPC Inc., an indirect subsidiary of PNC Bank Corp., serves as the Funds’ administrative and accounting agent. In compensation for these services, PFPC Inc. receives the larger of a monthly minimum fee or a monthly fee based upon average net assets. PFPC Inc. also acts as the transfer agent and dividend disbursing agent for the Funds. In compensation for these services, PFPC Inc. receives a monthly fee based on shareholder processing activity during the month.
C. DERIVATIVES AND OTHER FINANCIAL INSTRUMENTS
The Funds occasionally invest in equity certificates which allow the Funds to participate in the appreciation (depreciation) of the underlying security without actually owning the underlying security. These instruments are purchased pursuant to an agreement with a financial institution and are valued at a calculated market price based on the value of the underlying security in accordance with the agreement. At December 31, 2003, the Driehaus International Discovery Fund and the Driehaus Emerging Markets Growth Fund had unrealized appreciation of $474,019, and $509,479, respectively, as a result of their investment in these financial instruments. The aggregate market values of these certificates for the Driehaus International Discovery Fund and the Driehaus Emerging Markets Growth Fund represented 3.1% and 5.2%, respectively, of their total market values at December 31, 2003.
At December 31, 2003, the Funds had foreign currency forward contracts outstanding under which they are obligated to exchange currencies at specified future dates. At December 31, 2003, the Funds’ currency transactions are limited to transaction hedges.
The contractual amounts of foreign currency forward contracts do not necessarily represent the amounts potentially subject to risk. The measurement of the risks associated with these instruments is meaningful only when all related and offsetting transactions are considered. Risks arise from the possible inability of counter parties to meet the terms of their contracts and from movements in currency values.
26
Table of Contents
The Funds had the following outstanding contracts at December 31, 2003:
| Driehaus International Discovery Fund Transaction Hedges: Foreign Currency Purchased: |
| Unrealized | ||||||||||||||||
| Appreciation | ||||||||||||||||
| US Dollars | Settlement | (Depreciation) | ||||||||||||||
| Sold | Foreign Currency Purchased | Date | at December 31, 2003 | |||||||||||||
| $ | 208,198 | 276,709 | Australian Dollar | January 2004 | $ | 830 | ||||||||||
| 1,188,181 | 1,536,145 | Canadian Dollar | January 2004 | (3,367 | ) | |||||||||||
| 1,325,942 | 10,292,836 | Hong Kong Dollar | January 2004 | 125 | ||||||||||||
| 1,302,459 | 730,531 | Pound Sterling | January 2004 | 4,360 | ||||||||||||
| 95,363 | 118,022 | Swiss Franc | January 2004 | 893 | ||||||||||||
| 2,511,027 | 99,458,435 | Thailand Baht | January 2004 | (149 | ) | |||||||||||
| $ | 2,692 | |||||||||||||||
| Foreign Currency Sold: |
| Unrealized | ||||||||||||||||
| Appreciation | ||||||||||||||||
| US Dollars | Settlement | (Depreciation) | ||||||||||||||
| Purchased | Foreign Currency Sold | Date | at December 31, 2003 | |||||||||||||
| $ | 307,811 | 1,820,066 | Danish Krone | January 2004 | $ | (1,688 | ) | |||||||||
| 2,256,814 | 1,791,972 | Euro | January 2004 | (18,941 | ) | |||||||||||
| 454,520 | 254,966 | Pound Sterling | January 2004 | (1,062 | ) | |||||||||||
| 1,224,151 | 8,187,699 | South African Rand | January 2004 | (43,006 | ) | |||||||||||
| 285,894 | 2,061,118 | Swedish Krona | January 2004 | (2,547 | ) | |||||||||||
| 250,336 | 309,817 | Swiss Franc | January 2004 | (2,344 | ) | |||||||||||
| $ | (69,588 | ) | ||||||||||||||
| Net unrealized depreciation | $ | (66,896 | ) | |||||||||||||
| Driehaus Emerging Markets Growth Fund Transaction Hedges: Foreign Currency Purchased: |
| Unrealized | ||||||||||||||||
| Appreciation | ||||||||||||||||
| US Dollars | Settlement | (Depreciation) | ||||||||||||||
| Sold | Foreign Currency Purchased | Date | at December 31, 2003 | |||||||||||||
| $ | 218,670 | 1,841,749,796 | Indonesian Rupee | January 2004 | $ | 505 | ||||||||||
| 189,953 | 1,271,512 | South African Rand | January 2004 | (1,252 | ) | |||||||||||
| 446,343 | 17,680,728 | Thailand Baht | January 2004 | (194 | ) | |||||||||||
| $ | (941 | ) | ||||||||||||||
| Foreign Currency Sold: |
| Unrealized | ||||||||||||||||
| Appreciation | ||||||||||||||||
| US Dollars | Settlement | (Depreciation) | ||||||||||||||
| Purchased | Foreign Currency Sold | Date | at December 31, 2003 | |||||||||||||
| $ | 527,649 | 3,529,783 | South African Rand | January 2004 | $ | (13,734 | ) | |||||||||
| Net unrealized depreciation | $ | (14,675 | ) | |||||||||||||
27
Table of Contents
D. INVESTMENT TRANSACTIONS
The aggregate purchases and sales of investment securities, other than short-term obligations, for the year ended December 31, 2003, were as follows:
| Fund | Purchases | Sales | ||||||
Driehaus International Discovery Fund | $ | 647,475,129 | $ | 613,033,417 | ||||
Driehaus Emerging Markets Growth Fund | 232,182,607 | 218,862,199 | ||||||
E. RESTRICTED SECURITIES
Restricted securities are securities that are not registered for sale under the Securities Act of 1933 or applicable foreign law and that may be re-sold only in transactions exempt from applicable registration. Restricted securities include rule 144A securities which may be sold normally to qualified institutional buyers. At December 31, 2003, the Funds held no restricted securities, other than equity certificates. Since an investment in equity certificates represents an agreement entered into with a financial institution, with terms set by such financial institution, these instruments are also deemed to be restricted (see Note C).
F. LINES OF CREDIT
The Funds have a $50 million line of credit consisting of a $25 million committed line and a $25 million uncommitted line. This line of credit is available primarily to meet large, unexpected shareholder withdrawals subject to certain restrictions. At December 31, 2003, the Funds had no outstanding borrowings under the line of credit.
G. OFF BALANCE SHEET RISKS
The Funds’ investments in foreign securities may entail risks due to the potential for political and economic instability in the countries where the issuers of these securities are located. In addition, foreign exchange fluctuations could affect the value of positions held. These risks are generally intensified in emerging markets.
H. SHAREHOLDER FEES
The Funds may charge a redemption fee of 2.00% of the redemption amount for shares redeemed within 60 days of purchase. The fees charged by the Funds for the year ended December 31, 2003, were as follows:
| Fund | Redemption Fees | |||
Driehaus International Discovery Fund | $ | 33,904 | ||
Driehaus Emerging Markets Growth Fund | 11,636 | |||
The redemption fees are recorded in paid-in capital.
28
Table of Contents
To the Shareholders and Board of Trustees of the Driehaus International Discovery Fund and the Driehaus Emerging Markets Growth Fund:
We have audited the accompanying statements of assets and liabilities of the Driehaus International Discovery Fund and the Driehaus Emerging Markets Growth Fund (the “Funds”), including the schedules of investments and investments by industry on pages 4-8 and 15-19, as of December 31, 2003, and the related statements of operations for the year then ended, and the statements of changes in net assets and financial highlights on pages 9-11 and 20-22 for each of the two years in the period then ended. These financial statements and financial highlights are the responsibility of the Funds’ management. Our responsibility is to express an opinion on these financial statements and financial highlights based on our audits. The financial highlights for the periods ended December 31, 2001 and prior were audited by other auditors who have ceased operations. Those auditors expressed an unqualified opinion on those financial statements in their report dated February 8, 2002.
We conducted our audits in accordance with auditing standards generally accepted in the United States. Those standards require that we plan and perform the audit to obtain reasonable assurance about whether the financial statements and financial highlights are free of material misstatement. An audit includes examining, on a test basis, evidence supporting the amounts and disclosures in the financial statements and financial highlights. Our procedures included confirmations of securities owned as of December 31, 2003 by correspondence with the custodian and brokers. An audit also includes assessing the accounting principles used and significant estimates made by management, as well as evaluating the overall financial statement presentation. We believe that our audits provide a reasonable basis for our opinion.
In our opinion, the financial statements and financial highlights referred to above present fairly, in all material respects, the financial position of the Driehaus International Discovery Fund and the Driehaus Emerging Markets Growth Fund as of December 31, 2003, and the results of their operations for the year then ended and the changes in their net assets and their financial highlights for each of the two years in the period then ended, in conformity with accounting principles generally accepted in the United States.
Chicago, Illinois
29
Table of Contents
The following table sets forth certain information with respect to the trustees of the Trust:
| Term of | Number of | |||||||||
| Office and | Portfolios in | Other | ||||||||
| Position(s) | Length of | Principal | the Trust | Directorships | ||||||
| Name, Address and | Held with | Time | Occupation(s) | Overseen by | Held by | |||||
| Date of Birth | the Trust | Served** | During Past 5 Years | Trustee | Trustee | |||||
Interested Trustees:* | ||||||||||
| Richard H. Driehaus 25 East Erie Street Chicago, IL 60611 DOB: 07/27/42 | Trustee; Chairman; President | Since 1996 | Chairman of the Board and Chief Executive Officer of the Adviser and the Distributor; Chief Executive Officer of Driehaus Capital Management, L.L.C.; Chief Investment Officer and Portfolio Manager of the Adviser and Driehaus Capital Management, L.L.C. | 2 | Driehaus Enterprise Management, Inc.; Vintage Properties, Inc.; and 25 East Erie Corp. | |||||
| Robert F. Moyer 25 East Erie Street Chicago, IL 60611 DOB: 01/28/47 | Trustee; Senior Vice President | Since 1996 | President of the Adviser and the Distributor; President and Chief Operating Officer of Driehaus Capital Management, L.L.C. | 2 | None | |||||
| Independent Trustees: | ||||||||||
| Francis J. Harmon 25 East Erie Street Chicago, IL 60611 DOB: 11/02/42 | Trustee | Since 1998 | Principal Account Executive — Labor Affairs, Blue Cross and Blue Shield of Illinois. | 2 | None | |||||
| A.R. Umans 25 East Erie Street Chicago, IL 60611 DOB: 03/11/27 | Trustee | Since 1996 | Chairman of the Board and Chief Executive Officer, RHC/Spacemaster Corporation (manufacturing corporation). | 2 | None | |||||
30
Table of Contents
| Term of | Number of | |||||||||
| Office and | Portfolios in | Other | ||||||||
| Position(s) | Length of | Principal | the Trust | Directorships | ||||||
| Name, Address and | Held with | Time | Occupation(s) | Overseen by | Held by | |||||
| Date of Birth | the Trust | Served** | During Past 5 Years | Trustee | Trustee | |||||
| Daniel F. Zemanek 25 East Erie Street Chicago, IL 60611 DOB: 05/28/42 | Trustee | Since 1996 | Senior Vice President of Sunrise Development, Inc. since January 2003; Consultant, real-estate development, August 1998 to January 2003. | 2 | None |
| * | Mr. Driehaus and Mr. Moyer are “interested persons” of the Trust, the Adviser and the Distributor, as defined in the Investment Company Act of 1940, because they are officers of the Adviser and the Distributor. In addition, Mr. Driehaus controls the Adviser and the Distributor. |
| ** | Each Trustee will serve as a Trustee of the Trust until (i) termination of the Trust, or (ii) until the Trustee’s retirement, resignation or death, or (iii) as otherwise specified in the Trust’s governing documents. |
31
Table of Contents
The following table sets forth certain information with respect to the advisory board member and officers of the Trust:
| Term of | ||||||
| Position(s) | Office and | |||||
| Held | Length of | Principal | ||||
| Name, Address and | with | Time | Occupation(s) | |||
| Date of Birth | the Trust | Served | During Past 5 Years | |||
| Arthur B. Mellin1 190 South LaSalle Street Chicago, IL 60603 DOB: 11/17/42 | Advisory Board Member | Since 1998 | President of Mellin Securities Incorporated and Mellin Asset Management, Inc. | |||
| Michelle L. Cahoon 25 East Erie Street Chicago, IL 60611 DOB: 07/05/66 | Treasurer | Since 2002 | Vice President and Controller of the Adviser since 2003; Vice President, Treasurer and Controller of the Distributor since 2003; Controller of the Adviser and the Distributor since 2002; Manager with Arthur Andersen LLP from 1992-2002. | |||
| Lisa M. King 400 Bellevue Parkway Wilmington, DE 19809 DOB: 01/27/68 | Secretary | Since 2002 | Vice President and Counsel, PFPC Inc. (financial services company) since 2000; Associate, Stradley, Ronon, Stevens & Young, LLC (law firm) from 1996-2000. | |||
| Valerie Baxendale 25 East Erie Street Chicago, IL 60611 DOB: 10/02/61 | Assistant Secretary | Since 2003 | Regulatory Associate with the Adviser since 2003; Legal Assistant, Vedder, Price, Kaufman & Kammholz, P.C. from 2002 to 2003; Prior to 2002, Economics Instructor, Ivy Tech State College. | |||
| 1 | Mr. Driehaus and Mr. Mellin are brothers-in-law. |
The Statement of Additional Information for the Driehaus Mutual Funds contains more detail about the Trust’s trustees and officers and is available upon request, without charge. For further information, please call 1-800-560-6111.
32
Table of Contents
Special Meetings of Shareholders of the Driehaus International Growth Fund, the Driehaus European Opportunity Fund and the Driehaus Asia Pacific Growth Fund (each a “Selling Fund” and collectively, the “Selling Funds”) were held on September 12, 2003. The following proposal was voted on by the shareholders of each Selling Fund (the resulting votes are presented below):
| Proposal: | To approve an Agreement and Plan of Reorganization providing for the transfer of all of the assets and liabilities of: (a) Driehaus International Growth Fund to Driehaus International Discovery Fund; (b) Driehaus European Opportunity Fund to Driehaus International Discovery Fund; and (c) Driehaus Asia Pacific Growth Fund to Driehaus Emerging Markets Growth Fund; in exchange for shares of Driehaus International Discovery Fund, Driehaus International Discovery Fund and Driehaus Emerging Markets Growth Fund, respectively. The shares so received will be distributed to shareholders of the applicable Selling Fund and the Selling Fund will be terminated as soon as practicable thereafter. These actions are referred to as a “Reorganization.” |
| Fund | Affirmative | Against | Abstain | |||||||||
Driehaus International Growth Fund | 9,612,490.529 | 339,005.572 | 0 | |||||||||
Driehaus European Opportunity Fund | 650,676.461 | 34,486.776 | 2,549.622 | |||||||||
Driehaus Asia Pacific Growth Fund | 836,211.192 | 9,982.508 | 1,661.000 | |||||||||
33
Table of Contents
Item 2. Code of Ethics.
| (a) | As of the end of the period covered by this report, the registrant had not yet adopted a code of ethics that applies to its principal executive officer and principal financial officer; however, at its meeting on February 23, 2004, the registrant’s Board of Trustees adopted such a code. A copy of the code of ethics is filed pursuant to Item 10(a). | |||
| (c) | Not applicable | |||
| (d) | Not applicable | |||
Item 3. Audit Committee Financial Expert.
The registrant’s Board of Trustees has designated A.R. Umans as an audit committee financial expert. Mr. Umans is “independent,” as defined by this Item 3.
Item 4. Principal Accountant Fees and Services.
| (a) | Audit Fees |
For the fiscal years ended December 31, 2002 and 2003, Ernst & Young LLP, the registrant’s principal accountant (“E&Y”), billed the registrant $92,000 and $48,000, respectively, for professional services rendered for the audit of the registrant’s annual financial statements or services that are normally provided in connection with statutory and regulatory filings.
| (b) | Audit-Related Fees |
For the fiscal years ended December 31, 2002 and 2003, E&Y billed the registrant $0 and $0, respectively, for assurance and related services that are reasonably related to the performance of the audit of the registrant’s financial statements and that are not reported above.
For engagements that Driehaus Capital Management, Inc., the registrant’s investment adviser (“DCM”), or Driehaus Securities Corporation, the registrant’s distributor (“DSC”), entered into with E&Y on or after May 6, 2003, E&Y provided no audit-related services to DCM or DSC that were for engagements directly related to the registrant’s operations and financial reporting, except for the issuance of a consent in connection with the filing of Form N-14 for the registrant, for which E&Y billed DCM $4,800. This engagement was pre-approved by the Audit Committee.
Table of Contents
| (c) | Tax Fees |
For the fiscal years ended December 31, 2002 and 2003, E&Y billed the registrant $17,500 and $18,750, respectively, for professional services rendered for tax compliance, tax advice and tax planning. Such services consisted of review of the registrant’s income tax returns and tax distribution requirements. For engagements with E&Y entered into on or after May 6, 2003, the Audit Committee pre-approved all tax services that E&Y provided to the registrant.
For engagements that DCM or DSC entered into with E&Y on or after May 6, 2003, E&Y provided no tax services to DCM or DSC that were for engagements directly related to the registrant’s operations and financial reporting, except for an analysis of capital loss carryover limitations related to the reorganization of certain series of the registrant. Estimated fees for this engagement are $7,500, which will be paid by DCM and were pre-approved by the Audit Committee.
| (d) | All Other Fees |
For the fiscal years ended December 31, 2002 and 2003, E&Y billed the registrant $0 and $0, respectively, for products and services provided, other than the services reported above.
For engagements that DCM or DSC entered into with E&Y on or after May 6, 2003, E&Y provided no other services to DCM or DSC that were for engagements directly related to the registrant’s operations and financial reporting.
| (e)(1) | Audit Committee Pre-Approval Policies and Procedures |
Pursuant to registrant’s Audit Committee Charter (the “Charter”), the Audit Committee is responsible for pre-approving any engagement of the principal accountant to provide non-prohibited services to the registrant, including the fees and other compensation to be paid to the principal accountant, to the extent required by Rule 2-01(c)(7) of Regulation S-X. The Chairman of the Audit Committee may grant pre-approval for engagements of $5,000 or less. All such delegated pre-approvals will be presented to the Audit Committee no later than the next Audit Committee meeting.
Pursuant to the Charter, the Audit Committee is also responsible for pre-approving any engagement of the principal accountant, including the fees and other compensation to be paid to the principal accountant, to provide non-audit services to the registrant’s investment adviser (or any entity controlling, controlled by, or under common control with the adviser that provides ongoing services to the registrant), if the engagement relates directly to the operations and financial reporting of the registrant, to the extent required by Rule 2-01(c)(7) of Regulation S-X. The Chairman of the Audit Committee may grant pre-approval for engagements of $5,000 or less. All such delegated pre-approvals will be presented to the Audit Committee no later than the next Audit Committee meeting.
(e)(2) The percentage of services described in each of paragraphs (b) through (d) of this Item that were approved by the Audit Committee pursuant to paragraph (c)(7)(i)(C) of Rule 2-01 of Regulation S-X is 100%.
| (f) | Not applicable. |
Table of Contents
| (g) | Non-Audit Fees |
For the fiscal years ended December 31, 2002 and 2003, E&Y billed the registrant $17,500 and $18,750, respectively, in aggregate non-audit fees. For the fiscal years ended December 31, 2002 and 2003, E&Y billed DCM or DSC $31,450 and $52,850, respectively, in aggregate non-audit fees.
(h) The registrant’s Audit Committee has considered whether the provision of non-audit services that were rendered to DCM or DSC that were not pre-approved pursuant to Rule 2-01(c)(7)(ii) of Regulation S-X is compatible with maintaining E&Y’s independence.
Item 5. Audit Committee of Listed Registrants.
Not applicable.
Item 6. [Reserved]
Item 7. Disclosure of Proxy Voting Policies and Procedures for Closed-End Management Investment Companies.
Not applicable.
Item 8. Purchases of Equity Securities by Closed-End Management Investment Company and Affiliated Purchasers.
Not applicable.
Table of Contents
Item 9. Controls and Procedures.
| (a) | The registrant’s principal executive and principal financial officers, or persons performing similar functions, have concluded that the registrant’s disclosure controls and procedures (as defined in Rule 30a-3(c) under the Investment Company Act of 1940, as amended (the “1940 Act”) (17 CFR 270.30a-3(c))) are effective, as of a date within 90 days of the filing date of the report that includes the disclosure required by this paragraph, based on their evaluation of these controls and procedures required by Rule 30a-3(b) under the 1940 Act (17 CFR 270.30a-3(b)) and Rules 13a-15(b) or 15d-15(b) under the Securities Exchange Act of 1934, as amended (17 CFR 240.13a-15(b) or 240.15d-15(b)). | |||
| (b) | There were no changes in the registrant’s internal control over financial reporting (as defined in Rule 30a-3(d) under the 1940 Act (17 CFR 270.30a-3(d)) that occurred during the registrant’s second fiscal half-year that have materially affected, or are reasonably likely to materially affect, the registrant’s internal control over financial reporting. | |||
Item 10. Exhibits.
| (a)(1) | Code of ethics that is the subject of disclosure required by Item 2 is attached hereto. | |
| (a)(2) | Certifications pursuant to Section 302 of the Sarbanes-Oxley Act of 2002 are attached hereto. | |
| (a)(3) | Not applicable. | |
| (b) | Certifications pursuant to Section 906 of the Sarbanes-Oxley Act of 2002 are attached hereto. |
Table of Contents
SIGNATURES
Pursuant to the requirements of the Securities Exchange Act of 1934 and the Investment Company Act of 1940, the registrant has duly caused this report to be signed on its behalf by the undersigned, thereunto duly authorized.
| (registrant) | Driehaus Mutual Funds | |
| By (Signature and Title)* | /s/ Richard H. Driehaus | |
| Richard H. Driehaus, Chairman of the Board & President | ||
| (principal executive officer) |
| Date | March 1, 2004 | |
Pursuant to the requirements of the Securities Exchange Act of 1934 and the Investment Company Act of 1940, this report has been signed below by the following persons on behalf of the registrant and in the capacities and on the dates indicated.
| By (Signature and Title)* | /s/ Richard H. Driehaus | |
| Richard H. Driehaus, Chairman of the Board & President | ||
| (principal executive officer) |
| Date | March 1, 2004 | |
| By (Signature and Title)* | /s/ Michelle L. Cahoon | |
| Michelle L. Cahoon, Treasurer | ||
| (principal financial officer) |
| Date | March 1, 2004 | |
* Print the name and title of each signing officer under his or her signature.