UNITED STATES
SECURITIES AND EXCHANGE COMMISSION
Washington, D.C. 20549
FORM N-CSR
CERTIFIED SHAREHOLDER REPORT OF REGISTERED MANAGEMENT INVESTMENT
COMPANIES
Investment Company Act file number 811-07655
Driehaus Mutual Funds
(Exact name of registrant as specified in charter)
25 East Erie Street
Chicago, IL 60611
(Address of principal executive offices) (Zip code)
Janet L. McWilliams
Driehaus Capital Management LLC
25 East Erie Street
Chicago, IL 60611
(Name and address of agent for service)
Registrant's telephone number, including area code: 312-587-3800
Date of fiscal year end: December 31
Date of reporting period: December 31, 2022
| Item 1. | Reports to Stockholders. |
| (a) | The Reports to Shareholders are attached herewith. |

 |  |  |
| Howard Schwab Lead Portfolio Manager | Chad Cleaver Portfolio Manager | Rich Thies Portfolio Manager |
| Average Annual Total Returns as of 12/31/22 | 1 Year | 3 Years | 5 Years | 10 Years |
| Driehaus Emerging Markets Growth Fund Investor Class (DREGX) | -22.54% | -1.10% | 0.31% | 3.46% |
| Driehaus Emerging Markets Growth Fund Institutional Class (DIEMX)1 | -22.36% | -0.87% | 0.53% | 3.58% |
| MSCI Emerging Markets Index-N2 | -20.09% | -2.69% | -1.40% | 1.44% |
| MSCI Emerging Markets Growth Index-N3 | -23.96% | -2.93% | -1.33% | 2.68% |
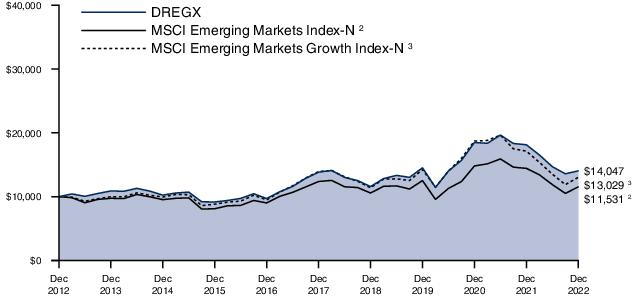
| 1 | The returns for the periods prior to July 17, 2017 (institutional share class inception date) include the performance of the investor share class. |
| 2 | The Morgan Stanley Capital International Emerging Markets Index-Net (MSCI Emerging Markets Index-N) is a market capitalization-weighted index designed to measure equity market performance in emerging markets. Data is in U.S. dollars and is calculated with net dividend reinvestment. Source: Morgan Stanley Capital International Inc. |
| 3 | The Morgan Stanley Capital International Emerging Markets Growth Index-Net (MSCI Emerging Markets Growth Index-N) is a subset of the MSCI Emerging Markets Index and includes only the MSCI Emerging Markets Index stocks which are categorized as growth stocks. Data is in U.S. dollars and is calculated with net dividend reinvestment. Source: Morgan Stanley Capital International Inc. |
| Shares, Principal Amount, or Number of Contracts | Value | |
| COMMON STOCKS — 94.83% | ||
| FAR EAST — 69.87% | ||
| China — 26.38% | ||
| AIA Group Ltd. | 3,936,200 | $43,772,257 |
| Aier Eye Hospital Group Co. Ltd. - A | 1,538,516 | 6,876,259 |
| Alibaba Group Holding Ltd. * | 5,038,200 | 55,671,966 |
| BeiGene Ltd. * | 504,500 | 8,673,927 |
| Beijing Oriental Yuhong Waterproof Technology Co. Ltd. - A | 2,202,500 | 10,635,949 |
| China Resources Land Ltd. | 3,540,000 | 16,213,671 |
| ENN Energy Holdings Ltd. | 836,000 | 11,738,670 |
| Foshan Haitian Flavouring & Food Co. Ltd. - A | 931,232 | 10,663,013 |
| Futu Holdings Ltd. - ADR 1,* | 94,786 | 3,853,051 |
| Galaxy Entertainment Group Ltd. | 3,251,000 | 21,491,599 |
| Haidilao International Holding Ltd. 2,* | 3,021,000 | 8,669,635 |
| Industrial & Commercial Bank of China Ltd. - H | 60,252,000 | 31,031,272 |
| JD Health International, Inc. 2,* | 1,195,100 | 10,924,467 |
| Jiangsu Hengli Hydraulic Co. Ltd. - A | 1,821,432 | 16,546,087 |
| Kweichow Moutai Co. Ltd. - A | 57,810 | 14,361,648 |
| Li Ning Co. Ltd. | 1,670,500 | 14,499,660 |
| Meituan - B 2,* | 1,880,900 | 42,097,923 |
| New Oriental Education & Technology Group, Inc. - SP ADR 1,* | 237,482 | 8,269,123 |
| Offcn Education Technology Co. Ltd. - A * | 19,924,985 | 13,270,521 |
| Pinduoduo, Inc. - ADR 1,* | 98,490 | 8,031,859 |
| Ping An Insurance Group Co. of China Ltd. - H | 5,641,000 | 37,327,463 |
| Proya Cosmetics Co. Ltd. - A | 1,306,583 | 31,478,131 |
| Shenzhen Inovance Technology Co. Ltd. - A | 1,056,109 | 10,558,507 |
| Shenzhen Mindray Bio-Medical Electronics Co. Ltd. - A | 420,619 | 19,118,055 |
| Super Hi International Holding Ltd. * | 176,000 | 224,131 |
| Suzhou Maxwell Technologies Co. Ltd. - A | 139,140 | 8,243,080 |
| Tencent Holdings Ltd. | 1,266,645 | 54,200,518 |
| Trip.com Group Ltd. - ADR 1,* | 702,910 | 24,180,104 |
| 542,622,546 | ||
| India — 16.43% | ||
| Bharat Electronics Ltd. | 9,962,567 | 12,030,224 |
| Bharat Forge Ltd. | 847,104 | 9,009,120 |
| Bharti Airtel Ltd. | 1,633,764 | 15,918,979 |
| Cipla Ltd. | 1,628,951 | 21,185,420 |
| Dabur India Ltd. | 1,454,733 | 9,872,596 |
| DLF Ltd. | 4,130,386 | 18,722,286 |
| HDFC Bank Ltd. - ADR 1 | 309,469 | 21,170,774 |
| Shares, Principal Amount, or Number of Contracts | Value | |
| Housing Development Finance Corp. Ltd. | 936,970 | $29,872,502 |
| ICICI Bank Ltd. - SP ADR 1 | 2,021,970 | 44,260,923 |
| KPIT Technologies Ltd. | 1,350,467 | 11,496,028 |
| Larsen & Toubro Ltd. | 984,205 | 24,813,910 |
| Max Healthcare Institute Ltd. * | 2,074,021 | 11,019,412 |
| Power Grid Corp. of India Ltd. | 4,773,920 | 12,331,521 |
| Reliance Industries Ltd. | 1,389,024 | 42,767,097 |
| State Bank of India | 3,490,971 | 25,896,397 |
| Sun Pharmaceutical Industries Ltd. | 1,744,833 | 21,120,220 |
| Tata Consultancy Services Ltd. | 164,639 | 6,481,081 |
| 337,968,490 | ||
| South Korea — 10.58% | ||
| Hanwha Solutions Corp. * | 529,000 | 18,088,447 |
| Hyundai Mipo Dockyard Co. Ltd. | 259,474 | 17,374,424 |
| KB Financial Group, Inc. | 435,594 | 16,688,762 |
| KT Corp. | 838,722 | 22,448,641 |
| LG Energy Solution Ltd. * | 39,740 | 13,696,665 |
| Macquarie Korea Infrastructure Fund | 1,130,245 | 9,916,160 |
| Samsung Biologics Co. Ltd. 2,* | 10,320 | 6,710,222 |
| Samsung Electronics Co. Ltd. | 2,169,784 | 95,238,857 |
| SK Hynix, Inc. | 292,479 | 17,450,482 |
| 217,612,660 | ||
| Taiwan — 8.28% | ||
| Chailease Holding Co. Ltd. | 1 | 7 |
| Chunghwa Telecom Co. Ltd. | 2,870,000 | 10,551,642 |
| Delta Electronics, Inc. | 2,367,000 | 22,063,916 |
| Hon Hai Precision Industry Co. Ltd. | 4,121,000 | 13,394,540 |
| Largan Precision Co. Ltd. | 127,000 | 8,429,341 |
| Sinbon Electronics Co. Ltd. | 739,000 | 6,612,061 |
| Taiwan Semiconductor Manufacturing Co. Ltd. - SP ADR 1 | 1,467,094 | 109,283,832 |
| 170,335,339 | ||
| Indonesia — 3.34% | ||
| Bank Central Asia Tbk PT | 37,114,875 | 20,384,274 |
| Bank Mandiri Persero Tbk PT | 43,874,100 | 27,971,764 |
| Telkom Indonesia Persero Tbk PT | 50,076,200 | 12,062,679 |
| United Tractors Tbk PT | 4,983,200 | 8,346,680 |
| 68,765,397 | ||
| Thailand — 2.94% | ||
| Airports of Thailand PCL - NVDR * | 9,863,300 | 21,358,380 |
| Energy Absolute PCL - NVDR | 6,079,000 | 17,025,062 |
| PTT Exploration & Production PCL - NVDR | 1,770,300 | 9,021,451 |
| SCB X PCL - NVDR | 4,185,500 | 12,930,518 |
| 60,335,411 | ||
| Singapore — 1.35% | ||
| United Overseas Bank Ltd. | 730,000 | 16,732,119 |
| Shares, Principal Amount, or Number of Contracts | Value | |
| Yangzijiang Shipbuilding Holdings Ltd. | 10,897,800 | $11,065,408 |
| 27,797,527 | ||
| Vietnam — 0.34% | ||
| Masan Group Corp. | 1,769,080 | 6,978,767 |
| Philippines — 0.23% | ||
| International Container Terminal Services, Inc. | 1,293,697 | 4,643,067 |
| Total FAR EAST (Cost $1,262,408,194) | 1,437,059,204 | |
| NORTH AMERICA — 8.97% | ||
| United States — 4.81% | ||
| Coupang, Inc. * | 739,930 | 10,884,370 |
| Globant SA 1,* | 55,741 | 9,373,407 |
| Hecla Mining Co. | 2,074,756 | 11,535,643 |
| MELI Kaszek Pioneer Corp. - A 1,* | 896,061 | 8,933,728 |
| MercadoLibre, Inc. * | 19,603 | 16,588,843 |
| Parade Technologies Ltd. | 534,000 | 13,430,138 |
| Samsonite International SA 2,* | 6,336,300 | 16,682,057 |
| Yum China Holdings, Inc. | 211,241 | 11,544,321 |
| 98,972,507 | ||
| Mexico — 3.65% | ||
| America Movil SAB de CV - SP ADR - L 1 | 556,683 | 10,131,630 |
| Arca Continental SAB de CV | 1,510,500 | 12,250,503 |
| Corp Inmobiliaria Vesta SAB de CV | 5,948,400 | 14,096,791 |
| Grupo Financiero Banorte SAB de CV - O | 5,340,092 | 38,431,453 |
| 74,910,377 | ||
| Canada — 0.51% | ||
| Ivanhoe Mines Ltd. - A * | 1,327,900 | 10,493,744 |
| Total NORTH AMERICA (Cost $171,679,242) | 184,376,628 | |
| SOUTH AMERICA — 6.97% | ||
| Brazil — 5.96% | ||
| Ambev SA - ADR 1,* | 6,670,077 | 18,142,610 |
| Banco do Brasil SA | 987,200 | 6,386,617 |
| Equatorial Energia SA | 2,817,900 | 14,433,558 |
| Iguatemi SA | 1,857,700 | 6,491,186 |
| Localiza Rent a Car SA | 615,300 | 6,109,778 |
| Minerva SA | 1,508,000 | 3,700,924 |
| Petro Rio SA * | 2,402,300 | 16,921,235 |
| Rumo SA | 2,840,000 | 10,031,487 |
| SLC Agricola SA | 1,562,314 | 13,856,269 |
| Vale SA - SP ADR 1 | 849,636 | 14,418,323 |
| WEG SA | 1,674,900 | 12,166,955 |
| 122,658,942 | ||
| Peru — 1.01% | ||
| Credicorp Ltd. 1 | 152,525 | 20,691,541 |
| Total SOUTH AMERICA (Cost $141,322,088) | 143,350,483 | |
| Shares, Principal Amount, or Number of Contracts | Value | |
| MIDDLE EAST — 6.44% | ||
| Saudi Arabia — 2.66% | ||
| Dr Sulaiman Al Habib Medical Services Group Co. | 155,232 | $9,064,982 |
| Nahdi Medical Co. | 218,093 | 9,680,698 |
| Saudi Arabian Oil Co. 2 | 3,384,804 | 29,054,936 |
| Saudi Telecom Co. | 706,825 | 6,878,260 |
| 54,678,876 | ||
| United Arab Emirates — 2.06% | ||
| Abu Dhabi National Oil Co for Distribution PJSC | 11,375,631 | 13,659,678 |
| Abu Dhabi Ports Co. PJSC * | 5,276,411 | 8,246,637 |
| Dubai Electricity & Water Authority PJSC | 20,458,334 | 12,923,633 |
| Emaar Properties PJSC | 4,728,777 | 7,545,236 |
| 42,375,184 | ||
| Qatar — 1.09% | ||
| Qatar Gas Transport Co. Ltd. | 9,046,910 | 9,124,009 |
| Qatar National Bank QPSC | 2,683,796 | 13,303,132 |
| 22,427,141 | ||
| Israel — 0.63% | ||
| Elbit Systems Ltd. | 79,346 | 12,904,183 |
| Total MIDDLE EAST (Cost $144,437,159) | 132,385,384 | |
| EUROPE — 1.73% | ||
| Netherlands — 0.79% | ||
| ASML Holding NV 1 | 29,915 | 16,345,556 |
| Jersey, C.I. — 0.51% | ||
| Glencore PLC | 1,558,893 | 10,410,662 |
| Greece — 0.43% | ||
| OPAP SA | 626,899 | 8,878,178 |
| Russia — 0.00% | ||
| Polyus PJSC 1,*,^ | 63,751 | 0 |
| Total EUROPE (Cost $46,199,534) | 35,634,396 | |
| AFRICA — 0.85% | ||
| South Africa — 0.85% | ||
| Standard Bank Group Ltd. | 1,777,181 | 17,549,809 |
| Total AFRICA (Cost $17,847,996) | 17,549,809 | |
| Total COMMON STOCKS (Cost $1,783,894,213) | 1,950,355,904 | |
| Shares, Principal Amount, or Number of Contracts | Value | ||
| SHORT TERM INVESTMENTS — 5.06% | |||
| Northern Institutional U.S. Government Select Portfolio (Shares Class), 3.61% 3 (Cost $104,173,837) | 104,173,837 | $104,173,837 | |
| TOTAL INVESTMENTS (Cost $1,888,068,050) | 99.89% | $2,054,529,741 | |
| Other Assets In Excess of Liabilities | 0.11% | 2,185,511 | |
| Net Assets | 100.00% | $2,056,715,252 | |
| ADR | American Depositary Receipt |
| NVDR | Non-Voting Depositary Receipt |
| PCL | Public Company Limited |
| PJSC | Public Joint Stock Company |
| PLC | Public Limited Company |
| SP ADR | Sponsored American Depositary Receipt |
| 1 | Foreign security denominated and/or traded in U.S. dollars. |
| 2 | Security is exempt from registration under Rule 144A of the Securities Act of 1933, as amended. The total value of these securities is $114,139,240, which represents 6% of Net Assets (see Note F in the Notes to Financial Statements). |
| 3 | 7 day current yield as of December 31, 2022 is disclosed. |
| ^ | Security valued at fair value as determined in good faith by the Adviser, in accordance with procedures established by, and under the general supervision of, the Trust’s Board of Trustee. The security is valued using significant unobservable inputs. |
| * | Non-income producing security. |
| Security Type | Percent of Net Assets | |
| Common Stocks | 94.83% | |
| Short Term Investments | 5.06% | |
| Total Investments | 99.89% | |
| Other Assets In Excess of Liabilities | 0.11% | |
| Net Assets | 100.00% |
| Regional Weightings | Percent of Net Assets | |
| Far East | 69.87% | |
| North America | 14.03% | |
| South America | 6.97% | |
| Middle East | 6.44% | |
| Europe | 1.73% | |
| Africa | 0.85% |
| Industry | Percent of Net Assets | |
| Aerospace & Defense | 1.21% | |
| Auto Components | 0.44% | |
| Banks | 15.24% | |
| Beverages | 2.18% | |
| Biotechnology | 0.42% | |
| Capital Markets | 0.67% | |
| Chemicals | 0.88% | |
| Construction & Engineering | 1.21% | |
| Construction Materials | 0.52% | |
| Diversified Consumer Services | 1.05% | |
| Diversified Financial Services | 1.45% | |
| Diversified Telecommunication Services | 2.53% | |
| Electric Utilities | 1.30% | |
| Electrical Equipment | 1.66% | |
| Electronic Equipment, Instruments & Components | 2.45% | |
| Food & Staples Retailing | 0.47% | |
| Food Products | 1.71% | |
| Gas Utilities | 0.57% | |
| Health Care Equipment & Supplies | 0.93% | |
| Health Care Providers & Services | 1.31% | |
| Holding Companies - Diversified | 0.43% | |
| Hotels, Restaurants & Leisure | 3.64% | |
| Independent Power and Renewable Electricity Producers | 0.83% |
| Industry | Percent of Net Assets | |
| Insurance | 3.94% | |
| Interactive Media & Services | 2.64% | |
| Internet & Direct Marketing Retail | 7.02% | |
| IT Services | 0.77% | |
| Life Sciences Tools & Services | 0.33% | |
| Machinery | 2.69% | |
| Metals & Mining | 2.28% | |
| Money Market Fund | 6.12% | |
| Multi-Utilities | 0.63% | |
| Oil, Gas & Consumable Fuels | 5.59% | |
| Personal Products | 2.01% | |
| Pharmaceuticals | 2.06% | |
| Real Estate Management & Development | 2.02% | |
| Road & Rail | 0.79% | |
| Semiconductors & Semiconductor Equipment | 7.61% | |
| Software | 0.56% | |
| Specialty Retail | 0.66% | |
| Technology Hardware, Storage & Peripherals | 4.63% | |
| Textiles, Apparel & Luxury Goods | 1.51% | |
| Transportation Infrastructure | 1.67% | |
| Wireless Telecommunication Services | 1.26% | |
| Other Assets In Excess of Liabilities | 0.11% | |
| TOTAL | 100.00% |
| | |
| Chad Cleaver, CFA Lead Portfolio Manager | Howard Schwab Portfolio Manager | Rich Thies Portfolio Manager |
| Average Annual Total Returns as of 12/31/22 | 1 Year | 3 Years | 5 Years | 10 Years |
| Driehaus Emerging Markets Small Cap Growth Fund (DRESX)1 | -21.17% | 6.87% | 4.40% | 4.71% |
| MSCI Emerging Markets Small Cap Index-N2 | -18.02% | 5.11% | 1.06% | 3.21% |
| MSCI Emerging Markets Small Cap Growth Index-N3 | -23.25% | 5.08% | 0.79% | 2.60% |
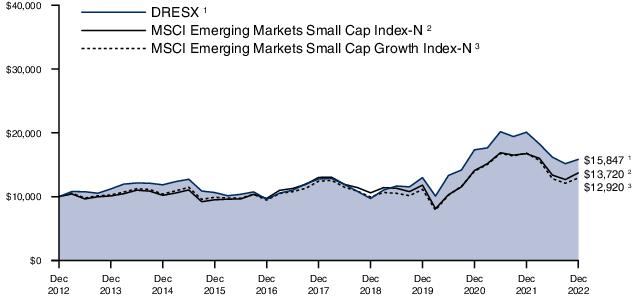
| 1 | The returns reflect fee waivers and/or reimbursements without which performance would have been lower. |
| 2 | The Morgan Stanley Capital International Emerging Markets Small Cap Index-Net (MSCI Emerging Markets Small Cap Index-N) is a market capitalization-weighted index designed to measure equity market performance of small cap stocks in emerging markets. Data is in U.S. dollars and is calculated with net dividend reinvestment. Source: Morgan Stanley Capital International Inc. |
| 3 | The Morgan Stanley Capital International Emerging Markets Small Cap Growth Index-Net (MSCI Emerging Markets Small Cap Growth Index-N) is a market capitalization-weighted index designed to measure equity market performance of small cap growth stocks in emerging markets. Data is in U.S. dollars and is calculated with net dividend reinvestment. Source: Morgan Stanley Capital International Inc. |
| Shares, Principal Amount, or Number of Contracts | Value | |
| COMMON STOCKS — 93.75% | ||
| FAR EAST — 73.46% | ||
| China — 28.84% | ||
| Akeso, Inc. - B 1,* | 288,000 | $1,586,584 |
| Bethel Automotive Safety Systems Co. Ltd. - A | 67,206 | 771,472 |
| Bosideng International Holdings Ltd. | 2,468,000 | 1,173,062 |
| Centre Testing International Group Co. Ltd. - A | 189,500 | 607,887 |
| China Meidong Auto Holdings Ltd. | 416,000 | 853,803 |
| Estun Automation Co. Ltd. - A | 199,678 | 622,728 |
| Hygeia Healthcare Holdings Co. Ltd. 1,* | 296,600 | 2,127,949 |
| Innovent Biologics, Inc. 1,* | 272,500 | 1,169,535 |
| Jiangsu Hengli Hydraulic Co. Ltd. - A | 187,350 | 1,701,908 |
| Jiumaojiu International Holdings Ltd. 1 | 463,000 | 1,236,770 |
| Longshine Technology Group Co. Ltd. - A | 153,125 | 484,153 |
| Man Wah Holdings Ltd. | 782,800 | 779,245 |
| Milkyway Chemical Supply Chain Service Co. Ltd. - A | 38,500 | 646,088 |
| Ming Yang Smart Energy Group Ltd. - A | 415,800 | 1,510,869 |
| Nantong Jianghai Capacitor Co. Ltd. - A | 254,300 | 818,317 |
| Ningbo Orient Wires & Cables Co. Ltd. - A | 113,200 | 1,104,529 |
| Offcn Education Technology Co. Ltd. - A * | 1,069,600 | 712,379 |
| Pacific Basin Shipping Ltd. | 2,439,000 | 824,931 |
| Proya Cosmetics Co. Ltd. - A | 92,020 | 2,216,941 |
| Shenzhen Kedali Industry Co. Ltd. - A | 47,100 | 804,976 |
| Silergy Corp. | 74,000 | 1,050,935 |
| SITC International Holdings Co. Ltd. | 428,000 | 951,909 |
| Sunresin New Materials Co. Ltd. - A | 189,944 | 1,901,435 |
| Suzhou Maxwell Technologies Co. Ltd. - A | 20,380 | 1,207,374 |
| Wuhan DR Laser Technology Corp. Ltd. - A | 41,600 | 754,003 |
| Yangtze Optical Fibre and Cable Joint Stock Ltd. Co. - H 1 | 650,000 | 1,157,525 |
| Yihai International Holding Ltd. * | 233,000 | 823,886 |
| 29,601,193 | ||
| India — 22.27% | ||
| APL Apollo Tubes Ltd. | 75,927 | 1,002,203 |
| AU Small Finance Bank Ltd. 1 | 199,545 | 1,578,535 |
| Bharat Forge Ltd. | 95,660 | 1,017,363 |
| Campus Activewear Ltd. * | 142,931 | 714,137 |
| Devyani International Ltd. * | 324,351 | 708,648 |
| Dixon Technologies India Ltd. | 24,638 | 1,162,837 |
| Shares, Principal Amount, or Number of Contracts | Value | |
| Gujarat Fluorochemicals Ltd. | 20,074 | $754,819 |
| Indian Hotels Co. Ltd. | 131,901 | 508,041 |
| KPIT Technologies Ltd. | 275,917 | 2,348,780 |
| Max Healthcare Institute Ltd. * | 418,607 | 2,224,087 |
| Motherson Sumi Wiring India Ltd. | 1,680,483 | 1,184,240 |
| Navin Fluorine International Ltd. | 24,570 | 1,208,527 |
| Oberoi Realty Ltd. | 99,520 | 1,044,100 |
| PB Fintech Ltd. * | 181,608 | 984,103 |
| Praj Industries Ltd. | 193,832 | 834,441 |
| Prestige Estates Projects Ltd. | 181,278 | 1,015,731 |
| Rainbow Children's Medicare Ltd. | 111,279 | 994,288 |
| Syngene International Ltd. 1 | 182,927 | 1,294,729 |
| TVS Motor Co. Ltd. | 97,090 | 1,273,800 |
| Varun Beverages Ltd. | 62,913 | 1,005,749 |
| 22,859,158 | ||
| Taiwan — 6.57% | ||
| ASPEED Technology, Inc. | 22,700 | 1,244,473 |
| Gloria Material Technology Corp. | 433,000 | 523,367 |
| Lotes Co. Ltd. | 45,000 | 1,209,351 |
| Sinbon Electronics Co. Ltd. | 180,000 | 1,610,515 |
| Voltronic Power Technology Corp. | 25,550 | 1,284,337 |
| Yageo Corp. | 59,000 | 865,742 |
| 6,737,785 | ||
| Vietnam — 5.60% | ||
| FPT Corp. | 660,680 | 2,305,948 |
| Masan Group Corp. | 278,280 | 1,097,775 |
| Military Commercial Joint Stock Bank * | 669,588 | 519,680 |
| Mobile World Investment Corp. | 936,000 | 1,822,490 |
| 5,745,893 | ||
| South Korea — 5.08% | ||
| Hanwha Solutions Corp. * | 35,380 | 1,209,772 |
| Hyundai Mipo Dockyard Co. Ltd. | 16,892 | 1,131,091 |
| LEENO Industrial, Inc. | 9,687 | 1,197,024 |
| POSCO Chemical Co. Ltd. | 4,564 | 652,003 |
| Samsung Engineering Co. Ltd. * | 57,753 | 1,021,694 |
| 5,211,584 | ||
| Indonesia — 2.41% | ||
| Merdeka Copper Gold Tbk PT * | 6,252,000 | 1,654,616 |
| Sumber Alfaria Trijaya Tbk PT | 4,798,200 | 816,781 |
| 2,471,397 | ||
| Thailand — 1.72% | ||
| Bangchak Corp PCL - NVDR | 780,800 | 710,125 |
| Thai Oil PCL - NVDR | 651,500 | 1,058,088 |
| 1,768,213 | ||
| Cambodia — 0.53% | ||
| NagaCorp Ltd. * | 613,339 | 540,619 |
| Shares, Principal Amount, or Number of Contracts | Value | |
| Philippines — 0.44% | ||
| Wilcon Depot, Inc. | 861,200 | $456,545 |
| Total FAR EAST (Cost $71,307,276) | 75,392,387 | |
| SOUTH AMERICA — 9.46% | ||
| Brazil — 8.43% | ||
| Arezzo Industria e Comercio SA | 28,000 | 415,293 |
| Cia Brasileira de Aluminio | 524,600 | 1,131,151 |
| Lojas Renner SA * | 230,300 | 892,606 |
| Orizon Valorizacao de Residuos SA * | 140,000 | 897,072 |
| Petro Rio SA * | 197,700 | 1,392,552 |
| Petroreconcavo SA | 189,500 | 1,184,547 |
| SLC Agricola SA | 162,000 | 1,436,789 |
| Vamos Locacao de Caminhoes Maquinas e Equipamentos SA * | 545,000 | 1,304,665 |
| 8,654,675 | ||
| Argentina — 1.03% | ||
| Pampa Energia SA - SP ADR 2,* | 32,956 | 1,052,615 |
| Total SOUTH AMERICA (Cost $8,461,212) | 9,707,290 | |
| MIDDLE EAST — 7.12% | ||
| Saudi Arabia — 3.57% | ||
| Abdullah Al Othaim Markets Co. | 18,191 | 504,717 |
| Arabian Drilling Co. * | 24,855 | 744,724 |
| Leejam Sports Co. JSC | 23,242 | 520,143 |
| Nahdi Medical Co. | 42,681 | 1,894,522 |
| 3,664,106 | ||
| United Arab Emirates — 2.62% | ||
| Abu Dhabi Ports Co. PJSC * | 807,845 | 1,262,601 |
| Emirates Central Cooling Systems Corp. * | 3,688,182 | 1,426,025 |
| 2,688,626 | ||
| Qatar — 0.93% | ||
| Qatar Gas Transport Co. Ltd. | 948,814 | 956,900 |
| Total MIDDLE EAST (Cost $7,512,080) | 7,309,632 | |
| NORTH AMERICA — 3.71% | ||
| Canada — 2.23% | ||
| Filo Mining Corp. * | 44,900 | 770,662 |
| Ivanhoe Mines Ltd. - A * | 191,494 | 1,513,283 |
| 2,283,945 | ||
| United States — 0.92% | ||
| Parade Technologies Ltd. | 37,455 | 941,996 |
| Mexico — 0.56% | ||
| FIBRA Macquarie Mexico 1 | 393,400 | 579,405 |
| Total NORTH AMERICA (Cost $3,191,996) | 3,805,346 | |
| Total COMMON STOCKS (Cost $90,472,564) | 96,214,655 | |
| Shares, Principal Amount, or Number of Contracts | Value | ||
| PREFERRED STOCKS — 0.86% | |||
| SOUTH AMERICA — 0.86% | |||
| Brazil — 0.86% | |||
| Bradespar SA, 2.74% 3 | 158,500 | $883,217 | |
| Total SOUTH AMERICA (Cost $789,301) | 883,217 | ||
| Total PREFERRED STOCKS (Cost $789,301) | 883,217 | ||
| SHORT TERM INVESTMENTS — 6.56% | |||
| Northern Institutional U.S. Government Select Portfolio (Shares Class), 3.61% 4 (Cost $6,732,347) | 6,732,347 | 6,732,347 | |
| TOTAL INVESTMENTS (Cost $97,994,212) | 101.17% | $103,830,219 | |
| Liabilities in Excess of Other Assets | (1.17)% | (1,201,414) | |
| Net Assets | 100.00% | $102,628,805 | |
| JSC | Joint Stock Company |
| NVDR | Non-Voting Depositary Receipt |
| PCL | Public Company Limited |
| PJSC | Public Joint Stock Company |
| SP ADR | Sponsored American Depositary Receipt |
| 1 | Security is exempt from registration under Rule 144A of the Securities Act of 1933, as amended. The total value of these securities is $10,731,032, which represents 10% of Net Assets (see Note F in the Notes to Financial Statements). |
| 2 | Foreign security denominated and/or traded in U.S. dollars. |
| 3 | Current yield is disclosed. Dividends are calculated based on a percentage of the issuer’s net income. |
| 4 | 7 day current yield as of December 31, 2022 is disclosed. |
| * | Non-income producing security. |
| Security Type | Percent of Net Assets | |
| Common Stocks | 93.75% | |
| Preferred Stocks | 0.86% | |
| Short Term Investments | 6.56% | |
| Total Investments | 101.17% | |
| Liabilities In Excess of Other Assets | (1.17)% | |
| Net Assets | 100.00% |
| Regional Weightings | Percent of Net Assets | |
| Far East | 73.46% | |
| South America | 10.32% | |
| North America | 10.27% | |
| Middle East | 7.12% |
| Industry | Percent of Net Assets | |
| Air Freight & Logistics | 0.63% | |
| Auto Components | 3.67% | |
| Automobiles | 1.24% | |
| Banks | 2.05% | |
| Beverages | 0.98% | |
| Biotechnology | 2.69% | |
| Chemicals | 4.94% | |
| Commercial Services & Supplies | 0.87% | |
| Communications Equipment | 1.13% | |
| Construction & Engineering | 1.81% | |
| Construction Materials | 0.63% | |
| Diversified Consumer Services | 0.69% | |
| Electric Utilities | 1.03% | |
| Electrical Equipment | 5.78% | |
| Electronic Equipment, Instruments & Components | 3.60% | |
| Energy Equipment & Services | 0.72% | |
| Equity Real Estate Investment Trusts | 0.56% | |
| Food & Staples Retailing | 3.14% | |
| Food Products | 3.27% | |
| Health Care Providers & Services | 5.21% | |
| Hotels, Restaurants & Leisure | 3.43% | |
| Household Durables | 1.89% |
| Industry | Percent of Net Assets | |
| Insurance | 0.96% | |
| IT Services | 2.25% | |
| Life Sciences Tools & Services | 1.26% | |
| Machinery | 3.37% | |
| Marine | 1.73% | |
| Metals & Mining | 7.29% | |
| Money Market Fund | 6.56% | |
| Oil, Gas & Consumable Fuels | 5.16% | |
| Personal Products | 2.16% | |
| Professional Services | 0.59% | |
| Real Estate Management & Development | 2.01% | |
| Road & Rail | 1.27% | |
| Semiconductors & Semiconductor Equipment | 5.06% | |
| Software | 2.76% | |
| Specialty Retail | 3.91% | |
| Textiles, Apparel & Luxury Goods | 2.25% | |
| Transportation Infrastructure | 1.23% | |
| Water Utilities | 1.39% | |
| Liabilities In Excess of Other Assets | (1.17)% | |
| TOTAL | 100.00% |
| |
| Richard Thies Lead Portfolio Manager | Chad Cleaver Portfolio Manager |
|  |
| Howard Schwab Portfolio Manager | Jonathon Mershimer Assistant Portfolio Manager |
| Average Annual Total Returns as of 12/31/22 | 1 Year | 3 Years | 5 Years | Since Inception (4/10/17 - 12/31/22) |
| Driehaus Emerging Markets Opportunities Fund (DMAGX)1 | -18.86% | 1.64% | 2.08% | 5.28% |
| MSCI Emerging Markets Index-N2 | -20.09% | -2.69% | -1.40% | 2.37% |
| MSCI EM/JP Morgan GBI Blended Index3 | -15.67% | -4.12% | -1.71% | 1.01% |
| 1 | Prior to January 29, 2020, the Driehaus Emerging Markets Opportunities Fund was known as the Driehaus Multi-Asset Growth Economies Fund. The returns for the period reflect fee waivers and/or reimbursements without which performance would have been lower. |
| 2 | The Morgan Stanley Capital International Emerging Markets Index-Net (MSCI Emerging Markets Index-N) is a market capitalization-weighted index designed to measure equity market performance in emerging markets. Data is in U.S. dollars and is calculated with net dividend reinvestment. Source: Morgan Stanley Capital International Inc. |
| 3 | The MSCI EM/JPMorgan Government Bond Index Blended Index is an equally weighted benchmark comprised of 50 percent by the Morgan Stanley Capital International Emerging Markets Index-Net (MSCI EM) and 50 percent by the JPMorgan Global Bond Index Emerging Markets Global Diversified (JPMorgan GBI). The MSCI EM is a market capitalization-weighted index designed to measure equity market performance in emerging markets and the JPMorgan GBI tracks debt instruments in the emerging markets. Source: Morgan Stanley Capital International Inc. and JPMorgan. |
| Shares, Principal Amount, or Number of Contracts | Value | |
| SOVEREIGN BONDS — 20.40% | ||
| Brazil — 1.63% | ||
| Brazil Notas do Tesouro Nacional Serie F 10.00%, 1/1/27 1 | 2,000,000 | $347,738 |
| Brazil Notas do Tesouro Nacional Serie F 10.00%, 1/1/31 1 | 2,500,000 | 413,466 |
| 761,204 | ||
| Chile — 1.03% | ||
| Chile Government International Bond 3.24%, 2/6/28 2 | 250,000 | 231,945 |
| Chile Government International Bond 2.45%, 1/31/31 2 | 300,000 | 248,850 |
| 480,795 | ||
| China — 2.07% | ||
| China Government Bond 3.27%, 11/19/30 1 | 6,500,000 | 966,061 |
| Colombia — 0.49% | ||
| Colombia Government International Bond 3.00%, 1/30/30 2 | 300,000 | 229,430 |
| Czech Republic — 1.24% | ||
| Czech Republic Government Bond 2.40%, 9/17/25 1 | 10,000,000 | 411,015 |
| Czech Republic Government Bond 1.20%, 3/13/31 1 | 5,000,000 | 164,546 |
| 575,561 | ||
| Dominican Republic — 0.54% | ||
| Dominican Republic International Bond 4.88%, 9/23/32 2 | 300,000 | 249,023 |
| Egypt — 0.30% | ||
| Egypt Government International Bond 5.87%, 2/16/31 2 | 200,000 | 139,780 |
| Indonesia — 1.25% | ||
| Indonesia Treasury Bond 7.00%, 9/15/30 1 | 9,000,000,000 | 584,787 |
| Mexico — 3.65% | ||
| Mexican Bonos 7.75%, 5/29/31 1 | 5,000,000 | 237,636 |
| Mexican Bonos 8.50%, 11/18/38 1 | 11,000,000 | 534,648 |
| Mexico Government International Bond 4.50%, 4/22/29 2 | 260,000 | 247,526 |
| Mexico Government International Bond 4.87%, 5/19/33 2 | 300,000 | 275,452 |
| Shares, Principal Amount, or Number of Contracts | Value | |
| Petroleos Mexicanos 6.50%, 3/13/27 2 | 300,000 | $273,726 |
| Petroleos Mexicanos 6.70%, 2/16/32 2 | 169,000 | 132,732 |
| 1,701,720 | ||
| Oman — 1.54% | ||
| Oman Government International Bond 6.75%, 10/28/27 2 | 400,000 | 415,265 |
| Oman Government International Bond 6.00%, 8/1/29 2 | 300,000 | 301,851 |
| 717,116 | ||
| Panama — 0.64% | ||
| Panama Government International Bond 2.25%, 9/29/32 2 | 400,000 | 296,215 |
| Peru — 1.33% | ||
| Peruvian Government International Bond 6.95%, 8/12/31 1 | 2,500,000 | 619,842 |
| Poland — 0.64% | ||
| Republic of Poland Government Bond 1.75%, 4/25/32 1 | 2,000,000 | 300,090 |
| Qatar — 0.83% | ||
| Qatar Government International Bond 3.75%, 4/16/30 2 | 400,000 | 388,234 |
| Saudi Arabia — 1.73% | ||
| Saudi Government International Bond 3.25%, 10/22/30 2 | 500,000 | 457,525 |
| Saudi Government International Bond 2.75%, 2/3/32 2 | 400,000 | 349,465 |
| 806,990 | ||
| South Africa — 0.49% | ||
| Republic of South Africa Government Bond 8.50%, 1/31/37 1 | 4,900,000 | 228,919 |
| United Arab Emirates — 1.00% | ||
| Abu Dhabi Government International Bond 1.63%, 6/2/28 2 | 250,000 | 219,863 |
| Abu Dhabi Government International Bond 1.70%, 3/2/31 2 | 300,000 | 248,162 |
| 468,025 | ||
| Total SOVEREIGN BONDS (Cost $10,261,273) | 9,513,792 | |
| Shares, Principal Amount, or Number of Contracts | Value | |
| COMMON STOCKS — 70.84% | ||
| Argentina — 0.83% | ||
| Pampa Energia SA - SP ADR 2,* | 12,079 | $385,803 |
| Brazil — 4.68% | ||
| Banco do Brasil SA | 41,000 | 265,246 |
| Cia de Saneamento Basico do Estado de Sao Paulo * | 18,800 | 202,398 |
| Iguatemi SA | 58,600 | 204,760 |
| Lojas Renner SA * | 50,800 | 196,893 |
| Petro Rio SA * | 114,900 | 809,329 |
| Rumo SA | 54,700 | 193,212 |
| SLC Agricola SA | 35,200 | 312,191 |
| 2,184,029 | ||
| Canada — 1.28% | ||
| B2Gold Corp. | 64,300 | 228,422 |
| Ivanhoe Mines Ltd. - A * | 46,700 | 369,047 |
| 597,469 | ||
| China — 16.37% | ||
| AIA Group Ltd. | 51,200 | 569,366 |
| Alibaba Group Holding Ltd. * | 89,600 | 990,077 |
| BeiGene Ltd. - ADR 2,* | 934 | 205,424 |
| BYD Co. Ltd. - H | 6,561 | 161,893 |
| China Resources Beer Holdings Co. Ltd. | 46,000 | 321,481 |
| China Resources Land Ltd. | 80,000 | 366,411 |
| Innovent Biologics, Inc. 3,* | 98,000 | 420,604 |
| JD Health International, Inc. 3,* | 29,372 | 268,491 |
| JD.com, Inc. - A | 1,783 | 50,300 |
| KE Holdings, Inc. - ADR 2,* | 16,495 | 230,270 |
| Li Ning Co. Ltd. | 57,684 | 500,687 |
| Meituan - B 3,* | 34,452 | 771,098 |
| Ping An Insurance Group Co. of China Ltd. - H | 47,000 | 311,007 |
| Postal Savings Bank of China Co. Ltd. - H 3 | 792,000 | 492,118 |
| Tencent Holdings Ltd. | 30,053 | 1,285,986 |
| Trip.com Group Ltd. - ADR 2,* | 20,119 | 692,094 |
| 7,637,307 | ||
| France — 0.50% | ||
| L'Oreal SA | 651 | 232,473 |
| India — 10.14% | ||
| Apollo Hospitals Enterprise Ltd. | 4,666 | 252,538 |
| Bharti Airtel Ltd. | 46,201 | 450,171 |
| DLF Ltd. | 80,179 | 363,437 |
| HDFC Bank Ltd. - ADR 2,4 | 7,431 | 508,355 |
| Housing Development Finance Corp. Ltd. | 12,290 | 391,830 |
| ICICI Bank Ltd. - SP ADR 2 | 41,524 | 908,960 |
| KPIT Technologies Ltd. | 23,881 | 203,290 |
| MakeMyTrip Ltd. 2,* | 12,310 | 339,387 |
| Shares, Principal Amount, or Number of Contracts | Value | |
| Max Healthcare Institute Ltd. * | 57,668 | $306,394 |
| Power Grid Corp. of India Ltd. | 102,198 | 263,988 |
| Reliance Industries Ltd. | 24,096 | 741,899 |
| 4,730,249 | ||
| Indonesia — 2.19% | ||
| Bank Central Asia Tbk PT | 848,045 | 465,764 |
| Bank Negara Indonesia Persero Tbk PT | 941,200 | 557,737 |
| 1,023,501 | ||
| Mexico — 2.00% | ||
| America Movil SAB de CV - SP ADR - L 2 | 15,626 | 284,393 |
| Grupo Financiero Banorte SAB de CV - O | 89,371 | 643,183 |
| Sitios Latinoamerica SAB de CV * | 15,626 | 7,378 |
| 934,954 | ||
| Netherlands — 1.01% | ||
| ASML Holding NV | 876 | 472,420 |
| Peru — 0.55% | ||
| Credicorp Ltd. 2 | 1,880 | 255,041 |
| Qatar — 0.61% | ||
| Qatar National Bank QPSC | 57,501 | 285,023 |
| Saudi Arabia — 3.40% | ||
| Nahdi Medical Co. | 3,557 | 157,888 |
| Saudi Arabian Oil Co. 3 | 108,945 | 935,177 |
| Saudi Telecom Co. | 50,559 | 492,000 |
| 1,585,065 | ||
| Singapore — 0.82% | ||
| United Overseas Bank Ltd. | 16,600 | 380,484 |
| South Korea — 10.02% | ||
| Hankook Tire & Technology Co. Ltd. | 12,863 | 317,637 |
| Hyundai Mipo Dockyard Co. Ltd. | 4,806 | 321,810 |
| KB Financial Group, Inc. | 8,371 | 320,715 |
| Kia Corp. | 3,738 | 175,875 |
| LEENO Industrial, Inc. | 2,632 | 325,236 |
| LG Energy Solution Ltd. * | 1,410 | 485,966 |
| Macquarie Korea Infrastructure Fund | 44,563 | 390,972 |
| Samsung Card Co. Ltd. | 14,533 | 340,050 |
| Samsung Electronics Co. Ltd. | 39,540 | 1,735,539 |
| SK Hynix, Inc. | 4,341 | 259,002 |
| 4,672,802 | ||
| Taiwan — 7.14% | ||
| ASPEED Technology, Inc. | 4,000 | 219,290 |
| Delta Electronics, Inc. | 35,986 | 335,442 |
| Hon Hai Precision Industry Co. Ltd. | 121,103 | 393,623 |
| Shares, Principal Amount, or Number of Contracts | Value | |
| Sinbon Electronics Co. Ltd. | 40,136 | $359,109 |
| Taiwan Semiconductor Manufacturing Co. Ltd. | 138,668 | 2,023,478 |
| 3,330,942 | ||
| Thailand — 1.50% | ||
| Airports of Thailand PCL - NVDR * | 201,600 | 436,553 |
| PTT Exploration & Production PCL - NVDR | 51,400 | 261,934 |
| 698,487 | ||
| United Arab Emirates — 1.99% | ||
| Air Arabia PJSC | 983,661 | 575,851 |
| Dubai Electricity & Water Authority PJSC | 554,709 | 350,413 |
| 926,264 | ||
| United Kingdom — 0.61% | ||
| Network International Holdings PLC 3,* | 79,137 | 285,105 |
| United States — 5.20% | ||
| EPAM System, Inc. * | 522 | 171,080 |
| Liberty Media Corp.-Liberty Formula One - C 4,* | 6,877 | 411,107 |
| MELI Kaszek Pioneer Corp. - A 4,* | 18,498 | 184,425 |
| PriceSmart, Inc. | 6,121 | 372,035 |
| Samsonite International SA 3,* | 362,154 | 953,470 |
| Yum China Holdings, Inc. | 6,053 | 330,797 |
| 2,422,914 | ||
| Total COMMON STOCKS (Cost $29,311,591) | 33,040,332 | |
| Shares, Principal Amount, or Number of Contracts | Value | ||
| SHORT TERM INVESTMENTS — 7.62% | |||
| Northern Institutional U.S. Government Select Portfolio (Shares Class), 3.61% 5 (Cost $3,554,812) | 3,554,812 | $3,554,812 | |
| TOTAL INVESTMENTS (Cost $43,127,676) | 98.86% | $46,108,936 | |
| Other Assets in Excess of Liabilities | 1.14% | 533,377 | |
| Net Assets | 100.00% | $46,642,313 | |
| ADR | American Depositary Receipt |
| NVDR | Non-Voting Depositary Receipt |
| PCL | Public Company Limited |
| PJSC | Public Joint Stock Company |
| PLC | Public Limited Company |
| SP ADR | Sponsored American Depositary Receipt |
| 1 | Foreign security, par value shown in local currency. |
| 2 | Foreign security denominated and/or traded in U.S. dollars. |
| 3 | Security is exempt from registration under Rule 144A of the Securities Act of 1933, as amended. The total value of these securities is $4,126,063, which represents 9% of Net Assets (see Note F in the Notes to Financial Statements). |
| 4 | All or a portion of this security is pledged as collateral for short sales or derivatives transactions. |
| 5 | 7 day current yield as of December 31, 2022 is disclosed. |
| * | Non-income producing security. |
| Security Type | Percent of Net Assets | |
| Sovereign Bonds | 20.40% | |
| Common Stocks | 70.84% | |
| Short Term Investments | 7.62% | |
| Total Investments | 98.86% | |
| Other Assets In Excess of Liabilities | 1.14% | |
| Net Assets | 100.00% |
| Regional Weightings | Percent of Net Assets | |
| Far East | 51.50% | |
| North America | 20.29% | |
| Middle East | 11.10% | |
| South America | 10.54% | |
| Europe | 4.00% | |
| Africa | 0.79% | |
| Central America | 0.64% |
| Industry | Percent of Net Assets | |
| Airlines | 1.24% | |
| Auto Components | 0.68% | |
| Automobiles | 0.73% | |
| Banks | 10.90% | |
| Beverages | 0.69% | |
| Biotechnology | 1.34% | |
| Capital Markets | 0.84% | |
| Consumer Finance | 0.73% | |
| Diversified Financial Services | 0.84% | |
| Diversified Telecommunication Services | 1.06% | |
| Electric Utilities | 1.40% | |
| Electrical Equipment | 1.04% | |
| Electronic Equipment, Instruments & Components | 2.33% | |
| Entertainment | 0.88% | |
| Food & Staples Retailing | 1.14% | |
| Food Products | 0.67% | |
| Health Care Providers & Services | 1.20% | |
| Holding Companies - Diversified | 0.40% | |
| Hotels, Restaurants & Leisure | 2.92% | |
| Insurance | 1.89% | |
| Interactive Media & Services | 2.76% | |
| Internet & Direct Marketing Retail | 4.46% |
| Industry | Percent of Net Assets | |
| IT Services | 0.98% | |
| Machinery | 0.69% | |
| Metals & Mining | 1.28% | |
| Money Market Fund | 7.62% | |
| Multi-Utilities | 0.75% | |
| Oil, Gas & Consumable Fuels | 5.90% | |
| Personal Products | 0.50% | |
| Real Estate Management & Development | 2.50% | |
| Road & Rail | 0.41% | |
| Semiconductors & Semiconductor Equipment | 7.07% | |
| Software | 0.43% | |
| Sovereign Bonds | 20.40% | |
| Specialty Retail | 0.42% | |
| Technology Hardware, Storage & Peripherals | 3.72% | |
| Textiles, Apparel & Luxury Goods | 3.11% | |
| Transportation Infrastructure | 0.94% | |
| Water Utilities | 0.43% | |
| Wireless Telecommunication Services | 1.57% | |
| Other Assets In Excess of Liabilities | 1.14% | |
| TOTAL | 100.00% |
 |  |  |
| Daniel Burr Portfolio Manager | David Mouser Portfolio Manager | Ryan Carpenter Assistant Portfolio Manager |
| Average Annual Total Returns as of 12/31/22 | 1 Year | 3 Years | 5 Years | 10 Years |
| Driehaus International Small Cap Growth Fund (DRIOX) | -24.40% | 3.33% | 3.63% | 8.24% |
| MSCI AC World ex USA Small Cap Growth Index-N1 | -26.09% | 0.65% | 0.75% | 5.35% |
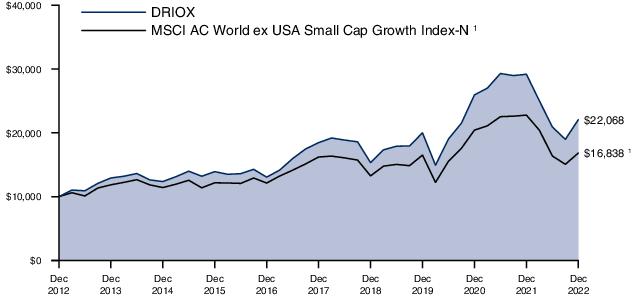
| 1 | The Morgan Stanley Capital International All Country World ex USA Small Cap Growth Index-Net (MSCI AC World ex USA Small Cap Growth Index-N) is a market capitalization-weighted index designed to measure equity market performance in global developed markets and emerging markets, excluding the U.S., and is composed of stocks which are categorized as small capitalization growth stocks. Data is in U.S. dollars and is calculated with net dividend reinvestment. Source: Morgan Stanley Capital International Inc. |
| Shares, Principal Amount, or Number of Contracts | Value | |
| COMMON STOCKS — 97.50% | ||
| EUROPE — 54.20% | ||
| United Kingdom — 13.39% | ||
| Abcam PLC 1,* | 307,651 | $4,787,050 |
| Balfour Beatty PLC | 425,961 | 1,738,524 |
| ConvaTec Group PLC 2 | 1,076,384 | 3,026,811 |
| Cranswick PLC | 26,495 | 985,918 |
| Ergomed PLC * | 74,879 | 1,151,478 |
| Genus PLC | 28,719 | 1,036,040 |
| Network International Holdings PLC 2,* | 299,027 | 1,077,296 |
| OSB Group PLC | 539,269 | 3,128,053 |
| Pets at Home Group PLC | 235,066 | 805,943 |
| RS GROUP PLC | 221,782 | 2,401,045 |
| Serco Group PLC | 2,155,194 | 4,048,981 |
| Trainline PLC 2,* | 295,156 | 979,852 |
| WH Smith PLC * | 143,813 | 2,580,992 |
| Yellow Cake PLC 2,* | 284,724 | 1,289,437 |
| 29,037,420 | ||
| Germany — 7.18% | ||
| Befesa SA 2 | 20,372 | 982,633 |
| Gerresheimer AG | 31,242 | 2,100,221 |
| GFT Technologies SE | 65,457 | 2,378,824 |
| HUGO BOSS AG | 51,131 | 2,964,349 |
| Nordex SE * | 169,021 | 2,388,257 |
| Rheinmetall AG | 11,889 | 2,367,780 |
| SMA Solar Technology AG * | 33,416 | 2,391,235 |
| 15,573,299 | ||
| France — 6.40% | ||
| Coface SA | 154,743 | 2,010,926 |
| Edenred | 42,606 | 2,320,515 |
| Gaztransport Et Technigaz SA | 20,101 | 2,147,408 |
| IPSOS | 53,227 | 3,333,146 |
| Vallourec SA * | 309,095 | 4,059,784 |
| 13,871,779 | ||
| Switzerland — 4.40% | ||
| Belimo Holding AG | 2,685 | 1,277,673 |
| Burckhardt Compression Holding AG | 2,646 | 1,576,754 |
| Flughafen Zurich AG * | 12,915 | 1,998,742 |
| Siegfried Holding AG * | 2,007 | 1,331,633 |
| Tecan Group AG | 7,506 | 3,347,725 |
| 9,532,527 | ||
| Sweden — 3.52% | ||
| Hexatronic Group AB | 368,946 | 5,004,797 |
| Kindred Group PLC | 164,332 | 1,710,274 |
| Note AB * | 52,853 | 906,644 |
| 7,621,715 | ||
| Netherlands — 2.98% | ||
| Corbion NV | 42,256 | 1,440,217 |
| Fugro NV * | 270,984 | 3,248,838 |
| OCI NV | 49,457 | 1,769,296 |
| 6,458,351 | ||
| Shares, Principal Amount, or Number of Contracts | Value | |
| Finland — 2.97% | ||
| Huhtamaki OYJ | 32,930 | $1,127,998 |
| Metso Outotec OYJ | 517,047 | 5,319,982 |
| 6,447,980 | ||
| Denmark — 2.83% | ||
| ISS A/S * | 228,624 | 4,847,745 |
| Royal Unibrew A/S | 18,202 | 1,297,785 |
| 6,145,530 | ||
| Austria — 2.56% | ||
| BAWAG Group AG 2,* | 48,489 | 2,584,871 |
| DO & CO AG * | 31,357 | 2,973,957 |
| 5,558,828 | ||
| Italy — 2.25% | ||
| FinecoBank Banca Fineco SpA | 97,418 | 1,618,443 |
| Leonardo SpA | 378,702 | 3,267,375 |
| 4,885,818 | ||
| Norway — 1.82% | ||
| Aker Solutions ASA | 610,934 | 2,332,285 |
| Schibsted ASA | 84,734 | 1,604,418 |
| 3,936,703 | ||
| Belgium — 1.60% | ||
| Lotus Bakeries NV | 511 | 3,457,040 |
| Ireland — 1.29% | ||
| Glanbia PLC | 224,545 | 2,794,234 |
| Spain — 1.01% | ||
| Indra Sistemas SA | 192,765 | 2,197,577 |
| Total EUROPE (Cost $110,454,276) | 117,518,801 | |
| FAR EAST — 27.30% | ||
| Japan — 20.52% | ||
| Asics Corp. | 188,000 | 4,174,276 |
| Azbil Corp. | 56,500 | 1,431,442 |
| Calbee, Inc. | 52,200 | 1,190,052 |
| Capcom Co. Ltd. | 83,800 | 2,688,190 |
| Fujitec Co. Ltd. | 50,150 | 1,145,227 |
| Fukuoka Financial Group, Inc. | 135,700 | 3,107,121 |
| Goldwin, Inc. | 25,700 | 1,870,123 |
| Hoshizaki Corp. | 93,100 | 3,302,198 |
| IHI Corp. | 122,800 | 3,597,729 |
| Kusuri no Aoki Holdings Co. Ltd. | 29,900 | 1,749,710 |
| M&A Capital Partners Co. Ltd. * | 42,200 | 1,483,945 |
| MINEBEA MITSUMI, Inc. | 73,654 | 1,106,157 |
| MonotaRO Co. Ltd. | 186,590 | 2,640,183 |
| Morinaga & Co. Ltd. | 67,700 | 2,024,707 |
| NET One Systems Co. Ltd. | 94,700 | 2,475,015 |
| Nichias Corp. | 61,330 | 1,103,791 |
| Sundrug Co. Ltd. | 118,600 | 3,537,938 |
| Tokai Carbon Co. Ltd. | 156,300 | 1,277,887 |
| Visional, Inc. * | 20,100 | 1,335,508 |
| Yokogawa Electric Corp. | 203,100 | 3,257,585 |
| 44,498,784 | ||
| Shares, Principal Amount, or Number of Contracts | Value | |
| South Korea — 2.07% | ||
| Hyundai Electric & Energy System Co. Ltd. | 49,164 | $1,658,199 |
| KT Corp. | 63,528 | 1,700,346 |
| LEENO Industrial, Inc. | 9,210 | 1,138,081 |
| 4,496,626 | ||
| China — 1.53% | ||
| AK Medical Holdings Ltd. 2 | 1,102,000 | 1,382,185 |
| Autohome, Inc. - ADR 1 | 25,853 | 791,102 |
| Jiumaojiu International Holdings Ltd. 2 | 427,000 | 1,140,607 |
| 3,313,894 | ||
| Indonesia — 0.94% | ||
| Indosat Tbk PT | 2,214,200 | 878,284 |
| Sumber Alfaria Trijaya Tbk PT | 6,751,000 | 1,149,199 |
| 2,027,483 | ||
| Taiwan — 0.88% | ||
| Giant Manufacturing Co. Ltd. | 293,125 | 1,912,172 |
| Australia — 0.79% | ||
| Cochlear Ltd. | 7,713 | 1,071,915 |
| Paladin Energy Ltd. * | 1,367,534 | 651,760 |
| 1,723,675 | ||
| India — 0.57% | ||
| Max Healthcare Institute Ltd. * | 230,697 | 1,225,709 |
| Total FAR EAST (Cost $58,462,744) | 59,198,343 | |
| NORTH AMERICA — 12.96% | ||
| Canada — 9.88% | ||
| Boardwalk REIT | 50,374 | 1,838,986 |
| Cameco Corp. | 62,100 | 1,407,569 |
| K92 Mining, Inc. * | 175,254 | 992,761 |
| Kinaxis, Inc. * | 36,911 | 4,141,174 |
| Major Drilling Group International, Inc. * | 257,033 | 1,997,036 |
| Pason Systems, Inc. | 219,400 | 2,582,892 |
| Precision Drilling Corp. * | 58,700 | 4,496,143 |
| Trican Well Service Ltd. * | 666,300 | 1,801,077 |
| Xenon Pharmaceuticals, Inc. 1,* | 54,828 | 2,161,868 |
| 21,419,506 | ||
| Mexico — 1.55% | ||
| Banco del Bajio SA 2 | 721,546 | 2,272,778 |
| GCC SAB de CV | 164,686 | 1,096,893 |
| 3,369,671 | ||
| United States — 1.53% | ||
| Samsonite International SA 2,* | 1,256,700 | 3,308,609 |
| Total NORTH AMERICA (Cost $25,948,898) | 28,097,786 | |
| SOUTH AMERICA — 1.86% | ||
| Brazil — 1.86% | ||
| Embraer SA - SP ADR 1,* | 93,363 | 1,020,458 |
| M Dias Branco SA * | 194,400 | 1,319,652 |
| Shares, Principal Amount, or Number of Contracts | Value | ||
| Sendas Distribuidora SA | 457,500 | $1,690,630 | |
| 4,030,740 | |||
| Total SOUTH AMERICA (Cost $4,298,108) | 4,030,740 | ||
| MIDDLE EAST — 1.18% | |||
| Israel — 1.18% | |||
| Nice Ltd. - SP ADR 1,* | 13,240 | 2,546,052 | |
| Total MIDDLE EAST (Cost $2,778,597) | 2,546,052 | ||
| Total COMMON STOCKS (Cost $201,942,623) | 211,391,722 | ||
| PREFERRED STOCKS — 0.73% | |||
| EUROPE — 0.73% | |||
| Germany — 0.73% | |||
| FUCHS PETROLUB SE, 1.03% 3 | 45,443 | 1,592,620 | |
| Total EUROPE (Cost $1,633,440) | 1,592,620 | ||
| Total PREFERRED STOCKS (Cost $1,633,440) | 1,592,620 | ||
| SHORT TERM INVESTMENTS — 1.48% | |||
| Northern Institutional U.S. Government Select Portfolio (Shares Class), 3.61% 4 (Cost $3,209,891) | 3,209,891 | 3,209,891 | |
| TOTAL INVESTMENTS (Cost $206,785,954) | 99.71% | $216,194,233 | |
| Other Assets In Excess of Liabilities | 0.29% | 620,027 | |
| Net Assets | 100.00% | $216,814,260 | |
| ADR | American Depositary Receipt |
| PLC | Public Limited Company |
| REIT | Real Estate Investment Trust |
| SP ADR | Sponsored American Depositary Receipt |
| 1 | Foreign security denominated and/or traded in U.S. dollars. |
| 2 | Security is exempt from registration under Rule 144A of the Securities Act of 1933, as amended. The total value of these securities is $18,045,079, which represents 8% of Net Assets (see Note F in the Notes to Financial Statements). |
| 3 | Current yield is disclosed. Dividends are calculated based on a percentage of the issuer’s net income. |
| 4 | 7 day current yield as of December 31, 2022 is disclosed. |
| * | Non-income producing security. |
| Security Type | Percent of Net Assets | |
| Common Stocks | 97.50% | |
| Preferred Stocks | 0.73% | |
| Short Term Investments | 1.48% | |
| Total Investments | 99.71% | |
| Other Assets In Excess of Liabilities | 0.29% | |
| Net Assets | 100.00% |
| Regional Weightings | Percent of Net Assets | |
| Europe | 54.93% | |
| Far East | 27.30% | |
| North America | 14.44% | |
| South America | 1.86% | |
| Middle East | 1.18% |
| Industry | Percent of Net Assets | |
| Aerospace & Defense | 3.07% | |
| Banks | 4.41% | |
| Beverages | 0.60% | |
| Biotechnology | 3.69% | |
| Building Products | 1.10% | |
| Capital Markets | 0.68% | |
| Chemicals | 2.80% | |
| Commercial Services & Supplies | 5.92% | |
| Construction & Engineering | 2.30% | |
| Construction Materials | 0.50% | |
| Containers & Packaging | 0.52% | |
| Diversified Telecommunication Services | 0.78% | |
| Electrical Equipment | 4.17% | |
| Electronic Equipment, Instruments & Components | 2.58% | |
| Energy Equipment & Services | 7.04% | |
| Entertainment | 1.24% | |
| Equity Real Estate Investment Trusts | 0.85% | |
| Food & Staples Retailing | 3.75% | |
| Food Products | 5.43% | |
| Health Care Equipment & Supplies | 2.53% | |
| Health Care Providers & Services | 0.57% | |
| Hotels, Restaurants & Leisure | 1.77% |
| Industry | Percent of Net Assets | |
| Insurance | 0.93% | |
| Interactive Media & Services | 0.36% | |
| IT Services | 4.82% | |
| Leisure Products | 0.88% | |
| Life Sciences Tools & Services | 3.66% | |
| Machinery | 7.40% | |
| Media | 2.28% | |
| Metals & Mining | 1.38% | |
| Money Market Fund | 1.48% | |
| Oil, Gas & Consumable Fuels | 1.94% | |
| Professional Services | 0.62% | |
| Semiconductors & Semiconductor Equipment | 1.63% | |
| Software | 3.09% | |
| Specialty Retail | 1.56% | |
| Textiles, Apparel & Luxury Goods | 5.69% | |
| Thrifts & Mortgage Finance | 1.44% | |
| Trading Companies & Distributors | 2.92% | |
| Transportation Infrastructure | 0.92% | |
| Wireless Telecommunication Services | 0.41% | |
| Other Assets In Excess of Liabilities | 0.29% | |
| TOTAL | 100.00% |
 |  | |
| Jeff James Lead Portfolio Manager | Michael Buck Portfolio Manager | |
 | ||
| Prakash Vijayan Assistant Portfolio Manager |
| Fund Only | Including Predecessor Limited Partnership | |||||
| Average Annual Total Returns as of 12/31/22 | 1 Year | 3 Years | 5 Years | Since Inception (11/18/13 - 12/31/22) | 10 Years | |
| Driehaus Micro Cap Growth Fund (DMCRX)1 | -33.53% | 15.45% | 16.44% | 15.15% | 18.43% | |
| Russell Microcap® Growth Index2 | -29.76% | -0.24% | 1.00% | 3.81% | 7.22% | |
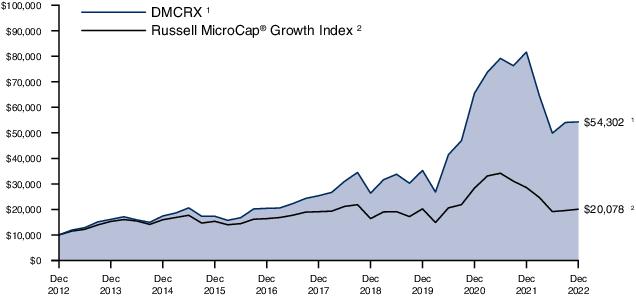
| 1 | The Driehaus Micro Cap Growth Fund (the “Fund”) performance shown above includes the performance of the Driehaus Micro Cap Fund, L.P. (the “Predecessor Limited Partnership”), one of the Fund’s predecessors, for the periods before the Fund’s registration statement became effective. The Predecessor Limited Partnership, which was established on July 1, 1996, was managed with substantially the same investment objective, policies and philosophies as are followed by the Fund. The Fund succeeded to the Predecessor Limited Partnership’s assets together with the assets of the Driehaus Institutional Micro Cap Fund, L.P. on November 18, 2013. The Predecessor Limited Partnership was not registered under the Investment Company Act of 1940, as amended (“1940 Act”), and thus was not subject to certain investment and operational restrictions that are imposed by the 1940 Act. If the Predecessor Limited Partnership had been registered under the 1940 Act, its performance may have been adversely affected. The Predecessor Limited Partnership’s performance has been restated to reflect estimated expenses of the Fund. The returns for periods prior to November 18, 2016, reflect fee waivers and/or reimbursements without which performance would have been lower. |
| 2 | The Russell Microcap® Growth Index measures the performance of the microcap growth segment of the U.S. equity market. It includes those Russell Microcap companies that are considered more growth oriented relative to the overall market as defined by FTSE Russell's leading style methodology. The Russell Microcap® Growth Index is constructed to provide a comprehensive and unbiased barometer for the microcap growth segment of the market. Data is calculated with net dividend reinvestment. Source: FTSE Russell. |
| Shares, Principal Amount, or Number of Contracts | Value | |
| COMMON STOCKS — 99.56% | ||
| HEALTH CARE — 31.36% | ||
| Biotechnology — 17.86% | ||
| Acumen Pharmaceuticals, Inc. * | 60,433 | $326,338 |
| Apellis Pharmaceuticals, Inc. * | 7,590 | 392,479 |
| Astria Therapeutics, Inc. * | 52,115 | 775,992 |
| Avidity Biosciences, Inc. * | 34,431 | 764,024 |
| BELLUS Health, Inc. 1,* | 39,196 | 322,191 |
| Biohaven Ltd. * | 46,149 | 640,548 |
| Biomea Fusion, Inc. * | 41,736 | 351,835 |
| Bioxcel Therapeutics, Inc. * | 40,250 | 864,570 |
| C4 Therapeutics, Inc. * | 27,203 | 160,498 |
| Chinook Therapeutics, Inc. * | 77,521 | 2,031,050 |
| Crinetics Pharmaceuticals, Inc. * | 150,253 | 2,749,630 |
| Cytokinetics, Inc. * | 19,145 | 877,224 |
| Day One Biopharmaceuticals, Inc. * | 51,820 | 1,115,166 |
| Dynavax Technologies Corp. * | 112,248 | 1,194,319 |
| IVERIC bio, Inc. * | 49,779 | 1,065,768 |
| KalVista Pharmaceuticals, Inc. * | 62,045 | 419,424 |
| Merus NV 1,* | 73,139 | 1,131,460 |
| Morphic Holding, Inc. * | 12,889 | 344,781 |
| Nuvalent, Inc. - A * | 75,190 | 2,239,158 |
| Prometheus Biosciences, Inc. * | 21,685 | 2,385,350 |
| Relay Therapeutics, Inc. * | 34,976 | 522,542 |
| REVOLUTION Medicines, Inc. * | 23,151 | 551,457 |
| SpringWorks Therapeutics, Inc. * | 21,028 | 546,938 |
| Vaxcyte, Inc. * | 52,370 | 2,511,142 |
| VectivBio Holding AG 1,* | 43,339 | 373,149 |
| Veracyte, Inc. * | 43,854 | 1,040,655 |
| Viridian Therapeutics, Inc. * | 39,568 | 1,155,781 |
| Xenon Pharmaceuticals, Inc. 1,* | 117,028 | 4,614,414 |
| 31,467,883 | ||
| Health Care Equipment & Supplies — 8.14% | ||
| Alphatec Holdings, Inc. * | 142,037 | 1,754,157 |
| Cutera, Inc. * | 27,295 | 1,206,985 |
| EDAP TMS SA - ADR 1,* | 84,556 | 901,367 |
| Establishment Labs Holdings, Inc. 1,* | 16,081 | 1,055,718 |
| Inspire Medical Systems, Inc. * | 7,254 | 1,827,137 |
| PROCEPT BioRobotics Corp. * | 49,448 | 2,054,070 |
| TransMedics Group, Inc. * | 59,176 | 3,652,343 |
| Treace Medical Concepts, Inc. * | 82,591 | 1,898,767 |
| 14,350,544 | ||
| Pharmaceuticals — 2.88% | ||
| CinCor Pharma, Inc. * | 33,449 | 411,088 |
| DICE Therapeutics, Inc. * | 64,271 | 2,005,255 |
| Terns Pharmaceuticals, Inc. * | 49,977 | 508,766 |
| Shares, Principal Amount, or Number of Contracts | Value | |
| Ventyx Biosciences, Inc. * | 65,651 | $2,152,696 |
| 5,077,805 | ||
| Health Care Providers & Services — 1.64% | ||
| AirSculpt Technologies, Inc. | 67,483 | 249,687 |
| Cross Country Healthcare, Inc. * | 99,064 | 2,632,131 |
| 2,881,818 | ||
| Health Care Technology — 0.84% | ||
| Phreesia, Inc. * | 45,640 | 1,476,910 |
| Total HEALTH CARE (Cost $42,479,020) | 55,254,960 | |
| INFORMATION TECHNOLOGY — 22.41% | ||
| Communications Equipment — 8.43% | ||
| Aviat Networks, Inc. * | 33,805 | 1,054,378 |
| Calix, Inc. * | 46,261 | 3,165,640 |
| Clearfield, Inc. * | 29,468 | 2,774,118 |
| Digi International, Inc. * | 66,317 | 2,423,886 |
| Extreme Networks, Inc. * | 140,123 | 2,565,652 |
| Harmonic, Inc. * | 219,538 | 2,875,948 |
| 14,859,622 | ||
| Semiconductors & Semiconductor Equipment — 5.89% | ||
| Aehr Test Systems * | 95,521 | 1,919,972 |
| Axcelis Technologies, Inc. * | 43,910 | 3,484,698 |
| Impinj, Inc. * | 31,998 | 3,493,542 |
| Maxeon Solar Technologies Ltd. 1,* | 41,008 | 658,588 |
| Photronics, Inc. * | 48,725 | 820,042 |
| 10,376,842 | ||
| Software — 3.85% | ||
| A10 Networks, Inc. | 85,656 | 1,424,459 |
| Agilysys, Inc. * | 48,959 | 3,874,615 |
| Alkami Technology, Inc. * | 31,947 | 466,107 |
| Model N, Inc. * | 24,841 | 1,007,551 |
| 6,772,732 | ||
| IT Services — 3.39% | ||
| Flywire Corp. * | 38,875 | 951,271 |
| Grid Dynamics Holdings, Inc. * | 50,817 | 570,167 |
| I3 Verticals, Inc. - A * | 37,984 | 924,531 |
| International Money Express, Inc. * | 71,169 | 1,734,388 |
| Payoneer Global, Inc. * | 328,706 | 1,798,022 |
| 5,978,379 | ||
| Electronic Equipment, Instruments & Components — 0.85% | ||
| CTS Corp. | 13,413 | 528,740 |
| Plexus Corp. * | 9,336 | 960,955 |
| 1,489,695 | ||
| Total INFORMATION TECHNOLOGY (Cost $31,364,322) | 39,477,270 | |
| Shares, Principal Amount, or Number of Contracts | Value | |
| INDUSTRIALS — 17.23% | ||
| Machinery — 5.25% | ||
| Energy Recovery, Inc. * | 59,395 | $1,217,003 |
| EnPro Industries, Inc. | 8,618 | 936,690 |
| Federal Signal Corp. | 44,973 | 2,089,895 |
| Lindsay Corp. | 5,716 | 930,851 |
| The Shyft Group, Inc. | 50,206 | 1,248,121 |
| Titan International, Inc. * | 90,558 | 1,387,349 |
| Wabash National Corp. | 64,123 | 1,449,180 |
| 9,259,089 | ||
| Construction & Engineering — 2.73% | ||
| Arcosa, Inc. | 27,692 | 1,504,783 |
| Dycom Industries, Inc. * | 19,053 | 1,783,361 |
| MYR Group, Inc. * | 11,484 | 1,057,332 |
| Sterling Infrastructure, Inc. * | 14,223 | 466,514 |
| 4,811,990 | ||
| Professional Services — 2.67% | ||
| Huron Consulting Group, Inc. * | 24,235 | 1,759,461 |
| ICF International, Inc. | 7,091 | 702,364 |
| NV5 Global, Inc. * | 16,941 | 2,241,633 |
| 4,703,458 | ||
| Trading Companies & Distributors — 2.26% | ||
| H&E Equipment Services, Inc. | 35,175 | 1,596,945 |
| Karat Packaging, Inc. | 63,396 | 911,001 |
| McGrath RentCorp | 15,022 | 1,483,272 |
| 3,991,218 | ||
| Electrical Equipment — 1.74% | ||
| Array Technologies, Inc. * | 83,528 | 1,614,596 |
| Shoals Technologies Group, Inc. - A * | 58,784 | 1,450,202 |
| 3,064,798 | ||
| Commercial Services & Supplies — 1.53% | ||
| Montrose Environmental Group, Inc. * | 48,476 | 2,151,849 |
| Performant Financial Corp. * | 149,270 | 538,865 |
| 2,690,714 | ||
| Air Freight & Logistics — 1.05% | ||
| Forward Air Corp. | 17,577 | 1,843,652 |
| Total INDUSTRIALS (Cost $27,942,386) | 30,364,919 | |
| CONSUMER STAPLES — 11.03% | ||
| Food Products — 4.40% | ||
| Sovos Brands, Inc. * | 137,557 | 1,976,694 |
| SunOpta, Inc. 1,* | 268,721 | 2,268,005 |
| The Real Good Food Co., Inc. * | 77,506 | 513,865 |
| Utz Brands, Inc. | 83,319 | 1,321,440 |
| Vital Farms, Inc. * | 112,284 | 1,675,277 |
| 7,755,281 | ||
| Shares, Principal Amount, or Number of Contracts | Value | |
| Beverages — 3.74% | ||
| Celsius Holdings, Inc. * | 11,713 | $1,218,621 |
| MGP Ingredients, Inc. | 24,953 | 2,654,500 |
| The Duckhorn Portfolio, Inc. * | 112,278 | 1,860,446 |
| The Vita Coco Co., Inc. * | 61,380 | 848,272 |
| 6,581,839 | ||
| Personal Products — 2.25% | ||
| elf Beauty, Inc. * | 66,720 | 3,689,616 |
| The Beauty Health Co. * | 31,077 | 282,801 |
| 3,972,417 | ||
| Food & Staples Retailing — 0.64% | ||
| The Chefs' Warehouse, Inc. * | 34,034 | 1,132,651 |
| Total CONSUMER STAPLES (Cost $15,293,043) | 19,442,188 | |
| CONSUMER DISCRETIONARY — 8.35% | ||
| Hotels, Restaurants & Leisure — 4.07% | ||
| Dave & Buster's Entertainment, Inc. * | 12,639 | 447,926 |
| Everi Holdings, Inc. * | 35,622 | 511,176 |
| Full House Resorts, Inc. * | 70,782 | 532,281 |
| Kura Sushi USA, Inc. - A * | 26,414 | 1,259,419 |
| Playa Hotels & Resorts NV * | 189,255 | 1,235,835 |
| Portillo's, Inc. - A * | 28,827 | 470,457 |
| Xponential Fitness, Inc. - A * | 118,244 | 2,711,335 |
| 7,168,429 | ||
| Auto Components — 2.02% | ||
| Gentherm, Inc. * | 19,145 | 1,249,977 |
| Modine Manufacturing Co. * | 34,335 | 681,893 |
| XPEL, Inc. * | 27,183 | 1,632,611 |
| 3,564,481 | ||
| Internet & Direct Marketing Retail — 1.21% | ||
| Xometry, Inc. - A * | 66,170 | 2,132,659 |
| Diversified Consumer Services — 1.05% | ||
| Stride, Inc. * | 32,487 | 1,016,194 |
| Udemy, Inc. * | 78,066 | 823,596 |
| 1,839,790 | ||
| Total CONSUMER DISCRETIONARY (Cost $15,397,670) | 14,705,359 | |
| ENERGY — 4.05% | ||
| Oil, Gas & Consumable Fuels — 4.05% | ||
| Energy Fuels, Inc. * | 105,966 | 658,049 |
| Golar LNG Ltd. 1,* | 65,437 | 1,491,309 |
| Green Plains, Inc. * | 33,113 | 1,009,946 |
| Matador Resources Co. | 29,458 | 1,686,176 |
| Ranger Oil Corp. - A | 31,611 | 1,278,033 |
| Shares, Principal Amount, or Number of Contracts | Value | |
| Uranium Energy Corp. 1,* | 262,465 | $1,018,364 |
| 7,141,877 | ||
| Total ENERGY (Cost $5,625,437) | 7,141,877 | |
| MATERIALS — 1.86% | ||
| Metals & Mining — 1.21% | ||
| ATI, Inc. * | 71,225 | 2,126,778 |
| Chemicals — 0.65% | ||
| Aspen Aerogels, Inc. * | 97,119 | 1,145,033 |
| Total MATERIALS (Cost $2,791,163) | 3,271,811 | |
| FINANCIALS — 1.83% | ||
| Insurance — 1.02% | ||
| BRP Group, Inc. - A * | 48,639 | 1,222,784 |
| James River Group Holdings Ltd. 1 | 27,259 | 569,986 |
| 1,792,770 | ||
| Banks — 0.81% | ||
| City Holding Co. | 9,315 | 867,133 |
| Heritage Financial Corp. | 18,356 | 562,428 |
| 1,429,561 | ||
| Total FINANCIALS (Cost $2,895,448) | 3,222,331 | |
| COMMUNICATION SERVICES — 1.44% | ||
| Media — 0.98% | ||
| Perion Network Ltd. 1,* | 68,481 | 1,732,569 |
| Interactive Media & Services — 0.46% | ||
| EverQuote, Inc. - A * | 54,971 | 810,273 |
| Total COMMUNICATION SERVICES (Cost $1,994,059) | 2,542,842 | |
| Total COMMON STOCKS (Cost $145,782,548) | 175,423,557 | |
| WARRANTS — 0.00% | ||
| EQRx, Inc., Exp. 12/31/28, Strike $11.50 * | 28,521 | 7,641 |
| Total WARRANTS (Cost $0) | 7,641 | |
| Shares, Principal Amount, or Number of Contracts | Value | ||
| SHORT TERM INVESTMENTS — 0.62% | |||
| Northern Institutional U.S. Government Select Portfolio (Shares Class), 3.61% 2 (Cost $1,090,197) | 1,090,197 | $1,090,197 | |
| TOTAL INVESTMENTS (Cost $146,872,745) | 100.18% | $176,521,395 | |
| Liabilities In Excess of Other Assets | (0.18)% | (312,945) | |
| Net Assets | 100.00% | $176,208,450 | |
| ADR | American Depositary Receipt |
| 1 | Foreign security denominated and/or traded in U.S. dollars. |
| 2 | 7 day current yield as of December 31, 2022 is disclosed. |
| * | Non-income producing security. |
| Security Type | Percent of Net Assets | |
| Common Stocks | 99.56% | |
| Warrants | 0.00% | |
| Short Term Investments | 0.62% | |
| Total Investments | 100.18% | |
| Liabilities In Excess of Other Assets | (0.18)% | |
| Net Assets | 100.00% |
| Industry | Percent of Net Assets | |
| Air Freight & Logistics | 1.05% | |
| Auto Components | 2.02% | |
| Banks | 0.81% | |
| Beverages | 3.74% | |
| Biotechnology | 17.86% | |
| Chemicals | 0.65% | |
| Commercial Services & Supplies | 1.53% | |
| Communications Equipment | 8.43% | |
| Construction & Engineering | 2.73% | |
| Diversified Consumer Services | 1.05% | |
| Electrical Equipment | 1.74% | |
| Electronic Equipment, Instruments & Components | 0.85% | |
| Food & Staples Retailing | 0.64% | |
| Food Products | 4.40% | |
| Health Care Equipment & Supplies | 8.14% | |
| Health Care Providers & Services | 1.64% | |
| Health Care Technology | 0.84% | |
| Hotels, Restaurants & Leisure | 4.07% |
| Industry | Percent of Net Assets | |
| Insurance | 1.02% | |
| Interactive Media & Services | 0.46% | |
| Internet & Direct Marketing Retail | 1.21% | |
| IT Services | 3.39% | |
| Machinery | 5.25% | |
| Media | 0.98% | |
| Metals & Mining | 1.21% | |
| Money Market Fund | 0.62% | |
| Oil, Gas & Consumable Fuels | 4.05% | |
| Personal Products | 2.25% | |
| Pharmaceuticals | 2.88% | |
| Professional Services | 2.67% | |
| Semiconductors & Semiconductor Equipment | 5.89% | |
| Software | 3.85% | |
| Trading Companies & Distributors | 2.26% | |
| Liabilities In Excess of Other Assets | (0.18)% | |
| TOTAL | 100.00% |
| | |
| Jeff James Lead Portfolio Manager | Michael Buck Portfolio Manager | |
| ||
| Prakash Vijayan Assistant Portfolio Manager |
| Fund Only | Including Predecessor Limited Partnership | |||||
| Average Annual Total Returns as of 12/31/22 | 1 Year | 3 Years | 5 Years | Since Inception (8/21/17 - 12/31/22) | 10 Years | |
| Driehaus Small Cap Growth Fund Investor Class (DVSMX)1 | -34.11% | 9.33% | 13.63% | 16.21% | 16.21% | |
| Driehaus Small Cap Growth Fund Institutional Class (DNSMX)1 | -33.93% | 9.67% | 13.95% | 16.53% | 16.38% | |
| Russell 2000® Growth Index2 | -26.36% | 0.65% | 3.51% | 5.96% | 9.20% | |

| 1 | The Driehaus Small Cap Growth Fund (“the Fund”) performance shown above includes the performance of the Driehaus Institutional Small Cap, L.P. (the “Predecessor Partnership”), one of the Fund’s predecessors, for the periods before the Fund’s registration statement became effective. The Predecessor Partnership was managed by the same investment team with substantially the same investment objective, policies and philosophies as are followed by the Fund. The Fund succeeded to the Predecessor Partnership’s assets together with the assets of the Driehaus Institutional Small Cap Recovery Fund, L.P., Driehaus Small Cap Recovery Fund, L.P. and Driehaus Small Cap Investors, L.P. (together, the “Limited Partnerships”) on August 21, 2017. The investment portfolios of the Limited Partnerships were identical and therefore had similar performance. The performance of the Predecessor Partnership is shown here because it has been in operation the longest. The Predecessor Partnership was not registered under the Investment Company Act of 1940, as amended (“1940 Act”), and thus was not subject to certain investment and operational restrictions that are imposed by the 1940 Act. If the Predecessor Partnership had been registered under the 1940 Act, its performance may have been adversely affected. The Predecessor Partnership’s performance has not been restated to reflect estimated expenses applicable to each class of shares of the Fund. The returns reflect fee waivers and/or reimbursements without which performance would have been lower. |
| 2 | The Russell 2000® Growth Index measures the performance of the small cap growth segment of the US Equity universe. It includes those Russell 2000® companies with higher price-value ratio and higher forecasted growth values. The Russell 2000® Index is constructed to provide a comprehensive and unbiased barometer for the small cap growth segment of the market. Data is calculated with net dividend reinvestment. Source: FTSE Russell. |
| Shares, Principal Amount, or Number of Contracts | Value | |
| COMMON STOCKS — 98.85% | ||
| INFORMATION TECHNOLOGY — 25.46% | ||
| Software — 7.75% | ||
| Agilysys, Inc. * | 38,428 | $3,041,192 |
| Clear Secure, Inc. - A | 182,556 | 5,007,511 |
| CyberArk Software Ltd. 1,* | 44,676 | 5,792,243 |
| EngageSmart, Inc. * | 210,787 | 3,709,851 |
| Gitlab, Inc. - A * | 93,265 | 4,237,962 |
| Instructure Holdings, Inc. * | 98,202 | 2,301,855 |
| Paylocity Holding Corp. * | 23,722 | 4,608,236 |
| Sprout Social, Inc. - A * | 44,005 | 2,484,522 |
| SPS Commerce, Inc. * | 16,871 | 2,166,743 |
| Tenable Holdings, Inc. * | 46,529 | 1,775,081 |
| 35,125,196 | ||
| Communications Equipment — 6.02% | ||
| Calix, Inc. * | 178,752 | 12,231,999 |
| Clearfield, Inc. * | 53,453 | 5,032,066 |
| Digi International, Inc. * | 92,241 | 3,371,409 |
| Extreme Networks, Inc. * | 239,556 | 4,386,270 |
| Harmonic, Inc. * | 173,072 | 2,267,243 |
| 27,288,987 | ||
| Semiconductors & Semiconductor Equipment — 6.00% | ||
| Allegro MicroSystems, Inc. * | 92,838 | 2,786,997 |
| Ambarella, Inc. * | 37,959 | 3,121,368 |
| Axcelis Technologies, Inc. * | 108,210 | 8,587,546 |
| Impinj, Inc. * | 83,574 | 9,124,609 |
| Maxeon Solar Technologies Ltd. 1,* | 112,098 | 1,800,294 |
| Rambus, Inc. * | 50,405 | 1,805,507 |
| 27,226,321 | ||
| Electronic Equipment, Instruments & Components — 3.03% | ||
| Badger Meter, Inc. | 41,884 | 4,566,612 |
| Fabrinet 1,* | 46,529 | 5,965,948 |
| Plexus Corp. * | 31,133 | 3,204,520 |
| 13,737,080 | ||
| IT Services — 2.17% | ||
| ExlService Holdings, Inc. * | 27,610 | 4,677,962 |
| Flywire Corp. * | 88,035 | 2,154,217 |
| Payoneer Global, Inc. * | 551,836 | 3,018,543 |
| 9,850,722 | ||
| Technology Hardware, Storage & Peripherals — 0.49% | ||
| Super Micro Computer, Inc. * | 27,219 | 2,234,680 |
| Total INFORMATION TECHNOLOGY (Cost $108,520,163) | 115,462,986 | |
| INDUSTRIALS — 23.18% | ||
| Construction & Engineering — 8.15% | ||
| Ameresco, Inc. - A * | 39,809 | 2,274,686 |
| Comfort Systems USA, Inc. | 49,101 | 5,650,543 |
| Shares, Principal Amount, or Number of Contracts | Value | |
| Dycom Industries, Inc. * | 34,972 | $3,273,379 |
| EMCOR Group, Inc. | 39,312 | 5,822,501 |
| Fluor Corp. * | 150,374 | 5,211,963 |
| Valmont Industries, Inc. | 15,518 | 5,131,337 |
| WillScot Mobile Mini Holdings Corp. * | 211,970 | 9,574,685 |
| 36,939,094 | ||
| Machinery — 3.67% | ||
| Chart Industries, Inc. * | 40,983 | 4,722,471 |
| Evoqua Water Technologies Corp. * | 121,765 | 4,821,894 |
| SPX Technologies, Inc. * | 67,800 | 4,451,070 |
| The Shyft Group, Inc. | 106,637 | 2,650,996 |
| 16,646,431 | ||
| Electrical Equipment — 2.32% | ||
| Array Technologies, Inc. * | 224,202 | 4,333,824 |
| Shoals Technologies Group, Inc. - A * | 251,246 | 6,198,239 |
| 10,532,063 | ||
| Commercial Services & Supplies — 2.24% | ||
| Driven Brands Holdings, Inc. * | 97,775 | 2,670,235 |
| MSA Safety, Inc. | 14,523 | 2,094,071 |
| Tetra Tech, Inc. | 37,057 | 5,380,306 |
| 10,144,612 | ||
| Aerospace & Defense — 1.92% | ||
| Axon Enterprise, Inc. * | 37,850 | 6,280,450 |
| Parsons Corp. * | 52,258 | 2,416,933 |
| 8,697,383 | ||
| Professional Services — 1.73% | ||
| Exponent, Inc. | 22,710 | 2,250,334 |
| FTI Consulting, Inc. * | 15,018 | 2,384,858 |
| KBR, Inc. | 60,791 | 3,209,765 |
| 7,844,957 | ||
| Trading Companies & Distributors — 1.72% | ||
| Applied Industrial Technologies, Inc. | 44,176 | 5,567,501 |
| Core & Main, Inc. - A * | 116,182 | 2,243,475 |
| 7,810,976 | ||
| Road & Rail — 0.74% | ||
| Saia, Inc. * | 15,969 | 3,348,380 |
| Building Products — 0.69% | ||
| AAON, Inc. | 41,725 | 3,142,727 |
| Total INDUSTRIALS (Cost $99,134,864) | 105,106,623 | |
| HEALTH CARE — 18.60% | ||
| Biotechnology — 9.64% | ||
| Apellis Pharmaceuticals, Inc. * | 39,361 | 2,035,357 |
| Crinetics Pharmaceuticals, Inc. * | 217,297 | 3,976,535 |
| Cytokinetics, Inc. * | 37,313 | 1,709,682 |
| Shares, Principal Amount, or Number of Contracts | Value | |
| Halozyme Therapeutics, Inc. * | 178,240 | $10,141,856 |
| IVERIC bio, Inc. * | 47,248 | 1,011,580 |
| Karuna Therapeutics, Inc. * | 11,873 | 2,333,044 |
| Merus NV 1,* | 85,670 | 1,325,315 |
| Nuvalent, Inc. - A * | 172,219 | 5,128,682 |
| Prometheus Biosciences, Inc. * | 13,665 | 1,503,150 |
| Relay Therapeutics, Inc. * | 110,757 | 1,654,709 |
| Vaxcyte, Inc. * | 61,108 | 2,930,129 |
| Xenon Pharmaceuticals, Inc. 1,* | 252,172 | 9,943,142 |
| 43,693,181 | ||
| Health Care Equipment & Supplies — 4.58% | ||
| Axonics, Inc. * | 36,771 | 2,299,291 |
| Inspire Medical Systems, Inc. * | 32,571 | 8,203,983 |
| PROCEPT BioRobotics Corp. * | 84,232 | 3,498,997 |
| Shockwave Medical, Inc. * | 8,825 | 1,814,508 |
| TransMedics Group, Inc. * | 80,148 | 4,946,735 |
| 20,763,514 | ||
| Pharmaceuticals — 2.43% | ||
| Axsome Therapeutics, Inc. * | 46,346 | 3,574,667 |
| DICE Therapeutics, Inc. * | 167,940 | 5,239,728 |
| Ventyx Biosciences, Inc. * | 67,361 | 2,208,767 |
| 11,023,162 | ||
| Health Care Providers & Services — 1.95% | ||
| AMN Healthcare Services, Inc. * | 64,692 | 6,651,632 |
| Option Care Health, Inc. * | 73,103 | 2,199,669 |
| 8,851,301 | ||
| Total HEALTH CARE (Cost $68,328,683) | 84,331,158 | |
| CONSUMER DISCRETIONARY — 9.97% | ||
| Hotels, Restaurants & Leisure — 4.08% | ||
| Playa Hotels & Resorts NV * | 303,918 | 1,984,585 |
| Texas Roadhouse, Inc. | 50,235 | 4,568,873 |
| Wingstop, Inc. | 51,539 | 7,092,797 |
| Xponential Fitness, Inc. - A * | 212,616 | 4,875,285 |
| 18,521,540 | ||
| Auto Components — 2.40% | ||
| Gentherm, Inc. * | 37,703 | 2,461,629 |
| Visteon Corp. * | 64,314 | 8,414,201 |
| 10,875,830 | ||
| Specialty Retail — 1.52% | ||
| Murphy USA, Inc. | 24,599 | 6,876,404 |
| Textiles, Apparel & Luxury Goods — 1.20% | ||
| Crocs, Inc. * | 50,226 | 5,446,005 |
| Internet & Direct Marketing Retail — 0.77% | ||
| Xometry, Inc. - A * | 107,637 | 3,469,141 |
| Total CONSUMER DISCRETIONARY (Cost $41,878,325) | 45,188,920 | |
| Shares, Principal Amount, or Number of Contracts | Value | |
| CONSUMER STAPLES — 7.75% | ||
| Beverages — 3.57% | ||
| Celsius Holdings, Inc. * | 58,097 | $6,044,412 |
| MGP Ingredients, Inc. | 48,918 | 5,203,897 |
| The Duckhorn Portfolio, Inc. * | 296,507 | 4,913,121 |
| 16,161,430 | ||
| Personal Products — 2.83% | ||
| BellRing Brands, Inc. * | 139,903 | 3,587,113 |
| elf Beauty, Inc. * | 138,782 | 7,674,644 |
| Inter Parfums, Inc. | 16,431 | 1,585,920 |
| 12,847,677 | ||
| Food & Staples Retailing — 0.93% | ||
| Performance Food Group Co. * | 72,359 | 4,225,042 |
| Food Products — 0.42% | ||
| Hostess Brands, Inc. * | 85,561 | 1,919,989 |
| Total CONSUMER STAPLES (Cost $29,239,116) | 35,154,138 | |
| ENERGY — 6.30% | ||
| Oil, Gas & Consumable Fuels — 4.13% | ||
| Cameco Corp. 1 | 224,696 | 5,093,858 |
| Denbury, Inc. * | 30,840 | 2,683,697 |
| Excelerate Energy, Inc. - A | 99,555 | 2,493,853 |
| Golar LNG Ltd. 1,* | 161,544 | 3,681,588 |
| Matador Resources Co. | 83,086 | 4,755,842 |
| 18,708,838 | ||
| Energy Equipment & Services — 2.17% | ||
| ChampionX Corp. | 45,493 | 1,318,842 |
| Patterson-UTI Energy, Inc. | 93,155 | 1,568,730 |
| ProFrac Holding Corp. - A * | 137,051 | 3,453,685 |
| TechnipFMC PLC 1,* | 287,949 | 3,510,099 |
| 9,851,356 | ||
| Total ENERGY (Cost $25,049,164) | 28,560,194 | |
| FINANCIALS — 3.88% | ||
| Insurance — 3.36% | ||
| Kinsale Capital Group, Inc. | 43,347 | 11,336,108 |
| RenaissanceRe Holdings Ltd. 1 | 21,088 | 3,885,042 |
| 15,221,150 | ||
| Banks — 0.52% | ||
| Hancock Whitney Corp. | 48,967 | 2,369,513 |
| Total FINANCIALS (Cost $15,510,354) | 17,590,663 | |
| MATERIALS — 1.72% | ||
| Metals & Mining — 1.24% | ||
| ATI, Inc. * | 188,285 | 5,622,190 |
| Shares, Principal Amount, or Number of Contracts | Value | ||
| Chemicals — 0.48% | |||
| Aspen Aerogels, Inc. * | 183,409 | $2,162,392 | |
| Total MATERIALS (Cost $8,344,544) | 7,784,582 | ||
| COMMUNICATION SERVICES — 1.63% | |||
| Diversified Telecommunication Services — 1.07% | |||
| Iridium Communications, Inc. * | 94,569 | 4,860,847 | |
| Entertainment — 0.56% | |||
| World Wrestling Entertainment, Inc. - A | 37,264 | 2,553,329 | |
| Total COMMUNICATION SERVICES (Cost $6,726,224) | 7,414,176 | ||
| REAL ESTATE — 0.36% | |||
| Equity Real Estate Investment Trusts — 0.36% | |||
| Ryman Hospitality Properties, Inc. | 19,741 | 1,614,419 | |
| Total REAL ESTATE (Cost $1,749,950) | 1,614,419 | ||
| Total COMMON STOCKS (Cost $404,481,387) | 448,207,859 | ||
| SHORT TERM INVESTMENTS — 1.04% | |||
| Northern Institutional U.S. Government Select Portfolio (Shares Class), 3.61% 2 (Cost $4,715,294) | 4,715,294 | 4,715,294 | |
| TOTAL INVESTMENTS (Cost $409,196,681) | 99.89% | $452,923,153 | |
| Other Assets In Excess of Liabilities | 0.11% | 515,154 | |
| Net Assets | 100.00% | $453,438,307 | |
| PLC | Public Limited Company |
| 1 | Foreign security denominated and/or traded in U.S. dollars. |
| 2 | 7 day current yield as of December 31, 2022 is disclosed. |
| * | Non-income producing security. |
| Security Type | Percent of Net Assets | |
| Common Stocks | 98.85% | |
| Short Term Investments | 1.04% | |
| Total Investments | 99.89% | |
| Other Assets In Excess of Liabilities | 0.11% | |
| Net Assets | 100.00% |
| Industry | Percent of Net Assets | |
| Aerospace & Defense | 1.92% | |
| Auto Components | 2.40% | |
| Banks | 0.52% | |
| Beverages | 3.57% | |
| Biotechnology | 9.64% | |
| Building Products | 0.69% | |
| Chemicals | 0.48% | |
| Commercial Services & Supplies | 2.24% | |
| Communications Equipment | 6.02% | |
| Construction & Engineering | 8.15% | |
| Diversified Telecommunication Services | 1.07% | |
| Electrical Equipment | 2.32% | |
| Electronic Equipment, Instruments & Components | 3.03% | |
| Energy Equipment & Services | 2.17% | |
| Entertainment | 0.56% | |
| Equity Real Estate Investment Trusts | 0.36% | |
| Food & Staples Retailing | 0.93% | |
| Food Products | 0.42% | |
| Health Care Equipment & Supplies | 4.58% | |
| Health Care Providers & Services | 1.95% | |
| Hotels, Restaurants & Leisure | 4.08% |
| Industry | Percent of Net Assets | |
| Insurance | 3.36% | |
| Internet & Direct Marketing Retail | 0.77% | |
| IT Services | 2.17% | |
| Machinery | 3.67% | |
| Metals & Mining | 1.24% | |
| Money Market Fund | 1.04% | |
| Oil, Gas & Consumable Fuels | 4.13% | |
| Personal Products | 2.83% | |
| Pharmaceuticals | 2.43% | |
| Professional Services | 1.73% | |
| Road & Rail | 0.74% | |
| Semiconductors & Semiconductor Equipment | 6.00% | |
| Software | 7.75% | |
| Specialty Retail | 1.52% | |
| Technology Hardware, Storage & Peripherals | 0.49% | |
| Textiles, Apparel & Luxury Goods | 1.20% | |
| Trading Companies & Distributors | 1.72% | |
| Other Assets In Excess of Liabilities | 0.11% | |
| TOTAL | 100.00% |
| |
| Jeff James Lead Portfolio Manager | Michael Buck Portfolio Manager |
| |
| Prakash Vijayan Assistant Portfolio Manager |
| Average Annual Total Returns as of 12/31/22 | 1 Year | Since Inception (5/1/20 - 12/31/22) |
| Driehaus Small/Mid Cap Growth Fund (DSMDX)1 | -31.45% | 13.82% |
| Russell 2500® Growth Index2 | -26.21% | 7.80% |
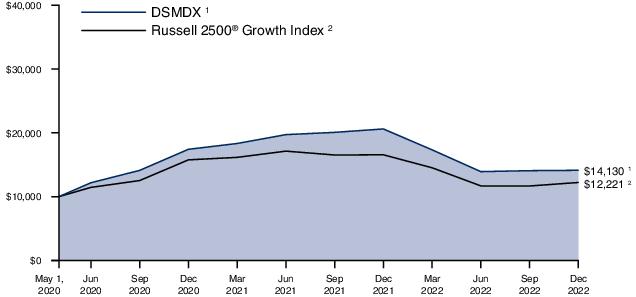
| 1 | The returns for the period reflect fee waivers and/or reimbursements without which performance would have been lower. |
| 2 | The Russell 2500® Growth Index measures the performance of the small to midcap growth segment of the US Equity universe. It measures the performance of those Russell 2500® Index companies with higher growth earning potential as defined by FTSE Russell’s leading style methodology. The Russell 2500® Growth Index is constructed to provide a comprehensive and unbiased barometer for the small to midcap growth segment of the market. Data is calculated with net dividend reinvestment. Source: FTSE Russell. |
| Shares, Principal Amount, or Number of Contracts | Value | |
| COMMON STOCKS — 98.63% | ||
| INDUSTRIALS — 25.58% | ||
| Construction & Engineering — 7.43% | ||
| AECOM | 1,767 | $150,071 |
| Ameresco, Inc. - A * | 963 | 55,026 |
| Quanta Services, Inc. | 2,554 | 363,945 |
| Valmont Industries, Inc. | 356 | 117,719 |
| WillScot Mobile Mini Holdings Corp. * | 6,066 | 274,001 |
| 960,762 | ||
| Commercial Services & Supplies — 3.86% | ||
| Clean Harbors, Inc. * | 1,136 | 129,640 |
| Driven Brands Holdings, Inc. * | 2,718 | 74,229 |
| MSA Safety, Inc. | 815 | 117,515 |
| Tetra Tech, Inc. | 1,223 | 177,567 |
| 498,951 | ||
| Machinery — 3.82% | ||
| AGCO Corp. | 1,858 | 257,686 |
| Chart Industries, Inc. * | 1,386 | 159,709 |
| Evoqua Water Technologies Corp. * | 1,939 | 76,784 |
| 494,179 | ||
| Aerospace & Defense — 3.46% | ||
| Axon Enterprise, Inc. * | 1,359 | 225,499 |
| Curtiss-Wright Corp. | 1,327 | 221,596 |
| 447,095 | ||
| Professional Services — 3.07% | ||
| Booz Allen Hamilton Holding Corp. | 877 | 91,664 |
| CACI International, Inc. - A * | 395 | 118,733 |
| FTI Consulting, Inc. * | 452 | 71,778 |
| KBR, Inc. | 2,172 | 114,681 |
| 396,856 | ||
| Road & Rail — 1.41% | ||
| Knight-Swift Transportation Holdings, Inc. | 1,765 | 92,503 |
| Saia, Inc. * | 429 | 89,953 |
| 182,456 | ||
| Electrical Equipment — 1.03% | ||
| Shoals Technologies Group, Inc. - A * | 5,420 | 133,712 |
| Building Products — 1.00% | ||
| Builders FirstSource, Inc. * | 1,008 | 65,399 |
| Carlisle Cos., Inc. | 274 | 64,568 |
| 129,967 | ||
| Trading Companies & Distributors — 0.50% | ||
| Core & Main, Inc. - A * | 3,325 | 64,206 |
| Total INDUSTRIALS (Cost $3,063,733) | 3,308,184 | |
| Shares, Principal Amount, or Number of Contracts | Value | |
| INFORMATION TECHNOLOGY — 22.51% | ||
| Semiconductors & Semiconductor Equipment — 9.45% | ||
| Ambarella, Inc. * | 1,059 | $87,081 |
| Axcelis Technologies, Inc. * | 2,022 | 160,466 |
| Enphase Energy, Inc. * | 1,000 | 264,960 |
| First Solar, Inc. * | 2,051 | 307,219 |
| Lattice Semiconductor Corp. * | 1,920 | 124,570 |
| ON Semiconductor Corp. * | 3,649 | 227,588 |
| Rambus, Inc. * | 1,418 | 50,793 |
| 1,222,677 | ||
| Software — 6.61% | ||
| Bill.com Holdings, Inc. * | 960 | 104,602 |
| Clear Secure, Inc. - A | 4,011 | 110,022 |
| CyberArk Software Ltd. 1,* | 1,285 | 166,600 |
| Gitlab, Inc. - A * | 2,669 | 121,280 |
| Paycom Software, Inc. * | 362 | 112,332 |
| Paylocity Holding Corp. * | 859 | 166,869 |
| Procore Technologies, Inc. * | 1,544 | 72,846 |
| 854,551 | ||
| Communications Equipment — 2.93% | ||
| Calix, Inc. * | 4,946 | 338,455 |
| Juniper Networks, Inc. | 1,275 | 40,749 |
| 379,204 | ||
| IT Services — 2.54% | ||
| ExlService Holdings, Inc. * | 776 | 131,478 |
| MongoDB, Inc. * | 1,002 | 197,233 |
| 328,711 | ||
| Electronic Equipment, Instruments & Components — 0.98% | ||
| Fabrinet 1,* | 983 | 126,040 |
| Total INFORMATION TECHNOLOGY (Cost $2,815,789) | 2,911,183 | |
| HEALTH CARE — 17.79% | ||
| Biotechnology — 11.78% | ||
| Alnylam Pharmaceuticals, Inc. * | 779 | 185,129 |
| Argenx SE - ADR 1,* | 366 | 138,652 |
| Ascendis Pharma A/S - ADR 1,* | 1,286 | 157,059 |
| Crinetics Pharmaceuticals, Inc. * | 3,423 | 62,641 |
| Halozyme Therapeutics, Inc. * | 4,931 | 280,574 |
| Karuna Therapeutics, Inc. * | 288 | 56,592 |
| Neurocrine Biosciences, Inc. * | 2,155 | 257,393 |
| United Therapeutics Corp. * | 499 | 138,767 |
| Xenon Pharmaceuticals, Inc. 1,* | 6,253 | 246,556 |
| 1,523,363 | ||
| Health Care Equipment & Supplies — 4.54% | ||
| Axonics, Inc. * | 1,144 | 71,534 |
| Inspire Medical Systems, Inc. * | 742 | 186,895 |
| Insulet Corp. * | 499 | 146,901 |
| Shares, Principal Amount, or Number of Contracts | Value | |
| Penumbra, Inc. * | 817 | $181,750 |
| 587,080 | ||
| Health Care Providers & Services — 1.47% | ||
| AMN Healthcare Services, Inc. * | 1,858 | 191,039 |
| Total HEALTH CARE (Cost $1,905,590) | 2,301,482 | |
| CONSUMER DISCRETIONARY — 14.16% | ||
| Specialty Retail — 3.66% | ||
| Murphy USA, Inc. | 491 | 137,254 |
| Tractor Supply Co. | 635 | 142,856 |
| Ulta Beauty, Inc. * | 411 | 192,788 |
| 472,898 | ||
| Auto Components — 3.40% | ||
| Mobileye Global, Inc. - A * | 6,299 | 220,843 |
| Visteon Corp. * | 1,673 | 218,878 |
| 439,721 | ||
| Hotels, Restaurants & Leisure — 3.05% | ||
| Hyatt Hotels Corp. - A * | 1,337 | 120,932 |
| Texas Roadhouse, Inc. | 1,106 | 100,591 |
| Wingstop, Inc. | 1,260 | 173,401 |
| 394,924 | ||
| Textiles, Apparel & Luxury Goods — 2.18% | ||
| Deckers Outdoor Corp. * | 546 | 217,942 |
| Skechers USA, Inc. - A * | 1,533 | 64,309 |
| 282,251 | ||
| Internet & Direct Marketing Retail — 1.35% | ||
| Chewy, Inc. - A * | 1,555 | 57,659 |
| Xometry, Inc. - A * | 3,608 | 116,286 |
| 173,945 | ||
| Distributors — 0.52% | ||
| LKQ Corp. | 1,263 | 67,457 |
| Total CONSUMER DISCRETIONARY (Cost $1,771,297) | 1,831,196 | |
| FINANCIALS — 5.23% | ||
| Insurance — 4.76% | ||
| Everest Re Group Ltd. 1 | 307 | 101,700 |
| Kinsale Capital Group, Inc. | 1,110 | 290,287 |
| Ryan Specialty Holdings, Inc. * | 2,955 | 122,662 |
| W. R. Berkley Corp. | 1,399 | 101,526 |
| 616,175 | ||
| Banks — 0.47% | ||
| Wintrust Financial Corp. | 718 | 60,685 |
| Total FINANCIALS (Cost $601,671) | 676,860 | |
| Shares, Principal Amount, or Number of Contracts | Value | |
| ENERGY — 4.00% | ||
| Oil, Gas & Consumable Fuels — 2.10% | ||
| Cameco Corp. 1 | 5,379 | $121,942 |
| Diamondback Energy, Inc. | 583 | 79,743 |
| New Fortress Energy, Inc. | 1,635 | 69,356 |
| 271,041 | ||
| Energy Equipment & Services — 1.90% | ||
| Helmerich & Payne, Inc. | 827 | 40,994 |
| ProFrac Holding Corp. - A * | 5,391 | 135,853 |
| TechnipFMC PLC 1,* | 5,697 | 69,447 |
| 246,294 | ||
| Total ENERGY (Cost $418,071) | 517,335 | |
| COMMUNICATION SERVICES — 3.93% | ||
| Entertainment — 2.05% | ||
| Liberty Media Corp.-Liberty Formula One - C * | 1,482 | 88,594 |
| Warner Music Group Corp. - A | 2,961 | 103,694 |
| World Wrestling Entertainment, Inc. - A | 1,070 | 73,317 |
| 265,605 | ||
| Interactive Media & Services — 1.06% | ||
| Pinterest, Inc. - A * | 5,673 | 137,740 |
| Diversified Telecommunication Services — 0.82% | ||
| Iridium Communications, Inc. * | 2,054 | 105,576 |
| Total COMMUNICATION SERVICES (Cost $492,408) | 508,921 | |
| CONSUMER STAPLES — 3.85% | ||
| Food & Staples Retailing — 1.45% | ||
| BJ's Wholesale Club Holdings, Inc. * | 584 | 38,638 |
| Performance Food Group Co. * | 2,547 | 148,719 |
| 187,357 | ||
| Food Products — 1.35% | ||
| Lamb Weston Holdings, Inc. | 1,953 | 174,520 |
| Beverages — 1.05% | ||
| Celsius Holdings, Inc. * | 1,306 | 135,876 |
| Total CONSUMER STAPLES (Cost $425,186) | 497,753 | |
| MATERIALS — 1.27% | ||
| Metals & Mining — 1.27% | ||
| ATI, Inc. * | 4,997 | 149,210 |
| MP Materials Corp. * | 602 | 14,617 |
| 163,827 | ||
| Total MATERIALS (Cost $165,177) | 163,827 | |
| Shares, Principal Amount, or Number of Contracts | Value | ||
| REAL ESTATE — 0.31% | |||
| Equity Real Estate Investment Trusts — 0.31% | |||
| Ryman Hospitality Properties, Inc. | 486 | $39,745 | |
| Total REAL ESTATE (Cost $42,923) | 39,745 | ||
| Total COMMON STOCKS (Cost $11,701,845) | 12,756,486 | ||
| SHORT TERM INVESTMENTS — 1.68% | |||
| Northern Institutional Government Portfolio (Shares Class), 3.73% 2 (Cost $217,423) | 217,423 | 217,423 | |
| TOTAL INVESTMENTS (Cost $11,919,268) | 100.31% | $12,973,909 | |
| Liabilities In Excess of Other Assets | (0.31)% | (40,466) | |
| Net Assets | 100.00% | $12,933,443 | |
| ADR | American Depositary Receipt |
| PLC | Public Limited Company |
| 1 | Foreign security denominated and/or traded in U.S. dollars. |
| 2 | 7 day current yield as of December 31, 2022 is disclosed. |
| * | Non-income producing security. |
| Security Type | Percent of Net Assets | |
| Common Stocks | 98.63% | |
| Short Term Investments | 1.68% | |
| Total Investments | 100.31% | |
| Liabilities In Excess of Other Assets | (0.31)% | |
| Net Assets | 100.00% |
| Industry | Percent of Net Assets | |
| Aerospace & Defense | 3.46% | |
| Auto Components | 3.40% | |
| Banks | 0.47% | |
| Beverages | 1.05% | |
| Biotechnology | 11.78% | |
| Building Products | 1.00% | |
| Commercial Services & Supplies | 3.86% | |
| Communications Equipment | 2.93% | |
| Construction & Engineering | 7.43% | |
| Distributors | 0.52% | |
| Diversified Telecommunication Services | 0.82% | |
| Electrical Equipment | 1.03% | |
| Electronic Equipment, Instruments & Components | 0.98% | |
| Energy Equipment & Services | 1.90% | |
| Entertainment | 2.05% | |
| Equity Real Estate Investment Trusts | 0.31% | |
| Food & Staples Retailing | 1.45% | |
| Food Products | 1.35% | |
| Health Care Equipment & Supplies | 4.54% | |
| Health Care Providers & Services | 1.47% |
| Industry | Percent of Net Assets | |
| Hotels, Restaurants & Leisure | 3.05% | |
| Insurance | 4.76% | |
| Interactive Media & Services | 1.06% | |
| Internet & Direct Marketing Retail | 1.35% | |
| IT Services | 2.54% | |
| Machinery | 3.82% | |
| Metals & Mining | 1.27% | |
| Money Market Fund | 1.68% | |
| Oil, Gas & Consumable Fuels | 2.10% | |
| Professional Services | 3.07% | |
| Road & Rail | 1.41% | |
| Semiconductors & Semiconductor Equipment | 9.45% | |
| Software | 6.61% | |
| Specialty Retail | 3.66% | |
| Textiles, Apparel & Luxury Goods | 2.18% | |
| Trading Companies & Distributors | 0.50% | |
| Liabilities In Excess of Other Assets | (0.31)% | |
| TOTAL | 100.00% |
 |  |  |
| Michael Caldwell Portfolio Manager | Tom McCauley Portfolio Manager | Yoav Sharon Portfolio Manager |
| Average Annual Total Returns as of 12/31/22 | 1 Year | 3 Years | 5 Years | Since Inception (8/26/13 - 12/31/22) |
| Driehaus Event Driven Fund (DEVDX)1 | -9.98% | 6.41% | 6.69% | 4.92% |
| S&P 500 Index2 | -18.11% | 7.66% | 9.42% | 11.47% |
| FTSE 3-Month T-Bill Index3 | 1.50% | 0.71% | 1.25% | 0.79% |
| 1 | The returns for the periods prior to March 1, 2014, reflect fee waivers and/or reimbursements without which performance would have been lower. |
| 2 | The S&P 500 Index consists of 500 stocks chosen for market size, liquidity and industry group. It is a market-weighted index, with each stock’s weight in the index proportionate to its market value. |
| 3 | The FTSE 3-Month T-Bill Index is designed to mirror the performance of the 3-month U.S. Treasury Bill. The FTSE 3-Month T-Bill Index is unmanaged and its returns reflect reinvestment of all distributions and changes in market prices. |
| Shares, Principal Amount, or Number of Contracts | Value | |
| BANK LOANS — 5.96% | ||
| Leisure Facilities & Services — 5.96% | ||
| Playa Resorts Holding B.V., 2022 Term Loan 1/5/29 1,2,3,4 | $3,019,000 | $2,937,879 |
| Playa Resorts Holding B.V., 2022 Term Loan 8.57%, (1-Month USD CME Term SOFR+425 basis points), 1/5/29 1,2,3 | 3,700,000 | 3,600,581 |
| Topgolf International, Inc., Initial Term Loan 10.58%, (1-Month USD Libor+625 basis points), 2/9/26 1 | 5,684,837 | 5,647,545 |
| 12,186,005 | ||
| Total BANK LOANS (Cost $12,194,216) | 12,186,005 | |
| CORPORATE BONDS — 27.75% | ||
| Commercial Support Services — 5.34% | ||
| Arrow Bidco LLC 9.50%, 3/15/24 5,6 | 10,931,000 | 10,904,740 |
| Electric Utilities — 4.03% | ||
| Vistra Corp. 7.00%, (U.S. Treasury Yield Curve Rate CMT 5Y + 574 basis points), 12/15/26 5,6,7,8 | 9,050,000 | 8,234,896 |
| Leisure Facilities & Services — 11.60% | ||
| Cinemark USA, Inc. 5.25%, 7/15/28 5,6 | 13,921,000 | 10,337,595 |
| Golden Entertainment, Inc. 7.62%, 4/15/26 5 | 13,543,000 | 13,348,200 |
| 23,685,795 | ||
| Oil & Gas Producers — 3.68% | ||
| Calumet Specialty Products Partners L.P./Calumet Finance Corp. 11.00%, 4/15/25 5 | 7,212,000 | 7,516,536 |
| Retail - Discretionary — 1.21% | ||
| Kohl's Corp. 3.63%, 5/1/31 | 3,534,000 | 2,473,800 |
| Technology Services — 1.89% | ||
| MoneyGram International, Inc. 5.37%, 8/1/26 5,6 | 3,815,000 | 3,867,104 |
| Total CORPORATE BONDS (Cost $60,145,210) | 56,682,871 | |
| COMMON STOCKS — 49.27% | ||
| Asset Management — 6.50% | ||
| Corazon Capital V838 Monoceros Corp. - A 6,* | 189,734 | 1,916,313 |
| First Light Acquisition Group, Inc. - A * | 68,127 | 692,852 |
| Shares, Principal Amount, or Number of Contracts | Value | |
| FTAC Zeus Acquisition Corp. - A * | 133,692 | $1,350,289 |
| Live Oak Mobility Acquisition Corp. - A 6,* | 214,262 | 2,154,404 |
| Logistics Innovation Technologies Corp. - A * | 192,225 | 1,941,473 |
| Screaming Eagle Acquisition Corp. - A * | 525,785 | 5,228,932 |
| 13,284,263 | ||
| Banking — 10.91% | ||
| Berkshire Hills Bancorp, Inc. 6 | 231,506 | 6,922,029 |
| Blue Foundry Bancorp 6,* | 446,396 | 5,736,189 |
| HarborOne Bancorp, Inc. 6 | 190,790 | 2,651,981 |
| Kearny Financial Corp./MD 6 | 686,270 | 6,965,641 |
| 22,275,840 | ||
| Biotechnology & Pharmaceuticals — 9.02% | ||
| Ascendis Pharma A/S - ADR 2,6,* | 13,514 | 1,650,465 |
| Biohaven Ltd. * | 71,277 | 989,325 |
| Crinetics Pharmaceuticals, Inc. * | 324,621 | 5,940,564 |
| DICE Therapeutics, Inc. 6,* | 77,220 | 2,409,264 |
| Relay Therapeutics, Inc. 6,* | 159,877 | 2,388,562 |
| Xenon Pharmaceuticals, Inc. 2,6,* | 128,193 | 5,054,650 |
| 18,432,830 | ||
| Entertainment Content — 1.54% | ||
| Activision Blizzard, Inc. | 41,196 | 3,153,554 |
| Holding Companies - Diversified — 0.00% | ||
| Flag U Founders 9,*,^ | 24,357 | 0 |
| Industrial Intermediate Products — 1.30% | ||
| Hillman Solutions Corp. 6,* | 368,616 | 2,657,721 |
| Industrial Support Services — 6.28% | ||
| Triton International Ltd. 2 | 46,634 | 3,207,487 |
| WillScot Mobile Mini Holdings Corp. 6,* | 212,837 | 9,613,847 |
| 12,821,334 | ||
| Leisure Facilities & Services — 7.54% | ||
| Golden Entertainment, Inc. 6,* | 297,989 | 11,144,789 |
| MGM Resorts International | 62,786 | 2,105,214 |
| Playa Hotels & Resorts NV 2,* | 328,860 | 2,147,456 |
| 15,397,459 | ||
| Leisure Products — 1.36% | ||
| Topgolf Callaway Brands Corp. * | 140,660 | 2,778,035 |
| Retail - Consumer Staples — 1.55% | ||
| Albertsons Cos, Inc. - A | 152,357 | 3,159,884 |
| Transportation & Logistics — 3.27% | ||
| Atlas Air Worldwide Holdings, Inc. * | 51,554 | 5,196,643 |
| RXO, Inc. 6,* | 29,442 | 506,403 |
| Shares, Principal Amount, or Number of Contracts | Value | |
| XPO Logistics, Inc. 6,* | 29,442 | $980,124 |
| 6,683,170 | ||
| Total COMMON STOCKS (Cost $99,764,029) | 100,644,090 | |
| PREFERRED STOCKS — 1.09% | ||
| Telecommunications — 1.09% | ||
| Telephone and Data Systems, Inc. 10 | 22,999 | 338,545 |
| Telephone and Data Systems, Inc. 6.00%, 10 | 143,604 | 1,881,213 |
| Total PREFERRED STOCKS (Cost $4,001,820) | 2,219,758 | |
| WARRANTS — 0.06% | ||
| Corazon Capital V838 Monoceros Corp. - A, Exp. 12/31/28, Strike $11.50 * | 53,713 | 591 |
| Deep Lake Capital Acquisition Corp. - B, Exp. 12/31/27, Strike $11.50 * | 10,795 | 38 |
| EQRx, Inc., Exp. 12/31/28, Strike $11.50 * | 26,680 | 7,148 |
| First Light Acquisition Group, Inc., Exp. 10/7/23, Strike $11.50 * | 193,125 | 5,330 |
| FTAC Zeus Acquisition Corp. - A, Exp. 11/23/26, Strike $.00 * | 66,846 | 1,337 |
| Inspirato, Inc., Exp. 1/1/30, Strike $11.50 * | 35,733 | 3,141 |
| Jack Creek Investment Corp., Exp. 12/31/27, Strike $11.50 * | 151,497 | 31,830 |
| Live Oak Mobility Acquisition Corp., Exp. 3/4/28, Strike $11.50 * | 42,851 | 5,999 |
| Logistics Innovation Technologies Corp., Exp. 6/15/28, Strike $11.50 * | 64,075 | 1,922 |
| Pagaya Technologies Ltd., Exp. 5/31/27, Strike $.00 * | 121,900 | 10,947 |
| Screaming Eagle Acquisition Corp. - A, Exp. 5/1/27, Strike $11.50 * | 175,261 | 41,309 |
| Senior Connect Acquisition Corp. I - A, Exp. 12/31/27, Strike $11.50 * | 62,919 | 3,781 |
| SomaLogic, Inc., Exp. 12/31/27, Strike $11.50 * | 22,690 | 9,076 |
| X4 Pharmaceuticals, Inc., Exp. 4/12/24, Strike $13.20 * | 5,547 | 65 |
| ZeroFox Holdings, Inc., Exp. 5/23/27, Strike $11.50 * | 65,250 | 9,885 |
| Total WARRANTS (Cost $9,328) | 132,399 | |
| Shares, Principal Amount, or Number of Contracts | Value | ||
| SHORT TERM INVESTMENTS — 14.02% | |||
| Northern Institutional Treasury Portfolio (Premier Class), 3.75% 11 (Cost $28,640,226) | 28,640,226 | $28,640,226 | |
| TOTAL INVESTMENTS (Cost $204,754,829) | 98.15% | $200,505,349 | |
| Other Assets In Excess of Liabilities | 1.85% | 3,783,513 | |
| Net Assets | 100.00% | $204,288,862 | |
| INVESTMENT SECURITIES SOLD SHORT — (8.68)% | |||
| EXCHANGE-TRADED FUNDS — (8.68)% | |||
| Global X US Infrastructure Development ETF | (34,526) | (914,593) | |
| iShares S&P Mid-Cap 400 Value ETF | (8,901) | (897,221) | |
| SPDR S&P Biotech ETF * | (79,187) | (6,572,521) | |
| SPDR S&P Regional Banking ETF | (159,162) | (9,349,176) | |
| Total EXCHANGE-TRADED FUNDS (Proceeds $23,667,538) | (17,733,511) | ||
| TOTAL INVESTMENT SECURITIES SOLD SHORT (Proceeds $23,667,538) | (8.68)% | $(17,733,511) | |
| ADR | American Depositary Receipt |
| CMT | Constant Maturity |
| 1 | Bank loans in which the Fund invests pay interest at rates which are periodically predetermined by reference to a base lending rate plus a premium. These base lending rates are generally (i) the lending rate offered by one or more major European banks, such as the London Inter-Bank Offered Rate (“LIBOR”), (ii) the prime rate offered by one or more United States banks or (iii) the certificate of deposit rate. Certain bank loans are subject to a LIBOR floor that establishes a minimum LIBOR rate. The interest rate shown reflects the rate in effect at December 31, 2022. Bank loans generally are subject to mandatory and/or optional repayment. As a result, the actual remaining maturity may be substantially less than the stated maturities shown. |
| 2 | Foreign security denominated and/or traded in U.S. dollars. |
| 3 | Foreign security, par value shown in local currency. |
| 4 | Position is unsettled. Contract rate was not determined at December 31, 2022 and does not take effect until settlement date. |
| 5 | Security is exempt from registration under Rule 144A of the Securities Act of 1933, as amended. The total value of these securities is $54,209,071, which represents 27% of Net Assets (see Note F in the Notes to Financial Statements). |
| 6 | All or a portion of this security is pledged as collateral for short sales or derivatives transactions. |
| 7 | Perpetual security. Maturity date shown is the next call date or final legal maturity date, whichever comes first. |
| 8 | Variable rate security. Rates disclosed as of December 31, 2022. |
| 9 | Special Purpose Acquisition Company (SPAC). |
| 10 | Current yield is disclosed. Dividends are calculated based on a percentage of the issuer’s net income. |
| 11 | 7 day current yield as of December 31, 2022 is disclosed. |
| ^ | Security valued at fair value as determined in good faith by the Adviser, in accordance with procedures established by, and under the general supervision of, the Trust’s Board of Trustee. The security is valued using significant unobservable inputs. |
| * | Non-income producing security. |
| Security Type | Percent of Net Assets | |
| Bank Loans | 5.96% | |
| Corporate Bonds | 27.75% | |
| Common Stocks | 49.27% | |
| Preferred Stocks | 1.09% | |
| Warrants | 0.06% | |
| Short Term Investments | 14.02% | |
| Total Investments | 98.15% | |
| Other Assets In Excess of Liabilities | 1.85% | |
| Net Assets | 100.00% |
| Pay Rate Index/Pay Rate | Receive Rate/Receive Rate Index | Maturity Date | Counterparty | Currency | Notional Amount | Value | Upfront Premiums Paid/ (Received) | Unrealized Appreciation (Depreciation) | ||
| S&P GSCI | Financing Index: 1-Month ICE LIBOR USD - 0.5% | 1/23/2023 | GSC | USD | 206,083 | $111,789 | $— | $111,789 | ||
| Financing Index: 1-Day US Federal Fund Effective Rate + 0.6% | Cannae Holdings, Inc. (Monthly) | 8/28/2023 | GSC | USD | 1,095,403 | 186,250 | — | 186,250 | ||
| Financing Index: 1-Month ICE LIBOR USD + 0.6% | Cannae Holdings, Inc. (Monthly) | 8/28/2023 | GSC | USD | 131,747 | 22,817 | — | 22,817 | ||
| Subtotal Appreciation | $320,856 | $— | $320,856 | |||||||
| 3-Day S&P GSCI | Financing Index: 1-Day US Federal Fund Effective Rate - 0.5% | 8/28/2023 | GSC | USD | 1,081,933 | $(178,528) | $— | $(178,528) | ||
| 3-Day S&P GSCI | Financing Index: 1-Month ICE LIBOR USD - 0.5% | 8/28/2023 | GSC | USD | 131,747 | (21,611) | — | (21,611) | ||
| Subtotal Depreciation | $(200,139) | $— | $(200,139) | |||||||
| Net Total Return Swaps outstanding at December 31, 2022 | $120,717 | $— | $120,717 | |||||||
| GSC - Goldman Sachs International | ||||||||||
| Driehaus Emerging Markets Growth Fund | Driehaus Emerging Markets Small Cap Growth Fund | ||
| ASSETS: | |||
| Investments, at cost | $1,783,894,213 | $91,261,865 | |
| Investments securities, at fair value | $1,950,355,904 | $97,097,872 | |
| Short-term securities, at fair value1 | 104,173,837 | 6,732,347 | |
| Warrant securities, at fair value2 | — | — | |
| Foreign currency, at fair value3 | 7,699,645 | 363,584 | |
| Unrealized appreciation on open OTC swap contracts | — | — | |
| Cash | — | — | |
| Deposit at broker for securities sold short | — | — | |
| Receivable for investment securities sold | 16,938,343 | — | |
| Receivable for foreign capital gains taxes | — | 709,685 | |
| Receivable for fund shares sold | 1,372,024 | 40,864 | |
| Receivable for interest and dividends | 4,327,096 | 112,890 | |
| Due from broker | — | — | |
| Due from affiliates | — | — | |
| Prepaid expenses | 213,172 | 18,974 | |
| TOTAL ASSETS | 2,085,080,021 | 105,076,216 | |
| LIABILITIES: | |||
| Payable for investment securities sold short, proceeds | — | — | |
| Payable for investment securities sold short, at fair value | — | — | |
| Unrealized depreciation on open OTC swap contracts | — | — | |
| Payable for fund shares redeemed | 2,526,368 | 40,370 | |
| Payable for investment securities purchased | 20,540,914 | 2,263,841 | |
| Advisory fees payable, net | 1,659,767 | 72,742 | |
| Payable for interest and dividends on securities sold short | — | — | |
| Accrued shareholder services plan fees | 263,886 | — | |
| Accrued administration and accounting fees | 204,318 | 19,736 | |
| Accrued foreign capital gains taxes | 2,941,023 | — | |
| Accrued expenses | 228,493 | 50,722 | |
| TOTAL LIABILITIES | 28,364,769 | 2,447,411 | |
| NET ASSETS | $2,056,715,252 | $102,628,805 | |
| NET ASSETS CONSISTED OF THE FOLLOWING AT DECEMBER 31, 2022: | |||
| Paid-in-capital | $2,124,309,828 | $127,935,028 | |
| Total distributable earnings (deficit) | (67,594,576) | (25,306,223) | |
| NET ASSETS | $2,056,715,252 | $102,628,805 | |
| NET ASSETS | $— | $102,628,805 | |
| SHARES OUTSTANDING (Unlimited shares authorized, no par value) | — | 5,887,574 | |
| NET ASSET VALUE | $— | $17.43 | |
| INVESTOR CLASS SHARES | |||
| NET ASSETS | $572,322,689 | $— | |
| SHARES OUTSTANDING (Unlimited shares authorized, no par value) | 18,062,120 | — | |
| NET ASSET VALUE | $31.69 | $— | |
| INSTITUTIONAL CLASS SHARES | |||
| NET ASSETS | $1,484,392,563 | $— | |
| SHARES OUTSTANDING (Unlimited shares authorized, no par value) | 46,558,184 | — | |
| NET ASSET VALUE | $31.88 | $— | |
| 1 | The cost of short-term securities was $104,173,837, $6,732,347, $3,554,812, $3,209,891, $1,090,197, $4,715,294, $217,423 and $28,640,226, respectively. |
| 2 | The cost of warrants was $0, $0, $0, $0, $0, $0, $0 and $9,328, respectively. |
| 3 | The cost of foreign currency was $7,794,300, $363,410, $2,303, $1,687, $0, $0, $0 and $0, respectively. |
| Driehaus Emerging Markets Opportunities Fund | Driehaus International Small Cap Growth Fund | Driehaus Micro Cap Growth Fund | Driehaus Small Cap Growth Fund | Driehaus Small/Mid Cap Growth Fund | Driehaus Event Driven Fund | |||||
| $39,572,864 | $203,576,063 | $145,782,548 | $404,481,387 | $11,701,845 | $176,105,275 | |||||
| $42,554,124 | $212,984,342 | $175,423,557 | $448,207,859 | $12,756,486 | $171,732,724 | |||||
| 3,554,812 | 3,209,891 | 1,090,197 | 4,715,294 | 217,423 | 28,640,226 | |||||
| — | — | 7,641 | — | — | 132,399 | |||||
| 2,300 | 1,688 | — | — | — | — | |||||
| — | — | — | — | — | 320,856 | |||||
| 461,971 | — | — | — | — | — | |||||
| — | — | — | — | — | 22,834,399 | |||||
| 18 | — | — | 976,558 | 21,663 | 14,766 | |||||
| — | — | — | — | — | — | |||||
| 2,820 | 209,397 | 4,673 | 344,871 | 1,305 | 193,533 | |||||
| 266,985 | 682,555 | 16,312 | 34,353 | 1,230 | 2,459,970 | |||||
| — | — | — | — | — | 90,968 | |||||
| — | — | — | — | 1,867 | — | |||||
| 12,915 | 27,383 | 35,684 | 67,331 | 8,177 | 35,101 | |||||
| 46,855,945 | 217,115,256 | 176,578,064 | 454,346,266 | 13,008,151 | 226,454,942 | |||||
| — | — | — | — | — | 23,667,538 | |||||
| — | — | — | — | — | 17,733,511 | |||||
| — | — | — | — | — | 200,139 | |||||
| — | 44,990 | 119,023 | 540,204 | — | 423,815 | |||||
| 100,495 | — | — | — | 41,631 | 3,482,045 | |||||
| 16,691 | 186,822 | 192,420 | 235,938 | — | 174,286 | |||||
| — | — | — | — | — | 4,858 | |||||
| — | — | — | 25,850 | — | 71,142 | |||||
| 6,396 | 19,968 | 16,930 | 37,069 | 6,288 | 12,924 | |||||
| 48,695 | — | — | — | — | — | |||||
| 41,355 | 49,216 | 41,241 | 68,898 | 26,789 | 63,360 | |||||
| 213,632 | 300,996 | 369,614 | 907,959 | 74,708 | 22,166,080 | |||||
| $46,642,313 | $216,814,260 | $176,208,450 | $453,438,307 | $12,933,443 | $204,288,862 | |||||
| $47,104,716 | $248,564,723 | $165,404,053 | $535,764,358 | $15,810,766 | $217,736,714 | |||||
| (462,403) | (31,750,463) | 10,804,397 | (82,326,051) | (2,877,323) | (13,447,852) | |||||
| $46,642,313 | $216,814,260 | $176,208,450 | $453,438,307 | $12,933,443 | $204,288,862 | |||||
| $46,642,313 | $216,814,260 | $176,208,450 | $— | $12,933,443 | $204,288,862 | |||||
| 4,117,445 | 27,455,148 | 17,535,280 | — | 1,042,413 | 17,324,213 | |||||
| $11.33 | $7.90 | $10.05 | $— | $12.41 | $11.79 | |||||
| $— | $— | $— | $67,143,425 | $— | $— | |||||
| — | — | — | 4,376,976 | — | — | |||||
| $— | $— | $— | $15.34 | $— | $— | |||||
| $— | $— | $— | $386,294,882 | $— | $— | |||||
| — | — | — | 24,703,222 | — | — | |||||
| $— | $— | $— | $15.64 | $— | $— | |||||
| Driehaus Emerging Markets Growth Fund | Driehaus Emerging Markets Small Cap Growth Fund | ||
| INVESTMENT INCOME: | |||
| Interest income1 | $1,614,725 | $70,860 | |
| Dividend income2 | 38,616,574 | 1,788,178 | |
| Non-cash dividend income | 2,874,635 | — | |
| Total investment income | 43,105,934 | 1,859,038 | |
| Expenses: | |||
| Investment advisory fees | 19,387,811 | 1,154,167 | |
| Shareholder services fees | 1,568,557 | — | |
| Administration fees | 666,955 | 35,980 | |
| Transfer agent fees | 214,528 | 11,546 | |
| Trustees fees | 497,933 | 26,900 | |
| Custody fees | 579,550 | 68,380 | |
| Reports to shareholders | 101,027 | 7,256 | |
| Professional fees | 376,956 | 57,576 | |
| Audit and tax fees | 108,604 | 66,862 | |
| Federal and state registration fees | 68,394 | 22,771 | |
| Dividends and interest on short positions | — | — | |
| Miscellaneous | 338,718 | 59,755 | |
| Total expenses | 23,909,033 | 1,511,193 | |
| Investment advisory fees recoupment (reimbursement) | — | (207,973) | |
| Fees paid indirectly | (284,955) | (2,159) | |
| Net expenses | 23,624,078 | 1,301,061 | |
| Net investment income (loss) | 19,481,856 | 557,977 | |
| NET REALIZED AND UNREALIZED GAIN (LOSS) ON INVESTMENT TRANSACTIONS: | |||
| Net realized gain (loss) on transactions from: | |||
| Investments3 | (188,963,856) | (10,860,850) | |
| Warrants | — | — | |
| Purchased options contracts | — | — | |
| Securities sold short | — | — | |
| Written options contracts | — | — | |
| Swap contracts | — | — | |
| Foreign currency | (3,121,524) | (70,620) | |
| Net realized gain (loss) on investment transactions | (192,085,380) | (10,931,470) | |
| Change in net unrealized appreciation (depreciation) on: | |||
| Investments4 | (355,037,886) | (15,208,214) | |
| Warrants | — | — | |
| Securities sold short | — | — | |
| Swap contracts | — | — | |
| Foreign currency | (234,775) | (82,078) | |
| Net change in unrealized appreciation (depreciation) on investment transactions | (355,272,661) | (15,290,292) | |
| Net realized and unrealized gain (loss) on investment transactions | (547,358,041) | (26,221,762) | |
| NET INCREASE (DECREASE) IN NET ASSETS FROM OPERATIONS | $(527,876,185) | $(25,663,785) | |
| 1 | Net of $0, $0, $2,377, $0, $0, $0, $0 and $0 of non-reclaimable foreign taxes withheld, respectively. |
| 2 | Net of $5,217,564, $154,778, $103,845, $532,892, $0, $13,715, $791 and $0 of non-reclaimable foreign taxes withheld, respectively. |
| 3 | Net realized gain (loss) on transactions from investments are net of $3,687,703, $311,395, $33,727, $0, $0, $0, $0 and $0 of foreign capital gains taxes, respectively. |
| 4 | Change in net unrealized appreciation (depreciation) on investments are net of $2,326,501, $792,813, $67,733, $0, $0, $0, $0 and $0 of change in deferred foreign capital gains taxes, respectively. |
| Driehaus Emerging Markets Opportunities Fund | Driehaus International Small Cap Growth Fund | Driehaus Micro Cap Growth Fund | Driehaus Small Cap Growth Fund | Driehaus Small/Mid Cap Growth Fund | Driehaus Event Driven Fund | |||||
| $554,468 | $85,792 | $53,443 | $100,927 | $1,598 | $3,691,419 | |||||
| 759,301 | 4,515,860 | 1,020,181 | 1,997,830 | 72,727 | 2,453,754 | |||||
| 75,345 | — | — | — | — | — | |||||
| 1,389,114 | 4,601,652 | 1,073,624 | 2,098,757 | 74,325 | 6,145,173 | |||||
| 433,106 | 2,445,663 | 2,689,241 | 2,952,515 | 95,279 | 1,988,353 | |||||
| — | — | — | 157,761 | — | 381,107 | |||||
| 16,157 | 81,200 | 69,263 | 169,431 | 5,110 | 68,373 | |||||
| 5,199 | 26,160 | 22,388 | 54,378 | 1,653 | 20,484 | |||||
| 12,133 | 60,478 | 52,784 | 124,393 | 3,983 | 49,897 | |||||
| 21,615 | 39,415 | 33,103 | 46,753 | 19,305 | 18,328 | |||||
| 2,947 | 9,930 | 7,828 | 39,306 | 2,589 | 18,732 | |||||
| 57,601 | 59,711 | 53,232 | 100,005 | 17,437 | 61,543 | |||||
| 46,444 | 25,929 | 32,700 | 32,700 | 32,700 | 48,800 | |||||
| 22,183 | 26,339 | 27,133 | 61,063 | 20,704 | 35,715 | |||||
| — | — | — | — | — | 604,408 | |||||
| 37,925 | 80,717 | 78,504 | 109,135 | 45,607 | 62,997 | |||||
| 655,310 | 2,855,542 | 3,066,176 | 3,847,440 | 244,367 | 3,358,737 | |||||
| (174,550) | — | — | — | (87,616) | — | |||||
| (4,343) | (12,224) | (111,859) | (184,230) | (5,893) | (64,164) | |||||
| 476,417 | 2,843,318 | 2,954,317 | 3,663,210 | 150,858 | 3,294,573 | |||||
| 912,697 | 1,758,334 | (1,880,693) | (1,564,453) | (76,533) | 2,850,600 | |||||
| (2,425,922) | (42,370,916) | (14,963,242) | (120,425,635) | (3,577,319) | (20,761,230) | |||||
| — | — | 3,258 | — | — | (236,545) | |||||
| 158,010 | — | — | — | — | (686,386) | |||||
| — | — | — | — | — | 9,024,604 | |||||
| — | — | — | — | — | 202,096 | |||||
| (89,677) | — | — | — | — | 590,718 | |||||
| (14,296) | (93,849) | — | — | — | — | |||||
| (2,371,885) | (42,464,765) | (14,959,984) | (120,425,635) | (3,577,319) | (11,866,743) | |||||
| (9,203,865) | (40,021,369) | (93,950,906) | (98,418,522) | (3,707,745) | (15,568,923) | |||||
| — | — | (28,317) | — | — | (641,900) | |||||
| — | — | — | — | — | 3,822,845 | |||||
| — | — | — | — | — | 158,635 | |||||
| 4,763 | (29,705) | — | — | — | — | |||||
| (9,199,102) | (40,051,074) | (93,979,223) | (98,418,522) | (3,707,745) | (12,229,343) | |||||
| (11,570,987) | (82,515,839) | (108,939,207) | (218,844,157) | (7,285,064) | (24,096,086) | |||||
| $(10,658,290) | $(80,757,505) | $(110,819,900) | $(220,408,610) | $(7,361,597) | $(21,245,486) | |||||
| Driehaus Emerging Markets Growth Fund | Driehaus Emerging Markets Small Cap Growth Fund | ||||||
| For the year ended December 31, 2022 | For the year ended December 31, 2021 | For the year ended December 31, 2022 | For the year ended December 31, 2021 | ||||
| INCREASE (DECREASE) IN NET ASSETS: | |||||||
| Operations: | |||||||
| Net investment income (loss) | $19,481,856 | $307,977 | $557,977 | $294,442 | |||
| Net realized gain (loss) on investment transactions | (192,085,380) | 189,076,575 | (10,931,470) | 18,667,537 | |||
| Net change in unrealized appreciation (depreciation) on investment transactions | (355,272,661) | (241,356,919) | (15,290,292) | (3,691,089) | |||
| Net increase (decrease) in net assets resulting from operations | (527,876,185) | (51,972,367) | (25,663,785) | 15,270,890 | |||
| Distributions from distributable earnings to shareholders: | |||||||
| Fund | — | — | — | (49,512) | |||
| Investor Class Shares | (4,378,459) | (124,720,312) | — | — | |||
| Institutional Class Shares | (9,874,900) | (219,579,683) | — | — | |||
| Total distributions to shareholders | (14,253,359) | (344,299,995) | — | (49,512) | |||
| Capital share transactions: | |||||||
| Proceeds from shares sold: | |||||||
| Fund | — | — | 33,164,101 | 27,161,675 | |||
| Investor Class | 112,615,114 | 114,382,649 | — | — | |||
| Institutional Class | 619,503,005 | 456,095,754 | — | — | |||
| Reinvestment of distributions: | |||||||
| Fund | — | — | — | 43,116 | |||
| Investor Class | 4,133,447 | 120,092,702 | — | — | |||
| Institutional Class | 8,864,468 | 196,637,512 | — | — | |||
| Cost of shares redeemed: | |||||||
| Fund | — | — | (21,520,461) | (15,512,569) | |||
| Investor Class | (199,869,549) | (201,365,699) | — | — | |||
| Institutional Class | (273,542,521) | (245,809,899) | — | — | |||
| Redemption fees: | |||||||
| Fund | — | — | 4,569 | 1,535 | |||
| Investor Class | 19,130 | 23,718 | — | — | |||
| Institutional Fund | 17,659 | 58,326 | — | — | |||
| Net increase (decrease) in net assets resulting from capital transactions | 271,740,753 | 440,115,063 | 11,648,209 | 11,693,757 | |||
| Total increase (decrease) in net assets | (270,388,791) | 43,842,701 | (14,015,576) | 26,915,135 | |||
| NET ASSETS: | |||||||
| Beginning of period | $2,327,104,043 | $2,283,261,342 | $116,644,381 | $89,729,246 | |||
| End of period | $2,056,715,252 | $2,327,104,043 | $102,628,805 | $116,644,381 | |||
| Driehaus Emerging Markets Opportunities Fund | Driehaus International Small Cap Growth Fund | Driehaus Micro Cap Growth Fund | ||||||||
| For the year ended December 31, 2022 | For the year ended December 31, 2021 | For the year ended December 31, 2022 | For the year ended December 31, 2021 | For the year ended December 31, 2022 | For the year ended December 31, 2021 | |||||
| $912,697 | $564,274 | $1,758,334 | $1,032,830 | $(1,880,693) | $(4,776,419) | |||||
| (2,371,885) | 441,572 | (42,464,765) | 63,535,651 | (14,959,984) | 114,688,268 | |||||
| (9,199,102) | (1,660,053) | (40,051,074) | (29,892,096) | (93,979,223) | (32,720,786) | |||||
| (10,658,290) | (654,207) | (80,757,505) | 34,676,385 | (110,819,900) | 77,191,063 | |||||
| (960,775) | (3,192,791) | (12,266,913) | (72,600,000) | (13,811,619) | (123,999,999) | |||||
| — | — | — | — | — | — | |||||
| — | — | — | — | — | — | |||||
| (960,775) | (3,192,791) | (12,266,913) | (72,600,000) | (13,811,619) | (123,999,999) | |||||
| 4,162,890 | 11,548,706 | 27,792,245 | 68,316,473 | 5,804,663 | 5,932,222 | |||||
| — | — | — | — | — | — | |||||
| — | — | — | — | — | — | |||||
| 445,299 | 3,192,291 | 10,992,388 | 64,761,613 | 10,997,421 | 89,300,107 | |||||
| — | — | — | — | — | — | |||||
| — | — | — | — | — | — | |||||
| (4,075,496) | (6,387,891) | (61,260,240) | (51,696,847) | (57,231,601) | (41,545,106) | |||||
| — | — | — | — | — | — | |||||
| — | — | — | — | — | — | |||||
| 1,119 | — | 2,146 | — | 235 | — | |||||
| — | — | — | — | — | — | |||||
| — | — | — | — | — | — | |||||
| 533,812 | 8,353,106 | (22,473,461) | 81,381,239 | (40,429,282) | 53,687,223 | |||||
| (11,085,253) | 4,506,108 | (115,497,879) | 43,457,624 | (165,060,801) | 6,878,287 | |||||
| $57,727,566 | $53,221,458 | $332,312,139 | $288,854,515 | $341,269,251 | $334,390,964 | |||||
| $46,642,313 | $57,727,566 | $216,814,260 | $332,312,139 | $176,208,450 | $341,269,251 | |||||
| Driehaus Small Cap Growth Fund | Driehaus Small/Mid Cap Growth Fund | ||||||
| For the year ended December 31, 2022 | For the year ended December 31, 2021 | For the year ended December 31, 2022 | For the year ended December 31, 2021 | ||||
| INCREASE (DECREASE) IN NET ASSETS: | |||||||
| Operations: | |||||||
| Net investment income (loss) | $(1,564,453) | $(2,917,475) | $(76,533) | $(155,857) | |||
| Net realized gain (loss) on investment transactions | (120,425,635) | 82,938,619 | (3,577,319) | 2,015,530 | |||
| Net change in unrealized appreciation (depreciation) on investment transactions | (98,418,522) | 2,862,750 | (3,707,745) | 1,216,089 | |||
| Net increase (decrease) in net assets resulting from operations | (220,408,610) | 82,883,894 | (7,361,597) | 3,075,762 | |||
| Distributions from distributable earnings to shareholders: | |||||||
| Fund | — | — | (461,634) | (1,753,267) | |||
| Investor Class Shares | (1,408,364) | (15,495,848) | — | — | |||
| Institutional Class Shares | (7,803,434) | (73,704,158) | — | — | |||
| Total distributions to shareholders | (9,211,798) | (89,200,006) | (461,634) | (1,753,267) | |||
| Capital share transactions: | |||||||
| Proceeds from shares sold: | |||||||
| Fund | — | — | 3,852,192 | 11,530,225 | |||
| Investor Class | 33,296,643 | 89,878,449 | — | — | |||
| Institutional Class | 223,937,354 | 208,019,662 | — | — | |||
| Reinvestment of distributions: | |||||||
| Fund | — | — | 435,076 | 1,753,267 | |||
| Investor Class | 1,406,995 | 15,479,510 | — | — | |||
| Institutional Class | 7,140,572 | 66,494,390 | — | — | |||
| Cost of shares redeemed: | |||||||
| Fund | — | — | (6,707,620) | (6,277,724) | |||
| Investor Class | (29,782,290) | (29,025,749) | — | — | |||
| Institutional Class | (162,493,695) | (90,522,445) | — | — | |||
| Redemption fees: | |||||||
| Fund | — | — | — | — | |||
| Investor Class | 25,376 | 58,498 | 3,277 | — | |||
| Institutional Fund | 216,119 | 2,412 | — | — | |||
| Net increase (decrease) in net assets resulting from capital transactions | 73,747,074 | 260,384,727 | (2,417,075) | 7,005,768 | |||
| Total increase (decrease) in net assets | (155,873,334) | 254,068,615 | (10,240,306) | 8,328,263 | |||
| NET ASSETS: | |||||||
| Beginning of period | $609,311,641 | $355,243,026 | $23,173,749 | $14,845,486 | |||
| End of period | $453,438,307 | $609,311,641 | $12,933,443 | $23,173,749 | |||
| Driehaus Event Driven Fund | ||
| For the year ended December 31, 2022 | For the year ended December 31, 2021 | |
| $2,850,600 | $188,587 | |
| (11,866,743) | 15,108,809 | |
| (12,229,343) | (4,075,164) | |
| (21,245,486) | 11,222,232 | |
| (3,000,010) | (22,722,926) | |
| — | — | |
| — | — | |
| (3,000,010) | (22,722,926) | |
| 127,169,234 | 123,731,700 | |
| — | — | |
| — | — | |
| 2,898,519 | 21,829,123 | |
| — | — | |
| — | — | |
| (105,167,933) | (72,489,715) | |
| — | — | |
| — | — | |
| — | — | |
| — | — | |
| — | — | |
| 24,899,820 | 73,071,108 | |
| 654,324 | 61,570,414 | |
| $203,634,538 | $142,064,124 | |
| $204,288,862 | $203,634,538 | |
| For the year ended December 31, 2022 | For the year ended December 31, 2021 | For the year ended December 31, 2020 | For the year ended December 31, 2019 | For the year ended December 31, 2018 | |||||
| Net asset value, beginning of period | $ 41.20 | $ 49.09 | $ 39.53 | $ 31.80 | $ 39.64 | ||||
| INCOME (LOSS) FROM INVESTMENT OPERATIONS: | |||||||||
| Net investment income (loss)1 | 0.28 | (0.07) | (0.09) | 0.30 | 0.26 | ||||
| Net realized and unrealized gain (loss) on investments | (9.56) | (0.93) | 10.87 | 7.76 | (6.73) | ||||
| Total income (loss) from investment operations | (9.28) | (1.00) | 10.78 | 8.06 | (6.47) | ||||
| LESS DISTRIBUTIONS: | |||||||||
| Net investment income | (0.20) | — | — | (0.33) | (0.16) | ||||
| Net realized gain | (0.03) | (6.89) | (1.22) | — | (1.21) | ||||
| Total distributions | (0.23) | (6.89) | (1.22) | (0.33) | (1.37) | ||||
| Redemption fees added to paid-in capital | 0.002 | 0.002 | 0.002 | 0.002 | 0.002 | ||||
| Net asset value, end of period | $ 31.69 | $ 41.20 | $ 49.09 | $ 39.53 | $ 31.80 | ||||
| Total Return | (22.54)% | (1.90)% | 27.31% | 25.34% | (16.26)% | ||||
| RATIOS/SUPPLEMENTAL DATA: | |||||||||
| Net assets, end of period (000’s) | $ 572,323 | $ 844,522 | $ 951,998 | $ 863,535 | $ 791,656 | ||||
| Ratio of total expenses before reimbursements, waivers, recoupments and/or fees paid indirectly to average net assets | 1.35% | 1.29% | 1.39% | 1.41% | 1.38% | ||||
| Ratio of total expenses net of reimbursements, waivers, recoupments and/or fees paid indirectly to average net assets3 | 1.34% | 1.28% | 1.38% | 1.40% | 1.37% | ||||
| Ratio of net investment income (loss) (including interest expense) net of reimbursements, waivers, recoupments and/or fees paid indirectly to average net assets3 | 0.81% | (0.13)% | (0.24)% | 0.85% | 0.69% | ||||
| Portfolio turnover | 160% | 169% | 203% | 167% | 218% |
| 1 | Net investment income (loss) per share has been calculated using the average shares method. |
| 2 | Amount represents less than $0.01 per share. |
| 3 | Such ratios are net of fees paid indirectly (see Note C in the Notes to Financial Statements). The ratio for the Fund includes the effect of fees paid indirectly which impacted the ratio by 0.01% for the years 2018, 2019, 2020, 2021 and 2022. |
| For the year ended December 31, 2022 | For the year ended December 31, 2021 | For the year ended December 31, 2020 | For the year ended December 31, 2019 | For the year ended December 31, 2018 | |||||
| Net asset value, beginning of period | $ 41.36 | $ 49.14 | $ 39.48 | $ 31.76 | $ 39.61 | ||||
| INCOME (LOSS) FROM INVESTMENT OPERATIONS: | |||||||||
| Net investment income (loss) | 0.371 | 0.051 | (0.01)1 | 0.381 | 0.32 | ||||
| Net realized and unrealized gain (loss) on investments | (9.61) | (0.94) | 10.89 | 7.75 | (6.71) | ||||
| Total income (loss) from investment operations | (9.24) | (0.89) | 10.88 | 8.13 | (6.39) | ||||
| LESS DISTRIBUTIONS: | |||||||||
| Net investment income | (0.21) | — | — | (0.41) | (0.25) | ||||
| Net realized gain | (0.03) | (6.89) | (1.22) | — | (1.21) | ||||
| Total distributions | (0.24) | (6.89) | (1.22) | (0.41) | (1.46) | ||||
| Redemption fees added to paid-in capital | 0.002 | 0.002 | 0.002 | 0.002 | 0.002 | ||||
| Net asset value, end of period | $ 31.88 | $ 41.36 | $ 49.14 | $ 39.48 | $ 31.76 | ||||
| Total Return | (22.36)% | (1.67)% | 27.60% | 25.60% | (16.08)% | ||||
| RATIOS/SUPPLEMENTAL DATA: | |||||||||
| Net assets, end of period (000’s) | $ 1,484,392 | $ 1,482,582 | $ 1,331,263 | $ 928,230 | $ 654,445 | ||||
| Ratio of total expenses before reimbursements, waivers, recoupments and/or fees paid indirectly to average net assets | 1.12% | 1.07% | 1.17% | 1.20% | 1.17% | ||||
| Ratio of total expenses net of reimbursements, waivers, recoupments and/or fees paid indirectly to average net assets3 | 1.11% | 1.06% | 1.16% | 1.19% | 1.16% | ||||
| Ratio of net investment income (loss) (including interest expense) net of reimbursements, waivers, recoupments and/or fees paid indirectly to average net assets3 | 1.07% | 0.10% | (0.02)% | 1.07% | 0.89% | ||||
| Portfolio turnover | 160% | 169% | 203% | 167% | 218% |
| 1 | Net investment income (loss) per share has been calculated using the average shares method. |
| 2 | Amount represents less than $0.01 per share. |
| 3 | Such ratios are net of fees paid indirectly (see Note C in the Notes to Financial Statements). The ratio for the Fund includes the effect of fees paid indirectly which impacted the ratio by 0.01% for the years 2018, 2019, 2020, 2021 and 2022 |
| For the year ended December 31, 2022 | For the year ended December 31, 2021 | For the year ended December 31, 2020 | For the year ended December 31, 2019 | For the year ended December 31, 2018 | |||||
| Net asset value, beginning of period | $ 22.11 | $ 19.08 | $ 14.38 | $ 10.80 | $ 14.21 | ||||
| INCOME (LOSS) FROM INVESTMENT OPERATIONS: | |||||||||
| Net investment income (loss) | 0.09 | 0.06 | 0.02 | 0.06 | (0.04)1 | ||||
| Net realized and unrealized gain (loss) on investments | (4.77) | 2.98 | 4.80 | 3.58 | (3.37) | ||||
| Total income (loss) from investment operations | (4.68) | 3.04 | 4.82 | 3.64 | (3.41) | ||||
| LESS DISTRIBUTIONS: | |||||||||
| Net investment income | — | (0.01) | (0.12) | (0.06) | — | ||||
| Total distributions | — | (0.01) | (0.12) | (0.06) | — | ||||
| Redemption fees added to paid-in capital | 0.002 | 0.002 | — | 0.002 | 0.002 | ||||
| Net asset value, end of period | $ 17.43 | $ 22.11 | $ 19.08 | $ 14.38 | $ 10.80 | ||||
| Total Return | (21.17)% | 15.93% | 33.56% | 33.71% | (24.00)% | ||||
| RATIOS/SUPPLEMENTAL DATA: | |||||||||
| Net assets, end of period (000’s) | $ 102,629 | $ 116,644 | $ 89,729 | $ 62,407 | $ 89,653 | ||||
| Ratio of total expenses before reimbursements, waivers, recoupments and/or fees paid indirectly to average net assets | 1.44% | 1.37% | 1.72% | 1.80%3 | 2.27%3 | ||||
| Ratio of total expenses net of reimbursements, waivers, recoupments and/or fees paid indirectly to average net assets4 | 1.24%5 | 1.24%5 | 1.45%5 | 1.45%3,5 | 2.26%3 | ||||
| Ratio of net investment income (loss) (including interest expense) net of reimbursements, waivers, recoupments and/or fees paid indirectly to average net assets4 | 0.53%5 | 0.28%5 | 0.12%5 | 0.52%5 | (0.30)% | ||||
| Portfolio turnover | 149% | 178% | 248% | 220% | 207% |
| 1 | Net investment income (loss) per share has been calculated using the average shares method. |
| 2 | Amount represents less than $0.01 per share. |
| 3 | Ratio of expenses to average net assets includes interest expense of 0.01% for the year ended December 31, 2019, and less than 0.005% for the year ended December 31, 2018. The interest expense is from utilizing the line of credit (see Note G in the Notes to Financial Statements). |
| 4 | Such ratios are net of fees paid indirectly (see Note C in the Notes to Financial Statements). The ratio for the Fund includes the effect of fees paid indirectly which impacted the ratio by 0.02%, 0.01%, 0.00%, 0.01%, and 0.00% for the years 2018, 2019, 2020, 2021 and 2022. |
| 5 | Such ratios are after prior administrative and transfer agent waivers and adviser expense reimbursements, when applicable. BNY Mellon Investment Servicing (US) Inc., the prior administrative agent and transfer agent, waived a portion of its fees beginning with the Fund’s commencement of operations, August 22, 2011 through July 31, 2020. Effective December 31, 2020, the Adviser contractually agreed to waive its investment advisory fee or absorb other operating expenses to the extent necessary to ensure that total annual Fund operating expenses (other than interest, taxes, brokerage commissions, dividends and interest on short sales, other investment-related expenses, acquired fund fees and expenses, and extraordinary expenses such as litigation and other expenses not incurred in the ordinary course of the Fund’s business) would not exceed the Fund’s operating expense cap of 1.24% of average daily net assets until April 30, 2023. From November 1, 2018, to December 31, 2020, the annual operating expense limitation was 1.45%. |
| For the year ended December 31, 2022 | For the year ended December 31, 2021 | For the year ended December 31, 2020 | For the year ended December 31, 2019 | For the year ended December 31, 2018 | |||||
| Net asset value, beginning of period | $ 14.25 | $ 15.17 | $ 11.94 | $ 9.93 | $ 11.54 | ||||
| INCOME (LOSS) FROM INVESTMENT OPERATIONS: | |||||||||
| Net investment income (loss) | 0.22 | 0.12 | 0.16 | 0.29 | 0.24 | ||||
| Net realized and unrealized gain (loss) on investments | (2.90) | (0.21) | 3.43 | 1.86 | (1.77) | ||||
| Total income (loss) from investment operations | (2.68) | (0.09) | 3.59 | 2.15 | (1.53) | ||||
| LESS DISTRIBUTIONS: | |||||||||
| Net investment income | (0.24) | (0.22) | (0.11) | (0.14) | — | ||||
| Net realized gain | — | (0.61) | (0.25) | — | (0.08) | ||||
| Total distributions | (0.24) | (0.83) | (0.36) | (0.14) | (0.08) | ||||
| Redemption fees added to paid-in capital | 0.001 | — | — | — | — | ||||
| Net asset value, end of period | $ 11.33 | $ 14.25 | $ 15.17 | $ 11.94 | $ 9.93 | ||||
| Total Return | (18.86)% | (0.53)% | 30.09% | 21.64% | (13.22)% | ||||
| RATIOS/SUPPLEMENTAL DATA: | |||||||||
| Net assets, end of period (000’s) | $ 46,642 | $ 57,728 | $ 53,221 | $ 39,043 | $ 31,637 | ||||
| Ratio of total expenses before reimbursements, waivers, recoupments and/or fees paid indirectly to average net assets | 1.36% | 1.31% | 1.62% | 1.89% | 2.05% | ||||
| Ratio of total expenses net of reimbursements, waivers, recoupments and/or fees paid indirectly to average net assets2,3 | 0.99% | 0.99% | 0.99% | 1.23% | 1.75% | ||||
| Ratio of net investment income (loss) (including interest expense) net of reimbursements, waivers, recoupments and/or fees paid indirectly to average net assets2 | 1.90% | 0.92% | 1.47% | 2.67% | 2.19% | ||||
| Portfolio turnover | 92% | 101% | 135% | 155% | 169% |
| 1 | Amount represents less than $0.01 per share. |
| 2 | Such ratios are net of fees paid indirectly (see Note C in the Notes to Financial Statements). The expense ratio impacts of fees paid indirectly were 0.00%, 0.00%, 0.00%, 0.01% and 0.01% for the years 2018, 2019, 2020, 2021 and 2022. |
| 3 | Effective May 1, 2019, the Adviser contractually agreed to waive its investment advisory fee or absorb other operating expenses to the extent necessary to ensure that total annual Fund operating expenses (other than interest, taxes, brokerage commissions, dividends and interest on short sales, other investment-related expenses, acquired fund fees and expenses, and extraordinary expenses such as litigation and other expenses not incurred in the ordinary course of the Fund’s business) would not exceed the Fund’s operating expense cap of 0.99% of average daily net assets until April 30, 2023. Prior to May 1, 2019, the annual operating expense limitation was 1.75%. |
| For the year ended December 31, 2022 | For the year ended December 31, 2021 | For the year ended December 31, 2020 | For the year ended December 31, 2019 | For the year ended December 31, 2018 | |||||
| Net asset value, beginning of period | $ 11.06 | $ 12.59 | $ 10.52 | $ 8.13 | $ 11.39 | ||||
| INCOME (LOSS) FROM INVESTMENT OPERATIONS: | |||||||||
| Net investment income (loss) | 0.06 | 0.04 | 0.01 | 0.06 | (0.02)1 | ||||
| Net realized and unrealized gain (loss) on investments | (2.75) | 1.42 | 3.10 | 2.41 | (1.92) | ||||
| Total income (loss) from investment operations | (2.69) | 1.46 | 3.11 | 2.47 | (1.94) | ||||
| LESS DISTRIBUTIONS: | |||||||||
| Net investment income | — | (0.04) | (0.08) | (0.01) | — | ||||
| Net realized gain | (0.47) | (2.95) | (0.96) | (0.07) | (1.32) | ||||
| Total distributions | (0.47) | (2.99) | (1.04) | (0.08) | (1.32) | ||||
| Redemption fees added to paid-in capital | 0.002 | 0.002 | 0.002 | 0.002 | 0.002 | ||||
| Net asset value, end of period | $ 7.90 | $ 11.06 | $ 12.59 | $ 10.52 | $ 8.13 | ||||
| Total Return | (24.40)% | 12.49% | 29.71% | 30.41% | (16.92)% | ||||
| RATIOS/SUPPLEMENTAL DATA: | |||||||||
| Net assets, end of period (000’s) | $ 216,814 | $ 332,312 | $ 288,855 | $ 268,229 | $ 218,430 | ||||
| Ratio of total expenses before reimbursements, waivers, recoupments and/or fees paid indirectly to average net assets | 1.16% | 1.15% | 1.23% | 1.24% | 1.50% | ||||
| Ratio of total expenses net of reimbursements, waivers, recoupments and/or fees paid indirectly to average net assets3 | 1.16% | 1.14% | 1.23% | 1.24% | 1.49% | ||||
| Ratio of net investment income (loss) (including interest expense) net of reimbursements, waivers, recoupments and/or fees paid indirectly to average net assets3 | 0.72% | 0.32% | 0.02% | 0.65% | (0.21)% | ||||
| Portfolio turnover | 75% | 93% | 104% | 96% | 118% |
| 1 | Net investment income (loss) per share has been calculated using the average shares method. |
| 2 | Amount represents less than $0.01 per share. |
| 3 | Such ratios are net of fees paid indirectly (see Note C in the Notes to Financial Statements). The ratio for the Fund includes the effect of fees paid indirectly which impacted the ratio by 0.01%, 0.00%, 0.00%, 0.01% and 0.01% for the years 2018, 2019, 2020, 2021 and 2022. |
| For the year ended December 31, 2022 | For the year ended December 31, 2021 | For the year ended December 31, 2020 | For the year ended December 31, 2019 | For the year ended December 31, 2018 | |||||
| Net asset value, beginning of period | $ 16.33 | $ 19.99 | $ 12.95 | $ 11.11 | $ 14.44 | ||||
| INCOME (LOSS) FROM INVESTMENT OPERATIONS: | |||||||||
| Net investment income (loss) | (0.11) | (0.22) | (0.20) | (0.16) | (0.19) | ||||
| Net realized and unrealized gain (loss) on investments | (5.35) | 4.44 | 11.20 | 3.90 | 0.55 | ||||
| Total income (loss) from investment operations | (5.46) | 4.22 | 11.00 | 3.74 | 0.36 | ||||
| LESS DISTRIBUTIONS: | |||||||||
| Net investment income | — | — | — | (0.02) | — | ||||
| Net realized gain | (0.82) | (7.88) | (3.96) | (1.88) | (3.69) | ||||
| Total distributions | (0.82) | (7.88) | (3.96) | (1.90) | (3.69) | ||||
| Redemption fees added to paid-in capital | 0.001 | — | 0.001 | 0.001 | 0.001 | ||||
| Net asset value, end of period | $ 10.05 | $ 16.33 | $ 19.99 | $ 12.95 | $ 11.11 | ||||
| Total Return | (33.53)% | 24.73% | 85.60% | 33.89% | 3.88% | ||||
| RATIOS/SUPPLEMENTAL DATA: | |||||||||
| Net assets, end of period (000’s) | $ 176,208 | $ 341,269 | $ 334,391 | $ 269,120 | $ 264,607 | ||||
| Ratio of total expenses before reimbursements, waivers, recoupments and/or fees paid indirectly to average net assets | 1.42% | 1.38% | 1.46% | 1.48% | 1.44%2 | ||||
| Ratio of total expenses net of reimbursements, waivers, recoupments and/or fees paid indirectly to average net assets3 | 1.37% | 1.35% | 1.43% | 1.43% | 1.42%2 | ||||
| Ratio of net investment income (loss) (including interest expense) net of reimbursements, waivers, recoupments and/or fees paid indirectly to average net assets3 | (0.87)% | (1.26)% | (1.33)% | (1.32)% | (1.19)% | ||||
| Portfolio turnover | 108% | 109% | 141% | 165% | 156% |
| 1 | Amount represents less than $0.01 per share. |
| 2 | Ratio of expenses to average net assets includes interest expense of less than 0.005% for the years ended December 31, 2018 and 2017. The interest expense is from utilizing the line of credit (see Note G in the Notes to Financial Statements). |
| 3 | Such ratios are net of fees paid indirectly (see Note C in the Notes to Financial Statements). The ratio for the Fund includes the effect of fees paid indirectly which impacted the ratio by 0.02%, 0.05%, 0.03%, 0.03%, and 0.05% for the years 2018, 2019, 2020, 2021, and 2022. |
| For the year ended December 31, 2022 | For the year ended December 31, 2021 | For the year ended December 31, 2020 | For the year ended December 31, 2019 | For the year ended December 31, 2018 | |||||
| Net asset value, beginning of period | $ 23.76 | $ 23.62 | $ 15.37 | $ 11.66 | $ 11.62 | ||||
| INCOME (LOSS) FROM INVESTMENT OPERATIONS: | |||||||||
| Net investment income (loss) | (0.09)1 | (0.14) | (0.18)1 | (0.13) | (0.12)1 | ||||
| Net realized and unrealized gain (loss) on investments | (8.01) | 4.80 | 9.98 | 4.81 | 0.48 | ||||
| Total income (loss) from investment operations | (8.10) | 4.66 | 9.80 | 4.68 | 0.36 | ||||
| LESS DISTRIBUTIONS: | |||||||||
| Net investment income | — | — | — | — | — | ||||
| Net realized gain | (0.33) | (4.52) | (1.55) | (0.97) | (0.33) | ||||
| Total distributions | (0.33) | (4.52) | (1.55) | (0.97) | (0.33) | ||||
| Redemption fees added to paid-in capital | 0.01 | — | — | 0.002 | 0.01 | ||||
| Net asset value, end of period | $ 15.34 | $ 23.76 | $ 23.62 | $ 15.37 | $ 11.66 | ||||
| Total Return | (34.11)% | 21.12% | 63.77% | 40.25% | 3.33% | ||||
| RATIOS/SUPPLEMENTAL DATA: | |||||||||
| Net assets, end of period (000’s) | $ 67,143 | $ 96,371 | $ 28,088 | $ 10,899 | $ 7,538 | ||||
| Ratio of total expenses before reimbursements, waivers, recoupments and/or fees paid indirectly to average net assets | 1.00% | 0.99% | 1.35% | 1.59% | 2.57% | ||||
| Ratio of total expenses net of reimbursements, waivers, recoupments and/or fees paid indirectly to average net assets3,4 | 0.96% | 1.11% | 1.20% | 1.17% | 1.18% | ||||
| Ratio of net investment income (loss) (including interest expense) net of reimbursements, waivers, recoupments and/or fees paid indirectly to average net assets3,4 | (0.54)% | (0.97)% | (1.04)% | (0.95)% | (0.87)% | ||||
| Portfolio turnover | 169% | 149% | 164% | 206% | 193% |
| 1 | Net investment income (loss) per share has been calculated using the average shares method. |
| 2 | Amount represents less than $0.01 per share. |
| 3 | Such ratios are net of fees paid indirectly (see Note C in the Notes to Financial Statements). The ratio for the Fund includes the effect of fees paid indirectly which impacted the ratio by 0.02%, 0.03%, 0.02%, 0.02%, and 0.04% for the years 2018, 2019, 2020, 2021, and 2022. |
| 4 | Such ratios are after administrative and transfer agent waivers and adviser expense reimbursements and recoupments, when applicable. BNY Mellon Investment Servicing (US) Inc., the prior administrative agent and transfer agent, waived a portion of its fees beginning with the Fund’s commencement of operations, August 21, 2017 through July 31, 2020. The Adviser contractually agree to waive its investment advisory fee or absorb other operating expenses to the extent necessary to ensure that total annual operating expenses for the Investor Class (other than interest, taxes, brokerage commissions and other portfolio transaction expenses, capital expenditures, and extraordinary expenses) would not exceed the Investor Class’s operating expense cap of 1.20% of average daily net assets until April 30, 2023. |
| For the year ended December 31, 2022 | For the year ended December 31, 2021 | For the year ended December 31, 2020 | For the year ended December 31, 2019 | For the year ended December 31, 2018 | |||||
| Net asset value, beginning of period | $ 24.15 | $ 23.88 | $ 15.47 | $ 11.70 | $ 11.63 | ||||
| INCOME (LOSS) FROM INVESTMENT OPERATIONS: | |||||||||
| Net investment income (loss) | (0.05)1 | (0.11) | (0.11)1 | (0.10) | (0.08)1 | ||||
| Net realized and unrealized gain (loss) on investments | (8.14) | 4.90 | 10.07 | 4.84 | 0.47 | ||||
| Total income (loss) from investment operations | (8.19) | 4.79 | 9.96 | 4.74 | 0.39 | ||||
| LESS DISTRIBUTIONS: | |||||||||
| Net investment income | — | — | — | — | — | ||||
| Net realized gain | (0.33) | (4.52) | (1.55) | (0.97) | (0.33) | ||||
| Total distributions | (0.33) | (4.52) | (1.55) | (0.97) | (0.33) | ||||
| Redemption fees added to paid-in capital | 0.01 | — | — | 0.002 | 0.01 | ||||
| Net asset value, end of period | $ 15.64 | $ 24.15 | $ 23.88 | $ 15.47 | $ 11.70 | ||||
| Total Return | (33.93)% | 21.44% | 64.39% | 40.62% | 3.59% | ||||
| RATIOS/SUPPLEMENTAL DATA: | |||||||||
| Net assets, end of period (000’s) | $ 386,295 | $ 512,941 | $ 327,155 | $ 161,821 | $ 123,395 | ||||
| Ratio of total expenses before reimbursements, waivers, recoupments and/or fees paid indirectly to average net assets | 0.75% | 0.73% | 0.80% | 0.89% | 1.04% | ||||
| Ratio of total expenses net of reimbursements, waivers, recoupments and/or fees paid indirectly to average net assets3,4 | 0.71% | 0.71% | 0.81% | 0.92% | 0.93% | ||||
| Ratio of net investment income (loss) (including interest expense) net of reimbursements, waivers, recoupments and/or fees paid indirectly to average net assets3,4 | (0.28)% | (0.58)% | (0.64)% | (0.70)% | (0.62)% | ||||
| Portfolio turnover | 169% | 149% | 164% | 206% | 193% |
| 1 | Net investment income (loss) per share has been calculated using the average shares method. |
| 2 | Amount represents less than $0.01 per share. |
| 3 | Such ratios are net of fees paid indirectly (see Note C in the Notes to Financial Statements). The ratio for the Fund includes the effect of fees paid indirectly which impacted the ratio by 0.02%, 0.03%, 0.01%, 0.02%, and 0.04% for the years 2018, 2019, 2020, 2021, and 2022. |
| 4 | Such ratios are after administrative and transfer agent waivers and adviser expense reimbursements and recoupments, when applicable. BNY Mellon Investment Servicing (US) Inc., the prior administrative agent and transfer agent, waived a portion of its fees beginning with the Fund’s commencement of operations, August 21, 2017 through July 31, 2020. The Adviser contractually agreed to waive its investment advisory fee or absorb other operating expenses to the extent necessary to ensure that total annual operating expenses for the Institutional Class (other than interest, taxes, brokerage commissions and other portfolio transaction expenses, capital expenditures, and extraordinary expenses) would not exceed the Institutional Class’s operating expense cap of 0.95% of average daily net assets until April 30, 2023. |
| For the year ended December 31, 2022 | For the year ended December 31, 2021 | For the period May 1, 2020* through December 31, 2020 | |||
| Net asset value, beginning of period | $ 18.75 | $ 17.19 | $ 10.00 | ||
| INCOME (LOSS) FROM INVESTMENT OPERATIONS: | |||||
| Net investment income (loss) | (0.07) | (0.12) | (0.04) | ||
| Net realized and unrealized gain (loss) on investments | (5.81) | 3.17 | 7.47 | ||
| Total income (loss) from investment operations | (5.88) | 3.05 | 7.43 | ||
| LESS DISTRIBUTIONS: | |||||
| Net investment income | — | — | — | ||
| Net realized gain | (0.46) | (1.49) | (0.24) | ||
| Total distributions | (0.46) | (1.49) | (0.24) | ||
| Redemption fees added to paid-in capital | 0.001 | — | — | ||
| Net asset value, end of period | $ 12.41 | $ 18.75 | $ 17.19 | ||
| Total Return | (31.45)% | 18.32% | 74.23%2 | ||
| RATIOS/SUPPLEMENTAL DATA: | |||||
| Net assets, end of period (000’s) | $ 12,933 | $ 23,174 | $ 14,845 | ||
| Ratio of total expenses before reimbursements, waivers, recoupments and/or fees paid indirectly to average net assets | 1.54% | 1.31% | 2.58%3 | ||
| Ratio of total expenses net of reimbursements, waivers, recoupments and/or fees paid indirectly to average net assets4,5 | 0.95% | 0.95% | 0.95%3 | ||
| Ratio of net investment income (loss) (including interest expense) net of reimbursements, waivers, recoupments and/or fees paid indirectly to average net assets4,5 | (0.48)% | (0.70)% | (0.73)%3 | ||
| Portfolio turnover | 188% | 191% | 96%2 |
| * | Fund commenced operations on May 1, 2020. |
| 1 | Amount represents less than $0.01 per share. |
| 2 | Not annualized. |
| 3 | Annualized. |
| 4 | Such ratios are after administrative and transfer agent waivers and adviser expense reimbursements, when applicable. BNY Mellon Investment Servicing (US) Inc., the prior administrative agent and transfer agent, and The Northern Trust Company, the current administrative agent and transfer agent, waived a portion of its fees beginning with the Fund’s commencement of operations, May 1, 2020 through July 31, 2020. The Adviser contractually agreed to waive its investment advisory fee or absorb other operating expenses to the extent necessary to ensure that total annual Fund operating expenses (other than interest, taxes, brokerage commissions and other portfolio transaction expenses, capital expenditures, and extraordinary expenses) would not exceed the Fund’s operating expense cap of 0.95% of average daily net assets until May 1, 2023. |
| 5 | Such ratios are net of fees paid indirectly (see Note C in the Notes to Financial Statements). The ratio for the Fund includes the effect of fees paid indirectly which impacted the ratio by 0.00, 0.01% and 0.04% for the years 2020, 2021 and 2022. |
| For the year ended December 31, 2022 | For the year ended December 31, 2021 | For the year ended December 31, 2020 | For the year ended December 31, 2019 | For the year ended December 31, 2018 | |||||
| Net asset value, beginning of period | $ 13.29 | $ 13.93 | $ 11.55 | $ 9.99 | $ 10.79 | ||||
| INCOME (LOSS) FROM INVESTMENT OPERATIONS: | |||||||||
| Net investment income (loss) | 0.16 | 0.04 | 0.12 | 0.26 | 0.25 | ||||
| Net realized and unrealized gain (loss) on investments | (1.49) | 0.93 | 2.74 | 1.69 | (0.69) | ||||
| Total income (loss) from investment operations | (1.33) | 0.97 | 2.86 | 1.95 | (0.44) | ||||
| LESS DISTRIBUTIONS: | |||||||||
| Net investment income | (0.02) | (0.15) | (0.17) | (0.39) | (0.36) | ||||
| Net realized gain | (0.15) | (1.46) | (0.31) | — | — | ||||
| Total distributions | (0.17) | (1.61) | (0.48) | (0.39) | (0.36) | ||||
| Net asset value, end of period | $ 11.79 | $ 13.29 | $ 13.93 | $ 11.55 | $ 9.99 | ||||
| Total Return | (9.98)% | 7.21% | 24.84% | 19.53% | (4.03)% | ||||
| RATIOS/SUPPLEMENTAL DATA: | |||||||||
| Net assets, end of period (000’s) | $ 204,289 | $ 203,635 | $ 142,064 | $ 69,455 | $ 51,675 | ||||
| Ratio of total expenses before reimbursements, waivers, recoupments and/or fees paid indirectly to average net assets | 1.69% | 1.49% | 1.59% | 1.93% | 1.90% | ||||
| Ratio of total expenses net of reimbursements, waivers, recoupments and/or fees paid indirectly to average net assets1,2 | 1.66% | 1.42% | 1.57% | 1.90% | 1.88% | ||||
| Ratio of net investment income (loss) (including dividends and interest on short positions and interest expense) net of reimbursements, waivers, recoupments and/or fees paid indirectly to average net assets1,2 | 1.43% | 0.10% | 0.67% | 2.63% | 2.57% | ||||
| Portfolio turnover | 81% | 109% | 136% | 111% | 101% |
| 1 | The ratio for the fund includes the effect of dividends and interest on short positions, and interest expense which increased the expense ratios by 0.31%, 0.30%, 0.13%, 0.10%, and 0.30% for the years 2018, 2019, 2020, 2021, and 2022. |
| 2 | Such ratios are net of fees paid indirectly (see Note C in the Notes to Financial Statements). The ratio for the fund includes the effect of fees paid indirectly which impacted the expense ratios by 0.02%, 0.03%, 0.02%, 0.07%, and 0.03% for the years 2018, 2019, 2020, 2021, and 2022. |
| Fund | Commencement of Operations |
| Emerging Markets Growth Fund | 12/31/97 |
| Emerging Markets Small Cap Growth Fund | 08/22/11 |
| Emerging Markets Opportunities Fund | 04/10/17 |
| International Small Cap Growth Fund | 09/17/07 |
| Micro Cap Growth Fund | 11/18/13 |
| Small Cap Growth Fund | 08/21/17 |
| Small/Mid Cap Growth Fund | 05/01/20 |
| Event Driven Fund | 08/26/13 |
| Assets | Total Value at December 31, 2022 | Level 1 Quoted Price | Level 2 Significant Observable Inputs | Level 3 Significant Unobservable Inputs | ||||
| Common Stocks | ||||||||
| Africa | $17,549,809 | $17,549,809 | $— | $— | ||||
| Europe | 35,634,396 | 35,634,396 | — | —* | ||||
| Far East | ||||||||
| China | 542,622,546 | 542,622,546 | — | — | ||||
| India | 337,968,490 | 337,968,490 | — | — | ||||
| Indonesia | 68,765,397 | 68,765,397 | — | — | ||||
| Philippines | 4,643,067 | — | 4,643,067 | — | ||||
| Singapore | 27,797,527 | 27,797,527 | — | — | ||||
| South Korea | 217,612,660 | — | 217,612,660 | — | ||||
| Taiwan | 170,335,339 | 170,335,339 | — | — | ||||
| Thailand | 60,335,411 | 60,335,411 | — | — | ||||
| Vietnam | 6,978,767 | 6,978,767 | — | — | ||||
| Middle East | ||||||||
| Israel | 12,904,183 | — | 12,904,183 | — | ||||
| Qatar | 22,427,141 | — | 22,427,141 | — | ||||
| Saudi Arabia | 54,678,876 | — | 54,678,876 | — | ||||
| United Arab Emirates | 42,375,184 | 42,375,184 | — | — | ||||
| North America | 184,376,628 | 184,376,628 | — | — | ||||
| South America | ||||||||
| Brazil | 122,658,942 | 32,560,933 | 90,098,009 | — | ||||
| Peru | 20,691,541 | 20,691,541 | — | — | ||||
| Short Term Investments | 104,173,837 | 104,173,837 | — | — | ||||
| Total | $2,054,529,741 | $1,652,165,805 | $402,363,936 | $— |
| *Level 3 security has zero value. |
| Assets | Total Value at December 31, 2022 | Level 1 Quoted Price | Level 2 Significant Observable Inputs | Level 3 Significant Unobservable Inputs | ||||
| Common Stocks | ||||||||
| Far East | ||||||||
| Cambodia | $540,619 | $540,619 | $— | $— | ||||
| China | 29,601,193 | 29,601,193 | — | — | ||||
| India | 22,859,158 | 22,859,158 | — | — | ||||
| Indonesia | 2,471,397 | 2,471,397 | — | — | ||||
| Philippines | 456,545 | — | 456,545 | — |
| Assets | Total Value at December 31, 2022 | Level 1 Quoted Price | Level 2 Significant Observable Inputs | Level 3 Significant Unobservable Inputs | ||||
| South Korea | $5,211,584 | $— | $5,211,584 | $— | ||||
| Taiwan | 6,737,785 | 6,737,785 | — | — | ||||
| Thailand | 1,768,213 | 1,768,213 | — | — | ||||
| Vietnam | 5,745,893 | 1,097,775 | 4,648,118 | — | ||||
| Middle East | ||||||||
| Qatar | 956,900 | — | 956,900 | — | ||||
| Saudi Arabia | 3,664,106 | 744,724 | 2,919,382 | — | ||||
| United Arab Emirates | 2,688,626 | 2,688,626 | — | — | ||||
| North America | 3,805,346 | 3,805,346 | — | — | ||||
| South America | ||||||||
| Argentina | 1,052,615 | 1,052,615 | — | — | ||||
| Brazil | 8,654,675 | — | 8,654,675 | — | ||||
| Preferred Stocks | ||||||||
| South America | 883,217 | — | 883,217 | — | ||||
| Short Term Investments | 6,732,347 | 6,732,347 | — | — | ||||
| Total | $103,830,219 | $80,099,798 | $23,730,421 | $— |
| Assets | Total Value at December 31, 2022 | Level 1 Quoted Price | Level 2 Significant Observable Inputs | Level 3 Significant Unobservable Inputs | ||||
| Common Stocks | ||||||||
| Argentina | $385,803 | $385,803 | $— | $— | ||||
| Brazil | 2,184,029 | — | 2,184,029 | — | ||||
| Canada | 597,469 | 597,469 | — | — | ||||
| China | 7,637,307 | 7,637,307 | — | — | ||||
| France | 232,473 | 232,473 | — | — | ||||
| India | 4,730,249 | 4,730,249 | — | — | ||||
| Indonesia | 1,023,501 | 1,023,501 | — | — | ||||
| Mexico | 934,954 | 934,954 | — | — | ||||
| Netherlands | 472,420 | 472,420 | — | — | ||||
| Peru | 255,041 | 255,041 | — | — | ||||
| Qatar | 285,023 | — | 285,023 | — | ||||
| Saudi Arabia | 1,585,065 | — | 1,585,065 | — | ||||
| Singapore | 380,484 | 380,484 | — | — | ||||
| South Korea | 4,672,802 | — | 4,672,802 | — | ||||
| Taiwan | 3,330,942 | 3,330,942 | — | — | ||||
| Thailand | 698,487 | 698,487 | — | — | ||||
| United Arab Emirates | 926,264 | 926,264 | — | — | ||||
| United Kingdom | 285,105 | 285,105 | — | — | ||||
| United States | 2,422,914 | 2,422,914 | — | — | ||||
| Short Term Investments | 3,554,812 | 3,554,812 | — | — | ||||
| Sovereign Bonds | 9,513,792 | — | 9,513,792 | — | ||||
| Total | $46,108,936 | $27,868,225 | $18,240,711 | $— |
| Assets | Total Value at December 31, 2022 | Level 1 Quoted Price | Level 2 Significant Observable Inputs | Level 3 Significant Unobservable Inputs | ||||
| Common Stocks | ||||||||
| Europe | $117,518,801 | $117,518,801 | $— | $— | ||||
| Far East | ||||||||
| Australia | 1,723,675 | 1,723,675 | — | — | ||||
| China | 3,313,894 | 3,313,894 | — | — | ||||
| India | 1,225,709 | 1,225,709 | — | — | ||||
| Indonesia | 2,027,483 | 2,027,483 | — | — | ||||
| Japan | 44,498,784 | 44,498,784 | — | — | ||||
| South Korea | 4,496,626 | — | 4,496,626 | — | ||||
| Taiwan | 1,912,172 | 1,912,172 | — | — | ||||
| Middle East | 2,546,052 | 2,546,052 | — | — | ||||
| North America | 28,097,786 | 28,097,786 | — | — | ||||
| South America | ||||||||
| Brazil | 4,030,740 | 1,020,458 | 3,010,282 | — | ||||
| Preferred Stocks | ||||||||
| Europe | 1,592,620 | 1,592,620 | — | — | ||||
| Short Term Investments | 3,209,891 | 3,209,891 | — | — | ||||
| Total | $216,194,233 | $208,687,325 | $7,506,908 | $— |
| Assets* | Total Value at December 31, 2022 | Level 1 Quoted Price | Level 2 Significant Observable Inputs | Level 3 Significant Unobservable Inputs | ||||
| Common Stocks | $175,423,557 | $175,423,557 | $— | $— | ||||
| Short Term Investments | 1,090,197 | 1,090,197 | — | — | ||||
| Warrants | 7,641 | 7,641 | — | — | ||||
| Total | $176,521,395 | $176,521,395 | $— | $— |
| * See Schedule of Investments for industry breakout. |
| Assets* | Total Value at December 31, 2022 | Level 1 Quoted Price | Level 2 Significant Observable Inputs | Level 3 Significant Unobservable Inputs | ||||
| Common Stocks | $448,207,859 | $448,207,859 | $— | $— | ||||
| Short Term Investments | 4,715,294 | 4,715,294 | — | — | ||||
| Total | $452,923,153 | $452,923,153 | $— | $— |
| * See Schedule of Investments for industry breakout. |
| Assets* | Total Value at December 31, 2022 | Level 1 Quoted Price | Level 2 Significant Observable Inputs | Level 3 Significant Unobservable Inputs | ||||
| Common Stocks | $12,756,486 | $12,756,486 | $— | $— | ||||
| Short Term Investments | 217,423 | 217,423 | — | — | ||||
| Total | $12,973,909 | $12,973,909 | $— | $— |
| * See Schedule of Investments for industry breakout. |
| Assets* | Total Value at December 31, 2022 | Level 1 Quoted Price | Level 2 Significant Observable Inputs | Level 3 Significant Unobservable Inputs | ||||
| Bank Loans | $12,186,005 | $— | $12,186,005 | $— | ||||
| Common Stocks | 100,644,090 | 100,644,090 | — | —** | ||||
| Corporate Bonds | 56,682,871 | — | 56,682,871 | — | ||||
| Preferred Stocks | 2,219,758 | 2,219,758 | — | — | ||||
| Short Term Investments | 28,640,226 | 28,640,226 | — | — | ||||
| Warrants | 132,399 | 123,219 | 9,180 | — | ||||
| Total | $200,505,349 | $131,627,293 | $68,878,056 | $— |
| Liabilities | ||||||||
| Exchange-Traded Funds Sold Short | $(17,733,511) | $(17,733,511) | $— | $— | ||||
| Total | $(17,733,511) | $(17,733,511) | $— | $— |
| Other Financial Instruments | ||||||||
| Total Return Swaps - Assets*** | $320,856 | $— | $320,856 | $— | ||||
| Total Return Swaps - Liabilities*** | (200,139) | — | (200,139) | — | ||||
| Total Other Financial Instruments | $120,717 | $— | $120,717 | $— |
| * See Schedule of Investments for industry breakout. |
| ** Level 3 security has zero value. |
| *** Swaps are reflected as the unrealized appreciation (depreciation) on the instrument. |
| Emerging Markets Growth Fund | Emerging Markets Small Cap Growth Fund | Emerging Markets Opportunities Fund | International Small Cap Growth Fund | ||||
| Paid-in capital | $— | $— | $— | $— | |||
| Total distributable earnings (deficit) | — | — | — | — |
| Micro Cap Growth Fund | Small Cap Growth Fund | Small/Mid Cap Growth Fund | Event Driven Fund | ||||
| Paid-in capital | $(1,878,098) | $(1,564,457) | $(76,426) | $345,075 | |||
| Total distributable earnings (deficit) | 1,878,098 | 1,564,457 | 76,426 | (345,075) |
| Not Subject to Expiration | ||||
| Fund | Short-Term | Long-Term | ||
| Emerging Markets Growth Fund | $(205,554,488) | $— | ||
| Emerging Markets Small Cap Growth Fund | (29,988,388) | — | ||
| Emerging Markets Opportunities Fund | (3,402,656) | — | ||
| International Small Cap Growth Fund | (36,124,731) | (5,522,571) | ||
| Micro Cap Growth Fund | (16,416,729) | — | ||
| Small Cap Growth Fund | (117,672,911) | — | ||
| Small/Mid Cap Growth Fund | (3,766,598) | — | ||
| Event Driven Fund | (12,861,871) | (3,745,545) | ||
| Fund | Year | Ordinary Income | Long-Term Capital Gain | Return of Capital | Total Distributions | |||||
| Emerging Markets Growth Fund | 2022 | $12,237,699 | $2,015,660 | $— | $14,253,359 | |||||
| 2021 | 118,399,989 | 225,900,006 | — | 344,299,995 | ||||||
| Emerging Markets Small Cap Growth Fund | 2022 | — | — | — | — | |||||
| 2021 | 49,512 | — | — | 49,512 | ||||||
| Emerging Markets Opportunities Fund | 2022 | 960,775 | — | — | 960,775 | |||||
| 2021 | 1,367,786 | 1,825,005 | — | 3,192,791 | ||||||
| International Small Cap Growth Fund | 2022 | 5,367,703 | 6,899,210 | — | 12,266,913 | |||||
| 2021 | 35,600,012 | 36,999,988 | — | 72,600,000 | ||||||
| Micro Cap Growth Fund | 2022 | — | 13,811,619 | — | 13,811,619 | |||||
| 2021 | 55,500,006 | 68,499,993 | — | 123,999,999 | ||||||
| Small Cap Growth Fund | 2022 | — | 9,211,798 | — | 9,211,798 | |||||
| 2021 | 41,199,996 | 48,000,010 | — | 89,200,006 | ||||||
| Small/Mid Cap Growth Fund | 2022 | — | 461,634 | — | 461,634 | |||||
| 2021 | 1,251,729 | 501,538 | — | 1,753,267 | ||||||
| Event Driven Fund | 2022 | 417,644* | 2,582,366 | — | 3,000,010 | |||||
| 2021 | 13,322,483 | 9,400,443 | — | 22,722,926 |
| Emerging Markets Growth Fund | Emerging Markets Small Cap Growth Fund | Emerging Markets Opportunities Fund | International Small Cap Growth Fund | ||||
| Undistributed ordinary income | $6,202,970 | $793,910 | $81,749 | $1,699,876 | |||
| Undistributed long-term capital gain | — | — | — | — | |||
| Accumulated earnings | 6,202,970 | 793,910 | 81,749 | 1,699,876 | |||
| Paid-in capital | 2,124,309,828 | 127,935,028 | 47,104,716 | 248,564,723 | |||
| Accumulated capital and other losses | (205,554,488) | (29,988,388) | (3,402,656) | (41,647,302) | |||
| Unrealized appreciation (depreciation) on investments, securities sold short, warrants and swaps | 131,756,942 | 3,888,255 | 2,858,504 | 8,196,963 | |||
| Net assets | $2,056,715,252 | $102,628,805 | $46,642,313 | $216,814,260 |
| Micro Cap Growth Fund | Small Cap Growth Fund | Small/Mid Cap Growth Fund | Event Driven Fund | ||||
| Undistributed ordinary income | $— | $— | $— | $2,800,303 | |||
| Undistributed long-term capital gain | — | — | — | — | |||
| Accumulated earnings | — | — | — | 2,800,303 | |||
| Paid-in capital | 165,404,053 | 535,764,358 | 15,810,766 | 217,736,714 | |||
| Accumulated capital and other losses | (16,416,729) | (117,672,911) | (3,766,598) | (16,607,416) | |||
| Unrealized appreciation (depreciation) on investments, securities sold short, warrants and swaps | 27,221,126 | 35,346,860 | 889,275 | 359,261 | |||
| Net assets | $176,208,450 | $453,438,307 | $12,933,443 | $204,288,862 |
| Fund | Tax Cost Basis | Gross Appreciation | Gross Depreciation | Net Appreciation/ Depreciation | ||||
| Emerging Markets Growth Fund | $1,918,783,551 | $204,266,872 | $(68,520,682) | $135,746,190 | ||||
| Emerging Markets Small Cap Growth Fund | 99,875,650 | 9,662,701 | (5,708,132) | 3,954,569 | ||||
| Emerging Markets Opportunities Fund | 43,208,629 | 4,958,168 | (2,057,861) | 2,900,307 | ||||
| International Small Cap Growth Fund | 207,970,574 | 21,410,786 | (13,187,127) | 8,223,659 | ||||
| Micro Cap Growth Fund | 149,300,269 | 36,917,946 | (9,696,820) | 27,221,126 | ||||
| Small Cap Growth Fund | 417,576,293 | 52,822,808 | (17,475,948) | 35,346,860 | ||||
| Small/Mid Cap Growth Fund | 12,084,636 | 1,224,831 | (335,558) | 889,273 | ||||
| Event Driven Fund | 182,533,293 | 12,711,606 | (12,352,344) | 359,262 |
| Asset derivatives | ||||
| Risk exposure category | Statements of Assets and Liabilities location | Fair Value | ||
| Equity contracts | Warrant securities, at fair value | $7,641 | ||
| Total | $7,641 | |||
| Asset derivatives | ||||
| Risk exposure category | Statements of Assets and Liabilities location | Fair Value | ||
| Equity contracts | Warrant securities, at fair value | $132,399 | ||
| Equity contracts | Unrealized appreciation on open OTC swap contracts | 320,856 | ||
| Total | $453,255 | |||
| Liabilities derivatives | ||||
| Risk exposure category | Statements of Assets and Liabilities location | Fair Value | ||
| Equity contracts | Unrealized depreciation on open OTC swap contracts | $200,139 | ||
| Total | $200,139 | |||
| Amount of net realized gain (loss) on derivatives | ||||||
| Risk exposure category | ||||||
| Derivative | Equity contracts | Interest rate contracts | Total | |||
| Purchased options contracts | $158,010 | $— | $158,010 | |||
| Swap contracts | — | (89,677) | (89,677) | |||
| Total | $158,010 | $(89,677) | $68,333 | |||
| Amount of net realized gain (loss) on derivatives | ||||
| Risk exposure category | ||||
| Derivative | Equity contracts | Total | ||
| Warrants | $3,258 | $3,258 | ||
| Total | $3,258 | $3,258 | ||
| Amount of net realized gain (loss) on derivatives | ||||
| Risk exposure category | ||||
| Derivative | Equity contracts | Total | ||
| Purchased options contracts | $(686,386) | $(686,386) | ||
| Written options contracts | 202,096 | 202,096 | ||
| Swap contracts | 590,718 | 590,718 | ||
| Warrants | (236,545) | (236,545) | ||
| Total | $(130,117) | $(130,117) | ||
| Quarterly Derivative Averages | ||||
| Derivative | Quarterly Average | $ Amount/ Number | ||
| Purchased options contracts | number of contracts | 923,077 | ||
| Change in net unrealized appreciation (depreciation) on derivatives | ||||
| Risk exposure category | ||||
| Derivative | Equity contracts | Total | ||
| Warrants | $(28,317) | $(28,317) | ||
| Total | $(28,317) | $(28,317) | ||
| Quarterly Derivative Averages | ||||
| Derivative | Quarterly Average | $ Amount/ Number | ||
| Warrants | number of contracts | 27,832 | ||
| Change in net unrealized appreciation (depreciation) on derivatives | ||||
| Risk exposure category | ||||
| Derivative | Equity contracts | Total | ||
| Swap contracts | $158,635 | $158,635 | ||
| Warrants | (641,900) | (641,900) | ||
| Total | $(483,265) | $(483,265) | ||
| Quarterly Derivative Averages | ||||
| Derivative | Quarterly Average | $ Amount/ Number | ||
| Written options contracts | number of contracts | (455) | ||
| Purchased options contracts | number of contracts | 412 | ||
| Swap contracts | gross notional amount | $1,199,635 | ||
| Warrants | number of contracts | 1,229,777 | ||
| Description | Gross Amounts Recognized in Statements of Assets and Liabilities | Derivatives Available for Offset | Collateral Received/ (Pledged) | Net Amount | ||||
| Unrealized appreciation on open OTC swap contracts | $320,856 | $(200,139) | $— | $120,717 |
| Description | Gross Amounts Recognized in Statements of Assets and Liabilities | Derivatives Available for Offset | Collateral Received/ (Pledged) | Net Amount | ||||
| Unrealized depreciation on open OTC swap contracts | $(200,139) | $200,139 | $— | $— |
| Period ended December 31 | Emerging Markets Small Cap Growth Fund | Emerging Markets Opportunities Fund | Small/Mid Cap Growth Fund | |||
| 2023 | $171,531 | $230,617 | $73,297 | |||
| 2024 | 126,032 | 191,639 | 75,963 | |||
| 2025 | 207,973 | 174,550 | 87,616 | |||
| Total | $505,536 | $596,806 | $236,876 |
| Fund | Shareholder services plan fees | Accrued shareholder services plan fees | ||
| Emerging Markets Growth Fund | $ 1,568,557 | $ 263,886 | ||
| Small Cap Growth Fund | 157,761 | 25,850 | ||
| Event Driven Fund | 381,107 | 71,142 |
| Fund | Purchases | Sales | ||
| Emerging Markets Growth Fund | 3,216,218,757 | 3,001,750,145 | ||
| Emerging Markets Small Cap Growth Fund | 159,207,979 | 144,778,945 | ||
| Emerging Markets Opportunities Fund | 41,181,161 | 41,525,008 | ||
| International Small Cap Growth Fund | 182,037,439 | 212,975,924 | ||
| Micro Cap Growth Fund | 232,057,193 | 288,865,339 | ||
| Small Cap Growth Fund | 890,574,505 | 828,464,769 | ||
| Small/Mid Cap Growth Fund | 29,714,428 | 32,721,406 | ||
| Event Driven Fund | 202,420,284 | 168,870,015 |
| Emerging Markets Growth Fund | Emerging Markets Small Cap Growth Fund | Emerging Markets Opportunities Fund | |||||||||
| 2022 | 2021 | 2022 | 2021 | 2022 | 2021 | ||||||
| Fund | |||||||||||
| Shares issued | — | — | 1,798,191 | 1,315,978 | 358,360 | 729,015 | |||||
| Shares reinvested | — | — | — | 1,994 | 38,688 | 226,243 | |||||
| Shares redeemed | — | — | (1,186,044) | (745,256) | (329,939) | (413,309) | |||||
| Net increase (decrease) | — | — | 612,147 | 572,716 | 67,109 | 541,949 | |||||
| Investor Class | |||||||||||
| Shares issued | 3,247,646 | 2,286,494 | — | — | — | — | |||||
| Shares reinvested | 127,497 | 2,945,615 | — | — | — | — | |||||
| Shares redeemed | (5,810,486) | (4,126,250) | — | — | — | — | |||||
| Net increase (decrease) | (2,435,343) | 1,105,859 | — | — | — | — | |||||
| Institutional Class | |||||||||||
| Shares issued | 18,312,464 | 9,064,263 | — | — | — | — | |||||
| Shares reinvested | 271,749 | 4,805,413 | — | — | — | — | |||||
| Shares redeemed | (7,874,410) | (5,111,672) | — | — | — | — | |||||
| Net increase (decrease) | 10,709,803 | 8,758,004 | — | — | — | — | |||||
| Total net increase (decrease) | 8,274,460 | 9,863,863 | — | — | — | — | |||||
| International Small Cap Growth Fund | Micro Cap Growth Fund | Small Cap Growth Fund | |||||||||
| 2022 | 2021 | 2022 | 2021 | 2022 | 2021 | ||||||
| Fund | |||||||||||
| Shares issued | 3,305,607 | 4,892,868 | 486,092 | 261,767 | — | — | |||||
| Shares reinvested | 1,367,213 | 6,080,902 | 1,068,748 | 5,973,251 | — | — | |||||
| Shares redeemed | (7,252,338) | (3,880,440) | (4,917,525) | (2,061,238) | — | — | |||||
| Net increase (decrease) | (2,579,518) | 7,093,330 | (3,362,685) | 4,173,780 | — | — | |||||
| Investor Class | |||||||||||
| Shares issued | — | — | — | — | 1,890,262 | 3,283,526 | |||||
| Shares reinvested | — | — | — | — | 87,718 | 698,534 | |||||
| Shares redeemed | — | — | — | — | (1,656,490) | (1,115,793) | |||||
| Net increase (decrease) | — | — | — | — | 321,490 | 2,866,267 | |||||
| Institutional Class | |||||||||||
| Shares issued | — | — | — | — | 12,619,228 | 8,078,057 | |||||
| Shares reinvested | — | — | — | — | 436,732 | 2,952,682 | |||||
| Shares redeemed | — | — | — | — | (9,590,296) | (3,492,518) | |||||
| Net increase (decrease) | — | — | — | — | 3,465,664 | 7,538,221 | |||||
| Total net increase (decrease) | — | — | — | — | 3,787,154 | 10,404,488 | |||||
| Small/Mid Cap Growth Fund | Event Driven Fund | ||||||
| 2022 | 2021 | 2022 | 2021 | ||||
| Fund | |||||||
| Shares issued | 276,302 | 602,661 | 10,275,917 | 8,560,659 | |||
| Shares reinvested | 33,544 | 99,901 | 241,947 | 1,677,873 | |||
| Shares redeemed | (503,594) | (329,889) | (8,515,544) | (5,112,285) | |||
| Net increase (decrease) | (193,748) | 372,673 | 2,002,320 | 5,126,247 | |||
| Investor Class | |||||||
| Shares issued | — | — | — | — | |||
| Shares reinvested | — | — | — | — | |||
| Shares redeemed | — | — | — | — | |||
| Net increase (decrease) | — | — | — | — | |||
| Institutional Class | |||||||
| Shares issued | — | — | — | — | |||
| Shares reinvested | — | — | — | — | |||
| Shares redeemed | — | — | — | — | |||
| Net increase (decrease) | — | — | — | — | |||
| Total net increase (decrease) | — | — | — | — | |||
| Funds comprising Driehaus Mutual Funds | Statement of operations | Statements of changes in net assets | Financial highlights | |||
| Driehaus Emerging Markets Growth FundDriehaus Emerging Markets Small Cap Growth FundDriehaus Emerging Markets Opportunities FundDriehaus International Small Cap Growth FundDriehaus Micro Cap Growth FundDriehaus Small Cap Growth FundDriehaus Event Driven Fund | For the year ended December 31, 2022 | For each of the two years in the period ended December 31, 2022 | For each of the five years in the period ended December 31, 2022 | |||
| Driehaus Small/Mid Cap Growth Fund | For the year ended December 31, 2022 | For each of the two years in the period ended December 31, 2022 | For each of the two years in the period ended December 31, 2022 and the period from May 1, 2020 (commencement of operations) through December 31, 2020 |

| Name, Address and Year of Birth | Position(s) Held with the Trust | Term of Office and Length of Time Served** | Principal Occupation(s) During the Past 5 Years | Other Directorships Held by Trustee During the Past 5 Years | |||||
| Interested Trustee:* | |||||||||
| Stephen T. Weber Driehaus Capital Management LLC 25 East Erie Street Chicago, IL 60611 YOB: 1970 | Trustee and President | Since Dec. 2020 Since Feb. 2020 | Director of Driehaus Trust Company, LLC since March 2021; Chief Executive Officer of the Adviser since March 2021; President and Head of Distribution of the Adviser since February 2020; Director of Sales and Relationship Management of the Adviser from 2006 through February 2020; President and Chief Executive Officer of Driehaus Securities LLC from 2018 through 2019. | None. | |||||
| Independent Trustees: | |||||||||
| Theodore J. Beck c/o Driehaus Capital Management LLC 25 East Erie Street Chicago, IL 60611 YOB: 1952 | Trustee Chair Vice Chair | Since 2012 Since June 2021 2020 to 2021 | Retired; President and Chief Executive Officer, National Endowment for Financial Education, 2005 to July 2018. | None. | |||||
| Dawn M. Vroegop c/o Driehaus Capital Management LLC 25 East Erie Street Chicago, IL 60611 YOB: 1966 | Trustee | Since 2012 | Private Investor. | Independent Trustee, Brighthouse Funds Trust I since December 2000 and Brighthouse Funds Trust II since May 2009. | |||||
| Christopher J. Towle, CFA c/o Driehaus Capital Management LLC 25 East Erie Street Chicago, IL 60611 YOB: 1957 | Trustee | Since 2016 | Retired; Portfolio Manager. | Independent Trustee, Brighthouse Funds Trust I and Brighthouse Funds Trust II, each from April 2018 to August 2019. | |||||
| Name, Address and Year of Birth | Position(s) Held with the Trust | Length of Time Served | Principal Occupation(s) During Past 5 Years | |||
| Stephen T. Weber 25 East Erie Street Chicago, IL 60611 YOB: 1970 | President | Since Feb. 2020 | Director of Driehaus Trust Company, LLC since March 2021; Chief Executive Officer of the Adviser since March 2021; President and Head of Distribution of the Adviser since February 2020; Director of Sales and Relationship Management of the Adviser from 2006 through February 2020; President and Chief Executive Officer of Driehaus Securities LLC from 2018 through 2019. | |||
| Robert M. Kurinsky 25 East Erie Street Chicago, IL 60611 YOB: 1972 | Vice President and Treasurer | Since 2019 | Chief Operating Officer of the Adviser since February 2020, Chief Financial Officer and Treasurer of the Adviser since January 2019; Treasurer and Chief Financial Officer of Driehaus Securities LLC from January 2019 through December 2019; Treasurer, Secretary and Chief Legal Officer of the Keeley Funds, Inc. through December 2018; President and Chief Operating Officer of Keeley-Teton Advisors, LLC from March 2017 to December 2018. | |||
| Janet L. McWilliams 25 East Erie Street Chicago, IL 60611 YOB: 1970 | Assistant Vice President and Chief Legal Officer | Since 2007 Since 2012 | General Counsel and Secretary of the Adviser and Driehaus Securities LLC since 2012; General Counsel and Secretary of Driehaus Securities LLC through December 2019. | |||
| Anne S. Kochevar 25 East Erie Street Chicago, IL 60611 YOB: 1963 | Chief Compliance Officer and Anti-Money Laundering Compliance Officer | Since 2019 | Chief Compliance Officer of the Adviser since July 2019; Anti-Money Laundering Compliance Officer of Driehaus Securities LLC from July 2019 to December 2019; Chief Compliance Officer of Confluence Investment Management from January 2018 to June 2019; and Chief Compliance Officer of Henderson Global Investors U.S. from November 2014 to January 2018. | |||
| Tanya S. Tancheff 333 South Wabash Avenue Chicago, IL 60604 YOB: 1973 | Secretary | Since December 2022 | The Northern Trust Company, Second Vice President 2022 - Present; ALPS Holdings, Inc., Senior Paralegal 2017 - 2022. | |||
| Malinda M. Sanborn 25 East Erie Street Chicago, IL 60611 YOB: 1965 | Assistant Treasurer | Since August 2020 | Director of Fund Administration of the Advisor since August 2014. | |||
| Christina E. Algozine 25 East Erie Street Chicago, IL 60611 YOB: 1985 | Assistant Secretary | Since 2019 | Assistant Secretary of the Adviser since January 2019; Assistant Secretary of Driehaus Securities LLC from January 2019 to December 2019; Senior Attorney, Aegon USA Investment Management, LLC from December 2014 to January 2019. |
| Emerging Markets Growth Fund — Investor Class | ||||||
| Beginning Account Value July 1, 2022 | Ending Account Value December 31, 2022 | Expenses Paid During Six Months Ended December 31, 2022* | ||||
| Actual | $1,000.00 | $956.00 | $6.85 | |||
| Hypothetical Example, assuming a 5% return before expenses | $1,000.00 | $1,018.20 | $7.07 | |||
| Emerging Markets Growth Fund — Institutional Class | ||||||
| Beginning Account Value July 1, 2022 | Ending Account Value December 31, 2022 | Expenses Paid During Six Months Ended December 31, 2022* | ||||
| Actual | $1,000.00 | $957.50 | $5.62 | |||
| Hypothetical Example, assuming a 5% return before expenses | $1,000.00 | $1,019.46 | $5.80 | |||
| Emerging Markets Small Cap Growth Fund | ||||||
| Beginning Account Value July 1, 2022 | Ending Account Value December 31, 2022 | Expenses Paid During Six Months Ended December 31, 2022* | ||||
| Actual | $1,000.00 | $978.70 | $6.18 | |||
| Hypothetical Example, assuming a 5% return before expenses | $1,000.00 | $1,018.95 | $6.31 | |||
| Emerging Markets Opportunities Fund | ||||||
| Beginning Account Value July 1, 2022 | Ending Account Value December 31, 2022 | Expenses Paid During Six Months Ended December 31, 2022* | ||||
| Actual | $1,000.00 | $993.30 | $4.97 | |||
| Hypothetical Example, assuming a 5% return before expenses | $1,000.00 | $1,020.21 | $5.04 | |||
| International Small Cap Growth Fund | ||||||
| Beginning Account Value July 1, 2022 | Ending Account Value December 31, 2022 | Expenses Paid During Six Months Ended December 31, 2022* | ||||
| Actual | $1,000.00 | $1,054.40 | $6.11 | |||
| Hypothetical Example, assuming a 5% return before expenses | $1,000.00 | $1,019.26 | $6.01 | |||
| Micro Cap Growth Fund | ||||||
| Beginning Account Value July 1, 2022 | Ending Account Value December 31, 2022 | Expenses Paid During Six Months Ended December 31, 2022* | ||||
| Actual | $1,000.00 | $1,088.70 | $7.58 | |||
| Hypothetical Example, assuming a 5% return before expenses | $1,000.00 | $1,017.95 | $7.32 | |||
| Small Cap Growth Fund — Investor Class | ||||||
| Beginning Account Value July 1, 2022 | Ending Account Value December 31, 2022 | Expenses Paid During Six Months Ended December 31, 2022* | ||||
| Actual | $1,000.00 | $1,040.20 | $5.25 | |||
| Hypothetical Example, assuming a 5% return before expenses | $1,000.00 | $1,020.06 | $5.19 | |||
| Small Cap Growth Fund — Institutional Class | ||||||
| Beginning Account Value July 1, 2022 | Ending Account Value December 31, 2022 | Expenses Paid During Six Months Ended December 31, 2022* | ||||
| Actual | $1,000.00 | $1,042.10 | $3.91 | |||
| Hypothetical Example, assuming a 5% return before expenses | $1,000.00 | $1,021.37 | $3.87 | |||
| Small/Mid Cap Growth Fund | ||||||
| Beginning Account Value July 1, 2022 | Ending Account Value December 31, 2022 | Expenses Paid During Six Months Ended December 31, 2022* | ||||
| Actual | $1,000.00 | $1,015.20 | $4.83 | |||
| Hypothetical Example, assuming a 5% return before expenses | $1,000.00 | $1,020.42 | $4.84 | |||
| Event Driven Fund | ||||||
| Beginning Account Value July 1, 2022 | Ending Account Value December 31, 2022 | Expenses Paid During Six Months Ended December 31, 2022* | ||||
| Actual | $1,000.00 | $1,008.70 | $8.61 | |||
| Hypothetical Example, assuming a 5% return before expenses | $1,000.00 | $1,016.64 | $8.64 | |||
| Emerging Markets Growth Fund – Investor Class | 1.39% |
| Emerging Markets Growth Fund – Institutional Class | 1.14% |
| Emerging Markets Small Cap Growth Fund | 1.24% |
| Emerging Markets Opportunities Fund | 0.99% |
| International Small Cap Growth Fund | 1.18% |
| Micro Cap Growth Fund | 1.44% |
| Small Cap Growth Fund – Investor Class | 1.02% |
| Small Cap Growth Fund – Institutional Class | 0.76% |
| Small/Mid Cap Growth Fund | 0.95% |
| Event Driven Fund | 1.70% |
| Emerging Markets Growth Fund | Emerging Markets Small Cap Growth Fund | Emerging Markets Opportunities Fund | International Small Cap Growth Fund | |||
| $2,015,660 | $— | $— | $6,899,210 |
| Micro Cap Growth Fund | Small Cap Growth Fund | Small/Mid Cap Growth Fund | Event Driven Fund | |||
| $13,811,619 | $9,211,798 | $461,634 | $2,582,366 |
| Emerging Markets Growth Fund | Emerging Markets Small Cap Growth Fund | Emerging Markets Opportunities Fund | International Small Cap Growth Fund | |||
| 100.00% | —% | 36.97% | —% |
| Micro Cap Growth Fund | Small Cap Growth Fund | Small/Mid Cap Growth Fund | Event Driven Fund | |||
| —% | —% | —% | 100.00% |
| Emerging Markets Growth Fund | Emerging Markets Small Cap Growth Fund | Emerging Markets Opportunities Fund | International Small Cap Growth Fund | |||
| —% | —% | —% | —% |
| Micro Cap Growth Fund | Small Cap Growth Fund | Small/Mid Cap Growth Fund | Event Driven Fund | |||
| —% | —% | —% | —% |
| Emerging Markets Growth Fund | Emerging Markets Small Cap Growth Fund | Emerging Markets Opportunities Fund | International Small Cap Growth Fund | |||
| 8.43% | —% | 0.46% | —% |
| Micro Cap Growth Fund | Small Cap Growth Fund | Small/Mid Cap Growth Fund | Event Driven Fund | |||
| —% | —% | —% | 68.40% |
| (b) | Not applicable. |
| Item 2. | Code of Ethics. |
| (a) | The registrant, as of the end of the period covered by this report, has adopted a code of ethics that applies to the registrant’s principal executive officer, principal financial officer, principal accounting officer or controller, or persons performing similar functions, regardless of whether these individuals are employed by the registrant or a third party. |
| (b) | No response required. |
| (c) | There have been no amendments, during the period covered by this report, to a provision of the code of ethics that applies to the registrant’s principal executive officer, principal financial officer, principal accounting officer or controller, or persons performing similar functions, regardless of whether these individuals are employed by the registrant or a third party, and that relates to any element of the code of ethics description. |
| (d) | The registrant has not granted any waivers, including an implicit waiver, from a provision of the code of ethics that applies to the registrant’s principal executive officer, principal financial officer, principal accounting officer or controller, or persons performing similar functions, regardless of whether these individuals are employed by the registrant or a third party, that relates to one or more of the items set forth in paragraph (b) of this item. |
| (e) | Not applicable. |
| (f) | The registrant’s Code of Ethics for Principal Executive and Principal Financial Officers is filed herewith. |
| Item 3. | Audit Committee Financial Expert. |
The registrant’s Board of Trustees has designated Christopher J. Towle as an audit committee financial expert. Christopher J. Towle is “independent,” as defined by this Item 3. Mr. Towle is a CFA charterholder and his relevant experience includes prior audit committee experience, experience reviewing financial statements, performing company specific financial analysis and creating financial models, as well as coursework in accounting.
| Item 4. | Principal Accountant Fees and Services. |
| (a) | Audit Fees |
For the fiscal years ended December 31, 2022 and 2021, Ernst & Young LLP, the registrant’s principal accountant (“E&Y”), billed the registrant $255,000 and $255,000, respectively, for professional services rendered for the audit of the registrant’s annual financial statements or services that are normally provided in connection with statutory and regulatory filings.
| (b) | Audit-Related Fees |
For the fiscal years ended December 31, 2022 and 2021, E&Y billed the registrant $0 and $0, respectively, for assurance and related services that are reasonably related to the performance of the audit of the registrant’s financial statements and that are not reported above.
For engagements that Driehaus Capital Management LLC, the registrant’s investment adviser (“DCM”) entered into with E&Y for fiscal years 2022 and 2021, E&Y provided no audit-related services to DCM that were for engagements directly related to the registrant’s operations and financial reporting.
| (c) | Tax Fees |
For the fiscal years ended December 31, 2022 and 2021, E&Y billed the registrant $91,850 and $91,200 respectively, for professional services rendered for tax compliance, tax advice, and tax planning. Such services consisted of review of the registrant’s income tax returns and tax distribution requirements and analysis related to foreign tax liabilities and passive foreign investment company status. The Audit Committee pre-approved all tax services that E&Y provided to the registrant.
For fiscal years 2022 and 2021, E&Y provided no tax services to DCM that were for engagements directly related to the registrant’s operations and financial reporting.
| (d) | All Other Fees |
For the fiscal years ended December 31, 2022 and 2021, E&Y billed the registrant $0 and $0, respectively, for products and services provided, other than the services reported above.
For fiscal years 2022 and 2021, E&Y provided no other services to DCM that were for engagements directly related to the registrant’s operations and financial reporting.
| (e)(1) | Audit Committee Pre-Approval Policies and Procedures |
Pursuant to registrant’s Audit Committee Charter (the “Charter”), the Audit Committee is responsible for pre-approving any engagement of the principal accountant to provide non-prohibited services to the registrant, including the fees and other compensation to be paid to the principal accountant, to the extent required by Rule 2-01(c)(7) of Regulation S-X. The Chairperson of the Audit Committee may grant pre-approval for such engagements of $5,000 or less. All such delegated pre-approvals will be presented to the Audit Committee no later than the next Audit Committee meeting.
Pursuant to the Charter, the Audit Committee is also responsible for pre-approving any engagement of the principal accountant, including the fees and other compensation to be paid to the principal accountant, to provide non-audit services to the registrant’s investment adviser (or any entity controlling, controlled by, or under common control with the adviser that provides ongoing services to the registrant), if the engagement relates directly to the operations and financial reporting of the registrant, to the extent required by Rule 2-01(c)(7) of Regulation S-X. The Chairperson of the Audit Committee may grant pre-approval for engagements of $5,000 or less. All such delegated pre-approvals will be presented to the Audit Committee no later than the next Audit Committee meeting.
| (e)(2) | The percentage of services described in each of paragraphs (b) through (d) of this Item that were approved by the Audit Committee pursuant to paragraph (c)(7)(i)(C) of Rule 2-01 of Regulation S-X is 0%. |
| (f) | Not applicable. |
| (g) | Non-Audit Fees |
For the fiscal years ended December 31, 2022 and 2021, E&Y billed the registrant $91,850 and $91,200, respectively, in aggregate non-audit fees. For the fiscal years ended December 31, 2022 and 2021, E&Y billed DCM $0 and $0, respectively, in aggregate non-audit fees.
| (h) | Not applicable. |
| (i) | Not applicable. |
| (j) | Not applicable. |
| Item 5. | Audit Committee of Listed Registrants. |
Not applicable.
| Item 6. | Investments. |
| (a) | Schedule of Investments in securities of unaffiliated issuers as of the close of the reporting period is included as part of the report to shareholders filed under Item 1(a) of this form. |
| (b) | Not applicable. |
| Item 7. | Disclosure of Proxy Voting Policies and Procedures for Closed-End Management Investment Companies. |
Not applicable.
| Item 8. | Portfolio Managers of Closed-End Management Investment Companies. |
Not applicable.
| Item 9. | Purchases of Equity Securities by Closed-End Management Investment Companies and Affiliated Purchasers. |
Not applicable.
Item 10. Submission of Matters to a Vote of Security Holders.
There have been no material changes to the procedures by which the shareholders may recommend nominees to the registrant’s board of directors, where those changes were implemented after the registrant last provided disclosure in response to the requirements of Item 407(c)(2)(iv) of Regulation S-K (17 CFR 229.407) (as required by Item 22(b)(15) of Schedule 14A (17 CFR 240.14a-101)), or this Item.
Item 11. Controls and Procedures.
| (a) | The registrant’s principal executive and principal financial officers, or persons performing similar functions, have concluded that the registrant’s disclosure controls and procedures (as defined in Rule 30a-3(c) under the Investment Company Act of 1940, as amended (the “1940 Act”) (17 CFR 270.30a-3(c))) are effective, as of a date within 90 days of the filing date of the report that includes the disclosure required by this paragraph, based on their evaluation of these controls and procedures required by Rule 30a-3(b) under the 1940 Act (17 CFR 270.30a-3(b)) and Rules 13a-15(b) or 15d-15(b) under the Securities Exchange Act of 1934, as amended (17 CFR 240.13a-15(b) or 240.15d-15(b)). |
| (b) | There were no changes in the registrant’s internal control over financial reporting (as defined in Rule 30a-3(d) under the 1940 Act (17 CFR 270.30a-3(d))) that occurred during the period covered by this report that has materially affected, or is reasonably likely to materially affect, the registrant’s internal control over financial reporting. |
Item 12. Disclosure of Securities Lending Activities for Closed-End Management Investment Companies.
Not applicable.
Item 13. Exhibits.
| (a)(2) | The certifications for the Registrant’s required by to Rule 30a-2(a) of the Investment Company Act of 1940 Act, as amended, are attached hereto as Ex99.Cert. |
| (a)(3) | Not applicable. |
| (a)(4) | Not applicable. |
SIGNATURES
Pursuant to the requirements of the Securities Exchange Act of 1934 and the Investment Company Act of 1940, the registrant has duly caused this report to be signed on its behalf by the undersigned, thereunto duly authorized.
| Driehaus Mutual Funds | ||
| By: | /s/ Stephen T. Weber | |
| Stephen T. Weber, President | ||
| (principal executive officer) | ||
| Date: | March 2, 2023 | |
Pursuant to the requirements of the Securities Exchange Act of 1934 and the Investment Company Act of 1940, this report has been signed below by the following persons on behalf of the registrant and in the capacities and on the dates indicated.
| By: | /s/ Stephen T. Weber | |
| Stephen T. Weber, President | ||
| (principal executive officer) | ||
| Date: | March 2, 2023 | |
| By: | /s/ Robert M. Kurinsky | |
| Robert M. Kurinsky, Vice President and Treasurer | ||
| (principal financial officer) | ||
| ||
| Date: | March 2, 2023 | |