CARRIAGE SERVICES ANNOUNCES RECORD 2013 ANNUAL RESULTS,
ACQUISITIONS FROM SCI SUBJECT TO FTC APPROVAL,
CAPITAL STRUCTURE STRATEGY AND EXECUTION TIMEFRAME, DAVID J. DECARLO JOINS CARRIAGE LEADERSIP TEAM,
AND INCREASED FULL YEAR OUTLOOKS FOR 2014 AND 2015
HOUSTON – March 5, 2014 – Carriage Services, Inc. (NYSE: CSV) today announced record results for the year ending December 31, 2013 along with major near term events that will significantly impact Carriage's intermediate term Outlook.
Melvin C. Payne, Chief Executive Officer, stated, “On January 8, 2014, we issued a press release announcing the termination of Carriage’s Good To Great Stock Award Program with an early cash-out and gave notice that the industry acquisition landscape was becoming more attractive and visible. Moreover, we also stated that we would likely soon look at the optimum capital structure strategy required to finance an accelerating growth strategy over the next five years. I am now extremely proud to announce the following major milestone events for our company.”
| |
| I. | Another year of record financial performance in 2013, consistent with our annual Good To Great theme of Carriage Services 2013 - Raising the Standard - ALL IN! |
| |
| • | Total Revenue of $214.0 million, an increase of 7.3%; |
| |
| • | Non-GAAP Adjusted Consolidated EBITDA of $56.1 million, an increase of 5.8%; |
| |
| • | Non-GAAP Basic Earnings Per Share of $1.00, an increase of 23.5%; and |
| |
| • | Non-GAAP Free Cash Flow of $33.2 million, an increase of 60.0%. |
| |
| II. | Agreement to acquire six businesses from SCI |
| |
| • | Enter two new large strategic markets, New Orleans and Washington, D.C.; |
| |
| • | Four businesses in New Orleans and two in Alexandria, VA; and |
| |
| • | Subject to FTC approval, such approval and closing expected early in the second quarter. |
| |
| III. | Financing Strategy and Execution Timeframe |
| |
| • | Plan developed with Bank of America, agent for our Bank Group, to expand our existing Revolving Credit Facility and extend our Bank Term Loan simultaneously with closing of SCI divestitures; and |
| |
| • | Plan developed to refinance the TIDES Convertible Security with a new Convertible Issue in conjunction with refinancing of Bank Revolving Credit and Term Loan Facilities. |
| |
| IV. | Increased Revenue Growth and Earning Power Outlook for 2014 and 2015 |
| |
| • | Strong pipeline of quality independent acquisition candidates, creating visibility of an acceleration of revenue and earnings over the next two full years; |
| |
| • | Full year 2014 Outlook range of $231 - $235 million Revenue and Adjusted Basic EPS of $1.18 - $1.22; |
| |
| • | Full year 2015 Outlook range of $254 - $262 million Revenue and Adjusted Basic EPS of $1.42 - $1.48; |
| |
| • | Full Year Outlooks are not “precisely wrong management estimates,” but rather “roughly right performance ranges” that will be updated with Rolling Four Quarter Outlooks as we move through these two years. |
| |
| V. | Dave DeCarlo joins Bill Heiligbrodt and Mel Payne as Executive Officer Leadership Team |
| |
| • | Bill, Dave and Mel will comprise new Operations and Strategic Growth Executive Committee; |
| |
| • | Bill heads Treasury and Finance, Accounting and Reporting, Legal, Investor Relations; and |
| |
| • | Dave heads Strategic and Corporate Development, Supply and Project Development, Operations Support including IT and HR, with a special focus on challenges and opportunities. |
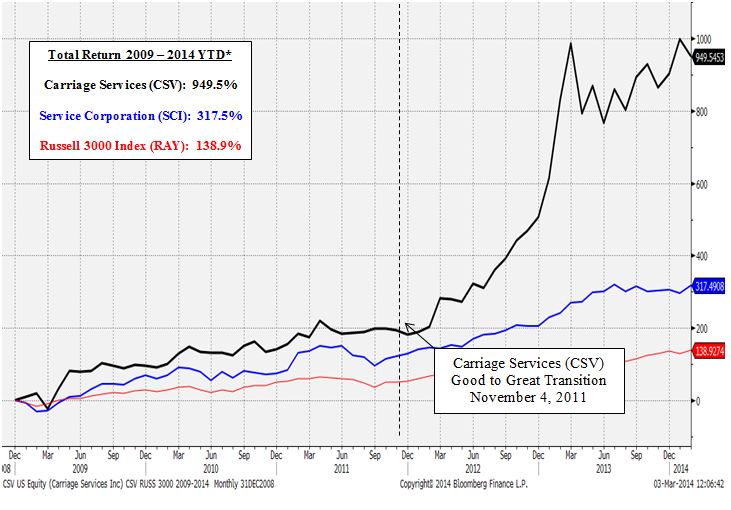
“On November 4, 2011, twenty years after Carriage was founded, we finalized a major Board and Executive Management reorganization, which we refer to internally as our Good To Great Transition Date, then launched a five year Good To Great Journey to take Carriage from a “Good” deathcare and consolidation company in 2012 to one considered “Great” by the end of 2016, using equity market valuation as a benchmark. We assigned 2012 the theme of Carriage Services 2012 - A NEW BEGINNING!, and challenged and empowered our entire field and home office support teams “to own” the five year Good To Great Journey with broadly higher and sustainable operating and financial performance. We assigned 2013 the theme of Carriage Services 2013 - Raising the Standard - ALL IN!
The results after two full years of this five year Good To Great Journey have been remarkable, as reflected in the Total Shareholder Return graph below comparing the five full years (since January 1, 2009) and YTD 2014 Total Shareholder Returns of Carriage (up 949.5%), SCI (up 317.5%) and the Russell 3000 Index (up 138.9%). Moreover, approximately 80% of Carriage’s Total Shareholder Return over the last five plus years has been realized since we launched our Good To Great Journey on January 1, 2012, as our stock price has increased 265% from $5.60 per share on December 31, 2011 to $20.43 per share on February 28, 2014.
*Total Return includes stock price appreciation and dividend reinvestment
While we have well executed our Standards Operating Model, Strategic Acquisition Model and 4E Leadership Model over the last two years, we believe that we are now well positioned to accelerate the high and sustainable earnings power of Carriage as an operating and consolidation platform in the still highly fragmented funeral and cemetery industry. While it took 22 years from its founding for Carriage to achieve $1.02 per share in Non-GAAP Adjusted EPS in 2013 ($1.00 Basic plus $0.02 from divested operations), we are poised to expand our earnings power as defined by Non-GAAP Adjusted EPS by over 40% over the 2014 and 2015 Full Year Outlook Periods, as shown below:
|
| | | | | | | | | | | | | | | | | | | | | | | | |
| | | Five Year Trend ($Millions Except Per Share and Percentage Amounts) |
| | | | | | | | | |
| | | Actual | | Outlook Midpoint | | |
| | | Actual | | Good To Great Actual | | Good To Great Outlook | | Percent |
| | | 2011 | | 2012 | | 2013 | | 2014 | | 2015 | | CAGR | |
| Total Revenue | | $ | 183.5 |
| | $ | 199.4 |
| | $ | 214.0 |
| | $ | 233.0 |
| | $ | 258.0 |
| | 8.9 | % |
| Total Field EBITDA | | 68.4 |
| | 79.1 |
| | 84.6 |
| | 93.4 |
| | 104.5 |
| | 11.2 | % |
| Total Field EBITDA Margin | | 37.3 | % | | 39.7 | % | | 39.5 | % | | 40.1 | % | | 40.5 | % | | 2.1 | % |
| | | | | | | | | | | | | |
| Total Overhead | | $ | 28.9 |
| | $ | 30.3 |
| | $ | 33.0 |
| | $ | 35.0 |
| | $ | 37.0 |
| | 6.4 | % |
| Total Overhead Margin | | 15.7 | % | | 15.2 | % | | 15.4 | % | | 15.0 | % | | 14.3 | % | | (2.3 | )% |
| | | | | | | | | | | | | |
| Adjusted Consolidated EBITDA | | $ | 48.9 |
| | $ | 53.1 |
| | $ | 56.1 |
| | $ | 62.9 |
| | $ | 71.0 |
| | 9.8 | % |
| Adjusted Consolidated EBITDA Margin | | 26.7 | % | | 26.6 | % | | 26.2 | % | | 27.0 | % | | 27.5 | % | | 0.8 | % |
| | | | | | | | | | | | | |
| Adjusted Net Income | | $ | 12.0 |
| | $ | 14.8 |
| | $ | 18.2 |
| | $ | 21.8 |
| | $ | 26.8 |
| | 22.2 | % |
| Adjusted Net Income Margin | | 6.5 | % | | 7.4 | % | | 8.5 | % | | 9.4 | % | | 10.4 | % | | 12.5 | % |
| | | | | | | | | | | | | |
| Adjusted Basic EPS | | $ | 0.65 |
| | $ | 0.81 |
| | $ | 1.00 |
| | $ | 1.20 |
| | $ | 1.45 |
| | 22.2 | % |
| Basic Shares Outstanding | | 18.4 |
| | 18.2 |
| | 18.2 |
| | 18.2 |
| | 18.5 |
| | Flat | |
The above tables reference certain Non-GAAP financial measurements that are defined and reconciled at the end of this press release.
SCI has pioneered the consolidation of the highly fragmented funeral and cemetery industry over the last fifty years, and has been especially opportunistic over the last eight years with the acquisition of Alderwoods in 2006 (second largest consolidator at the time) and Stewart Enterprises in late 2013 (second largest at the time), leaving only SCI and Carriage as remaining long term, well established and capitalized consolidators with a similar portfolio revenue profile of funeral and cemetery businesses. We are extraordinarily well positioned to benefit as a highly differentiated family succession planning solution over the next five to ten years, as we have developed an innovative high performance culture operating and consolidation framework that is uniquely attractive to the remaining large, quality independents in 15-20 large, demographically strong strategic markets.
Bill and I are therefore thrilled to have Dave DeCarlo joining our Executive Officer Leadership Team to head the Strategic Development function in order to focus on and realize the full potential of the current industry acquisition landscape. I speak for Dave, Bill and I on behalf of our Senior Leadership Team and Board of Directors when I say that we believe that Carriage is entering a “sweet spot” period of rapidly accelerating earnings power, Free Cash Flow and shareholder value creation as we leverage Carriage’s high performance Standards Operating Model, Consolidation and Overhead Platform, and low share count with selective high quality acquisitions vetted by our proprietary Strategic Acquisition Model. Our Good To Great Journey should continue to produce exceptional shareholder returns in future years and hard earned and well deserved recognition for our company and its Being The Best field operating and home office support leaders and employees.
Lastly and importantly for our company leadership and employees, I am extremely proud to publicly announce our Good To Great annual theme for this year, “Carriage Services 2014 : Being The Best - One Team, One Vision!”, concluded Mr. Payne.”
FIELD OPERATIONS
Year Ended December 31, 2013 compared to Year Ended December 31, 2012
| |
| • | Total Field Revenue increased 7.3% to $214.0 million; |
| |
| • | Total Field EBITDA increased 7.0% to $84.6 million; |
| |
| • | Total Field EBITDA Margin decreased 20 basis points to 39.5%; |
| |
| • | Total Funeral Operating Revenue increased 7.2% to $154.7 million; |
| |
| • | Same Store Funeral Revenue increased 0.2% with same store volume increasing 1.6%; |
| |
| • | Acquisition Funeral Revenue increased 39.1% with acquisition volume increasing 28.9%; |
| |
| • | Total Funeral Field EBITDA Margin decreased 150 basis points to 35.9%; |
| |
| • | Total Cemetery Operating Revenue increased 5.7% to $40.5 million; |
| |
| • | Cemetery pre-need property sale contracts increased 11.7% to 7,020; |
| |
| • | Preneed property revenue recognized increased 10.8% and At-need revenue increased 6.5%; |
| |
| • | Total Cemetery Field EBITDA Margin increased 320 basis points to 28.9%; |
| |
| • | Total Financial Revenue increased 12.1% to $18.8 million; |
| |
| • | Funeral Financial Revenue increased 21.3% to $9.3 million; |
| |
| • | Cemetery Financial Revenue increased 4.4% to $9.5 million; |
| |
| • | Total Financial EBITDA Margin increased 100 basis points to 92.3%. |
FREE CASH FLOW
We produced Free Cash Flow from operations for the year 2013 of $33.2 million compared to Free Cash Flow from operations of $20.8 million for the corresponding period in 2012. The sources and uses of cash for the year 2012 and 2013 consisted of the following (in millions): |
| | | | | | | |
| | December 31, |
| | 2012 | | | 2013 | |
| | | | | | |
| Cash flow provided by operations | $ | 25.8 |
| | $ | 39.8 |
|
| Cash used for maintenance capital expenditures | | (5.0 | ) | | | (6.6 | ) |
| Free Cash Flow | $ | 20.8 |
| | $ | 33.2 |
|
| Cash at beginning of period | | 1.1 |
| | | 1.7 |
|
| Cash used for growth capital expenditures | | (5.4 | ) | | | (4.1 | ) |
| Cash used for acquisitions and new construction | | (45.1 | ) | | | (19.7 | ) |
| Proceeds from sale of business | | 0.6 |
| | | 10.2 |
|
| Borrowings (payments) on the Credit Facility and debt | | 40.1 |
| | | (19.0 | ) |
| Cash used for dividends on common stock and redeemable preferred stock | | (1.8 | ) | | | (1.8 | ) |
| Repurchase of common stock | | (4.5 | ) | | | — |
|
| Payment of loan origination costs and call premium on our Senior Notes | | (4.9 | ) | | | — |
|
| Other investing and financing activities, net | | 0.8 |
| | | 0.9 |
|
| Cash at end of period | $ | 1.7 |
| | $ | 1.4 |
|
ROLLING FOUR QUARTER OUTLOOK RAISED AND INCREASED TO TWO FULL YEARS
The Rolling Four Quarter Outlooks (“Outlooks”) reflects management’s opinion on the performance of the portfolio of businesses, plus visible and likely acquisitions, for the rolling four quarter periods ending December 31, 2014, and December 31, 2015, and the performance of trusts during the corresponding periods. These Outlooks do not reflect dilution from conversion related to our existing convertible subordinated debentures, as we intend to refinance this security in the near term based on market conditions.
These yearly Outlooks are not intended to be management estimates or forecasts of our future performance, as we believe such precise quarterly and annual estimates will be precisely wrong all the time. Rather, our intent and goal is to reflect a "roughly right range" most of the time of future "Rolling Four Quarters Outlook" performance as we execute our Standards Operating, Strategic Acquisition and 4E Leadership Models over time.
ROLLING FOUR QUARTER OUTLOOK – Periods Ending December 31, 2014 and December 31, 2015
|
| | | | |
| | | Range (in millions, except per share amounts) |
| | | 2014 | | 2015 |
| Revenues | | $231.0 - $235.0 | | $254.0 - $262.0 |
| Consolidated EBITDA | | $57.9 - $59.0 | | $65.9 - $69.0 |
| Adjusted Consolidated EBITDA | | $62.4 - $63.5 | | $69.4 - $72.5 |
| Net Income | | $18.5 - $19.2 | | $23.1 - $25.9 |
| Adjusted Net Income | | $21.5 - $22.2 | | $25.4 - $28.2 |
| Adjusted Basic Earnings Per Share | | $1.18 - $1.22 | | $1.42 - $1.48 |
Factors affecting our analysis include, among others, number and size of acquisitions, and timing of closing, funeral contract volumes, average revenue per funeral service, cemetery interment volumes, preneed cemetery sales, capital expenditures, execution of our funeral and cemetery Standards Operating Model, Strategic Acquisition Model and Withdrawable Trust Income. Revenues, Consolidated EBITDA, Adjusted Consolidated EBITDA, Net Income, Adjusted Net Income, GAAP Earnings Per Share and Adjusted Earnings Per Share for the four quarter periods ending December 31, 2014 and 2015 are expected to improve relative to the same period in the previous period for the following reasons:
| |
| • | Increases in Acquired Funeral Revenue and Acquired Funeral Field EBITDA; |
| |
| • | Increases in Acquired Cemetery Revenue and Acquired Cemetery Field EBITDA; |
| |
| • | Modest increases in Same Store Funeral Revenue and Same Store Funeral Field EBITDA; |
| |
| • | Increases in Same Store Cemetery Revenue and Same Store Cemetery Field EBITDA; |
| |
| • | Increases in Financial Revenue and Financial EBITDA from trust funds; and |
| |
| • | Reduced interest expense in conjunction with the fourth amendment to our bank credit facilities and the refinancing of our $90 million 7% convertible subordinated debentures. |
We have not included in our Rolling Four Quarter Outlook a potentially fully diluted EPS calculation using the 4.4 million underlying shares of the TIDES security due to our intent to refinance this security in the near term. Our 2014 Rolling Four Quarter Outlook includes a reduction in cash taxes of approximately $7.25 million due to favorable adjustments from approved accounting method changes. This benefit will not occur in 2015. The 2015 Rolling Four Quarter Outlook cash flow will be approximately the same as 2014 without the tax benefit.
CONFERENCE CALL AND INVESTOR RELATIONS CONTACT
Carriage Services has scheduled a conference call for tomorrow, March 6, 2014 at 9:30 a.m. central time. To participate in the call, please dial 866-516-3867 (ID-77317838) and ask for the Carriage Services conference call. A replay of the conference call will be available through March 10, 2014 and may be accessed by dialing 855-859-2056 (ID-77317838). The conference call will also be available at www.carriageservices.com. For any investor relations questions, please contact Bill Heiligbrodt at 713-332-8553.
TRUST FUND PERFORMANCE
During 2013, Carriage’s discretionary trust funds gained 14.2%. The current yield on Carriage’s discretionary fixed income portfolio, which comprises 75% of discretionary trust assets, is 8.7% and the estimated annual income for the discretionary portfolio is approximately $11.3 million.
The total discretionary portfolio performance of 14.2% exceeded the 80/20 index benchmark performance of 12.4% in 2013 due to each of the fixed income and equity components of Carriage's discretionary portfolio outperforming their respective benchmarks (S&P 500 & High Yield Index). The discretionary portfolio equity and high yield performance in 2013 of 45% and 8.2%, respectively, exceeded the 32.4% for the S&P 500 and a 7.5% gain for the High Yield Index.
The 2013 performance of Carriage's discretionary trust portfolio continued to benefit Carriage through higher income earned from preneed funeral and cemetery contracts that have been serviced and through increased income from the cemetery perpetual care trusts. These benefits are evident in the increase in recognized financial revenue in our Trend Reports. Given the recurring nature of the income generated by the fixed income portfolio, we expect the performance of the discretionary trust portfolio to benefit Carriage for the foreseeable future.
Shown below are consolidated performance metrics for the combined trust fund portfolios (preneed funeral, cemetery merchandise and services and cemetery perpetual care) at key dates.
|
| | | | | | | | | | | | |
| Investment Performance |
| | | Investment Performance(1) | | Index Performance |
| | | Discretionary | Total Trust | | S&P 500 Stock Index | High Yield Index | 80/20 index Benchmark(2) |
| | | | | | | | |
| 1 year ended 12/31/13 | | 14.2 | % | 13.7 | % | | 32.4 | % | 7.5 | % | 12.4 | % |
| 2 years ended 12/31/13 | | 37.5 | % | 33.2 | % | | 53.0 | % | 24.4 | % | 30.2 | % |
| 3 years ended 12/31/13 | | 33.5 | % | 30.7 | % | | 56.2 | % | 30.6 | % | 35.7 | % |
| 4 years ended 12/31/13 | | 61.1 | % | 54.4 | % | | 79.4 | % | 50.4 | % | 56.2 | % |
| 5 years ended 12/31/13 | | 150.6 | % | 127.1 | % | | 125.8 | % | 137.9 | % | 135.5 | % |
(1) Investment performance includes realized income and unrealized appreciation (depreciation).
| |
| (2) | The 80/20 Benchmark is 80% weighted to the High Yield Index and 20% weighted to the S&P 500 Stock Index. |
|
| | | | | | | | | | | | | | |
Asset Allocation as of December 31, 2013 (in thousands) |
| | | | Discretionary Trust Funds | | Total Trust Funds |
| Asset Class | | | MV |
| % |
| | MV |
| % |
|
| Cash | | | $ | 5,539 |
| 3 | % | | $ | 19,986 |
| 9 | % |
| Equities | | | 36,255 |
| 20 | % | | 53,126 |
| 24 | % |
| Fixed Income | | | 133,530 |
| 75 | % | | 147,412 |
| 65 | % |
| Other/Insurance | | | 3,521 |
| 2 | % | | 3,720 |
| 2 | % |
| Total Portfolios | | | $ | 178,845 |
| 100 | % | | $ | 224,244 |
| 100 | % |
|
| | | | | | | | | | | | | | | |
| CARRIAGE SERVICES, INC. |
| FIVE YEAR OPERATING AND FINANCIAL METRICS TREND REPORT |
| FROM CONTINUING OPERATIONS (IN THOUSANDS - EXCEPT PER SHARE AMOUNTS) |
| | | | | | |
| | 2009 | 2010 | 2011 | 2012 | 2013 |
| | | | | | |
| Same Store Contracts | | | | | |
| Atneed Contracts | 18,307 |
| 18,299 |
| 17,792 |
| 17,735 |
| 17,958 |
|
| Preneed Contracts | 4,634 |
| 4,695 |
| 4,957 |
| 4,699 |
| 4,825 |
|
| Total Same Store Funeral Contracts | 22,941 |
| 22,994 |
| 22,749 |
| 22,434 |
| 22,783 |
|
| | | | | | |
| Acquisition Contracts | | | | | |
| Atneed Contracts | 52 |
| 1,307 |
| 3,067 |
| 4,773 |
| 5,991 |
|
| Preneed Contracts | 17 |
| 284 |
| 599 |
| 821 |
| 1,222 |
|
| Total Acquisition Funeral Contracts | 69 |
| 1,591 |
| 3,666 |
| 5,594 |
| 7,213 |
|
| Total Funeral Contracts | 23,010 |
| 24,585 |
| 26,415 |
| 28,028 |
| 29,996 |
|
| | | | | | |
| Funeral Operating Revenue | | | | | |
| Same Store Revenue | $ | 120,309 |
| $ | 119,799 |
| $ | 118,801 |
| $ | 118,571 |
| $ | 118,813 |
|
| Acquisition Revenue | 310 |
| 5,705 |
| 14,210 |
| 25,801 |
| 35,891 |
|
| Total Funeral Operating Revenue | $ | 120,619 |
| $ | 125,504 |
| $ | 133,011 |
| $ | 144,372 |
| $ | 154,704 |
|
| | | | | | |
| Cemetery Operating Revenue | | | | | |
| Same Store Revenue | $ | 39,316 |
| $ | 37,797 |
| $ | 36,481 |
| $ | 38,113 |
| $ | 40,181 |
|
| Acquisition Revenue | — |
| — |
| — |
| 166 |
| 298 |
|
| Total Cemetery Operating Revenue | $ | 39,316 |
| $ | 37,797 |
| $ | 36,481 |
| $ | 38,279 |
| $ | 40,479 |
|
| | | | | | |
| Financial Revenue | | | | | |
| Preneed Funeral Commission Income | $ | 2,023 |
| $ | 2,265 |
| $ | 1,811 |
| $ | 1,711 |
| $ | 1,853 |
|
| Preneed Funeral Trust Earnings | 3,817 |
| 5,965 |
| 6,290 |
| 5,921 |
| 7,408 |
|
| Cemetery Trust Earnings | 2,436 |
| 4,507 |
| 4,627 |
| 7,647 |
| 8,095 |
|
| Preneed Cemetery Finance Charges | 1,445 |
| 1,479 |
| 1,294 |
| 1,462 |
| 1,418 |
|
| Total Financial Revenue | $ | 9,721 |
| $ | 14,216 |
| $ | 14,022 |
| $ | 16,741 |
| $ | 18,774 |
|
| Total Revenue | $ | 169,656 |
| $ | 177,517 |
| $ | 183,514 |
| $ | 199,392 |
| $ | 213,957 |
|
| | | | | | |
| Field EBITDA | | | | | |
| Same Store Funeral Field EBITDA | $ | 42,992 |
| $ | 39,979 |
| $ | 42,728 |
| $ | 45,634 |
| $ | 44,682 |
|
| Same Store Funeral Field EBITDA Margin | 35.7 | % | 33.4 | % | 36.0 | % | 38.5 | % | 37.6 | % |
| Acquisition Funeral Field EBITDA | 105 |
| 624 |
| 3,681 |
| 8,339 |
| 10,886 |
|
| Acquisition Funeral Field EBITDA Margin | 33.9 | % | 10.9 | % | 25.9 | % | 32.3 | % | 30.3 | % |
| Total Funeral Field EBITDA | $ | 43,097 |
| $ | 40,603 |
| $ | 46,409 |
| $ | 53,973 |
| $ | 55,568 |
|
| Total Funeral Field EBITDA Margin | 35.7 | % | 32.4 | % | 34.9 | % | 37.4 | % | 35.9 | % |
| | | | | | |
| Same Store Cemetery Field EBITDA | $ | 9,152 |
| $ | 8,938 |
| $ | 9,370 |
| $ | 9,897 |
| $ | 11,757 |
|
| Same Store Cemetery Field EBITDA Margin | 23.3 | % | 23.6 | % | 25.7 | % | 26.0 | % | 29.3 | % |
| Acquisition Cemetery Field EBITDA | — |
| — |
| — |
| (76 | ) | (43 | ) |
| Acquisition Cemetery Field EBITDA Margin | — | % | — | % | — | % | -45.8 | % | -14.4 | % |
| Total Cemetery Field EBITDA | $ | 9,152 |
| $ | 8,938 |
| $ | 9,370 |
| $ | 9,821 |
| $ | 11,714 |
|
| Total Cemetery Field EBITDA Margin | 23.3 | % | 23.6 | % | 25.7 | % | 25.7 | % | 28.9 | % |
| | | | | | |
| Funeral Financial EBITDA | $ | 4,131 |
| $ | 6,854 |
| $ | 6,728 |
| $ | 6,224 |
| $ | 7,987 |
|
| Cemetery Financial EBITDA | 3,881 |
| 5,986 |
| 5,921 |
| 9,060 |
| 9,338 |
|
| Total Financial EBITDA | $ | 8,012 |
| $ | 12,840 |
| $ | 12,649 |
| $ | 15,284 |
| $ | 17,325 |
|
| Total Financial EBITDA Margin | 82.4 | % | 90.3 | % | 90.2 | % | 91.3 | % | 92.3 | % |
| | | | | | |
| Total Field EBITDA | $ | 60,261 |
| $ | 62,381 |
| $ | 68,428 |
| $ | 79,078 |
| $ | 84,607 |
|
| Total Field EBITDA Margin | 35.5 | % | 35.1 | % | 37.3 | % | 39.7 | % | 39.5 | % |
|
| | | | | | | | | | | | | | | |
| FIVE YEAR OPERATING AND FINANCIAL METRICS TREND REPORT |
| FROM CONTINUING OPERATIONS (IN THOUSANDS - EXCEPT PER SHARE AMOUNTS) |
| | | | | | |
| | 2009 | 2010 | 2011 | 2012 | 2013 |
| | | | | | |
| Overhead | | | | | |
| Total Variable Overhead | $ | 3,254 |
| $ | 3,555 |
| $ | 9,422 |
| $ | 9,623 |
| $ | 8,845 |
|
| Total Regional Fixed Overhead | 2,693 |
| 2,868 |
| 3,028 |
| 2,581 |
| 3,346 |
|
| Total Corporate Fixed Overhead | 13,989 |
| 14,794 |
| 16,436 |
| 18,068 |
| 20,829 |
|
| Total Overhead | $ | 19,936 |
| $ | 21,217 |
| $ | 28,886 |
| $ | 30,272 |
| $ | 33,020 |
|
| Overhead as a percent of sales | 11.8 | % | 12.0 | % | 15.7 | % | 15.2 | % | 15.4 | % |
| | | | | | |
| Consolidated EBITDA | $ | 40,325 |
| $ | 41,164 |
| $ | 39,542 |
| $ | 48,806 |
| $ | 51,587 |
|
| Consolidated EBITDA Margin | 23.8 | % | 23.2 | % | 21.5 | % | 24.5 | % | 24.1 | % |
| | | | | | |
| Other Expenses and Interest | | | | | |
| Property Depreciation & Amortization | $ | 10,199 |
| $ | 9,849 |
| $ | 9,480 |
| $ | 9,948 |
| $ | 11,668 |
|
| Non Cash Stock Compensation | 1,169 |
| 1,722 |
| 1,870 |
| 2,174 |
| 2,916 |
|
| Interest Expense, Net | 18,071 |
| 17,178 |
| 17,191 |
| 16,125 |
| 12,541 |
|
| Additional Interest and Costs of the Credit Facility | 180 |
| — |
| 201 |
| 3,031 |
| — |
|
| Pretax Income | $ | 10,706 |
| $ | 12,415 |
| $ | 10,800 |
| $ | 17,528 |
| $ | 24,462 |
|
| Tax Provision | 4,336 |
| 4,954 |
| 4,590 |
| 6,960 |
| 9,277 |
|
| GAAP Net Income | $ | 6,370 |
| $ | 7,461 |
| $ | 6,210 |
| $ | 10,568 |
| $ | 15,185 |
|
| | | | | | |
| Tax rate | 40.5 | % | 39.9 | % | 42.5 | % | 39.7 | % | 37.9 | % |
| Special Items, Net of Tax | | | | | |
| Withdrawable Trust Income | $ | 156 |
| $ | 2,269 |
| $ | 2,979 |
| $ | 1,265 |
| $ | 960 |
|
| Acquisition/Divestiture Expenses | — |
| 440 |
| 816 |
| 884 |
| 496 |
|
| Severance Costs | — |
| 156 |
| 1,278 |
| 529 |
| 965 |
|
| Litigation Settlements and Other Related Costs | — |
| (450 | ) | — |
| (465 | ) | — |
|
| Additional Interest & Other Costs of the Credit Facility | — |
| — |
| 133 |
| 2,000 |
| 248 |
|
| Consulting Fees | — |
| — |
| — |
| — |
| 368 |
|
| Securities Transaction Expenses | — |
| — |
| 333 |
| — |
| 160 |
|
| Other Special Items | — |
| (337 | ) | 795 |
| — |
| 54 |
|
| Gain on Repurchase of TIDES | — |
| (209 | ) | (558 | ) | — |
| — |
|
| Prior Period Amortization Adjustment for TIDES | — |
| — |
| — |
| — |
| (538 | ) |
| Tax Adjustment from Prior Period | — |
| — |
| — |
| — |
| 260 |
|
| Sum of Special Items, net of tax | $ | 156 |
| $ | 1,869 |
| $ | 5,776 |
| $ | 4,213 |
| $ | 2,973 |
|
| | | | | | |
| Adjusted Net Income | $ | 6,526 |
| $ | 9,330 |
| $ | 11,986 |
| $ | 14,781 |
| $ | 18,158 |
|
| Adjusted Net Profit Margin | 3.8 | % | 5.3 | % | 6.5 | % | 7.4 | % | 8.5 | % |
| | | | | | |
| GAAP Basic Earnings Per Share | $ | 0.36 |
| $ | 0.42 |
| $ | 0.34 |
| $ | 0.58 |
| $ | 0.83 |
|
| GAAP Diluted Earnings Per Share | $ | 0.36 |
| $ | 0.42 |
| $ | 0.34 |
| $ | 0.58 |
| $ | 0.82 |
|
| | | | | | |
| Adjusted Basic Earnings Per Share | $ | 0.37 |
| $ | 0.53 |
| $ | 0.65 |
| $ | 0.81 |
| $ | 1.00 |
|
| Adjusted Diluted Earnings Per Share | $ | 0.37 |
| $ | 0.52 |
| $ | 0.65 |
| $ | 0.81 |
| $ | 0.98 |
|
| | | | | | |
| Reconciliation of Consolidated EBITDA to Adjusted Consolidated EBITDA | | | | | |
| Consolidated EBITDA | $ | 40,325 |
| $ | 41,164 |
| $ | 39,542 |
| $ | 48,806 |
| $ | 51,587 |
|
| Withdrawable Trust Income | 236 |
| 3,438 |
| 4,513 |
| 1,916 |
| 1,454 |
|
| Acquisition/Divestiture Expenses | — |
| 667 |
| 1,237 |
| 1,340 |
| 752 |
|
| Severance Costs | — |
| 237 |
| 1,936 |
| 802 |
| 1,462 |
|
| Litigation Settlements and Other Related Costs | — |
| (682 | ) | — |
| 195 |
| — |
|
| Consulting Fees | — |
| — |
| — |
| — |
| 557 |
|
| Securities Transaction Expenses | — |
| — |
| 504 |
| — |
| 242 |
|
| Other Special Items | — |
| — |
| 1,205 |
| — |
| 83 |
|
| Adjusted Consolidated EBITDA | $ | 40,561 |
| $ | 44,824 |
| $ | 48,937 |
| $ | 53,059 |
| $ | 56,137 |
|
| Adjusted Consolidated EBITDA Margin | 23.9 | % | 25.3 | % | 26.7 | % | 26.6 | % | 26.2 | % |
CARRIAGE SERVICES, INC.
CONDENSED CONSOLIDATED BALANCE SHEETS
(in thousands)
|
| | | | | | | |
| | December 31, |
| | 2012 | | 2013 |
| ASSETS | | | |
| Current assets: | | | |
| Cash and cash equivalents | $ | 1,698 |
| | $ | 1,377 |
|
| Accounts receivable, net | 17,812 |
| | 17,950 |
|
| Assets held for sale | 1,466 |
| | 3,544 |
|
| Inventories | 5,133 |
| | 5,300 |
|
| Prepaid expenses | 5,107 |
| | 4,421 |
|
| Other current assets | 1,923 |
| | 3,525 |
|
| Total current assets | 33,139 |
| | 36,117 |
|
| Preneed cemetery trust investments | 70,960 |
| | 68,341 |
|
| Preneed funeral trust investments | 82,896 |
| | 97,144 |
|
| Preneed receivables, net | 23,222 |
| | 24,521 |
|
| Receivables from preneed trusts | 25,871 |
| | 11,166 |
|
| Property, plant and equipment, net | 152,433 |
| | 160,690 |
|
| Cemetery property | 75,156 |
| | 72,911 |
|
| Goodwill | 218,442 |
| | 221,087 |
|
| Deferred charges and other non-current assets | 9,424 |
| | 12,280 |
|
| Cemetery perpetual care trust investments | 46,542 |
| | 42,342 |
|
| Total assets | $ | 738,085 |
| | $ | 746,599 |
|
| LIABILITIES AND STOCKHOLDERS’ EQUITY | | | |
| Current liabilities: | | | |
| Current portion of long-term debt and capital lease obligations | $ | 11,218 |
| | $ | 13,424 |
|
| Accounts payable | 5,243 |
| | 7,046 |
|
| Other liabilities | 13,067 |
| | 9,939 |
|
| Accrued liabilities | 12,278 |
| | 12,854 |
|
| Liabilities associated with assets held for sale | 369 |
| | 4,357 |
|
| Total current liabilities | 42,175 |
| | 47,620 |
|
| Long-term debt, net of current portion | 118,841 |
| | 105,642 |
|
| Line of credit | 44,700 |
| | 36,900 |
|
| Convertible junior subordinated debenture due in 2029 to an affiliate | 89,770 |
| | 89,770 |
|
| Obligations under capital leases, net of current portion | 4,013 |
| | 3,786 |
|
| Deferred preneed cemetery revenue | 63,998 |
| | 55,479 |
|
| Deferred preneed funeral revenue | 39,794 |
| | 30,588 |
|
| Deferred tax liability | — |
| | 11,915 |
|
| Other long-term liabilities | — |
| | 1,548 |
|
| Deferred preneed cemetery receipts held in trust | 70,960 |
| | 68,341 |
|
| Deferred preneed funeral receipts held in trust | 82,896 |
| | 97,144 |
|
| Care trusts’ corpus | 45,920 |
| | 41,893 |
|
| Total liabilities | 603,067 |
| | 590,626 |
|
| Commitments and contingencies: | | | |
| Redeemable Preferred Stock | 200 |
| | — |
|
| Stockholders’ equity: | | | |
| Common stock, $.01 par value; 80,000,000 shares authorized; 22,078,000 and 22,183,000 issued as of December 31, 2012 and 2013, respectively | 221 |
| | 222 |
|
| Additional paid-in capital | 202,462 |
| | 204,324 |
|
| Accumulated deficit | (52,598 | ) | | (33,306 | ) |
| Treasury stock, at cost; 3,922,000 shares at December 31, 2012 and 2013 | (15,267 | ) | | (15,267 | ) |
| Total stockholders’ equity | 134,818 |
| | 155,973 |
|
| Total liabilities and stockholders’ equity | $ | 738,085 |
| | $ | 746,599 |
|
CARRIAGE SERVICES, INC.
CONDENSED CONSOLIDATED STATEMENTS OF OPERATIONS
(in thousands, except share and per share data)
|
| | | | | | | |
| | Year Ended December 31, |
| | 2012 | | 2013 |
| | | | |
| Revenues | $ | 199,392 |
| | $ | 213,957 |
|
| Field costs and expenses | 139,250 |
| | 149,576 |
|
| Gross profit | 60,142 |
| | 64,381 |
|
| General and administrative expenses | 23,458 |
| | 27,378 |
|
| Operating income | 36,684 |
| | 37,003 |
|
| Interest expense, net | (16,125 | ) | | (12,541 | ) |
| Loss on early extinguishment of debt and other costs | (3,031 | ) | | — |
|
| Income from continuing operations before income taxes | 17,528 |
| | 24,462 |
|
| Provision for income taxes | (6,960 | ) | | (9,277 | ) |
| Net income from continuing operations | 10,568 |
| | 15,185 |
|
| Net income from discontinued operations, net of tax | 835 |
| | 4,111 |
|
| Net income | 11,403 |
| | 19,296 |
|
| Preferred stock dividend | 14 |
| | 4 |
|
| Net income available to common stockholders | $ | 11,389 |
| | $ | 19,292 |
|
| | | | |
| Basic earnings per common share: | | | |
| Continuing operations | $ | 0.58 |
| | $ | 0.83 |
|
| Discontinued operations | 0.05 |
| | 0.23 |
|
| Basic earnings per common share | $ | 0.63 |
| | $ | 1.06 |
|
Diluted earnings per common share: | | | |
| Continuing operations | $ | 0.58 |
| | $ | 0.82 |
|
| Discontinued operations | 0.05 |
| | 0.18 |
|
| Diluted earnings per common share | $ | 0.63 |
| | $ | 1.00 |
|
| | | | |
| Dividends declared per common share | $ | 0.10 |
| | $ | 0.10 |
|
| | | | |
| Weighted average number of common and common equivalent shares outstanding: | | | |
| Basic | 18,126 |
| | 17,826 |
|
| Diluted | 18,226 |
| | 22,393 |
|
The GAAP Diluted EPS for the year ended December 31, 2013 includes 4.4 million shares that would be issued upon conversion of our convertible subordinated debentures (TIDES) as a result of the if-converted method prescribed by accounting standards.
CARRIAGE SERVICES, INC.
CONSOLIDATED STATEMENTS OF CASH FLOWS
(in thousands)
|
| | | | | | | |
| | Year Ended December 31, |
| | 2012 | | 2013 |
| Cash flows from operating activities: | | | |
| Net income | $ | 11,403 |
| | $ | 19,296 |
|
| Adjustments to reconcile net income to net cash provided by operating activities: | | | |
| Depreciation and amortization | 10,076 |
| | 11,748 |
|
| Impairment of goodwill | 1,100 |
| | 100 |
|
| Gain on sale of business | (610 | ) | | (6,091 | ) |
| Amortization of deferred financing costs | 685 |
| | 362 |
|
| Provision for losses on accounts receivable | 2,589 |
| | 2,005 |
|
| Stock-based compensation expense | 2,174 |
| | 3,583 |
|
| Deferred income taxes | 3,930 |
| | 12,572 |
|
| Loss on early extinguishment of debt | 1,323 |
| | — |
|
| Other | 88 |
| | 85 |
|
| Changes in operating assets and liabilities that provided (required) cash: | | | |
| Accounts and preneed receivables | (4,623 | ) | | (3,329 | ) |
| Inventories and other current assets | 5,332 |
| | (337 | ) |
| Deferred charges and other | (38 | ) | | (35 | ) |
| Preneed funeral and cemetery trust investments | 6,659 |
| | (1,415 | ) |
| Accounts payable | (1,002 | ) | | 1,142 |
|
| Accrued and other liabilities | (6,195 | ) | | (3,294 | ) |
| Deferred preneed funeral and cemetery revenue | 3,720 |
| | 1,187 |
|
| Deferred preneed funeral and cemetery receipts held in trust | (10,850 | ) | | 2,266 |
|
| Net cash provided by operating activities | 25,761 |
| | 39,845 |
|
| | | | |
| Cash flows from investing activities: | | | |
| Acquisitions and new construction | (45,141 | ) | | (19,701 | ) |
| Net proceeds from sales of businesses and other assets | 603 |
| | 10,184 |
|
| Capital expenditures | (10,436 | ) | | (10,695 | ) |
| Net cash used in investing activities | (54,974 | ) | | (20,212 | ) |
| | | | |
| Cash flows from financing activities: | | | |
| Net borrowings from (payments against) the revolving credit facility | 43,307 |
| | (7,800 | ) |
| Payments on long-term debt and obligations under capital leases | (3,174 | ) | | (11,219 | ) |
| Proceeds from the exercise of stock options and employee stock purchase plan contributions | 896 |
| | 894 |
|
| Dividends on common stock | (1,804 | ) | | (1,817 | ) |
| Dividends on redeemable preferred stock | (14 | ) | | (4 | ) |
| Payment of loan origination costs | (3,235 | ) | | (621 | ) |
| Excess tax benefit of equity compensation | 36 |
| | 613 |
|
| Payment of call premium associated with the senior note redemption | (1,707 | ) | | — |
|
| Purchase of treasury stock | (4,531 | ) | | — |
|
| Net cash provided by (used in) financing activities | 29,774 |
| | (19,954 | ) |
| | | | |
| Net increase (decrease) in cash and cash equivalents | 561 |
| | (321 | ) |
| Cash and cash equivalents at beginning of year | 1,137 |
| | 1,698 |
|
| Cash and cash equivalents at end of year | $ | 1,698 |
| | $ | 1,377 |
|
CARRIAGE SERVICES, INC.
CALCULATION OF EARNINGS PER SHARE
(in thousands, except share and per share data)
|
| | | | | | | |
| | Year Ended December 31, |
| | 2012 | | 2013 |
| | |
| Numerator for basic earnings per share: | | | |
| Numerator from continuing operations | | | |
| Income from continuing operations | $ | 10,568 |
| | $ | 15,185 |
|
| Less: Earnings allocated to unvested restricted stock | (361 | ) | | (314 | ) |
| Income attributable to continuing operations | $ | 10,207 |
| | $ | 14,871 |
|
| | | | |
| Numerator from discontinued operations | | | |
| Income from discontinued operations | $ | 835 |
| | $ | 4,111 |
|
| Less: Earnings allocated to unvested restricted stock | — |
| | (85 | ) |
| Income attributable to discontinued operations | $ | 835 |
| | $ | 4,026 |
|
| | | | |
| Numerator for diluted earnings per share: | | | |
| Adjustment for diluted earnings per share: | | | |
| Interest on convertible junior subordinated debentures, net of tax | — |
| | 3,452 |
|
| | $ | — |
| | $ | 3,452 |
|
| | | | |
| Income attributable to continuing operations | $ | 10,207 |
| | $ | 18,323 |
|
| Income attributable to discontinuing operations | $ | 835 |
| | $ | 4,026 |
|
| | | | |
| Denominator | | | |
| Denominator for basic earnings per common share - weighted average shares outstanding | 18,126 |
| | 17,826 |
|
| Effect of dilutive securities: | | | |
| Stock options | 100 |
| | 175 |
|
| Convertible junior subordinated debentures | — |
| | 4,392 |
|
| Denominator for diluted earnings per common share - weighted average shares outstanding | 18,226 |
| | 22,393 |
|
| | | | |
| Basic earnings per common share: | | | |
| Continuing operations | $ | 0.58 |
| | $ | 0.83 |
|
| Discontinued operations | 0.05 |
| | 0.23 |
|
| Basic earnings per common share | $ | 0.63 |
| | $ | 1.06 |
|
| | | | |
| Diluted earnings per common share: | | | |
| Continuing operations | $ | 0.58 |
| | $ | 0.82 |
|
| Discontinued operations | 0.05 |
| | 0.18 |
|
| Diluted earnings per common share | $ | 0.63 |
| | $ | 1.00 |
|
| | | | |
NON-GAAP FINANCIAL MEASURES
This press release uses Non-GAAP financial measures to present the financial performance of the Company. Non-GAAP financial measures should be viewed in addition to, and not as an alternative for, the Company’s reported operating results or cash flow from operations or any other measure of performance as determined in accordance with GAAP. We believe the non-GAAP results are useful to investors because such results help investors compare our results to previous periods and provide insights into underlying trends in our business. The Company’s GAAP financial statements accompany this release. Reconciliations of the Non-GAAP financial measures to GAAP measures are provided in this press release.
The Non-GAAP financial measures include “Adjusted Net Income”, “Adjusted Basic Earnings Per Share”, “Adjusted Diluted Earnings Per Share”, “Consolidated EBITDA”, “Adjusted Consolidated EBITDA”, “Free Cash Flow”, “Funeral, Cemetery and Financial EBITDA”, “Total Field EBITDA” and “Special Items” in this press release. These financial measurements are defined as similar GAAP items adjusted for Special Items and are reconciled to GAAP in this press release. In addition, the Company’s presentation of these measures may not be comparable to similarly titled measures in other companies’ reports. The definitions used by the Company for our internal management purposes and in this press release are as follows:
| |
| • | Adjusted Net Income is defined as net income from continuing operations plus adjustments for special items and other non-recurring expenses or credits. |
| |
| • | Consolidated EBITDA is defined as net income from continuing operations before income taxes, interest expenses, non-cash stock compensation, depreciation and amortization, and interest income and other, net. |
| |
| • | Adjusted Consolidated EBITDA is defined as Consolidated EBITDA plus adjustments for special items and non-recurring expenses or credits. |
| |
| • | Free Cash Flow is defined as net cash provided by operations less cash for maintenance capital expenditures. |
| |
| • | Funeral Field EBITDA is defined as Funeral Gross Profit less depreciation and amortization, regional and unallocated overhead expenses and net financial income. |
| |
| • | Cemetery Field EBITDA is defined as Cemetery Gross Profit less depreciation and amortization, regional and unallocated overhead expenses and net financial income. |
| |
| • | Financial EBITDA is defined as Financial Revenue less Financial expenses. |
| |
| • | Total Field EBITDA is defined as Gross Profit less depreciation and amortization, regional and unallocated overhead expenses. |
| |
| • | Special Items is defined as charges or credits that are non-GAAP yet can be non-recurring such as withdrawable trust income, acquisition and divestiture expenses, litigation settlements, severance costs, loss on early retirement of debt and other costs, discrete tax items and other non-recurring amounts. |
| |
| • | Adjusted Basic Earnings Per Share is defined as GAAP Basic Earnings Per Share, adjusted for special items. |
| |
| • | Adjusted Diluted Earnings Per Share is defined as GAAP Diluted Earnings Per Share, adjusted for special items. |
Certain state regulations allow the withdrawal of financial income from preneed cemetery merchandise and services trust funds when realized in the trust. Under current generally accepted accounting principles, trust income is only recognized in the Company’s financial statements at a later time when the related merchandise and services sold on the preneed contract is delivered at the time of death. Carriage has provided financial income from the trusts, termed “Withdrawable Trust Income” and reported on a Non-GAAP proforma basis within Special Items in the accompanying Operating and Financial Metrics Trend Report (a Non-GAAP Unaudited Income Statement), to reflect the current cash results. Management believes that the Withdrawable Trust Income provides useful information to investors because it presents income and cash flow when earned by the trusts.
Reconciliation of Non-GAAP Financial Measures:
This press release includes the use of certain financial measures that are not GAAP measures. The Non-GAAP financial measures are presented for additional information and are reconciled to their most comparable GAAP measures below.
Reconciliation of Net Income from continuing operations to Adjusted Net Income for the years ended December 31, 2009, 2010, 2011, 2012 and 2013 (thousands):
|
| | | | | | | | | | | | | | | |
| | Year Ended December 31, |
| | 2009 | 2010 | 2011 | 2012 | 2013 |
| Net Income from continuing operations | $ | 6,370 |
| $ | 7,461 |
| $ | 6,210 |
| $ | 10,568 |
| $ | 15,185 |
|
| Special items, net of tax | | | | | |
| Withdrawable Trust Income | 156 |
| 2,269 |
| 2,979 |
| 1,265 |
| 960 |
|
| Acquisition/Divestiture Expenses | — |
| 440 |
| 816 |
| 884 |
| 496 |
|
| Severance Costs | — |
| 156 |
| 1,278 |
| 529 |
| 965 |
|
| Litigation Settlements and Other Related Costs | — |
| (450 | ) | — |
| (465 | ) | — |
|
| Additional Interest and Other costs of the Credit Facility | — |
| — |
| 133 |
| 2,000 |
| 248 |
|
| Consulting Fees | — |
| — |
| — |
| — |
| 368 |
|
| Securities Transaction Expenses | — |
| — |
| 333 |
| — |
| 160 |
|
| Other Special Items | — |
| (337 | ) | 795 |
| — |
| 54 |
|
| Gain on Repurchase of TIDES | — |
| (209 | ) | (558 | ) | — |
| — |
|
| Prior Period Amortization Adjustment for TIDES | — |
| — |
| — |
| — |
| (538 | ) |
| Tax Adjustment from Prior Period | — |
| — |
| — |
| — |
| 260 |
|
| Sum of Special items affecting net income, net of tax | $ | 156 |
| $ | 1,869 |
| $ | 5,776 |
| $ | 4,213 |
| $ | 2,973 |
|
| Adjusted Net Income | $ | 6,526 |
| $ | 9,330 |
| $ | 11,986 |
| $ | 14,781 |
| $ | 18,158 |
|
Reconciliation of Net Income from continuing operations to Consolidated EBITDA and Adjusted Consolidated EBITDA for the years ended December 31, 2009, 2010, 2011, 2012 and 2013 (in thousands):
|
| | | | | | | | | | | | | | | |
| | Year Ended December 31, |
| | 2009 | 2010 | 2011 | 2012 | 2013 |
| Net income from continuing operations | $ | 6,370 |
| $ | 7,461 |
| $ | 6,210 |
| $ | 10,568 |
| $ | 15,185 |
|
| Provision for income taxes | 4,336 |
| 4,954 |
| 4,590 |
| 6,960 |
| 9,277 |
|
| Pre-tax earnings from continuing operations | $ | 10,706 |
| $ | 12,415 |
| $ | 10,800 |
| $ | 17,528 |
| $ | 24,462 |
|
| Interest expense, net | 18,071 |
| 17,178 |
| 17,191 |
| 16,125 |
| 12,541 |
|
| Loss on early extinguishment of debt and other costs | 180 |
| — |
| 201 |
| 3,031 |
| — |
|
| Non-cash stock compensation | 1,169 |
| 1,722 |
| 1,870 |
| 2,174 |
| 2,916 |
|
| Depreciation & amortization | 10,199 |
| 9,849 |
| 9,480 |
| 9,948 |
| 11,668 |
|
| Consolidated EBITDA | $ | 40,325 |
| $ | 41,164 |
| $ | 39,542 |
| $ | 48,806 |
| $ | 51,587 |
|
| Adjusted For: | | | | | |
| Withdrawable Trust Income | $ | 236 |
| $ | 3,438 |
| $ | 4,513 |
| $ | 1,916 |
| $ | 1,454 |
|
| Acquisition/Divestiture Expenses | — |
| 667 |
| 1,237 |
| 1,340 |
| 752 |
|
| Severance Costs | — |
| 237 |
| 1,936 |
| 802 |
| 1,462 |
|
| Litigation Settlements and Other Related Costs | — |
| (682 | ) | — |
| 195 |
| — |
|
| Consulting Fees | — |
| — |
| — |
| — |
| 557 |
|
| Securities Transaction Expenses | — |
| — |
| 504 |
| — |
| 242 |
|
| Other Special Items | — |
| — |
| 1,205 |
| — |
| 83 |
|
| Adjusted Consolidated EBITDA | $ | 40,561 |
| $ | 44,824 |
| $ | 48,937 |
| $ | 53,059 |
| $ | 56,137 |
|
| Revenue | $ | 169,656 |
| $ | 177,517 |
| $ | 183,514 |
| $ | 199,392 |
| $ | 213,957 |
|
| | | | | | |
| Adjusted Consolidated EBITDA Margin | 23.9 | % | 25.3 | % | 26.7 | % | 26.6 | % | 26.2 | % |
Reconciliation of funeral and cemetery income before income taxes to Field EBITDA for the years ended December 31, 2009, 2010, 2011, 2012 and 2013 (in thousands):
|
| | | | | | | | | | | | | | | |
| Funeral Field EBITDA | Year Ended December 31, |
| | 2009 | 2010 | 2011 | 2012 | 2013 |
| Gross Profit (GAAP) | $ | 37,774 |
| $ | 37,321 |
| $ | 41,401 |
| $ | 46,886 |
| $ | 48,973 |
|
| Depreciation & amortization | 5,454 |
| 5,287 |
| 5,668 |
| 5,925 |
| 6,471 |
|
| Regional & unallocated costs | 4,000 |
| 4,849 |
| 6,068 |
| 7,386 |
| 8,111 |
|
| Net financial income | (4,131 | ) | (6,854 | ) | (6,728 | ) | (6,224 | ) | (7,987 | ) |
| Funeral Field EBITDA | $ | 43,097 |
| $ | 40,603 |
| $ | 46,409 |
| $ | 53,973 |
| $ | 55,568 |
|
| Funeral Field Operating Revenue | $ | 120,619 |
| $ | 125,504 |
| $ | 133,011 |
| $ | 144,372 |
| $ | 154,704 |
|
| Funeral Field EBITDA Margin | 35.7 | % | 32.4 | % | 34.9 | % | 37.4 | % | 35.9 | % |
|
| | | | | | | | | | | | | | | |
| Cemetery Field EBITDA | Year Ended December 31, |
| | 2009 | 2010 | 2011 | 2012 | 2013 |
| Gross Profit (GAAP) | $ | 7,172 |
| $ | 9,065 |
| $ | 9,536 |
| $ | 13,256 |
| $ | 15,408 |
|
| Depreciation & amortization | 3,154 |
| 3,206 |
| 2,798 |
| 3,059 |
| 3,741 |
|
| Regional & unallocated costs | 2,707 |
| 2,653 |
| 2,957 |
| 2,566 |
| 1,903 |
|
| Net financial income | (3,881 | ) | (5,986 | ) | (5,921 | ) | (9,060 | ) | (9,338 | ) |
| Cemetery Field EBITDA | $ | 9,152 |
| $ | 8,938 |
| $ | 9,370 |
| $ | 9,821 |
| $ | 11,714 |
|
| Cemetery Field Operating Revenue | $ | 39,316 |
| $ | 37,797 |
| $ | 36,481 |
| $ | 38,279 |
| $ | 40,479 |
|
| Cemetery Field EBITDA Margin | 23.3 | % | 23.6 | % | 25.7 | % | 25.7 | % | 28.9 | % |
|
| | | | | | | | | | | | | | | |
| Total Field EBITDA | Year Ended December 31, |
| | 2009 | 2010 | 2011 | 2012 | 2013 |
| Funeral Field EBITDA | $ | 43,097 |
| $ | 40,603 |
| $ | 46,409 |
| $ | 53,973 |
| $ | 55,568 |
|
| Cemetery Field EBITDA | 9,152 |
| 8,938 |
| 9,370 |
| 9,821 |
| 11,714 |
|
| Funeral Financial EBITDA | 4,131 |
| 6,854 |
| 6,728 |
| 6,224 |
| 7,987 |
|
| Cemetery Financial EBITDA | 3,881 |
| 5,986 |
| 5,921 |
| 9,060 |
| 9,338 |
|
| Total Field EBITDA | $ | 60,261 |
| $ | 62,381 |
| $ | 68,428 |
| $ | 79,078 |
| $ | 84,607 |
|
Reconciliation of GAAP basic earnings per share to Adjusted basic earnings per share for the years ended December 31, 2009, 2010, 2011, 2012 and 2013:
|
| | | | | | | | | | | | | | | |
| | Year Ended December 31, |
| | 2009 | 2010 | 2011 | 2012 | 2013 |
| GAAP basic earnings per share from continuing operations | $ | 0.36 |
| $ | 0.42 |
| $ | 0.34 |
| $ | 0.58 |
| $ | 0.83 |
|
| Special items affecting net income | 0.01 |
| 0.11 |
| 0.31 |
| 0.23 |
| 0.17 |
|
| Adjusted basic earnings per share | $ | 0.37 |
| $ | 0.53 |
| $ | 0.65 |
| $ | 0.81 |
| $ | 1.00 |
|
Reconciliation of GAAP diluted earnings per share to Adjusted diluted earnings per share for the years ended December 31, 2009, 2010, 2011, 2012 and 2013:
|
| | | | | | | | | | | | | | | |
| | Year Ended December 31, |
| | 2009 | 2010 | 2011 | 2012 | 2013 |
| GAAP diluted earnings per share from continuing operations | $ | 0.36 |
| $ | 0.42 |
| $ | 0.34 |
| $ | 0.58 |
| $ | 0.82 |
|
| Special items affecting net income | 0.01 |
| 0.10 |
| 0.31 |
| 0.23 |
| 0.13 |
|
| Dilution effect of convertible junior subordinated debentures | — |
| — |
| — |
| — |
| 0.03 |
|
| Adjusted diluted earnings per share | $ | 0.37 |
| $ | 0.52 |
| $ | 0.65 |
| $ | 0.81 |
| $ | 0.98 |
|
Reconciliation of Net Income to Consolidated EBITDA and Adjusted Consolidated EBITDA for the estimated rolling four quarters ending December 31, 2014 and 2015 (in thousands):
|
| | | | | | |
| | Rolling Four Quarter Outlook |
| | December 31, |
| | 2014E | 2015E |
| Net income | $ | 18,850 |
| $ | 24,500 |
|
| Provision for income taxes | 12,050 |
| 15,000 |
|
| Pre-tax earnings | $ | 30,900 |
| $ | 39,500 |
|
| Net interest expense, including loan cost amortization | 12,200 |
| 12,600 |
|
| Depreciation & amortization, including stock compensation | 15,300 |
| 15,400 |
|
| Consolidated EBITDA | $ | 58,400 |
| $ | 67,500 |
|
| Adjusted for special items | 4,500 |
| 3,500 |
|
| Adjusted Consolidated EBITDA | $ | 62,900 |
| $ | 71,000 |
|
Reconciliation of Net Income from Adjusted Net Income for the estimated rolling four quarters ending December 31, 2014 and 2015 (in thousands):
|
| | | | | | |
| | Rolling Four Quarter Outlook |
| | December 31, |
| | 2014E | 2015E |
| Net income | $ | 18,850 |
| $ | 24,500 |
|
| Special items, net of tax | 3,000 |
| 2,300 |
|
| Adjusted Net Income | $ | 21,850 |
| $ | 26,800 |
|
Reconciliation of GAAP basic earnings per share to Adjusted basic earnings per share for the estimated rolling four quarters ending December 31, 2014 and 2015:
|
| | | | | | |
| | Rolling Four Quarter Outlook |
| | December 31, |
| | 2014E | 2015E |
| GAAP basic earnings per share | $ | 1.04 |
| $ | 1.33 |
|
| Special items affecting net income | 0.16 |
| 0.12 |
|
| Adjusted basic earnings per share | $ | 1.20 |
| $ | 1.45 |
|
CAUTIONARY STATEMENT ON FORWARD-LOOKING STATEMENTS
Certain statements made herein or elsewhere by, or on behalf of, the Company that are not historical facts are intended to be forward-looking statements within the meaning of Section 27A of the Securities Act of 1933, as amended, and Section 21E of the Securities Exchange Act of 1934, as amended. In addition to historical information, this Press Release contains certain statements and information that may constitute forward-looking statements within the safe harbor provisions of the Private Securities Litigation Reform Act of 1995. These statements include any projections of earnings, revenues, asset sales, cash flow, debt levels or other financial items; any statements of the plans, strategies and objectives of management for future operations; any statements regarding future economic conditions or performance; any statements of belief; and any statements of assumptions underlying any of the foregoing and are based on our current expectations and beliefs concerning future developments and their potential effect on us. The words “may”, “will”, “estimate”, “intend”, “believe”, “expect”, “project”, “forecast”, “foresee”, “should”, “would”, “could”, “plan”, “anticipate” and other similar words or expressions are intended to identify forward-looking statements, which are generally not historical in nature. While management believes that these forward-looking statements are reasonable as and when made, there can be no assurance that future developments affecting us will be those that we anticipate. All comments concerning our expectations for future revenues and operating results are based on our forecasts for our existing operations and do not include the potential impact of any future acquisitions. Our forward-looking statements involve significant risks and uncertainties (some of which are beyond our control) and assumptions that could cause actual results to differ materially from our historical experience and our present expectations or projections. Important factors that could cause actual results to differ materially from those in the forward-looking statements include, but are not limited to, those summarized below:
| |
| • | the execution of our Standards Operating Model; |
| |
| • | changes in the number of deaths in our markets; |
| |
| • | changes in consumer preferences; |
| |
| • | ability to find and retain skilled personnel; |
| |
| • | the effects of competition; |
| |
| • | the investment performance of our funeral and cemetery trust funds; |
| |
| • | fluctuations in interest rates; |
| |
| • | our ability to obtain debt or equity financing on satisfactory terms to fund additional acquisitions, expansion projects, working capital requirements and the repayment or refinancing of indebtedness; |
| |
| • | death benefits related to preneed funeral contracts funded through life insurance contracts; |
| |
| • | our ability to generate preneed sales; |
| |
| • | the financial condition of third-party insurance companies that fund our preneed funeral contracts; |
| |
| • | increased or unanticipated costs, such as insurance or taxes; |
| |
| • | effects of the application of applicable laws and regulations, including changes in such regulations or the interpretation thereof; |
| |
| • | consolidation of the deathcare industry; and |
| |
| • | other factors and uncertainties inherent in the deathcare industry. |
For additional information regarding known material factors that could cause our actual results to differ from our projected results, please see “Risk Factors” in our Annual Report on Form 10-K for the year ended December 31, 2012. Readers are cautioned not to place undue reliance on forward-looking statements, which speak only as of the date hereof. We undertake no obligation to publicly update or revise any forward-looking statements after the date they are made, whether as a result of new information, future events or otherwise. A copy of the Company’s Form 10-K, and other Carriage Services information and news releases, are available at www.carriageservices.com.
This press release includes the use of certain financial measures that are not GAAP measures. The Non-GAAP financial measures are presented for additional information and are reconciled to their most comparable GAAP measures in the tables presented above.