Exhibit 99.3

Link to searchable text of slide shown above
Link to searchable text of slide shown above

Link to searchable text of slide shown above

Link to searchable text of slide shown above

Link to searchable text of slide shown above

Link to searchable text of slide shown above

Link to searchable text of slide shown above
Link to searchable text of slide shown above

Link to searchable text of slide shown above
Link to searchable text of slide shown above
Link to searchable text of slide shown above
Link to searchable text of slide shown above

Link to searchable text of slide shown above

Link to searchable text of slide shown above
Link to searchable text of slide shown above
Link to searchable text of slide shown above

Link to searchable text of slide shown above

Link to searchable text of slide shown above

Link to searchable text of slide shown above
Link to searchable text of slide shown above

Link to searchable text of slide shown above
Link to searchable text of slide shown above

Link to searchable text of slide shown above

Link to searchable text of slide shown above
Link to searchable text of slide shown above
Link to searchable text of slide shown above
Link to searchable text of slide shown above

Link to searchable text of slide shown above

Link to searchable text of slide shown above

Link to searchable text of slide shown above
Link to searchable text of slide shown above

Link to searchable text of slide shown above

Link to searchable text of slide shown above
Link to searchable text of slide shown above

Link to searchable text of slide shown above
Link to searchable text of slide shown above
Searchable text section of graphics shown above
Carriage Services, Inc.
(NYSE: CSV)
December 2003 Investor Presentation
Copyright 2003 © Carriage Services, Inc. All rights reserved.
Forward-looking statements contained herein are subject to certain risks and uncertainties as further described in the last slide in this presentation.
1
• Carriage Services is a leading provider of death care services in the United States.
• Focus on attractive suburban and rural markets
• Primary competitors are local independents
[LOGO]
2
Currently own and operate 139 Funeral
Homes and 30 Cemeteries in 29 States
[GRAPHIC]
3
• Carriage Services is a leading provider of death care services in the United States.
• Focus on attractive suburban and rural markets
• Primary competitors are local independents
• Capital structure and cash flow much improved
• Recently completed a successful turnaround strategy
• Significantly improved EBITDA and free cash flow
• Reduced debt and contingent acquisition obligations from $205M in 2000 to estimated $135M by 2003 year end
4
Total Debt & Contingent
Acquisition Obligations
Total Debt & Contingent Acquisition Obligations ($ in Millions)
[CHART]
5
($ in Millions)
[CHART]
6
($ in Millions)
[CHART]
7
“We are committed to being the most professional, ethical and highest quality funeral and cemetery service organization in our industry.”
8
• Honesty, Integrity and Quality in all that we do
• Hard work, pride of accomplishment and shared success through employee ownership
• Belief in the power of people though individual initiative and teamwork
• Outstanding service and profitability go hand-in-hand
• Growth of the Company is driven by decentralization and partnership
9
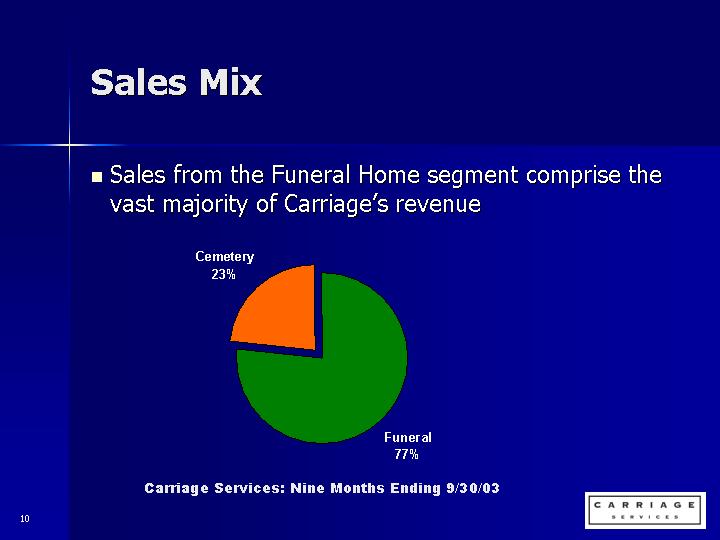
• Sales from the Funeral Home segment comprise the vast majority of Carriage’s revenue
[CHART]
Carriage Services: Nine Months Ending 9/30/03
10
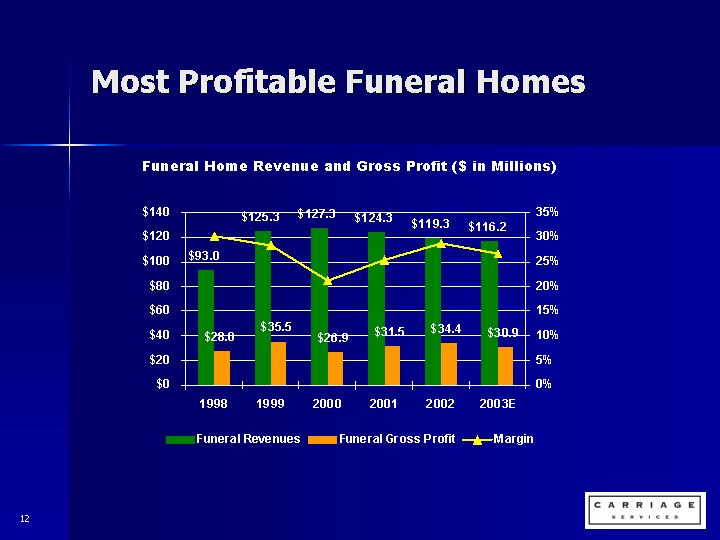
• Remain some of the most profitable Funeral Homes in the industry
• Carriage’s Funeral Homes have experienced challenges from declining death rate and losses of market share in certain markets
• Highly focused on operations, people, technology improvements and growing market share
11
Funeral Home Revenue and Gross Profit ($ in Millions)
[CHART]
12
Funeral Homes
• Offer a complete suite of products and services to meet families’ funeral needs.
Funeral Home Service Offerings and Pricing Points
[CHART]
13
• In addition to sales at the time of need, Carriage offers customers the option of purchasing funeral products and services in advance
• Focus of pre-need sales strategy is local market
[CHART]
3Q03 Funeral Revenue Breakdown Pre-Need versus At-Need
14
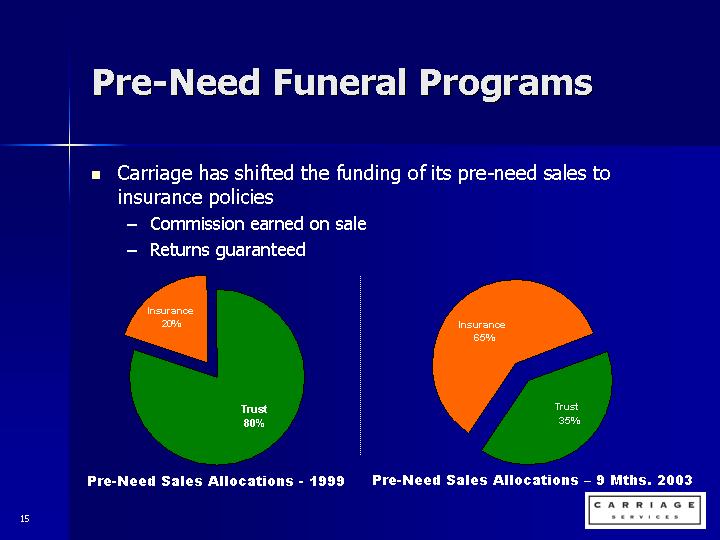
• Carriage has shifted the funding of its pre-need sales to insurance policies
• Commission earned on sale
• Returns guaranteed
Pre-Need Sales Allocations -1999
[CHART]
Pre-Need Sales Allocations – 9 Mths. 2003
15
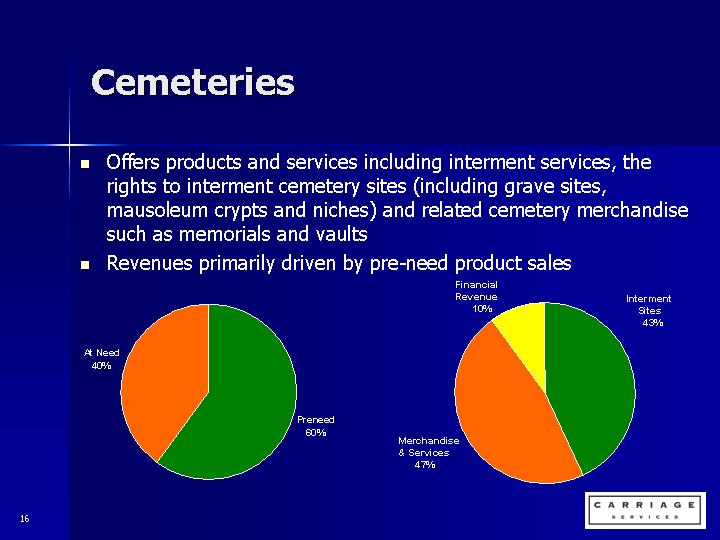
• Offers products and services including interment services, the rights to interment cemetery sites (including grave sites, mausoleum crypts and niches) and related cemetery merchandise such as memorials and vaults
• Revenues primarily driven by pre-need product sales
[CHART]
[CHART]
16
• Cemetery gross margins have improved since management shifted focus to its family service model
Cemetery Revenue and Gross Profit ($ in Millions)
[CHART]
17
Industry Overview
18
• There are approximately 22,000 funeral homes and 10,000 cemeteries in the United States
• Majority of operators consists of small, family-owned businesses that control one or several funeral homes or cemeteries in a single community
[CHART]
2003E U.S. Death Care Market
19
• Death care businesses traditionally transfer to successive family generations
• Local heritage and tradition
• Heritage and tradition afford a local franchise
• Provide the opportunity for growing market share
20
• Number of deaths in the United States had increased at a compounded rate of approximately 1% for years 1950 to 2000
• 2001 was down 2.4%, and 1.6% in 2002
CDC Death Rate Trends - Adjusted for Non-Reporting Cities
|
| 1Q |
| 2Q |
| 3Q |
| 4Q |
| Full year |
|
2000 % Change |
| -2.1 | % | 1.2 | % | 10.7 | % | 6.9 | % | 3.8 | % |
2001 % Change |
| -1.6 | % | 2.2 | % | -6.1 | % | -4.0 | % | -2.4 | % |
2002 % Change |
| -1.5 | % | 0.0 | % | -2.9 | % | -2.1 | % | -1.6 | % |
2003 % Change |
| -2.1 | % | -2.4 | % | 1.8 | % |
|
|
|
|
CDC death rates are not necessarily indicative of death rates experienced in CSV’s markets!
• Recent trends have caused some volatility in financial results
• Carriage believes longer term deaths and death rates will increase as baby boom generation ages
21
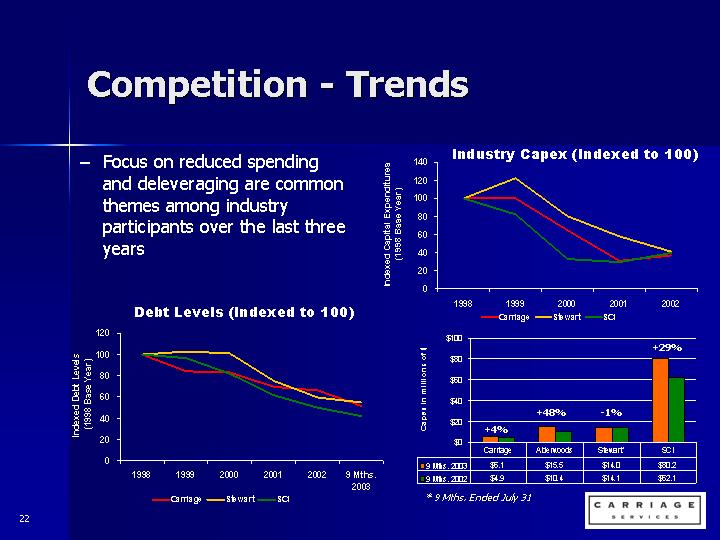
• Focus on reduced spending and deleveraging are common themes among industry participants over the last three years
Debt Levels (Indexed to 100)
[CHART]
Industry Capex (Indexed to 100)
[CHART]
[CHART]
* 9 Mths. Ended July 31
22
• Cremations have increased as a percentage of total services
• Urban areas generally have driven the move to cremations
• Carriage maintains the highest percentage of burials among its peers
Industry Cremation vs. Burial Rates (% Total Services)
[CHART]
[CHART]
23
• All competitors have been adversely affected by the slower than expected death rate trend.
• Carriage’s lean operating structure and focus on best practices have helped weather the storm
• Carriage had the highest gross margin (25.7%) among its peers for the first three quarters of 2003*
[CHART]
* For Stewart, three quarters ending July 31
24
Financial Overview
25
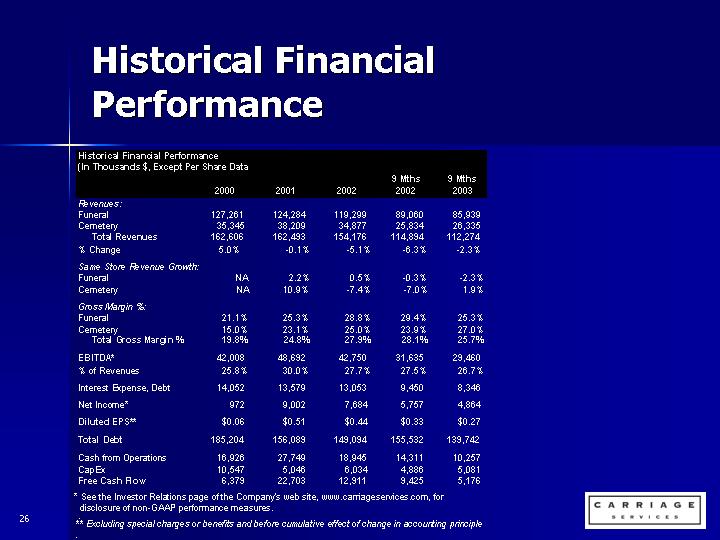
Historical Financial Performance
Historical Financial Performance
(In Thousands $, Except Per Share Data
|
| 2000 |
| 2001 |
| 2002 |
| 9 Mths |
| 9 Mths |
| |||||
Revenues: |
|
|
|
|
|
|
|
|
|
|
| |||||
Funeral |
| 127,261 |
| 124,284 |
| 119,299 |
| 89,060 |
| 85,939 |
| |||||
Cemetery |
| 35,345 |
| 38,209 |
| 34,877 |
| 25,834 |
| 26,335 |
| |||||
Total Revenues |
| 162,606 |
| 162,493 |
| 154,176 |
| 114,894 |
| 112,274 |
| |||||
% Change |
| 5.0 | % | -0.1 | % | -5.1 | % | -6.3 | % | -2.3 | % | |||||
|
|
|
|
|
|
|
|
|
|
|
| |||||
Same Store Revenue Growth: |
|
|
|
|
|
|
|
|
|
|
| |||||
Funeral |
| NA |
| 2.2 | % | 0.5 | % | -0.3 | % | -2.3 | % | |||||
Cemetery |
| NA |
| 10.9 | % | -7.4 | % | -7.0 | % | 1.9 | % | |||||
|
|
|
|
|
|
|
|
|
|
|
| |||||
Gross Margin %: |
|
|
|
|
|
|
|
|
|
|
| |||||
Funeral |
| 21.1 | % | 25.3 | % | 28.8 | % | 29.4 | % | 25.3 | % | |||||
Cemetery |
| 15.0 | % | 23.1 | % | 25.0 | % | 23.9 | % | 27.0 | % | |||||
Total Gross Margin % |
| 19.8 | % | 24.8 | % | 27.9 | % | 28.1 | % | 25.7 | % | |||||
|
|
|
|
|
|
|
|
|
|
|
| |||||
EBITDA* |
| 42,008 |
| 48,692 |
| 42,750 |
| 31,635 |
| 29,460 |
| |||||
% of Revenues |
| 25.8 | % | 30.0 | % | 27.7 | % | 27.5 | % | 26.7 | % | |||||
|
|
|
|
|
|
|
|
|
|
|
| |||||
Interest Expense, Debt |
| 14,052 |
| 13,579 |
| 13,053 |
| 9,450 |
| 8,346 |
| |||||
|
|
|
|
|
|
|
|
|
|
|
| |||||
Net Income* |
| 972 |
| 9,002 |
| 7,684 |
| 5,757 |
| 4,864 |
| |||||
|
|
|
|
|
|
|
|
|
|
|
| |||||
Diluted EPS** |
| $ | 0.06 |
| $ | 0.51 |
| $ | 0.44 |
| $ | 0.33 |
| $ | 0.27 |
|
|
|
|
|
|
|
|
|
|
|
|
|
|
|
|
|
|
Total Debt |
| 185,204 |
| 156,089 |
| 149,094 |
| 155,532 |
| 139,742 |
| |||||
|
|
|
|
|
|
|
|
|
|
|
| |||||
Cash from Operations |
| 16,926 |
| 27,749 |
| 18,945 |
| 14,311 |
| 10,257 |
| |||||
CapEx |
| 10,547 |
| 5,046 |
| 6,034 |
| 4,886 |
| 5,081 |
| |||||
Free Cash Flow |
| 6,379 |
| 22,703 |
| 12,911 |
| 9,425 |
| 5,176 |
| |||||
* See the Investor Relations page of the Company’s web site, www.carriageservices.com, for disclosure of non-GAAP performance measures.
** Excluding special charges or benefits and before cumulative effect of change in accounting principle
26
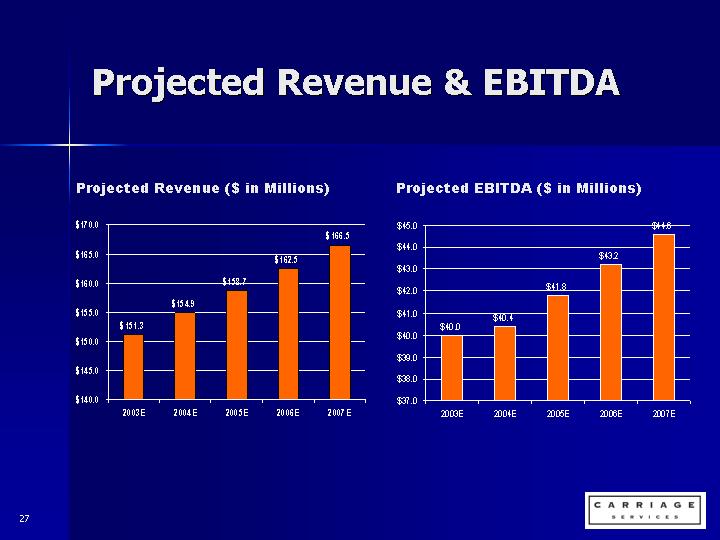
Projected Revenue ($ in Millions)
[CHART]
Projected EBITDA ($ in Millions)
[CHART]
27
• Based on nominal organic growth expectations:
• Adjusted for divestitures
• No acquisitions
• No growth in same store funeral service volumes between 2003 and 2007
• Modest increases in average revenue per funeral
• Achieve stable and moderate revenue growth from existing portfolio of businesses, through a combination of growth in revenue per experience and market share
28
• Management of fixed costs and improvement of field based operating margins, EBITDA is projected to increase from $40.0 to $44.6 million by 2007.
• Approximately 80% of Capex is “maintenance”
• The balance relates to development of new cemetery facilities or properties.
29
Long-Term Base Case Scenario
(Revised as of August 5, 2003)
(In Millions $, Except Per Share Data)
|
| Actual |
| 12/31/03 |
| 12/31/04 |
| 12/31/05 |
| 12/31/06 |
| 12/31/07 |
| 5-Yr. |
|
|
|
|
|
|
|
|
|
|
|
|
|
|
|
|
|
Revenue |
| 154.2 |
| 151.3 |
| 154.9 |
| 158.7 |
| 162.5 |
| 166.5 |
| 1.5 | % |
|
|
|
|
|
|
|
|
|
|
|
|
|
|
|
|
Income Before Taxes & Special Items |
| 12.5 |
| 10.2 |
| 11.8 |
| 13.1 |
| 14.6 |
| 16.2 |
| 5.3 | % |
Interest |
| 19.8 |
| 18.2 |
| 16.6 |
| 16.3 |
| 15.9 |
| 15.3 |
| -5.0 | % |
Depreciation & Amortization |
| 10.5 |
| 11.6 |
| 12.0 |
| 12.4 |
| 12.7 |
| 13.1 |
| 4.5 | % |
|
|
|
|
|
|
|
|
|
|
|
|
|
|
|
|
EBITDA (Excluding Special Items) |
| 42.8 |
| 40.0 |
| 40.4 |
| 41.8 |
| 43.2 |
| 44.6 |
| 0.8 | % |
|
|
|
|
|
|
|
|
|
|
|
|
|
|
|
|
EPS, Diluted |
| 0.44 | (1) | 0.38 | (2) | 0.41 |
| 0.45 |
| 0.50 |
| 0.55 |
| 4.6 | % |
|
|
|
|
|
|
|
|
|
|
|
|
|
|
|
|
Diluted Shares Outstanding |
| 17.4 |
| 17.9 |
| 17.9 |
| 18.1 |
| 18.2 |
| 18.2 |
| 0.9 | % |
|
|
|
|
|
|
|
|
|
|
|
|
|
|
|
|
Cash Flow from Operations Before TIDES Deferral |
| 18.9 |
| 12.8 |
| 15.4 |
| 17.0 |
| 18.9 |
| 20.3 |
| 1.4 | % |
|
|
|
|
|
|
|
|
|
|
|
|
|
|
|
|
Cash Flow from Deferral of TIDES |
| 0.0 |
| 3.5 |
| 6.8 |
| 7.3 |
| 7.8 |
| 8.5 |
| NM |
|
|
|
|
|
|
|
|
|
|
|
|
|
|
|
|
|
Cash Flow from Operations & TIDES Deferral |
| 18.9 |
| 16.3 |
| 22.2 |
| 24.3 |
| 26.7 |
| 28.8 |
| 8.8 | % |
|
|
|
|
|
|
|
|
|
|
|
|
|
|
|
|
Less Capital Expenditures |
| 6.0 |
| 6.0 |
| 6.5 |
| 6.0 |
| 5.5 |
| 5.5 |
| -1.7 | % |
|
|
|
|
|
|
|
|
|
|
|
|
|
|
|
|
Free Cash Flow |
| 12.9 |
| 10.3 |
| 15.7 |
| 18.3 |
| 21.2 |
| 23.3 |
| 12.6 | % |
|
|
|
|
|
|
|
|
|
|
|
|
|
|
|
|
Plus/Minus Net Cash Taxes |
| (1.6 | ) | 0.2 |
| 4.0 |
| 4.7 |
| 5.5 |
| 6.4 |
| NM |
|
|
|
|
|
|
|
|
|
|
|
|
|
|
|
|
|
Pre-Tax Free Cash Flow |
| 11.3 |
| 10.5 |
| 19.7 |
| 23.0 |
| 26.7 |
| 29.7 |
| 21.3 | % |
|
|
|
|
|
|
|
|
|
|
|
|
|
|
|
|
Divestitures & Other |
| (4.5 | ) | 7.5 |
| 3.8 |
| 0.2 |
| 0.2 |
| 0.2 |
| NM |
|
|
|
|
|
|
|
|
|
|
|
|
|
|
|
|
|
Cumulative Deferral of TIDES |
| 0.0 |
| 3.5 |
| 10.8 |
| 18.6 |
| 27.0 |
| 36.0 |
| NM |
|
|
|
|
|
|
|
|
|
|
|
|
|
|
|
|
|
Total Debt |
| 149.1 |
| 134.8 |
| 111.9 |
| 93.4 |
| 72.0 |
| 48.5 |
| -20.1 | % |
|
|
|
|
|
|
|
|
|
|
|
|
|
|
|
|
Total Debt / EBITDA |
| 3.5 |
| 3.4 |
| 2.8 |
| 2.2 |
| 1.7 |
| 1.1 |
| -20.8 | % |
(1) Excludes special items equal to $0.72 per share.
(2) Excludes the effect of $0.02 benefit recorded in 2003 as special charges and other items. |
| NM = Not meaningful |
30
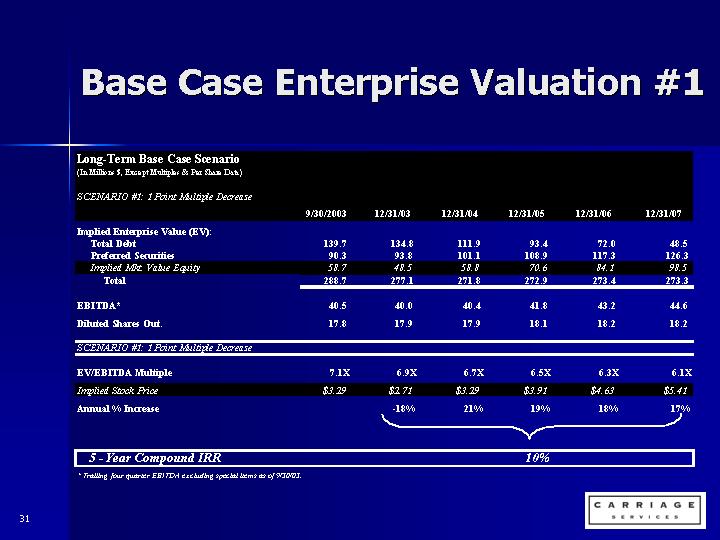
Base Case Enterprise Valuation #1
Long-Term Base Case Scenario
(In Millions $, Except Multiples & Per Share Data)
SCENARIO #1: 1 Point Multiple Decrease
|
| 9/30/2003 |
| 12/31/03 |
| 12/31/04 |
| 12/31/05 |
| 12/31/06 |
| 12/31/07 |
| ||||||
|
|
|
|
|
|
|
|
|
|
|
|
|
| ||||||
Implied Enterprise Value (EV): |
|
|
|
|
|
|
|
|
|
|
|
|
| ||||||
Total Debt |
| 139.7 |
| 134.8 |
| 111.9 |
| 93.4 |
| 72.0 |
| 48.5 |
| ||||||
Preferred Securities |
| 90.3 |
| 93.8 |
| 101.1 |
| 108.9 |
| 117.3 |
| 126.3 |
| ||||||
Implied Mkt. Value Equity |
| 58.7 |
| 48.5 |
| 58.8 |
| 70.6 |
| 84.1 |
| 98.5 |
| ||||||
Total |
| 288.7 |
| 277.1 |
| 271.8 |
| 272.9 |
| 273.4 |
| 273.3 |
| ||||||
|
|
|
|
|
|
|
|
|
|
|
|
|
| ||||||
EBITDA* |
| 40.5 |
| 40.0 |
| 40.4 |
| 41.8 |
| 43.2 |
| 44.6 |
| ||||||
|
|
|
|
|
|
|
|
|
|
|
|
|
| ||||||
Diluted Shares Out. |
| 17.8 |
| 17.9 |
| 17.9 |
| 18.1 |
| 18.2 |
| 18.2 |
| ||||||
|
|
|
|
|
|
|
|
|
|
|
|
|
| ||||||
SCENARIO #1: 1 Point Multiple Decrease |
|
|
|
|
|
|
|
|
|
|
|
|
| ||||||
|
|
|
|
|
|
|
|
|
|
|
|
|
| ||||||
EV/EBITDA Multiple |
| 7.1 | X | 6.9 | X | 6.7 | X | 6.5 | X | 6.3 | X | 6.1 | X | ||||||
|
|
|
|
|
|
|
|
|
|
|
|
|
| ||||||
Implied Stock Price |
| $ | 3.29 |
| $ | 2.71 |
| $ | 3.29 |
| $ | 3.91 |
| $ | 4.63 |
| $ | 5.41 |
|
|
|
|
|
|
|
|
|
|
|
|
|
|
|
|
|
|
|
|
|
Annual % Increase |
|
|
| -18 | % | 21 | % | 19 | % | 18 | % | 17 | % | ||||||
|
|
|
|
|
|
|
|
|
|
|
|
|
| ||||||
5 - Year Compound IRR |
|
|
|
| �� |
|
| 10 | % |
|
|
|
| ||||||
* Trailing four quarter EBITDA excluding special items as of 9/30/03.
31
Base Case Enterprise Valuation #2
Long-Term Base Case Scenario
(In Millions $, Except Multiples & Per Share Data)
SCENARIO #2: Flat Multiple
|
| 9/30/2003 |
| 12/31/03 |
| 12/31/04 |
| 12/31/05 |
| 12/31/06 |
| 12/31/07 |
| ||||||
|
|
|
|
|
|
|
|
|
|
|
|
|
| ||||||
Implied Enterprise Value (EV): |
|
|
|
|
|
|
|
|
|
|
|
|
| ||||||
Total Debt |
| 139.7 |
| 134.8 |
| 111.9 |
| 93.4 |
| 72.0 |
| 48.5 |
| ||||||
Preferred Securities |
| 90.3 |
| 93.8 |
| 101.1 |
| 108.9 |
| 117.3 |
| 126.3 |
| ||||||
Implied Mkt. Value Equity |
| 58.7 |
| 56.5 |
| 75.0 |
| 95.7 |
| 118.7 |
| 143.1 |
| ||||||
Total |
| 288.7 |
| 285.1 |
| 288.0 |
| 298.0 |
| 308.0 |
| 317.9 |
| ||||||
|
|
|
|
|
|
|
|
|
|
|
|
|
| ||||||
EBITDA* |
| 40.5 |
| 40.0 |
| 40.4 |
| 41.8 |
| 43.2 |
| 44.6 |
| ||||||
|
|
|
|
|
|
|
|
|
|
|
|
|
| ||||||
Diluted Shares Out. |
| 17.8 |
| 17.9 |
| 17.9 |
| 18.1 |
| 18.2 |
| 18.2 |
| ||||||
|
|
|
|
|
|
|
|
|
|
|
|
|
| ||||||
SCENARIO #2: Flat Multiple |
|
|
|
|
|
|
|
|
|
|
|
|
| ||||||
|
|
|
|
|
|
|
|
|
|
|
|
|
| ||||||
EV/EBITDA Multiple |
| 7.1 | X | 7.1 | X | 7.1 | X | 7.1 | X | 7.1 | X | 7.1 | X | ||||||
|
|
|
|
|
|
|
|
|
|
|
|
|
| ||||||
Implied Stock Price |
| $ | 3.29 |
| $ | 3.16 |
| $ | 4.19 |
| $ | 5.30 |
| $ | 6.54 |
| $ | 7.86 |
|
|
|
|
|
|
|
|
|
|
|
|
|
|
|
|
|
|
|
|
|
Annual % Increase |
|
|
| -4 | % | 33 | % | 27 | % | 23 | % | 20 | % | ||||||
|
|
|
|
|
|
|
|
|
|
|
|
|
| ||||||
5 - Year Compound IRR |
|
|
|
|
|
|
| 19 | % |
|
|
|
| ||||||
* Trailing four quarter EBITDA excluding special items as of 9/30/03.
32
Base Case Enterprise Valuation #3
Long-Term Base Case Scenario
(In Millions $, Except Multiples & Per Share Data)
SCENARIO #3: 1 Point Multiple Increase
|
| 9/30/2003 |
| 12/31/03 |
| 12/31/04 |
| 12/31/05 |
| 12/31/06 |
| 12/31/07 |
| ||||||
|
|
|
|
|
|
|
|
|
|
|
|
|
| ||||||
Implied Enterprise Value (EV): |
|
|
|
|
|
|
|
|
|
|
|
|
| ||||||
Total Debt |
| 139.7 |
| 134.8 |
| 111.9 |
| 93.4 |
| 72.0 |
| 48.5 |
| ||||||
Preferred Securities |
| 90.3 |
| 93.8 |
| 101.1 |
| 108.9 |
| 117.3 |
| 126.3 |
| ||||||
Implied Mkt. Value Equity |
| 58.7 |
| 64.5 |
| 91.2 |
| 120.8 |
| 153.2 |
| 187.7 |
| ||||||
Total |
| 288.7 |
| 293.1 |
| 304.2 |
| 323.1 |
| 342.5 |
| 362.5 |
| ||||||
|
|
|
|
|
|
|
|
|
|
|
|
|
| ||||||
EBITDA* |
| 40.5 |
| 40.0 |
| 40.4 |
| 41.8 |
| 43.2 |
| 44.6 |
| ||||||
|
|
|
|
|
|
|
|
|
|
|
|
|
| ||||||
Diluted Shares Out. |
| 17.8 |
| 17.9 |
| 17.9 |
| 18.1 |
| 18.2 |
| 18.2 |
| ||||||
|
|
|
|
|
|
|
|
|
|
|
|
|
| ||||||
SCENARIO #3: 1 Point Multiple Increase |
|
|
|
|
|
|
|
|
|
|
|
|
| ||||||
|
|
|
|
|
|
|
|
|
|
|
|
|
| ||||||
EV/EBITDA Multiple |
| 7.1 | X | 7.3 | X | 7.5 | X | 7.7 | X | 7.9 | X | 8.1 | X | ||||||
|
|
|
|
|
|
|
|
|
|
|
|
|
| ||||||
Implied Stock Price |
| $ | 3.29 |
| $ | 3.61 |
| $ | 5.09 |
| $ | 6.69 |
| $ | 8.44 |
| $ | 10.31 |
|
|
|
|
|
|
|
|
|
|
|
|
|
|
| ||||||
Annual % Increase |
|
|
| 10 | % | 41 | % | 31 | % | 26 | % | 22 | % | ||||||
|
|
|
|
|
|
|
|
|
|
|
|
|
| ||||||
5 - Year Compound IRR |
|
|
|
|
|
|
| 26 | % |
|
|
|
| ||||||
* Trailing four quarter EBITDA excluding special items as of 9/30/03.
33
• Carriage Services is a leading provider of death care services in the United States.
• Focus on attractive suburban and rural markets
• Most profitable funeral homes in the industry
• Capital structure and cash flow much improved
• Recently completed a successful turnaround strategy
• Significantly improved EBITDA and free cash flow
• Reduced debt and contingent acquisition obligations from $205M in 2000 to estimated $135M by 2003 year end
• Compelling valuation scenarios
34
In addition to historical information, this presentation contains forward-looking statements made by the management of Carriage Services, Inc. (the “Company” or “Carriage”). Such statements are typically identified by terms expressing future expectations or goals. These forward-looking statements, although made in good faith, are subject to certain risks and uncertainties that could cause actual results to differ materially from those reflected in these forward-looking statements. Factors that might cause such a difference include Carriage’s inability to sell businesses and properties for the estimated proceeds, to achieve the free cash flow from operations in the base case scenario, or to achieve internal growth from our businesses; adverse changes in economic and financial market conditions, increasing interest rates, and restricted credit availability; lower death rates; changing consumer preferences; competition in our markets from new entrants and existing business competitors; Carriage’s inability to maintain operating ratios within the limits set forth within our financing arrangements; and changes in government regulation of the death care industry. Readers are cautioned not to place undue reliance on these forward-looking statements, which reflect management’s opinions only as of the date hereof. We undertake no obligation to revise or publicly release the results of any revision of these forward-looking statements. Readers should carefully review the Cautionary Statements described in this and other documents we file from time to time with the Securities and Exchange Commission, including Annual Reports on Form 10-K and Current Reports on Form 8-K filed by Carriage in the future.
35
Thank You
36