Searchable text section of graphics shown above
[LOGO]
Industry Landscape
| | North American | | Volume of Funeral | | EBITDA(1) Margin | | Cremation Rate | |
| | Properties | | Contracts 2003 | | LTM 9/30/04 | | 9 Months 2004 | |
| | | | | | | | | |
[LOGO] | | [CHART] | (2) | 24,121 | | 26.1 | % | 31 | % |
Industry margins are largely driven by product mix and operating efficiencies
Source: Company filings and public documents.
(1) EBITDA equal to net income from continuing operations plus income taxes, interest expense, nonrecurring items and depreciation and amortization.
(2) Properties data as of December 31, 2004.
1
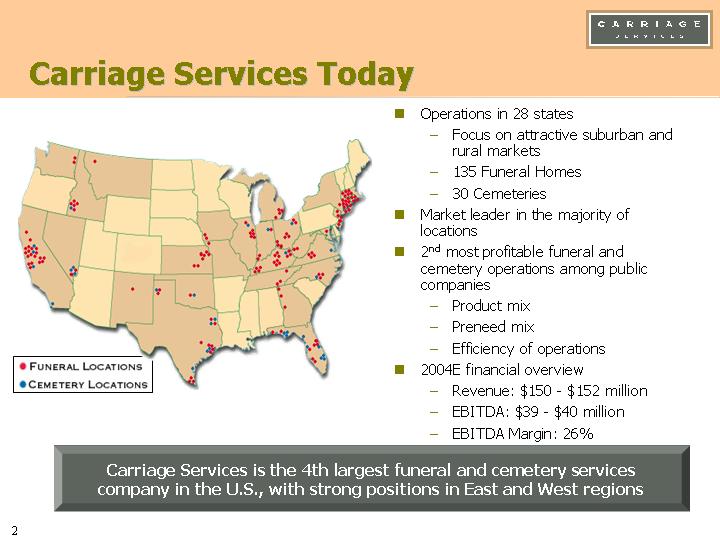
Carriage Services Today
[GRAPHIC]
• Operations in 28 states
• Focus on attractive suburban and rural markets
• 135 Funeral Homes
• 30 Cemeteries
• Market leader in the majority of locations
• 2nd most profitable funeral and cemetery operations among public companies
• Product mix
• Preneed mix
• Efficiency of operations
• 2004E financial overview
• Revenue: $150 - $152 million
• EBITDA: $39 - $40 million
• EBITDA Margin: 26%
Carriage Services is the 4th largest funeral and cemetery services
company in the U.S., with strong positions in East and West regions
2
Strong and Consistent Financial Performance
Same-Store Revenue and EBITDA | Same-Store Margins |
| |
[CHART] | [CHART] |
Carriage has historically generated the 2nd highest EBITDA margins in the industry
(1) Based on midpoint of Company guidance for the fourth quarter of 2004 and adjusted for one-time property tax assessment
3
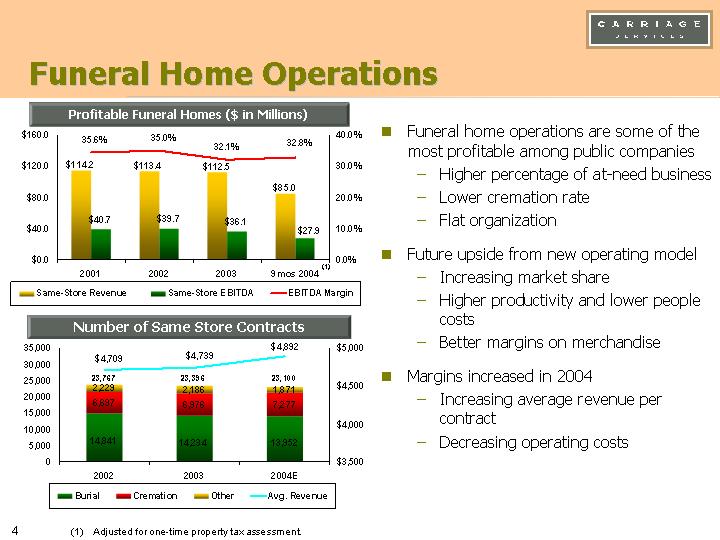
Funeral Home Operations
Profitable Funeral Homes ($ in Millions)
[CHART]
Number of Same Store Contracts
[CHART]
(1) Adjusted for one-time property tax assessment.
• Funeral home operations are some of the most profitable among public companies
• Higher percentage of at-need business
• Lower cremation rate
• Flat organization
• Future upside from new operating model
• Increasing market share
• Higher productivity and lower people costs
• Better margins on merchandise
• Margins increased in 2004
• Increasing average revenue per contract
• Decreasing operating costs
4
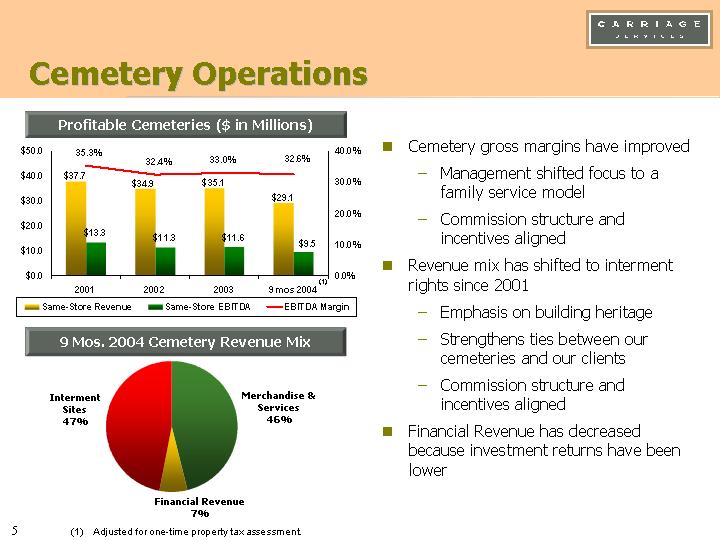
Cemetery Operations
Profitable Cemeteries ($ in Millions)
[CHART]
9 Mos. 2004 Cemetery Revenue Mix
[CHART]
(1) Adjusted for one-time property tax assessment.
• Cemetery gross margins have improved
• Management shifted focus to a family service model
• Commission structure and incentives aligned
• Revenue mix has shifted to interment rights since 2001
• Emphasis on building heritage
• Strengthens ties between our cemeteries and our clients
• Commission structure and incentives aligned
• Financial Revenue has decreased because investment returns have been lower
5
Disclosure of Non-GAAP Performance Measures
We report our financial results in accordance with generally accepted accounting principles (“GAAP”). However, management believes that certain non-GAAP performance measures and ratios, which management uses in managing our business, may provide users of this financial information additional meaningful comparisons between results in historical periods.
We refer to the term “EBITDA” in various places of our financial discussion. EBITDA is defined by us as net income before interest expense, income tax expense, and depreciation and amortization expense. EBITDA is not a measure of operating performance under generally accepted accounting principles, or GAAP, and should not be considered in isolation nor construed as an alternative to operating profit, net income (loss) or cash flows from operating, investing or financing activities, each as determined in accordance with GAAP. You should also not consider EBITDA as a measure of liquidity. Moreover, since EBITDA is not a measure determined in accordance with GAAP and thus is susceptible to varying interpretations and calculations, EBITDA, as presented, may not be comparable to similarly titled measures presented by other companies.
Reconciliation of Net Income from total operations to EBITDA from same-store operations:
| | | | | | | | Last Twelve | |
| | | | | | | | Months Ended | |
| | 2001 | | 2002 | | 2003 | | 9/30/2004 | |
Net income | | $ | 9,002 | | $ | 20,278 | | $ | 6,625 | | $ | 5,178 | |
Provision (benefit) for income taxes | | $ | 2,251 | | $ | (8,116 | ) | $ | 3,974 | | $ | 3,641 | |
Pre-tax earnings | | $ | 11,253 | | $ | 12,162 | | $ | 10,599 | | $ | 8,819 | |
Effect of acquired, sold and discontinued | | $ | (2,665 | ) | $ | (1,603 | ) | $ | (532 | ) | $ | (355 | ) |
Non-recurring and special charges | | $ | — | | $ | 361 | | $ | (577 | ) | $ | 2,043 | |
Interest expense, including loan cost amortization | | $ | 20,344 | | $ | 19,750 | | $ | 17,811 | | $ | 17,396 | |
Depreciation & amortization | | $ | 17,095 | | $ | 10,601 | | $ | 11,022 | | $ | 11,770 | |
Same-store EBITDA | | $ | 46,027 | | $ | 41,271 | | $ | 38,323 | | $ | 39,673 | |
Same-store revenue | | $ | 151,876 | | $ | 148,323 | | $ | 147,652 | | $ | 152,103 | |
Same-store EBITDA margin | | 30.3 | % | 27.8 | % | 26.0 | % | 26.1 | % |
Same-store EBIT margin | | 19.3 | % | 20.9 | % | 18.6 | % | 18.3 | % |
Reconciliation of Operating Income from funeral home operations to EBITDA from funeral home operations:
| | 2001 | | 2002 | | 2003 | | 9/30/04 | |
Operating income | | $ | 31,471 | | $ | 34,374 | | $ | 29,535 | | $ | 22,235 | |
Acquired, sold and discontinued | | $ | (2,665 | ) | $ | (1,573 | ) | $ | (532 | ) | $ | (324 | ) |
Depreciation & amortization | | $ | 11,872 | | $ | 6,872 | | $ | 7,053 | | $ | 5,554 | |
Non-recurring charges | | $ | — | | $ | — | | $ | — | | $ | 300 | |
Same-store EBITDA from funeral home operations | | $ | 40,678 | | $ | 39,673 | | $ | 36,056 | | $ | 27,765 | |
Same-store revenue from funeral home operations | | $ | 114,222 | | $ | 113,446 | | $ | 112,475 | | $ | 85,038 | |
Same-store EBITDA margin | | 35.6 | % | 35.0 | % | 32.1 | % | 32.7 | % |
Reconciliation of Operating Income from cemetery operations to EBITDA from cemetery operations:
| | 2001 | | 2002 | | 2003 | | 9/30/04 | |
Operating income | | $ | 8,824 | | $ | 8,456 | | $ | 8,790 | | $ | 6,783 | |
Expenses from prior period divestitures | | $ | — | | $ | (30 | ) | $ | — | | $ | — | |
Depreciation & amortization | | $ | 4,489 | | $ | 2,854 | | $ | 2,854 | | $ | 2,513 | |
Non-recurring charges | | $ | — | | $ | — | | $ | — | | $ | 200 | |
Same-store EBITDA from cemetery operations | | $ | 13,313 | | $ | 11,280 | | $ | 11,644 | | $ | 9,496 | |
Same-store revenue from cemetery operations | | $ | 37,654 | | $ | 34,877 | | $ | 35,086 | | $ | 29,087 | |
Same-store EBITDA margin | | 35.5 | % | 32.3 | % | 33.0 | % | 32.6 | % |
Reconciliation of the estimate of 2004 Net Income from total operations to the estimate of 2004 EBITDA from same-store operations:
| | 2004 Estimate
Range | |
| | Low | | Mid-range | | High | |
Net income | | $ | 16,000 | | | | $ | 17,600 | |
Provision (benefit) for income taxes | | $ | 6,000 | | | | $ | 6,600 | |
Pre-tax earnings | | $ | 10,000 | | | | $ | 11,000 | |
Interest expense, including loan cost amortization | | $ | 18,000 | | | | $ | 18,000 | |
Depreciation & amortization | | $ | 11,000 | | | | $ | 11,000 | |
Total estimated EBITDA | | $ | 39,000 | | $ | 39,500 | | $ | 40,000 | |
Total estimated revenue | | $ | 150,000 | | $ | 151,000 | | $ | 152,000 | |
Total estimated EBITDA margin | | 26.0 | % | 26.2 | % | 26.3 | % |
Total estimated EBIT margin | | 18.7 | % | 18.9 | % | 19.1 | % |