Exhibit 99.2
Link to searchable text of slide shown above
Link to searchable text of slide shown above
Link to searchable text of slide shown above

Link to searchable text of slide shown above
Link to searchable text of slide shown above

Link to searchable text of slide shown above
Link to searchable text of slide shown above
Link to searchable text of slide shown above
Link to searchable text of slide shown above
Link to searchable text of slide shown above
Link to searchable text of slide shown above
Link to searchable text of slide shown above
Link to searchable text of slide shown above
Link to searchable text of slide shown above
Link to searchable text of slide shown above

Link to searchable text of slide shown above
Link to searchable text of slide shown above

Link to searchable text of slide shown above
Link to searchable text of slide shown above
Link to searchable text of slide shown above
Link to searchable text of slide shown above
Link to searchable text of slide shown above
Link to searchable text of slide shown above
Link to searchable text of slide shown above
Link to searchable text of slide shown above
Link to searchable text of slide shown above
Link to searchable text of slide shown above

Link to searchable text of slide shown above
Link to searchable text of slide shown above
Searchable text section of graphics shown above
[LOGO]
Carriage Services
(NYSE: CSV)
2005 UBS Global Healthcare Services Conference
February 15, 2005
Forward-Looking Statements
The statements in this presentation that are not historical facts are forward-looking statements made in reliance on the “safe harbor” protections provided under the Private Securities Litigation Reform Act of 1995. These statements may be accompanied by words that convey the uncertainty of future events or outcomes. These statements are based on assumptions that we believe are reasonable; however, many important factors could cause our actual results in the future to differ materially from the forward-looking statements made herein and in any other documents or oral presentations made by, or on behalf of, the Company. For further information on these risks and uncertainties, see the Company’s Securities and Exchange Commission filings, including our 2003 Annual Report on Form 10-K. We assume no obligation to publicly update or revise any forward-looking statements made herein or any other forward-looking statements made by the Company, whether as a result of new information, future events or otherwise.
2
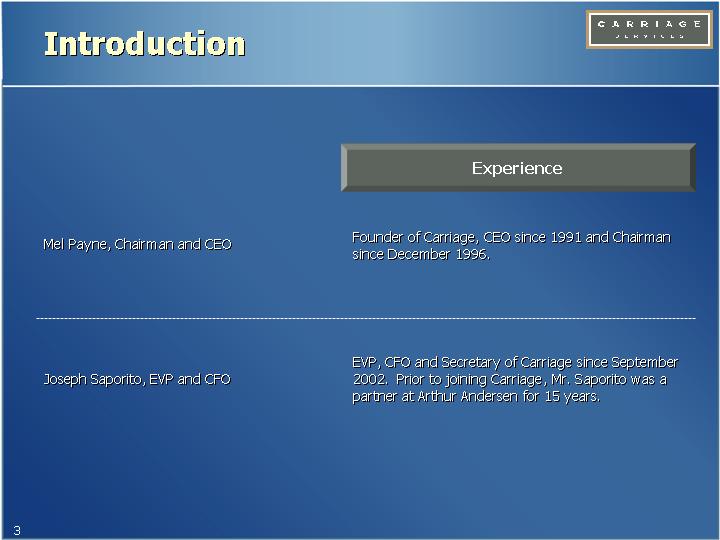
Introduction
|
| Experience |
|
|
|
Mel Payne, Chairman and CEO |
| Founder of Carriage, CEO since 1991 and Chairman since December 1996. |
|
|
|
Joseph Saporito, EVP and CFO |
| EVP, CFO and Secretary of Carriage since September 2002. Prior to joining Carriage, |
3
Industry Overview
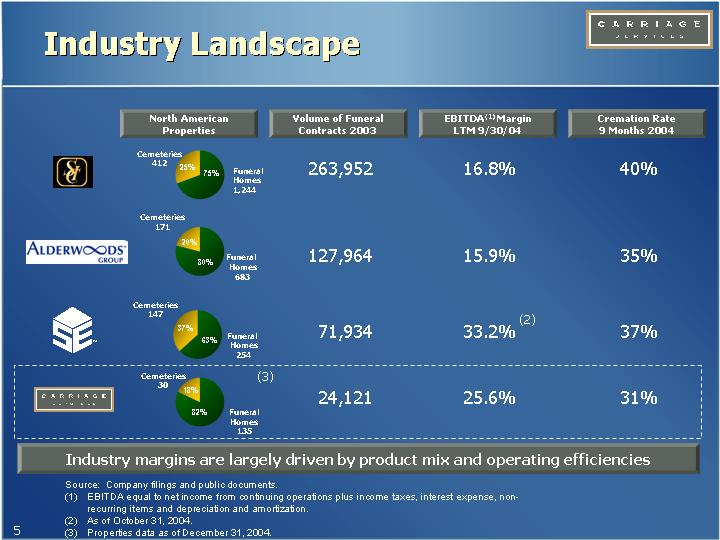
Industry Landscape
|
| North American |
| Volume of Funeral |
| EBITDA(1) Margin |
| Cremation Rate |
|
|
|
|
|
|
|
|
|
|
|
[LOGO] |
| [CHART] |
| 263,952 |
| 16.8 | % | 40 | % |
|
|
|
|
|
|
|
|
|
|
[LOGO] |
| [CHART] |
| 127,964 |
| 15.9 | % | 35 | % |
|
|
|
|
|
|
|
|
|
|
[LOGO] |
| [CHART] |
| 71,934 |
| 33.2 | %(2) | 37 | % |
|
|
|
|
|
|
|
|
|
|
[LOGO] |
| [CHART] | (3) | 24,121 |
| 25.6 | % | 31 | % |
Industry margins are largely driven by product mix and operating efficiencies
Source: Company filings and public documents.
(1) EBITDA equal to net income from continuing operations plus income taxes, interest expense, non-recurring items and depreciation and amortization.
(2) As of October 31, 2004.
(3) Properties data as of December 31, 2004.
5
Death Care Industry
• Highly fragmented industry
• Approximately 22,000 funeral homes and 10,000 cemeteries in the U.S.
• Dominated by independent operators
• Death care businesses traditionally transferred to successive family generations, but this trend is diminishing
• Public companies are dominated by 4 players who tend to own larger, institutional and urban businesses
• Public companies divesting non-core properties and de-leveraging
• Local heritage and tradition are critical to maintain and grow market share
• Growing demand for cremations
• Only minimal acquisitions completed in last five years
Industry Revenue Share
[CHART]
6
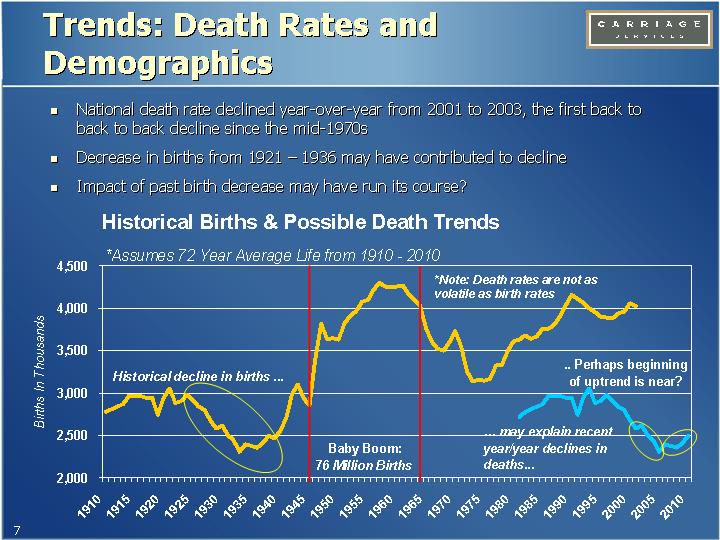
Trends: Death Rates and Demographics
• National death rate declined year-over-year from 2001 to 2003, the first back to back to back decline since the mid-1970s
• Decrease in births from 1921 – 1936 may have contributed to decline
• Impact of past birth decrease may have run its course?
Historical Births & Possible Death Trends
[CHART]*
*Assumes 72 Year Average Life from 1910 - 2010
7
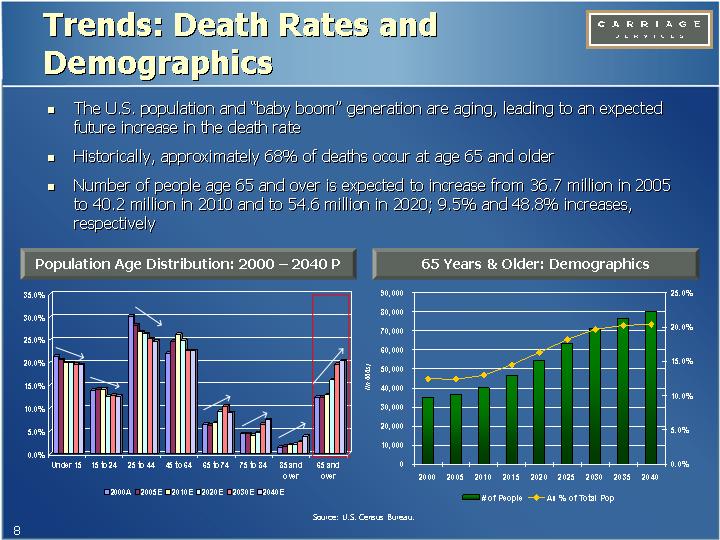
• The U.S. population and “baby boom” generation are aging, leading to an expected future increase in the death rate
• Historically, approximately 68% of deaths occur at age 65 and older
• Number of people age 65 and over is expected to increase from 36.7 million in 2005 to 40.2 million in 2010 and to 54.6 million in 2020; 9.5% and 48.8% increases, respectively
Population Age Distribution: 2000 – 2040 P
[CHART]
65 Years & Older: Demographics
[CHART]
Source: U.S. Census Bureau.
8
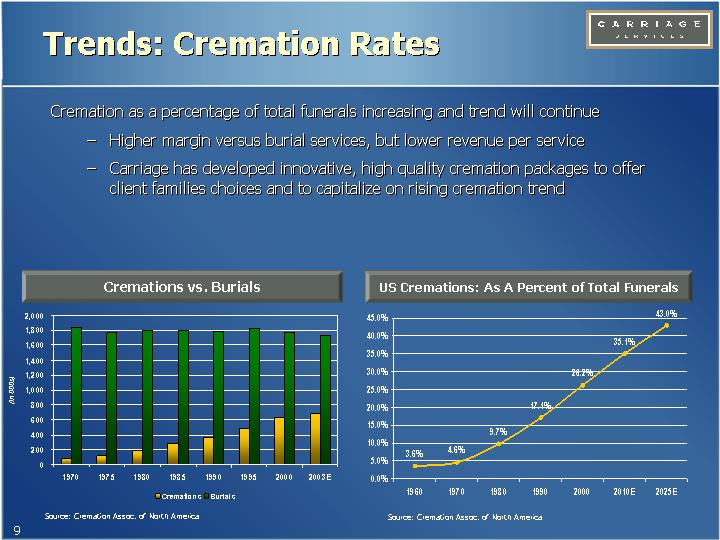
Trends: Cremation Rates
Cremation as a percentage of total funerals increasing and trend will continue
• Higher margin versus burial services, but lower revenue per service
• Carriage has developed innovative, high quality cremation packages to offer client families choices and to capitalize on rising cremation trend
Cremations vs. Burials
[CHART]
Source: Cremation Assoc. of North America
US Cremations: As A Percent of Total Funerals
[CHART]
Source: Cremation Assoc. of North America
9
Company Overview
Carriage History
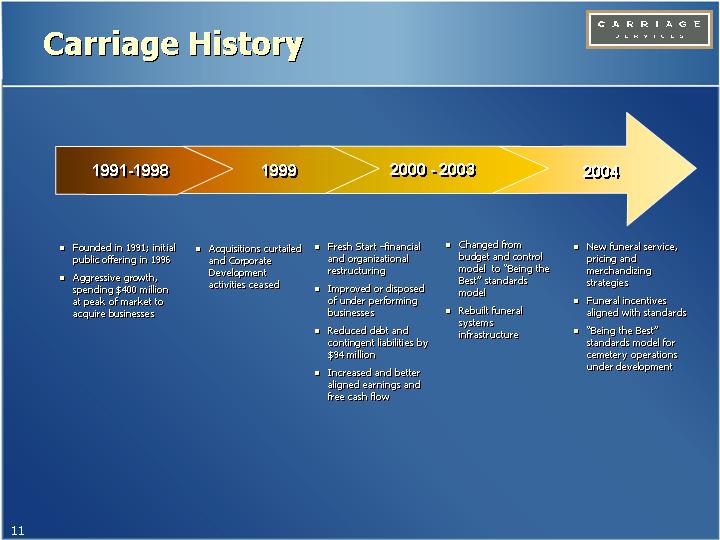
1991-1998 |
| 1999 |
| 2000 - 2003 |
| 2004 |
• Founded in 1991; initial public offering in 1996
• Aggressive growth, spending $400 million at peak of market to acquire businesses |
| • Acquisitions curtailed and Corporate Development activities ceased |
| • Fresh Start –financial and organizational restructuring
• Improved or disposed of under performing businesses
• Reduced debt and contingent liabilities by $94 million
• Increased and better aligned earnings and free cash flow |
| • Changed from budget and control model to “Being the Best” standards model
• Rebuilt funeral systems infrastructure |
| • New funeral service, pricing and merchandizing strategies
• Funeral incentives aligned with standards
• “Being the Best” standards model for cemetery operations under development |
11
Business Strategy – Focus on Leadership and Entrepreneurial Principles
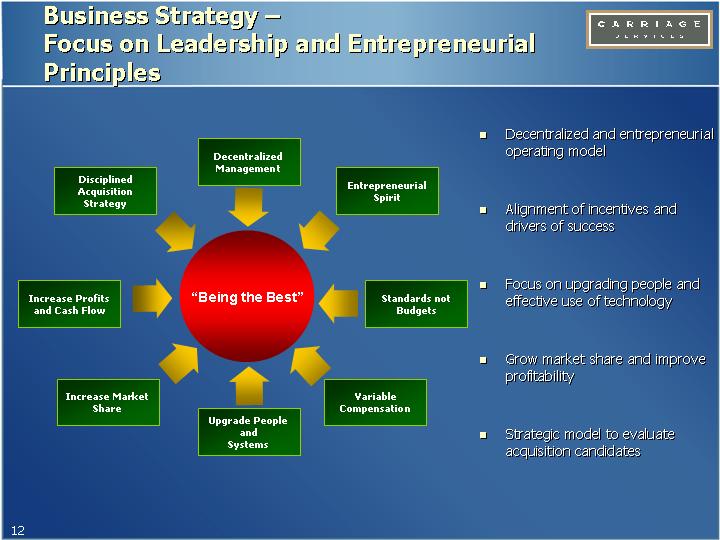
“Being the Best”
Decentralized Management
Entrepreneurial Spirit
Standards not Budgets
Variable Compensation
Upgrade People and Systems
Increase Market Share
Increase Profits and Cash Flow
Disciplined Acquisition Strategy
• Decentralized and entrepreneurial operating model
• Alignment of incentives and drivers of success
• Focus on upgrading people and effective use of technology
• Grow market share and improve profitability
• Strategic model to evaluate acquisition candidates
12
Funeral Operations – Drivers of Success
|
|
|
| Weighting |
|
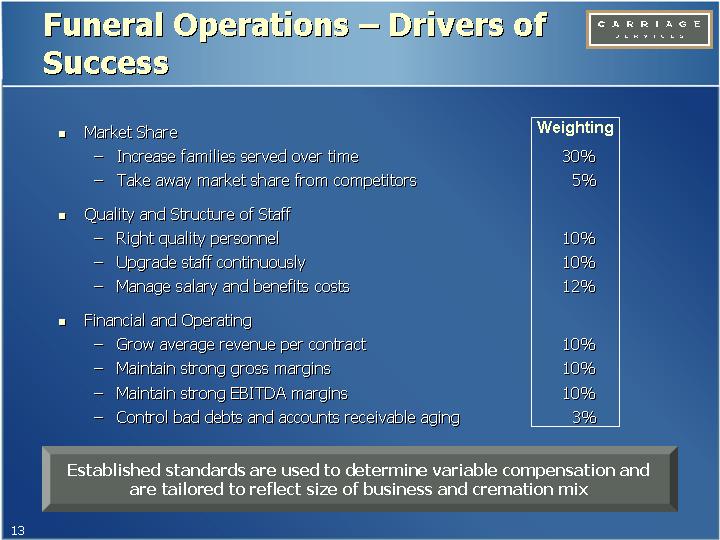
• Market Share |
|
|
| ||
• Increase families served over time |
| 30 | % | ||
• Take away market share from competitors |
| 5 | % | ||
|
|
|
|
|
|
• Quality and Structure of Staff |
|
|
| ||
• Right quality personnel |
| 10 | % | ||
• Upgrade staff continuously |
| 10 | % | ||
• Manage salary and benefits costs |
| 12 | % | ||
|
|
|
|
|
|
• Financial and Operating |
|
|
| ||
• Grow average revenue per contract |
| 10 | % | ||
• Maintain strong gross margins |
| 10 | % | ||
• Maintain strong EBITDA margins |
| 10 | % | ||
• Control bad debts and accounts receivable aging |
| 3 | % | ||
Established standards are used to determine variable compensation and are tailored to reflect size of business and cremation mix
13
Carriage Services Today
[GRAPHIC]
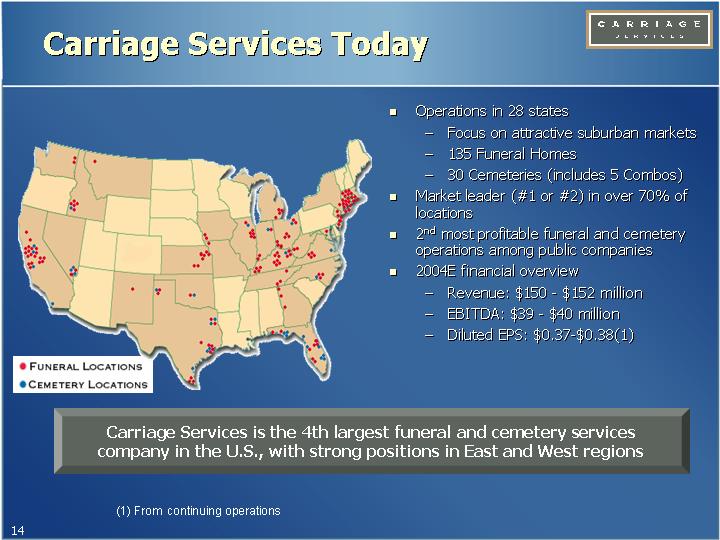
• Operations in 28 states
• Focus on attractive suburban markets
• 135 Funeral Homes
• 30 Cemeteries (includes 5 Combos)
• Market leader (#1 or #2) in over 70% of locations
• 2nd most profitable funeral and cemetery operations among public companies
• 2004E financial overview
• Revenue: $150 - $152 million
• EBITDA: $39 - $40 million
• Diluted EPS: $0.37-$0.38(1)
Carriage Services is the 4th largest funeral and cemetery services company in the U.S., with strong positions in East and West regions
(1) From continuing operations
14
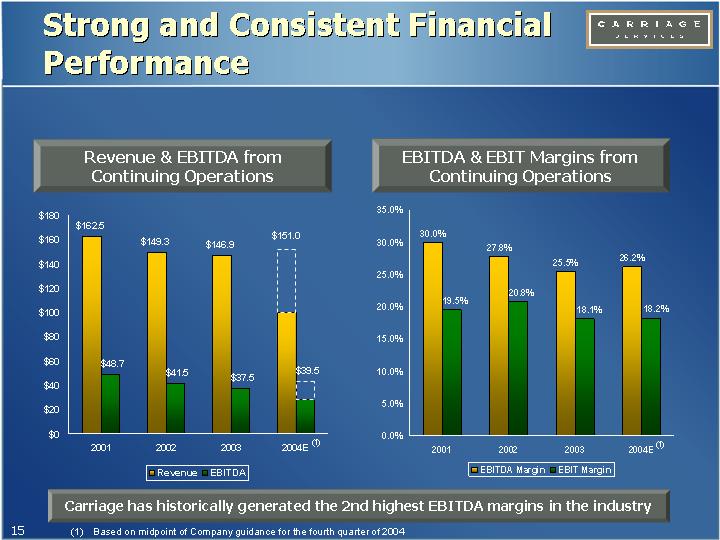
Strong and Consistent Financial Performance
Revenue & EBITDA from Continuing Operations
[CHART](1)
EBITDA & EBIT Margins from Continuing Operations
[CHART](1)
Carriage has historically generated the 2nd highest EBITDA margins in the industry
(1) Based on midpoint of Company guidance for the fourth quarter of 2004
15
Funeral Home Operations
Profitable Funeral Homes: From Continuing Operations ($ in Millions)
[CHART]
Contracts from Continuing Operations
[CHART]
• Funeral home operations are some of the most profitable among public companies
• Higher percentage of at-need business
• Lower cremation rate
• Flat organization
• Future upside from new operating model
• Increasing market share
• Higher productivity and lower people costs
• Improved merchandise strategy
• Margins increased in 2004
• Average revenue increased 3.3%
• Decreasing operating costs
16
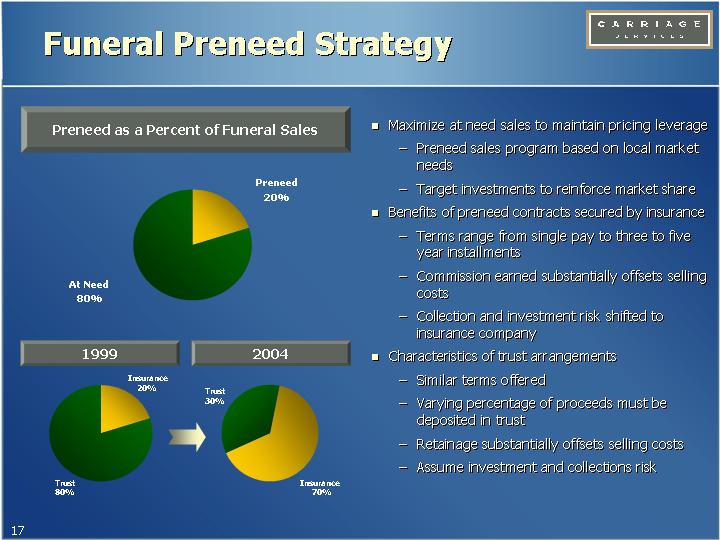
Funeral Preneed Strategy
Preneed as a Percent of Funeral Sales
[CHART]
1999 |
| 2004 |
|
|
|
[CHART] |
| [CHART] |
• Maximize at need sales to maintain pricing leverage
• Preneed sales program based on local market needs
• Target investments to reinforce market share
• Benefits of preneed contracts secured by insurance
• Terms range from single pay to three to five year installments
• Commission earned substantially offsets selling costs
• Collection and investment risk shifted to insurance company
• Characteristics of trust arrangements
• Similar terms offered
• Varying percentage of proceeds must be deposited in trust
• Retainage substantially offsets selling costs
• Assume investment and collections risk
17
Cemetery Operations – Drivers of Success
• Preneed sales – right kind of sales in the right way
• Emphasis on networking with satisfied families
• Sales result from defining family’s need
• Revenue growth standard based on property sales
• Emphasis on sales to new families
• Maintain or grow at need business (interments)
• General Managers lead the business and accountable for results
• Sales Managers critical to creating heritage and value
• Build stable sales team – reduce costly turnover
• Recruit outside the industry – reduce “retreads”
• Training and monitor daily activity that drives sales
• Emphasis on family service counselors
• Grounds personnel key to appearance, image and reputation
• Superintendent must have ownership mentality
• Focus on collections and promotional costs
Plan to fully implement operating model and standards by 2006
18
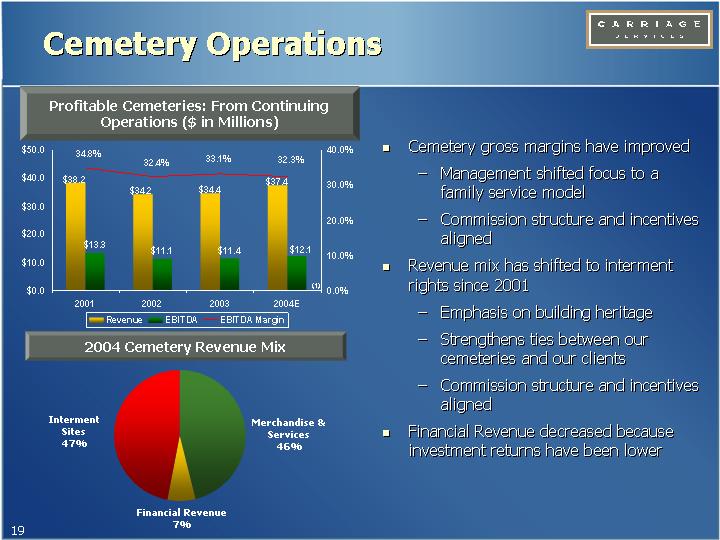
Cemetery Operations
Profitable Cemeteries: From Continuing Operations ($ in Millions)
[CHART]
2004 Cemetery Revenue Mix
[CHART]
• Cemetery gross margins have improved
• Management shifted focus to a family service model
• Commission structure and incentives aligned
• Revenue mix has shifted to interment rights since 2001
• Emphasis on building heritage
• Strengthens ties between our cemeteries and our clients
• Commission structure and incentives aligned
• Financial Revenue decreased because investment returns have been lower
19
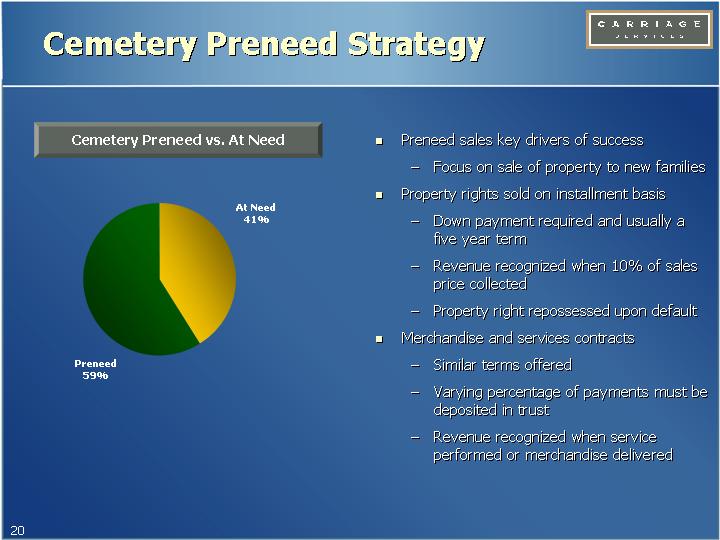
Cemetery Preneed Strategy
Cemetery Preneed vs. At Need
[CHART]
• Preneed sales key drivers of success
• Focus on sale of property to new families
• Property rights sold on installment basis
• Down payment required and usually a five year term
• Revenue recognized when 10% of sales price collected
• Property right repossessed upon default
• Merchandise and services contracts
• Similar terms offered
• Varying percentage of payments must be deposited in trust
• Revenue recognized when service performed or merchandise delivered
20
Financial Strategy to Facilitate Growth
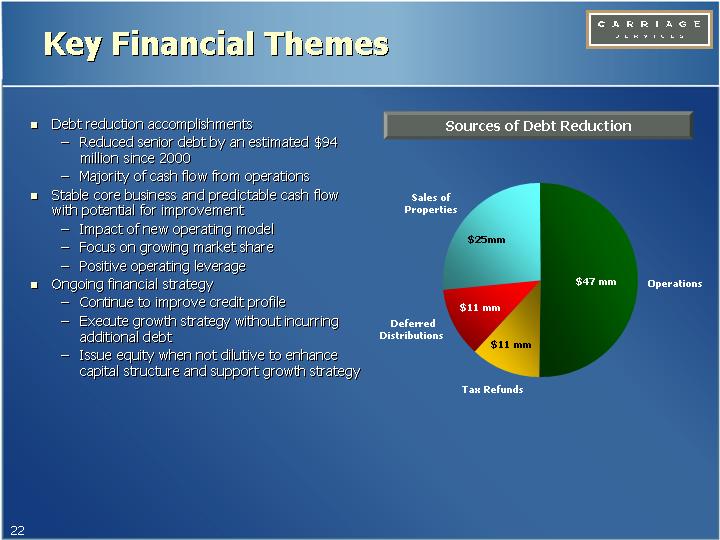
Key Financial Themes
• Debt reduction accomplishments
• Reduced senior debt by an estimated $94 million since 2000
• Majority of cash flow from operations
• Stable core business and predictable cash flow with potential for improvement
• Impact of new operating model
• Focus on growing market share
• Positive operating leverage
• Ongoing financial strategy
• Continue to improve credit profile
• Execute growth strategy without incurring additional debt
• Issue equity when not dilutive to enhance capital structure and support growth strategy
Sources of Debt Reduction
[CHART]
22
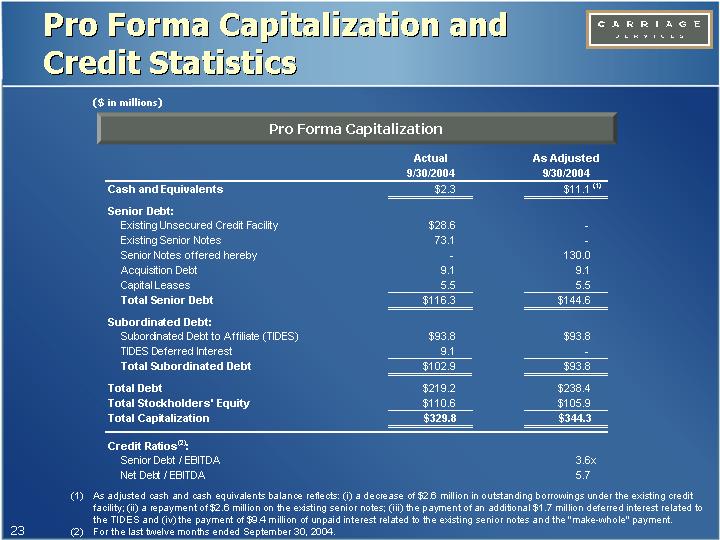
Pro Forma Capitalization and Credit Statistics
($ in millions)
Pro Forma Capitalization
|
| Actual |
| As Adjusted |
| ||
Cash and Equivalents |
| $ | 2.3 |
| $ | 11.1 | (1) |
|
|
|
|
|
| ||
Senior Debt: |
|
|
|
|
| ||
Existing Unsecured Credit Facility |
| $ | 28.6 |
| — |
| |
Existing Senior Notes |
| 73.1 |
| — |
| ||
Senior Notes offered hereby |
| — |
| 130.0 |
| ||
Acquisition Debt |
| 9.1 |
| 9.1 |
| ||
Capital Leases |
| 5.5 |
| 5.5 |
| ||
Total Senior Debt |
| $ | 116.3 |
| $ | 144.6 |
|
|
|
|
|
|
| ||
Subordinated Debt: |
|
|
|
|
| ||
Subordinated Debt to Affiliate (TIDES) |
| $ | 93.8 |
| $ | 93.8 |
|
TIDES Deferred Interest |
| 9.1 |
| — |
| ||
Total Subordinated Debt |
| $ | 102.9 |
| $ | 93.8 |
|
|
|
|
|
|
| ||
Total Debt |
| $ | 219.2 |
| $ | 238.4 |
|
Total Stockholders’ Equity |
| $ | 110.6 |
| $ | 105.9 |
|
Total Capitalization |
| $ | 329.8 |
| $ | 344.3 |
|
|
|
|
|
|
| ||
Credit Ratios(2): |
|
|
|
|
| ||
Senior Debt / EBITDA |
|
|
| 3.6 | x | ||
Net Debt / EBITDA |
|
|
| 5.7 |
| ||
(1) As adjusted cash and cash equivalents balance reflects: (i) a decrease of $2.6 million in outstanding borrowings under the existing credit facility; (ii) a repayment of $2.6 million on the existing senior notes; (iii) the payment of an additional $1.7 million deferred interest related to the TIDES and (iv) the payment of $9.4 million of unpaid interest related to the existing senior notes and the “make-whole” payment.
(2) For the last twelve months ended September 30, 2004.
23
Term Income Deferrable Equity Securities (TIDES)
• Carriage Issued $93.75 million of 7% convertible preferred securities in June 1999
• Matures in 2029
• Subordinated to all indebtedness
• Distributions may be deferred for up to 5 years at Carriage’s option
• By bringing distributions current, deferral period can be reset unlimited number of times
• Practical implications of the TIDES include:
• Inexpensive capital (7% tax-deductible coupon)
• No call provision, even upon change in control
• Possible future exchange for common equity, if accretive
24
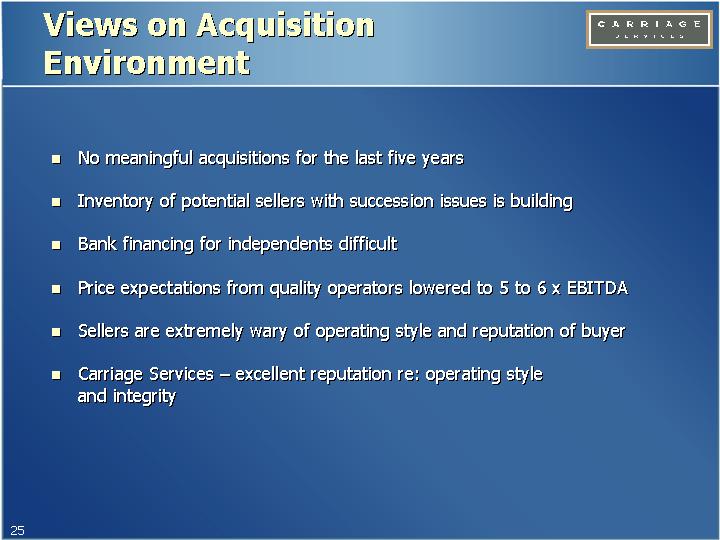
Views on Acquisition Environment
• No meaningful acquisitions for the last five years
• Inventory of potential sellers with succession issues is building
• Bank financing for independents difficult
• Price expectations from quality operators lowered to 5 to 6 x EBITDA
• Sellers are extremely wary of operating style and reputation of buyer
• Carriage Services – excellent reputation re: operating style and integrity
25
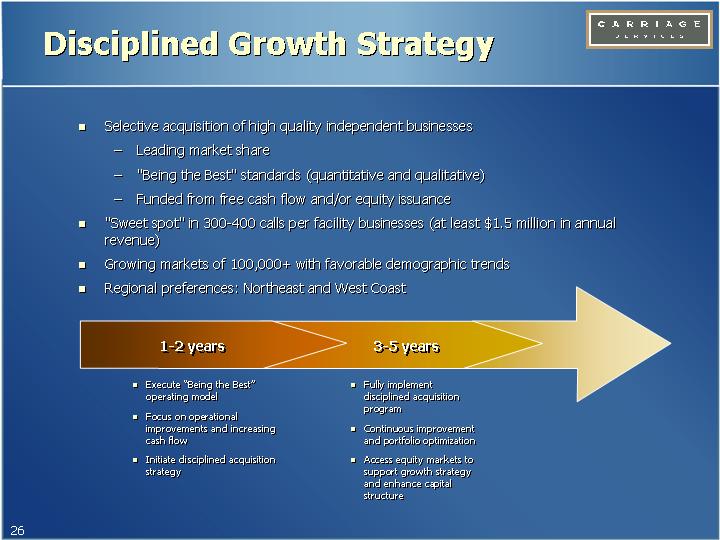
Disciplined Growth Strategy
• Selective acquisition of high quality independent businesses
• Leading market share
• “Being the Best” standards (quantitative and qualitative)
• Funded from free cash flow and/or equity issuance
• “Sweet spot” in 300-400 calls per facility businesses (at least $1.5 million in annual revenue)
• Growing markets of 100,000+ with favorable demographic trends
• Regional preferences: Northeast and West Coast
1-2 years |
| 3-5 years |
|
|
|
• Execute “Being the Best” operating model • Focus on operational improvements and increasing cash flow • Initiate disciplined acquisition strategy |
| • Fully implement disciplined acquisition program • Continuous improvement and portfolio optimization • Access equity markets to support growth strategy and enhance capital structure |
26
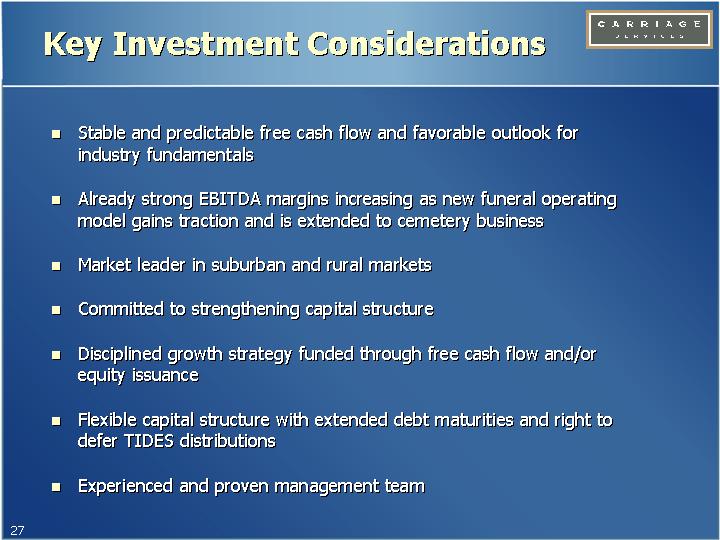
Key Investment Considerations
• Stable and predictable free cash flow and favorable outlook for industry fundamentals
• Already strong EBITDA margins increasing as new funeral operating model gains traction and is extended to cemetery business
• Market leader in suburban and rural markets
• Committed to strengthening capital structure
• Disciplined growth strategy funded through free cash flow and/or equity issuance
• Flexible capital structure with extended debt maturities and right to defer TIDES distributions
• Experienced and proven management team
27
Presentation of Financial Information
We report our financial results in accordance with generally accepted accounting principles (“GAAP”). However, management believes that certain non-GAAP performance measures and ratios, which management uses in managing our business, may provide users of this financial information additional meaningful comparisons between results in historical periods.
We refer to the term “EBITDA” in various places of our financial discussion. EBITDA is defined by us as net income before interest expense, other income (expense), income tax expense, and depreciation and amortization expense. EBITDA is not a measure of operating performance under generally accepted accounting principles, or GAAP, and should not be considered in isolation nor construed as an alternative to operating profit, net income (loss) or cash flows from operating, investing or financing activities, each as determined in accordance with GAAP. You should also not consider EBITDA as a measure of liquidity. Moreover, since EBITDA is not a measure determined in accordance with GAAP and thus is susceptible to varying interpretations and calculations, EBITDA, as presented, may not be comparable to similarly titled measures presented by other companies.
Reconciliation of Net Income from continuing operations to EBITDA from continuing operations:
|
| 2001 |
| 2002 |
| 2003 |
| Last Twelve |
| |||||
Net income from continuing operations |
| $ | 9,002 |
| $ | 19,533 |
| $ | 5,898 |
| $ | 6,537 |
| |
Provision (benefit) for income taxes |
| $ | 2,251 |
| $ | (8,583 | ) | $ | 3,519 |
| $ | 3,921 |
| |
Pre-tax earnings from continuing operations |
| $ | 11,253 |
| $ | 10,950 |
| $ | 9,417 |
| $ | 10,458 $ |
| |
Other (income) expense |
| $ | — |
| $ | 361 |
| $ | (577 | ) | $ | (511 | ) | |
Interest expense, including loan cost amortization |
| $ | 20,344 |
| $ | 19,715 |
| $ | 17,787 |
| $ | 17,389 |
| |
Depreciation & amortization |
| $ | 17,095 |
| $ | 10,446 |
| $ | 10,859 |
| $ | 11,643 |
| |
EBITDA from continuing operations |
| $ | 48,692 |
| $ | 41,472 |
| $ | 37,486 |
| $ | 38,979 |
| |
Revenue from continuing operations |
| $ | 162,493 |
| $ | 149,317 |
| $ | 146,939 |
| $ | 152,051 |
| |
EBITDA margin from continuing operations |
| 29.97 | % | 27.77 | % | 25.51 | % | 25.64 | % | |||||
Reconciliation of Gross Profit from funeral home operations to EBITDA from continuing funeral home operations:
|
| 2001 |
| 2002 |
| 2003 |
| 2004E |
| ||||
Gross profit from funeral home operations |
| $ | 31,471 |
| $ | 33,407 |
| $ | 29,098 |
| $ | 29,429 |
|
Depreciation & amortization |
| $ | 11,872 |
| $ | 6,723 |
| $ | 6,894 |
| $ | 7,242 |
|
EBITDA from funeral home operations |
| $ | 43,343 |
| $ | 40,130 |
| $ | 35,992 |
| $ | 36,671 |
|
Revenue from funeral home operations |
| $ | 124,284 |
| $ | 115,100 |
| $ | 112,588 |
| $ | 112,816 |
|
EBITDA margin from continuing funeral home operations |
| 34.87 | % | 34.87 | % | 31.97 | % | 32.51 | % | ||||
Reconciliation of Gross Profit from cemetery operations to EBITDA from continuing cemetery operations:
|
| 2001 |
| 2002 |
| 2003 |
| 2004E |
| ||||
Gross profit from cemetery operations |
| $ | 8,824 |
| $ | 8,221 |
| $ | 8,521 |
| $ | 8,874 |
|
Depreciation & amortization |
| $ | 4,489 |
| $ | 2,848 |
| $ | 2,850 |
| $ | 3,199 |
|
EBITDA from cemetery operations |
| $ | 13,313 |
| $ | 11,069 |
| $ | 11,371 |
| $ | 12,073 |
|
Revenue from cemetery operations |
| $ | 38,209 |
| $ | 34,217 |
| $ | 34,351 |
| $ | 37,390 |
|
EBITDA margin from continuing cemetery operations |
| 34.84 | % | 32.35 | % | 33.10 | % | 32.29 | % | ||||
28
Carriage Services
(NYSE: CSV)
2005 UBS Global Healthcare Services Conference
February 15, 2005