Searchable text section of graphics shown above
[LOGO]
Carriage Services
(NYSE: CSV)
2005 Merrill Lynch Deathcare Conference
April 21, 2005
Forward-Looking Statements
The statements in this presentation that are not historical facts are forward-looking statements made in reliance on the “safe harbor” protections provided under the Private Securities Litigation Reform Act of 1995. These statements may be accompanied by words that convey the uncertainty of future events or outcomes. These statements are based on assumptions that we believe are reasonable; however, many important factors could cause our actual results in the future to differ materially from the forward-looking statements made herein and in any other documents or oral presentations made by, or on behalf of, the Company. For further information on these risks and uncertainties, see the Company’s Securities and Exchange Commission filings, including our 2004 Annual Report on Form 10-K. We assume no obligation to publicly update or revise any forward-looking statements made herein or any other forward-looking statements made by the Company, whether as a result of new information, future events or otherwise.
2
Introduction
| | Experience |
| | |
Mel Payne, Chairman and CEO | | Founder of Carriage, CEO since 1991 and Chairman since December 1996. |
| | |
Joseph Saporito, EVP and CFO | | EVP, CFO and Secretary of Carriage since September 2002. Prior to joining Carriage, Mr. Saporito was a partner at Arthur Andersen for 15 years. |
3
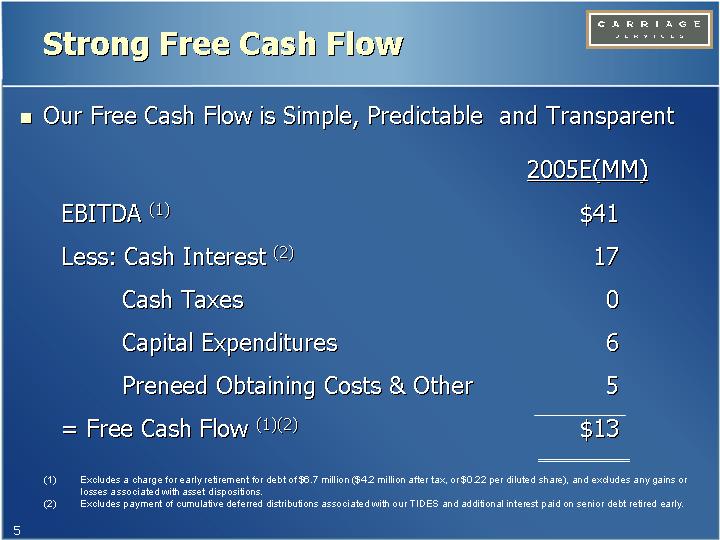
Strong Free Cash Flow
• Our Free Cash Flow is Simple, Predictable and Transparent
| | 2005E(MM) | |
EBITDA (1) | | $ | 41 | |
Less: Cash Interest (2) | | 17 | |
Cash Taxes | | 0 | |
Capital Expenditures | | 6 | |
Preneed Obtaining Costs & Other | | 5 | |
= Free Cash Flow (1)(2) | | $ | 13 | |
(1) Excludes a charge for early retirement for debt of $6.7 million ($4.2 million after tax, or $0.22 per diluted share), and excludes any gains or losses associated with asset dispositions.
(2) Excludes payment of cumulative deferred distributions associated with our TIDES and additional interest paid on senior debt retired early.
5
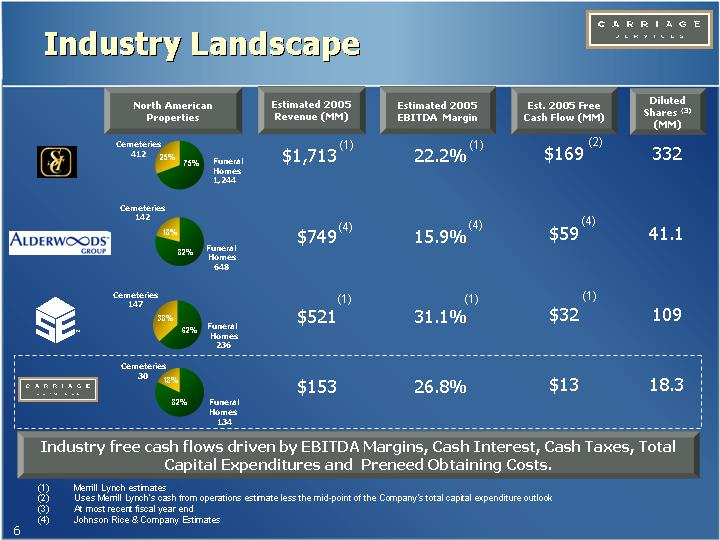
Industry Landscape
| | North American
Properties | | Estimated 2005
Revenue (MM) | | Estimated 2005
EBITDA Margin | | Est. 2005 Free
Cash Flow (MM) | | Diluted
Shares (3)
(MM) | |
[LOGO] | | [CHART] | | $ | 1,713 | (1) | 22.2 | %(1) | $ | 169 | (2) | 332 | |
| | | | | | | | | | | |
[LOGO] | | [CHART] | | $ | 749 | (4) | 15.9 | %(4) | $ | 59 | (4) | 41.1 | |
| | | | | | | | | | | |
[LOGO] | | [CHART] | | $ | 521 | (1) | 31.1 | %(1) | $ | 32 | (1) | 109 | |
| | | | | | | | | | | |
[LOGO] | | [CHART] | | $ | 153 | | 26.8 | % | $ | 13 | | 18.3 | |
Industry free cash flows driven by EBITDA Margins, Cash Interest, Cash Taxes, Total
Capital Expenditures and Preneed Obtaining Costs.
(1) Merrill Lynch estimates
(2) Uses Merrill Lynch’s cash from operations estimate less the mid-point of the Company’s total capital expenditure outlook
(3) At most recent fiscal year end
(4) Johnson Rice & Company Estimates
6
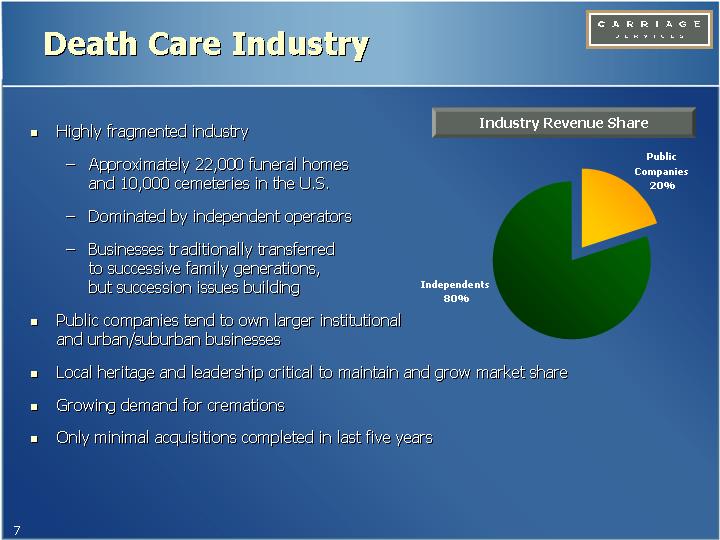
Death Care Industry
• Highly fragmented industry
• Approximately 22,000 funeral homes and 10,000 cemeteries in the U.S.
• Dominated by independent operators
• Businesses traditionally transferred to successive family generations, but succession issues building
• Public companies tend to own larger institutional and urban/suburban businesses
• Local heritage and leadership critical to maintain and grow market share
• Growing demand for cremations
• Only minimal acquisitions completed in last five years
Industry Revenue Share
[CHART]
7
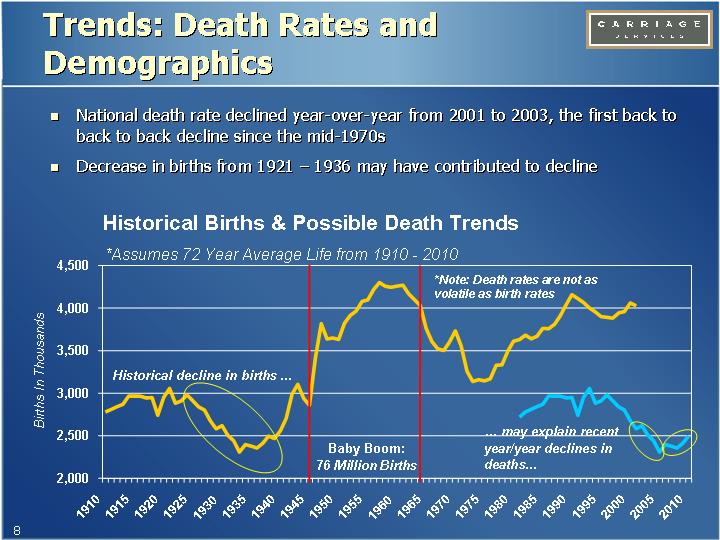
Trends: Death Rates and Demographics
• National death rate declined year-over-year from 2001 to 2003, the first back to back to back decline since the mid-1970s
• Decrease in births from 1921 – 1936 may have contributed to decline
Historical Births & Possible Death Trends
*Assumes 72 Year Average Life from 1910 - 2010
[CHART]
8
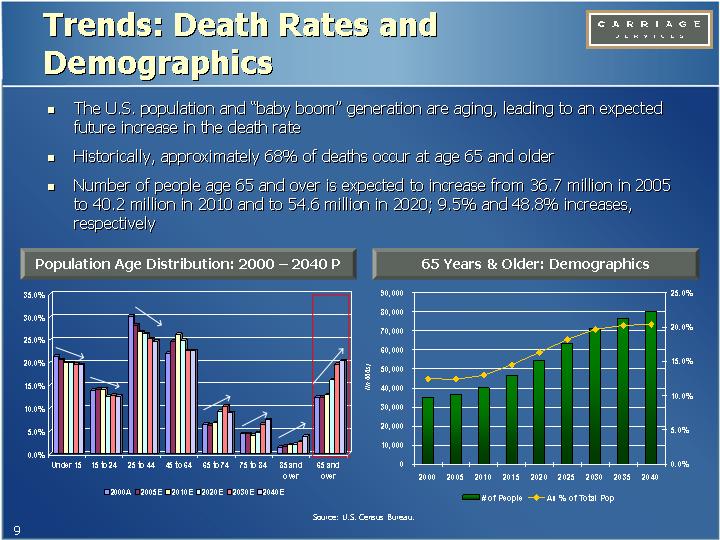
• The U.S. population and “baby boom” generation are aging, leading to an expected future increase in the death rate
• Historically, approximately 68% of deaths occur at age 65 and older
• Number of people age 65 and over is expected to increase from 36.7 million in 2005 to 40.2 million in 2010 and to 54.6 million in 2020; 9.5% and 48.8% increases, respectively
Population Age Distribution: 2000 – 2040 P | | 65 Years & Older: Demographics |
| | |
[CHART] | | [CHART] |
Source: U.S. Census Bureau.
9
Trends: Cremation Rates
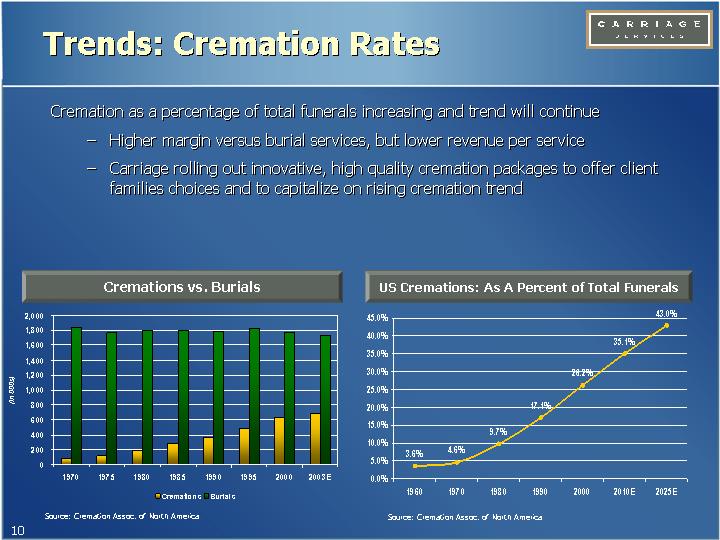
Cremation as a percentage of total funerals increasing and trend will continue
• Higher margin versus burial services, but lower revenue per service
• Carriage rolling out innovative, high quality cremation packages to offer client families choices and to capitalize on rising cremation trend
Cremations vs. Burials | | US Cremations: As A Percent of Total Funerals |
| | |
[CHART] | | [CHART] |
| | |
Source: Cremation Assoc. of North America | | Source: Cremation Assoc. of North America |
10
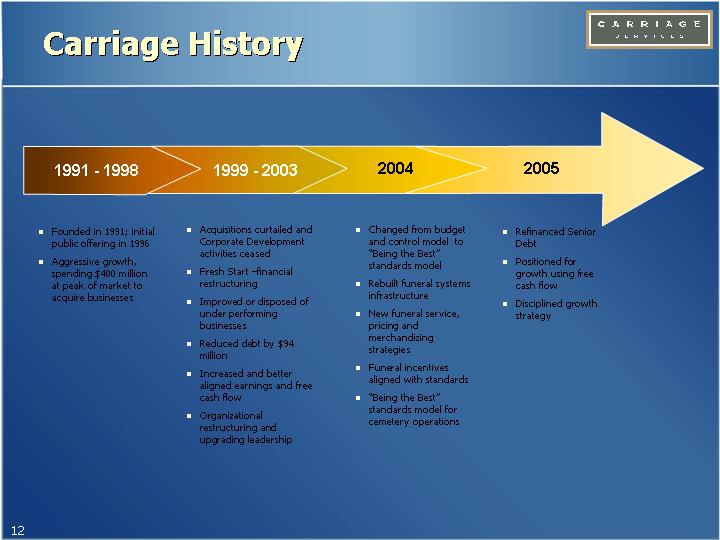
Carriage History
1991 - 1998 | | 1999 - 2003 | | 2004 | | 2005 |
| | | | | | |
• Founded in 1991; initial public offering in 1996 | | • Acquisitions curtailed and Corporate Development | | • Changed from budget and control model to “Being the | | • Refinanced Senior Debt |
| | activities ceased | | Best” standards model | | |
• Aggressive growth, spending $400 | | | | | | • Positioned for |
million at peak of market to acquire | | • Fresh Start –financial | | • Rebuilt funeral systems | | growth using |
businesses | | restructuring | | infrastructure | | free cash flow |
| | | | | | |
| | • Improved or disposed of | | • New funeral service, | | • Disciplined |
| | under performing | | pricing and merchandizing | | growth strategy |
| | businesses | | strategies | | |
| | | | | | |
| | • Reduced debt by $94 million | | • Funeral incentives aligned with standards | | |
| | | | | | |
| | • Increased and better aligned earnings and free cash flow | | • “Being the Best” standards model for cemetery operations | | |
| | • Organizational | | | | |
| | restructuring and upgrading leadership | | | | |
12
Carriage Services Today
[GRAPHIC]
• Operations in 28 states
• Focus on attractive suburban markets
• 134 Funeral Homes
• 30 Cemeteries (includes 5 Combos)
• Market leader (#1 or #2) in over 70% of locations
• 2nd most profitable funeral and cemetery operations among public companies
Carriage Services is the 4th largest funeral and cemetery services
company in the U.S., with strong positions in East and West regions
13
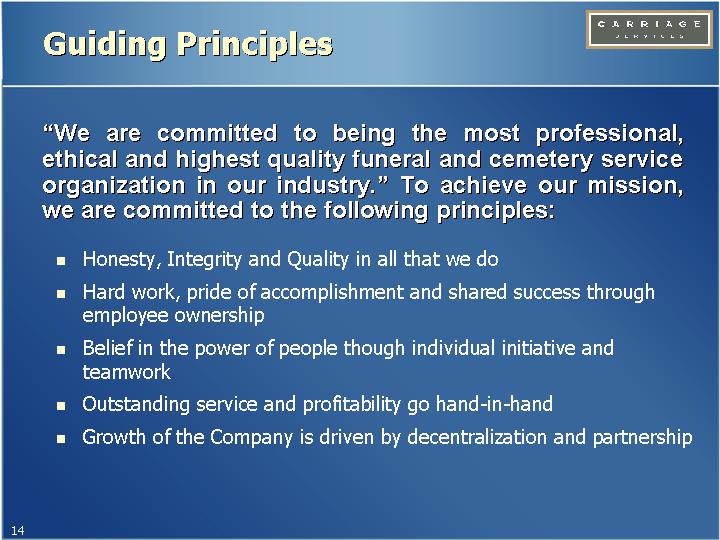
Guiding Principles
“We are committed to being the most professional, ethical and highest quality funeral and cemetery service organization in our industry.” To achieve our mission, we are committed to the following principles:
• Honesty, Integrity and Quality in all that we do
• Hard work, pride of accomplishment and shared success through employee ownership
• Belief in the power of people though individual initiative and teamwork
• Outstanding service and profitability go hand-in-hand
• Growth of the Company is driven by decentralization and partnership
14
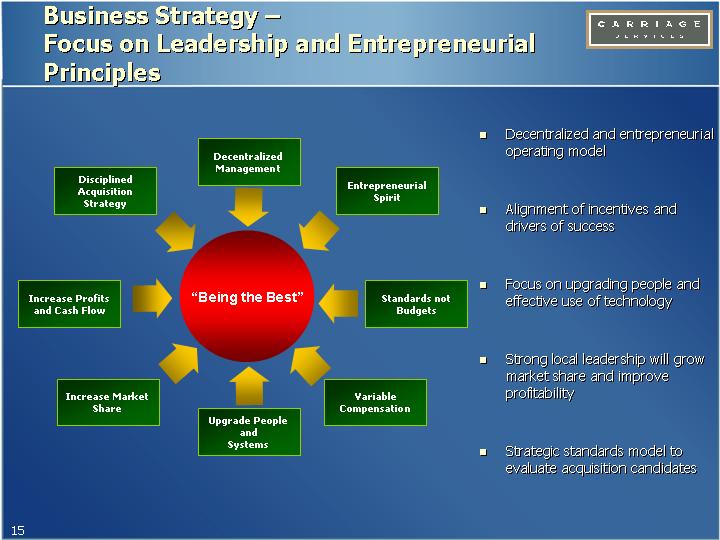
Business Strategy –
Focus on Leadership and Entrepreneurial Principles
| | Decentralized | | |
Disciplined | | Management | | Entrepreneurial |
Acquisition | | | | Spirit |
Strategy | | | | |
| | | | |
Increase Profits | | “Being the Best” | | Standards not |
and Cash Flow | | | | Budgets |
| | | | |
Increase Market | | | | Variable |
Share | | Upgrade People | | Compensation |
| | and | | |
| | Systems | | |
• Decentralized and entrepreneurial operating model
• Alignment of incentives and drivers of success
• Focus on upgrading people and effective use of technology
• Strong local leadership will grow market share and improve profitability
• Strategic standards model to evaluate acquisition candidates
15
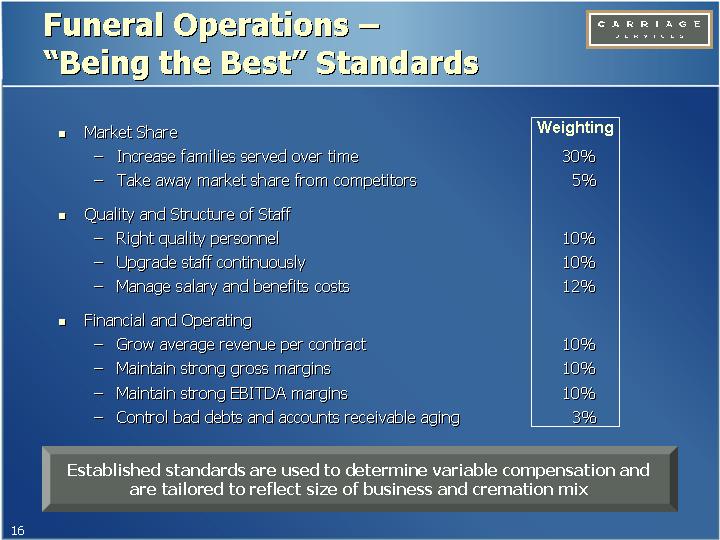
Funeral Operations – “Being the Best” Standards
| | | | Weighting | |
• | Market Share | | | |
| • | Increase families served over time | | 30 | % |
| • | Take away market share from competitors | | 5 | % |
• | Quality and Structure of Staff | | | |
| • | Right quality personnel | | 10 | % |
| • | Upgrade staff continuously | | 10 | % |
| • | Manage salary and benefits costs | | 12 | % |
• | Financial and Operating | | | |
| • | Grow average revenue per contract | | 10 | % |
| • | Maintain strong gross margins | | 10 | % |
| • | Maintain strong EBITDA margins | | 10 | % |
| • | Control bad debts and accounts receivable aging | | 3 | % |
Established standards are used to determine variable compensation and are tailored to reflect size of business and cremation mix
16
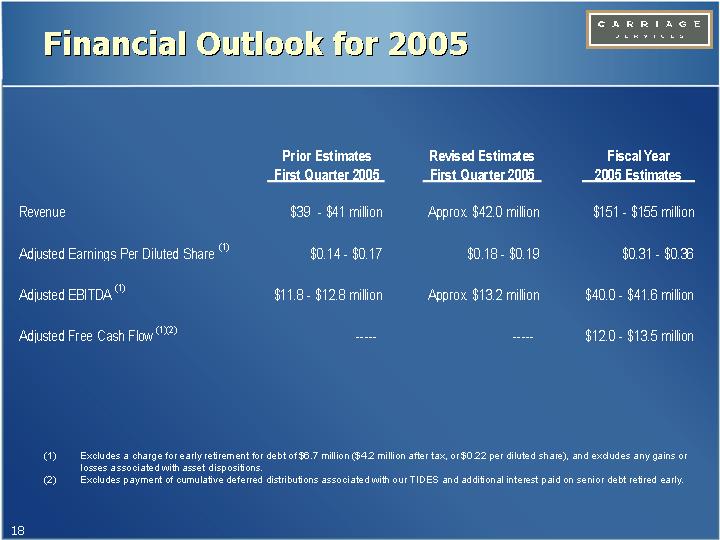
Financial Outlook for 2005
| | Prior Estimates
First Quarter 2005 | | Revised Estimates
First Quarter 2005 | | Fiscal Year
2005 Estimates | |
| | | | | | | |
Revenue | | $39 - $41 million | | Approx. $42.0 million | | $151 - $155 million | |
| | | | | | | |
Adjusted Earnings Per Diluted Share (1) | | $0.14 - $0.17 | | $0.18 - $0.19 | | $0.31 - $0.36 | |
| | | | | | | |
Adjusted EBITDA (1) | | $11.8 - $12.8 million | | Approx. $13.2 million | | $40.0 - $41.6 million | |
| | | | | | | |
Adjusted Free Cash Flow (1)(2) | | — | | — | | $12.0 - $13.5 million | |
(1) Excludes a charge for early retirement for debt of $6.7 million ($4.2 million after tax, or $0.22 per diluted share), and excludes any gains or losses associated with asset dispositions.
(2) Excludes payment of cumulative deferred distributions associated with our TIDES and additional interest paid on senior debt retired early.
18
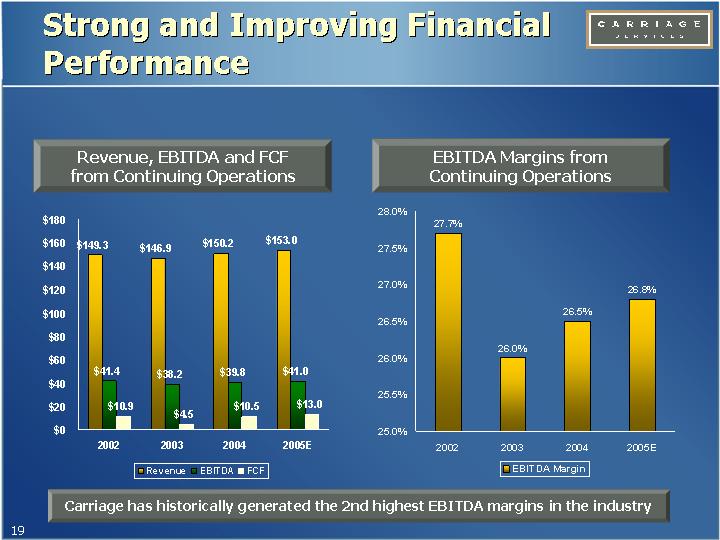
Strong and Improving Financial Performance
Revenue, EBITDA and FCF from Continuing Operations | | EBITDA Margins from Continuing Operations |
| | |
[CHART] | | [CHART] |
Carriage has historically generated the 2nd highest EBITDA margins in the industry
19
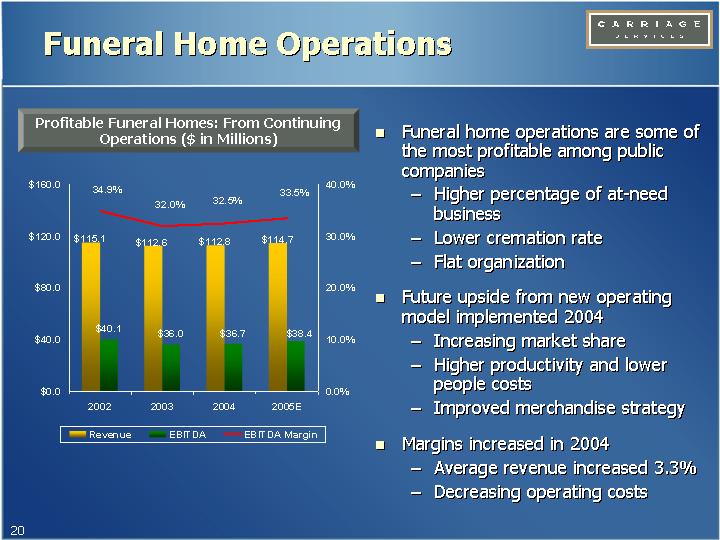
Funeral Home Operations
Profitable Funeral Homes: From Continuing Operations
($ in Millions) | • | Funeral home operations are some of the most profitable among public companies |
| | | • | Higher percentage of at-need business |
| | | • | Lower cremation rate |
| | | • | Flat organization |
| | | | |
[CHART] | • | Future upside from new operating model implemented 2004 |
| | | • | Increasing market share |
| | | • | Higher productivity and lower people costs |
| | | • | Improved merchandise strategy |
| | | | |
| • | Margins increased in 2004 |
| | | • | Average revenue increased 3.3% |
| | | • | Decreasing operating costs |
20
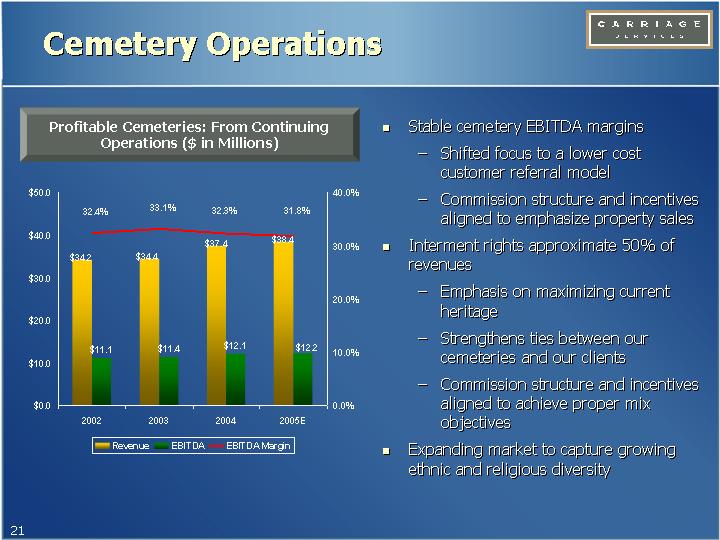
Cemetery Operations
Profitable Cemeteries: From Continuing Operations
($ in Millions) | • | Stable cemetery EBITDA margins |
| | | • | Shifted focus to a lower cost customer referral model |
| | | • | Commission structure and incentives aligned to emphasize property sales |
| | | | |
[CHART] | • | Interment rights approximate 50% of revenues |
| | | • | Emphasis on maximizing current heritage |
| | | • | Strengthens ties between our cemeteries and our clients |
| | | • | Commission structure and incentives aligned to achieve proper mix objectives |
| | | | |
| • | Expanding market to capture growing ethnic and religious diversity |
21
Financial Strategy to Facilitate Growth
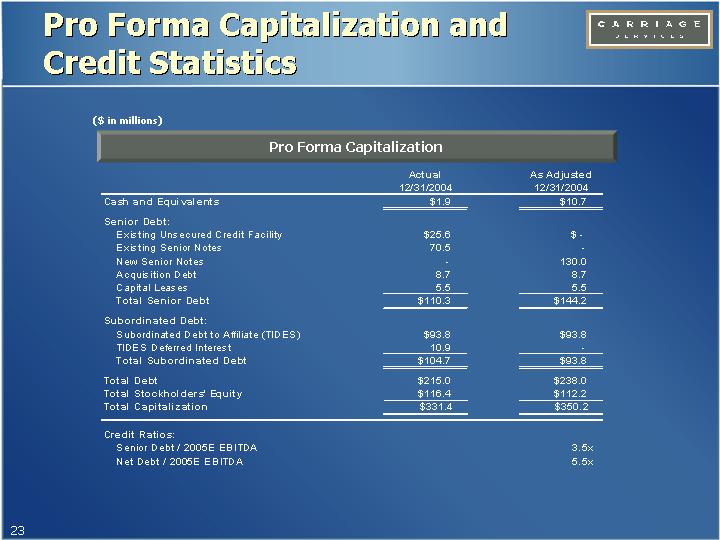
Pro Forma Capitalization and Credit Statistics
($ in millions)
Pro Forma Capitalization
| | Actual
12/31/2004 | | As Adjusted
12/31/2004 | |
Cash and Equivalents | | $ | 1.9 | | $ | 10.7 | |
| | | | | |
Senior Debt: | | | | | |
Existing Unsecured Credit Facility | | $ | 25.6 | | $ | — | |
Existing Senior Notes | | 70.5 | | — | |
New Senior Notes | | — | | 130.0 | |
Acquisition Debt | | 8.7 | | 8.7 | |
Capital Leases | | 5.5 | | 5.5 | |
Total Senior Debt | | $ | 110.3 | | $ | 144.2 | |
| | | | | |
Subordinated Debt: | | | | | |
Subordinated Debt to Affiliate (TIDES) | | $ | 93.8 | | $ | 93.8 | |
TIDES Deferred Interest | | 10.9 | | — | |
Total Subordinated Debt | | $ | 104.7 | | $ | 93.8 | |
| | | | | |
Total Debt | | $ | 215.0 | | $ | 238.0 | |
Total Stockholders’ Equity | | $ | 116.4 | | $ | 112.2 | |
Total Capitalization | | $ | 331.4 | | $ | 350.2 | |
| | | | | |
Credit Ratios: | | | | | |
Senior Debt / 2005E EBITDA | | | | 3.5 | x |
Net Debt / 2005E EBITDA | | | | 5.5 | x |
23
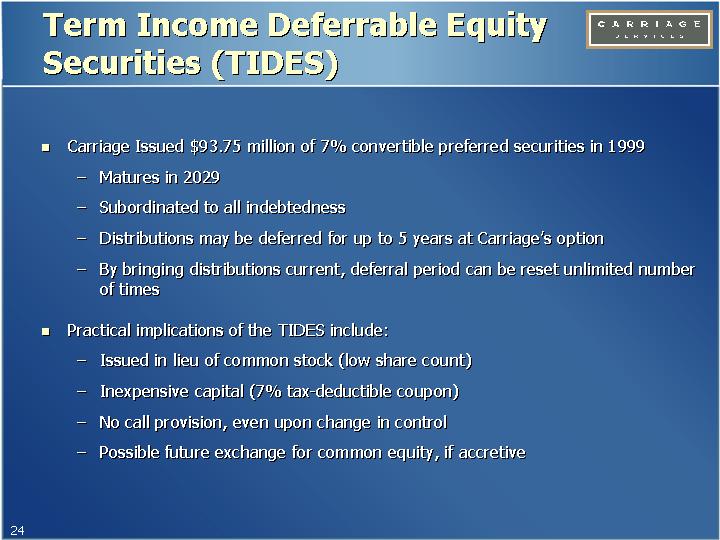
Term Income Deferrable Equity Securities (TIDES)
• Carriage Issued $93.75 million of 7% convertible preferred securities in 1999
• Matures in 2029
• Subordinated to all indebtedness
• Distributions may be deferred for up to 5 years at Carriage’s option
• By bringing distributions current, deferral period can be reset unlimited number of times
• Practical implications of the TIDES include:
• Issued in lieu of common stock (low share count)
• Inexpensive capital (7% tax-deductible coupon)
• No call provision, even upon change in control
• Possible future exchange for common equity, if accretive
24
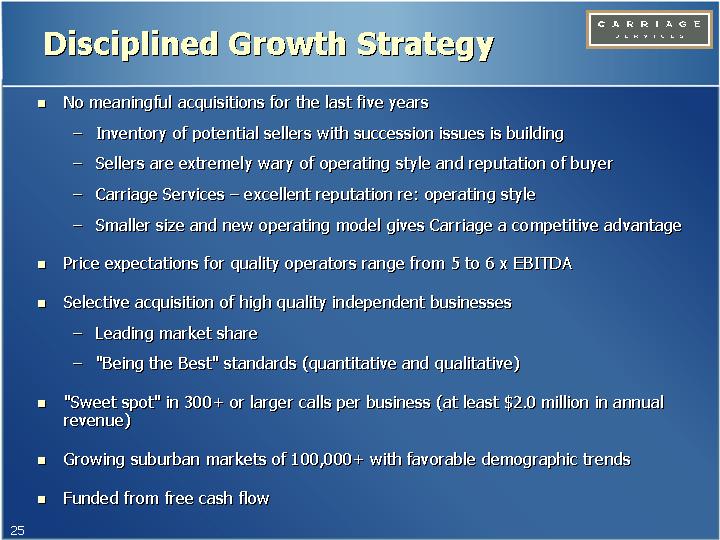
Disciplined Growth Strategy
• No meaningful acquisitions for the last five years
• Inventory of potential sellers with succession issues is building
• Sellers are extremely wary of operating style and reputation of buyer
• Carriage Services – excellent reputation re: operating style
• Smaller size and new operating model gives Carriage a competitive advantage
• Price expectations for quality operators range from 5 to 6 x EBITDA
• Selective acquisition of high quality independent businesses
• Leading market share
• “Being the Best” standards (quantitative and qualitative)
• “Sweet spot” in 300+ or larger calls per business (at least $2.0 million in annual revenue)
• Growing suburban markets of 100,000+ with favorable demographic trends
• Funded from free cash flow
25
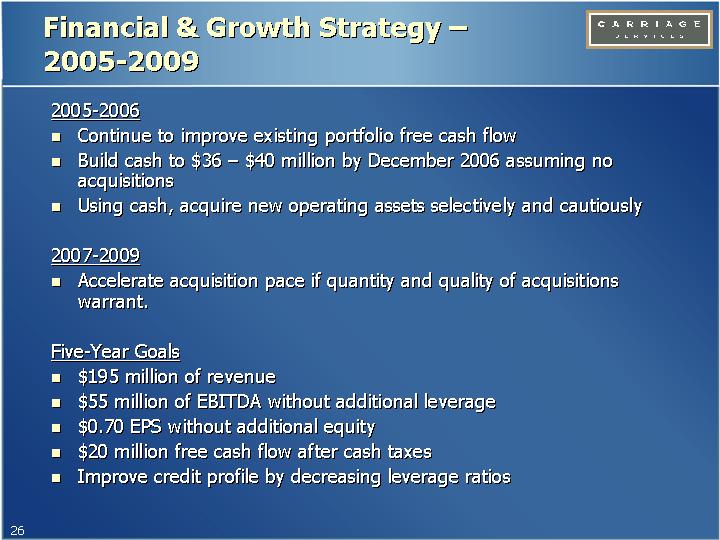
Financial & Growth Strategy – 2005-2009
2005-2006
• Continue to improve existing portfolio free cash flow
• Build cash to $36 – $40 million by December 2006 assuming no acquisitions
• Using cash, acquire new operating assets selectively and cautiously
2007-2009
• Accelerate acquisition pace if quantity and quality of acquisitions warrant.
Five-Year Goals
• $195 million of revenue
• $55 million of EBITDA without additional leverage
• $0.70 EPS without additional equity
• $20 million free cash flow after cash taxes
• Improve credit profile by decreasing leverage ratios
26
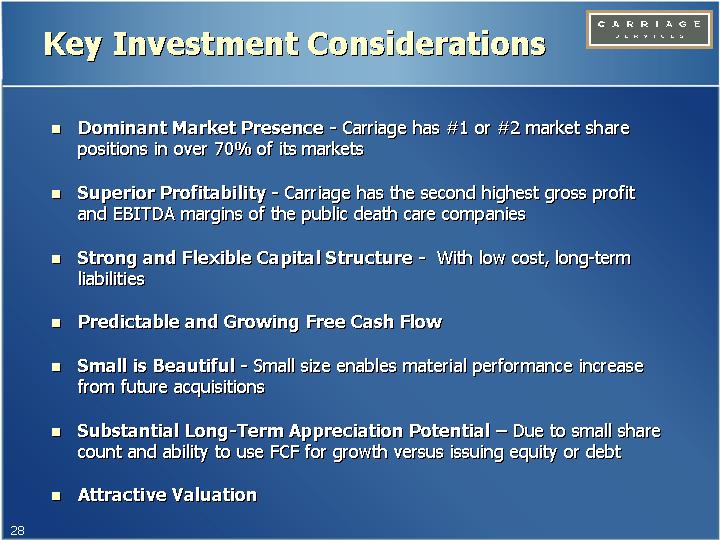
Key Investment Considerations
• Dominant Market Presence - Carriage has #1 or #2 market share positions in over 70% of its markets
• Superior Profitability - Carriage has the second highest gross profit and EBITDA margins of the public death care companies
• Strong and Flexible Capital Structure - With low cost, long-term liabilities
• Predictable and Growing Free Cash Flow
• Small is Beautiful - Small size enables material performance increase from future acquisitions
• Substantial Long-Term Appreciation Potential – Due to small share count and ability to use FCF for growth versus issuing equity or debt
• Attractive Valuation
28
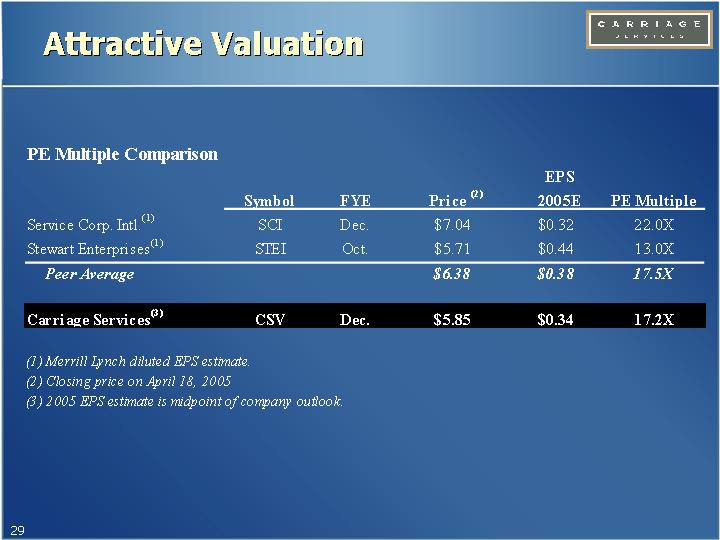
Attractive Valuation
PE Multiple Comparison
| | Symbol | | FYE | | Price (2) | | EPS
2005E | | PE Multiple | |
Service Corp. Intl.(1) | | SCI | | Dec. | | $ | 7.04 | | $ | 0.32 | | 22.0 | X |
Stewart Enterprises(1) | | STEI | | Oct. | | $ | 5.71 | | $ | 0.44 | | 13.0 | X |
Peer Average | | | | | | $ | 6.38 | | $ | 0.38 | | 17.5 | X |
| | | | | | | | | | | |
Carriage Services(3) | | CSV | | Dec. | | $ | 5.85 | | $ | 0.34 | | 17.2 | X |
(1) Merrill Lynch diluted EPS estimate.
(2) Closing price on April 18, 2005
(3) 2005 EPS estimate is midpoint of company outlook.
29
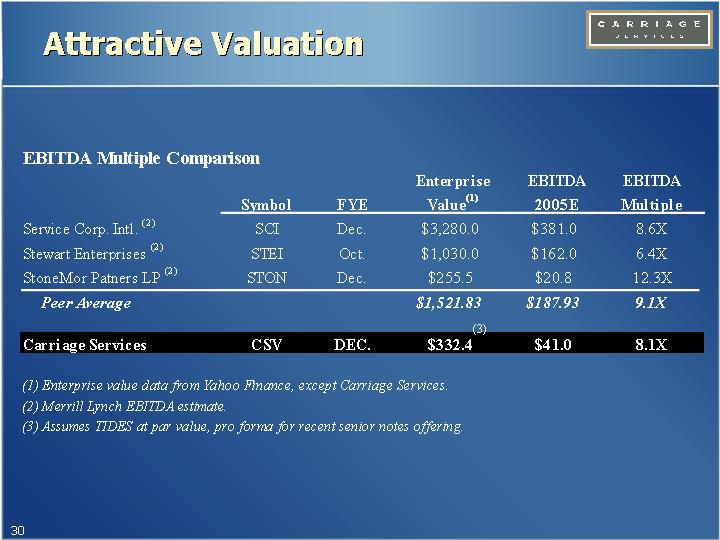
EBITDA Multiple Comparison
| | Symbol | | FYE | | Enterprise
Value(1) | | EBITDA
2005E | | EBITDA
Multiple | |
Service Corp. Intl. (2) | | SCI | | Dec. | | $ | 3,280.0 | | $ | 381.0 | | 8.6X | |
Stewart Enterprises (2) | | STEI | | Oct. | | $ | 1,030.0 | | $ | 162.0 | | 6.4X | |
StoneMor Patners LP (2) | | STON | | Dec. | | $ | 255.5 | | $ | 20.8 | | 12.3X | |
Peer Average | | | | | | $ | 1,521.83 | | $ | 187.93 | | 9.1X | |
| | | | | | | | | | | |
Carriage Services | | CSV | | DEC. | | $ | 332.4 | (3) | $ | 41.0 | | 8.1X | |
(1) Enterprise value data from Yahoo Finance, except Carriage Services.
(2) Merrill Lynch EBITDA estimate.
(3) Assumes TIDES at par value, pro forma for recent senior notes offering.
30
FCF Yield & Multiple Comparison
| | Symbol | | FYE | | Equity
Market Cap (1) | | 2005E
FCF | | FCF
Yield | | FCF
Multiple | |
Service Corp. Intl. (2) | | SCI | | Dec. | | $ | 2,180.0 | | $ | 169.0 | | 7.8 | % | 12.9X | |
Stewart Enterprises (3) | | STEI | | Oct. | | $ | 627.0 | | $ | 31.9 | | 5.1 | % | 19.7X | |
StoneMor Patners LP (3) | | STON | | Dec. | | $ | 184.9 | | $ | 13.8 | | 7.5 | % | 13.4X | |
Peer Average | | | | | | $ | 997.30 | | $ | 71.57 | | 6.8 | % | 15.3X | |
| | | | | | | | | | | | | |
Carriage Services(4) | | CSV | | DEC. | | $ | 105.1 | | $ | 13.0 | | 12.4 | % | 8.1X | |
| | | | | | | | | | | | | | | | | |
(1) Equity market cap data from Yahoo Finance.
(2) 2005 FCF estimate uses Merrill Lynch’s cash from operations estimate less midpoint of Company’s total capex outlook.
(3) Merrill Lynch FCF estimate.
(4) 2005 FCF estimate uses mid-point of company outlook.
31
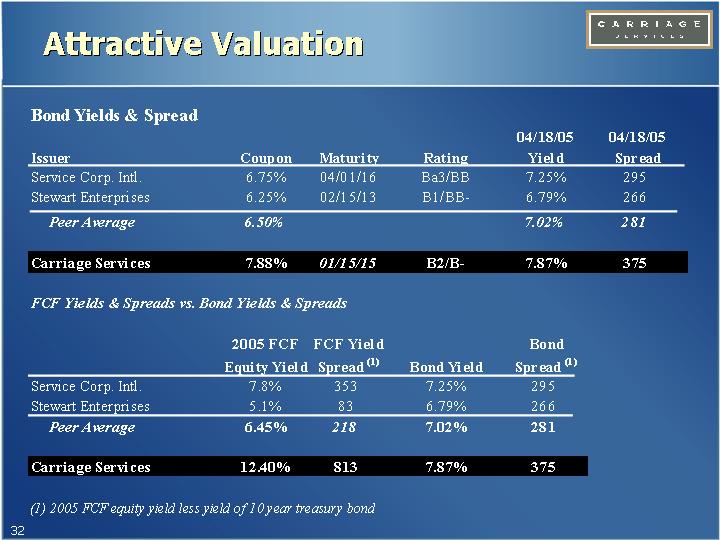
Bond Yields & Spread
| | | | | | | | 04/18/05 | | 04/18/05 | |
Issuer | | Coupon | | Maturity | | Rating | | Yield | | Spread | |
Service Corp. Intl. | | 6.75 | % | 04/01/16 | | Ba3/BB | | 7.25 | % | 295 | |
Stewart Enterprises | | 6.25 | % | 02/15/13 | | B1/BB- | | 6.79 | % | 266 | |
Peer Average | | 6.50 | % | | | | | 7.02 | % | 281 | |
| | | | | | | | | | | |
Carriage Services | | 7.88 | % | 01/15/15 | | B2/B- | | 7.87 | % | 375 | |
FCF Yields & Spreads vs. Bond Yields & Spreads
| | 2005 FCF
Equity Yield | | FCF Yield
Spread (1) | | Bond Yield | | Bond
Spread (1) | | | |
Service Corp. Intl. | | 7.8 | % | 353 | | 7.25 | % | 295 | | | |
Stewart Enterprises | | 5.1 | % | 83 | | 6.79 | % | 266 | | | |
Peer Average | | 6.45 | % | 218 | | 7.02 | % | 281 | | | |
| | | | | | | | | | | |
Carriage Services | | 12.40 | % | 813 | | 7.87 | % | 375 | | | |
(1) 2005 FCF equity yield less yield of 10 year treasury bond
32
Key Investment Considerations
• Dominant Market Presence - Carriage has #1 or #2 market share positions in over 70% of its markets
• Superior Profitability - Carriage has the second highest gross profit and EBITDA margins of the public death care companies
• Strong and Flexible Capital Structure - With low cost, long-term liabilities
• Predictable and Growing Free Cash Flow
• Small is Beautiful - Small size enables material performance increase from future acquisitions
• Substantial Long-Term Appreciation Potential – Due to small share count and ability to use FCF for growth versus issuing equity or debt
• Attractive Valuation
33
Presentation of Financial Information
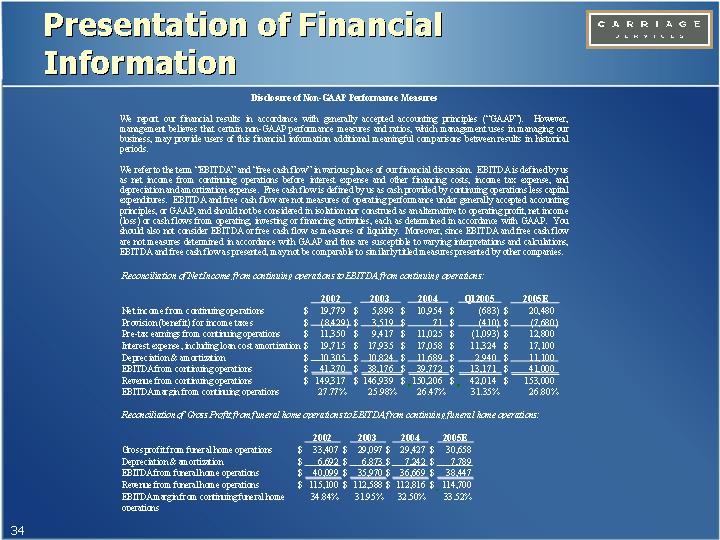
Disclosure of Non-GAAP Performance Measures
We report our financial results in accordance with generally accepted accounting principles (“GAAP”). However, management believes that certain non-GAAP performance measures and ratios, which management uses in managing our business, may provide users of this financial information additional meaningful comparisons between results in historical periods.
We refer to the term “EBITDA” and “free cash flow” in various places of our financial discussion. EBITDA is defined by us as net income from continuing operations before interest expense and other financing costs, income tax expense, and depreciation and amortization expense. Free cash flow is defined by us as cash provided by continuing operations less capital expenditures. EBITDA and free cash flow are not measures of operating performance under generally accepted accounting principles, or GAAP, and should not be considered in isolation nor construed as an alternative to operating profit, net income (loss) or cash flows from operating, investing or financing activities, each as determined in accordance with GAAP. You should also not consider EBITDA or free cash flow as measures of liquidity. Moreover, since EBITDA and free cash flow are not measures determined in accordance with GAAP and thus are susceptible to varying interpretations and calculations, EBITDA and free cash flow as presented, may not be comparable to similarly titled measures presented by other companies.
Reconciliation of Net Income from continuing operations to EBITDA from continuing operations:
| | 2002 | | 2003 | | 2004 | | Q12005 | | 2005E | |
Net income from continuing operations | | $ | 19,779 | | $ | 5,898 | | $ | 10,954 | | $ | (683 | ) | $ | 20,480 | |
Provision (benefit) for income taxes | | $ | (8,429 | ) | $ | 3,519 | | $ | 71 | | $ | (410 | ) | $ | (7,680 | ) |
Pre-tax earnings from continuing operations | | $ | 11,350 | | $ | 9,417 | | $ | 11,025 | | $ | (1,093 | ) | $ | 12,800 | |
Interest expense, including loan cost amortization | | $ | 19,715 | | $ | 17,935 | | $ | 17,058 | | $ | 11,324 | | $ | 17,100 | |
Depreciation & amortization | | $ | 10,305 | | $ | 10,824 | | $ | 11,689 | | $ | 2,940 | | $ | 11,100 | |
EBITDA from continuing operations | | $ | 41,370 | | $ | 38,176 | | $ | 39,772 | | $ | 13,171 | | $ | 41,000 | |
Revenue from continuing operations | | $ | 149,317 | | $ | 146,939 | | $ | 150,206 | | $ | 42,014 | | $ | 153,000 | |
EBITDA margin from continuing operations | | 27.77 | % | 25.98 | % | 26.47 | % | 31.35 | % | 26.80 | % |
Reconciliation of Gross Profit from funeral home operations to EBITDA from continuing funeral home operations:
| | 2002 | | 2003 | | 2004 | | 2005E | |
Gross profit from funeral home operations | | $ | 33,407 | | $ | 29,097 | | $ | 29,427 | | $ | 30,658 | |
Depreciation & amortization | | $ | 6,692 | | $ | 6,873 | | $ | 7,242 | | $ | 7,789 | |
EBITDA from funeral home operations | | $ | 40,099 | | $ | 35,970 | | $ | 36,669 | | $ | 38,447 | |
Revenue from funeral home operations | | $ | 115,100 | | $ | 112,588 | | $ | 112,816 | | $ | 114,700 | |
EBITDA margin from continuing funeral home operations | | 34.84 | % | 31.95 | % | 32.50 | % | 33.52 | % |
34
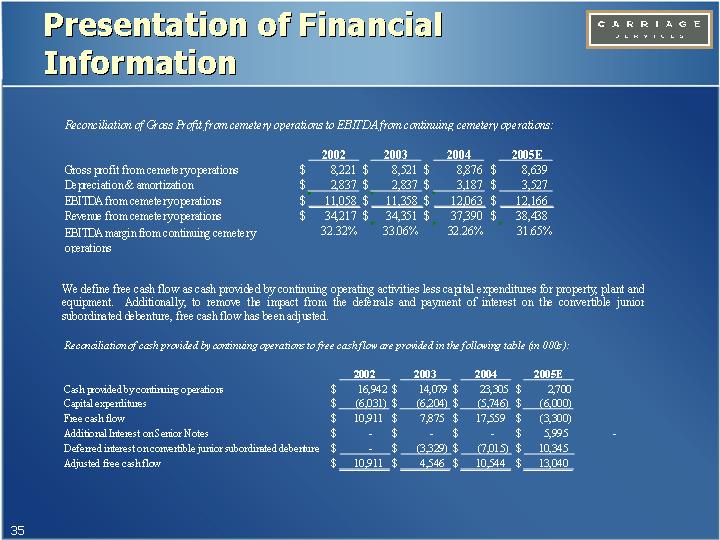
Reconciliation of Gross Profit from cemetery operations to EBITDA from continuing cemetery operations:
| | 2002 | | 2003 | | 2004 | | 2005E | |
Gross profit from cemetery operations | | $ | 8,221 | | $ | 8,521 | | $ | 8,876 | | $ | 8,639 | |
Depreciation & amortization | | $ | 2,837 | | $ | 2,837 | | $ | 3,187 | | $ | 3,527 | |
EBITDA from cemetery operations | | $ | 11,058 | | $ | 11,358 | | $ | 12,063 | | $ | 12,166 | |
Revenue from cemetery operations | | $ | 34,217 | | $ | 34,351 | | $ | 37,390 | | $ | 38,438 | |
EBITDA margin from continuing cemetery operations | | 32.32 | % | 33.06 | % | 32.26 | % | 31.65 | % |
We define free cash flow as cash provided by continuing operating activities less capital expenditures for property, plant and equipment. Additionally, to remove the impact from the deferrals and payment of interest on the convertible junior subordinated debenture, free cash flow has been adjusted.
Reconciliation of cash provided by continuing operations to free cash flow are provided in the following table (in 000s):
| | 2002 | | 2003 | | 2004 | | 2005E | |
Cash provided by continuing operations | | $ | 16,942 | | $ | 14,079 | | $ | 23,305 | | $ | 2,700 | |
Capital expenditures | | $ | (6,031 | ) | $ | (6,204 | ) | $ | (5,746 | ) | $ | (6,000 | ) |
Free cash flow | | $ | 10,911 | | $ | 7,875 | | $ | 17,559 | | $ | (3,300 | ) |
Additional Interest on Senior Notes | | $ | — | | $ | — | | $ | — | | $ | 5,995 | |
Deferred interest on convertible junior subordinated debenture | | $ | — | | $ | (3,329 | ) | $ | (7,015 | ) | $ | 10,345 | |
Adjusted free cash flow | | $ | 10,911 | | $ | 4,546 | | $ | 10,544 | | $ | 13,040 | |
35
[LOGO]
Carriage Services
(NYSE: CSV)
2005 Merrill Lynch Deathcare Conference
April 21, 2005