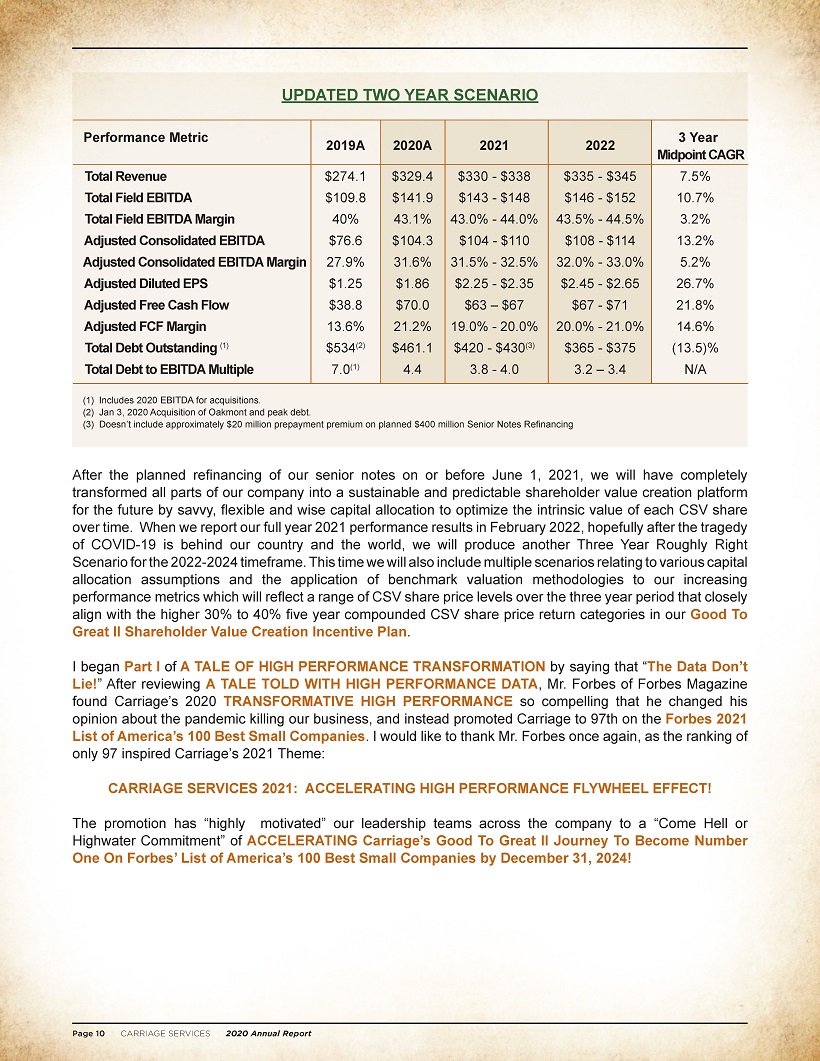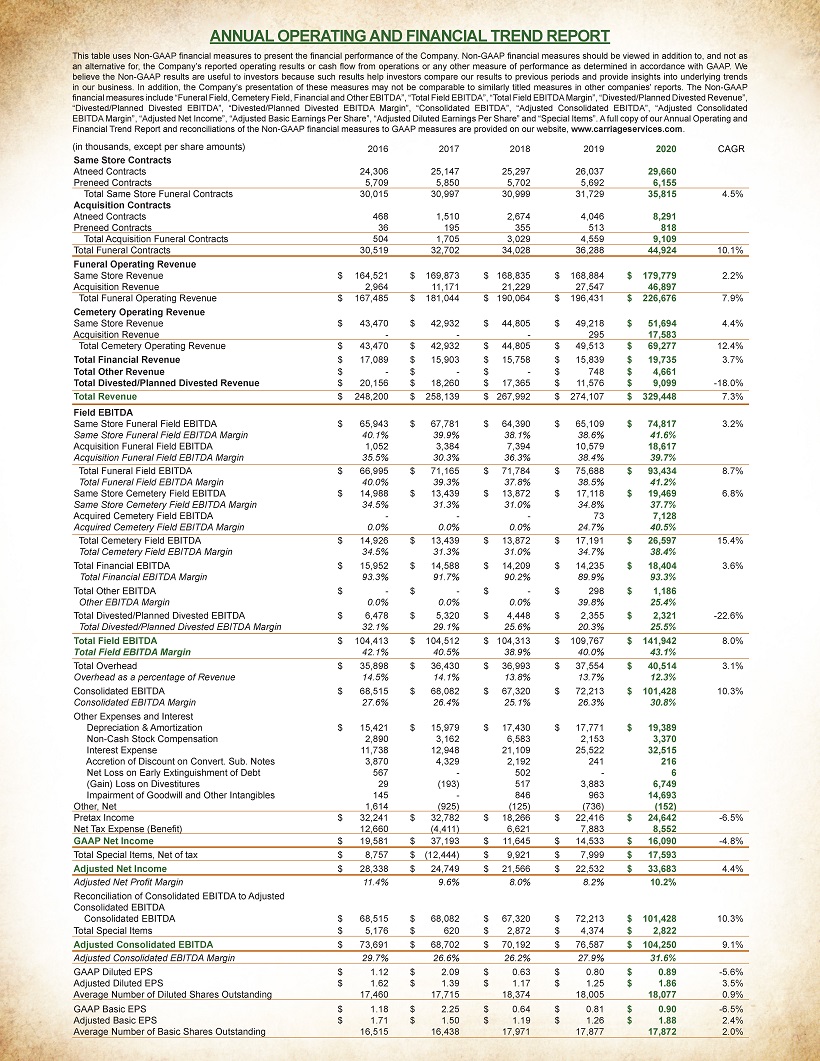
ANNUAL OPERATING AND FINANCIAL TREND REPORT
This table uses Non-GAAP financial measures to present the financial performance of the Company. Non-GAAP financial measures should be viewed in addition to, and not as an alternative for, the Company’s reported operating results or cash flow from operations or any other measure of performance as determined in accordance with GAAP. We believe the Non-GAAP results are useful to investors because such results help investors compare our results to previous periods and provide insights into underlying trends in our business. In addition, the Company’s presentation of these measures may not be comparable to similarly titled measures in other companies’ reports. The Non-GAAP financial measures include “Funeral Field, Cemetery Field, Financial and Other EBITDA”, “Total Field EBITDA”, “Total Field EBITDA Margin”, “Divested/Planned Divested Revenue”,
“Divested/Planned Divested EBITDA”, “Divested/Planned Divested EBITDA Margin”, “Consolidated EBITDA”, “Adjusted Consolidated EBITDA”, “Adjusted Consolidated EBITDA Margin”, “Adjusted Net Income”, “Adjusted Basic Earnings Per Share”, “Adjusted Diluted Earnings Per Share” and “Special Items”. A full copy of our Annual Operating and
Financial Trend Report and reconciliations of the Non-GAAP financial measures to GAAP measures are provided on our website, www.carriageservices.com.
(in thousands, except per share amounts)
2016 2017 2018 2019 2020 CAGR
Same Store Contracts
Atneed Contracts 24,306 25,147 25,297 26,037 29,660
Preneed Contracts 5,709 5,850 5,702 5,692 6,155
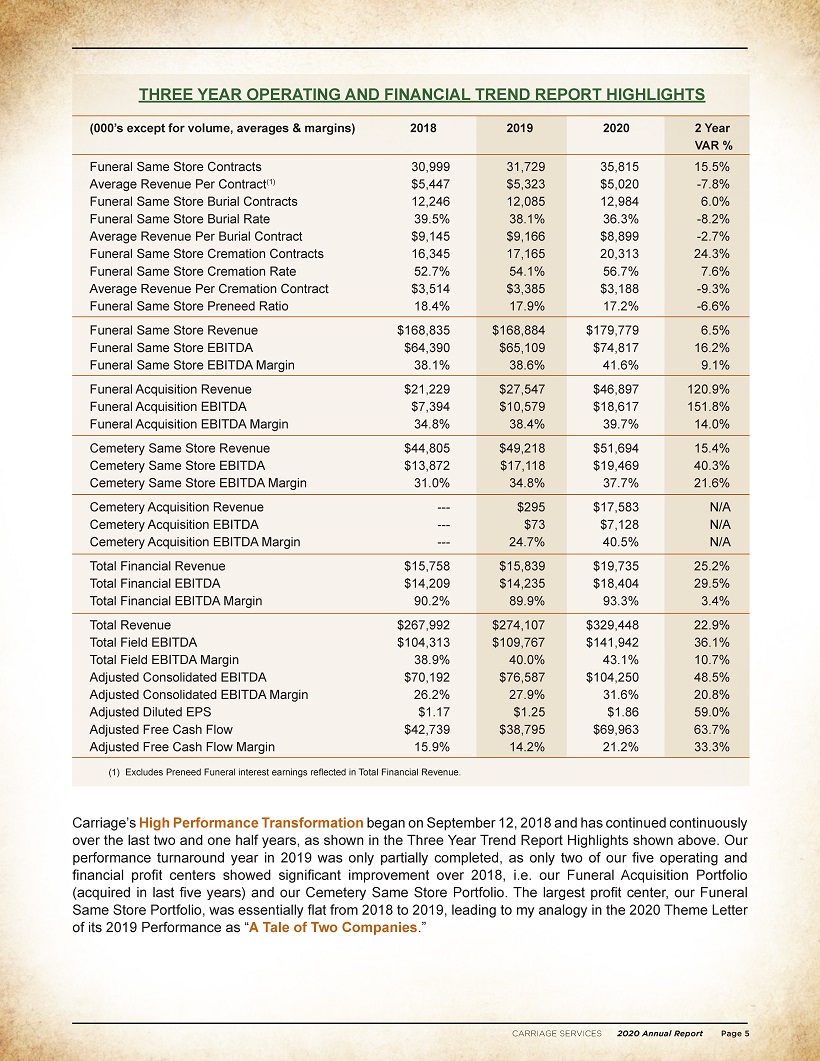
Total Same Store Funeral Contracts 30,015 30,997 30,999 31,729 35,815 4.5%
Acquisition Contracts
Atneed Contracts 468 1,510 2,674 4,046 8,291
Preneed Contracts 36 195 355 513 818
Total Acquisition Funeral Contracts 504 1,705 3,029 4,559 9,109
Total Funeral Contracts 30,519 32,702 34,028 36,288 44,924 10.1%
Funeral Operating Revenue
Same Store Revenue $ 164,521 $ 169,873 $ 168,835 $ 168,884 $ 179,779 2.2%
Acquisition Revenue 2,964 11,171 21,229 27,547 46,897
Total Funeral Operating Revenue $ 167,485 $ 181,044 $ 190,064 $ 196,431 $ 226,676 7.9%
Cemetery Operating Revenue
Same Store Revenue $ 43,470 $ 42,932 $ 44,805 $ 49,218 $ 51,694 4.4%
Acquisition Revenue - - 295 17,583
Total Cemetery Operating Revenue $ 43,470 $ 42,932 $ 44,805 $ 49,513 $ 69,277 12.4%
Total Financial Revenue $ 17,089 $ 15,903 $ 15,758 $ 15,839 $ 19,735 3.7%
Total Other Revenue $ - $ - $ - $ 748 $ 4,661
Total Divested/Planned Divested Revenue $ 20,156 $ 18,260 $ 17,365 $ 11,576 $ 9,099 -18.0%
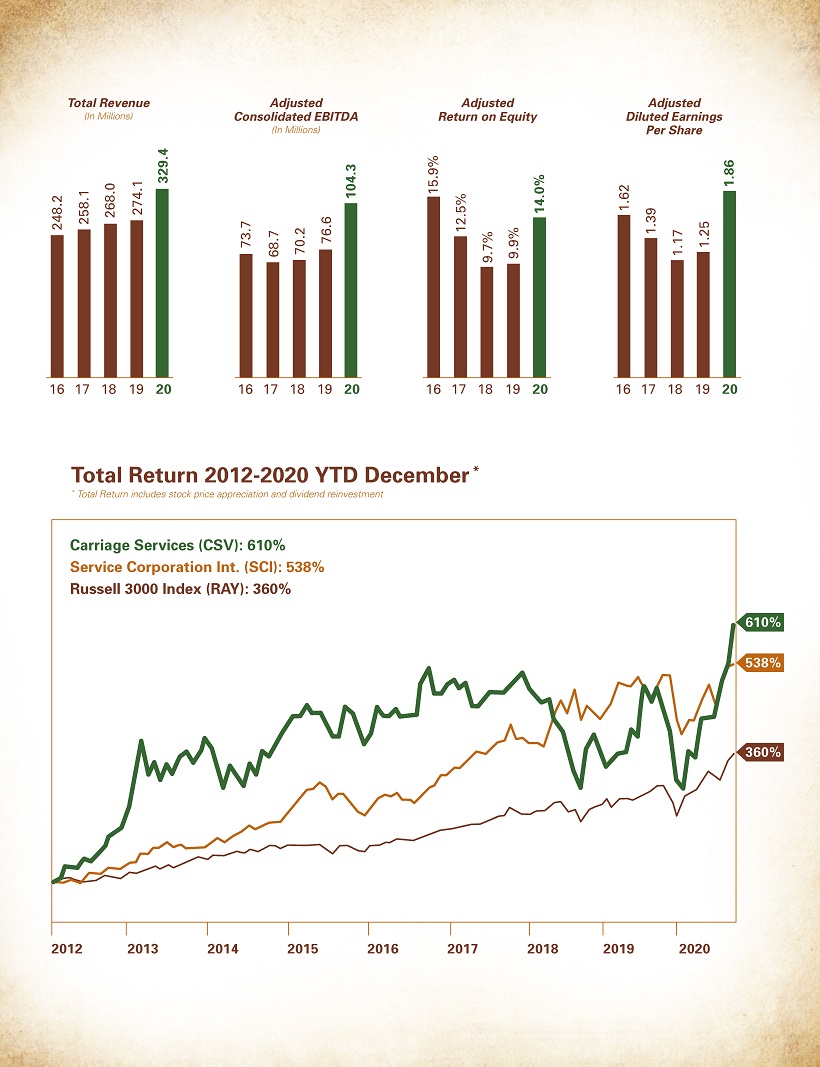
Total Revenue $ 248,200 $ 258,139 $ 267,992 $ 274,107 $ 329,448 7.3%
Field EBITDA
Same Store Funeral Field EBITDA $ 65,943 $ 67,781 $ 64,390 $ 65,109 $ 74,817 3.2%
Same Store Funeral Field EBITDA Margin 40.1% 39.9% 38.1% 38.6% 41.6%
Acquisition Funeral Field EBITDA 1,052 3,384 7,394 10,579 18,617
Acquisition Funeral Field EBITDA Margin 35.5% 30.3% 36.3% 38.4% 39.7%
Total Funeral Field EBITDA $ 66,995 $ 71,165 $ 71,784 $ 75,688 $ 93,434 8.7%
Total Funeral Field EBITDA Margin 40.0% 39.3% 37.8% 38.5% 41.2%
Same Store Cemetery Field EBITDA $ 14,988 $ 13,439 $ 13,872 $ 17,118 $ 19,469 6.8%
Same Store Cemetery Field EBITDA Margin 34.5% 31.3% 31.0% 34.8% 37.7%
Acquired Cemetery Field EBITDA - - 73 7,128
Acquired Cemetery Field EBITDA Margin 0.0% 0.0% 0.0% 24.7% 40.5%
Total Cemetery Field EBITDA $ 14,926 $ 13,439 $ 13,872 $ 17,191 $ 26,597 15.4%
Total Cemetery Field EBITDA Margin 34.5% 31.3% 31.0% 34.7% 38.4%
Total Financial EBITDA $ 15,952 $ 14,588 $ 14,209 $ 14,235 $ 18,404 3.6%
Total Financial EBITDA Margin 93.3% 91.7% 90.2% 89.9% 93.3%
Total Other EBITDA $ - $ - $ - $ 298 $ 1,186
Other EBITDA Margin 0.0% 0.0% 0.0% 39.8% 25.4%
Total Divested/Planned Divested EBITDA $ 6,478 $ 5,320 $ 4,448 $ 2,355 $ 2,321 -22.6%
Total Divested/Planned Divested EBITDA Margin 32.1% 29.1% 25.6% 20.3% 25.5%
Total Field EBITDA $ 104,413 $ 104,512 $ 104,313 $ 109,767 $ 141,942 8.0%
Total Field EBITDA Margin 42.1% 40.5% 38.9% 40.0% 43.1%
Total Overhead $ 35,898 $ 36,430 $ 36,993 $ 37,554 $ 40,514 3.1%
Overhead as a percentage of Revenue 14.5% 14.1% 13.8% 13.7% 12.3%
Consolidated EBITDA $ 68,515 $ 68,082 $ 67,320 $ 72,213 $ 101,428 10.3%
Consolidated EBITDA Margin 27.6% 26.4% 25.1% 26.3% 30.8%
Other Expenses and Interest
Depreciation & Amortization $ 15,421 $ 15,979 $ 17,430 $ 17,771 $ 19,389
Non-Cash Stock Compensation 2,890 3,162 6,583 2,153 3,370
Interest Expense 11,738 12,948 21,109 25,522 32,515
Accretion of Discount on Convert. Sub. Notes 3,870 4,329 2,192 241 216
Net Loss on Early Extinguishment of Debt 567 - 502 - 6
(Gain) Loss on Divestitures 29 (193) 517 3,883 6,749
Impairment of Goodwill and Other Intangibles 145 - 846 963 14,693
Other, Net 1,614 (925) (125) (736) (152)
Pretax Income $ 32,241 $ 32,782 $ 18,266 $ 22,416 $ 24,642 -6.5%
Net Tax Expense (Benefit) 12,660 (4,411) 6,621 7,883 8,552
GAAP Net Income $ 19,581 $ 37,193 $ 11,645 $ 14,533 $ 16,090 -4.8%
Total Special Items, Net of tax $ 8,757 $ (12,444) $ 9,921 $ 7,999 $ 17,593
Adjusted Net Income $ 28,338 $ 24,749 $ 21,566 $ 22,532 $ 33,683 4.4%
Adjusted Net Profit Margin 11.4% 9.6% 8.0% 8.2% 10.2%
Reconciliation of Consolidated EBITDA to Adjusted
Consolidated EBITDA
Consolidated EBITDA $ 68,515 $ 68,082 $ 67,320 $ 72,213 $ 101,428 10.3%
Total Special Items $ 5,176 $ 620 $ 2,872 $ 4,374 $ 2,822
Adjusted Consolidated EBITDA $ 73,691 $ 68,702 $ 70,192 $ 76,587 $ 104,250 9.1%
Adjusted Consolidated EBITDA Margin 29.7% 26.6% 26.2% 27.9% 31.6%
GAAP Diluted EPS $ 1.12 $ 2.09 $ 0.63 $ 0.80 $ 0.89 -5.6%
Adjusted Diluted EPS $ 1.62 $ 1.39 $ 1.17 $ 1.25 $ 1.86 3.5%
Average Number of Diluted Shares Outstanding 17,460 17,715 18,374 18,005 18,077 0.9%
GAAP Basic EPS $ 1.18 $ 2.25 $ 0.64 $ 0.81 $ 0.90 -6.5%
Adjusted Basic EPS $ 1.71 $ 1.50 $ 1.19 $ 1.26 $ 1.88 2.4%
Average Number of Basic Shares Outstanding 16,515 16,438 17,971 17,877 17,872 2.0%