QuickLinks -- Click here to rapidly navigate through this document
UNITED STATES
SECURITIES AND EXCHANGE COMMISSION
Washington, D.C. 20549
FORM 10-K
ANNUAL REPORT PURSUANT TO SECTION 13 OR 15(d) OF
THE SECURITIES EXCHANGE ACT OF 1934
For the fiscal year ended December 31, 2007
Commission File Number: 0-21123
![]()
SRS LABS, INC.
(Exact name of registrant as specified in its charter)
| Delaware (State of incorporation) | 33-0714264 (I.R.S. Employer Identification No.) | |
2909 Daimler Street, Santa Ana, California (Address of principal executive offices) | 92705 (Zip Code) |
(949) 442-1070
(Registrant's telephone number, including area code)
Securities registered pursuant to Section 12(b) of the Act:
| Title of each class | Name of each exchange on which registered | |
|---|---|---|
| Common Stock, Par Value $0.001 Per Share | The NASDAQ Stock Market LLC (NASDAQ Global Market) |
Indicate by check mark if the registrant is a well-known seasoned issuer, as defined in Rule 405 of the Securities Act. Yes o No ý
Indicate by check mark if the registrant is not required to file reports pursuant to Section 13 or Section 15(d) of the Act. Yes o No ý
Indicate by check mark whether the registrant (1) has filed all reports required to be filed by Section 13 or 15(d) of the Securities Exchange Act of 1934 during the preceding 12 months (or for such shorter period that the registrant was required to file such reports), and (2) has been subject to such filing requirements for the past 90 days. Yes ý No o
Indicate by check mark if disclosure of delinquent filers pursuant to Item 405 of Regulation S-K (§229.405 of this chapter) is not contained herein, and will not be contained, to the best of registrant's knowledge, in definitive proxy or information statements incorporated by reference in Part III of this Form 10-K or any amendment to this Form 10-K. o
Indicate by check mark whether the registrant is a large accelerated filer, an accelerated filer, a non-accelerated filer, or a smaller reporting company. See the definitions of "large accelerated filer," "accelerated filer" and "smaller reporting company" in Rule 12b-2 of the Exchange Act. (Check one):
| Large accelerated filer o | Accelerated filer ý | Non-accelerated filer o (Do not check if a smaller reporting company) | Smaller reporting company o |
Indicate by check mark whether the registrant is a shell company (as defined in Rule 12b-2 of the Exchange Act). Yes o No ý
The aggregate market value of the registrant's voting common stock held by non-affiliates of the registrant was approximately $130,931,104 (computed using the closing price of $9.75 per share of common stock on June 30, 2007, as reported by the NASDAQ Stock Market).
As of March 4, 2008, 16,946,377 shares of the registrant's common stock, par value $0.001 per share, were outstanding. Of that amount, 1,167,662 shares were held as treasury shares.
DOCUMENTS INCORPORATED BY REFERENCE
Portions of the registrant's definitive proxy statement prepared in connection with the Annual Meeting of Stockholders to be held in 2008 are incorporated by reference in Part III of this Form 10-K.
SRS LABS, INC.
Annual Report on Form 10-K
Table of Contents
| | | Page | ||
|---|---|---|---|---|
PART I | ||||
Item 1. | Business | 3 | ||
Item 1A. | Risk Factors | 11 | ||
Item 1B. | Unresolved Staff Comments | 15 | ||
Item 2. | Properties | 15 | ||
Item 3. | Legal Proceedings | 15 | ||
Item 4. | Submission of Matters to a Vote of Security Holders | 15 | ||
PART II | ||||
Item 5. | Market for Registrant's Common Equity, Related Stockholder Matters and Issuer Purchases of Equity Securities | 16 | ||
Item 6. | Selected Financial Data | 19 | ||
Item 7. | Management's Discussion and Analysis of Financial Condition and Results of Operation | 20 | ||
Item 7A. | Quantitative and Qualitative Disclosures About Market Risk | 31 | ||
Item 8. | Financial Statements and Supplementary Data | 31 | ||
Item 9. | Changes in and Disagreements With Accountants on Accounting and Financial Disclosure | 31 | ||
Item 9A. | Controls and Procedures | 32 | ||
Item 9B. | Other Information | 33 | ||
PART III | ||||
Item 10. | Directors, Executive Officers and Corporate Governance | 34 | ||
Item 11. | Executive Compensation | 34 | ||
Item 12. | Security Ownership of Certain Beneficial Owners and Management and Related Stockholder Matters | 34 | ||
Item 13. | Certain Relationships and Related Transactions, and Director Independence | 34 | ||
Item 14. | Principal Accounting Fees and Services | 34 | ||
PART IV | ||||
Item 15. | Exhibits and Financial Statement Schedule | 35 | ||
Signatures | 40 | |||
As used herein, the "Company," "SRS Labs," "SRS," "we," "us," or "our" means SRS Labs, Inc., its wholly-owned subsidiary, SRSWOWcast.com, Inc., and, for the applicable periods, its former subsidiary, ValenceTech Limited (collectively with its direct and indirect wholly-owned subsidiaries, "Valence"), and the former joint venture with Coming Home Studios LLC, CHS/SRS LLC. SRS®, Circle Surround®, Circle Surround II™, Circle Surround Automotive™, SRS Xspace 3D™, SRS WOW™, SRS WOW XT™, SRS WOW HD™, SRS TruBass®, SRS FOCUS®, SRS Headphone™, SRS DialogClarity™, SRS TruSurround® XT, TruSurround® HD, SRS 3D® Sound, SRS CS Auto™, VIP™, TruSurround HD4™ and SRS VolumeIQ™ are our United States of America trademarks. All other trademarks and trade names appearing are the property of their respective owners.
SPECIAL NOTE REGARDING FORWARD-LOOKING STATEMENTS
Some of the statements in this Annual Report on Form 10-K contain forward-looking statements regarding our assumptions, projections, expectations, targets, intentions or beliefs about future events, which involve risks and uncertainties. All statements other than statements of historical facts included in this Annual Report, including statements relating to expectation of future financial performance and capital requirements, continued growth, changes in economic conditions or capital markets, changes in customer usage patterns and preferences and the impact of recent accounting pronouncements, are forward-looking statements. In some cases, you can identify forward-looking statements by terms such as may, will, should, expect, plan, intend, forecast, anticipate, believe, estimate, predict, potential, continue or the negative of these terms or other comparable terminology. The forward-looking statements contained in this Annual Report involve known and unknown risks, uncertainties and situations that may cause our or our industry's actual results, level of activity, performance or achievements to be materially different from any future results, levels of activity, performance or achievements expressed or implied by these statements. Factors that might cause actual events or results to differ materially from those indicated by these forward-looking statements may include the matters listed in this Annual Report, including, but not limited to, those listed under "Risk Factors" in Item 1A.
2
Overview
We are a leading developer and provider of audio and voice technology solutions for the home entertainment, portable media device, personal telecommunications, personal computer, automotive, and broadcast markets. Prior to September 29, 2006, we were also a developer and provider of application specific integrated circuits and standard integrated circuits through our formerly wholly-owned subsidiary, Valence.
Licensing: Our operations are conducted through SRS Labs, Inc., the parent company, and its wholly-owned subsidiary, SRSWOWcast.com, Inc. Our business is focused on developing and licensing audio, voice and surround sound technology solutions to many of the world's leading original equipment manufacturers ("OEMs"), software providers and semiconductor companies, and licensing and marketing hardware and software products for the Internet and professional audio markets.
Discontinued Operations:
Valence: Through our formerly wholly-owned subsidiary, Valence, we operated a fabless semiconductor business which developed, designed and marketed standard and custom analog integrated circuits, digital signal processors, and mixed signal integrated circuits primarily to OEMs and original design manufacturers ("ODMs") in the Asia Pacific region.
On February 23, 2006, our Board of Directors (the "Board") approved a plan to sell Valence in order to focus management's attention and financial resources on our licensing business. On July 14, 2006, we entered into a definitive Sale and Purchase Agreement to sell Valence to Noblehigh Enterprises Inc. The sale transaction was completed on September 29, 2006 and, accordingly, the results of the operations of Valence through the date of sale are included as discontinued operations in the accompanying consolidated statements of operations for all periods presented.
CHS/SRS LLC: In September 2004, we entered into a strategic alliance with Coming Home Studios LLC ("CHS") to use and promote SRS Labs' technologies, to promote CHS productions and to promote each company's respective brands. In connection with the strategic alliance, SRS and CHS established a joint venture, CHS/SRS, LLC (the "Joint Venture"), to produce and distribute nine concert videos featuring our Circle Surround technology. On February 23, 2006, the Board authorized management to take all reasonable steps to divest our entire equity interest in the Joint Venture. On June 30, 2006, we completed the sale of our interest in the Joint Venture to CHS and, accordingly, the results of the operations of the Joint Venture through the date of sale are included as discontinued operations in the accompanying consolidated statements of operations for all periods presented.
Further financial information for mix of revenues by market sectors, geographic areas and customer concentration is included in this Annual Report on Form 10-K under "Item 8. Financial Statements and Supplemental Data" and in Notes 1 and 8 to the Notes to Consolidated Financial Statements. Reference also is made to "Item 1A. Risk Factors" for a discussion relating to certain risks relating to our business.
We were incorporated in the State of California on June 23, 1993 and reincorporated in the State of Delaware on June 28, 1996. Our executive offices are located at 2909 Daimler Street, Santa Ana, California 92705. Our telephone number is (949) 442-1070.
Our Products and Technologies
Our licensing business is focused on developing and marketing audio rendering, voice and surround sound technologies to OEMs, ODMs, semiconductor manufacturers, and software providers in the home entertainment, portable media devices, personal computers, personal telecommunications and
3
automotive markets. Our portfolio of licensable technologies includes a wide range of techniques for the processing and delivery of audio, voice and surround sound, including the following:
- •
- Surround Sound—Our surround sound technology, Circle Surround, is a complete encoding and decoding format. Circle Surroundencoding enables the distribution of up to 6.1 channels of audio over existing two-channel carriers such as digital media files, standard definition and high-definition television, FM radio and CDs. Circle Surrounddecoding decodes Circle Surround encoded material for multi-channel playback or creates up to 6.1 channels of audio from older formats of material, including mono, stereo, 4-channel surround or other matrix surround formats. Circle Surround decoding is available in three solutions: Circle Surround, Circle Surround II and Circle Surround Automotive.
- •
- Audio Rendering—Our audio rendering technologies optimize device audio output and enable the presentation of 3D and multichannel audio content over two speakers. These technologies include the ability to render 5.1 multichannel content over two speakers, to create a wider sound stage for more natural audio, to improve the perceived bass response in small speakers, to dynamically position audio sources in a virtual 3D space using headphones, and to reposition the audio image for non-optimally placed speakers. Our audio technologies include SRS Xspace 3D, SRS WOW, SRS WOW XT, SRS WOW HD, SRS TruBass, SRS FOCUS, SRS Headphone, SRS DialogClarity, SRS TruSurround XT, TruSurround HD, TruSurround HD4, VolumeIQ, SRS 3D Sound and SRS CS Auto.
- •
- Voice Processing—Our VIP and Noise Reduction technologies dramatically reduce noise to produce a much clearer and crisper dialog over wireless communication devices and improve the intelligibility of the human voice in a variety of listening situations, including high ambient background environments.
Our portfolio of technologies addresses a broad spectrum of product applications within the vertical markets that we have targeted. Our technologies may be implemented in a variety of methods, including discrete analog components, chip modules, analog semiconductors, DSPs and software. These various implementation options offer customers flexibility when incorporating our technologies into products.
Our Customers and Markets
We license our technologies throughout the Western Hemisphere, the Asia Pacific region and in Europe. The following table presents our revenue by geographic area. Licensing-related revenue is summarized based on the location of the licensee's corporate headquarters. For product and online sales, revenue is allocated to the Americas.
| | Years Ended December 31, | |||||||||||||||||
|---|---|---|---|---|---|---|---|---|---|---|---|---|---|---|---|---|---|---|
| | 2007 | % | 2006 | % | 2005 | % | ||||||||||||
| Geographic Area Revenue: | ||||||||||||||||||
| Korea | $ | 7,834,730 | 42 | % | $ | 5,652,550 | 30 | % | $ | 3,980,660 | 27 | % | ||||||
| Japan | 7,346,548 | 39 | 8,115,378 | 44 | 5,564,809 | 38 | ||||||||||||
| Americas | 1,837,096 | 9 | 1,534,421 | 8 | 2,024,269 | 14 | ||||||||||||
| Greater China | 1,649,591 | 9 | 3,165,572 | 17 | 2,763,646 | 19 | ||||||||||||
| Europe | 183,975 | 1 | 79,608 | 1 | 275,094 | 2 | ||||||||||||
| Total | $ | 18,851,940 | 100 | % | $ | 18,547,529 | 100 | % | $ | 14,608,478 | 100 | % | ||||||
Through our licensing business, we market our portfolio of technologies to the following markets: home entertainment, portable media devices, personal computers, personal telecommunications and automotive. Our license agreements typically have multi-year or automatic renewal terms, and either require per-unit royalty payments for all products implementing our technologies or provide for fixed
4
annual or quarterly royalty payments. The license agreements also generally specify the use of our trademarks and logos on the product, within the packaging and in the user's manual, and require our review and approval of the product to guarantee the quality of the technology implementation and the correct usage of our logos and trademarks. We believe these terms ensure the quality and consistency of the technology and elevate the awareness of the SRS brand in the marketplace. Most of our licensing agreements do not have volume requirements and may be terminated by the licensees or us without substantial financial penalty.
The following chart shows the percentage of our licensing revenue we received in 2007 and 2006 from each of these markets.
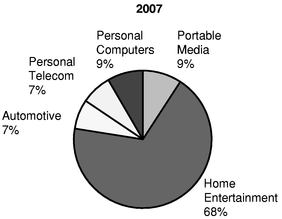 | 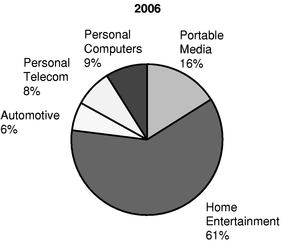 |
Home Entertainment
Home entertainment products represent the largest current market for our technologies and have in recent years been the largest revenue contributor. Manufacturers in this market utilize our technologies to differentiate their products from their competitors while improving functionality and product performance. In many instances, manufacturers license multiple technologies from us for multiple product lines and divisions. Product categories within this market include HD televisions (such as LCD and Plasma televisions), set-top boxes, DVD players, audio/video receivers, and complete home-theater-in-a-box systems.
Televisions. Our audio technologies are widely used by television manufacturers as a differentiating feature and as a solution to audio challenges that manufacturers encounter. As television makers continue to migrate from bulky tube models to thinner digital displays, manufacturers are finding that they have less room for speakers, which may compromise the overall audio quality of the television. We provide manufacturers with patented solutions for accurately presenting surround sound, improving bass response, increasing dialog clarity, and creating a more natural sound stage. These solutions improve the audio quality of the television set without the expense of additional equipment or larger speakers. In 2007, our technologies continued to grow in popularity for use in flat panel televisions from companies such as LG, Samsung, Panasonic and Toshiba. During 2007, we signed contracts to provide audio enhancement technologies to Beko, Vestel, Profilo and Sharp, among others.
DVD Players and Set-top Boxes. Although they present surround sound content, DVD players and set-top boxes are typically connected to televisions with two-channel speakers. Our SRS TruSurround XT technology creates a surround sound experience over any existing two-speaker system, including the internal speakers of a television. This technology also creates a virtual surround experience from stereo material.
5
Portable Media
MP3 players and other portable media players enable consumers to enjoy audio and video content while on the go. The audio contents are stored in a compressed industry standard MP3 audio standard. As such, when the contents are decoded and played back through miniature earphones, the contents generally suffer loss of audio quality. Our technologies, such as SRS WOW and SRS WOW HD, are capable of improving the audio quality during playback. Our Mobile HD technologies also enable rendering of surround sound through earphones when playing back surround sound encoded contents often used along with contemporary video contents. Associated with the increasing popularity of MP3 players, there has been a noticeable growth in the market for accessories, such as docking stations and miniature speaker systems. The small footprint of these devices limits speaker size and speaker spacing. Our solutions enable vendors of these devices to increase the quality of their audio output generally without increasing hardware component costs.
Personal Computers
Personal computers ("PCs") in the home are often used as media hubs. Through PCs, users can enjoy and manage collections of music and movies, along with downloaded and recorded television programming. This content is now being distributed through the home using networked media adapter products. Throughout these systems, there is a need for optimizing playback on the computer speakers, presenting a home theater experience on a laptop, transmitting surround sound around the home, and enjoying content on headphones. We believe our technology solutions are well positioned to fill these needs.
Personal Telecommunications
We provide the personal telecommunications market with both voice and audio rendering technologies. Mobile phones are incorporating more multimedia features and functionality at a rapid pace. New services include digital music downloads, ring-tones and true-tones, streaming video, gaming and television viewing. Our strong presence in the home entertainment market, our suite of voice technologies, and our entry into the mobile market with customers like NEC present growth opportunities for us. Our solutions address specific needs in the mobile market. For example, our technologies address needs like voice intelligibility in noisy environments, clarity of dialog in video content, poor bass-response of small speakers, hampered stereo imaging in narrow-set speakers, and 3D positioning audio for interactive gaming. Our technologies are licensed by telecommunications companies such as Motorola, Samsung, Pantech and NEC.
Automotive
We have invested in research to create solutions specific to the needs of the automotive market. Within vehicles, audio and video content is played from multiple sources and then presented on both speakers and headphones. Stereo content from sources like CDs, MP3 players, mobile television and high definition radio needs to be presented on all speakers in the car, some of which may not be optimally placed and may not have strong bass response. Surround sound content from DVDs, radio and downloaded music needs to be rendered on both car speakers with a maximum sweet spot and on rear-seat headphones. Our automotive solutions such as SRS CS Auto, SRS Circle Surround II and SRS TruSurround XT meet these needs and provide manufacturers in this segment with a fully tunable solution. Our technologies are licensed by companies such as Fujitsu-ten, Panasonic, Clarion and Kenwood and used on automobiles manufactured by companies such as Toyota, Subaru, Nissan and Honda.
Customer Concentration
For fiscal year 2007, Samsung accounted for approximately 28% of our consolidated revenues. For fiscal year 2006, Samsung and Sony accounted for approximately 17% and 11% of our consolidated
6
revenues, respectively. For fiscal year 2005, Samsung and Sony each accounted for approximately 13% of our consolidated revenues. Given the significant amount of revenues derived from these customers, the loss of any such customer or the uncollectibility of related receivables could have a material adverse effect on our consolidated financial condition and consolidated results of operations. During 2007, we were informed by Sony that they were no longer using our technology in the majority of their televisions. We are working with Sony to re-establish this relationship; however, we cannot guarantee that we will be successful in regaining any significant business from Sony.
Our Strategy
Our sales strategy is to identify high-growth markets, develop needed technology solutions and features, and work with software and semiconductor platform partners to make these technologies widely available and easy to implement by OEMs and ODMs. We believe that we will continue to strengthen our market position as a leader in audio and voice technology by employing the strategy of providing a stream of patented audio and voice technologies, penetrating new licensing accounts, expanding relationships with existing licensees, creating a broad platform of software and semiconductor partners, and developing strong awareness of the SRS brand.
The mission of our licensing platform efforts is to achieve broad coverage for our technology solutions within all of our targeted product markets in order to expand sales and licensing opportunities. By developing strong relationships with leading software and semiconductor companies, we believe our audio technologies can be delivered to customers worldwide across high growth and high volume product applications.
We work together with our platform partners (leading semiconductor manufacturers and middleware or firmware software providers) to provide our mutual customers with the technology that best fits their needs. We also together solicit other new customers to consider using the platform. Many times, a platform will become enabled with our technology due to customer requests.
As a technology licensing company, the strength of our brand is an important asset. Since brand recognition drives licensing sales, we have invested in strategies designed to increase consumer awareness of SRS Labs with the ultimate goal of establishing our brand with both product manufacturers and consumers around the world as the symbol for high-quality audio. The three primary vehicles that we use to further the proliferation of our brand are: (a) placement of the SRS logo by OEMs on products and in co-marketing programs; (b) online branding programs; and (c) use, and recognition of use, of SRS technology by content and broadcast professionals.
OEM Marketing Programs. In the majority of products that use SRS technologies, our logo is either prominently displayed on the product itself or, in the case of software products and mobile phones, featured in the graphical user interface. We believe this logo exposure is a key tool in reaching consumers worldwide. In addition, we work with our OEM customers as they launch new products that feature SRS technologies. We supply complete SRS corporate and technology tool kits with a wide array of material, including SRS logos, illustrations, technology explanations and suggested demonstration material. In 2006 and 2007, for example, we worked with Sharper Image to prominently display products with the SRS logo in their retail stores, catalogs, SkyMall magazines and on their website.
Online Branding. Online exposure has also been an important part of our branding strategy. One benefit of our relationship with Microsoft is that the SRS logo displayed in the audio control panel of Microsoft's Windows Media Player links to an SRS technology page. As a result, we have received significant traffic and opportunities to create brand awareness with consumers and educate consumers on the benefits of our technology. Our online efforts also include the direct sale of plug-ins for Windows Media Player. Revenue from the sale of these products has not been significant, but gives us a valuable demonstration platform to showcase our audio technologies.
7
Use of SRS Technology by Content and Broadcast Professionals. We develop, license and sell professional hardware and software products to enable content companies, broadcasters and music publishers to encode their material using our Circle Surround technology. When Circle Surround is professionally used, the logo is often displayed within the content itself, on the packaging material or, in the case of radio, an announcement that the broadcast is being delivered in Circle Surround. We have concentrated on three key market sectors in the professional audio space: television, radio and music; and we have developed a line of hardware and software products to address these markets. These products are sold directly to professional customers and are also available from selected dealers and distributors servicing the professional audio and broadcast markets. We did not generate significant revenue from the sale of professional hardware equipment in 2007; however, we believe that these facilitate the licensing of our technology to OEMs that benefit from enhanced audio transmissions.
Sales and Marketing
We have two primary types of revenue agreements with our licensees—bundled or non-bundled. Under a bundled agreement, royalty revenue may be collected by our platform partner, who bundles our technology within their solution, at the time the chip is sold to an OEM or ODM. The platform partner remits the royalty to us on behalf of the licensee. Most often, however, we license our technologies to OEMs and ODMs under non-bundled agreements and collect revenue directly from them. These licensing arrangements with OEMs or ODMs authorize them to design, build and sell products containing our technology. Under this licensing approach, the licensees are free to choose a semiconductor solution from the platform partner that best suits their technical and cost requirements. We receive royalties directly from the licensed OEM or ODM for the use of our technologies in licensed products manufactured and shipped by the OEM or ODM. Many major OEMs have licenses or purchase products manufactured by a licensed ODM for the use of one or more of our technologies and for the use and display of our trademarks.
Our process for selecting particular platform partners for distributing our technology is based on several criteria including: (a) segment leadership—we target platform partners that hold preeminent positions in market segments characterized by high growth, volume and/or margins; (b) volume—we seek platforms that will maximize exposure of our technologies to a large number of potential OEMs; (c) synergy—we seek platforms which serve to position our technologies along with compatible and additive technologies for integrated delivery; and (d) convergence potential—we target arrangements that will enable us to establish a presence on platforms that intersect merging functional features. An example of this convergence would be the platforms for new personal multifunctional devices that include mobile phone, personal digital assistant and music capabilities.
To implement our licensing sales strategy within our identified markets, we have established a direct sales force and an international network of independent sales agents. In North America, we employ a direct sales force to market our portfolio of audio and voice technologies to the OEM community. Internationally, we maintain offices in Japan, Hong Kong, Taiwan, China, Spain and Korea to support our multi-national OEM customers. We actively promote the use of our trademarks and logos and direct customers to prominently display the appropriate SRS technology logo on products and packaging and in advertising. We work closely with our licensees to enhance their success in selling finished products and semiconductor products that incorporate our technologies through a variety of licensee support programs. These programs include engineering support, sales training, tradeshow support, publicity and media relations programs, customized marketing materials, advertising, speaking engagements and industry conferences. Where possible, we use the Internet to provide technology demonstrations. We conduct in-person technology demonstrations or presentations for the press and other companies to promote our technologies and products.
We also regularly participate in tradeshows and conferences to increase awareness of our technologies and to market our technologies and products. We work closely with our licensees and platform partners to actively explore additional opportunities to place our technologies in new products and/or markets.
8
Research and Development
We license our products in markets that are characterized by rapidly changing technology and continuous improvements in products and services. Our research and development expenditures in 2007, 2006 and 2005 were $3,107,482, $2,572,577 and $2,224,237, respectively. These expenses generally consist of salaries and related costs of employees and consultants engaged in ongoing research, design and development activities and costs for engineering materials and supplies.
As of December 31, 2007, we had 15 employees in our research and development group, representing 36% of our total employees. Our software, hardware and application engineers focus on developing intellectual property, technology solutions and consumer products. All engineers are based in the U.S. and support our licensing business.
Competition
Competition in the audio, voice and surround sound technology licensing business includes other licensing companies who offer competing technologies as well as the internal engineering departments of our current or prospective licensees, who may develop audio technologies for use in their own products.
In the field of audio improvement, we compete directly with other audio providers, including Dolby, DTS, BBE Sound, Emersys and Qsound. Our 3D positional audio technology directly competes with technologies from QSound and Synoptic. We believe that our bass technology, SRS TruBass, competes directly with several technologies, including MaxxBass from Waves, Ltd, Vi.B.E from Spatializer, and non-proprietary bass systems, such as Bass Boost, that are included on a variety of electronics products, including televisions, portable stereos and speaker products. Additionally, many of our OEM customers maintain their own audio improvement technologies. Because our audio technologies work with any existing recorded material, whether mono, stereo or surround sound, most of our audio technologies, including SRS 3D, SRS FOCUS, SRS TruBass and SRS DialogClarity, can be used either as an alternative or as a complement to most competing audio technologies. Our surround sound rendering technologies compete primarily with Dolby Virtual Speaker, and our surround sound format competes directly with the Dolby ProLogic technologies. However, our surround sound decoders and renderers are compatible with third party content formats.
Many companies in the wireless and telecommunications industry are investigating methods to increase the quality of a voice signal, but we believe that their development work focuses on techniques to reduce noise and provide echo cancellation. Our voice technology, VIP, processes the actual voice signal to improve intelligibility.
In the broadcast and professional audio markets, our Circle Surround technology competes directly with surround sound formats from Dolby and DTS, which market professional products for the encoding and creation of multichannel content. Both of these companies have more established reputations, greater technical, sales, marketing and distribution capabilities and stronger brand presence in the movie/cinema, television broadcast and music recording segments of professional audio. These competitors also have established or may establish strategic relationships with potential customers of our Circle Surround technology, which may affect our customers' decisions to purchase products or license technology from us.
Many of our competitors have, or may have, substantially greater resources than us to devote to advancing their existing technologies and developing new products and technologies. We believe that we compete based primarily on the quality and performance of our proprietary technologies, brand name awareness, the ease and cost of implementing our technologies, the ability to meet OEMs' needs to differentiate their products, and the strength of our licensee relationships. We believe we compete
9
favorably based on these factors; however, we cannot guarantee that we will continue to be competitive with the existing or future products or technologies of our competitors.
Intellectual Property Rights and Proprietary Information
We operate in industries where innovation, investment in new ideas and protection of intellectual property rights are important for success. We rely on a variety of intellectual property protections for our products and services, including patent, copyright, trademark and trade secret laws and contractual obligations. We pursue a policy of enforcing such rights. We cannot guarantee, however, that our intellectual property rights will adequately protect our competitive position or that competitors will not be able to produce non-infringing competitive products or services. We cannot guarantee that third parties will not assert infringement claims against us, or that if required to obtain any third party licenses as a result of an infringement dispute, we will be able to obtain such licenses.
In order to protect the underlying technology concepts, we have filed and/or obtained patents for all of our marketed technologies including technologies marketed under the trademarks SRS, TruSurround, TruSurround XT, SRS FOCUS, Circle Surround, Circle Surround II, SRS WOW, VIP and SRS TruBass. In addition, we have numerous issued patents and patents pending for speaker and other acoustic reproduction technologies. We pursue a general practice of filing patent applications for our technologies in the United States and various foreign countries where our licensees manufacture, distribute or sell licensed products. We continue to update and add new applications to our patent portfolio to address changing worldwide market conditions and our new technological innovations. The range of expiration dates for our patents extend between the years 2008 to 2016. We have multiple patents covering unique aspects and improvements for many of our technologies. Accordingly, the expiration of any single patent may not significantly affect our intellectual property position or the ability to generate licensing revenue.
We also routinely file U.S. federal and foreign trademark applications for the various word names and logos used to market our technology solutions to licensees and the general public. The duration of the U.S. and foreign registered trademarks can typically be maintained indefinitely, provided that proper maintenance fees are paid and the trademarks are continually used or licensed by us.
Seasonality
Due to the dependence on the consumer electronics market, we experience seasonal fluctuation in sales and earnings. In particular, we believe that our business experiences seasonality relating to the holiday season, resulting in higher revenues in the fourth and first quarters. We have moved toward diversifying our key market segments in the consumer electronics industry in an effort to reduce the impact of our seasonal fluctuations.
Employees
As of December 31, 2007, we employed 42 persons, including 10 in finance and administration, 15 in research and development, engineering and product development, and 17 in sales and marketing. None of our employees are covered by a collective bargaining agreement or are presently represented by a labor union. We have not experienced any labor problems or a work stoppage and believe we have good relations with our employees.
Available Information
Our Internet address iswww.srslabs.com. Our annual report on Form 10-K, quarterly reports on Form 10-Q, current reports on Form 8-K, and any amendments to those reports, are available free of charge, on our website as soon as reasonably practicable after we electronically file such material with or furnish it to the Securities and Exchange Commission ("SEC"). Our SEC reports can be accessed
10
through the investor relations section of our website. The information found on our website is not incorporated in and is not part of this or any other report we file with or furnish to the SEC.
You should carefully consider the risk factors described below, as well as the other information included in this Annual Report on Form 10-K, prior to making a decision to invest in our securities. The risks and uncertainties described below are not the only ones facing our company. Additional risks and uncertainties not presently known or that we currently believe to be less significant may also adversely affect us.
We are exposed to risks in our licensing business related to product and customer concentration.
Currently, we generate a majority of our revenue in the home theater market, principally through the inclusion of SRS technology inside LCD and Plasma televisions, and set-top boxes. We expect that the consumer home entertainment market will continue to account for a significant portion of our licensing revenues for the foreseeable future. While consumer spending in general on consumer electronic products has increased, retail prices for certain consumer electronics products that include our audio technology, have decreased significantly. We expect that this trend will continue for the foreseeable future. In addition, from time to time, certain of our OEM and semiconductor manufacturer customers may account for a significant portion of our revenues. For example, for the year ended December 31, 2007, Samsung accounted for approximately 28% of our consolidated revenues. These manufacturers could develop their own technologies or decide to exclude our audio rendering technology from their products altogether in an effort to reduce cost. The loss of any key customer could have a material adverse affect on our financial condition and results of operations.
Our business is highly dependent on the consumer electronics market, which is characterized by short product life cycles, fluctuations in demand and seasonality, and is subject to risks related to product transitions and supply of other components.
The consumer electronics market is characterized by intense competition, rapidly evolving technology, and ever-changing consumer preferences. These factors result in the frequent introduction of new products, short product life cycles and significant price competition. As a result, we may need to develop new products or technologies to integrate with the new products and technologies developed by our customers. If we are unable to develop the necessary technologies to meet the changing needs of our customers or provide such technologies at competitive prices, our customers may reduce their use of our technologies and our revenues may decline. In addition, the dynamic nature of this market limits our, as well as our customers,' ability to accurately forecast quarterly and annual sales. If we, or our customers, are unable to adequately manage product transitions, our business and results of operations could be negatively affected.
Pricing pressures on the consumer electronics product manufacturers, who incorporate our technologies into their products, could limit the licensing fees we charge for our technologies, which could reduce our revenues.
The markets for the consumer electronics products in which our technologies are incorporated are intensely competitive and price sensitive. Retail prices for consumer electronics products that include our technologies, have decreased significantly, and we expect prices to continue to decrease for the foreseeable future. In response, manufacturers have sought to reduce their product costs, which can result in downward pressure on the licensing fees we charge our customers who incorporate our technologies into their products. Alternatively, our customers may seek to eliminate our technologies in their products in favor of internally developed technologies. A decline in the licensing fees we charge could materially and adversely affect our operating results.
11
We face intense competition from companies with greater brand recognition and resources.
The digital audio, consumer electronics and entertainment markets are intensely competitive, subject to rapid change, and significantly affected by new product introductions and other market activities of industry participants
Many of our current and potential competitors enjoy substantial competitive advantages, including:
- •
- greater name recognition;
- •
- a longer operating history;
- •
- more developed distribution channels and deeper relationships with consumer electronics products designers and manufacturers;
- •
- a more extensive customer base;
- •
- broader product and service offerings;
- •
- greater resources for competitive activities, such as research and development, strategic acquisitions, alliances, joint ventures, sales and marketing, and lobbying industry and government standards; and
- •
- more technicians and engineers.
As a result, these current and potential competitors may be able to respond more quickly and effectively than we can to new or changing opportunities, technologies, standards, or customer requirements.
We are subject to risks associated with substantial international operations.
We conduct sales and customer support operations in a number of countries throughout the world that require refinement to adapt to the changing market conditions on a regional basis. In addition, many of our significant customers are headquartered in the Asia Pacific region, particularly Japan and Korea. Approximately 90%, 91% and 84% of our revenues were derived from customers with headquarters located in the Asia Pacific markets during the years ended December 31, 2007, 2006 and 2005, respectively. We expect to continue to derive a significant portion of our revenues from sales to customers in these markets for the foreseeable future. Also, a substantial number of products incorporating our technologies are manufactured, assembled and tested by third parties in Asia. As a result, we are subject to a number of risks of conducting business outside of the United States, any of which could have a material adverse impact on our business and results of operations, including:
- •
- political, social and economic instability, and the risk of war, terrorist activities or other international incidents in Asia and elsewhere abroad;
- •
- difficulties and costs of staffing and managing foreign operations;
- •
- unexpected changes in, or impositions of, government requirements;
- •
- adverse changes in tariffs and other protectionist laws and business practices that favor local competitors;
- •
- potentially longer payment cycles and greater difficulty in collecting receivables from foreign entities;
- •
- the burdens of complying with a variety of non-U.S. laws and reduced protection of our intellectual property in some countries;
12
- •
- potentially adverse tax consequences and the complexities of foreign value added tax systems; and
- •
- other factors beyond our control, including natural disasters and major health concerns.
Our ability to generate revenues and meet with customers may be affected by widespread illness.
Widespread illnesses such as the SARS illness and the Avian Influenza, or Asia Bird Flu, could impact our operations or our consumer electronics licensee's operations. For example, our ability to visit our customers, our ability to conduct sales meetings or presentations, and our ability to sell through rates of electronics products to end consumers may be dramatically affected by either widespread or perceived potential illnesses.
If the sale of consumer electronics products incorporating our technologies does not grow in emerging markets, our ability to increase our licensing revenue may be limited.
We also expect that growth in our licensing revenue will depend, in part, upon the growth of sales of consumer electronics products incorporating our technologies in other countries, including China and India, as consumers in these markets have more disposable income and are increasingly purchasing entertainment products with surround sound capabilities. These countries have rapidly expanding and growing economies that are less mature than economies of other regions in which we derive significant portions of our revenue. Because of this, changes to employment patterns, currency fluctuations and political uncertainties could impact our ability to grow our licensing revenue in these regions.
We have a long and unpredictable sales cycle, which can result in uncertainty and delays in generating additional revenues.
Historically, because of the complexity of our technologies, it can take a significant amount of time and effort to explain the benefits of our technologies to potential new customers and to negotiate a sale. For example, it typically takes six to nine months after our first contact with a prospective customer before we start licensing our technology to that customer. In addition, purchases of our products are usually made in connection with new design starts by our customers, the timing of which is outside of our control. Accordingly, we may be unable to predict accurately the timing of any significant future sales of our products. We may also spend substantial time and management attention on potential license agreements that are not consummated, or in which the consumer electronic product ultimately does not sell in large quantities, thereby foregoing other higher revenue opportunities.
If our patents and other intellectual property rights do not adequately protect our products, we may lose market share to our competitors and be unable to operate our business profitably.
Our ability to compete may be affected by our ability to protect our proprietary information. We have filed numerous U.S. and foreign patent applications and to date have a number of issued U.S. and foreign patents covering various aspects of our technologies. We cannot guarantee that the steps taken by us to protect our intellectual property will be adequate to prevent misappropriation of our technology or that our competitors will not independently develop technologies that are substantially equivalent or superior to our technology. In addition, the laws of certain foreign countries may not protect our intellectual property rights to the same extent as do the laws of the U.S. It is possible that third parties may assert claims or initiate litigation against us or our customers with respect to existing or future products. In addition, we may initiate claims or litigation against third parties for infringement of our proprietary rights or to determine the scope and validity of our proprietary rights. Claims and litigation brought against us or initiated by us could be costly and time consuming and could divert our management from our business.
13
If we lose the services of our key personnel, or if we are unable to attract and retain other key personnel, we may not be able to manage our operations or meet our growth objectives.
Our future success depends to a large extent upon the continued service of key personnel, including engineering, sales and administrative staff. We anticipate that any future growth will require us to recruit and hire a number of new personnel in engineering, operations, finance, sales and marketing. Competition for such personnel can be intense, and it is possible that we may not be able to recruit and retain necessary personnel to operate our business and support future growth.
The market price of our common stock is volatile and your investment in our common stock could suffer a decline in value.
The trading price of our common stock has been, and will likely continue to be, subject to wide fluctuations in response to quarterly variations in our operating results, announcements of new products or technological innovations by us or our competitors, strategic alliances between us and third parties, general market fluctuations and other events and factors. Changes in earnings estimates made by brokerage firms and industry analysts relating to the markets in which we do business, or relating to us specifically, have in the past resulted in, and could in the future result in, an immediate and adverse effect on the market price of the common stock. Even though our stock is quoted on the NASDAQ Global Market, our stock has had and may continue to have low trading volume and high volatility. The historically low trading volume of our stock makes it more likely that a severe fluctuation in volume, either up or down, will significantly impact the stock price. Because of the relatively low trading volume of our stock, our stockholders may have difficulty selling our common stock.
Our certificate of incorporation and bylaws as well as Delaware law contain provisions that could discourage transactions resulting in a change in control, which may negatively affect the market price of our common stock.
Our certificate of incorporation, our bylaws and Delaware law contain provisions that might enable our management to discourage, delay or prevent a change in control. In addition, these provisions could limit the price that investors would be willing to pay in the future for shares of our common stock.
14
Item 1B. Unresolved Staff Comments.
None.
Our worldwide headquarters are located in Santa Ana, California, in a 23,400 square foot facility consisting of office and warehouse space. The lease for the facility is scheduled to expire on May 31, 2008. We intend to renew the lease at such time. We lease this facility from Daimler Commerce Partners, L.P., the general partner of which is Conifer Investments, Inc ("Conifer"). The sole shareholders of Conifer are Thomas C.K. Yuen, our Chairman, Chief Executive Officer and President, and his spouse, Misako Yuen, as co-trustees of the Thomas Yuen Family Trust. Mr. and Mrs. Yuen also serve as the executive officers of Conifer. Mr. and Mrs. Yuen, as co-trustees of the trust, beneficially own a significant amount of our outstanding shares of common stock. We paid the Daimler Commerce Partners rent of $230,256, $230,256 and $222,066 in 2007, 2006 and 2005, respectively. We believe the terms and conditions of the lease are competitive based on a review of similar properties in the area with similar terms and conditions.
Our worldwide headquarters house personnel responsible for the development of our technologies and the administration of the licensing business. We believe that our current facilities are adequate to support our current requirements.
On June 8, 2007, we sent a letter to Sony Corporation ("Sony") relating to the possible infringement of several SRS patents by Sony's S-Force technology. Sony responded to the letter by filing a Complaint for Declaratory Relief in the U.S. District Court in the Southern District of New York on July 6, 2007. In November 2007, Sony and SRS entered into a standstill agreement for the purpose of conducting discussions towards an amicable resolution of the dispute and the Complaint for Declaratory Relief was dismissed. We are unable to determine at this time the impact that this matter may have, if any, on our consolidated financial position, results of operations or cash flows. From time to time we may be involved in other litigation matters and disputes arising in the normal course of business. Any such matters and disputes could be costly and time consuming, subject us to damages or equitable remedies, and divert our management and key personnel from our business operations.
Item 4. Submission of Matters to a Vote of Security Holders
None.
15
Item 5. Market for Registrant's Common Equity, Related Stockholder Matters and Issuer Purchases of Equity Securities
Market for Common Stock
Our common stock trades on the NASDAQ Global Market under the symbol "SRSL". The table below reflects the high and low sales prices of our common stock as reported by The NASDAQ Stock Market for the periods indicated.
| | High | Low | ||||
|---|---|---|---|---|---|---|
| Fiscal 2007 | ||||||
| First Quarter | $ | 14.06 | $ | 9.09 | ||
| Second Quarter | $ | 15.70 | $ | 9.00 | ||
| Third Quarter | $ | 11.89 | $ | 6.91 | ||
| Fourth Quarter | $ | 7.65 | $ | 5.10 | ||
Fiscal 2006 | ||||||
| First Quarter | $ | 6.72 | $ | 5.11 | ||
| Second Quarter | $ | 6.32 | $ | 4.60 | ||
| Third Quarter | $ | 6.25 | $ | 4.39 | ||
| Fourth Quarter | $ | 11.63 | $ | 5.80 | ||
At March 4, 2008, the closing sale price our common stock was $4.22 per share.
Holders
At March 4, 2008, there were 401 stockholders of record.
Dividend Policy
We have never paid cash dividends on our common stock. We currently intend to retain our available funds for future growth and, therefore, we do not anticipate paying any dividends in the foreseeable future.
Securities Authorized for Issuance Under Equity Compensation Plans
The following equity compensation plans have been approved by our stockholders: the SRS Labs, Inc. Stock Option, Nonqualified Stock Option and Restricted Stock Purchase Plan (the "1993 Plan"), the SRS Labs, Inc. Amended and Restated 1996 Long-Term Incentive Plan (the "1996 Plan"), the SRS Labs, Inc. Amended and Restated 1996 Non-employee Directors' Stock Option Plan (the "Non-employee Directors Plan") and the SRS Labs, Inc. 2006 Stock Incentive Plan (the "2006 Plan"). A description of the material features of each of these plans is included in Note 7 to the Notes to Consolidated Financial Statements under the caption "Stock Award/Option Plans/Warrants." No options have been granted under the 1993 Plan since June 7, 1996. The 1993 Plan expired on December 10, 2003 and no options or other rights to acquire equity are outstanding under that plan. On June 22, 2006, our stockholders voted to approve the 2006 Plan, and to discontinue the issuance of any awards under the 1996 Plan. We do not have any equity compensation plans other than those approved by our stockholders. The following table sets forth information regarding the number of shares of our common stock that may be issued pursuant to our equity compensation plans or arrangements as of December 31, 2007.
16
Equity Compensation Plan Information
| | (a) | (b) | (c) | |||||
|---|---|---|---|---|---|---|---|---|
| Plan category | Number of securities to be issued upon exercise of outstanding options, warrants and rights | Weighted-average exercise price of outstanding options, warrants and rights | Number of securities remaining available for future issuance under equity compensation plans (excluding securities reflected in column(a)) | |||||
| Equity compensation plans approved by security holders | 2,442,868 | (1) | $ | 5.90 | 1,207,340 | (2) | ||
- (1)
- Represents shares of common stock that may be issued pursuant to outstanding options granted under the following plans: 1,692,708 shares under the 1996 Plan, 132,500 shares under the Non-employee Directors Plan and 617,660 shares under the 2006 Plan.
- (2)
- Represents shares of common stock that may be issued pursuant to future grants under the following plans: 325,000 shares under the Non-employee Directors Plan and 882,340 shares under the 2006 Plan.
Issuer Purchases of Equity Securities
On November 6, 2007, we announced that our Board of Directors approved a stock repurchase program. Under the stock repurchase program, we may acquire up to $10.0 million of our outstanding common stock. The stock repurchase program commenced November 12, 2007 and is expected to continue for a six month period. As of December 31, 2007, total purchases under the program since inception were 493,564 shares at an average purchase price of $5.97 per share.
The following table details the repurchases that were made under the program during the three months ended December 31, 2007:
| Period | Total Number of Shares Purchased | Average Price Paid per Share | Total Number of Shares Purchased as Part of Publicly Announced Plans or Programs | Maximum Number (or Approximate Dollar Value) of Shares that May Yet Be Purchased Under the Plans or Programs | |||||||
|---|---|---|---|---|---|---|---|---|---|---|---|
| October 1–October 31 | — | — | — | — | |||||||
| November 1–November 30 | 117,664 | $ | 5.71 | 117,664 | $ | 9,328,700 | |||||
| December 1–December 31 | 375,900 | $ | 6.05 | 375,900 | $ | 7,053,264 | |||||
| Total | 493,564 | $ | 5.97 | 493,564 | $ | 7,053,264 | |||||
17
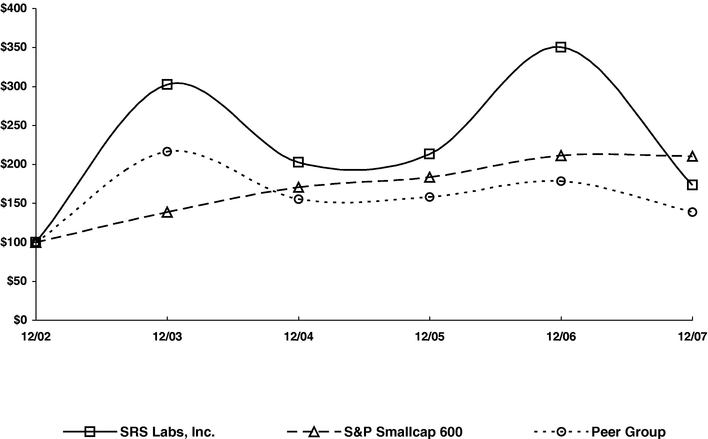
Stock Price Performance Graph
The following graph illustrates a comparison of the total return of our common stock with the total return for the S & P Smallcap 600 Index and a peer group selected by us for the five year period ended December 31, 2007. The comparison assumes $100 was invested on December 31, 2002 in our common stock and in each of the indices shown and assumes that all of the dividends were reinvested.
The comparisons in the table are required by the SEC and are not intended to forecast or be indicative of possible future performance of our common stock. This graph shall not be deemed "filed" for purposes of Section 18 of the Securities Exchange Act of 1934 ("Exchange Act") or otherwise subject to the liabilities under that of 1933 or the Exchange Act.
COMPARISON OF 5 YEAR CUMULATIVE TOTAL RETURN*
Among SRS Labs, Inc., The S&P Smallcap 600 Index
And A Peer Group
- *
- $100 invested on 12/31/02 in stock or index-including reinvestment of dividends. Fiscal year ending December 31.
18
Item 6. Selected Financial Data
The following selected financial information as of and for the dates and periods indicated have been derived from our audited consolidated financial statements. The information set forth below is not necessarily indicative of results of future operations, and should be read in conjunction with "Management's Discussion and Analysis of Financial Condition and Results of Operations" in Part II, Item 7 of this Annual Report on Form 10-K and our consolidated financial statements and related notes included elsewhere in this Report.
| | Years Ended December 31, | |||||||||||||||||
|---|---|---|---|---|---|---|---|---|---|---|---|---|---|---|---|---|---|---|
| | 2007 | 2006 | 2005 | 2004 | 2003 | |||||||||||||
| | (In thousands except per share data) | |||||||||||||||||
| Consolidated Statement of Operations Data: | ||||||||||||||||||
| Revenues | $ | 18,852 | $ | 18,547 | $ | 14,608 | $ | 10,832 | $ | 9,102 | ||||||||
| Cost of sales | 164 | 171 | 236 | 228 | 103 | |||||||||||||
| Gross profit | 18,688 | 18,376 | 14,372 | 10,604 | 8,999 | |||||||||||||
| Operating expenses: | ||||||||||||||||||
| Sales and marketing | 6,718 | 7,345 | 5,192 | 4,550 | 4,193 | |||||||||||||
| Research and development | 3,107 | 2,573 | 2,224 | 2,262 | 1,876 | |||||||||||||
| General and administrative | 5,444 | 5,660 | 5,170 | 4,622 | 4,048 | |||||||||||||
| Total operating expenses | 15,269 | 15,578 | 12,586 | 11,434 | 10,117 | |||||||||||||
| Operating income (loss) | 3,419 | 2,798 | 1,786 | (830 | ) | (1,118 | ) | |||||||||||
| Other income, net | 2,041 | 1,136 | 673 | 595 | 543 | |||||||||||||
| Income (loss) from continuing operations before income taxes | 5,460 | 3,934 | 2,459 | (235 | ) | (575 | ) | |||||||||||
| Income taxes | 46 | 868 | 796 | 523 | 631 | |||||||||||||
| Income (loss) from continuing operations | 5,414 | 3,066 | 1,663 | (758 | ) | (1,206 | ) | |||||||||||
| Discontinued operations: | ||||||||||||||||||
| Income (loss) from discontinued operations, net of income taxes (benefit) | — | 1,017 | (3,087 | ) | 2,337 | 1,665 | ||||||||||||
| Gain on disposal of discontinued operations | — | 625 | — | — | — | |||||||||||||
| Income (loss) from discontinued operations | — | 1,642 | (3,087 | ) | 2,337 | 1,665 | ||||||||||||
| Net income (loss) | $ | 5,414 | $ | 4,708 | $ | (1,424 | ) | $ | 1,579 | $ | 459 | |||||||
| Income (loss) from continuing operations per common share: | ||||||||||||||||||
| Basic | $ | 0.34 | $ | 0.21 | $ | 0.12 | $ | (0.05 | ) | $ | (0.09 | ) | ||||||
| Diluted | $ | 0.32 | $ | 0.20 | $ | 0.11 | $ | (0.05 | ) | $ | (0.09 | ) | ||||||
| Income (loss) from discontinued operations per common share: | ||||||||||||||||||
| Basic | $ | 0.00 | $ | 0.11 | $ | (0.22 | ) | $ | 0.17 | $ | 0.13 | |||||||
| Diluted | $ | 0.00 | $ | 0.11 | $ | (0.22 | ) | $ | 0.15 | $ | 0.12 | |||||||
| Net income (loss) per common share: | ||||||||||||||||||
| Basic | $ | 0.34 | $ | 0.31 | $ | (0.10 | ) | $ | 0.11 | $ | 0.04 | |||||||
| Diluted | $ | 0.32 | $ | 0.30 | $ | (0.10 | ) | $ | 0.10 | $ | 0.03 | |||||||
| Weighted average number of common shares used in the calculation of per share amounts: | ||||||||||||||||||
| Basic | 16,154 | 14,956 | 14,118 | 13,950 | 13,033 | |||||||||||||
| Diluted | 16,990 | 15,466 | 15,199 | 15,781 | 14,421 | |||||||||||||
| Consolidated Balance Sheet Data: | ||||||||||||||||||
| Working capital | $ | 39,272 | $ | 34,697 | $ | 8,849 | $ | 7,192 | $ | 12,335 | ||||||||
| Total assets | 51,383 | 45,049 | 35,065 | 35,502 | 31,491 | |||||||||||||
| Stockholders' equity | 49,007 | 42,744 | 30,813 | 32,431 | 27,950 | |||||||||||||
19
Item 7. Management's Discussion and Analysis of Financial Condition and Results of Operation
Overview
SRS Labs is a leading developer and provider of audio and voice technology solutions for the home entertainment, portable media device, personal telecommunications, personal computer, automotive, and broadcast markets. Prior to September 29, 2006, we also developed and provided application specific integrated circuits and standard integrated circuits through our formerly wholly-owned subsidiary, Valence.
Licensing: Our operations are conducted through SRS Labs, Inc., the parent company, and its wholly-owned subsidiary, SRSWOWcast.com, Inc. Our business is focused on developing and licensing audio, voice and surround sound technology solutions to many of the world's leading OEMs, software providers and semiconductor companies, and license and marketing hardware and software products for the Internet and professional audio markets.
Discontinued Operations:
Valence: Through our formerly wholly-owned subsidiary, Valence, we operated a fabless semiconductor business which developed, designed and marketed standard and custom analog integrated circuits, digital signal processors and mixed signal integrated circuits primarily to OEMs and ODMs in the Asia Pacific region.
On February 23, 2006, our Board approved a plan to sell Valence in order to focus management's attention and financial resources on our licensing business. On July 14, 2006, we entered into a definitive Sale and Purchase Agreement to sell Valence to Noblehigh Enterprises Inc. ("Noblehigh"). The sale transaction was completed on September 29, 2006, and accordingly, the results of the operations of Valence through the date of sale are included as discontinued operations in the accompanying consolidated statement of operations for the years ended December 31, 2006 and 2005.
The sale of Valence to Noblehigh was effected through two simultaneous transactions: (1) the repurchase by Valence of approximately 74% of the outstanding shares of Valence from SRS using its existing cash and (2) the purchase by Noblehigh of the remaining outstanding shares of Valence from SRS for $4.3 million in cash. The sale resulted in a gain on the disposal of discontinued operations of $237,625 in the accompanying consolidated statement of operations for the year ended December 31, 2006.
Additionally, we repurchased from the certain members of management of Valence, who are also owners of Nobelhigh (the "Management Buyers"), 357,625 shares of our common stock, which were obtained through the exercise of vested employee stock options, for an aggregate repurchase price of $2,114,586. Such shares were immediately canceled and are therefore not outstanding as of December 31, 2006. The repurchase price per share paid for such shares was equal to the average closing price of our common stock for the seven trading days ending three days prior to the closing date of the sale of Valence. See Note 11 of our Notes to the Consolidated Financial Statements.
CHS/SRS LLC: In September 2004, we entered into a strategic alliance with Coming Home Studios LLC to use and promote SRS Labs' technologies, to promote CHS productions and to promote each company's respective brands. In connection with the strategic alliance, SRS and CHS established a joint venture, CHS/SRS, LLC, to produce and distribute nine concert videos featuring our Circle Surround technology.
We recorded an asset impairment charge of $3.3 million related to our investment in the Joint Venture in the fourth fiscal quarter of 2005. On February 23, 2006, our Board authorized management to take all reasonable steps to divest our entire equity interest in the Joint Venture. On June 30, 2006, we completed the sale of our interest in the Joint Venture to CHS and, accordingly, the results of the
20
operations of the Joint Venture through the date of sale are included as discontinued operations in the accompanying consolidated statement of operations for the years ended December 31, 2006 and 2005. The sale resulted in a gain on the disposal of discontinued operations of $387,021 in the accompanying consolidated statement of operations for the year ended December 31, 2006. See Note 11 of our Notes to the Consolidated Financial Statements.
Critical Accounting Policies
Our discussion and analysis of our results of operations and liquidity and capital resources are based on our consolidated financial statements, which have been prepared in accordance with accounting principles generally accepted in the United States.
The preparation of these financial statements requires us to make estimates and judgments that affect the reported amounts of assets, liabilities, revenues and expenses, and disclosure of contingent assets and liabilities. We base our estimates on historical and anticipated results and trends and on various other assumptions that we believe are reasonable under the circumstances, including assumptions as to future events. These estimates form the basis for making judgments about the carrying value of assets and liabilities that are not readily apparent from other sources. By their nature, estimates are subject to an inherent degree of uncertainty. Actual results may differ from our estimates.
The following represents a summary of our critical accounting policies, defined as those policies that we believe are: (a) the most important to the portrayal of our financial condition and results of operations, and (b) that require management's most difficult, subjective or complex judgments, often as a result of the need to make estimates about the matters that are inherently uncertain. Our most critical accounting estimates include revenue recognition; valuation of accounts receivable, which impacts operating expenses; valuation of intangible assets and capitalization of software, which primarily impacts operating expenses when we impair assets or accelerate their depreciation; recognition and measurement of current and deferred income tax assets and liabilities, which impacts our tax provision; and stock-based compensation, which impacts operating expenses. We discuss each of these policies below, as well as the estimates and judgments involved. We also have other policies that we consider key accounting policies; however, these policies do not meet the definition of critical accounting estimates, because they do not generally require us to make estimates or judgments that are difficult or subjective.
Revenue Recognition
Royalty revenues associated with ongoing royalty license agreements based on a per unit royalty method are recognized upon receipt of reports from licensees stating the number of products implementing SRS patented technologies on which royalties are due, generally one quarter in arrears. Royalty revenues associated with ongoing royalty license agreements based on a flat fee method are recognized ratably over the term of the contract. Licensing revenues for one-time technology transfer fees are recognized in the period in which the license agreement is consummated and the related technology and passage of title is transferred. We occasionally enter into arrangements under which license fees are prepaid and then recognized either on a per unit or flat fee arrangement basis. In such cases, the prepaid fees are recorded as deferred revenues and recognized as earned.
Accounts Receivable
We perform ongoing credit evaluations of our customers and adjust credit limits based upon payment history, the customer's current credit worthiness and various other factors, as determined by our review of their current credit information. We continuously monitor collections and payments from our customers and maintain allowances for doubtful accounts based upon specific customer circumstances, current economic trends, historical experience and the age of past due receivables.
21
While such credit losses have historically been within our expectations and the provisions established, we cannot guarantee that we will continue to experience the same credit loss rates that we have in the past. Unanticipated changes in the liquidity or financial position of our customers may require additional provisions for doubtful accounts.
Intangible Assets, Capitalization of Software and Impairment of Long-Lived Assets
In accordance with Statement of Financial Accounting Standards ("SFAS") No. 144,Accounting for the Impairment or Disposal of Long-Lived Assets ("SFAS No. 144"), all of our intangible assets that have definite lives are being amortized on a straight-line basis over their estimated useful lives. Costs paid by us related to the establishment and transfer of patents, primarily legal costs, are capitalized and amortized over ten years. We annually evaluate the recoverability of our patents and intangible assets based on the estimated future undiscounted cash flows. Should the carrying value of patents or intangible assets exceed the estimated future undiscounted cash flows for the expected periods of benefit, such assets will be written down to fair value. As discussed further in Note 1 to the Notes to the Consolidated Financial Statements, based upon our most recent assessment as of December 31, 2007, we have determined there was no impairment in the value of our long-lived assets.
Income Taxes
In preparing our consolidated financial statements, we estimate our income taxes in each of the countries in which we operate. The process used to make these estimates includes an assessment of the current tax expense, the results from tax examinations and the effects of temporary differences resulting from the different treatment of transactions for tax and financial accounting purposes. These differences result in deferred tax assets and liabilities, which are included in our consolidated balance sheet. We account for income taxes in accordance with SFAS No. 109,Accounting for Income Taxes ("SFAS No. 109"), which requires that deferred tax assets and liabilities be recognized using enacted tax rates for the effect of temporary differences between the book and tax bases of recorded assets and liabilities. SFAS No. 109 also requires that deferred tax assets be reduced by a valuation allowance if it is more likely than not that some portion or all of the deferred tax asset will not be realized. We evaluate the reliability of our deferred tax assets by assessing our valuation allowance and by adjusting the amount of such allowance, if necessary. At December 31, 2007, we had net deferred tax assets primarily resulting from temporary differences between the book and tax bases of assets and liabilities, and loss and credit carry forwards. We continue to provide a valuation allowance our deferred tax assets based on an assessment of the likelihood of their realization. In reaching our conclusion, we evaluated certain relevant criteria including deferred tax liabilities that can be used to offset deferred tax assets, estimates of future taxable income of appropriate character within the carry-forward period available under the tax law, and tax planning strategies. Our judgments regarding future taxable income may change due to market conditions, changes in U.S. or international tax laws, and other factors. These changes, if any, may require material adjustments to these deferred tax assets, resulting either in a tax benefit, if it is estimated that future taxable income is likely, or a reduction in the value of the deferred tax assets, if it is determined that their value is impaired, resulting in a reduction in net income or an increase in net loss in the period when such determinations are made.
Our income tax provision is based on calculations and assumptions that will be subject to examination by the taxing authorities in the jurisdictions in which we operate. Should the actual results differ from our estimates, we would have to adjust the income tax provision in the period in which the facts and circumstances that give rise to the revision become known. Tax law and rate changes are reflected in the income tax provision in the period in which such changes are enacted.
22
Stock-Based Compensation
On January 1, 2006, we adopted the provisions of SFAS No. 123(R),Share-Based Payment ("SFAS No. 123R") using the modified prospective application transition method. SFAS No. 123R requires measurement of all employee stock-based compensation awards using a fair-value method and recording of such expense in the consolidated financial statements over the requisite service period. Previously, we had applied the provisions of Accounting Principles Board Opinion No. 25,Accounting for Stock Issued to Employees ("APB 25") and related interpretations and elected to utilize the disclosure option of SFAS No. 123,Accounting for Stock-Based Compensation ("SFAS No. 123"). In 2007 and 2006, we recorded stock-based compensation expense of $1,727,017 and $1,460,910, respectively, under the fair-value provisions of SFAS No. 123R, compared to $55,802 in 2005 under the provisions of APB 25 and related interpretations.
To determine the expected term of our employee stock options granted in fiscal 2007, we utilized the simplified approach as defined by SEC Staff Accounting Bulletin No. 107,Share-Based Payment. To determine the risk-free interest rate, we utilized an average interest rate based on U.S. Treasury instruments whose term was consistent with the expected term of our awards. To determine the expected stock price volatility, we examined the historical volatilities for our common stock and those of our peers. See Note 7 ("Stockholders' Equity and Stock-Based Compensation") of our Notes to Consolidated Financial Statements for further discussion.
Results of Operations
The following table sets forth certain consolidated operating data as a percentage of revenues for the years ended December 31, 2007, 2006 and 2005:
| | Years Ended December 31, | |||||||
|---|---|---|---|---|---|---|---|---|
| | 2007 | 2006 | 2005 | |||||
| Revenues | 100 | % | 100 | % | 100 | % | ||
| Cost of sales | 1 | 1 | 2 | |||||
| Gross margin | 99 | 99 | 98 | |||||
| Operating expenses: | ||||||||
| Sales and marketing | 36 | 39 | 36 | |||||
| Research and development | 16 | 14 | 15 | |||||
| General and administrative | 29 | 31 | 36 | |||||
| Total operating expenses | 81 | 84 | 87 | |||||
| Operating income | 18 | 15 | 11 | |||||
| Other income, net | 11 | 6 | 5 | |||||
| Income from continuing operations before income taxes | 29 | 21 | 16 | |||||
| Income taxes | 0 | 5 | 5 | |||||
| Income from continuing operations | 29 | 16 | 11 | |||||
| Discontinued operations: | ||||||||
| Income (loss) from discontinued operations net of income taxes | — | 6 | (21 | ) | ||||
| Gain on disposal of discontinued operations | — | 3 | 0 | |||||
| Income (loss) from discontinued operations | — | 9 | (21 | ) | ||||
| Net income (loss) | 29 | % | 25 | % | (10 | )% | ||
23
Year Ended December 31, 2007 Compared to Year Ended December 31, 2006
Revenues
Total revenues for fiscal 2007 were $18,851,940 compared to $18,547,529 in fiscal 2006, an increase of $304,411, or 2%. This increase was primarily attributable to increases in royalties related to the sales of flat panel televisions and monitors, which grew by $2,699,310, or 31%, and increases in the automotive market, which grew by $275,793, or 26%. The majority of the increases in flat panel televisions and monitors revenues were the direct result of our receipt of larger royalty payments from many of the multinational television OEMs, including Samsung, LG and Toshiba, or their respective chip manufacturers, offset by a decrease in revenues from Sony. Additionally, during the second half of 2007, we established direct relationships with many of the China based TV manufacturers which requires such companies to pay royalties directly to SRS, rather than through an Integrated Chip ("IC") provider. This had a negative impact on our revenues during this time period as royalties were earned at the time that TVs were shipped to retail, rather than when the ICs were shipped to manufacturing. However, we believe that over the long term, having direct relationships with the China based TV manufacturers will have a positive impact on the results of our operations. Additionally, we expect that the global unit volumes of flat panel televisions and monitors will continue to increase in 2008 and for the foreseeable future, albeit at a slower growth rate than has been experienced during the past several years. While we continue to have good relationships with many of the major global television OEMs, we cannot guarantee that we will be successful in growing or maintaining this market of our business. Revenues in the automotive market also increased in 2007 as compared to 2006. This increase was primarily due to increased revenues from several customers in Japan who provide line install, dealer option and after market automotive audio systems to many of the significant Japanese automotive manufactures, including Toyota, Honda, Subaru and Nissan. We expect the revenues in this sector to continue to grow in 2008. Revenues in our portable media devices segment and personal telecommunications segments fell by 39% and 13%, respectively. The decrease in revenue in portable media devices was primarily attributable to the loss of one customer. Revenues from that customer continued in the first and second quarters of fiscal 2006 but no substantive revenues were received from that customer in the third and fourth quarters of 2006 or during the first three quarters of 2007. However, during 2007, we were able to secure a new design win from this customer and started to receive limited royalties during the fourth quarter of 2007. The decrease in personal telecommunications revenues was primarily attributable to one customer who has experienced a decrease in its sales of handset units. We continue to be included in the customer's products; however, sales of these products were at lower levels in 2007 than during 2006. Additionally, although we have received additional design wins at several mobile phone handset makers, to date, none of these relationships are comprehensive in nature and therefore revenues continue to be limited. The following table represents our mix of licensing revenues by market source:
| | Years Ended December 31, | ||||
|---|---|---|---|---|---|
| | 2007 | 2006 | |||
| Home entertainment (TV, set-top box, A/V receiver, DVD) | 68 | % | 61 | % | |
| Portable media devices (digital media player, headphone) | 9 | 16 | |||
| PC (software, hardware) | 9 | 9 | |||
| Personal telecommunications (mobile phone, PDA) | 7 | 8 | |||
| Automotive | 7 | 6 | |||
| 100 | % | 100 | % | ||
24
Sales and Marketing
Sales and marketing expenses consist primarily of employee salaries, sales consultants' fees and related expenses, sales commissions and costs associated with branding activities. Sales and marketing expenses were $6,717,906 for fiscal year 2007, as compared to $7,345,133 for fiscal year 2006. Overall sales and marketing expenses were $627,227, or 9%, lower in fiscal 2007 due in large part to a decrease in headcount and payroll related costs in the marketing department, reduced sales commissions and reduced company wide bonuses. We recorded $495,132 in stock-based compensation expense for sales and marketing personnel during 2007 as compared to $515,762 in 2006. In 2008, we expect to continue to invest in our sales and marketing activities, particularly by hiring additional sales and marketing personnel and increasing our branding efforts. As a percentage of total revenues, sales and marketing expenses decreased from 39% for fiscal year 2006 to 36% for fiscal year 2007.
Research and Development
Research and development expenses consist of salaries and related costs of employees engaged in ongoing research, design and development activities and costs for engineering materials and supplies. Research and development expenses were $3,107,482 for fiscal year 2007, as compared to $2,572,577 for fiscal year 2006. The overall increase in research and development expenses of $534,905, or 21%, was primarily attributable to hiring an additional three engineers in 2007, as well as incurring additional expenditures as a result of expanding our intellectual property portfolio. We recorded $428,516 in stock-based compensation expense for engineering personnel during 2007 as compared to $331,480 in 2006. We expect that research and development expenses will increase substantially in 2008 as we continue to expand our intellectual property portfolio, which we believe is critical to our business, and as we seek to accelerate the implementation of our technology with a greater number of customers and devices. We expect that research and development expenses will continue to fluctuate as a percentage of revenues due to fluctuations in our revenues. As a percentage of total revenues, research and development expenses increased from 14% for fiscal year 2006 to 16% for fiscal year 2007.
General and Administrative
General and administrative expenses consist primarily of employee-related expenses, legal costs associated with the administration of intellectual property, and other professional fees and costs associated with being a publicly held company. General and administrative expenses were $5,443,735 for fiscal year 2007 as compared to $5,660,260 for fiscal year 2006. The overall decrease of $216,525, or 4%, was primarily attributable to a decrease in consultants' fees and costs associated with the separation of our former Chief Financial Officer in the first quarter of 2006, coupled with reduced bonus expense. These decreases in costs were offset partially by an increase in stock-based compensation expense due to stock option grants in 2007. We recorded $803,369 in stock-based compensation expense for corporate employees and directors during 2007 as compared to $512,525 in 2006. As a percentage of total revenues, general and administrative expenses decreased from 31% for fiscal year 2006 to 29% for fiscal year 2007.
Other Income, Net
Other income, net, consists principally of interest income. Other income, net, was $2,041,288 for fiscal year 2007, compared to $1,135,870 for fiscal year 2006, an increase of $905,418 or 80%. This increase was primarily attributable to the increase in interest income due to higher interest rates and higher cash balances.
25
Provision for Income Taxes
The income tax provision for fiscal 2007 was $45,558 compared to $868,203 for fiscal 2006, representing a decrease of $822,645, or 95%. The current year provision consists primarily of estimated sales tax payable to the state of California. The prior year provision consisted primarily of taxes paid on licensing revenues sourced from countries requiring foreign tax withholdings, principally Korea and Taiwan.
We had federal and state net operating loss carryforwards at December 31, 2007 of $13,596,056 and $5,206,235, respectively. The net operating loss carryforwards began to expire in 2005 and will continue through 2026. In addition, we had federal foreign tax credit carryforwards of approximately $3,412,608, at December 31, 2007, which begin to expire in 2014, and federal and state tax capital loss carryforwards of approximately $16,219,585, which begin to expire in 2011. As of December 31, 2007, we continued to have a valuation allowance of $16,399,164 against our deferred tax assets, which was established primarily due to our cumulative losses in recent years and based on our assessment of our future ability to realize certain deferred tax assets.
Year Ended December 31, 2006 Compared to Year Ended December 31, 2005
Revenues
Total revenues for fiscal 2006 were $18,547,529 compared to $14,608,478 in fiscal 2005, an increase of $3,939,051, or 27%. This increase was primarily attributable to increases in royalties related to the sales of flat panel televisions and monitors, which grew by $5,282,295, or 133%, and increases in the automotive market, which grew by $602,786, or 130%. The majority of the increases in flat panel televisions and monitors revenues was the direct result of our receipt of larger royalty payments from many of the multinational television OEMs, including Sony, Samsung, LG and Toshiba, or their respective manufacturers. Revenues in the automotive market increased substantially in 2006 as compared to 2005. This increase was primarily due to increased revenues from one customer in Japan who provides line install, dealer option and after market automotive audio systems to many of the significant Japanese automotive manufactures, including Toyota, Honda, Subaru and Nissan. Revenues in our portable media devices segment and personal telecommunications segments fell by 13% and 6%, respectively. The decrease in revenue in portable media devices was primarily attributable to the loss of one customer. Revenues from that customer continued in the first and second quarters of fiscal 2006; however, no substantive revenues were received from that customer in the third and fourth quarters of 2006. The decrease in personal telecommunications revenues is primarily attributable to one customer who has experienced a decrease in its sales of handset units. We continue to be included in the customer's products; however, sales of these products were at lower levels in 2006 than during 2005. The following table represents our mix of licensing revenues by market source:
| | Years Ended December 31, | ||||
|---|---|---|---|---|---|
| | 2006 | 2005 | |||
| Home entertainment (TV, set-top box, A/V receiver, DVD) | 61 | % | 51 | % | |
| Portable media devices (digital media player, headphone) | 16 | 23 | |||
| PC (software, hardware) | 9 | 12 | |||
| Personal telecommunications (mobile phone, PDA) | 8 | 11 | |||
| Automotive | 6 | 3 | |||
| 100 | % | 100 | % | ||
26
Sales and Marketing
Sales and marketing expenses consist primarily of employee salaries, sales consultants' fees and related expenses, sales commissions and costs associated with branding activities. Sales and marketing expenses were $7,345,133 for fiscal year 2006, as compared to $5,192,090 for fiscal year 2005. Overall sales and marketing expenses were $2,153,043, or 41%, higher in fiscal 2006 due in large part to increased staffing as we added sales personnel and consultants in the United States, Europe, Taiwan and Korea. We hired a Vice President of Sales-Licensing in August 2005 and an Executive Vice President of Marketing and Business Development in December 2005 (who separated from the company in July 2006). Additionally, we increased staffing at the corporate level to support our branding and marketing activities. Some of these staffing increases were moderated during the second half of fiscal 2006 as we increased our branding and marketing activities at the local level, and reduced expenditures at the corporate level. We also paid increased commissions on higher licensing revenues. Lastly, we recorded $515,762 in stock-based compensation expense for sales and marketing personnel during 2006 as compared to zero in 2005, due to the adoption of SFAS No. 123R at the beginning of fiscal 2006. As a percentage of total revenues, sales and marketing expenses increased from 36% for fiscal year 2005 to 39% for fiscal year 2006.
Research and Development
Research and development expenses consist of salaries and related costs of employees engaged in ongoing research, design and development activities and costs for engineering materials and supplies. Research and development expenses were $2,572,577 for fiscal year 2006, as compared to $2,224,237 for fiscal year 2005. The overall increase in research and development expenses of $348,340, or 16%, was primarily attributable to $331,480 in stock-based compensation expense for engineering personnel during 2006 as compared to zero in 2005, due to the adoption of SFAS No. 123R at the beginning of fiscal 2006. We expect that research and development expenses will continue to fluctuate as a percentage of revenues due to fluctuations in our revenues. As a percentage of total revenues, research and development expenses decreased from 15% for fiscal year 2005 to 14% for fiscal year 2006.
General and Administrative
General and administrative expenses consist primarily of employee-related expenses, legal costs associated with the administration of intellectual property, and other professional fees and costs associated with being a publicly held company. General and administrative expenses were $5,660,260 for fiscal year 2006 as compared to $5,170,256 for fiscal year 2005. The overall increase of $490,004, or 9%, was primarily attributable to $512,525 in stock-based compensation expense for corporate employees and directors during 2006 as compared to $55,802 in 2005, due to the adoption of SFAS No. 123R at the beginning of fiscal 2006. As a percentage of total revenues, general and administrative expenses decreased from 35% for fiscal year 2005 to 31% for fiscal year 2006.
Other Income, Net
Other income, net, consists principally of interest income. Other income, net, was $1,135,870 for fiscal year 2006, compared to $673,132 for fiscal year 2005, an increase of $462,738 or 69%. This increase was primarily attributable to the increase in interest income due to higher interest rates and higher cash balances.
Provision for Income Taxes
The income tax provision for fiscal 2006 was $868,203 compared to $795,919 for fiscal 2005, representing an increase of $72,284, or 9%. The provision consists primarily of taxes paid on licensing revenues sourced from countries requiring foreign tax withholdings, principally Korea and Taiwan.
27
We had federal and state net operating loss carryforwards at December 31, 2006 of $17,621,730 and $7,992,523, respectively. The net operating loss carryforwards began expiring in 2003 and will continue through 2026. In addition, we had federal tax credit carryforwards of approximately $2,865,936 at December 31, 2006, which begin to expire in 2010, and federal and state tax capital loss carryforwards of approximately $16,219,585, which begin to expire in 2011. As of December 31, 2006, we had a valuation allowance of $15,089,937 against our deferred tax assets, which was established primarily due to our cumulative losses in recent years and based on our assessment of our future ability to realize certain deferred tax assets.
Selected Quarterly Operating Results
The following table sets forth certain quarterly summary consolidated financial data for the eight quarters in the period ended December 31, 2007. The quarterly information is based upon financial statements prepared by us on a basis consistent with our audited consolidated financial statements and, in management's opinion, includes all adjustments, consisting only of normal recurring adjustments necessary for a fair presentation of the information for the periods presented. This information should be read in conjunction with our audited consolidated financial statements and notes thereto appearing elsewhere in this Report. Our quarterly operating results have varied significantly in the past and are expected to vary significantly in the future. Due to rounding differences, the quarters in a given year may not add precisely to the annual numbers for that year.
| | Three Months Ended | |||||||||||||||||||||||||
|---|---|---|---|---|---|---|---|---|---|---|---|---|---|---|---|---|---|---|---|---|---|---|---|---|---|---|
| | Mar 31, 2007 | June 30, 2007 | Sep 30, 2007 | Dec 31, 2007 | Mar 31, 2006 | June 30, 2006 | Sep 30, 2006 | Dec 31, 2006 | ||||||||||||||||||
| | (In thousands except per share amounts) | |||||||||||||||||||||||||
| Revenues | $ | 5,072 | $ | 4,695 | $ | 4,769 | $ | 4,315 | $ | 4,336 | $ | 4,260 | $ | 4,910 | $ | 5,042 | ||||||||||
| Gross profit | 5,034 | 4,654 | 4,732 | 4,267 | 4,288 | 4,225 | 4,866 | 4,998 | ||||||||||||||||||
| Operating expenses | 4,115 | 3,874 | 3,586 | 3,693 | 4,157 | 3,875 | 3,649 | 3,897 | ||||||||||||||||||
| Income from continuing operations | 1,412 | 1,289 | 1,674 | 1,040 | 151 | 406 | 1,276 | 1,233 | ||||||||||||||||||
| Income (loss) from discontinued operations. | — | — | — | — | 11 | 524 | 1,114 | (7 | ) | |||||||||||||||||
| Net income | $ | 1,412 | $ | 1,289 | $ | 1,674 | $ | 1,040 | $ | 163 | $ | 929 | $ | 2,391 | $ | 1,225 | ||||||||||
| Income from continuing operations per common share: | ||||||||||||||||||||||||||
| Basic | $ | 0.09 | $ | 0.08 | $ | 0.10 | $ | 0.06 | $ | 0.01 | $ | 0.03 | $ | 0.09 | $ | 0.08 | ||||||||||
| Diluted | $ | 0.08 | $ | 0.08 | $ | 0.10 | $ | 0.06 | $ | 0.01 | $ | 0.02 | $ | 0.08 | $ | 0.07 | ||||||||||
| Income from discontinued operations per common share: | ||||||||||||||||||||||||||
| Basic | $ | — | $ | — | $ | — | $ | — | $ | 0.00 | $ | 0.04 | $ | 0.07 | $ | 0.00 | ||||||||||
| Diluted | $ | — | $ | — | $ | — | $ | — | $ | 0.00 | $ | 0.03 | $ | 0.07 | $ | 0.00 | ||||||||||
| Net income per common share: | ||||||||||||||||||||||||||
| Basic | $ | 0.09 | $ | 0.08 | $ | 0.10 | $ | 0.06 | $ | 0.01 | $ | 0.06 | $ | 0.16 | $ | 0.08 | ||||||||||
| Diluted | $ | 0.08 | $ | 0.08 | $ | 0.10 | $ | 0.06 | $ | 0.01 | $ | 0.06 | $ | 0.15 | $ | 0.07 | ||||||||||
28
Liquidity and Capital Resources
At December 31, 2007, cash and cash equivalents and investments available for sale were $45,067,166 compared to $40,238,130 as of December 31, 2006, an increase of $4,829,036. Our cash and cash equivalents were $39,615,291 as of December 31, 2007, an increase of $4,603,866 from cash and cash equivalents of $35,011,425 held at December 31, 2006. The increase was primarily a result of positive cash flow generated by operating activities and the exercise of employee stock options, partially offset by the purchase of treasury stock. Cash and cash equivalents generally consist of cash, money market funds and other money market instruments with original maturities of three months or less. We held $5,451,875 in investments available for sale at December 31, 2007, as compared to $5,226,705 at December 31, 2006, an increase of $225,170, due to the change in the market value of the instrument. Investments consist of U.S. government securities rated AAA. In fiscal 2007, 2006 and 2005, operations were funded primarily from cash from operating activities.
Net cash provided by operating activities was $6,558,565 and $4,950,707 for fiscal 2007 and 2006, respectively. The $1,607,858 increase in net cash provided by operating activities in fiscal year 2007, compared to fiscal year 2006, was primarily a result of the Company not spending any cash in the current year related to discontinued operations, as the Company sold its discontinued operations in 2006. Additionally, the 2007 deferred revenue increased $757,271 primarily due to the Company entering into a multi-year license agreement with LG Electronics for the use of our existing technology for television and monitors through December 2010. We received an initial lump sum payment under this agreement in the current year. We are recognizing the revenue ratably over the four year period of the contract. Offsetting these increases, accrued liabilities decreased $605,928 primarily due to a decrease in accrued commissions and amounts due to employees for 2007 under the Profit Sharing and Bonus Plan.
Our investing activities used cash of $850,927 in 2007 and provided cash of $15,768,382 in 2006. In 2007, our cash used in investing activities was primarily related to expenditures incurred in expanding and protecting our intellectual property portfolio. In 2006, our cash provided by investing activities was primarily related to the sale of investments of $11,996,917 and proceeds received from the sale of our interests in Valence and the Joint Venture, which totaled $4,687,021.
Our financing activities used cash of $1,103,772 during 2007 and provided cash of $5,539,997 during 2006. Our financing activities during 2007 primarily consisted of proceeds from the exercise of employee stock options of $1,842,964, offset by the purchase of outstanding stock for $2,946,736 under the stock repurchase program announced in November 2007. During 2006, we received cash of $7,654,583 as the result of the exercise of employee stock options. This increase in cash was partially offset by our purchase of $2,114,586 of outstanding stock as part of the sale of our interest in Valence.
We believe our existing cash balances and investments together with cash generated from operating activities will be sufficient to meet our anticipated cash needs for at least the next twelve months. Our future capital requirements will depend on many factors, including our level of revenues, the timing and extent of spending to support product development efforts, the expansion of sales and marketing activities, the timing of introductions of new products, the costs to ensure access to adequate manufacturing capacity, and the continuing market acceptance of our products. We could be required, or could elect, to seek additional funding through public or private equity or debt financing. It is possible that such additional funds will not be available on terms acceptable to us or at all.
29
Contractual Cash Obligations and Contingent Liabilities and Commitments
We have contractual obligations and commitments with regards to operating lease arrangements. The following table quantifies our expected contractual obligations and commitments subsequent to December 31, 2007:
| | Payments due by period | ||||||||||
|---|---|---|---|---|---|---|---|---|---|---|---|
| Contractual Obligations | Total | Less than 1 year | 1-3 years | More than 3 years | |||||||
| Operating lease obligations | $ | 127,778 | $ | 109,312 | $ | 18,466 | — | ||||
Recent Accounting Pronouncements
In December 2007, the Financial Accounting Standards Board ("FASB") issued SFAS No. 141 (revised 2007),Business Combinations ("SFAS No. 141(R)"), which replaces SFAS No. 141. SFAS No. 141(R) retains the purchase method of accounting for acquisitions, but requires a number of changes, including changes in the way assets and liabilities are recognized in the purchase accounting. It also changes the recognition of assets acquired and liabilities assumed arising from contingencies, requires the capitalization of in-process research and development at fair value, and requires the expensing of acquisition-related costs as incurred. SFAS No. 141R is effective for us beginning January 1, 2009 and will apply prospectively to business combinations completed on or after that date.
In December 2007, the FASB also issued SFAS No. 160,Noncontrolling Interests in Consolidated Financial Statements, an amendment of ARB 51 ("SFAS No. 160"), which changes the accounting and reporting for minority interests. Minority interests will be recharacterized as noncontrolling interests and will be reported as a component of equity separate from the parent's equity, and purchases or sales of equity interests that do not result in a change in control will be accounted for as equity transactions. In addition, net income attributable to the noncontrolling interest will be included in consolidated net income on the face of the income statement and, upon a loss of control, the interest sold, as well as any interest retained, will be recorded at fair value with any gain or loss recognized in earnings. SFAS No. 160 is effective for us beginning January 1, 2009 and will apply prospectively, except for the presentation and disclosure requirements, which will apply retrospectively. We do not expect the adoption of SFAS No. 160 will have a material effect on our consolidated financial position or results of operations.
In July 2006, the FASB issued FASB Interpretation No. 48,Accounting for Uncertainty in Income Taxes ("FIN 48"). FIN 48 is an interpretation of SFAS No. 109,Accounting for Income Taxes, and it seeks to reduce the diversity in practice associated with certain aspects of measurement and recognition in accounting for income taxes. FIN 48 prescribes a recognition threshold and measurement attribute for the financial statement recognition and measurement of a tax position that an entity takes or expects to take in a tax return. Additionally, FIN 48 provides guidance on de-recognition, classification, interest and penalties, accounting in interim periods, disclosure, and transition. Under FIN 48, an entity may only recognize or continue to recognize tax positions that meet a "more likely than not" threshold. We adopted FIN 48 on January 1, 2007. As a result of adoption of FIN 48, we recognized no liability for unrecognized income tax benefits. Additionally, we recognized no interest and penalties related to uncertain tax positions and as of the year ended December 31, 2007, we have no accrued interest related to uncertain tax positions. The tax years 2003 through 2006 remain open to examination by the major taxing jurisdictions.
In February 2007, the FASB issued SFAS No. 159,The Fair Value Option for Financial Assets and Financial Liabilities ("SFAS No. 159"). SFAS No. 159 permits entities to choose to measure financial assets and liabilities (except for those that are specifically scoped out of the Statement) at fair value. The election to measure a financial asset or liability at fair value can be made on an
30
instrument-by-instrument basis and is irrevocable. The difference between carrying value and fair value at the election date is recorded as a transition adjustment to opening retained earnings. Subsequent changes in fair value are recognized in earnings. The effective date for this statement is as of the beginning of an entity's first fiscal year that begins after November 15, 2007. Accordingly, we adopted SFAS No. 159 effective January 1, 2008. We do not expect the adoption of SFAS No. 159 to have a material impact on our consolidated financial position or consolidated results of operations.
In September 2006, the FASB issued SFAS No. 157,Fair Value Measurements ("SFAS No. 157"). The purpose of SFAS No. 157 is to define fair value, establish a framework for measuring fair value and enhance disclosures about fair value measurements. The measurement and disclosure requirements are effective for us beginning January 1, 2008. We do not expect the adoption of SFAS No. 157 will have a material effect on our consolidated financial position or results of operations.
Item 7A. Quantitative and Qualitative Disclosures About Market Risk
Our exposure to market risk includes changes in interest rates, which relates primarily to our invested balances of cash, cash equivalents and investments. Our investment policy specifies excess funds are to be invested in a manner that preserves capital, provides liquidity and generates the highest available after-tax return. To limit exposure to market risk, we place our cash in banks, cash equivalents in high quality, short-term commercial paper and money market funds and investments consisting of U.S. government securities and U.S government-backed securities. We do not invest in any derivative instruments. All cash, cash equivalents and investments are carried at fair value, which approximates cost.
Item 8. Financial Statements and Supplementary Data
The financial statement information, including the Report of Independent Registered Public Accounting Firm, required by this Item 8 is set forth on pages 44 to 69 of this Annual Report on Form 10-K and is hereby incorporated into this Item 8 by reference. The quarterly financial information required by this Item 8 is set forth in Item 7 of this Annual Report on Form 10-K and is hereby incorporated into this Item 8 by reference.
Item 9. Changes in and Disagreements with Accountants on Accounting and Financial Disclosure
On December 5, 2006, we engaged Squar, Milner, Peterson, Miranda & Williamson, LLP, Newport Beach, California ("Squar Milner"), as our independent registered public accounting firm to audit our financial statements beginning with the fiscal year ended December 31, 2006. On that date, we advised BDO Seidman, LLP ("BDO") of our decision to dismiss BDO as our independent registered public accounting firm. Our Audit Committee unanimously approved the engagement of Squar Milner and the dismissal of BDO on December 5, 2006.
The Audit Committee believes the change of our independent registered public accounting firm is in the best interest of the Company and the recent simplification of our business model makes this an appropriate time for the change.
The reports of BDO on our financial statements for the year ended December 31, 2005 did not contain any adverse opinion or disclaimer of opinion, and were not otherwise qualified as to uncertainty, audit scope or accounting principles.
During fiscal year 2005 and through December 5, 2006, there were no disagreements with BDO on any matter of accounting principles or practices, financial statement disclosure, or auditing scope or procedure, which disagreements if not resolved to the satisfaction of BDO would have caused them to make reference thereto in their reports on the financial statements for such years.
31
During fiscal year 2005 and through December 5, 2006, we did not consult Squar Milner regarding either (i) the application of accounting principles to a specified transaction, either completed or proposed, or the type of audit opinion that might be rendered on the Company's financial statements; or (ii) any matter that was either the subject of a disagreement or a reportable event (each as defined in Item 304(a)(1) of Regulation S-K) or (iii) any of the matters or events set forth in Item 304(a)(2)(i) and (ii) of Regulation S-K.
Item 9A. Controls and Procedures
Evaluation of Disclosure Controls and Procedures
We maintain "disclosure controls and procedures," as such term is defined in Rules 13a-15(e) and 15d-15(e) under the Exchange Act, that are designed to ensure that information required to be disclosed by us in reports that we file or submit under the Exchange Act is recorded, processed, summarized, and reported within the time periods specified in SEC rules and forms, and that such information is accumulated and communicated to our management, including our Chief Executive Officer and Chief Financial Officer, as appropriate, to allow timely decisions regarding required disclosure. In designing and evaluating our disclosure controls and procedures, management recognized that disclosure controls and procedures, no matter how well conceived and operated, can provide only reasonable, not absolute, assurance that the objectives of the disclosure controls and procedures are met. Additionally, in designing disclosure controls and procedures, our management necessarily was required to apply its judgment in evaluating the cost-benefit relationship of possible disclosure controls and procedures. The design of any disclosure controls and procedures also is based in part upon certain assumptions about the likelihood of future events, and there can be no assurance that any design will succeed in achieving its stated goals under all potential future conditions.
Subject to the limitations noted above, our management, with the participation of our Chief Executive Officer and Chief Financial Officer, has evaluated the effectiveness of the design and operation of our disclosure controls and procedures as of the end of the year covered by this Annual Report on Form 10-K. Based on that evaluation, the Chief Executive Officer and Chief Financial Officer have concluded that, as of such date, our disclosure controls and procedures were effective to meet the objective for which they were designed and operate at the reasonable assurance level.
Management's Report on Internal Control over Financial Reporting
Our management is responsible for establishing and maintaining adequate internal control over financial reporting for the Company as defined in Rule 13a-15(f) or 15d-15(f) of the Exchange Act. Internal control over financial reporting is a process designed to provide reasonable assurance regarding the reliability of financial reporting and the preparation of financial statements for external purposes in accordance with generally accepted accounting principles, and includes those policies and procedures that: (i) pertain to the maintenance of records that, in reasonable detail, accurately and fairly reflect the transactions and dispositions of our assets; (ii) provide reasonable assurance that transactions are recorded as necessary to permit preparation of financial statements in accordance with generally accepted accounting principles, and that our receipts and expenditures are being made only in accordance with authorizations of our management and directors; and (iii) provide reasonable assurance regarding prevention or timely detection of unauthorized acquisition, use or disposition of our assets that could have a material effect on our financial statements.
Because of its inherent limitations, internal control over financial reporting may not prevent or detect misstatements. Also, projections of any evaluation of effectiveness to future periods are subject to the risk that controls may become inadequate because of changes in conditions, or that the degree of compliance with the policies or procedures may deteriorate.
32
Our management assessed the effectiveness of the Company's internal control over financial reporting as of December 31, 2007 using the criteria set forth by the Committee of Sponsoring Organizations of the Treadway Commission in its report,Internal Control-Integrated Framework. Based on this assessment and those criteria, management concluded that our internal control over financial reporting was effective as of December 31, 2007.
Attestation Report of Independent Registered Public Accounting Firm
Our internal control over financial reporting has been audited by Squar, Milner, Peterson, Miranda & Williamson, LLP, an independent registered public accounting firm, as stated in their report, which is included herein on page 41.
Changes in Internal Controls
There have been no changes in our internal controls over financial reporting that occurred during our fourth quarter ended December 31, 2007 that have materially affected, or are reasonably likely to materially affect, our internal controls over financial reporting.
None.
33
Item 10. Directors, Executive Officers and Corporate Governance
The information set forth under the captions "Election of Directors," "Information About the Board of Directors and Committees of the Board," "Executive Officers" and "Transactions with Management and Others—Section 16(a) Beneficial Ownership Reporting Compliance" in our definitive proxy statement (the "Proxy Statement") for the Annual Meeting of Stockholders that is scheduled to occur in June 2008 is incorporated herein by reference. The Proxy Statement will be filed with the SEC no later than 120 days after the end of fiscal year 2007.
Item 11. Executive Compensation
Except as specifically provided, the information set forth under the captions "Compensation of Executive Officers" and "Information About the Board of Directors and Committees of the Board—Compensation of Directors" in the Proxy Statement is incorporated herein by reference. The Proxy Statement will be filed with the SEC no later than 120 days after the end of fiscal year 2007.
Item 12. Security Ownership of Certain Beneficial Owners and Management and Related Stockholder Matters
Information regarding security ownership of certain beneficial owners and management is incorporated by reference to the information set forth under the caption "Security Ownership of Certain Beneficial Owners and Management" in the Proxy Statement. The Proxy Statement will be filed with the SEC no later than 120 days after the end of fiscal year 2007.
Information regarding equity compensation plans required by this Item 12 is included in Item 5 of Part II of this Annual Report on Form 10-K and is incorporated into this Item by reference.
Item 13. Certain Relationships and Related Transactions, and Director Independence
The information set forth under the captions "Transactions with Management and Others" and "Information About the Board of Directors and Committees of the Board" in the Proxy Statement is incorporated herein by reference. The Proxy Statement will be filed with the SEC no later than 120 days after the end of fiscal year 2007.
Item 14. Principal Accounting Fees and Services
Information regarding principal accounting fees and services is incorporated by reference to the information set forth under the caption "Relationship of the Company with Independent Registered Public Accounting Firm" in the Proxy Statement. The Proxy Statement will be filed with the SEC no later than 120 days after the end of fiscal year 2007.
34
Item 15. Exhibits and Financial Statement Schedule
- (1)
- Financial Statements
| | Page | |
|---|---|---|
| Report of Independent Registered Public Accounting Firm—Squar, Milner, Peterson, Miranda & Williamson, LLP | 41 | |
| Report of Independent Registered Public Accounting Firm—BDO Seidman, LLP | 43 | |
| Consolidated Balance Sheets as of December 31, 2007 and 2006 | 44 | |
| Consolidated Statements of Operations for the years ended December 31, 2007, 2006 and 2005 | 45 | |
| Consolidated Statements of Stockholders' Equity and Comprehensive Income (Loss) for the years ended December 31, 2007, 2006 and 2005 | 46 | |
| Consolidated Statements of Cash Flows for the years ended December 31, 2007, 2006 and 2005 | 47 | |
| Notes to Consolidated Financial Statements | 48 |
- (2)
- Financial Statement Schedule
| | Page | |
|---|---|---|
| Schedule II—Valuation and Qualifying Accounts and Reserves for the years ended December 31, 2007, 2006 and 2005 | 69 |
The financial statement schedule included on page 69 to this Annual Report on Form 10-K and in Part II, Item 8 herein is filed as part of this Annual Report on Form 10-K. All other schedules are omitted because they are not applicable or the required information is shown in the consolidated financial statements or related notes.
35
- (3)
- Exhibits
The exhibits listed below are hereby filed with the SEC as part of this Annual Report on Form 10-K. We will furnish a copy of any exhibit upon request, but a reasonable fee will be charged to cover our expenses in furnishing such exhibit.
| Exhibit Number | Description | |
|---|---|---|
| 3.1 | Certificate of Incorporation of the Company, previously filed with the SEC as Exhibit 3.1 to the Company's Registration Statement on Form SB-2, specifically included in Amendment No. 1 to such Registration Statement filed with the SEC on July 3, 1996 (File No. 333-4974-LA) (the "Registration Statement Amendment No. 1"), which is incorporated herein by reference. | |
3.2 | Bylaws of the Company, previously filed with the SEC as Exhibit 3.1 to the Company's Quarterly Report on Form 10-Q for the period ended September 30, 1999, filed with the SEC on November 12, 1999, which is incorporated herein by reference. | |
Material Contracts Relating to Management Compensation Plans or Arrangements | ||
10.1 | Employment Agreement dated July 1, 1996, between the Company and Thomas C.K. Yuen, previously filed with the SEC as Exhibit 10.8 to the Registration Statement Amendment No. 1, which is incorporated herein by reference. | |
10.2 | Amendment to Employment Agreement dated as of March 14, 1997, between the Company and Thomas C.K. Yuen, previously filed with the SEC as Exhibit 10.2 to the Company's Annual Report on Form 10-KSB for the fiscal year ended December 31, 1996, filed with the SEC on March 31, 1997 (the "1996 Annual Report"), which is incorporated herein by reference. | |
10.3 | Employment Agreement dated July 1, 1996, between the Company and Alan D. Kraemer, previously filed with the SEC as Exhibit 10.11 to the Registration Statement Amendment No. 1, which is incorporated herein by reference. | |
10.4 | SRS Labs, Inc. Amended and Restated 1996 Non-employee Directors Stock Option Plan, as amended, previously filed with the SEC as Appendix B to the Company's Definitive Proxy Statement dated and filed with the SEC on April 30, 2003, which is incorporated herein by reference. | |
10.5 | Form of Indemnification Agreement, previously filed with the SEC as Exhibit 10.20 to the Registration Statement Amendment No. 1, which is incorporated herein by reference. | |
10.6 | Non-employee Director Compensation Policy adopted by the Company's Board of Directors on January 28, 2005, previously filed with the SEC as Exhibit 10.1 to the Company's Current Report on Form 8-K filed with the SEC on February 3, 2005, which is incorporated herein by reference. | |
10.7 | Form of Non-Employee Director Stock Option Agreement under the SRS Labs, Inc. Amended and Restated 1996 Non-Employee Directors' Stock Option Plan (Initial Appointment), previously filed with the SEC as Exhibit 10.2 to the Company's Current Report on Form 8-K file with the SEC on February 3, 2005, which is incorporated herein by reference. |
36
10.8 | Form of Non-Employee Director Stock Option Agreement under the SRS Labs, Inc. Amended and Restated 1996 Non-Employee Directors' Stock Option Plan (Re-Election), previously filed with the SEC as Exhibit 10.3 to the Company's Current Report on Form 8-K file with the SEC on February 3, 2005, which is incorporated herein by reference. | |
10.9 | Form of Non-Employee Director Stock Option Agreement under the SRS Labs, Inc. Amended and Restated 1996 Long-Term Incentive Plan, previously filed with the SEC as Exhibit 10.4 to the Company's Current Report on Form 8-K file with the SEC on February 3, 2005, which is incorporated herein by reference. | |
10.10 | Form of Nonqualified Stock Option Agreement under the SRS Labs, Inc. Amended and Restated 1996 Long-Term Incentive Plan dated March 29, 2005 (With Schedule of Optionees Attached—Thomas C.K. Yuen, Janet M. Biski, Alan D. Kraemer, Philip Wong and Jennifer Drescher), previously filed with the SEC as Exhibit 10.1 to the Company's Current Report Form 8-K filed with the SEC on April 4, 2005, which is incorporated herein by reference. | |
10.11 | SRS Labs, Inc. 2005 Change in Control Protection Plan approved April 27, 2005, previously filed with the SEC as Exhibit 10.1 to the Company's Current Report on Form 8-K filed with the SEC on May 3, 2005, which is incorporated herein by reference. | |
10.12 | Form of Participation Agreement under the SRS Labs, Inc. 2005 Change in Control Protection Plan for Selected Executive Officers (With Schedule of Parties Attached—Thomas C.K. Yuen, Janet M. Biski and Alan D. Kraemer) approved April 27, 2005, previously filed with the SEC as Exhibit 10.2 to the Company's Current Report on Form 8-K filed with the SEC on May 3, 2005, which is incorporated herein by reference. | |
10.13 | SRS Labs, Inc. Amended and Restated 1996 Long-Term Incentive Plan, as amended, approved April 27, 2005, previously filed with the SEC as Exhibit 10.5 to the Form 8-K filed with the SEC on May 3, 2005, which is incorporated herein by reference. | |
10.14 | Employment Letter Agreement dated June 24, 2005 by and between the Company and Michael Franzi, previously filed with the SEC as Exhibit 10.1 to the Company's Current Report on Form 8-K filed with the SEC on August 18, 2005, which is incorporated herein by reference. | |
10.15 | Stock Option Agreement dated August 17, 2005 by and between the Company and Michael Franzi, previously filed with the SEC as Exhibit 10.2 to the Company's Current Report on Form 8-K filed with the SEC on August 18, 2005, which is incorporated herein by reference. | |
10.16 | Employment Letter Agreement dated December 21, 2005 by and between the Company and Ulrich E. Gottschling, previously filed with the SEC as Exhibit 99.1 to the Company's Current Report on Form 8-K filed with the SEC on December 29, 2005, which is incorporated herein by reference. | |
10.17 | Participation Agreement for Ulrich E. Gottschling under the SRS Labs, Inc. 2005 Change in Control Protection Plan, dated January 12, 2006, previously filed with the SEC as Exhibit 99.1 to the Company's Current Report on Form 8-K filed with the SEC on January 18, 2006, which is incorporated herein by reference. | |
10.18 | Participation Agreement for Michael Franzi under the SRS Labs, Inc. 2005 Change in Control Protection Plan, dated January 12, 2005, previously filed with the SEC as Exhibit 99.2 to the Company's Current Report on Form 8-K filed with the SEC on January 18, 2006, which is incorporated herein by reference. |
37
10.19 | Form of Nonqualified Stock Option Agreement under the SRS Labs, Inc. 1996 Amended and Restated Long-Term Incentive Plan, as amended, previously filed with the SEC as Exhibit 99.8 to the Company's Current Report on Form 8-K filed with the SEC on January 18, 2006, which is incorporated herein by reference. | |
10.20 | SRS Labs, Inc. 2006 Stock Incentive Plan, as approved by the Company's shareholders on June 22, 2006, previously filed with the SEC as Exhibit 10.1 to the Company's Current Report on Form 8-K filed with the SEC on June 28, 2006, which is incorporated herein by reference. | |
10.21 | Salary adjustment for Alan Kraemer, Executive Vice President, Chief Technology Officer, Sarah Yang, Vice President, Software Engineering and Michael Franzi, Vice President, Sales Licensing, as approved on February 8, 2007, previously filed with the SEC on the Company's Current Report on Form 8-K filed with the SEC on February 13, 2007, which is incorporated herein by reference. | |
10.22 | SRS Labs, Inc. Profit Sharing and Bonus Plan, as amended on June 20, 2007, previously filed with the SEC as Exhibit 10.1 to the Company's Current Report on Form 8-K filed with the SEC on June 25, 2007, which is incorporated herein by reference. | |
10.23 | SRS Labs, Inc. stock repurchase program, previously filed with the SEC in the Company's Current Report on Form 8-K on November 6, 2007, which is incorporated herein by reference. | |
10.24 | SRS Labs, Inc. 2006 Stock Incentive Plan, as amended on December 17, 2007, previously filed with the SEC as Exhibit 10.1 to the Company's Current Report on Form 8-K filed with the SEC on December 21, 2007, which is incorporated herein by reference. | |
10.25 | Salary adjustment for Alan Kraemer, Executive Vice President, Chief Technology Officer, Ulrich Gottschling, Chief Financial Officer, and Sarah Yang, Vice President, Software Engineering, as approved on January 2, 2008, previously filed with the SEC on the Company's Current Report on Form 8-K filed with the SEC on January 7, 2008, which is incorporated herein by reference. | |
Other Material Contracts | ||
10.26 | License Agreement dated as of June 27, 1988, between Hughes Aircraft and Sony Corporation, as amended and assigned to the Company, previously filed with the SEC as Exhibit 10.6 to the Company's Registration Statement on Form SB-2, specifically included in Amendment No. 3 to such Registration Statement filed with the SEC on August 7, 1996 (File No. 333-4974-LA), which is incorporated herein by reference. | |
10.27 | Industrial Real Estate Lease dated May 30, 1997, between the Company and Daimler Commerce Partners, L.P., previously filed with the SEC as Exhibit 10.1 to the Company's Quarterly Report on Form 10-QSB for the quarterly period ended June 30, 1997, filed with the SEC on August 13, 1997, which is incorporated herein by reference. | |
10.28 | Stock Divestment Agreement dated July 1, 1996, between the Company, Thomas C.K. Yuen, Stephen V. Sedmak and Walter W. Cruttenden III, previously filed with the SEC as Exhibit 10.17 to the Company's Registration Statement on Form SB-2, specifically included in Amendment No. 2 to such Registration Statement file with the SEC on August 2, 1996 (File No. 333-4974-LA), which is incorporated herein by reference. | |
21 | Subsidiaries of the Company. |
38
23.1 | Consent of Independent Registered Public Accounting Firm, Squar, Milner, Peterson, Miranda & Williamson, LLP, dated March 12, 2008. | |
23.2 | Consent of Independent Registered Public Accounting Firm, BDO Seidman LLP, dated March 13, 2008. | |
31.1 | Certification of the Chief Executive Officer of SRS Labs, Inc., pursuant to Section 302 of the Sarbanes-Oxley Act of 2002. | |
31.2 | Certification of the Chief Financial Officer of SRS Labs, Inc., pursuant to Section 302 of the Sarbanes-Oxley Act of 2002. | |
32.1 | Certification of Chief Executive Officer of SRS Labs, Inc., pursuant to 18 U.S.C. Section 1350, as adopted pursuant to Section 906 of the Sarbanes-Oxley Act of 2002. | |
32.2 | Certification of Chief Financial Officer of SRS Labs, Inc., pursuant to 18 U.S.C. Section 1350, as adopted pursuant to Section 906 of the Sarbanes-Oxley Act of 2002. |
39
Pursuant to the requirements of Section 13 or 15(d) of the Securities Exchange Act of 1934, the registrant has duly caused this report to be signed on its behalf by the undersigned, thereunto duly authorized.
| | | | ||
|---|---|---|---|---|
| SRS Labs, Inc. | ||||
Dated: March 13, 2008 | By: | /s/ THOMAS C.K. YUEN Chairman of the Board and Chief Executive Officer | ||
Pursuant to the requirements of the Securities Exchange Act of 1934, this report has been signed below by the following persons on behalf of the registrant and in the capacities and on the dates indicated.
| Name | Capacity | Date | ||
|---|---|---|---|---|
/s/ THOMAS C.K. YUEN Thomas C.K. Yuen | Director, Chairman of the Board and Chief Executive Officer (Principal Executive Officer) | March 13, 2008 | ||
/s/ ULRICH GOTTSCHLING Ulrich Gottschling | Chief Financial Officer (Principal Financial and Accounting Officer) | March 13, 2008 | ||
/s/ DAVID R. DUKES David R. Dukes | Director | March 13, 2008 | ||
/s/ WINSTON E. HICKMAN Winston E. Hickman | Director | March 13, 2008 | ||
/s/ CAROL L. MILTNER Carol L. Miltner | Director | March 13, 2008 | ||
/s/ SAM YAU Sam Yau | Director | March 13, 2008 |
40
REPORT OF INDEPENDENT REGISTERED PUBLIC ACCOUNTING FIRM
To the Board of Directors and Stockholders
SRS Labs, Inc.
Santa Ana, California
We have audited the accompanying consolidated balance sheets of SRS Labs, Inc. and Subsidiaries (collectively the Company) as of December 31, 2007 and 2006, and the related consolidated statements of operations, stockholders' equity and comprehensive income (loss), and cash flows for each of the years in the two-year period ended December 31, 2007. We also have audited the Company's internal control over financial reporting as of December 31, 2007, based on criteria established inInternal Control—Integrated Framework issued by the Committee of Sponsoring Organizations of the Treadway Commission (COSO). Our audit also included the financial statement schedule listed in Item 15(2) herein. The Company's management is responsible for these financial statements, for maintaining effective internal control over financial reporting, and for its assessment of the effectiveness of internal control over financial reporting included in Item 9A. Our responsibility is to express an opinion on these financial statements and an opinion on the Company's internal control over financial reporting based on our audits.
We conducted our audits in accordance with the standards of the Public Company Accounting Oversight Board (United States). Those standards require that we plan and perform the audits to obtain reasonable assurance about whether the financial statements are free of material misstatement and whether effective internal control over financial reporting was maintained in all material respects. Our audits of the financial statements included examining, on a test basis, evidence supporting the amounts and disclosures in the financial statements, assessing the accounting principles used and significant estimates made by management, and evaluating the overall financial statement presentation. Our audit of internal control over financial reporting included obtaining an understanding of internal control over financial reporting, assessing the risk that a material weakness exists, and testing and evaluating the design and operating effectiveness of internal control based on the assessed risk. Our audits also included performing such other procedures as we considered necessary in the circumstances. We believe that our audits provide a reasonable basis for our opinions.
A company's internal control over financial reporting is a process designed to provide reasonable assurance regarding the reliability of financial reporting and the preparation of financial statements for external purposes in accordance with generally accepted accounting principles. A company's internal control over financial reporting includes those policies and procedures that (1) pertain to the maintenance of records that, in reasonable detail, accurately and fairly reflect the transactions and dispositions of the assets of the company; (2) provide reasonable assurance that transactions are recorded as necessary to permit preparation of financial statements in accordance with generally accepted accounting principles, and that receipts and expenditures of the company are being made only in accordance with authorizations of management and directors of the company; and (3) provide reasonable assurance regarding prevention or timely detection of unauthorized acquisition, use, or disposition of the company's assets that could have a material effect on the financial statements.
Because of its inherent limitations, internal control over financial reporting may not prevent or detect misstatements. Also, projections of any evaluation of effectiveness to future periods are subject to the risk that controls may become inadequate because of changes in conditions, or that the degree of compliance with the policies or procedures may deteriorate.
In our opinion, the financial statements referred to above present fairly, in all material respects, the consolidated financial position of SRS Labs, Inc. and Subsidiaries as of December 31, 2007 and 2006, and the consolidated results of their operations and their cash flows for each of the years in the two-year period ended December 31, 2007, in conformity with accounting principles generally accepted in the United States of America. Also in our opinion, the Company maintained, in all material
41
respects, effective internal control over financial reporting as of December 31, 2007, based on criteria established inInternal Control—Integrated Framework issued by the Committee of Sponsoring Organizations of the Treadway Commission (COSO).
Also, in our opinion, the aforementioned financial statement schedule, when considered in relation to the basic consolidated financial statements taken as a whole, presents fairly, in all material respects, the 2007 financial information set forth therein.
| | | |
|---|---|---|
| /s/ SQUAR, MILNER, PETERSON, MIRANDA & WILLIAMSON, LLP Squar, Milner, Peterson, Miranda & Williamson, LLP |
Newport Beach, California
March 12, 2008
42
REPORT OF INDEPENDENT REGISTERED PUBLIC ACCOUNTING FIRM
To the Board of Directors and Stockholders of
SRS Labs, Inc.
Santa Ana, California
We have audited the accompanying consolidated statement of operations of SRS Labs, Inc. and Subsidiaries as of December 31, 2005, and the related consolidated statements of stockholders' equity and comprehensive (loss) income and cash flows for the year ended December 31, 2005. We have also audited the schedule II for 2005 listed in the accompanying index, Item 15(2). These consolidated financial statements and schedule are the responsibility of the Company's management. Our responsibility is to express an opinion on the consolidated financial statements and schedule based on our audits.
We conducted our audits in accordance with the standards of the Public Company Accounting Oversight Board (United States). Those standards require that we plan and perform the audit to obtain reasonable assurance about whether the financial statements and the schedules are free of material misstatement. The Company is not required to have, nor are we engaged to perform, an audit of its internal control over financial reporting. Our audits included consideration of internal control over financial reporting as a basis for designing audit procedures that are appropriate in the circumstances, but not for the purpose of expressing an opinion on the effectiveness of the Company's internal control over financial reporting. Accordingly, we express no such opinion. An audit also includes examining, on a test basis, evidence supporting the amounts and disclosures in the financial statements and schedules, assessing the accounting principles used and significant estimates made by management, as well as evaluating the overall presentation of the financial statements and schedules. We believe that our audits provide a reasonable basis for our opinion.
In our opinion, the consolidated financial statements referred to above present fairly, in all material respects, the consolidated statement of operations of SRS Labs, Inc. and Subsidiaries as of December 31, 2005, and the results of their cash flows for the year ended December 31, 2005, in conformity with accounting principles generally accepted in the United States of America.
Also, in our opinion, the consolidated financial statement schedule for 2005 presents fairly, in all material respects, the information set forth therein.
| | | |
|---|---|---|
| /s/ BDO SEIDMAN, LLP BDO Seidman, LLP |
Costa Mesa, California
February 24, 2006
43
SRS LABS, INC. AND SUBSIDIARIES
CONSOLIDATED BALANCE SHEETS
| | December 31, 2007 | December 31, 2006 | |||||||
|---|---|---|---|---|---|---|---|---|---|
| ASSETS | |||||||||
| Current Assets | |||||||||
| Cash and cash equivalents | $ | 39,615,291 | $ | 35,011,425 | |||||
| Accounts receivable, net | 1,138,425 | 1,180,879 | |||||||
| Prepaid expenses and other current assets | 893,388 | 808,940 | |||||||
| Total Current Assets | 41,647,104 | 37,001,244 | |||||||
Investments available for sale | 5,451,875 | 5,226,705 | |||||||
| Property and equipment, net | 309,727 | 389,667 | |||||||
| Intangible assets, net | 2,197,616 | 2,045,139 | |||||||
| Deferred income taxes, net | 1,776,202 | 386,412 | |||||||
| Total Assets | $ | 51,382,524 | $ | 45,049,167 | |||||
LIABILITIES AND STOCKHOLDERS' EQUITY | |||||||||
| Current Liabilities | |||||||||
| Accounts payable | $ | 529,063 | $ | 609,899 | |||||
| Accrued liabilities | 689,308 | 1,295,236 | |||||||
| Deferred revenue | 1,156,836 | 399,565 | |||||||
| Total Current Liabilities | 2,375,207 | 2,304,700 | |||||||
Commitments and contingencies (Note 5) | |||||||||
Stockholders' Equity | |||||||||
| Preferred stock—$0.001 par value; 2,000,000 shares authorized; no shares issued and outstanding | — | — | |||||||
| Common stock—$0.001 par value; 56,000,000 shares authorized; 16,946,377 and 16,561,036 shares issued; 15,778,715 and 15,886,938 shares outstanding at December 31, 2007 and 2006, respectively | 16,947 | 16,562 | |||||||
| Additional paid-in capital | 74,143,772 | 70,574,176 | |||||||
| Accumulated other comprehensive loss | (48,125 | ) | (273,295 | ) | |||||
| Accumulated deficit | (19,155,096 | ) | (24,569,531 | ) | |||||
| Treasury stock at cost, 1,167,662 and 674,098 shares at December 31, 2007 and 2006, respectively | (5,950,181 | ) | (3,003,445 | ) | |||||
| Total Stockholders' Equity | 49,007,317 | 42,744,467 | |||||||
Total Liabilities and Stockholders' Equity | $ | 51,382,524 | $ | 45,049,167 | |||||
See accompanying notes to the consolidated financial statements.
44
SRS LABS, INC. AND SUBSIDIARIES
CONSOLIDATED STATEMENTS OF OPERATIONS
| | Year Ended December 31, | |||||||||||
|---|---|---|---|---|---|---|---|---|---|---|---|---|
| | 2007 | 2006 | 2005 | |||||||||
| Revenues | $ | 18,851,940 | $ | 18,547,529 | $ | 14,608,478 | ||||||
| Cost of sales | 164,112 | 171,094 | 236,484 | |||||||||
Gross profit | 18,687,828 | 18,376,435 | 14,371,994 | |||||||||
Operating expenses: | ||||||||||||
| Sales and marketing | 6,717,906 | 7,345,133 | 5,192,090 | |||||||||
| Research and development | 3,107,482 | 2,572,577 | 2,224,237 | |||||||||
| General and administrative | 5,443,735 | 5,660,260 | 5,170,256 | |||||||||
Total operating expenses | 15,269,123 | 15,577,970 | 12,586,583 | |||||||||
Operating income | 3,418,705 | 2,798,465 | 1,785,411 | |||||||||
| Other income, net | 2,041,288 | 1,135,870 | 673,132 | |||||||||
| Income from continuing operations before income taxes | 5,459,993 | 3,934,335 | 2,458,543 | |||||||||
| Income taxes | 45,558 | 868,203 | 795,919 | |||||||||
| Income from continuing operations | 5,414,435 | 3,066,132 | 1,662,624 | |||||||||
Discontinued operations (Note 11): | ||||||||||||
| Income (loss) from discontinued operations, net of income taxes | — | 1,017,079 | (3,087,009 | ) | ||||||||
| Gain on disposal of discontinued operations | — | 624,646 | — | |||||||||
| Income (loss) from discontinued operations | — | 1,641,725 | (3,087,009 | ) | ||||||||
Net income (loss) | $ | 5,414,435 | $ | 4,707,857 | $ | (1,424,385 | ) | |||||
Income from continuing operations per common share: | ||||||||||||
| Basic | $ | 0.34 | $ | 0.21 | $ | 0.12 | ||||||
| Diluted | $ | 0.32 | $ | 0.20 | $ | 0.11 | ||||||
Income (loss) from discontinued operations per common share: | ||||||||||||
| Basic | $ | — | $ | 0.11 | $ | (0.22 | ) | |||||
| Diluted | $ | — | $ | 0.11 | $ | (0.22 | ) | |||||
Net income (loss) per common share: | ||||||||||||
| Basic | $ | 0.34 | $ | 0.31 | $ | (0.10 | ) | |||||
| Diluted | $ | 0.32 | $ | 0.30 | $ | (0.10 | ) | |||||
Weighted averaged shares used in the per share calculation: | ||||||||||||
| Basic | 16,154,313 | 14,955,889 | 14,117,795 | |||||||||
| Diluted | 16,989,839 | 15,465,822 | 15,198,875 | |||||||||
See accompanying notes to consolidated financial statements
45
SRS LABS, INC. AND SUBSIDIARIES
CONSOLIDATED STATEMENTS OF STOCKHOLDERS' EQUITY
AND COMPREHENSIVE INCOME (LOSS)
| | Common Stock | | Accumulated Other Comprehensive Income (Loss) | | | | | |||||||||||||||||
|---|---|---|---|---|---|---|---|---|---|---|---|---|---|---|---|---|---|---|---|---|---|---|---|---|
| | Additional Paid-In Capital | Accumulated Deficit | Treasury Stock | | Comprehensive Income (Loss) | |||||||||||||||||||
| | Shares | Amount | Total | |||||||||||||||||||||
| BALANCE, January 1, 2005 | 14,229,541 | $ | 14,672 | $ | 62,523,292 | $ | (309,722 | ) | $ | (27,853,003 | ) | $ | (1,943,855 | ) | $ | 32,431,384 | ||||||||
| Proceeds from exercise of stock options | 282,274 | 283 | 989,730 | — | — | — | 990,013 | |||||||||||||||||
| Tax benefit from exercise of stock options | — | — | 5,694 | — | — | — | 5,694 | |||||||||||||||||
| Deferred stock option compensation | — | — | 55,802 | — | — | — | 55,802 | |||||||||||||||||
| Treasury stock | (232,223 | ) | — | — | — | — | (1,059,590 | ) | (1,059,590 | ) | ||||||||||||||
| Unrealized loss on investments available for sale, net of tax | — | — | — | (186,299 | ) | — | — | (186,299 | ) | (186,299 | ) | |||||||||||||
| Net loss | — | — | — | — | (1,424,385 | ) | — | (1,424,385 | ) | (1,424,385 | ) | |||||||||||||
| BALANCE, December 31, 2005 | 14,279,592 | $ | 14,955 | $ | 63,574,518 | $ | (496,021 | ) | $ | (29,277,388 | ) | $ | (3,003,445 | ) | $ | 30,812,619 | $ | (1,610,684 | ) | |||||
| Proceeds from exercise of stock options | 1,607,346 | 1,607 | 6,501,799 | — | — | — | 6,503,406 | |||||||||||||||||
| Proceeds from exercise of Valence management stock options (Note 11) | 357,625 | 358 | 1,151,177 | — | — | — | 1,151,535 | |||||||||||||||||
| Purchase of treasury stock | — | — | — | — | — | (2,114,586 | ) | (2,114,586 | ) | |||||||||||||||
| Cancellation of treasury stock | (357,625 | ) | (358 | ) | (2,114,228 | ) | — | — | 2,114,586 | — | ||||||||||||||
| Stock-based compensation | — | — | 1,460,910 | — | — | — | 1,460,910 | |||||||||||||||||
| Currency translation adjustment | — | — | — | 81,303 | — | — | 81,303 | 81,303 | ||||||||||||||||
| Unrealized gain on investments available for sale, net of tax | — | — | — | 141,423 | — | — | 141,423 | 141,423 | ||||||||||||||||
| Net income | — | — | — | — | 4,707,857 | — | 4,707,857 | 4,707,857 | ||||||||||||||||
| BALANCE, December 31, 2006 | 15,886,938 | $ | 16,562 | $ | 70,574,176 | $ | (273,295 | ) | $ | (24,569,531 | ) | $ | (3,003,445 | ) | $ | 42,744,467 | $ | 4,930,583 | ||||||
| Proceeds from exercise of stock options | 385,341 | 385 | 1,842,579 | — | — | — | 1,842,964 | |||||||||||||||||
| Purchase of treasury stock | (493,564 | ) | — | — | — | — | (2,946,736 | ) | (2,946,736 | ) | ||||||||||||||
| Stock-based compensation | — | — | 1,727,017 | — | — | — | 1,727,017 | |||||||||||||||||
| Unrealized gain on investments available for sale, net of tax | — | — | — | 225,170 | — | — | 225,170 | 225,170 | ||||||||||||||||
| Net income | — | — | — | — | 5,414,435 | — | 5,414,435 | 5,414,435 | ||||||||||||||||
| BALANCE, December 31, 2007 | 15,778,715 | $ | 16,947 | $ | 74,143,772 | $ | (48,125 | ) | $ | (19,155,096 | ) | $ | (5,950,181 | ) | $ | 49,007,317 | $ | 5,639,605 | ||||||
See accompanying notes to consolidated financial statements
46
SRS LABS, INC. AND SUBSIDIARIES
CONSOLIDATED STATEMENTS OF CASH FLOWS
| | Years Ended December 31, | |||||||||||
|---|---|---|---|---|---|---|---|---|---|---|---|---|
| | 2007 | 2006 | 2005 | |||||||||
| Cash Flows from Operating Activities: | ||||||||||||
| Net income (loss) | $ | 5,414,435 | $ | 4,707,857 | $ | (1,424,385 | ) | |||||
| Adjustments to reconcile net income (loss) to net cash provided by operating activities: | ||||||||||||
| Depreciation and amortization | 733,873 | 727,773 | 840,073 | |||||||||
| Provision for doubtful accounts | 108,321 | (19,594 | ) | 38,010 | ||||||||
| Deferred taxes | (1,389,790 | ) | (6,025 | ) | — | |||||||
| Accretion of discount on investments available for sale | — | (1,904 | ) | (2,202 | ) | |||||||
| Net realized gain on investments available for sale | — | (3,125 | ) | — | ||||||||
| Stock-based compensation | 1,727,017 | 1,359,767 | 55,802 | |||||||||
| Loss (gain) on disposition of furniture, fixtures and equipment | 10,459 | 1,582 | (5,030 | ) | ||||||||
| Write-off of intangible assets | 34,058 | 12,072 | — | |||||||||
| Gain on disposal of discontinued operations | — | (624,646 | ) | — | ||||||||
| Changes in operating assets and liabilities: | ||||||||||||
| Accounts receivable | (65,867 | ) | 725,495 | (847,399 | ) | |||||||
| Prepaid expenses and other current assets | (84,448 | ) | (206,093 | ) | 186,539 | |||||||
| Accounts payable | (80,836 | ) | (131,912 | ) | 295,312 | |||||||
| Accrued liabilities | (605,928 | ) | 493,338 | 355,906 | ||||||||
| Deferred revenue | 757,271 | (138,071 | ) | 100,726 | ||||||||
| Income taxes payable | — | — | (241,068 | ) | ||||||||
| Net cash (used by) provided by operating activities of discontinued operations | — | (1,945,807 | ) | 3,642,043 | ||||||||
| Net cash provided by operating activities | 6,558,565 | 4,950,707 | 2,994,327 | |||||||||
| Cash Flows from Investing Activities: | ||||||||||||
| Proceeds from sale of investments available for sale | — | 11,996,917 | — | |||||||||
| Proceeds from sale of Valence | — | 4,300,000 | — | |||||||||
| Proceeds from sale of equity interest in CHS/SRS LLC | — | 387,021 | — | |||||||||
| Purchase of property and equipment | (147,466 | ) | (214,459 | ) | (154,851 | ) | ||||||
| Proceeds from sales of furniture, fixtures and equipment | — | — | 8,749 | |||||||||
| Expenditures related to intangible assets | (703,461 | ) | (520,881 | ) | (440,515 | ) | ||||||
| Net cash used by investing activities of discontinued operations | — | (180,216 | ) | (597,706 | ) | |||||||
| Net cash (used in) provided by investing activities | (850,927 | ) | 15,768,382 | (1,184,323 | ) | |||||||
| Cash Flows from Financing Activities: | ||||||||||||
| Purchase of treasury stock | (2,946,736 | ) | (2,114,586 | ) | (1,059,590 | ) | ||||||
| Proceeds from exercise of stock options | 1,842,964 | 7,654,583 | 990,013 | |||||||||
| Net cash (used in) provided by financing activities | (1,103,772 | ) | 5,539,997 | (69,577 | ) | |||||||
| Net Increase in Cash and Cash Equivalents | 4,603,866 | 26,259,086 | 1,740,427 | |||||||||
| Cash and Cash Equivalents, Beginning of Year | 35,011,425 | 8,752,339 | 7,011,912 | |||||||||
| Cash and Cash Equivalents, End of Year | $ | 39,615,291 | $ | 35,011,425 | $ | 8,752,339 | ||||||
| Supplemental Disclosures of Cash Flow Information: | ||||||||||||
| Cash paid during the period for: | ||||||||||||
| Income taxes | $ | 1,392,197 | $ | 856,841 | $ | 420,836 | ||||||
| Supplemental Disclosure of Non-Cash Activities: | ||||||||||||
| Unrealized gain (loss) on investments, net | $ | 225,170 | $ | 141,423 | $ | (186,299 | ) | |||||
| Tax benefit on employee stock plans | $ | — | $ | — | $ | 5,694 | ||||||
See accompanying notes to consolidated financial statements
47
SRS LABS, INC. AND SUBSIDIARIES
NOTES TO CONSOLIDATED FINANCIAL STATEMENTS
1. Organization and Significant Accounting Policies
Organization
SRS Labs, Inc. (collectively with its subsidiaries, the "Company," "SRS Labs," or "SRS") is a leading developer and provider of audio and voice technology solutions for the home entertainment, portable media device, personal telecommunications, personal computer, automotive, and broadcast markets. Prior to September 29, 2006, the Company also developed and provided application-specific integrated circuits and standard integrated circuits, or ICs, through its former wholly-owned subsidiary, Valence Tech Limited ("Valence").
Licensing: Through SRS Labs, Inc., the parent company, and its wholly-owned subsidiary, SRSWOWcast.com, Inc., or SRSWOWcast, the Company develops and licenses audio, voice and surround sound technology solutions to many of the world's leading original equipment manufacturers ("OEMs"), software providers and semiconductor companies, and license and market hardware and software products for the Internet and professional audio markets.
Discontinued Operations:
Valence: Through its former wholly-owned subsidiary, Valence, the Company operated a fabless semiconductor business which developed, designed and marketed standard and custom analog ICs, digital signal processors, and mixed signal integrated circuits primarily to OEMs and original design manufacturers ("ODMs") in the Asia Pacific region.
On February 23, 2006, the Company's Board of Directors (the "Board") approved a plan to sell Valence in order to focus management's attention and financial resources on the Company's licensing business. On July 14, 2006, the Company entered into a definitive Sale and Purchase Agreement to sell Valence to Noblehigh Enterprises Inc. The sale transaction was completed on September 29, 2006 and, accordingly, the results of the operations of Valence through the date of sale are included as discontinued operations in the accompanying consolidated statements of operations for all periods presented. See Note 11.
CHS/SRS LLC: In September 2004, SRS entered into a strategic alliance with Coming Home Studios LLC ("CHS") to use and promote SRS Labs' technologies, to promote CHS productions and to promote each company's respective brands. In connection with the strategic alliance, SRS and CHS established a joint venture, CHS/SRS, LLC (the "Joint Venture"), to produce and distribute nine concert videos featuring SRS' Circle Surround technology. On February 23, 2006, the Board authorized management to take all reasonable steps to divest the Company's entire equity interest in the Joint Venture. On June 30, 2006, SRS completed the sale of its interest in the Joint Venture to CHS and, accordingly, the results of the operations of the Joint Venture through the date of sale are included as discontinued operations in the accompanying consolidated statements of operations for all periods presented. See Note 11.
Basis of Presentation
The consolidated financial statements have been prepared in accordance with accounting principles generally accepted in the United States of America and include the Company and its wholly-owned subsidiary SRSWOWcast and the activities of its previously wholly-owned subsidiary Valence through the date of disposal (September 29, 2006) and the Joint Venture through the date of disposal (June 30, 2006) after elimination of all intercompany accounts and transactions.
48
SRS LABS, INC. AND SUBSIDIARIES
NOTES TO CONSOLIDATED FINANCIAL STATEMENTS (Continued)
1. Organization and Significant Accounting Policies (Continued)
Cash and Cash Equivalents
Cash and cash equivalents generally consist of cash, money market funds and other money market instruments with original or remaining maturities of three months or less at the date of purchase.
Investments
The Company accounts for investments in accordance with Statement of Financial Accounting Standards ("SFAS") No. 115,Accounting for Certain Investments in Debt and Equity Securities. Investments, consisting primarily of U.S. government securities, are classified as available for sale and are reported at fair value, based on quoted market prices, in the accompanying consolidated balance sheets. Those securities with a maturity date of one year or less are classified as current assets. Unrealized gains and losses, net of applicable income taxes, are reported as a separate component of stockholders' equity.
Investments classified as available for sale or held to maturity are considered to be impaired when a decline in fair value is judged to be other-than-temporary. The Company evaluates securities for other-than-temporary impairment at least on a quarterly basis, and more frequently when economic or market concerns warrant such evaluation. The Company employs a systematic methodology that considers available evidence in evaluating potential impairment of its investments. In the event that the cost of an investment exceeds its fair value, the Company evaluates, among other factors, the magnitude and duration of the decline in fair value; for equity and debt securities the financial health of and business outlook for the issuer; the performance of the underlying assets for interests in securitized assets; and the Company's intent and ability to hold the investment. Once a decline in fair value is determined to be other-than-temporary, an impairment charge is recorded in investment income and a new cost basis in the investment is established.
Property and Equipment
Property and equipment are stated at cost, net of accumulated depreciation and amortization. The cost of additions and improvements are capitalized, while repairs and maintenance are expensed as incurred. Depreciation and amortization are calculated using the straight-line method, which amortizes cost over the lesser of the estimated useful lives of the respective assets or the term of the related lease. Useful lives range from two to five years.
Intangible Assets
Costs paid by the Company related to the establishment and transfer of patents, primarily legal costs, are capitalized and amortized, depending on the estimated life of the technology patented. These assets are being amortized over ten years.
Impairment of Long-Lived Assets
The Company evaluates the recoverability of long-lived assets with finite lives in accordance with SFAS No. 144,Accounting for the Impairment or Disposal of Long-Lived Assets ("SFAS No. 144"),. The Company assesses potential impairments to its long-lived assets when there is evidence that events or changes in circumstances indicate that the carrying amount of an asset may not be recovered. An impairment loss is recognized when the carrying amount of the long-lived asset is not recoverable and
49
SRS LABS, INC. AND SUBSIDIARIES
NOTES TO CONSOLIDATED FINANCIAL STATEMENTS (Continued)
1. Organization and Significant Accounting Policies (Continued)
exceeds its fair value. The carrying amount of a long-lived asset is not recoverable if it exceeds the sum of the undiscounted cash flows expected to result from the use and eventual disposition of the asset. Any required impairment loss is measured as the amount by which the carrying amount of a long-lived asset exceeds its fair value and is recorded as a reduction in the carrying value of the related asset and a charge to operating results. Based upon the most recent assessment as of December 31, 2007, the Company has determined there was no impairment in the value of long-lived assets.
Use of Estimates
The preparation of consolidated financial statements in conformity with accounting principles generally accepted in the United States of America requires management to make estimates and assumptions that affect the reported amounts of assets and liabilities and disclosure of contingent assets and liabilities as of the date of the financial statements and the reported revenues and expenses during the reporting periods. Some of the estimates needed to be made by management include the allowance for doubtful accounts, estimated useful lives of property and equipment and intangible assets, stock-based compensation and the valuation allowance for the Company's deferred tax asset. Actual results could materially differ from these estimates.
Revenue Recognition
We have two primary types of revenue agreements with our licensees—bundled or non-bundled. Under a bundled agreement, royalty revenue may be collected by our platform partner, who bundles our technology within their solution, at the time the chip is sold to an OEM or ODM. The platform partner remits the royalty to us on behalf of the licensee. Most often, however, we license our technologies to OEMs and ODMs under non-bundled agreements and collect revenue directly from them. These licensing arrangements with OEMs or ODMs authorize them to design, build and sell products containing our technology. Under this licensing approach, the licensees are free to choose a semiconductor solution from the platform partner that best suits their technical and cost requirements. Under the non-bundled agreement, we receive royalties directly from the licensed OEM or ODM for the use of our technologies in licensed products manufactured and shipped by the OEM or ODM.
Revenues associated with ongoing bundled and non-bundled royalty license agreements are recognized upon receipt of reports from licensees stating the number of products implementing SRS patented technologies on which royalties are due, generally one quarter in arrears. The Company also has arrangements under which license fees are prepaid upfront, in addition to ongoing per-unit license fees. In such cases, the prepaid fees are recorded as deferred revenues and are either recognized as revenue upon receipt of reports from licensees stating the number of products shipped on which royalties are due or ratably over the term of the license agreement if there is no licensee reporting requirement. Licensing revenues for one-time technology transfer fees are recognized in the period in which the license agreement is consummated and the related technology and passage of title is transferred. Revenue from product sales is generally recognized upon shipment, at which point title passes. Certain products may be sold under consignment agreements, and revenue for such products is recognized upon reported distributor sales. Design revenue under design contracts is recognized on the percentage-of-completion method. Estimates are reviewed and revised periodically throughout the lives of the contracts. Any revisions are recorded in the accounting period in which the revisions are made.
50
SRS LABS, INC. AND SUBSIDIARIES
NOTES TO CONSOLIDATED FINANCIAL STATEMENTS (Continued)
1. Organization and Significant Accounting Policies (Continued)
Research and Development
Research and development expenses include costs and expenses associated with the development of our design methodology and the design and development of new products, including initial nonrecurring engineering and product verification charges. Research and development is expensed as incurred.
Income Taxes
The Company accounts for income taxes in accordance with SFAS No. 109,Accounting for Income Taxes. Deferred taxes on income result from temporary differences between the reporting of income for financial statement and tax reporting purposes. A valuation allowance related to a deferred tax asset is recorded when it is more likely than not that some or all of the deferred tax asset will not be realized.
Discontinued Operations
In accordance with SFAS No. 144, the Company accounts for the results of operations of a component of an entity that has been disposed or that meets all of the "held for sale" criteria, as discontinued operations, if the component's operations and cash flows have been (or will be) eliminated from the ongoing operations of the entity as a result of the disposal transaction and the Company will not have any significant continuing involvement in the operations of the component after the disposal transaction. The "held for sale" classification requires having the appropriate approvals by the Company's management, Board, and stockholders, as applicable, and meeting other criteria. When all of these criteria are met, the component is then classified as "held for sale" and its operations reported as discontinued operations.
At December 31, 2005, Valence and the Joint Venture were reclassified as discontinued operations. For the years ended December 31, 2007, 2006 and 2005, the Company's continuing operations represent the business activities of its licensing segment.
Income (Loss) Per Common Share
The Company applies SFAS No. 128,Earnings per Share ("SFAS No. 128"), which requires the disclosure of basic and diluted net income or loss per share for all current and prior periods. Basic net income or loss per common share is computed by dividing net income or loss available to common stockholders by the weighted average number of common shares outstanding during each year. Diluted net income or loss per common share reflects the maximum dilution, based on the average price of our common stock each period and is computed similar to basic income or loss per share except that the denominator is increased to include the number of additional shares that would have been outstanding if potentially dilutive stock options and warrants had been exercised.
51
SRS LABS, INC. AND SUBSIDIARIES
NOTES TO CONSOLIDATED FINANCIAL STATEMENTS (Continued)
1. Organization and Significant Accounting Policies (Continued)
Basic and diluted net income (loss) per share computed in accordance with SFAS No. 128 for the years ended December 31, 2007, 2006 and 2005 are as follows:
| | Years Ended December 31, | |||||||||||
|---|---|---|---|---|---|---|---|---|---|---|---|---|
| | 2007 | 2006 | 2005 | |||||||||
| BASIC EPS | ||||||||||||
| Numerator: | ||||||||||||
| Income from continuing operations | $ | 5,414,435 | $ | 3,066,132 | $ | 1,662,624 | ||||||
| Income (loss) from discontinued operations | — | 1,641,725 | (3,087,009 | ) | ||||||||
| Net income (loss) | $ | 5,414,435 | $ | 4,707,857 | $ | (1,424,385 | ) | |||||
| Denominator: Weighted average common shares outstanding | 16,154,313 | 14,955,889 | 14,117,795 | |||||||||
| Income from continuing operations per share | $ | 0.34 | $ | 0.21 | $ | 0.12 | ||||||
| Income (loss) from discontinued operations per share | $ | — | $ | 0.11 | $ | (0.22 | ) | |||||
| Net income (loss) per share | $ | 0.34 | $ | 0.31 | $ | (0.10 | ) | |||||
DILUTED EPS | ||||||||||||
| Numerator: | ||||||||||||
| Income from continuing operations | $ | 5,414,435 | $ | 3,066,132 | $ | 1,662,624 | ||||||
| Income (loss) from discontinued operations | — | 1,641,725 | (3,087,009 | ) | ||||||||
| Net income (loss) | $ | 5,414,435 | $ | 4,707,857 | $ | (1,424,385 | ) | |||||
| Denominator: Weighted average common shares outstanding | 16,154,313 | 14,955,889 | 14,117,795 | |||||||||
| Common equivalent shares outstanding: Dilutive options | 835,526 | 509,933 | 1,081,080 | |||||||||
| Total diluted common shares | 16,989,839 | 15,465,822 | 15,198,875 | |||||||||
| Income from continuing operations per share | $ | 0.32 | $ | 0.20 | $ | 0.11 | ||||||
| Income (loss) from discontinued operations per share | $ | — | $ | 0.11 | $ | (0.22 | ) | |||||
| Net income (loss) per share | $ | 0.32 | $ | 0.30 | $ | (0.10 | ) | |||||
There were options outstanding at December 31, 2007, 2006 and 2005 to purchase 542,660, 1,196,763 and 4,444,254 shares of the Company's common stock, respectively, that were not included above because they would be anti-dilutive.
Stock-Based Compensation
On January 1, 2006, the Company adopted the provisions of SFAS No. 123(R),Share-Based Payment ("SFAS No. 123(R)"), using the modified prospective application transition method. SFAS No. 123(R) requires measurement of all employee stock-based compensation awards using a fair-value method and recording of such expense in the consolidated financial statements over the requisite service period. Previously, we had applied the provisions of Accounting Principles Board Opinion No. 25,Accounting for Stock Issued to Employees ("APB 25") and related interpretations and elected to utilize the disclosure option of SFAS No. 123,Accounting for Stock-Based Compensation. In 2007, we recorded stock-based compensation expense of $1,727,017 under the fair-value provisions of SFAS No. 123(R), compared to $1,460,910 in 2006 and $55,802 in 2005 under the provisions of APB 25 and related interpretations. See Note 7.
52
SRS LABS, INC. AND SUBSIDIARIES
NOTES TO CONSOLIDATED FINANCIAL STATEMENTS (Continued)
1. Organization and Significant Accounting Policies (Continued)
Fair Value of Financial Instruments
Management believes the carrying amounts of cash and cash equivalents, accounts receivable, accounts payable and accrued liabilities approximate fair value due to the short period of time between origination of the instruments and their expected realization. The carrying amounts of investments available for sale are reported at fair value based on quoted market prices. See Note 2.
Customer Concentration
For fiscal year 2007, Samsung accounted for approximately 28% of the Company's consolidated revenues. For fiscal year 2006, Samsung and Sony accounted for approximately 17% and 11% of the Company's consolidated revenues, respectively. For fiscal year 2005, Samsung and Sony each accounted for approximately 13% of the Company's consolidated revenues. Given the significant amount of revenues derived from these customers, the loss of any such customer or the uncollectibility of related receivables could have a material adverse effect on the Company's consolidated financial condition and results of operations. During 2007, the Company was informed by Sony that they were no longer using our technology in the majority of their televisions. The Company is working with Sony to re-establish this relationship; however, the Company cannot guarantee that it will be successful in regaining any significant business from Sony.
Concentrations of Credit Risk
Financial instruments, which potentially subject the Company to concentrations of credit risk, consist primarily of cash equivalents, investments and accounts receivable. The Company places its cash in banks and its cash and cash equivalents in commercial paper and money market funds at certain financial institutions in excess of amounts insured by federal agencies. The Company does not believe that it is subject to any unusual financial risk beyond the normal risk associated with commercial banking relationships. The Company performs periodic evaluations of the relative credit standing of these financial institutions. Investments consist of U.S. government securities rated AAA. The Company has not experienced any significant losses on its cash equivalents or investments.
The Company's accounts receivables are derived from sales to OEMs, ODMs and platform partners primarily in Asia, North America and Europe. Customers' headquarters geographically located in the Asia Pacific markets accounted for approximately 90%, 91% and 84%, of the Company's revenues in 2007, 2006 and 2005, respectively, and are expected to continue to account for a substantial percentage of sales in the future. The Company makes periodic evaluations of the creditworthiness of its customers and manages its exposure to losses from bad debts by limiting the amount of credit extended whenever deemed necessary and generally does not require collateral. The Company maintains an allowance for estimated uncollectible accounts receivable and such losses have historically been within management's expectations.
Recent Accounting Pronouncements
In December 2007, the Financial Accounting Standards Board ("FASB") issued SFAS No. 141 (revised 2007),Business Combinations ("SFAS No. 141(R)"), which replaces SFAS No 141. SFAS 141(R) retains the purchase method of accounting for acquisitions, but requires a number of changes, including changes in the way assets and liabilities are recognized in the purchase accounting. It also changes the recognition of assets acquired and liabilities assumed arising from contingencies,
53
SRS LABS, INC. AND SUBSIDIARIES
NOTES TO CONSOLIDATED FINANCIAL STATEMENTS (Continued)
1. Organization and Significant Accounting Policies (Continued)
requires the capitalization of in-process research and development at fair value, and requires the expensing of acquisition-related costs as incurred. SFAS No. 141(R) is effective for us beginning January 1, 2009 and will apply prospectively to business combinations completed on or after that date.
In December 2007, the FASB also issued SFAS No. 160,Noncontrolling Interests in Consolidated Financial Statements, an amendment of ARB 51 ("SFAS No. 160"), which changes the accounting and reporting for minority interests. Minority interests will be recharacterized as noncontrolling interests and will be reported as a component of equity separate from the parent's equity, and purchases or sales of equity interests that do not result in a change in control will be accounted for as equity transactions. In addition, net income attributable to the noncontrolling interest will be included in consolidated net income on the face of the income statement and, upon a loss of control, the interest sold, as well as any interest retained, will be recorded at fair value with any gain or loss recognized in earnings. SFAS No. 160 is effective for us beginning January 1, 2009 and will apply prospectively, except for the presentation and disclosure requirements, which will apply retrospectively. We do not expect the adoption of SFAS No. 160 will have a material effect on our consolidated financial position or results of operations.
In July 2006, the FASB issued FASB Interpretation No. 48,Accounting for Uncertainty in Income Taxes ("FIN 48"). FIN 48 is an interpretation of SFAS No. 109,Accounting for Income Taxes, and it seeks to reduce the diversity in practice associated with certain aspects of measurement and recognition in accounting for income taxes. FIN 48 prescribes a recognition threshold and measurement attribute for the financial statement recognition and measurement of a tax position that an entity takes or expects to take in a tax return. Additionally, FIN 48 provides guidance on de-recognition, classification, interest and penalties, accounting in interim periods, disclosure, and transition. Under FIN 48, an entity may only recognize or continue to recognize tax positions that meet a "more likely than not" threshold. We adopted FIN 48 on January 1, 2007. As a result of adoption of FIN 48, we recognized no liability for unrecognized income tax benefits. Additionally, we recognized no interest and penalties related to uncertain tax positions and as of the year ended December 31, 2007, we have no accrued interest related to uncertain tax positions. The tax years 2003 through 2006 remain open to examination by the major taxing jurisdictions.
In February 2007, the FASB issued SFAS No. 159,The Fair Value Option for Financial Assets and Financial Liabilities ("SFAS No. 159"). SFAS No. 159 permits entities to choose to measure financial assets and liabilities (except for those that are specifically scoped out of the Statement) at fair value. The election to measure a financial asset or liability at fair value can be made on an instrument-by-instrument basis and is irrevocable. The difference between carrying value and fair value at the election date is recorded as a transition adjustment to opening retained earnings. Subsequent changes in fair value are recognized in earnings. The effective date for this Statement is as of the beginning of an entity's first fiscal year that begins after November 15, 2007. The Company will adopt SFAS No. 159, effective January 1, 2008. The Company does not expect the adoption of SFAS No. 159 to have a material impact on its consolidated financial position or results of operations.
In September 2006, the FASB issued SFAS No. 157,Fair Value Measurements ("SFAS No. 157"). The purpose of SFAS No. 157 is to define fair value, establish a framework for measuring fair value and enhance disclosures about fair value measurements. The measurement and disclosure requirements are effective for us beginning January 1, 2008. We do not expect the adoption of SFAS No. 157 will have a material effect on our consolidated financial position or results of operations.
54
SRS LABS, INC. AND SUBSIDIARIES
NOTES TO CONSOLIDATED FINANCIAL STATEMENTS (Continued)
2. Investments Available for Sale
Investments with maturities greater than one year from the balance sheet date are classified as long-term investments. The Company invests its excess cash in U.S. Treasury and agency securities rated "AAA", and tax-exempt securities with approved financial institutions with a minimum investment grade of "A1." The investments available for sale consist mainly of bonds and include only marketable securities with secondary or resale markets to ensure portfolio liquidity.
The following table summarizes the Company's investment securities available for sale:
| | December 31, | |||||||
|---|---|---|---|---|---|---|---|---|
| | 2007 | 2006 | ||||||
| U.S. Government securities available for sale: | ||||||||
| Cost | $ | 5,500,000 | $ | 5,500,000 | ||||
| Unrealized losses | (48,125 | ) | (273,295 | ) | ||||
| Estimated fair value | $ | 5,451,875 | $ | 5,226,705 | ||||
The contractual maturities of investments are shown below. Actual maturities may differ from contractual maturities.
| | December 31, 2007 | December 31, 2006 | |||||||||||
|---|---|---|---|---|---|---|---|---|---|---|---|---|---|
| | Cost | Estimated Fair Value | Cost | Estimated Fair Value | |||||||||
| U.S. Government securities available for sale: | |||||||||||||
| Due in one year or less | $ | — | $ | — | $ | — | $ | — | |||||
| Due in one to five years | 5,500,000 | 5,451,875 | 5,500,000 | 5,226,705 | |||||||||
| $ | 5,500,000 | $ | 5,451,875 | $ | 5,500,000 | $ | 5,226,705 | ||||||
The following table summarizes sales of available for sale securities for the years ended December 31, 2007, 2006 and 2005. Realized gains are included in other income, net in the accompanying consolidated statements of operations. Specific identification was used to determine costs in computing realized gains or losses.
| | Years Ended December 31, | ||||||||
|---|---|---|---|---|---|---|---|---|---|
| | 2007 | 2006 | 2005 | ||||||
| Proceeds from sale | $ | — | $ | 11,996,917 | $ | — | |||
| Realized gains | $ | — | $ | 3,125 | $ | — | |||
55
SRS LABS, INC. AND SUBSIDIARIES
NOTES TO CONSOLIDATED FINANCIAL STATEMENTS (Continued)
3. Property and Equipment
Property and equipment, net, consist of the following:
| | December 31, | ||||||
|---|---|---|---|---|---|---|---|
| | 2007 | 2006 | |||||
| Property and equipment | $ | 1,170,737 | $ | 1,198,726 | |||
| Computer equipment | 989,078 | 930,231 | |||||
| Leasehold improvements | 134,894 | 94,840 | |||||
| 2,294,709 | 2,223,797 | ||||||
| Less accumulated depreciation and amortization | (1,984,982 | ) | (1,834,130 | ) | |||
| $ | 309,727 | $ | 389,667 | ||||
Depreciation and amortization expense totaling $216,948, $246,098 and $225,669 for the years ended December 31, 2007, 2006 and 2005, respectively, is reflected in general and administrative expenses.
4. Intangible Assets
Intangible assets, net consist of the following:
| | December 31, | ||||||||
|---|---|---|---|---|---|---|---|---|---|
| | 2007 | 2006 | |||||||
| Patents | $ | 3,315,343 | $ | 2,715,250 | |||||
| Accumulated amortization | (1,622,954 | ) | (1,326,836 | ) | |||||
| Patents, net | 1,692,389 | 1,388,414 | |||||||
| Other intangibles: | |||||||||
| License agreements acquired in purchase of SRSWOWcast | 640,071 | 640,071 | |||||||
| Poly Planar purchased technology for speaker products | — | 120,000 | |||||||
| Capitalized software and hardware for several technologies | 663,310 | 658,942 | |||||||
| Total other intangibles | 1,303,381 | 1,419,013 | |||||||
| Accumulated amortization, other intangibles | (798,154 | ) | (762,288 | ) | |||||
| Other intangibles, net | 505,227 | 656,725 | |||||||
| Intangible assets, net | $ | 2,197,616 | $ | 2,045,139 | |||||
56
SRS LABS, INC. AND SUBSIDIARIES
NOTES TO CONSOLIDATED FINANCIAL STATEMENTS (Continued)
4. Intangible Assets (Continued)
Amortization periods range from three to ten years depending on the estimated useful life of the asset. Amortization expense consists of the following:
| | Years Ended December 31, | |||||||||
|---|---|---|---|---|---|---|---|---|---|---|
| | 2007 | 2006 | 2005 | |||||||
| Patents | $ | 296,118 | $ | 233,468 | $ | 202,190 | ||||
| Other intangibles: | ||||||||||
| License agreements acquired in purchase of SRSWOWcast | 64,007 | 64,007 | 64,007 | |||||||
| Poly Planar purchased technology for speaker products | — | — | 4,000 | |||||||
| Capitalized software and hardware for several technologies | 156,800 | 181,800 | 123,845 | |||||||
| Total intangible amortization expense | $ | 516,925 | $ | 479,275 | $ | 394,042 | ||||
As of December 31, 2007, the weighted average remaining useful life of the Company's patents and intangible assets was approximately 6.7 years. The following table shows the estimated amortization expense for those assets for each of the five succeeding fiscal years and thereafter.
| Years Ending December 31, | | |||
|---|---|---|---|---|
| 2008 | $ | 440,618 | ||
| 2009 | 337,665 | |||
| 2010 | 300,142 | |||
| 2011 | 280,262 | |||
| 2012 | 270,254 | |||
| Thereafter | 568,675 | |||
| Total | $ | 2,197,616 | ||
5. Commitments and Contingencies
Leases
The Company leases office space and certain equipment under non-cancelable operating leases expiring through 2008. The Company leases its corporate office and storage facilities located in Santa Ana, California, under a lease agreement with a partnership that is affiliated with a principal stockholder, who is also an executive officer and a director, of the Company. The lease is for a term of three years and expires on May 31, 2008. We intend to renew the lease. We paid rent of $230,256, $230,256 and $222,066 during 2007, 2006 and 2005, respectively.
Future annual minimum lease payments under non-cancelable operating leases for the remaining periods at December 31, 2007 are as follows:
| Year Ending December 31, | Facility-Related Party | Office Equipment | Total | ||||||
|---|---|---|---|---|---|---|---|---|---|
| 2008 | $ | 95,940 | $ | 13,372 | $ | 109,312 | |||
| 2009 | — | 10,073 | 10,073 | ||||||
| 2010 | — | 8,394 | 8,394 | ||||||
| Total | $ | 95,940 | $ | 31,839 | $ | 127,779 | |||
57
SRS LABS, INC. AND SUBSIDIARIES
NOTES TO CONSOLIDATED FINANCIAL STATEMENTS (Continued)
5. Commitments and Contingencies (Continued)
Litigation
On June 8, 2007, the Company sent a letter to Sony Corporation ("Sony") relating to the possible infringement of several SRS patents by Sony's S-Force technology. Sony responded to the letter by filing a Complaint for Declaratory Relief in the U.S. District Court in the Southern District of New York on July 6, 2007. In November 2007, Sony and SRS entered into a standstill agreement for the purpose of conducting discussions towards an amicable resolution of the dispute and the Complaint for Declaratory Relief was dismissed. SRS is unable to determine at this time the impact that this matter may have, if any, on its consolidated financial position, results of operations or cash flows. From time to time the Company may be involved in other litigation matters and disputes arising in the normal course of business. Any such matters and disputes could be costly and time consuming, subject the Company to damages or equitable remedies, and divert management and key personnel from the Company's business operations.
Indemnifications
The Company enters into standard license agreements in its ordinary course of business. Pursuant to these agreements, the Company agrees to indemnify its customers for losses suffered or incurred by them as a result of any patent, copyright, or other intellectual property infringement claim by any third party with respect to the Company's products. These agreements generally have perpetual terms. The maximum amount of indemnification the Company could be required to make under these agreements is generally limited to the license fees received by the Company. The Company estimates the fair value of its indemnification obligation as insignificant, based upon its history of litigation concerning product and patent infringement claims. Accordingly, the Company has no liabilities recorded for indemnification under these agreements as of December 31, 2007 and 2006.
The Company has agreements whereby its officers and directors are indemnified for certain events or occurrences while the officer or director is, or was, serving at our request in such capacity. The maximum potential amount of future payments the Company could be required to make under these indemnification agreements is unlimited; however, the Company has a directors and officers' insurance policy that reduces its exposure and enables the Company to recover a portion of any future amounts paid. As a result of the insurance policy coverage, the Company believes the estimated fair value of these indemnification agreements is minimal. Currently, the Company has no liabilities recorded for these agreements as of December 31, 2007 and 2006.
Warranties
The Company offers its customers a warranty that its software products will substantially conform to their functional specifications. To date, there have been no payments or material costs incurred related to fulfilling these warranty obligations. Accordingly, the Company has no liabilities recorded for these warranties as of December 31, 2007 and 2006. The Company assesses the need for a warranty reserve on a quarterly basis. There can be no guarantee that a warranty reserve will not become necessary in the future.
Employment Contracts
The Company has employment agreements with its Chief Executive Officer and four other employees (collectively "Agreements"). Each of the Agreements was entered into for an initial term that has since expired and all are now automatically renewed annually on various anniversary dates.
58
SRS LABS, INC. AND SUBSIDIARIES
NOTES TO CONSOLIDATED FINANCIAL STATEMENTS (Continued)
5. Commitments and Contingencies (Continued)
Under the terms of each of the Agreements, the Company may be obligated to pay a severance payment ranging from one to two years of the respective employee's base salary, depending on the date of termination, if the employee is terminated by the Company without cause.
Change in Control Plan
The Compensation Committee of the Board, the sponsor of the Company's 2005 Change in Control Protection Plan (the "Change in Control Plan"), has designated certain of its executive officers as participants in the Change in Control Plan. The Change in Control Plan generally provides that if a participant's employment is terminated without cause or if the participant resigns for good reason during a two-year period following a change in control, as defined in the Change in Control Plan, the participant will be entitled to receive a severance payment. Under the Change in Control Plan, the size of the severance payment that would be due to a participant upon the occurrence of a covered termination ranges from to one to two times the participant's average taxable income during the five years preceding the change in control, depending on the participant's position with the Company. The Change in Control Plan also provides that the Company will pay a participant's COBRA premiums for a period of 18 months following a covered termination.
6. Income Taxes
The components of income from continuing operations before income taxes are as follows:
| | Year Ended December 31, | |||||||
|---|---|---|---|---|---|---|---|---|
| | 2007 | 2006 | 2005 | |||||
| United States | 5,414,435 | $ | 3,934,335 | $ | 2,458,543 | |||
The provision for income taxes on continuing operations consists of the following:
| | Year Ended December 31, | |||||||||||
|---|---|---|---|---|---|---|---|---|---|---|---|---|
| | 2007 | 2006 | 2005 | |||||||||
| Current: | ||||||||||||
| Federal | $ | — | $ | (42,970 | ) | $ | 51,833 | |||||
| State | 45,558 | — | 17,127 | |||||||||
| Foreign | — | 905,148 | 726,959 | |||||||||
| Total | 45,558 | 862,178 | 795,919 | |||||||||
| Deferred: | ||||||||||||
| Federal | (929,588 | ) | 768,341 | (578,005 | ) | |||||||
| State | (29,273 | ) | 52,673 | 143,881 | ||||||||
| Foreign | — | 6,025 | — | |||||||||
| Change in valuation allowance, net | 958,861 | (821,014 | ) | 434,124 | ||||||||
| Total | — | 6,025 | — | |||||||||
| Total income tax provision | $ | 45,558 | $ | 868,203 | $ | 795,919 | ||||||
59
SRS LABS, INC. AND SUBSIDIARIES
NOTES TO CONSOLIDATED FINANCIAL STATEMENTS (Continued)
6. Income Taxes (Continued)
The reconciliation of the income tax expense computed at U.S. federal statutory rates to the provision for income taxes is as follows:
| | Year Ended December 31, | |||||||||
|---|---|---|---|---|---|---|---|---|---|---|
| | 2007 | 2006 | 2005 | |||||||
| Tax at U.S. federal statutory rates | $ | 1,856,398 | $ | 1,377,017 | $ | 835,905 | ||||
| State income taxes, net of federal benefit | 151,796 | 226,067 | 143,333 | |||||||
| Nondeductible expenses | 9,983 | 13,137 | 107,320 | |||||||
| Change in valuation allowance, net | (3,573,788 | ) | 821,014 | 434,126 | ||||||
| Research and development credit | (110,996 | ) | (220,712 | ) | (125,000 | ) | ||||
| Change in beginning deferred balance | — | — | (493,612 | ) | ||||||
| Foreign tax rate differential and other | 1,712,165 | (1,348,320 | ) | (106,153 | ) | |||||
| Total income tax expense | $ | 45,558 | $ | 868,203 | $ | 795,919 | ||||
Deferred income taxes reflect the net tax effects of temporary differences between the carrying amounts of assets and liabilities for financial reporting purposes and the amounts used for income tax purposes. Significant components of the Company's deferred tax assets are as follows:
| | December 31, | |||||||
|---|---|---|---|---|---|---|---|---|
| | 2007 | 2006 | ||||||
| Deferred tax assets: | ||||||||
| Depreciation and amortization | $ | 627,281 | $ | 621,615 | ||||
| Accruals | 553,051 | 233,815 | ||||||
| Net operating loss carryforwards | 4,359,101 | 4,233,982 | ||||||
| Tax credit carryforwards | 4,919,261 | 3,301,629 | ||||||
| Capital loss carryforwards | 6,460,261 | 6,460,261 | ||||||
| Other | 1,256,411 | 625,047 | ||||||
| Valuation allowance | (16,399,164 | ) | (15,089,937 | ) | ||||
| Total net deferred tax assets | $ | 1,776,202 | $ | 386,412 | ||||
The Company has deferred tax liabilities that are immaterial. The Company has federal and state net operating loss carryforwards at December 31, 2007 of approximately $13,596,056 and $5,206,235, respectively. These net operating loss carryforwards began to expire in 2005 and will continue to expire through 2026. The Company also has federal and state research credits of approximately $904,438 and $602,215, respectively, which will begin to expire in 2011. In addition, the Company has federal foreign tax credit carryforwards of approximately $3,412,608 at December 31, 2007, which will begin to expire in 2014. The Company also has federal and state capital loss carryforwards at December 31, 2007 of $16,219,585, which begin to expire in 2011.
As of December 31, 2007, a valuation allowance of $16,399,164 has been provided based on the Company's assessment of the future realizability of deferred tax assets. The valuation allowance on deferred tax assets relates to future deductible temporary differences, capital loss carryforwards, foreign credit carryforwards, research and development credit carryforwards, and net operating loss carryforwards for which the Company has concluded it is more likely than not that these items will not be realized in the ordinary course of operations. Management periodically evaluates the recoverability of the deferred tax assets and recognizes the tax benefit only as reassessment demonstrates they are
60
SRS LABS, INC. AND SUBSIDIARIES
NOTES TO CONSOLIDATED FINANCIAL STATEMENTS (Continued)
6. Income Taxes (Continued)
realizable. At such time it is determined that it is more likely than not that the deferred tax assets are realizable, the valuation allowance is adjusted. This assessment is based on projections of future taxable income, which is impacted in future periods by income before taxes and stock option exercises. The amount of the net deferred tax assets considered realizable, however, could be reduced in the near term if actual future earnings are lower than estimated, or if there are differences in the timing or amount of future reversals of existing taxable temporary differences. As a result of SFAS No. 123R, the Company's deferred tax assets at December 31, 2007 do not include approximately $3.1 million of excess tax benefits from employee stock option exercises that are a component of the Company's net operating loss carryovers. Equity will be increased by approximately $3.1 million if and when such excess tax benefits are ultimately realized.
The use of loss carryforwards and tax credit carry forwards may become limited in the event of an ownership change as defined under Internal Revenue Code section 382.
The Company adopted the provisions of FIN 48 at the beginning of fiscal year 2007. Upon adoption of FIN 48, no adjustment to the consolidated financial statements was required. FIN 48 provides a comprehensive model for the financial statement recognition, measurement, presentation and disclosure of uncertain tax positions taken or expected to be taken in income tax returns. Unrecognized tax benefits represent tax positions for which reserves have been established. The Company determined that it did not have any unrecorded tax contingencies and therefore a rollforward of the tax contingency reserve that reconciles the beginning and ending balance of the reserve was not necessary as there was no tax contingency reserve. The Company will recognize interest and penalties related to unrecognized tax benefits within the income tax expense line in the accompanying consolidated statement of operations. As of December 31, 2007, the Company has not recognized liabilities for penalty and interest as the Company does not have liability for unrecognized tax benefits. The tax years 2003 through 2006 remain open to examination by the major taxing jurisdictions.
7. Stockholders' Equity and Stock-Based Compensation
Stock Repurchases
On June 30, 2004, the Board authorized the repurchase of up to $3,000,000 of its outstanding common stock for a period from July 1, 2004 to December 31, 2004 (the "2004 Repurchase Program"). The Company repurchased 216,575 shares at a cost of $1,225,254 under the 2004 Repurchase Program.
On March 25, 2005, the Board authorized the repurchase of up to $3,000,000 of the Company's common stock for a period from April 17, 2005 to March 31, 2006 (the "2005 Repurchase Program"). All shares repurchased under the 2004 and 2005 Repurchase Program are reflected as treasury stock in the accompanying consolidated balance sheets. The Company repurchased 232,223 shares at a cost of $1,059,590 under the 2005 Repurchase Program. There was no activity under the 2005 Repurchase Program during 2006, and the program expired on March 31, 2006.
On September 29, 2006, the Company repurchased from certain members of management of Valence 357,625 shares of SRS common stock, which were obtained by them through the exercise of vested employee stock options, for an aggregate repurchase price of $2,114,586. Such shares were immediately canceled and were therefore not outstanding as of December 31, 2006. The repurchase price per share paid for such shares was equal to the average closing price of SRS common stock for the seven trading days ending three days prior to the closing date of the sale of Valence. See Note 11.
On November 6, 2007, the Company announced that the Board authorized the repurchase of up to $10,000,000 of its outstanding common stock for a period from November 12, 2007 to May 11, 2008. As of December 31, 2007, the Company repurchased 493,564 shares at a cost of $2,946,736 under this repurchase program.
61
SRS LABS, INC. AND SUBSIDIARIES
NOTES TO CONSOLIDATED FINANCIAL STATEMENTS (Continued)
7. Stockholders' Equity and Stock-Based Compensation (Continued)
Stock Award/Option Plans/Warrants
In July 1996, the Board adopted and the Company's stockholders approved the 1996 Long-Term Incentive Plan (as amended and restated, the "1996 Plan"), for which 1,000,000 shares of the Company's common stock were reserved for issuance to officers, employees and consultants of the Company. Prior to the adoption of the 2006 Plan (defined below), if any award granted under the 1996 Plan expires, terminates or is forfeited before the exercise thereof or the payment in full thereof, the shares covered by the unexercised or unpaid portion would have become available for new grants under the 1996 Plan. In June 1997, the Board and the Company's stockholders approved the amendment and restatement of the 1996 Plan, including an increase to the number of shares reserved for issuance under the plan by 1,000,000. In June 1998, the Board and the Company's stockholders approved an amendment to the 1996 Plan to increase the number of shares reserved for issuance under the plan by 2,500,000. Also in June 1998, in a separate amendment, the Board and the Company's stockholders approved an amendment to allow all directors of the Company and any subsidiary of the Company to participate in the 1996 Plan. In June 2000, the Board adopted and the Company's stockholders approved an amendment to the 1996 Plan to increase the number of shares reserved for issuance under the plan by 2,500,000. In June 2003, the Board and the Company's stockholders approved an amendment to the 1996 Plan to increase the number of shares reserved for issuance under the plan by 1,500,000. The Compensation Committee or, in the absence of a Compensation Committee, the Board, as a whole, has been appointed to administer the 1996 Plan. Options issued under the 1996 Plan vest in the manner prescribed by the Compensation Committee or the Board, as applicable. As of December 31, 2007, options to purchase 1,692,708 shares of the Company's common stock were outstanding under the 1996 Plan. No additional options will be granted under the 1996 Plan as of December 31, 2007.
In July 1996, the Board adopted and the Company's stockholders approved the 1996 Non-employee Directors Stock Option Plan (the "Non-employee Directors Plan"), a non-discretionary formula plan for which 120,000 shares of the Company's common stock were reserved for issuance to the Company's non-employee directors. A committee consisting of all directors who are not eligible to participate in the Non-employee Directors Plan administers the Non-employee Directors Plan. With the exception of the initial option granted to a non-employee director, which vests immediately, options granted under the Non-employee Directors Plan vest over a three-year period, the first installment vesting on the date of grant. In June 1999, the Company's stockholders approved the Amended and Restated 1996 Non-employee Directors' Stock Option Plan (the "Amended Non-employee Directors Plan"). Among the changes set forth in the Amended Non-employee Directors Plan was to increase by 130,000 the number of shares of common stock that may be issued under the plan. In June 2001, the Board adopted and the Company's stockholders approved an amendment to the Amended Non-employee Directors Plan to increase the number of shares reserved for issuance under the plan by 250,000. As of December 31, 2007, options to purchase 132,500 shares of common stock were outstanding under the Amended Non-employee Directors Plan. There are 325,000 shares of common stock available for grant under the Non-employee Directors Plan as of December 31, 2007.
On June 22, 2006, the Board adopted and the Company's stockholders approved the 2006 Stock Incentive Plan (the "2006 Plan"), for which 1,500,000 shares of the Company's common stock has been reserved for issuance under the plan provided that the Company shall not make additional awards under the 1996 Plan. Either the Board or a committee appointed by the Board (the "Committee") will
62
SRS LABS, INC. AND SUBSIDIARIES
NOTES TO CONSOLIDATED FINANCIAL STATEMENTS (Continued)
7. Stockholders' Equity and Stock-Based Compensation (Continued)
administer the 2006 Plan. The Compensation Committee is currently acting as the Committee for purposes of the 2006 Plan. Under the 2006 Plan, the Committee may grant options that are intended to qualify as incentive stock options. Additionally, the Committee may also grant share appreciation rights, restricted shares, restricted share units, unrestricted shares, deferred share units, and performance awards. The vesting period is dependent on the type of award granted and may be determined by the Committee. As of December 31, 2007, options to purchase 617,660 shares of common stock were outstanding under the 2006 Plan. There are 882,340 shares of common stock available for grant under the 2006 Plan as of December 31, 2007.
Stock-Based Compensation
In December 2004, the FASB issued SFAS No. 123(R). This Statement requires companies to expense the estimated fair value of stock options and similar equity instruments issued to employees over the requisite service period. SFAS No. 123(R) eliminates the alternative to use the intrinsic method of accounting provided for in APB 25, which generally resulted in an immaterial amount of compensation expense recorded in the financial statements related to the grant of stock options to employees if certain conditions were met. The pro forma impact from recognition of the estimated fair value of stock options granted to employees has been previously disclosed in the Company's footnotes as required under previous accounting rules.
On January 1, 2006, the Company adopted SFAS No. 123(R) using the modified prospective application method, which requires the Company to record compensation expense for all awards granted after the date of adoption, and for the unvested portion of previously granted awards that remain outstanding at the date of adoption. Accordingly, prior period amounts presented herein have not been restated to reflect the adoption of SFAS No. 123(R).
The following table illustrates the effect on net income and net income per share as if the Company had applied the fair value recognition provisions of SFAS No. 123(R) to periods prior to the Company's actual date of adoption to options granted under the Company's stock option plans. For purposes of this pro forma disclosure, the fair value of the options is estimated using a BSM option-pricing model and amortized on a straight-line basis to expense over the options' vesting period:
| | Year Ended December 31, 2005 | |||
|---|---|---|---|---|
| Net loss as reported | $ | (1,424,385 | ) | |
| Add: stock-based compensation expense included in reported net loss, net of 40% tax effect | 33,481 | |||
| Less: fair value of stock-based compensation expense | (1,136,471 | ) | ||
| Pro forma net loss | $ | (2,527,375 | ) | |
| Net loss per share: | ||||
| Basic, as reported | $ | (0.10 | ) | |
| Basic, pro forma | $ | (0.18 | ) | |
| Diluted, as reported | $ | (0.10 | ) | |
| Diluted, pro forma | $ | (0.18 | ) | |
63
SRS LABS, INC. AND SUBSIDIARIES
NOTES TO CONSOLIDATED FINANCIAL STATEMENTS (Continued)
7. Stockholders' Equity and Stock-Based Compensation (Continued)
Total compensation cost recognized in 2007 and 2006 pursuant to SFAS No. 123(R) is as follows:
| | Years Ended December 31, | ||||||
|---|---|---|---|---|---|---|---|
| | 2007 | 2006 | |||||
| Continuing Operations: | |||||||
| Sales and marketing | $ | 495,132 | $ | 515,762 | |||
| Research and development | 428,516 | 331,480 | |||||
| General and administrative | 803,369 | 512,525 | |||||
| Total compensation cost recognized in continuing operations | $ | 1,727,017 | $ | 1,359,767 | |||
| Total compensation cost recognized in discontinued operations | $ | — | $ | 101,143 | |||
| Total compensation cost recognized | $ | 1,727,017 | $ | 1,460,910 | |||
Option awards are generally granted with an exercise price equal to the market price of the Company's stock at the date of grant. Option awards generally have a term of 10 years and vest and become exercisable over a four-year service period.
The fair value of each share-based award is estimated on the grant date using the BSM option-pricing model. Expected volatilities are based on the historical volatility of the Company's stock price. The expected term of options granted subsequent to the adoption of SFAS No. 123(R) is derived using the simplified method as defined in the SEC's Staff Accounting Bulletin 107,Implementation of FASB 123(R). The risk-free rate for periods within the contractual life of the option is based on the U.S. Treasury interest rates in effect at the time of grant. The fair value of options granted was estimated using the following weighted-average assumptions:
| | Years Ended December 31, | ||||||
|---|---|---|---|---|---|---|---|
| | 2007 | 2006 | 2005 | ||||
| Expected term (in years) | 6.25 | 6.25 | 6.25 | ||||
| Expected volatility | 56 | % | 57 | % | 58 | % | |
| Risk-free interest rate | 4.8 | % | 4.9 | % | 4.1 | % | |
| Dividend yield | 0.00 | % | 0.00 | % | 0.00 | % | |
The following table summarizes the weighted-average fair value of stock options granted and the total intrinsic value of stock options exercised during the years ended December 31, 2007, 2006 and 2005:
| | Years Ended December 31, | ||||||||
|---|---|---|---|---|---|---|---|---|---|
| | 2007 | 2006 | 2005 | ||||||
| Weighted-average fair value at date of grant | $ | 5.66 | $ | 3.50 | $ | 3.25 | |||
| Intrinsic value of options exercised | $ | 2,846,841 | $ | 6,267,399 | $ | 575,008 | |||
64
SRS LABS, INC. AND SUBSIDIARIES
NOTES TO CONSOLIDATED FINANCIAL STATEMENTS (Continued)
7. Stockholders' Equity and Stock-Based Compensation (Continued)
A summary of option activity under the stock option plans and changes during the year ended December 31, 2007 is presented below:
| | | Weighted-Average | | |||||||
|---|---|---|---|---|---|---|---|---|---|---|
| | Shares | Exercise Price | Remaining Contractual Term (in Yrs) | Aggregate Intrinsic Value | ||||||
| Outstanding, January 1, 2007 | 2,360,088 | $ | 4.91 | |||||||
| Granted | 526,520 | 9.63 | ||||||||
| Cancelled/Forfeited | 58,399 | 6.76 | ||||||||
| Exercised | 385,341 | 4.78 | ||||||||
| Outstanding, December 31, 2007 | 2,442,868 | $ | 5.90 | 6.42 | $ | 1,738,516 | ||||
| Options exercisable, December 31, 2007 | 1,492,892 | $ | 4.67 | 5.01 | $ | 1,710,044 | ||||
The following table summarizes information concerning currently outstanding and exercisable options and warrants at December 31, 2007:
| Range of Exercise Prices | Number of Options Outstanding | Weighted Average Remaining Contractual Life (in Years) | Weighted Average Exercise Price | Exercisable As of 12/31/2007 | Weighted Average Exercise Price | |||||||
|---|---|---|---|---|---|---|---|---|---|---|---|---|
| $1.91–$3.80 | 623,474 | 3.4 | $ | 2.92 | 623,474 | $ | 2.92 | |||||
| $3.81–$5.70 | 441,979 | 6.7 | 4.87 | 330,541 | 4.79 | |||||||
| $5.71–$7.60 | 848,255 | 7.0 | 6.06 | 508,877 | 6.06 | |||||||
| $7.61–$9.50 | 364,160 | 9.1 | 9.29 | — | — | |||||||
| $9.51–$11.40 | 145,000 | 9.0 | 10.62 | 10,000 | 10.56 | |||||||
| $17.10–$19.00 | 20,000 | 2.2 | 19.00 | 20,000 | 19.00 | |||||||
| 2,442,868 | 6.4 | $ | 5.90 | 1,492,892 | $ | 4.67 | ||||||
The total shares subject to options exercisable as of December 31, 2007, 2006 and 2005 were 1,492,892, 1,538,920 and 3,248,290, respectively, with weighted average exercise prices of $4.67, $4.46 and $4.16, respectively.
8. Segment Information
The Company previously operated in two business segments—semiconductors and licensing. However, as a result of selling Valence, the semiconductor business, the Company now has continuing operations in only one business segment, licensing. The Company's revenue from continuing operations is solely derived from licensing related revenue.
The following schedule presents the Company's revenue by geographic area. For product sales, revenue is allocated based on the country to which product was shipped. Licensing-related revenue is summarized based on the location of the licensee's corporate headquarters. For product and online
65
SRS LABS, INC. AND SUBSIDIARIES
NOTES TO CONSOLIDATED FINANCIAL STATEMENTS (Continued)
8. Segment Information (Continued)
sales, revenue is allocated to the Americas. The Americas region includes North, Central and South America. The Greater China region includes China, Taiwan and Hong Kong.
| | Years Ended December 31, | |||||||||||||||||
|---|---|---|---|---|---|---|---|---|---|---|---|---|---|---|---|---|---|---|
| | 2007 | % | 2006 | % | 2005 | % | ||||||||||||
| Geographic Area Revenue: | ||||||||||||||||||
| Korea | $ | 7,834,730 | 42 | % | $ | 5,652,550 | 30 | % | $ | 3,980,660 | 27 | % | ||||||
| Japan | 7,346,548 | 39 | 8,115,378 | 44 | 5,564,809 | 38 | ||||||||||||
| Americas | 1,837,096 | 9 | 1,534,421 | 8 | 2,024,269 | 14 | ||||||||||||
| Greater China | 1,649,591 | 9 | 3,165,572 | 17 | 2,763,646 | 19 | ||||||||||||
| Europe | 183,975 | 1 | 79,608 | 1 | 275,094 | 2 | ||||||||||||
| Total | $ | 18,851,940 | 100 | % | $ | 18,547,529 | 100 | % | $ | 14,608,478 | 100 | % | ||||||
9. Related-Party Transactions
The Company leases its corporate office and storage facilities located in Santa Ana, California under a lease agreement with a partnership that is affiliated with a stockholder, officer and director of the Company. The lease has a term of three years, and expires on May 31, 2008. We paid the partnership rent of $230,256, $230,256 and $222,066 during 2007, 2006 and 2005, respectively. See Note 5.
10. Employee Benefit Plan
The Company's employees based in the United States may participate in a salary deferral plan (the "401(k) Plan") in which eligible employees can contribute up to 75% of their eligible compensation. The Company also may contribute on a discretionary basis. The Company's matching contribution vests ratably over a four year period. During the years ended December 31, 2007, 2006 and 2005, the Company contributed approximately $126,675, $114,372 and $93,700, respectively, to the 401(k) Plan.
11. Discontinued Operations
Valence: Through its former subsidiary, Valence, the Company operated a fabless semiconductor business which developed, designed and marketed standard and custom analog ICs, digital signal processors, and mixed signal integrated circuits primarily to OEMs and ODMs in the Asia Pacific region.
On February 23, 2006, the Board of Directors approved a plan to sell Valence in order to focus management's attention and the Company's financial resources on its licensing business. On July 14, 2006, the Company entered into a definitive Sale and Purchase Agreement to sell Valence to Noblehigh Enterprises Inc. ("Noblehigh"). Noblehigh is owned by Willas Array Electronics (Holding) Limited as well as certain members of management of Valence (the "Management Buyers"). The sale transaction was completed on September 29, 2006 and, accordingly, the results of the operations of Valence and its cash flows through the date of sale are reported as discontinued operations in all periods presented. The transaction did not require approval by SRS's stockholders.
The sale to Noblehigh was effected through two simultaneous transactions: (1) the repurchase by Valence of approximately 74% of the outstanding shares of Valence from SRS using its existing cash
66
SRS LABS, INC. AND SUBSIDIARIES
NOTES TO CONSOLIDATED FINANCIAL STATEMENTS (Continued)
11. Discontinued Operations (Continued)
and (2) the purchase by Noblehigh of the remaining outstanding shares of Valence from SRS for $4.3 million. The sale resulted in a gain on the disposal, which is reflected in the accompanying consolidated financial statement of operations for 2006, calculated as follows:
| Cash proceeds from sale | $ | 4,300,000 | ||
| Less: Transaction costs | (924,450 | ) | ||
| Net proceeds | 3,375,550 | |||
| Net assets sold | (3,137,925 | ) | ||
| Gain on sale of Valence | $ | 237,625 | ||
Additionally, the Company repurchased from the Management Buyers 357,625 shares of SRS common stock, which were obtained by the Management Buyers through the exercise of vested employee stock options, for an aggregate repurchase price of $2,114,586. Such shares were immediately canceled and were therefore not outstanding as of December 31, 2006. The repurchase price per share paid for such shares was equal to the average closing price of SRS common stock for the seven trading days ending three days prior to the closing date of the sale of Valence.
CHS/SRS LLC: In September 2004, the Company entered into a strategic alliance with Coming Home Studios LLC, to use and promote SRS Labs' technologies, to promote CHS productions and to promote each company's respective brands. In connection with the strategic alliance, the Company and CHS established a joint venture, CHS/SRS, LLC, to produce and distribute nine concert videos featuring SRS Labs' Circle Surround technology. Initially, CHS was the manager of the Joint Venture; however, the Company became the manager of the Joint Venture in July 2005. As a result of becoming the manager of, and providing financial support to, the Joint Venture, the Company was required under FASB Interpretation No. 46,Consolidation of Variable Interest Entities, to consolidate the financial statements of the Joint Venture into its consolidated financial statements commencing with the third quarter of fiscal 2005. Previously, the Company accounted for its 50% equity ownership in the Joint Venture as an investment using the equity method.
The Company recorded an asset impairment charge of $3.3 million related to our investment in the Joint Venture in the fourth quarter of fiscal 2005. On February 23, 2006, the Board authorized management to divest its entire equity interest in the Joint Venture. The transaction did not require approval by SRS stockholders. As a result of its decision to sell its interest in the Joint Venture, the Company has accounted for the Joint Venture as a discontinued operation in the consolidated financial statements for all periods presented. On June 30, 2006, the Company completed the sale of its interest in the Joint Venture to CHS in exchange for $200,000, the rights to all cash assets of the Joint Venture, and a promissory note in the amount of $175,000. The Company recorded a gain on disposal of its interest in the Joint Venture of $387,021 in the Company's accompanying consolidated statement of operations for the year ended December 31, 2006. Any amounts related to the promissory note and accrued interest thereon will be recorded at the time the cash is received by SRS.
Income from discontinued operations consists of direct revenues and direct expenses of Valence and the Joint Venture. General corporate overhead costs have not been allocated to discontinued
67
SRS LABS, INC. AND SUBSIDIARIES
NOTES TO CONSOLIDATED FINANCIAL STATEMENTS (Continued)
11. Discontinued Operations (Continued)
operations. A summary of the operating results of Valence and the Joint Venture included in discontinued operations in the accompanying consolidated statements of operation is as follows:
| | Years Ended December 31, | ||||||
|---|---|---|---|---|---|---|---|
| | 2006 | 2005 | |||||
| Valence: | |||||||
| Revenues. | $ | 7,682,931 | $ | 8,432,449 | |||
| Cost of sales | 3,562,750 | 3,411,649 | |||||
| Gross margin | 4,120,181 | 5,020,800 | |||||
| Total operating expenses | 3,193,519 | 5,056,831 | |||||
| Income (loss) from operations | 926,662 | (36,031 | ) | ||||
| Other income (expense), net | 31,669 | (3,302 | ) | ||||
| Income (loss) before income tax expense | 958,331 | (39,333 | ) | ||||
| Income tax expense (benefit) | 33,632 | (175,026 | ) | ||||
| Net income from Valence | 924,699 | 135,693 | |||||
| Net income (loss) from Joint Venture | 92,380 | (3,222,702 | ) | ||||
| Net income (loss) from discontinued operations, net of taxes | 1,017,079 | (3,087,009 | ) | ||||
| Gain on disposal of discontinued operations | 624,646 | — | |||||
| Total income (loss) from discontinued operations | $ | 1,641,725 | $ | (3,087,009 | ) | ||
68
SCHEDULE II
VALUATION AND QUALIFYING ACCOUNTS AND RESERVES
| | Balance at Beginning of Period | Additions Charged to Expense | Deductions | Balance at End of Period | |||||||||
|---|---|---|---|---|---|---|---|---|---|---|---|---|---|
| For the year ended December 31, 2007: | |||||||||||||
| Allowance for doubtful accounts | $ | 39,256 | $ | 108,321 | $ | 74,863 | $ | 72,714 | |||||
| For the year ended December 31, 2006: | |||||||||||||
| Allowance for doubtful accounts | $ | 38,011 | $ | 19,594 | $ | 18,349 | $ | 39,256 | |||||
| For the year ended December 31, 2005: | |||||||||||||
| Allowance for doubtful accounts | $ | — | $ | 38,011 | $ | — | $ | 38,011 | |||||
69
| Exhibit Number | Description | |
|---|---|---|
| 3.1 | Certificate of Incorporation of the Company, previously filed with the SEC as Exhibit 3.1 to the Company's Registration Statement on Form SB-2, specifically included in Amendment No. 1 to such Registration Statement filed with the SEC on July 3, 1996 (File No. 333-4974-LA) (the "Registration Statement Amendment No. 1"), which is incorporated herein by reference. | |
3.2 | Bylaws of the Company, previously filed with the SEC as Exhibit 3.1 to the Company's Quarterly Report on Form 10-Q for the period ended September 30, 1999, filed with the SEC on November 12, 1999, which is incorporated herein by reference. | |
Material Contracts Relating to Management Compensation Plans or Arrangements | ||
10.1 | Employment Agreement dated July 1, 1996, between the Company and Thomas C.K. Yuen, previously filed with the SEC as Exhibit 10.8 to the Registration Statement Amendment No. 1, which is incorporated herein by reference. | |
10.2 | Amendment to Employment Agreement dated as of March 14, 1997, between the Company and Thomas C.K. Yuen, previously filed with the SEC as Exhibit 10.2 to the Company's Annual Report on Form 10-KSB for the fiscal year ended December 31, 1996, filed with the SEC on March 31, 1997 (the "1996 Annual Report"), which is incorporated herein by reference. | |
10.3 | Employment Agreement dated July 1, 1996, between the Company and Alan D. Kraemer, previously filed with the SEC as Exhibit 10.11 to the Registration Statement Amendment No. 1, which is incorporated herein by reference. | |
10.4 | SRS Labs, Inc. Amended and Restated 1996 Non-employee Directors Stock Option Plan, as amended, previously filed with the SEC as Appendix B to the Company's Definitive Proxy Statement dated and filed with the SEC on April 30, 2003, which is incorporated herein by reference. | |
10.5 | Form of Indemnification Agreement, previously filed with the SEC as Exhibit 10.20 to the Registration Statement Amendment No. 1, which is incorporated herein by reference. | |
10.6 | Non-employee Director Compensation Policy adopted by the Company's Board of Directors on January 28, 2005, previously filed with the SEC as Exhibit 10.1 to the Company's Current Report on Form 8-K filed with the SEC on February 3, 2005, which is incorporated herein by reference. | |
10.7 | Form of Non-Employee Director Stock Option Agreement under the SRS Labs, Inc. Amended and Restated 1996 Non-Employee Directors' Stock Option Plan (Initial Appointment), previously filed with the SEC as Exhibit 10.2 to the Company's Current Report on Form 8-K file with the SEC on February 3, 2005, which is incorporated herein by reference. | |
10.8 | Form of Non-Employee Director Stock Option Agreement under the SRS Labs, Inc. Amended and Restated 1996 Non-Employee Directors' Stock Option Plan (Re-Election), previously filed with the SEC as Exhibit 10.3 to the Company's Current Report on Form 8-K file with the SEC on February 3, 2005, which is incorporated herein by reference. | |
10.9 | Form of Non-Employee Director Stock Option Agreement under the SRS Labs, Inc. Amended and Restated 1996 Long-Term Incentive Plan, previously filed with the SEC as Exhibit 10.4 to the Company's Current Report on Form 8-K file with the SEC on February 3, 2005, which is incorporated herein by reference. |
10.10 | Form of Nonqualified Stock Option Agreement under the SRS Labs, Inc. Amended and Restated 1996 Long-Term Incentive Plan dated March 29, 2005 (With Schedule of Optionees Attached—Thomas C.K. Yuen, Janet M. Biski, Alan D. Kraemer, Philip Wong and Jennifer Drescher), previously filed with the SEC as Exhibit 10.1 to the Company's Current Report Form 8-K filed with the SEC on April 4, 2005, which is incorporated herein by reference. | |
10.11 | SRS Labs, Inc. 2005 Change in Control Protection Plan approved April 27, 2005, previously filed with the SEC as Exhibit 10.1 to the Company's Current Report on Form 8-K filed with the SEC on May 3, 2005, which is incorporated herein by reference. | |
10.12 | Form of Participation Agreement under the SRS Labs, Inc. 2005 Change in Control Protection Plan for Selected Executive Officers (With Schedule of Parties Attached—Thomas C.K. Yuen, Janet M. Biski and Alan D. Kraemer) approved April 27, 2005, previously filed with the SEC as Exhibit 10.2 to the Company's Current Report on Form 8-K filed with the SEC on May 3, 2005, which is incorporated herein by reference. | |
10.13 | SRS Labs, Inc. Amended and Restated 1996 Long-Term Incentive Plan, as amended, approved April 27, 2005, previously filed with the SEC as Exhibit 10.5 to the Form 8-K filed with the SEC on May 3, 2005, which is incorporated herein by reference. | |
10.14 | Employment Letter Agreement dated June 24, 2005 by and between the Company and Michael Franzi, previously filed with the SEC as Exhibit 10.1 to the Company's Current Report on Form 8-K filed with the SEC on August 18, 2005, which is incorporated herein by reference. | |
10.15 | Stock Option Agreement dated August 17, 2005 by and between the Company and Michael Franzi, previously filed with the SEC as Exhibit 10.2 to the Company's Current Report on Form 8-K filed with the SEC on August 18, 2005, which is incorporated herein by reference. | |
10.16 | Employment Letter Agreement dated December 21, 2005 by and between the Company and Ulrich E. Gottschling, previously filed with the SEC as Exhibit 99.1 to the Company's Current Report on Form 8-K filed with the SEC on December 29, 2005, which is incorporated herein by reference. | |
10.17 | Participation Agreement for Ulrich E. Gottschling under the SRS Labs, Inc. 2005 Change in Control Protection Plan, dated January 12, 2006, previously filed with the SEC as Exhibit 99.1 to the Company's Current Report on Form 8-K filed with the SEC on January 18, 2006, which is incorporated herein by reference. | |
10.18 | Participation Agreement for Michael Franzi under the SRS Labs, Inc. 2005 Change in Control Protection Plan, dated January 12, 2005, previously filed with the SEC as Exhibit 99.2 to the Company's Current Report on Form 8-K filed with the SEC on January 18, 2006, which is incorporated herein by reference. | |
10.19 | Form of Nonqualified Stock Option Agreement under the SRS Labs, Inc. 1996 Amended and Restated Long-Term Incentive Plan, as amended, previously filed with the SEC as Exhibit 99.8 to the Company's Current Report on Form 8-K filed with the SEC on January 18, 2006, which is incorporated herein by reference. |
10.20 | SRS Labs, Inc. 2006 Stock Incentive Plan, as approved by the Company's shareholders on June 22, 2006, previously filed with the SEC as Exhibit 10.1 to the Company's Current Report on Form 8-K filed with the SEC on June 28, 2006, which is incorporated herein by reference. | |
10.21 | Salary adjustment for Alan Kraemer, Executive Vice President, Chief Technology Officer, Sarah Yang, Vice President, Software Engineering and Michael Franzi, Vice President, Sales Licensing, as approved on February 8, 2007, previously filed with the SEC on the Company's Current Report on Form 8-K filed with the SEC on February 13, 2007, which is incorporated herein by reference. | |
10.22 | SRS Labs, Inc. Profit Sharing and Bonus Plan, as amended on June 20, 2007, previously filed with the SEC as Exhibit 10.1 to the Company's Current Report on Form 8-K filed with the SEC on June 25, 2007, which is incorporated herein by reference. | |
10.23 | SRS Labs, Inc. stock repurchase program, previously filed with the SEC in the Company's Current Report on Form 8-K on November 6, 2007, which is incorporated herein by reference. | |
10.24 | SRS Labs, Inc. 2006 Stock Incentive Plan, as amended on December 17, 2007, previously filed with the SEC as Exhibit 10.1 to the Company's Current Report on Form 8-K filed with the SEC on December 21, 2007, which is incorporated herein by reference. | |
10.25 | Salary adjustment for Alan Kraemer, Executive Vice President, Chief Technology Officer, Ulrich Gottschling, Chief Financial Officer, and Sarah Yang, Vice President, Software Engineering, as approved on January 2, 2008, previously filed with the SEC on the Company's Current Report on Form 8-K filed with the SEC on January 7, 2008, which is incorporated herein by reference. | |
Other Material Contracts | ||
10.26 | License Agreement dated as of June 27, 1988, between Hughes Aircraft and Sony Corporation, as amended and assigned to the Company, previously filed with the SEC as Exhibit 10.6 to the Company's Registration Statement on Form SB-2, specifically included in Amendment No. 3 to such Registration Statement filed with the SEC on August 7, 1996 (File No. 333-4974-LA), which is incorporated herein by reference. | |
10.27 | Industrial Real Estate Lease dated May 30, 1997, between the Company and Daimler Commerce Partners, L.P., previously filed with the SEC as Exhibit 10.1 to the Company's Quarterly Report on Form 10-QSB for the quarterly period ended June 30, 1997, filed with the SEC on August 13, 1997, which is incorporated herein by reference. | |
10.28 | Stock Divestment Agreement dated July 1, 1996, between the Company, Thomas C.K. Yuen, Stephen V. Sedmak and Walter W. Cruttenden III, previously filed with the SEC as Exhibit 10.17 to the Company's Registration Statement on Form SB-2, specifically included in Amendment No. 2 to such Registration Statement file with the SEC on August 2, 1996 (File No. 333-4974-LA), which is incorporated herein by reference. | |
21 | Subsidiaries of the Company. | |
23.1 | Consent of Independent Registered Public Accounting Firm, Squar, Milner, Peterson, Miranda & Williamson, LLP, dated March 12, 2008. |
23.2 | Consent of Independent Registered Public Accounting Firm, BDO Seidman LLP, dated March 13, 2008. | |
31.1 | Certification of the Chief Executive Officer of SRS Labs, Inc., pursuant to Section 302 of the Sarbanes-Oxley Act of 2002. | |
31.2 | Certification of the Chief Financial Officer of SRS Labs, Inc., pursuant to Section 302 of the Sarbanes-Oxley Act of 2002. | |
32.1 | Certification of Chief Executive Officer of SRS Labs, Inc., pursuant to 18 U.S.C. Section 1350, as adopted pursuant to Section 906 of the Sarbanes-Oxley Act of 2002. | |
32.2 | Certification of Chief Financial Officer of SRS Labs, Inc., pursuant to 18 U.S.C. Section 1350, as adopted pursuant to Section 906 of the Sarbanes-Oxley Act of 2002. |
SRS LABS, INC. Annual Report on Form 10-K Table of Contents
SPECIAL NOTE REGARDING FORWARD-LOOKING STATEMENTS
PART I
- Item 1A. Risk Factors
Item 1B. Unresolved Staff Comments.
Item 2. Properties
Item 3. Legal Proceedings
Item 4. Submission of Matters to a Vote of Security Holders
Equity Compensation Plan Information
COMPARISON OF 5 YEAR CUMULATIVE TOTAL RETURN* Among SRS Labs, Inc., The S&P Smallcap 600 Index And A Peer Group
- Item 6. Selected Financial Data
Item 7. Management's Discussion and Analysis of Financial Condition and Results of Operation
- Item 7A. Quantitative and Qualitative Disclosures About Market Risk
Item 8. Financial Statements and Supplementary Data
Item 9. Changes in and Disagreements with Accountants on Accounting and Financial Disclosure
Item 9A. Controls and Procedures
Item 9B. Other Information
- Item 10. Directors, Executive Officers and Corporate Governance
Item 11. Executive Compensation
Item 12. Security Ownership of Certain Beneficial Owners and Management and Related Stockholder Matters
Item 13. Certain Relationships and Related Transactions, and Director Independence
Item 14. Principal Accounting Fees and Services
EXHIBIT INDEX
SIGNATURES
REPORT OF INDEPENDENT REGISTERED PUBLIC ACCOUNTING FIRM
REPORT OF INDEPENDENT REGISTERED PUBLIC ACCOUNTING FIRM
SRS LABS, INC. AND SUBSIDIARIES CONSOLIDATED BALANCE SHEETS
SRS LABS, INC. AND SUBSIDIARIES CONSOLIDATED STATEMENTS OF OPERATIONS
SRS LABS, INC. AND SUBSIDIARIES CONSOLIDATED STATEMENTS OF STOCKHOLDERS' EQUITY AND COMPREHENSIVE INCOME (LOSS)
SRS LABS, INC. AND SUBSIDIARIES CONSOLIDATED STATEMENTS OF CASH FLOWS
SRS LABS, INC. AND SUBSIDIARIES NOTES TO CONSOLIDATED FINANCIAL STATEMENTS
SCHEDULE II VALUATION AND QUALIFYING ACCOUNTS AND RESERVES
EXHIBIT INDEX