UNITED STATES
SECURITIES AND EXCHANGE COMMISSION
WASHINGTON, D.C. 20549
FORM 6-K
REPORT OF FOREIGN PRIVATE ISSUER
PURSUANT TO RULE 13a-16 OR 15d-16
OF THE SECURITIES EXCHANGE ACT OF 1934
For the month of March 2014
ALON BLUE SQUARE ISRAEL LTD.
(translation of registrant’s name into English)
Europark Yakum, France Building,
Yakum 60972 Israel
(Address of principal executive offices)
Indicate by check mark whether the registrant files or will file annual reports under cover of Form 20-F or Form 40 F:
Form 20-F x Form 40-F¨
Indicate by check mark if the registrant is submitting the Form 6-K in paper as permitted by Regulation S-T Rule 101(b)(1): ______
Indicate by check mark if the registrant is submitting the Form 6-K in paper as permitted by Regulation S-T Rule 101(b)(7): ______
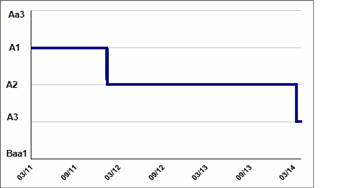
Alon Blue Square Israel Ltd. (NYSE: BSI) (the "Company") announced today that Midroog Ltd. (an Israeli rating agency, a 51% subsidiary of Moody’s ("Midroog")) has reaffirmed the P-1 rating for NIS 120 million in commercial paper (CPs) issued by the Company. The CP rating is valid until March 17, 2015. Midroog also issued an update to its rating of the Company's Series A and Series C debentures, from "A2" with a negative outlook to "A3" with a stable outlook. An A3/stable rating has also been assigned to bonds of up to NIS 150 million par value, which the Company is considering issuing by expanding Series C bonds or by issuing a new series.
Attached to this Form 6-K is an unofficial English translation of the Midroog report, provided by Midroog, as well as a related Consent of Rating Agency.
SIGNATURES
Pursuant to the requirements of the Securities Exchange Act of 1934, the registrant has duly caused this report to be signed by the undersigned, thereunto duly authorized.
| ALON BLUE SQUARE ISRAEL LTD. | |||
| March 18, 2014 | By: | /s/ Ortal Klein | |
| Ortal Klein, Adv. | |||
| Corporate Secretary | |||
| 2 |

Alon Blue Square Israel Ltd.
Rating ActionMarch 2014
Authors:
Elad Seroussi, Senior Analyst
elads@midroog.co.il
Liat Kadish, CPA, Team Leader
liatk@midroog.co.il
Contacts:
Sigal Issachar, Head of Corporate Finance
i.sigal@midroog.co.il

| 3 |
Alon Blue Square Israel Ltd.
| Issue/Bond Rating | A3 | Outlook: Stable | ||
| Commercial Paper | Prime -1 |
Midroog announces a downgrade of the Series A and C bonds issued by Alon Blue Square Israel Ltd. (“Alon Blue Square” or the "Company” or the "Group") from A2 to A3, with a stable outlook. An A3/stable rating is also assigned to bonds of up to NIS 150 million par value, which the Company is considering issuing by expanding Series C bonds or by issuing a new series.The proceeds of the bonds are earmarked for debt refinancing and for financing current operations.Midroog also reaffirms the P-1 rating for NIS 120 million in commercial papers, (CPs) issued by the Company. The CP rating is valid until March 17, 2015.
The issue rating relates to its structure based on data submitted to Midroog up to March 17, 2014. Midroog may reconsider and revise the rating assigned depending on the structure of the issue, if carried out.
Following is a breakdown of the series of bonds in circulation issued by the Company and rated by Midroog:
| Bond Series | Stock No. | Original Date of Issue | Fixed Annual Coupon | Linkage | Book Value of Bond Balance on September 30, 2013 (NIS M)* | Remainder of Bond Repayment Years | ||||||||||||||||
| A | Non-negotiable | Aug-03 | 5.90 | % | CPI | 82.0 | 2014 | |||||||||||||||
| C | 1121334 | Oct-10 | 2.50 | % | CPI | 215.0 | 2014-2022 |
* In November 2013 the Company expanded the Series C bonds by about NIS 62 million par value, while repaying about NIS 21.5 million par value of Series C.
| 4 |
| Key Rating Rationale |
The present rating downgrade, following the posting of a negative outlook in May 2013, reflects the erosion in the Group's financial results at a level no longer commensurate with the previous rating. This is primarily due to a continued decline in the business standing of Mega Retail Ltd. ("Mega"), a fully-owned subsidiary of the Company and one of its three main operating arms, which also include Dor Alon Energy in Israel (1988) Ltd. ("Dor Alon") and Blue Square Real Estate Ltd. ("Blue Square Real Estate").
The operations of Mega, which coordinates the Group's supermarket segment, is an integral part of the entire group's credit risk analysis, as reflected in its size in relation to the Group's total turnover, the managerial resources invested in it and the extent of its influence on the Group's overall strategy. The operating performances of the supermarket segment in the first nine months of 2013 were much weaker than previously forecasted, largely owing to a one-time reduction of the gross margin and a reduction in market shares, due to the sale of money-losing stores and a decline in same store sales.
In the past year, Mega management formulated an in-depth strategy for boosting revenues by repositioning the discount chain and improving the price perception and value proposition, cutting back losses by revamping stores and fundamentally improving the supply chain. We believe that the success of this complex process will only be determined in the medium term. So far, it is challenged by a tough business environment characterized by fierce competition in the food sector alongside choosier customer demands than in the past, a slowdown in growth and a certain rise in unemployment. In our assessment, Mega has a limited ability to adjust material operating expenses (e.g. wages and rent) to the declining pace of revenues, which reduces its maneuverability in a challenging business environment. The power of the longstanding chain is drawn, among other things, from its economies of scale vis-a-vis suppliers, a significant supply chain and centrally-located stores, mostly owned by the Group and mainly the sub-chain "Mega in town". With the implementation of the strategic plan, we expect a certain improvement in Mega's operating profitability in 2014 and a moderation in the erosion of revenues.
The Group has two additional operating arms: Dor Alon and Blue Square Real Estate, which maintain stability, although we should mention that the bulk of the latter's income is based on rent from Mega. The erosion in Mega's EBIT has sharply impacted the results of the overall group. Profit stability, as evaluated by Midroog, is a negative factor in the rating.
| 5 |
Blue Square Real Estate (A1 CR) and Dor Alon (A2 St) both have strong business and financial profiles. Dor Alon posts large market shares in the fuel marketing sector, a large nationwide chain of gas stations under the Dor Alon and Alonit brands, and a stable financial profile which has demonstrated stable profitability in recent years, while regularly raising dividends to the parent company. Blue Square Real Estate has grown consistently in profitability and demonstrates gradual growth in the volume of its operations, a gradual reduction in the risk profile of the Tel Aviv Wholesale Market Project, particularly after having received a construction loan for the project, an increase in its portfolio of properties and less dependence on Mega, as a major leaseholder. In recent years, Blue Square Real Estate, which holds unencumbered properties worth about NIS 2.2 billion, is the Group's main holding and has been consistently raising dividends in significant amounts. In addition, the Company has a 49% stake in the credit card company, Diners Club Israel Ltd. ("Diners"), which has been generating stable and high profitability over the years.
The Company's rating is supported by a wide dispersal of sources of income, strong retail brands (Mega, Eden Teva Market, Dor Alon, Alonit), a wide spread of real estate properties, and a nationwide deployment of retail points of sale. The rating is also supported by good financial stability and liquidity, reliant on marketable controlling holdings in the main assets. Having said that, the Company is relatively highly leveraged and posts slow coverage ratios. On September 30, 2013, the Company posted a weak debt-to-EBITDAR coverage ratio of 7.8x. In 2014 we anticipate a certain improvement in the coverage ratios and expect the Company to sustain over time an adjusted debt to EBITDAR coverage ratio of less than 8.0x.
The stable outlook rests on our projections for an improvement in the Company's business results and a reduction in losses at the consolidated group level. Midroog prepared several sensitivity scenarios to the Company's forecast. In the base scenario for 2014, the Group will demonstrate a certain improvement in profit, largely stemming from a moderate improvement in the supermarket segment.
The rating downgrade still does not affect the CP rating, which remains P-1, owing to the high level of liquidity on the solo non-consolidated level and good financial flexibility, deriving from the holding of marketable companies free of liens and financial covenants, a relatively convenient debt repayment burden, diverse sources of credit and high refinancing abilities. On top of this, a banking corporation has provided an additional underwritten credit facility of about NIS 50 million in February 2014, so that as of the date of this report, underwritten credit facilities from banking corporations total about NIS 100 million.
The CP rating is also based on the Company's statement to Midroog that at any point in time throughout the CP period, it will maintain unencumbered liquid resources to back the CP of no less than 110% of the total CP amount issued. These include one or more of the following four resources: (1) an available and underwritten credit facility from a banking corporation with Aa deposit rating, effective up to the end of the CP period, without any financial covenants or restrictions on its use; (2) an underwritten and unused facility from one of the two largest credit card companies in Israel to move up credit card due dates; (3) liquid deposits in Aa rated banking corporations in Israel; (4) negotiable securities invested in a conservative investment portfolio (rated A and up). Maintaining these available resources is critical to the Company's ability to meet the requirement to immediately pay back the CP within seven days, under the CP terms.
| 6 |
Alon Blue Square Ltd. (Consolidated), Key Financial Figures in NIS M*:
| 1-9 2013 | 1-9 2012 | FY 2012 | FY 2011 | FY 2010 | ||||||||||||||||
| Revenue | 9,049 | 9,608 | 12,685 | 12,346 | 8,344 | |||||||||||||||
| Gross profit | 1,986 | 2,094 | 2,753 | 2,904 | 2,286 | |||||||||||||||
| Operating profit (EBIT) | 71 | 158 | 176 | 292 | 243 | |||||||||||||||
| Net profit | -113 | 21 | 22 | 84 | 62 | |||||||||||||||
| Gross profit % | 21.9 | % | 21.8 | % | 21.7 | % | 23.5 | % | 27.4 | % | ||||||||||
| EBIT% | 0.8 | % | 1.6 | % | 1.4 | % | 2.4 | % | 2.9 | % | ||||||||||
| EBITDA | 274 | 366 | 454 | 566 | 450 | |||||||||||||||
| FFO | 98 | 210 | 231 | 290 | 280 | |||||||||||||||
| Dividends paid | - | - | - | 75 | 875 | |||||||||||||||
| Total assets | 9,330 | 9,588 | 9,213 | 9,094 | 8,770 | |||||||||||||||
| Liquid financial assets | 787 | 549 | 587 | 377 | 436 | |||||||||||||||
| Debt** | 5,131 | 5,262 | 5,207 | 4,955 | 4,671 | |||||||||||||||
| Debt, net | 4,345 | 4,712 | 4,620 | 4,578 | 4,235 | |||||||||||||||
| Equity | 1,504 | 1,585 | 1,588 | 1,546 | 1,582 | |||||||||||||||
| Equity-to-total assets | 16.1 | % | 16.5 | % | 17.2 | % | 17.0 | % | 18.0 | % | ||||||||||
| Debt-to-CAP | 77.2 | % | 76.8 | % | 76.4 | % | 75.6 | % | 74.1 | % | ||||||||||
* The Company consolidates the financial statements of Dor Alon as of October 3, 2010.
Alon Blue Square Ltd. - Results of Accounting Activity Segments in NIS M[1]:
| 1-9 2013 | 1-9 2012 | FY 2012 | FY 2011 | FY 2010 | ||||||||||||||||
| Revenues | ||||||||||||||||||||
| Supermarkets | 4,834 | 4,965 | 6,553 | 6,724 | 6,895 | |||||||||||||||
| Non-food | 256 | 159 | 321 | 289 | 482 | |||||||||||||||
| Gas stations and commercial complexes | 3,898 | 2,967 | 5,773 | 5,302 | 1,153 | |||||||||||||||
| Real estate | 29 | 22 | 31 | 31 | 25 | |||||||||||||||
| Other** | 32 | 2 | 7 | - | - | |||||||||||||||
| Operating profit (EBIT ) before other profit | ||||||||||||||||||||
| Supermarkets* | 32 | 88 | 126 | 177 | 242 | |||||||||||||||
| Non-food | -12 | 1 | -12 | -20 | -7 | |||||||||||||||
| Gas stations and commercial complexes* | 108 | 131 | 146 | 174 | 43 | |||||||||||||||
| Real estate | 15 | 11 | 17 | 15 | -5 | |||||||||||||||
| Other** | -28 | -20 | -34 | 7 | - | |||||||||||||||
| Number of stores at end of period | ||||||||||||||||||||
| supermarket outlets | 213 | 212 | 212 | 211 | 206 | |||||||||||||||
| gas station and commercial complexes | 206 | 202 | 202 | 196 | 188 | |||||||||||||||
| convenience stores and AM:PM | 212 | 209 | 209 | 198 | 177 | |||||||||||||||
* Mainly includes the activity of Alon Mobile
1 The EBIT of the supermarket segment is stated before rent payments to Blue Square Real Estate, and the real estate segment does not include rent income from companies in Alon Blue Square.
| 7 |
| Key Rating Factors |
The downturn in the supermarket segment was more significant than we projected
The Group's revenues in the supermarket segment decreased by about 2.6% in the first nine months of 2013, largely due to a reduction in commercial spaces and loss of market shares. In same store sales (SSS), Mega decline by 0.3% during the same period, following a SSS decline of over 2.5% in 2011-2012. Mega's share of the food, beverages and tobacco market in 2012 stood at about 11.9%, and in our assessment fell back in 2013 to about 11.2%.
Mega's operating sector is characterized by growing competition in recent years, strengthening of the discount chains, and consolidation and increase in commercial spaces. According to StoreNext figures, in 2013 the fast-moving consumer goods (FMCG) market posted financial growth of about 3.0% (similar to local Israeli growth in that year) alongside a real drop of about 1.7%. Further to the trend in the last few years, in 2013 as well the heavy discount (HD) stores outperformed the neighborhood stores, but the strengthening trend of these chains is more moderate than in previous years. In 2013 about 64.1% of monetary sales in this market are attributed to HD stores.
Mega's position in the food retail sector is positively influenced by the wide geographic deployment of stores in central locations, by the diversity of customers, by economies of scale and the strong position of the "Mega in town" sub-chain, in the neighborhood stores category. As of September 30, 2013, about 63% of Mega's stores belonged to the "Mega in town" sub-chain and about 31% to discount stores, primarily the "Megal Bool" sub-chain. This sub-chain is Mega's main weak link, where it has difficulty competing with the market players, largely due to the problematic price perception in the eyes of consumers, fierce competition and the onerous size of stores. In our assessment, Mega in town's centrally-located stores support its position in the sector, although it is difficult for these stores to offset the brunt of the blow from the discount activity.
The drop in profitability of the supermarket segment in 2013 compared to 2012 was also influenced from the onetime measure to maintain market share by lowering the percentage of gross profit to about 25.4%, in the first half of the year. We estimate the blow to gross profit in 2013 from this measure at about NIS 50 million. In the second half of the year, Mega resumed its representative rate of gross profitability of around 27% on average and consequently relatively improved its EBIT.
The strategic plan implemented by Mega in recent months is based, among other things, on closing money-losing stores in the "Megal Bool" sub-chain and converting others to "You" and "You Grocery Store" brands, which will focus on the discount field, but will be adapted to this type of activity both in terms of the structure of expenses and operations and in terms of the value proposition to customers. In addition, the plan aims to cut costs by optimizing commercial space and improving the supply chain and logistics.
| 8 |
We believe that in 2014, in view of the sector-wide challenges Mega faces, it will maintain gross profitability at around 27% and show improved operating profit (EBIT), mainly owing to the sale of money-losing stores and moderately reducing rental costs. In our assessment, the intense competition will continue to have a negative impact, and we expect a slowdown in the food sector this year. However, the integration of the strategic plan stands to somewhat balance some of these adverse effects and lead to a moderation in revenue erosion.
The stable fuel activity and ownership of solid real estate properties reduces the Group's overall risk
Dor Alon (78.4%) is one of the Company's other major holdings. It has a strong business position in the retail fuel marketing sector, a large market share of about 17% of the gas stations in Israel, large nationwide deployment of gas stations under the Dor Alon brand and Alonit brand convenience stores, and stable financial profile. The fuel marketing sector is characterized, in our assessment, by medium business risk. Dor Alon posts relatively high profitability for the sector, which is due, among other things, to a broad retail segment, strong business development in the convenience stores segment, an operating concession on Highway 6, and a relatively thin operating expenses structure. In Midroog's base scenario, we assumed a moderate improvement in Dor Alon's profitability in 2014, compared to 2013.
Blue Square Real Estate (74.8%) owns a significant scope and wide dispersal of real estate properties, most of which are solid centrally-located properties with high occupancy (about 98%). Most of these properties were acquired at historical costs. The lion's share of Blue Square Real Estate's rent income is from Mega chain stores (mostly "Mega in town") and two logistic centers rented to Group companies. On the other hand, in recent years Blue Square Real Estate has stepped up its real estate development operations, mainly in the Tel Aviv Wholesale Market Project (50%). Blue Square Real Estate has a high-quality financial profile, is relatively low-leveraged and has an NOI of over NIS 200 million a year. Blue Square Real Estate's exposure to the Wholesale Market Project has gone down in the last year after receiving a bank construction loan for the project. Blue Square Real Estate is slated to complete several projects in the coming years, which are expected to substantially increase the volume of its revenues and profitability, while a significant number of lease contracts have been signed in advance.
Measures to reduce losses in other segments
Since 2011, the non-food segment has posted a cumulative operating loss of about NIS 44 million, on top of a cumulative operating loss of about NIS 30 million from the Kfar Hasha'ashuim (toy store chain) activity. The controlling stake in Kfar Hasha'ashuim was sold in February 2014. The operating loss posted by the non-food segment in the first nine months of 2013 stems from high fixed expenses at the logistic center in Be'er Tuvia, high onetime expenses due to the conversion of Naaman's Sheshet chain of household and gift stores into Naaman stores, and growing competition in the relevant fields of business.
| 9 |
We believe that in 2014 the results of the non-food activity will improve owing to the conversion of the Sheshet chain into a Naaman chain and the opening of new stores, as well as a projected reduction in losses of the logistics center in Be'er Tuvia, by bringing in leaseholders from a third party. The Company is also acting to merge Bee operations with Mega in 2014 in order to take advantage of the synergy between the supermarket and household goods segments in order to streamline operations.
Alon Mobile's activity under the YouPhone brand continues to show a negative cash flow, primarily due to the setup expenses, hiring employees and establishing the brand. Alon Mobile operates as a full MNVO and competes with both veteran and new mobile companies. Alon Mobile's business model is based on leasing communication infrastructure from the veteran operators, investing resources in collecting subscribers and taking advantage of the synergy between the Group's brands for creating customer loyalty based on the selling power and wide dispersal of the Group companies.
Alon Mobile will continue to also invest in the coming year in increasing its subscriber base, and in our estimation will only reach a breakeven point in the medium to long term. Yet we believe this is a value-creating activity which contributes to synergy within the Group.
Relatively high leverage due to ownership of real estate properties and coverage ratios adversely affected by the weakness of the Mega segment
The consolidated net debt as of September 30, 2013 totaled about NIS 4.4 billion2, compared to about NIS 4.7 billion as of December 31, 2012. About NIS 1.7 billion of the consolidated net debt balance was entered in the balance sheets of Blue Square Real Estate and roughly another NIS 1.4 billion was entered in the balance sheet of Dor Alon. The total net debt decreased since the beginning of the year by about NIS 340 million, largely due to a reduction of about NIS 200 million in Dor Alon by lowering working capital needs.
The debt-to-CAP ratio as of September 30, 2013 was about 77%, showing no material change compared to the corresponding period. We are adjusting the value of the Company's properties to the economic value of the income-producing real estate properties owned by Blue Square Real Estate, and we are adding assets and a net debt of about NIS 200 million for Blue Square Real Estate's stake (50%) in the Wholesale Market Project. All the above leads to a debt-to-CAP ratio as of September 30, 2013 of about 69% and an equity-to-total assets ratio of about 23%, compared to an equity-to-total assets accounting ratio of about 16%. The adjusted figures also reflect a high leverage level, although commensurate with the rating grade, also taking into account the high component of real estate properties.
2 The debt stated is an accounting debt according to the Company's financial statements and does not include transactions on a proportionate consolidation basis - figures which include the Company's stake in the Mall Company and the Residential Company (proportionate consolidation of the Wholesale Market Project) and the consolidation of three other properties which are not included in the third quarter statements of 2013, which are stated in the Company's statements according to the equity method.
| 10 |
In terms of coverage ratios, Midroog deducts the debt and the cash balances in the books of the subsidiary Blue Square Real Estate, from the net consolidated debt. At the same time, the remaining debt reflecting the capitalization of rent expenses paid by the Company is adjusted both with respect to the properties rented from the subsidiary and from third parties. For comparative purposes, this adjustment is meant to exclude the influence of the real estate sector from the coverage ratio. The latent risk of Blue Square Real Estate’s leverage, especially with respect to new development projects in which this subsidiary is involved, is factored in separately.
| Declining profitability in 2013 led to a continued impairment of the Company's coverage ratios. The adjusted net debt-to-EBITDAR coverage ratio rose to 7.7x as of September 30, 2013. The Group's weak FFO base, which fell by about 50% compared to the previous period due to the decline in EBIT, results in particularly slow coverage ratios, as measured by a high adjusted debt-to-FFOR of over 13.5x, is expected to remain weak even factoring in the projected improvement in the short-medium period. | Net debt coverage ratios adjusted to capitalization of leasing fees: |
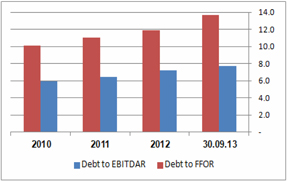 |
Despite the projected improvement in the Company's results, according to our base scenario for 2014, we still assume relatively slow coverage ratios. We expect that the Company will post over time adjusted debt to EBITDAR coverage ratios below 8.0x.
Good liquidity and strong financial flexibility reliant on cash balances, underwritten credit facilities, strong and marketable holdings and good access to financing sources
The short-term rating is based on the Company's long-term rating and on an analysis of its liquidity. This analysis is based on an evaluation of resources and uses over a one-year period as well as on assessment of the Company's ability to meet its current liabilities, including its ability to meet the requirement to immediately pay back the CPs within seven days. We are also evaluating the Company's liquidity on the solo level which includes the Bee Group and Alon Mobile. The liquidity level is good for servicing the debt, and it relies on the Company's ability to generate cash from operations in growth years, cash balances, underwritten bank credit facilities and dividend payouts from subsidiaries.
| 11 |
Our assessment of the Company's liquidity for 2014 is based on the following assumptions:
| · | We assess that Alon Blue Square (solo) has cash and negotiable securities worth about NIS 170 million as of December 31, 2013. |
| · | In our assessment, in 2014 the Company will have high investments in fixed assets in the subsidiary Mega, due to the conversion of chain stores and other projects, although we believe that a large percentage of these investments are flexible and will be managed according to the development of the pace of sales in the new discount format. We assumed moderate growth in the supermarket sector, which stands to have a minor effect on Mega's working capital. |
| · | Current dividends from the Dor Alon and Blue Square Real Estate holdings in 2014 are expected to range around NIS 60-80 million. This in addition to the buyback of Blue Square Real Estate shares, which was consummated in February 2014, while Alon Blue Square accepted the offer in a sum of about NIS 120 million. |
| · | The Company has a monetary balances deposit agreement with the subsidiary Blue Square Real Estate3, whereby at any given time, depending on Alon Blue Square's needs and Blue Square Real Estate's needs, the latter may deposit sums of no more than NIS 200 million with Alon Blue Square. Midroog assesses that as of the date of this report, the balance stands at about NIS 80 million, following a recent repayment of about NIS 120 million. |
| · | Underwritten bank credit facilities of about NIS 100 million, including a credit line of NIS 50 million which was recently provided. |
| · | An underwritten credit facility from a credit card company of up to about NIS 140 million, reliant on the Company's wide spread of customers making credit card transactions. |
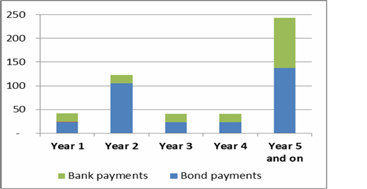
| · | Principal payments of about NIS 120 million. The repayment burden of the Company (solo) is expected to decrease significantly after 2014 and will stand at about NIS 40 million in each subsequent year (about NIS 60 million assuming an expansion of Series C in a sum of about NIS 150 million, according to the rating action plan). |
| · | The Company has a fortified unencumbered holding of negotiable shares of Blue Square Real Estate and Dor Alon, as well as a 100% stake in Mega and Alon Mobile. The Company also holds 49% of the shares of Diners' Credit Card Company. |
We assess the liquidity needs of the parent company, Alon Israel Oil Company Ltd., to be low in the short and medium terms, and therefore weak pressure for a dividend payout. Having said that, we also believe, that over time, a dividend payment will be demanded, as in previous years.
3 The agreement is meant to be put to vote of the shareholders for re-ratification on March 19 2014.
| 12 |
Amortization Schedule of the (Solo) Long-term Debt as of September 30, 2013, in NIS M*:
| Rating Outlook |
Factors that can improve the rating:
| · | Reduction in leverage and sustaining over time an adjusted net debt-to-EBITDAR coverage ratio below 7.0x. |
Factors that can lower the rating:
| · | No improvement in Mega's business standing and its implication on the overall group's financial position, including continuing to report losses. |
| · | Long-term deviation from the net adjusted debt-to-EBITDAR coverage ratio above 8.0x. |
| · | Substantial dividend payout which is not backed by cash flow |
| Rating History |
| 13 |
| About the Company |
Alon Blue Square Israel Ltd., a public company listed on the Tel Aviv and New York stock exchanges, is Israel’s largest retail company. The Company is about 72.7% owned by Alon Israel Oil Company Ltd., a private holding company engaged in the retail and energy sectors in Israel and overseas. Ownership of the parent company is shared by Bielsol Investments Ltd., a private company jointly owned by David Weissman and the Biran family, and purchasing cooperative agencies belonging to kibbutzim. The Company operates today through four main subsidiaries: Mega Retail (100% holding), which concentrates the retail food business; BEE Retail (100%), which presently holds about 77.5% of Na'aman Ltd. and 35% of Kfar Hasha'ashuim; Dor Alon (78.4% holding), engaged in the marketing and sale of fuel in Israel; Blue Square Real Estate (74.8% holding), which owns real estate properties, most of which are currently leased for the retail activity. The Company also has a 49% stake in Diners club Israel Ltd.
Mr. David Weissman is the Company's CEO and chief business manager together with Mrs. Limor Ganot. Mr. Yitzhak Bader is the Chairman of the board of directors.
| Related Reports |
Alon Blue Square Israel Ltd., Rating Action, November 2013
Blue Square Real Estate Ltd., Credit Review, February 2014
The Retail Sector - Rating Methodology, August 2010
Financial Ratios Adjustment Methodology, November 2010
The reports are published on Midroog's website:www.midroog.co.il.
Date of the report: March 17, 2014
| 14 |
KEY FINANCIAL TERMS
| Interest | Net financing expenses from Income Statement |
| Cash Interest | Financing expenses from income statement after adjustments for non-cash flow expenditures from statement of cash flows |
| Operating profit (EBIT) | Profit before tax, financing and onetime expenses/profits |
Operating profit before amortization (EBITA) | EBIT + amortization of intangible assets. |
| Operating profit before depreciation and amortization (EBITDA) | EBIT + depreciation + amortization of intangible assets. |
Operating profit before depreciation, amortization and rent/leasing (EBITDAR) | EBIT + depreciation + amortization of intangible assets + rent + operational leasing. |
| Assets | Company's total balance sheet assets. |
| Debt | Short term debt + current maturities of long-term loans + long-term debt + liabilities on operational leasing |
| Net debt | Debt - cash and cash equivalent – long-term investments |
| Capitalization (CAP) | Debt + total shareholders' equity (including minority interest) + long-term deferred taxes in balance sheet |
Capital investments Capital Expenditures (CAPEX) | Gross investments in equipment, machinery and intangible assets |
Funds From Operations (FFO)*
| Cash flow from operations before changes in working capital and before changes in other asset and liabilities |
| Cash Flow from Current Operations (CFO)* | Cash flow from operating activity according to consolidated cash flow statements |
| Retained Cash Flow (RCF)* | Funds from operations (FFO) less dividend paid to shareholders |
| Free Cash Flow (FCF)* | Cash flow from operating activity (CFO) - CAPEX - dividends |
* It should be noted that in IFRS reports, interest payments and receipts, tax and dividends from investees will be included in the calculation of the operating cash flows, even if they are not entered in cash flow from operating activity.
| 15 |
| Obligations Rating Scale |
| Investment grade | Aaa | Obligations rated Aaa are those that, in Midroog's judgment, are of the highest quality and involve minimal credit risk. |
| Aa | Obligations rated Aa are those that, in Midroog's judgment, are of high quality and involve very low credit risk. | |
| A | Obligations rated A are considered by Midroog to be in the upper-end of the middle rating, and involve low credit risk. | |
| Baa | Obligations rated Baa are those that, in Midroog's judgment, involve moderate credit risk. They are considered medium grade obligations, and could have certain speculative characteristics. | |
| Speculative Investment | Ba | Obligations rated Ba are those that, in Midroog's judgment, contain speculative elements, and involve a significant degree of credit risk. |
| B | Obligations rated B are those that, in Midroog's judgment, are speculative and involve a high credit risk. | |
| Caa | Obligations rated Caa are those that, in Midroog's judgment, have weak standing and involve a very high credit risk. | |
| Ca | Obligations rated Ca are very speculative investments, and are likely to be in, or very near to, a situation of insolvency, with some prospect of recovery of principal and interest. | |
| C | Obligations rated C are assigned the lowest rating, and are generally in a situation of insolvency, with poor prospects of repayment of principal and interest. |
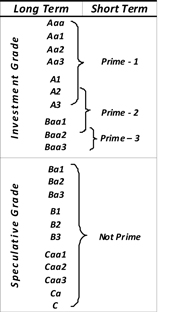
Midroog applies numerical modifiers 1, 2 and 3 in each of the rating categories from Aa to Caa. Modifier 1 indicates that the bond ranks in the higher end of the letter-rating category. Modifier 2 indicates that the bonds are in the middle of the letter-rating category; and modifier 3 indicates that the bonds are in the lower end of the letter-rating category.
| 16 |
Moody's short term ratings describe the ability of issuers to honor short-term financial obligations.Ratings may be assigned to issuers, individual issues and financial instruments.As a rule, short-term obligations are for a period of no more than 13 months, unless indicated otherwise.
| Symbol | Definition | |
| Prime – 1 | Issuers (or supporting institutions) rated P-1 have a superior ability to repay short-term debt obligations. | |
| Prime – 2 | Issuers (or supporting institutions) rated P-2 have a strong ability to repay short-term debt obligations. | |
| Prime – 3 | Issuers (or supporting institutions) rated P-3 have an acceptable ability to repay their short-term debt obligations. | |
| Not Prime (N-P) | Issuers rated N-P do not fall within any of the Prime rating categories. |
Short- term vs. Long term Ratings
| 17 |
| 18 |
Report No.: CTR050314000M
Midroog Ltd.., Millennium 17 Ha’Arba'a Street, Tel-Aviv 64739
Tel: 03-6844700, Fax: 03-6855002,www.midroog.co.il
© Copyright 2014, Midroog Ltd. (“Midroog”). All rights reserved.
This document (including the contents thereof) is the property of Midroog and is protected by copyright and other intellectual property laws. There is to be no copying, photocopying, reproduction, modification, distribution, or display of this document for any commercial purpose without the express written consent of Midroog.
All the information contained herein on which Midroog relied was submitted to it by sources it believes to be reliable and accurate. Midroog does not independently check the correctness, completeness, compliance, accuracy or reliability of the information (hereinafter: the "information") submitted to it, and it relies on the information submitted to it by the rated Company for assigning the rating.
The rating is subject to change as a result of changes in the information obtained or for any other reason, and therefore it is recommended to monitor its revision or modification on Midroog's websitewww.midroog.co.il. The ratings assigned by Midroog express a subjective opinion, and they do not constitute a recommendation to buy or not to buy bonds or other rated instruments. The ratings should not be referred as endorsements of the accuracy of any of the data or opinions, or attempts to independently assess or vouch for the financial condition of any company. The ratings should not be construed as an opinion on the attractiveness of their price or the return of bonds or other rated instruments. Midroog's ratings relate directly only to credit risks and not to any other risk, such as the risk that the market value of the rated debt will drop due to changes in interest rates or due to other factors impacting the capital market. Any other rating or opinion given by Midroog must be considered as an individual element in any investment decision made by the user of the Information contained in this document or by someone on his behalf. Accordingly, any user of the information contained in this document must conduct his own investment feasibility study on the Issuer, guarantor, debenture or other rated document that he intends to hold, buy or sell. Midroog's ratings are not designed to meet the investment needs of any particular investor. The investor should always seek the assistance of a professional for advice on investments, the law, or other professional matters. Midroog hereby declares that the Issuers of bonds or of other rated instruments or in connection with the issue thereof the rating is being assigned, have undertaken, even prior to performing the rating, to render Midroog a payment for valuation and rating services provided by Midroog.
Midroog is a 51% subsidiary of Moody’s. Nevertheless, Midroog's rating process is entirely independent of Moody's and Midroog has its own policies, procedures and independent rating committee; however, its methodologies are based on those of Moody’s.
For further information on the rating procedures of Midroog or of its rating committee, please refer to the relevant pages on Midroog's website.
| 19 |
CONSENT OF RATING AGENCY
We consent to the incorporation by reference in the Registration Statement on Form S-8 (No. 333-149175) of Alon Blue Square Israel Ltd. (“the Company”) of the reference to our A3/Stable rating (on local scale), for Series A and C bonds and the reaffirmation of our “P-1” rating for the Company's commercial paper in the sum of NIS 120 million, and of the unofficial translation of our Monitoring Report dated March 2014 with respect to the foregoing, included in this Current Report on Form 6-K.
| /s/ Eran Heimer | ||
| Eran Heimer, CEO | ||
| Midroog Ltd. |
Tel-Aviv, Israel,
March 16, 2014.
| 20 |