Exhibit 99.1

Alon Blue Square Israel Ltd.
Monitoring reportו March 2015
Contacts:
Elad Seroussi, Senior Analyst
elads@midroog.co.il
Liat Kadish, CPA, Team Leader
liatk@midroog.co.il
Sigal Issachar, VP, Head of Corporate Finance
i.sigal@midroog.co.il

| 1 |
Alon Blue Square Israel Ltd.
| Issue/Bond Rating | A3 | Outlook: Negative |
| Commercial Paper | P-2 |
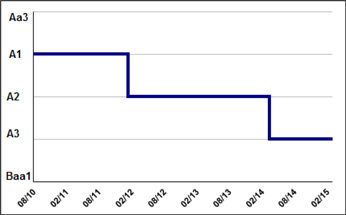
Midroog announces reaffirmation of an A3 rating for the issuer and Series C bonds issued by Alon Blue Square Israel Ltd. (“Alon Square” or the "Company” or the "Group"),while revising the outlook from stable to negative. Midroog is also downgrading the rating of commercial paper (CP) issued by the Company, up to NIS 120 million, from P-1 to P-2.The CP rating is valid until March 31, 2016.
Following is a breakdown of the bond series in circulation issued by the Company and rated by Midroog*:
| Bond Series | Security No. | Original Date of Issue | Fixed Annual Coupon | Linkage | Book Value of Bond Balance on Sept. 30, 2014 (NIS M) | Remainder of Bond Repayment Years | ||||||||||||
| C | 1121334 | Oct. 2010 | 2.50 | % | CPI | 412.5 | 2014-2022 | |||||||||||
* In November 2014, the Company repaid about NIS 48 million par value of Series C bonds.
Key Rating Considerations
The Company's rating is supported by broad diversity in sources of income, strong retail brands (Mega, Eden Teva, Dor Alon and Alonit), ownership of widely dispersed real estate assets in prime locations, and national deployment of retail sales points.
The Company is suffering from weakness in the food retail segment through its holding in Mega Retail ("Mega"), but is stronger in the fuels segment, where it operates through Dor Alon (A2/stable) in the real estate segment, where it operates through Blue Square Real Estate (A1, under credit review), and through the holdings in Diners. The food retail segment led to deterioration of the Company's results also in the past year, beyond our forecasts, which we suspect could persist this year, alongside completion of a strategic plan by Mega Retail, with emphasis on its heavy-discount stores, involving closure and sale of branches operating in the red, and moves to establish the YOU discount format. In neighborhood stores, Mega is characterized by an established, profitable format, though that area is, as well as the entire market, also suffering from negative growth. Mega is contending with a headwind of fierce competition and a drop in consumer spending on consumer goods. We consequently lowered our forecasts for the segment, and in the base scenario for 2015, expect further erosion in market share and failure to substantially improve profitability in the segment. In our opinion, continuing weakness at Mega in the short term, might require infusion of sources from Alon Square, or increasing debt at Mega. The cash flow deficit could be curbed in the medium run, insofar as efficiency measures are executed, on top of possibly selling more assets.
| 2 |
Blue Square real estate and Dor Alon are sustaining stability. Blue Square Real Estate has been gradually expanding its scope of activity, and broadening its portfolio of assets in the future could reduce its dependence on Mega as its key tenant. On the other hand, book value leverage at Blue Square Real Estate has trended upward in the last year, following substantial dividend distributions. Dor Alon is characterized by a strong business profile, featuring large market shares in fuel retail, national dispersion of gas stations branded "Dor Alon" and "Alonit", stable profitability over time, which is also reflected in profit per kiloliter, and has increased regular dividends to its parent company.
Alon Square is also running high book value leverage (as measured by consolidated financial statements) which is not expected to substantially change. However, we are factoring in the high component of quality properties in the balance sheet, whose economic value is greater than their book value. On a consolidated basis, the Company's interest coverage ratio is weak, compared to its peers with similar ratings, mainly due to erosion of operating cash flows in recent years. Our base scenario does not foresee this ratio improving.
The rating is supported by good financial flexibility and reasonable liquidity, which rely on significant liquid balances, negotiable controlling interests in its main assets, a low level of debt and mitigated leverage relative to the market value of the assets on a solo basis, and a convenient repayment schedule. In 2014, the Company financed its activity at the solo level, among other things, by recycling debt and receipt of dividends from subsidiaries. In our opinion, the Company's reliance on dividends from subsidiaries might hurt their financial strength. We assume that in 2015 the Company's cash balances and liquid portfolio (including the proceeds from the sale of Blue Square Real Estate shares in early 2015) will erode.
The Company's food and non-food retail activities have poor track record for meeting guidance, which attests to difficulty in adjusting the business model to the challenging industry environment. In our view, management changes in the Group at the level of the parent company, Alon, could indicate future change in Group strategy, in which case we will examine the ramifications. Also, substantial change for the worse in the parent company's credit risk could hurt the Company's rating.
In Midroog's base scenario, the Company is likely to only slightly improve consolidated EBITDA in 2015, to about NIS 350 million, versus EBITDA expected for 2014, of about NIS 300 million, due to our assumption of similar level of sales as in 2014 (full income generation by YOU branches that opened this year, versus continuing SSS erosion in the rest of the chain), closing down loss-making Mega branches, and completing projects in real estate. We will consider downgrading if the Group does not achieve improvement in EBITDA in the medium term, improving leverage levels and shortening present coverage ratios, or, if we see substantial deterioration in Mega's status in its sector.
The negative outlook reflects our concerns that food retail results could be worse than we expect, which could hurt coverage ratios and liquidity beyond our forecasts.
| 3 |
The revision in outlook leads us to revise the rating for the Company's CPs to P-2, as per our methodology, the long-term rating is a major factor in setting the short-term rating. The CP rating also relies on the Company's statement to Midroog that at every point in time over the lifetime of the CP, it will maintain liquid sources, free of encumbrance, to back the paper, amounting to no less than 110% of the total paper issued. These sources include one or more of the following four: (1) An available, underwritten credit facility from a banking corporation with a deposit rating in the Aa rating group, in force throughout the CP's duration, which does not involve financial covenants or constraints on its use (2) An underwritten, unexploited facility from one of the two big credit card companies in Israel, to advance crediting of credit card transactions (3) Liquid deposits at banks in Israel within the Aa rating group (4) Negotiable investment-grade securities (rated A and up). Maintaining these available sources is the main basis for the Company's ability to immediately pay back the CP within seven days on demand, under the CP terms. It bears saying that at this time, some of the Company's underwritten bank facilities have expired, and the Company has stated that it is working on renewing them in the near run.
As of writing, total available facilities from banks amount to about NIS 200 million, but most of these facilities are not underwritten at present. The company has stated to us that it expects to obtain underwriting for these facilities within weeks, subject to the extent of the CPs expected to remain in circulation.
Alon Blue Square Israel Ltd. (Consolidated), Key Financial Figures in NIS M:
| 1-9 2014 | 1-9 2013 | FY 2013 | FY 2012 | FY 2011 | ||||||||||||||||
| Revenue | 8,489 | 9,049 | 11,886 | 12,685 | 12,346 | |||||||||||||||
| Gross profit | 1,896 | 1,952 | 2,574 | 2,753 | 2,904 | |||||||||||||||
| Operating profit (EBIT) | 33 | 71 | 101 | 176 | 292 | |||||||||||||||
| Financing income (expense), net | 159 | 209 | 254 | 242 | 172 | |||||||||||||||
| Net profit (loss)* | (29 | ) | (113 | ) | (117 | ) | 22 | 84 | ||||||||||||
| Gross profit % | 22.3 | % | 21.6 | % | 21.7 | % | 21.7 | % | 23.5 | % | ||||||||||
| EBIT % | 0.4 | % | 0.8 | % | 0.8 | % | 1.4 | % | 2.4 | % | ||||||||||
| EBITDA | 235 | 274 | 370 | 454 | 566 | |||||||||||||||
| FFO | 71 | 94 | 114 | 234 | 290 | |||||||||||||||
| CapEx | (189 | ) | (114 | ) | (153 | ) | (208 | ) | (292 | ) | ||||||||||
| Total assets | 9,157 | 9,330 | 9,163 | 9,213 | 9,094 | |||||||||||||||
| Liquid financial assets | 738 | 819 | 855 | 623 | 420 | |||||||||||||||
| Debt | 5,017 | 5,131 | 5,235 | 5,207 | 4,955 | |||||||||||||||
| Debt, net | 4,279 | 4,312 | 3,379 | 4,584 | 4,534 | |||||||||||||||
| Equity | 1,453 | 1,504 | 1,485 | 1,588 | 1,546 | |||||||||||||||
| Equity-to-total assets | 15.9 | % | 16.1 | % | 16.2 | % | 17.2 | % | 17.0 | % | ||||||||||
| Debt-to-CAP | 77.6 | % | 77.2 | % | 77.7 | % | 76.4 | % | 75.6 | % | ||||||||||
| EBIT to financing | 0.23 | 0.28 | 0.30 | 0.54 | 0.89 | |||||||||||||||
* For the first nine months of 2014 the Company recorded net other income of about NIS 54 million, including capital gains from selling the land of the logistical center in Rishon Letzion and Mega branches
| 4 |
Alon Blue Square Israel Ltd. - Results of Accounting Activity Segments in NIS M1:
| 1-9 2014 | 1-9 2013 | FY 2013 | FY 2012 | FY 2011 | ||||||||||||||||
| Revenues | ||||||||||||||||||||
| Gas stations and commercial complexes | 3,716 | 3,898 | 5,141 | 5,773 | 5,302 | |||||||||||||||
| Supermarkets | 4,152 | 4,400 | 5,774 | 6,553 | 6,724 | |||||||||||||||
| Supermarkets – terminated activity | 284 | 434 | 556 | 0 | 0 | |||||||||||||||
| Houseware and textile | 215 | 243 | 334 | 321 | 289 | |||||||||||||||
| Real estate | 36 | 29 | 38 | 31 | 31 | |||||||||||||||
| Other | 74 | 45 | 44 | 7 | 0 | |||||||||||||||
| Operating profit (EBIT) before other profit | ||||||||||||||||||||
| Gas stations and commercial complexes | 32 | 126 | 177 | |||||||||||||||||
| Supermarkets | -12 | -12 | -20 | |||||||||||||||||
| Supermarkets – terminated activity | 108 | 146 | 174 | |||||||||||||||||
| Houseware and textile | 11 | 1 | (21 | ) | (16 | ) | (29 | ) | ||||||||||||
| Real estate | 59 | 36 | 75 | 0 | 0 | |||||||||||||||
| Other | (15 | ) | (25 | ) | (12 | ) | (10 | ) | 0 | |||||||||||
| Number of stores at end of period | ||||||||||||||||||||
| Supermarket outlets | 206 | 213 | 212 | 212 | 211 | |||||||||||||||
| Gas station and commercial complexes | 208 | 206 | 202 | 202 | 196 | |||||||||||||||
| Convenience stores and AM:PM | 215 | 212 | 209 | 209 | 198 | |||||||||||||||
| Non-food | 114 | 134 | 131 | 138 | 248 | |||||||||||||||
Key Rating Rationale
The supermarkets segment continues to weigh on the Company’s results. En route to completing execution of its strategic plan, Mega will have to demonstrate improved performance under challenging market conditions in the year to come
Based on StoreNext figures, in 2013 the fast-moving consumer goods (FMCG) market contracted by about 1.7% in financial terms, versus increasing by over 3.0% in 2012-2013. In quantitative terms, the market contracted by about 0.6%, after contracting by 1.6% in 2013. We believe the industry continued to be characterized by weak sales in early 2015. In 2014, the conditions in the food market were a negative catalyst, weighing on retail revenues and profits, including because of intense competition in the segment.
In Midroog's opinion, although the food retail segment is defensive, in the near term competition will remain ferocious because of the proliferation of competitors and commercial space. The food sector in Israel is characterized by relatively steady demand compared with the economic cycle, low entry barriers, low profitability, and low operating flexibility because of the heavy component of fixed costs. Efficiency measures and the reduction of commercial space that some of the companies in the industry have been resorting to, should support higher profitability than achieved in the last year. However, that trend of improvement is likely to be offset by likely minimum wage hikes in the years to come.
1The EBIT of the supermarket segment is stated before rent payments to Blue Square Real Estate, and the real estate segment does not include rent income from companies in Alon Square. The others segment includes mainly operations of Alon Mobile and Diners. As said above, the 2014 results of the supermarkets segment includes nonrecurring capital gains totaling about NIS 54 million.
| 5 |
Mega's status in the food retail sector is boosted by broad geographical dispersion in central locations, its size advantage versus suppliers, and the strong business position of its sub-chain "Mega in the City" in the category of neighborhood supermarkets. As of the review, about 60% of Mega's branches belonged to the "Mega in the City" sub-chain.
Pursuant to its strategic plan to boost sales per square meter and reposition the heavy-discount chain, during 2014 the Company closed about 20 branches that had been operating at a loss and reduced commercial space by about 50,000m2. The YOU chain, launched during Q413, today counts over 30 branches, most of which were Mega Bool stores converted during the last year. The Company is in the process of converting more branches, aiming for the chain to reach about 40 stores by mid-2015. According to the Company's figures, the YOU chain branches produce high SSS growth.
In the first nine months of 2014, Mega revenues (excluding terminated activity) fell by 5.6%, chiefly due to loss of market share, format conversions and reduction of commercial space. Sales per square meter for the whole Mega chain were about NIS 13,300 in the first nine months of 2014, compared with about NIS 13,200 in the same period of the year before. The relative stability is due to contraction of commercial space.
In assessing the development of results at Mega in the year to come, we assume minimal growth in revenues, mainly due to full income generation by the YOU branches opening this year, against persisting same-store erosion in the rest of the chain. We assume an increase in revenues per square meter from an estimated NIS 17,000 in 2014 to NIS 18,000 in 2015. We assume gross profitability in the range of 25.5%-26%, as the launch of the YOU branches presses on gross profitability, which will be partially offset by steps to improve the supply chain. Also, given the sale of losing branches during 2014 and the modest reduction in rental expenses, we estimate EBIT in the food retail segment below 0.5%, and total EBITDA from the segment in the range of no more than NIS 150-170 million. In this scenario, based on debt service requirements, substantial expected investments in the sector of NIS 70-100 million in 2015, and assuming no more than modest positive working capital, Mega may need cash flow infusions from the Company, or to increase bank debt.
Risk mitigated by stability in fuels activity, solid real estate assets
Dor Alon (78.4%), another of the Company's material assets, is strongly positioned in the retail fuel sector, with a high 17% share of the Israeli gas stations market, nationwide dispersion of Dor Alon branded stations and Alonit branded convenience stores, and a stable financial profile. The fuels marketing industry is characterized by moderate business risk. Dor Alon achieves reasonable profitability for the industry, based on the broad retail sector, strong business development of convenience stores, the concession to operate Highway 6, and a relatively lean structure of operating costs. In Midroog's base scenario, we assume that operating profitability will be similar in 2015 to 2014, and leverage levels will remain the same, mainly due to debt recycling.
| 6 |
Blue Square Real Estate (63.7%) owns a significant scope of widely dispersed real estate assets, most of them solid ones in central locations, and with high occupancy rates (about 98%). Most of the assets were bought at historic costs. The greater part of rental income for Blue Square Real Estate is Mega branches (mainly Mega in the City) and two logistics centers, which are leased out to Group companies. These assets are responsible for about 80% of Blue Square Real Estate's NOI flow. Although that rate is lower than in the past and is liable to decrease further in the future, Mega is still a key tenant for Blue Square Real Estate. Blue Square Real Estate is expected to complete a number of projects in the years to come, most notably the construction of the Wholesale Market (50%), which should substantially boost its revenues and profits. Significant lease agreements have been signed in advance at many of the projects. In 2014, projects such as Comverse House and the Eyal Logistics Center were completed, and the Givon parking lot is nearing completion. In recent years Blue Square Real Estate was a substantial source of dividends for Alon Square (including a substantial stock buyback), a source for credit, and for financial flexibility to sell assets. All these led to an increase in Blue Square Real Estate's level of leverage in recent years.
Profitability in the houseware and textile segment somewhat improved in the first nine months of 2014, mainly thanks to Naaman, and we also think that over time, sublets will be found that will reduce the operating loss caused by the logistics center in Be'er Tuvia. Alon Mobile, which operates under the brand YouPhone, continues to present negative cash flow, which we estimate will run in the range of NIS 10-15 million in 2015, including working capital requirements.
Also, in 2014, the Company received its first dividend from its holding in Diners.
Relatively high coverage, which relies on real estate assets and slow coverage ratios – which are affected by the weakness in the Mega segment
The Company's leverage level is roughly unchanged from the corresponding period of last year. The high Group leverage is reflected in a debt-to-CAP ratio of about 78% as of September 30, 2014, compared with 77% in the last review. We are adjusting the Company's asset value for the economic value of commercial real estate assets owned by Blue Square Real Estate and are also adding assets and net debt for the share (50%) that Blue Square Real Estate owns in the Wholesale Market project. The adjusted economic debt-to-CAP ratio as of September 30, 2014 is about 72% (about 72% as of September 30, 2013). The adjusted figures also reflect high leverage, but the level of risk is mitigated by the significant component of real estate assets on the balance sheet.
| 7 |
As profitability continued to weaken in 2014, the Company presents weak adjusted coverage ratios2. The net debt adjusted to EBITDAR coverage ratio was 7.4x as of September 30, 2014 (about 7.7x as of September 9, 2013). The Group's weak FFO, which dropped by about 25% compared with the same period of the year before because of diminished operating income, results in especially slow coverage ratios, as measured by adjusted debt to FFOR higher than 13.5x, and is likely to remain weak, even with the anticipated improvement in our base scenario for the short term. The ratio of EBIT to financing in the Group's consolidated report was just 0.2 as of September 30, 2014, which is low relative to similarly rated peers. We expect this ratio to remain low, around 0.5, in the range of the forecast.
Good liquidity and financial flexibility rely on cash balances, underwrittencredit facilities, dividends and selling shares
The Company's short-term rating is based on the long-term rating, and analysis of solo expanded liquidity including the company, Mega, the BEE group and Alon Mobile. This analysis is based on studying sources and uses throughout a period of a year and appraisal of the Company's ability to meet current liabilities, including a demand to immediately repay CP within seven days. The present liquidity level has improved, among other things, due to raising capital in 2014, selling assets, and receiving dividends and bank credit facilities. However, looking at 2015, we assume that the ratio of sources (excluding the liquid portfolio) to uses will be lower than 0.5, and that the high cash balances will erode. Our estimation of the Company's liquidity (solo expanded) in 2015 is based on the following main assumptions:
| · | Cash balance and negotiable securities at the level of the Company solo of about NIS 245 million, as of December 31, 2014. Additionally, The Company sold at least NIS 85 million worth of shares in Blue square real estate during 2015, to this date. |
| · | A negative gap in the range of NIS 70-120 million between sources and uses at Mega, due to debt service needs, investments in fixed assets and negative operating cash flow. |
| · | A negative gap of NIS 45 million in the operations of the BEE Group, Alon Mobile and operations of the Company's headquarters. |
| · | Midroog's assessment of NIS 80 million in dividends from the holdings in Dor Alon and Blue Square Real Estate in 2015. |
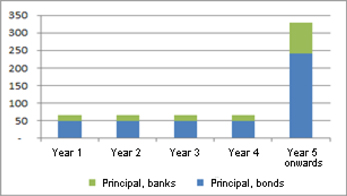
| · | Principal payments amounting to about NIS 66 million. The Company's repayments burden solo should remain steady in the years to come. |
| · | We assume the Company will not be distributing dividends to its shareholders. |
2 When studying the coverage ratio, Midroog deducts the debt and cash balances in the books of subsidiary Blue Square Real Estate from the consolidated net debt. In parallel, the remaining debt is adjusted to reflect capitalization of the rental costs the Company pays for assets rented from its subsidiary and from third parties as well. This adjustment is designed to neutralize the influence of the real estate segment on the coverage ratio, for the sake of comparisons.
| 8 |
Additionally, the Company has Available bank credit facilities, not presently underwritten, amounting to about NIS 200 million, a financial balances deposits agreement with Blue Square Real Estate, totaling about NIS 80 million, An underwritten facility from a credit card company up to NIS 140 million, relying on broad diversity of customers carrying out credit card transactions. The size of the facility changes during the month depending on clearing cyclicality. The Company has stated that it means to obtain underwriting for these facilities in the weeks to come, subject to the extent of the CPs expected to remain in circulation
In our opinion, the Company's level of leverage to asset value (LTV) of around 40%-50% under various scenarios is reasonable, which buttresses its financial flexibility. The Company's financial flexibility is also based on its holding in liquid shares and in fortified, unencumbered interests in Blue Square Real Estate and in Dor Alon.
Amortization schedule of (solo) long-term debt as of September 30, 2014, in NIS M*:
Rating Outlook
Factors that can improve the rating:
| · | Substantial improvement in the food retail segment, as reflected in revenue growth and a substantial increase in the EBITDA of the segment and of the group as a whole |
| · | Reducing leverage and sustaining an adjusted net debt-to-EBITDAR coverage ratio below 7.0x over time. |
Factors that can lower the rating:
| · | Failure to improve Mega's business standing and results |
| · | Substantial erosion in the net adjusted debt-to-EBITDAR ratio |
| · | Substantial erosion in the Company's level of liquidity |
| · | Substantial deterioration in the parent company's credit risk |
| 9 |
Rating History
About the Company
Alon Square, a public company listed on the Tel Aviv and New York stock exchanges, is Israel’s largest retail company. The Company is about 72.7% owned by Alon Israel Oil Company Ltd., a private holding company engaged in the retail and energy sectors in Israel and overseas. Ownership of the parent company is shared by Bielsol Investments Ltd., a private company jointly owned by David Weissman and the Biran family, and purchasing cooperative agencies belonging to kibbutzim. The Company operates today through four main subsidiaries: Mega Retail (100% holding), which concentrates the retail food business; BEE Retail (100%), which presently holds about 77.5% of Na'aman Ltd. and 35% of Kfar Hasha'ashuim; Dor Alon (78.4%), engaged in the marketing and sale of fuel in Israel; Blue Square Real Estate (63.7%), which owns real estate properties, most of which are currently leased for the retail activity. The Company also has a 49% stake in Diners Club Israel Ltd.
Mr. David Weissman is the Company's CEO and chief business manager. Mr. Amit Ben Yitzhak is chairman of the board of directors.
Related Reports
Alon Blue Square Israel Ltd., Rating Action, March 2014
The Retail Sector - Rating Methodology, August 2010
Financial Ratios Adjustment Methodology, November 2010
Commercial papers - Methodology, March 2008
The reports are published on Midroog's website:www.midroog.co.il.
Date of the report: March 9, 2015
| 10 |
KEY FINANCIAL TERMS
| Interest | Net financing expenses from Income Statement | |
| Cash Interest | Financing expenses from income statement after adjustments for non-cash flow expenditures from statement of cash flows | |
| Operating profit (EBIT) | Profit before tax, financing and onetime expenses/profits | |
Operating profit before amortization (EBITA) | EBIT + amortization of intangible assets. | |
| Operating profit before depreciation and amortization (EBITDA) | EBIT + depreciation + amortization of intangible assets. | |
Operating profit before depreciation, amortization and rent/leasing (EBITDAR) | EBIT + depreciation + amortization of intangible assets + rent + operational leasing. | |
| Assets | Company's total balance sheet assets. | |
| Debt | Short term debt + current maturities of long-term loans + long-term debt + liabilities on operational leasing | |
| Net debt | Debt - cash and cash equivalent – long-term investments | |
| Capitalization (CAP) | Debt + total shareholders' equity (including minority interest) + long-term deferred taxes in balance sheet | |
Capital investments Capital Expenditures (CAPEX) | Gross investments in equipment, machinery and intangible assets | |
Funds From Operations (FFO)* | Cash flow from operations before changes in working capital and before changes in other asset and liabilities | |
| Cash Flow from Current Operations (CFO)* | Cash flow from operating activity according to consolidated cash flow statements | |
| Retained Cash Flow (RCF)* | Funds from operations (FFO) less dividend paid to shareholders | |
| Free Cash Flow (FCF)* | Cash flow from operating activity (CFO) - CAPEX - dividends |
* It should be noted that in IFRS reports, interest payments and receipts, tax and dividends from investees will be included in the calculation of the operating cash flows, even if they are not entered in cash flow from operating activity.
| 11 |
Obligations Rating Scale
| Investment grade | Aaa | Obligations rated Aaa are those that, in Midroog's judgment, are of the highest quality and involve minimal credit risk. | |
| Aa | Obligations rated Aa are those that, in Midroog's judgment, are of high quality and involve very low credit risk. | ||
| A | Obligations rated A are considered by Midroog to be in the upper-end of the middle rating, and involve low credit risk. | ||
| Baa | Obligations rated Baa are those that, in Midroog's judgment, involve moderate credit risk. They are considered medium grade obligations, and could have certain speculative characteristics. | ||
| Speculative Investment | Ba | Obligations rated Ba are those that, in Midroog's judgment, contain speculative elements, and involve a significant degree of credit risk. | |
| B | Obligations rated B are those that, in Midroog's judgment, are speculative and involve a high credit risk. | ||
| Caa | Obligations rated Caa are those that, in Midroog's judgment, have weak standing and involve a very high credit risk. | ||
| Ca | Obligations rated Ca are very speculative investments, and are likely to be in, or very near to, a situation of insolvency, with some prospect of recovery of principal and interest. | ||
| C | Obligations rated C are assigned the lowest rating, and are generally in a situation of insolvency, with poor prospects of repayment of principal and interest. |
Midroog applies numerical modifiers 1, 2 and 3 in each of the rating categories from Aa to Caa. Modifier 1 indicates that the bond ranks in the higher end of the letter-rating category. Modifier 2 indicates that the bonds are in the middle of the letter-rating category; and modifier 3 indicates that the bonds are in the lower end of the letter-rating category.
| 12 |
Moody's short term ratings describe the ability of issuers to honor short-term financial obligations.Ratings may be assigned to issuers, individual issues and financial instruments.As a rule, short-term obligations are for a period of no more than 13 months, unless indicated otherwise.
| Symbol | Definition | |
| Prime – 1 | Issuers (or supporting institutions) rated P-1 have a superior ability to repay short-term debt obligations. | |
| Prime – 2 | Issuers (or supporting institutions) rated P-2 have a strong ability to repay short-term debt obligations. | |
| Prime – 3 | Issuers (or supporting institutions) rated P-3 have an acceptable ability to repay their short-term debt obligations. | |
| Not Prime (N-P) | Issuers rated N-P do not fall within any of the Prime rating categories. |
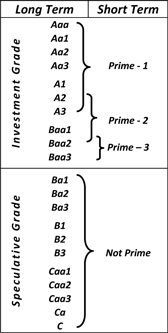
Short- term vs. Long term Ratings
| 13 |
Report No.:CTR050315000M
Midroog Ltd., Millennium 17 Ha’Arba'a Street, Tel-Aviv 64739
Tel: 03-6844700, Fax: 03-6855002,www.midroog.co.il
© Copyright 2015, Midroog Ltd. (“Midroog”). All rights reserved.
This document (including the contents thereof) is the property of Midroog and is protected by copyright and other intellectual property laws. There is to be no copying, photocopying, reproduction, modification, distribution, or display of this document for any commercial purpose without the express written consent of Midroog.
All the information contained herein on which Midroog relied was submitted to it by sources it believes to be reliable and accurate. Midroog does not independently check the correctness, completeness, compliance, accuracy or reliability of the information (hereinafter: the "information") submitted to it, and it relies on the information submitted to it by the rated Company for assigning the rating.
The rating is subject to change as a result of changes in the information obtained or for any other reason, and therefore it is recommended to monitor its revision or modification on Midroog's websitewww.midroog.co.il. The ratings assigned by Midroog express a subjective opinion, and they do not constitute a recommendation to buy or not to buy bonds or other rated instruments. The ratings should not be referred as endorsements of the accuracy of any of the data or opinions, or attempts to independently assess or vouch for the financial condition of any company. The ratings should not be construed as an opinion on the attractiveness of their price or the return of bonds or other rated instruments. Midroog's ratings relate directly only to credit risks and not to any other risk, such as the risk that the market value of the rated debt will drop due to changes in interest rates or due to other factors impacting the capital market. Any other rating or opinion given by Midroog must be considered as an individual element in any investment decision made by the user of the Information contained in this document or by someone on his behalf. Accordingly, any user of the information contained in this document must conduct his own investment feasibility study on the Issuer, guarantor, debenture or other rated document that he intends to hold, buy or sell. Midroog's ratings are not designed to meet the investment needs of any particular investor. The investor should always seek the assistance of a professional for advice on investments, the law, or other professional matters. Midroog hereby declares that the Issuers of bonds or of other rated instruments or in connection with the issue thereof the rating is being assigned, have undertaken, even prior to performing the rating, to render Midroog a payment for valuation and rating services provided by Midroog.
Midroog is a 51% subsidiary of Moody’s. Nevertheless, Midroog's rating process is entirely independent of Moody's and Midroog has its own policies, procedures and independent rating committee; however, its methodologies are based on those of Moody’s.
For further information on the rating procedures of Midroog or of its rating committee, please refer to the relevant pages on Midroog's website.
| 14 |