The Reserves Committee of the Board of Directors has reviewed the Corporation’s procedures for assembling and reporting other information associated with oil, gas and surface mineable oil sands activities and has reviewed that information with management. The Board of Directors has, on the recommendation of the Reserves Committee, approved:
Because the reserves data are based on judgments regarding future events, actual results will vary and the variations may be material. However, any variations should be consistent with the fact that reserves are categorized according to the probability of their recovery.
SIGNED: “STEVE W. LAUT”
Steve W. Laut
SIGNED: “DOUGLAS A. PROLL”
Douglas A. Proll
SIGNED: “DAVID A. TUER”
David A. Tuer
SIGNED: “JAMES S. PALMER”
James S. Palmer
The Audit Committee is appointed by the Board of Directors (the “Board”) to assist the Board in fulfilling its responsibility for the stewardship of the Corporation in overseeing the business and affairs of the Corporation. Although the Audit Committee has the powers and responsibilities set forth in this Charter, the role of the Audit Committee is oversight. The Audit Committee’s primary duties and responsibilities are to:
The Audit Committee has the authority to conduct any investigation appropriate to fulfilling its responsibilities, and it has direct access to the independent auditors as well as officers and employees of the Corporation. The Audit Committee has the authority to retain, at the Corporation’s expense, special legal, accounting or other consultants or experts it deems necessary in the performance of its duties. The Corporation shall at all times make adequate provisions for the payment of all fees and other compensation approved by the Audit Committee, to the Corporation’s independent auditors in connection with the issuance of its audit report, or to any consultants or experts employed by the Audit Committee.
71 | Canadian Natural Resources Limited |
Management’s Report
The accompanying consolidated financial statements and all other information contained elsewhere in this Annual Report are the responsibility of management. The consolidated financial statements have been prepared by management in accordance with the accounting policies described in the accompanying notes. Where necessary, management has made informed judgements and estimates in accounting for transactions that were not complete at the balance sheet date. In the opinion of management, the financial statements have been prepared in accordance with Canadian generally accepted accounting principles appropriate in the circumstances. The financial information presented elsewhere in the Annual Report has been reviewed to ensure consistency with that in the consolidated financial statements.
Management maintains appropriate systems of internal control. Policies and procedures are designed to give reasonable assurance that transactions are appropriately authorized and recorded, assets are safeguarded from loss or unauthorized use and financial records are properly maintained to provide reliable information for preparation of financial statements.
PricewaterhouseCoopers LLP, an independent firm of Chartered Accountants, has been engaged, as approved by a vote of the shareholders at the Company’s most recent Annual General Meeting, to audit and provide their independent audit opinions on the following:
| · | the Company’s consolidated financial statements as at December 31, 2009; and |
| · | the effectiveness of the Company’s internal control over financial reporting as at December 31, 2009. |
Their report is presented with the consolidated financial statements.
The Board of Directors (the “Board”) is responsible for ensuring that management fulfills its responsibilities for financial reporting and internal controls. The Board exercises this responsibility through the Audit Committee of the Board, which is comprised entirely of independent directors. The Audit Committee meets with management and the independent auditors to satisfy itself that management responsibilities are properly discharged and to review the consolidated financial statements before they are presented to the Board for approval. The consolidated financial statements have been approved by the Board on the recommendation of the Audit Committee.
| (signed) “Steve W. Laut” | (signed) “Douglas A. Proll” | (signed) “Randall S. Davis” |
Steve W. Laut President | Douglas A. Proll, CA Chief Financial Officer & Senior Vice-President, Finance | Randall S. Davis, CA Vice-President, Finance & Accounting |
Calgary, Alberta, Canada
March 3, 2010
Management’s Assessment of Internal Control Over Financial Reporting
Management is responsible for establishing and maintaining adequate internal control over financial reporting for the Company as defined in Rules 13a–15(f) and 15(d)–15(f) under the United States Securities Exchange Act of 1934, as amended.
Management, including the Company’s President and the Company’s Chief Financial Officer and Senior Vice-President, Finance, performed an assessment of the Company’s internal control over financial reporting based on the criteria established in Internal Control – Integrated Framework issued by the Committee of Sponsoring Organizations of the Treadway Commission (“COSO”).
Based on the assessment, management has concluded that the Company’s internal control over financial reporting is effective as at December 31, 2009. Management recognizes that all internal control systems have inherent limitations. Because of its inherent limitations, internal control over financial reporting may not prevent or detect misstatements. Also, projections of any evaluation of effectiveness to future periods are subject to the risk that controls may become inadequate because of changes in conditions, or that the degree of compliance with the policies or procedures may deteriorate.
PricewaterhouseCoopers LLP, an independent firm of Chartered Accountants, has provided an opinion on the Company’s internal control over financial reporting as at December 31, 2009, as stated in their Auditors’ Report.
| (signed) “Steve W. Laut” | | (signed) “Douglas A. Proll” |
Steve W. Laut President | | Douglas A. Proll, CA Chief Financial Officer & Senior Vice-President, Finance |
Calgary, Alberta, Canada
March 3, 2010
Independent Auditors’ Report
To the Shareholders of Canadian Natural Resources Limited
We have completed integrated audits of Canadian Natural Resources Limited’s 2009, 2008 and 2007 consolidated financial statements and of its internal control over financial reporting as at December 31, 2009. Our opinions, based on our audits, are presented below.
Consolidated Financial statements
We have audited the accompanying consolidated balance sheets of Canadian Natural Resources Limited (the “Company”) as at December 31, 2009 and December 31, 2008, and the related consolidated statements of earnings, shareholders’ equity, comprehensive income and cash flows for each of the years in the three year period ended December 31, 2009. These financial statements are the responsibility of the Company’s management. Our responsibility is to express an opinion on these financial statements based on our audits.
We conducted our audits of the Company’s financial statements as at December 31, 2009 and for each of the years in the three year period then ended in accordance with Canadian generally accepted auditing standards and the standards of the Public Company Accounting Oversight Board (United States). Those standards require that we plan and perform an audit to obtain reasonable assurance about whether the financial statements are free of material misstatement. An audit of financial statements includes examining, on a test basis, evidence supporting the amounts and disclosures in the financial statements. A financial statement audit also includes assessing the accounting principles used and significant estimates made by management, and evaluating the overall financial statement presentation. We believe that our audits provide a reasonable basis for our opinion.
In our opinion, the consolidated financial statements referred to above present fairly, in all material respects, the financial position of the Company as at December 31, 2009 and December 31, 2008 and the results of its operations and its cash flows for each of the years in the three year period ended December 31, 2009 in accordance with Canadian generally accepted accounting principles.
Internal control over financial reporting
We have also audited Canadian Natural Resources Limited’s internal control over financial reporting as at December 31, 2009, based on criteria established in Internal Control - Integrated Framework issued by the Committee of Sponsoring Organizations of the Treadway Commission (COSO). The Company’s management is responsible for maintaining effective internal control over financial reporting and for its assessment of the effectiveness of internal control over financial reporting, included in the accompanying Management’s Report. Our responsibility is to express an opinion on the Company’s internal control over financial reporting based on our audit.
We conducted our audit of internal control over financial reporting in accordance with the standards of the Public Company Accounting Oversight Board (United States). Those standards require that we plan and perform the audit to obtain reasonable assurance about whether effective internal control over financial reporting was maintained in all material respects. An audit of internal control over financial reporting includes obtaining an understanding of internal control over financial reporting, assessing the risk that a material weakness exists, testing and evaluating the design and operating effectiveness of internal control based on the assessed risk, and performing such other procedures as we consider necessary in the circumstances. We believe that our audit provides a reasonable basis for our opinion.
A company’s internal control over financial reporting is a process designed to provide reasonable assurance regarding the reliability of financial reporting and the preparation of financial statements for external purposes in accordance with generally accepted accounting principles. A company’s internal control over financial reporting includes those policies and procedures that (i) pertain to the maintenance of records that, in reasonable detail, accurately and fairly reflect the transactions and dispositions of the assets of the company; (ii) provide reasonable assurance that transactions are recorded as necessary to permit preparation of financial statements in accordance with generally accepted accounting principles, and that receipts and expenditures of the company are being made only in accordance with authori zations of management and directors of the company; and (iii) provide reasonable assurance regarding prevention or timely detection of unauthorized acquisition, use, or disposition of the company’s assets that could have a material effect on the financial statements.
Because of its inherent limitations, internal control over financial reporting may not prevent or detect misstatements. Also, projections of any evaluation of effectiveness to future periods are subject to the risk that controls may become inadequate because of changes in conditions, or that the degree of compliance with the policies or procedures may deteriorate.
In our opinion, the Company maintained, in all material respects, effective internal control over financial reporting as at December 31, 2009 based on criteria established in Internal Control — Integrated Framework issued by the COSO.
(signed) “PricewaterhouseCoopers LLP”
Chartered Accountants
March 3, 2010
Consolidated Balance Sheets
As at December 31 (millions of Canadian dollars) | | 2009 | | | 2008 | |
| ASSETS | | | | | | |
| Current assets | | | | | | |
Cash and cash equivalents | | $ | 13 | | | $ | 27 | |
Accounts receivable | | | 1,148 | | | | 1,059 | |
Inventory, prepaids and other | | | 584 | | | | 455 | |
Future income tax (note 8) | | | 146 | | | | – | |
Current portion of other long-term assets (note 3) | | | – | | | | 1,851 | |
| | | | 1,891 | | | | 3,392 | |
Property, plant and equipment (note 4) | | | 39,115 | | | | 38,966 | |
Other long-term assets (note 3) | | | 18 | | | | 292 | |
| | | $ | 41,024 | | | $ | 42,650 | |
| | | | | | | | | |
| LIABILITIES | | | | | | | | |
| Current liabilities | | | | | | | | |
Accounts payable | | $ | 240 | | | $ | 383 | |
Accrued liabilities | | | 1,522 | | | | 1,802 | |
Future income tax (note 8) | | | – | | | | 585 | |
Current portion of long-term debt (note 5) | | | – | | | | 420 | |
Current portion of other long-term liabilities (note 6) | | | 643 | | | | 230 | |
| | | | 2,405 | | | | 3,420 | |
Long-term debt (note 5) | | | 9,658 | | | | 12,596 | |
Other long-term liabilities (note 6) | | | 1,848 | | | | 1,124 | |
Future income tax (note 8) | | | 7,687 | | | | 7,136 | |
| | | | 21,598 | | | | 24,276 | |
| SHAREHOLDERS’ EQUITY | | | | | | | | |
Share capital (note 9) | | | 2,834 | | | | 2,768 | |
| Retained earnings | | | 16,696 | | | | 15,344 | |
Accumulated other comprehensive (loss) income (note 10) | | | (104 | ) | | | 262 | |
| | | | 19,426 | | | | 18,374 | |
| | | $ | 41,024 | | | $ | 42,650 | |
Commitments and contingencies (note 14)
Approved by the Board of Directors:
| (signed) "Catherine M. Best" | | (signed) " N. Murray Edwards" |
Catherine M. Best Chair of the Audit Committee and Director | | N. Murray Edwards Vice-Chairman of the Board of Directors and Director |
Consolidated Statements of Earnings
For the years ended December 31 (millions of Canadian dollars, except per common share amounts) | | 2009 | | | 2008 | | | 2007 | |
| Revenue | | $ | 11,078 | | | $ | 16,173 | | | $ | 12,543 | |
| Less: royalties | | | (936 | ) | | | (2,017 | ) | | | (1,391 | ) |
| Revenue, net of royalties | | | 10,142 | | | | 14,156 | | | | 11,152 | |
| Expenses | | | | | | | | | | | | |
| Production | | | 2,987 | | | | 2,451 | | | | 2,184 | |
| Transportation and blending | | | 1,218 | | | | 1,936 | | | | 1,570 | |
| Depletion, depreciation and amortization | | | 2,819 | | | | 2,683 | | | | 2,863 | |
Asset retirement obligation accretion (note 6) | | | 90 | | | | 71 | | | | 70 | |
| Administration | | | 181 | | | | 180 | | | | 208 | |
Stock-based compensation expense (recovery) (note 6) | | | 355 | | | | (52 | ) | | | 193 | |
| Interest, net | | | 410 | | | | 128 | | | | 276 | |
Risk management activities (note 13) | | | 738 | | | | (1,230 | ) | | | 1,562 | |
| Foreign exchange (gain) loss | | | (631 | ) | | | 718 | | | | (471 | ) |
| | | | 8,167 | | | | 6,885 | | | | 8,455 | |
| Earnings before taxes | | | 1,975 | | | | 7,271 | | | | 2,697 | |
Taxes other than income tax (note 8) | | | 106 | | | | 178 | | | | 165 | |
Current income tax expense (note 8) | | | 388 | | | | 501 | | | | 380 | |
Future income tax (recovery) expense (note 8) | | | (99 | ) | | | 1,607 | | | | (456 | ) |
| Net earnings | | $ | 1,580 | | | $ | 4,985 | | | $ | 2,608 | |
Net earnings per common share (note 12) | | | | | | | | | | | | |
| Basic and diluted | | $ | 2.92 | | | $ | 9.22 | | | $ | 4.84 | |
Consolidated Statements of Shareholders’ Equity
For the years ended December 31 (millions of Canadian dollars) | | 2009 | | | 2008 | | | 2007 | |
Share capital (note 9) | | | | | | | | | |
| Balance – beginning of year | | $ | 2,768 | | | $ | 2,674 | | | $ | 2,562 | |
| Issued upon exercise of stock options | | | 24 | | | | 18 | | | | 21 | |
| Previously recognized liability on stock options exercised for common shares | | | 42 | | | | 76 | | | | 91 | |
| Balance – end of year | | | 2,834 | | | | 2,768 | | | | 2,674 | |
| Retained earnings | | | | | | | | | | | | |
| Balance – beginning of year, as originally reported | | | 15,344 | | | | 10,575 | | | | 8,141 | |
| Transition adjustment on adoption of financial instruments standards | | | – | | | | – | | | | 10 | |
| Balance – beginning of year, as restated | | | 15,344 | | | | 10,575 | | | | 8,151 | |
| Net earnings | | | 1,580 | | | | 4,985 | | | | 2,608 | |
Dividends on common shares (note 9) | | | (228 | ) | | | (216 | ) | | | (184 | ) |
| Balance – end of year | | | 16,696 | | | | 15,344 | | | | 10,575 | |
Accumulated other comprehensive (loss) income (note 10) | | | | | | | | | | | | |
| Balance – beginning of year, as originally reported | | | 262 | | | | 72 | | | | (13 | ) |
| Transition adjustment on adoption of financial instruments standards | | | – | | | | – | | | | 159 | |
| Balance – beginning of year, as restated | | | 262 | | | | 72 | | | | 146 | |
| Other comprehensive (loss) income, net of taxes | | | (366 | ) | | | 190 | | | | (74 | ) |
| Balance – end of year | | | (104 | ) | | | 262 | | | | 72 | |
| Shareholders’ equity | | $ | 19,426 | | | $ | 18,374 | | | $ | 13,321 | |
Consolidated Statements of Comprehensive Income
For the years ended December 31 (millions of Canadian dollars) | | 2009 | | | 2008 | | | 2007 | |
| Net earnings | | $ | 1,580 | | | $ | 4,985 | | | $ | 2,608 | |
| Net change in derivative financial instruments designated as cash flow hedges | | | | | | | | | | | | |
Unrealized (loss) income during the year, net of taxes of $5 million (2008 – $1 million, 2007 – $6 million) | | | (33 | ) | | | 30 | | | | 38 | |
Reclassification to net earnings, net of taxes of $1 million (2008 – $6 million, 2007 – $45 million) | | | (10 | ) | | | (12 | ) | | | (96 | ) |
| | | | (43 | ) | | | 18 | | | | (58 | ) |
| Foreign currency translation adjustment | | | | | | | | | | | | |
| Translation of net investment | | | (323 | ) | | | 172 | | | | (16 | ) |
| Other comprehensive (loss) income, net of taxes | | | (366 | ) | | | 190 | | | | (74 | ) |
| Comprehensive income | | $ | 1,214 | | | $ | 5,175 | | | $ | 2,534 | |
Consolidated Statements of Cash Flows
For the years ended December 31 (millions of Canadian dollars) | | 2009 | | | 2008 | | | 2007 | |
| Operating activities | | | | | | | | | |
| Net earnings | | $ | 1,580 | | | $ | 4,985 | | | $ | 2,608 | |
| Non-cash items | | | | | | | | | | | | |
Depletion, depreciation and amortization | | | 2,819 | | | | 2,683 | | | | 2,863 | |
Asset retirement obligation accretion | | | 90 | | | | 71 | | | | 70 | |
Stock-based compensation expense (recovery) | | | 355 | | | | (52 | ) | | | 193 | |
Unrealized risk management loss (gain) | | | 1,991 | | | | (3,090 | ) | | | 1,400 | |
Unrealized foreign exchange (gain) loss | | | (661 | ) | | | 832 | | | | (524 | ) |
Deferred petroleum revenue tax expense (recovery) | | | 15 | | | | (67 | ) | | | 44 | |
Future income tax (recovery) expense | | | (99 | ) | | | 1,607 | | | | (456 | ) |
| Other | | | 5 | | | | 25 | | | | 38 | |
| Abandonment expenditures | | | (48 | ) | | | (38 | ) | | | (71 | ) |
| Net change in non-cash working capital (note 15) | | | (235 | ) | | | (189 | ) | | | (346 | ) |
| | | | 5,812 | | | | 6,767 | | | | 5,819 | |
| Financing activities | | | | | | | | | | | | |
| Repayment of bank credit facilities, net | | | (2,021 | ) | | | (623 | ) | | | (1,925 | ) |
| Issue of medium-term notes | | | – | | | | – | | | | 273 | |
| Repayment of senior unsecured notes | | | (34 | ) | | | (31 | ) | | | (33 | ) |
| Issue of US dollar debt securities | | | – | | | | 1,215 | | | | 2,553 | |
| Issue of common shares on exercise of stock options | | | 24 | | | | 18 | | | | 21 | |
| Dividends on common shares | | | (225 | ) | | | (208 | ) | | | (178 | ) |
| Net change in non-cash working capital (note 15) | | | (12 | ) | | | 46 | | | | 8 | |
| | | | (2,268 | ) | | | 417 | | | | 719 | |
| Investing activities | | | | | | | | | | | | |
| Expenditures on property, plant and equipment | | | (2,985 | ) | | | (7,433 | ) | | | (6,464 | ) |
| Net proceeds on sale of property, plant and equipment | | | 36 | | | | 20 | | | | 110 | |
| Net expenditures on property, plant and equipment | | | (2,949 | ) | | | (7,413 | ) | | | (6,354 | ) |
| Net change in non-cash working capital (note 15) | | | (609 | ) | | | 235 | | | | (186 | ) |
| | | | (3,558 | ) | | | (7,178 | ) | | | (6,540 | ) |
| (Decrease) increase in cash and cash equivalents | | | (14 | ) | | | 6 | | | | (2 | ) |
| Cash and cash equivalents – beginning of year | | | 27 | | | | 21 | | | | 23 | |
| Cash and cash equivalents – end of year | | $ | 13 | | | $ | 27 | | | $ | 21 | |
Supplemental disclosure of cash flow information (note 15)
Notes to the Consolidated Financial Statements
(tabular amounts in millions of Canadian dollars, unless otherwise stated)
1. ACCOUNTING POLICIES
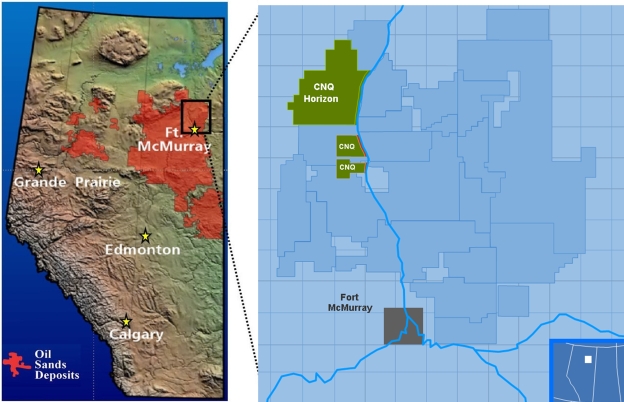
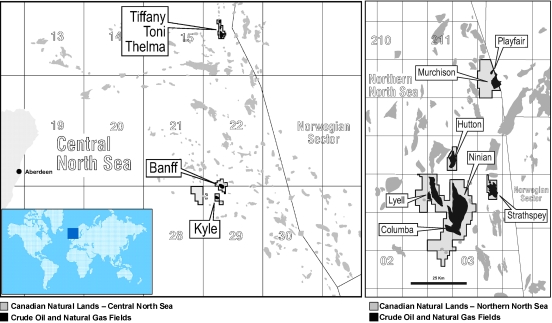
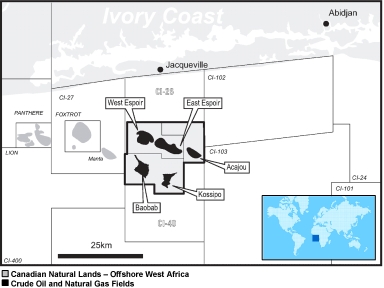
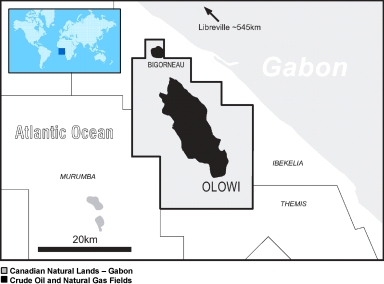
Canadian Natural Resources Limited (the “Company”) is a senior independent crude oil and natural gas exploration, development and production company head-quartered in Calgary, Alberta, Canada. The Company’s conventional crude oil and natural gas operations are focused in North America, largely in Western Canada; the United Kingdom (“UK”) portion of the North Sea; and Côte d’Ivoire and Gabon in Offshore West Africa.
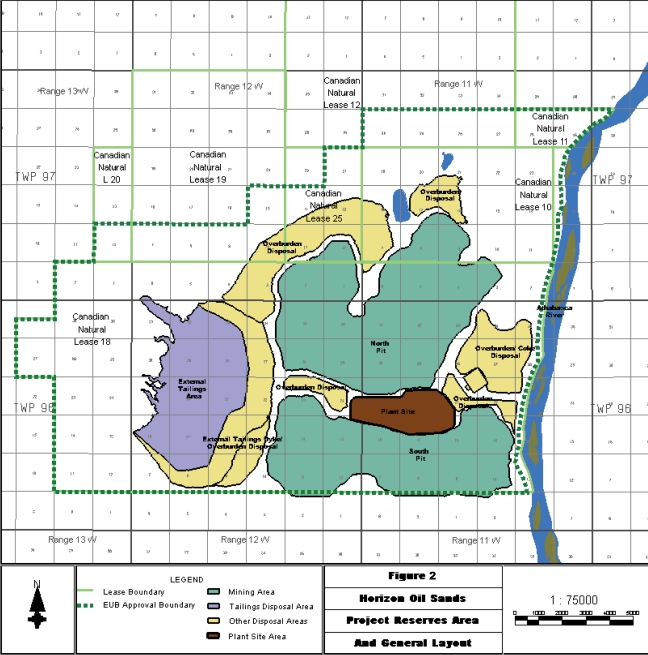
Horizon oil sands properties (“Horizon”) produce synthetic crude oil through bitumen mining and upgrading operations. During 2009, Horizon Phase 1 assets were completed and available for their intended use. All Horizon related financial results are included in the “Oil Sands Mining and Upgrading” segment.
Also within Western Canada, the Company maintains certain midstream activities that include pipeline operations and an electricity co-generation system.
The consolidated financial statements of the Company have been prepared in accordance with accounting principles generally accepted in Canada (“Canadian GAAP”). A summary of differences between accounting principles in Canada and those generally accepted in the United States (“US GAAP”) is contained in note 17.
Significant accounting policies are summarized as follows:
(A) PRINCIPLES OF CONSOLIDATION
The consolidated financial statements include the accounts of the Company and all of its subsidiary companies and partnerships. A significant portion of the Company’s activities are conducted jointly with others and the consolidated financial statements reflect only the Company’s proportionate interest in such activities.
(B) MEASUREMENT UNCERTAINTY
Management has made estimates and assumptions regarding certain assets, liabilities, revenues and expenses in the preparation of the consolidated financial statements. Such estimates primarily relate to unsettled transactions and events as of the date of the consolidated financial statements. Accordingly, actual results may differ from estimated amounts.
Purchase price allocations, depletion, depreciation and amortization, and amounts used in impairment calculations are based on estimates of crude oil and natural gas reserves. The estimation of reserves involves the exercise of judgement. Forecasts are based on engineering data, estimated future prices, expected future rates of production and the timing of future capital expenditures, all of which are subject to many uncertainties and interpretations. The Company expects that, over time, its reserve estimates will be revised upward or downward based on updated information such as the results of future drilling, testing and production levels, and may be affected by changes in commodity prices. As a result, the impact of differences between actual and estimated oil and gas reserves amounts on the consolidated financial statements of future periods may be material.
The calculation of asset retirement obligations includes estimates of the future costs to settle the asset retirement obligation, the timing of the cash flows to settle the obligation, and the future inflation rates. The impact of differences between actual and estimated costs, timing and inflation on the consolidated financial statements of future periods may be material.
The calculation of income taxes requires judgement in applying tax laws and regulations, estimating the timing of temporary difference reversals, and estimating the realizability of future tax assets. These estimates impact current and future income tax assets and liabilities, and current and future income tax expense (recovery).
The measurement of petroleum revenue tax expense in the United Kingdom and the related provision in the consolidated financial statements are subject to uncertainty associated with future recoverability of crude oil and natural gas reserves, commodity prices and the timing of future events, which may result in material changes to deferred amounts.
The estimation of fair value for derivative financial instruments requires the use of assumptions. In determining these assumptions, the Company has relied primarily on external, readily observable market inputs including quoted commodity prices and volatility, interest rate yield curves, and foreign exchange rates. The resulting fair value estimates may not necessarily be indicative of the amounts that could be realized or settled in a current market transaction and these differences may be material.
(C) CASH AND CASH EQUIVALENTS
Cash comprises cash on hand and demand deposits. Other investments (term deposits and certificates of deposit) with an original term to maturity at purchase of three months or less are reported as cash equivalents on the balance sheet.
(D) INVENTORIES
Inventories are carried at the lower of cost and net realizable value. Cost consists of purchase costs, direct production costs, direct overhead and depletion, depreciation and amortization and is determined on a first-in, first-out basis. Inventories are primarily comprised of crude oil production held for sale.
(E) PROPERTY, PLANT AND EQUIPMENT
Conventional Crude Oil and Natural Gas
The Company follows the full cost method of accounting for its conventional crude oil and natural gas properties and equipment as prescribed by Accounting Guideline 16 (“AcG 16”) issued by the Canadian Institute of Chartered Accountants (“CICA”). Accordingly, all costs relating to the exploration for and development of conventional crude oil and natural gas reserves are capitalized and accumulated in country-by-country cost centres. Directly attributable administrative overhead incurred during the development of certain large capital projects is capitalized until the projects are available for their intended use. Proceeds on disposal of properties are ordinarily deducted from such costs without recognition of a gain or loss except where such dispositions result in a change in the depletion rate of the specific cost centre of 20% or more.
Oil Sands Mining and Upgrading
Horizon is comprised of both mining and upgrading operations and accordingly, capitalized costs are accounted for separately from the Company’s Canadian conventional crude oil and natural gas costs. Capitalized mining activity costs include property acquisition, construction and development costs. Construction and development costs are capitalized separately to each Phase of Horizon. The construction and development of a particular Phase of Horizon is considered complete once the Phase is available for its intended use. Costs related to major maintenance turnaround activities are capitalized and amortized on a straight-line basis over the period to the next scheduled major maintenance turnaround. During 2009, Horizon Phase 1 assets were completed and available for their intended use. Accordingly, capitalization of all associated Phase 1 de velopment costs, including capitalized interest and stock-based compensation, and all directly attributable Phase 1 administrative costs ceased and depletion, depreciation and amortization of these assets commenced.
Midstream and Other
The Company capitalizes all costs that expand the capacity or extend the useful life of the assets.
(F) OVERBURDEN REMOVAL COSTS
Overburden removal costs incurred during development of the Horizon mine are capitalized to property, plant and equipment. Overburden removal costs incurred during production of the Horizon mine are included in the cost of inventory, unless the overburden removal activity has resulted in a betterment of the mineral property, in which case the costs are capitalized to property, plant and equipment. Capitalized overburden removal costs are amortized over the life of the mining reserves that directly benefit from the overburden removal activity.
(G) CAPITALIZED INTEREST
The Company capitalizes construction period interest based on major qualifying costs incurred and the Company’s cost of borrowing. Interest capitalization on a particular project ceases once this project is available for its intended use.
(H) LEASES
Leases that transfer substantially all of the benefits and risks of ownership to the Company are accounted for as capital leases and are recorded as property, plant and equipment with an offsetting liability. All other leases are accounted for as operating leases whereby lease costs are expensed as incurred. Contractual arrangements that meet the definition of a lease are accounted for as capital leases or operating leases as appropriate.
(I) DEPLETION, DEPRECIATION, AMORTIZATION AND IMPAIRMENT
Conventional Crude Oil and Natural Gas
Substantially all costs related to each country-by-country cost centre are depleted on the unit-of-production method based on the estimated proved reserves of that country. Volumes of net production and net reserves before royalties are converted to equivalent units on the basis of estimated relative energy content. In determining its depletion base, the Company includes estimated future costs to be incurred in developing proved reserves and excludes the cost of unproved properties and major development projects. Costs for major development projects, as identified by management, are not subject to depletion until the projects are available for their intended use. Unproved properties and major development projects are assessed periodically to determine whether impairment has occurred. When proved reserves are assigned or the value of an unproved property or major development project is considered to be impaired, the cost of the property or the amount of the impairment is added to costs subject to depletion. Processing and production facilities are depreciated on a straight-line basis over their estimated lives.
The Company reviews the carrying amount of its conventional crude oil and natural gas properties (“the properties”) relative to their recoverable amount (“the ceiling test”) for each cost centre at each annual balance sheet date, or more frequently if circumstances or events indicate impairment may have occurred. The recoverable amount is calculated as the undiscounted cash flow from the properties using proved reserves and expected future prices and costs. If the carrying amount of the properties exceeds their recoverable amount, an impairment loss is recognized in depletion and depreciation expense equal to the amount by which the carrying amount of the properties exceeds their fair value. Fair value is calculated as the cash flow from those properties using proved and probable reserves and expected future prices and co sts, discounted at a risk-free interest rate.
Oil Sands Mining and Upgrading
Mine-related costs and costs of the upgrader and related infrastructure located on the Horizon site are amortized on the unit-of-production method based on the estimated proved reserves of Horizon or productive capacity, respectively. Moveable mine-related equipment is depreciated on a straight-line basis over its estimated useful life.
The Company reviews the carrying amount of Horizon relative to its recoverable amount if circumstances or events indicate impairment may have occurred. The recoverable amount is calculated as the undiscounted cash flow from Horizon assets using proved and probable reserves and expected future prices and costs. If the carrying amount exceeds the recoverable amount, an impairment loss is recognized in depletion equal to the amount by which the carrying amount of the assets exceeds fair value. Fair value is calculated as the discounted cash flow from Horizon using proved and probable reserves and expected future prices and costs.
Midstream and Other
Midstream assets are depreciated on a straight-line basis over their estimated lives. The Company reviews the recoverability of the carrying amount of the midstream assets when events or circumstances indicate that the carrying amount might not be recoverable. If the carrying amount of the midstream assets exceeds their recoverable amount, an impairment loss equal to the amount by which the carrying amount of the midstream assets exceeds their fair value is recognized in depreciation. Other capital assets are amortized on a declining balance basis.
(J) ASSET RETIREMENT OBLIGATIONS
The Company provides for future asset retirement obligations on its resource properties, facilities, production platforms, gathering systems, and oil sands mining operations and tailings ponds based on current legislation and industry operating practices. The fair values of asset retirement obligations related to property, plant and equipment are recognized as a liability in the period in which they are incurred. Retirement costs equal to the fair value of the asset retirement obligations are capitalized as part of the cost of the associated property, plant and equipment and are amortized to expense through depletion and depreciation over the lives of the respective assets. The fair value of an asset retirement obligation is estimated by discounting the expected future cash flows to settle the asset retirement obligation at the Company’s a verage credit-adjusted risk-free interest rate. In subsequent periods, the asset retirement obligation is adjusted for the passage of time and for changes in the amount or timing of the underlying future cash flows. Actual expenditures are charged against the accumulated asset retirement obligation as incurred.
The Company’s Horizon upgrader and related infrastructure and its midstream pipelines have an indeterminate life and therefore the fair values of the related asset retirement obligations cannot be reasonably determined. The asset retirement obligations for these assets will be recorded in the year in which the lives of the assets are determinable.
(K) FOREIGN CURRENCY TRANSLATION
Foreign operations that are self-sustaining are translated using the current rate method. Under this method, assets and liabilities are translated to Canadian dollars from their functional currency using the exchange rate in effect at the consolidated balance sheet date. Revenues and expenses are translated to Canadian dollars at the monthly average exchange rates. Gains or losses on translation are included in accumulated other comprehensive income (loss) in shareholders’ equity in the consolidated balance sheets.
Foreign operations that are integrated are translated using the temporal method. For foreign currency balances and integrated subsidiaries, monetary assets and liabilities are translated to Canadian dollars at the exchange rate in effect at the consolidated balance sheet date. Non-monetary assets and liabilities are translated at the exchange rate in effect when the assets were acquired or obligations incurred. Revenues and expenses are translated to Canadian dollars at the monthly average exchange rates. Provisions for depletion, depreciation and amortization are translated at the same rate as the related assets. Gains or losses on translation of integrated foreign operations and foreign currency balances are included in the consolidated statements of earnings.
(L) REVENUE RECOGNITION AND COSTS OF GOODS SOLD
Revenue from the production of crude oil and natural gas is recognized when title passes to the customer, delivery has taken place and collection is reasonably assured. The Company assesses customer creditworthiness, both before entering into contracts and throughout the revenue recognition process.
Revenue as reported represents the Company’s share and is presented before royalty payments to governments and other mineral interest owners. Revenue, net of royalties represents the Company’s share after royalty payments to governments and other mineral interest owners.
Related costs of goods sold are comprised of production; transportation and blending; and depletion, depreciation and amortization expenses. These amounts have been separately presented in the consolidated statements of earnings.
(M) PRODUCTION SHARING CONTRACTS
Production generated from Offshore West Africa is currently shared under the terms of various Production Sharing Contracts (“PSCs”). Revenues are divided into cost recovery oil and profit oil. Cost recovery oil allows the Company to recover its capital and production costs and the costs carried by the Company on behalf of the respective Government State Oil Companies (the “Governments”). Profit oil is allocated to the joint venture partners in accordance with their respective equity interests, after a portion has been allocated to the Governments. The Governments’ share of profit oil attributable to the Company’s equity interest is allocated to royalty expense and current income tax expense in accordance with the terms of the PSCs.
(N) PETROLEUM REVENUE TAX
The Company accounts for the UK petroleum revenue tax (“PRT”) over the life of the field. The total future liability or recovery of PRT is estimated using proved and probable reserves and anticipated future sales prices and costs. The estimated future PRT is then apportioned to accounting periods on the basis of total estimated future operating income. Changes in the estimated total future PRT are accounted for prospectively.
(O) INCOME TAX
The Company follows the liability method of accounting for income taxes. Under this method, future income tax assets and liabilities are recognized based on the estimated tax effects of temporary differences in the carrying value of assets and liabilities in the consolidated financial statements and their respective tax bases, using income tax rates substantively enacted or enacted as of the consolidated balance sheet date. The effect of a change in income tax rates on the future income tax assets and liabilities is recognized in net earnings in the period of the change.
Taxable income arising from the conventional crude oil and natural gas business in Canada is primarily generated through partnerships, with the related income taxes payable in subsequent periods. Accordingly, North America current and future income taxes have been provided on the basis of this corporate structure.
(P) STOCK-BASED COMPENSATION PLANS
The Company accounts for stock-based compensation using the intrinsic value method as the Company’s Stock Option Plan (the “Option Plan”) provides current employees with the right to elect to receive common shares or a direct cash payment in exchange for options surrendered. A liability for potential cash settlements under the Option Plan is accrued over the vesting period of the stock options based on the difference between the exercise price of the stock options and the market price of the Company’s common shares, after consideration of an estimated forfeiture rate. This liability is revalued at each reporting date to reflect changes in the market price of the Company’s common shares and actual forfeitures, with the net change recognized in net earnings, or capitalized during the construction period in the case of Horizon. When stock options are surrendered for cash, the cash settlement paid reduces the outstanding liability. When stock options are exercised for common shares under the Option Plan, consideration paid by employees and any previously recognized liability associated with the stock options are recorded as share capital.
The Company has an employee stock savings plan and a stock bonus plan. Contributions to the employee stock savings plan are recorded as compensation expense at the time of the contribution. Contributions to the stock bonus plan are recognized as compensation expense over the related vesting period.
(Q) FINANCIAL INSTRUMENTS
The Company classifies its financial instruments into one of the following categories: held-for-trading financial assets and financial liabilities; held-to-maturity investments; loans and receivables; available-for-sale financial assets; and other financial liabilities. All financial instruments are required to be measured at fair value on initial recognition. Measurement in subsequent periods is dependent on the classification of the respective financial instrument.
Held-for-trading financial instruments are subsequently measured at fair value with changes in fair value recognized in net earnings. Available-for-sale financial assets are subsequently measured at fair value with changes in fair value recognized in other comprehensive income, net of tax. All other categories of financial instruments are measured at amortized cost using the effective interest method.
Cash and cash equivalents are classified as held-for-trading and are measured at fair value. Accounts receivable are classified as loans and receivables. Accounts payable, accrued liabilities, certain other long-term liabilities, and long-term debt are classified as other financial liabilities. Although the Company does not intend to trade its derivative financial instruments, risk management assets and liabilities are classified as held-for-trading for accounting purposes.
Financial assets and liabilities are categorized using a three-level hierarchy that reflects the significance of the inputs used in making fair value measurements for these assets and liabilities. The fair values of financial assets and liabilities included in Level 1 are determined by reference to quoted prices in active markets for identical assets and liabilities. Fair values of financial assets and liabilities in Level 2 are based on inputs other than Level 1 quoted prices that are observable for the asset or liability either directly (as prices) or indirectly (derived from prices). The fair values of Level 3 financial assets and liabilities are not based on observable market data. The disclosure of the fair value hierarchy excludes financial assets and liabilities where book value approximates fair value due to the liquid nature of the asse t or liability.
Transaction costs that are directly attributable to the acquisition or issue of a financial asset or liability and original issue discounts on long-term debt have been included in the carrying value of the related financial asset or liability and are amortized to consolidated net earnings over the life of the financial instrument using the effective interest method.
(R) RISK MANAGEMENT ACTIVITIES
The Company uses derivative financial instruments to manage its commodity price, foreign currency and interest rate exposures. These financial instruments are entered into solely for hedging purposes and are not used for speculative purposes. All derivative financial instruments are recognized on the consolidated balance sheet at estimated fair value at each balance sheet date. The estimated fair value of derivative financial instruments is determined based on appropriate internal valuation methodologies and/or third party indications. Fair values determined using valuation models require the use of assumptions concerning the amount and timing of future cash flows and discount rates.
The Company documents all derivative financial instruments that are formally designated as hedging transactions at the inception of the hedging relationship, in accordance with the Company’s risk management policies. The effectiveness of the hedging relationship is evaluated, both at inception of the hedge and on an ongoing basis.
The Company periodically enters into commodity price contracts to manage anticipated sales of crude oil and natural gas production in order to protect cash flow for capital expenditure programs. The effective portion of changes in the fair value of derivative commodity price contracts formally designated as cash flow hedges is initially recognized in other comprehensive income and is reclassified to risk management activities in consolidated net earnings in the same period or periods in which the commodity is sold. The ineffective portion of changes in the fair value of these designated contracts is immediately recognized in risk management activities in consolidated net earnings. All changes in the fair value of non-designated crude oil and natural gas commodity price contracts are recognized in risk management activities in consolidated net ea rnings.
The Company enters into interest rate swap contracts to manage its fixed to floating interest rate mix on certain of its long-term debt. The interest rate swap contracts require the periodic exchange of payments without the exchange of the notional principal amounts on which the payments are based. Changes in the fair value of interest rate swap contracts designated as fair value hedges and corresponding changes in the fair value of the hedged long-term debt are included in interest expense in consolidated net earnings. Changes in the fair value of non-designated interest rate swap contracts are included in risk management activities in consolidated net earnings.
Cross currency swap contracts are periodically used to manage currency exposure on US dollar denominated long-term debt. The cross currency swap contracts require the periodic exchange of payments with the exchange at maturity of notional principal amounts on which the payments are based. Changes in the fair value of the foreign exchange component of cross currency swap contracts designated as cash flow hedges are included in foreign exchange in consolidated net earnings. The effective portion of changes in the fair value of the interest rate component of cross currency swap contracts designated as cash flow hedges is initially included in other comprehensive income and is reclassified to interest expense when realized, with the ineffective portion recognized in risk management activities in consolidated net earnings. Changes in the fair value o f non-designated cross currency swap contracts are included in risk management activities in consolidated net earnings.
Realized gains or losses on the termination of financial instruments that have been designated as cash flow hedges are deferred under accumulated other comprehensive income on the consolidated balance sheets and amortized into consolidated net earnings in the period in which the underlying hedged item is recognized. In the event a designated hedged item is sold, extinguished or matures prior to the termination of the related derivative instrument, any unrealized derivative gain or loss is recognized immediately in consolidated net earnings. Realized gains or losses on the termination of financial instruments that have not been designated as hedges are recognized in consolidated net earnings immediately.
Upon termination of an interest rate swap designated as a fair value hedge, the interest rate swap is de-recognized on the balance sheet and the related long-term debt hedged is no longer revalued for changes in fair value. The fair value adjustment on the long-term debt at the date of termination of the interest rate swap is amortized to interest expense over the remaining term of the debt.
Foreign currency forward contracts are periodically used to manage foreign currency cash management requirements. The foreign currency forward contracts involve the purchase or sale of an agreed upon amount of US dollars at a specified future date at forward exchange rates. Changes in the fair value of foreign currency forward contracts designated as cash flow hedges are initially recorded in other comprehensive income and are reclassified to foreign exchange loss (gain) when realized. Changes in the fair value of foreign currency forward contracts not included as hedges are included in risk management activities in consolidated net earnings.
Embedded derivatives are derivatives that are included in a non-derivative host contract. Embedded derivatives are recorded at fair value separately from the host contract when their economic characteristics and risks are not clearly and closely related to the host contract.
(S) COMPREHENSIVE INCOME
Comprehensive income is comprised of the Company’s net earnings and other comprehensive income. Other comprehensive income includes the effective portion of changes in the fair value of derivative financial instruments designated as cash flow hedges and foreign currency translation gains and losses on the net investment in self-sustaining foreign operations. Other comprehensive income is shown net of related income taxes.
(T) PER COMMON SHARE AMOUNTS
The Company uses the treasury stock method to determine the dilutive effect of stock options and other dilutive instruments. This method assumes that proceeds received from the exercise of in-the-money stock options not accounted for as a liability are used to purchase common shares at the average market price during the year. The Company’s Option Plan described in note 9 results in a liability and expense for all outstanding stock options. As such, the potential common shares associated with the stock options are not included in the calculation of diluted earnings per share. The dilutive effect of other convertible securities is calculated by applying the “if-converted” method, which assumes that the securities are converted at the beginning of the period and that income items are adjusted to net earnings.
(U) RECENTLY ISSUED ACCOUNTING STANDARDS UNDER CANADIAN GAAP
The following standards will be effective for the Company’s year beginning on January 1, 2011:
Business Combinations, Consolidated Financial Statements and Non-Controlling Interests
| ● | Section 1582 – “Business Combinations”, 1601 – “Consolidated Financial Statements”, and 1602 – “Non-Controlling Interests” replace Section 1581 – “Business Combinations”, and 1600 – “Consolidated Financial Statements”. The new standards are the Canadian equivalent of IFRS 3 “Business Combinations” and IAS 27 “Consolidated and Separate Financial Statements”. Section 1582 is effective for business combinations for acquisition dates on or after January 1, 2011. Earlier adoption is permitted, provided all three new standards are adopted simultaneously. Section 1582 requires equity instruments issued as part of the purchase consideration to be measured at fair value at the acquisition date, rather than the date when the acquisition was agreed to and announced. In addition, most acquisition costs are expensed as incurred, instead of being included in the purchase consideration. The new standard also requires non-controlling interests to be measured at fair value instead of carrying amounts. Section 1602 provides guidance on the treatment of non-controlling interests after acquisition. Section 1601 carries forward existing guidance on the preparation of consolidated financial statements, other than non-controlling interests. There is no impact on the Company’s results of operations or financial position at this time. |
(V) INTERNATIONAL FINANCIAL REPORTING STANDARDS
In February 2008, the CICA’s Accounting Standards Board confirmed that Canadian publicly accountable entities will be required to adopt International Financial Reporting Standards (“IFRS”) as promulgated by the International Accounting Standards Board in place of Canadian GAAP effective January 1, 2011. The Company has assessed which accounting policies will be affected by the change to IFRS and continues to assess the potential impact of these changes on its financial position and results of operations.
(W) COMPARATIVE FIGURES
Certain prior year figures have been reclassified to conform to the presentation adopted in 2009.
2. CHANGES IN ACCOUNTING POLICIES
During 2009, the Company adopted the following new accounting standards issued by the CICA:
Goodwill and Intangible Assets
| ● | Effective January 1, 2009 Section 3064 – “Goodwill and Intangible Assets” replaced Section 3062 – “Goodwill and Other Intangible Assets” and Section 3450 – “Research and Development Costs”. In addition, EIC-27 – “Revenue and Expenditures during the Pre-Operating Period” was withdrawn. The new standard addresses when an internally generated intangible asset meets the definition of an asset. The adoption of this standard, which was adopted retroactively, did not have an impact on the Company’s results of operations or financial position. |
Credit Risk and the Fair Value of Financial Assets and Liabilities
| ● | On January 20, 2009 the Emerging Issues Committee (“EIC”) issued a new abstract EIC–173 “Credit Risk and the Fair Value of Financial Assets and Financial Liabilities”. This abstract concludes that an entity’s own credit risk and the credit risk of the counterparty should be taken into account when determining the fair value of financial assets and financial liabilities, including derivative financial instruments. This abstract applies to all financial assets and liabilities measured at fair value in interim and annual financial statements for periods ending on or after January 20, 2009. The adoption of this abstract did not have a material impact on the Company’s results of operations or financial position. |
The Company also adopted the following amendments to accounting standards issued by the CICA:
Financial Instruments
| ● | Effective July 1, 2009 Section 3855 – “Financial Instruments – Recognition and Measurement” was amended to add guidance on the assessment of embedded derivatives upon reclassification of a financial asset from the held-for-trading category. This amendment did not have any impact on the Company’s results of operations or financial position. |
Financial Instruments – Disclosures
| · | Effective October 1, 2009 Section 3862 – “Financial Instruments – Disclosures” was amended to include additional disclosure requirements for fair value measurements of financial instruments and to enhance liquidity risk disclosure requirements. The amendment requires the classification and disclosure of fair value measurements using a three-level hierarchy that reflects the significance of the inputs used in making the fair value measurements. This amendment affected disclosure only and did not impact the Company’s accounting for financial instruments (note 13). |
3. OTHER LONG-TERM ASSETS
| | | 2009 | | | 2008 | |
Risk management (note 13) | | $ | – | | | $ | 2,119 | |
| Other | | | 18 | | | | 24 | |
| | | | 18 | | | | 2,143 | |
| Less: current portion | | | – | | | | 1,851 | |
| | | $ | 18 | | | $ | 292 | |
4. PROPERTY, PLANT AND EQUIPMENT
| | | Cost | | | 2009 Accumulated depletion and depreciation | | | Net | | | Cost | | | 2008 Accumulated depletion and depreciation | | | Net | |
| Conventional crude oil and natural gas | | | | | | | | | | | | | | | | | | |
| North America | | $ | 38,259 | | | $ | 16,425 | | | $ | 21,834 | | | $ | 36,532 | | | $ | 14,381 | | | $ | 22,151 | |
| North Sea | | | 3,879 | | | | 2,067 | | | | 1,812 | | | | 4,167 | | | | 2,119 | | | | 2,048 | |
| Offshore West Africa | | | 2,861 | | | | 978 | | | | 1,883 | | | | 2,671 | | | | 777 | | | | 1,894 | |
| Other | | | 42 | | | | 14 | | | | 28 | | | | 40 | | | | 14 | | | | 26 | |
| Oil Sands Mining and Upgrading | | | 13,481 | | | | 186 | | | | 13,295 | | | | 12,573 | | | | – | | | | 12,573 | |
| Midstream | | | 284 | | | | 81 | | | | 203 | | | | 278 | | | | 72 | | | | 206 | |
| Head office | | | 200 | | | | 140 | | | | 60 | | | | 190 | | | | 122 | | | | 68 | |
| | | $ | 59,006 | | | $ | 19,891 | | | $ | 39,115 | | | $ | 56,451 | | | $ | 17,485 | | | $ | 38,966 | |
During the year ended December 31, 2009, the Company capitalized directly attributable administrative costs of $41 million (2008 – $55 million, 2007 – $47 million) in the North Sea and Offshore West Africa, related to exploration and development and $79 million (2008 – $404 million, 2007 – $312 million) in North America, related to Oil Sands Mining and Upgrading.
During the year ended December 31, 2009, the Company capitalized $106 million (2008 – $481 million, 2007 – $356 million) in construction period interest costs related to Oil Sands Mining and Upgrading.
Included in property, plant and equipment are unproved land and major development projects that are not currently subject to depletion or depreciation:
| | | 2009 | | | 2008 | |
| Conventional crude oil and natural gas | | | | | | |
| North America | | $ | 2,102 | | | $ | 2,271 | |
| North Sea | | | 4 | | | | 12 | |
| Offshore West Africa | | | 666 | | | | 595 | |
| Other | | | 28 | | | | 26 | |
| Oil Sands Mining and Upgrading | | | 752 | | | | 12,573 | |
| | | $ | 3,552 | | | $ | 15,477 | |
The Company has used the following estimated benchmark future prices (“escalated pricing”) in its full cost ceiling tests for conventional crude oil and natural gas activities prepared in accordance with Canadian GAAP, as at December 31, 2009:
| | | 2010 | | | 2011 | | | 2012 | | | 2013 | | | 2014 | | | Average annual increase thereafter | |
| Crude oil and NGLs | | | | | | | | | | | | | | | | | | |
| North America | | | | | | | | | | | | | | | | | | |
| WTI at Cushing (US$/bbl) | | $ | 79.17 | | | $ | 84.46 | | | $ | 86.89 | | | $ | 90.20 | | | $ | 92.01 | | | | 2 | % |
| Western Canada Select (C$/bbl) | | $ | 74.14 | | | $ | 78.29 | | | $ | 76.86 | | | $ | 78.87 | | | $ | 79.49 | | | | 2 | % |
| Edmonton Par (C$/bbl) | | $ | 84.25 | | | $ | 89.99 | | | $ | 92.61 | | | $ | 96.19 | | | $ | 98.13 | | | | 2 | % |
| North Sea and Offshore West Africa | | | | | | | | | | | | | | | | | | | | | | | | |
| North Sea Brent (US$/bbl) | | $ | 77.92 | | | $ | 83.19 | | | $ | 85.59 | | | $ | 88.88 | | | $ | 90.65 | | | | 2 | % |
| Natural gas | | | | | | | | | | | | | | | | | | | | | | | | |
| North America | | | | | | | | | | | | | | | | | | | | | | | | |
| Henry Hub Louisiana (US$/mmbtu) | | $ | 5.70 | | | $ | 6.48 | | | $ | 6.70 | | | $ | 7.43 | | | $ | 8.12 | | | | 2 | % |
| AECO (C$/mmbtu) | | $ | 5.36 | | | $ | 6.21 | | | $ | 6.44 | | | $ | 7.23 | | | $ | 7.98 | | | | 2 | % |
| Huntingdon/Sumas (C$/mmbtu) | | $ | 5.61 | | | $ | 6.46 | | | $ | 6.69 | | | $ | 7.48 | | | $ | 8.23 | | | | 2 | % |
Offshore West Africa property, plant and equipment has been reduced by $115 million to reflect the impact of a ceiling test impairment charge as at December 31, 2009. The impairment charge has been included in depletion, depreciation and amortization expenses.
5. LONG-TERM DEBT
| | | 2009 | | | 2008 | |
| Canadian dollar denominated debt | | | | | | |
| Bank credit facilities | | | | | | |
| Bankers’ acceptances | | $ | 1,897 | | | $ | 4,073 | |
| Medium-term notes | | | | | | | | |
| 5.50% unsecured debentures due December 17, 2010 | | | 400 | | | | 400 | |
| 4.50% unsecured debentures due January 23, 2013 | | | 400 | | | | 400 | |
| 4.95% unsecured debentures due June 1, 2015 | | | 400 | | | | 400 | |
| | | | 3,097 | | | | 5,273 | |
| US dollar denominated debt | | | | | | | | |
| Senior unsecured notes | | | | | | | | |
| Adjustable rate due May 27, 2009 (2009 – US$nil, 2008 – US$31 million) | | | – | | | | 38 | |
| US dollar debt securities | | | | | | | | |
6.70% due July 15, 2011 (2009 and 2008 – US$400 million) | | | 419 | | | | 490 | |
5.45% due October 1, 2012 (2009 and 2008 – US$350 million) | | | 366 | | | | 429 | |
5.15% due February 1, 2013 (2009 and 2008 – US$400 million) | | | 419 | | | | 490 | |
4.90% due December 1, 2014 (2009 and 2008 – US$350 million) | | | 366 | | | | 429 | |
6.00% due August 15, 2016 (2009 and 2008 – US$250 million) | | | 262 | | | | 306 | |
5.70% due May 15, 2017 (2009 and 2008 – US$1,100 million) | | | 1,151 | | | | 1,346 | |
5.90% due February 1, 2018 (2009 and 2008 – US$400 million) | | | 419 | | | | 490 | |
7.20% due January 15, 2032 (2009 and 2008 – US$400 million) | | | 419 | | | | 490 | |
6.45% due June 30, 2033 (2009 and 2008 – US$350 million) | | | 366 | | | | 429 | |
5.85% due February 1, 2035 (2009 and 2008 – US$350 million) | | | 366 | | | | 429 | |
6.50% due February 15, 2037 (2009 and 2008 – US$450 million) | | | 471 | | | | 551 | |
6.25% due March 15, 2038 (2009 and 2008 – US$1,100 million) | | | 1,151 | | | | 1,346 | |
6.75% due February 1, 2039 (2009 and 2008 – US$400 million) | | | 419 | | | | 490 | |
Less – original issue discount on senior unsecured notes and US dollar debt securities (1) | | | (22 | ) | | | (23 | ) |
| | | | 6,572 | | | | 7,730 | |
Fair value impact of interest rate swaps on US dollar debt securities (2) | | | 38 | | | | 68 | |
| | | | 6,610 | | | | 7,798 | |
| Long-term debt before transaction costs | | | 9,707 | | | | 13,071 | |
Less: transaction costs (1) (3) | | | (49 | ) | | | (55 | ) |
| | | | 9,658 | | | | 13,016 | |
| Less: current portion | | | – | | | | 420 | |
| | | $ | 9,658 | | | $ | 12,596 | |
| (1) | The Company has included unamortized original issue discounts and directly attributable transaction costs in the carrying value of the outstanding debt. |
| (2) | The carrying value of US$350 million of 5.45% notes due October 2012 and US$350 million of 4.90% notes due December 2014 have been adjusted by $38 million (2008 – $68 million) to reflect the fair value impact of hedge accounting. |
| (3) | Transaction costs primarily represent underwriting commissions charged as a percentage of the related debt offerings, as well as legal, rating agency and other professional fees. |
Bank Credit Facilities
As at December 31, 2009, the Company had in place unsecured bank credit facilities of $3,955 million, comprised of:
| · | a $200 million demand credit facility; |
| · | a revolving syndicated credit facility of $2,230 million maturing June 2012; |
| · | a revolving syndicated credit facility of $1,500 million maturing June 2012; and |
| · | a £15 million demand credit facility related to the Company’s North Sea operations. |
The revolving syndicated credit facilities are extendible annually for one year periods at the mutual agreement of the Company and the lenders. If the facilities are not extended, the full amount of the outstanding principal would be repayable on the maturity date. Borrowings under these facilities can be made by way of Canadian dollar and US dollar bankers’ acceptances, and LIBOR, US base rate and Canadian prime loans.
During 2009, the Company repaid the remaining $2,350 million outstanding on the non-revolving syndicated credit facility related to the acquisition of Anadarko Canada Corporation (“ACC”) and cancelled the facility. In March 2007, $1,500 million was repaid.
During 2009, the Company renegotiated its demand credit facility, increasing it to $200 million.
The Company’s weighted average interest rate on bank credit facilities outstanding as at December 31, 2009, was 0.8% (2008 – 2.2%).
In addition to the outstanding debt, letters of credit and financial guarantees aggregating $358 million, including $300 million related to Horizon, were outstanding at December 31, 2009.
Medium-Term Notes
During 2009, the Company filed a base shelf prospectus that allows for the issue of up to $3,000 million of medium-term notes in Canada until November 2011. If issued, these securities will bear interest as determined at the date of issuance.
Senior Unsecured Notes
During 2009, the remaining US$31 million of senior unsecured notes bearing interest at 6.54% was repaid.
US Dollar Debt Securities
During 2009, the Company filed a base shelf prospectus that allows for the issue of up to US$3,000 million of debt securities in the United States until November 2011. If issued, these securities will bear interest as determined at the date of issuance.
In January 2008, the Company issued US$1,200 million of unsecured notes under a previous US base shelf prospectus, comprised of US$400 million of 5.15% unsecured notes due February 2013, US$400 million of 5.90% unsecured notes due February 2018, and US$400 million of 6.75% unsecured notes due February 2039. Proceeds from the securities issued were used to repay bankers’ acceptances under the Company’s bank credit facilities.
During 2008, US$8 million of US dollar debt securities was repaid.
During 2008, the Company terminated the interest rate swaps that had been designated as a fair value hedge of US$350 million of 5.45% unsecured notes due October 2012. Accordingly, the Company ceased revaluing the related debt for subsequent changes in fair value from the date of termination of the interest rate swaps. The fair value adjustment of $20 million at the date of termination is being amortized to interest expense over the remaining term of the debt, with $14 million remaining at December 31, 2009.
Required Debt Repayments
Required debt repayments are as follows:
| Year | | Repayment | |
| 2010 | | $ | 400 | |
| 2011 | | $ | 419 | |
| 2012 | | $ | 366 | |
| 2013 | | $ | 819 | |
| 2014 | | $ | 366 | |
| Thereafter | | $ | 5,424 | |
No debt repayments are reflected in the above table for $1,897 million of revolving bank credit facilities due to the extendable nature of the facilities. Should the bank credit facilities not be extended by mutual agreement of the Company and the lenders, the amounts outstanding under these facilities would be due in 2012.
6. OTHER LONG-TERM LIABILITIES
| | | 2009 | | | 2008 | |
| Asset retirement obligations | | $ | 1,610 | | | $ | 1,064 | |
| Stock-based compensation | | | 392 | | | | 171 | |
Risk management (note 13) | | | 309 | | | | - | |
| Other | | | 180 | | | | 119 | |
| | | | 2,491 | | | | 1,354 | |
| Less: current portion | | | 643 | | | | 230 | |
| | | $ | 1,848 | | | $ | 1,124 | |
Asset Retirement Obligations
At December 31, 2009, the Company’s total estimated undiscounted costs to settle its asset retirement obligations were approximately $6,606 million (2008 – $4,474 million; 2007 – $4,426 million). Payments to settle these asset retirement obligations will occur on an ongoing basis over a period of approximately 60 years and have been discounted using a weighted average credit-adjusted risk-free interest rate of 6.9% (2008 – 6.7%; 2007 – 6.6%). A reconciliation of the discounted asset retirement obligations is as follows:
| | | 2009 | | | 2008 | | | 2007 | |
| Balance – beginning of year | | $ | 1,064 | | | $ | 1,074 | | | $ | 1,166 | |
Liabilities incurred (1) | | | 299 | | | | 18 | | | | 21 | |
| Liabilities acquired | | | – | | | | 3 | | | | – | |
| Liabilities disposed | | | – | | | | – | | | | (65 | ) |
| Liabilities settled | | | (48 | ) | | | (38 | ) | | | (71 | ) |
| Asset retirement obligation accretion | | | 90 | | | | 71 | | | | 70 | |
| Revision of estimates | | | 276 | | | | (156 | ) | | | 35 | |
| Foreign exchange | | | (71 | ) | | | 92 | | | | (82 | ) |
| Balance – end of year | | $ | 1,610 | | | $ | 1,064 | | | $ | 1,074 | |
| (1) | During 2009, the Company recognized additional asset retirement obligations related to Horizon and Gabon, Offshore West Africa. |
Stock-Based Compensation
The Company recognizes a liability for potential cash settlements under its Option Plan. The current portion represents the maximum amount of the liability payable within the next twelve–month period if all vested options are surrendered for cash settlement.
| | | 2009 | | | 2008 | | | 2007 | |
| Balance – beginning of year | | $ | 171 | | | $ | 529 | | | $ | 744 | |
| Stock-based compensation expense (recovery) | | | 355 | | | | (52 | ) | | | 193 | |
| Cash payment for options surrendered | | | (94 | ) | | | (207 | ) | | | (375 | ) |
| Transferred to common shares | | | (42 | ) | | | (76 | ) | | | (91 | ) |
| Capitalized (recovery) to Oil Sands Mining and Upgrading | | | 2 | | | | (23 | ) | | | 58 | |
| Balance – end of year | | | 392 | | | | 171 | | | | 529 | |
| Less: current portion | | | 365 | | | | 159 | | | | 390 | |
| | | $ | 27 | | | $ | 12 | | | $ | 139 | |
7. EMPLOYEE FUTURE BENEFITS
In connection with the acquisition of ACC, the Company assumed obligations to provide defined contribution pension benefits to certain ACC employees continuing their employment with the Company, and defined benefit pension and other post-retirement benefits to former ACC employees, under registered and unregistered pension plans.
The estimated future cost of providing defined benefit pension and other post-retirement benefits to former ACC employees is actuarially determined using management’s best estimates of demographic and financial assumptions. The discount rate of 5.5% (2008 – 7.0%) used to determine accrued benefit obligations is based on a year-end market rate of interest for high-quality debt instruments with cash flows that match the timing and amount of expected benefit payments. Company contributions to the defined contribution plan are expensed as incurred.
The benefit obligation under the registered pension plan at December 31, 2009 was $29 million (2008 – $27 million). As required by government regulations, the Company has set aside funds with an independent trustee to meet these benefit obligations. As at December 31, 2009, these plan assets had a fair value of $32 million (2008 – $34 million). The unregistered pension plan and other post-retirement benefits are unfunded and have a benefit obligation of $10 million at December 31, 2009 (2008 – $9 million).
8. TAXES
Taxes Other Than Income Tax
| | | 2009 | | | 2008 | | | 2007 | |
| Current PRT expense | | $ | 70 | | | $ | 210 | | | $ | 97 | |
| Deferred PRT expense (recovery) | | | 15 | | | | (67 | ) | | | 44 | |
| Provincial capital taxes and surcharges | | | 21 | | | | 35 | | | | 24 | |
| | | $ | 106 | | | $ | 178 | | | $ | 165 | |
Income Tax
The provision for income tax is as follows:
| | | 2009 | | | 2008 | | | 2007 | |
| Current income tax – North America | | $ | 28 | | | $ | 33 | | | $ | 96 | |
| Current income tax – North Sea | | | 278 | | | | 340 | | | | 210 | |
| Current income tax – Offshore West Africa | | | 82 | | | | 128 | | | | 74 | |
| Current income tax expense | | | 388 | | | | 501 | | | | 380 | |
| Future income tax (recovery) expense | | | (99 | ) | | | 1,607 | | | | (456 | ) |
| Income tax expense (recovery) | | $ | 289 | | | $ | 2,108 | | | $ | (76 | ) |
The provision for income tax is different from the amount computed by applying the combined statutory Canadian federal and provincial income tax rates to earnings before taxes. The reasons for the difference are as follows:
| | | 2009 | | | 2008 | | | 2007 | |
| Canadian statutory income tax rate | | | 29.1 | % | | | 29.8 | % | | | 32.5 | % |
| Income tax provision at statutory rate | | $ | 576 | | | $ | 2,166 | | | $ | 877 | |
| Effect on income taxes of: | | | | | | | | | | | | |
| Deductible UK petroleum revenue tax | | | (43 | ) | | | (72 | ) | | | (71 | ) |
| Foreign and domestic tax rate differentials | | | (127 | ) | | | (5 | ) | | | (25 | ) |
| North America income tax rate and other legislative changes | | | (19 | ) | | | (19 | ) | | | (864 | ) |
| Côte d’Ivoire income tax rate changes | | | – | | | | (22 | ) | | | – | |
| Non-taxable portion of foreign exchange (gain) loss | | | (92 | ) | | | 127 | | | | (96 | ) |
| Stock options exercised in shares | | | 27 | | | | 6 | | | | 63 | |
| Other | | | (33 | ) | | | (73 | ) | | | 40 | |
| Income tax expense (recovery) | | $ | 289 | | | $ | 2,108 | | | $ | (76 | ) |
The following table summarizes the temporary differences that give rise to the net future income tax asset and liability:
| | | 2009 | | | 2008 | |
| Future income tax liabilities | | | | | | |
| Property, plant and equipment | | $ | 6,992 | | | $ | 6,303 | |
| Timing of partnership items | | | 1,127 | | | | 1,276 | |
| Unrealized foreign exchange gain on long-term debt | | | 152 | | | | 13 | |
| Unrealized risk management activities | | | – | | | | 651 | |
| Other | | | 31 | | | | – | |
| Future income tax assets | | | | | | | | |
| Asset retirement obligations | | | (499 | ) | | | (372 | ) |
| Loss carryforwards for income tax | | | (84 | ) | | | (62 | ) |
| Stock-based compensation | | | (83 | ) | | | (38 | ) |
| Unrealized risk management activities | | | (69 | ) | | | – | |
| Other | | | – | | | | (7 | ) |
| Deferred petroleum revenue tax | | | (26 | ) | | | (43 | ) |
| Net future income tax liability | | | 7,541 | | | | 7,721 | |
| Less: current portion of future income tax (asset) liability | | | (146 | ) | | | 585 | |
| Future income tax liability | | $ | 7,687 | | | $ | 7,136 | |
During 2009, substantively enacted or enacted income tax rate changes resulted in a reduction of future income tax liabilities of $19 million in British Columbia.
During 2008, substantively enacted or enacted income tax rate changes resulted in a reduction of future income tax liabilities of approximately $19 million in British Columbia and approximately $22 million in Côte d’Ivoire.
During 2007, substantively enacted or enacted income tax rate and other legislative changes resulted in a reduction of future income tax liabilities of approximately $864 million in North America.
As a result of enacted income tax rate changes in 2007, the Canadian Federal corporate income tax rate is being reduced from 21% in 2007 to 15% in 2012.
The Company is subject to income tax reassessments arising in the normal course. The Company does not believe that any liabilities ultimately arising from these reassessments will be material.
9. SHARE CAPITAL
Authorized
200,000 Class 1 preferred shares with a stated value of $10.00 each.
Unlimited number of common shares without par value.
Issued
| | | 2009 | | | 2008 | |
| Common shares | | Number of shares (thousands) | | | Amount | | | Number of shares (thousands) | | | Amount | |
| Balance – beginning of year | | | 540,991 | | | $ | 2,768 | | | | 539,729 | | | $ | 2,674 | |
| Issued upon exercise of stock options | | | 1,336 | | | | 24 | | | | 1,262 | | | | 18 | |
| Previously recognized liability on stock options exercised for common shares | | | - | | | | 42 | | | | - | | | | 76 | |
| Balance – end of year | | | 542,327 | | | $ | 2,834 | | | | 540,991 | | | $ | 2,768 | |
Dividend Policy
The Company has paid regular quarterly dividends in January, April, July and October of each year since 2001. The dividend policy undergoes a periodic review by the Board of Directors and is subject to change.
On March 3, 2010, the Board of Directors set the Company’s regular quarterly dividend at $0.15 per common share (2009 – $0.105 per common share, 2008 – $0.10 per common share).
Normal Course Issuer Bid
On March 3, 2010 the Board of Directors approved a resolution to file with the Toronto Stock Exchange a notice of intention to purchase by way of normal course issuer bid up to 2.5% of the Company’s issued and outstanding common shares. Subject to acceptance by the Toronto Stock Exchange of the Notice of Intention, the purchases would be made through the facilities of the Toronto Stock Exchange and the New York Stock Exchange.
Share split
On March 3, 2010, the Company’s Board of Directors approved a resolution to subdivide the Company’s common shares on a two for one basis, subject to shareholder approval. The proposal will be voted on at the Company’s Annual and Special Meeting of Shareholders to be held on May 6, 2010.
Stock Options
The Company’s Option Plan provides for the granting of stock options to employees. Stock options granted under the Option Plan have terms ranging from five to six years to expiry and vest over a five-year period. The exercise price of each stock option granted is determined at the closing market price of the common shares on the Toronto Stock Exchange on the day prior to the grant. Each stock option granted provides the holder the choice to purchase one common share of the Company at the stated exercise price or receive a cash payment equal to the difference between the stated exercise price and the market price of the Company’s common shares on the date of surrender of the option.
The following table summarizes information relating to stock options outstanding at December 31, 2009 and 2008:
| | | 2009 | | | 2008 | |
| | | Stock options (thousands) | | | Weighted average exercise price | | | Stock options (thousands) | | | Weighted average exercise price | |
| | | | | | | | | | | | | |
| Outstanding – beginning of year | | | 30,962 | | | $ | 51.94 | | | | 30,659 | | | $ | 47.23 | |
| Granted | | | 6,736 | | | $ | 67.91 | | | | 7,705 | | | $ | 53.38 | |
| Surrendered for cash settlement | | | (2,833 | ) | | $ | 27.31 | | | | (3,702 | ) | | $ | 25.60 | |
| Exercised for common shares | | | (1,336 | ) | | $ | 17.99 | | | | (1,262 | ) | | $ | 14.61 | |
| Forfeited | | | (1,423 | ) | | $ | 59.55 | | | | (2,438 | ) | | $ | 56.56 | |
| Outstanding – end of year | | | 32,106 | | | $ | 58.54 | | | | 30,962 | | | $ | 51.94 | |
| Exercisable – end of year | | | 10,969 | | | $ | 53.90 | | | | 8,809 | | | $ | 44.58 | |
The range of exercise prices of stock options outstanding and exercisable at December 31, 2009 was as follows:
| | | | Stock options outstanding | | | Stock options exercisable | |
| Range of exercise prices | | | Stock options outstanding (thousands) | | | Weighted average remaining term (years) | | | Weighted average exercise price | | | Stock options exercisable (thousands) | | | Weighted average exercise price | |
| $ | 16.89 – $19.99 | | | | 338 | | | | 0.28 | | | $ | 17.36 | | | | 331 | | | $ | 17.36 | |
| $ | 20.00 – $29.99 | | | | 1,993 | | | | 0.35 | | | $ | 25.61 | | | | 1,342 | | | $ | 25.35 | |
| $ | 30.00 – $39.99 | | | | 755 | | | | 0.63 | | | $ | 33.28 | | | | 528 | | | $ | 33.29 | |
| $ | 40.00 – $49.99 | | | | 6,523 | | | | 4.06 | | | $ | 46.38 | | | | 1,252 | | | $ | 45.96 | |
| $ | 50.00 – $59.99 | | | | 4,700 | | | | 1.85 | | | $ | 58.11 | | | | 2,609 | | | $ | 58.04 | |
| $ | 60.00 – $69.99 | | | | 10,601 | | | | 3.84 | | | $ | 65.58 | | | | 2,503 | | | $ | 61.54 | |
| $ | 70.00 – $79.99 | | | | 6,412 | | | | 3.32 | | | $ | 70.82 | | | | 2,363 | | | $ | 70.72 | |
| $ | 80.00 – $89.99 | | | | - | | | | - | | | $ | - | | | | - | | | $ | - | |
| $ | 90.00 – $92.50 | | | | 784 | | | | 4.53 | | | $ | 92.50 | | | | 41 | | | $ | 92.50 | |
| | | | | | 32,106 | | | | 3.18 | | | $ | 58.54 | | | | 10,969 | | | $ | 53.90 | |
10. ACCUMULATED OTHER COMPREHENSIVE (LOSS) INCOME
The components of accumulated other comprehensive income, net of taxes, were as follows:
| | | 2009 | | | 2008 | |
| Derivative financial instruments designated as cash flow hedges | | $ | 76 | | | $ | 119 | |
| Foreign currency translation adjustment | | | (180 | ) | | | 143 | |
| | | $ | (104 | ) | | $ | 262 | |
During the next twelve months, $1 million is expected to be reclassified to net earnings from accumulated other comprehensive income.
During 2008, the Company determined that its operations in Offshore West Africa were operationally and financially independent and the current rate method of translation was adopted for translation of the financial statements of its Offshore West African subsidiaries. This change was applied prospectively and increased assets by $32 million, decreased liabilities by $4 million and increased accumulated other comprehensive income by $36 million.
11. CAPITAL DISCLOSURES
The Company does not have any externally imposed regulatory capital requirements for managing capital. The Company has defined its capital to mean its long-term debt and consolidated shareholders’ equity, as determined each reporting date. The Company is subject to certain financial covenants in its long-term debt agreements and is in compliance with these covenants.
The Company’s objectives when managing its capital structure are to maintain financial flexibility and balance to enable the Company to access capital markets to sustain its on-going operations and to support its growth strategies. The Company primarily monitors capital on the basis of an internally derived non-GAAP financial measure referred to as its “debt to book capitalization ratio”, which is the arithmetic ratio of current and long-term debt divided by the sum of the carrying value of shareholders’ equity plus current and long-term debt. The Company aims over time to maintain its debt to book capitalization ratio in the range of 35% to 45%. However, the Company may exceed the high end of such target range if it is investing in capital projects, undertaking acquisitions, or in periods of lower commodity prices. The C ompany may be below the low end of the target range when cash flow from operating activities is greater than current investment activities. The ratio is currently below the target range at 33%.
Readers are cautioned that the debt to book capitalization ratio is not defined by GAAP and this financial measure may not be comparable to similar measures presented by other companies. Further, there can be no assurances that the Company will continue to use this measure to monitor capital or will not alter the method of calculation of this measure at some point in the future.
| | | 2009 | | | 2008 | | |
Long-term debt (1) | | $ | 9,658 | | | $ | 13,016 | |
| Total shareholders’ equity | | $ | 19,426 | | | $ | 18,374 | |
| Debt to book capitalization | | | 33 | % | | | 41 | % |
| (1) | Includes the current portion of long-term debt. |
12. NET EARNINGS PER COMMON SHARE
| | | 2009 | | | 2008 | | | 2007 | |
| Weighted average common shares outstanding – basic and diluted (thousands of shares) | | | 541,925 | | | | 540,647 | | | | 539,336 | |
| Net earnings – basic and diluted | | $ | 1,580 | | | $ | 4,985 | | | $ | 2,608 | |
| Net earnings per common share – basic and diluted | | $ | 2.92 | | | $ | 9.22 | | | $ | 4.84 | |
13. FINANCIAL INSTRUMENTS
The carrying values of the Company’s financial instruments by category are as follows:
| | | 2009 | |
| Asset (liability) | | Loans and receivables at amortized cost | | | Held for trading at fair value | | | Other financial liabilities at amortized cost | |
| Cash and cash equivalents | | $ | – | | | $ | 13 | | | $ | – | |
| Accounts receivable | | | 1,148 | | | | – | | | | – | |
| Other long-term assets | | | – | | | | – | | | | – | |
| Accounts payable | | | – | | | | – | | | | (240 | ) |
| Accrued liabilities | | | – | | | | – | | | | (1,522 | ) |
| Other long-term liabilities | | | – | | | | (309 | ) | | | (167 | ) |
| Long-term debt | | | – | | | | – | | | | (9,658 | ) |
| | | $ | 1,148 | | | $ | (296 | ) | | $ | (11,587 | ) |
| | | 2008 | |
| Asset (liability) | | Loans and receivables at amortized cost | | | Held for trading at fair value | | | Other financial liabilities at amortized cost | |
| Cash and cash equivalents | | $ | – | | | $ | 27 | | | $ | – | |
| Accounts receivable | | | 1,059 | | | | – | | | | – | |
| Other long-term assets | | | – | | | | 2,119 | | | | – | |
| Accounts payable | | | – | | | | – | | | | (383 | ) |
| Accrued liabilities | | | – | | | | – | | | | (1,802 | ) |
| Other long-term liabilities | | | – | | | | – | | | | (105 | ) |
Long-term debt (1) | | | – | | | | – | | | | (13,016 | ) |
| | | $ | 1,059 | | | $ | 2,146 | | | $ | (15,306 | ) |
| (1) | Includes the current portion of long-term debt. |
The carrying value of the Company’s financial instruments approximates their fair value, except for fixed-rate long-term debt as noted below. The fair values of the Company’s financial assets and liabilities are outlined below:
| | | 2009 | |
| | | Carrying value | | | Fair value | |
Asset (liability) (1) | | | | | Level 1 | | | Level 2 | |
| Other long-term assets | | $ | – | | | $ | – | | | $ | – | |
| Other long-term liabilities | | | (309 | ) | | | – | | | | (309 | ) |
Fixed-rate long-term debt(2) (3) | | | (7,761 | ) | | | (8,212 | ) | | | – | |
| | | $ | (8,070 | ) | | $ | (8,212 | ) | | $ | (309 | ) |
| | | 2008 | |
| | | Carrying value | | | Fair value | |
Asset (liability) (1) | | | | | Level 1 | | | Level 2 | |
| Other long-term assets | | $ | 2,119 | | | $ | – | | | $ | 2,119 | |
| Other long-term liabilities | | | – | | | | – | | | | – | |
Fixed-rate long-term debt(2) (3) | | | (8,943 | ) | | | (7,649 | ) | | | – | |
| | | $ | (6,824 | ) | | $ | (7,649 | ) | | $ | 2,119 | |
(1) | Excludes financial assets and liabilities where book value approximates fair value due to the liquid nature of the asset or liability (cash and cash equivalents, accounts receivable, accounts payable and accrued liabilities). |
| (2) | The carrying values of US$350 million of 5.45% notes due October 2012 and US$350 million of 4.90% notes due December 2014 have been adjusted by $38 million (2008 – $68 million) to reflect the fair value impact of hedge accounting. |
| (3) | The fair value of fixed-rate long-term debt has been determined based on quoted market prices. |
Risk Management
The changes in estimated fair values of derivative financial instruments included in the risk management asset (liability) were recognized in the financial statements as follows:
| | | 2009 | | | 2008 | |
| Asset (liability) | | Risk management mark-to-market | | | Risk management mark-to-market | |
| Balance – beginning of year | | $ | 2,119 | | | $ | (1,474 | ) |
| Net cost of outstanding put options | | | – | | | | 297 | |
| Net change in fair value of outstanding derivative financial instruments attributable to: | | | | | | | | |
| Risk management activities | | | (1,991 | ) | | | 3,090 | |
| Interest expense | | | (25 | ) | | | 60 | |
| Foreign exchange | | | (338 | ) | | | 449 | |
| Other comprehensive income | | | (78 | ) | | | 18 | |
| Settlement of interest rate swaps | | | 4 | | | | (20 | ) |
| | | | (309 | ) | | | 2,420 | |
Add: put premium financing obligations (1) | | | – | | | | (301 | ) |
| Balance – end of year | | | (309 | ) | | | 2,119 | |
| Less: current portion | | | (182 | ) | | | 1,851 | |
| | | $ | (127 | ) | | $ | 268 | |
(1) The Company negotiated payment of put option premiums with various counterparties at the time of actual settlement of the respective options. These obligations were reflected in the net risk management asset (liability). |
Net (gains) losses from risk management activities for the years ended December 31 were as follows:
| | | 2009 | | | 2008 | | | 2007 | |
| Net realized risk management (gain) loss | | $ | (1,253 | ) | | $ | 1,860 | | | $ | 162 | |
| Net unrealized risk management loss (gain) | | | 1,991 | | | | (3,090 | ) | | | 1,400 | |
| | | $ | 738 | | | $ | (1,230 | ) | | $ | 1,562 | |
Financial Risk Factors
Market risk is the risk that the fair value or future cash flows of a financial instrument will fluctuate because of changes in market prices. The Company’s market risk is comprised of commodity price risk, interest rate risk, and foreign currency exchange risk.
Commodity price risk management
The Company uses commodity derivative financial instruments to manage its exposure to commodity price risk associated with the sale of its future crude oil and natural gas production. At December 31, 2009, the Company had the following net derivative financial instruments outstanding to manage its commodity price exposures:
| | Remaining term | Volume | Weighted average price | Index |
| Crude oil | | | | |
| Crude oil price collars | Jan 2010 – Mar 2010 | 6,000 bbl/d | US$60.00 – US$105.15 | WTI |
| | Jan 2010 – Jun 2010 | 100,000 bbl/d | US$60.00 – US$90.13 | WTI |
| | Jan 2010 – Sep 2010 | 50,000 bbl/d | US$65.00 – US$105.49 | WTI |
| | Jan 2010 – Dec 2010 | 50,000 bbl/d | US$60.00 – US$75.08 | WTI |
| | Jul 2010 – Dec 2010 | 50,000 bbl/d | US$65.00 – US$108.94 | WTI |
| | | | | |
| | Remaining term | Volume | Weighted average price | Index |
| Natural gas | | | | |
Natural gas price collars(1) | Jan 2010 – Dec 2010 | 220,000 GJ/d | C$6.00 – C$8.00 | AECO |
| (1) | Subsequent to December 31, 2009, the Company entered into 400,000 GJ/d of C$4.50 – C$6.30 natural gas AECO collars for the period April to September 2010. |
The Company’s outstanding commodity derivative financial instruments are expected to be settled monthly based on the applicable index pricing for the respective contract month.
There were no commodity derivative financial instruments designated as hedges at December 31, 2009.
Interest rate risk management
The Company is exposed to interest rate price risk on its fixed rate long-term debt and to interest rate cash flow risk on its floating rate long-term debt. The Company enters into interest rate swap contracts to manage its fixed to floating interest rate mix on long-term debt. The interest rate swap contracts require the periodic exchange of payments without the exchange of the notional principal amounts on which the payments are based. At December 31, 2009, the Company had the following interest rate swap contracts outstanding:
| | Remaining term | Amount ($ millions) | Fixed rate | Floating rate |
| Interest rate | | | | |
| Swaps – fixed to floating | Jan 2010 – Dec 2014 | US$350 | 4.90% | LIBOR (1) + 0.38% |
| | | | | |
| Swaps – floating to fixed | Jan 2010 – Feb 2011 | C$300 | 1.0680% | 3 month CDOR (2) |
| | Jan 2010 – Feb 2012 | C$200 | 1.4475% | 3 month CDOR (2) |
(1) London Interbank Offered Rate
(2) Canadian Dealer Offered Rate
All fixed to floating interest rate related derivative financial instruments designated as hedges at December 31, 2009 were classified as fair value hedges.
Foreign currency exchange rate risk management
The Company is exposed to foreign currency exchange rate risk in Canada primarily related to its US dollar denominated long-term debt and working capital. The Company is also exposed to foreign currency exchange rate risk on transactions conducted in other currencies in its subsidiaries and in the carrying value of its self-sustaining foreign subsidiaries. The Company periodically enters into cross currency swap contracts and foreign currency forward contracts to manage known currency exposure on US dollar denominated long-term debt and working capital. The cross currency swap contracts require the periodic exchange of payments with the exchange at maturity of notional principal amounts on which the payments are based. At December 31, 2009, the Company had the following cross currency swap contracts outstanding:
| | Remaining term | Amount ($ millions) | Exchange rate (US$/C$) | Interest rate (US$) | Interest rate (C$) |
| Cross currency | | | | | |
| Swaps | Jan 2010 – Aug 2016 | US$250 | 1.116 | 6.00% | 5.40% |
| | Jan 2010 – May 2017 | US$1,100 | 1.170 | 5.70% | 5.10% |
| | Jan 2010 – Mar 2038 | US$550 | 1.170 | 6.25% | 5.76% |
All cross currency swap derivative financial instruments designated as hedges at December 31, 2009 were classified as cash flow hedges.
In addition to the cross currency swap contracts noted above, at December 31, 2009, the Company had US$1,062 million of foreign currency forward contracts outstanding, with terms of approximately 30 days or less.
Financial instrument sensitivities
The following table summarizes the annualized sensitivities of the Company’s net earnings and other comprehensive income to changes in the fair value of financial instruments outstanding as at December 31, 2009, resulting from changes in the specified variable, with all other variables held constant. These sensitivities are prepared on a different basis than those sensitivities disclosed in the Company’s other continuous disclosure documents, are limited to the impact of changes in a specified variable applied to financial instruments only and do not represent the impact of a change in the variable on the operating results of the Company taken as a whole. Further, these sensitivities are theoretical, as changes in one variable may contribute to changes in another variable, which may magnify or counteract the sensitivities. In additio n, changes in fair value generally can not be extrapolated because the relationship of a change in an assumption to the change in fair value may not be linear.
| | | Impact on net earnings | | | Impact on other comprehensive income | |
| Commodity price risk | | | | | | |
| Increase WTI US$1.00/bbl | | $ | (21 | ) | | $ | – | |
| Decrease WTI US$1.00/bbl | | $ | 20 | | | $ | – | |
| Increase AECO C$0.10/mcf | | $ | (4 | ) | | $ | – | |
| Decrease AECO C$0.10/mcf | | $ | 4 | | | $ | – | |
| Interest rate risk | | | | | | | | |
| Increase interest rate 1% | | $ | (12 | ) | | $ | 14 | |
| Decrease interest rate 1% | | $ | 8 | | | $ | (18 | ) |
| Foreign currency exchange rate risk | | | | | | | | |
| Increase exchange rate by US$0.01 | | $ | (29 | ) | | $ | – | |
| Decrease exchange rate by US$0.01 | | $ | 29 | | | $ | – | |
Credit risk is the risk that a party to a financial instrument will cause a financial loss to the Company by failing to discharge an obligation.
Counterparty credit risk management
The Company’s accounts receivable are mainly with customers in the crude oil and natural gas industry and are subject to normal industry credit risks. The Company manages these risks by reviewing its exposure to individual companies on a regular basis and where appropriate, ensures that parental guarantees or letters of credit are in place to minimize the impact in the event of default. At December 31, 2009, substantially all of the Company’s accounts receivables were due within normal trade terms.
The Company is also exposed to possible losses in the event of nonperformance by counterparties to derivative financial instruments; however, the Company manages this credit risk by entering into agreements with counterparties that are substantially all investment grade financial institutions and other entities. At December 31, 2009, the Company had net risk management assets of $7 million with specific counterparties related to derivative financial instruments (December 31, 2008 – $2,119 million).
Liquidity Risk
Liquidity risk is the risk that the Company will encounter difficulty in meeting obligations associated with financial liabilities.
Management of liquidity risk requires the Company to maintain sufficient cash and cash equivalents, along with other sources of capital, consisting primarily of cash flow from operating activities, available credit facilities, and access to debt capital markets, to meet obligations as they become due. The Company believes it has adequate bank credit facilities to provide liquidity to manage fluctuations in the timing of the receipt and/or disbursement of operating cash flows.
The maturity dates for financial liabilities are as follows:
| | | Less than 1 year | | | 1 to less than 2 years | | | 2 to less than 5 years | | | Thereafter | |
| Accounts payable | | $ | 240 | | | $ | – | | | $ | – | | | $ | – | |
| Accrued liabilities | | $ | 1,522 | | | $ | – | | | $ | – | | | $ | – | |
| Risk management | | $ | 182 | | | $ | 15 | | | $ | 48 | | | $ | 64 | |
| Other long-term liabilities | | $ | 96 | | | $ | 18 | | | $ | 32 | | | $ | 21 | |
Long-term debt (1) | | $ | 400 | | | $ | 419 | | | $ | 1,551 | | | $ | 5,424 | |
| (1) | The long-term debt represents principal repayments only and does not reflect fair value adjustments, original issue discounts or transaction costs. No debt repayments are reflected for $1,897 million of revolving bank credit facilities due to the extendable nature of the facilities. |
14. COMMITMENTS AND CONTINGENCIES
The Company has committed to certain payments as follows:
| | | 2010 | | | 2011 | | | 2012 | | | 2013 | | | 2014 | | | Thereafter | |
| Product transportation and pipeline | | $ | 207 | | | $ | 162 | | | $ | 136 | | | $ | 125 | | | $ | 126 | | | $ | 1,051 | |
| Offshore equipment operating leases | | $ | 155 | | | $ | 124 | | | $ | 103 | | | $ | 102 | | | $ | 101 | | | $ | 261 | |
| Offshore drilling | | $ | 49 | | | $ | - | | | $ | - | | | $ | - | | | $ | - | | | $ | - | |
Asset retirement obligations (1) | | $ | 16 | | | $ | 20 | | | $ | 21 | | | $ | 31 | | | $ | 39 | | | $ | 6,479 | |
| Office leases | | $ | 25 | | | $ | 19 | | | $ | 3 | | | $ | 2 | | | $ | 2 | | | $ | - | |
| Other | | $ | 271 | | | $ | 67 | | | $ | 23 | | | $ | 15 | | | $ | 12 | | | $ | 34 | |
| | (1) Amounts represent management’s estimate of the future undiscounted payments to settle asset retirement obligations related to resource properties, facilities, and production platforms, based on current legislation and industry operating practices. Amounts disclosed for the period 2010 – 2014 represent the minimum required expenditures to meet these obligations. Actual expenditures in any particular year may exceed these minimum amounts. |
The Company is defendant and plaintiff in a number of legal actions that arise in the normal course of business. In addition, the Company is subject to certain contractor claims. The Company believes that any liabilities that might arise pertaining to any such matters would not have a material effect on its consolidated financial position.
15. SUPPLEMENTAL DISCLOSURE OF CASH FLOW INFORMATION
Changes in non-cash working capital were as follows:
| | | 2009 | | | 2008 | | | 2007 | |
| Changes in non-cash working capital | | | | | | | | | |
| Accounts receivable and other | | $ | (276 | ) | | $ | 111 | | | $ | 334 | |
| Accounts payable | | | (151 | ) | | | (4 | ) | | | (456 | ) |
| Accrued liabilities | | | (429 | ) | | | (15 | ) | | | (402 | ) |
| Net changes in non-cash working capital | | $ | (856 | ) | | $ | 92 | | | $ | (524 | ) |
| Relating to: | | | | | | | | | | | | |
| Operating activities | | $ | (235 | ) | | $ | (189 | ) | | $ | (346 | ) |
| Financing activities | | | (12 | ) | | | 46 | | | | 8 | |
| Investing activities | | | (609 | ) | | | 235 | | | | (186 | ) |
| | | $ | (856 | ) | | $ | 92 | | | $ | (524 | ) |
Other cash flow information: | | | 2009 | | | | 2008 | | | | 2007 | |
| Interest paid | | $ | 516 | | | $ | 574 | | | $ | 556 | |
| Taxes other than income tax paid | | $ | 52 | | | $ | 300 | | | $ | 116 | |
| Current income tax paid | | $ | 216 | | | $ | 258 | | | $ | 302 | |
16. SEGMENTED INFORMATION
The Company’s conventional crude oil and natural gas activities are conducted in three geographic segments: North America, North Sea and Offshore West Africa. These activities include the exploration, development, production and marketing of conventional crude oil, natural gas liquids and natural gas.
The Company’s Oil Sands Mining and Upgrading is a separate segment from conventional crude oil and natural gas activities as the bitumen will be recovered through mining operations.
Midstream activities include the Company’s pipeline operations and an electricity co-generation system. Activities that are not included in the above segments are reported in the segmented information as other. Inter-segment eliminations include internal transportation, electricity charges and natural gas sales.
| | Conventional Crude Oil and Natural Gas |
| | North America | North Sea | Offshore West Africa | Total |
| | | 2009 | | | 2008 | | | 2007 | | | 2009 | | | 2008 | | | 2007 | | | 2009 | | | 2008 | | | 2007 | | | 2009 | | | 2008 | | | 2007 | |
| Segmented revenue | | $ | 7,973 | | | $ | 13,496 | | | $ | 10,149 | | | $ | 961 | | | $ | 1,769 | | | $ | 1,597 | | | $ | 913 | | | $ | 944 | | | $ | 776 | | | $ | 9,847 | | | $ | 16,209 | | | $ | 12,522 | |
| Less: royalties | | | (825 | ) | | | (1,876 | ) | | | (1,318 | ) | | | (2 | ) | | | (4 | ) | | | (3 | ) | | | (81 | ) | | | (143 | ) | | | (70 | ) | | | (908 | ) | | | (2,023 | ) | | | (1,391 | ) |
| Revenue, net of royalties | | | 7,148 | | | | 11,620 | | | | 8,831 | | | | 959 | | | | 1,765 | | | | 1,594 | | | | 832 | | | | 801 | | | | 706 | | | | 8,939 | | | | 14,186 | | | | 11,131 | |
| Segmented expenses | | | | | | | | | | | | | | | | | | | | | | | | | | | | | | | | | | | | | | | | | | | | | | | | |
| Production | | | 1,748 | | | | 1,881 | | | | 1,642 | | | | 376 | | | | 457 | | | | 432 | | | | 179 | | | | 102 | | | | 94 | | | | 2,303 | | | | 2,440 | | | | 2,168 | |
| Transportation and blending | | | 1,213 | | | | 1,975 | | | | 1,595 | | | | 8 | | | | 10 | | | | 16 | | | | 1 | | | | 1 | | | | 1 | | | | 1,222 | | | | 1,986 | | | | 1,612 | |
| Depletion, depreciation and amortization | | | 2,060 | | | | 2,236 | | | | 2,350 | | | | 261 | | | | 317 | | | | 340 | | | | 335 | | | | 132 | | | | 165 | | | | 2,656 | | | | 2,685 | | | | 2,855 | |
| Asset retirement obligation accretion | | | 41 | | | | 42 | | | | 38 | | | | 24 | | | | 27 | | | | 30 | | | | 4 | | | | 2 | | | | 2 | | | | 69 | | | | 71 | | | | 70 | |
| Realized risk management activities | | | (880 | ) | | | 1,861 | | | | 129 | | | | (373 | ) | | | (1 | ) | | | 33 | | | | – | | | | – | | | | – | | | | (1,253 | ) | | | 1,860 | | | | 162 | |
| Total segmented expenses | | | 4,182 | | | | 7,995 | | | | 5,754 | | | | 296 | | | | 810 | | | | 851 | | | | 519 | | | | 237 | | | | 262 | | | | 4,997 | | | | 9,042 | | | | 6,867 | |
| Segmented earnings before the following | | $ | 2,966 | | | $ | 3,625 | | | $ | 3,077 | | | $ | 663 | | | $ | 955 | | | $ | 743 | | | $ | 313 | | | $ | 564 | | | $ | 444 | | | $ | 3,942 | | | $ | 5,144 | | | $ | 4,264 | |
| Non–segmented expenses |
| Administration |
| Stock-based compensation expense (recovery) |
| Interest, net |
| Unrealized risk management activities |
| Foreign exchange (gain) loss |
| Total non-segmented expenses |
| Earnings before taxes |
| Taxes other than income tax |
| Current income tax expense |
| Future income tax (recovery) expense |
| Net earnings |
| | Oil Sands Mining and Upgrading | Midstream | Inter–segment elimination and other | Total |
| | | 2009 | | | 2008 | | | 2007 | | | 2009 | | | 2008 | | | 2007 | | | 2009 | | | 2008 | | | 2007 | | | 2009 | | | 2008 | | | 2007 | |
| Segmented revenue | | $ | 1,253 | | | $ | – | | | $ | – | | | $ | 72 | | | $ | 77 | | | $ | 74 | | | $ | (94 | ) | | $ | (113 | ) | | $ | (53 | ) | | $ | 11,078 | | | $ | 16,173 | | | $ | 12,543 | |
| Less: royalties | | | (36 | ) | | | – | | | | – | | | | – | | | | – | | | | – | | | | 8 | | | | 6 | | | | – | | | | (936 | ) | | | (2,017 | ) | | | (1,391 | ) |
| Revenue, net of royalties | | | 1,217 | | | | – | | | | – | | | | 72 | | | | 77 | | | | 74 | | | | (86 | ) | | | (107 | ) | | | (53 | ) | | | 10,142 | | | | 14,156 | | | | 11,152 | |
| Segmented expenses | | | | | | | | | | | | | | | | | | | | | | | | | | | | | | | | | | | | | | | | | | | | | | | | |
| Production | | | 683 | | | | – | | | | – | | | | 19 | | | | 25 | | | | 22 | | | | (18 | ) | | | (14 | ) | | | (6 | ) | | | 2,987 | | | | 2,451 | | | | 2,184 | |
| Transportation and blending | | | 41 | | | | – | | | | – | | | | – | | | | – | | | | – | | | | (45 | ) | | | (50 | ) | | | (42 | ) | | | 1,218 | | | | 1,936 | | | | 1,570 | |
| Depletion, depreciation and amortization | | | 187 | | | | – | | | | – | | | | 9 | | | | 8 | | | | 8 | | | | (33 | ) | | | (10 | ) | | | – | | | | 2,819 | | | | 2,683 | | | | 2,863 | |
| Asset retirement obligation accretion | | | 21 | | | | – | | | | – | | | | – | | | | – | | | | – | | | | – | | | | – | | | | – | | | | 90 | | | | 71 | | | | 70 | |
| Realized risk management activities | | | – | | | | – | | | | – | | | | – | | | | – | | | | – | | | | – | | | | – | | | | – | | �� | | (1,253 | ) | | | 1,860 | | | | 162 | |
| Total segmented expenses | | | 932 | | | | – | | | | – | | | | 28 | | | | 33 | | | | 30 | | | | (96 | ) | | | (74 | ) | | | (48 | ) | | | 5,861 | | | | 9,001 | | | | 6,849 | |
| Segmented earnings before the following | | $ | 285 | | | $ | – | | | $ | – | | | $ | 44 | | | $ | 44 | | | $ | 44 | | | $ | 10 | | | $ | (33 | ) | | $ | (5 | ) | | $ | 4,281 | | | $ | 5,155 | | | $ | 4,303 | |
| Non–segmented expenses | | | | | | | | | | | | | | | | | | | | | | | | | | | | | | | | | | | | | | | | | | | | | | | | |
| Administration | | | | | | | | | | | | | | | | | | | | | | | | | | | | | | | | | | | | | | | 181 | | | | 180 | | | | 208 | |
| Stock-based compensation expense (recovery) | | | | | | | | | | | | | | | | | | | | | | | | | | | | | | | | | | | | | | | 355 | | | | (52 | ) | | | 193 | |
| Interest, net | | | | | | | | | | | | | | | | | | | | | | | | | | | | | | | | | | | | | | | 410 | | | | 128 | | | | 276 | |
| Unrealized risk management activities | | | | | | | | | | | | | | | | | | | | | | | | | | | | | | | | | | | | | | | 1,991 | | | | (3,090 | ) | | | 1,400 | |
| Foreign exchange (gain) loss | | | | | | | | | | | | | | | | | | | | | | | | | | | | | | | | | | | | | | | (631 | ) | | | 718 | | | | (471 | ) |
| Total non–segmented expenses | | | | | | | | | | | | | | | | | | | | | | | | | | | | | | | | | | | | | | | 2,306 | | | | (2,116 | ) | | | 1,606 | |
| Earnings before taxes | | | | | | | | | | | | | | | | | | | | | | | | | | | | | | | | | | | | | | | 1,975 | | | | 7,271 | | | | 2,697 | |
| Taxes other than income tax | | | | | | | | | | | | | | | | | | | | | | | | | | | | | | | | | | | | | | | 106 | | | | 178 | | | | 165 | |
| Current income tax expense | | | | | | | | | | | | | | | | | | | | | | | | | | | | | | | | | | | | | | | 388 | | | | 501 | | | | 380 | |
| Future income tax (recovery) expense | | | | | | | | | | | | | | | | | | | | | | | | | | | | | | | | | | | | | | | (99 | ) | | | 1,607 | | | | (456 | ) |
| Net earnings | | | | | | | | | | | | | | | | | | | | | | | | | | | | | | | | | | | | | | $ | 1,580 | | | $ | 4,985 | | | $ | 2,608 | |
Capital Expenditures
| | | | | 2009 | | | | | | | | | 2008 | | | | | |
| | | | | | | | | | | | | | | | | | | |
| | Net expenditures | | | Non cash and fair value changes(1) | | | Capitalized costs | | | Net expenditures | | | Non cash and fair value changes(1) | | | Capitalized costs | | |
| Conventional crude oil and natural gas | | | | | | | | | | | | | | | | | |
| North America | | $ | 1,663 | | | $ | 65 | | | $ | 1,728 | | | $ | 2,344 | | | $ | (7 | ) | | $ | 2,337 | |
| North Sea | | | 168 | | | | 146 | | | | 314 | | | | 319 | | | | (127 | ) | | | 192 | |
| Offshore West Africa | | | 544 | | | | 111 | | | | 655 | | | | 811 | | | | 6 | | | | 817 | |
| Other | | | 2 | | | | - | | | | 2 | | | | 1 | | | | - | | | | 1 | |
| | | | 2,377 | | | | 322 | | | | 2,699 | | | | 3,475 | | | | (128 | ) | | | 3,347 | |
Oil Sands Mining and Upgrading(2) | | | 553 | | | | 355 | | | | 908 | | | | 3,912 | | | | 10 | | | | 3,922 | |
| Midstream | | | 6 | | | | - | | | | 6 | | | | 9 | | | | - | | | | 9 | |
| Head office | | | 13 | | | | - | | | | 13 | | | | 17 | | | | - | | | | 17 | |
| | | $ | 2,949 | | | $ | 677 | | | $ | 3,626 | | | $ | 7,413 | | | $ | (118 | ) | | $ | 7,295 | |
| (1) | Asset retirement obligations, future income tax adjustments related to differences between carrying value and tax value, and other fair value adjustments. |
| (2) | Net expenditures for Oil Sands Mining and Upgrading also include capitalized interest, stock-based compensation, and the impact of intersegment eliminations. |
Segmented Assets
| | | 2009 | | | 2008 | |
| Conventional crude oil and natural gas | | | | | | |
| North America | | $ | 22,994 | | | $ | 24,875 | |
| North Sea | | | 1,968 | | | | 2,638 | |
| Offshore West Africa | | | 2,033 | | | | 2,013 | |
| Other | | | 42 | | | | 64 | |
| Oil Sands Mining and Upgrading | | | 13,621 | | | | 12,677 | |
| Midstream | | | 306 | | | | 315 | |
| Head office | | | 60 | | | | 68 | |
| | | $ | 41,024 | | | $ | 42,650 | |
17. DIFFERENCES BETWEEN CANADIAN AND UNITED STATES GENERALLY ACCEPTED ACCOUNTING PRINCIPLES
The Company’s consolidated financial statements have been prepared in accordance with Canadian GAAP. These principles conform in all material respects with US GAAP except for those noted below. Certain differences arising from US GAAP disclosure requirements are not addressed.
The application of US GAAP would have the following effects on consolidated net earnings (loss) as reported:
| (millions of Canadian dollars, except per common share amounts) | | Notes | | | 2009 | | | 2008 | | | 2007 | |
| Net earnings – Canadian GAAP | | | | | $ | 1,580 | | | $ | 4,985 | | | $ | 2,608 | |
| Adjustments | | | | | | | | | | | | | | | |
Depletion, net of taxes of $7 million (2008 – $2,503 million, 2007 – $1 million) | | | (A,B,C,D | ) | | | (273 | ) | | | (6,169 | ) | | | (10 | ) |
Stock-based compensation, net of taxes of $51 million (2008 – $32 million, 2007 – $3 million) | | (B) | | | | (154 | ) | | | (76 | ) | | | (22 | ) |
| Future income taxes | | (F) | | | | - | | | | 234 | | | | (234 | ) |
| Net earnings (loss) – US GAAP | | | | | | $ | 1,153 | | | $ | (1,026 | ) | | $ | 2,342 | |
| Net earnings (loss) – US GAAP per common share | | | | | | | | | | | | | | | | |
Basic | | | | | | $ | 2.13 | | | $ | (1.90 | ) | | $ | 4.34 | |
Diluted | | (E) | | | $ | 2.13 | | | $ | (1.90 | ) | | $ | 4.32 | |
Comprehensive income (loss) under US GAAP would be as follows:
| (millions of Canadian dollars) | Notes | | 2009 | | | 2008 | | | 2007 | |
| Comprehensive income – Canadian GAAP | | | $ | 1,214 | | | $ | 5,175 | | | $ | 2,534 | |
| US GAAP earnings adjustments | | | | (427 | ) | | | (6,011 | ) | | | (266 | ) |
| Comprehensive income (loss) – US GAAP | | | $ | 787 | | | $ | (836 | ) | | $ | 2,268 | |
The application of US GAAP would have the following effects on the consolidated balance sheets as reported:
| | | | | | 2009 | |
| (millions of Canadian dollars) | | Notes | | | Canadian GAAP | | | Increase (Decrease) | | | US GAAP | |
| Current assets | | | | | $ | 1,891 | | | $ | 103 | | | $ | 1,994 | |
| Property, plant and equipment | | | (A,B,C,D | ) | | | 39,115 | | | | (8,824 | ) | | | 30,291 | |
| Other long-term assets | | (G) | | | | 18 | | | | 49 | | | | 67 | |
| | | | | | | $ | 41,024 | | | $ | (8,672 | ) | | $ | 32,352 | |
| | | | | | | | | | | | | | | | | |
| Current liabilities | | (B) | | | $ | 2,405 | | | $ | 387 | | | $ | 2,792 | |
| Long-term debt | | (G) | | | | 9,658 | | | | 49 | | | | 9,707 | |
| Other long-term liabilities | | (B) | | | | 1,848 | | | | 35 | | | | 1,883 | |
| Future income tax | | (A,B,C,D,F) | | | | 7,687 | | | | (2,474 | ) | | | 5,213 | |
| Share capital | | | | | | | 2,834 | | | | - | | | | 2,834 | |
| Retained earnings | | | | | | | 16,696 | | | | (6,669 | ) | | | 10,027 | |
| Accumulated other comprehensive income | | | | | | | (104 | ) | | | - | | | | (104 | ) |
| | | | | | | $ | 41,024 | | | $ | (8,672 | ) | | $ | 32,352 | |
| | | | | | 2008 | |
| (millions of Canadian dollars) | | Notes | | | Canadian GAAP | | | Increase (Decrease) | | | US GAAP | |
| Current assets | | | | | $ | 3,392 | | | $ | - | | | $ | 3,392 | |
| Property, plant and equipment | | | (A,B,C,D | ) | | | 38,966 | | | | (8,551 | ) | | | 30,415 | |
| Other long-term assets | | (G) | | | | 292 | | | | 55 | | | | 347 | |
| | | | | | | $ | 42,650 | | | $ | (8,496 | ) | | $ | 34,154 | |
| | | | | | | | | | | | | | | | | |
| Current liabilities | | (B) | | | $ | 3,420 | | | $ | 150 | | | $ | 3,570 | |
| Long-term debt | | (G) | | | | 12,596 | | | | 55 | | | | 12,651 | |
| Other long-term liabilities | | (B) | | | | 1,124 | | | | 15 | | | | 1,139 | |
| Future income tax | | (A,B,C,D,F) | | | | 7,136 | | | | (2,474 | ) | | | 4,662 | |
| Share capital | | | | | | | 2,768 | | | | - | | | | 2,768 | |
| Retained earnings | | | | | | | 15,344 | | | | (6,242 | ) | | | 9,102 | |
| Accumulated other comprehensive income | | | | | | | 262 | | | | - | | | | 262 | |
| | | | | | | $ | 42,650 | | | $ | (8,496 | ) | | $ | 34,154 | |
Notes:
| (A) | Under Canadian full cost accounting guidance, costs capitalized in each country cost centre are limited to an amount equal to the future net revenues from proved and probable reserves using estimated future prices and costs discounted at the risk-free rate, plus the carrying amount of unproved properties and major development projects (the “ceiling test”) as described in note 1(I). Under the full cost method of accounting as set forth by the US Securities and Exchange Commission, the ceiling test differs from Canadian GAAP in that future net revenues from proved reserves are based on prices using the average first-day-of-the-month price during the previous twelve-month period and costs as at the balance sheet date, and are discounted at 10%. Capitalized costs and future net revenues are determined on a net of tax basis. In addition, beginning in 2009, the C ompany’s Oil Sands Mining and Upgrading activities are included in the Company’s US GAAP full cost oil and gas cost center for Canada for ceiling test purposes. These differences in applying the ceiling test to current and prior years resulted in the recognition of ceiling test impairments under US GAAP, which reduced property, plant and equipment by $8,951 million in 2009 (2008 – $8,697 million, 2007 – $36 million). |
For the year ended December 31, 2009, US GAAP net earnings would have decreased by $815 million (2008 – $6,164 million), net of income taxes of $178 million (2008 – $2,501 million) to reflect the impact of a current year ceiling test impairment. In addition, the impact of prior ceiling test impairments would have increased US GAAP net earnings by $551 million (2008 – increased by $3 million, 2007 – decreased by $4 million), net of income taxes of $188 million (2008 – $1 million, 2007 – $8 million) to reflect the impact of lower depletion charges. The 2007 income tax effect includes the effect of enacted Canadian income tax rate changes on this item.
During 2009, the US Securities and Exchange Commission adopted revisions to its oil and gas reporting disclosures contained in Regulation S-K and Topic 932 “Extractive Activities – Oil and Gas” (a summary of the requirements included in Regulation S-X). These revisions change the price basis for calculating oil and gas reserves from a single-day, year-end price to a monthly average price based on “first-day-of-the-month” prices. These revisions impacted the reserves used in the Company’s calculation of the ceiling test under US GAAP at December 31, 2009 and will impact the calculation of depletion in future periods. In addition, oil and gas activities are now determined based on the end product, rather than the method of extraction. As a result, the Company’s Oil and Sands Mining and Upgrading operation s are now included in its full cost oil and gas cost center for Canada. These revisions are effective for filings made on or after January 1, 2010, and will be applied prospectively with no retroactive restatement.
| (B) | The Company accounts for its stock-based compensation liability under Canadian GAAP using the intrinsic value method, as described in note 1(P). Under US GAAP, effective January 1, 2006, the Company would have adopted Financial Accounting Standards Board Statement (FASB) Topic 718 “Compensation – Stock Compensation” (previously FAS 123(R)), which requires companies to account for all stock-based compensation liabilities using the fair value method, where fair value is measured using an option pricing model. The Company uses the Black Scholes option pricing model to determine the fair value of its stock-based compensation liability for US GAAP purposes. The previous US GAAP standard, FAS 123, required companies to account for cash settled stock-based compensation liabilities using the intrinsic value method. For the year ended December 31, 2009, US GAAP net earnings would have decreased by $154 million (2 008 – $76 million, 2007 – $22 million), net of income taxes of $51 million (2008 – $32 million, 2007 – $3 million) related to the different valuation methodologies. The 2007 income tax effect includes the effect of enacted Canadian income tax rate changes on this item. In addition, US GAAP net earnings would have decreased by $1 million (2008 - $nil, 2007 - $nil), net of income taxes of $nil (2008 - $nil, 2007 - $nil) related to the impact of the change in capitalized stock-based compensation on depletion, depreciation and amortization expenses. |
| (C) | Under US GAAP, the foreign currency component of a business combination is not eligible for cash flow hedging. The impact of prior year adjustments would have decreased US GAAP net earnings by $7 million for the year ended December 31, 2009 (2008 – $8 million, 2007 – $6 million), net of income taxes of $3 million (2008 – $3 million, 2007 – $7 million), to reflect the impact of higher depletion charges. The 2007 income tax effect includes the effect of enacted Canadian income tax rate changes on this item. |
| (D) | Under Canadian GAAP, the Company began capitalizing interest on the Horizon Project when the Board of Directors approval was received in 2005. For US GAAP, capitalization of interest on projects constructed over time is mandatory and interest would have been capitalized to the costs of construction beginning in 2004. As a result of applying US GAAP, an additional $27 million would have been capitalized to property, plant and equipment in 2004. During 2009, Horizon Phase 1 assets were completed and available for their intended use. Accordingly, capitalization of all associated Phase 1 development costs, including capitalized interest ceased and depletion, depreciation and amortization of these assets commenced. For the year ended December 31, 2009, US GAAP net earnings would have decreased by $1 million (2008 – nil, 2007 – nil), net of income taxes of $nil ( 2008 – $nil, 2007 – $nil). |
| (E) | Under Canadian GAAP, the Company is not required to include potential common shares related to stock options in the calculation of diluted earnings per share as the Company has recorded the potential settlement of the stock options as a liability. Under US GAAP Topic 260 “Earnings Per Share” (previously FAS 128 “Earnings Per Share”), the Company would have included potential common shares related to stock options in the calculation of diluted earnings per share. For the year ended December 31, 2009, nil additional shares would have been included in the calculation of diluted earnings per share for US GAAP (2008 – nil additional shares, 2007 – 3,376,000 additional shares). |
| (F) | Under Canadian GAAP, the effects of income tax changes are recognized when the changes are considered substantively enacted. Under US GAAP, the income tax changes would not be recognized until the changes are enacted into law. For the years ended December 31, 2008 and 2007, the differences between substantively enacted and enacted tax legislation resulted in a difference in timing of the recognition of a $234 million future income tax recovery. |
| (G) | Under Canadian GAAP, debt issue costs on long-term debt must be included in the carrying value of the related debt. Under US GAAP, these items must be recorded as a deferred charge. Application of US GAAP would have resulted in the balance sheet reclassification of $49 million of debt issue costs from long-term debt to deferred charges in 2009 (2008 – $55 million, 2007 – $51 million). |
| (H) | In December 2007, the FASB issued Topic 805 “Business Combinations” (previously FAS 141(R) “Business Combinations”), which replaced FAS 141 effective for fiscal years beginning after December 15, 2008. Topic 805 retains the purchase method of accounting and requires assets acquired and liabilities assumed in a business combination to be measured at fair value at the date of acquisition. The standard also requires acquisition-related costs and restructuring costs to be recognized separately from the business combination. This standard is to be applied prospectively to all business combinations subsequent to the effective date and does not require restatement of previously completed business combinations. The adoption of this standard did not result in a US GAAP reconciling item. |
MANAGEMENT’S DISCUSSION AND ANALYSIS
SPECIAL NOTE REGARDING FORWARD-LOOKING STATEMENTS
Certain statements relating to Canadian Natural Resources Limited (the “Company”) in this document or documents incorporated herein by reference constitute forward-looking statements or information (collectively referred to herein as “forward-looking statements”) within the meaning of applicable securities legislation. Forward-looking statements can be identified by the words “believe”, “anticipate”, “expect”, “plan”, “estimate”, “target”, “continue”, “could”, “intend”, “may”, “potential”, “predict”, “should”, “will”, “objective”, “project”, “forecast”, “goal”, “guidance”, “outlook”, &# 8220;effort”, “seeks”, “schedule” or expressions of a similar nature suggesting future outcome or statements regarding an outlook. Disclosure related to expected future commodity pricing, production volumes, royalties, operating costs, capital expenditures, and other guidance provided throughout this Management’s Discussion and Analysis (“MD&A”) including the information in the “Outlook” section and the sensitivity analysis constitute forward-looking statements. Disclosure of plans relating to and expected results of existing and future developments, including but not limited to the Horizon Oil Sands, Primrose East, Pelican Lake, Olowi Field (Offshore Gabon), and the Kirby Thermal Oil Sands Project also constitute forward-looking statements. This forward-looking information is based on annual budgets and multi-year forecasts, and is reviewed and revised throughout the year if necessary in the context of targeted financial ratios, project returns , product pricing expectations and balance in project risk and time horizons. These statements are not guarantees of future performance and are subject to certain risks and the reader should not place undue reliance on these forward-looking statements as there can be no assurances that the plans, initiatives or expectations upon which they are based will occur.
In addition, statements relating to “reserves” are deemed to be forward-looking statements as they involve the implied assessment based on certain estimates and assumptions that the reserves described can be profitably produced in the future. There are numerous uncertainties inherent in estimating quantities of proved crude oil and natural gas reserves and in projecting future rates of production and the timing of development expenditures. The total amount or timing of actual future production may vary significantly from reserve and production estimates.
The forward-looking statements are based on current expectations, estimates and projections about the Company and the industry in which the Company operates, which speak only as of the date such statements were made or as of the date of the report or document in which they are contained, and are subject to known and unknown risks and uncertainties that could cause the actual results, performance or achievements of the Company to be materially different from any future results, performance or achievements expressed or implied by such forward-looking statements. Such risks and uncertainties include, among others: general economic and business conditions which will, among other things, impact demand for and market prices of the Company’s products; volatility of and assumptions regarding crude oil and natural gas prices; fluctuations in curren cy and interest rates; assumptions on which the Company’s current guidance is based; economic conditions in the countries and regions in which the Company conducts business; political uncertainty, including actions of or against terrorists, insurgent groups or other conflict including conflict between states; industry capacity; ability of the Company to implement its business strategy, including exploration and development activities; impact of competition; the Company’s defense of lawsuits; availability and cost of seismic, drilling and other equipment; ability of the Company and its subsidiaries to complete capital programs; the Company’s and its subsidiaries’ ability to secure adequate transportation for its products; unexpected difficulties in mining, extracting or upgrading the Company’s bitumen products; potential delays or changes in plans with respect to exploration or development projects or capital expenditures; ability of the Company to attract the necessary labour re quired to build its thermal and oil sands mining projects; operating hazards and other difficulties inherent in the exploration for and production and sale of crude oil and natural gas; availability and cost of financing; the Company’s and its subsidiaries’ success of exploration and development activities and their ability to replace and expand crude oil and natural gas reserves; timing and success of integrating the business and operations of acquired companies; production levels; imprecision of reserve estimates and estimates of recoverable quantities of crude oil, bitumen, natural gas and liquids not currently classified as proved; actions by governmental authorities; government regulations and the expenditures required to comply with them (especially safety and environmental laws and regulations and the impact of climate change initiatives on capital and operating costs); asset retirement obligations; the adequacy of the Company’s provision for taxes; and other circumstances affecting revenues and expenses. The Company’s operations have been, and in the future may be, affected by political developments and by federal, provincial and local laws and regulations such as restrictions on production, changes in taxes, royalties and other amounts payable to governments or governmental agencies, price or gathering rate controls and environmental protection regulations. Should one or more of these risks or uncertainties materialize, or should any of the Company’s assumptions prove incorrect, actual results may vary in material respects from those projected in the forward-looking statements. The impact of any one factor on a particular forward-looking statement is not determinable with certainty as such factors are dependent upon other factors, and the Company’s course of action would depend upon its assessment of the future considering all information then available. For additional information refer to the “Risks and Uncertainties” section of this MD&A. Readers ar e cautioned that the foregoing list of factors is not exhaustive. Unpredictable or unknown factors not discussed in this report could also have material adverse effects on forward-looking
statements. Although the Company believes that the expectations conveyed by the forward-looking statements are reasonable based on information available to it on the date such forward-looking statements are made, no assurances can be given as to future results, levels of activity and achievements. All subsequent forward-looking statements, whether written or oral, attributable to the Company or persons acting on its behalf are expressly qualified in their entirety by these cautionary statements. Except as required by law, the Company assumes no obligation to update forward-looking statements should circumstances or Management’s estimates or opinions change.
SPECIAL NOTE REGARDING NON-GAAP FINANCIAL MEASURES
Management’s Discussion and Analysis includes references to financial measures commonly used in the crude oil and natural gas industry, such as adjusted net earnings from operations, cash flow from operations, cash production cost and net asset value. These financial measures are not defined by generally accepted accounting principles in Canada (“GAAP”) and therefore are referred to as non-GAAP measures. The non-GAAP measures used by the Company may not be comparable to similar measures presented by other companies. The Company uses these non-GAAP measures to evaluate its performance. The non-GAAP measures should not be considered an alternative to or more meaningful than net earnings, as determined in accordance with Canadian GAAP, as an indication of the Company’s performance. The non-GAAP measures adjusted net earnings from operations and cash flow from operations are reconciled to net earnings, as determined in accordance with Canadian GAAP, in the “Financial Highlights” section of this MD&A. The derivation of cash production costs is included in the “Operating Highlights – Oil Sands Mining and Upgrading” section of this MD&A. The Company also presents certain non-GAAP financial ratios and their derivation in the “Liquidity and Capital Resources” section of this MD&A.
MANAGEMENT’S DISCUSSION AND ANALYSIS
Management’s Discussion and Analysis of the financial condition and results of operations of the Company should be read in conjunction with the Company’s audited consolidated financial statements and related notes for the year ended December 31, 2009. The consolidated financial statements have been prepared in accordance with generally accepted accounting principles in Canada (“Canadian GAAP”). A reconciliation of Canadian GAAP to generally accepted accounting principles in the United States (“US GAAP”) is included in note 17 to the consolidated financial statements. All dollar amounts are referenced in millions of Canadian dollars, except where otherwise noted. The calculation of barrels of oil equivalent (“boe”) is based on a conversion ratio of six thousand cubic feet (“mcf”) of natu ral gas to one barrel (“bbl”) of crude oil to estimate relative energy content. This conversion may be misleading, particularly when used in isolation, since the 6 mcf:1 bbl ratio is based on an energy equivalency at the burner tip and does not represent the value equivalency at the wellhead. Production volumes and per barrel statistics are presented throughout this MD&A on a “before royalty” or “gross” basis, and realized prices are net of transportation and blending costs and exclude the effect of risk management activities. Production on an “after royalty” or “net” basis is also presented for information purposes only. The following discussion and analysis refers primarily to the Company’s 2009 financial results compared to 2008 and 2007, unless otherwise indicated. In addition, this MD&A details the Company’s capital program and outlook for 2010. Additional information relating to the Company, including its quarterly MD&A for the year and three months ended December 31, 2009, its Annual Information Form for the year ended December 31, 2009, and its audited consolidated financial statements for the year ended December 31, 2009 is available on SEDAR at www.sedar.com and on EDGAR at www.sec.gov. This MD&A is dated March 3, 2010.
ABBREVIATIONS
| AECO | Alberta natural gas reference location |
| API | Specific gravity measured in degrees on the American Petroleum Institute scale |
| ARO | Asset retirement obligations |
| bbl | barrels |
| bbl/d | barrels per day |
| bcf | billion cubic feet |
| boe | barrels of oil equivalent |
| boe/d | barrels of oil equivalent per day |
| Brent | Dated Brent |
| C$ | Canadian dollars |
| CICA | Canadian Institute of Chartered Accountants |
CO2 | Carbon dioxide |
CO2e | Carbon dioxide equivalents |
| Canadian GAAP | Generally accepted accounting principles in Canada |
| FPSO | Floating Production, Storage and Offtake Vessel |
| GHG | Greenhouse gas |
| GJ | gigajoules |
| GJ/d | gigajoules per day |
| Heavy Differential | Heavy crude oil differential from WTI |
| Horizon | Horizon Oil Sands |
| LIBOR | London Interbank Offered Rate |
| mcf | thousand cubic feet |
| mmbbl | million barrels |
| mmbtu | million British thermal units |
| mmcf/d | million cubic feet per day |
| mmcfe | millions of cubic feet equivalent |
| NGLs | Natural gas liquids |
| NYMEX | New York Mercantile Exchange |
| NYSE | New York Stock Exchange |
| PRT | Petroleum Revenue Tax |
| SCO | Synthetic light crude oil |
| SEC | United States Securities and Exchange Commission |
| TSX | Toronto Stock Exchange |
| UK | United Kingdom |
| US | United States |
| US GAAP | Generally accepted accounting principles in the United States |
| US$ | United States dollars |
| WCS | Western Canadian Select |
| WTI | West Texas Intermediate |
OBJECTIVE AND STRATEGY
The Company’s objectives are to increase crude oil and natural gas production, reserves, cash flow and net asset value (1) on a per common share basis through the development of its existing crude oil and natural gas properties and through the discovery and/or acquisition of new reserves. The Company strives to meet these objectives by having a defined growth and value enhancement plan for each of its products and segments. The Company takes a balanced approach to growth and investments and focuses on creating long-term shareholder value. The Company allocates its capital by maintaining:
| | § | Balance among its products, namely natural gas, light/medium crude oil and NGLs, Pelican Lake crude oil (2), primary heavy crude oil and thermal heavy crude oil and SCO; |
| | § | Balance among near-, mid- and long-term projects; |
| | § | Balance among acquisitions, exploitation and exploration; and |
| | § | Balance between sources and terms of debt financing and maintenance of a strong balance sheet. |
(1) Discounted value of crude oil and natural gas reserves plus value of undeveloped land, less net debt.
(2) Pelican Lake crude oil is 14–17º API oil, which receives medium quality crude netbacks due to lower production costs and lower royalty rates.
The Company’s three-phase crude oil marketing strategy includes:
| | § | Blending various crude oil streams with diluents to create more attractive feedstock; |
| | § | Supporting and participating in pipeline expansions and/or new additions; and |
| | § | Supporting and participating in projects that will increase the downstream conversion capacity for heavy crude oil. |
Operational discipline and cost control are fundamental to the Company. By consistently controlling costs throughout all cycles of the industry, the Company believes it will achieve continued growth. Cost control is attained by developing area knowledge, by dominating core areas and by maintaining high working interests and operator status in its properties.
The Company is committed to maintaining a strong balance sheet and flexible capital structure. The Company believes it has built the necessary financial capacity to complete all of its growth projects. Additionally, the Company’s risk management hedge program reduces the risk of volatility in commodity prices and supports the Company’s cash flow for its capital expenditures programs.
Strategic accretive acquisitions are a key component of the Company’s strategy. The Company has used a combination of internally generated cash flows and debt financing to selectively acquire properties generating future cash flows in its core regions.
Highlights for the year ended December 31, 2009 include the following:
| | § | Achieved net earnings of $1.6 billion, adjusted net earnings from operations of $2.7 billion, and cash flow from operations of $6.1 billion; |
| | § | Completed the construction of Phase 1 of Horizon and commenced operations; |
| | § | Achieved annual crude oil and natural gas production guidance; |
| | § | Achieved first crude oil production from Platform C in the Olowi Field in Offshore Gabon; |
| | § | Reduced long-term debt by $3.4 billion to $9.7 billion in 2009 from $13.0 billion in 2008; and |
| | § | Increased annual dividend payout to $0.42 from $0.40, our 10th consecutive year of dividend increases. |
NET EARNINGS AND CASH FLOW FROM OPERATIONS
| Financial Highlights | | | | | | | | | |
| | | | | | | | | | |
| ($ millions, except per common share amounts) | | 2009 | | | 2008 | | | 2007 | |
| Revenue, before royalties | | $ | 11,078 | | | $ | 16,173 | | | $ | 12,543 | |
| Net earnings | | $ | 1,580 | | | $ | 4,985 | | | $ | 2,608 | |
| Per common share– basic and diluted | | $ | 2.92 | | | $ | 9.22 | | | $ | 4.84 | |
Adjusted net earnings from operations (1) | | $ | 2,689 | | | $ | 3,492 | | | $ | 2,406 | |
| Per common share– basic and diluted | | $ | 4.96 | | | $ | 6.46 | | | $ | 4.46 | |
Cash flow from operations (2) | | $ | 6,090 | | | $ | 6,969 | | | $ | 6,198 | |
| Per common share– basic and diluted | | $ | 11.24 | | | $ | 12.89 | | | $ | 11.49 | |
| Dividends declared per common share | | $ | 0.42 | | | $ | 0.40 | | | $ | 0.34 | |
| Total assets | | $ | 41,024 | | | $ | 42,650 | | | $ | 36,114 | |
| Total long-term liabilities | | $ | 19,193 | | | $ | 20,856 | | | $ | 19,230 | |
| Capital expenditures, net of dispositions | | $ | 2,997 | | | $ | 7,451 | | | $ | 6,425 | |
| | (1) Adjusted net earnings from operations is a non-GAAP measure that represents net earnings adjusted for certain items of a non-operational nature. The Company evaluates its performance based on adjusted net earnings from operations. The reconciliation “Adjusted Net Earnings from Operations” presented below lists the after-tax effects of certain items of a non-operational nature that are included in the Company’s financial results. Adjusted net earnings from operations may not be comparable to similar measures presented by other companies. |
| | (2) Cash flow from operations is a non-GAAP measure that represents net earnings adjusted for non-cash items before working capital adjustments. The Company evaluates its performance based on cash flow from operations. The Company considers cash flow from operations a key measure as it demonstrates the Company’s ability to generate the cash flow necessary to fund future growth through capital investment and to repay debt. The reconciliation “Cash Flow from Operations" presented below lists the effects of certain non-cash items that are included in the Company’s financial results. Cash flow from operations may not be comparable to similar measures presented by other companies. |
| Adjusted Net Earnings from Operations | | | | | | | | | |
| ($ millions) | | 2009 | | | 2008 | | | 2007 | |
| Net earnings as reported | | $ | 1,580 | | | $ | 4,985 | | | $ | 2,608 | |
Stock-based compensation expense (recovery), net of tax (a) | | | 261 | | | | (38 | ) | | | 134 | |
Unrealized risk management loss (gain), net of tax (b) | | | 1,437 | | | | (2,112 | ) | | | 977 | |
Unrealized foreign exchange (gain) loss, net of tax (c) | | | (570 | ) | | | 698 | | | | (449 | ) |
Effect of statutory tax rate and other legislative changes on future income tax liabilities (d) | | | (19 | ) | | | (41 | ) | | | (864 | ) |
| Adjusted net earnings from operations | | $ | 2,689 | | | $ | 3,492 | | | $ | 2,406 | |
| | (a) The Company’s employee stock option plan provides for a cash payment option. Accordingly, the intrinsic value of outstanding vested options is recorded as a liability on the Company’s balance sheet and periodic changes in the intrinsic value are recognized in net earnings or are capitalized to Oil Sands Mining and Upgrading construction costs. |
| | (b) Derivative financial instruments are recorded at fair value on the balance sheet, with changes in fair value of non-designated hedges recognized in net earnings. The amounts ultimately realized may be materially different than reflected in the financial statements due to changes in prices of the underlying items hedged, primarily crude oil and natural gas. |
| | (c) Unrealized foreign exchange gains and losses result primarily from the translation of US dollar denominated long-term debt to period-end exchange rates, offset by the impact of cross currency swap hedges, and are recognized in net earnings. |
| | (d) All substantively enacted or enacted adjustments in applicable income tax rates and other legislative changes are applied to underlying assets and liabilities on the Company’s consolidated balance sheet in determining future income tax assets and liabilities. The impact of these tax rate and other legislative changes is recorded in net earnings during the period the legislation is substantively enacted or enacted. Income tax rate changes during 2009 resulted in a reduction of future income tax liabilities of approximately $19 million in North America. Income tax rate changes during 2008 resulted in a reduction of future income tax liabilities of approximately $19 million in North America and $22 million in Côte d’Ivoire, Offshore West Africa. Income tax rate and other legislative changes during 2007 resulted in a reduction of future income tax liabilities of approximately $864 milli on in North America. |
| Cash Flow from Operations | | | | | | | | | |
| ($ millions) | | 2009 | | | 2008 | | | 2007 | |
| Net earnings | | $ | 1,580 | | | $ | 4,985 | | | $ | 2,608 | |
| Non-cash items: | | | | | | | | | | | | |
| Depletion, depreciation and amortization | | | 2,819 | | | | 2,683 | | | | 2,863 | |
| Asset retirement obligation accretion | | | 90 | | | | 71 | | | | 70 | |
| Stock-based compensation expense (recovery) | | | 355 | | | | (52 | ) | | | 193 | |
| Unrealized risk management loss (gain) | | | 1,991 | | | | (3,090 | ) | | | 1,400 | |
| Unrealized foreign exchange (gain) loss | | | (661 | ) | | | 832 | | | | (524 | ) |
| Deferred petroleum revenue tax expense (recovery) | | | 15 | | | | (67 | ) | | | 44 | |
| Future income tax (recovery) expense | | | (99 | ) | | | 1,607 | | | | (456 | ) |
| Cash flow from operations | | $ | 6,090 | | | $ | 6,969 | | | $ | 6,198 | |
For 2009, the Company reported net earnings of $1,580 million compared to net earnings of $4,985 million for 2008 (2007 – $2,608 million). The 2009 operating results of the Company were significantly impacted by lower benchmark crude oil and natural gas pricing, partially offset by the impact of the commencement of production from Horizon. Net earnings for the year ended December 31, 2009 included net unrealized after-tax expenses of $1,109 million related to the effects of risk management activities, fluctuations in foreign exchange rates and stock-based compensation, and the impact of statutory tax rate and other legislative changes on future income tax liabilities (2008 – $1,493 million after-tax income; 2007 – $202 million after-tax income). Excluding these items, adjusted net earnings from operations for the year ended Dec ember 31, 2009 decreased to $2,689 million from $3,492 million for 2008 (2007 – $2,406 million) primarily due to the impact of lower realized pricing, lower natural gas sales volumes, higher production expenses, higher depletion, depreciation and amortization expense, including the impact of a ceiling test impairment in Gabon, Offshore West Africa, higher accretion expense, higher interest expense, and the impact of realized foreign exchange loss, partially offset by the impact of higher crude oil sales volumes, lower royalty expense, realized risk management activities and the weaker Canadian dollar relative to the US dollar during 2009.
The impacts of unrealized risk management activities, stock-based compensation and changes in foreign exchange rates are expected to continue to contribute to significant volatility in consolidated net earnings and are discussed in detail in the relevant sections of this MD&A.
Cash flow from operations for the year ended December 31, 2009 decreased to $6,090 million ($11.24 per common share) from $6,969 million ($12.89 per common share) for 2008 (2007 – $6,198 million; $11.49 per common share). The decrease was primarily due to the impact of lower realized pricing, lower natural gas sales volumes, higher production expense, higher interest expense and the impact of realized foreign exchange losses, partially offset by the impact of higher crude oil sales volumes, lower royalty expense, lower current income tax and PRT and the impact of realized risk management gains and the weaker Canadian dollar relative to the US dollar during 2009.
The Company’s 2009 average sales price per bbl of conventional crude oil and NGLs decreased 30% to average $57.68 per bbl from $82.41 per bbl in 2008 (2007 – $55.45 per bbl). The Company’s average natural gas price decreased 46% to average $4.53 per mcf from $8.39 per mcf for 2008 (2007 – $6.85 per mcf).
Total production of crude oil and NGLs before royalties increased 13% to 355,463 bbl/d from 315,667 bbl/d for 2008 (2007 – 331,232 bbl/d). The increase in crude oil and NGLs production was primarily due to new production from Horizon and the Olowi Field in Offshore Gabon, partially offset by the impact of planned maintenance shutdowns in the North Sea, and in North America due to the cyclic nature of the Company’s thermal production and shut in of Primrose East for part of the year.
Total natural gas production before royalties decreased 12% to average 1,315 mmcf/d from 1,495 mmcf/d for 2008 (2007 – 1,668 mmcf/d). The decrease in natural gas production primarily reflected natural production declines and the Company’s strategic reduction in natural gas drilling activity in North America.
Total crude oil and NGLs and natural gas production volumes before royalties increased 2% to average 574,730 boe/d from 564,845 boe/d for 2008 (2007 – 609,206 boe/d). Total production for 2009 was within the Company’s previously issued revised guidance.
SUMMARY OF QUARTERLY RESULTS
The following is a summary of the Company’s quarterly results for the eight most recently completed quarters:
| ($ millions, except per common share amounts) | | | | | | | | | | | | | | | |
| 2009 | | Total | | | Dec 31 | | | Sep 30 | | | Jun 30 | | | Mar 31 | |
| Revenue, before royalties | | $ | 11,078 | | | $ | 3,319 | | | $ | 2,823 | | | $ | 2,750 | | | $ | 2,186 | |
| Net earnings | | $ | 1,580 | | | $ | 455 | | | $ | 658 | | | $ | 162 | | | $ | 305 | |
| Net earnings per common share | | | | | | | | | | | | | | | | | | | | |
| – basic and diluted | | $ | 2.92 | | | $ | 0.85 | | | $ | 1.21 | | | $ | 0.30 | | | $ | 0.56 | |
| | | | | | | | | | | | | | | | | | | | | |
| 2008 | | Total | | | Dec 31 | | | Sep 30 | | | Jun 30 | | | Mar 31 | |
| Revenue, before royalties | | $ | 16,173 | | | $ | 2,511 | | | $ | 4,583 | | | $ | 5,112 | | | $ | 3,967 | |
| Net earnings (loss) | | $ | 4,985 | | | $ | 1,770 | | | $ | 2,835 | | | $ | (347 | ) | | $ | 727 | |
| Net earnings (loss) per common share | | | | | | | | | | | | | | | | | | | | |
| – basic and diluted | | $ | 9.22 | | | $ | 3.27 | | | $ | 5.25 | | | $ | (0.65 | ) | | $ | 1.35 | |
Volatility in quarterly net earnings over the eight most recently completed quarters was primarily due to:
| § | Crude oil pricing – The impact of fluctuating demand, geopolitical uncertainties on worldwide benchmark pricing, and the fluctuations in the Heavy Crude Oil Differential from WTI (“Heavy Differential”) in North America. |
| § | Natural gas pricing – The impact of seasonal fluctuations in both the demand for natural gas and inventory storage levels, and the impact of increased shale gas production in the US, as well as fluctuations in imports of liquefied natural gas into the US. |
| § | Crude oil and NGLs sales volumes – Fluctuations in production from the Company’s Primrose thermal projects, the results from the Pelican Lake water and polymer flood projects, and the commencement of operations at Horizon. Sales volumes also reflected fluctuations due to timing of liftings and maintenance activities in the North Sea and Offshore West Africa and the impact of the shut in, and subsequent restoration of some of the production in the Baobab Field. |
| § | Natural gas sales volumes – Production declines due to the Company’s strategic decision to reduce natural gas drilling activity in North America and the allocation of capital to higher return crude oil projects, as well as natural decline rates. |
| § | Production expense – Fluctuations primarily due to the impact of the demand for services, industry-wide inflationary cost pressures experienced in prior quarters, fluctuations in product mix, the impact of seasonal costs that are dependent on weather, and the commencement of operations at Horizon and the Olowi Field in Offshore Gabon. |
| § | Depletion, depreciation and amortization – Fluctuations due to changes in sales volumes, finding and development costs associated with crude oil and natural gas exploration, estimated future costs to develop the Company’s proved undeveloped reserves, the commencement of operations at Horizon and the Olowi Field in Offshore Gabon, and the impact of a ceiling test impairment at the Olowi Field at December 31, 2009. |
| § | Stock-based compensation – Fluctuations due to the mark-to-market movements of the Company’s stock-based compensation liability. Stock-based compensation expense (recovery) reflected fluctuations in the Company’s share price. |
| § | Risk management – Fluctuations due to the recognition of realized and unrealized gains and losses from the mark-to-market and subsequent settlement of the Company’s risk management activities. |
| § | Foreign exchange rates – Fluctuations in the Canadian dollar relative to the US dollar impacted the realized price the Company received for its crude oil and natural gas sales, as sales prices are based predominately on US dollar denominated benchmarks. Similarly, unrealized foreign exchange gains and losses were recorded with respect to US dollar denominated debt and the re-measurement of North Sea future income tax liabilities denominated in UK pounds sterling to US dollars, partially offset by the impact of cross currency swap hedges. |
| § | Income tax expense (recovery) – Fluctuations in income tax expense (recovery) include statutory tax rate and other legislative changes substantively enacted or enacted in the various periods. |
BUSINESS ENVIRONMENT
| (Yearly average) | | 2009 | | | 2008 | | | 2007 | |
| WTI benchmark price (US$/bbl) | | $ | 61.93 | | | $ | 99.65 | | | $ | 72.40 | |
| Dated Brent benchmark price (US$/bbl) | | $ | 61.61 | | | $ | 96.99 | | | $ | 72.59 | |
WCS blend differential from WTI (US$/bbl) (1) | | $ | 9.64 | | | $ | 20.03 | | | $ | 23.25 | |
WCS blend differential from WTI (%) (1) | | | 16 | % | | | 20 | % | | | 32 | % |
| SCO price (US$/bbl) | | $ | 61.51 | | | $ | 102.48 | | | $ | 70.11 | |
| Condensate benchmark price (US$/bbl) | | $ | 60.60 | | | $ | 100.10 | | | $ | 72.88 | |
| NYMEX benchmark price (US$/mmbtu) | | $ | 4.03 | | | $ | 8.95 | | | $ | 6.92 | |
| AECO benchmark price (C$/GJ) | | $ | 3.91 | | | $ | 7.71 | | | $ | 6.26 | |
| US / Canadian dollar average exchange rate | | $ | 0.8760 | | | $ | 0.9381 | | | $ | 0.9304 | |
| US / Canadian dollar year end exchange rate | | $ | 0.9555 | | | $ | 0.8166 | | | $ | 1.0120 | |
(1) Beginning in 2008, the Company has quantified the Heavy Differential using the WCS blend as the heavy crude oil marker. Prior period amounts have been reclassified.
Commodity Prices
Substantially all of the Company’s production is sold based on US dollar benchmark pricing. Specifically, crude oil is marketed based on WTI and Brent indices. Canadian natural gas pricing is primarily based on Alberta AECO reference pricing, which is derived from the NYMEX reference pricing and adjusted for its basis or location differential to the NYMEX delivery point at Henry Hub. The Company’s realized price is also highly sensitive to fluctuations in foreign exchange rates. The average value of the Canadian dollar in relation to the US dollar fluctuated significantly throughout 2009, with a high of approximately $0.97 in December 2009 and a low of approximately $0.77 in March 2009.
The overall decrease in WTI pricing in 2009 reflected a decrease in demand as a result of worldwide financial and economic events during the year, and ongoing geopolitical uncertainty resulting in increased market volatility, partially offset by strong Asian demand in the second half of the year. For 2009, WTI averaged US$61.93 per bbl, a decrease of 38% compared to US$99.65 per bbl for 2008 (2007 – US$72.40 per bbl).
Brent averaged US$61.61 per bbl for 2009, a decrease of 36% compared to US$96.99 per bbl for 2008 (2007 – US$72.59 per bbl). Crude oil sales contracts for the North Sea and Offshore West Africa are typically based on Brent pricing, which is more reflective of international markets and the overall supply and demand balance.
The Heavy Differential averaged 16% of WTI for 2009 compared to 20% for 2008 (2007 – 32%), reflecting relatively weak refinery margins.
The Company anticipates continued volatility in the crude oil pricing benchmarks due to the unpredictable nature of supply and demand factors, geopolitical events and the timing and extent of recovery of the global economy. The Heavy Differential is expected to continue to reflect seasonal demand fluctuations and refinery margins.
NYMEX natural gas prices averaged US$4.03 per mmbtu for 2009, a decrease of 55% from US$8.95 per mmbtu for 2008 (2007 – US$6.92 per mmbtu). Alberta based AECO natural gas pricing for 2009 decreased 49% to average $3.91 per GJ from $7.71 per GJ in 2008 (2007 – $6.26 per GJ). During 2009, natural gas pricing decreased due to a significant increase in production from shale gas reservoirs in the US, a significant decline in industrial demand caused by the onset of worldwide financial and economic events, and record storage levels in North America.
Operating, Royalty and Capital Costs
Strong commodity prices in recent years have resulted in increased demand for oilfield services worldwide. This has led to inflationary operating and capital cost pressures throughout the crude oil and natural gas industry, particularly related to drilling activities and oil sands developments.
In Canada, the Federal Government has indicated its intent to develop regulations that would be in effect in the near term to address industrial GHG emissions, as part of the national GHG reduction target. The Federal Government has also outlined national and sectoral reduction targets for several categories of air pollutants. In Alberta, GHG regulations came into effect July 1, 2007, affecting facilities emitting more than 100 kilotonnes of CO2e annually. Two of the Company’s facilities, the Primrose/Wolf Lake in-situ heavy crude oil facilities and the Hays sour natural gas plant, fall under the regulations. The British Columbia carbon tax is currently being assessed at $15/tonne of CO2e on fu el consumed and gas flared in the province. This rate is scheduled to increase to $20/tonne on July 1, 2010, and to $30/tonne by July 1, 2012. As part of its involvement with the Western Climate Initiative, British Columbia has also announced that certain upstream oil and gas facilities will be included in a regional cap and trade system beginning in 2012. It is estimated that six facilities in British Columbia will be included under the cap and trade system, based on a proposed 25 kt CO2e threshold. Saskatchewan is expected to release GHG regulations in 2010 that would require the North Tangleflags in-situ heavy oil facility to meet a reduction target for its GHG emissions intensity. In the UK, GHG regulations have been in effect since 2005. During Phase 1 (2005 – 2007) of the UK National Allocation Plan, the Company operated below its CO2 allocation. For Phase 2 (2008 – 2012) the Company’s CO2 allocation has been decreased below the Company’s estimated current operations emissions. The Company continues to focus on implementing reduction programs based on efficiency audits to reduce CO2 emissions at its major facilities and on trading mechanisms to ensure compliance with requirements now in effect.
Legislation to regulate GHGs in the United States through a cap and trade system is currently before the US Congress, although there is no certainty as to the form or stringency of the final legislation. In the absence of legislation, the US Environmental Protection Agency (“EPA”) is authorized under the Clean Air Act to regulate GHGs, although EPA action would be subject to legal and political challenges. The ultimate form of Canadian regulation is anticipated to be strongly influenced by the regulatory decisions made within the US. Various states have enacted or are evaluating low carbon fuel standards, which may affect access to market for crude oil with higher emissions intensity.
Continued cost pressures and the final outcome of changes to environmental regulations may adversely impact the Company’s future net earnings, cash flow and capital projects. For additional details, refer to the “Greenhouse Gas and Other Air Emissions” section of this MD&A.
The Alberta Government implemented changes to the Alberta Royalty Framework (“ARF”) effective January 1, 2009. The ARF includes a number of changes to royalty rates for natural gas, conventional crude oil, and oil sands production. Under the ARF, royalties payable vary according to commodity prices and the productivity of wells. Changes to the Alberta royalty regime under the ARF include the implementation of a sliding scale for oil sands royalties ranging from 1% to 9% on a gross revenue basis pre-payout and 25% to 40% on a net revenue basis post-payout, depending on benchmark crude oil pricing. For additional details, refer to the “Royalties” section of this MD&A.
ANALYSIS OF CHANGES IN REVENUE, BEFORE ROYALTIES AND RISK MANAGEMENT ACTIVITIES
| | | | | | | | | Changes | | | | | | | | | | | | Changes | | | | | | | |
| | | | | | | | | due to | | | | | | | | | | | | due to | | | | | | | |
| ($ millions) | | 2007 | | | Volumes | | | Prices | | | Other | | | 2008 | | | Volumes | | | Prices | | | Other | | | 2009 | |
| North America | | | | | | | | | | | | | | | | | | | | | | | | | | | |
| Crude oil and NGLs | | $ | 5,847 | | | $ | (49 | ) | | $ | 3,013 | | | $ | – | | | $ | 8,811 | | | $ | (424 | ) | | $ | (2,649 | ) | | $ | – | | | $ | 5,738 | |
| Natural Gas | | | 4,302 | | | | (531 | ) | | | 914 | | | | – | | | | 4,685 | | | | (598 | ) | | | (1,852 | ) | | | – | | | | 2,235 | |
| | | | 10,149 | | | | (580 | ) | | | 3,927 | | | | – | | | | 13,496 | | | | (1,022 | ) | | | (4,501 | ) | | | – | | | | 7,973 | |
| North Sea | | | | | | | | | | | | | | | | | | | | | | | | | | | | | | | | | | | | |
| Crude oil and NGLs | | | 1,575 | | | | (334 | ) | | | 512 | | | | – | | | | 1,753 | | | | (344 | ) | | | (465 | ) | | | – | | | | 944 | |
| Natural gas | | | 22 | | | | (5 | ) | | | (1 | ) | | | – | | | | 16 | | | | – | | | | 1 | | | | – | | | | 17 | |
| | | | 1,597 | | | | (339 | ) | | | 511 | | | | – | | | | 1,769 | | | | (344 | ) | | | (464 | ) | | | – | | | | 961 | |
| Offshore West Africa | | | | | | | | | | | | | | | | | | | | | | | | | | | | | | | | | | | | |
| Crude oil and NGLs | | | 751 | | | | (136 | ) | | | 280 | | | | – | | | | 895 | | | | 413 | | | | (436 | ) | | | – | | | | 872 | |
| Natural gas | | | 25 | | | | 5 | | | | 19 | | | | – | | | | 49 | | | | 18 | | | | (26 | ) | | | – | | | | 41 | |
| | | | 776 | | | | (131 | ) | | | 299 | | | | – | | | | 944 | | | | 431 | | | | (462 | ) | | | – | | | | 913 | |
| Subtotal | | | | | | | | | | | | | | | | | | | | | | | | | | | | | | | | | | | | |
| Crude oil and NGLs | | | 8,173 | | | | (519 | ) | | | 3,805 | | | | – | | | | 11,459 | | | | (355 | ) | | | (3,550 | ) | | | – | | | | 7,554 | |
| Natural gas | | | 4,349 | | | | (531 | ) | | | 932 | | | | – | | | | 4,750 | | | | (580 | ) | | | (1,877 | ) | | | – | | | | 2,293 | |
| | | | 12,522 | | | | (1,050 | ) | | | 4,737 | | | | – | | | | 16,209 | | | | (935 | ) | | | (5,427 | ) | | | – | | | | 9,847 | |
| Oil Sands Mining and Upgrading | | | – | | | | – | | | | – | | | | – | | | | – | | | | 1,253 | | | | – | | | | – | | | | 1,253 | |
| Midstream | | | 74 | | | | – | | | | – | | | | 3 | | | | 77 | | | | – | | | | – | | | | (5 | ) | | | 72 | |
Intersegment eliminations and other (1) | | | (53 | ) | | | – | | | | – | | | | (60 | ) | | | (113 | ) | | | – | | | | – | | | | 19 | | | | (94 | ) |
| Total | | $ | 12,543 | | | $ | (1,050 | ) | | $ | 4,737 | | | $ | (57 | ) | | $ | 16,173 | | | $ | 318 | | | $ | (5,427 | ) | | $ | 14 | | | $ | 11,078 | |
(1) Eliminates primarily internal transportation, electricity charges, and natural gas sales.
Revenue decreased 32% to $11,078 million for 2009 from $16,173 million for 2008 (2007 – $12,543 million). The decrease was primarily due to decreased realized crude oil and NGLs and natural gas prices company-wide.
For 2009, 17% of the Company’s crude oil and natural gas revenue was generated outside of North America (2008 – 17%; 2007 – 19%). North Sea accounted for 9% of crude oil and natural gas revenue for 2009 (2008 – 11%; 2007 – 13%), and Offshore West Africa accounted for 8% of crude oil and natural gas revenue for 2009 (2008 – 6%; 2007 – 6%).
ANALYSIS OF DAILY PRODUCTION, BEFORE ROYALTIES
| | 2009 | 2008 | 2007 |
Crude oil and NGLs (bbl/d) | | | |
| North America – Conventional | 234,523 | 243,826 | 246,779 |
| North America – Oil Sands Mining and Upgrading | 50,250 | – | – |
| North Sea | 37,761 | 45,274 | 55,933 |
| Offshore West Africa | 32,929 | 26,567 | 28,520 |
| | 355,463 | 315,667 | 331,232 |
Natural gas (mmcf/d) | | | |
| North America | 1,287 | 1,472 | 1,643 |
| North Sea | 10 | 10 | 13 |
| Offshore West Africa | 18 | 13 | 12 |
| | 1,315 | 1,495 | 1,668 |
Total barrels of oil equivalent (boe/d) | 574,730 | 564,845 | 609,206 |
| Product mix | | | |
| Light/medium crude oil and NGLs | 21% | 22% | 23% |
| Pelican Lake crude oil | 6% | 6% | 6% |
| Primary heavy crude oil | 15% | 16% | 15% |
| Thermal heavy crude oil | 11% | 12% | 11% |
| Synthetic crude oil | 9% | – | – |
| Natural gas | 38% | 44% | 45% |
Percentage of gross revenue (1) | | | |
| (excluding midstream revenue) | | | |
| Crude oil and NGLs | 75% | 68% | 62% |
| Natural gas | 25% | 32% | 38% |
| (1) | Net of transportation and blending costs and excluding risk management activities. |
ANALYSIS OF DAILY PRODUCTION, NET OF ROYALTIES
| | 2009 | 2008 | 2007 |
Crude oil and NGLs (bbl/d) | | | |
| North America – Conventional | 201,873 | 207,933 | 210,769 |
| North America – Oil Sands Mining and Upgrading | 48,833 | – | – |
| North Sea | 37,683 | 45,182 | 55,825 |
| Offshore West Africa | 29,922 | 22,641 | 26,012 |
| | 318,311 | 275,756 | 292,606 |
Natural gas (mmcf/d) | | | |
| North America | 1,214 | 1,225 | 1,378 |
| North Sea | 10 | 10 | 13 |
| Offshore West Africa | 17 | 11 | 11 |
| | 1,241 | 1,246 | 1,402 |
Total barrels of oil equivalent (boe/d) | 525,103 | 483,541 | 526,193 |
The Company’s business approach is to maintain large project inventories and production diversification among each of the commodities it produces; namely natural gas, light/medium crude oil and NGLs, Pelican Lake crude oil, primary heavy crude oil, thermal heavy crude oil, and SCO.
Total production averaged 574,730 boe/d for 2009, a 2% increase from 564,845 boe/d for 2008 (2007 – 609,206 boe/d).
Total production of crude oil and NGLs before royalties increased 13% to 355,463 bbl/d for 2009 from 315,667 bbl/d for 2008 (2007 – 331,232 bbl/d). The increase in crude oil and NGLs production from 2008 was primarily due to the commencement of production from Horizon and the Olowi Field in Offshore Gabon and the restoration of some of the production in the Baobab Field in Offshore Côte d’Ivoire. Crude oil and NGLs production for 2009 was within the Company’s previously issued guidance of 352,000 to 363,000 bbl/d.
Natural gas production continued to represent the Company’s largest product offering, accounting for 38% of the Company’s total production in 2009. Total natural gas production before royalties decreased 12% to 1,315 mmcf/d for 2009 from 1,495 mmcf/d for 2008 (2007 – 1,668 mmcf/d). The decrease in natural gas production from 2008 primarily reflected natural production declines due to the Company’s strategic decision to reduce natural gas drilling activity to focus on higher return crude oil projects. Natural gas production for 2009 exceeded the Company’s previously issued guidance of 1,305 to 1,314 mmcf/d.
For 2010, annual production is forecasted to average between 400,000 and 445,000 bbl/d of crude oil and NGLs and between 1,117 and 1,185 mmcf/d of natural gas.
North America - Conventional
North America crude oil and NGLs production for 2009 decreased 4% to average 234,523 bbl/d from 243,826 bbl/d for 2008 (2007 – 246,779 bbl/d). The decrease in production from 2008 was primarily due to the cyclic nature of the Company’s thermal production and was in line with expectations.
North America natural gas production for 2009 decreased 13% to average 1,287 mmcf/d from 1,472 mmcf/d for 2008 (2007 –1,643 mmcf/d). The decrease in natural gas production from 2008 reflected production declines due to the Company’s strategic decision to reduce natural gas drilling activity to focus on higher return crude oil projects.
North America – Oil Sands Mining and Upgrading
Horizon Phase 1 achieved first production of synthetic crude oil during 2009. Production averaged 50,250 bbl/d for 2009. Production volumes fluctuated throughout the year as the Company continued to stabilize and ramp up production.
North Sea
North Sea crude oil production for 2009 was 37,761 bbl/d, a decrease of 17% from 45,274 bbl/d for 2008 (2007 – 55,933 bbl/d) due to expected production decline.
Offshore West Africa
Offshore West Africa crude oil production for 2009 increased 24% to 32,929 bbl/d from 26,567 bbl/d for 2008 (2007 – 28,520 bbl/d). Production increased in 2009 due to additional volumes from the Baobab drilling program, which was completed in the second quarter, and new production from the Olowi Field in Offshore Gabon, offset by expected declines at Espoir.
Production volumes from the first platform at the Olowi Field continue to be below expectations and, as a result, the Company recognized a ceiling test impairment of $115 million at December 31, 2009. Drilling results and production data is being reviewed in order to develop appropriate remediation strategies and determine the impact on future production from the Field, the impact on recoverable reserves and the scope of the overall development plan. The Company continues drilling at the next scheduled platform with production targeted for the second quarter of 2010.
CRUDE OIL INVENTORY VOLUMES
The Company recognizes revenue on its crude oil production when title transfers to the customer and delivery has taken place. Revenue has not been recognized on crude oil volumes that were stored in various tanks, pipelines, or floating production, storage and offtake vessels as follows:
| (bbl) | 2009 | 2008 | 2007 |
| North America – Conventional | 1,131,372 | 761,351 | 1,097,526 |
| North America – Oil Sands Mining and Upgrading (SCO) | 1,224,481 | – | – |
| North Sea | 713,112 | 558,904 | 1,032,723 |
Offshore West Africa(1) | 51,103 | 1,113,156 | 342,987 |
| | 3,120,068 | 2,433,411 | 2,473,236 |
| (1) | Prior period inventory volumes include one-time adjustments to sales volumes for MD&A reporting purposes only. |
OPERATING HIGHLIGHTS – CONVENTIONAL
| | | 2009 | | | 2008 | | | 2007 | |
Crude oil and NGLs ($/bbl) (1) | | | | | | | | | |
Sales price (2) | | $ | 57.68 | | | $ | 82.41 | | | $ | 55.45 | |
| Royalties | | | 6.73 | | | | 10.48 | | | | 5.94 | |
| Production expense | | | 15.92 | | | | 16.26 | | | | 13.34 | |
| Netback | | $ | 35.03 | | | $ | 55.67 | | | $ | 36.17 | |
Natural gas ($/mcf) (1) | | | | | | | | | | | | |
Sales price (2) | | $ | 4.53 | | | $ | 8.39 | | | $ | 6.85 | |
Royalties (3) | | | 0.32 | | | | 1.46 | | | | 1.11 | |
| Production expense | | | 1.08 | | | | 1.02 | | | | 0.91 | |
| Netback | | $ | 3.13 | | | $ | 5.91 | | | $ | 4.83 | |
Barrels of oil equivalent ($/boe) (1) | | | | | | | | | | | | |
Sales price (2) | | $ | 44.87 | | | $ | 68.62 | | | $ | 49.05 | |
| Royalties | | | 4.72 | | | | 9.78 | | | | 6.26 | |
| Production expense | | | 11.98 | | | | 11.79 | | | | 9.75 | |
| Netback | | $ | 28.17 | | | $ | 47.05 | | | $ | 33.04 | |
| (1) | Amounts expressed on a per unit basis are based on sales volumes. |
| (2) | Net of transportation and blending costs and excluding risk management activities. |
| (3) | Natural gas royalties for 2009 reflect the impact of natural gas physical sales contracts. |
| ANALYSIS OF PRODUCT PRICES – CONVENTIONAL |
| | | 2009 | | | 2008 | | | 2007 | |
Crude oil and NGLs ($/bbl) (1) (2) | | | | | | | | | |
| North America | | $ | 54.70 | | | $ | 77.42 | | | $ | 49.16 | |
| North Sea | | $ | 68.84 | | | $ | 100.31 | | | $ | 74.99 | |
| Offshore West Africa | | $ | 65.27 | | | $ | 97.96 | | | $ | 71.68 | |
| Company average | | $ | 57.68 | | | $ | 82.41 | | | $ | 55.45 | |
| | | | | | | | | | | | | |
Natural gas ($/mcf) (1) (2) | | | | | | | | | | | | |
| North America | | $ | 4.51 | | | $ | 8.41 | | | $ | 6.87 | |
| North Sea | | $ | 4.66 | | | $ | 4.09 | | | $ | 4.26 | |
| Offshore West Africa | | $ | 6.11 | | | $ | 10.03 | | | $ | 5.68 | |
| Company average | | $ | 4.53 | | | $ | 8.39 | | | $ | 6.85 | |
| | | | | | | | | | | | | |
Company average ($/boe) (1) (2) | | $ | 44.87 | | | $ | 68.62 | | | $ | 49.05 | |
(1) Amounts expressed on a per unit basis are based on sales volumes.
(2) Net of transportation and blending costs and excluding risk management activities.
Realized crude oil and NGLs prices decreased 30% to average $57.68 per bbl for 2009 from $82.41 per bbl for 2008 (2007 – $55.45 per bbl). The decrease in 2009 was primarily a result of lower WTI and Brent benchmark crude oil prices during most of the year, partially offset by the impact of the narrowing of the Heavy Differential and the weaker Canadian dollar relative to the US dollar during 2009.
The Company’s realized natural gas price decreased 46% to average $4.53 per mcf for 2009 from $8.39 per mcf for 2008 (2007 – $6.85 per mcf). The decrease in 2009 was primarily due to lower benchmark prices resulting from lower demand, as well as higher storage levels due to increased shale gas production in the US.
North America
North America realized crude oil prices decreased 29% to average $54.70 per bbl for 2009 from $77.42 per bbl for 2008 (2007 – $49.16 per bbl). The decrease in 2009 was due to decreased WTI benchmark pricing, partially offset by the impact of a narrower Heavy Differential, and a weaker Canadian dollar.
The Company continues to focus on its crude oil marketing strategy, including the development of a blending strategy that expands markets within current pipeline infrastructure, supporting pipeline projects that will provide capacity to transport crude oil to new markets, and working with refiners to add incremental heavy crude oil conversion capacity. During 2009, the Company contributed approximately 140,000 bbl/d of heavy crude oil blends to the WCS stream. The Company has entered into a 20 year transportation agreement to commit to ship 120,000 bbl/d of heavy sour crude oil on the proposed 500,000 bbl/d Keystone Pipeline US Gulf Coast expansion from Hardisty, Alberta to the US Gulf Coast. Contemporaneously, the Company also entered into a 20 year crude oil purchase and sales agreement to sell 100,000 bbl/d of heavy sour crude oil to a major US refiner. Deliveries under the agreements are expected to commence in 2012 upon completion of the pipeline expansion and are subject to Keystone’s receipt of regulatory approval of the pipeline expansion.
In the first quarter of 2010, the Company announced, together with North West Upgrading Inc., the submission of a joint proposal to the Alberta Government to construct and operate a bitumen refinery near Redwater, Alberta. This proposal was submitted in response to a request for proposal under the Alberta Royalty Framework’s Bitumen Royalty In Kind (BRIK) program.
North America realized natural gas prices decreased 46% to average $4.51 per mcf for 2009 from $8.41 per mcf for 2008 (2007 – $6.87 per mcf), primarily related to lower benchmark prices due to the impact of weather and storage levels.
Comparisons of the prices received for the Company’s North America conventional production by product type were as follows:
| (Yearly average) | | 2009 | | | 2008 | | | 2007 | |
Wellhead Price (1) (2) | | | | | | | | | |
| Light/medium crude oil and NGLs (C$/bbl) | | $ | 57.02 | | | $ | 89.04 | | | $ | 66.24 | |
| Pelican Lake crude oil (C$/bbl) | | $ | 55.52 | | | $ | 76.91 | | | $ | 46.29 | |
| Primary heavy crude oil (C$/bbl) | | $ | 55.66 | | | $ | 74.91 | | | $ | 43.77 | |
| Thermal heavy crude oil (C$/bbl) | | $ | 51.18 | | | $ | 71.89 | | | $ | 43.49 | |
| Natural gas (C$/mcf) | | $ | 4.51 | | | $ | 8.41 | | | $ | 6.87 | |
(1) Amounts expressed on a per unit basis are based on sales volumes.
(2) Net of transportation and blending costs and excluding risk management activities.
North Sea realized crude oil prices decreased 31% to average $68.84 per bbl for 2009 from $100.31 per bbl for 2008 (2007 – $74.99 per bbl). Realized crude oil prices per bbl in any particular period are dependant on the terms of the various sales contracts, the frequency and timing of liftings of each field, and prevailing crude oil prices at the time of lifting. The decrease in realized crude oil prices in the North Sea from 2008 reflected weaker Brent benchmark pricing, partially offset by the impact of the weaker Canadian dollar.
Offshore West Africa
Offshore West Africa realized crude oil prices decreased 33% to average $65.27 per bbl for 2009 from $97.96 per bbl for 2008 (2007 – $71.68 per bbl). Realized crude oil prices per bbl in any particular period are dependant on the terms of the various sales contracts, the frequency and timing of liftings of each field, and prevailing crude oil prices at the time of lifting. The decrease in realized crude oil prices in Offshore West Africa from 2008 reflected weaker Brent benchmark pricing, partially offset by the impact of the weaker Canadian dollar.
ROYALTIES – CONVENTIONAL
| | | 2009 | | | 2008 | | | 2007 | |
Crude oil and NGLs ($/bbl) (1) | | | | | | | | | |
| North America | | $ | 7.93 | | | $ | 11.99 | | | $ | 7.19 | |
| North Sea | | $ | 0.14 | | | $ | 0.21 | | | $ | 0.14 | |
| Offshore West Africa | | $ | 5.79 | | | $ | 14.81 | | | $ | 6.40 | |
| Company average | | $ | 6.73 | | | $ | 10.48 | | | $ | 5.94 | |
Natural gas ($/mcf) (1) | | | | | | | | | | | | |
North America (2) | | $ | 0.32 | | | $ | 1.47 | | | $ | 1.12 | |
| Offshore West Africa | | $ | 0.53 | | | $ | 1.52 | | | $ | 0.51 | |
| Company average | | $ | 0.32 | | | $ | 1.46 | | | $ | 1.11 | |
Company average ($/boe) (1) | | $ | 4.72 | | | $ | 9.78 | | | $ | 6.26 | |
Percentage of revenue (3) | | | | | | | | | | | | |
| Crude oil and NGLs | | | 12 | % | | | 13 | % | | | 11 | % |
Natural gas (2) | | | 7 | % | | | 17 | % | | | 16 | % |
| Boe | | | 11 | % | | | 14 | % | | | 13 | % |
(1) Amounts expressed on a per unit basis are based on sales volumes.
(2) Natural gas royalties for 2009 reflect the impact of natural gas physical sales contracts.
(3) Net of transportation and blending costs and excluding risk management activities.
North America
Government royalties on a significant portion of North America crude oil and NGLs production fall under the oil sands royalty regime and are calculated on a project by project basis as a percentage of gross revenue less operating, capital and abandonment costs (“net profit”). For 2008 and prior years, royalties were calculated as 1% of gross revenues until the Company’s capital investments in the applicable project were fully recovered, at which time the royalty increased to 25% of net profit. Effective January 1, 2009, changes to the Alberta royalty regime under the ARF include the implementation of a sliding scale for oil sands royalties ranging from 1% to 9% on a gross revenue basis pre-payout and 25% to 40% on a net revenue basis post-payout depending on benchmark crude oil pricing.
In addition, effective January 1, 2009, new royalty formulas under the ARF for conventional crude oil and natural gas operate on sliding scales ranging up to 50%, determined by commodity prices and well productivity.
In March 2009, the Government of Alberta announced new incentive programs to stimulate activity in Alberta. These programs provide for:
| · | A royalty credit of $200 per meter on new conventional crude oil and natural gas wells drilled between April 1, 2009 and March 31, 2010, to a maximum of 10% of conventional Crown royalties paid in Alberta. |
| · | Reduced royalty rates that set the maximum royalty at 5% for the first 12 months of production, up to a maximum of 50,000 boe or 500 mmcfe, for new conventional crude oil and natural gas wells that commence production between April 1, 2009 and March 31, 2010. |
In June 2009, the Government of Alberta extended the two incentive programs described above by one year, to
March 31, 2011.
Effective September 1, 2009, the Province of British Columbia announced an oil and gas stimulus package that includes:
| · | A one-year, 2% royalty rate for all natural gas wells drilled between September 1, 2009 and June 30, 2010. Qualifying wells must commence production before December 31, 2010. |
| · | A permanent increase of 15% in the existing royalty holiday credits for the Deep Royalty Program. |
| · | Permanent qualification of horizontal wells drilled to a vertical depth between 1,900 and 2,300 meters into the Deep Royalty Program. |
| · | An additional $50 million allocation for the Infrastructure Royalty Credit Program to stimulate investment in oil and gas roads and pipelines. |
Crude oil and NGLs royalties for 2009 compared to 2008 reflected weaker realized crude oil prices and the impact of the ARF and averaged approximately 14% of gross revenues for 2009 compared to 15% for 2008 (2007 – 15%). North America crude oil and NGLs royalties per bbl are anticipated to average 17% to 19% of gross revenue for 2010.
Natural gas royalties averaged approximately 7% of gross revenues for 2009 compared to 18% for 2008 (2007 – 16%), primarily due to lower benchmark natural gas prices and the impact of the ARF. North America natural gas royalties per mcf are anticipated to average 11% to 13% of gross revenue for 2010.
North Sea
North Sea government royalties on crude oil were eliminated effective January 1, 2003. The remaining royalty is a gross overriding royalty on the Ninian Field.
Offshore West Africa
Under the terms of Production Sharing Contracts (“PSCs”), royalty rates fluctuate based on realized commodity pricing, capital costs, and the timing of liftings from each field. Royalty rates as a percentage of revenue averaged approximately 9% for 2009 compared to 15% for 2008 (2007 – 9%). Offshore West Africa royalty rates are anticipated to average 7% to 9% of gross revenue for 2010.
PRODUCTION EXPENSE – CONVENTIONAL
| | | 2009 | | | 2008 | | | 2007 | |
Crude oil and NGLs ($/bbl) (1) | | | | | | | | | |
| North America | | $ | 14.63 | | | $ | 14.96 | | | $ | 12.26 | |
| North Sea | | $ | 26.98 | | | $ | 26.29 | | | $ | 20.78 | |
| Offshore West Africa | | $ | 12.83 | | | $ | 10.29 | | | $ | 8.32 | |
| Company average | | $ | 15.92 | | | $ | 16.26 | | | $ | 13.34 | |
Natural gas ($/mcf) (1) | | | | | | | | | | | | |
| North America | | $ | 1.07 | | | $ | 1.00 | | | $ | 0.90 | |
| North Sea | | $ | 2.16 | | | $ | 2.51 | | | $ | 2.17 | |
| Offshore West Africa | | $ | 1.23 | | | $ | 1.61 | | | $ | 1.48 | |
| Company average | | $ | 1.08 | | | $ | 1.02 | | | $ | 0.91 | |
Company average ($/boe) (1) | | $ | 11.98 | | | $ | 11.79 | | | $ | 9.75 | |
(1) Amounts expressed on a per unit basis are based on sales volumes.
North America
North America crude oil and NGLs production expense for 2009 decreased 2% to $14.63 per bbl from $14.96 per bbl for 2008 (2007 – $12.26 per bbl). The decrease in production expense per bbl from 2008 was primarily a result of the Company’s focus on optimizing service costs, together with lower power prices and cost of natural gas for fuel for the Company’s thermal operations partially offset by the impact of increased property tax.
North America natural gas production expense for 2009 increased 7% to $1.07 per mcf from $1.00 per mcf for 2008 (2007 – $0.90 per mcf). The increase in production expense per mcf from 2008 was primarily a result of the impact of lower production volumes on fixed costs, offset by reductions due to the Company’s focus on optimizing service costs and lower power prices.
North Sea
North Sea crude oil production expense increased on a per barrel basis from 2008 primarily due to lower production volumes on a relatively fixed operating cost base and the weakening of the Canadian dollar against the UK pound sterling.
Offshore West Africa
Offshore West Africa crude oil production expense increased on a per barrel basis from 2008. Production expense was impacted by the timing of liftings of each field and higher operating costs per barrel in Gabon.
DEPLETION, DEPRECIATION AND AMORTIZATION – CONVENTIONAL
($ millions, except per boe amounts) (1) | | 2009 | | | 2008 | | | 2007 | |
| North America | | $ | 2,060 | | | $ | 2,236 | | | $ | 2,350 | |
| North Sea | | | 261 | | | | 317 | | | | 340 | |
| Offshore West Africa | | | 335 | | | | 132 | | | | 165 | |
| Expense | | $ | 2,656 | | | $ | 2,685 | | | $ | 2,855 | |
| $/boe | | $ | 13.82 | | | $ | 12.97 | | | $ | 12.84 | |
(1) Amounts expressed on a per unit basis are based on sales volumes.
Depletion, Depreciation and Amortization (“DD&A”) expense for 2009 decreased slightly to $2,656 million from $2,685 million for 2008 (2007 – $2,855 million), primarily due to the impact of lower sales volumes offset by the impact of a ceiling test impairment related to Gabon, Offshore West Africa.
ASSET RETIREMENT OBLIGATION ACCRETION – CONVENTIONAL
($ millions, except per boe amounts) (1) | | 2009 | | | 2008 | | | 2007 | |
| North America | | $ | 41 | | | $ | 42 | | | $ | 38 | |
| North Sea | | | 24 | | | | 27 | | | | 30 | |
| Offshore West Africa | | | 4 | | | | 2 | | | | 2 | |
| Expense | | $ | 69 | | | $ | 71 | | | $ | 70 | |
| $/boe | | $ | 0.36 | | | $ | 0.34 | | | $ | 0.32 | |
(1) Amounts expressed on a per unit basis are based on sales volumes.
Asset retirement obligation accretion expense represents the increase in the carrying amount of the asset retirement obligation due to the passage of time. Accretion expense in 2009 was comparable to 2008.
OPERATING HIGHLIGHTS – OIL SANDS MINING AND UPGRADING
FINANCIAL METRICS
($/bbl) (1) | | 2009 | | | 2008 | | | 2007 | |
SCO sales price (2) | | $ | 70.83 | | | $ | – | | | $ | – | |
| Bitumen value for royalty purposes | | $ | 56.57 | | | $ | – | | | $ | – | |
Bitumen royalties (3) | | $ | 2.15 | | | $ | – | | | $ | – | |
(1) Amounts expressed on a per unit basis are based on sales volumes.
(2) Net of transportation and excluding risk management activities.
(3) Calculated based on actual bitumen royalties expensed during the period; divided by the corresponding SCO sales volumes.
PRODUCTION COSTS
The following tables provide reconciliations of Oil Sands Mining and Upgrading production costs to the Segmented Information disclosed in note 16 to the Company’s consolidated financial statements.
| ($ millions) | | 2009 | | | 2008 | | | 2007 | |
| Cash costs, excluding natural gas costs | | $ | 599 | | | $ | – | | | $ | – | |
| Natural gas costs | | | 84 | | | | – | | | | – | |
| Total cash production costs | | $ | 683 | | | $ | – | | | $ | – | |
($/bbl) (1) | | 2009 | | | 2008 | | | 2007 | |
| Cash costs, excluding natural gas costs | | $ | 34.97 | | | $ | – | | | $ | – | |
| Natural gas costs | | | 4.92 | | | | – | | | | – | |
| Total cash production costs | | $ | 39.89 | | | $ | – | | | $ | – | |
| Sales (bbl/d) | | | 46,896 | | | | – | | | | – | |
(1) Amounts expressed on a per unit basis are based on sales volumes.
First sales from Horizon occurred in the second quarter of 2009.
Production expense in 2009 reflected the effects of the commencement of operations. Total cash production costs averaged $39.89 per bbl in 2009. Cash production costs in 2009 reflected the impact of maintenance costs related to premature equipment failures and overall plant reliability. Cash production costs are targeted to average $31.00 to $37.00 per barrel in 2010.
| ($ millions) | | 2009 | | | 2008 | | | 2007 | |
| Depreciation, depletion and amortization | | $ | 187 | | | $ | – | | | $ | – | |
| Asset retirement obligation accretion | | | 21 | | | | – | | | | – | |
| Total | | $ | 208 | | | $ | – | | | $ | – | |
($/bbl) (1) | | 2009 | | | 2008 | | | 2007 | |
| Depreciation, depletion and amortization | | $ | 10.95 | | | $ | – | | | $ | – | |
| Asset retirement obligation accretion | | | 1.22 | | | | – | | | | – | |
| Total | | $ | 12.17 | | | $ | – | | | $ | – | |
(1) Amounts expressed on a per unit basis are based on sales volumes.
During 2009, Horizon Phase 1 assets were completed and available for their intended use. Accordingly, capitalization of all associated Phase 1 development costs, including capitalized interest and stock-based compensation, and all directly attributable Phase 1 administrative costs has ceased, and depletion, depreciation and amortization of these assets has commenced. Depletion, depreciation and amortization included the disposal of a portion of the tailings line pipe related to premature wear.
MIDSTREAM
| ($ millions) | | 2009 | | | 2008 | | | 2007 | |
| Revenue | | $ | 72 | | | $ | 77 | | | $ | 74 | |
| Production expense | | | 19 | | | | 25 | | | | 22 | |
| Midstream cash flow | | | 53 | | | | 52 | | | | 52 | |
| Depreciation | | | 9 | | | | 8 | | | | 8 | |
| Segment earnings before taxes | | $ | 44 | | | $ | 44 | | | $ | 44 | |
The Company’s midstream assets consist of three crude oil pipeline systems and a 50% working interest in an 84-megawatt cogeneration plant at Primrose. Approximately 80% of the Company’s heavy crude oil production is transported to international mainline liquid pipelines via the 100% owned and operated ECHO Pipeline, the 62% owned and operated Pelican Lake Pipeline and the 15% owned Cold Lake Pipeline. The midstream pipeline assets allow the Company to control the transport of its own production volumes as well as earn third party revenue. This transportation control enhances the Company’s ability to manage the full range of costs associated with the development and marketing of its heavier crude oil.
ADMINISTRATION EXPENSE
($ millions, except per boe amounts) (1) | | 2009 | | | 2008 | | | 2007 | |
| Expense | | $ | 181 | | | $ | 180 | | | $ | 208 | |
| $/boe | | $ | 0.87 | | | $ | 0.87 | | | $ | 0.93 | |
(1) Amounts expressed on a per unit basis are based on sales volumes.
Administration expense for 2009 was comparable to 2008. Administration expense on a boe basis in 2009 includes sales volumes associated with the commencement of Horizon.
STOCK-BASED COMPENSATION
| ($ millions) | | 2009 | | | 2008 | | | 2007 | |
| Expense (recovery) | | $ | 355 | | | $ | (52 | ) | | $ | 193 | |
The Company’s Stock Option Plan (the “Option Plan”) provides current employees (the “option holders”) with the right to elect to receive common shares or a direct cash payment in exchange for options surrendered. The design of the Option Plan balances the need for a long-term compensation program to retain employees with the benefits of reducing the impact of dilution on current Shareholders and the reporting of the obligations associated with stock options. Transparency of the cost of the Option Plan is increased as changes in the intrinsic value of outstanding stock options are recognized each period. The cash payment feature provides option holders with substantially the same benefits and allows them to realize the value of their options through a simplified administration process.
The Company recorded a $355 million ($261 million after-tax) stock-based compensation expense during 2009 primarily as a result of normal course graded vesting of options granted in prior periods, the impact of vested options exercised or surrendered during the year, and the 56% increase in the Company’s share price for the year ended December 31, 2009 (December 31, 2009 – $76.00; December 31, 2008 – $48.75; December 31, 2007 – $72.58; December 31, 2006 – $62.15). As required by Canadian GAAP, the Company records a liability for potential cash payments to settle its outstanding employee stock options each reporting period based on the difference between the exercise price of the stock options and the market price of the Company’s common shares, pursuant to a graded vesting schedule. For the year ended December 31, 2009, the Company capitalized $2 million in stock-based compensation to Oil Sands Mining and Upgrading (2008 – $23 million recovery; 2007 – $58 million capitalized).
The stock-based compensation liability reflected the Company’s potential cash liability should all the vested options be surrendered for a cash payout at the market price on December 31, 2009. In periods when substantial stock price changes occur, the Company’s earnings are subject to significant volatility. The Company utilizes its stock-based compensation plan to attract and retain employees in a competitive environment. All employees participate in this plan.
For the year ended December 31, 2009, the Company paid $94 million for stock options surrendered for cash settlement (2008 – $207 million; 2007 – $375 million).
INTEREST EXPENSE
($ millions, except per boe amounts and interest rates) (1) | | 2009 | | | 2008 | | | 2007 | |
| Expense, gross | | $ | 516 | | | $ | 609 | | | $ | 632 | |
| Less: capitalized interest, Oil Sands Mining and Upgrading | | | 106 | | | | 481 | | | | 356 | |
| Expense, net | | $ | 410 | | | $ | 128 | | | $ | 276 | |
| $/boe | | $ | 1.96 | | | $ | 0.62 | | | $ | 1.24 | |
| Average effective interest rate | | | 4.3 | % | | | 5.1 | % | | | 5.5 | % |
(1) Amounts expressed on a per unit basis are based on sales volumes.
Gross interest expense decreased from 2008 primarily due to lower debt levels and lower variable interest rates and reflected the impact of fluctuations in foreign exchange rates on US dollar denominated debt. The Company’s average effective interest rate decreased from the comparable period in 2008 primarily due to lower variable interest rates.
During 2009, interest capitalization ceased on Horizon Phase 1 as the Phase 1 assets were completed and available for their intended use, increasing net interest expense accordingly.
RISK MANAGEMENT ACTIVITIES
The Company utilizes various derivative financial instruments to manage its commodity price, currency and interest rate exposures. These derivative financial instruments are not intended for trading or speculative purposes.
| ($ millions) | | 2009 | | | 2008 | | | 2007 | |
| Crude oil and NGLs financial instruments | | $ | (1,330 | ) | | $ | 2,020 | | | $ | 505 | |
| Natural gas financial instruments | | | (33 | ) | | | (21 | ) | | | (343 | ) |
| Foreign currency contracts | | | 110 | | | | (139 | ) | | | - | |
| Realized (gain) loss | | $ | (1,253 | ) | | $ | 1,860 | | | $ | 162 | |
| Crude oil and NGLs financial instruments | | $ | 2,039 | | | $ | (3,104 | ) | | $ | 1,244 | |
| Natural gas financial instruments | | | (58 | ) | | | 16 | | | | 156 | |
| Foreign currency contracts | | | 10 | | | | (2 | ) | | | - | |
| Unrealized loss (gain) | | $ | 1,991 | | | $ | (3,090 | ) | | $ | 1,400 | |
| Net loss (gain) | | $ | 738 | | | $ | (1,230 | ) | | $ | 1,562 | |
Complete details related to outstanding derivative financial instruments at December 31, 2009 are disclosed in note 13 to the Company’s consolidated financial statements.
The commodity derivative financial instruments currently outstanding have not been designated as hedges for accounting purposes (the “non-designated hedges”). The fair value of these non-designated hedges is based on prevailing forward commodity prices in effect at the end of each reporting period and is reflected in risk management activities in consolidated net earnings. The cash settlement amount of the commodity derivative financial instruments may vary materially depending upon the underlying crude oil and natural gas prices at the time of final settlement, as compared to their mark-to-market value at December 31, 2009.
Due to changes in crude oil and natural gas forward pricing and the reversal of prior period unrealized gains and losses, the Company recorded a net unrealized loss of $1,991 million ($1,437 million after-tax) on its risk management activities for the year ended December 31, 2009 (2008 – $3,090 million unrealized gain, $2,112 million after-tax; 2007 – $1,400 million unrealized loss, $977 million after-tax).
FOREIGN EXCHANGE
| ($ millions) | | 2009 | | | 2008 | | | 2007 | |
| Net realized loss (gain) | | $ | 30 | | | $ | (114 | ) | | $ | 53 | |
Net unrealized (gain) loss (1) | | | (661 | ) | | | 832 | | | | (524 | ) |
| Net (gain) loss | | $ | (631 | ) | | $ | 718 | | | $ | (471 | ) |
(1) Amounts are reported net of the hedging effect of cross currency swap hedges.
As a result of foreign currency translation, the Company’s operating results are affected by the fluctuations in the exchange rates between the Canadian dollar, US dollar, and UK pound sterling. A majority of the Company’s revenue is based on reference to US dollar benchmark prices. An increase in the value of the Canadian dollar in relation to the US dollar results in decreased revenue from the sale of the Company’s production. Conversely a decrease in the value of the Canadian dollar in relation to the US dollar results in increased revenue from the sale of the Company’s production. Production expenses and future income tax liabilities in the North Sea are subject to foreign currency fluctuations due to changes in the exchange rate of the UK pound sterling to the US dollar. The value of the Company’s US dollar den ominated debt is also impacted by the value of the Canadian dollar in relation to the US dollar.
The net unrealized foreign exchange gain in 2009 was primarily related to the strengthening Canadian dollar in relation to the US dollar with respect to the US dollar denominated debt, partially offset by the impact of the re-measurement of North Sea future income tax liabilities denominated in UK pounds sterling to US dollars. Included in the net unrealized gain for the year ended December 31, 2009 was an unrealized loss of $338 million (2008 – $449 million unrealized gain, 2007 – $351 million unrealized loss) related to the impact of cross currency swap hedges. The net realized foreign exchange loss for 2009 was primarily due to the result of foreign exchange rate fluctuations on settlement of working capital items denominated in US dollars or UK pounds sterling and the repayment of US dollar denominated debt. The Canadian dollar e nded the year at US$0.9555 compared to US$0.8166 at December 31, 2008 (December 31, 2007 – US$1.0120).
TAXES
| ($ millions, except income tax rates) | | 2009 | | | 2008 | | | 2007 | |
| Current | | $ | 91 | | | $ | 245 | | | $ | 121 | |
| Deferred | | | 15 | | | | (67 | ) | | | 44 | |
| Taxes other than income tax | | $ | 106 | | | $ | 178 | | �� | $ | 165 | |
| | | | | | | | | | | | | |
North America (1) | | $ | 28 | | | $ | 33 | | | $ | 96 | |
| North Sea | | | 278 | | | | 340 | | | | 210 | |
| Offshore West Africa | | | 82 | | | | 128 | | | | 74 | |
| Current income tax | | | 388 | | | | 501 | | | | 380 | |
| Future income tax | | | (99 | ) | | | 1,607 | | | | (456 | ) |
| | | | 289 | | | | 2,108 | | | | (76 | ) |
Income tax rate and other legislative changes (2) (3) (4) | | | 19 | | | | 41 | | | | 864 | |
| | | $ | 308 | | | $ | 2,149 | | | $ | 788 | |
| Effective income tax rate before income tax rate and other legislative changes | | | 24.3 | % | | | 27.8 | % | | | 32.2 | % |
(1) Includes North America Conventional Crude Oil and Natural Gas, Midstream, and Oil Sands Mining and Upgrading segments.
(2) Includes the effects of one time recoveries of $19 million due to British Columbia corporate income tax rate reductions substantively enacted or enacted during 2009.
(3) Includes the effects of one time recoveries of $19 million due to British Columbia corporate income tax rate reductions and $22 million due to Côte d’Ivoire corporate income tax rate reductions substantively enacted or enacted during 2008.
(4) Includes the effect of one time recoveries of $864 million due to Canadian Federal income tax rate reductions and other legislative changes substantively enacted or enacted during 2007.
Taxes other than income tax primarily includes current and deferred PRT, which is charged on certain fields in the North Sea at the rate of 50% of net operating income, after allowing for certain deductions including related capital and abandonment expenditures.
Taxable income from the conventional crude oil and natural gas business in Canada is primarily generated through partnerships, with the related income taxes payable in subsequent periods. North America current income taxes have been provided on the basis of this corporate structure. In addition, current income taxes in each business segment will vary depending on available income tax deductions related to the nature, timing and amount of capital expenditures incurred in any particular year.
The Company is subject to income tax reassessments arising in the normal course. The Company does not believe that any liabilities ultimately arising from these reassessments will be material.
For 2010, based on budgeted prices and the current availability of tax pools, the Company expects to incur current income tax expense in Canada of $450 million to $550 million and in the North Sea and Offshore West Africa of $220 million to $260 million.
NET CAPITAL EXPENDITURES (1)
| ($ millions) | | 2009 | | | 2008 | | | 2007 | |
| Expenditures on property, plant and equipment | | | | | | | | | |
| Net property acquisitions (dispositions) | | $ | 6 | | | $ | 336 | | | $ | (39 | ) |
| Land acquisition and retention | | | 77 | | | | 86 | | | | 95 | |
| Seismic evaluations | | | 73 | | | | 107 | | | | 124 | |
| Well drilling, completion and equipping | | | 1,244 | | | | 1,664 | | | | 1,642 | |
| Production and related facilities | | | 977 | | | | 1,282 | | | | 1,205 | |
| Total net reserve replacement expenditures | | | 2,377 | | | | 3,475 | | | | 3,027 | |
| Oil Sands Mining and Upgrading: | | | | | | | | | | | | |
| Horizon Phase 1 construction costs | | | 69 | | | | 2,732 | | | | 2,740 | |
| Horizon Phase 1 commissioning costs and other | | | 202 | | | | 364 | | | | – | |
| Horizon Phases 2/3 construction costs | | | 104 | | | | 336 | | | | 124 | |
| Capitalized interest, stock-based compensation and other | | | 98 | | | | 480 | | | | 437 | |
| Sustaining capital | | | 80 | | | | – | | | | – | |
Total Oil Sands Mining and Upgrading (2) | | | 553 | | | | 3,912 | | | | 3,301 | |
| Midstream | | | 6 | | | | 9 | | | | 6 | |
Abandonments (3) | | | 48 | | | | 38 | | | | 71 | |
| Head office | | | 13 | | | | 17 | | | | 20 | |
| Total net capital expenditures | | $ | 2,997 | | | $ | 7,451 | | | $ | 6,425 | |
| By segment | | | | | | | | | | | | |
| North America | | $ | 1,663 | | | $ | 2,344 | | | $ | 2,428 | |
| North Sea | | | 168 | | | | 319 | | | | 439 | |
| Offshore West Africa | | | 544 | | | | 811 | | | | 159 | |
| Other | | | 2 | | | | 1 | | | | 1 | |
| Oil Sands Mining and Upgrading | | | 553 | | | | 3,912 | | | | 3,301 | |
| Midstream | | | 6 | | | | 9 | | | | 6 | |
Abandonments (3) | | | 48 | | | | 38 | | | | 71 | |
| Head office | | | 13 | | | | 17 | | | | 20 | |
| Total | | $ | 2,997 | | | $ | 7,451 | | | $ | 6,425 | |
(1) Net capital expenditures exclude adjustments related to differences between carrying value and tax value, and other fair value adjustments.
(2) Net expenditures for Oil Sands Mining and Upgrading assets also include the impact of intersegment eliminations.
(3) Abandonments represent expenditures to settle ARO and have been reflected as capital expenditures in this table.
The Company’s operating strategy is focused on building a diversified asset base that is balanced among various products. In order to facilitate efficient operations, the Company concentrates its activities in core regions where it can dominate the land base and infrastructure. The Company focuses on maintaining its land inventories to enable the continuous exploitation of play types and geological trends, greatly reducing overall exploration risk. By dominating infrastructure, the Company is able to maximize utilization of its production facilities, thereby increasing control over production costs.
Net capital expenditures for 2009 were $2,997 million compared to $7,451 million for 2008 (2007 – $6,425 million). The decrease in capital expenditures from the prior year reflects the completion of Horizon Phase 1 construction. Capital expenditures were also impacted by the effects of an overall strategic reduction in the North America natural gas drilling program.
Drilling Activity (number of wells)
| | 2009 | 2008 | 2007 |
| Net successful natural gas wells | 109 | 269 | 383 |
| Net successful crude oil wells | 644 | 682 | 592 |
| Dry wells | 46 | 39 | 93 |
| Stratigraphic test / service wells | 329 | 131 | 254 |
| Total | 1,128 | 1,121 | 1,322 |
| Success rate (excluding stratigraphic test / service wells) | 94% | 96% | 91% |
North America
North America, excluding Oil Sands Mining and Upgrading, accounted for approximately 58% of the total capital expenditures for the year ended December 31, 2009 compared to approximately 32% for 2008 (2007 – 39%).
During 2009, the Company targeted 117 net natural gas wells, including 21 wells in Northeast British Columbia, 39 wells in the Northern Plains region, 47 wells in Northwest Alberta, and 10 wells in the Southern Plains region. The Company also targeted 676 net crude oil wells during the year. The majority of these wells were concentrated in the Company’s crude oil Northern Plains region where 496 primary heavy crude oil wells, 60 Pelican Lake crude oil wells, 82 thermal crude oil wells and 2 light crude oil wells were drilled. Another 36 wells targeting light crude oil were drilled outside the Northern Plains region.
The Company continued to access its large crude oil drilling inventory to maximize value in both the short and long term. Due to the Company’s focus on drilling crude oil wells in recent years, a low natural gas price, and as a result of royalty changes under the ARF, natural gas drilling activities have been reduced. Deferred natural gas well locations have been retained in the Company’s prospect inventory.
As part of the phased expansion of its In-Situ Oil Sands Assets, the Company is continuing to develop its Primrose thermal projects. During 2009, the Company drilled 82 thermal oil wells, and 36 stratigraphic test wells and observation wells. Overall Primrose thermal production for 2009 was approximately 64,000 bbl/d (2008 – 65,000 bbl/d; 2007 – 64,000 bbl/d). The Primrose East Expansion, a new facility located 15 kilometers from the existing Primrose South steam plant and 25 kilometers from the Wolf Lake central processing facility, was completed and first steaming commenced in September 2008, with first production achieved in the fourth quarter of 2008. During the first quarter of 2009, operational issues on one of the pads caused steaming to cease on all well pads in the Primrose East project area. During 2009, upon receipt of reg ulatory approval, the Company began diagnostic steaming and is continuing to work on resolving the issue.
The next planned phase of the Company’s In-Situ Oil Sands Assets expansion is the Kirby project located 120 kilometers north of the existing Primrose facilities. During 2007, the Company filed a combined application and Environmental Impact Assessment for this project with Alberta Environment and the Alberta Energy and Utilities Board. Final corporate sanction and project scope is targeted for late 2010. Currently, the Company is proceeding with the detailed engineering and design work.
Development of new pads and tertiary recovery conversion projects at Pelican Lake continued as expected throughout 2009. Drilling consisted of 60 horizontal crude oil wells, with plans to drill 147 additional horizontal crude oil wells in 2010. The response from the water and polymer flood projects continues to be positive. Pelican Lake production averaged approximately 37,000 bbl/d in 2009 (2008 – 37,000 bbl/d; 2007 – 34,000 bbl/d).
For 2010, the Company’s overall drilling activity in North America is expected to comprise approximately 93 natural gas wells and 956 crude oil wells, excluding stratigraphic and service wells.
Oil Sands Mining and Upgrading
With construction completed, Horizon Phase 1 assets are now available for their intended use. Accordingly, capitalization of all associated development costs, including capitalized interest and stock-based compensation, and all directly attributable Phase 1 administrative costs ceased, and depletion, depreciation and amortization of these assets commenced.
Production was lower than anticipated due to a number of challenges encountered in the third and fourth quarter. The challenges primarily relate to:
| · | Premature equipment failures in the Ore Preparation Plant, Primary Upgrading, the Naphtha Recovery Unit and the Sulphur Plant; |
| · | Ore processing challenges arising in September resulting from a higher percentage of clays in the second mine bench and the lack of available blending materials from other mine benches associated with early mine operations; and |
| · | Equipment failure in the hydrogen plant requiring a shutdown for an extended period to time, and issues with one of the coker furnaces. |
Engineering and procurement is underway for Tranche 2 of the Phase 2/3 expansion with a focus on increasing reliability and uptime. Tranches 3 and 4 of Phase 2/3 continue to be re-profiled. The Company continues to work on completing its lessons learned from the construction of Phase 1 and implementing these into the development of future expansions.
North Sea
During 2009, the Company drilled 0.9 net oil wells and 0.3 net exploration wells at Deep Banff, which did not find commercial reserves. Focus continued on lowering costs and high grading infill drilling opportunities ahead of the planned restart of platform drilling operations in the second quarter of 2010.
The Company also completed planned maintenance turnarounds at four of its five Platform installations on time and on budget.
Offshore West Africa
The Company drilled 6.1 net wells during 2009.
The Company completed the Baobab drilling program in the first quarter of 2009, adding approximately 10,000 bbl/d net to the Company.
Progress on the Facility Upgrade Project at Espoir to increase processing capacity of the Floating Production Storage and Offtake Vessel (“FPSO”) has reverted to the original schedule to accommodate effective utilization of the installation vessel at Olowi.
LIQUIDITY AND CAPITAL RESOURCES
| ($ millions, except ratios) | | 2009 | | | 2008 | | | 2007 | |
Working capital (deficit) (1) | | $ | (514 | ) | | $ | 392 | | | $ | (1,382 | ) |
Long-term debt (2) (3) | | $ | 9,658 | | | $ | 13,016 | | | $ | 10,940 | |
| | | | | | | | | | | | | |
| Shareholders’ equity | | | | | | | | | | | | |
| Share capital | | $ | 2,834 | | | $ | 2,768 | | | $ | 2,674 | |
| Retained earnings | | | 16,696 | | | | 15,344 | | | | 10,575 | |
| Accumulated other comprehensive (loss) income | | | (104 | ) | | | 262 | | | | 72 | |
| Total | | $ | 19,426 | | | $ | 18,374 | | | $ | 13,321 | |
| | | | | | | | | | | | | |
Debt to book capitalization (3) (4) | | | 33 | % | | | 41 | % | | | 45 | % |
Debt to market capitalization (3) (5) | | | 19 | % | | | 33 | % | | | 22 | % |
After tax return on average common shareholders’ equity (6) | | | 8 | % | | | 33 | % | | | 22 | % |
After tax return on average capital employed (3) (7) | | | 6 | % | | | 19 | % | | | 12 | % |
(1) Calculated as current assets less current liabilities, excluding the current portion of long-term debt.
(2) Includes the current portion of long-term debt (2009 – $nil; 2008 – $420 million; 2007 – $nil).
(3) Long-term debt at December 31, 2009 and 2008 is stated at its carrying value, net of fair value adjustments, original issue discounts and transaction costs.
(4) Calculated as current and long-term debt; divided by the book value of common shareholders’ equity plus current and long-term debt.
(5) Calculated as current and long-term debt; divided by the market value of common shareholders’ equity plus current and long-term debt.
(6) Calculated as net earnings for the year; as a percentage of average common shareholders’ equity for the year.
(7) Calculated as net earnings plus after-tax interest expense for the year; as a percentage of average capital employed. Average capital employed is the average shareholders’ equity and current and long-term debt for the year, including $12,855 million in average capital employed related to the Horizon Oil Sands (2008 – $10,678 million; 2007 – $7,001 million).
At December 31, 2009, the Company’s capital resources consisted primarily of cash flow from operations, available bank credit facilities and access to debt capital markets. Cash flow from operations is dependent on factors discussed in the “Risks and Uncertainties” section of this MD&A. The Company’s ability to renew existing bank credit facilities and raise new debt is also dependent upon these factors, as well as maintaining an investment grade debt rating and the condition of capital and credit markets. The Company continues to believe that its internally generated cash flow from operations supported by the implementation of its on-going hedge policy, the flexibility of its capital expenditure programs supported by its multi-year financial plans, its existing bank credit facilities, and its ability to raise new deb t on commercially acceptable terms, will provide sufficient liquidity to sustain its operations in the short, medium and long term and support its growth strategy.
During 2009, the Company repaid $2,350 million remaining on the non-revolving syndicated credit facility related to the acquisition of Anadarko Canada Corporation and cancelled the facility. At December 31, 2009, the Company had $2,004 million of available credit under its bank credit facilities. The Company’s current debt ratings are BBB (high) with a stable trend by DBRS Limited, Baa2 with a stable outlook by Moody’s Investors Service and BBB with a stable outlook by Standard & Poor’s.
Further details related to the Company’s long-term debt at December 31, 2009 are discussed below and in note 5 to the Company’s audited annual consolidated financial statements.
Long-term debt was $9,658 million at December 31, 2009, resulting in a debt to book capitalization level of 33% as at December 31, 2009 (December 31, 2008 – 41%; December 31, 2007 – 45%). This ratio is below the 35% to 45% range targeted by management. The Company remains committed to maintaining a strong balance sheet and flexible capital structure. The Company has hedged a portion of its crude oil and natural gas production for 2010 at prices that protect investment returns to ensure ongoing balance sheet strength and the completion of its capital expenditure programs.
During 2009, the Company filed new base shelf prospectuses that allow for the issue of up to $3,000 million of medium-term notes in Canada and US$3,000 million of debt securities in the United States until November 2011. If issued, these securities will bear interest as determined at the date of issuance.
The Company’s commodity hedging program reduces the risk of volatility in commodity prices and supports the Company’s cash flow for its capital expenditures programs. This program currently allows for the hedging of up to 60% of the near 12 months budgeted production and up to 40% of the following 13 to 24 months estimated production. For the purpose of this program, the purchase of crude oil put options is in addition to the above parameters. As at December 31, 2009, in accordance with the policy, approximately 39% of budgeted crude oil and approximately 17% of budgeted natural gas volumes were hedged using collars for 2010.
Further details related to the Company’s commodity related derivative financial instruments outstanding at December 31, 2009, are discussed in note 13 to the Company’s audited annual consolidated financial statements.
Share Capital
As at December 31, 2009, there were 542,327,000 common shares outstanding and 32,106,000 stock options outstanding. As at March 3, 2010, the Company had 542,655,000 common shares outstanding and 30,702,000 stock options outstanding.
The Company did not renew its Normal Course Issuer Bid during 2009. During 2008 and 2009, the Company did not purchase any common shares for cancellation under the programs then in place.
On March 3, 2010, the Company’s Board of Directors approved an increase in the annual dividend declared by the Company to $0.60 per common share for 2010. The increase represents a 43% increase from the prior year. The dividend policy undergoes a periodic review by the Board of Directors and is subject to change. In March 2009, an increase in the annual dividend paid by the Company to $0.42 per common share was approved for 2009. The increase represented a 5% increase from 2008.
On March 3, 2010 the Board of Directors approved a resolution to file with the Toronto Stock Exchange a Notice of Intention to purchase by way of normal course issuer bid up to 2.5% of the Company’s issued and outstanding common shares. Subject to acceptance by the Toronto Stock Exchange of the Notice of Intention, the purchases would be made through the facilities of the Toronto Stock Exchange and the New York Stock Exchange.
Share Split
On March 3, 2010, the Company’s Board of Directors approved a resolution to subdivide the Company’s common shares on a two for one basis, subject to shareholder approval. The proposal will be voted on at the Company’s Annual and Special Meeting of Shareholders to be held on May 6, 2010.
COMMITMENTS AND OFF BALANCE SHEET ARRANGEMENTS
In the normal course of business, the Company has entered into various commitments that will have an impact on the Company’s future operations. These commitments primarily relate to firm commitments for gathering, processing and transmission services; operating leases relating to offshore FPSOs, drilling rigs and office space; expenditures relating to ARO; as well as long-term debt and interest payments. As at December 31, 2009, no entities were consolidated under CICA Handbook Accounting Guideline 15, “Consolidation of Variable Interest Entities”. The following table summarizes the Company’s commitments as at December 31, 2009:
| ($ millions) | | 2010 | | | 2011 | | | 2012 | | | 2013 | | | 2014 | | | Thereafter | |
| Product transportation and pipeline | | $ | 207 | | | $ | 162 | | | $ | 136 | | | $ | 125 | | | $ | 126 | | | $ | 1,051 | |
| Offshore equipment operating lease | | $ | 155 | | | $ | 124 | | | $ | 103 | | | $ | 102 | | | $ | 101 | | | $ | 261 | |
| Offshore drilling | | $ | 49 | | | $ | – | | | $ | – | | | $ | – | | | $ | – | | | $ | – | |
Asset retirement obligations (1) | | $ | 16 | | | $ | 20 | | | $ | 21 | | | $ | 31 | | | $ | 39 | | | $ | 6,479 | |
Long-term debt (2) | | $ | 400 | | | $ | 419 | | | $ | 366 | | | $ | 819 | | | $ | 366 | | | $ | 5,424 | |
Interest expense (3) | | $ | 473 | | | $ | 451 | | | $ | 415 | | | $ | 370 | | | $ | 350 | | | $ | 4,779 | |
| Office leases | | $ | 25 | | | $ | 19 | | | $ | 3 | | | $ | 2 | | | $ | 2 | | | $ | – | |
| Other | | $ | 271 | | | $ | 67 | | | $ | 23 | | | $ | 15 | | | $ | 12 | | | $ | 34 | |
(1) Amounts represent management’s estimate of the future undiscounted payments to settle ARO related to resource properties, facilities, and production platforms, based on current legislation and industry operating practices. Amounts disclosed for the period 2010 – 2014 represent the minimum required expenditures to meet these obligations. Actual expenditures in any particular year may exceed these minimum amounts.
(2) The long-term debt represents principal repayments only and does not reflect fair value adjustments, original issue discounts or transaction costs. No debt repayments are reflected for $1,897 million of revolving bank credit facilities due to the extendable nature of the facilities.
(3) Interest expense amounts represent the scheduled fixed rate and variable rate cash payments related to long-term debt. Interest on variable rate long-term debt was estimated based upon prevailing interest rates as of December 31, 2009.
LEGAL PROCEEDINGS
The Company is defendant and plaintiff in a number of legal actions. In addition, the Company is subject to certain contractor construction claims. The Company believes that any liabilities that might arise pertaining to any such matters would not have a material effect on its consolidated financial position.
RESERVES
For the year ended December 31, 2009, the Company retained qualified independent reserves evaluators, Sproule Associates Limited (“Sproule”), and GLJ Petroleum Consultants Ltd. (“GLJ”), to evaluate and review all of the Company’s proved, as well as probable crude oil, synthetic crude oil, bitumen, natural gas, coal bed methane, and NGLs reserves and prepare Evaluation Reports on these reserves. Sproule evaluated and reviewed all of the Company’s crude oil, bitumen, natural gas, coal bed methane and NGLs reserves. GLJ evaluated all of the synthetic crude oil reserves related to the Company’s oil sands mine. The Company has been granted an exemption from certain provisions of National Instrument 51-101 – “Standa rds of Disclosure for Oil and Gas Activities” (“NI 51-101”), which prescribes the standards for the preparation and disclosure of reserves and related information for companies listed in Canada. This exemption allows the Company to substitute SEC requirements, under Regulations S-K and S-X, for certain disclosures required under NI 51-101. On December 31, 2008, the SEC released its final rules for the modernization of oil and gas reporting (“Final Rule”). The material changes include the ability to include oil sands mining as an oil and gas activity, ability to use reliable technology to establish undeveloped reserves, the optional ability to report probable reserves, the requirement to track undeveloped locations, and the directive to use 12–month average price and current costs. These resulting changes are more in line with NI 51-101; however, there are material differences to the type of volumes disclosed and the basis from which the volumes are determined. NI 51-101 re quires gross reserves and future net revenue under forecast pricing and costs, however, the SEC, as discussed, requires disclosure of net reserves, after royalties, using 12–month average prices and current costs. Therefore the difference between the reported numbers, under the two disclosure standards can be material.
The Company annually discloses proved reserves and the standardized measure of discounted future net cash flows using 12–month average prices and current costs as mandated by the SEC in the supplementary oil and gas information section of the Company’s Annual Report and in its annual Form 40-F filing with the SEC.
The following tables summarize the Company’s proved crude oil and natural gas reserves, net of royalties, as at December 31, 2009 and 2008:
| Crude oil and NGLs (mmbbl) | Synthetic
Crude
Oil (1) | Bitumen (2) | Other Oil & NGLs | North
America
Total | North Sea | Offshore West Africa | Total |
| | | | | | | | |
| Net proved reserves | | | | | | | |
| Reserves, December 31, 2008 | – | 690 | 258 | 948 | 256 | 142 | 1,346 |
| Extensions and discoveries | – | 24 | 6 | 30 | – | – | 30 |
| Improved recovery | – | 8 | 75 | 83 | – | – | 83 |
SEC Reliable Technology (3) | – | 7 | – | 7 | – | – | 7 |
SEC Rule Transition (4) | 1,650 | – | – | 1,650 | – | – | 1,650 |
| Purchases of reserves in place | – | – | 1 | 1 | – | – | 1 |
| Sales of reserves in place | – | – | – | – | – | – | – |
| Production | – | (49) | (24) | (73) | (14) | (11) | (98) |
| Economic revisions due to prices | – | (64) | (8) | (72) | 57 | (4) | (19) |
| Revisions of prior estimates | – | 79 | 11 | 90 | (59) | (4) | 27 |
| Reserves, December 31, 2009 | 1,650 | 695 | 319 | 2,664 | 240 | 123 | 3,027 |
| | (1) Prior to December 31, 2009, the Company’s Horizon SCO reserves were reported separately in accordance with SEC’s Industry Guide 7. With SEC’s Final Rule in effect January 1, 2010, this synthetic crude oil is now included in the Company’s crude oil and natural gas reserve totals. |
| | (2) Bitumen as defined by the SEC, under the Final Rule, “is petroleum in a solid or semi-solid state in natural deposits with a viscosity greater than 10,000 centipoise measured at original temperature in the deposit and atmospheric pressure, on a gas free basis.” Under this definition, all the Company’s thermal and primary heavy crude oil reserves have been included. Prior to December 31, 2009, these numbers would have been included within the Company’s conventional crude oil and NGL totals. |
| | (3) SEC reliable technology accounts for reserve volumes added due to the reserve rule changes. |
| | (4) For continuity purposes, with respect to the transition from Industry Guide 7 into SEC’s Final Rule, the following SCO table has been provided to illustrate the changes in the Company’s Horizon SCO reserves for the 2009 year. |
| | Horizon SCO reserves (mmbbl) | Net Proved (mmbl) |
| | Reserves, December 31, 2008 | 1,946 |
| | Production | (18) |
| | Economic revisions due to prices | (307) |
| | Revisions of prior estimates | 29 |
| | Reserves, December 31, 2009 | 1,650 |
| Natural gas (bcf) | North America | North Sea | Offshore West Africa | Total |
| Net proved reserves | | | | |
| Reserves, December 31, 2008 | 3,523 | 67 | 94 | 3,684 |
| Extensions and discoveries | 92 | – | – | 92 |
| Improved recovery | 11 | – | – | 11 |
| SEC Reliable Technology | – | – | – | – |
| Purchases of reserves in place | 15 | – | – | 15 |
| Sales of reserves in place | (6) | – | – | (6) |
| Production | (443) | (4) | (6) | (453) |
| Economic revisions due to prices | (335) | 12 | (4) | (327) |
| Revisions of prior estimates | 170 | (8) | 1 | 163 |
| Reserves, December 31, 2009 | 3,027 | 67 | 85 | 3,179 |
The Company’s net proved crude oil and NGLs reserves at December 31, 2009, excluding synthetic crude oil, totaled 1,377 mmbbl. Approximately 132% of the production was replaced by reserve additions and revisions during 2009. Additions resulting from exploration and development and acquisition activities amounted to 121 mmbbl, while net positive revisions amounted to 8 mmbbl.
The Company’s net proved natural gas reserves, net of royalties, at December 31, 2009 totaled 3,179 bcf. Additions related to exploration, development, acquisition and dispostion activities amounted to 112 bcf, while net negative revisions amounted to 164 bcf. This net loss is largely due to the change in price from year end 2008 to year end 2009.
The Reserves Committee of the Company’s Board of Directors has met with and carried out independent due diligence procedures with each of Sproule and GLJ to review the qualifications of and procedures used by each evaluator in determining the estimate of the Company’s quantities and net present value of remaining synthetic crude oil, crude oil, NGLs and natural gas reserves.
Additional reserves disclosure is annually disclosed in the supplementary oil and gas information of the Company’s Annual Report.
RISKS AND UNCERTAINTIES
The Company is exposed to various operational risks inherent in exploring, developing, producing and marketing crude oil and natural gas and the mining and upgrading of bitumen into SCO. These inherent risks include, but are not limited to, the following items:
| · | Economic risk of finding, producing and replacing reserves at a reasonable cost, including the risk of reserve revisions due to economic and technical factors. Reserve revisions can have a positive or negative impact on asset valuations, ARO and depletion rates; |
| · | Prevailing prices of crude oil and NGLs, and natural gas; |
| · | Regulatory risk related to approval for exploration and development activities, which can add to costs or cause delays in projects; |
| · | Labour risk associated with securing the manpower necessary to complete capital projects in a timely and cost effective manner; |
| · | Operating hazards and other difficulties inherent in the exploration for and production and sale of crude oil and natural gas; |
| · | Success of exploration and development activities; |
| · | Timing and success of integrating the business and operations of acquired companies; |
| · | Credit risk related to non-payment for sales contracts or non-performance by counterparties to contracts; |
| · | Interest rate risk associated with the Company’s ability to secure financing on commercially acceptable terms; |
| · | Foreign exchange risk due to fluctuating exchange rates on the Company’s US dollar denominated debt and as the majority of sales are based in US dollars; |
| · | Environmental impact risk associated with exploration and development activities, including GHG; |
| · | Risk of catastrophic loss due to fire, explosion or acts of nature; |
| · | Geopolitical risks associated with changing governmental policies, social instability and other political, economic or diplomatic developments in the Company’s operations; |
| · | Future legislative and regulatory developments related to environmental regulation; |
| · | The ability to replace reserves of oil and gas, whether sourced from exploration, improved recovery or acquisition; |
| · | Potential actions of governments, regulatory authorities and other stakeholders that may impose operating costs or restrictions in the jurisdations where the Company has operations; |
| · | Changing royalty regimes; |
| · | Business interruptions because of unexpected events such as fires, blowouts, freeze-ups, equipment failures and other similar events affecting the Company or other parties whose operations or assets directly or indirectly affect the Company and that may or may not be financially recoverable; and |
| · | Other circumstances affecting revenue and expenses. |
The Company uses a variety of means to help mitigate and/or minimize these risks. The Company maintains a comprehensive property loss and business interruption insurance program to reduce risk to an acceptable level. Operational control is enhanced by focusing efforts on large core areas with high working interests and by assuming operatorship of key facilities. Product mix is diversified, consisting of the production of natural gas and the production of crude oil of various grades. The Company believes this diversification reduces price risk when compared with over-leverage to one commodity. Accounts receivable from the sale of crude oil and natural gas are mainly with customers in the crude oil and natural gas industry and are subject to normal industry credit risks. The Company manages these risks by reviewing its exposure to individual compa nies on a regular basis and where appropriate, ensures that parental guarantees or letters of credit are in place to minimize the impact in the event of default. Substantially all of the Company’s accounts receivables are due within normal trade terms. Derivative financial instruments are utilized to help ensure targets are met and to manage commodity prices, foreign currency rates and interest rate exposure. The Company is exposed to possible losses in the event of non-performance by counterparties to derivative financial instruments; however, the Company manages this credit risk by
entering into agreements with substantially all investment grade financial institutions and other entities. The arrangements and policies concerning the Company’s financial instruments are under constant review and may change depending upon the prevailing market conditions.
The Company’s capital structure mix is also monitored on a continual basis to ensure that it optimizes flexibility, minimizes cost and offers the greatest opportunity for growth. This includes the determination of a reasonable level of debt and any interest rate exposure risk that may exist.
For additional detail regarding the Company’s risks and uncertainties, refer to the Company’s Annual Information Form.
ENVIRONMENT
The Company continues to invest in people, technologies, facilities and infrastructure to recover and process crude oil and natural gas resources efficiently and in an environmentally sustainable manner.
The crude oil and natural gas industry is experiencing incremental increases in costs related to environmental regulation, particularly in North America and the North Sea. Existing and expected legislation and regulations require the Company to address and mitigate the effect of its activities on the environment. Increasingly stringent laws and regulations may have an adverse effect on the Company’s future net earnings and cash flow from operations.
The Company’s associated environmental risk management strategies focus on working with legislators and regulators to ensure that any new or revised policies, legislation or regulations properly reflect a balanced approach to sustainable development. Specific measures in response to existing or new legislation include a focus on the Company’s energy efficiency, air emissions management, released water quality, reduced fresh water use and the minimization of the impact on the landscape. Training and due diligence for operators and contractors are key to the effectiveness of the Company’s environmental management programs and the prevention of incidents. The Company’s environmental risk management strategies employ an Environmental Management Plan (the “Plan”). Details of the Plan, along with performance results , are presented to, and reviewed by, the Board of Directors quarterly.
The Company’s Plan and operating guidelines focus on minimizing the impact of operations while meeting regulatory requirements, regional management frameworks, industry operating standards and guidelines, and internal corporate standards. The Company, as part of this Plan, has implemented a proactive program that includes:
| · | An internal environmental compliance audit and inspection program of the Company’s operating facilities; |
| · | A suspended well inspection program to support future development or eventual abandonment; |
| · | Appropriate reclamation and decommissioning standards for wells and facilities ready for abandonment; |
| · | An effective surface reclamation program; |
| · | A due diligence program related to groundwater monitoring; |
| · | An active program related to preventing and reclaiming spill sites; |
| · | A solution gas conservation program; |
| · | A program to replace the majority of fresh water for steaming with brackish water; |
| · | Water programs to improve efficiency of use, recycle rates and water storage; |
| · | Environmental planning for all projects to assess impacts and to implement avoidance and mitigation programs; |
| · | Reporting for environmental liabilities; |
| · | A program to optimize efficiencies at the Company’s operating facilities; |
| · | Continued evaluation of new technologies to reduce environmental impacts; |
| · | Development and implementation of a tailings management plan; and |
| · | CO2 reduction programs including the injection of CO2 into tailings and for use in enhanced oil recovery. |
For 2009, the Company’s capital expenditures included $48 million for abandonment expenditures (2008 – $38 million; 2007 – $71 million).
The Company’s estimated undiscounted ARO at December 31, 2009 was as follows:
| Estimated ARO, undiscounted ($ millions) | | 2009 | | | 2008 | |
| North America, Conventional | | $ | 3,346 | | | $ | 3,072 | |
North America, Oil Sands Mining and Upgrading (1) | | | 1,485 | | | | 93 | |
| North Sea | | | 1,522 | | | | 1,216 | |
| Offshore West Africa | | | 253 | | | | 93 | |
| | | | 6,606 | | | | 4,474 | |
| North Sea PRT recovery | | | (568 | ) | | | (529 | ) |
| | | $ | 6,038 | | | $ | 3,945 | |
(1) Prior period amounts have been reclassified to conform to the presentation adopted in 2009.
The estimate of ARO is based on estimates of future costs to abandon and restore wells, production facilities and offshore production platforms. Factors that affect costs include number of wells drilled, well depth and the specific environmental legislation. The estimated costs are based on engineering estimates using current costs in accordance with present legislation and industry operating practice. The Company’s strategy in the North Sea consists of developing commercial hubs around its core operated properties with the goal of increasing production, lowering costs and extending the economic lives of its production facilities, thereby delaying the eventual abandonment dates. The future abandonment costs incurred in the North Sea are estimated to result in a PRT recovery of $568 million (2008 – $529 million; 2007 – $555 mill ion), as abandonment costs are an allowable deduction in determining PRT and may be carried back to reclaim PRT previously paid. The expected PRT recovery reduces the Company’s net undiscounted abandonment liability to $6,038 million (2008 – $3,945 million).
GREENHOUSE GAS AND OTHER AIR EMISSIONS
The Company, through the Canadian Association of Petroleum Producers (“CAPP”), is working with legislators and regulators as they develop and implement new GHG emission laws and regulations. Internally, the Company is pursuing an integrated emissions reduction strategy, to ensure that it is able to comply with existing and future emissions reduction requirements, for both GHGs and air pollutants (such as sulphur dioxide and oxides of nitrogen). The Company continues to develop strategies that will enable it to deal with the risks and opportunities associated with new GHG and air emissions policies. In addition, the Company is working with relevant parties to ensure that new policies encourage technological innovation, energy efficiency, targeted research and development while not impacting competitiveness.
In Canada, the Federal Government has indicated its intent to develop regulations that would be in effect in the near term to address industrial GHG emissions, as part of the national GHG reduction target. The Federal Government has also outlined national and sectoral reduction targets for several categories of air pollutants.
In Alberta, GHG reduction regulations came into effect July 1, 2007, affecting facilities emitting more than 100 kilotonnes of CO2e annually. Two of the Company’s facilities, the Primrose/Wolf Lake in-situ heavy crude oil facilities and the Hays sour natural gas plant, fall under the regulations. The British Columbia carbon tax is currently being assessed at $15/tonne of CO2e on fuel consumed and gas flared in the province. This rate is scheduled to increase to $20/tonne on July 1, 2010, and to $30/tonne by July 1, 2012. As part of its involvement with the Western Climate Initiative, British Columbia has also announced that certain upstream oil and gas facilities will be included in a regional cap and trade system beginning in 2012. It is estimated that six facilities in British Columbia will be included under the cap and trade system, based on a proposed 25 kt CO2e threshold. Saskatchewan is expected to release GHG regulations in 2010 that may require the North Tangleflags in-situ heavy oil facility to meet a reduction target for its GHG emissions intensity. In the UK, GHG regulations have been in effect since 2005. During Phase 1 (2005 – 2007) of the UK National Allocation Plan, the Company operated below its CO2 allocation. For Phase 2 (2008 – 2012) the Company’s CO2 allocation has been decreased below the Company’s estimated current operations emissions. The Company continues to focus on implementing reduction programs based on efficiency audits to red uce CO2 emissions at its major facilities and on trading mechanisms to ensure compliance with requirements now in effect.
Legislation to regulate GHGs in the United States through a cap and trade system is currently before the US Congress, although there is no certainty as to the form or stringency of the final legislation. In the absence of legislation, the US Environmental Protection Agency (EPA) is authorized under the Clean Air Act to regulate GHGs, although EPA action would be subject to legal and political challenges. The ultimate form of Canadian regulation is anticipated to be strongly influenced by the regulatory decisions made within the US. Various states have enacted or are evaluating low carbon fuel standards, which may affect access to market for crude oil with higher emissions intensity.
There are a number of unresolved issues in relation to Canadian Federal and Provincial GHG regulatory requirements. Key among them is the form of regulation, an appropriate facility emission threshold, availability and duration of compliance mechanisms, and resolution of federal/provincial harmonization agreements. The Company continues to pursue GHG emission reduction initiatives including solution gas conservation, compressor optimization to improve fuel gas efficiency, CO2 capture and sequestration in oil sands tailings, CO2 capture and storage in association with enhanced oil recovery, and participation in an industry initiative to promote an integrated CO2 capture and storage network.
The additional requirements of enacted or proposed GHG regulations on the Company’s operations will increase capital expenditures and operating expenses, especially those related to the Horizon Project and the Company’s other existing and planned large oil sands projects. This may have an adverse effect on the Company’s net earnings and cash flow from operations.
Air pollutant standards and guidelines are being developed federally and provincially and the Company is participating in these discussions. Ambient air quality and sector based reductions in air emissions are being reviewed. Through Company and industry participation with stakeholders, guidelines have been developed that adopt a structured process to emission reductions that is commensurate with technological development and operational requirements.
CRITICAL ACCOUNTING ESTIMATES
The preparation of financial statements requires the Company to make judgments, assumptions and estimates in the application of Canadian GAAP that have a significant impact on the financial results of the Company. Actual results may differ from those estimates, and those differences may be material. Critical accounting estimates are reviewed by the Company’s Audit Committee annually. The Company believes the following are the most critical accounting estimates in preparing its consolidated financial statements.
Property, Plant and Equipment / Depletion, Depreciation and Amortization
Under Canadian GAAP, the Company follows the CICA’s guideline on the full cost method of accounting for its conventional crude oil and natural gas properties and equipment. Accordingly, all costs relating to the exploration for and development of conventional crude oil and natural gas reserves, whether successful or not, are capitalized and accumulated in country-by-country cost centres. Proceeds on disposal of properties are ordinarily deducted from such costs without recognition of a gain or loss except where such dispositions result in a change in the depletion rate of the specific cost centre of 20% or more. Under Canadian GAAP, substantially all of the capitalized costs and estimated future capital costs related to each cost centre from which there is production are depleted on the unit-of-production method based on the estimated prov ed reserves of that country using estimated future prices and costs, rather than constant prices and costs as required by the SEC for US GAAP purposes.
Under Canadian GAAP, the carrying amount of crude oil and natural gas properties in each cost centre may not exceed their recoverable amount (“the ceiling test”). The recoverable amount is calculated as the undiscounted cash flow using proved reserves and estimated future prices and costs. If the carrying amount of a cost centre exceeds its recoverable amount, an impairment loss equal to the amount by which the carrying amount of the properties exceeds their estimated fair value is charged against net earnings. Fair value is calculated as the cash flow from those properties using proved and probable reserves and estimated future prices and costs, discounted at a risk-free interest rate. At December 31, 2009, a ceiling test impairment of $115 million was recognized under Canadian GAAP related to the Olowi Field in Offshore Gabon. Furt her, net revenues exceed capitalized costs for all other cost centres; therefore, no other impairments were required under Canadian GAAP. Under US GAAP, the ceiling test differs from Canadian GAAP in that future net revenues from proved reserves are based on prices and costs using the average first-day-of-the-month price during the previous twelve-month period and costs as at the balance sheet date and are discounted at 10%. Capitalized costs and future net revenues are determined on a net of tax basis. These differences in applying the ceiling test in the current year resulted in the recognition of an after-tax ceiling test impairment of $815 million under US GAAP.
The alternate acceptable method of accounting for crude oil and natural gas properties and equipment is the successful efforts method. A major difference in applying the successful efforts method is that exploratory dry holes and geological and geophysical exploration costs would be charged against net earnings in the year incurred rather than being capitalized to property, plant and equipment. In addition, under this method, cost centres are defined based on reserve pools rather than by country. The use of the full cost method usually results in higher capitalized costs and increased DD&A rates compared to the successful efforts method.
Crude Oil and Natural Gas Reserves
The estimation of reserves involves the exercise of judgment. Forecasts are based on engineering data, estimated future prices, expected future rates of production and the timing of future capital expenditures, all of which are subject to many uncertainties and interpretations. The Company expects that over time its reserve estimates will be revised either upward or downward based on updated information such as the results of future drilling, testing and production levels. Reserve estimates can have a significant impact on net earnings, as they are a key component in the calculation of depletion, depreciation and amortization and for determining potential asset impairment. For example, a revision to the proved reserve estimates would result in a higher or lower DD&A charge to net earnings. Downward revisions to reserve estimates may also res ult in an impairment of crude oil and natural gas property, plant and equipment carrying amounts under the ceiling test.
Asset Retirement Obligations
Under CICA Handbook Section 3110, “Asset Retirement Obligations”, the Company is required to recognize a liability for the future retirement obligations associated with its property, plant and equipment. An ARO liability associated with the retirement of a tangible long-lived asset is recognized to the extent of a legal obligation resulting from an existing or enacted law, statute, ordinance or written or oral contract, or by legal construction of a contract under the doctrine of promissory estoppel. The ARO is based on estimated costs, taking into account the anticipated method and extent of restoration consistent with legal requirements, technological advances and the possible use of the site. Since these estimates are specific to the sites involved, there are many individual assumptions underlying the Company’s total ARO amo unt. These individual assumptions can be subject to change.
The estimated fair values of ARO related to long-term assets are recognized as a liability in the period in which they are incurred. Retirement costs equal to the estimated fair value of the ARO are capitalized as part of the cost of associated capital assets and are amortized to expense through depletion over the life of the asset. The fair value of the ARO is estimated by discounting the expected future cash flows to settle the ARO at the Company’s average credit-adjusted risk-free interest rate, which is currently 6.9%. In subsequent periods, the ARO is adjusted for the passage of time and for any changes in the amount or timing of the underlying future cash flows. The estimates described impact earnings by way of depletion on the retirement cost and accretion on the asset retirement liability. In addition, differences between actual an d estimated costs to settle the ARO, timing of cash flows to settle the obligation and future inflation rates may result in gains or losses on the final settlement of the ARO.
An ARO is not recognized for assets with an indeterminate useful life (e.g. pipeline assets and the Horizon upgrader and related infrastructure) because an amount cannot be reasonably determined. An ARO for these assets will be recorded in the first period in which the lives of these assets are determinable.
Income Taxes
The Company follows the liability method of accounting for income taxes. Under this method, future income tax assets and liabilities are recognized based on the estimated tax effects of temporary differences between the carrying value of assets and liabilities in the consolidated financial statements and their respective tax bases, using income tax rates substantively enacted or enacted as of the consolidated balance sheet date. Accounting for income taxes is a complex process that requires management to interpret frequently changing laws and regulations (e.g. changing income tax rates) and make certain judgments with respect to the application of tax law, estimating the timing of temporary difference reversals, and estimating the realizability of tax assets. These interpretations and judgments impact the current and future income tax provisions , future income tax assets and liabilities, and net earnings.
Risk Management Activities
The Company utilizes various derivative financial instruments to manage its commodity price, foreign currency and interest rate exposures. These financial instruments are entered into solely for hedging purposes and are not used for speculative purposes.
The estimated fair value of derivative financial instruments has been determined based on appropriate internal valuation methodologies. Fair values determined using valuation models require the use of assumptions concerning the amount and timing of future cash flows and discount rates. In determining these assumptions, the Company has relied primarily on external readily observable market inputs including quoted commodity prices and volatility, interest rate yield curves, and foreign exchange rates. The resulting fair value estimates may not necessarily be indicative of the amounts that may be realized or settled in a current market transaction and these differences may be material.
Purchase Price Allocations
The purchase prices of business combinations and asset acquisitions are allocated to the underlying acquired assets and liabilities based on their estimated fair value at the time of acquisition. The determination of fair value requires the Company to make assumptions and estimates regarding future events. The allocation process is inherently subjective and impacts the amounts assigned to individually identifiable assets and liabilities. As a result, the purchase price allocation impacts the Company’s reported assets and liabilities and future net earnings due to the impact on future DD&A expense and impairment tests.
The Company has made various assumptions in determining the fair values of the acquired assets and liabilities. The most significant assumptions and judgments relate to the estimation of the fair value of the crude oil and natural gas properties. To determine the fair value of these properties, the Company estimates (a) crude oil and natural gas reserves, and (b) future prices of crude oil and natural gas. Reserve estimates are based on the work performed by the Company’s internal engineers and outside consultants. The judgments associated with these estimated reserves are described above in “Crude Oil and Natural Gas Reserves”. Estimates of future prices are based on prices derived from price forecasts among industry analysts and internal assessments. The Company applies estimated future prices to the estimated reserves quanti ties acquired, and estimates future operating and development costs, to arrive at estimated future net revenues for the properties acquired.
CONTROL ENVIRONMENT
The Company’s management, including the President and the Chief Financial Officer and Senior Vice-President, Finance, evaluated the effectiveness of disclosure controls and procedures as at December 31, 2009, and concluded that disclosure controls and procedures are effective to ensure that information required to be disclosed by the Company in its annual filings and other reports filed with securities regulatory authorities in Canada and the United States is recorded, processed, summarized and reported within the time periods specified and such information is accumulated and communicated to the Company’s management to allow timely decisions regarding required disclosures.
The Company’s management also performed an assessment of internal control over financial reporting as at December 31, 2009, and concluded that internal control over financial reporting is effective. Further, there were no changes in the Company’s internal control over financial reporting during 2009 that have materially affected, or are reasonably likely to materially affect, internal controls over financial reporting.
While the Company’s management believes that the Company’s disclosure controls and procedures and internal controls over financial reporting provide a reasonable level of assurance they are effective, they recognize that all control systems have inherent limitations. Because of its inherent limitations, the Company’s control systems may not prevent or detect misstatements. Also, projections of any evaluation of effectiveness to future periods are subject to the risk that controls may become inadequate because of changes in conditions, or that the degree of compliance with the policies or procedures may deteriorate.
NEW ACCOUNTING STANDARDS
During 2009, the Company adopted the following new accounting standards issued by the CICA:
Goodwill and Intangible Assets
| · | Effective January 1, 2009 Section 3064 – “Goodwill and Intangible Assets” replaced Section 3062 – “Goodwill and Other Intangible Assets” and Section 3450 – “Research and Development Costs”. In addition, EIC-27 – “Revenue and Expenditures during the Pre-Operating Period” was withdrawn. The new standard addresses when an internally generated intangible asset meets the definition of an asset. The adoption of this standard, which was adopted retroactively, did not have an impact on the Company’s results of operations or financial position. |
Credit Risk and the Fair Value of Financial Assets and Liabilities
| · | On January 20, 2009 the Emerging Issues Committee (“EIC”) issued a new abstract EIC–173 “Credit Risk and the Fair Value of Financial Assets and Financial Liabilities”. This abstract concludes that an entity’s own credit risk and the credit risk of the counterparty should be taken into account when determining the fair value of financial assets and financial liabilities, including derivative financial instruments. This abstract applies to all financial assets and liabilities measured at fair value in interim and annual financial statements for periods ending on or after January 20, 2009. The adoption of this abstract did not have a material impact on the Company’s results of operation s or financial position. |
The Company also adopted the following amendments to accounting standards issued by the CICA:
Financial Instruments
| · | Effective July 1, 2009 Section 3855 – “Financial Instruments – Recognition and Measurement” was amended to add guidance on the assessment of embedded derivatives upon reclassification of a financial asset from the held-for-trading category. This amendment did not have any impact on the Company’s results of operations or financial position. |
Financial Instruments – Disclosures
| · | Effective October 1, 2009 Section 3862 – “Financial Instruments – Disclosures” was amended to include additional disclosure requirements for fair value measurements of financial instruments and to enhance liquidity risk disclosure requirements. The amendment requires the classification and disclosure of fair value measurements using a three-level hierarchy that reflects the significance of the inputs used in making the fair value measurements. This amendment affected disclosure only and did not impact the Company’s accounting for financial instruments. |
INTERNATIONAL FINANCIAL REPORTING STANDARDS
In February 2008, the CICA’s Accounting Standards Board confirmed that Canadian publicly accountable enterprises will be required to adopt International Financial Reporting Standards (“IFRS”) as promulgated by the International Accounting Standards Board (“IASB”) in place of Canadian GAAP effective January 1, 2011.
The Company has established a formal IFRS project governance structure. The structure includes a Steering Committee, which consists of senior levels of management from finance and accounting, operations and information technology (“IT”). The Steering Committee provides regular updates to the Company’s Management and the Audit Committee of the Board of Directors.
The Company’s IFRS conversion project has been broken down into the following phases:
• | Phase 1 Diagnostic – identification of potential accounting and reporting differences between Canadian GAAP and IFRS. |
| Phase 2 Planning – establishment of project governance, processes, resources, budget and timeline. |
| Phase 3 Policy Delivery and Documentation – establishment of accounting policies under IFRS. |
| Phase 4 Policy Implementation – establishment of processes for accounting and reporting, IT change requirements, and education. |
| Phase 5 Sustainment – ongoing compliance with IFRS after implementation. |
The Company has completed the Diagnostic and Planning phases (Phases 1 and 2). Significant differences were identified in accounting for Property, Plant & Equipment (“PP&E”), including exploration costs, depletion and depreciation, capitalized interest, impairment testing, and asset retirement obligations. Other significant differences were noted in accounting for stock-based compensation, risk management activities, and income taxes. The Company is continuing to perform the
necessary research to develop and document IFRS policies to address the major differences noted (Phase 3). A summary of the significant differences identified is included below. At this time, the impact on the Company’s future financial position and results of operations is not reasonably determinable. In addition, certain IFRS standards are expected to change prior to adoption in 2011, and the impact of these potential changes is not known.
The Company has identified, developed and tested process and system changes required to capture data required for IFRS accounting and reporting (Phase 4), including requirements to capture both Canadian GAAP and IFRS data in 2010. IT system changes are substantially complete and implemented as at December 31, 2009.
Summary of Identified IFRS Accounting Policy Differences
Property, Plant & Equipment
Adoption of IFRS will significantly impact the Company’s accounting policies for PP&E. For Canadian GAAP purposes, the Company follows the full cost method of accounting for its conventional crude oil and natural gas properties and equipment as prescribed by Accounting Guideline 16. Application of the full cost method of accounting is discussed in the “Critical Accounting Estimates” section of this MD&A. Significant differences in accounting for PP&E under IFRS include:
| · | Pre-exploration costs must be expensed. Under full cost accounting, these costs are currently included in the country cost centre. |
| · | Exploration and evaluation costs will be initially capitalized as exploration and evaluation assets. Once technical feasibility and commercial viability of reserves is established for an area, the costs will be transferred to PP&E. If technically feasible and commercially viable reserves are not established for a new area, the costs must be expensed. Under full cost accounting, exploration and evaluation costs are currently disclosed as PP&E but withheld from depletion. Costs are transferred to the depletable assets when proved reserves are assigned or when it is determined that the costs are impaired. |
| · | PP&E for producing properties will be depreciated at an asset level. Under full cost accounting, PP&E is depleted on a country cost centre basis. |
| · | Interest directly attributable to the acquisition or construction of a qualifying asset must be capitalized to the cost of the asset. Under Canadian GAAP, capitalization of interest is discretionary. |
| · | Impairment of PP&E will be tested at a cash generating unit level (the lowest level at which cash inflows can be identified). Under full cost accounting, impairment is tested at the country cost centre level. |
IFRS 1 “First-time Adoption of International Financial Reporting Standards” issued by the IASB includes a transition exemption for oil and gas companies following full cost accounting under their previous GAAP. The transition exemption allows full cost companies to allocate their existing full cost PP&E balances using reserve values or volumes to IFRS compliant units of account without requiring retroactive adjustment, subject to an initial impairment test. The Company intends to adopt this transition exemption.
Asset Retirement Obligations
Canadian GAAP accounting requirements for ARO are discussed in the “Critical Accounting Estimates” section of this MD&A. A significant difference in accounting for ARO under IFRS is that the liability must be re-measured at each balance sheet date using the current discount rates, whereas under Canadian GAAP the discount rates do not change once the liability is recorded. On transition to IFRS, the change in ARO liability on PP&E for which the full cost exemption above is applied must be recorded in retained earnings. For the change in ARO liability on other non-full cost PP&E, the change will be adjusted to PP&E in accordance with the general exemption for decommissioning liabilities included in IFRS 1. In future periods, the impact of changes in discount rates on the ARO liability for all PP&E is adjusted to PP& amp;E.
Stock-based Compensation
Under Canadian GAAP, the Company’s stock option plan liability is valued using the intrinsic value method, calculated as the amount by which the market price of the Company’s shares exceeds the exercise price of the option for vested options. Under IFRS, the stock option plan liability must be measured using a fair value option pricing model such as the Black-Scholes-Merton model. The Company intends to utilize the exemption in IFRS 1 under which options that were settled prior to January 1, 2010 will not have to be retrospectively restated.
Income Taxes
Both Canadian GAAP and IFRS follow the liability method of accounting for income taxes, where tax liabilities and assets are recognized on temporary differences. However, there are certain exceptions to the treatment of temporary differences under IFRS that may result in an adjustment to the Company’s future tax liability under IFRS. In addition, the Company’s future tax liability will be impacted by the tax effects of any changes noted in the above areas.
Other IFRS 1 Exemptions
The Company also intends to adopt the following IFRS 1 transition exemptions:
| | · | The Company intends to elect to reset the foreign currency translation adjustment to zero by transferring the Canadian GAAP balance to retained earnings on January 1, 2010, rather than retrospectively restating the balance. |
| | · | The Company intends to adopt the IFRS 1 election to not restate business combinations entered into prior to January 1, 2010. |
OUTLOOK
The Company continues to implement its strategy of maintaining a large portfolio of varied projects, which the Company believes will enable it, over an extended period of time, to provide consistent growth in production and create shareholder value. Annual budgets are developed, scrutinized throughout the year and revised if necessary in the context of targeted financial ratios, project returns, product pricing expectations, and balance in project risk and time horizons. The Company maintains a high ownership level and operatorship level in all of its properties and can therefore control the nature, timing and extent of capital expenditures in each of its project areas. The Company expects production levels in 2010 to average between 400,000 bbl/d and 445,000 bbl/d of crude oil and NGLs and between 1,117 mmcf/d and 1,185 mmcf/d of natural gas.
The forecasted capital expenditures in 2010 are currently expected to be as follows:
| ($ millions) | | 2010 Forecast | |
| Conventional crude oil and natural gas | | | |
| North America natural gas | | $ | 674 | |
| North America crude oil and NGLs | | | 1,900 | |
| North Sea | | | 199 | |
| Offshore West Africa | | | 264 | |
| Property acquisitions, dispositions and midstream | | | 100 | |
| | | $ | 3,137 | |
| Oil Sands Mining and Upgrading | | | | |
| Horizon Phase 2/3 – Tranche 2 | | $ | 479 | |
| Horizon Phase 2/3 – Engineering | | | 95 | |
| Sustaining capital | | | 164 | |
| Capitalized interest and other costs | | | 47 | |
| | | $ | 785 | |
| Total | | $ | 3,922 | |
The above capital expenditure budget incorporates the following levels of drilling activity:
| (Number of wells) | 2010 Forecast |
| Targeting natural gas | 93 |
| Targeting crude oil | 966 |
| Stratigraphic test / service wells – conventional | 227 |
| Stratigraphic test wells – mining | 166 |
| Total | 1,452 |
North America Natural Gas
The 2010 North America natural gas drilling program is highlighted by the continued high-grading of the Company’s natural gas asset base as follows:
| (Number of wells) | 2010 Forecast |
| Coal bed methane and shallow natural gas | 8 |
| Conventional natural gas | 36 |
| Cardium natural gas | 1 |
| Deep natural gas | 47 |
| Foothills natural gas | 1 |
| Total | 93 |
North America Crude Oil and NGLs
The 2010 North America crude oil drilling program is highlighted by continued development of the Primrose thermal projects, Pelican Lake, and a strong conventional primary heavy program, as follows:
| (Number of wells) | 2010 Forecast |
| Conventional primary heavy crude oil | 610 |
| Thermal heavy crude oil | 28 |
| Light crude oil | 117 |
| Pelican Lake crude oil | 201 |
| Total | 956 |
Oil Sands Mining and Upgrading
In 2010, Horizon Phase 2/3 Tranche 2 expenditures are targeted to increase reliability of the plant while also affording some debottlenecking opportunities.
Engineering and procurement is underway for Tranche 2 of the Phase 2/3 expansion, and Tranches 3 and 4 of Phase 2/3 continue to be re-profiled. The Company continues to work on completing its lessons learned from the construction of Phase 1 and implementing these into the development of future expansions.
North Sea
During 2010, the Company will recommence platform drilling activities in the Northern North Sea with a program of infill wells and workovers.
Offshore West Africa
During 2010, the Company will complete the project to increase capacity on the Espoir FPSO. At Olowi, the Company will complete commissioning of the remaining platforms and continue the drilling program from these locations.
SENSITIVITY ANALYSIS
The following table is indicative of the annualized sensitivities of cash flow from operations and net earnings from changes in certain key variables. The analysis is based on business conditions and sales volumes during the fourth quarter of 2009, excluding mark-to-market gains (losses) on risk management activities and capitalized interest, and is not necessarily indicative of future results. Each separate line item in the sensitivity analysis shows the effect of a change in that variable only with all other variables being held constant.
| | | Cash flow from operations ($ millions) | | | Cash flow from operations (per common share, basic) | | | Net earnings ($ millions) | | | Net earnings (per common share, basic) | |
| Price changes | | | | | | | | | | | | |
Crude oil – WTI US$1.00/bbl (1) | | | | | | | | | | | | |
| Excluding financial derivatives | | $ | 109 | | | $ | 0.20 | | | $ | 90 | | | $ | 0.17 | |
| Including financial derivatives | | $ | 91 | | | $ | 0.17 | | | $ | 76 | | | $ | 0.14 | |
Natural gas – AECO C$0.10/mcf (1) | | | | | | | | | | | | | | | | |
| Excluding financial derivatives | | $ | 33 | | | $ | 0.06 | | | $ | 24 | | | $ | 0.04 | |
| Including financial derivatives | | $ | 18 | | | $ | 0.03 | | | $ | 14 | | | $ | 0.03 | |
| Volume changes | | | | | | | | | | | | | | | | |
| Crude oil – 10,000 bbl/d | | $ | 161 | | | $ | 0.30 | | | $ | 105 | | | $ | 0.19 | |
| Natural gas – 10 mmcf/d | | $ | 12 | | | $ | 0.02 | | | $ | 4 | | | $ | 0.01 | |
| Foreign currency rate change | | | | | | | | | | | | | | | | |
$0.01 change in US$ (1) | | | | | | | | | | | | | | | | |
| Including financial derivatives | | $ | 95 – 97 | | | $ | 0.17 – 0.18 | | | $ | 31 – 32 | | | $ | 0.06 | |
| Interest rate change – 1% | | $ | 13 | | | $ | 0.02 | | | $ | 13 | | | $ | 0.02 | |
(1) | For details of financial instruments in place, refer to note 13 to the Company’s audited annual consolidated financial statements as at December 31, 2009. |
DAILY PRODUCTION BY SEGMENT, BEFORE ROYALTIES
| | | Q1 | | Q2 | | Q3 | | Q4 | | 2009 | | 2008 | | 2007 |
| Crude oil and NGLs (bbl/d) | | | | | | | | | | | | | | |
| North America – Conventional | | 253,833 | | 232,139 | | 223,307 | | 229,206 | | 234,523 | | 243,826 | | 246,779 |
| North America – Oil Sands Mining and Upgrading | | 3,384 | | 59,599 | | 66,907 | | 70,194 | | 50,250 | | – | | – |
| North Sea | | 42,369 | | 40,362 | | 34,034 | | 34,408 | | 37,761 | | 45,274 | | 55,933 |
| Offshore West Africa | | 30,431 | | 33,572 | | 35,021 | | 32,643 | | 32,929 | | 26,567 | | 28,520 |
| Total | | 330,017 | | 365,672 | | 359,269 | | 366,451 | | 355,463 | | 315,667 | | 331,232 |
| Natural gas (mmcf/d) | | | | | | | | | | | | | | |
| North America | | 1,347 | | 1,322 | | 1,264 | | 1,218 | | 1,287 | | 1,472 | | 1,643 |
| North Sea | | 10 | | 10 | | 8 | | 12 | | 10 | | 10 | | 13 |
| Offshore West Africa | | 12 | | 20 | | 21 | | 20 | | 18 | | 13 | | 12 |
| Total | | 1,369 | | 1,352 | | 1,293 | | 1,250 | | 1,315 | | 1,495 | | 1,668 |
| Barrels of oil equivalent (boe/d) | | | | | | | | | | | | | | |
| North America – Conventional | | 478,301 | | 452,494 | | 433,928 | | 432,167 | | 449,054 | | 489,081 | | 520,564 |
| North America – Oil Sands Mining and Upgrading | | 3,384 | | 59,599 | | 66,907 | | 70,194 | | 50,250 | | – | | – |
| North Sea | | 44,039 | | 42,045 | | 35,380 | | 36,440 | | 39,444 | | 46,956 | | 58,099 |
| Offshore West Africa | | 32,418 | | 36,846 | | 38,540 | | 36,056 | | 35,982 | | 28,808 | | 30,543 |
| Total | | 558,142 | | 590,984 | | 574,755 | | 574,857 | | 574,730 | | 564,845 | | 609,206 |
PER UNIT RESULTS – CONVENTIONAL (1)
| | | | Q1 | | | | Q2 | | | | Q3 | | | | Q4 | | | | 2009 | | | | 2008 | | | | 2007 | |
| Crude oil and NGLs ($/bbl) | | | | | | | | | | | | | | | | | | | | | | | | | | | | |
Sales price (2) | | $ | 41.25 | | | $ | 59.56 | | | $ | 62.90 | | | $ | 68.00 | | | $ | 57.68 | | | $ | 82.41 | | | $ | 55.45 | |
| Royalties | | | 3.98 | | | | 7.27 | | | | 7.89 | | | | 7.96 | | | | 6.73 | | | | 10.48 | | | | 5.94 | |
| Production expense | | | 15.02 | | | | 16.59 | | | | 16.71 | | | | 15.45 | | | | 15.92 | | | | 16.26 | | | | 13.34 | |
| Netback | | $ | 22.25 | | | $ | 35.70 | | | $ | 38.30 | | | $ | 44.59 | | | $ | 35.03 | | | $ | 55.67 | | | $ | 36.17 | |
| Natural gas ($/mcf) | | | | | | | | | | | | | | | | | | | | | | | | | | | | |
Sales price (2) | | $ | 5.46 | | | $ | 4.11 | | | $ | 3.80 | | | $ | 4.75 | | | $ | 4.53 | | | $ | 8.39 | | | $ | 6.85 | |
Royalties (3) | | | 0.72 | | | | 0.06 | | | | 0.13 | | | | 0.35 | | | | 0.32 | | | | 1.46 | | | | 1.11 | |
| Production expense | | | 1.18 | | | | 1.05 | | | | 1.05 | | | | 1.03 | | | | 1.08 | | | | 1.02 | | | | 0.91 | |
| Netback | | $ | 3.56 | | | $ | 3.00 | | | $ | 2.62 | | | $ | 3.37 | | | $ | 3.13 | | | $ | 5.91 | | | $ | 4.83 | |
| Barrels of oil equivalent ($/boe) | | | | | | | | | | | | | | | | | | | | | | | | | | | | |
Sales price (2) | | $ | 37.87 | | | $ | 44.52 | | | $ | 45.52 | | | $ | 51.95 | | | $ | 44.87 | | | $ | 68.62 | | | $ | 49.05 | |
| Royalties | | | 4.14 | | | | 4.34 | | | | 4.85 | | | | 5.60 | | | | 4.72 | | | | 9.78 | | | | 6.26 | |
| Production expense | | | 11.77 | | | | 12.21 | | | | 12.26 | | | | 11.72 | | | | 11.98 | | | | 11.79 | | | | 9.75 | |
| Netback | | $ | 21.96 | | | $ | 27.97 | | | $ | 28.41 | | | $ | 34.63 | | | $ | 28.17 | | | $ | 47.05 | | | $ | 33.04 | |
(1) Amounts expressed on a per unit basis are based on sales volumes.
(2) Net of transportation and blending costs and excluding risk management activities.
(3) Natural gas royalties for 2009 reflect the impact of natural gas physical sales contracts.
TRADING AND SHARE STATISTICS
| | | | Q1 | | | | Q2 | | | | Q3 | | | | Q4 | | | | 2009 | | | | 2008 | |
| TSX – C$ | | | | | | | | | | | | | | | | | | | | | | | | |
| Trading volume (thousands) | | | | | | | | | | | | | | | | | | | 520,160 | | | | 679,738 | |
| Share Price ($/share) | | | | | | | | | | | | | | | | | | | | | | | | |
| High | | $ | 57.20 | | | $ | 68.69 | | | $ | 76.91 | | | $ | 79.00 | | | $ | 79.00 | | | $ | 111.30 | |
| Low | | $ | 35.85 | | | $ | 47.70 | | | $ | 52.71 | | | $ | 65.97 | | | $ | 35.85 | | | $ | 34.19 | |
| Close | | $ | 48.91 | | | $ | 61.19 | | | $ | 72.30 | | | $ | 76.00 | | | $ | 76.00 | | | $ | 48.75 | |
| Market capitalization as at December 31 ($ millions) | | | | | | | | | | | | | | | | | | $ | 41,217 | | | $ | 26,373 | |
| Shares outstanding (thousands) | | | | | | | | | | | | | | | | | | | 542,327 | | | | 540,991 | |
| NYSE – US$ | | | | | | | | | | | | | | | | | | | | | | | | |
| Trading volume (thousands) | | | | | | | | | | | | | | | | | | | 757,307 | | | | 967,228 | |
| Share Price ($/share) | | | | | | | | | | | | | | | | | | | | | | | | |
| High | | $ | 48.54 | | | $ | 63.46 | | | $ | 71.93 | | | $ | 76.51 | | | $ | 76.51 | | | $ | 109.32 | |
| Low | | $ | 27.69 | | | $ | 37.73 | | | $ | 45.03 | | | $ | 62.05 | | | $ | 27.69 | | | $ | 26.43 | |
| Close | | $ | 38.56 | | | $ | 52.49 | | | $ | 67.19 | | | $ | 71.95 | | | $ | 71.95 | | | $ | 39.98 | |
| Market capitalization as at December 31 ($ millions) | | | | | | | | | | | | | | | | | | $ | 39,020 | | | $ | 21,629 | |
| Shares outstanding (thousands) | | | | | | | | | | | | | | | | | | | 542,327 | | | | 540,991 | |
ADDITIONAL DISCLOSURE
Certifications
The required disclosure is included in Exhibits 2, 3, 4 and 5 of the Annual Report on Form 40-F
Disclosure Controls and Procedures
As of the end of the registrant’s fiscal year ended December 31, 2009, an evaluation of the effectiveness of Canadian Natural’s “disclosure controls and procedures” (as such term is defined in Rules 13a-15(e) and 15d-15(e) of the Securities Exchange Act of 1934, as amended (the “Exchange Act”) was carried out by Canadian Natural’s management with the participation of Canadian Natural’s principal executive officer and principal financial officer. Based upon the evaluation, Canadian Natural’s principal executive officer and principal financial officer have concluded that as of the end of the fiscal year, Canadian Natural’s disclosure controls and procedures are effective to ensure that information required to be disclosed by the registrant in reports that it files or submits und er the Exchange Act is (i) recorded, processed, summarized and reported within the time periods specified in Securities and Exchange Commission rules and forms and (ii) accumulated and communicated to the registrant’s management, including its principal executive officer and principal financial officer, to allow timely decisions regarding required disclosure.
It should be noted that while Canadian Natural’s principal executive officer and principal financial officer believe that Canadian Natural’s disclosure controls and procedures provide a reasonable level of assurance that they are effective, they do not expect Canadian Natural’s disclosure controls and procedures or internal control over financial reporting will prevent all errors and fraud. A control system, no matter how well conceived or operated, can provide only reasonable, not absolute, assurance that the objectives of the control system are met.
Management’s Assessment of Internal Control Over Financial Reporting
The required disclosure is included in the “Management’s Assessment of Internal Control Over Financial Reporting” that accompanies Canadian Natural’s audited consolidated financial statements for the fiscal year ended December 31, 2009, filed as part of this Annual Report on Form 40-F.
Attestation Report of the Registered Public Accounting Firm
The required disclosure is included in the “Independent Auditors’ Report” that accompanies Canadian Natural’s audited consolidated financial statements for the fiscal year ended December 31, 2009, filed as part of this Annual Report on Form 40-F.
Changes in Internal Control Over Financial Reporting
During the fiscal year ended December 31, 2009, there were no changes in Canadian Natural’s internal control over financial reporting that have materially affected, or are reasonably likely to materially affect, Canadian Natural’s internal control over financial reporting.
Notices Pursuant to Regulation BTR
None.
Audit Committee Financial Expert
The Board of Directors of Canadian Natural has determined that Ms. C.M. Best qualifies as an “audit committee financial expert” (as defined in paragraph 8(b) of General Instruction B to the Form 40-F) serving on its Audit Committee. Ms. C.M. Best is, as are all members of the Audit Committee of the Board of Directors of Canadian Natural, “independent” as such term is defined in the rules of the New York Stock Exchange.
Code of Ethics
Canadian Natural has a long-standing Code of Integrity, Business Ethics and Conduct (the “Code of Ethics”), which covers such topics as employment standards, conflict of interest, the treatment of confidential information and trading in Canadian Natural’s shares and is designed to ensure that Canadian Natural’s business is consistently conducted in a legal and ethical manner. Each director and all employees, including each member of senior management and more specifically the principal executive officer, the principal financial officer and the principal accounting officer, are required to abide by the Code of Ethics. The Nominating and Corporate Governance Committee periodically reviews the Code of Ethics to ensure it addresses appropriate topics and complies with regulatory requirements and recommend s any appropriate changes to the Board for approval.
Any waivers of or amendments to the Code of Ethics must be approved by the Board of Directors and will be appropriately disclosed. In the past fiscal year, there has not been any amendments to the Code of Ethics or waivers, including implicit waivers, from any provisions of the Code of Ethics.
The Code of Ethics is available through the System for Electronic Document and Analysis and Retrieval (SEDAR) at www.sedar.com. Requests for copies can also be made by contacting: Bruce E. McGrath, Corporate Secretary, Canadian Natural Resources Limited, 2500-855 2nd Street, S.W., Calgary, Alberta, Canada T2P 4J8.
Principal Accountant Fees and Services
PricewaterhouseCoopers LLP (“PwC”) has been the auditor of Canadian Natural since Canadian Natural’s inception. The aggregate amounts billed by PwC for each of the last two fiscal years for audit fees, audit-related fees, tax fees and all other fees, excluding expenses, are set forth below.
Audit Fees
The aggregate fees billed for each of the last two fiscal years of Canadian Natural ending December 31, 2009 and December 31, 2008, for professional services rendered by PwC for the audit of its internal controls and annual consolidated financial statements in connection with statutory and regulatory filings or engagements for those fiscal years, unaudited reviews of the first, second and third quarters of its interim consolidated financial statements and audits of certain of Canadian Natural’s subsidiary companies’ annual financial statements were $2,710,110 for 2009 and were $2,685,800 for 2008.
Audit-Related Fees
The aggregate fees billed for each of the last two fiscal years of Canadian Natural, ending December 31, 2009 and December 31, 2008, for audit-related services by PwC including debt covenant compliance and Crown Royalty Statements, were $154,302 for 2009 and were $156,300 for 2008. Canadian Natural’s Audit Committee approved all of these audit-related services.
Tax Fees
The aggregate fees billed for each of the last two fiscal years of Canadian Natural, ending December 31, 2009 and December 31, 2008, for professional services rendered by PwC for tax-related services related to expatriate personal tax compliance as well as other corporate tax return matters provided in 2009 were $131,653 for 2009 and were $91,500 for 2008. Canadian Natural’s Audit Committee approved all of these tax-related services.
All Other Fees
The aggregate fees billed for each of the last two fiscal years of Canadian Natural, ending December 31, 2009 and December 31, 2008 for other services were $9,500 for 2009 and were $9,500 for 2008. The fees for other services paid in 2009 related to accessing resource materials through PwC’s accounting literature library. Canadian Natural’s Audit Committee approved all of the noted services.
Audit Committee Pre-Approval Policies and Procedures
The Audit Committee’s duties and responsibilities include the review and approval of fees to be paid to the independent auditors, scope and timing of the audit and other related services rendered by the independent auditors. The Audit Committee also reviews and approves the independent auditor’s annual audit plan, including scope, staffing, locations and reliance upon management and internal audit department prior to the commencement of the audit and reviews and approves proposed non-audit services to be provided by the independent auditors, except those non-audit services prohibited by legislation. Canadian Natural did not rely on the de minimis exemption provided by paragraph (c)(7)(i)(c) of Rule 2.01 of Regulation S-X in 2009.
COMMITMENTS AND OFF BALANCE SHEET ARRANGEMENTS
In the normal course of business, the Company has entered into various commitments that will have an impact on the Company’s future operations. These commitments primarily relate to firm commitments for gathering, processing and transmission services; operating leases relating to offshore FPSOs, drilling rigs and office space; expenditures relating to ARO; as well as long-term debt and interest payments. As at December 31, 2009, no entities were consolidated under CICA Handbook Accounting Guideline 15, “Consolidation of Variable Interest Entities”. The following table summarizes the Company’s commitments as at December 31, 2009:
| ($ millions) | 2010 | 2011 | 2012 | 2013 | 2014 | Thereafter |
| Product transportation and pipeline | $ | 207 | $ | 162 | $ | 136 | $ | 125 | $ | 126 | $ | 1,051 |
| Offshore equipment operating lease | $ | 155 | $ | 124 | $ | 103 | $ | 102 | $ | 101 | $ | 261 |
| Offshore drilling | $ | 49 | $ | – | $ | – | $ | – | $ | – | $ | – |
Asset retirement obligations (1) | $ | 16 | $ | 20 | $ | 21 | $ | 31 | $ | 39 | $ | 6,479 |
Long-term debt (2) | $ | 400 | $ | 419 | $ | 366 | $ | 819 | $ | 366 | $ | 5,424 |
Interest expense (3) | $ | 473 | $ | 451 | $ | 415 | $ | 370 | $ | 350 | $ | 4,779 |
| Office leases | $ | 25 | $ | 19 | $ | 3 | $ | 2 | $ | 2 | $ | – |
| Other | $ | 271 | $ | 67 | $ | 23 | $ | 15 | $ | 12 | $ | 34 |
| (1) | Amounts represent management’s estimate of the future undiscounted payments to settle ARO related to resource properties, facilities, and production platforms, based on current legislation and industry operating practices. Amounts disclosed for the period 2010 – 2014 represent the minimum required expenditures to meet these obligations. Actual expenditures in any particular year may exceed these minimum amounts. |
| (2) | The long-term debt represents principal repayments only and does not reflect fair value adjustments, original issue discounts or transaction costs. No debt repayments are reflected for $1,897 million of revolving bank credit facilities due to the extendable nature of the facilities. |
| (3) | Interest expense amounts represent the scheduled fixed rate and variable rate cash payments related to long-term debt. Interest on variable rate long-term debt was estimated based upon prevailing interest rates as of December 31, 2009. |
Identification of the Audit Committee
Canadian Natural has a separately designated standing audit committee established in accordance with section 3(a)(58)(A) of the Exchange Act. The members of the Audit Committee are Messrs. G. A. Filmon, G. D. Giffin, D. A. Tuer and Ms. C.M. Best, who chairs the Audit Committee.
UNDERTAKING AND CONSENT TO SERVICE OF PROCESS
Undertaking
Canadian Natural undertakes to make available, in person or by telephone, representatives to respond to inquiries made by the Commission staff, and to furnish promptly, when requested to do so by the Commission staff, information relating to: the securities registered pursuant to Form 40-F; the securities in relation to which the obligation to file an annual report on Form 40-F arises; or transactions in said securities.
Consent to Service of Process
Canadian Natural has previously filed a Form F-X in connection with the class of securities in relation to which the obligation to file this report arises.
Any change to the name or address of the agent for service of process of Canadian Natural shall be communicated promptly to the Commission by an amendment to the Form F-X referencing the file number of the relevant registration statement.
SIGNATURES
Pursuant to the requirements of the Exchange Act, Canadian Natural certifies that it meets all of the requirements for filing on Form 40-F and has duly caused this Annual Report to be signed on its behalf by the undersigned, thereto duly authorized.
Dated this 25th day of March, 2010.
CANADIAN NATURAL RESOURCES LIMITED
| By: | /s/ Steve W. Laut | |
| Name: | Steve W. Laut | |
| Title: | President (Principal Executive Officer) | |
Documents filed as part of this report:
EXHIBIT INDEX
| Exhibit No. | Description |
| | |
| 1. | Supplementary Oil & Gas Information for the fiscal year ended December 31, 2009. |
| | |
| 2. | Certification of Chief Executive Officer pursuant to Rule 13a-14(a) or 15d-14 of the Securities Exchange Act of 1934. |
| | |
| 3. | Certification of Chief Financial Officer pursuant to Rule 13a-14(a) or 15d-14 of the Securities Exchange Act of 1934. |
| | |
| 4. | Certification of Chief Executive Officer pursuant to Section 1350 of Chapter 63 of Title 18 of the United States Code (18 U.S.C. 1350). |
| | |
| 5. | Certification of Chief Financial Officer pursuant to Section 1350 of Chapter 63 of Title 18 of the United States Code (18 U.S.C. 1350). |
| | |
| 6. | Consent of PricewaterhouseCoopers LLP, independent chartered accountants. |
| | |
| 7. | Consent of Sproule Associates Limited, independent petroleum engineering consultants. |
| | |
| 8. | Consent of GLJ Petroleum Consultants Ltd., independent petroleum engineering consultants. |