Exhibit 99.2
2Q 2007 Earnings Conference Call Remarks
Ken Matheny
Vice President, Investor Relations and Public Affairs
November 1, 2007
Welcome to Marathon Oil Corporation’s third quarter 2007 earnings Web cast and conference call. As a reminder for telephone participants, you can find the synchronized slides that accompany this call on our website www.Marathon.com.
With us on the call today, are Clarence Cazalot, president and CEO, Janet Clark, executive vice president and CFO, Gary Heminger, Marathon executive vice president and president of our Refining, Marketing and Transportation organization, Phil Behrman, senior vice president Worldwide Exploration, Steve Hinchman, senior vice president Worldwide Production, and Garry Peiffer, senior vice president of finance and commercial services downstream.
Slide 2 contains the Forward Looking Statement and other information related to this presentation. Our remarks and answers to questions today will contain certain forward-looking statements that are subject to risks and uncertainties that could cause actual results to differ materially from those expressed or implied by such statements.
In accordance with safe harbor provisions of the Private Securities Litigation Reform Act of 1995, Marathon Oil Corporation has included in its Annual Report on Form 10-K for the year ended December 31, 2006, and subsequent Forms 8-K and 10-Q, cautionary language identifying important factors, but not necessarily all factors, that could cause future outcomes to differ materially from those set forth in the forward-looking statements.
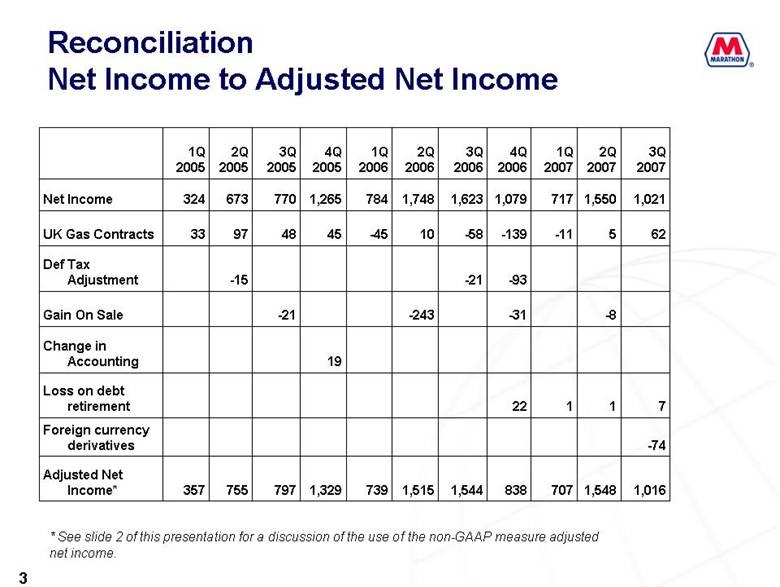
Turning to slide 3, net income for the third quarter was $1 billion versus $1.6 billion in the third quarter 2006. This slide also provides a reconciliation of Net Income to Adjusted Net Income by quarter for the last three years.
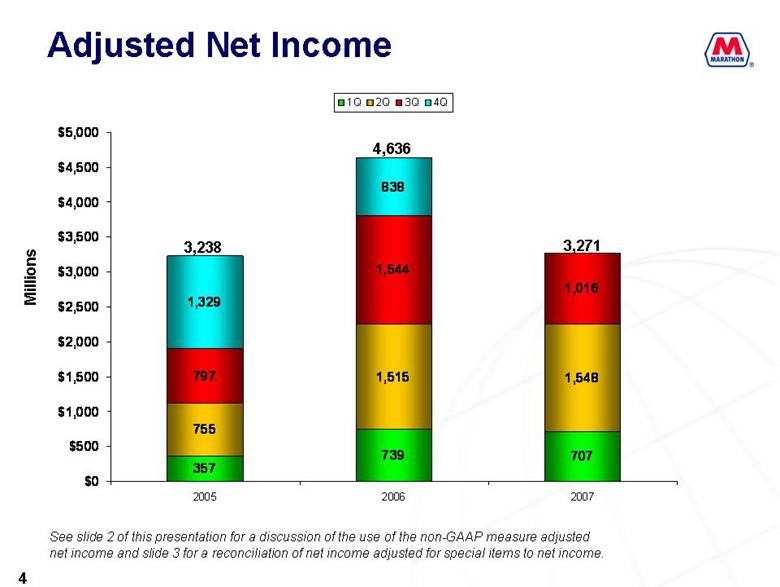
The bar graphs on slide 4 show the quarterly net income adjusted for special items for the third quarter was just over $1 billion, down $528 million from the third quarter 2006. For ease of comparison, this slide also provides the quarterly and yearly data for 2006 and 2005.
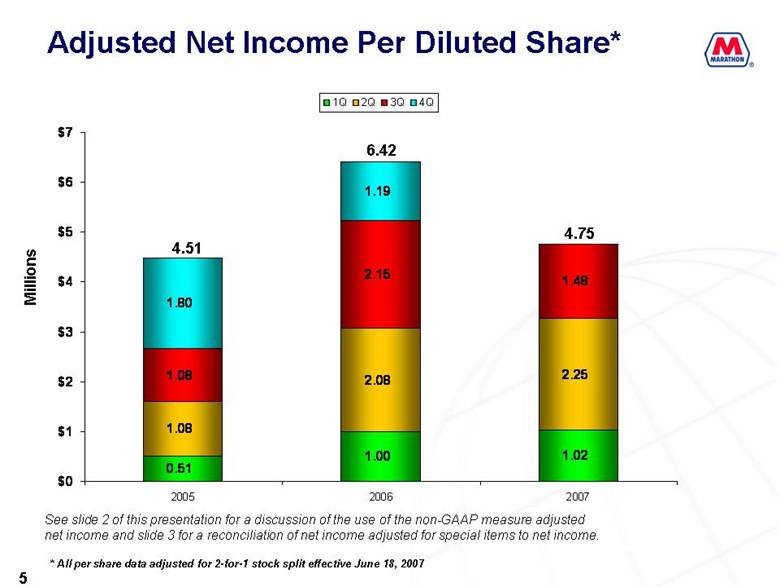
Slide 5 shows that on a per share basis, adjusted net income was down $0.67 or 31 percent from the year ago third quarter level and $0.77 per share or 34 percent below the second quarter 2007.
Because the Western acquisition was pending during the third quarter, there were minimal share purchases during the quarter.
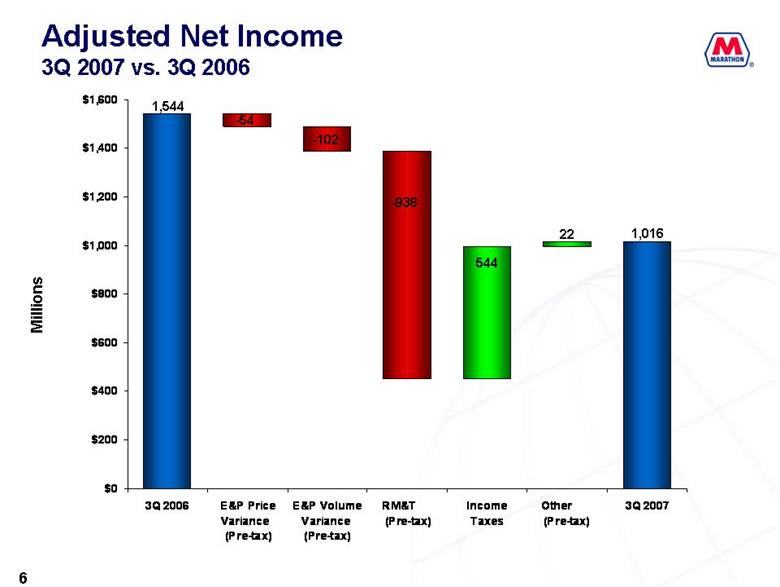
Moving to slide 6, the year over year decrease in third quarter net income adjusted for special items was largely a result of a lower refining and wholesale marketing gross margin, partially offset by lower income taxes.
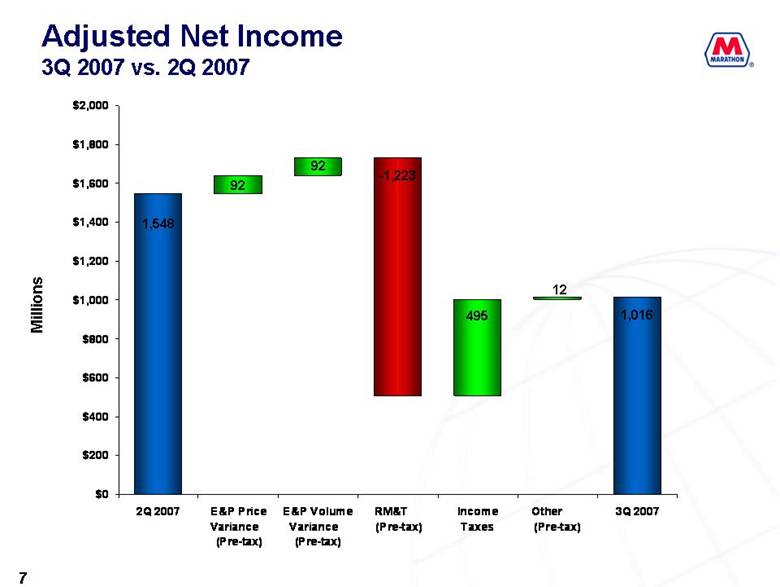
Moving to slide 7, adjusted net income for the third quarter 2007 was $532 million lower than the second quarter 2007. This decrease was also primarily a result of a lower refining and wholesale marketing gross margin partially offset by lower income taxes.
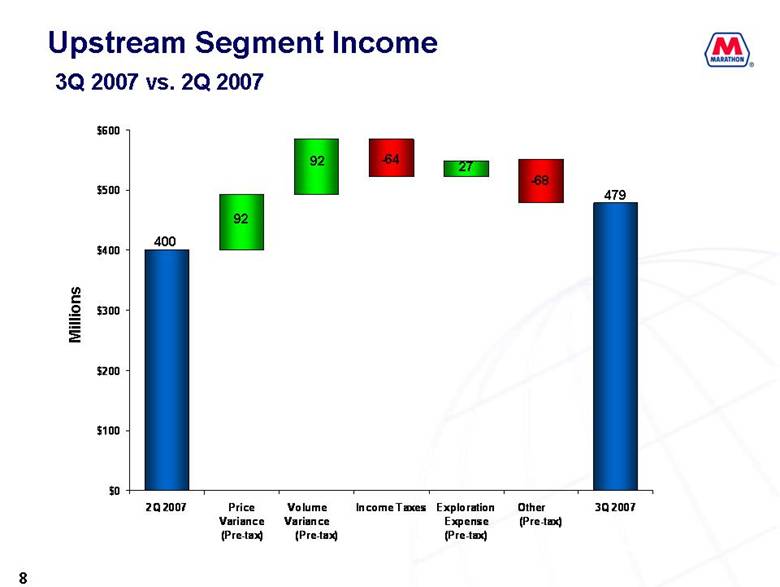
Turning to slide 8, upstream segment income for the third quarter increased $79 million over the second quarter 2007. This increase was a result of higher natural gas sales volumes and higher liquid hydrocarbon sales prices partially offset by higher income taxes, lower revenue associated with storage volumes in Ireland and higher operating costs, primarily related to workovers in the Gulf of Mexico, UK, and Gabon.
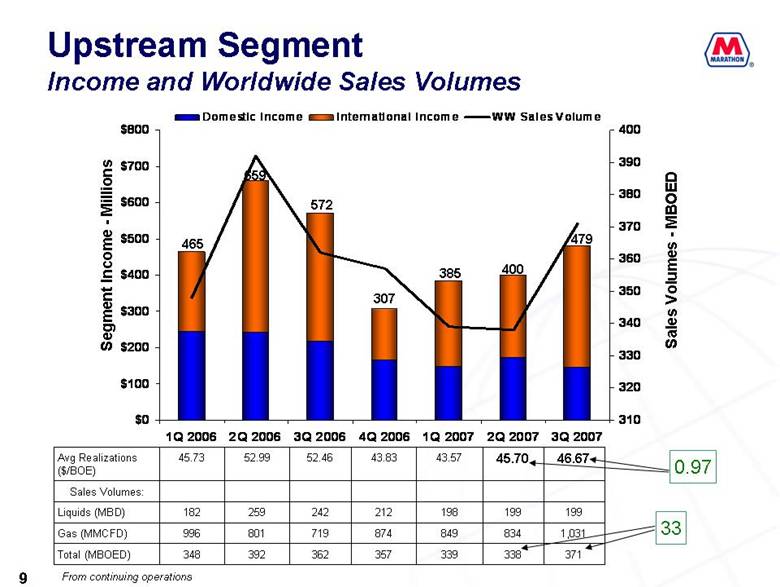
As shown on slide 9, worldwide sales volumes on a BOE basis increased 33,000 boe per day in the third quarter 2007 as compared to the second quarter 2007 and the average realized price per boe increased $0.97 per BOE quarter over quarter.
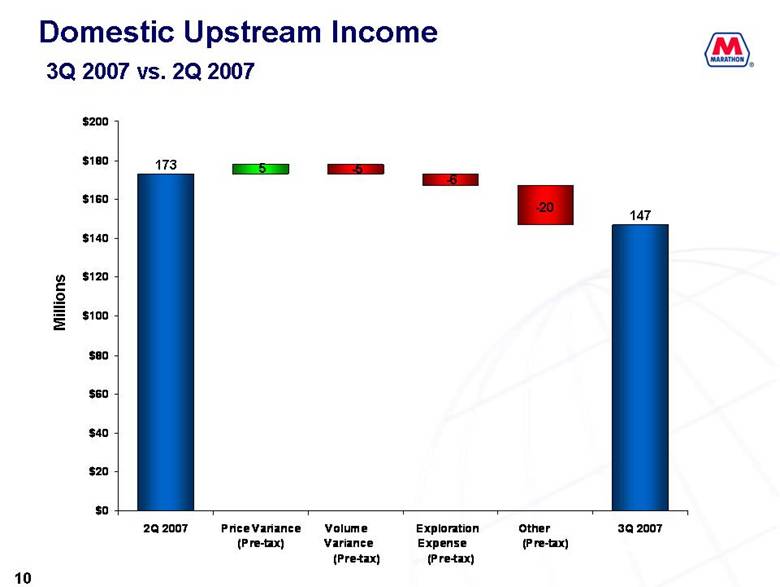
Moving to slide 10, domestic upstream income decreased $26 million from the second quarter, largely a result of slightly higher operating costs associated with the previously mentioned workovers in the Gulf of Mexico.
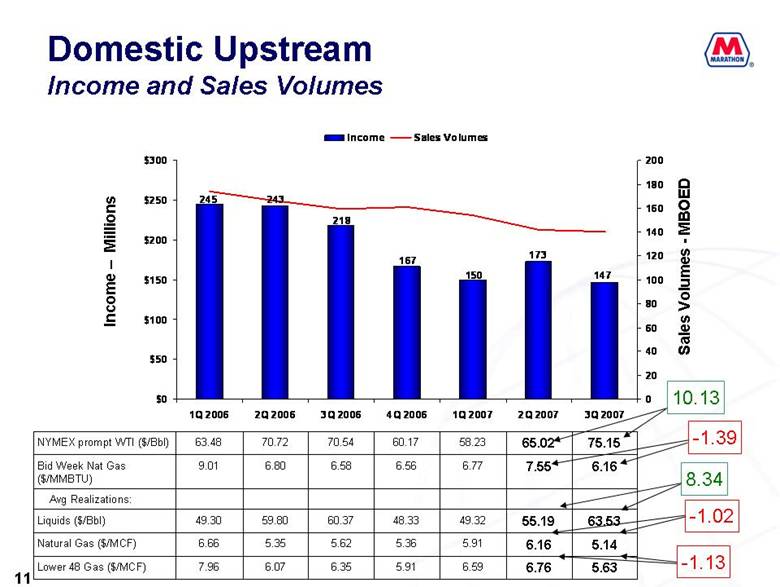
As shown on Slide 11, the NYMEX prompt price for WTI crude was up $10.13 per barrel from the second quarter while our average domestic realized liquid hydrocarbon price was up $8.34. Our lower realizations compared to the NYMEX were primarily the result of weaker differentials for Gulf Coast and Wyoming crude streams as well as NGL price realizations which did not keep pace with the WTI increase.
The Bid Week Natural Gas price was down $1.39 per million BTUs from the second quarter, while our domestic natural gas realizations were down $1.02 per mcf. Our lower 48 realizations were down $1.13 per mcf, primarily reflecting the relative positive movement of differentials to Henry Hub quarter on quarter.
Turning to slide 12, third quarter domestic upstream expense, excluding exploration expense, was $1.64 per BOE higher than the second quarter primarily as a result of the higher workover expenses already discussed. Domestic upstream income per BOE decreased $2.08 quarter over quarter.
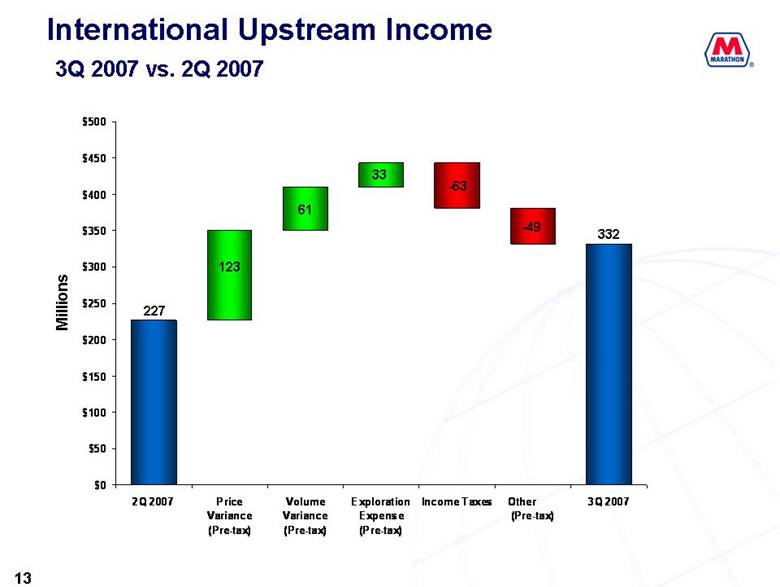
Moving to slide 13, international upstream income for the third quarter increased $105 million over the second quarter as a result of higher volumes and higher realized prices, which were partially offset by higher income taxes, lower revenue associated with storage volumes in Ireland, higher operating costs, primarily from workovers in the UK and Gabon and increased DD&A due to higher EG gas sales to the LNG plant.
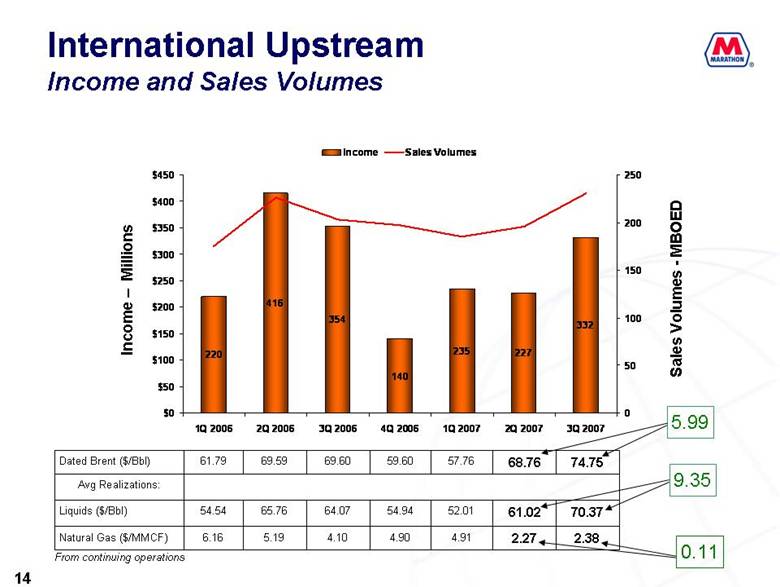
As shown on Slide 14, our international liquids realizations increased approximately $9.35 per barrel while Dated Brent increased only $5.99 per barrel. This out performance compared to Dated Brent was primarily due to higher market premiums for our light sweet sales as well as the timing of liftings.
The increase in the international natural gas realizations compared to the second quarter, was a result of higher volumes and higher realized prices in Europe. These gains were partially offset by much higher gas sales volumes to our LNG facility in Equatorial Guinea during the third quarter, which was its first full quarter of operation. Please remember that our LNG business is reported through the Integrated Gas segment, so there is additional uplift in value realized by this facility that is not reported through our upstream business.
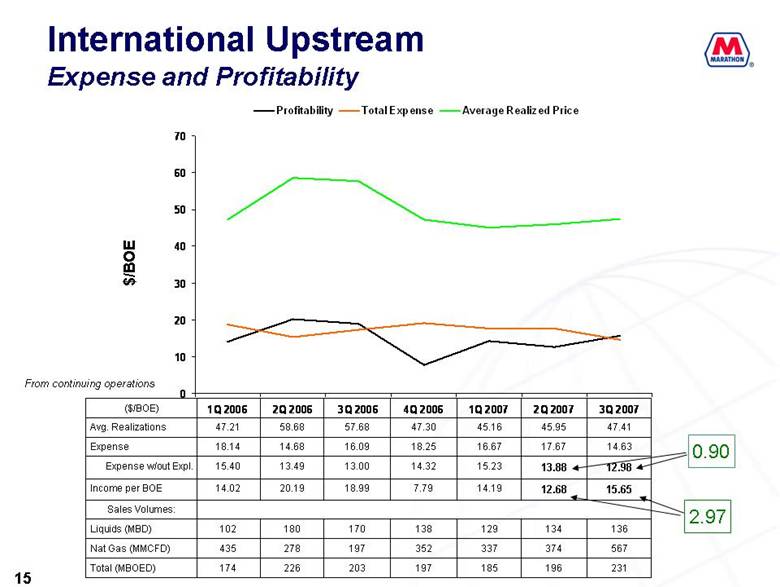
Turning to slide 15, third quarter international upstream expense, excluding exploration expense, decreased $0.90 per BOE over the second quarter 2007, largely a result of the higher volume of natural gas production in EG. Total income per BOE increased $2.97 to $15.65 primarily due to the higher realizations.
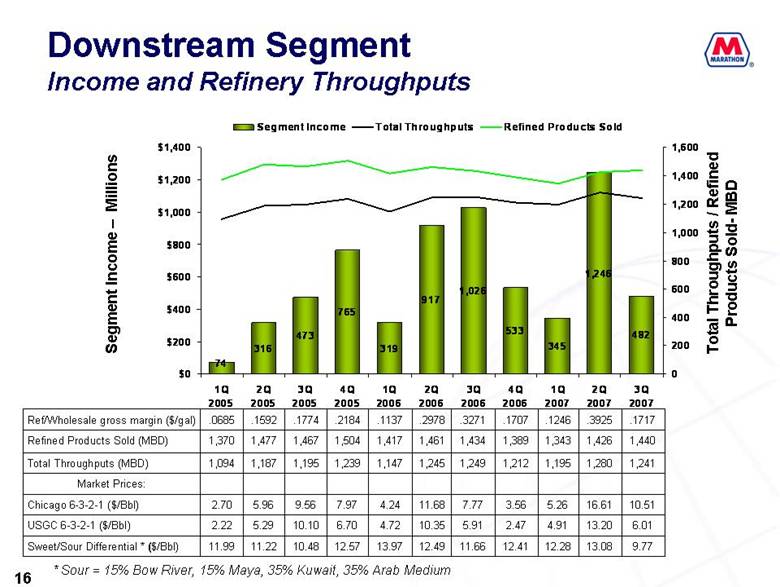
Moving to our downstream business and slide 16, third quarter 2007 segment income totaled $482 million compared to just over $1 billion earned in the same quarter last year. Because of the seasonality of the downstream business, I will compare our third quarter 2007 results against the same quarter of 2006.
The most significant factor contributing to downstream’s lower segment income quarter to quarter was that the price of crude oil rose significantly during the third quarter 2007 while in the third quarter 2006 prices fell substantially. This was the primary reason our crude oil and other feedstock acquisition costs increased substantially more than the change in the average price of LLS during the September 2007 quarter compared to the September 2006 quarter would indicate. Due to these escalating prices in the third quarter 2007, we took a charge for crude and feedstock derivative activity. This charge wasn’t completely offset by changes in the value of the underlying crude and feedstock inventories and purchases. The opposite effect occurred in the third quarter 2006 when prices declined during the quarter and we recorded a gain on crude and feedstock derivative activity.
In addition, the average sweet/sour differential narrowed about $2 per barrel between the periods which also negatively impacted earnings. And finally, we ran a sweeter crude slate in the third quarter 2007 compared to the third quarter 2006 which also increased our crude acquisition costs quarter to quarter.
2
In addition to the increased cost of crude and feedstocks, the increase in our wholesale sales price realizations per gallon during third quarter 2007 over the comparable prior year period was less than the increase in the average spot market prices for the products that are used in the LLS 6-3-2-1 calculation.
In addition to the derivatives effects I just discussed in the third quarter 2007 we had a small derivative loss related to ethanol versus a large derivative gain in the third quarter 2006. This swing was primarily due to the fact that during the third quarter 2006 we had a number of derivative contracts in place to hedge long-term ethanol purchase contracts. When prices fell in the third quarter of 2006, the derivatives contracts increased in value generating a positive income effect without any offsetting effect from the physical ethanol purchase contracts during this same quarter.
In total, Marathon’s refining and wholesale marketing gross margin included derivative losses of $360 million in the third quarter of 2007 compared to derivative gains of $384 million in the third quarter of 2006. Since we have elected not to use hedge accounting for our downstream, all of our derivative activities are required to be marked to market by FAS 133. Therefore, the derivative change reflects both the realized effects of derivatives as well as the unrealized effect of marking open derivative positions to market. In addition, derivatives used in non-trading activities have an underlying physical commodity transaction; however, the income effect related to the derivatives and income effect related to the underlying physical transactions may not necessarily be recognized in net income in the same period.
The downstream segment also incurred higher costs in the third quarter 2007 compared to the same quarter last year primarily because of higher planned turnaround expenses.
In the third quarter 2007, crude oil in transit effect was negative $30 million versus a positive effect of about $53 million in the same quarter last year.
Partially offsetting these negative results was the fact that the Chicago crack spread, in particular, was much stronger in the third quarter 2007 than it was in the same quarter last year. The LLS 6-3-2-1 crack spread on a two-thirds Chicago and one-third U.S. Gulf Coast basis, increased from $7.15 in the third quarter 2006 to $9.01 in the third quarter 2007.
Our refineries operated well last quarter. Crude oil throughputs improved from 1,031,000 bpd in the third quarter 2006 to 1,042,000 bpd in the third quarter 2007. However, planned turnarounds under way at the end of the third quarter at our Catlettsburg, Kentucky and St. Paul Park, Minnesota refineries reduced our average third quarter 2007 total crude and other charge and blendstock inputs to 1,241,000 bpd compared to 1,249,000 bpd in the same quarter last year. For the full year, we expect our total crude oil throughputs will exceed the record level of 980,000 bpd we achieved in 2006.
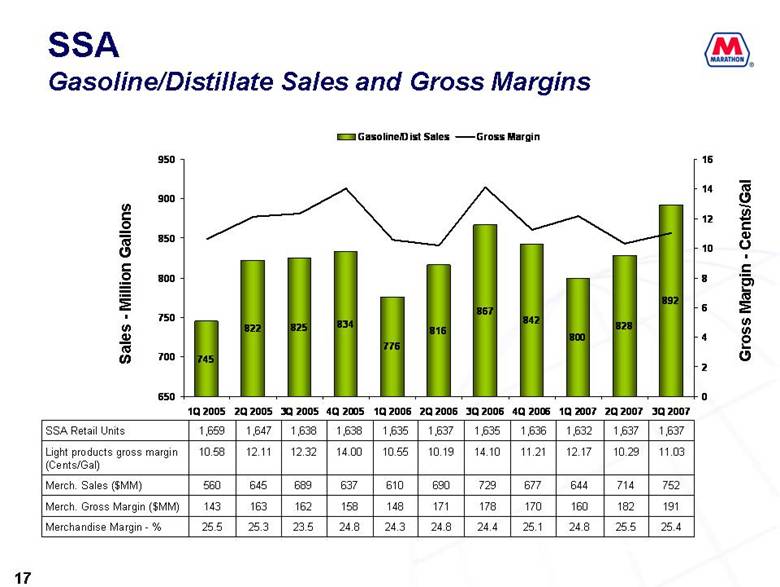
As shown on slide 17, Speedway SuperAmerica’s gasoline and distillate sales were up 25 million gallons, an increase of 2.9 percent quarter over quarter. Speedway SuperAmerica’s same store gasoline sales volumes were up 1.9 percent and same store merchandise sales increased 2.6 percent in the third quarter 2007 compared to the same quarter in 2006.
And last, Speedway SuperAmerica’s gross margin for gasoline and distillate was 11.03 cents per gallon compared to 14.10 cents per gallon in the same quarter last year.
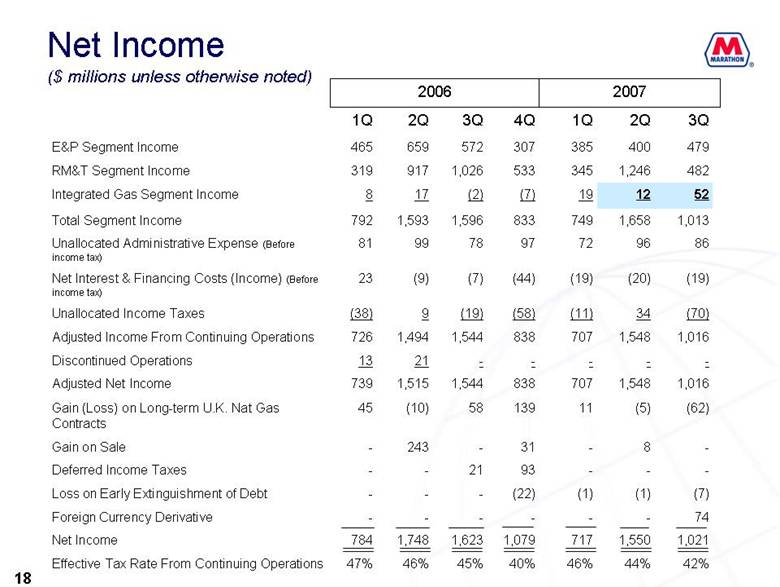
Slide 18 provides a summary of segment data, along with a reconciliation to net income. Of note is the integrated gas segment which had income of $52 million during the third quarter 2007 compared to $12 million in the second quarter. The increase in earnings is primarily attributable to the fact that the third quarter was the first full quarter of operations for the EG LNG production facility, which commenced primary operations in May 2007.
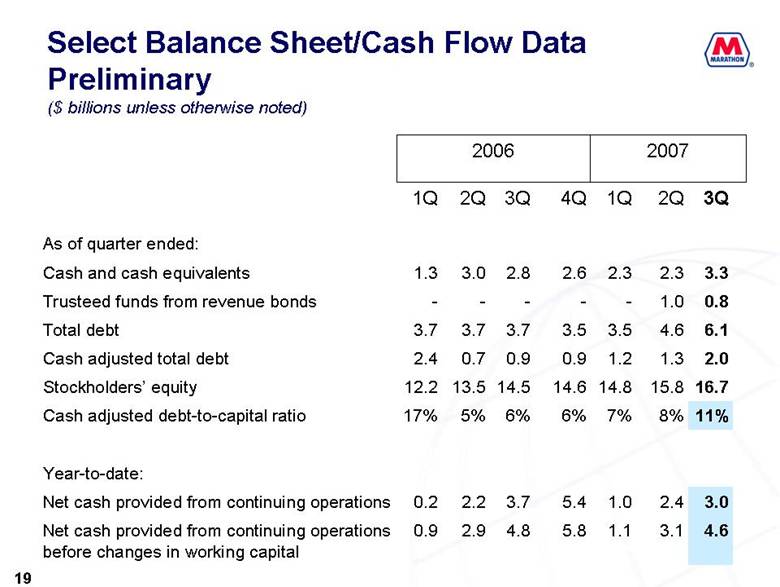
Slide 19 provides selected preliminary Balance Sheet and Cash Flow data. Cash-adjusted debt to total capital at the end of the third quarter was approximately 11%. As a reminder, the cash-adjusted debt balance includes approximately $508 million of debt serviced by U.S. Steel.
3
Year-to-date preliminary cash flow from operations was approximately $3.0 billion, and preliminary cash flow from operations before working capital changes was approximately $4.6 billion.
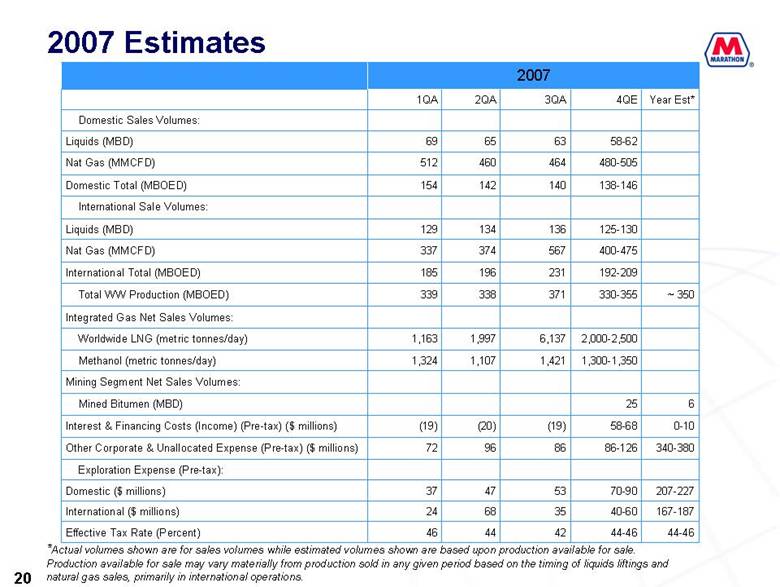
Slide 20 provides guidance for the fourth quarter and full year 2007.
Before I turn the call over to Clarence there are a few additional comments to make. This will be my last conference call with investors as I have decided to retire at the end of the year after more than 30 years with Marathon. More than seven of those years have been spent working with investors — nearly 40 conference calls, hundreds of meetings and literally thousands of telephone calls. While I am looking forward to retirement, I would be remiss if I did not say how much I have enjoyed the time spent with all of you. You have challenged me with questions and I have benefited from your knowledge and insights. You kept me on my toes and I think it is safe to say I’ve gained more from the experience than you. I will miss the challenge but most of all I will miss the relationships and the opportunity to talk with you on a regular basis.
But this is a good news story. The timing is right. Marathon is positioned with a management team, employees and an asset base as good as any I have seen in my 30 year career. The good news for me is that I am healthy and will have time to do most anything my family wants to do. The good news for all of you is that Howard Thill will replace me. Many of you know Howard very well and recognize that he is more than qualified for the job. Howard along with Michol Ecklund and Bonnie Chisum will be here to meet all your investor needs. I can guarantee investor relations at Marathon will not miss a beat, in fact the beat will probably step up a notch.
So for the last time my thanks to all of you, it has been a great ride, and I will now turn the call over to Clarence Cazalot.
Ken, thank you so much. We’ve still got two more months to ask you questions and challenge you a bit. I, on behalf of the company, want to thank you again. Ken, as you all know, has made tremendous contributions to Marathon for over 30 years. And certainly from my standpoint, having worked with him for the last six years, you know what a gentleman he is, a man of great integrity, and he’s been a great source of advice and guidance for me personally. I want to wish Ken and Peg all the best as they take on new challenges and to congratulate Howard on the job, and we look forward to working with Howard as well.
As Ken pointed out, in the third quarter our upstream business benefited from the increase in crude oil prices while it was a challenging environment for the downstream sector as margins were compressed by increased crude costs. This certainly points out the volatility in our business but also the advantage of being a strong integrated company. Despite this near-term volatility, we continue to invest in profitable, long-term growth opportunities and I think as you all recognize, our clear intent is to create long-term value through fully integrated energy solutions such as the potential linkage of our recently acquired interest in the Canadian oil sands with our best in class U.S. refining and marketing assets.
As you know we just announced yesterday approval of our Detroit refinery upgrade and expansion project. When completed in 2010, this refinery project will allow us to process an additional 80,000 barrels of heavy oil and unlock additional value from our oil sands assets. And I know there’s a great expectation out there about what the precise downstream value proposition is. Gary Heminger will outline for you in an illustrative fashion, this value proposition using a reasonable set of assumptions. But first, I’d like Steve Hinchman to give an update on our production business.
Thank-you Clarence.
Our upstream operations performed well over the third quarter; including our LNG facility in Equatorial Guinea; which achieved an average utilization rate of 93% of design capacity.
Unfortunately on October 4th we discovered a small leak in a 2 inch drain line within the refrigeration unit of the EG LNG facility requiring a full shut-in of the plant. The leak has been isolated and repairs are
4
underway. The plant should be back on line and manufacturing LNG within the next few weeks. This outage will impact our annualized production volumes by about 7,500 BOEPD and is reflected in the fourth quarter guidance.
In Norway the Alvheim FPSO construction has been completed and commissioning, although taking longer then we expected, is now nearly complete. We expect to sail out of the Haugesund ship yard by Mid-December. We will stop in Amofjord, which is near Stavanger, to install the thrusters and commission the fire water and sea water pumps before sailing to location. First production is expected in the first quarter but is dependent upon having a weather window conducive to safely linking the vessel to the loading bouy.
Our production for the year will fall within the prior guidance of 350,000 to 375,000 BOEPD, but near the low end attributable to these two events.
Now Gary Heminger will make some additional comments.
Thanks Steve. As Clarence mentioned, we closed the Western transaction on October 18, 2007 and yesterday we announced the approval of the Detroit upgrade and expansion project. But before I get into the linkage between these projects, and the value proposition for Marathon, I’d like to welcome Steve Reynish and his team to Marathon. We are excited not only to have the Western assets but we are also pleased to have been able to retain a highly talented staff which Steve will lead as President of Marathon Oil Canada. Steve most recently was the Executive Vice president and Chief Operating Officer of Western and prior to that was the president and Chief Operating Officer of Albian Sands Energy which operates the Muskeg River Mine on behalf of the Athabasca Oil Sands Project (or AOSP) owners. Steve and his team bring valuable knowledge to the operation of the business.
To help investors, analysts and other interested parties better understand our value proposition we’ve prepared the following slides to compare our project with that of a typical Alberta upgrader. I want to emphasize that this example provides an illustrative case of the preliminary and hopefully you will recognize that we have a long way to go in the commercial negotiations around areas such as transportation and so this analysis is not intended as a reflection of our economic case for the project.
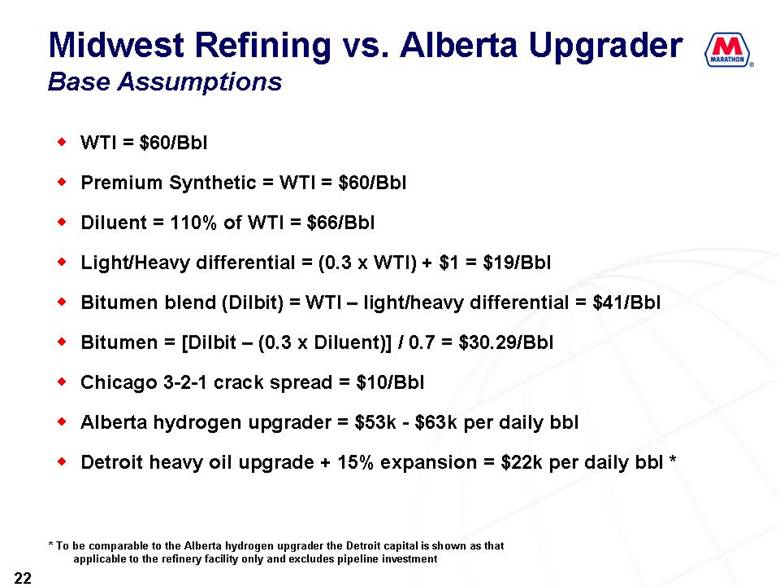
Slide 22 provides the relevant assumptions used in the rest of this presentation. While I won’t go over these individually I felt it important that you see what our the base assumptions for this illustrative case are and that they are reasonable, and not based on the much higher crude prices we’ve seen recently or the higher crack spreads refiners had this past summer.
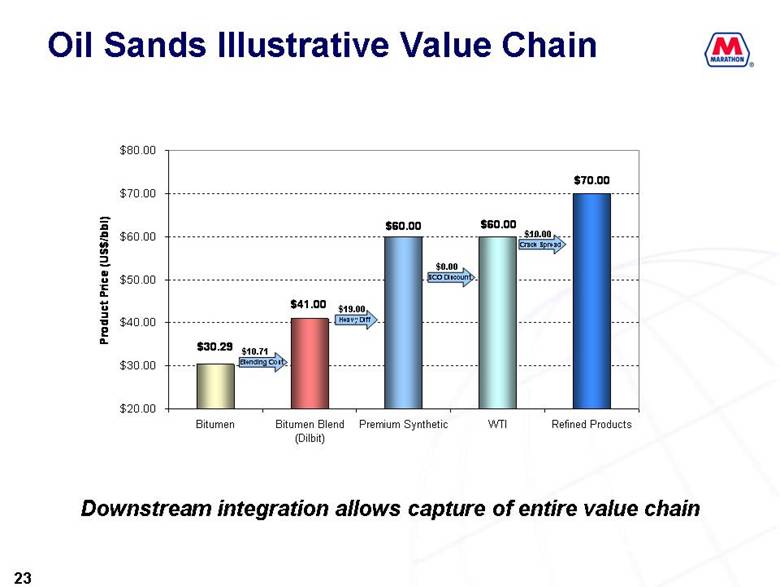
Moving on, slide 23 illustrates the typical value chain moving from bitumen to refined products, using the previously outlined price assumptions. This slide reflects the three value chain options available to a Canadian Heavy Oil producer: selling Dilbit, upgrading to a synthetic crude oil, or gaining access to a refinery with heavy oil capability. As shown here and as further demonstrated in the following slides, the Midwest refinery option clearly provides the highest value.
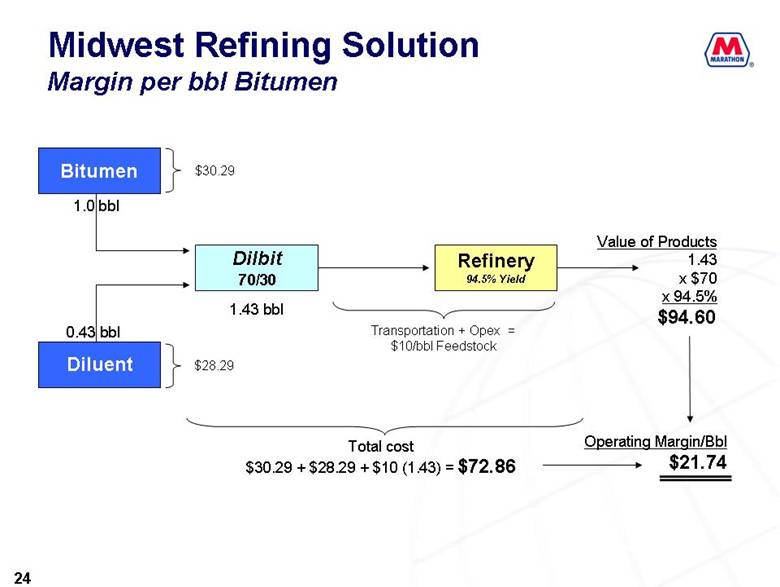
Moving to slide 24, and using the value chain just demonstrated, the value of linking our AOSP production with our Detroit refinery is further demonstrated. This slide reflects the margin value of a Midwest refinery heavy oil upgrading solution on a bitumen basis. Starting with a 70/30 blend or 1 barrel of Bitumen and 0.43 barrels of diluents and using the previously stated price assumptions, adding $10.00 per barrel transportation and refinery expenses, this refinery feedstock of 1.43 barrels is then converted into finished products valued at approximately $94.60. The result of this value chain is a margin of $21.74 per barrel of bitumen.
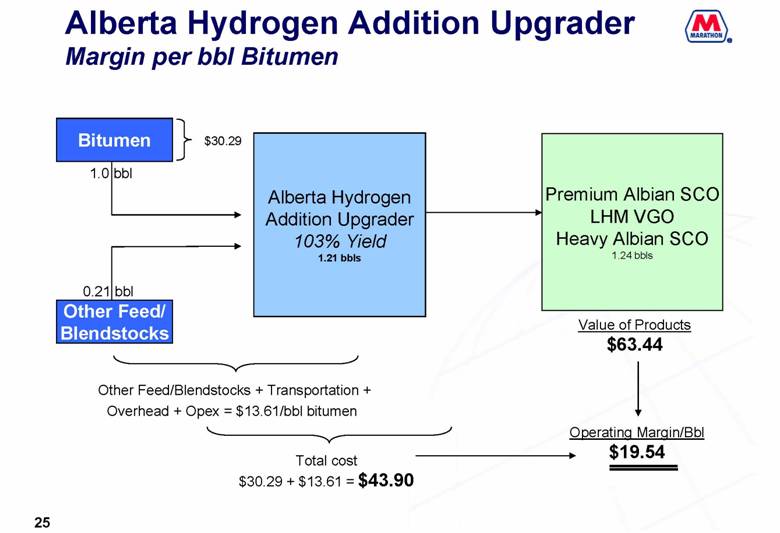
Slide 25 reflects the margin value calculation of a typical Alberta upgrader. This option also starts with 1 barrel of bitumen but the diluent is recycled to the mine for repeated blending purposes. Other blend stocks of approximately 0.21 barrels are necessary to optimize the upgrader option. It is estimated that total costs, including feedstocks and blendstocks, transportation, opex and overhead are approximately $13.61 per barrel of bitumen. The resulting blend of products reflects a yield of approximately 103% as a
5
result of the expansion that occurs during upgrading to the bitumen barrel. The product output of the upgrader consists of a mix of premium synthetic crude oil, vacuum gas oil and heavy synthetic crude oil which yields $63.44 of revenue for every barrel of bitumen processed resulting in an operating margin of $19.54 per barrel of bitumen.
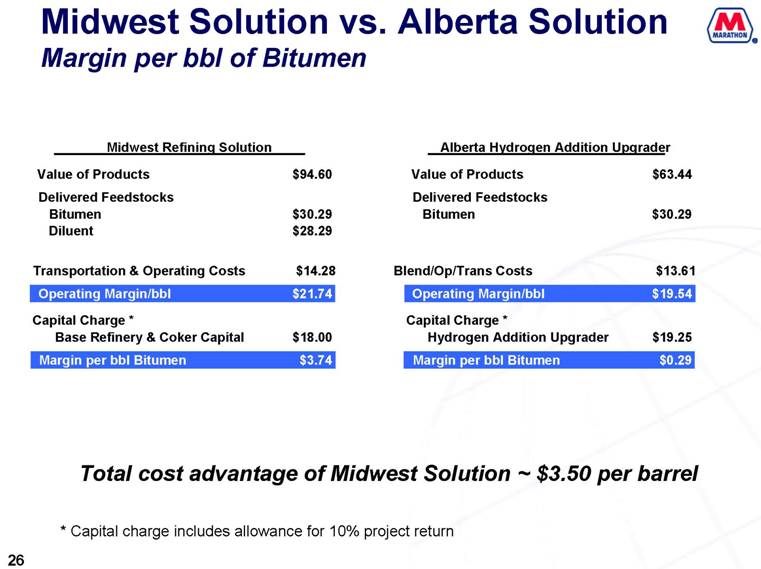
Slide 26, with a side-by-side comparison, illustrates the total value advantage of a Midwest refinery heavy oil upgrading solution when compared to an Alberta upgrader using the stated assumptions. As illustrated on the previous slides, there is an operating margin advantage of approximately $2.20 per barrel. In addition, as shown here, we estimate there is an additional value of approximately $1.25 per bitumen barrel when taking capital costs into consideration. This calculation imputes a market value for a base refinery to truly reflect comparable costs. In total, we believe Marathon’s integrated solution has approximately a $3.50 per bitumen barrel competitive advantage to upgrading at the field level. And with this solution, we are supplying refined product directly to a market that currently has excess demand.
And of course, we are still in the early days of our Canadian oil sands project and will continue to explore our options for gaining value from this asset. We continue to look at other potential long-term refining solutions within our network. And we look forward to working with our partners on the promising future of the AOSP project, including discussions about technology opportunities and options for optimizing the value of the current upgrader.
Let me finish by taking a few minutes to remark on the Alberta Royalty changes outlined in Premier Stelmach’s address last week. While we would have preferred that there would have been limited changes to the royalty regime, we believe there is minimal effect based on the pricing assumptions we used. It is disappointing the royalty will graduate with oil prices and this may limit upside and future capital spending. We will obviously continue to study and follow the open items still being discussed in the province pertaining to bitumen upgrading.
We are confident Marathon will deliver a superior competitive solution through the integration of the oil sands with our refining system. We will update you as we continue down the path of this integration.
Now I’ll turn the call back to Ken.
Thank you Gary. We will now open the call to questions. To accommodate all who want to ask questions we ask that you limit yourself to one question plus a follow up. You may reprompt for additional questions as time permits. For the benefit of all listeners we ask that you identify yourself and your affiliation.
6

| Third Quarter 2007 Earnings Conference Call and Web Cast November 1, 2007 |
| Except for historical information, this presentation contains forward-looking information with respect to the timing and levels of the company’s worldwide liquid hydrocarbon and natural gas production available for sale, integrated gas segment sales volumes, mined bitumen, net interest, administrative and exploration expenses and the effective tax rate. These statements are subject to risks and uncertainties that could cause actual results to differ materially from those expressed or implied from such information. The projected income, expense items and tax rate are preliminary estimates and are subject to change. In accordance with the “safe harbor” provisions of the Private Securities Litigation Reform Act of 1995, Marathon Oil Corporation has included in its Annual Report on Form 10-K for the year ended December 31, 2006, and subsequent Forms 8-K and 10-Q, cautionary language identifying important factors, though not necessarily all such factors, that could cause future outcomes to differ materially from those set forth in the forward-looking statements. Other Information In addition to net income determined in accordance with generally accepted accounting principles (GAAP), Marathon has provided supplementally “net income adjusted for special items,” a non-GAAP financial measure which facilitates comparisons to earnings forecasts prepared by stock analysts and other third parties. Such forecasts generally exclude the effects of items that are difficult to predict or to measure in advance and are not directly related to Marathon's ongoing operations. A reconciliation between GAAP net income and “net income adjusted for special items” is provided in a table on slide 3. “Net income adjusted for special items” should not be considered a substitute for net income as reported in accordance with GAAP. Management, as well as certain investors, uses “net income adjusted for special items” to evaluate Marathon's financial performance between periods. Management also uses “net income adjusted for special items” to compare Marathon's performance to certain competitors. Forward Looking Statement |
| Reconciliation Net Income to Adjusted Net Income -74 Foreign currency derivatives 1,548 1 -8 5 1,550 2Q 2007 707 1 -11 717 1Q 2007 19 Change in Accounting -31 -243 -21 Gain On Sale -93 -21 -15 Def Tax Adjustment 62 -139 -58 10 -45 45 48 97 33 UK Gas Contracts 838 22 1,079 4Q 2006 1,016 1,544 1,515 739 1,329 797 755 357 Adjusted Net Income* 7 Loss on debt retirement 1,021 1,623 1,748 784 1,265 770 673 324 Net Income 3Q 2007 3Q 2006 2Q 2006 1Q 2006 4Q 2005 3Q 2005 2Q 2005 1Q 2005 * See slide 2 of this presentation for a discussion of the use of the non-GAAP measure adjusted net income. |
| Adjusted Net Income Millions See slide 2 of this presentation for a discussion of the use of the non-GAAP measure adjusted net income and slide 3 for a reconciliation of net income adjusted for special items to net income. 3,238 4,636 3,271 357 739 707 755 1,515 1,548 797 1,544 1,016 1,329 838 $0 $500 $1,000 $1,500 $2,000 $2,500 $3,000 $3,500 $4,000 $4,500 $5,000 2005 2006 2007 1Q 2Q 3Q 4Q |
| Adjusted Net Income Per Diluted Share* Millions 4.51 6.42 See slide 2 of this presentation for a discussion of the use of the non-GAAP measure adjusted net income and slide 3 for a reconciliation of net income adjusted for special items to net income. * All per share data adjusted for 2-for-1 stock split effective June 18, 2007 4.75 0.51 1.00 1.02 1.08 2.08 2.25 1.08 2.15 1.48 1.80 1.19 $0 $1 $2 $3 $4 $5 $6 $7 2005 2006 2007 1Q 2Q 3Q 4Q |
| Adjusted Net Income 3Q 2007 vs. 3Q 2006 Millions 1,544 -102 -54 -938 544 1,016 22 $0 $200 $400 $600 $800 $1,000 $1,200 $1,400 $1,600 3Q 2006 E&P Price Variance (Pre-tax) E&P Volume Variance (Pre-tax) RM&T (Pre-tax) Income Taxes Other (Pre-tax) 3Q 2007 |
| Adjusted Net Income 3Q 2007 vs. 2Q 2007 Millions 1,548 -1,223 92 495 1,016 12 92 $0 $200 $400 $600 $800 $1,000 $1,200 $1,400 $1,600 $1,800 $2,000 2Q 2007 E&P Price Variance (Pre-tax) E&P Volume Variance (Pre-tax) RM&T (Pre-tax) Income Taxes Other (Pre-tax) 3Q 2007 |
| Upstream Segment Income 3Q 2007 vs. 2Q 2007 Millions 400 92 92 -64 479 27 -68 $0 $100 $200 $300 $400 $500 $600 2Q 2007 Price Variance (Pre-tax) Volume Variance (Pre-tax) Income Taxes Exploration Expense (Pre-tax) Other (Pre-tax) 3Q 2007 |
| Upstream Segment Income and Worldwide Sales Volumes 338 834 199 45.70 339 849 198 43.57 357 874 212 43.83 371 1,031 199 46.67 362 719 242 52.46 392 801 259 52.99 348 996 182 45.73 Gas (MMCFD) Total (MBOED) Liquids (MBD) Avg Realizations ($/BOE) Segment Income - Millions Sales Volumes - MBOED 465 659 From continuing operations 572 307 385 400 0.97 479 33 $0 $100 $200 $300 $400 $500 $600 $700 $800 1Q 2006 2Q 2006 3Q 2006 4Q 2006 1Q 2007 2Q 2007 3Q 2007 310 320 330 340 350 360 370 380 390 400 Domestic Income International Income WW Sales Volume Sales Volumes: |
| Domestic Upstream Income 3Q 2007 vs. 2Q 2007 Millions 173 5 -5 -6 147 -20 $0 $20 $40 $60 $80 $100 $120 $140 $160 $180 $200 2Q 2007 Price Variance (Pre-tax) Volume Variance (Pre-tax) Exploration Expense (Pre-tax) (Pre-tax) 3Q 2007 Other |
| Domestic Upstream Income and Sales Volumes 6.76 6.16 55.19 7.55 65.02 6.59 5.91 49.32 6.77 58.23 5.63 5.14 63.53 6.16 75.15 5.91 5.36 48.33 6.56 60.17 6.35 5.62 60.37 6.58 70.54 6.07 5.35 59.80 6.80 70.72 7.96 6.66 49.30 9.01 63.48 NYMEX prompt WTI ($/Bbl) Bid Week Nat Gas ($/MMBTU) Lower 48 Gas ($/MCF) Natural Gas ($/MCF) Liquids ($/Bbl) Income – Millions Sales Volumes - MBOED 10.13 8.34 -1.02 -1.13 -1.39 150 167 218 245 243 173 147 $0 $50 $100 $150 $200 $250 $300 1Q 2006 2Q 2006 3Q 2006 4Q 2006 1Q 2007 2Q 2007 3Q 2007 0 20 40 60 80 100 120 140 160 180 200 Income Sales Volumes Avg Realizations: |

| Domestic Upstream Expense and Profitability $/BOE 142 460 65 13.44 23.73 27.38 45.34 154 512 69 10.78 22.04 24.71 41.67 $/BOE 161 522 74 11.29 20.45 24.51 39.58 464 522 523 561 Nat Gas (MMCFD) 63 72 79 80 Liquids (MBD) 11.36 14.88 16.15 15.70 Income per BOE 140 159 166 174 Total (MBOED) 25.37 19.61 18.29 19.65 Expense w/out Expl. 22.31 45.83 21.04 45.21 29.47 45.47 21.43 44.25 Expense Avg. Realizations -1.64 -2.08 0 5 10 15 20 25 30 35 40 45 50 1Q 2006 2Q 2006 3Q 2006 4Q 2006 1Q 2007 2Q 2007 3Q 2007 Profitability Total Expense Average Realized Price Sales Volumes: |
| International Upstream Income 3Q 2007 vs. 2Q 2007 Millions 227 123 61 -63 332 33 -49 $0 $50 $100 $150 $200 $250 $300 $350 $400 $450 $500 2Q 2007 Price Variance (Pre-tax) Volume Variance (Pre-tax) Exploration Expense (Pre-tax) Income Taxes Other (Pre-tax) 3Q 2007 |
| International Upstream Income and Sales Volumes 2.27 61.02 68.76 Avg Realizations: 4.91 52.01 57.76 4.90 54.94 59.60 4.10 64.07 69.60 2.38 70.37 74.75 5.19 65.76 69.59 6.16 54.54 61.79 Dated Brent ($/Bbl) Natural Gas ($/MMCF) Liquids ($/Bbl) Sales Volumes - MBOED Income – Millions From continuing operations 5.99 9.35 0.11 227 332 140 354 416 235 220 $0 $50 $100 $150 $200 $250 $300 $350 $400 $450 1Q 2006 2Q 2006 3Q 2006 4Q 2006 1Q 2007 2Q 2007 3Q 2007 0 50 100 150 200 250 Income Sales Volumes |
| International Upstream Expense and Profitability 196 374 134 12.68 13.88 17.67 45.95 185 337 129 14.19 15.23 16.67 45.16 231 567 136 15.65 12.98 14.63 47.41 197 352 138 7.79 14.32 18.25 47.30 203 197 170 18.99 13.00 16.09 57.68 226 278 180 20.19 13.49 14.68 58.68 174 435 102 14.02 15.40 18.14 47.21 ($/BOE) Sales Volumes: Expense w/out Expl. Liquids (MBD) Nat Gas (MMCFD) Total (MBOED) Income per BOE Expense Avg. Realizations $/BOE From continuing operations 2.97 0.90 0 10 20 30 40 50 60 70 1Q 2006 2Q 2006 3Q 2006 4Q 2006 1Q 2007 2Q 2007 3Q 2007 Profitability Total Expense Average Realized Price |
| Downstream Segment Income and Refinery Throughputs 13.08 13.20 16.61 1,280 1,426 .3925 Market Prices: 12.28 4.91 5.26 1,195 1,343 .1246 12.41 2.47 3.56 1,212 1,389 .1707 11.66 5.91 7.77 1,249 1,434 .3271 9.77 6.01 10.51 1,241 1,440 .1717 12.49 10.35 11.68 1,245 1,461 .2978 13.97 4.72 4.24 1,147 1,417 .1137 12.57 6.70 7.97 1,239 1,504 .2184 1,467 1,477 1,370 Refined Products Sold (MBD) 10.48 10.10 9.56 1,195 .1774 11.22 5.29 5.96 1,187 .1592 2.22 USGC 6-3-2-1 ($/Bbl) 11.99 2.70 1,094 .0685 Chicago 6-3-2-1 ($/Bbl) Sweet/Sour Differential * ($/Bbl) Total Throughputs (MBD) Ref/Wholesale gross margin ($/gal) Segment Income – Millions Total Throughputs / Refined Products Sold- MBD * Sour = 15% Bow River, 15% Maya, 35% Kuwait, 35% Arab Medium 1,026 533 345 482 1,246 74 917 319 765 473 316 $0 $200 $400 $600 $800 $1,000 $1,200 $1,400 1Q 2005 2Q 2005 3Q 2005 4Q 2005 1Q 2006 2Q 2006 3Q 2006 4Q 2006 1Q 2007 2Q 2007 3Q 2007 0 200 400 600 800 1,000 1,200 1,400 1,600 Segment Income Total Throughputs Refined Products Sold |
| SSA Gasoline/Distillate Sales and Gross Margins 25.5 182 714 10.29 1,637 24.8 160 644 12.17 1,632 25.4 191 752 11.03 1,637 25.1 170 677 11.21 1,636 24.4 178 729 14.10 1,635 24.8 171 690 10.19 1,637 24.3 148 610 10.55 1,635 24.8 158 637 14.00 1,638 23.5 162 689 12.32 1,638 25.3 163 645 12.11 1,647 10.58 Light products gross margin (Cents/Gal) 25.5 143 560 1,659 SSA Retail Units Merchandise Margin - % Merch. Gross Margin ($MM) Merch. Sales ($MM) Sales - Million Gallons Gross Margin - Cents/Gal 842 800 828 892 816 745 825 776 834 867 822 650 700 750 800 850 900 950 1Q 2005 2Q 2005 3Q 2005 4Q 2005 1Q 2006 2Q 2006 3Q 2006 4Q 2006 1Q 2007 2Q 2007 3Q 2007 0 2 4 6 8 10 12 14 16 Gasoline/Dist Sales Gross Margin |
| Net Income ($ millions unless otherwise noted) 74 - - - - - - Foreign Currency Derivative 46% 717 (1) - - 11 707 - 707 (11) (19) 72 749 19 345 385 1Q 2007 44% 1,550 (1) - 8 (5) 1,548 - 1,548 34 (20) 96 1,658 12 1,246 400 2Q 42% 1,021 (7) - - (62) 1,016 - 1,016 (70) (19) 86 1,013 52 482 479 3Q 2006 40% 1,079 (22) 93 31 139 838 - 838 (58) (44) 97 833 (7) 533 307 4Q - - - Loss on Early Extinguishment of Debt 47% 784 - - 45 739 13 726 (38) 23 81 792 8 319 465 1Q 21 - Deferred Income Taxes Effective Tax Rate From Continuing Operations Net Income Gain on Sale Gain (Loss) on Long-term U.K. Nat Gas Contracts Adjusted Net Income Discontinued Operations Adjusted Income From Continuing Operations Unallocated Income Taxes Net Interest & Financing Costs (Income) (Before income tax) Unallocated Administrative Expense (Before income tax) Total Segment Income Integrated Gas Segment Income RM&T Segment Income E&P Segment Income 45% 46% 1,623 1,748 - 243 58 (10) 1,544 1,515 - 21 1,544 1,494 572 659 1,026 917 1,596 1,593 (19) 9 3Q 2Q 78 99 (7) (2) 17 (9) |
| Select Balance Sheet/Cash Flow Data Preliminary ($ billions unless otherwise noted) 1.1 1.0 7% 14.8 1.2 3.5 - 2.3 1Q 2007 3.1 2.4 8% 15.8 1.3 4.6 1.0 2.3 2Q 0.8 - - - - Trusteed funds from revenue bonds 4.6 3.0 11% 16.7 2.0 6.1 3.3 3Q 5.8 5.4 6% 14.6 0.9 3.5 2.6 4Q 2006 4.8 3.7 6% 14.5 0.9 3.7 2.8 3Q 0.9 0.2 17% 12.2 2.4 3.7 1.3 1Q 2.9 2.2 5% 13.5 0.7 3.7 3.0 2Q Net cash provided from continuing operations before changes in working capital Net cash provided from continuing operations Year-to-date: Cash adjusted debt-to-capital ratio Stockholders’ equity Cash adjusted total debt Total debt Cash and cash equivalents As of quarter ended: |
| 2007 Estimates Mining Segment Net Sales Volumes: 6 25 2,000-2,500 6,137 1,997 1,163 1,300-1,350 1,421 1,107 1,324 44-46 167-187 207-227 340-380 0-10 ~ 350 Year Est* 46 24 37 72 (19) 339 185 337 129 154 512 69 1QA 2007 44 68 47 96 (20) 338 196 374 134 142 460 65 2QA 42 35 53 86 (19) 371 231 567 136 140 464 63 3QA 44-46 40-60 70-90 86-126 58-68 330-355 192-209 400-475 125-130 138-146 480-505 58-62 4QE International ($ millions) Effective Tax Rate (Percent) Other Corporate & Unallocated Expense (Pre-tax) ($ millions) Domestic ($ millions) Liquids (MBD) Nat Gas (MMCFD) International Total (MBOED) Domestic Total (MBOED) Nat Gas (MMCFD) Liquids (MBD) Integrated Gas Net Sales Volumes: Interest & Financing Costs (Income) (Pre-tax) ($ millions) *Actual volumes shown are for sales volumes while estimated volumes shown are based upon production available for sale. Production available for sale may vary materially from production sold in any given period based on the timing of liquids liftings and natural gas sales, primarily in international operations. Domestic Sales Volumes: Total WW Production (MBOED) International Sale Volumes: Exploration Expense (Pre-tax): Methanol (metric tonnes/day) Worldwide LNG (metric tonnes/day) Mined Bitumen (MBD) |
| Canadian Oil Sands -Refining Integration November 1, 2007 |
| Midwest Refining vs. Alberta Upgrader Base Assumptions WTI = $60/Bbl Premium Synthetic = WTI = $60/Bbl Diluent = 110% of WTI = $66/Bbl Light/Heavy differential = (0.3 x WTI) + $1 = $19/Bbl Bitumen blend (Dilbit) = WTI – light/heavy differential = $41/Bbl Bitumen = [Dilbit – (0.3 x Diluent)] / 0.7 = $30.29/Bbl Chicago 3-2-1 crack spread = $10/Bbl Alberta hydrogen upgrader = $53k - $63k per daily bbl Detroit heavy oil upgrade + 15% expansion = $22k per daily bbl * * To be comparable to the Alberta hydrogen upgrader the Detroit capital is shown as that applicable to the refinery facility only and excludes pipeline investment |
| Oil Sands Illustrative Value Chain Downstream integration allows capture of entire value chain Blending Cost $10.71 Heavy Diff $19.00 SCO Discount $0.00 Crack Spread $10.00 $30.29 $41.00 $60.00 $60.00 $70.00 $20.00 $30.00 $40.00 $50.00 $60.00 $70.00 $80.00 Bitumen Bitumen Blend (Dilbit) Premium Synthetic WTI Refined Products Product Price (US$/bbl) |
| Midwest Refining Solution Margin per bbl Bitumen Bitumen $30.29 1.0 bbl Value of Products Dilbit Refinery 1.43 70/30 94.5% Yield x $70 x 94.5% 1.43 bbl $94.60 0.43 bbl Transportation + Opex = $10/bbl Feedstock Diluent $28.29 Total cost Operating Margin/Bbl $30.29 + $28.29 + $10 (1.43) = $72.86 $21.74 |
| Alberta Hydrogen Addition Upgrader Margin per bbl Bitumen Bitumen $30.29 1.0 bbl Alberta Hydrogen Premium AlbianSCO Addition Upgrader LHM VGO 103% Yield Heavy AlbianSCO 1.21 bbls 1.24 bbls 0.21 bbl Other Feed/ Blendstocks Value of Products $63.44 Other Feed/Blendstocks+ Transportation + Overhead + Opex= $13.61/bbl bitumen Operating Margin/Bbl $19.54 Total cost $30.29 + $13.61 = $43.90 |
| Midwest Solution vs. Alberta Solution Margin per bbl of Bitumen Midwest Refining Solution Alberta Hydrogen Addition Upgrader Value of Products $94.60 Value of Products $63.44 Delivered Feedstocks Delivered Feedstocks Bitumen $30.29 Bitumen $30.29 Diluent $28.29 Transportation & Operating Costs $14.28 Blend/Op/Trans Costs $13.61 Operating Margin/bbl $21.74 Operating Margin/bbl $19.54 Capital Charge * Capital Charge * Base Refinery & Coker Capital $18.00 Hydrogen Addition Upgrader $19.25 Margin per bbl Bitumen $3.74 Margin per bbl Bitumen $0.29 Total cost advantage of Midwest Solution ~ $3.50 per barrel * Capital charge includes allowance for 10% project return |


