Exhibit 13
SUN BANCORP, INC. AND SUBSIDIARIES
SELECTED FINANCIAL DATA
(Dollars in thousands, except per share amounts)
| | | | | | | | | | | | | | | | | | | | |
At or for the Years Ended December 31, | | 2012 | | | 2011 | | | 2010 | | | 2009 | | | 2008 | |
Selected Balance Sheet Data | | | | | | | | | | | | | | | | | | | | |
Total assets | | $ | 3,224,031 | | | $ | 3,183,916 | | | $ | 3,417,546 | | | $ | 3,578,905 | | | $ | 3,622,126 | |
Cash and investments | | | 631,596 | | | | 652,537 | | | | 680,719 | | | | 516,312 | | | | 512,017 | |
Loans receivable, net of allowance for loan losses | | | 2,351,222 | | | | 2,272,647 | | | | 2,453,457 | | | | 2,657,694 | | | | 2,702,516 | |
Total deposits | | | 2,713,224 | | | | 2,667,977 | | | | 2,940,460 | | | | 2,909,268 | | | | 2,896,364 | |
Borrowings | | | 70,992 | | | | 31,269 | | | | 33,417 | | | | 146,193 | | | | 154,097 | |
Junior subordinated debentures | | | 92,786 | | | | 92,786 | | | | 92,786 | | | | 92,786 | | | | 92,786 | |
Shareholders’ equity | | | 262,595 | | | | 309,083 | | | | 268,242 | | | | 356,593 | | | | 358,508 | |
Selected Results of Operations | | | | | | | | | | | | | | | | | | | | |
Interest income | | $ | 115,433 | | | $ | 126,680 | | | $ | 145,603 | | | $ | 150,999 | | | $ | 174,634 | |
Net interest income | | | 97,848 | | | | 103,528 | | | | 110,962 | | | | 100,157 | | | | 99,661 | |
Provision for loan losses | | | 57,215 | | | | 74,266 | | | | 101,518 | | | | 46,666 | | | | 20,000 | |
Net interest income after provision for loan losses | | | 40,633 | | | | 29,262 | | | | 9,444 | | | | 53,491 | | | | 79,661 | |
Non-interest income | | | 29,450 | | | | 13,468 | | | | 15,512 | | | | 17,070 | | | | 32,299 | |
Non-interest expense | | | 120,608 | | | | 110,225 | | | | 201,052 | | | | 104,067 | | | | 92,640 | |
Net (loss) income | | | (50,491 | ) | | | (67,505 | ) | | | (185,418 | ) | | | (17,131 | ) | | | 14,894 | |
Net (loss) income available to common shareholders | | | (50,491 | ) | | | (67,505 | ) | | | (185,418 | ) | | | (22,482 | ) | | | 14,894 | |
Per Share Data (1) | | | | | | | | | | | | | | | | | | | | |
(Loss) earnings per common share: | | | | | | | | | | | | | | | | | | | | |
Basic | | $ | (0.59 | ) | | $ | (0.88 | ) | | $ | (6.56 | ) | | $ | (0.97 | ) | | $ | 0.63 | |
Diluted | | | (0.59 | ) | | | (0.88 | ) | | | (6.56 | ) | | | (0.97 | ) | | | 0.62 | |
Book Value | | | 3.05 | | | | 3.61 | | | | 5.33 | | | | 15.29 | | | | 15.57 | |
Selected Ratios | | | | | | | | | | | | | | | | | | | | |
Return on average assets | | | (1.60 | )% | | | (2.05 | )% | | | (5.20 | )% | | | (0.47 | )% | | | 0.44 | % |
Return on average equity | | | (17.19 | ) | | | (22.57 | ) | | | (56.93 | ) | | | (4.44 | ) | | | 4.09 | |
Ratio of average equity to average assets | | | 9.31 | | | | 9.10 | | | | 9.13 | | | | 10.69 | | | | 10.72 | |
| (1) | Data is adjusted for a 5% stock dividend issued in May 2009. |
SUN BANCORP, INC. AND SUBSIDIARIES
MANAGEMENT’S DISCUSSION AND ANALYSIS OF FINANCIAL CONDITION
AND RESULTS OF OPERATIONS
(All dollar amounts except share and per share amounts presented in the tables are in thousands)
ORGANIZATION OF INFORMATION
Management’s Discussion and Analysis of Financial Condition and Results of Operations provides a narrative on the financial condition and results of operations of Sun Bancorp, Inc. (the “Company”) and should be read in conjunction with the accompanying consolidated financial statements. It includes the following sections:
| | • | | CRITICAL ACCOUNTING POLICIES, JUDGMENTS AND ESTIMATES |
| | • | | RECENT ACCOUNTING PRINCIPLES |
| | • | | LIQUIDITY AND CAPITAL RESOURCES |
| | • | | FORWARD-LOOKING STATEMENTS |
OVERVIEW
General Overview
The Company is a bank holding company headquartered in Vineland, New Jersey, and has an executive office in Mt. Laurel, New Jersey, with its principal subsidiary being Sun National Bank (the “Bank”). At December 31, 2012, the Company had total assets of $3.2 billion, total liabilities of $3.0 billion and total shareholders’ equity of $262.6 million. The Company’s principal business is to serve as a holding company for the Bank. As a registered bank holding company, the Company is subject to the supervision and regulation of the Board of Governors of the Federal Reserve System (the “FRB”).
Through the Bank, the Company provides commercial and consumer banking services. As of December 31, 2012, the Company had 62 locations throughout New Jersey.
The Company offers a comprehensive array of lending, depository and financial services to its commercial and consumer customers throughout the marketplace. The Company’s lending services to businesses include term loans and lines of credit, mortgage loans, construction loans and equipment leasing. The Company is a Preferred Lender with both the Small Business Administration (“SBA”) and the New Jersey Economic Development Authority. The Company’s commercial deposit services include business checking accounts and cash management services such as electronic banking, sweep accounts, lockbox services, online banking, remote deposit and controlled disbursement services. The Company’s lending services to consumers include residential mortgage loans, residential construction loans, second mortgage loans, home equity loans and installment loans. The Company’s consumer deposit services include checking accounts, savings accounts, money market deposits, certificates of deposit and individual retirement accounts. In addition, the Company offers mutual funds, securities brokerage, annuities and investment advisory services through a third-party arrangement.
The Company funds its lending activities primarily through retail and brokered deposits, the scheduled maturities of its investment portfolio and other wholesale funding sources.
As a financial institution with a primary focus on traditional banking activities, the Company generates the majority of its revenue through net interest income, which is defined as the difference between interest income earned on loans and investments and interest paid on deposits and borrowings. Growth in net interest income is dependent upon the Company’s ability to prudently manage the balance sheet for growth, combined with how successfully it maintains or increases net interest margin, which is net interest income as a percentage of average interest-earning assets.
The Company also generates revenue through fees earned on the various services and products offered to its customers and through sales of loans, primarily SBA loans and residential mortgages. Offsetting these revenue sources are provisions for credit losses on loans, operating expenses and income taxes.
2
Market Overview
The economic recovery has been slower than anticipated through most of 2012, but signs of growth have appeared in the fourth quarter of 2012 and continued into 2013. Interest rates have remained near historical lows. The unemployment rate in the U.S. remained stable at 7.8% in December 2012 from September 2012 and decreased from 8.5% in December 2011. According to recently released estimates, the U.S. gross domestic product for the fourth quarter of 2012 decreased at an annual rate of 0.1% as compared to 3.1% growth in the third quarter of 2012. This decrease primarily reflected a decrease in private inventory investment, federal government spending and exports, partially offset by increases in personal consumption and residential fixed investment and a decrease in imports. The increase in job growth which occurred during 2012 coupled with increased spending and some improvement in the housing sector have created some optimism in the markets that an economic recovery may be underway. However, the fiscal cliff talks and the debt crisis, both domestically and in Europe, as well as the continuing weakness in the housing sector have continued to temper that optimism.
At the state level, according to the latest South Jersey Business Survey produced by the Federal Reserve Bank of Philadelphia (the “Federal Reserve”), a modest increase in business activity was reported in the fourth quarter of 2012. Sales have been steady and employment continues to improve. Companies are optimistic about overall business growth over the next six months. In Northern New Jersey, business activity is expected to continue to increase at a slow pace. Overall, New Jersey’s unemployment rate remains one of the highest in the U.S at 9.6% as of December 2012.
At its latest meeting in January 2013, the FRB decided to keep the Federal Funds target rate unchanged in a continued effort to help stimulate economic growth. Since December 2008, the FRB has kept the Federal Funds rate, a key indicator of short-term rates such as credit card rates and HELOC rates, at a range of 0.00%-0.25% with the intent of encouraging consumers and businesses to borrow and spend to help jump start the economy. The FRB expects to maintain the current target range through late 2014. In addition, FRB policymakers decided to continue its program to extend the average maturity of its holdings of securities. The FRB policymakers continue to consider providing additional monetary policy accommodations to support the economic recovery.
The continued uncertainty with the economy, together with the challenging regulatory environment, will continue to affect the Company and the markets in which it does business, and may adversely impact the Company’s results in the future. The following discussion provides further detail on the financial condition and results of operations of the Company at and for the year ended December 31, 2012.
Executive Summary
The Company’s net loss available to common shareholders for 2012 was $50.5 million, or $0.59 per diluted share, compared to a net loss of $67.5 million, or $0.88 per diluted share, in 2011. The following is an overview of key factors affecting the Company’s results for 2012:
| | • | As part of a continuing strategy to reduce balance sheet risk, the Company signed a definitive agreement on January 17, 2013 to sell $45.8 million of loans, having a book balance of $35.1 million, to a third-party investor for gross proceeds of $22.0 million. As the formal approval to sell these loans occurred during 2012, the related loans were transferred to held-for-sale as of December 31, 2012 at lower of cost or market, which resulted in a net loss of $7.6 million after accounting for loan loss reserves, customer derivative termination costs, and other expenses. The transaction closed on February 8, 2013. In addition, the Company reached workout settlements with several troubled borrowers, resulting in a loss of $6.7 million in the fourth quarter of 2012. |
| | • | Provision expense totaled $57.2 million during 2012 as compared to $74.3 million during 2011. The allowance for loan losses equaled $45.9 million at December 31, 2012, an increase of $4.2 million from December 31, 2011. The allowance for loan losses equaled 2.02% of gross loans held-for-investment and 55.3% of non-performing loans held for investment at December 31, 2012 as compared to 1.82% and 38.7%, respectively, at December 31, 2011. |
| | • | Commercial loan production was $378 million during the year ended December 31, 2012 versus $323 million in the prior year. The Company continues to maintain a disciplined underwriting and pricing strategy in this uncertain economic environment. |
| | • | The net interest margin equaled 3.43% for 2012 versus 3.50% in 2011. The net interest margin in 2012 was negatively impacted by the maturity of legacy commercial loans as well as the overall low interest rate environment. |
3
| | • | | Non-interest income increased $16.0 million to $29.5 million during 2012 as compared to 2011 primarily due to a reduction of $10.3 million in negative derivative credit adjustments due to significant swap losses resulting from the loan sale and credit deterioration in the prior year. There also was an increase in gains on the sale of mortgage loans of $7.2 million over the same period. The Company’s residential mortgage operations were strong as $666 million in residential mortgage loans were closed during 2012 as compared to $192 million in 2011. These increases were partially offset by a decrease of $1.0 million in bank-owned life insurance income due to death benefits recognized in 2011. |
| | • | | Non-interest expense increased $10.4 million from $110.2 million in 2011 to $120.6 million in 2012. This increase was due primarily to an increase of $10.0 million in salaries and employee benefits resulting from the expansion of the Company’s mortgage operations in 2012. |
| | • | | Total risk-based capital was 13.72% at December 31, 2012, well above 11.50%, the regulatory required level. |
Impact of Hurricane Sandy
In late October 2012, many parts of New Jersey were devastated by the impact of Hurricane Sandy. The Company incurred additional expenses as a result of the impact of the storm on its own customers and its business operations. Due to the extent of damages and uninsured losses experienced by some of the Company’s commercial borrowers, additional loan loss reserves of $4.3 million were recorded in the fourth quarter of 2012 to reflect potential losses inherent in the portfolio as a result of Hurricane Sandy. Damages resulting from the storm to some of the Company’s facilities resulted in repair and clean-up costs of approximately $222 thousand which were also recognized in the fourth quarter of 2012.
CRITICAL ACCOUNTING POLICIES, JUDGMENTS AND ESTIMATES
The discussion and analysis of the financial condition and results of operations are based on the Consolidated Financial Statements, which are prepared in conformity with accounting principles generally accepted in the United States of America (“GAAP”). The preparation of these financial statements requires management to make estimates and assumptions affecting the reported amounts of assets and liabilities, disclosure of contingent assets and liabilities, and the reported amounts of income and expenses. Management evaluates these estimates and assumptions on an ongoing basis, including those related to the allowance for loan losses, goodwill, intangible assets, income taxes, stock-based compensation and the fair value of financial instruments. Management bases its estimates on historical experience and various other factors and assumptions that are believed to be reasonable under the circumstances. These form the basis for making judgments on the carrying value of assets and liabilities that are not readily apparent from other sources. Actual results may differ from these estimates under different assumptions or conditions.
Allowance for Loan Losses. Through the Bank, the Company originates loans that it intends to hold for the foreseeable future or until, maturity or repayment. The Company may not be able to collect all principal and interest due on these loans. The allowance for loan losses represents management’s estimate of probable credit losses inherent in the loan portfolio as of the balance sheet date. The determination of the allowance for loan losses requires management to make significant estimates with respect to the amounts and timing of losses, and market and economic conditions. The allowance for loan losses is maintained at a level that management considers adequate to provide for estimated losses and impairment based upon an evaluation of known and inherent risk in the loan portfolio. Loan impairment is evaluated based on the fair value of collateral or estimated net realizable value. A provision for loan losses is charged to operations based on management’s evaluation of the estimated losses that have been incurred in the Company’s loan portfolio. It is the policy of management to provide for losses on unidentified loans in its portfolio in addition to classified loans.
Management monitors its allowance for loan losses on a monthly basis and makes adjustments to the allowance through the provision for loan losses as economic conditions and other pertinent factors indicate. The quarterly review and adjustment of the qualitative factors employed in the allowance methodology and the updating of historic loss experience allow for timely reaction to emerging conditions and trends. In this context, a series of qualitative factors are used in a methodology as a measurement of how current circumstances are affecting the loan portfolio. Included in these qualitative factors are:
| | • | | Levels of past due, classified and non-accrual loans, troubled debt restructurings and modifications |
| | • | | Nature and volume of loans |
| | • | | Changes in lending policies and procedures, underwriting standards, collections, charge-offs and recoveries, and for commercial loans, the level of loans being approved with exceptions to policy |
| | • | | Experience, ability and depth of management and staff |
4
| | • | | National and local economic and business conditions, including various market segments |
| | • | | Quality of the Company’s loan review system and degree of Board oversight |
| | • | | Concentrations of credit by industry, geography and collateral type, with a specific emphasis on real estate, and changes in levels of such concentrations |
| | • | | Effect of external factors, including the deterioration of collateral values on the level of estimated credit losses in the current portfolio |
Additionally, historic loss experience over a three-year loss horizon, based on a rolling 12-quarter migration analysis, is taken into account for commercial loans and historic loss experience over the more conservative of either the trailing four or eight quarters is calculated for non-commercial loans. In determining the allowance for loan losses, management has established both specific and general pooled allowances. Values assigned to the qualitative factors and those developed from historic loss experience provide a dynamic basis for the calculation of reserve factors for both pass-rated loans (general pooled allowance) and those deemed impaired (specific allowance). A specific allowance is calculated on individually identified impaired loans. Loans not individually reviewed are evaluated as a group using reserve factor percentages based on historic loss experience and the qualitative factors described above. In determining the appropriate level of the general pooled allowance, management makes estimates based on internal risk ratings, which take into account such factors as debt service coverage, loan-to-value ratios and external factors. Estimates are periodically measured against actual loss experience.
As changes in the Company’s operating environment occur and as recent loss experience fluctuates, the factors for each category of loan based on type and risk rating will change to reflect current circumstances and the quality of the loan portfolio. Given that the components of the allowance are based partially on historical losses and on risk rating changes in response to recent events, required reserves may trail the emergence of any unforeseen deterioration in credit quality.
Although the Company maintains its allowance for loan losses at levels considered adequate to provide for the inherent risk of loss in its loan portfolio, if economic conditions differ substantially from the assumptions used in making the evaluations or loan performance deteriorates further from current levels, there can be no assurance that future losses will not exceed estimated amounts or that additional provisions for loan losses will not be required in future periods. Accordingly, the current state of the national economy and local economies of the areas in which the loans are concentrated and their slow recovery from a severe recession could result in an increase in loan delinquencies, foreclosures or repossessions resulting in increased charge-off amounts and the need for additional loan loss allowances in future periods. In addition, the Company’s determination as to the amount of its allowance for loan losses is subject to review by the Bank’s primary regulator, the Office of the Comptroller of the Currency (the “OCC”), as part of its examination process, which may result in the establishment of an additional allowance based upon the judgment of the OCC after a review of the information available at the time of the OCC examination.
Accounting for Income Taxes. The Company accounts for income taxes in accordance with Financial Accounting Standards Board Accounting Standards Codification (“FASB ASC”) 740, Income Taxes(“FASB ASC 740”). FASB ASC 740 requires the recording of deferred income taxes that reflect the net tax effects of temporary differences between the carrying amounts of assets and liabilities for financial reporting purposes and the amounts used for income tax purposes. Management exercises significant judgment in the evaluation of the amount and timing of the recognition of the resulting tax assets and liabilities. The judgments and estimates required for the evaluation are updated based upon changes in business factors and the tax laws. If actual results differ from the assumptions and other considerations used in estimating the amount and timing of tax recognized, there can be no assurance that additional expenses will not be required in future periods. The Company recognizes, when applicable, interest and penalties related to unrecognized tax benefits in the provision for income taxes in the consolidated statements of operations. Assessment of uncertain tax positions under FASB ASC 740 requires careful consideration of the technical merits of a position based on management’s analysis of tax regulations and interpretations. Significant judgment may be involved in applying the requirements of FASB ASC 740.
Management expects that the Company’s adherence to FASB ASC 740 may result in increased volatility in quarterly and annual effective income tax rates, as FASB ASC 740 requires that any change in judgment or change in measurement of a tax position taken in a prior period be recognized as a discrete event in the period in which it occurs. Factors that could impact management’s judgment include changes in income, tax laws and regulations, and tax planning strategies.
5
Fair Value Measurement. The Company accounts for fair value measurement in accordance with FASB ASC 820, Fair Value Measurements and Disclosures(“FASB ASC 820”). FASB ASC 820 establishes a framework for measuring fair value. FASB ASC 820 defines fair value as the price that would be received to sell an asset or paid to transfer a liability in an orderly transaction between market participants at the measurement date, emphasizing that fair value is a market-based measurement and not an entity-specific measurement. FASB ASC 820 clarifies the application of fair value measurement in a market that is not active. FASB ASC 820 also includes additional factors for determining whether there has been a significant decrease in market activity, affirms the objective of fair value when a market is not active, eliminates the presumption that all transactions are not orderly unless proven otherwise, and requires an entity to disclose inputs and valuation techniques, and changes therein, used to measure fair value. FASB ASC 820 addresses the valuation techniques used to measure fair value. These valuation techniques include the market approach, income approach and cost approach. The market approach uses prices or relevant information generated by market transactions involving identical or comparable assets or liabilities. The income approach involves converting future amounts to a single present amount. The measurement is valued based on current market expectations about those future amounts. The cost approach is based on the amount that currently would be required to replace the service capacity of the asset.
FASB ASC 820 establishes a fair value hierarchy, which prioritizes the inputs to valuation techniques used to measure fair value into three broad levels. The fair value hierarchy gives the highest priority to quoted prices in active markets for identical assets or liabilities (Level 1) and the lowest priority to unobservable inputs (Level 3). A financial instrument’s categorization within the fair value hierarchy is based upon the lowest level of input that is significant to the instrument’s fair value measurement. The three levels within the fair value hierarchy are described as follows:
| • Level 1 — | Quoted prices (unadjusted) in active markets for identical assets or liabilities. |
| • Level 2 — | Inputs other than quoted prices included within Level 1 that are observable for the asset or liability, either directly or indirectly. Level 2 inputs include: quoted prices for similar assets or liabilities in active markets; quoted prices for identical or similar assets or liabilities in markets that are not active; inputs other than quoted prices that are observable for the asset or liability; and inputs that are derived principally from or corroborated by observable market data by correlation or other means. |
| • Level 3 — | Unobservable inputs that are supported by little or no market activity and that are significant to the fair value of the assets or liabilities. Level 3 assets and liabilities include financial instruments whose value is determined using pricing models, discounted cash flow methodologies, or similar techniques, as well as instruments for which the determination of fair value requires significant management judgment or estimation. |
The Company measures financial assets and liabilities at fair value in accordance with FASB ASC 820. These measurements involve various valuation techniques and models, which involve inputs that are observable, when available, and include the following significant financial instruments: investment securities available for sale and derivative financial instruments. The following is a summary of valuation techniques utilized by the Company for its significant financial assets and liabilities which are measured at fair value on a recurring basis.
Investment securities available-for-sale. Where quoted prices are available in an active market, securities are classified within Level 1 of the valuation hierarchy. If quoted market prices are not available, then fair values are estimated using quoted prices of securities with similar characteristics or discounted cash flows based on observable market inputs and are classified within Level 2 of the fair value hierarchy. In certain cases where there is limited activity or less transparency around inputs to the valuation, securities are classified within Level 3 of the valuation hierarchy. Level 3 market value measurements include an internally developed discounted cash flow model combined with using market data points of similar securities with comparable credit ratings in addition to market yield curves with similar maturities in determining the discount rate. In addition, significant estimates and unobservable inputs are required in the determination of Level 3 market value measurements. If actual results differ significantly from the estimates and inputs applied, it could have a material effect on the Company’s consolidated financial statements.
Derivative financial instruments. The Company’s derivative financial instruments are not exchange-traded and therefore are valued utilizing models that use as their basis readily observable market parameters, specifically the London Interbank Offered Rate (“LIBOR”) swap curve, and are classified within Level 2 of the valuation hierarchy.
Residential mortgage loans held-for-sale. Effective July 1, 2012, the Company’s residential mortgage loans held-for-sale were recorded at fair value utilizing Level 2 measurements. This fair value measurement is determined based upon third party quotes obtained on similar loans.
The Company adopted the fair value option on these loans which allows the Company to record the mortgage loans held-for-sale portfolio at fair market value as opposed to the lower of cost or market. The Company economically hedges its residential loans held for sale portfolio with forward sale agreements which are reported at fair value. A lower of cost or market accounting treatment would not allow the Company to record the excess of the fair market value over book value but would require the Company to record the corresponding reduction in value on the hedges. Both the loans and related hedges are carried at fair value which reduces earnings volatility as the amounts more closely offset, particularly in environments when interest rates are declining. For loans held-for-sale for which the fair value option has been elected, the aggregate fair value exceeded the aggregate principal balance by $2.1 million as of December 31, 2012.
6
Interest rate lock commitments on residential mortgages.The Company enters into interest rate lock commitments on its residential mortgage loans originated for sale. The determination of the fair value of interest rate lock commitments is based on agreed upon pricing with the respective investor on each loan and includes a pull through percentage. The pull through percentage represents an estimate of loans in the pipeline to be delivered to an investor versus the total loans committed for delivery. Significant changes in this input could result in a significantly higher or lower fair value measurement. As the pull through percentage is a significant unobservable input, this is deemed a Level 3 valuation input. The pull through percentage, which is based upon historical experience, was 70% as of December 31, 2012.
In addition, certain assets are measured at fair value on a nonrecurring basis; that is, the instruments are not measured at fair value on an ongoing basis but are subject to fair value adjustments in certain circumstances (for example, when there is evidence of impairment). The Company measures impaired loans, commercial loans held-for-sale, SBA servicing assets, restricted equity investments and loans or bank properties transferred into other real estate owned at fair value on a non-recurring basis.
Valuation techniques and models utilized for measuring financial assets and liabilities are reviewed and validated by the Company at least quarterly.
Goodwill. Goodwill is the excess of the fair value of liabilities assumed over the fair value of tangible and identifiable intangible assets acquired in a business combination. Goodwill is not amortized but is tested for impairment annually or more frequently if events or changes in circumstances indicate that the asset might be impaired. The Company tests goodwill for impairment annually. The Company elected not to apply the qualitative evaluation option permitted under Accounting Standards Update 2011-8,Intangibles – Goodwill and Other (Topic 35): Testing Goodwill for Impairment,issued in September 2011. Therefore, the Company utilizes the two-step goodwill impairment test outlined in FASB ASC 350,Intangibles – Goodwill and Other. Significant judgment is applied when goodwill is assessed for impairment. Step one, which is used to identify potential impairment, compares the fair value of the reporting unit with its carrying amount, including goodwill. As defined in FASB ASC 280,Segment Reporting, a reporting unit is an operating segment or one level below an operating segment. The Company has one reportable operating segment, “Community Banking”, as defined in Note 2 of the Notes to Consolidated Financial Statements. If the fair value of a reporting unit exceeds its carrying value, goodwill of the reporting unit is considered not impaired and step two is therefore unnecessary. If the carrying amount of the reporting unit exceeds its fair value, the second step is performed to measure the amount of the impairment loss, if any. An implied loss is recorded to the extent that the carrying amount of goodwill exceeds its implied fair value.
The Company performed a goodwill impairment analysis at December 31, 2012. In performing step one of the impairment analysis, the Company estimated the fair value of the Company through the consideration of its quoted market valuation, market earnings multiples of peer companies and market earnings multiples of peer companies adjusted to include a market observed control premium (i.e., its acquisition value relative to its peers). The considerations above are sensitive to both the fluctuation of the Company’s stock price and those of peer companies. The step one impairment test completed at December 31, 2012 indicated that the Company’s fair value was above its carrying value, and therefore the Company did not need to perform a step two analysis. As a result, the Company’s goodwill balance was not considered impaired at December 31, 2012.
However, given the continued turmoil in the capital markets and with bank stocks in general, it is possible that our assumptions and conclusions regarding the valuation of our Company could change adversely in the future and could result in impairment of the Company’s goodwill. While any charge resulting from a partial or full impairment of goodwill would be a non-cash charge and have no impact on the Company’s regulatory capital, the charge could have a material adverse impact on our financial position and results of operations. For more information on goodwill, see Notes 2 and 10 of the Notes to Consolidated Financial Statements.
RECENT ACCOUNTING PRINCIPLES
In February 2013, the FASB issued Accounting Standards Update (“ASU”) 2013-02,Comprehensive Income (Topic 220): Reporting of Amounts Reclassified Out of Accumulated Other Comprehensive Income.The amendments in this update aim to improve the reporting of reclassifications out of accumulated other comprehensive income. The amendments seek to attain that objective by requiring an entity to report the effect of significant reclassifications out of accumulated other comprehensive income on the respective line items in net income if the amount being reclassified is required under GAAP to be reclassified in its entirety to net income. For other amounts that are not required under GAAP to be reclassified in their entirety to net income in the same reporting period, an entity is required to cross-reference other disclosures required under GAAP that provide additional detail about those amounts. This would be the case when a portion of the amount reclassified out of accumulated other comprehensive income is reclassified to a balance sheet account instead of directly to income or expense in the same reporting period. For public entities, the amendments are effective prospectively for reporting periods beginning after December 15, 2012. The Company is currently evaluating the impact of the adoption of this accounting standards update on its financial statements.
7
In July 2012, the FASB issued ASU 2012-02,Intangibles – Goodwill and Other (Topic 350): Testing Indefinite-Lived Intangible Assets for Impairment. This amendment provides an entity with the option first to assess qualitative factors to determine whether the existence of events and circumstances indicates that it is more likely than not that the indefinite-lived intangible asset is impaired. If, after assessing the totality of events and circumstances, an entity concludes that it is not more likely than not that the indefinite-lived intangible asset is impaired, then the entity is not required to take further action. However, if an entity concludes otherwise, then it is required to determine the fair value of the indefinite-lived intangible asset and perform the quantitative impairment test by comparing the fair value with the carrying amount in accordance with Subtopic 350-30. This amendment is effective for public entities for annual and interim impairment tests performed for fiscal years beginning after September 15, 2012. The guidance will have no impact on the Company as it does not have any indefinite-lived intangible assets.
In December 2011, the FASB issued ASU 2011-11,Balance Sheet (Topic 210): Disclosures about Offsetting Assets and Liabilities (“ASU 2011-11”).This amendment results in common offsetting requirements and disclosure requirements in GAAP and International Financial Reporting Standards (“IFRS”). This guidance is not intended to change, but enhance, the application requirements in FASB ASC 210,Balance Sheet (“FASB ASC 210”). This guidance is effective for public entities during interim and annual periods beginning after January 1, 2013. This guidance amends only the disclosure requirements and not the application of the accounting standard. In January 2013, the FASB issued Accounting Standards Update (“ASU”) 2013-01,Balance Sheet (Topic 210): Clarifying the Scope of Disclosures about Offsetting Assets and Liabilities. The amendments in this update clarify that the scope of ASU 2011-11 applies to derivatives accounted for in accordance with FASB ASC 815, Derivatives and Hedging (“FASB ASC 815”), including bifurcated embedded derivatives, repurchase agreements and reverse repurchase agreements, and securities borrowing and securities lending transactions that are either offset in accordance with FASB ASC 210 or FASB ASC 815 or subject to an enforceable master netting arrangement or similar agreement. This guidance is effective for fiscal years beginning on or after January 1, 2013, and interim periods within those annual periods. An entity should provide the required disclosures retrospectively for all comparative periods presented. The Company is currently evaluating the impact of the adoption of these accounting standards updates on its financial statements.
In June 2011, the FASB issued ASU 2011-05,Comprehensive Income (Topic 220): Presentation of Comprehensive Income. Subsequently in December 2011, the FASB issued ASU 2011-12,Deferral of the Effective Date for Amendments to the Presentation of Reclassifications of Items Out of Accumulated Other Comprehensive Income in Accounting Standards Update No. 2011-05. This guidance eliminates the presentation option of presenting the component of other comprehensive income as part of the statement of changes in stockholders’ equity. In addition, the updates to comprehensive income guidance require all nonowner changes in stockholders’ equity be presented either in a single continuous statement of comprehensive income or two separate but consecutive statements. The Company elected to adopt the two statement approach. In this two statement approach, the first statement should present total net income and its components followed consecutively by a second statement that should present total other comprehensive income, the components of other comprehensive income and the total of comprehensive income. These changes apply to both annual and interim financial statements. The Company adopted the new accounting guidance effective January 1, 2012, and applied it retrospectively to fiscal years 2011 and 2010. The adoption added the consolidated statements of comprehensive loss but did not impact the Company’s results of operations, financial position, or cash flows.
In May 2011, the FASB issued ASU 2011-04,Amendments to Achieve Common Fair Value Measurement and Disclosure Requirements in U.S. GAAP and IFRS, to achieve common fair value measurement and disclosure requirements between U.S. GAAP and international accounting principles. While the overall guidance is consistent with U.S. GAAP, the amendment includes additional fair value disclosure requirements. The amendments in the guidance are effective for interim and annual periods beginning after December 15, 2011. The adoption of this amendment did not have a material effect on the Company’s financial statements; however, the adoption did result in expanded fair value disclosures in Note 24.
RESULTS OF OPERATIONS
The following discussion focuses on the major components of the Company’s operations and presents an overview of the significant changes in the results of operations during the past three fiscal years. This discussion should be reviewed in conjunction with the consolidated financial statements and notes thereto presented elsewhere in this Annual Report. All earnings per share amounts are presented assuming dilution.
Net Interest Income. Net interest income is the most significant component of the Company’s income from operations. Net interest income is the difference between interest earned on total interest-earning assets (primarily loans and investment securities), on a fully taxable equivalent basis, where appropriate, and interest paid on total interest-bearing liabilities (primarily deposits and borrowed funds). Fully taxable equivalent basis represents income on total interest-earning assets that is either tax-exempt or taxed at a reduced rate, adjusted to give effect to the prevailing incremental federal tax rate, and adjusted for nondeductible carrying costs and state income taxes, where applicable. Yield calculations, where appropriate, include these adjustments. Net interest income depends on the volume and interest rate earned on interest-earning assets, and the volume and interest rate paid on interest-bearing liabilities.
8
The Company’s net interest margin and interest rate spread in 2012 were 3.43% and 3.27%, respectively, as compared to 3.50% and 3.30%, respectively, for 2011 and 3.50% and 3.28%, respectively, for 2010. The margin decrease from 2011 is due primarily to the decline in the yield on interest-bearing assets of 23 basis points, which was partially offset by a decline of 20 basis points in costs of interest-bearing liabilities. The margin impact of the decline in yield on interest-bearing assets of 31 basis points in 2011 from 2010 was almost directly offset by a decline of 33 basis points in costs of interest-bearing liabilities.
Net interest income (on a tax-equivalent basis) decreased $6.2 million, or 5.9%, to $98.7 million for 2012 compared to $104.9 million for 2011. Net interest income (on a tax-equivalent basis) decreased $7.9 million, or 7.0%, to $104.9 million for 2011 compared to $112.8 million for 2010.
Table 1 provides detail regarding the Company’s average daily balances with corresponding interest income (on a tax-equivalent basis) and interest expense, as well as yield and cost information for the years ended December 31, 2012, 2011 and 2010. Average balances are derived from daily balances. Table 2 further provides certain information regarding changes in interest income and interest expense of the Company for the years ended December 31, 2012, 2011 and 2010.
TABLE 1: STATEMENTS OF AVERAGE BALANCES, INCOME OR EXPENSE, YIELD OR COST
| | | | | | | | | | | | | | | | | | | | | | | | | | | | | | | | | | | | |
Years Ended December 31, | | 2012 | | | 2011 | | | 2010 | |
| | | Average | | | Income/ | | | Yield/ | | | Average | | | Income/ | | | Yield/ | | | Average | | | Income/ | | | Yield/ | |
| | | Balance | | | Expense | | | Cost | | | Balance | | | Expense | | | Cost | | | Balance | | | Expense | | | Cost | |
Interest-earning assets: | | | | | | | | | | | | | | | | | | | | | | | | | | | | | | | | | | | | |
Loans receivable (1), (2): | | | | | | | | | | | | | | | | | | | | | | | | | | | | | | | | | | | | |
Commercial and industrial | | $ | 1,814,626 | | | $ | 82,165 | | | | 4.53 | % | | $ | 1,954,701 | | | $ | 92,107 | | | | 4.71 | % | | $ | 2,245,118 | | | $ | 105,210 | | | | 4.69 | % |
Home equity | | | 216,218 | | | | 8,738 | | | | 4.04 | | | | 232,278 | | | | 9,774 | | | | 4.21 | | | | 251,599 | | | | 11,714 | | | | 4.66 | |
Second mortgage | | | 37,021 | | | | 2,128 | | | | 5.75 | | | | 48,998 | | | | 2,863 | | | | 5.84 | | | | 62,349 | | | | 3,889 | | | | 6.24 | |
Residential real estate | | | 207,553 | | | | 8,199 | | | | 3.95 | | | | 87,858 | | | | 4,547 | | | | 5.18 | | | | 79,547 | | | | 4,415 | | | | 5.55 | |
Other | | | 35,636 | | | | 2,477 | | | | 6.95 | | | | 51,041 | | | | 3,502 | | | | 6.86 | | | | 60,874 | | | | 4,163 | | | | 6.84 | |
| | | | | | | | | | | | | | | | | | | | | | | | | | | | | | | | | | | | |
Total loans receivable | | | 2,311,054 | | | | 103,707 | | | | 4.49 | | | | 2,374,876 | | | | 112,793 | | | | 4.75 | | | | 2,699,487 | | | | 129,391 | | | | 4.79 | |
Investment securities (3) | | | 537,710 | | | | 12,529 | | | | 2.33 | | | | 505,006 | | | | 14,940 | | | | 2.96 | | | | 452,365 | | | | 17,846 | | | | 3.95 | |
Interest-earning deposits with banks | | | 28,646 | | | | 68 | | | | 0.24 | | | | 117,830 | | | | 288 | | | | 0.24 | | | | 69,803 | | | | 166 | | | | 0.24 | |
| | | | | | | | | | | | | | | | | | | | | | | | | | | | | | | | | | | | |
Total interest-earning assets | | | 2,877,410 | | | | 116,304 | | | | 4.04 | | | | 2,997,712 | | | | 128,021 | | | | 4.27 | | | | 3,221,655 | | | | 147,403 | | | | 4.58 | |
| | | | | | | | | | | | | | | | | | | | | | | | | | | | | | | | | | | | |
Non-interest-earning assets: | | | | | | | | | | | | | | | | | | | | | | | | | | | | | | | | | | | | |
Cash and due from banks | | | 73,000 | | | | | | | | | | | | 72,455 | | | | | | | | | | | | 47,393 | | | | | | | | | |
Bank properties and equipment, net | | | 52,781 | | | | | | | | | | | | 54,589 | | | | | | | | | | | | 52,944 | | | | | | | | | |
Goodwill and intangible assets, net | | | 43,280 | | | | | | | | | | | | 46,961 | | | | | | | | | | | | 95,010 | | | | | | | | | |
Other assets | | | 108,299 | | | | | | | | | | | | 114,158 | | | | | | | | | | | | 150,558 | | | | | | | | | |
| | | | | | | | | | | | | | | | | | | | | | | | | | | | | | | | | | | | |
Total non-interest-earning assets | | | 277,360 | | | | | | | | | | | | 288,163 | | | | | | | | | | | | 345,905 | | | | | | | | | |
| | | | | | | | | | | | | | | | | | | | | | | | | | | | | | | | | | | | |
Total assets | | $ | 3,154,770 | | | | | | | | | | | $ | 3,285,875 | | | | | | | | | | | $ | 3,567,560 | | | | | | | | | |
| | | | | | | | | | | | | | | | | | | | | | | | | | | | | | | | | | | | |
Interest-bearing liabilities: | | | | | | | | | | | | | | | | | | | | | | | | | | | | | | | | | | | | |
Interest-bearing deposit accounts: | | | | | | | | | | | | | | | | | | | | | | | | | | | | | | | | | | | | |
Interest-bearing demand deposits | | $ | 1,225,609 | | | $ | 4,778 | | | | 0.39 | % | | $ | 1,317,816 | | | $ | 7,024 | | | | 0.53 | % | | $ | 1,312,871 | | | $ | 10,692 | | | | 0.81 | % |
Savings deposits | | | 263,307 | | | | 900 | | | | 0.34 | | | | 271,970 | | | | 1,412 | | | | 0.52 | | | | 295,121 | | | | 2,283 | | | | 0.77 | |
Time deposits | | | 643,822 | | | | 7,876 | | | | 1.22 | | | | 675,464 | | | | 10,301 | | | | 1.53 | | | | 899,038 | | | | 15,805 | | | | 1.76 | |
| | | | | | | | | | | | | | | | | | | | | | | | | | | | | | | | | | | | |
Total interest-bearing deposit accounts | | | 2,132,738 | | | | 13,554 | | | | 0.64 | | | | 2,265,250 | | | | 18,737 | | | | 0.83 | | | | 2,507,030 | | | | 28,780 | | | | 1.15 | |
| | | | | | | | | | | | | | | | | | | | | | | | | | | | | | | | | | | | |
Short-term borrowings: | | | | | | | | | | | | | | | | | | | | | | | | | | | | | | | | | | | | |
Federal funds purchased | | | 5,437 | | | | 20 | | | | 0.37 | | | | 36 | | | | — | | | | — | | | | 16,907 | | | | 89 | | | | 0.53 | |
Repurchase agreements with customers | | | 5,157 | | | | 7 | | | | 0.14 | | | | 6,681 | | | | 7 | | | | 0.10 | | | | 16,069 | | | | 29 | | | | 0.18 | |
Long-term borrowings: | | | | | | | | | | | | | | | | | | | | | | | | | | | | | | | | | | | | |
FHLBNY advances (4) | | | 37,038 | | | | 898 | | | | 2.42 | | | | 18,316 | | | | 884 | | | | 4.83 | | | | 22,710 | | | | 1,076 | | | | 4.74 | |
Obligation under capital lease | | | 7,737 | | | | 513 | | | | 6.63 | | | | 7,988 | | | | 527 | | | | 6.60 | | | | 8,212 | | | | 550 | | | | 6.70 | |
Junior subordinated debentures | | | 92,786 | | | | 2,594 | | | | 2.80 | | | | 92,786 | | | | 2,997 | | | | 3.23 | | | | 92,786 | | | | 4,117 | | | | 4.44 | |
| | | | | | | | | | | | | | | | | | | | | | | | | | | | | | | | | | | | |
Total borrowings | | | 148,155 | | | | 4,032 | | | | 2.72 | | | | 125,807 | | | | 4,415 | | | | 3.51 | | | | 156,684 | | | | 5,861 | | | | 3.74 | |
| | | | | | | | | | | | | | | | | | | | | | | | | | | | | | | | | | | | |
Total interest-bearing liabilities | | | 2,280,893 | | | | 17,586 | | | | 0.77 | | | | 2,391,057 | | | | 23,152 | | | | 0.97 | | | | 2,663,714 | | | | 34,641 | | | | 1.30 | |
| | | | | | | | | | | | | | | | | | | | | | | | | | | | | | | | | | | | |
Non-interest-bearing liabilities: | | | | | | | | | | | | | | | | | | | | | | | | | | | | | | | | | | | | |
Non-interest-bearing demand deposits | | | 499,435 | | | | | | | | | | | | 509,678 | | | | | | | | | | | | 481,757 | | | | | | | | | |
Other liabilities | | | 80,777 | | | | | | | | | | | | 86,013 | | | | | | | | | | | | 96,420 | | | | | | | | | |
| | | | | | | | | | | | | | | | | | | | | | | | | | | | | | | | | | | | |
Total non-interest-bearing liabilities | | | 580,212 | | | | | | | | | | | | 595,691 | | | | | | | | | | | | 578,177 | | | | | | | | | |
| | | | | | | | | | | | | | | | | | | | | | | | | | | | | | | | | | | | |
Total liabilities | | | 2,861,105 | | | | | | | | | | | | 2,986,748 | | | | | | | | | | | | 3,241,891 | | | | | | | | | |
Shareholders’ equity | | | 293,665 | | | | | | | | | | | | 299,127 | | | | | | | | | | | | 325,669 | | | | | | | | | |
| | | | | | | | | | | | | | | | | | | | | | | | | | | | | | | | | | | | |
Total liabilities and shareholders’ equity | | $ | 3,154,770 | | | | | | | | | | | $ | 3,285,875 | | | | | | | | | | | $ | 3,567,560 | | | | | | | | | |
| | | | | | | | | | | | | | | | | | | | | | | | | | | | | | | | | | | | |
Net interest income (5) | | | | | | $ | 98,718 | | | | | | | | | | | $ | 104,869 | | | | | | | | | | | $ | 112,762 | | | | | |
| | | | | | | | | | | | | | | | | | | | | | | | | | | | | | | | | | | | |
Interest rate spread | | | | | | | | | | | 3.27 | % | | | | | | | | | | | 3.30 | % | | | | | | | | | | | 3.28 | % |
Net interest margin (6) | | | | | | | | | | | 3.43 | % | | | | | | | | | | | 3.50 | % | | | | | | | | | | | 3.50 | % |
Ratio of average interest-earning assets to average interest- bearing liabilities | | | | | | | | | | | 126.15 | % | | | | | | | | | | | 125.37 | % | | | | | | | | | | | 120.95 | % |
9
| (1) | Average balances include non-accrual loans (see “Non-Performing and Problem Assets”). |
| (2) | Loan fees are included in interest income and the amount is not material for this analysis. |
| (3) | Interest earned on non-taxable investment securities is shown on a tax equivalent basis assuming a 35% marginal federal tax rate for all periods. The fully taxable equivalent adjustment for the years ended December 31, 2012, 2011 and 2010 was $870 thousand, $1.3 million and $1.8 million, respectively. |
| (4) | Amounts include Advances from the Federal Home Loan Bank of New York (“FHLBNY”) and Securities sold under agreements to repurchase – FHLBNY. |
| (5) | Interest rate spread represents the difference between the average yield on interest-earning assets and the average cost of interest-bearing liabilities. |
| (6) | Net interest margin represents net interest income as a percentage of average interest-earning assets. |
TABLE 2: RATE-VOLUME VARIANCE ANALYSIS (1)
| | | | | | | | | | | | | | | | | | | | | | | | |
Years Ended December 31, | | 2012 vs. 2011 | | | 2011 vs. 2010 | |
| | | Increase (Decrease) Due To | | | Increase (Decrease) Due To | |
| | | Volume | | | Rate | | | Net | | | Volume | | | Rate | | | Net | |
Interest income: | | | | | | | | | | | | | | | | | | | | | | | | |
Loans receivable: | | | | | | | | | | | | | | | | | | | | | | | | |
Commercial and industrial | | $ | (6,458 | ) | | $ | (3,484 | ) | | $ | (9,942 | ) | | $ | (13,680 | ) | | $ | 577 | | | $ | (13,103 | ) |
Home equity | | | (656 | ) | | | (380 | ) | | | (1,036 | ) | | | (860 | ) | | | (1,080 | ) | | | (1,940 | ) |
Second mortgage | | | (691 | ) | | | (44 | ) | | | (735 | ) | | | (792 | ) | | | (234 | ) | | | (1,026 | ) |
Residential real estate | | | 3,568 | | | | 84 | | | | 3,652 | | | | 442 | | | | (310 | ) | | | 132 | |
Other | | | (1,004 | ) | | | (21 | ) | | | (1,025 | ) | | | (674 | ) | | | 13 | | | | (661 | ) |
| | | | | | | | | | | | | | | | | | | | | | | | |
Total loans receivable | | | (5,241 | ) | | | (3,845 | ) | | | (9,086 | ) | | | (15,564 | ) | | | (1,034 | ) | | | (16,598 | ) |
Investment securities | | | (193 | ) | | | (2,218 | ) | | | (2,411 | ) | | | 1,908 | | | | (4,814 | ) | | | (2,906 | ) |
Interest-earning deposits with banks | | | (217 | ) | | | (3 | ) | | | (220 | ) | | | 117 | | | | 5 | | | | 122 | |
Total interest-earning assets | | | (5,651 | ) | | | (6,066 | ) | | | (11,717 | ) | | | (13,539 | ) | | | (5,843 | ) | | | (19,382 | ) |
| | | | | | | | | | | | | | | | | | | | | | | | |
Interest expense: | | | | | | | | | | | | | | | | | | | | | | | | |
Interest-bearing deposit accounts: | | | | | | | | | | | | | | | | | | | | | | | | |
Interest-bearing demand deposits | | | (470 | ) | | | (1,776 | ) | | | (2,246 | ) | | | 40 | | | | (3,708 | ) | | | (3,668 | ) |
Savings deposits | | | (44 | ) | | | (468 | ) | | | (512 | ) | | | (167 | ) | | | (704 | ) | | | (871 | ) |
Time deposits | | | (459 | ) | | | (1,966 | ) | | | (2,425 | ) | | | (3,587 | ) | | | (1,917 | ) | | | (5,504 | ) |
| | | | | | | | | | | | | | | | | | | | | | | | |
Total interest-bearing deposit accounts | | | (973 | ) | | | (4,210 | ) | | | (5,183 | ) | | | (3,714 | ) | | | (6,329 | ) | | | (10,043 | ) |
| | | | | | | | | | | | | | | | | | | | | | | | |
Short-term borrowings: | | | | | | | | | | | | | | | | | | | | | | | | |
Federal funds purchased | | | 20 | | | | — | | | | 20 | | | | (44 | ) | | | (45 | ) | | | (89 | ) |
Repurchase agreements with customers | | | — | | | | — | | | | — | | | | (17 | ) | | | (5 | ) | | | (22 | ) |
Long-term borrowings: | | | | | | | | | | | | | | | | | | | | | | | | |
FHLBNY advances (2) | | | 157 | | | | (143 | ) | | | 14 | | | | 82 | | | | (274 | ) | | | (192 | ) |
Obligation under capital lease | | | (13 | ) | | | (1 | ) | | | (14 | ) | | | (15 | ) | | | (8 | ) | | | (23 | ) |
Junior subordinated debentures | | | (2 | ) | | | (401 | ) | | | (403 | ) | | | — | | | | (1,120 | ) | | | (1,120 | ) |
| | | | | | | | | | | | | | | | | | | | | | | | |
Total borrowings | | | 162 | | | | (545 | ) | | | (383 | ) | | | 6 | | | | (1,452 | ) | | | (1,446 | ) |
| | | | | | | | | | | | | | | | | | | | | | | | |
Total interest-bearing liabilities | | | (811 | ) | | | (4,755 | ) | | | (5,566 | ) | | | (3,708 | ) | | | (7,781 | ) | | | (11,489 | ) |
| | | | | | | | | | | | | | | | | | | | | | | | |
Net change in net interest income | | $ | (4,840 | ) | | $ | (1,311 | ) | | $ | (6,151 | ) | | $ | (9,831 | ) | | $ | 1,938 | | | $ | (7,893 | ) |
| | | | | | | | | | | | | | | | | | | | | | | | |
| (1) | For each category of interest-earning assets and interest-bearing liabilities, information is provided on changes attributable to (i) changes in volume (changes in average volume multiplied by the prior year rate) and (ii) changes in rate (changes in rate multiplied by the prior year average volume). The combined effect of changes in both volume and rate has been allocated to volume or rate changes in proportion to the absolute dollar amounts of the change in each. |
| (2) | Amounts include Advances from the FHLBNY and Securities sold under agreements to repurchase – FHLBNY. |
10
Interest income (on a tax-equivalent basis) decreased $11.7 million, or 9.2%, to $116.3 million for 2012 compared to $128.0 million in 2011, primarily due to a decrease of 26 basis points in the yield on loans and a decrease of 63 basis points in yield on average investments, as well as a decrease of $63.8 million, or 2.7%, in average loan balances. The rate declines were due to the overall decline in market interest rates during 2012. Significant pressures on loan yields existed through 2012 due to the competitive lending environment.
Interest income (on a tax-equivalent basis) decreased $19.4 million, or 13.1%, to $128.0 million for 2011 compared to $147.4 million in 2010, primarily due to a decrease of $324.6 million, or 12.0% in average loan balances as well as a decrease of four basis points in the yield on loans and a decrease of 99 basis points in yield on average investments. These declines were due to the overall decline in market interest rates during 2011. Interest income on loans decreased $16.6 million as average loans receivable declined $324.6 million, or 12.0%, over the prior year. Interest income on investments decreased $2.9 million even as average investments increased $52.6 million, or 11.6%, over the prior year. During 2011, the Company sold $102.2 million in higher yielding available-for-sale securities.
Interest expense decreased $5.6 million, or 24.0%, to $17.6 million for 2012 compared to $23.2 million in 2011, primarily due to a decrease in the cost of interest-bearing deposits of $5.2 million, or 19 basis points. The Company continued to lower interest rates on its deposit products throughout 2012.
Interest expense decreased $11.5 million, or 33.2%, to $23.2 million for 2011 compared to $34.6 million in 2010, primarily due to a decrease in the cost of interest-bearing deposits of $10.0 million, or 32 basis points.
Provision for Loan Losses. The Company recorded a provision for loan losses of $57.2 million during 2012, as compared to $74.3 million during 2011 and $101.5 million during 2010. The Company’s total loans held-for-investment before allowance for loan losses were $2.27 billion at December 31, 2012, as compared to $2.29 billion at December 31, 2011. The ratio of allowance for loan losses to loans held-for-investment was 2.02% at December 31, 2012 compared to 1.82% at December 31, 2011. Net charge-offs were $52.4 million, or 2.26% of average loans outstanding, for the year ended December 31, 2012 as compared to $114.7 million, or 4.83% of average loans outstanding, and $79.8 million, or 2.95% of average loans outstanding, for the years ended December 31, 2011 and 2010, respectively. Total gross charge-offs in 2012 were $55.6 million, of which $51.3 million related to the commercial portfolio. During 2012, the Company signed a definitive agreement to sell $45.8 million of loans, having a book balance of $38.1 million to a third party investor and the related loans were marked to fair value and moved to loans held-for-sale. The resulting charge-offs totaled $13.1 million. Excluding charge-offs related to the loan sale, commercial charge-offs were largely driven by charge-offs of $23.2 million taken on 10 relationships. The Company’s provision levels remained elevated during the year as delinquency levels and credit trends were still in the process of stabilizing in 2012.
The charge-offs in 2011 included $69.4 million in losses recorded on the sale of $159.8 million in book balance of criticized and classified commercial real estate loans during May 2011. Excluding the charge-offs related to the loan sale, total commercial charge-offs were $43.2 million in 2011. Charge-offs, excluding the loan sale, were primarily driven by three commercial relationships for $25.0 million.
At least quarterly, management performs an analysis to identify the inherent risk of loss in the Company’s loan portfolio. This analysis includes a qualitative evaluation of concentrations of credit, past loss experience, current economic conditions, amount and composition of the loan portfolio (including loans being specifically monitored by management), estimated fair value of underlying collateral, delinquencies, and other factors. Additionally, management updates the migration analysis and historic loss experience on a quarterly basis.
Non-Interest Income. Non-interest income increased $16.0 million, or 118.7%, to $29.5 million for 2012 as compared to $13.5 million for 2011. The primary drivers of this change were a $7.2 million increase in gains on the sale of residential mortgage loans and a decrease of $10.3 million in derivative credit evaluation adjustment charges as compared to the prior year. The increase in gains on the sale of mortgage loans resulted from the expansion of the Company’s mortgage operations which began in the first quarter of 2012. Derivative credit valuation adjustments were higher in 2011 compared to 2012 due to swap termination costs associated with the May 2011 commercial loan sale.
Non-interest income decreased $2.0 million, or 13.2%, to $13.5 million for 2011 as compared to $15.5 million for 2010. The primary drivers of this change were a $3.1 million decrease in gains on the sale of available-for-sale securities and a decrease of $717 thousand in service charges on deposit accounts as compared to the prior year; partially offset by a decrease of $1.1 million in impairment losses on available-for-sale securities and an increase of $890 thousand in bank-owned life insurance income over the same period from a death benefit recorded in 2011.
11
Non-Interest Expense. Non-interest expense increased $10.4 million, or 9.4%, to $120.6 million for 2012 as compared to $110.2 million for 2011. The primary driver of this increase was the increase in salaries and employee benefits of $10.0 million, or 19.0%, from the prior year primarily due to the expansion of the Company’s mortgage operations. In addition, there was an increase of $1.3 million in provision for unfunded commitments as this reserve was reduced by $1.1 million in 2011 due to a reduction in unfunded commitments and mortgage recourse reserves of $775 thousand were recorded in 2012 as compared to $0 in 2011. Partially offsetting these increases was a decrease in problem loan costs of $2.7 million, or 31.9% from 2011 to 2012 due to loan sale related expenses in 2011.
Non-interest expense decreased $90.8 million, or 45.2%, to $110.2 million for 2011 as compared to $201.1 million for 2010. The primary driver of this decrease was the prior year goodwill impairment charge of $89.7 million. Salaries and employee benefits decreased $2.7 million, or 4.9%, from the prior year primarily due to staffing reductions that occurred towards the end of 2010. Problem loan costs increased $3.2 million, or 61.6% from 2010 to 2011 due to loan sale related expenses as well as credit deterioration in the commercial real estate loan portfolio. Other expense decreased by $2.8 million, or 33.1%, for the same period due to positive derivative credit valuation adjustments recorded in 2011.
Income Tax Expense. Income tax expense decreased $44 thousand from $10 thousand for the year ended December 31, 2011 to a tax benefit position of $34 thousand for 2012. As the Company remained in a cumulative loss position at December 31, 2012, a full deferred tax valuation allowance is still considered appropriate. As such, the Company recorded no federal income tax expense in 2012. The tax benefit in 2012 relates to a prior period federal refund owed to the Company.
Income tax expense decreased $9.3 million from $9.3 million for the year ended December 31, 2010 to income tax expense of $10 thousand for 2011. As the Company remained in a cumulative loss position at December 31, 2011, a full deferred tax valuation allowance is considered appropriate. As such, the Company recorded no federal income tax expense in 2011.
LIQUIDITY AND CAPITAL RESOURCES
The liquidity of the Company is the ability to maintain cash flows that are adequate to fund operations and meet its other obligations on a timely and cost-effective basis in various market conditions. The ability of the Company to meet its current financial obligations is a function of balance sheet structure, the ability to liquidate assets and the availability of alternative sources of funds. To meet the needs of the clients and manage the risk of the Company, the Company engages in liquidity planning and management.
The major source of the Company’s funding is deposits, which management believes will be sufficient to meet the Company’s daily and long-term operating liquidity needs. The ability of the Company to retain and attract new deposits is dependent upon the variety and effectiveness of its customer account products, customer service and convenience, and rates paid to customers. The Company also obtains funds from the repayment and maturities of loans, maturities or calls of investment securities, as well as from a variety of wholesale funding sources including, but not limited to, brokered deposits, federal funds purchased, FHLBNY advances, securities sold under agreements to repurchase, and other secured and unsecured borrowings. Additional liquidity can be obtained from loan sales or participations. In a continued effort to balance deposit growth and net interest margin, especially in the current interest rate environment and with highly competitive local deposit pricing, the Company continually evaluates these other funding sources for funding cost efficiencies. During the year, the Company aggressively lowered interest rates on deposits while managing overall funding and liquidity. As a result of this planned reduction in deposit rates, the Company experienced an overall decline in its deposit balances. Core deposits, which exclude all certificates of deposit, decreased $19.1 million to $2.02 billion, or 74.3% of total deposits, at December 31, 2012, as compared to $2.03 billion, or 76.3% of total deposits, at December 31, 2011. The Company has additional secured borrowing capacity with the FRB of approximately $174.4 million and the FHLBNY of approximately $202.5 million. At December 31, 2012, $0 and $61.4 million of the Company’s secured borrowing capacity through the FRB and the FHLBNY was utilized, respectively. The Company has additional unsecured borrowing capacity through lines of credit with other financial institutions of approximately $55.0 million. Management continues to monitor the Company’s liquidity and has taken measures to increase its borrowing capacity by providing additional collateral through the pledging of loans. As of December 31, 2012, the Company had a par value of $364.4 million and $180.7 million in loans and securities, respectively, pledged as collateral on secured borrowings.
The Company’s primary uses of funds are the origination of loans, the funding of the Company’s maturing certificates of deposit, deposit withdrawals, the repayment of borrowings and general operating expenses. Certificates of deposit scheduled to mature during the 12 months ending December 31, 2013 total $437.0 million, or approximately 62.6% of total certificates of deposit. The Company continues to operate with a core deposit relationship strategy that values a long-term stable customer relationship. This strategy employs a pricing strategy that rewards customers that establish core accounts and maintain a certain minimum threshold account balance. Based on market conditions and other liquidity considerations, the Company may also avail itself to the secondary borrowings discussed above.
Total loans receivable increased $83.4 million, or 3.6%, during 2012. The Company anticipates that deposits, cash and cash equivalents on hand, the cash flow from assets, as well as other sources of funds will provide adequate liquidity for the Company’s future operating, investing and financing needs.
12
Management currently operates under a capital plan for the Company and the Bank that is expected to allow the Company and the Bank to grow capital internally at levels sufficient for achieving its internal growth projections while managing its operating and financial risks. The principal components of the capital plan are to generate additional capital through retained earnings from internal growth, access the capital markets for external sources of capital, such as common equity and capital securities, when necessary or appropriate, redeem existing capital instruments and refinance such instruments at lower rates when conditions permit, and maintain sufficient capital for safe and sound operations. The Company continues to assess its plan for contingency capital needs, and when appropriate, the Company’s Board of Directors may consider various capital raising alternatives. As part of its assessment, the Company performs stress tests on select balance sheet components, deemed to have inherent risk given relevant economic and regulatory conditions, in an effort to gauge potential exposure on its capital position.
On July 7, 2010, the Company entered into securities purchase agreements with WLR SBI Acquisition Co, LLC, an affiliate of WL Ross & Co. LLC (“WL Ross”), members and affiliates of the Bank’s founding Brown Family (the “Brown Family”), certain affiliates of Siguler Guff & Company, LP (the “Siguler Guff Shareholders”) and certain other institutional and accredited investors (the “Other Investors”). On September 22, 2010, the Company completed the issuance and sale of 4,672,750 shares of its common stock and 88,009 shares of its Mandatorily Convertible Cumulative Non-Voting Perpetual Stock, Series B (the “Series B Preferred Stock”) for net proceeds of $98.5 million. At the Company’s Annual Meeting of Shareholders held on November 1, 2010, its shareholders approved an amendment to our Amended and Restated Certificate of Incorporation allowing for the conversion of the 88,009 shares of Series B Preferred Stock into 22,002,250 shares of common stock at a conversion price of $4.00 per share.
On March 22, 2011, the Company completed a public offering of 28,750,000 shares of common stock at a public offering price of $3.00 per share, which included the full exercise of the over-allotment option granted to the underwriters to purchase an additional 3,750,000 shares of common stock. After deducting the underwriting discount and offering expenses payable by the Company, the net proceeds were $81.4 million. The Company’s three largest shareholders, WL Ross, Siguler Guff, and the Brown Family, along with certain officers and directors, purchased an aggregate of 10,193,224 shares in the offering. WL Ross and the Siguler Guff Shareholders maintained their percentage interest in the Company in the offering. Pursuant to the terms of the securities purchase agreements entered into between WL Ross, the Siguler Guff Shareholders, the Brown Family and the Company in connection with the private placement of Company securities in July 2010, each of these investors was entitled to purchase shares in the offering at $2.85 per share which represented the public offering price less the underwriting discount of $0.15 per share paid to the underwriters on the other shares sold.
On April 11, 2011, the Company issued and sold in a private placement transaction an additional 3,802,131 shares at $2.85 per share totaling $10.8 million in additional stock proceeds pursuant to the exercise of gross-up rights contained in the previously executed securities purchase agreements with the three investors noted above. The gross-up rights were triggered by the underwriters’ exercise of the over-allotment option in the public offering. On August 8, 2011, the Company issued in a private placement approximately 2,378,232 additional shares at $2.85 per share totaling $6.8 million in stock proceeds pursuant to the exercise of gross-up rights. The transactions were triggered pursuant to the gross-up rights issued to Anchorage Capital Group, LLC (“Anchorage”), in connection with its purchase of shares in the public offering.
At December 31, 2012, WL Ross beneficially owned approximately 24.7% of our outstanding common stock, the Brown Family beneficially owned approximately 18.1% of our outstanding common stock and the Siguler Guff Shareholders and Anchorage each beneficially owned approximately 9.8% of our outstanding common stock. None of the Other Investors beneficially owned more than 2% of our common stock.
The Company is subject to regulatory capital requirements adopted by the FRB for bank holding companies. The Bank is also subject to similar capital requirements adopted by the OCC. Under the requirements, the federal bank regulatory agencies have established quantitative measures to ensure that minimum thresholds for Total Capital, Tier 1 Capital and Leverage (Tier 1 Capital divided by average assets) ratios are maintained. Failure to meet minimum capital requirements can initiate certain mandatory, and possibly additional discretionary, actions by regulators that, if undertaken, could have a direct material effect on the Company’s and the Bank’s consolidated financial statements. Under capital adequacy guidelines and the regulatory framework for prompt corrective action, the Company and the Bank must meet specific capital guidelines that involve quantitative measures of their assets and certain off-balance sheet items as calculated under regulatory practices. The Company’s and the Bank’s capital amounts and classifications are also subject to qualitative judgments by the federal bank regulators about components, risk weightings and other factors. The Company’s and the Bank’s risk-based capital ratios have been computed in accordance with regulatory practices. The Company and the Bank were in compliance with these regulatory capital requirements of the FRB and the OCC as of December 31, 2012. As discussed below and elsewhere herein, additional capital requirements have been imposed on the Bank by the OCC, which the Bank was also in full compliance with as of December 31, 2012.
13
On April 15, 2010, the Bank entered into an Agreement with the OCC (the “OCC Agreement”) which contained requirements to develop and implement a profitability and capital plan that provides for the maintenance of adequate capital to support the Bank’s risk profile in the current economic environment. The capital plan was also required to contain a dividend policy allowing dividends only if the Bank is in compliance with the capital plan, and obtains prior approval from the OCC. During the second quarter of 2010, the Company delivered its profit and capital plans to the OCC. The Company continues to maintain and update appropriate capital and profit plan in accordance with the OCC Agreement.
The Bank also agreed to: (a) implement a program to protect the Bank’s interest in criticized or classified assets, (b) review and revise the Bank’s loan review program; (c) implement a program for the maintenance of an adequate allowance for loan losses; and (d) revise the Bank’s credit administration policies. During the second quarter of 2010, the Company revised and implemented changes to policies and procedures pursuant to the OCC Agreement. As noted earlier in this section, the Bank also agreed that its brokered deposits will not exceed 3.5% of its total liabilities unless approved by the OCC. Effective October 18, 2012, the OCC approved an increase of this limit to 6.0%. Management does not expect this restriction will limit its access to liquidity as the Bank does not rely on brokered deposits as a major source of funding. At December 31, 2012, the Bank’s brokered deposits represented 4.0% of its total liabilities.
The Bank is also subject to individual minimum capital ratios established by the OCC requiring the Bank to continue to maintain a Leverage ratio at least equal to 8.50% of adjusted total assets, to continue to maintain a Tier 1 Capital ratio at least equal to 9.50% of risk-weighted assets and to achieve, by June 30, 2010, and thereafter maintain, a Total Capital ratio at least equal to 11.50% of risk-weighted assets. At December 31, 2012, the Bank exceeded all of the three capital ratio requirements established by the OCC as its Leverage ratio was 9.24%, its Tier 1 Capital ratio was 11.76%, and its Total Capital ratio was 13.02%.
Management is working towards taking all of the necessary actions for the Bank to become fully compliant with all requirements of the OCC Agreement.
TABLE 3: REGULATORY CAPITAL LEVELS
| | | | | | | | | | | | | | | | | | | | | | | | | | | | |
| | | Actual | | | For Capital
Adequacy Purposes | | | To Be Well-Capitalized
Under Prompt Corrective
Action Provisions (1) | |
December 31, 2012 | | Amount | | | Ratio | | | Amount | | | Ratio | | | Amount | | | | | | Ratio | |
Total Capital (to Risk-Weighted Assets): | | | | | | | | | | | | | | | | | | | | | | | | | | | | |
Sun Bancorp, Inc. | | $ | 340,111 | | | | 13.72 | % | | $ | 198,340 | | | | 8.00 | % | | | | | | | N/A | | | | | |
Sun National Bank | | | 322,041 | | | | 13.02 | | | | 197,964 | | | | 8.00 | | | $ | 247,455 | | | | | | | | 10.00 | % |
Tier I Capital (to Risk-Weighted Assets) (1) | | | | | | | | | | | | | | | | | | | | | | | | | | | | |
Sun Bancorp, Inc. | | | 293,008 | | | | 11.82 | | | | 99,170 | | | | 4.00 | | | | | | | | N/A | | | | | |
Sun National Bank | | | 290,922 | | | | 11.76 | | | | 98,982 | | | | 4.00 | | | | 148,473 | | | | | | | | 6.00 | |
Leverage Ratio: | | | | | | | | | | | | | | | | | | | | | | | | | | | | |
Sun Bancorp, Inc. | | | 293,008 | | | | 9.30 | | | | 126,080 | | | | 4.00 | | | | | | | | N/A | | | | | |
Sun National Bank | | | 290,922 | | | | 9.24 | | | | 125,902 | | | | 4.00 | | | | 157,377 | | | | | | | | 5.00 | |
| (1) | Not applicable to bank holding companies. |
The Company’s ratio of tangible equity to tangible assets, which is a non-GAAP financial measure of risk, was 6.95% at December 31, 2012, compared with 8.41% at December 31, 2011. Tangible equity and tangible assets are calculated by subtracting identifiable intangible assets and goodwill from shareholders’ equity and total assets, respectively, and may be used by investors to assist them in understanding how much loss, exclusive of intangible assets and goodwill, can be absorbed before shareholders’ equity is depleted. The Company’s and Bank’s regulators also exclude intangible assets and goodwill from shareholders’ equity when assessing capital adequacy of each.
The Company’s capital securities are deconsolidated in accordance with GAAP and qualify as Tier 1 capital under federal regulatory guidelines. These instruments are subject to a 25% capital limitation under risk-based capital guidelines developed by the FRB. In March 2005, the FRB amended its risk-based capital standards to expressly allow the continued limited inclusion of outstanding and prospective issuances of capital securities in a bank holding company’s Tier 1 capital, subject to tightened quantitative limits. The FRB’s amended rule was to become effective March 31, 2009, and would have limited capital securities and other restricted core capital elements to 25% of all core capital elements, net of goodwill less any associated deferred tax liability. On March 16, 2009, the FRB extended for two years the ability for bank holding companies to include restricted core capital elements as Tier 1 capital up to 25% of all core capital elements, including goodwill. The portion that exceeds the 25% capital limitation qualifies as Tier 2, or supplementary capital of the Company. At December 31, 2012, the $74.1 million in capital securities qualify as Tier 1.
14
The ability of the Bank to pay dividends to the Company is controlled by certain regulatory restrictions. Generally, dividends declared in a given year by a national bank are limited to its net profit, as defined by regulatory agencies, for that year, combined with its retained net income for the preceding two years, less any required transfer to surplus or to fund for the retirement of any preferred stock. In addition, a national bank may not pay any dividends in an amount greater than its undivided profits and a national bank may not declare any dividends if such declaration would leave the bank inadequately capitalized. Therefore, the ability of the Bank to declare dividends will depend on its future net income and capital requirements. Also, banking regulators have indicated that national banks should generally pay dividends only out of current operating earnings. Further, per the OCC Agreement, a dividend may only be declared if it is in accordance with the approved capital plan, the Bank remains in compliance with the capital plan following the payment of the dividend and the dividend is approved by the OCC. As a result of these restrictions, the amount available for payment of dividends to the Company by the Bank totaled $0 at December 31, 2012.
The Bank’s deposits are insured to applicable limits by the Federal Deposit Insurance Corporation (“FDIC”). As part of the Dodd-Frank Wall Street Reform and Consumer Protection Act of 2010 (the “Dodd-Frank Act”) which was signed into law on July 21, 2010, the maximum deposit insurance limit is $250 thousand.
In addition, the Dodd-Frank Act amended the Federal Deposit Insurance Act to provide for full deposit insurance coverage for noninterest-bearing transaction accounts for a two year period beginning December 31, 2010. This applies to all insured depository institutions with no opt in or opt out requirements. This amendment expired on December 31, 2012.
In May 2009, the FDIC imposed a special assessment equal to five basis points of assets, less Tier 1 capital, as of June 30, 2009, payable on September 30, 2009, and reserved the right to impose additional special assessments. In November 2009, instead of imposing additional special assessments, the FDIC amended the assessment regulations to require all insured depository institutions to prepay their estimated risk-based assessments for the fourth quarter of 2009, and for all of 2010, 2011 and 2012 on December 30, 2009. For purposes of estimating the future assessments, each institution’s base assessment rate in effect on September 30, 2009 was used, assuming a 5% annual growth rate in the assessment base and a three basis point increase in the assessment rate in 2011 and 2012. The prepaid assessment will be applied against actual quarterly assessments until exhausted. Any funds remaining after June 30, 2013 will be returned to the institution. If the prepayment impairs an institution’s liquidity or otherwise creates significant hardship, it was able to apply for an exemption. Requiring this prepaid assessment does not preclude the FDIC from changing assessment rates or from further revising the risk-based assessment system. On December 30, 2009, the Company paid the FDIC prepaid assessment of $18.3 million which was to be recognized as expense for a three-year period from that date. At December 31, 2012, the remaining balance of the FDIC prepaid assessment was $2.6 million, with $3.9 million being recognized in expense during 2012.
Under federal law, deposits and certain claims for administrative expenses and employee compensation against an insured depository institution are afforded a priority over other general unsecured claims against such an institution, including federal funds and letters of credit, in the liquidation or other resolution of such an institution by any receiver appointed by regulatory authorities. Such priority creditors would include the FDIC.
See Note 23 of the Notes to Consolidated Financial Statements for additional information regarding regulatory matters.
Asset and Liability Management. Interest rate, credit and operational risks are among the most significant market risks impacting the performance of the Company. The Company has an Asset Liability Committee (“ALCO”), composed of senior management representatives from a variety of areas within the Company. ALCO, which meets at least quarterly, devises strategies and tactics to maintain the net interest income of the Company within acceptable ranges over a variety of interest rate scenarios. Should the Company’s risk modeling indicate an undesired exposure to changes in interest rates, there are a number of remedial options available, including changing the investment portfolio characteristics, and changing loan and deposit pricing strategies. Two of the tools used in monitoring the Company’s sensitivity to interest rate changes are gap analysis and net interest income simulation.
Gap Analysis. Banks are concerned with the extent to which they are able to match maturities or re-pricing characteristics of interest-earning assets and interest-bearing liabilities. Such matching is facilitated by examining the extent to which such assets and liabilities are interest-rate sensitive and by monitoring the bank’s interest rate sensitivity gap. Gap analysis measures the volume of interest-earning assets that will mature or re-price within a specific time period, compared to the interest-bearing liabilities maturing or re-pricing within that same time period. On a monthly basis, the Company and the Bank monitor their gap, primarily cumulative through both six month and one year maturities.
Table 4 provides the maturity and re-pricing characteristics of the Company’s interest-earning assets and interest-bearing liabilities at December 31, 2012. All amounts are categorized by their actual maturity or re-pricing date with the exception of interest-bearing demand deposits and savings deposits. As a result of prior experience during periods of rate volatility and management’s estimate of future rate sensitivities, the Company allocates the interest-bearing demand deposits and savings deposits into categories noted below, based on the estimated duration of those deposits.
15
TABLE 4: INTEREST RATE SENSITIVITY SCHEDULE
| | | | | | | | | | | | | | | | | | | | |
| | | Maturity/Re-pricing Time Periods | |
December 31, 2012 | | 0-3 Months | | | 4-12 Months | | | 1-5 Years | | | Over 5 Years | | | Total | |
Interest-earning assets: | | | | | | | | | | | | | | | | | | | | |
FHLB interest- bearing deposits | | $ | 699 | | | $ | — | | | $ | — | | | $ | — | | | $ | 699 | |
Loans receivable | | | 1,246,490 | | | | 335,655 | | | | 583,283 | | | | 120,581 | | | | 2,286,009 | |
Investment securities | | | 105,435 | | | | 97,611 | | | | 147,431 | | | | 108,637 | | | | 459,114 | |
Federal funds sold | | | 91,601 | | | | — | | | | — | | | | — | | | | 91,601 | |
| | | | | | | | | | | | | | | | | | | | |
Total interest-earning assets | | | 1,444,225 | | | | 433,266 | | | | 730,714 | | | | 229,218 | | | | 2,837,423 | |
| | | | | | | | | | | | | | | | | | | | |
Interest-bearing liabilities: | | | | | | | | | | | | | | | | | | | | |
Interest-bearing & non-interest demand deposits | | | 582,090 | | | | 161,961 | | | | 363,242 | | | | 110,557 | | | | 1,217,850 | |
Savings deposits | | | 74,231 | | | | 32,751 | | | | 87,548 | | | | 69,624 | | | | 264,154 | |
Time certificates | | | 138,417 | | | | 299,070 | | | | 259,774 | | | | 625 | | | | 697,886 | |
Federal Home Loan Bank Advances | | | 334 | | | | 70 | | | | 430 | | | | 60,582 | | | | 61,416 | |
Securities sold under agreements to repurchase | | | 1,968 | | | | — | | | | — | | | | — | | | | 1,968 | |
Guaranteed interest in Company’s subordinated debt | | | 92,779 | | | | (20 | ) | | | (104 | ) | | | (419 | ) | | | 92,236 | |
Other Borrowings | | | 68 | | | | 210 | | | | 1,472 | | | | 5,859 | | | | 7,609 | |
| | | | | | | | | | | | | | | | | | | | |
Total interest-bearing liabilities | | | 889,887 | | | | 494,042 | | | | 712,362 | | | | 246,828 | | | | 2,343,119 | |
| | | | | | | | | | | | | | | | | | | | |
Periodic gap | | $ | 554,338 | | | $ | (60,776 | ) | | $ | 18,352 | | | $ | (17,610 | ) | | $ | 494,304 | |
| | | | | | | | | | | | | | | | | | | | |
Cumulative gap | | $ | 554,338 | | | $ | 493,562 | | | $ | 511,914 | | | $ | 494,304 | | | | | |
| | | | | | | | | | | | | | | | | | | | |
Cumulative gap as a % of total assets | | | 17.2 | % | | | 15.3 | % | | | 15.9 | % | | | 15.3 | % | | | | |
| | | | | | | | | | | | | | | | | | | | |
At December 31, 2012, the Company’s gap analysis showed an asset-sensitive position with total interest-bearing assets maturing or re-pricing within one year, exceeding interest-earning liabilities maturing or re-pricing during the same time period by $493.6 million, representing a positive one-year gap ratio of 15.3%. All amounts are categorized by their actual maturity, anticipated call or re-pricing date with the exception of interest-bearing demand deposits and savings deposits. Though the rates on interest-bearing demand and savings deposits generally trend with open market rates, they often do not fully adjust to open market rates and frequently adjust with a time lag. As a result of prior experience during periods of rate volatility and management’s estimate of future rate sensitivities, the Company allocates the interest-bearing demand deposits and savings deposits based on an estimated decay rate for those deposits.
Net Interest Income Simulation. Due to the inherent limitations of gap analysis, the Company also uses simulation models to measure the impact of changing interest rates on its operations. The simulation model attempts to capture the cash flow and re-pricing characteristics of the current assets and liabilities on the Company’s balance sheet. Assumptions regarding such things as prepayments, rate change behaviors, level and composition of new balance sheet activity, and new product lines are incorporated into the simulation model. Net interest income is simulated over a 12-month horizon under a variety of linear yield curve shifts, subject to certain limits agreed to by ALCO.
Net interest income simulation analysis, at December 31, 2012, shows a position that is slightly asset sensitive as rates increase. The net income simulation results are impacted by an expected continuation of deposit pricing competition which may limit deposit pricing flexibility in both increasing and decreasing rate environments, floating-rate loan floors initially limiting loan rate increases and a relatively short liability maturity structure including retail certificates of deposit.
Actual results may differ from the simulated results due to such factors as the timing, magnitude and frequency of interest rate changes, changes in market conditions, management strategies and differences in actual versus forecasted balance sheet composition and activity. Table 5 provides the Company’s estimated earnings sensitivity profile versus the most likely rate forecast as of December 31, 2012. The Company anticipates that strong deposit pricing competition will continue to limit deposit pricing flexibility in an increasing and a decreasing rate environment.
16
TABLE 5: SENSITIVITY PROFILE
| | | | |
Change in Interest Rates (Basis Points) | | Percentage Change in
Net Interest Income
Year 1 | |
+200 | | | 2.5 | % |
+100 | | | 0.8 | % |
-100 | | | -1.8 | % |
-200 | | | -4.1 | % |
Derivative Financial Instruments. The Company utilizes certain derivative financial instruments to enhance its ability to manage interest rate risk that exists as part of its ongoing business operations. In general, the derivative transactions entered into by the Company fall into one of two types: a fair value hedge of a specific fixed-rate loan agreement and an economic hedge of a derivative offering to a Bank customer. Derivative financial instruments involve, to varying degrees, interest rate, market and credit risk. The Company manages these risks as part of its asset and liability management process, and through credit policies and procedures. The Company seeks to minimize counterparty credit risk by establishing credit limits and collateral agreements. The Company does not use derivative financial instruments for trading purposes. For more information on the Company’s financial derivative instruments, please see Note 19 of the Notes to Consolidated Financial Statements.
Disclosures about Contractual Obligations and Commercial Commitments. Purchase obligations include significant contractual cash obligations. Table 6 provides the Company’s contractual cash obligations at December 31, 2012. Included in Table 6 are the minimum contractual obligations under legally enforceable contracts with contract terms that are both fixed and determinable. The majority of these amounts are primarily for services, including core processing systems and telecommunications maintenance.
TABLE 6: CONTRACTUAL OBLIGATIONS
| | | | | | | | | | | | | | | | | | | | |
| | | | | | Payments Due by Period | |
December 31, 2012 | | Total | | | Less Than
1 Year | | | 1 to 3
Years | | | 3 to 5
Years | | | After 5
Years | |
Time deposits (1) | | $ | 697,886 | | | $ | 437,006 | | | $ | 166,827 | | | $ | 93,428 | | | $ | 625 | |
Long-term debt | | | 154,841 | | | | 3,928 | | | | 7,256 | | | | 7,262 | | | | 136,394 | |
Leases | | | 57,447 | | | | 4,953 | | | | 9,610 | | | | 9,063 | | | | 33,822 | |
Purchase obligations (off-balance sheet) | | | 15,489 | | | | 5,401 | | | | 5,969 | | | | 2,871 | | | | 1,248 | |
| | | | | | | | | | | | | | | | | | | | |
Total contractual cash obligations | | $ | 925,663 | | | $ | 451,288 | | | $ | 189,663 | | | $ | 112,624 | | | $ | 172,088 | |
| | | | | | | | | | | | | | | | | | | | |
| (1) | Amount represents the book value of time deposits, including brokered time deposits. |
The Company maintains a reserve for unfunded loan commitments and letters of credit, which is reported in other liabilities in the Consolidated Statements of Financial Condition, consistent with FASB ASC 825, Financial Instruments. As of the balance sheet date, the Company records estimated losses inherent with unfunded loan commitments in accordance with FASB ASC 450, Contingencies, and estimated future obligations under letters of credit in accordance with FASB ASC 460, Guarantees . The methodology used to determine the adequacy of this reserve is integrated in the Company’s process for establishing the allowance for loan losses and considers the probability of future losses and obligations that may be incurred under these off-balance sheet agreements. The reserve for unfunded loan commitments and letters of credit at December 31, 2012 and December 31, 2011 was $613 thousand and $381 thousand, respectively. Management believes this reserve level is sufficient to absorb estimated probable losses related to these commitments.
Table 7 provides the Company’s off balance sheet commitments (see Note 18 of the Notes to Consolidated Financial Statements for additional information) at December 31, 2012.
TABLE 7: OFF BALANCE SHEET COMMITMENTS
| | | | | | | | | | | | | | | | | | | | |
| | | | | | Amount of Commitment Expiration Per Period | |
December 31, 2012 | | Unfunded
Commitments | | | Less Than
1 Year | | | 1 to 3
Years | | | 3 to 5
Years | | | After 5
Years | |
Lines of credit | | $ | 543,594 | | | $ | 277,208 | | | $ | 24,295 | | | $ | 6,595 | | | $ | 235,496 | |
Commercial standby letters of credit | | | 40,541 | | | | 40,232 | | | | 309 | | | | — | | | | — | |
Construction funding | | | 101,083 | | | | 26,039 | | | | 75,044 | | | | — | | | | — | |
Other commitments | | | 157,219 | | | | 157,219 | | | | — | | | | — | | | | — | |
| | | | | | | | | | | | | | | | | | | | |
Total off balance sheet commitments | | $ | 842,438 | | | $ | 500,698 | | | $ | 99,648 | | | $ | 6,595 | | | $ | 235,496 | |
| | | | | | | | | | | | | | | | | | | | |
17
Standby letters of credit are conditional commitments issued by the Company to guarantee the performance of a customer to a third party. The guarantees are primarily issued to support private borrowing arrangements. The credit risk involved in issuing letters of credit is essentially the same as that involved in extending loan facilities to customers. In the event of a draw by the beneficiary that complies with the terms of the letter of credit, the Company would be required to honor the commitment. The Company takes various forms of collateral, such as real estate assets and customer business assets, to secure the commitment. Additionally, all letters of credit are supported by indemnification agreements executed by the customer. The maximum undiscounted exposure related to these commitments at December 31, 2012 was $40.5 million and the portion of the exposure not covered by collateral was approximately $666 thousand. We believe that the utilization rate of these letters of credit will continue to be substantially less than the amount of these commitments, as has been our experience to date.
Impact of Inflation and Changing Prices. The consolidated financial statements of the Company and notes thereto, presented elsewhere herein, have been prepared in accordance with GAAP, which requires the measurement of financial condition and operating results without considering the change in the relative purchasing power of money over time and due to inflation. The impact of inflation is reflected in the increased cost of the Company’s operations. Nearly all the assets and liabilities of the Company are monetary. As a result, interest rates have a greater impact on the Company’s performance than do the effects of general levels of inflation. Interest rates do not necessarily move in the same direction or to the same extent as the price of goods and services.
FINANCIAL CONDITION
The Company’s assets were $3.22 billion at December 31, 2012 compared to $3.18 billion at December 31, 2011. Gross loans receivable and loans held-for-sale increased $82.8 million, or 3.6%, to $2.40 billion at December 31, 2012 as compared to $2.31 billion at December 31, 2011. The investment portfolio decreased $70.7 million, or 13.3%, to $462.0 million at December 31, 2012 from $532.7 million at December 31, 2011. Deposits increased 1.7% to $2.71 billion at December 31, 2012 as compared to $2.67 billion at December 31, 2011. Excluding junior subordinated debentures, borrowings increased $39.7 million, or 127.0%, to $71.0 million at December 31, 2012.
Loans. Gross loans held-for-investment decreased $15.0 million from the prior year end to $2.28 billion at December 31, 2012 as the Company transferred $33.5 million of book balance loans to loans held-for-sale as of December 31, 2012. The Company’s home equity portfolio, which includes second mortgages, decreased $27.3 million, in comparison to the prior year end. The Company continues to see competition for loans across all products and market segments. During 2012, competitive pressures have increased as interest rates fell to historical lows and loan activity has increased as the economy improves.
The trend of the Company’s lending continues to reflect the geographic and borrower diversification of the commercial loan portfolio. As the Company’s marketplace has expanded within the State of New Jersey, commercial lending activities have grown, especially in the central and northern parts of the state. The recent recession which impacted all aspects of the national and regional economy and the slow pace of recovery have created increased stress in our loan portfolios and have had an adverse effect on the Company’s financial condition and results of operation. At December 31, 2012 and 2011, the Company did not have more than 10% of its total loans outstanding concentrated in any one industry category, including, but not limited to, the hospitality, entertainment and leisure industries, and general office space. The loan categories are based upon borrowers engaged in similar activities who would be similarly impacted by economic or other conditions.
Table 8 provides selected data relating to the composition of the Company’s loan portfolio by type of loan and type of collateral at December 31, 2012, 2011, 2010, 2009 and 2008.
TABLE 8: SUMMARY OF LOAN PORTFOLIO
| | | | | | | | | | | | | | | | | | | | | | | | | | | | | | | | | | | | | | | | |
December 31, | | 2012 | | | 2011 | | | 2010 | | | 2009 | | | 2008 | |
| | | Amount | | | % | | | Amount | | | % | | | Amount | | | % | | | Amount | | | % | | | Amount | | | % | |
Type of Loan: | | | | | | | | | | | | | | | | | | | | | | | | | | | | | | | | | | | | | | | | |
Commercial and industrial | | $ | 1,725,567 | | | | 77.37 | % | | $ | 1,878,026 | | | | 83.49 | % | | $ | 2,103,492 | | | | 85.74 | % | | $ | 2,249,365 | | | | 84.64 | % | | $ | 2,234,202 | | | | 82.67 | % |
Home equity | | | 207,720 | | | | 9.31 | | | | 224,517 | | | | 9.98 | | | | 239,729 | | | | 9.77 | | | | 258,592 | | | | 9.73 | | | | 274,360 | | | | 10.15 | |
Second mortgage | | | 30,842 | | | | 1.38 | | | | 41,470 | | | | 1.84 | | | | 53,912 | | | | 2.20 | | | | 68,592 | | | | 2.58 | | | | 84,388 | | | | 3.12 | |
Residential real estate | | | 273,413 | | | | 12.26 | | | | 100,438 | | | | 4.47 | | | | 79,074 | | | | 3.22 | | | | 75,322 | | | | 2.83 | | | | 67,473 | | | | 2.50 | |
Other | | | 38,618 | | | | 1.74 | | | | 46,671 | | | | 2.07 | | | | 58,963 | | | | 2.40 | | | | 65,776 | | | | 2.47 | | | | 79,402 | | | | 2.94 | |
Less: Loan loss allowance | | | (45,873 | ) | | | (2.06 | ) | | | (41,667 | ) | | | (1.85 | ) | | | (81,713 | ) | | | (3.33 | ) | | | (59,953 | ) | | | (2.25 | ) | | | (37,309 | ) | | | (1.38 | ) |
| | | | | | | | | | | | | | | | | | | | | | | | | | | | | | | | | | | | | | | | |
Net loans receivable | | $ | 2,230,287 | | | | 100.00 | % | | $ | 2,249,455 | | | | 100.00 | % | | $ | 2,453,457 | | | | 100.00 | % | | $ | 2,657,694 | | | | 100.00 | % | | $ | 2,702,516 | | | | 100.00 | % |
| | | | | | | | | | | | | | | | | | | | | | | | | | | | | | | | | | | | | | | | |
Type of Collateral: | | | | | | | | | | | | | | | | | | | | | | | | | | | | | | | | | | | | | | | | |
Residential real estate: | | | | | | | | | | | | | | | | | | | | | | | | | | | | | | | | | | | | | | | | |
1-4 family | | $ | 543,439 | | | | 24.37 | % | | $ | 429,106 | | | | 18.88 | % | | $ | 426,488 | | | | 17.38 | % | | $ | 460,106 | | | | 17.31 | % | | $ | 494,828 | | | | 18.31 | % |
Other | | | 19,425 | | | | 0.87 | | | | 15,127 | | | | 0.67 | | | | 19,835 | | | | 0.81 | | | | 22,992 | | | | 0.87 | | | | 24,692 | | | | 0.91 | |
Construction and land development: | | | | | | | | | | | | | | | | | | | | | | | | | | | | | | | | | | | | | | | | |
1-4 family | | | 6,438 | | | | 0.29 | | | | 15,807 | | | | 0.70 | | | | 28,816 | | | | 1.17 | | | | 43,803 | | | | 1.65 | | | | 64,646 | | | | 2.39 | |
Other | | | 50,753 | | | | 2.28 | | | | 82,116 | | | | 3.61 | | | | 147,909 | | | | 6.03 | | | | 187,624 | | | | 7.06 | | | | 153,205 | | | | 5.67 | |
Commercial real estate | | | 1,096,982 | | | | 49.19 | | | | 1,226,349 | | | | 53.96 | | | | 1,385,210 | | | | 56.46 | | | | 1,503,301 | | | | 56.56 | | | | 1,495,398 | | | | 55.34 | |
Commercial business loans | | | 522,202 | | | | 23.41 | | | | 500,301 | | | | 22.01 | | | | 466,870 | | | | 19.03 | | | | 425,541 | | | | 16.01 | | | | 434,097 | | | | 16.06 | |
Consumer | | | 30,536 | | | | 1.37 | | | | 37,087 | | | | 1.63 | | | | 43,835 | | | | 1.79 | | | | 50,827 | | | | 1.91 | | | | 56,312 | | | | 2.08 | |
Other | | | 6,385 | | | | 0.28 | | | | 8,421 | | | | 0.37 | | | | 16,207 | | | | 0.66 | | | | 23,453 | | | | 0.88 | | | | 16,647 | | | | 0.62 | |
Less: Loan loss allowance | | | (45,873 | ) | | | (2.06 | ) | | | (41,667 | ) | | | (1.83 | ) | | | (81,713 | ) | | | (3.33 | ) | | | (59,953 | ) | | | (2.25 | ) | | | (37,309 | ) | | | (1.38 | ) |
| | | | | | | | | | | | | | | | | | | | | | | | | | | | | | | | | | | | | | | | |
Net loans receivable | | $ | 2,230,287 | | | | 100.00 | % | | $ | 2,272,647 | | | | 100.00 | % | | $ | 2,453,457 | | | | 100.00 | % | | $ | 2,657,694 | | | | 100.00 | % | | $ | 2,702,516 | | | | 100.00 | % |
| | | | | | | | | | | | | | | | | | | | | | | | | | | | | | | | | | | | | | | | |
18
Many of the Company’s commercial and industrial loans have a real estate component as part of the collateral securing the accommodation. Additionally, the Company makes commercial real estate loans for the acquisition, refinance, improvement and construction of real property. Loans secured by owner occupied properties are dependent upon the successful operation of the borrower’s business. If the operating company experiences difficulties in terms of sales volume and/or profitability, the borrower’s ability to repay the loan may be impaired. Loans secured by properties where repayment is dependent upon payment of rent by third-party tenants or the sale of the property may be impacted by loss of tenants, lower lease rates needed to attract new tenants or the inability to sell a completed project in a timely fashion and at a profit. At December 31, 2012, commercial and industrial loans secured by commercial real estate properties totaled $1.11 billion of which $527.8 million, or 47.4%, were classified as owner occupied and $584.9 million, or 52.6%, were classified as non-owner occupied. Management considers these loans to be well diversified across multiple industries.
The Company’s home equity loan portfolio, including second mortgages, represents 10.7% of total loans outstanding at December 31, 2012. The home equity loan portfolio decreased $27.3 million, or 10.3%, from December 31, 2011. Usage of home equity lines of credit has remained constant, at approximately 48.4% over the past year with approximately 25.4% of the overall home equity loan portfolio balance being in a first lien position. At December 31, 2012, residential real estate loans represent 12.3% of total loans outstanding and is the largest component of the Company’s non-commercial portfolio. The residential loan portfolio increased $173.0 million, or 172.2%, from December 31, 2011. This increase is due to the Company’s strategy implemented in 2011 to increase its held-for-investment jumbo residential mortgage portfolio.
Table 9 provides the estimated maturity of the Company’s loan portfolio at December 31, 2012. The table does not include potential prepayments or scheduled principal payments. Adjustable-rate mortgage loans are shown based on contractual maturities.
TABLE 9: ESTIMATED MATURITY OF LOAN PORTFOLIO
| | | | | | | | | | | | | | | | | | | | |
December 31, 2012 | | Due Within
1 Year | | | Due After
1 Through
5 Years | | | Due After
5 Years | | | Allowance for
Loan Loss | | | Total | |
Commercial and industrial | | $ | 354,373 | | | $ | 1,002,974 | | | $ | 368,220 | | | $ | 33,197 | | | $ | 1,692,370 | |
Home equity (1) | | | 308 | | | | 6,579 | | | | 231,675 | | | | 2,734 | | | | 235,828 | |
Residential real estate | | | 1,576 | | | | 388 | | | | 271,449 | | | | 3,333 | | | | 270,080 | |
Other | | | 5,944 | | | | 4,576 | | | | 28,098 | | | | 6,609 | | | | 32,009 | |
| | | | | | | | | | | | | | | | | | | | |
Total | | $ | 362,201 | | | $ | 1,014,517 | | | $ | 899,442 | | | $ | 45,873 | | | $ | 2,230,287 | |
| | | | | | | | | | | | | | | | | | | | |
| (1) | Amount includes both home equity and second mortgages. |
Table 10 provides the dollar amount of all loans due one year or more after December 31, 2012, which have pre-determined interest rates and which have floating or adjustable interest rates.
TABLE 10: LOANS GREATER THAN 12 MONTHS
| | | | | | | | | | | | |
December 31, 2012 | | Fixed-Rates | | | Floating or
Adjustable
Rates | | | Total | |
Commercial and industrial | | $ | 461,017 | | | $ | 910,177 | | | $ | 1,371,194 | |
Home equity (1) | | | 31,307 | | | | 206,947 | | | | 238,254 | |
Residential real estate | | | 172,585 | | | | 99,252 | | | | 271,837 | |
Other | | | 29,412 | | | | 3,262 | | | | 32,674 | |
| | | | | | | | | | | | |
Total | | $ | 694,321 | | | $ | 1,219,638 | | | $ | 1,913,959 | |
| | | | | | | | | | | | |
| (1) | Amount includes both home equity and second mortgages. |
See Notes 5 and 6 of the Notes to Consolidated Financial Statements for additional information on loans.
19
Non-Performing and Problem Assets
Loan Delinquencies. The Company’s collection procedures provide for a late charge assessment after a commercial loan is 10 days past due, or a residential mortgage loan is 15 days past due. The Company contacts the borrower and payment is requested. If the delinquency continues, subsequent efforts are made to contact the borrower. If the loan continues to be delinquent for 90 days or more, the Company usually declares the loan to be in default and payment in full is demanded. The Company will initiate collection and foreclosure proceedings and steps will be taken to liquidate any collateral taken as security for the loan unless other repayment arrangements are made. Delinquent loans are reviewed on a case-by-case basis in accordance with the lending policy.
Interest accruals are generally discontinued when a loan becomes 90 days past due or when collection of principal or interest is considered doubtful. When interest accruals are discontinued, interest credited to income in the current year is reversed, and interest accrued in the prior year is charged to the allowance for loan losses. Generally, commercial loans and commercial real estate loans are charged-off no later than 180 days delinquent, unless the loan is well secured and in the process of collection or other extenuating circumstances support collection. Residential real estate loans are typically placed on non-accrual at the time the loan is 90 days delinquent. Other consumer loans are typically charged-off at 180 days delinquent. In all cases, loans must be placed on non-accrual or charged-off at an earlier date if collection of principal or interest is considered doubtful.
Non-Performing Assets. Total non-performing assets decreased $9.6 million from $112.7 million at December 31, 2011 to $103.1 million at December 31, 2012. This decrease was primarily a result of a decrease in non-accrual loans of $63.7 million due to the May 2011 loan sale. Commercial non-accrual loans were $53.3 million at December 31, 2012. Interest income that would have been recorded on non-accrual loans as of December 31, 2012, under the original terms of such loans, would have totaled approximately $7.7 million for 2012. The ratio of non-performing assets to net loans decreased to 4.62% at December 31, 2012 compared to 4.96% at December 31, 2011.
Table 11 provides a summary of non-performing assets at December 31, 2012, 2011, 2010, 2009 and 2008.
TABLE 11: SUMMARY OF NON-PERFORMING ASSETS
| | | | | | | | | | | | | | | | | | | | |
December 31, | | 2012 | | | 2011 | | | 2010 | | | 2009 | | | 2008 | |
Non-performing loans: | | | | | | | | | | | | | | | | | | | | |
Loans accounted for on a non-accrual basis: | | | | | | | | | | | | | | | | | | | | |
Commercial and industrial | | $ | 53,315 | | | $ | 81,041 | | | $ | 148,517 | | | $ | 73,596 | | | $ | 37,528 | |
Commercial and industrial, held-for-sale | | | 10,224 | | | | — | | | | — | | | | — | | | | — | |
Home equity lines of credit | | | 3,714 | | | | 3,620 | | | | 4,616 | | | | 4,737 | | | | 1,682 | |
Home equity term loans | | | 1,226 | | | | 1,246 | | | | 1,134 | | | | 938 | | | | 130 | |
Residential real estate | | | 5,747 | | | | 2,522 | | | | 4,243 | | | | 7,443 | | | | 2,225 | |
Other | | | 658 | | | | 1,227 | | | | 916 | | | | 1,168 | | | | 668 | |
| | | | | | | | | | | | | | | | | | | | |
Total non-accruing loans | | | 74,884 | | | | 89,656 | | | | 159,426 | | | | 87,882 | | | | 42,233 | |
| | | | | | | | | | | | | | | | | | | | |
TDR, non-accruing | | | 18,244 | | | | 17,875 | | | | 11,796 | | | | — | | | | — | |
| | | | | | | | | | | | | | | | | | | | |
TDR, non-accruing, held-for-sale | | | 2,499 | | | | — | | | | — | | | | — | | | | — | |
| | | | | | | | | | | | | | | | | | | | |
Accruing loans that are contractually past due 90 days or more: | | | | | | | | | | | | | | | | | | | | |
Commercial and industrial | | | — | | | | 138 | | | | 1,167 | | | | 6,457 | | | | 4,014 | |
Home equity lines of credit | | | — | | | | — | | | | 379 | | | | — | | | | 286 | |
Home equity term loans | | | — | | | | — | | | | — | | | | 891 | | | | — | |
Residential real estate | | | — | | | | — | | | | 72 | | | | 49 | | | | 162 | |
Other | | | — | | | | 16 | | | | 936 | | | | 561 | | | | 125 | |
| | | | | | | | | | | | | | | | | | | | |
Total loans 90-days past due | | | — | | | | 154 | | | | 2,554 | | | | 7,958 | | | | 4,587 | |
| | | | | | | | | | | | | | | | | | | | |
Total non-performing loans | | | 95,627 | | | | 107,685 | | | | 173,776 | | | | 95,840 | | | | 46,820 | |
Real estate owned | | | 7,473 | | | | 5,020 | | | | 3,913 | | | | 9,527 | | | | 1,962 | |
| | | | | | | | | | | | | | | | | | | | |
Total non-performing assets | | $ | 103,100 | | | $ | 112,705 | | | $ | 177,689 | | | $ | 105,367 | | | $ | 48,782 | |
| | | | | | | | | | | | | | | | | | | | |
Total non-performing loans to net loans receivable | | | 4.29 | % | | | 4.74 | % | | | 7.08 | % | | | 3.61 | % | | | 1.73 | % |
Total non-performing loans to total assets | | | 2.97 | % | | | 3.38 | % | | | 5.08 | % | | | 2.68 | % | | | 1.29 | % |
Total non-performing assets to net loans receivable | | | 4.62 | % | | | 4.96 | % | | | 7.24 | % | | | 3.96 | % | | | 1.81 | % |
Total non-performing assets to total assets | | | 3.20 | % | | | 3.54 | % | | | 5.20 | % | | | 2.94 | % | | | 1.35 | % |
Total allowance for loan losses to total non-performing loans | | | 47.97 | % | | | 38.69 | % | | | 47.02 | % | | | 62.56 | % | | | 79.69 | % |
20
Potential Problem Loans. At December 31, 2012, there were 18 loan relationships aggregating $9.2 million for which known information exists as to the potential inability of the borrowers to comply with present loan repayment terms and have therefore caused management to place them on its internally monitored loan list. The classification of these loans, however, does not imply that management expects losses, but that it believes a higher level of scrutiny is prudent under the circumstances. These loans were not classified as non-accrual and were not considered non-performing. Depending upon the state of the economy, future events and their impact on these borrowers, these loans and others not currently so identified could be classified as non-performing assets in the future. At December 31, 2012, these loans were current and well collateralized.
Real Estate Owned. Real estate acquired by the Company as a result of foreclosure or deed in lieu and bank property that is not in use is classified as real estate owned until such time as it is sold. The property acquired through foreclosure or deed in lieu is carried at the lower of the related loan balance or fair value of the property based on a current appraisal less estimated cost to dispose. Losses arising from foreclosure are charged against the allowance for loan losses. Bank property is carried at the lower of cost or fair value less estimated cost to dispose. Costs to maintain real estate owned and any subsequent gains or losses are included in the Company’s results of operations. Table 12 provides a summary of real estate owned at December 31, 2012 and 2011.
TABLE 12: SUMMARY OF REAL ESTATE OWNED
| | | | | | | | |
December 31, | | 2012 | | | 2011 | |
Commercial properties | | $ | 5,382 | | | $ | 1,777 | |
Residential properties | | | 696 | | | | 1,683 | |
Bank properties | | | 1,395 | | | | 1,560 | |
| | | | | | | | |
Total | | $ | 7,473 | | | $ | 5,020 | |
| | | | | | | | |
Table 13 provides a summary of real estate owned activity for the year ended December 31, 2012.
TABLE 13: SUMMARY OF REAL ESTATE OWNED ACTIVITY
| | | | | | | | | | | | | | | | |
| | | Underlying Property | | | | |
At or for year-ended December 31, 2012 | | Commercial | | | Residential | | | Bank | | | Total | |
Balance, beginning of year | | $ | 1,777 | | | $ | 1,683 | | | $ | 1,560 | | | $ | 5,020 | |
Transfers into real estate owned | | | 6,000 | | | | 315 | | | | 1,365 | | | | 7,680 | |
Transfers into operations | | | — | | | | — | | | | — | | | | — | |
Sale of real estate owned | | | (1,956 | ) | | | (1,153 | ) | | | (797 | ) | | | (3,906 | ) |
Write down of real estate owned | | | (439 | ) | | | (149 | ) | | | (733 | ) | | | (1,321 | ) |
| | | | | | | | | | | | | | | | |
Balance, end of year | | $ | 5,382 | | | $ | 696 | | | $ | 1,395 | | | $ | 7,473 | |
| | | | | | | | | | | | | | | | |
Real estate owned increased $2.5 million to $7.5 million at December 31, 2012 as compared to December 31, 2011. During 2012, the Company transferred $7.7 million in book value of loans into real estate owned, including 23 commercial properties aggregating $6.0 million, three bank properties totaling $1.4 million, and four residential properties for $315 thousand. In 2012, the Company recorded $1.4 million of write-downs of real estate owned, including $149 thousand on the carrying value of four residential properties, $733 thousand on the carrying value of six bank properties, and $439 thousand on the carrying value of six commercial properties. There were 11 commercial properties, two bank properties, and six residential properties, with carrying amounts of $2.0 million, $797 thousand and $1.2 million, respectively, sold during the year ended December 31, 2012 resulting in a net gain of $345 thousand, which is included in real estate owned expense, net in the consolidated statements of operations. The Company recognized a reduction of carrying value of $3.9 million on these sales. See Note 9 of the Notes to Consolidated Financial Statements for additional information on real estate owned.
21
Allowances for Losses on Loans. The Company’s allowance for losses on loans was $45.9 million, or 2.02% of gross loans held-for-investment, at December 31, 2012 compared to $41.7 million, or 1.82% of gross loans held-for-investment, at December 31, 2011. The provision for loan losses was $57.2 million for 2012, $74.3 million for 2011 and $101.5 million for 2010. The decrease in the provision for loan losses is due to the impact of the prior year loan sale as well as a decrease in non-accrual loans and criticized and classified loans and stabilizing delinquencies. Net charge-offs were $53.0 million for the year ended December 31, 2012 as compared to $114.7 million for the year ended December 31, 2011. The decrease in net charge-offs during 2012 was primarily due to $69.4 million of losses recorded on the sale of commercial real estate loans in the prior year. For the credit related charge-offs, management has been monitoring the performance, economic climate and future cash flow potential of these relationships for some time and strongly believes all of these borrowers have been profoundly impacted by the severity of the recession and the seemingly prolonged return to stable economic conditions. During 2012, the Company signed a definitive agreement to sell $45.8 million of loans having a book balance of $35.1 million to a third party investor and the related loans were moved to loans held-for-sale and recorded at lower of cost or market. The resulting charge-offs totaled $13.1 million. Excluding charge-offs related to the loan sale, the remaining net charge-offs in 2012 are primarily due to 10 commercial relationships totaling $23.2 million. The decrease in 2012 net charge-offs resulted in a decrease in net charge-offs to average outstanding loans to 2.29% for 2012 as compared to 4.83% for 2011 and 2.95% for 2010. Non-performing loans also decreased $12.1 million to $95.6 million at December 31, 2012 as compared to $107.7 million at December 31, 2011 as a result of problem loan resolution strategies implemented in 2012. During 2012, the Company entered into three troubled debt restructuring agreements (“TDR”), which were on non-accrual status and had a carrying amount of $9.1 million at December 31, 2012.
Table 14 provides information with respect to changes in the Company’s allowance for loan losses for the years ended December 31, 2012, 2011, 2010, 2009, and 2008.
TABLE 14: ALLOWANCE FOR LOAN LOSSES
| | | | | | | | | | | | | | | | | | | | |
At or for the Years Ended December 31, | | 2012 | | | 2011 | | | 2010 | | | 2009 | | | 2008 | |
Allowance for loan losses, beginning of year | | $ | 41,667 | | | $ | 81,713 | | | $ | 59,953 | | | $ | 37,309 | | | $ | 27,002 | |
Charge-offs: | | | | | | | | | | | | | | | | | | | | |
Commercial and industrial | | | (51,265 | ) | | | (112,108 | ) | | | (74,014 | ) | | | (19,898 | ) | | | (6,520 | ) |
Home equity | | | (2,222 | ) | | | (3,038 | ) | | | (3,435 | ) | | | (1,795 | ) | | | (1,012 | ) |
Second mortgage | | | (267 | ) | | | (299 | ) | | | (761 | ) | | | (81 | ) | | | (81 | ) |
Residential real estate | | | (249 | ) | | | (1,064 | ) | | | (1,085 | ) | | | (360 | ) | | | (346 | ) |
Other | | | (1,610 | ) | | | (1,303 | ) | | | (1,507 | ) | | | (2,614 | ) | | | (2,769 | ) |
| | | | | | | | | | | | | | | | | | | | |
Total charge-offs | | | (55,613 | ) | | | (117,812 | ) | | | (80,802 | ) | | | (24,748 | ) | | | (10,728 | ) |
| | | | | | | | | | | | | | | | | | | | |
Recoveries: | | | | | | | | | | | | | | | | | | | | |
Commercial and industrial | | | 1,950 | | | | 2,459 | | | | 482 | | | | 334 | | | | 619 | |
Home equity | | | 422 | | | | 60 | | | | 60 | | | | 67 | | | | 24 | |
Second mortgage | | | 28 | | | | 28 | | | | 26 | | | | 4 | | | | 1 | |
Residential real estate | | | 14 | | | | 43 | | | | 199 | | | | 5 | | | | 5 | |
Other | | | 190 | | | | 523 | | | | 277 | | | | 316 | | | | 386 | |
| | | | | | | | | | | | | | | | | | | | |
Total recoveries | | | 2,604 | | | | 3,113 | | | | 1,044 | | | | 726 | | | | 1,035 | |
| | | | | | | | | | | | | | | | | | | | |
Net charge-offs | | | (53,009 | ) | | | (114,699 | ) | | | (79,758 | ) | | | (24,022 | ) | | | (9,693 | ) |
Provision for loan losses | | | 57,215 | | | | 74,266 | | | | 101,518 | | | | 46,666 | | | | 20,000 | |
Reserves transferred | | | — | | | | 387 | | | | — | | | | — | | | | — | |
Allowance for loan losses, end of year | | $ | 45,873 | | | $ | 41,667 | | | $ | 81,713 | | | $ | 59,953 | | | $ | 37,309 | |
Net loans charged-off as a percent of average loans outstanding | | | 2.29 | % | | | 4.83 | % | | | 2.95 | % | | | 0.88 | % | | | 0.37 | % |
Allowance for loan losses as a percent of total gross loans outstanding | | | 2.02 | % | | | 1.80 | % | | | 3.22 | % | | | 2.21 | % | | | 1.36 | % |
Table 15 provides the allocation of the Company’s allowance for loan losses by loan category and the percent of loans in each category to loans receivable at December 31, 2012, 2011, 2010, 2009, and 2008. The portion of the allowance for loan losses allocated to each loan category does not represent the total available for future losses that may occur within the loan category since the allowance for loan losses is a valuation reserve applicable to the entire loan portfolio.
TABLE 15: ALLOCATION OF ALLOWANCE FOR LOAN LOSSES
| | | | | | | | | | | | | | | | | | | | | | | | | | | | | | | | | | | | | | | | |
December 31, | | 2012 | | | 2011 | | | 2010 | | | 2009 | | | 2008 | |
| | | Amount | | | % | | | Amount | | | % | | | Amount | | | % | | | Amount | | | % | | | Amount | | | % | |
Allowance for loan losses: | | | | | | | | | | | | | | | | | | | | | | | | | | | | | | | | | | | | | | | | |
Commercial and industrial | | $ | 33,197 | | | | 72.37 | % | | $ | 34,227 | | | | 82.14 | % | | $ | 76,759 | | | | 82.97 | % | | $ | 55,359 | | | | 82.77 | % | | $ | 33,342 | | | | 81.55 | % |
Residential real estate | | | 3,333 | | | | 7.27 | | | | 903 | | | | 2.17 | | | | 661 | | | | 3.12 | | | | 494 | | | | 2.77 | | | | 375 | | | | 2.46 | |
Home equity (1) | | | 2,734 | | | | 5.96 | | | | 2,566 | | | | 6.16 | | | | 3,084 | | | | 11.58 | | | | 3,034 | | | | 12.04 | | | | 2,738 | | | | 13.09 | |
Other | | | 6,609 | | | | 14.41 | | | | 3,971 | | | | 9.53 | | | | 1,209 | | | | 2.33 | | | | 1,066 | | | | 2.42 | | | | 854 | | | | 2.90 | |
| | | | | | | | | | | | | | | | | | | | | | | | | | | | | | | | | | | | | | | | |
Total allowance for loan losses | | $ | 45,873 | | | | 100.0 | % | | $ | 41,667 | | | | 100.0 | % | | $ | 81,713 | | | | 100.0 | % | | $ | 59,953 | | | | 100.00 | % | | $ | 37,309 | | | | 100.00 | % |
| | | | | | | | | | | | | | | | | | | | | | | | | | | | | | | | | | | | | | | | |
| (1) | Amount includes both home equity and second mortgages. |
22
See Note 6 of the Notes to Consolidated Financial Statements for additional information on the allowance for loan losses.
Investment Securities. Investment securities available for sale and held to maturity decreased $72.8 million, or 14.1%, from $516.9 million at December 31, 2011 to $444.1 million at December 31, 2012. For the year ended December 31, 2012, the Company’s investment impairment review did not identify any credit losses. During 2011, the Company realized OTTI charges of $250 thousand on a single issuer trust preferred security with a par value of $5.0 million. The cumulative OTTI on the single issuer trust preferred security is $1.2 million. The estimated average life of the investment portfolio at December 31, 2012 was 3.3 years with an estimated modified duration of 2.5 years. The reinvestment strategy for 2013 is expected to maintain the average life, duration and portfolio size at approximately the same levels as December 31, 2012.
The Company’s investment policy is established by senior management and approved by the Board of Directors. It is based on asset and liability management goals, and is designed to provide a portfolio of high quality investments that optimizes interest income within acceptable limits of risk and liquidity.
Table 16 provides the estimated fair value and amortized cost of the Company’s portfolio of investment securities at December 31, 2012, 2011, and 2010. For all debt securities classified as available for sale, the carrying value is the estimated fair value.
TABLE 16: SUMMARY OF INVESTMENT SECURITIES
| | | | | | | | | | | | | | | | | | | | | | | | | | | | | | | | | | | | |
December 31, | | 2012 | | | 2011 | | | 2010 | |
| | | Amortized
Cost | | | Net
Unrealized
Gains
(Losses) | | | Estimated
Fair
Value | | | Amortized
Cost | | | Net
Unrealized
Gains
(Losses) | | | Estimated
Fair
Value | | | Amortized
Cost | | | Net
Unrealized
Gains
(Losses) | | | Estimated
Fair
Value | |
Available for sale: | | | | | | | | | | | | | | | | | | | | | | | | | | | | | | | | | | | | |
U.S. Treasury obligations | | $ | 9,998 | | | $ | 13 | | | $ | 10,011 | | | $ | 11,999 | | | $ | 80 | | | $ | 12,079 | | | $ | 47,017 | | | $ | 2 | | | $ | 47,019 | |
U.S. Government agencies | | | 4,966 | | | | (17 | ) | | | 4,949 | | | | — | | | | — | | | | — | | | | — | | | | — | | | | — | |
U.S. Government agency mortgage-backed securities | | | 348,854 | | | | 6,124 | | | | 354,978 | | | | 423,269 | | | | 5,635 | | | | 428,904 | | | | 329,973 | | | | (1,486 | ) | | | 328,487 | |
Other mortgage-backed securities | | | 287 | | | | (1 | ) | | | 286 | | | | 323 | | | | (27 | ) | | | 296 | | | | 7,472 | | | | (1,335 | ) | | | 6,137 | |
State and municipal obligations | | | 36,848 | | | | 3,322 | | | | 40,170 | | | | 45,424 | | | | 3,361 | | | | 48,785 | | | | 82,744 | | | | (347 | ) | | | 82,397 | |
Trust preferred securities | | | 12,622 | | | | (6,740 | ) | | | 5,882 | | | | 12,619 | | | | (7,711 | ) | | | 4,908 | | | | 12,867 | | | | (7,225 | ) | | | 5,642 | |
Corporate Bonds | | | 24,449 | | | | 993 | | | | 25,442 | | | | 19,689 | | | | (281 | ) | | | 19,408 | | | | — | | | | — | | | | — | |
Other | | | 1,464 | | | | — | | | | 1,464 | | | | 1,165 | | | | — | | | | 1,165 | | | | 3,182 | | | | — | | | | 3,182 | |
| | | | | | | | | | | | | | | | | | | | | | | | | | | | | | | | | | | | |
Total available for sale investment securities | | $ | 439,488 | | | $ | 3,694 | | | $ | 443,182 | | | $ | 514,488 | | | $ | 1,057 | | | $ | 515,545 | | | $ | 483,255 | | | $ | (10,391 | ) | | $ | 472,864 | |
| | | | | | | | | | | | | | | | | | | | | | | | | | | | | | | | | | | | |
Held to maturity: | | | | | | | | | | | | | | | | | | | | | | | | | | | | | | | | | | | | |
U.S. Government agency mortgage-backed securities | | $ | 662 | | | $ | 48 | | | $ | 710 | | | $ | 1,344 | | | $ | 69 | | | $ | 1,413 | | | $ | 2,887 | | | $ | 116 | | | $ | 3,003 | |
Other mortgage-backed securities | | | 250 | | | | — | | | | 250 | | | | — | | | | — | | | | — | | | | 152 | | | | — | | | | 152 | |
| | | | | | | | | | | | | | | | | | | | | | | | | | | | | | | | | | | | |
Total held to maturity investment securities | | $ | 912 | | | $ | 48 | | | $ | 960 | | | $ | 1,344 | | | $ | 69 | | | $ | 1,413 | | | $ | 3,039 | | | $ | 166 | | | $ | 3,155 | |
| | | | | | | | | | | | | | | | | | | | | | | | | | | | | | | | | | | | |
Table 17 provides the gross unrealized losses and fair value at December 31, 2012, aggregated by investment category and length of time the individual securities have been in a continuous unrealized loss position.
TABLE 17: ANALYSIS OF GROSS UNREALIZED LOSSES BY INVESTMENT CATEGORY
| | | | | | | | | | | | | | | | | | | | | | | | |
| | | Less than 12 Months | | | 12 Months or Longer | | | Total | |
December 31, 2012 | | Estimated
Fair Value | | | Gross
Unrealized
Losses | | | Estimated
Fair Value | | | Gross
Unrealized
Losses | | | Estimated
Fair Value | | | Gross
Unrealized
Losses | |
U.S. Government agencies | | $ | 4,949 | | | $ | (17 | ) | | $ | — | | | $ | — | | | $ | 4,949 | | | $ | (17 | ) |
U.S. Government agency mortgage-backed securities | | | 69,145 | | | | (980 | ) | | | — | | | | — | | | | 69,145 | | | | (980 | ) |
Other mortgage-backed securities | | | 286 | | | | (1 | ) | | | — | | | | — | | | | 286 | | | | (1 | ) |
Trust preferred securities | | | — | | | | — | | | | 5,882 | | | | (6,740 | ) | | | 5,882 | | | | (6,740 | ) |
| | | | | | | | | | | | | | | | | | | | | | | | |
Total | | $ | 74,380 | | | $ | (998 | ) | | $ | 5,882 | | | $ | (6,740 | ) | | $ | 80,262 | | | $ | (7,738 | ) |
| | | | | | | | | | | | | | | | | | | | | | | | |
23
The Company determines whether the unrealized losses are temporary in accordance with FASB ASC 325,Investments-Other.- and FASB ASC 320,Investments-Debt and Equity Securities.The evaluation is based upon factors such as the creditworthiness of the underlying borrowers, performance of the underlying collateral, if applicable, and the level of credit support in the security structure. Management also evaluates other facts and circumstances that may be indicative of an OTTI condition. This includes, but is not limited to, an evaluation of the type of security, length of time and extent to which the fair value has been less than cost, and near-term prospects of the issuer.
For the year ended December 31, 2012, the Company reviewed its unrealized losses on securities to determine whether such losses were considered to be OTTI. As previously discussed, this review indicated no such unrealized losses were due to deterioration in credit of the underlying securities.
U.S. Government Agencies. At December 31, 2012, the gross unrealized loss in the category of less than 12 months of $17 thousand consisted of one agency security with an estimated fair value of $4.9 million issued and guaranteed by a U.S. Government sponsored agency. The Company monitors key credit metrics such as delinquencies, defaults, cumulative losses and credit support levels to determine if an OTTI exists. As of December 31, 2012, management concluded that an OTTI did not exist on the aforementioned security based upon its assessment. Management also concluded that it does not intend to sell the security, and that it is not more likely than not it will be required to sell the security, before their recovery, which may be maturity, and management expects to recover the entire amortized cost basis of this security.
U.S. Government Agency Mortgage-Backed Securities – At December 31, 2012, the gross unrealized loss in the category of less than 12 months of $980 thousand consisted of nine mortgage-backed securities with an estimated fair value of $69.1 million issued and guaranteed by a U.S. Government sponsored agency. The Company monitors key credit metrics such as delinquencies, defaults, cumulative losses and credit support levels to determine if an OTTI exists. As of December 31, 2012, management concluded that an OTTI did not exist on any of the aforementioned securities based upon its assessment. Management also concluded that it does not intend to sell the securities and that it is not more likely than not it will be required to sell the securities before their recovery, which may be maturity, and management expects to recover the entire amortized cost basis of these securities.
Other Mortgage-Backed Securities – At December 31, 2012, the gross unrealized loss in the category of 12 months or longer of $1 thousand consisted of one non-agency mortgage-backed security with an estimated fair value of $286 thousand. This security was rated “AA” by at least one nationally recognized rating agency. The Company monitors key credit metrics such as delinquencies, defaults, cumulative losses and credit support levels to determine if an OTTI exists. As of December 31, 2012, management concluded that an OTTI did not exist on the this security and believes the unrealized loss is due to increases in market interest rates since the time the underlying security was purchased.
Trust Preferred Securities – At December 31, 2012, the gross unrealized loss in the category of 12 months or longer of $6.7 million consisted of two trust preferred securities. The trust preferred securities are comprised of one non-rated single issuer security with an amortized cost of $3.8 million and an estimated fair value of $1.9 million, and one non-investment grade rated pooled security with an amortized cost of $8.8 million and estimated fair value of $3.9 million. The non-investment grade pooled security is a senior position in the capital structure with approximately 1.93 times principal coverage as of the last reporting date.
In August 2009, the issuer of the single issuer trust preferred security elected to defer its normal quarterly dividend payment. As contractually permitted, the issuer may defer dividend payments up to five years with accumulated dividends, and interest on those deferred dividends, payable upon the resumption of its scheduled dividend payments. The issuer is currently operating under an agreement with its regulators. The agreement stipulates the issuer must receive permission from its regulators prior to resuming its scheduled dividend payments.
During the year ended December 31, 2012, the Company did not record a credit related OTTI charge related to this deferring single issuer trust preferred security. Based on the Company’s most recent evaluation, the Company does not expect the issuer to default on the security based primarily on the issuer’s subsidiary bank reporting that it meets the minimum regulatory requirements to be considered a “well capitalized” institution. The Company recognizes the length of time the issue has been in deferral, the difficult economic environment and some weakened performance measures, while recently improving, increases the probability that a full recovery of principal and anticipated dividends may not be realized. However, the Company concluded that an additional impairment charge was not warranted at December 31, 2012.
Expected maturities of individual securities will differ from contractual maturities because borrowers may have the right to call or prepay obligations with or without call or prepayment penalties. Table 18 provides an estimated maturity summary with the carrying values and weighted average yields on the Company’s portfolio of investment securities at December 31, 2012. The investment securities are presented in the table based on current prepayment assumptions. Yields on tax-exempt obligations have been calculated on a tax-equivalent basis.
24
TABLE 18: MATURITY DISTRIBUTION OF INVESTMENT SECURITIES
| | | | | | | | | | | | | | | | | | | | | | | | | | | | | | | | | | | | | | | | |
| | | 1 Year or Less | | | 1 to 5 Years | | | 5 to 10 Years | | | More than 10 Years | | | Total | |
December 31, 2012 | | Carrying
Value | | | Yield | | | Carrying
Value | | | Yield | | | Carrying
Value | | | Yield | | | Carrying
Value | | | Yield | | | Carrying
Value | | | Yield | |
Available for sale: | | | | | | | | | | | | | | | | | | | | | | | | | | | | | | | | | | | | | | | | |
U.S. Treasury obligations | | $ | 10,011 | | | | 0.78 | % | | $ | — | | | | — | % | | $ | — | | | | — | % | | $ | — | | | | — | % | | $ | 10,011 | | | | 0.78 | % |
U.S. Government agencies | | | — | | | | — | | | | — | | | | — | | | | 4,949 | | | | 2.08 | | | | — | | | | — | | | | 4,949 | | | | 2.08 | |
U.S. Government agency mortgage-backed securities | | | — | | | | — | | | | 9,320 | | | | 1.41 | | | | 21,668 | | | | 2.57 | | | | 323,990 | | | | 1.81 | | | | 354,978 | | | | 1.84 | |
Other mortgage-backed securities | | | — | | | | — | | | | — | | | | — | | | | — | | | | — | | | | 286 | | | | 2.82 | | | | 286 | | | | 2.82 | |
State and municipal obligations | | | 225 | | | | 5.23 | | | | — | | | | — | | | | 8,786 | | | | 4.19 | | | | 31,159 | | | | 4.23 | | | | 40,170 | | | | 4.23 | |
Corporate bonds | | | — | | | | — | | | | 25,442 | | | | 2.20 | | | | — | | | | — | | | | — | | | | — | | | | 25,442 | | | | 2.20 | |
Trust preferred securities | | | — | | | | — | | | | — | | | | — | | | | — | | | | — | | | | 5,882 | | | | 1.24 | | | | 5,882 | | | | 1.24 | |
Other securities | | | 1,216 | | | | 0.01 | | | | 248 | | | | 1.00 | | | | — | | | | — | | | | — | | | | — | | | | 1,464 | | | | 0.18 | |
| | | | | | | | | | | | | | | | | | | | | | | | | | | | | | | | | | | | | | | | |
Total available for sale investment securities | | $ | 11,452 | | | | 0.78 | % | | $ | 35,010 | | | | 1.98 | % | | $ | 35,403 | | | | 2.90 | % | | $ | 361,317 | | | | 2.01 | % | | $ | 443,182 | | | | 2.05 | % |
| | | | | | | | | | | | | | | | | | | | | | | | | | | | | | | | | | | | | | | | |
Held to maturity: | | | | | | | | | | | | | | | | | | | | | | | | | | | | | | | | | | | | | | | | |
U.S. Government agency mortgage-backed securities | | $ | — | | | | — | % | | $ | — | | | | 0 | % | | $ | 662 | | | | 3.82 | % | | $ | — | | | | — | % | | $ | 662 | | | | 3.82 | % |
Other mortgage-backed securities | | | — | | | | — | | | | 250 | | | | 0.89 | | | | — | | | | — | | | | — | | | | — | | | | 250 | | | | 0.89 | |
| | | | | | | | | | | | | | | | | | | | | | | | | | | | | | | | | | | | | | | | |
Total held to maturity investment securities | | $ | — | | | | — | % | | $ | 250 | | | | 0.89 | % | | $ | 662 | | | | 3.82 | % | | $ | — | | | | — | % | | $ | 912 | | | | 3.01 | % |
| | | | | | | | | | | | | | | | | | | | | | | | | | | | | | | | | | | | | | | | |
See Note 4 of the Notes to Consolidated Financial Statements for additional information on investment securities.
Restricted Equity Investments. During 2012, restricted equity investments increased $2.1 million to $17.9 million at December 31, 2012 from $15.8 million at December 31, 2011. The Company, through the Bank, is a member of the Federal Reserve, the Federal Home Loan Bank of New York (“FHLBNY”) and Atlantic Central Bankers Bank, and is required to maintain an investment in the capital stock of each. The FRB, FHLBNY and the Atlantic Central Bankers Bank stock are restricted in that they can only be redeemed by the issuer at par value. These securities are carried at cost and the Company did not identify any events or changes in circumstances that may have had an adverse effect on the value of the investment in accordance with FASB ASC 942, Financial Services—Depository and Lending. As of December 31, 2012, management does not believe that an OTTI of these holdings exists and expects to recover the entire cost of these securities.
Bank Owned Life Insurance. During 2012, bank owned life insurance (“BOLI”) increased $2.0 million to $76.9 million at December 31, 2012. Of the $76.9 million BOLI cash surrender value, the Company had $25.4 million invested in a general account and $51.5 million in a separate account at December 31, 2012. The BOLI separate account is invested in a mortgage-backed securities fund, which is managed by an independent investment firm. Pricing volatility of these underlying investments may have an impact on investment income; however, these fluctuations would be partially mitigated by a stable value wrap agreement which is a component of the separate account. While generally protected by the stable value wrap, significant declines in fair value may result in charges in future periods for values outside the wrap coverage.
Cash and Cash Equivalents. Cash and cash equivalents increased $49.8 million to $169.6 million at December 31, 2012 from $119.8 million at December 31, 2011. This increase is primarily due to the decrease of $70.7 million in investment securities in 2012 and the increase of $45.2 million in deposits partially offset by an increase of $83.3 million in gross loans receivable during the same period.
Goodwill. The goodwill balance was $38.2 million at December 31, 2012 and 2011. See the Critical Accounting Policies, Judgments and Estimates section for additional detail.
Deferred Taxes, net. Deferred taxes, net, increased $1.1 million from $432 thousand at December 31, 2011 to $1.5 million at December 31, 2012 due to an increase in unrealized gains on investment securities.
25
Deposits. Deposits at December 31, 2012 totaled $2.7 billion, an increase of $45.2 million, or 1.7%, from December 31, 2011. Core deposits, which exclude all certificates of deposit, decreased $19.1 million to $2.02 billion, or 74.3% of total deposits, at December 31, 2012 as compared to $2.03 billion, or 76.3% of total deposits, at December 31, 2011.
Table 19 provides a summary of deposits at December 31, 2012, 2011, and 2010.
TABLE 19: SUMMARY OF DEPOSITS
| | | | | | | | | | | | |
December 31, | | 2012 | | | 2011 | | | 2010 | |
Demand deposits | | $ | 1,751,183 | | | $ | 1,772,386 | | | $ | 1,862,940 | |
Savings deposits | | | 264,155 | | | | 262,044 | | | | 279,086 | |
Time deposits under $100,000 | | | 323,768 | | | | 376,369 | | | | 480,993 | |
Time deposits $100,000 or more | | | 256,725 | | | | 177,747 | | | | 228,121 | |
Brokered time deposits | | | 117,393 | | | | 79,431 | | | | 89,320 | |
| | | | | | | | | | | | |
Total | | $ | 2,713,224 | | | $ | 2,667,977 | | | $ | 2,940,460 | |
| | | | | | | | | | | | |
Consumer and commercial deposits are attracted principally from within the Company’s primary market area through a wide complement of deposit products that include checking, savings, money market, certificates of deposits and individual retirement accounts. The Company continues to operate with a core deposit relationship strategy that values the importance of building a long-term stable relationship with each and every customer. The relationship pricing strategy rewards customers that establish core accounts and maintain a certain minimum threshold account balance. Management regularly meets to evaluate internal cost of funds, to analyze the competition, to review the Company’s cash flow requirements for lending and liquidity, and executes any appropriate pricing changes when necessary.
Table 20 provides the distribution of total deposits between core and non-core at December 31, 2012, 2011, and 2010.
TABLE 20: DISTRIBUTION OF DEPOSITS
| | | | | | | | | | | | | | | | | | | | | | | | |
December 31, | | 2012 | | | 2011 | | | 2010 | |
| | | Amount | | | % | | | Amount | | | % | | | Amount | | | % | |
Core deposits | | $ | 2,015,338 | | | | 74.28 | % | | $ | 2,034,430 | | | | 76.3 | % | | $ | 2,142,026 | | | | 72.8 | % |
Non-core deposits | | | 697,886 | | | | 25.72 | | | | 633,547 | | | | 23.7 | | | | 798,434 | | | | 27.2 | |
| | | | | | | | | | | | | | | | | | | | | | | | |
Total deposits | | $ | 2,713,224 | | | | 100.0 | % | | $ | 2,667,977 | | | | 100.0 | % | | $ | 2,940,460 | | | | 100.0 | % |
| | | | | | | | | | | | | | | | | | | | | | | | |
Table 21 provides a summary of certificates of deposit of $100,000 or more by remaining maturity at December 31, 2012.
TABLE 21: CERTIFICATES OF DEPOSIT OF $100,000 OR MORE
| | | | |
December 31, 2012 | | Amount | |
Three months or less | | $ | 48,681 | |
Over three through six months | | | 38,031 | |
Over six through twelve months | | | 70,761 | |
Over twelve months | | | 99,252 | |
| | | | |
Total | | $ | 256,725 | |
| | | | |
See Note 11 of the Notes to Consolidated Financial Statements for additional information on deposits.
Borrowings. Borrowed funds, excluding debentures held by trusts, increased $40.0 million to $63.4 million at December 31, 2012, from $23.4 million at December 31, 2011.
Table 22 provides the maximum month end amount of borrowings by type during the years ended December 31, 2012 and 2011.
26
TABLE 22: SUMMARY OF MAXIMUM MONTH END BORROWINGS
| | | | | | | | |
Years Ended December 31, | | 2012 | | | 2011 | |
FHLBNY advances | | $ | 2,625 | | | $ | 3,895 | |
FHLBNY repurchase agreements | | | 45,000 | | | | 15,000 | |
FHLBNY overnight line of credit | | | 37,000 | | | | — | |
Repurchase agreements with customers | | | 7,278 | | | | 8,249 | |
Table 23 provides information regarding FHLBNY advances and FHLBNY repurchase agreements, interest rates, approximate weighted average amounts outstanding and their approximate weighted average rates at or for the years ended December 31, 2012, 2011, and 2010.
TABLE 23: SUMMARY OF FHLBNY BORROWINGS
| | | | | | | | | | | | |
At or for the Years Ended December 31, | | 2012 | | | 2011 | | | 2010 | |
FHLBNY term amortizing advances outstanding at year end | | $ | 1,415 | | | $ | 2,733 | | | $ | 3,999 | |
Weighted average interest rate at year end | | | 5.43 | % | | | 4.75 | % | | | 4.51 | % |
Approximate average amount outstanding during the year | | $ | 2,023 | | | $ | 3,317 | | | $ | 4,561 | |
Approximate weighted average rate during the year | | | 5.00 | % | | | 4.62 | % | | | 4.45 | % |
FHLBNY term non-amortizing advances outstanding at year end | | $ | 60,000 | | | $ | — | | | $ | — | |
Weighted average interest rate at year end | | | 2.02 | % | | | — | % | | | — | % |
Approximate average amount outstanding during the year | | $ | 16,250 | | | $ | — | | | $ | 2,500 | |
Approximate weighted average rate during the year | | | 1.99 | | | | — | % | | | 5.80 | % |
FHLBNY repurchase agreements outstanding at year end | | $ | — | | | $ | 15,000 | | | $ | 15,000 | |
Weighted average interest rate at year end | | | — | % | | | 4.84 | % | | | 4.84 | % |
Approximate average amount outstanding during the year | | $ | 18,333 | | | $ | 15,000 | | | $ | 15,000 | |
Approximate weighted average rate during the year | | | 2.30 | % | | | 4.91 | % | | | 4.91 | % |
Table 24 provides information regarding securities sold under agreements to repurchase with customers, interest rates, approximate average amounts outstanding and their approximate weighted average rates at December 31, 2012, 2011, and 2010.
TABLE 24: SUMMARY OF SECURITIES SOLD UNDER AGREEMENTS TO REPURCHASE WITH CUSTOMERS
| | | | | | | | | | | | |
At or for the Years Ended December 31, | | 2012 | | | 2011 | | | 2010 | |
Balance at year end | | $ | 1,968 | | | $ | 5,668 | | | $ | 6,307 | |
Weighted average interest rate at year end | | | 0.17 | % | | | 0.08 | % | | | 0.21 | % |
Approximate average amount outstanding during the year | | $ | 4,859 | | | $ | 6,659 | | | $ | 15,243 | |
Approximate weighted average rate during the year | | | 0.15 | % | | | 0.10 | % | | | 0.19 | % |
Deposits are the primary source of funds for the Company’s lending activities, investment activities and general business purposes. Should the need arise, the Company has the ability to access lines of credit from various sources including the FRB, the FHLBNY and various other correspondent banks. In addition, on an overnight basis, the Company has the ability to sell securities under agreements to repurchase.
See Notes 12 and 13 of the Notes to Consolidated Financial Statements for additional information on borrowings.
Junior Subordinated Debentures Held by Trusts that Issued Capital Debt. Table 25 provides a summary of the outstanding capital securities issued by each Issuer Trust and the junior subordinated debenture issued by the Company to each Issuer Trust as of December 31, 2012.
TABLE 25: SUMMARY OF CAPITAL SECURITIES AND JUNIOR SUBORDINATED DEBENTURES
| | | | | | | | | | | | | | | | | | | | | | |
December 31, 2012 | | Capital Securities | | Junior Subordinated Debentures | |
Issuer Trust | | Issuance Date | | | Stated Value | | | Distribution Rate | | Principal Amount | | | Maturity | | | Redeemable Beginning | |
Sun Capital Trust V | | | December 18, 2003 | | | $ | 15,000 | | | 3-mo LIBOR plus 2.80% | | $ | 15,464 | | | | December 30, 2033 | | | | December 30, 2008 | |
Sun Capital Trust VI | | | December 19, 2003 | | | | 25,000 | | | 3-mo LIBOR plus 2.80% | | | 25,774 | | | | January 23, 2034 | | | | January 23, 2009 | |
Sun Statutory Trust VII | | | January 17, 2006 | | | | 30,000 | | | 3-mo LIBOR plus 1.35% | | | 30,928 | | | | March 15, 2036 | | | | March 15, 2011 | |
Sun Capital Trust VII | | | April 19, 2007 | | | | 10,000 | | | 6.428% Fixed | | | 10,310 | | | | June 30, 2037 | | | | June 30, 2012 | |
Sun Capital Trust VIII | | | July 5, 2007 | | | | 10,000 | | | 3-mo LIBOR plus 1.39% | | | 10,310 | | | | October 1, 2037 | | | | October 1, 2012 | |
| | | | | | | | | | | | | | | | | | | | | | |
| | | | | | $ | 90,000 | | | | | $ | 92,786 | | | | | | | | | |
| | | | | | | | | | | | | | | | | | | | | | |
27
On January 23, 2009 and December 30, 2008, the capital securities of Sun Capital Trust VI and Sun Capital Trust V, respectively, became eligible for redemption. As a result of the current interest environment, the Company has elected not to call these securities; however, the Company maintains the right to call these securities in the future on the respective payment anniversary dates.
The Company has customarily relied on dividend payments from the Bank to fund junior subordinated debenture interest obligations. The amount available for payment of dividends to the Company by the Bank was $0 as of December 31, 2012 and no dividends may be paid by the Bank without OCC approval. Per the OCC Agreement, a dividend may only be declared if it is in accordance with the approved capital plan, the Bank remains in compliance with the capital plan following the payment of the dividend and the dividend is approved by the OCC. The Company believes it is capable of funding its junior subordinated debenture interest obligations through available cash balances maintained at the bank holding company for the period of time necessary until earnings are expected to support a dividend from the Bank. See Note 23 of the Notes to Consolidated Financial Statements for additional information on dividend limitations.
Other Liabilities. Other liabilities totaled $82.9 million at December 31, 2012 and $82.4 million at December 31, 2011. Derivative liabilities are the primary component of other liabilities. See Note 19 of the Notes to Consolidated Financial Statements for additional information on derivative instruments.
28
FORWARD-LOOKING STATEMENTS
The Company may from time to time make written or oral “forward-looking statements,” including statements contained in the company’s filings with the securities and exchange commission, in its reports to shareholders and in other communications by the Company, which are made in good faith by the company pursuant to the “safe harbor” provisions of the private securities litigation reform act of 1995. Forward-looking statements often include the words “believes,” “expects,” “anticipates,” “estimates,” “forecasts,” “intends,” “plans,” “targets,” “potentially,” “probably,” “projects,” “outlook,” or similar expressions or future or conditional verbs such as “may,” “will,” “should,” “would,” “could.”
| | • | | statements and assumptions relating to financial performance; |
| | • | | statements relating to the anticipated effects on results of operations or financial condition from recent or future developments or events; |
| | • | | statements relating to our business and growth strategies and our regulatory capital levels; |
| | • | | statements relating to potential sales of our criticized and classified assets; and |
| | • | | any other statements, projections or assumptions that are not historical facts. |
Actual future results may differ materially from our forward-looking statements, and we qualify all forward-looking statements by various risks and uncertainties we face, some of which are beyond our control, as well as the assumptions underlying the statements, including, among others, the following factors:
| | • | | the strength of the United States economy in general and the strength of the local economies in which we conduct operations; |
| | • | | the credit risks of lending activities, including changes in the level and trend of loan delinquencies and write-offs; |
| | • | | the overall quality of the composition of our loan and securities portfolios; |
| | • | | the market for criticized and classified assets that we may sell; |
| | • | | legislative and regulatory changes, including the Dodd-Frank Wall Street Reform and Consumer Protection Act (the “Dodd-Frank Act”) and impending regulations, changes in banking, securities and tax laws and regulations and their application by our regulators and changes in the scope and cost of FDIC insurance and other coverages; |
| | • | | the effects of, and changes in, monetary and fiscal policies and laws, including interest rate policies of the FRB; |
| | • | | inflation, interest rate, market and monetary fluctuations; |
| | • | | fluctuations in the demand for loans, the number of unsold homes and other properties and fluctuations in real estate values in our market areas; |
| | • | | the effect of and our compliance with the terms of the OCC Agreement as well as compliance with the individual minimum capital ratios established for the Bank by the OCC; |
| | • | | the results of examinations of us by the Federal Reserve and of the Bank by the OCC, including the possibility that the OCC may, among other things, require the Bank to increase its allowance for loan losses or to write-down assets; |
| | • | | our ability to control operating costs and expenses; |
| | • | | our ability to manage delinquency rates; |
| | • | | our ability to retain key members of our senior management team; |
| | • | | the costs of litigation, including settlements and judgments; |
| | • | | the increased competitive pressures among financial services companies; |
| | • | | the timely development of and acceptance of new products and services and the perceived overall value of these products and services by businesses and consumers, including the features, pricing and quality compared to our competitors’ products and services; |
| | • | | changes in consumer and business spending, borrowing and saving habits and demand for financial services in our market area; |
| | • | | adverse changes in securities markets; |
| | • | | the inability of key third-party providers to perform their obligations to us; |
| | • | | changes in accounting policies and practices, as may be adopted by the financial institution regulatory agencies, the Financial Accounting Standards Board; |
| | • | | war or terrorist activities; |
| | • | | other economic, competitive, governmental, regulatory and technological factors affecting our operations, pricing, products and services and the other risks described elsewhere herein or in the documents incorporated by reference herein and our other filings with the Securities and Exchange Commission (“SEC”); and |
29
| | • | | our success at managing the risks involved in the foregoing. |
The development of any or all of these factors could have an adverse impact on our financial position and results of operations.
Any forward-looking statements are based upon management’s beliefs and assumptions at the time they are made. We undertake no obligation to publicly update or revise any forward-looking statements included or incorporated by reference herein or to update the reasons why actual results could differ from those contained in such statements, whether as a result of new information, future events or otherwise, unless otherwise required to do so by law or regulation. In light of these risks, uncertainties and assumptions, the forward-looking statements discussed herein or in the documents incorporated by reference herein might not occur, and you should not put undue reliance on any forward-looking statements.
* * * * * *
NON-GAAP FINANCIAL MEASURES
This Annual Report on Form 10-K of the Company contains financial information by methods other than in accordance with Generally Accepted Accounting Principles in the United States of America (“GAAP”). Management uses these “non-GAAP” measures in their analysis of the Company’s performance. Management believes that these non-GAAP financial measures provide a greater understanding of ongoing operations and enhance comparability of results with prior periods as well as demonstrating the effects of significant gains and charges in the current period. The Company believes that a meaningful analysis of its financial performance requires an understanding of the factors underlying that performance. These disclosures should not be viewed as a substitute for operating results determined in accordance with GAAP, nor are they necessarily comparable to non-GAAP performance measures that may be presented by other companies. Management uses these measures to evaluate the underlying performance and efficiency of operations. Management believes these measures reflect core trends of the business. Reconciliations of these ratios to GAAP are presented below.
Tangible Equity to Tangible Assets Ratio:
Tangible equity and tangible assets are calculated by subtracting identifiable intangible assets and goodwill from shareholders’ equity and total assets, respectively, and may be used by investors to assist them in understanding how much loss, exclusive of intangible assets and goodwill, can be absorbed before shareholders’ equity is depleted. The Company’s and the Bank’s regulators also exclude intangible assets and goodwill from shareholders’ equity when assessing capital adequacy of each.
The following table reconciles this non-GAAP performance measure to the GAAP performance measure for the periods indicated:
| | | | | | | | | | | | |
Years Ended December 31, | | 2012 | | | 2011 | | | 2010 | |
Total assets | | $ | 3,224,031 | | | $ | 3,183,926 | | | $ | 3,417,546 | |
Less: Intangible assets | | | 3,262 | | | | 6,947 | | | | 10,631 | |
Less: Goodwill | | | 38,188 | | | | 38,188 | | | | 38,188 | |
| | | | | | | | | | | | |
Tangible assets | | $ | 3,182,581 | | | $ | 3,138,791 | | | $ | 3,368,727 | |
| | | | | | | | | | | | |
Total stockholders’ equity | | $ | 262,595 | | | $ | 309,083 | | | $ | 268,242 | |
Less: Intangible assets | | | 3,262 | | | | 6,947 | | | | 10,631 | |
Less Goodwill | | | 38,188 | | | | 38,188 | | | | 38,188 | |
| | | | | | | | | | | | |
Tangible stockholders’ equity | | $ | 221,145 | | | $ | 263,948 | | | $ | 219,423 | |
| | | | | | | | | | | | |
Total stockholders’ equity to total assets ratio | | | 8.14 | % | | | 9.71 | % | | | 7.85 | % |
Tangible common equity to tangible assets ratio | | | 6.95 | % | | | 8.41 | % | | | 6.51 | % |
Tax Equivalent Net Interest Income:
Tax-equivalent net interest income is net interest income plus the taxes that would have been paid had tax-exempt securities been taxable. This number attempts to enhance the comparability of the performance of assets that have different tax liabilities.
The following table provides a reconciliation of tax equivalent net interest income to GAAP net interest income using a 35% tax rate:
| | | | | | | | | | | | |
Years Ended December 31, | | 2012 | | | 2011 | | | 2010 | |
Net interest income, as presented | | $ | 97,848 | | | $ | 103,528 | | | $ | 110,962 | |
Effect of tax-exempt income | | | 870 | | | | 1,341 | | | | 1,800 | |
| | | | | | | | | | | | |
Net interest income, tax equivalent | | $ | 98,718 | | | $ | 104,869 | | | $ | 112,762 | |
| | | | | | | | | | | | |
Core Deposits:
Core deposits is calculated by excluding time deposits and brokered deposits from total deposits.
The following table provides a reconciliation of core deposits to GAAP total deposits:
| | | | | | | | |
Years Ended December 31, | | 2012 | | | 2011 | |
Total deposits | | $ | 2,713,224 | | | $ | 2,667,977 | |
Less: Time deposits | | | 580,493 | | | | 554,116 | |
Less: Brokered deposits | | | 117,393 | | | | 79,431 | |
| | | | | | | | |
Core deposits | | $ | 2,015,338 | | | $ | 2,034,430 | |
| | | | | | | | |
30
MANAGEMENT’S ANNUAL REPORT ON INTERNAL CONTROL OVER FINANCIAL REPORTING
Management of the Company is responsible for establishing and maintaining adequate internal control over financial reporting, as such term is defined in Securities Exchange Act of 1934 Rules 13(a)-15(f). The Company’s internal control over financial reporting is a process designed to provide reasonable assurance regarding the reliability of financial reporting and the preparation of financial statements for external purposes in accordance with U.S. generally accepted accounting principles.
Management, including the chief executive officer and chief financial officer, conducted an evaluation of the effectiveness of the Company’s internal control over financial reporting based on the framework in Internal Control—Integrated Framework issued by the Committee of Sponsoring Organizations of the Treadway Commission. Because management’s assessment was also conducted to meet the reporting requirements of Section 112 of the Federal Deposit Insurance Corporation Improvement Act (FDICIA), management’s assessment of the Company’s internal control over financial reporting also included controls over the preparation of the schedules equivalent to the basic financial statements in accordance with the instructions for Consolidated Reports of Condition and Income for Schedules RC, RI, RI-A. Based on our evaluation under the framework in Internal Control—Integrated Framework, we concluded that the Company’s internal control over financial reporting was effective as of December 31, 2012.
Deloitte & Touche LLP, an independent registered public accounting firm, has audited the consolidated financial statements included in this Annual Report and has issued a report on the effectiveness of our internal control over financial reporting. Their reports follow this statement.
31
REPORT OF INDEPENDENT REGISTERED PUBLIC ACCOUNTING FIRM
To the Board of Directors and Shareholders of
Sun Bancorp, Inc.
Vineland, New Jersey
We have audited the internal control over financial reporting of Sun Bancorp, Inc. and subsidiaries (the “Company”) as of December 31, 2012, based on criteria established in Internal Control — Integrated Framework issued by the Committee of Sponsoring Organizations of the Treadway Commission. Because management’s assessment and our audit were conducted to meet the reporting requirements of Section 112 of the Federal Deposit Insurance Corporation Improvement Act (FDICIA), management’s assessment and our audit of the Company’s internal control over financial reporting included controls over the preparation of the Federal Financial Institutions Examination Council Instructions for Consolidated Reports of Condition and Income for Schedules RC, RI, RI-A. The Company’s management is responsible for maintaining effective internal control over financial reporting and for its assessment of the effectiveness of internal control over financial reporting, included in the accompanying Management’s Annual Report on Internal Control Over Financial Reporting. Our responsibility is to express an opinion on the Company’s internal control over financial reporting based on our audit.
We conducted our audit in accordance with the standards of the Public Company Accounting Oversight Board (United States). Those standards require that we plan and perform the audit to obtain reasonable assurance about whether effective internal control over financial reporting was maintained in all material respects. Our audit included obtaining an understanding of internal control over financial reporting, assessing the risk that a material weakness exists, testing and evaluating the design and operating effectiveness of internal control based on the assessed risk, and performing such other procedures as we considered necessary in the circumstances. We believe that our audit provides a reasonable basis for our opinion.
A company’s internal control over financial reporting is a process designed by, or under the supervision of, the company’s principal executive and principal financial officers, or persons performing similar functions, and effected by the company’s board of directors, management, and other personnel to provide reasonable assurance regarding the reliability of financial reporting and the preparation of financial statements for external purposes in accordance with generally accepted accounting principles. A company’s internal control over financial reporting includes those policies and procedures that (1) pertain to the maintenance of records that, in reasonable detail, accurately and fairly reflect the transactions and dispositions of the assets of the company; (2) provide reasonable assurance that transactions are recorded as necessary to permit preparation of financial statements in accordance with generally accepted accounting principles, and that receipts and expenditures of the company are being made only in accordance with authorizations of management and directors of the company; and (3) provide reasonable assurance regarding prevention or timely detection of unauthorized acquisition, use, or disposition of the company’s assets that could have a material effect on the financial statements.
Because of the inherent limitations of internal control over financial reporting, including the possibility of collusion or improper management override of controls, material misstatements due to error or fraud may not be prevented or detected on a timely basis. Also, projections of any evaluation of the effectiveness of the internal control over financial reporting to future periods are subject to the risk that the controls may become inadequate because of changes in conditions, or that the degree of compliance with the policies or procedures may deteriorate.
In our opinion, the Company maintained, in all material respects, effective internal control over financial reporting as of December 31, 2012, based on the criteria established in Internal Control — Integrated Framework issued by the Committee of Sponsoring Organizations of the Treadway Commission.
We have also audited, in accordance with the standards of the Public Company Accounting Oversight Board (United States), the consolidated financial statements as of and for the year ended December 31, 2012 of the Company and our report dated March 18, 2013 expressed an unqualified opinion and includes an explanatory paragraph relating to the change in presentation of comprehensive income due to the Company’s adoption of Accounting Standards Update 2011-05.
/s/ Deloitte & Touche LLP
Philadelphia, PA
March 18, 2013
32
REPORT OF INDEPENDENT REGISTERED PUBLIC ACCOUNTING FIRM
To the Board of Directors and Shareholders of
Sun Bancorp, Inc.
Vineland, New Jersey
We have audited the accompanying consolidated statements of financial condition of Sun Bancorp, Inc. and subsidiaries (the “Company”) as of December 31, 2012 and 2011, and the related consolidated statements of operations, comprehensive income, shareholders’ equity, and cash flows for each of the three years in the period ended December 31, 2012. These financial statements are the responsibility of the Company’s management. Our responsibility is to express an opinion on these financial statements based on our audits.
We conducted our audits in accordance with the standards of the Public Company Accounting Oversight Board (United States). Those standards require that we plan and perform the audit to obtain reasonable assurance about whether the financial statements are free of material misstatement. An audit includes examining, on a test basis, evidence supporting the amounts and disclosures in the financial statements. An audit also includes assessing the accounting principles used and significant estimates made by management, as well as evaluating the overall financial statement presentation. We believe that our audits provide a reasonable basis for our opinion.
In our opinion, such consolidated financial statements present fairly, in all material respects, the financial position of Sun Bancorp, Inc. and subsidiaries as of December 31, 2012 and 2011, and the results of their operations and their cash flows for each of the three years in the period ended December 31, 2012, in conformity with accounting principles generally accepted in the United States of America.
As discussed in Note 2 to the financial statements, the Company changed its presentation of comprehensive income due to the adoption of Accounting Standards Update 2011-05.
We have also audited, in accordance with the standards of the Public Company Accounting Oversight Board (United States), the Company’s internal control over financial reporting as of December 31, 2012, based on the criteria established in Internal Control—Integrated Framework issued by the Committee of Sponsoring Organizations of the Treadway Commission and our report dated March 18, 2013 expressed an unqualified opinion on the Company’s internal control over financial reporting.
/s/ Deloitte & Touche LLP
Philadelphia, PA
March 18, 2013
33
SUN BANCORP, INC. AND SUBSIDIARIES
CONSOLIDATED STATEMENTS OF FINANCIAL CONDITION
(Dollars in thousands, except par value amounts)
| | | | | | | | |
December 31, | | 2012 | | | 2011 | |
ASSETS | | | | | | | | |
Cash and due from banks | | $ | 77,564 | | | $ | 68,773 | |
Interest-earning bank balances | | | 92,052 | | | | 51,049 | |
| | | | | | | | |
Cash and cash equivalents | | | 169,616 | | | | 119,822 | |
Investment securities available for sale (amortized cost of $439,488 and $514,488 at December 31, 2012 and 2011, respectively) | | | 443,182 | | | | 515,545 | |
Investment securities held to maturity (estimated fair value of $960 and $1,413 at December 31, 2012 and 2011, respectively) | | | 912 | | | | 1,344 | |
Loans receivable (net of allowance for loan losses of $45,873 and $41,667 at December 31, 2012 and 2011, respectively) | | | 2,230,287 | | | | 2,249,455 | |
Loans held-for-sale, at lower of cost or market | | | 21,922 | | | | 23,192 | |
Loans held-for-sale, at fair value | | | 99,013 | | | | — | |
Restricted equity investments, at cost | | | 17,886 | | | | 15,826 | |
Bank properties and equipment, net | | | 50,805 | | | | 54,756 | |
Real estate owned, net | | | 7,473 | | | | 5,020 | |
Accrued interest receivable | | | 8,054 | | | | 8,912 | |
Goodwill | | | 38,188 | | | | 38,188 | |
Intangible assets, net | | | 3,262 | | | | 6,947 | |
Bank owned life insurance (BOLI) | | | 76,858 | | | | 74,871 | |
Other assets | | | 56,573 | | | | 70,048 | |
| | | | | | | | |
Total assets | | $ | 3,224,031 | | | $ | 3,183,926 | |
| | | | | | | | |
LIABILITIES AND SHAREHOLDERS’ EQUITY | | | | | | | | |
LIABILITIES | | | | | | | | |
Deposits | | $ | 2,713,224 | | | | 2,667,977 | |
Securities sold under agreements to repurchase – customers | | | 1,968 | | | | 5,668 | |
Advances from the Federal Home Loan Bank of New York (FHLBNY) | | | 61,415 | | | | 2,733 | |
Securities sold under agreements to repurchase – FHLBNY | | | — | | | | 15,000 | |
Obligation under capital lease | | | 7,609 | | | | 7,868 | |
Junior subordinated debentures | | | 92,786 | | | | 92,786 | |
Deferred taxes, net | | | 1,509 | | | | 432 | |
Other liabilities | | | 82,925 | | | | 82,379 | |
| | | | | | | | |
Total liabilities | | | 2,961,436 | | | | 2,874,843 | |
| | | | | | | | |
Commitments and contingencies (see Note 18) | | | | | | | | |
| | |
SHAREHOLDERS’ EQUITY | | | | | | | | |
Preferred stock, $1 par value, 1,000,000 shares authorized, none issued | | | — | | | | — | |
Common stock, $1 par value, 200,000,000 shares authorized; 88,290,735 shares issued and 86,184,012 shares outstanding at December 31, 2012; 87,825,038 shares issued and 85,718,315 shares outstanding at December 31, 2011 | | | 88,301 | | | | 87,825 | |
Additional paid-in capital | | | 506,537 | | | | 504,508 | |
Retained deficit | | | (308,011 | ) | | | (257,520 | ) |
Accumulated other comprehensive income | | | 2,186 | | | | 625 | |
Deferred compensation plan trust | | | (256 | ) | | | (193 | ) |
Treasury stock at cost, 2,106,723 shares at December 31, 2012 and 2011, respectively | | | (26,162 | ) | | | (26,162 | ) |
| | | | | | | | |
Total shareholders’ equity | | | 262,595 | | | | 309,083 | |
| | | | | | | | |
Total liabilities and shareholders’ equity | | $ | 3,224,031 | | | $ | 3,183,926 | |
| | | | | | | | |
See Notes to Consolidated Financial Statements.
34
SUN BANCORP, INC. AND SUBSIDIARIES
CONSOLIDATED STATEMENTS OF OPERATIONS
(Dollars in thousands, except per share amounts)
| | | | | | | | | | | | |
Years Ended December 31, | | 2012 | | | 2011 | | | 2010 | |
INTEREST INCOME | | | | | | | | | | | | |
Interest and fees on loans | | $ | 103,707 | | | $ | 112,793 | | | $ | 129,391 | |
Interest on taxable investment securities | | | 9,138 | | | | 10,507 | | | | 11,993 | |
Interest on non-taxable investment securities | | | 1,618 | | | | 2,487 | | | | 3,344 | |
Dividends on restricted equity investments | | | 970 | | | | 893 | | | | 875 | |
| | | | | | | | | | | | |
Total interest income | | | 115,433 | | | | 126,680 | | | | 145,603 | |
| | | | | | | | | | | | |
INTEREST EXPENSE | | | | | | | | | | | | |
Interest on deposits | | | 13,553 | | | | 18,737 | | | | 28,780 | |
Interest on funds borrowed | | | 1,438 | | | | 1,418 | | | | 1,744 | |
Interest on junior subordinated debentures | | | 2,594 | | | | 2,997 | | | | 4,117 | |
| | | | | | | | | | | | |
Total interest expense | | | 17,585 | | | | 23,152 | | | | 34,641 | |
| | | | | | | | | | | | |
Net interest income | | | 97,848 | | | | 103,528 | | | | 110,962 | |
PROVISION FOR LOAN LOSSES | | | 57,215 | | | | 74,266 | | | | 101,518 | |
| | | | | | | | | | | | |
Net interest income after provision for loan losses | | | 40,633 | | | | 29,262 | | | | 9,444 | |
| | | | | | | | | | | | |
NON-INTEREST INCOME | | | | | | | | | | | | |
Service charges on deposit accounts | | | 10,660 | | | | 10,889 | | | | 11,572 | |
Other service charges | | | 294 | | | | 330 | | | | 364 | |
Gain on sale of loans | | | 10,479 | | | | 3,247 | | | | 3,560 | |
Net gain on sale of investment securities | | | 234 | | | | 1,855 | | | | 4,751 | |
Investment products income | | | 2,296 | | | | 2,913 | | | | 2,831 | |
BOLI income | | | 1,986 | | | | 2,964 | | | | 2,074 | |
Net impairment losses on available for sale securities: | | | | | | | | | | | | |
Total impairment | | $ | — | | | $ | (250 | ) | | $ | (4,944 | ) |
Portion of loss recognized in other comprehensive income (before taxes) | | | — | | | | — | | | | 3,615 | |
| | | | | | | | | | | | |
Net impairment losses recognized in operations | | | — | | | | (250 | ) | | | (1,329 | ) |
Derivative credit adjustment | | | (2,275 | ) | | | (12,538 | ) | | | (12,214 | ) |
Other | | | 5,776 | | | | 4,058 | | | | 3,903 | |
| | | | | | | | | | | | |
Total non-interest income | | | 29,450 | | | | 13,468 | | | | 15,512 | |
| | | | | | | | | | | | |
NON-INTEREST EXPENSE | | | | | | | | | | | | |
Salaries and employee benefits | | | 62,500 | | | | 52,501 | | | | 55,219 | |
Occupancy expense | | | 13,011 | | | | 13,373 | | | | 12,508 | |
Equipment expense | | | 7,399 | | | | 7,342 | | | | 6,783 | |
Amortization of intangible assets | | | 3,685 | | | | 3,685 | | | | 3,685 | |
Data processing expense | | | 4,384 | | | | 4,352 | | | | 4,359 | |
Professional fees | | | 3,459 | | | | 3,271 | | | | 2,724 | |
Goodwill impairment | | | — | | | | — | | | | 89,706 | |
Insurance expense | | | 5,824 | | | | 6,186 | | | | 7,696 | |
Advertising expense | | | 2,809 | | | | 2,946 | | | | 2,335 | |
Problem loan expense | | | 5,681 | | | | 8,342 | | | | 5,162 | |
Real estate owned expense, net | | | 2,358 | | | | 1,186 | | | | 801 | |
Office supplies expense | | | 1,247 | | | | 1,307 | | | | 1,501 | |
Other | | | 8,251 | | | | 5,734 | | | | 8,573 | |
| | | | | | | | | | | | |
Total non-interest expense | | | 120,608 | | | | 110,225 | | | | 201,052 | |
| | | | | | | | | | | | |
LOSS BEFORE INCOME TAXES | | | (50,525 | ) | | | (67,495 | ) | | | (176,096 | ) |
INCOME TAX (BENEFIT) EXPENSE | | | (34 | ) | | | 10 | | | | 9,322 | ) |
| | | | | | | | | | | | |
NET LOSS | | | (50,491 | ) | | | (67,505 | ) | | | (185,418 | ) |
| | | | | | | | | | | | |
NET LOSS AVAILABLE TO COMMON SHAREHOLDERS | | $ | (50,491 | ) | | $ | (67,505 | ) | | $ | (185,418 | ) |
| | | | | | | | | | | | |
Basic loss per common share | | $ | (0.59 | ) | | $ | (0.88 | ) | | $ | (6.56 | ) |
| | | | | | | | | | | | |
Diluted loss per common share | | $ | (0.59 | ) | | $ | (0.88 | ) | | $ | (6.56 | ) |
| | | | | | | | | | | | |
Weighted average common shares – basic | | | 85,938,714 | | | | 76,653,990 | | | | 28,258,953 | |
| | | | | | | | | | | | |
Weighted average common shares – diluted | | | 85,938,714 | | | | 76,653,990 | | | | 28,258,953 | |
| | | | | | | | | | | | |
See Notes to Consolidated Financial Statements.
35
SUN BANCORP, INC. AND SUBSIDIARIES
CONSOLIDATED STATEMENTS OF COMPREHENSIVE LOSS
(Dollars in thousands)
| | | | | | | | | | | | |
| | | For the Year Ended
December 31, | |
| | | 2012 | | | 2011 | | | 2010 | |
NET LOSS AVAILABLE TO COMMON SHAREHOLDERS | | $ | (50,491 | ) | | $ | (67,505 | ) | | | (185,418 | ) |
| | | |
Other Comprehensive Income, net of tax (See Note 2) | | | | | | | | | | | | |
Unrealized gains (losses) on securities: | | | | | | | | | | | | |
Unrealized holding gains (losses) gains arising during period | | $ | 1,649 | | | $ | 7,721 | | | | (1,765 | ) |
Less: reclassification adjustment for gains included in net income | | | (88 | ) | | | (1,098 | ) | | | (2,842 | ) |
Reclassification adjustment for net impairment loss recognized in earnings | | | — | | | | 148 | | | | 808 | |
Reclassification adjustment for portion of impairment loss recognized in other comprehensive loss | | | — | | | | — | | | | (2,198 | ) |
| | | | | | | | | | | | |
Other comprehensive income (loss) | | | 1,561 | | | | 6,771 | | | | (5,997 | ) |
| | | | | | | | | | | | |
COMPREHENSIVE LOSS | | $ | (48,930 | ) | | $ | (60,734 | ) | | | (191,415 | ) |
| | | | | | | | | | | | |
See Notes to Consolidated Financial Statements.
36
SUN BANCORP, INC. AND SUBSIDIARIES
CONSOLIDATED STATEMENTS OF SHAREHOLDERS’ EQUITY
(Dollars in thousands)
| | | | | | | | | | | | | | | | | | | | | | | | | | | | | | | | |
| | | Preferred
Stock | | | Common
Stock | | | Additional
Paid-In
Capital | | | Retained
Earnings
(Deficit) | | | Accumulated
Other
Comprehensive
(Loss) Gain | | | Deferred
Compensation
Plan Trust | | | Treasury
Stock | | | Total | |
BALANCE, JANUARY 1, 2010 | | $ | — | | | $ | 25,436 | | | $ | 362,189 | | | $ | (4,597 | ) | | $ | (149 | ) | | $ | (124 | ) | | $ | (26,162 | ) | | $ | 356,593 | |
Net loss | | | — | | | | — | | | | — | | | | (185,418 | ) | | | — | | | | — | | | | — | | | | (185,418 | ) |
Other comprehensive loss | | | — | | | | — | | | | — | | | | — | | | | (5,997 | ) | | | — | | | | — | | | | (5,997 | ) |
Issuance of preferred stock (See Note 21) | | | 88,009 | | | | — | | | | — | | | | — | | | | — | | | | | | | | — | | | | 88,009 | |
Redemption of preferred stock (See Note 21) | | | (88,009 | ) | | | — | | | | — | | | | — | | | | — | | | | | | | | — | | | | (88,009 | ) |
Issuance of common stock | | | — | | | | 26,983 | | | | 81,074 | | | | — | | | | — | | | | (110 | ) | | | — | | | | 107,947 | |
Preferred and common stock issuance costs (See Note 21) | | | — | | | | — | | | | (7,495 | ) | | | — | | | | — | | | | — | | | | — | | | | (7,495 | ) |
Stock-based compensation | | | — | | | | 45 | | | | 2,567 | | | | — | | | | — | | | | — | | | | — | | | | 2,612 | |
| | | | | | | | | | | | | | | | | | | | | | | | | | | | | | | | |
BALANCE, DECEMBER 31, 2010 | | $ | — | | | $ | 52,464 | | | $ | 438,335 | | | $ | (190,015 | ) | | $ | (6,146 | ) | | $ | (234 | ) | | $ | (26,162 | ) | | $ | 268,242 | |
| | | | | | | | | | | | | | | | | | | | | | | | | | | | | | | | |
Net loss | | | — | | | | — | | | | — | | | | (67,505 | ) | | | — | | | | — | | | | — | | | | (67,505 | ) |
Other comprehensive income | | | — | | | | — | | | | — | | | | — | | | | 6,771 | | | | — | | | | — | | | | 6,771 | |
Capital raise | | | — | | | | 34,930 | | | | 64,621 | | | | — | | | | — | | | | — | | | | — | | | | 99,551 | |
Deferred cost of capital raise | | | — | | | | — | | | | (571 | ) | | | — | | | | — | | | | — | | | | — | | | | (571 | ) |
Issuance of common stock | | | — | | | | 354 | | | | 742 | | | | — | | | | — | | | | 41 | | | | — | | | | 1,137 | |
Stock based compensation | | | — | | | | 77 | | | | 1,381 | | | | — | | | | — | | | | — | | | | — | | | | 1,458 | |
| | | | | | | | | | | | | | | | | | | | | | | | | | | | | | | | |
BALANCE, DECEMBER 31, 2011 | | $ | — | | | $ | 87,825 | | | $ | 504,508 | | | $ | (257,520 | ) | | $ | 625 | | | $ | (193 | ) | | $ | (26,162 | ) | | $ | 309,083 | |
| | | | | | | | | | | | | | | | | | | | | | | | | | | | | | | | |
Net loss | | | — | | | | — | | | | — | | | | (50,491 | ) | | | — | | | | — | | | | — | | | | (50,491 | ) |
Other comprehensive income | | | — | | | | — | | | | — | | | | — | | | | 1,561 | | | | — | | | | — | | | | 1,561 | |
Issuance of common stock | | | — | | | | 396 | | | | 794 | | | | — | | | | — | | | | (63 | ) | | | — | | | | 1,127 | |
Stock based compensation | | | — | | | | 80 | | | | 1,235 | | | | — | | | | — | | | | — | | | | — | | | | 1,315 | |
| | | | | | | | | | | | | | | | | | | | | | | | | | | | | | | | |
BALANCE, DECEMBER 31, 2012 | | $ | — | | | $ | 88,301 | | | $ | 506,537 | | | $ | (308,011 | ) | | $ | 2,186 | | | $ | (256 | ) | | $ | (26,162 | ) | | $ | 262,595 | |
| | | | | | | | | | | | | | | | | | | | | | | | | | | | | | | | |
See Notes to Consolidated Financial Statements.
37
SUN BANCORP, INC. AND SUBSIDIARIES
CONSOLIDATED STATEMENTS OF CASH FLOWS
(Dollars in thousands)
| | | | | | | | | | | | |
Years Ended December 31, | | 2012 | | | 2011 | | | 2010 | |
OPERATING ACTIVITIES | | | | | | | | | | | | |
Net (loss) income | | $ | (50,491 | ) | | $ | (67,505 | ) | | $ | (185,418 | ) |
Adjustments to reconcile net income to net cash provided by operating activities: | | | | | | | | | | | | |
Provision for loan losses | | | 57,215 | | | | 74,266 | | | | 101,518 | |
Increase (decrease) in reserve for unfunded commitments | | | 232 | | | | (1,109 | ) | | | 525 | |
Depreciation, amortization and accretion | | | 12,700 | | | | 11,978 | | | | 11,574 | |
Goodwill impairment | | | — | | | | — | | | | 89,706 | |
Impairment of bank properties and equipment and real estate owned | | | 1,736 | | | | 1,394 | | | | 277 | |
Impairment charge on available for sale securities | | | — | | | | 250 | | | | 1,329 | |
Net gain on sales and calls of investment securities | | | (151 | ) | | | (1,901 | ) | | | (4,673 | ) |
Loss (gain) on real estate owned | | | 345 | | | | (26 | ) | | | (18 | ) |
Purchase of trading securities | | | — | | | | (41,371 | ) | | | — | |
Proceeds from sale of trading securities | | | — | | | | 41,367 | | | | — | |
Increase in fair value of interest rate lock commitments | | | (847 | ) | | | — | | | | — | |
Gain on sale of loans | | | (8,414 | ) | | | (3,247 | ) | | | (3,560 | ) |
Increase in cash surrender value of BOLI | | | (1,987 | ) | | | (2,199 | ) | | | (2,074 | ) |
Deferred income taxes | | | — | | | | — | | | | 20,342 | |
Stock-based compensation | | | 1,315 | | | | 1,458 | | | | 2,612 | |
Shares contributed to employee benefit plans | | | 1,126 | | | | 1,096 | | | | 644 | |
Credit valuation adjustment | | | 54 | | | | (2,042 | ) | | | 1,948 | |
Change in fair value of residential mortgage loans held-for-sale | | | (2,065 | ) | | | — | | | | — | |
Mortgage loans originated for sale | | | (471,185 | ) | | | (141,482 | ) | | | (189,077 | ) |
Proceeds from the sale of mortgage loans | | | 405,842 | | | | 135,895 | | | | 185,520 | |
Change in assets and liabilities which provided (used) cash: | | | | | | | | | | | | |
Accrued interest receivable | | | 858 | | | | 1,092 | | | | 2,231 | |
Other assets | | | 4,378 | | | | 12,629 | | | | 5,373 | |
Other liabilities | | | 11,698 | | | | 11,872 | | | | (1,169 | ) |
| | | | | | | | | | | | |
Net cash (used in) provided by operating activities | | | (37,641 | ) | | | 32,415 | | | | 37,610 | |
| | | | | | | | | | | | |
INVESTING ACTIVITIES | | | | | | | | | | | | |
Purchases of investment securities available for sale | | | (117,411 | ) | | | (248,524 | ) | | | (465,629 | ) |
Purchases of investment securities held to maturity | | | (250 | ) | | | — | | | | — | |
Net (purchase) redemption of restricted equity securities | | | (2,060 | ) | | | 1,764 | | | | (2,091 | ) |
Proceeds from maturities, prepayments or calls of investment securities available for sale | | | 141,795 | | | | 151,002 | | | | 246,278 | |
Proceeds from maturities, prepayments or calls of investment securities held to maturity | | | 676 | | | | 1,693 | | | | 3,911 | |
Proceeds from sale of investment securities available for sale | | | 47,500 | | | | 63,001 | | | | 175,381 | |
Proceeds from the sale of commercial real estate loans | | | — | | | | 98,628 | | | | 54,808 | |
Net (increase) decrease in loans | | | (67,475 | ) | | | 12,447 | | | | 51,794 | |
Purchases of bank properties and equipment | | | (3,869 | ) | | | (8,384 | ) | | | (5,090 | ) |
Return of surrender value of BOLI | | | — | | | | 2,230 | | | | 5,171 | |
Proceeds from sale of real estate owned | | | 3,559 | | | | 1,597 | | | | 8,049 | |
Insurance proceeds from real estate owned | | | — | | | | — | | | | 154 | |
| | | | | | | | | | | | |
Net cash provided by investing activities | | | 2,465 | | | | 75,454 | | | | 72,736 | |
| | | | | | | | | | | | |
FINANCING ACTIVITIES | | | | | | | | | | | | |
Net increase (decrease) in deposits | | | 45,247 | | | | (272,105 | ) | | | 31,192 | |
Net repayments of federal funds purchased | | | — | | | | — | | | | (89,000 | ) |
Net repayments of securities sold under agreements to repurchase - customer | | | (3,700 | ) | | | (639 | ) | | | (12,370 | ) |
Repayments of short-term advances from FHLBNY | | | (1,318 | ) | | | (1,266 | ) | | | (11,216 | ) |
Borrowings of long-term advances from FHLBNY | | | 60,000 | | | | — | | | | — | |
Repayments under securities sold under agreements to repurchase - FHLB | | | (15,000 | ) | | | — | | | | — | |
Repayment of obligation under capital lease | | | (259 | ) | | | (243 | ) | | | (190 | ) |
Proceeds from the issuance of preferred stock (see Note 21) | | | — | | | | — | | | | 88,009 | |
Redemption of preferred stock | | | — | | | | — | | | | (88,009 | ) |
Preferred stock issuance costs | | | — | | | | — | | | | (7,495 | ) |
Common stock issuance costs | | | — | | | | (571 | ) | | | — | |
Proceeds from issuance of common stock | | | — | | | | 99,551 | | | | 106,839 | |
| | | | | | | | | | | | |
Net cash provided by (used in) financing activities | | | 84,970 | | | | (175,273 | ) | | | 17,760 | |
| | | | | | | | | | | | |
NET INCREASE (DECREASE) IN CASH AND CASH EQUIVALENTS | | | 49,794 | | | | (67,404 | ) | | | 128,106 | |
CASH AND CASH EQUIVALENTS, BEGINNING OF YEAR | | | 119,822 | | | | 187,226 | | | | 59,120 | |
| | | | | | | | | | | | |
CASH AND CASH EQUIVALENTS, END OF YEAR | | $ | 169,616 | | | $ | 119,822 | | | $ | 187,226 | |
| | | | | | | | | | | | |
SUPPLEMENTAL DISCLOSURES OF CASH FLOW INFORMATION | | | | | | | | | | | | |
Interest paid | | $ | 21,137 | | | $ | 25,048 | | | $ | 32,766 | |
Income taxes paid | | | — | | | | 154 | | | | 110 | |
SUPPLEMENTAL DISCLOSURE OF NON-CASH ITEMS | | | | | | | | | | | | |
Transfer of real estate owned to bank property | | $ | — | | | $ | — | | | $ | 1,900 | |
Transfer of loans or bank properties to real estate owned | | | 7,679 | | | | 3,344 | | | | 4,625 | |
Transfer of loans from held-for-sale to held-for-investment | | | 9,905 | | | | 6,374 | | | | 2,985 | |
Commitments to purchase investment securities | | | — | | | | — | | | | 2,500 | |
See Notes to Consolidated Financial Statements.
38
SUN BANCORP, INC. AND SUBSIDIARIES
NOTES TO CONSOLIDATED FINANCIAL STATEMENTS
(All dollar amounts presented in the tables, except share and per share amounts, are in thousands)
1. NATURE OF OPERATIONS
Sun Bancorp, Inc. (the “Company”) is registered as a bank holding company under the Bank Holding Company Act of 1956, as amended. The Company is the parent company of Sun National Bank (the “Bank”), a national bank and the Company’s principal wholly owned subsidiary. The Bank’s wholly owned subsidiaries are Sun Financial Services, L.L.C., and 2020 Properties, L.L.C. and 4040 Properties, L.L.C. The Bank’s former subsidiary, Sun Home Loans, Inc., was merged into the Bank on September 16, 2011, pursuant to New Jersey Law.
The Company’s principal business is to serve as a holding company for the Bank. The Bank is in the business of attracting customer deposits through its Community Banking Centers and investing these funds, together with borrowed funds and cash from operations, in loans, primarily commercial real estate, small business, residential mortgage and non-real estate loans, as well as mortgage-backed and investment securities. The principal business of Sun Financial Services, L.L.C. is to offer mutual funds, securities brokerage, annuities and investment advisory services through the Bank’s Community Banking Centers. The principal business of 2020 Properties, L.L.C. and 4040 Properties, L.L.C. is to acquire and thereafter liquidate certain real estate and other assets in satisfaction of debts previously contracted by the Bank. The Company’s various capital trusts, Sun Capital Trust V, Sun Capital Trust VI, Sun Capital Trust VII, Sun Statutory Trust VII and Sun Capital Trust VIII, collectively, the “Issuing Trusts,” are presented on a deconsolidated basis. The Issuing Trusts, consisting of Delaware business trusts and one business trust operating in Connecticut, hold junior subordinated debentures issued by the Company.
Through the Bank, the Company provides commercial and consumer banking services. As of December 31, 2012, the Company had 62 locations throughout New Jersey.
The Company’s outstanding common stock is traded on the NASDAQ Global Select Market under the symbol “SNBC”. The Company is subject to the reporting requirements of the Securities and Exchange Commission (“SEC”). The Bank’s primary federal regulator is the Office of the Comptroller of the Currency (the “OCC”).
2. SUMMARY OF SIGNIFICANT ACCOUNTING POLICIES
Basis of Presentation. The accounting and reporting policies conform to accounting principles generally accepted in the United States of America (“GAAP”) and to general practices in the banking industry. The preparation of the consolidated financial statements in conformity with GAAP requires management to make estimates and assumptions that affect the reported amounts of assets and liabilities and disclosure of contingent assets and liabilities at the date of the financial statements. The significant estimates include the allowance for loan losses, goodwill, intangible assets, income taxes, stock-based compensation, and the fair value of financial instruments. Actual results may differ from these estimates under different assumptions or conditions.
Basis of Consolidation. The consolidated financial statements include, after all intercompany balances and transactions have been eliminated, the accounts of the Company, its principal wholly owned subsidiary, the Bank, and the Bank’s wholly owned subsidiaries, Sun Financial Services, L.L.C., 2020 Properties, L.L.C., and 4040 Properties, L.L.C. In accordance with Financial Accounting Standards Board Accounting Standards Codification (“FASB ASC”) 810, Consolidation, the Issuing Trusts are deconsolidated. See Note 14 of the Notes to Consolidated Financial Statements for additional information on the Company’s participation in the Issuing Trusts.
Segment Information. In accordance with FASB ASC 280, Segment Reporting(FASB ASC 280), the Company has one reportable operating segment, “Community Banking.” All of the Company’s activities are interrelated, and each activity is dependent and assessed based on how each of the activities of the Company supports the others. For example, lending is dependent upon the ability of the Company to fund itself with deposits and other borrowings, and manage interest rate and credit risk. Accordingly, all significant operating decisions are based upon analysis of the Company as one segment or unit.
Cash and Cash Equivalents. Cash and cash equivalents includes cash and amounts due from banks, interest-earning bank balances and federal funds sold, all of which have original maturity dates of 90 days or less.
Investment Securities. The Company’s investment securities include both held-to-maturity and available-for-sale. The purchase and sale of the Company’s investment securities are recorded based on trade date accounting. At December 31, 2012 and 2011, the Company had no unsettled transactions. The following provides further information on the Company’s accounting for debt securities:
Held-to-Maturity - Investment securities that management has the positive intent and ability to hold until maturity are classified
39
as held-to-maturity and carried at their remaining unpaid principal balance, net of unamortized premiums or unaccreted discounts. Premiums are amortized and discounts are accreted using the interest method over the estimated remaining term of the underlying security.
Available- for-Sale – Investment securities that will be held for indefinite periods of time, including securities that may be sold in response to changes in market interest or prepayment rates, needs for liquidity, and changes in the availability and the yield of alternative investments, are classified as available-for-sale. These assets are carried at their estimated fair value. Fair values are based on quoted prices for identical assets in active markets, quoted prices for similar assets in markets that are either actively or not actively traded, or in some cases where there is limited activity or less transparency around inputs, internally developed discounted cash flow models. Unrealized gains and losses are excluded from earnings and are reported net of tax in accumulated other comprehensive income (loss) on the consolidated statements of financial condition until realized, including those recognized through the non-credit component of an other-than-temporary impairment (“OTTI”) charge.
Trading –From time to time, the Company purchases debt securities principally for the purpose of selling in the near-term. Any trading security balances held as of the reporting date are classified as held-for-trading and accounted for at fair value. Realized and unrealized gains and losses on trading securities are included in other income on the consolidated statements of operations. Fair values of trading securities are based on quoted market prices, pricing models (utilizing indicators of general market conditions or other economic measurements), or management’s estimates of amounts to be realized on settlement, assuming current market conditions and an orderly disposition over a reasonable period of time. The Company had no investment securities classified as trading at December 31, 2012 and 2011.
In accordance with FASB ASC 325-40, Beneficial Interests in Securitized Financial Assets(FASB ASC 325-40), and FASB ASC 320,Investment – Debt and Equity Securities (FASB ASC 320), the Company evaluates its securities portfolio for OTTI throughout the year. Each investment, which has a fair value less than the book value, is reviewed on a quarterly basis by management. Management considers, at a minimum, whether the following factors exist that, both individually or in combination, could indicate that the decline is other-than-temporary: (a) the Company has the intent to sell the security; (b) it is more likely than not that it will be required to sell the security before recovery; and (c) the Company does not expect to recover the entire amortized cost basis of the security. Among the factors that are considered in determining the Company’s intent is a review of capital adequacy, interest rate risk profile and liquidity at the Company. An impairment charge is recorded against individual securities if the review described above concludes that the decline in value is other-than-temporary. During 2012, it was determined there were no other-than-temporarily impaired investments. As a result, the Company did not record credit related OTTI charges through earnings during the year ended December 31, 2012 as compared to $250 thousand for the year ended December 31, 2011 and $1.3 million for the year ended December 31, 2010.
Loans Held-for-Sale. The Company had $120.9 million and $23.2 million of loans held-for-sale at December 31, 2012 and 2011, respectively. The balance at December 31, 2012 includes $99.0 million of residential mortgages originated with the intent to sell which are recorded at fair value and $21.9 million of commercial real estate loans, recorded at lower of cost or market. Effective July 1, 2012, the Company elected the fair value option under FASB ASC 825,The Fair Value Option for Financial Instruments, (“FASB ASC 825”), on its residential mortgage loans held-for-sale portfolio. This election resulted in a positive market value adjustment of $2.1 million, which was recognized in gain on sale of loans on the consolidated statements of operations for the twelve months ended December 31, 2012. At December 31, 2011, loans held-for-sale were carried at the lower of cost or estimated fair value, on an aggregate basis.
Deferred Loan Fees. Loan fees on loans held-for-investment, net of certain direct loan origination costs, are deferred and the balance is amortized to income as a yield adjustment over the life of the loan using the interest method. Loan fees on loans held-for-sale, net of certain direct loan origination costs, are deferred until the related loans are sold and are included in the determination of the gains or losses upon sale, which are reported in gain on sale of loans in the consolidated statements of operations.
Allowance for Loan Losses. The allowance for loan losses is determined by management based upon past experience, evaluation of estimated loss and impairment in the loan portfolio, current economic conditions and other pertinent factors. The allowance for loan losses is maintained at a level that management considers adequate to provide for estimated losses and impairment based upon an evaluation of known and inherent risk in the loan portfolio. Loan impairment is evaluated based on the fair value of collateral. While management uses the best information available to make such evaluations, future adjustments to the allowance may be necessary if economic conditions differ substantially from the assumptions used in making the evaluations.
The provision for loan losses is based upon historical loan loss experience, a series of qualitative factors and an evaluation of
40
estimated losses in the current commercial loan portfolio, including the evaluation of impaired loans under FASB ASC 310, Receivables (“FASB ASC 310”). Values assigned to the qualitative factors and those developed from historic loss experience provide a dynamic basis for the calculation of reserve factors for both pass-rated loans (general pooled allowance) and those criticized and classified loans that continue to perform. A loan is considered to be impaired when, based upon current information and events, it is probable that the Company will be unable to collect all amounts due according to the contractual terms of the loan. An insignificant delay or insignificant shortfall in amount of payments does not necessarily result in the loan being identified as impaired. For this purpose, delays less than 90 days are considered to be insignificant. Impairment losses are included in the provision for loan losses. Loans not individually reviewed are evaluated as a group using reserve factor percentages based on historic loss experience qualitative factors. Included in these qualitative factors are:
| | • | | Levels of past due, classified and non-accrual loans, troubled debt restructurings and modifications |
| | • | | Nature and volume of loans |
| | • | | Changes in lending policies and procedures, underwriting standards, collections, charge-offs and recoveries, and for commercial loans, the level of loans being approved with exceptions to policy |
| | • | | Experience, ability and depth of management and staff |
| | • | | National and local economic and business conditions, including various market segments |
| | • | | Quality of the Company’s loan review system and degree of Board oversight |
| | • | | Concentrations of credit by industry, geography and collateral type, with a specific emphasis on real estate, and changes in levels of such concentrations |
| | • | | Effect of external factors, including the deterioration of collateral values, on the level of estimated credit losses in the current portfolio |
Commercial loans, including commercial real estate loans, are placed on non-accrual at the time the loan is 90 days delinquent unless the credit is well secured and in the process of collection. Generally, commercial loans and commercial real estate loans are charged-off no later than 180 days delinquent unless the loan is well secured and in the process of collection, or other extenuating circumstances support collection. Residential real estate loans are typically placed on non-accrual at the time the loan is 90 days delinquent. Other consumer loans are typically charged-off at 180 days delinquent. In all cases, loans must be placed on non-accrual or charged-off at an earlier date if collection of principal or interest is considered doubtful.
Restricted Equity Securities. Certain securities are classified as restricted equity securities because ownership is restricted and there is not an established market for their resale. These securities are carried at cost and are evaluated for impairment on a quarterly basis.
Bank Properties and Equipment. Land is carried at cost. Bank properties and equipment are stated at cost, less accumulated depreciation. Depreciation, which is recorded in equipment expense on the consolidated statements of operations, is computed by the straight-line method based on the estimated useful lives of the assets, generally as follows:
| | |
Asset Type | | Estimated Useful Life |
| Buildings | | 40 years |
| Leasehold improvements | | Lesser of the useful life or the remaining lease term, including renewals, if applicable |
| Equipment | | Three to 10 years |
Real Estate Owned. Real estate owned is comprised of property acquired through foreclosure, deed in lieu and bank property that is not in use. Property acquired through foreclosure is carried at the lower of cost or fair value of the property based on an appraisal less estimated disposal costs. Credit losses arising from foreclosure transactions are charged against the allowance for loan losses. Bank properties are carried at the lower of cost or fair value less estimated disposal cost. Costs to maintain real estate owned and any subsequent gains or losses are included in real estate owned expense, net on the Company’s consolidated statements of operations.
Goodwill and Intangible Assets. Goodwill is the excess of the fair value of liabilities assumed over the fair value of tangible and identifiable intangible assets acquired in a business combination. Goodwill is not amortized but is tested for impairment annually or more frequently if events or changes in circumstances indicate that the asset might be impaired. The Company tests goodwill for impairment annually as of December 31. The Company elected to not apply the qualitative evaluation option permitted under Accounting Standards Update (“ASU”) 2011-8,Intangibles – Goodwill and Other (Topic 35): Testing Goodwill for Impairment issued in September 2011. Therefore, the Company utilizes the two-step goodwill impairment test outlined in FASB ASC 350, Intangibles – Goodwill and Other (“FASB ASC 350”). Step one, which is used to identify potential impairment, compares the fair value of the reporting unit with its carrying amount, including goodwill. A reporting unit is an operating segment, or one level below an operating segment, as defined in FASB ASC 280. If the fair value of a reporting unit exceeds its carrying value, goodwill of the reporting unit is not considered impaired and step two is therefore unnecessary. If the carrying amount of the reporting unit exceeds its fair value,
41
the second step is performed to measure the amount of the impairment loss, if any. At December 31, 2012, the Company performed its annual goodwill impairment test, and step one of the analysis indicated that the Company’s fair value was greater than its carrying value; therefore, the Company’s goodwill was not impaired at December 31, 2012.
Intangible assets, net on the consolidated statements of financial condition, consist of core deposit intangibles, net of accumulated amortization from the Bank’s previous acquisitions. Core deposit intangibles are amortized using the straight-line method based on the characteristics of the particular deposit type and are evaluated annually for impairment. See Note 10 for further details on goodwill and intangible assets.
Bank Owned Life Insurance (“BOLI”). The Company has purchased life insurance policies on certain key employees. These policies are recorded at their cash surrender value, or the amount that can be realized in accordance with FASB ASC 325-30, Investments in Insurance Contracts. At December 31, 2012, the Company had $25.4 million invested in a general account and $51.5 million in a separate account, for a total BOLI cash surrender value of $76.9 million. The BOLI separate account is invested in a mortgage-backed securities fund, which is managed by an independent investment firm. Pricing volatility of these underlying instruments may have an impact on investment income; however, the fluctuations would be partially mitigated by a stable value wrap agreement which is a component of the separate account. Income from these policies and changes in the cash surrender value are recorded in BOLI income of the consolidated statements of operations.
Long-Lived Assets. Management evaluates the carrying amount of long-lived assets for impairment whenever events or changes in circumstances indicate that the carrying amount of an asset may not be recoverable. Measurement of an impaired loss for long-lived assets and intangibles with definite lives would be based on the fair value of the asset. The Company recognized impairment losses of $37 thousand, $338 thousand and $123 thousand for the years ended December 31, 2012, 2011 and 2010, respectively, on long-lived assets. Impairment losses on long-lived assets are recorded in other expense in the Company’s consolidated statements of operations.
Loan Servicing Assets. The Company originates certain Small Business Administration (“SBA”) loans for sale to institutional investors. In accordance with FASB ASC 860, Transfers and Servicing(“FASB ASC 860”), the cost of loans sold is allocated between the servicing rights, the retained portion of the loan and the sold portion of the loan based on the relative fair values of each.
Loan servicing rights are amortized in proportion to, and over the period of, estimated net servicing income. In accordance with FASB ASC 860, the Company regularly evaluates the loan servicing asset for impairment. Because loans are sold individually and are not pooled, the Company does not stratify groups of loans based on risk characteristics for purposes of measuring impairment. The Company measures the loan servicing assets by estimating the present value of expected future cash flows for each servicing asset, based on their unique characteristics and market-based assumptions for prepayment speeds and records a valuation allowance for the amount by which the carrying amount of the servicing asset exceeds the fair value. The gross carrying value of the Company’s loan servicing assets was $389 thousand and $429 thousand at December 31, 2012 and 2011, respectively. The fair value of the loan servicing rights is determined by valuation techniques. Valuation adjustments to the loan servicing assets for the years ended December 31, 2012, 2011 and 2010 were $95 thousand, of expense, $0 and $0, respectively. These adjustments are reflected in other income on the consolidated statements of operations. The valuation allowance for the loan servicing assets at December 31, 2012 and 2011 was $118 thousand and $23 thousand, respectively. The net carrying value of the loan servicing asset is included within other assets on the consolidated statements of financial condition.
Securities Sold Under Agreements to Repurchase. The Company enters into sales of securities under agreements to repurchase with its customers and the Federal Home Loan Bank of New York (“FHLBNY”). In accordance with FASB ASC 860, these agreements are treated as financings, and the obligations to repurchase securities sold are reflected as a liability in the consolidated statements of financial condition. Securities pledged as collateral under agreements to repurchase are reflected as assets in the accompanying consolidated statements of financial condition.
Accounting for Derivative Financial Instruments and Hedging Activities. The Company recognizes all derivative instruments at fair value as either assets or liabilities in other assets or other liabilities on the consolidated statements of financial condition. The accounting for changes in the fair value of a derivative instrument depends on whether it has been designated and qualifies as part of a hedging relationship. For derivatives not designated as hedges, the gain or loss is recognized in current earnings.
The Company’s derivative financial instruments are not exchange-traded and therefore are valued utilizing models that use as their basis readily observable market parameters, specifically the LIBOR swap curve, and are classified within Level 2 of the valuation hierarchy.
Accumulated Other Comprehensive Loss. The Company classifies items of accumulated other comprehensive loss by their nature and displays the accumulated balance of accumulated other comprehensive loss separately from retained earnings and additional paid-in capital in the equity section of the consolidated statements of financial condition. Amounts categorized as
42
accumulated other comprehensive loss represent net unrealized gains or losses on investment securities available for sale, net of tax and the non-credit portion of any OTTI loss not recorded in earnings. Reclassifications are made to avoid double counting items which are displayed as part of net income for the period. These reclassifications for the years ended December 31, 2012, 2011, and 2010 are as follows:
DISCLOSURE OF RECLASSIFICATION AMOUNTS, NET OF TAX
| | | | | | | | | | | | | | | | | | | | | | | | | | | | | | | | | | | | |
Years Ended December 31, | | 2012 | | | 2011 | | | 2010 | |
| | | Pre-tax | | | Tax | | | After-tax | | | Pre-tax | | | Tax | | | After-tax | | | Pre-tax | | | Tax | | | After-tax | |
Unrealized holding gain (loss) on securities available for sale during the year | | $ | 2,788 | | | $ | (1,139 | ) | | $ | 1,649 | | | $ | 13,053 | | | $ | (5,332 | ) | | $ | 7,721 | | | $ | (2,903 | ) | | $ | 1,138 | | | $ | (1,765 | ) |
Less: | | | | | | | | | | | | | | | | | | | | | | | | | | | | | | | | | | | | |
Reclassification adjustment for net gain included in net income | | | (151 | ) | | | 63 | | | | (88 | ) | | | (1,855 | ) | | | 757 | | | | (1,098 | ) | | | (4,673 | ) | | | 1,831 | | | | (2,842 | ) |
Reclassification adjustment for net impairment loss recognized in earnings (1) | | | — | | | | — | | | | — | | | | 250 | | | | (102 | ) | | | 148 | | | | 1,329 | | | | (521 | ) | | | 808 | |
Reclassification adjustment for portion of impairment loss recognized in other comprehensive loss | | | — | | | | — | | | | — | | | | — | | | | — | | | | — | | | | (3,615 | ) | | | 1,417 | | | | (2,198 | ) |
| | | | | | | | | | | | | | | | | | | | | | | | | | | | | | | | | | | | |
Net unrealized gain (loss) on securities available for sale | | $ | 2,637 | | | $ | (1,076 | ) | | $ | 1,561 | | | $ | 11,448 | | | $ | (4,677 | ) | | $ | 6,771 | | | $ | (9,862 | ) | | $ | 3,865 | | | $ | (5,997 | ) |
| | | | | | | | | | | | | | | | | | | | | | | | | | | | | | | | | | | | |
| (1) | All amounts are included in non-interest income in the Consolidated statements of operations. |
Treasury Stock. Stock held in treasury by the Company is accounted for using the cost method which treats stock held in treasury as a reduction to total shareholders’ equity. At December 31, 2012 and 2011, the Company held 2,106,723 shares of treasury stock.
Stock-Based Compensation. The Company accounts for stock-based compensation issued to employees and non-employee directors, in accordance with the fair value recognition provisions of FASB ASC 718, Compensation - Stock Compensation, (“FASB ASC 718”). Under the fair value provisions of FASB ASC 718, stock-based compensation cost is measured at the grant date based on the fair value of the award and is recognized as expense over the appropriate vesting period using the straight-line method. However, consistent with FASB ASC 718, the amount of stock-based compensation cost recognized at any date must at least equal the portion of the grant date value of the award that is vested at that date and, as a result, it may be necessary to recognize the expense using a ratable method. Although the provisions of FASB ASC 718 should generally be applied to non-employees, FASB ASC 505-50, Equity-Based Payments to Non-Employees, is used in determining the measurement date of the compensation expense for non-employees.
Determining the fair value of stock-based awards at measurement date requires judgment, including estimating the expected term of the stock options and the expected volatility of the Company’s stock. In addition, judgment is required in estimating the amount of stock-based awards that are expected to be forfeited. If actual results differ significantly from these estimates or different key assumptions were used, it could have a material effect on the Company’s consolidated financial statements.
In accordance with FASB ASC 718, the fair value of the stock options granted is estimated on the date of grant using the Black-Scholes option pricing model which uses the assumptions noted in the table below. The expected term of a stock option is estimated using historical exercise behavior of employees at a particular level of management who were granted options with a comparable term. The stock options have historically been granted a 10 year term. The risk-free interest rate is based on the U.S. Treasury yield curve in effect at the time of the grant. The expected volatility is based on the historical volatility of the Company’s stock price.
Significant weighted average assumptions used to calculate the fair value of the option awards for the years ended December 31, 2012, 2011 and 2010 are as follows:
WEIGHTED AVERAGE ASSUMPTIONS USED IN BLACK-SCHOLES OPTION PRICING MODEL
| | | | | | | | | | | | |
Years Ended December 31, | | 2012 | | | 2011 | | | 2010 | |
Fair value of options granted during the year | | $ | 1.52 | | | $ | 2.11 | | | $ | 2.75 | |
Risk-free rate of return | | | 0.98 | % | | | 2.72 | % | | | 3.05 | % |
Expected term in months | | | 61 | | | | 78 | | | | 111 | |
Expected volatility | | | 62 | % | | | 47 | % | | | 45 | % |
Expected dividends (1) | | $ | — | | | $ | — | | | $ | — | |
| (1) | To date, the Company has not paid cash dividends on its common stock. |
43
At December 31, 2012, the Company had five stock-based employee compensation plans, which are described more fully in Note 15.
Interest Income on Loans. Interest income on loans is credited to operations based upon the principal amount outstanding. Interest accruals are generally discontinued when a loan becomes 90 days past due, or when principal or interest is considered doubtful of collection. When interest accruals are discontinued unpaid, interest credited to income in the current year is reversed and unpaid interest accrued in the prior year is charged to the allowance for loan losses.
Income Taxes. The Company accounts for income taxes in accordance with FASB ASC 740, Income Taxes (“FASB ASC 740”). FASB ASC 740 requires the recording of deferred income taxes that reflect the net tax effects of temporary differences between the carrying amounts of assets and liabilities for financial reporting purposes and the amounts used for income tax purposes. Management exercises significant judgment in the evaluation of the amount and timing of the recognition of the resulting tax assets and liabilities. The judgments and estimates required for the evaluation are updated based upon changes in business factors and the tax laws. If actual results differ from the assumptions and other considerations used in estimating the amount and timing of tax recognized, there can be no assurance that additional expenses will not be required in future periods. The Company recognizes, when applicable, interest and penalties related to unrecognized tax benefits in the provision for income taxes in the consolidated statements of operations. Assessment of uncertain tax positions under FASB ASC 740 requires careful consideration of the technical merits of a position based on management’s analysis of tax regulations and interpretations. Significant judgment is applied when addressing the requirements of FASB ASC 740. At December 31, 2012, the Company had a valuation allowance of $113.4 million against its gross deferred tax asset. As the Company remained in a cumulative loss position, a full deferred tax valuation allowance is still appropriate at December 31, 2012. See Note 20 for additional information on the Company’s application of FASB ASC 740.
Loss Per Common Share. Basic loss per share is computed by dividing net loss available to common shareholders by the weighted average number of shares of common stock outstanding, net of any treasury shares, during the period. Diluted earnings per share is calculated by dividing net income available to common shareholders by the weighted average number of shares of common stock outstanding, net of any treasury shares, after consideration of the potential dilutive effect of common stock equivalents, based upon the treasury stock method using an average market price of common shares sold during the period. Dilution is not considered when the Company is in a net loss position.
Recent Accounting Principles. In February 2013, the FASB issued Accounting Standards Update (“ASU”) 2013-02,Comprehensive Income (Topic 220): Reporting of Amounts Reclassified Out of Accumulated Other Comprehensive Income.The amendments in this update aim to improve the reporting of reclassifications out of accumulated other comprehensive income. The amendments seek to attain that objective by requiring an entity to report the effect of significant reclassifications out of accumulated other comprehensive income on the respective line items in net income if the amount being reclassified is required under GAAP to be reclassified in its entirety to net income. For other amounts that are not required under GAAP to be reclassified in their entirety to net income in the same reporting period, an entity is required to cross-reference other disclosures required under GAAP that provide additional detail about those amounts. This would be the case when a portion of the amount reclassified out of accumulated other comprehensive income is reclassified to a balance sheet account instead of directly to income or expense in the same reporting period. For public entities, the amendments are effective prospectively for reporting periods beginning after December 15, 2012. The Company is currently evaluating the impact of the adoption of this accounting standards update on its financial statements.
In July 2012, the FASB issued ASU 2012-02,Intangibles – Goodwill and Other (Topic 350): Testing Indefinite-Lived Intangible Assets for Impairment. This amendment provides an entity with the option first to assess qualitative factors to determine whether the existence of events and circumstances indicates that it is more likely than not that the indefinite-lived intangible asset is impaired. If, after assessing the totality of events and circumstances, an entity concludes that it is not more likely than not that the indefinite-lived intangible asset is impaired, then the entity is not required to take further action. However, if an entity concludes otherwise, then it is required to determine the fair value of the indefinite-lived intangible asset and perform the quantitative impairment test by comparing the fair value with the carrying amount in accordance with Subtopic 350-30. This amendment is effective for public entities for annual and interim impairment tests performed for fiscal years beginning after September 15, 2012. The guidance will have no impact on the Company as it does not have any indefinite-lived intangible assets.
In December 2011, the FASB issued ASU 2011-11,Balance Sheet (Topic 210): Disclosures about Offsetting Assets and Liabilities (“ASU 2011-11”).This amendment results in common offsetting requirements and disclosure requirements in GAAP and International Financial Reporting Standards (“IFRS”). This guidance is not intended to change, but enhance, the application requirements in FASB ASC 210,Balance Sheet (“FASB ASC 210”). This guidance is effective for public entities during interim and annual periods beginning after January 1, 2013. This guidance amends only the disclosure requirements and not the application of the accounting standard. In January 2013, the FASB issued Accounting Standards Update (“ASU”) 2013-01,Balance Sheet (Topic 210): Clarifying the Scope of Disclosures about Offsetting Assets and Liabilities. The amendments in this update clarify that the scope of
44
ASU 2011-11 applies to derivatives accounted for in accordance with FASB ASC 815, Derivatives and Hedging (“FASB ASC 815”), including bifurcated embedded derivatives, repurchase agreements and reverse repurchase agreements, and securities borrowing and securities lending transactions that are either offset in accordance with FASB ASC 210 or FASB ASC 815 or subject to an enforceable master netting arrangement or similar agreement. This guidance is effective for fiscal years beginning on or after January 1, 2013, and interim periods within those annual periods. An entity should provide the required disclosures retrospectively for all comparative periods presented. The Company is currently evaluating the impact of the adoption of these accounting standards updates on its financial statements.
In June 2011, the FASB issued ASU 2011-05,Comprehensive Income (Topic 220): Presentation of Comprehensive Income. Subsequently in December 2011, the FASB issued ASU 2011-12,Deferral of the Effective Date for Amendments to the Presentation of Reclassifications of Items Out of Accumulated Other Comprehensive Income in Accounting Standards Update No. 2011-05. This guidance eliminates the presentation option of presenting the component of other comprehensive income as part of the statement of changes in stockholders’ equity. In addition, the updates to comprehensive income guidance require all nonowner changes in stockholders’ equity to be presented either in a single continuous statement of comprehensive income or two separate but consecutive statements. The Company elected to adopt the two statement approach. In this two statement approach, the first statement should present total net income and its components followed consecutively by a second statement that should present total other comprehensive income, the components of other comprehensive income and the total of comprehensive income. These changes apply to both annual and interim financial statements. The Company adopted the new accounting guidance effective January 1, 2012, and applied it retrospectively to fiscal years 2011 and 2010. The adoption added the Condensed Consolidated Statements of Comprehensive Income but did not impact the Company’s results of operations, financial position, or cash flows.
In May 2011, the FASB issued ASU 2011-04,Amendments to Achieve Common Fair Value Measurement and Disclosure Requirements in U.S. GAAP and IFRS, to achieve common fair value measurement and disclosure requirements between U.S. GAAP and international accounting principles. While the overall guidance is consistent with U.S. GAAP, the amendment includes additional fair value disclosure requirements. The amendments in the guidance are effective for interim and annual periods beginning after December 15, 2011. The adoption of this amendment did not have a material effect on the Company’s financial statements; however, the adoption did result in expanded fair value disclosures in Note 24.
3. BRANCH SALES AND CONSOLIDATIONS
During 2012, the Company consolidated three owned branch offices and one leased branch office into existing branch offices. As a result of these consolidations, the Company added the three owned branch offices to the real estate owned portfolio in the amount of $1.4 million, which included a loss on the transfer of $236 thousand. No branch sales or consolidations occurred in 2011. During the third quarter of 2010, the Company consolidated four owned branch offices and one leased branch office into existing branch offices. In 2010, as a result of these consolidations, the Company added the four owned branch offices to the real estate owned portfolio in the amount of $1.3 million, which included a loss on the transfer of $130 thousand.
4. INVESTMENT SECURITIES
The amortized cost of investment securities and the approximate fair value at December 31, 2012 and 2011 were as follows:
SUMMARY OF INVESTMENT SECURITIES
| | | | | | | | | | | | | | | | |
| | | Amortized
Cost | | | Gross
Unrealized
Gains | | | Gross
Unrealized
Losses | | | Estimated
Fair Value | |
December 31, 2012 | | | | | | | | | | | | | | | | |
Available for sale: | | | | | | | | | | | | | | | | |
U.S. Treasury obligations | | $ | 9,998 | | | $ | 13 | | | $ | — | | | $ | 10,011 | |
U.S. Government agencies | | | 4,966 | | | | — | | | | (17 | ) | | | 4,949 | |
U.S. Government agency mortgage-backed securities | | | 348,854 | | | | 7,104 | | | | (980 | ) | | | 354,978 | |
Other mortgage-backed securities | | | 287 | | | | — | | | | (1 | ) | | | 286 | |
State and municipal obligations | | | 36,848 | | | | 3,322 | | | | — | | | | 40,170 | |
Trust preferred securities | | | 12,622 | | | | — | | | | (6,740 | ) | | | 5,882 | |
Corporate bonds | | | 24,449 | | | | 993 | | | | — | | | | 25,442 | |
Other | | | 1,464 | | | | — | | | | — | | | | 1,464 | |
| | | | | | | | | | | | | | | | |
Total available for sale | | | 439,488 | | | | 11,432 | | | | (7,738 | ) | | | 443,182 | |
| | | | | | | | | | | | | | | | |
Held to maturity: | | | | | | | | | | | | | | | | |
U.S. Government agency mortgage-backed securities | | | 662 | | | | 48 | | | | — | | | | 710 | |
Other mortgage-backed securities | | | 250 | | | | — | | | | — | | | | 250 | |
| | | | | | | | | | | | | | | | |
Total held to maturity | | | 912 | | | | 48 | | | | — | | | | 960 | |
| | | | | | | | | | | | | | | | |
Total investment securities | | $ | 440,400 | | | $ | 11,480 | | | $ | (7,738 | ) | | $ | 444,142 | |
| | | | | | | | | | | | | | | | |
December 31, 2011 | | | | | | | | | | | | | | | | |
Available for sale: | | | | | | | | | | | | | | | | |
U.S. Treasury obligations | | $ | 11,999 | | | $ | 80 | | | $ | — | | | $ | 12,079 | |
U.S. Government agencies | | | | | | | | | | | | | | | | |
U.S. Government agency mortgage-backed securities | | | 423,269 | | | | 6,264 | | | | (629 | ) | | | 428,904 | |
Other mortgage-backed securities | | | 323 | | | | — | | | | (27 | ) | | | 296 | |
State and municipal obligations | | | 45,424 | | | | 3,373 | | | | (12 | ) | | | 48,785 | |
Trust preferred securities | | | 12,619 | | | | — | | | | (7,711 | ) | | | 4,908 | |
Corporate bonds | | | 19,689 | | | | 57 | | | | (338 | ) | | | 19,408 | |
| | | | | | | | | | | | | | | | |
Other | | | 1,165 | | | | — | | | | — | | | | 1,165 | |
| | | | | | | | | | | | | | | | |
Total available for sale | | | 514,488 | | | | 9,774 | | | | (8,717 | ) | | | 515,545 | |
| | | | | | | | | | | | | | | | |
Held to maturity: | | | | | | | | | | | | | | | | |
U.S. Government agency mortgage-backed securities | | | 1,344 | | | | 69 | | | | — | | | | 1,413 | |
Other mortgage-backed securities | | | — | | | | — | | | | — | | | | — | |
| | | | | | | | | | | | | | | | |
Total held to maturity | | | 1,344 | | | | 69 | | | | — | | | | 1,413 | |
| | | | | | | | | | | | | | | | |
Total investment securities | | $ | 515,832 | | | $ | 9,843 | | | $ | (8,717 | ) | | $ | 516,958 | |
| | | | | | | | | | | | | | | | |
45
During 2012, the Company had six securities called prior to maturity for $7.0 million of proceeds, resulting in gross realized gains and losses of $10 thousand and $93 thousand, respectively, eight available for sale securities were sold prior to maturity for gross proceeds of $47.5 million, which resulted in gross realized gains and losses of $475 thousand and $241 thousand, respectively and eight securities matured, generating $9.1 million of gross proceeds. During 2011, the Company had nine securities called prior to maturity for $27.0 million of proceeds, resulting in gross realized gains of $46 thousand, 22 available for sale securities were sold prior to maturity for gross proceeds of $61.4 million, which resulted in gross realized gains and losses of $1.9 million and $1.0 million, respectively, three trading securities were sold for gross proceeds of $42.2 million, resulting in gross realized gains of $880 thousand and 20 securities matured, generating $63.6 million of gross proceeds.
The following table provides the gross unrealized losses and fair value, aggregated by investment category and length of time the individual securities have been in a continuous unrealized loss position at December 31, 2012 and 2011:
GROSS UNREALIZED LOSSES BY INVESTMENT CATEGORY
| | | | | | | | | | | | | | | | | | | | | | | | |
| | | Less than 12 Months | | | 12 Months or Longer | | | Total | |
| | | Estimated
Fair Value | | | Gross
Unrealized
Losses | | | Estimated
Fair Value | | | Gross
Unrealized
Losses | | | Estimated
Fair Value | | | Gross
Unrealized
Losses | |
December 31, 2012 | | | | | | | | | | | | | | | | | | | | | | | | |
| | | | | | |
U.S. Government agencies | | $ | 4,949 | | | $ | (17 | ) | | $ | — | | �� | $ | — | | | $ | 4,949 | | | $ | (17 | ) |
U.S. Government agency mortgage-backed securities | | | 69,145 | | | | (980 | ) | | | | | | | | | | | 69,145 | | | | (980 | ) |
Other mortgage-backed securities | | | 286 | | | | (1 | ) | | | — | | | | — | | | | 286 | | | | (1 | ) |
Trust preferred securities | | | — | | | | — | | | | 5,882 | | | | (6,740 | ) | | | 5,882 | | | | (6,740 | ) |
| | | | | | | | | | | | | | | | | | | | | | | | |
Total | | $ | 74,380 | | | $ | (998 | ) | | $ | 5,882 | | | $ | (6,740 | ) | | $ | 80,262 | | | $ | (7,738 | ) |
| | | | | | |
December 31, 2011 | | | | | | | | | | | | | | | | | | | | | | | | |
U.S. Government agency mortgage-backed securities | | $ | 79,221 | | | $ | (627 | ) | | $ | 7,224 | | | $ | (2 | ) | | $ | 86,445 | | | $ | (629 | ) |
Other mortgage-backed securities | | | — | | | | — | | | | 296 | | | | (27 | ) | | | 296 | | | | (27 | ) |
State and municipal obligations | | | — | | | | — | | | | 233 | | | | (12 | ) | | | 233 | | | | (12 | ) |
Corporate bonds | | | 14,231 | | | | (338 | ) | | | — | | | | — | | | | 14,231 | | | | (338 | ) |
Trust preferred securities | | | — | | | | — | | | | 4,908 | | | | (7,711 | ) | | | 4,908 | | | | (7,711 | ) |
| | | | | | | | | | | | | | | | | | | | | | | | |
Total | | $ | 93,452 | | | $ | (965 | ) | | $ | 12,661 | | | $ | (7,752 | ) | | $ | 106,113 | | | $ | (8,717 | ) |
| | | | | | | | | | | | | | | | | | | | | | | | |
The Company determines whether unrealized losses are temporary in nature in accordance with FASB ASC 325-40, when applicable, and FASB ASC 320. The evaluation is based upon factors such as the creditworthiness of the underlying borrowers, performance of the underlying collateral, if applicable, and the level of credit support in the security structure. Management also evaluates other facts and circumstances that may be indicative of an OTTI condition. This includes, but is not limited to, an evaluation of the type of security, length of time and extent to which the fair value has been less than cost and near-term prospects of the issuer.
46
For the year ended December 31, 2012, the Company’s investment impairment review did not identify any credit losses. For the year ended December 31, 2011, the Company’s investment impairment review identified credit losses of $250 thousand on a single issuer trust preferred security for which the Company had previously recorded an OTTI charge in 2010. Application of the guidance did not have an impact on any other securities in an unrealized loss position at December 31, 2012 or 2011.
The following is a roll-forward for the years ended December 31, 2012 and 2011 of OTTI charges recognized in earnings as a result of credit losses on investments:
CUMULATIVE OTTI RECOGNIZED IN OPERATIONS
| | | | |
At or for the Year Ended December 31, 2012 | | Amount | |
Cumulative OTTI, beginning of year | | $ | 10,203 | |
Additional increase as a result of net impairment losses recognized on investments | | | — | |
Decrease as a result of the sale of an investment with net impairment losses | | | — | |
| | | | |
Cumulative OTTI, end of year | | $ | 10,203 | |
| | | | |
| | | | |
At or for the Year Ended December 31, 2011 | | Amount | |
Cumulative OTTI, beginning of year | | $ | 10,683 | |
Additional increase as a result of net impairment losses recognized on investments | | | 250 | |
Decrease as a result of the sale of an investment with net impairment losses | | | (730 | ) |
| | | | |
Cumulative OTTI, end of year | | $ | 10,203 | |
| | | | |
U.S. Government Agencies. At December 31, 2012, the gross unrealized loss in the category of less than 12 months of $17 thousand consisted of one agency security with an estimated fair value of $4.9 million issued and guaranteed by a U.S. Government sponsored agency. The Company monitors key credit metrics such as delinquencies, defaults, cumulative losses and credit support levels to determine if an OTTI exists. As of December 31, 2012, management concluded that an OTTI did not exist on the aforementioned security based upon its assessment. Management also concluded that it does not intend to sell the security, and that it is not more likely than not it will be required to sell the security, before its recovery, which may be maturity, and management expects to recover the entire amortized cost basis of this security.
U.S. Government Agency Mortgage-Backed Securities. At December 31, 2012, the gross unrealized loss in the category of less than 12 months of $980 thousand consisted of nine mortgage-backed securities with an estimated fair value of $69.1 million issued and guaranteed by a U.S. Government sponsored agency. The Company monitors key credit metrics such as delinquencies, defaults, cumulative losses and credit support levels to determine if an OTTI exists. As of December 31, 2012, management concluded that an OTTI did not exist on any of the aforementioned securities based upon its assessment. Management also concluded that it does not intend to sell the securities, and that it is not more likely than not it will be required to sell the securities, before their recovery, which may be maturity, and management expects to recover the entire amortized cost basis of these securities.
Other Mortgage-Backed Securities.At December 31, 2012, the gross unrealized loss in the category of less than 12 months of $1 thousand consisted of one non-agency mortgage-backed security with an estimated fair value of $286 thousand. This security was rated “AA” by at least one nationally recognized rating agency. The Company monitors key credit metrics such as delinquencies, defaults, cumulative losses and credit support levels to determine if an OTTI exists. As of December 31, 2012, management concluded that an OTTI did not exist on this security and believes the unrealized loss is due to increases in market interest rates since the time the underlying security was purchased. Management also concluded that it does not intend to sell the security, and that it is not more likely than not it will be required to sell the security, before its recovery, which may be maturity, and management expects to recover the entire amortized cost basis of this security.
Trust Preferred Securities. At December 31, 2012, the gross unrealized loss in the category of 12 months or longer of $6.7 million consisted of two trust preferred securities. The trust preferred securities are comprised of one non-rated single issuer security with an amortized cost of $3.8 million and an estimated fair value of $1.9 million, and one non-investment grade rated pooled security with an amortized cost of $8.8 million and estimated fair value of $3.9 million.
For the pooled security, the Company monitors each issuer in the collateral pool with respect to financial performance using data from the issuer’s most recent regulatory reports as well as information on issuer deferrals and defaults. Also the security structure is monitored with respect to collateral coverage and current levels of subordination. Expected future cash flows are projected assuming additional defaults and deferrals based on the performance of the collateral pool. The non-investment grade pooled security is in a senior position in the capital structure. The security had a 1.93 times principal coverage. As of the most recent reporting date interest has been paid in accordance with the terms of the security. The Company reviews projected cash flow analysis for adverse changes in
47
the present value of projected future cash flows that may result in an other-than-temporary credit impairment to be recognized through earnings. The most recent valuations assumed no recovery on any defaulted collateral, no recovery on any deferring collateral and additional 3.6% defaults or deferrals’ every 3 years with no recovery rate. As of December 31, 2012, management concluded that an OTTI did not exist on the aforementioned security based upon its assessment. Management also concluded that it does not intend to sell the security, and that it is not more likely than not it will be required to sell the security, before their recovery, which may be maturity, and management expects to recover the entire amortized cost basis of this security.
The financial performance of the single issuer trust preferred security is monitored on a quarterly basis using data from the issuer’s most recent regulatory reports to assess the probability of cash flow impairment. Expected future cash flows are projected incorporating the contractual cash flow of the security adjusted, if necessary, for potential changes in the amount or timing of cash flows due to the underlying creditworthiness of the issuer and covenants in the security.
In August 2009, the issuer of the single issuer trust preferred security elected to defer its normal quarterly dividend payment. As contractually permitted, the issuer may defer dividend payments up to five years with accumulated dividends, and interest on those deferred dividends, payable upon the resumption of its scheduled dividend payments. The issuer is currently operating under an agreement with its regulators. The agreement stipulates the issuer must receive permission from its regulators prior to resuming its scheduled dividend payments.
During the year ended December 31, 2012, the Company did not record a credit related OTTI charge related to this deferring single issuer trust preferred security. Based on the Company’s most recent evaluation, the Company does not expect the issuer to default on the security based primarily on the issuer’s subsidiary bank reporting that it meets the minimum regulatory requirements to be considered a “well-capitalized” institution. The Company recognizes that the length of time the issue has been in deferral, the difficult economic environment and some weakened performance measures, while recently improving, increases the probability that a full recovery of principal and anticipated dividends may not be realized. However, the Company concluded that an additional impairment charge is not warranted at December 31, 2012.
The amortized cost and estimated fair value of the investment securities, by contractual maturity, at December 31, 2012 is shown below. Actual maturities will differ from contractual maturities as borrowers may have the right to call or prepay obligations with or without call or prepayment penalties.
CONTRACTUAL MATURITIES OF INVESTMENT SECURITIES
| | | | | | | | | | | | | | | | |
| | | Available for Sale | | | Held to Maturity | |
December 31, 2012 | | Amortized
Cost | | | Estimated
Fair Value | | | Amortized
Cost | | | Estimated
Fair Value | |
Due in one year or less | | $ | 11,437 | | | $ | 11,452 | | | $ | — | | | $ | — | |
Due after one year through five years | | | 24,697 | | | | 25,691 | | | | 250 | | | | 250 | |
Due after five years through ten years | | | 12,971 | | | | 13,735 | | | | — | | | | — | |
Due after ten years | | | 41,242 | | | | 37,040 | | | | — | | | | — | |
| | | | | | | | | | | | | | | | |
Total investment securities, excluding mortgage-backed securities | | | 90,347 | | | | 87,918 | | | | 250 | | | | 250 | |
| | | | |
U.S. Government agency mortgage-backed securities | | | 348,854 | | | | 354,978 | | | | 662 | | | | 710 | |
Other mortgage-backed securities | | | 287 | | | | 286 | | | | — | | | | — | |
| | | | | | | | | | | | | | | | |
Total investment securities | | $ | 439,488 | | | $ | 443,182 | | | $ | 912 | | | $ | 960 | |
| | | | | | | | | | | | | | | | |
At December 31, 2012, the Company had $127.0 million, amortized cost, and $132.0 million, estimated fair value, of investment securities pledged to secure public deposits. At December 31, 2012, the Company had $188.9 million, amortized cost, and $192.8 million, estimated fair value, of investment securities pledged as collateral on secured borrowings.
48
5. LOANS RECEIVABLE
The components of loans receivable, net were as follows:
Loan Components
| | | | | | | | |
December 31, | | 2012 | | | 2011 | |
Commercial: | | | | | | | | |
Commercial and industrial | | $ | 556,966 | | | $ | 551,396 | |
CRE owner occupied | | | 527,825 | | | | 604,361 | |
CRE non-owner occupied | | | 584,857 | | | | 626,795 | |
Land and development | | | 55,919 | | | | 95,474 | |
Consumer: | | | | | | | | |
Home equity lines of credit | | | 207,720 | | | | 224,517 | |
Home equity term loans | | | 30,842 | | | | 41,470 | |
Residential real estate | | | 273,413 | | | | 100,438 | |
Other | | | 38,618 | | | | 46,671 | |
| | | | | | | | |
Total gross loans | | | 2,276,160 | | | | 2,291,122 | |
Allowance for loan losses | | | (45,873 | ) | | | (41,667 | ) |
| | | | | | | | |
Loans, net | | $ | 2,230,287 | | | $ | 2,249,455 | |
| | | | | | | | |
Loans past due 90 days and accruing | | $ | — | | | $ | 154 | |
Troubled debt restructuring, accruing | | | — | | | | — | |
| | | | | | | | |
Loans on Non-accrual Status
| | | | | | | | |
December 31, | | 2012 | | | 2011 | |
Commercial | | | | | | | | |
Commercial and industrial | | $ | 12,156 | | | $ | 6,501 | |
Commercial and industrial, held-for-sale | | | 1,114 | | | | — | |
CRE owner occupied | | | 14,957 | | | | 32,579 | |
CRE owner occupied, held-for-sale | | | 3,223 | | | | — | |
CRE non-owner occupied | | | 5,305 | | | | 9,873 | |
CRE non-owner occupied, held-for-sale | | | 5,298 | | | | — | |
Land and development | | | 20,897 | | | | 32,088 | |
Land and development, held-for-sale | | | 589 | | | | — | |
Consumer: | | | | | | | | |
Home equity lines of credit | | | 3,714 | | | | 3,620 | |
Home equity term loans | | | 1,226 | | | | 1,246 | |
Residential real estate | | | 5,747 | | | | 2,522 | |
Other | | | 658 | | | | 1,227 | |
| | | | | | | | |
Total non-accrual loans | | $ | 74,884 | | | $ | 89,656 | |
| | | | | | | | |
Troubled debt restructurings, non-accrual | | $ | 18,244 | | | $ | 17,875 | |
| | | | | | | | |
Troubled debt restructurings, non-accrual, held-for-sale | | $ | 2,499 | | | $ | — | |
| | | | | | | | |
Many of the Company’s commercial and industrial loans have a real estate component as part of the collateral securing the accommodation. Additionally, the Company makes commercial real estate loans for the acquisition, refinance, improvement and construction of real property. Loans secured by owner-occupied properties are dependent upon the successful operation of the borrower’s business. If the operating company experiences difficulties in terms of sales volume and/or profitability, the borrower’s ability to repay the loan may be impaired. Loans secured by properties where repayment is dependent upon payment of rent by third-party tenants or the sale of the property may be impacted by loss of tenants, lower lease rates needed to attract new tenants or the inability to sell a completed project in a timely fashion and at a profit. At December 31, 2012, commercial and industrial loans secured by commercial real estate properties totaled $1.1 billion of which $527.8 million, or 47.44%, were classified as owner occupied and $584.9 million, or 52.56%, were classified as non-owner occupied.
As of December 31, 2012, the Company had $24.3 million outstanding on 19 residential construction, commercial construction and land development relationships whose agreements included interest reserves. As of December 31, 2011, the Company had $31.4 million outstanding on 18 residential construction, commercial construction and land development relationships whose agreements included interest reserves. The total amount available in those reserves to fund interest payments was $3.6 million and $956 thousand for the periods ended December 31, 2012 and December 31, 2011, respectively. There were no relationships with interest reserves which were on non-accrual status as of December 31, 2012. The Company had six residential construction relationships with interest reserves of $3.4 million on non-accrual status as of December 31, 2011. As these relationships were in technical default, no additional funding of the interest reserves could have been made. Construction projects are monitored throughout their lives by professional inspectors engaged by the Company. The budgets for loan advances and borrower equity injections are developed at underwriting time in conjunction with the review of the
49
plans and specifications for the project being financed. Advances of the Company’s funds are based on the prepared budgets and will not be made unless the project has been inspected by the Company’s professional inspector who must certify that the work related to the advance is in place and properly complete. As it relates to construction project financing, the Company does not extend, renew or restructure terms unless its borrower posts cash collateral in an interest reserve.
Included in the Company’s loan portfolio are modified commercial loans. Per FASB ASC 310-40, Troubled Debt Restructuring, a modification is one in which the creditor, for economic or legal reasons related to the debtor’s financial difficulties, grants a concession to the debtor that it would not otherwise consider, such as providing for a below market interest rate and/or forgiving principal or previously accrued interest; this modification may stem from an agreement or be imposed by law or a court, and may involve a multiple note structure. Generally, prior to the modification, the loans which are modified as a troubled debt restructuring (“TDR”) are already classified as non-performing. These loans may only be returned to performing (i.e. accrual status) after considering the borrower’s sustained repayment performance for a reasonable amount of time, generally six months; this sustained repayment performance may include the period of time just prior to the restructuring. During 2012, the Company entered into three TDR agreements. The Company granted a partial debt forgiveness on two of the agreements and permitted an advance on a defaulted relationship for the third TDR. As of December 31, 2012, the total carrying value of the TDR’s was $9.1 million, of which $0 was performing.
There was a commitment to lend additional funds on two non-accrual TDRs at December 31, 2012 of $962 thousand. Interest income not recognized as a result of the above non-accrual loans was $7.7 million, $4.9 million and $5.4 million for the years ended December 31, 2012, 2011 and 2010, respectively. The amount of interest included in net income on these loans for the years ended December 31, 2012, 2011 and 2010 was $5.0 million, $3.8 million and $3.9 million, respectively.
Under approved lending decisions, the Company had commitments to lend additional funds totaling approximately $842.4 million and $423.4 million at December 31, 2012 and 2011, respectively. Commitments to extend credit are agreements to lend to a customer as long as there is no violation of any condition established in the contract. Commitments generally have fixed expiration dates or other termination clauses and may require payment of a fee. Since many of the commitments are expected to expire without being drawn upon, the total commitment amounts do not necessarily represent future cash requirements. The Company evaluates each customer’s creditworthiness on an individual basis. The type and amount of collateral obtained, if deemed necessary by the Company upon extension of credit, is based on management’s credit evaluation of the borrower.
Most of the Company’s business activity is with customers located within its local market area. Generally, commercial real estate, residential real estate and other assets are used to secure loans. The ultimate repayment of loans is dependent, to a certain degree, on the local economy and real estate market. As of December 31, 2012, the Company had $364.4 million in loans pledged as collateral on secured borrowings.
6. ALLOWANCE FOR LOAN LOSSES
An analysis of the change in the allowance for loan losses is as follows:
Allowance for Loan Losses and Recorded Investment in Financing Receivables
| | | | | | | | | | | | | | | | | | | | |
| | | For the Year Ended December 31, 2012 | |
| | | Commercial
and industrial | | | Home Equity(1) | | | Residential
Real Estate | | | Other | | | Total | |
Allowance for loan losses: | | | | | | | | | | | | | | | | | | | | |
| | | | | |
Beginning balance | | $ | 34,227 | | | $ | 2,566 | | | $ | 903 | | | $ | 3,971 | | | $ | 41,667 | |
Charge-offs | | | (51,265 | ) | | | (2,489 | ) | | | (249 | ) | | | (1,610 | ) | | | (55,613 | ) |
Recoveries | | | 1,950 | | | | 450 | | | | 14 | | | | 190 | | | | 2,604 | |
| | | | | | | | | | | | | | | | | | | | |
Net charge-offs | | | (49,315 | ) | | | (2,039 | ) | | | (235 | ) | | | (1,420 | ) | | | (53,009 | ) |
Provision for loan losses | | | 48,285 | | | | 2,207 | | | | 2,665 | | | | 4,058 | | | | 57,215 | |
| | | | | | | | | | | | | | | | | | | | |
Ending balance | | $ | 33,197 | | | $ | 2,734 | | | $ | 3,333 | | | $ | 6,609 | | | $ | 45,873 | |
| | | | | | | | | | | | | | | | | | | | |
Ending balance: individually evaluated for impairment | | $ | 951 | | | $ | — | | | $ | 98 | | | $ | — | | | $ | 1,049 | |
| | | | | | | | | | | | | | | | | | | | |
Ending balance: collectively evaluated for impairment | | $ | 32,246 | | | $ | 2,734 | | | $ | 3,235 | | | $ | 6,609 | | | $ | 44,824 | |
| | | | | | | | | | | | | | | | | | | | |
Financing Receivables: | | | | | | | | | | | | | | | | | | | | |
Ending balance | | $ | 1,725,567 | | | $ | 238,562 | | | $ | 273,413 | | | $ | 38,618 | | | $ | 2,276,160 | |
| | | | | | | | | | | | | | | | | | | | |
Ending balance: individually evaluated for impairment | | $ | 71,443 | | | $ | 4,756 | | | $ | 5,612 | | | $ | 631 | | | $ | 82,442 | |
| | | | | | | | | | | | | | | | | | | | |
Ending balance: collectively evaluated for impairment | | $ | 1,654,124 | | | $ | 233,806 | | | $ | 267,801 | | | $ | 37,987 | | | $ | 2,193,718 | |
| | | | | | | | | | | | | | | | | | | | |
| (1) | Amount includes both home equity lines of credit and term loans |
50
| | | | | | | | | | | | | | | | | | | | |
| | | For the Year Ended December 31, 2011 | |
| | | Commercial
and industrial | | | Home Equity(1) | | | Residential
Real Estate | | | Other | | | Total | |
Allowance for loan losses: | | | | | | | | | | | | | | | | | | | | |
| | | | | |
Beginning balance | | $ | 76,759 | | | $ | 2,883 | | | $ | 661 | | | $ | 1,410 | | | $ | 81,713 | |
Charge-offs | | | (112,108 | ) | | | (3,337 | ) | | | (1,064 | ) | | | (1,303 | ) | | | (117,812 | ) |
Recoveries | | | 2,459 | | | | 88 | | | | 43 | | | | 523 | | | | 3,113 | |
| | | | | | | | | | | | | | | | | | | | |
Net charge-offs | | | (109,649 | ) | | | (3,249 | ) | | | (1,021 | ) | | | (780 | ) | | | (114,699 | ) |
Provision for loan losses | | | 67,117 | | | | 2,932 | | | | 1,263 | | | | 2,954 | | | | 74,266 | |
Reserves transferred | | | — | | | | — | | | | — | | | | 387 | | | | 387 | |
| | | | | | | | | | | | | | | | | | | | |
Ending balance | | $ | 34,227 | | | $ | 2,566 | | | $ | 903 | | | $ | 3,971 | | | $ | 41,667 | |
| | | | | | | | | | | | | | | | | | | | |
Ending balance: individually evaluated for impairment | | $ | 5,429 | | | $ | — | | | $ | 14 | | | $ | 47 | | | $ | 5,490 | |
| | | | | | | | | | | | | | | | | | | | |
Ending balance: collectively evaluated for impairment | | $ | 28,798 | | | $ | 2,566 | | | $ | 889 | | | $ | 3,924 | | | $ | 36,177 | |
| | | | | | | | | | | | | | | | | | | | |
Financing Receivables: | | | | | | | | | | | | | | | | | | | | |
Ending balance | | $ | 1,878,026 | | | $ | 265,987 | | | $ | 100,438 | | | $ | 46,671 | | | $ | 2,291,122 | |
| | | | | | | | | | | | | | | | | | | | |
Ending balance: individually evaluated for impairment | | $ | 98,916 | | | $ | 4,595 | | | $ | 2,522 | | | $ | 97 | | | $ | 106,130 | |
| | | | | | | | | | | | | | | | | | | | |
Ending balance: collectively evaluated for impairment | | $ | 1,779,110 | | | $ | 261,392 | | | $ | 97,916 | | | $ | 46,574 | | | $ | 2,184,992 | |
| | | | | | | | | | | | | | | | | | | | |
| (1) | Amount includes both home equity lines of credit and term loans |
| | | | |
At or for the Year Ended December 31, | | 2010 | |
Balance, beginning of year | | $ | 59,953 | |
Charge-offs | | | (80,802 | ) |
Recoveries | | | 1,044 | |
| | | | |
Net charge-offs | | | (79,758 | ) |
Provision for loan losses | | | 101,518 | |
| | | | |
Balance, end of year | | $ | 81,713 | |
| | | | |
The allowance for loan losses was $45.9 million, $41.7 million and $81.7 million at December 31, 2012, 2011 and 2010, respectively. The ratio of allowance for loan losses to loans held-for-investment was 2.02%, 1.82% and 3.22% at December 31, 2012, 2011 and 2010, respectively.
The provision for loan losses charged to expense is based upon historical loan loss experience, a series of qualitative factors, and an evaluation of estimated losses in the current commercial loan portfolio, including the evaluation of impaired loans under FASB ASC 310. Values assigned to the qualitative factors and those developed from historic loss experience provide a dynamic basis for the calculation of reserve factors for both pass-rated loans (general pooled allowance) and those criticized and classified loans that continue to perform.
A loan is considered to be impaired when, based upon current information and events, it is probable that the Company will be unable to collect all amounts due according to the contractual terms of the loan. An insignificant delay or insignificant shortfall in amount of payments does not necessarily result in a loan being identified as impaired. For this purpose, delays less than 90 days are considered to be insignificant. Impairment losses are included in the provision for loan losses on the consolidated statements of operations. Impaired loans include accruing and non-accruing TDR loans. Loans not individually reviewed are evaluated as a group using reserve factor percentages based on historic loss experience and qualitative factors, which generally include consumer loans, residential real estate loans, and small business loans. In determining the appropriate level of the general pooled allowance, management makes estimates based on internal risk ratings, which take into account such factors as debt service coverage, loan-to-value ratios, management’s abilities, and certain external factors.
51
The following tables present the Company’s components of impaired loans, segregated by class of loans. Commercial and consumer loans that were collectively evaluated for impairment are not included in the data that follows:
Impaired Loans
For the Year Ended December 31, 2012
| | | | | | | | | | | | | | | | | | | | | | | | |
| | | Recorded
Investment | | | Unpaid
Principal
Balance | | | Related
Allowance | | | Average
Recorded
Investment | | | Accrued
Interest Income
Recognized | | | Cash
Interest
Income
Recognized | |
With no related allowance: | | | | | | | | | | | | | | | | | | | | | | | | |
Commercial: | | | | | | | | | | | | | | | | | | | | | | | | |
Commercial & industrial | | $ | 17,257 | | | $ | 19,260 | | | $ | — | | | $ | 14,977 | | | $ | 53 | | | $ | 53 | |
Commercial & industrial, held for sale | | | 1,125 | | | | 2,252 | | | | — | | | | 1,987 | | | | — | | | | — | |
CRE owner occupied | | | 22,586 | | | | 44,110 | | | | — | | | | 25,521 | | | | 86 | | | | 86 | |
CRE owner occupied, held for sale | | | 5,596 | | | | 17,091 | | | | — | | | | 11,384 | | | | — | | | | — | |
CRE non-owner occupied | | | 5,305 | | | | 9,761 | | | | — | | | | 14,452 | | | | 24 | | | | 24 | |
CRE non-owner occupied, held for sale | | | 5,428 | | | | 9,583 | | | | — | | | | 5,269 | | | | — | | | | — | |
Land and development | | | 20,649 | | | | 33,607 | | | | — | | | | 27,353 | | | | 22 | | | | 22 | |
Land and development, held for sale | | | 589 | | | | 2,124 | | | | — | | | | 1,255 | | | | — | | | | — | |
Consumer: | | | | | | | | | | | | | | | | | | | | | | | | |
Residential real estate | | | 5, 428 | | | | 5,852 | | | | — | | | | 4,334 | | | | — | | | | — | |
Home Equity Lines of Credit | | | 3,582 | | | | 4,610 | | | | — | | | | 2,942 | | | | 9 | | | | 9 | |
Home Equity Term Loans | | | 1,174 | | | | 1,285 | | | | — | | | | 1,023 | | | | 3 | | | | 3 | |
Other | | | 631 | | | | 1,489 | | | | — | | | | 231 | | | | — | | | | — | |
| | | | | | | | | | | | | | | | | | | | | | | | |
With an allowance recorded: | | | | | | | | | | | | | | | | | | | | | | | | |
Commercial: | | | | | | | | | | | | | | | | | | | | | | | | |
Commercial & industrial | | $ | — | | | $ | 939 | | | $ | — | | | $ | 1,222 | | | $ | — | | | $ | — | |
CRE owner occupied | | | 4,649 | | | | 8,779 | | | | 649 | | | | 6,029 | | | | — | | | | — | |
Land and development | | | 997 | | | | 1,013 | | | | 302 | | | | 553 | | | | — | | | | — | |
Consumer: | | | | | | | | | | | | | | | | | | | | | | | | |
Residential Real Estate | | | 184 | | | | 194 | | | | 98 | | | | 71 | | | | — | | | | — | |
Other | | | — | | | | — | | | | — | | | | 4 | | | | — | | | | — | |
| | | | | | | | | | | | | | | | | | | | | | | | |
Total commercial | | $ | 84,182 | | | $ | 148,519 | | | $ | 951 | | | $ | 110,002 | | | $ | 185 | | | $ | 185 | |
Total consumer | | $ | 10,999 | | | $ | 13,430 | | | $ | 98 | | | $ | 8,605 | | | $ | 12 | | | $ | 12 | |
| | | | | | | | | | | | | | | | | | | | | | | | |
Impaired Loans
For the Year Ended December 31, 2011
| | | | | | | | | | | | | | | | | | | | | | | | |
| | | Recorded
Investment | | | Unpaid
Principal
Balance | | | Related
Allowance | | | Average
Recorded
Investment | | | Accrued
Interest
Income
Recognized | | | Cash
Interest
Income
Recognized | |
With no related allowance: | | | | | | | | | | | | | | | | | | | | | | | | |
Commercial: | | | | | | | | | | | | | | | | | | | | | | | | |
Commercial & industrial | | $ | 9,401 | | | $ | 12,778 | | | $ | — | | | $ | 9,180 | | | $ | 67 | | | $ | 67 | |
CRE owner occupied | | | 32,202 | | | | 55,982 | | | | — | | | | 36,266 | | | | 357 | | | | 357 | |
CRE non-owner occupied | | | 7,308 | | | | 8,584 | | | | — | | | | 15,299 | | | | 36 | | | | 36 | |
Land and development | | | 25,925 | | | | 26,148 | | | | — | | | | 29,932 | | | | 57 | | | | 57 | |
Consumer: | | | | | | | | | | | | | | | | | | | | | | | | |
Residential real estate | | | 2,433 | | | | 2,758 | | | | — | | | | 470 | | | | — | | | | — | |
Home Equity Lines of Credit | | | 3,398 | | | | 4,402 | | | | — | | | | 637 | | | | — | | | | — | |
Home Equity Term Loans | | | 1,197 | | | | 1,306 | | | | — | | | | 228 | | | | — | | | | — | |
Other | | | 50 | | | | 50 | | | | — | | | | 2 | | | | — | | | | — | |
| | | | | | | | | | | | | | | | | | | | | | | | |
With an allowance recorded: | | | | | | | | | | | | | | | | | | | | | | | | |
Commercial: | | | | | | | | | | | | | | | | | | | | | | | | |
Commercial & industrial | | $ | 4,955 | | | $ | 6,110 | | | $ | 262 | | | $ | 13,368 | | | $ | 337 | | | $ | 337 | |
CRE owner occupied | | | 9,706 | | | | 14,449 | | | | 2,448 | | | | 18,929 | | | | 212 | | | | 212 | |
CRE non-owner occupied | | | 2,565 | | | | 3,468 | | | | 229 | | | | 6,211 | | | | 438 | | | | 438 | |
Land and development | | | 6,854 | | | | 7,063 | | | | 2,490 | | | | 7,937 | | | | — | | | | — | |
Consumer: | | | | | | | | | | | | | | | | | | | | | | | | |
Residential Real Estate | | | 89 | | | | 164 | | | | 14 | | | | 45 | | | | — | | | | — | |
Other | | | 47 | | | | 47 | | | | 47 | | | | 19 | | | | — | | | | — | |
| | | | | | | | | | | | | | | | | | | | | | | | |
Total commercial | | $ | 98,916 | | | $ | 134,582 | | | $ | 5,429 | | | $ | 136,582 | | | $ | 1,504 | | | $ | 1,504 | |
Total consumer | | $ | 7,214 | | | $ | 8,726 | | | $ | 61 | | | $ | 1,354 | | | $ | — | | | $ | — | |
| | | | | | | | | | | | | | | | | | | | | | | | |
52
Impaired Loans
For the Year Ended December 31, 2010
| | | | | | | | | | | | | | | | | | | | | | | | |
| | | Recorded
Investment | | | Unpaid
Principal
Balance | | | Related
Allowance | | | Average
Recorded
Investment | | | Accrued
Interest
Income
Recognized | | | Cash
Interest
Income
Recognized | |
With no related allowance: | | | | | | | | | | | | | | | | | | | | | | | | |
Commercial: | | | | | | | | | | | | | | | | | | | | | | | | |
Commercial & industrial | | $ | 8,650 | | | $ | 9,570 | | | $ | — | | | $ | 5,387 | | | $ | 58 | | | $ | 58 | |
CRE owner occupied | | | 32,325 | | | | 65,398 | | | | — | | | | 37,502 | | | | 18 | | | | 18 | |
CRE non-owner occupied | | | 24,047 | | | | 33,445 | | | | — | | | | 9,398 | | | | — | | | | — | |
Land and development | | | 21,044 | | | | 33,387 | | | | — | | | | 12,343 | | | | 9 | | | | 9 | |
Consumer: | | | | | | | | | | | | | | | | | | | | | | | | |
Residential real estate | | | — | | | | — | | | | — | | | | 23 | | | | — | | | | — | |
Other | | | — | | | | — | | | | — | | | | 644 | | | | — | | | | — | |
| | | | | | | | | | | | | | | | | | | | | | | | |
With an allowance recorded: | | | | | | | | | | | | | | | | | | | | | | | | |
Commercial: | | | | | | | | | | | | | | | | | | | | | | | | |
Commercial & industrial | | $ | 26,938 | | | $ | 32,365 | | | $ | 6,109 | | | $ | 20,959 | | | $ | 454 | | | $ | 438 | |
CRE owner occupied | | | 20,365 | | | | 25,099 | | | | 4,800 | | | | 22,463 | | | | 433 | | | | 420 | |
CRE non-owner occupied | | | 20,275 | | | | 26,512 | | | | 4,770 | | | | 8,998 | | | | — | | | | — | |
Land and development | | | 27,085 | | | | 28,460 | | | | 5,401 | | | | 9,209 | | | | 29 | | | | 29 | |
Consumer: | | | | | | | | | | | | | | | | | | | | | | | | |
Other | | | — | | | | — | | | | — | | | | 323 | | | | — | | | | — | |
| | | | | | | | | | | | | | | | | | | | | | | | |
Total commercial | | $ | 180,729 | | | $ | 254,236 | | | $ | 21,080 | | | $ | 126,259 | | | $ | 1,001 | | | $ | 972 | |
Total consumer | | $ | — | | | $ | — | | | $ | — | | | $ | 990 | | | $ | — | | | $ | — | |
| | | | | | | | | | | | | | | | | | | | | | | | |
In accordance with FASB ASC 310, those impaired loans which are fully collateralized do not result in a specific allowance for loan losses. Included in impaired loans at December 31, 2012 were five TDR relationships (11 contracts), four of which were fully collateralized and one of which had specific reserves totaling $154 thousand. In addition, one of the TDRs at December 31, 2012 included a $6.5 million line of credit, of which $5.6 million was utilized and $939 thousand was available. One TDR included a commitment to lend additional funds of $23 thousand at December 31, 2012.
The following table presents an analysis of the Company’s TDR agreements entered into during the twelve months ended December 31, 2012:
Troubled Debt Restructuring as of December 31, 2012
| | | | | | | | | | | | |
| | | Number of Contracts | | | Pre-Modification
Outstanding Recorded
Investment | | | Post-Modification
Outstanding Recorded
Investment | |
Loans held-for-investment | | | | | | | | | | | | |
CRE owner occupied | | | 1 | | | $ | 8,955 | | | $ | 8,382 | |
Land and development | | | 1 | | | | 371 | | | | 749 | |
CRE non-owner occupied | | | 1 | | | | 265 | | | | — | |
Troubled Debt Restructuring as of December 31, 2011
| | | | | | | | | | | | |
| | | Number of Contracts | | | Pre-Modification
Outstanding Recorded
Investment | | | Post-Modification
Outstanding Recorded
Investment | |
Commercial and industrial | | | 4 | | | $ | 8,277 | | | $ | 7,855 | |
CRE owner occupied | | | 6 | | | | 19,363 | | | | 9,329 | |
Land and development | | | 1 | | | | 1,745 | | | | 691 | |
53
Troubled Debt Restructurings That Subsequently Defaulted
For the Year Ended December 31, 2012
| | | | | | | | | | | | |
| | | Number of Contracts | | | Pre-Modification
Outstanding Recorded Investment | | | Post-Modification
Outstanding Recorded
Investment | |
Commercial and industrial | | | 1 | | | $ | 3,257 | | | $ | 5,225 | |
CRE owner occupied(1) | | | 3 | | | | 10,928 | | | | 3,525 | |
Land and development | | | 1 | | | | 371 | | | | 749 | |
| (1) | One of the above contracts was charged off during the twelve months ended December 31, 2012. The recorded investment on this contract is now $139 thousand. The other contracts are displayed in the table above outstanding as of December 31, 2012. |
Troubled Debt Restructurings That Subsequently Defaulted
For the Year Ended December 31, 2011
| | | | | | | | | | | | |
| | | Number of Contracts | | | Pre-Modification
Outstanding Recorded Investment | | | Post-Modification
Outstanding Recorded
Investment | |
Commercial and industrial (1) | | | 5 | | | $ | 8,400 | | | $ | 7,978 | |
CRE owner occupied | | | 7 | | | | 18,922 | | | | 9,451 | |
| (1) | One of the above contracts was charged off during the twelve months ended December 31, 2011. The recorded investment on this contract is now $0. The other contracts are displayed in the table above outstanding as of December 31, 2011. |
The following tables present the Company’s distribution of risk ratings loan portfolio, segregated by class, as of December 31, 2012 and 2011:
Credit Quality Indicators
As of December 31, 2012
Credit Risk by Internally Assigned Grade
| | | | | | | | | | | | | | | | | | | | | | | | | | | | | | | | |
| | | Commercial | | | Consumer | |
| | | Commercial
& industrial | | | CRE
owner
occupied | | | CRE non-
owner
occupied | | | Land and
development | | | Home
equity
lines of
credit | | | Home
equity
term
loans | | | Residential
real estate | | | Other | |
Grade: | | | | | | | | | | | | | | | | | | | | | | | | | | | | | | | | |
Pass | | $ | 479,983 | | | $ | 456,576 | | | $ | 544,645 | | | $ | 32,791 | | | $ | 200,429 | | | $ | 29,561 | | | $ | 265,139 | | | $ | 37,561 | |
Special Mention | | | 36,233 | | | | 19,955 | | | | 24,885 | | | | — | | | | — | | | | — | | | | — | | | | — | |
Substandard | | | 40,750 | | | | 51,294 | | | | 15,327 | | | | 23,128 | | | | 7,291 | | | | 1,281 | | | | 8,274 | | | | 1,057 | |
| | | | | | | | | | | | | | | | | | | | | | | | | | | | | | | | |
Total | | $ | 556,966 | | | $ | 527,825 | | | $ | 584,857 | | | $ | 55,919 | | | $ | 207,720 | | | $ | 30,842 | | | $ | 273,413 | | | $ | 38,618 | |
| | | | | | | | | | | | | | | | | | | | | | | | | | | | | | | | |
Credit Quality Indicators
As of December 31, 2011
Credit Risk by Internally Assigned Grade
| | | | | | | | | | | | | | | | | | | | | | | | | | | | | | | | |
| | | Commercial | | | Consumer | |
| | | Commercial
& industrial | | | CRE
owner
occupied | | | CRE non-
owner
occupied | | | Land and
development | | | Home
equity
lines of
credit | | | Home
equity
term
loans | | | Residential
real estate | | | Other | |
Grade: | | | | | | | | | | | | | | | | | | | | | | | | | | | | | | | | |
Pass | | $ | 501,605 | | | $ | 515,555 | | | $ | 567,295 | | | $ | 42,268 | | | $ | 218,066 | | | $ | 40,138 | | | $ | 94,681 | | | $ | 44,821 | |
Special Mention | | | 26,062 | | | | 24,483 | | | | 30,013 | | | | 5,799 | | | | — | | | | — | | | | — | | | | — | |
Substandard | | | 23,729 | | | | 64,323 | | | | 29,487 | | | | 47,407 | | | | 6,451 | | | | 1,332 | | | | 5,757 | | | | 1,850 | |
| | | | | | | | | | | | | | | | | | | | | | | | | | | | | | | | |
Total | | $ | 551,396 | | | $ | 604,361 | | | $ | 626,795 | | | $ | 95,474 | | | $ | 224,517 | | | $ | 41,470 | | | $ | 100,438 | | | $ | 46,671 | |
| | | | | | | | | | | | | | | | | | | | | | | | | | | | | | | | |
The Company’s primary tool for assessing risk when evaluating a credit in terms of its underwriting, structure, documentation and eventual collectability is a risk rating system in which the loan is assigned a numeric value. Behind each numeric category is a defined set of characteristics reflective of the particular level of risk.
54
The risk rating system is based on a nine point grade using a two-digit scale. The upper five grades are for “pass” categories, while the lower four grades represent “criticized” categories which are equivalent to the guidelines utilized by the OCC.
The portfolio manager is responsible for assigning, maintaining, and documenting accurate risk ratings for all commercial loans and commercial real estate loans. The portfolio manager assigns a risk rating at the inception of the credit, reaffirms it at each renewal, extension, or modification, and adjusts the rating based on the performance of the credit. As part of the credit review process, a regional credit officer will review risk ratings for accuracy. The portfolio manager’s risk rating will also be reviewed periodically by the loan review department and the Bank’s regulators.
To calculate risk ratings in a consistent fashion, the Company uses a Risk Rating Form that provides for a numerical grade to be assigned to up to six characteristics of a credit including elements of its financial condition, abilities of management, position in the market, collateral support and the impact of changing conditions. When combined, an overall risk rating is provided. A separate set of risk rating elements are provided for credits associated with the financing of real estate projects.
The following tables present the Company’s analysis of past due loans, segregated by class of loans, as of December 31, 2012 and 2011:
Aging of Receivables
For the Year Ended December 31, 2012
| | | | | | | | | | | | | | | | | | | | | | | | | | | | |
| | | 30-59
Days
Past
Due | | | 60-89
Days
Past
Due | | | 90 Days
Past Due | | | Total
Past
Due | | | Current | | | Total
Financing
Receivables | | | Loans 90
Days Past
Due and
Accruing | |
Commercial: | | | | | | | | | | | | | | | | | | | | | | | | | | | | |
Commercial & industrial | | $ | 3,192 | | | $ | 797 | | | $ | 2,350 | | | $ | 6,339 | | | $ | 550,627 | | | $ | 556,966 | | | $ | — | |
CRE owner occupied | | | 5,828 | | | | 223 | | | | 10,811 | | | | 16,862 | | | | 510,963 | | | | 527,825 | | | | — | |
CRE non-owner occupied | | | 4,037 | | | | 1 | | | | 2,974 | | | | 7,012 | | | | 577,845 | | | | 584,857 | | | | — | |
Land and development | | | 3,823 | | | | — | | | | 12,139 | | | | 15,962 | | | | 39,957 | | | | 55,919 | | | | — | |
Consumer: | | | | | | | | | | | | | | | | | | | | | | | | | | | | |
Home equity lines of credit | | | 2,296 | | | | 880 | | | | 2,518 | | | | 5,694 | | | | 202,026 | | | | 207,720 | | | | — | |
Home equity term loans | | | 960 | | | | 340 | | | | 972 | | | | 2,272 | | | | 28,570 | | | | 30,842 | | | | — | |
Residential real estate | | | 8,387 | | | | 328 | | | | 5,288 | | | | 14,003 | | | | 259,410 | | | | 273,413 | | | | — | |
Other | | | 599 | | | | 273 | | | | 499 | | | | 1,371 | | | | 37,247 | | | | 38,618 | | | | — | |
| | | | | | | | | | | | | | | | | | | | | | | | | | | | |
Total | | $ | 29,122 | | | $ | 2,842 | | | $ | 37,551 | | | $ | 69,515 | | | $ | 2,206,645 | | | $ | 2,276,160 | | | $ | — | |
| | | | | | | | | | | | | | | | | | | | | | | | | | | | |
Aging of Receivables
For the Year Ended December 31, 2011
| | | | | | | | | | | | | | | | | | | | | | | | | | | | |
| | | 30-59
Days
Past
Due | | | 60-89
Days
Past
Due | | | 90 Days
Past Due | | | Total
Past
Due | | | Current | | | Total
Financing
Receivables | | | Loans 90
Days Past
Due and
Accruing | |
Commercial: | | | | | | | | | | | | | | | | | | | | | | | | | | | | |
Commercial & industrial | | $ | 1,024 | | | $ | 4,600 | | | $ | 6,407 | | | $ | 12,031 | | | $ | 539,365 | | | $ | 551,396 | | | $ | — | |
CRE owner occupied | | | 6,408 | | | | 1,176 | | | | 35,003 | | | | 42,587 | | | | 561,774 | | | | 604,361 | | | | — | |
CRE non-owner occupied | | | 2,187 | | | | 4,981 | | | | 8,398 | | | | 15,566 | | | | 611,229 | | | | 626,795 | | | | — | |
Land and development | | | 371 | | | | — | | | | 32,088 | | | | 32,459 | | | | 63,015 | | | | 95,474 | | | | — | |
Consumer: | | | | | | | | | | | | | | | | | | | | | | | | | | | | |
Home equity lines of credit | | | 2,001 | | | | 1,016 | | | | 3,182 | | | | 6,199 | | | | 218,318 | | | | 224,517 | | | | 138 | |
Home equity term loans | | | 687 | | | | 145 | | | | 1,200 | | | | 2,032 | | | | 39,438 | | | | 41,470 | | | | — | |
Residential real estate | | | 3,324 | | | | 565 | | | | 2,307 | | | | 6,196 | | | | 94,242 | | | | 100,438 | | | | — | |
Other | | | 891 | | | | 227 | | | | 902 | | | | 2,020 | | | | 44,651 | | | | 46,671 | | | | 16 | |
| | | | | | | | | | | | | | | | | | | | | | | | | | | | |
Total | | $ | 16,893 | | | $ | 12,710 | | | $ | 89,487 | | | $ | 119,090 | | | $ | 2,172,032 | | | $ | 2,291,122 | | | $ | 154 | |
| | | | | | | | | | | | | | | | | | | | | | | | | | | | |
7. RESTRICTED EQUITY INVESTMENTS
The Company, through the Bank, is a member of the FRB, the FHLBNY and Atlantic Central Bankers Bank, and is required to maintain an investment in the capital stock of each. These investments are restricted in that they can only be redeemed by the issuer at par value. These securities are carried at cost and the Company did not identify any events or changes in circumstances that may have had an adverse effect on the value of the investments in accordance with FASB ASC 942, Financial Services – Depository and Lending. As of December 31, 2012, management does not believe that an impairment of these holdings exists and expects to recover the entire cost of these securities.
55
The Company’s restricted equity investments at December 31, 2012 and 2011 were as follows:
RESTRICTED EQUITY INVESTMENTS
| | | | | | | | |
December 31, | | 2012 | | | 2011 | |
FRB stock | | $ | 10,783 | | | $ | 10,536 | |
FHLBNY stock | | | 6,955 | | | | 5,142 | |
Atlantic Central Bankers Bank stock | | | 148 | | | | 148 | |
| | | | | | | | |
Total | | $ | 17,886 | | | $ | 15,826 | |
| | | | | | | | |
8. BANK PROPERTIES AND EQUIPMENT
Bank properties and equipment consist of the following major classifications:
SUMMARY OF BANK PROPERTIES AND EQUIPMENT
| | | | | | | | |
December 31, | | 2012 | | | 2011 | |
Land | | $ | 8,998 | | | $ | 9,193 | |
Buildings | | | 30,617 | | | | 31,689 | |
Capital lease | | | 8,630 | | | | 8,630 | |
Leasehold improvements and equipment | | | 44,781 | | | | 42,899 | |
| | | | | | | | |
Total bank properties and equipment | | | 93,026 | | | | 92,411 | |
Accumulated depreciation | | | (42,221 | ) | | | (37,655 | ) |
| | | | | | | | |
Bank properties and equipment, net | | $ | 50,805 | | | $ | 54,756 | |
| | | | | | | | |
The Company recognized depreciation expense of $5.7 million, $6.3 million and $5.4 million for the years ended December 31, 2012, 2011 and 2010, respectively.
On occasion, the Company engages construction related services from companies affiliated with certain directors under separate agreements with the Company. The Company did not engage in any construction related services with related parties during 2012, 2011 or 2010.
9. REAL ESTATE OWNED
Real estate owned consisted of the following:
SUMMARY OF REAL ESTATE OWNED
| | | | | | | | |
December 31, | | 2012 | | | 2011 | |
Commercial properties | | $ | 5,382 | | | $ | 1,777 | |
Residential properties | | | 696 | | | | 1,683 | |
Bank properties | | | 1,395 | | | | 1,560 | |
| | | | | | | | |
Total | | $ | 7,473 | | | $ | 5,020 | |
| | | | | | | | |
SUMMARY OF REAL ESTATE OWNED ACTIVITY
| | | | | | | | | | | | | | | | |
| | | Underlying Property | | | | |
At or for the year ended December 31, 2012 | | Commercial
Properties | | | Residential
Properties | | | Bank
Properties | | | Total | |
Balance, beginning of year | | $ | 1,777 | | | $ | 1,683 | | | $ | 1,560 | | | $ | 5,020 | |
Transfers into real estate owned | | | 6,000 | | | | 315 | | | | 1,365 | | | | 7,680 | |
Transfers into operations | | | — | | | | — | | | | — | | | | — | |
Sale of real estate owned | | | (1,956 | ) | | | (1,153 | ) | | | (797 | ) | | | (3,906 | ) |
Write down of real estate owned | | | (439 | ) | | | (149 | ) | | | (733 | ) | | | (1,321 | ) |
| | | | | | | | | | | | | | | | |
Balance, end of year | | $ | 5,382 | | | $ | 696 | | | $ | 1,395 | | | $ | 7,473 | |
| | | | | | | | | | | | | | | | |
56
During 2012, the Company transferred $7.7 million in book value of loans into real estate owned, including 23 commercial properties aggregating $6.0 million, three bank properties totaling $1.3 million, and four residential properties for $315 thousand. In 2012, the Company recorded $1.4 million of write-downs of real estate owned, including $149 thousand on the carrying value of four residential properties, $733 thousand on the carrying value of six bank properties, and $439 thousand on the carrying value of six commercial properties. There were 11 commercial properties, two bank properties and six residential properties, with carrying amounts of $2.0 million, $797 thousand and $1.2 million, respectively, sold during the year ended December 31, 2012, which resulted in a net gain of $345 thousand, which is included in real estate owned expense, net in the consolidated statements of operations. At December 31, 2012, the Company maintained 29 properties in the real estate owned portfolio, six of which are former bank branches.
Expenses applicable to real estate owned include the following:
REAL ESTATE OWNED EXPENSES, NET
| | | | | | | | | | | | |
Years Ended December 31, | | 2012 | | | 2011 | | | 2010 | |
Net (gain) loss on sales of real estate | | $ | 345 | | | $ | (26 | ) | | $ | (18 | ) |
Write-down of real estate owned | | | 1,433 | | | | 667 | | | | 383 | |
Operating expenses, net of rental income | | | 580 | | | | 545 | | | | 436 | |
| | | | | | | | | | | | |
Total | | $ | 2,358 | | | $ | 1,186 | | | $ | 801 | |
| | | | | | | | | | | | |
10. GOODWILL AND INTANGIBLE ASSETS
In accordance with FASB ASC 350, the Company tests goodwill for impairment annually at year end and the current year analysis was performed at December 31, 2012.
In performing step one of the impairment analysis as defined by FASB ASC 350, the market value assigned to the Company’s stock was based upon an acquisition value relative to recent acquisition transactions by companies in the Company’s geographic proximity and comparable size. The acquisition value is sensitive to both the fluctuation of the Company’s stock price and the stock price and equity of peer companies. The analysis resulted in an estimated Company fair value above its carrying value, and therefore the Company was deemed to have no goodwill impairment during 2012. During the year ended December 31, 2011, the Company did not record a goodwill impairment charge. A goodwill impairment charge of $89.7 million was recorded in the year ended December 31, 2010. This was the total accumulated impairment of goodwill for the years ended December 31, 2012, 2011 and 2010.
The Company has a core deposit premium intangible asset that resulted from previous acquisitions. The carrying value of this asset was $3.3 million, and $6.9 million, at December 31, 2012 and 2011, respectively. The Company incurred amortization expense of $3.7 million, on its core deposit intangible during each of the years ended December 31, 2012, 2011 and 2010.
Information regarding the Company’s expected amortization expense is as follows:
AMORTIZATION OF INTANGIBLE ASSETS
| | | | |
| | | Amount | |
Expected for Years Ended December 31, | | | | |
2013 | | | 2,708 | |
2014 | | | 554 | |
Thereafter | | | — | |
| | | | |
Total | | $ | 3,262 | |
| | | | |
57
11. DEPOSITS
Deposits consist of the following major classifications:
SUMMARY OF DEPOSITS
| | | | | | | | |
December 31, | | 2012 | | | 2011 | |
Interest-bearing demand deposits | | $ | 1,215,548 | | | $ | 1,244,590 | |
Non-interest-bearing demand deposits | | | 535,635 | | | | 527,796 | |
Savings deposits | | | 264,155 | | | | 262,044 | |
Time deposits under $100,000 | | | 323,768 | | | | 376,369 | |
Time deposits $100,000 or more | | | 256,725 | | | | 177,747 | |
Brokered time deposits | | | 117,393 | | | | 79,431 | |
| | | | | | | | |
Total | | $ | 2,713,224 | | | $ | 2,667,977 | |
| | | | | | | | |
A summary of time deposits by year of maturity is as follows:
MATURITIES OF TIME DEPOSITS(1)
| | | | |
Years Ended December 31, | | Amount | |
2013 | | $ | 437,006 | |
2014 | | | 90,465 | |
2015 | | | 76,362 | |
2016 | | | 32,013 | |
2017 | | | 61,415 | |
Thereafter | | | 625 | |
| | | | |
Total | | $ | 697,886 | |
| | | | |
| (1) | Amounts include brokered time deposits. |
A summary of interest expense on deposits is as follows:
SUMMARY OF INTEREST EXPENSE
| | | | | | | | | | | | |
Years Ended December 31, | | 2012 | | | 2011 | | | 2010 | |
Savings deposits | | $ | 900 | | | $ | 1,412 | | | $ | 2,283 | |
Time deposits | | | 7,875 | | | | 10,301 | | | | 15,805 | |
Interest-bearing demand deposits | | | 4,778 | | | | 7,024 | | | | 10,692 | |
| | | | | | | | | | | | |
Total | | $ | 13,553 | | | $ | 18,737 | | | $ | 28,780 | |
| | | | | | | | | | | | |
12. ADVANCES FROM THE FEDERAL HOME LOAN BANK OF NEW YORK
At December 31, 2012, the Company had fixed-rate advances from the FHLBNY of $61.4 million, which mature through 2022 with interest rates ranging from 1.60% to 5.87%. At December 31, 2011, the Company had fixed-rate advances from the FHLBNY of $2.7 million, which mature through 2018 with interest rates ranging from 3.78% to 5.87%. The weighted average interest rate at December 31, 2012 and 2011 was 2.10% and 4.62%, respectively. Interest expense on advances from the FHLBNY was $425 thousand, $153 thousand and $348 thousand for the years ended December 31, 2012, 2011 and 2010, respectively, and is included in interest on funds borrowed on the consolidated statements of operations.
The contractual maturities of the Company’s fixed-rate advances from the FHLBNY at December 31, 2012 are as follows:
CONTRACTUAL MATURITIES OF ADVANCES FROM THE FHLBNY
| | | | |
Years Ended December 31, | | Amount | |
2013 | | $ | 299 | |
2014 | | | — | |
2015 | | | — | |
2016 | | | — | |
2017 | | | — | |
Thereafter | | | 61,116 | |
| | | | |
Total | | $ | 61,415 | |
| | | | |
58
13. SECURITIES SOLD UNDER AGREEMENTS TO REPURCHASE
The Company has overnight repurchase agreements with customers, as well as term repurchase agreements with the FHLBNY. At December 31, 2012 and 2011, customer repurchase agreements were $2.0 million with an interest rate of 0.17% and $5.7 million with interest rate of 0.08%, respectively. Interest expense on customer repurchase agreements was $7 thousand, $7 thousand and $30 thousand for the years ended December 31, 2012, 2011 and 2010, respectively, and is included in interest on funds borrowed on the consolidated statements of operations. Collateral for customer repurchase agreements consisted of U.S. Treasury notes or securities issued or guaranteed by one of the U.S. Government sponsored agencies. The fair value of the collateral was approximately equal to the amounts outstanding.
At December 31, 2012, the Company did not have any FHLBNY repurchase agreements. At December 31, 2011, the Company had one FHLBNY repurchase agreement for $15.0 million with an interest rate of 4.84%. Interest expense on FHLBNY repurchase agreements was $472 thousand, $737 thousand and $737 thousand for the years ended December 31, 2012, 2011 and 2010, respectively, and is included in interest on funds borrowed on the consolidated statements of operations. Collateral for the FHLBNY repurchase agreements consists of securities issued or guaranteed by one of the U.S. Government sponsored agencies. The fair value of the collateral exceeded the amount outstanding at December 31, 2012, 2011 and 2010.
A summary of securities sold under agreements to repurchase, interest rates, approximate average amounts outstanding and their approximate weighted average rates at December 31, 2012, 2011 and 2010 is as follows:
SUMMARY OF REPURCHASE AGREEMENTS
| | | | | | | | | | | | |
At or for the Years Ended December 31, | | 2012 | | | 2011 | | | 2010 | |
FHLBNY repurchase agreements outstanding at year end | | $ | — | | | $ | 15,000 | | | $ | 15,000 | |
Weighted average interest rate at year end | | | — | % | | | 4.84 | % | | | 4.84 | % |
Approximate average amount outstanding during the year | | $ | 18,333 | | | $ | 15,000 | | | $ | 15,000 | |
Approximate weighted average rate during the year | | | 2.30 | % | | | 4.91 | % | | | 4.91 | % |
| | | |
Repurchase agreements with customers outstanding at year end | | $ | 1,968 | | | $ | 5,668 | | | $ | 6,307 | |
Weighted average interest rate at year end | | | 0.17 | % | | | 0.08 | % | | | 0.21 | % |
Approximate average amount outstanding during the year | | $ | 4,859 | | | $ | 6,659 | | | $ | 15,243 | |
Approximate weighted average rate during the year | | | 0.15 | % | | | 0.10 | % | | | 0.19 | % |
The maximum month end amount of securities sold under agreements to repurchase for the years ended December 31, 2012 and 2011 is as follows:
SUMMARY OF MAXIMUM MONTH END REPURCHASE AGREEMENTS
| | | | | | | | |
December 31, | | 2012 | | | 2011 | |
FHLBNY repurchase agreements | | $ | 45,000 | | | $ | 15,000 | |
Repurchase agreements with customers | | $ | 7,278 | | | $ | 8,249 | |
14. JUNIOR SUBORDINATED DEBENTURES HELD BY TRUSTS THAT ISSUED CAPITAL DEBT
The Company has established Issuer Trusts that have issued guaranteed preferred beneficial interests in the Company’s junior subordinated debentures. These Issuer Trusts are variable interest entities under FASB ASC 810-10, Consolidation (“FASB ASC 810-10”).
In accordance with FASB ASC 810-10, all the Issuer Trusts outstanding at December 31, 2012 and 2011 are deconsolidated. The junior subordinated debentures issued by the Company to the Issuer Trusts at December 31, 2012 and 2011 of $92.8 million are reflected as junior subordinated debentures in the Company’s consolidated statements of financial condition. The Company records interest expense on the corresponding debentures in its consolidated statements of operations. The Company also recorded the common capital securities issued by the Issuer Trusts in other assets in its consolidated statements of financial condition at December 31, 2012 and 2011.
The following is a summary of the outstanding capital securities issued by each Issuer Trust and the junior subordinated debentures issued by the Company to each Issuer Trust as of December 31, 2012.
59
SUMMARY OF CAPITAL SECURITIES AND JUNIOR SUBORDINATED DEBENTURES
| | | | | | | | | | | | | | | | |
December 31, 2012 | | Capital Securities | | Junior Subordinated Debentures |
Issuer Trust | | Issuance Date | | Stated
Value | | | Distribution Rate | | Principal
Amount | | | Maturity | | Redeemable
Beginning |
Sun Capital Trust V | | December 18, 2003 | | $ | 15,000 | | | 3-mo LIBOR plus 2.80% | | $ | 15,464 | | | December 30, 2033 | | December 30, 2008 |
Sun Capital Trust VI | | December 19, 2003 | | | 25,000 | | | 3-mo LIBOR plus 2.80% | | | 25,774 | | | January 23, 2034 | | January 23, 2009 |
Sun Statutory Trust VII | | January 17, 2006 | | | 30,000 | | | 3-mo LIBOR plus 1.35% | | | 30,928 | | | March 15, 2036 | | March 15, 2011 |
Sun Capital Trust VII | | April 19, 2007 | | | 10,000 | | | 6.428% Fixed | | | 10,310 | | | June 30, 2037 | | June 30, 2012 |
Sun Capital Trust VIII | | July 5, 2007 | | | 10,000 | | | 3-mo LIBOR plus 1.39% | | | 10,310 | | | October 1, 2037 | | October 1, 2012 |
| | | | | | | | | | | | | | | | |
| | | | $ | 90,000 | | | | | $ | 92,786 | | | | | |
| | | | | | | | | | | | | | | | |
On January 23, 2009 and December 30, 2008 the capital securities of Sun Capital Trust VI and Sun Capital Trust V, respectively, became eligible for redemption. As a result of the current interest environment, the Company has elected not to call these securities; however the Company maintains the right to call these securities in the future on the respective payment anniversary dates.
The Company’s capital securities are deconsolidated in accordance with GAAP and qualify as Tier 1 capital under federal regulatory guidelines. These instruments are subject to a 25% capital limitation under risk-based capital guidelines developed by the FRB. In March 2005, the FRB amended its risk-based capital standards to expressly allow the continued limited inclusion of outstanding and prospective issuances of capital securities in a bank holding company’s Tier 1 capital, subject to tightened quantitative limits. The FRB’s amended rule was to become effective March 31, 2009, and would have limited capital securities and other restricted core capital elements to 25% of all core capital elements, net of goodwill, less any associated deferred tax liability. On March 16, 2009, the FRB extended for two years the ability of bank holding companies to include restricted core capital elements as Tier 1 capital up to 25% of all core capital elements, including goodwill. The portion that exceeds the 25% capital limitation qualifies as Tier 2, or supplementary capital of the Company. Management currently operates under a capital plan for the Company and the Bank that is expected to allow the Company and the Bank to maintain regulatory capital levels at or above the levels set for them.
The Issuer Trusts are wholly owned unconsolidated subsidiaries of the Company and have no independent operations. The obligations of Issuer Trusts are fully and unconditionally guaranteed by the Company. The debentures are unsecured and rank subordinate and junior in right of payment to all indebtedness, liabilities and obligations of the Company. Interest on the debentures is cumulative and payable in arrears. Proceeds from any redemption of debentures would cause a mandatory redemption of capital securities having an aggregate liquidation amount equal to the principal amount of debentures redeemed.
Sun Statutory Trust VII has a fixed rate of 6.24% for a period of five years from the date of issuance and beginning in year six a variable rate of London Interbank Offered Rate (“LIBOR”) plus 1.35%. Sun Capital Trust VII has a fixed rate of 6.428% for a period of five years from the date of issuance and beginning in year six a variable rate of LIBOR plus 1.53%. Sun Capital Trust V, Sun Capital Trust VI, Sun Statutory Trust VII, Sun Capital Trust VII and Sun Capital Trust VIII do not have interest rate caps.
The Company has customarily relied on dividend payments from the Bank to fund junior subordinated debenture interest obligations. The amount available for payment of dividends to the Company by the Bank was $0 as of December 31, 2012 and no dividends may be paid by the Bank without OCC approval. Per the OCC Agreement, a dividend may only be declared if it is in accordance with the approved capital plan, the Bank remains in compliance with the capital plan following the payment of the dividend and the dividend is approved by the OCC. See Note 23 for additional information on dividend limitations.
15. STOCK-BASED INCENTIVE PLANS
In September 2010, the Board of Directors of the Company adopted a Stock-Based Incentive Plan (the “2010 Plan”). The purpose of the 2010 Plan, as is all of the Company’s stock-based plans, is to attract and retain personnel for positions of substantial responsibility and to provide additional incentive to officers, employees, directors, and other persons providing services to the Company, or any present or future parent or subsidiary of the Company to promote the long-term interests of the Company and its shareholders. The 2010 Plan authorizes the issuance of 4,900,000 shares of common stock pursuant to awards that may be granted in the form of options to purchase common stock and awards of shares of common stock. The maximum number of stock awards may not exceed 1,400,000 shares. Under the 2010 Plan, options expire ten years after the date of grant, unless terminated earlier under the option terms. For both options and stock awards, a Committee of non-employee directors has the authority to determine the conditions upon which the options granted will vest. At December 31, 2012, there were 232,647 options and 588,136 awards granted under the 2010 Plan.
In September 2010, the Board of Directors of the Company adopted a Performance Equity Plan (the “2010 Performance Plan”). The 2010 Performance Plan authorizes the issuance of 2,700,000 shares of common stock pursuant to awards that may be granted in the form of options at an exercise price which is 110% of the fair market value of the Company’s common stock on the date of grant. The purpose of the 2010 Performance Plan is to establish an effective link between incentive compensation and performance for officers and employees with the Company’s stockholders by rewarding actions that result in building long-term shareholder value. Under the 2010 Performance Plan, options expire ten years after the date of grant, unless terminated earlier under the option terms. For options, a Committee of non-employee directors has the authority to determine the conditions upon which the options granted will vest. At December 31, 2012, there were no options or stock awards granted under the 2010 Performance Plan.
60
The 2004 Stock Plan, as amended in 2009, (the “2004 Plan”), authorizes the issuance of 2,500,425 shares of common stock pursuant to awards that may be granted in the form of options to purchase common stock and awards of shares of common stock. The maximum number of stock awards that may be granted over time may not exceed 761,101 shares. At December 31, 2012, the amount of shares of common stock available for future grants under the 2004 Plan, as amended, was 328,174 shares, of which 9,495 shares are available for issuance as stock awards. Under the 2004 Plan, options expire 10 years after the date of grant, unless terminated earlier under the option terms. For both options and stock awards, a Committee of non-employee directors has the authority to determine the conditions upon which the options granted will vest. Each director and advisory director of the Company received compensation in the form of stock awards which were immediately vested upon issuance. There were 0, 0, and 220,534 stock awards issued from the 2004 Plan for the years ended December 31, 2012, 2011 and 2010, respectively. The Company granted 0, 16,500 and 763,994 options for the years ended December 31, 2012, 2011 and 2010, respectively, under the 2004 Plan. These options were granted at the then fair market value of the Company’s stock. During 2012, there were no options granted under the 2004 Plan. During 2011, there were 16,500 options granted under the 2004 Plan which vested evenly over four years beginning two years after the date of grant. During 2010, there were 503,300 options granted under the 2004 Plan which vested 25% immediately and the remaining 75% evenly over three years, 94,657 options granted which vest evenly over five years, 75,000 options granted that vest 100% two years after the date of grant, 47,037 options granted which vested immediately, and 44,000 options granted which vest evenly over four years beginning two years after the date of grant. There are 1,411,150 options outstanding and 263,611 non-vested restricted stock awards under the 2004 Plan at December 31, 2012.
In January 2006, as a result of the Advantage Bank (“Advantage”) acquisition, the Company assumed stock options previously granted under the Advantage Plans. Upon merger, all stock options under the Advantage Plans became fully vested and were converted to stock options of the Company. The number of shares of common stock that may be purchased pursuant to any such option is equal to the number of shares covered by the option multiplied by the merger exchange ratio, with the exercise price of each converted option equal to the original exercise price divided by the merger exchange ratio. Stock options previously granted under the Advantage Plans are both incentive and non-qualified and expire from 2012 through 2014. There are 136 stock options outstanding under these plans at December 31, 2012. No additional stock options will be granted under these plans.
In July 2004, as a result of the acquisition of Community Bancorp of New Jersey (“Community”), the Company assumed stock options previously granted under the Community Plans. Upon merger, all stock options under the Community Plans became fully vested and were converted to stock options of the Company. The number of shares of common stock that could have been purchased pursuant to any such option equaled the number of shares covered by the option multiplied by the merger exchange ratio, with the exercise price of each converted option equal to the original exercise price divided by the merger exchange ratio. Stock options previously granted under the Community Plans were both incentive and non-qualified and any remaining options expired in 2012. There are no stock options outstanding under these plans at December 31, 2012. No additional stock options will be granted under these plans.
Options granted under the 2002 Stock Option Plan (the “2002 Plan”) may be either qualified incentive options or nonqualified options as determined by the Compensation Committee of the Board of Directors or the Board of Directors. The 2002 Plan authorizes the issuance of 1,108,089 shares of common stock. The grant of reload options is authorized under the 2002 Plan. The award of a reload option allows the optionee to receive the grant of an additional stock option, at the then current market price, in the event that such optionee exercises all or part of an option (an “original option”) by surrendering already owned shares of common stock in full or partial payment of the option price under such original option. The exercise of an additional option issued in accordance with the reload feature will reduce the total number of shares eligible for award under the Plan. Under the 2002 Plan, the nonqualified options expire ten years and ten days after the date of grant, unless terminated earlier under the option terms. The qualified incentive options expire 10 years after the date of grant, unless terminated earlier under the option terms. The vesting provision of the 2002 Plan generally allows 20% of options granted to employees to vest six months after the date of grant, and 20% for each of the next four anniversaries of the grant, subject to employment and other conditions. The vesting provision of the 2002 Plan generally allows options granted to directors to vest as of the date of grant. At December 31, 2012, there were no options outstanding with the reload feature under the 2002 Plan and no shares available for grant.
There are no equity compensation plans providing for the issuance of shares of the Company which were not approved by the shareholders.
61
Options outstanding under the 2002, 2004, 2010, Community Plans and Advantage Plans are as follows:
SUMMARY OF STOCK OPTIONS GRANTED AND OUTSTANDING
| | | | | | | | | | | | |
| | | Incentive | | | Nonqualified | | | Total | |
Stock options granted and outstanding: | | | | | | | | | | | | |
December 31, 2012 at prices ranging from $2.85 to $17.49 per share | | | 835,097 | | | | 950,060 | | | | 1,785,157 | |
December 31, 2011 at prices ranging from $3.09 to $17.49 per share | | | 1,012,612 | | | | 1,815,465 | | | | 2,828,077 | |
December 31, 2010 at prices ranging from $3.51 to $17.49 per share | | | 846,377 | | | | 1,353,234 | | | | 2,199,611 | |
Activity in the stock option plans for the years ended December 31, 2012, 2011 and 2010, respectively was as follows:
SUMMARY OF STOCK OPTION ACTIVITY
| | | | | | | | | | | | | | | | | | | | | | | | |
Years Ended December 31, | | 2012 | | | 2011 | | | 2010 | |
| | | Number of
Options | | | Weighted
Average
Exercise
Price | | | Number
of Options | | | Weighted
Average
Exercise
Price | | | Number
of Options | | | Weighted
Average
Exercise
Price | |
Stock options outstanding, beginning of year | | | 2,828,077 | | | $ | 7.94 | | | | 2,728,139 | | | $ | 8.29 | | | | 2,199,611 | | | $ | 9.51 | |
Granted | | | 232,647 | | | | 2.92 | | | | 242,500 | | | | 4.28 | | | | 763,994 | | | | 4.77 | |
Exercised | | | — | | | | — | | | | — | | | | — | | | | — | | | | — | |
Forfeited | | | (74,776 | ) | | | 3.76 | | | | (63,095 | ) | | | 4.84 | | | | (29,521 | ) | | | 8.16 | |
Expired | | | (1,200,791 | ) | | | 8.11 | | | | (79,467 | ) | | | 11.39 | | | | (205,945 | ) | | | 8.27 | |
| | | | | | | | | | | | | | | | | | | | | | | | |
Stock options outstanding, end of year | | | 1,785,157 | | | $ | 7.35 | | | | 2,828,077 | | | $ | 7.94 | | | | 2,728,139 | | | $ | 8.29 | |
| | | | | | | | | | | | | | | | | | | | | | | | |
Stock options exercisable, end of year | | | 1,178,775 | | | $ | 8.66 | | | | 2,037,549 | | | $ | 8.73 | | | | 1,750,189 | | | $ | 9.37 | |
| | | | | | | | | | | | | | | | | | | | | | | | |
Stock options vested or expected to vest(1) | | | 1,725,894 | | | $ | 7.44 | | | | 2,599,466 | | | $ | 7.98 | | | | 2,584,682 | | | $ | 8.36 | |
| | | | | | | | | | | | | | | | | | | | | | | | |
| (1) | Includes vested shares and nonvested shares after a forfeiture rate assumption, which is based upon historical data, is applied. |
The weighted average grant date fair value per share of options granted during the years ended December 31, 2012, 2011 and 2010 were $1.52, $2.11 and $2.75, respectively. The aggregate intrinsic value of options outstanding at December 31, 2012, 2011 and 2010 was $132 thousand, $0, and $284 thousand, respectively.
No options were exercised during 2012, 2011 or 2010. The aggregate intrinsic value of options exercisable at December 31, 2012, 2011 and 2010 was $0.
A summary of the Company’s nonvested options at December 31, 2012, 2011 and 2010, respectively, are presented in the following table:
SUMMARY OF NONVESTED STOCK OPTION ACTIVITY
| | | | | | | | | | | | | | | | | | | | | | | | |
Years Ended December 31, | | 2012 | | | 2011 | | | 2010 | |
| | | Number
of Shares | | | Weighted
Average
Grant Date
Fair Value | | | Number
of Shares | | | Weighted
Average
Grant Date
Fair Value | | | Number
of Shares | | | Weighted
Average
Grant Date
Fair Value | |
Nonvested stock options outstanding, beginning of year | | | 790,528 | | | $ | 5.90 | | | | 977,950 | | | $ | 6.38 | | | | 597,363 | | | $ | 15.31 | |
Granted | | | 232,647 | | | | 2.92 | | | | 242,500 | | | | 4.28 | | | | 763,994 | | | | 4.77 | |
Vested | | | (342,017 | ) | | | 6.30 | | | | (366,827 | ) | | | 6.29 | | | | (353,886 | ) | | | 17.82 | |
Forfeited | | | (74,776 | ) | | | 3.76 | | | | (63,095 | ) | | | 4.84 | | | | (29,521 | ) | | | 8.16 | |
| | | | | | | | | | | | | | | | | | | | | | | | |
Nonvested stock options outstanding, end of year | | | 606,382 | | | $ | 4.79 | | | | 790,528 | | | $ | 5.90 | | | | 977,950 | | | $ | 6.38 | |
| | | | | | | | | | | | | | | | | | | | | | | | |
At December 31, 2012, there was $923 thousand of total unrecognized compensation cost related to options granted under the stock option plans. That cost is expected to be recognized over a weighted average period of 2.6 years.
62
A summary of the Company’s nonvested stock awards at December 31, 2012, 2011 and 2010, respectively, are presented in the following table:
SUMMARY OF NONVESTED STOCK AWARD ACTIVITY
| | | | | | | | | | | | | | | | | | | | | | | | |
Years Ended December 31, | | 2012 | | | 2011 | | | 2010 | |
| | | Number
of Shares | | | Weighted
Average
Grant Date
Fair Value | | | Number
of Shares | | | Weighted
Average
Grant Date
Fair Value | | | Number
of Shares | | | Weighted
Average
Grant Date
Fair Value | |
Nonvested stock awards outstanding, beginning of year | | | 175,989 | | | $ | 6.07 | | | | 309,481 | | | $ | 6.16 | | | | 182,297 | | | $ | 7.67 | |
Issued | | | 588,136 | | | | 2.88 | | | | — | | | | — | | | | 176,250 | | | | 4.76 | |
Vested | | | (106,012 | ) | | | 5.57 | | | | (110,973 | ) | | | 6.56 | | | | (48,066 | ) | | | 6.79 | |
Forfeited | | | (19,076 | ) | | | 3.21 | | | | (19,689 | ) | | | 4.83 | | | | (1,000 | ) | | | 3.54 | |
| | | | | | | | | | | | | | | | | | | | | | | | |
Nonvested stock awards outstanding, end of year | | | 639,037 | | | $ | 3.30 | | | | 178,819 | | | $ | 6.05 | | | | 309,481 | | | $ | 6.16 | |
| | | | | | | | | | | | | | | | | | | | | | | | |
During 2012, 2011 and 2010, the Company issued 588,136, 0 and 176,250 shares of stock awards, respectively, that were valued at $1.8 million, $0 and $839 thousand, respectively, at the time these awards were granted. The value of these shares is based upon the closing price of the Company’s common stock on the date of grant. At December 31, 2012, there was $1.8 million of total unrecognized compensation cost related to these stock awards that is expected to be recognized over a weighted average period of 4.47 years. The total compensation expense recognized on stock awards which vested during 2012 was $469 thousand.
16. EMPLOYEE AND DIRECTOR STOCK PURCHASE PLANS
In 1997, the Company adopted an Employee Stock Purchase Plan (“ESPP”) and a Directors Stock Purchase Plan (“DSPP”) (collectively, the “Purchase Plans”). Under the ESPP and the DSPP, as amended and restated in 2009, 323,254 shares and 119,216 shares, respectively, were reserved for issuance. Under the terms of the Purchase Plans, the Company grants participants an option to purchase shares of Company common stock with an exercise price equal to 95% of market prices. Under the ESPP, employees are permitted, through payroll deduction, to purchase up to $25,000 of fair market value of the Company’s common stock per year. Under the DSPP, directors are permitted to remit funds, on a regular basis, to purchase up to $25,000 of fair market value of the Company’s common stock per year. Participants incur no brokerage commissions or service charges for purchases made under the Purchase Plans. For the years ended December 31, 2012, 2011 and 2010 there were 38,787 shares, 36,167 shares and 25,321 shares, respectively, purchased through the ESPP. For the years ended December 31, 2012, 2011 and 2010, there were 16,754 shares, 15,538 shares and 11,497 shares, respectively, purchased through the DSPP. At December 31, 2012, there were 103,069 and 1,324 shares remaining in the ESPP and DSPP, respectively.
17. BENEFITS
The Company has established a 401(k) Retirement Plan (the “401(k) Plan”) for all qualified employees. Employees are eligible to participate in the 401(k) Plan following completion of 90 days of service and attaining age 21. The Company’s match begins after one year of service. Vesting in the Company’s match contribution accrues evenly over four years. Pursuant to the 401(k) Plan, employees can contribute up to 75% of their compensation to the maximum allowed by law. The Company will match 50% of the first 6% of the base contribution that an employee contributes. The Company match consists of a contribution of the Company’s common stock, at market value. The Company’s contribution to the 401(k) Plan was $670 thousand, $644 thousand and $641 thousand for the years ended December 31, 2012, 2011 and 2010, respectively.
In April 2009, the Company established the Directors’ Deferred Fee Plan, a deferred stock compensation plan for members of its Board of Directors (the “Directors’ Plan”). The Directors’ Plan provides Directors with the opportunity to defer, for tax planning purposes, receipt of all or a portion of any Sun Bancorp, Inc. stock earned as compensation. The Directors’ Plan balance as of December 31, 2012 and 2011 was $256 thousand and $193 thousand, respectively.
In September 2010, in an effort to facilitate the succession plan of the Company’s Chairmanship, the Company established a Salary Continuation Plan (the “Salary Plan”) to compensate the Chairman of the Company for advising the incoming Chairman and the Board of Directors, as well as reward him for his many years of service to the Company. Under the Salary Plan, for a period of three years, the Chairman will receive a monthly payment equal to his base salary in effect and due to him at retirement. At December 31, 2012, the Company had an accrued liability of $1.0 million in other liabilities on the consolidated statements of financial condition related to the Salary Plan.
63
18. COMMITMENTS AND CONTINGENT LIABILITIES
The Company, from time to time, may be a defendant in legal proceedings related to the conduct of its business. Management, after consultation with legal counsel, believes that the liabilities, if any, arising from such litigation and claims will not be material to the consolidated financial statements.
Letters of Credit. In the normal course of business, the Company has various commitments and contingent liabilities, such as customers’ letters of credit (including standby letters of credit of $40.5 million and $51.9 million at December 31, 2012 and 2011, respectively), which are not reflected in the accompanying consolidated financial statements. Standby letters of credit are conditional commitments issued by the Company to guarantee the performance of a customer to a third party. The credit risk involved in issuing letters of credit is essentially the same as that involved in extending loan facilities to customers. In the judgment of management, the financial condition of the Company will not be affected materially by the final outcome of any letters of credit.
Reserve for Unfunded Commitments. The Company maintains a reserve for unfunded loan commitments and letters of credit which is reported in other liabilities in the consolidated statements of financial condition consistent with FASB ASC 825,Financial Instruments. As of December 31, 2012, the Company records estimated losses inherent with unfunded loan commitments in accordance with FASB ASC 450, Contingencies, and estimated future obligations under letters of credit in accordance with FASB ASC 460, Guarantees. The methodology used to determine the adequacy of this reserve is integrated in the Company’s process for establishing the allowance for loan losses and considers the probability of future losses and obligations that may be incurred under these off-balance sheet agreements. The reserve for unfunded loan commitments and letters of credit as of December 31, 2012 and 2011 was $613 thousand and $381 thousand, respectively. Management believes this reserve level is sufficient to absorb estimated probable losses related to these commitments.
Reserve for residential mortgage loans sold with recourse. The Company maintains a reserve for residential mortgage loans sold with recourse to third-party purchasers which is reported in other liabilities in the consolidated statements of financial condition. As of December 31, 2012, the Company records estimated losses inherent with residential mortgage loans sold with recourse in accordance with FASB ASC 450, Contingencies. This reserve is determined based upon the probability of future losses which is calculated using historical Company and industry loss data. The reserve for residential mortgage loan recourse as of December 31, 2012 and 2011 was $325 thousand and $0, respectively. Management believes this reserve level is sufficient to address potential recourse exposure.
Leases. The following is a schedule of the Company’s future minimum lease payments under capital leases as of December 31, 2012:
FUTURE MINIMUM LEASE PAYMENTS UNDER OBLIGATIONS UNDER CAPITAL LEASES
| | | | |
Years Ended December 31, | | Amount | |
2013 | | $ | 776 | |
2014 | | | 776 | |
2015 | | | 797 | |
2016 | | | 839 | |
2017 | | | 839 | |
Thereafter | | | 7,819 | |
| | | | |
Total minimum lease payments | | | 11,846 | |
Less: Amount representing interest | | | 4,237 | |
| | | | |
Present value of minimum lease payment, net | | $ | 7,609 | |
| | | | |
The following table shows future minimum payments under noncancelable operating leases with initial terms of one year or more at December 31, 2012. Future minimum receipts under sub-lease agreements are deemed not material.
64
FUTURE MINIMUM PAYMENTS UNDER NONCANCELABLE OPERATING LEASES
| | | | |
Years Ended December 31, | | Amount | |
2013 | | $ | 4,177 | |
2014 | | | 4,110 | |
2015 | | | 3,928 | |
2016 | | | 3,855 | |
2017 | | | 3,529 | |
Thereafter | | | 26,001 | |
| | | | |
Total minimum lease payments | | $ | 45,600 | |
| | | | |
Rental expense, which is included in occupancy expense on the Company’s consolidated statements of operations for all leases was $4.8 million, $4.5 million and $4.5 million for the years ended December 31, 2012, 2011 and 2010, respectively.
19. DERIVATIVE INSTRUMENTS AND HEDGING ACTIVITIES
Derivative financial instruments involve, to varying degrees, interest rate, market and credit risk. The Company manages these risks as part of its asset and liability management process and through credit policies and procedures. The Company seeks to minimize counterparty credit risk by establishing credit limits and collateral agreements. The Company utilizes certain derivative financial instruments to enhance its ability to manage interest rate risk that exists as part of its ongoing business operations. In general, the derivative transactions entered into by the Company fall into one of two types: a fair value hedge of a specific fixed-rate loan agreement and an economic hedge of a derivative offering to a Bank customer. The Company does not use derivative financial instruments for trading purposes.
Fair Value Hedges - Interest Rate Swaps. The Company has entered into interest rate swap arrangements to exchange the periodic payments on fixed-rate commercial loan agreements for variable-rate payments based on the one-month London Interbank Offered Rate (“LIBOR”) without the exchange of the underlying principal. The interest rate swaps are designated as fair value hedges under FASB ASC 815, Derivatives and Hedging (“FASB ASC 815”), and are executed for periods and terms that match the related underlying fixed-rate loan agreements. The Company applies the “shortcut” method of accounting under FASB ASC 815, which assumes there is no ineffectiveness as changes in the interest rate component of the swaps’ fair value are expected to exactly offset the corresponding changes in the fair value of the underlying commercial loan agreements. Because the hedging arrangement is considered highly effective, changes to the underlying benchmark interest rates considered in the valuation of these instruments do not result in an impact to earnings; however, there may be fair value adjustments related to credit quality variations between counterparties, which may impact earnings as required by FASB ASC 820,Fair Value Measurements and Disclosures (“FASB ASC 820”). The fair value adjustments related to credit quality were not material as of December 31, 2012 and 2011.
The following tables provide information pertaining to interest rate swaps designated as fair value hedges under FASB ASC 815 at December 31, 2012 and 2011:
SUMMARY OF INTEREST RATE SWAPS DESIGNATED AS FAIR VALUE HEDGES
| | | | | | | | | | | | | | | | |
December 31, | | 2012 | | | 2011 | |
Balance Sheet Location | | Notional | | | Fair Value | | | Notional | | | Fair
Value | |
Other liabilities | | $ | 30,545 | | | $ | (3,503 | ) | | $ | 33,663 | | | $ | (4,489 | ) |
SUMMARY OF INTEREST RATE SWAPS COMPONENTS
| | | | | | | | |
December 31, | | 2012 | | | 2011 | |
Weighted average pay rate | | | 6.85 | % | | | 6.83 | % |
Weighted average receive rate | | | 2.22 | % | | | 2.27 | % |
Weighted average maturity in years | | | 2.6 | | | | 3.4 | |
Customer Derivatives – Interest Rate Swaps/Caps. The Company enters into interest rate swaps that allow our commercial loan customers to effectively convert a variable-rate commercial loan agreement to a fixed-rate commercial loan agreement. Under these agreements, the Company enters into a variable-rate loan agreement with a customer in addition to an interest rate swap agreement, which serves to effectively swap the customer’s variable-rate loan into a fixed-rate loan. The Company then enters into a corresponding swap agreement with a third party in order to economically hedge its exposure on the variable and fixed components of the customer agreement. The interest rate swaps with both the customers and third parties are not designated as hedges under FASB ASC 815 and are marked to market through earnings. As the interest rate swaps are structured to offset each other, changes to the underlying benchmark interest rates considered in the valuation of these instruments do not result in an impact to earnings; however,
65
there may be fair value adjustments related to credit quality variations between counterparties, which may impact earnings as required by FASB ASC 820. The Company recognized negative net derivative valuation adjustments of $2.3 million, $12.5 million and $12.2 million during the years ended December 31, 2012, 2011 and 2010, respectively. These balances included swap termination fees of $2.2 million, $14.6 million and $10.3 million during the years ended December 31, 2012, 2011 and 2010, respectively. These amounts are included in the derivative credit valuation adjustment in the consolidated statements of operations.
SUMMARY OF INTEREST RATE SWAPS NOT DESIGNATED AS HEDGING INSTRUMENTS
| | | | | | | | | | | | | | | | |
December 31, | | 2012 | | | 2011 | |
Balance Sheet Location | | Notional | | | Fair Value | | | Notional | | | Fair Value | |
Other assets | | $ | 358,753 | | | $ | 40,594 | | | $ | 400,311 | | | $ | 50,355 | |
Other liabilities | | | 358,753 | | | | (40,646 | ) | | | 400,311 | | | | (50,462 | ) |
In addition, the Company has entered into an interest rate floor sale transaction with one commercial customer. The Company entered into a corresponding interest rate floor purchase transaction with a third party in order to offset its exposure on the variable and fixed components of the customer agreement. As the interest rate floors with both the customer and the third party are not designated as hedges under FASB ASC 815, the instruments are marked to market through earnings. As the interest rate floors are structured to offset each other, changes to the underlying benchmark interest rates considered in the valuation of these instruments do not result in an impact to earnings; however, there may be fair value adjustments related to credit quality variations between counterparties, which may impact earnings as required by FASB ASC 820. The combined notional amount of the two interest rate floors was $15.9 million and $16.6 million at December 31, 2012 and December 31, 2011, respectively.
The Company has an International Swaps and Derivatives Association agreement with a third party that requires a minimum dollar transfer amount upon a margin call. This requirement is dependent on certain specified credit measures. The amount of collateral posted with the third party at December 31, 2012 and 2011 was $54.6 million and $62.6 million, respectively. The amount of collateral posted with the third party is deemed to be sufficient to collateralize both the fair market value change as well as any additional amounts that may be required as a result of a change in the specified credit measures. The aggregate fair value of all derivative financial instruments in a liability position with credit measure contingencies and entered into with the third party was $44.1 million and $55.0 million at December 31, 2012 and 2011, respectively.
Interest rate lock commitments on residential mortgages. As a part of its normal residential mortgage operations, the Company will enter into an interest rate lock commitment with a potential borrower. The Company enters into a corresponding commitment to an investor to sell that loan at a specific price shortly after origination. In accordance with FASB ASC 820, adjustments are recorded through earnings to account for the net change in fair value of these transactions for both the held-for-sale pipeline and warehouse. For the year ended December 31, 2012, the Company recognized $638 thousand and $209 thousand in positive fair value adjustments on its held-for-sale pipeline and warehouse, respectively, which were included in other non-interest income on the consolidated statements of operations as an increase to income. In the year ended December 31, 2011, $0 in fair value adjustments were recorded. The interest rate lock commitment had notional amounts of $90.1 million and $98.5 million for the held-for-sale pipeline and warehouse, respectively as of December 31, 2012.
20. INCOME TAXES
The income tax (benefit) expense consists of the following:
SUMMARY OF INCOME TAX (BENEFIT) EXPENSE
| | | | | | | | | | | | |
Years Ended December 31, | | 2012 | | | 2011 | | | 2010 | |
Current | | $ | (34 | ) | | $ | 10 | | | $ | (11,020 | ) |
Deferred | | | — | | | | — | | | | 20,342 | |
| | | | | | | | | | | | |
Income tax (benefit) provision | | $ | (34 | ) | | $ | 10 | | | $ | 9,322 | |
| | | | | | | | | | | | |
66
Items that gave rise to significant portions of the deferred tax accounts are as follows:
DETAILS OF DEFERRED TAX LIABILITY, NET
| | | | | | | | |
December 31, | | 2012 | | | 2011 | |
Deferred tax asset: | | | | | | | | |
Allowance for loan losses | | $ | 19,239 | | | $ | 17,319 | |
Goodwill amortization | | | 1,262 | | | | 3,263 | |
Impairments realized on investment securities | | | 490 | | | | 490 | |
Fixed assets | | | 2,596 | | | | 1,588 | |
Net operating loss carry forwards | | | 85,466 | | | | 66,334 | |
Alternative minimum tax credits | | | 2,010 | | | | 1,975 | |
Other | | | 5,194 | | | | 3,804 | |
| | | | | | | | |
Total deferred tax asset before valuation allowance | | | 116,257 | | | | 94,773 | |
| | | | | | | | |
Less: valuation allowance | | | (113,398 | ) | | | (91,416 | ) |
Deferred tax liability: | | | | | | | | |
Core deposit intangible amortization | | | 420 | | | | 1,203 | |
Unrealized gain on investment securities | | | 1,509 | | | | 432 | |
Deferred loan costs | | | 2,119 | | | | 1,817 | |
Other | | | 320 | | | | 337 | |
| | | | | | | | |
Total deferred tax liability | | | 4,368 | | | | 3,789 | |
| | | | | | | | |
Net deferred tax (liability) asset | | $ | (1,509 | ) | | $ | (432 | ) |
| | | | | | | | |
The Company has $199.2 million of federal net operating loss carryforwards at December 31, 2012 of which $38.8 million will expire in 2030, $113.5 million will expire in 2031, and $46.9 million will expire in 2032. The Company also has $268.9 million of state net operating loss carryforwards at December 31, 2012 of which $3.0 million expire in 2015, $37.4 million expire in 2029, $74.7 million expire in 2030, $110.2 million expire in 2031, and $43.7 million expire in 2032.
At December 31, 2012, the Company had a valuation allowance of $113.4 million against the net deferred tax asset as it is more likely than not that the full deferred tax asset will not be realized. Management considered all positive and negative evidence regarding the ultimate ability to fully realize the deferred tax assets, including past operating results and the forecast of future taxable income. In addition, the Company is a three-year cumulative loss company. The net deferred tax liability of $1.5 million relates to unrealized gains on investment securities.
The provision for income taxes differs from that computed at the statutory rate as follows:
RECONCILIATION OF FEDERAL STATUTORY INCOME TAX
| | | | | | | | | | | | | | | | | | | | | | | | |
Years Ended December 31, | | 2012 | | | 2011 | | | 2010 | |
| | | Amount | | | % | | | Amount | | | % | | | Amount | | | % | |
Loss before income taxes | | $ | (50,524 | ) | | | | | | $ | (67,495 | ) | | | | | | $ | (176,096 | ) | | | | |
Tax computed at statutory rate | | | (17,683 | ) | | | 35.0 | % | | | (23,624 | ) | | | 35.0 | % | | | (61,634 | ) | | | 35.0 | % |
(Decrease) increase in charge resulting from: | | | | | | | | | | | | | | | | | | | | | | | | |
State taxes, net of federal benefit | | | (3,040 | ) | | | 6.0 | | | | (3,949 | ) | | | 5.9 | | | | (8,514 | ) | | | 4.8 | |
Tax exempt interest (net) | | | (638 | ) | | | 1.3 | | | | (900 | ) | | | 1.3 | | | | (1,233 | ) | | | 0.7 | |
BOLI | | | (695 | ) | | | 1.4 | | | | (1,037 | ) | | | 1.5 | | | | (726 | ) | | | 0.4 | |
Nondeductible goodwill | | | — | | | | — | | | | — | | | | — | | | | 18,980 | | | | (10.8 | ) |
Valuation allowance | | | 21,981 | | | | (43.5 | ) | | | 29,524 | | | | (43.7 | ) | | | 61,892 | | | | (35.1 | ) |
Other, net | | | 41 | | | | (0.1 | ) | | | (4 | ) | | | 0.0 | | | | 557 | | | | (0.3 | ) |
| | | | | | | | | | | | | | | | | | | | | | | | |
Total income tax (benefit) expense | | $ | (34 | ) | | | 0.1 | % | | $ | 10 | | | | 0.0 | % | | $ | 9,322 | | | | (5.3 | )% |
| | | | | | | | | | | | | | | | | | | | | | | | |
FASB ASC 740 clarifies the accounting for income taxes by prescribing a minimum probability threshold that a tax position must meet before a financial statement benefit is recognized. The minimum threshold is defined in ASC 740 as a tax position that is more likely than not to be sustained upon examination by the applicable taxing authority, including resolution of any related appeals or litigation processes, based on the technical merits of the position. The tax benefit to be recognized is measured as the largest amount of benefit that has greater than 50% likelihood of being realized upon ultimate settlement. ASC 740 was applied to all existing tax positions upon initial adoption. There was no liability for uncertain tax positions and no known unrecognized tax benefits at December 31, 2012 or 2011.
The Company recognizes, when applicable, interest and penalties related to unrecognized tax benefits in the provision for income taxes in the results of operations. As of December 31, 2012, the tax year ended December 31, 2011 was subject to examination by the Internal Revenue Service (the “IRS”) and to state examination. During 2012, the IRS completed its examination of the Company’s 2008 through 2010 tax returns, which did not result in any material change to the Company’s tax position. However, the federal statute remains open for 2009 and 2010.
67
21. SECURITIES PURCHASE AGREEMENTS
On July 7, 2010, the Company entered into securities purchase agreements with WLR SBI AcquisitionCo, LLC, an affiliate of WL Ross & Co. LLC (“WL Ross”), members and affiliates of the Bank’s founding Brown Family (the “Brown Family”), certain affiliates of Siguler Guff & Company, LP (the “Siguler Guff Shareholders”) and certain other institutional and accredited investors (the “Other Investors”). On September 22, 2010, the Company completed the issuance and sale of 4,672,750 shares of its common stock and 88,009 shares of its Mandatorily Convertible Cumulative Non-Voting Perpetual Stock, Series B (the “Series B Preferred Stock”) for net proceeds of $98.5 million. At the Company’s Annual Meeting of Shareholders held on November 1, 2010, its shareholders approved an amendment to our Amended and Restated Certificate of Incorporation allowing for the conversion of the 88,009 shares of Series B Preferred Stock into 22,002,250 shares of common stock at a conversion price of $4.00 per share.
On March 22, 2011, the Company completed a public offering of 28,750,000 shares of common stock at a public offering price of $3.00 per share, which included the full exercise of the over-allotment option granted to the underwriters to purchase an additional 3,750,000 shares of common stock. After deducting the underwriting discount and offering expenses payable by the Company, the net proceeds were $81.4 million. The Company’s three largest shareholders, WL Ross, Siguler Guff, and the Brown Family, along with certain officers and directors, purchased an aggregate of 10,193,224 shares in the offering. WL Ross and the Siguler Guff Shareholders maintained their percentage interest in the Company in the offering. Pursuant to the terms of the securities purchase agreements entered into between WL Ross, the Siguler Guff Shareholders, the Brown Family and the Company in connection with the private placement of Company securities in July 2010, each of these investors was entitled to purchase shares in the offering at $2.85 per share which represented the public offering price less the underwriting discount of $0.15 per share paid to the underwriters on the other shares sold.
On April 11, 2011, the Company issued and sold in a private placement transaction an additional 3,802,131 shares at $2.85 per share totaling $10.8 million in additional stock proceeds pursuant to the exercise of gross-up rights contained in the previously executed security purchase agreements with the three investors noted above. The gross-up rights were triggered by the underwriters’ exercise of the over-allotment option in the public offering. On August 8, 2011, the Company issued approximately 2,378,232 additional shares at $2.85 per share totaling $6.8 million in stock proceeds pursuant to the exercise of gross-up rights. The transactions were triggered pursuant to the gross-up rights issued to Anchorage Capital Group, LLC (“Anchorage”), in connection with its purchase of shares in the public offering.
22. LOSS PER COMMON SHARE
Basic earnings (loss) per share is computed by dividing net income (loss) available to common shareholders by the weighted average number of shares of common stock outstanding, net of any treasury shares, during the period. Diluted earnings per share is calculated by dividing net income (loss) available to common shareholders by the weighted average number of shares of common stock outstanding, net of any treasury shares, after consideration of the potential dilutive effect of common stock equivalents, based upon the treasury stock method using an average market price for the period.
Loss per share was calculated as follows:
LOSS PER COMMON SHARE COMPUTATION
| | | | | | | | | | | | |
| Years Ended December 31, | | 2012 | | | 2011 | | | 2010 | |
Net loss | | $ | (50,491 | ) | | $ | (67,505 | ) | | $ | (185,418 | ) |
| | | | | | | | | | | | |
Net loss available to common shareholders | | $ | (50,191 | ) | | $ | (67,505 | ) | | $ | (185,418 | ) |
| | | | | | | | | | | | |
Average common shares outstanding | | | 85,938,714 | | | | 76,653,990 | | | | 28,258,953 | |
Net effect of dilutive stock options | | | — | | | | — | | | | — | |
| | | | | | | | | | | | |
Dilutive common shares outstanding | | | 85,738,714 | | | | 76,653,990 | | | | 28,258,953 | |
| | | | | | | | | | | | |
Loss per share – basic | | $ | (0.59 | ) | | $ | (0.88 | ) | | $ | (6.56 | ) |
Loss per share – diluted | | $ | (0.59 | ) | | $ | (0.88 | ) | | $ | (6.56 | ) |
23. REGULATORY MATTERS
The Company is subject to risk-based capital guidelines adopted by the FRB for bank holding companies. The Bank is also subject to similar capital requirements adopted by the OCC. Under the requirements the federal bank regulatory agencies have
68
established quantitative measures to ensure that minimum thresholds for Total Capital, Tier 1 Capital and Leverage (Tier 1 Capital divided by average assets) ratios (set forth in the table below) are maintained. Failure to meet minimum capital requirements can initiate certain mandatory, and possibly additional discretionary, actions by regulators that, if undertaken, could have a direct material effect on the Company’s and the Bank’s consolidated financial statements. Under capital adequacy guidelines and the regulatory framework for prompt corrective action, the Company and the Bank must meet specific capital guidelines that involve quantitative measures of their assets and certain off-balance sheet items as calculated under regulatory practices.
The Company’s and Bank’s capital amounts and classifications are also subject to qualitative judgments by the federal bank regulators about components, risk weightings and other factors. The Company’s and the Bank’s risk-based capital ratios have been computed in accordance with regulatory practices. The Company and the Bank were in compliance with these regulatory capital requirements of the FRB and the OCC as of December 31, 2012. As discussed below and elsewhere herein, additional capital requirements have been imposed on the Bank by the OCC, which the Bank was also in full compliance with as of December 31, 2012.
On April 15, 2010, the Bank entered into the OCC Agreement which contained requirements to develop and implement a profitability and capital plan that provides for the maintenance of adequate capital to support the Bank’s risk profile in the current economic environment. The capital plan was also required to contain a dividend policy allowing dividends only if the Bank is in compliance with the capital plan, and obtains prior approval from the OCC. During the second quarter of 2010, the Company delivered its profit and capital plans to the OCC.
The Bank also agreed to: (a) implement a program to protect the Bank’s interest in criticized or classified assets, (b) review and revise the Bank’s loan review program; (c) implement a program for the maintenance of an adequate allowance for loan losses; and (d) revise the Bank’s credit administration policies. During the second quarter of 2010, the Company revised and implemented changes to policies and procedures pursuant to the OCC Agreement. As noted earlier in this section, the Bank also agreed that its brokered deposits will not exceed 3.5% of its total liabilities unless approved by the OCC. Effective October 18, 2012, the OCC approved an increase of this limit to 6.0%. Management does not expect that this restriction will limit its access to liquidity as the Bank does not rely on brokered deposits as a major source of funding. As of December 31, 2012, the Bank’s brokered deposits represented 4.0% of its total liabilities.
The Bank is also subject to individual minimum capital ratios established by the OCC requiring the Bank to continue to maintain a Leverage ratio at least equal to 8.50% of adjusted total assets, to continue to maintain a Tier 1 Capital ratio at least equal to 9.50% of risk-weighted assets and to maintain a Total Capital ratio at least equal to 11.50% of risk-weighted assets. At December 31, 2012, the Bank met all of the three capital ratios established by the OCC as its Leverage ratio was 9.24%, its Tier 1 Capital ratio was 11.76%, and its Total Capital ratio was 13.02%.
The following table provides both the Company’s and the Bank’s risk-based capital ratios as of December 31, 2012 and 2011.
REGULATORY CAPITAL LEVELS
| | | | | | | | | | | | | | | | | | | | | | | | |
| | | Actual | | | For Capital Adequacy
Purposes | | | To Be Well Capitalized
Under Prompt Corrective
Action Provisions(1) | |
| | | Amount | | | Ratio | | | Amount | | | Ratio | | | Amount | | | Ratio | |
December 31, 2012 | | | | | | | | | | | | | | | | | | | | | | | | |
Total Capital (to Risk-Weighted Assets): | | | | | | | | | | | | | | | | | | | | | | | | |
Sun Bancorp, Inc. | | $ | 340,111 | | | | 13.72 | % | | $ | 198,340 | | | | 8.00 | % | | | N/A | |
Sun National Bank | | | 322,041 | | | | 13.02 | | | | 197,964 | | | | 8.00 | | | $ | 247,455 | | | | 10.00 | % |
Tier 1 Capital (to Risk-Weighted Assets): | | | | | | | | | | | | | | | | | | | | | | | | |
Sun Bancorp, Inc. | | | 293,008 | | | | 11.82 | | | | 99,170 | | | | 4.00 | | | | N/A | |
Sun National Bank | | | 290,922 | | | | 11.76 | | | | 98,982 | | | | 4.00 | | | | 148,473 | | | | 6.00 | |
Leverage Ratio: | | | | | | | | | | | | | | | | | | | | | | | | |
Sun Bancorp, Inc. | | | 293,008 | | | | 9.30 | | | | 126,080 | | | | 4.00 | | | | N/A | |
Sun National Bank | | | 290,922 | | | | 9.24 | | | | 125,902 | | | | 4.00 | | | | 157,377 | | | | 5.00 | |
| | | | | | |
December 31, 2011 | | | | | | | | | | | | | | | | | | | | | | | | |
Total Capital (to Risk-Weighted Assets): | | | | | | | | | | | | | | | | | | | | | | | | |
Sun Bancorp, Inc. | | $ | 385,034 | | | | 15.22 | % | | $ | 202,415 | | | | 8.00 | % | | | N/A | |
Sun National Bank | | | 338,240 | | | | 13.39 | | | | 202,120 | | | | 8.00 | | | $ | 252,650 | | | | 10.00 | % |
Tier 1 Capital (to Risk-Weighted Assets): | | | | | | | | | | | | | | | | | | | | | | | | |
Sun Bancorp, Inc. | | | 353,283 | | | | 13.96 | | | | 101,208 | | | | 4.00 | | | | N/A | |
Sun National Bank | | | 306,534 | | | | 12.13 | | | | 101,060 | | | | 4.00 | | | | 151,590 | | | | 6.00 | |
Leverage Ratio: | | | | | | | | | | | | | | | | | | | | | | | | |
Sun Bancorp, Inc. | | | 353,283 | | | | 11.09 | | | | 127,381 | | | | 4.00 | | | | N/A | |
Sun National Bank | | | 306,534 | | | | 9.64 | | | | 127,240 | | | | 4.00 | | | | 159,050 | | | | 5.00 | |
| (1) | Not applicable for bank holding companies. |
69
At December 31, 2012 and 2011, although the Company and the Bank exceeded the required ratios for classification as “well capitalized,” due to the fact that it was subject to the OCC Agreement, it cannot be deemed “well capitalized.”
The Bank’s deposits are insured to applicable limits by the FDIC. Pursuant to the Dodd-Frank Act, the Federal Deposit Insurance Act was amended to increase the maximum deposit insurance amount from $100,000 to $250,000 and extended the unlimited deposit insurance coverage for noninterest-bearing transaction accounts until December 31, 2012, at which time the extension expired. Upon expiration, these types of deposits were only insured up to the same $250 thousand limit as other types of deposit accounts.
In November 2009, instead of imposing additional special assessments, the FDIC amended the assessment regulations to require all insured depository institutions to prepay their estimated risk-based assessments for the fourth quarter of 2009, and for all of 2010, 2011, and 2012 on December 30, 2009. For purposes of estimating the future assessments, each institution’s base assessment rate in effect on September 30, 2009 was used, assuming a five percent annual growth rate in the assessment base and a three basis point increase in the assessment rate in 2011 and 2010. The prepaid assessment will be applied against actual quarterly assessments until exhausted. Any funds remaining after June 30, 2013 will be returned to the institution. If the prepayment would impair an institution’s liquidity or otherwise create significant hardship, it was able to apply for an exemption. Requiring this prepaid assessment did not preclude the FDIC from changing assessment rates or from further revising the risk-based assessment system. On December 31, 2009, the Company paid the FDIC prepaid assessment of $18.3 million, of which approximately $3.9 million applied to 2012. The remaining prepaid assessment of approximately $2.6 million at December 31, 2012 will be recognized as expense over the course of the respective periods covered.
The Company’s capital securities are deconsolidated in accordance with GAAP and qualify as Tier 1 capital under federal regulatory guidelines. These instruments are subject to a 25% capital limitation under risk-based capital guidelines developed by the FRB. In March 2005, the FRB amended its risk-based capital standards to expressly allow the continued limited inclusion of outstanding and prospective issuances of capital securities in a bank holding company’s Tier 1 capital, subject to tightened quantitative limits. The FRB’s amended rule was to become effective March 31, 2009, and would have limited capital securities and other restricted core capital elements to 25% of all core capital elements, net of goodwill less any associated deferred tax liability. On March 16, 2009, the FRB extended for two years the ability for bank holding companies to include restricted core capital elements as Tier 1 capital up to 25% of all core capital elements, including goodwill. The portion that exceeds the 25% capital limitation qualifies as Tier 2, or supplementary capital of the Company. At December 31, 2012, the $74.1 million in capital securities qualified as Tier 1 capital.
The ability of the Bank to pay dividends to the Company is controlled by certain regulatory restrictions. Generally, dividends declared in a given year by a national bank are limited to its net profit, as defined by regulatory agencies, for that year, combined with its retained net income for the preceding two years, less any required transfer to surplus or to fund for the retirement of any preferred stock. In addition, a national bank may not pay any dividends in an amount greater than its undivided profits and a national bank may not declare any dividends if such declaration would leave the bank inadequately capitalized. Therefore, the ability of the Bank to declare dividends will depend on its future net income and capital requirements. Also, banking regulators have indicated that national banks should generally pay dividends only out of current operating earnings. Following this guidance, the amount available for payment of dividends to the Company by the Bank totaled $0 at December 31, 2012. Per the OCC Agreement, a dividend may only be declared if it is in accordance with the approved capital plan, the Bank remains in compliance with the capital plan following the payment of the dividend and the dividend is approved by the OCC.
24. FAIR VALUE OF FINANCIAL INSTRUMENTS
The Company accounts for fair value measurements in accordance with FASB ASC 820. FASB ASC 820 defines fair value, establishes a framework for measuring fair value and expands disclosures about fair value measurements. The definition of fair value retains the exchange price notion in earlier definitions of fair value. FASB ASC 820 clarifies that the exchange price is the price in an orderly transaction between market participants to sell the asset or transfer the liability in the market in which the reporting entity would transact for the asset or liability. The definition focuses on the price that would be received to sell the asset or paid to transfer the liability (an exit price), not the price that would be paid to acquire the asset or received to assume the liability (an entry price). FASB ASC 820 emphasizes that fair value is a market-based measurement, not an entity-specific measurement and also clarifies the application of fair value measurement in a market that is not active.
70
FASB ASC 820 describes three levels of inputs that may be used to measure fair value:
| | |
| Level 1 | | Quoted prices in active markets for identical assets or liabilities. |
| |
| Level 2 | | Inputs other than quoted prices included within Level 1 that are observable for the asset or liability, either directly or indirectly. Level 2 inputs include: quoted prices for similar assets or liabilities in active markets; quoted prices for identical or similar assets or liabilities in markets that are not active; inputs other than quoted prices that are observable for the asset or liability; and inputs that are derived principally from or corroborated by observable market data by correlation or other means. |
| |
| Level 3 | | Unobservable inputs that are supported by little or no market activity and that are significant to the fair value of the assets or liabilities. Level 3 assets and liabilities include financial instruments whose value is determined using pricing models, discounted cash flow methodologies, or similar techniques, as well as instruments for which the determination of fair value requires significant management judgment or estimation. |
FASB ASC 820 requires the Company to disclose the fair value of financial assets on both a recurring and non-recurring basis. Those assets and liabilities which will continue to be measured at fair value on a recurring basis are as follows:
SUMMARY OF RECURRING FAIR VALUE MEASUREMENTS
| | | | | | | | | | | | | | | | |
| | | | | | Category Used for Fair Value Measurement | |
| | | Total | | | Level 1 | | | Level 2 | | | Level 3 | |
December 31, 2012 | | | | | | | | | | | | | | | | |
Assets: | | | | | | | | | | | | | | | | |
Investment securities available for sale: | | | | | | | | | | | | | | | | |
U.S. Treasury obligations | | $ | 10,011 | | | $ | 10,011 | | | $ | — | | | $ | — | |
U.S. Government agencies | | | 4,949 | | | | — | | | | 4,949 | | | | — | |
U.S. Government agency mortgage-backed securities | | | 354,978 | | | | — | | | | 354,978 | | | | — | |
Other mortgage-backed securities | | | 286 | | | | — | | | | 286 | | | | — | |
State and municipal obligations | | | 40,170 | | | | — | | | | 40,170 | | | | — | |
Trust preferred securities | | | 5,882 | | | | — | | | | — | | | | 5,882 | |
Corporate bonds | | | 25,442 | | | | — | | | | 25,442 | | | | — | |
Other securities | | | 1,464 | | | | 1,464 | | | | — | | | | — | |
Residential loans held-for-sale | | | 99,013 | | | | — | | | | 99,013 | | | | — | |
Interest rate lock commitments on residential mortgages | | | 847 | | | | — | | | | — | | | | 847 | |
Interest rate swaps | | | 40,594 | | | | — | | | | 40,594 | | | | — | |
Interest rate floor | | | 275 | | | | — | | | | 275 | | | | — | |
Liabilities: | | | | | | | | | | | | | | | | |
Fair value interest rate swaps | | | 3,503 | | | | — | | | | 3,503 | | | | — | |
Interest rate swaps | | | 40,646 | | | | — | | | | 40,646 | | | | — | |
Interest rate floor | | | 275 | | | | — | | | | 275 | | | | — | |
| | | | |
December 31, 2011 | | | | | | | | | | | | | | | | |
Assets: | | | | | | | | | | | | | | | | |
Investment securities available for sale: | | | | | | | | | | | | | | | | |
U.S. Treasury obligations | | $ | 12,079 | | | $ | 12,079 | | | $ | — | | | $ | — | |
U.S. Government agencies | | | — | | | | — | | | | — | | | | — | |
U.S. Government agency mortgage-backed securities | | | 428,904 | | | | — | | | | 428,904 | | | | — | |
Other mortgage-backed securities | | | 296 | | | | — | | | | 296 | | | | — | |
State and municipal obligations | | | 48,785 | | | | — | | | | 48,785 | | | | — | |
Trust preferred securities | | | 4,908 | | | | — | | | | — | | | | 4,908 | |
Corporate bonds | | | 19,408 | | | | — | | | | 19,408 | | | | — | |
Other | | | 1,165 | | | | 665 | | | | 500 | | | | — | |
Interest rate swaps | | | 50,355 | | | | — | | | | 50,355 | | | | — | |
Interest rate floor | | | 360 | | | | — | | | | 360 | | | | — | |
Liabilities: | | | | | | | | | | | | | | | | |
Fair value interest rate swaps | | | 4,489 | | | | — | | | | 4,489 | | | | — | |
Interest rate swaps | | | 50,462 | | | | — | | | | 50,462 | | | | — | |
Interest rate floor | | | 360 | | | | — | | | | 360 | | | | — | |
71
Level 1 Valuation Techniques and Inputs
U.S. Treasury securities. The Company reports U.S. Treasury securities at fair value utilizing Level 1 inputs. These securities are priced using observable quotations for the indicated security.
Other securities. The other securities category is comprised of money market mutual funds. Given the short maturity structure and the expectation that the investment can be redeemed at par value, the fair value of these investments is assumed to be the book value.
Level 2 Valuation Techniques and Inputs
The majority of the Company’s investment securities are reported at fair value utilizing Level 2 inputs. Prices of these securities are obtained through independent, third-party pricing services. Prices obtained through these sources include market derived quotations and matrix pricing and may include both observable and unobservable inputs. Fair market values take into consideration data such as dealer quotes, new issue pricing, trade prices for similar issues, prepayment estimates, cash flows, market credit spreads and other factors. The Company reviews the output from the third-party providers for reasonableness by the pricing consistency among securities with similar characteristics, where available, and comparing values with other pricing sources available to the Company.
In general, the Level 2 valuation process uses the following significant inputs in determining the fair value of the Company’s different classes of investments:
U.S. Government agency securities. These securities are evaluated based on either a nominal spread basis for non-callable securities or on an option adjusted spread (“OAS”) basis for callable securities. The nominal spread and OAS levels are derived from observations of identical or comparable securities actively trading in the markets.
U.S. Government agency mortgage-backed securities. The Company’s agency mortgage-backed securities generally include fixed-rate agency mortgage-backed pools and adjustable-rate agency mortgage-backed pools.
Fixed-rate agency mortgage-backed pools are evaluated based on spreads to actively traded To-Be-Announced (“TBA”) and seasoned securities, the pricing of which is provided by inter-dealer brokers, broker dealers and other contributing firms active in trading the security class. Further delineation is made by weighted average coupon (“WAC”) and weighted average maturity (“WAM”) with spreads on individual securities relative to actively traded securities as determined and quality controlled using OAS valuations.
Adjustable-rate agency mortgage-backed pools are evaluated on a bond equivalent effective margin (“BEEM”) basis obtained from broker dealers and other contributing firms active in the market. BEEM levels are established for key sectors using characteristics such as month-to-roll, index, periodic and life caps and index margins and convertibility. Individual securities are then evaluated based on how their characteristics map to the sectors established.
Agency collateralized mortgage obligations (“CMOs”) are evaluated based on nominal spread and OAS values of securities with comparable tranche type, average life, average life variance and prepayment characteristics of the underlying collateral.
Other mortgage-backed securities. The Company’s other mortgage-backed securities consist of whole loan, non-agency CMOs. These securities are evaluated based on generic tranche and generic prepayment speed estimates of various types of collateral from contributing firms and broker/dealers in the whole loan CMO market.
State and municipal obligations. These securities are evaluated using information on identical or similar securities provided by market makers, broker/dealers and buy-side firms, new issue sales and bid-wanted lists. The individual securities are then priced based on mapping the characteristics of the security such as obligation type (general obligation, revenue, etc.), maturity, state discount and premiums, call features, taxability and other considerations.
72
Corporate bonds. The fair value measurements for corporate bonds consider observable data that may include dealer quotes, market spreads, cash flows, the U.S. Treasury yield curve, live trading levels, trade execution data, market consensus prepayment speeds, credit quality information and the bond’s terms and conditions, among other things. If relevant and observable prices are available, those valuations would be classified as Level 2. If prices are not available, other valuation techniques would be used and the item would be classified as Level 3.
Residential mortgage loans held-for-sale. Effective July 1, 2012, the Company’s residential mortgage loans held-for-sale were recorded at fair value utilizing Level 2 measurements. This fair value measurement is determined based upon third party quotes obtained on similar loans. The Company adopted the fair value option on these loans as it believes the fair value measurement of such loans reduces certain timing differences in the Company’s financial statements and better aligns with the management of the portfolio from a business perspective. The fair value option allows the Company to record the mortgage loans held-for-sale portfolio at fair market value as opposed to the lower of cost or market. The adoption of this accounting election resulted in an increase of $2.1 million in gain on sale of loans in the consolidated statements of operations for the year ended December 31, 2012. The Company economically hedges its residential loans held for sale portfolio with forward sale agreements which are reported at fair value. A lower of cost or market accounting treatment would not allow the Company to record the excess of the fair market value over book value but would require the Company to record the corresponding reduction in value on the hedges. Both the loans and related hedges are carried at fair value which reduces earnings volatility as the amounts more closely offset, particularly in environments when interest rates are declining. For loans held-for-sale for which the fair value option has been elected, the aggregate fair value exceeded the aggregate principal balance by $2.1 million as of December 31, 2012. There were no residential mortgage loans held-for-sale that were nonaccrual or 90 or more days past due as of December 31, 2012 or December 31, 2011. Interest income on these loans is recognized in interest and fees on loans in the consolidated statements of operations.
Interest rate swaps. The Company’s interest rate swaps, including fair value interest rate swaps and small exposures in interest rate caps and floors, are reported at fair value utilizing models provided by an independent third-party and observable market data. When entering into an interest rate swap agreement, the Company is exposed to fair value changes due to interest rate movements, and also the potential nonperformance of its contract counterparty. Interest rate swaps are evaluated based on a zero coupon LIBOR curve created from readily observable data on LIBOR, interest rate futures and the interest rate swap markets. The zero coupon curve is used to discount the projected cash flows on each individual interest rate swap. In addition, the Company has developed a methodology to value the nonperformance risk based on internal credit risk metrics and the unique characteristics of derivative instruments, which include notional exposure rather than principal at risk and interest payment netting. The results of this methodology are used to adjust the base fair value of the instrument for the potential counterparty credit risk. Interest rate caps and floors are evaluated using industry standard options pricing models and observed market data on LIBOR and Eurodollar option and cap/floor volatilities.
Level 3 Valuation Techniques and Inputs
Trust preferred securities. The trust preferred securities are evaluated based on whether the security is an obligation of a single issuer or part of a securitization pool. For single issuer obligations, the Company uses present value cash flow models which incorporate the contractual cash flow for each issue adjusted as necessary for any potential changes in amount or timing of cash flows. The cash flow model of a pooled issue incorporates anticipated loss rates and severities of the underlying collateral as well as credit support provided within the securitization. At least quarterly, the Company’s Treasury personnel review the modeling assumptions and the discount and forward rates. Changes in these assumptions could potentially have a significant impact on the fair value of the trust preferred securities. The cash flow model for the pooled issue owned by the Company at December 31, 2012 assumes no recovery on defaulted collateral, no recovery on securities in deferral and an additional 3.6% future default rate assumption on the remaining performing collateral every three years with no recovery rate.
For trust preferred securities, projected cash flows are discounted at a rate based on a trading group of similar securities quoted on the New York Stock Exchange (“NYSE”) or over-the-counter markets which is reviewed for market data points such as credit rating, maturity, price and liquidity. The Company indexes the market securities to a comparable maturity interest rate swap to determine the market spread, which is then used as the discount rate in the cash flow models. As of the reporting date, those market spreads were 6.0% for the pooled security and 10.0% for the single issuer that is currently deferring interest payments. An increase or decrease of 3% in the discount rate on the pooled issue would result in a decrease of $1.3 million or an increase of $2.2 million in the security fair value, respectively. An increase or decrease of 3% in the discount rate on the single issuer would result in a decrease of $407 thousand or an increase of $649 thousand in the security fair value, respectively.
Interest rate lock commitments on residential mortgages.The determination of the fair value of interest rate lock commitments is based on agreed upon pricing with the respective investor on each loan and includes a pull through percentage. The pull through percentage represents an estimate of loans in the pipeline to be delivered to an investor versus the total loans committed for delivery. Significant changes in this input could result in a significantly higher or lower fair value measurement. As the pull through percentage is a significant unobservable input, this is deemed a Level 3 valuation input. The pull through percentage, which is based upon historical experience, was 70% as of December 31, 2012. An increase or decrease of 20% in the pull through assumption would result in a positive or negative change of $236 thousand in the fair value of interest rate lock commitments. The fair value of interest rate lock commitments was $847 thousand at December 31, 2012.
73
The following provides details of the Level 3 fair value measurement activity for the years ended December 31, 2012 and 2011:
FAIR VALUE MEASUREMENTS USING SIGNIFICANT UNOBSERVABLE INPUTS – LEVEL 3
TRUST PREFERRED SECURITIES
| | | | | | | | |
For the Years Ended December 31, | | 2012 | | | 2011 | |
Balance, beginning of year | | $ | 4,908 | | | $ | 5,642 | |
Total gains (losses), realized/unrealized: | | | | | | | | |
Included in earnings (1) | | | — | | | | (250 | ) |
Included in accumulated other comprehensive income (loss) | | | 974 | | | | (484 | ) |
Purchases | | | — | | | | — | |
Maturities | | | — | | | | — | |
Prepayments | | | — | | | | — | |
Calls | | | — | | | | — | |
Transfers into Level 3 | | | — | | | | — | |
| | | | | | | | |
Balance, end of year | | $ | 5,882 | | | $ | 4,908 | |
| | | | | | | | |
| (1) | Amount included in net impairment losses on available for sale securities of the consolidated statements of operations. |
FAIR VALUE MEASUREMENTS USING SIGNIFICANT UNOBSERVABLE INPUTS – LEVEL 3
INTEREST RATE LOCK COMMITMENTS ON RESIDENTIAL MORTGAGES
| | | | | | | | |
For the Years Ended December 31, | | 2012 | | | 2011 | |
Balance, beginning of year | | $ | — | | | $ | — | |
Total gains (losses), realized/unrealized: | | | | | | | | |
Included in other income | | | 847 | | | | — | |
Included in accumulated other comprehensive income (loss) | | | — | | | | — | |
Transfers into Level 3 | | | — | | | | — | |
| | | | | | | | |
Balance, end of year | | $ | 847 | | | | — | |
| | | | | | | | |
Certain assets are measured at fair value on a non-recurring basis; that is, the instruments are not measured at fair value on an ongoing basis, but are subject to fair value adjustments in certain circumstances (for example, when there is evidence of impairment). The Company measures commercial real estate loans, impaired loans, SBA servicing assets, restricted equity investments and loans or bank properties transferred into other real estate owned at fair value on a non-recurring basis. At December 31, 2012 and 2011, these assets were valued in accordance with GAAP and the following table summarizes these assets requiring fair value disclosure under the provisions of FASB ASC 820.
SUMMARY OF NON-RECURRING FAIR VALUE MEASUREMENTS
| | | | | | | | | | | | | | | | | | | | |
| | | | | | Category Used for Fair Value
Measurement | | | Total (Losses) Gains Or Changes in Net Assets | |
| | | Total | | | Level 1 | | | Level 2 | | | Level 3 | | | | |
December 31, 2012 | | | | | | | | | | | | | | | | | | | | |
Assets: | | | | | | | | | | | | | | | | | | | | |
Impaired loans | | $ | 75,550 | | | $ | — | | | $ | — | | | $ | 75,550 | | | $ | (33,105 | ) |
Commercial real estate loans held-for-sale | | | 21,922 | | | | — | | | | 21,922 | | | | — | | | | (5,890 | ) |
Real estate owned | | | 1,881 | | | | — | | | | — | | | | 1,881 | | | | (1,322 | ) |
SBA servicing asset | | | 389 | | | | — | | | | — | | | | 389 | | | | (95 | ) |
| | | | | |
December 31, 2011 | | | | | | | | | | | | | | | | | | | | |
Assets: | | | | | | | | | | | | | | | | | | | | |
Impaired loans | | $ | 82,031 | | | $ | — | | | $ | — | | | $ | 82,031 | | | $ | (90,390 | ) |
Real estate owned | | | 2,272 | | | | — | | | | — | | | | 2,272 | | | | (666 | ) |
Under FASB ASC 310, collateral dependent impaired loans are based on the fair value of the underlying collateral which is based on appraisals. It is the policy of the Company to obtain a current appraisal or evaluation when a loan has been identified as non-performing. The type of appraisal obtained will be commensurate with the size and complexity of the loan. The resulting value will be adjusted for the potential cost of liquidation. New appraisals are obtained on an annual basis, at a minimum, until the loan is repaid in full, liquidated or returns to performing status.
74
While the loan policy dictates that a loan be assigned to the special assets department when it is downgraded to classified, there is a need for loan officers to consistently and accurately determine collateral values when a loan is initially designated as criticized or classified. The most effective means of determining the fair value of real estate collateral at a point in time is by obtaining a current appraisal or evaluation of the property. In anticipation of the receipt of a current appraisal or evaluation, the Company has provided for an alternative and interim means of determining the fair value of the real estate collateral.
The most recent appraised or reported value of the collateral securing a loan, net of a discount, is the Company’s basis for determining fair value. The discount is based on the age of the existing appraisal or evaluation and on the nature of the property. Values developed from the discounting of real estate and equipment collateral will be subject to a further 10% discount for the cost of liquidation based on the net value of the collateral.
The following steps are taken to determine the fair value of commercial real estate securing a loan that will be potentially subject to impairment:
| | |
Loan Category Used for Impairment Review | | Method of Determining the Value |
Loans less than $1 million | | Evaluation or restricted use appraisal |
| |
Loans $1 million or greater | | |
Existing appraisal 18 months or less | | Restricted use appraisal |
Existing appraisal greater than 18 months | | Summary form appraisal |
| |
Commercial loans secured primarily by residential real estate | | |
Loans less than $1 million | | Automated valuation model |
Loans $1 million or greater | | Summary form appraisal |
Non-commercial loans secured primarily by residential real estate | | |
Loans less than $250,000 Loans $250,000 or greater | | Automated valuation model or Summary form appraisal Summary form appraisal |
An evaluation report, as defined by the OCC, is a written report prepared by an appraiser that describes the real estate collateral, its condition, current and projected uses and sources of information used in the analysis, and provides an estimate of value in situations when an appraisal is not required.
A restricted use appraisal report is defined as a written report prepared under the Uniform Standards of Professional Appraisal Practice (“USPAP”). A restricted use appraisal is for the Company’s use only and contains a brief statement of information significant to the solution of the appraisal problem. This report can be used for ongoing collateral monitoring.
A summary form appraisal report is defined as a written report prepared under the USPAP which contains a detailed summary of all information significant to the solution of the appraisal problem. This report is more detailed than a restricted use report and provides sufficient information to enable the user to understand the rationale for the opinions and conclusions in the report.
An automated valuation model is an internal computer program that estimates a property’s market value based on market, economic, and demographic factors.
On a quarterly basis, or more frequently as necessary, the Company will review the circumstances of each collateral dependent loan and real estate owned property. A collateral dependent loan is defined as one that relies solely on the operation or the sale of the collateral for repayment. Adjustments to any specific reserve relating to a collateral shortfall, as compared to the outstanding loan balance, will be made if justified by appraisals, market conditions or current events concerning the credit.
All appraisals received which are utilized to determine valuations for criticized and classified loans or properties placed in real estate owned are provided under an “as is value”. Partially charged off loans are measured for impairment upon receipt of an updated appraisal based on the relationship between the remaining balance of the charged down loan and the discounted appraised value. Such loans will remain on non-accrual status unless performance by the borrower warrants a return to accrual status. Recognition of non-accrual status occurs at the time a loan can no longer support principal and interest payments in accordance with the original terms and conditions of the loan documents. When impairment is determined, a specific reserve reflecting any calculated shortfall between the
75
value of the collateral and the outstanding balance of the loan is recorded. Subsequent adjustments, prior to receipt of a new appraisal, to any specific reserve relating will be made if justified by market conditions or current events concerning the credit. If an internal discount-based evaluation is being used, the discount percentage may be adjusted to reflect market changes, changes to the collateral value of similar credits or circumstances of the individual credit itself. The amount of charge off is determined by calculating the difference between the current loan balance and the current collateral valuation, plus estimated cost to liquidate.
Impaired loan fair value measurements are based upon unobservable inputs, and therefore, are categorized as a Level 3 measurement. Specific reserves were calculated for impaired loans with an aggregate carrying amount of $5.8 million and $24.1 million at December 31, 2012 and 2011, respectively. The collateral underlying these loans had a fair value of $4.8 million and $18.7 million, including a specific reserve in the allowance for loan losses of $1.0 million and $5.4 million at December 31, 2012 and 2011, respectively. There were charge-offs of $2.0 million and $20.6 million during the years ended December 31, 2012 and 2011, respectively. No specific reserve was calculated for impaired loans with an aggregate carrying amount of $70.8 million and $63.3 million at December 31, 2012 and 2011, respectively, as the underlying collateral was not below the carrying amount; however, these loans did include charge-offs of $30.1 million and $64.4 million during the years ended December 31, 2012 and 2011, respectively.
Once a loan is determined to be uncollectible, the underlying collateral is repossessed and reclassified as real estate owned. The balance of other real estate owned also includes bank properties transferred from operations. These assets are carried at lower of cost or fair value of the collateral, less cost to sell. In some cases, adjustments are made to the appraised values for various factors including age of the appraisal, age of comparable properties included in the appraisal, and known changes in the market and the collateral. During the year ended December 31, 2012, the Company recorded a decrease in fair value of $733 thousand on six bank properties, $439 thousand on six commercial properties, and $149 thousand on four residential properties. During the year ended December 31, 2011, the Company recorded a decrease in fair value of $406 thousand on five bank properties and $260 thousand on two commercial properties. The adjustments to the bank, commercial, and residential properties were based upon unobservable inputs, and therefore categorized as Level 3 measurements.Total real estate owned measured at fair value at December 31, 2012 and 2011 was $1.9 million and $2.3 million, respectively.
From time to time, the Company may identify commercial loans which it intends to sell to a third-party. The Company signed a definitive agreement on January 17, 2013 to sell $45.8 million of loans, having a book balance of $35.1 million, to a third-party investor for gross proceeds of $21.9 million. As the formal approval to sell these loans occurred during 2012, the related loans were transferred to held-for-sale as of December 31, 2012 at lower of cost or estimated fair value. The estimated fair value was determined based upon the agreed upon sales price with the third-party purchaser, which is considered a Level 2 input and resulted in a net loss of $5.9 million upon transfer to loans held-for-sale.
The SBA servicing assets are reviewed for impairment in accordance with FASB ASC 860, Transfers and Servicing . Because loans are sold individually and not pooled, the Company does not stratify groups of loans based on risk characteristics for purposes of measuring impairment. The Company measures the SBA servicing assets by estimating the present value of expected future cash flows for each servicing asset, based on their unique characteristics and market-based prepayment assumptions. This is a Level 3 input. A valuation allowance is recorded for the amount by which the carrying amount of the servicing asset exceeds the calculated fair value. The Company had a valuation allowance of $118 thousand and $23 thousand on its SBA servicing assets at December 31, 2012 and 2011, respectively.
In accordance with ASC 825-10-50-10, Fair Value of Financial Instruments, the Company is required to disclose the fair value of its financial instruments. The fair value of a financial instrument is the current amount that would be exchanged between willing parties, other than in a distressed sale. Fair value is best determined using observable market prices; however, for many of the Company’s financial instruments, no quoted market prices are readily available. In instances where quoted market prices are not readily available, fair value is determined using cash flow models or other techniques appropriate for the particular instrument. These techniques involve some degree of judgment and, as a result, are not necessarily indicative of the amounts the Company would realize in a current market exchange. Utilizing different assumptions or estimation techniques may have a material effect on the estimated fair value.
CARRYING AMOUNTS AND ESTIMATED FAIR VALUES OF FINANCIAL ASSETS AND LIABILITIES
| | | | | | | | | | | | | | | | |
December 31, | | 2012 | | | 2011 | |
| | | Carrying
Amount | | | Estimated
Fair Value | | | Carrying
Amount | | | Estimated
Fair Value | |
Assets: | | | | | | | | | | | | | | | | |
Cash and due from banks | | $ | 77,564 | | | $ | 77,564 | | | $ | 68,773 | | | $ | 68,773 | |
Interest-earning bank balances | | | 92,052 | | | | 92,052 | | | | 51,049 | | | | 51,049 | |
Investment securities available for sale | | | 443,182 | | | | 443,182 | | | | 515,545 | | | | 515,545 | |
Investment securities held to maturity | | | 912 | | | | 960 | | | | 1,344 | | | | 1,413 | |
Loans receivable, net | | | 2,203,307 | | | | 2,055,025 | | | | 2,215,785 | | | | 2,031,013 | |
Loans held-for-sale | | | 123,005 | | | | 123,005 | | | | 23,192 | | | | 23,287 | |
Hedged commercial loans (1) | | | 26,980 | | | | 30,477 | | | | 33,670 | | | | 38,148 | |
Restricted equity investments | | | 17,886 | | | | 17,886 | | | | 15,826 | | | | 15,826 | |
Interest rate lock commitments on residential mortgages | | | 847 | | | | 847 | | | | — | | | | — | |
Interest rate swaps | | | 40,594 | | | | 40,594 | | | | 50,355 | | | | 50,355 | |
Interest rate floor | | | 275 | | | | 275 | | | | 360 | | | | 360 | |
| | | | |
Liabilities: | | | | | | | | | | | | | | | | |
Demand deposits | | | 1,751,183 | | | | 1,729,671 | | | | 1,772,386 | | | | 1,797,554 | |
Savings deposits | | | 264,155 | | | | 262,636 | | | | 262,044 | | | | 264,469 | |
Time deposits | | | 697,886 | | | | 695,093 | | | | 633,547 | | | | 638,036 | |
Securities sold under agreements to repurchase – customers | | | 1,968 | | | | 1,968 | | | | 5,668 | | | | 5,668 | |
Advances from FHLBNY | | | 61,415 | | | | 62,784 | | | | 2,733 | | | | 3,017 | |
Securities sold under agreements to repurchase – FHLBNY | | | — | | | | — | | | | 15,000 | | | | 15,382 | |
Junior subordinated debentures | | | 92,786 | | | | 57,072 | | | | 92,786 | | | | 46,973 | |
Fair value interest rate swaps | | | 3,503 | | | | 3,503 | | | | 4,489 | | | | 4,489 | |
Interest rate swaps | | | 40,646 | | | | 40,646 | | | | 50,462 | | | | 50,462 | |
Interest rate floor | | | 275 | | | | 275 | | | | 360 | | | | 360 | |
| (1) | Includes positive market value adjustment of $3.5 million and $4.5 million at December 31, 2012 and December 31, 2011, respectively, which is equal to the change in value of related interest rate swaps designated as fair value hedges of these hedged loans in accordance with FASB ASC 815. |
76
Cash and cash equivalents. For cash and cash equivalents, the carrying amount is a reasonable estimate of fair value. This is a Level 1 fair value input.
Investment securities. For investment securities, fair values are based on a combination of quoted prices for identical assets in active markets, quoted prices for similar assets in markets that are either actively or not actively traded and pricing models, discounted cash flow methodologies, or similar techniques that may contain unobservable inputs that are supported by little or no market activity and require significant judgment. The fair value of held-to-maturity securities is measured utilizing Level 2 inputs.
Loans receivable. The fair value of loans receivable is estimated using a discounted cash flow analysis. Projected future cash flows are calculated using loan characteristics, and assumptions of voluntary and involuntary prepayment speeds. For performing loans Level 2 inputs are utilized as the cash flow analysis is performed using available data on the performance of similar loans. Projected cash flows are prepared using discount rates believed to represent current market rates. For non-performing loans, the cash flow assumptions are considered Level 3 inputs as market data is not readily available.
Loans held-for-sale.Loans held-for-sale includes residential mortgage loans that are originated with the intent to sell. At December 31, 2012, these loans were recorded at fair value as the Company elected the fair value option under FASB 825, effective July 1, 2012. At December 31, 2011, loans held-for-sale were recorded at the lower of amortized cost or fair value. The fair value of loans held-for-sale is valued using the quoted market price of such loans, which is a Level 2 input. At December 31, 2012, loans held-for-sale also included $21.9 million of commercial real estate loans recorded at lower of cost or estimated fair value for which the fair value was determined based upon the agreed upon sales price with the third-party purchaser.
Hedged commercial loans. The hedged commercial loans are one component of a declared hedging relationship as defined under FASB ASC 815. The Interest Rate Swap component of the declared hedging relationship is carried at their fair value and the carrying value of the commercial loans includes a similar change in fair values. The fair value of these loans is measured utilizing Level 2 inputs.
Restricted equity securities. Ownership in equity securities of FRB, FHLBNY, and Atlantic Central Bankers Bank is restricted and there is no established market for their resale. The carrying amount is a reasonable estimate of fair value. As these securities are readily marketable, the fair value is based on Level 2 inputs.
Interest rate lock commitments on residential mortgages. The fair value of interest rate lock commitments is estimated using pricing from existing purchase commitments on each loan in the pipeline. This value is adjusted for a pull through estimate which is determined based on historical experience with loan deliveries from the residential mortgage pipeline. As this estimate is unobservable and can result in significant fluctuation in the fair value determination, this is considered a Level 3 input under the fair value hierarchy.
77
Interest rate swaps/floors and fair value interest rate swaps. The Company’s derivative financial instruments are not exchange-traded and therefore are valued utilizing models with the primary input being readily observable market parameters, specifically the LIBOR swap curve. In addition, the Company incorporates a qualitative fair value adjustment related to credit quality variations between counterparties as required by FASB ASC 820. This is a Level 2 input.
Demand deposits, savings deposits and time deposits. The fair value of demand deposits and savings deposits is determined by projecting future cash flows using an estimated economic life based on account characteristics, a Level 2 input. The resulting cash flow is discounted using rates available on alternative funding sources. The fair value of time deposits is estimated using the rate and maturity characteristics of the deposits to estimate their cash flow. This cash flow is discounted at rates for similar term wholesale funding.
Securities sold under agreements to repurchase - customer. The fair value is estimated to be the amount payable at the reporting date. This is considered a Level 2 input.
Securities sold under agreements to repurchase – FHLBNY and FHLBNY advances. The fair value is estimated through Level 2 inputs by determining the cost or benefit for early termination of the individual borrowing.
Junior subordinated debentures. The fair value was estimated by discounting approximate cash flows of the borrowings by yields estimating the fair value of similar issues. The valuation model considers current market spreads known and anticipated credit losses of the underlying collateral, term and reinvestment period and market transactions of similar issues, if available. This is a Level 3 input under the fair value hierarchy.
The fair value estimates presented herein are based on pertinent information available to management as of December 31, 2012 and 2011. Although management is not aware of any factors that would significantly affect the estimated fair value amounts, such amounts have not been comprehensively revalued for purposes of these consolidated financial statements since those dates and, therefore, current estimates of fair value may differ significantly from the amount presented herein.
25. RELATED PARTY TRANSCATIONS
Certain officers, directors and their associates (related parties) have loans and conduct other transactions with the Company. Such transactions are made on substantially the same terms, including interest rates and collateral, as those prevailing at the time for other non-related party transactions. Related party activity for the years ended December 31, 2012 and 2011 is summarized as follows:
SUMMARY OF LOANS TO RELATED PARTIES
| | | | | | | | |
At or for the Years Ended December 31, | | 2012 | | | 2011 | |
Balance, beginning of year | | $ | 57,753 | | | $ | 68,259 | |
Additions | | | 5,947 | | | | 5,980 | |
Repayments | | | (5,879 | ) | | | (16,486 | ) |
| | | | | | | | |
Balance, end of year | | $ | 57,821 | | | $ | 57,753 | |
| | | | | | | | |
Interest income earned on related party loans was $2.0 million and $1.7 million for the years ended December 31, 2012 and 2011, respectively.
Certain office space of the Company is leased from companies affiliated with the Chairman of the Company’s Board of Directors under separate agreements with the Company. Terms of these three agreements at December 31, 2012 are as follows:
SUMMARY OF LEASES WITH AFFILIATES TO THE CHAIRMAN OF THE BOARD OF DIRECTORS
| | | | | | | | |
December 31, 2012 | | Annual
Rental
Payment | | | Renewal Option
Remaining | | Annual
Rental
Increases |
Expiration date: | | | | | | | | |
October 2027 | | $ | 1,136 | | | 2 five-year terms | | CPI |
August 2025 (1) | | | 506 | | | 4 five-year terms | | Fixed |
June 2029 (2) | | | 269 | | | 4 five-year terms | | CPI |
| (1) | This lease is recorded as a $4.7 million obligation under capital lease at December 31, 2012. |
| (2) | This lease is recorded as a $2.9 million obligation under capital lease at December 31, 2012. |
78
Certain office space of the Company is leased from companies affiliated with certain Directors under separate agreements with the Company. Terms of these two agreements at December 31, 2012 are as follows:
SUMMARY OF LEASES WITH AFFILIATES TO THE DIRECTORS
| | | | | | | | |
December 31, 2012 | | Annual
Rental
Payment | | | Renewal Option
Remaining | | Annual
Rental
Increases |
Expiration date: | | | | | | | | |
January 2017 | | $ | 167 | | | 1 five-year terms | | Fixed |
January 2027 | | | 174 | | | 4 five-year terms | | Fixed |
The Company believes that each of the related party transactions described above were on terms as fair to the Company as could have been obtained from unaffiliated third parties.
26. CONDENSED FINANCIAL INFORMATION OF PARENT COMPANY
The condensed financial statements of Sun Bancorp, Inc. are as follows:
CONDENSED STATEMENTS OF FINANCIAL CONDITION
| | | | | | | | |
December 31, | | 2012 | | | 2011 | |
Assets: | | | | | | | | |
Cash and due from banks | | $ | 17,962 | | | $ | 47,614 | |
Investments in subsidiaries: | | | | | | | | |
Bank subsidiaries | | | 334,584 | | | | 352,333 | |
Non-bank subsidiaries | | | 2,786 | | | | 2,786 | |
Accrued interest receivable and other assets | | | 2,040 | | | | 1,302 | |
| | | | | | | | |
Total assets | | $ | 357,372 | | | $ | 404,035 | |
| | | | | | | | |
Liabilities and Shareholders’ Equity: | | | | | | | | |
Liabilities | | | | | | | | |
Junior subordinated debentures | | $ | 92,786 | | | $ | 92,786 | |
Other liabilities | | | 1,991 | | | | 2,166 | |
| | | | | | | | |
Total liabilities | | | 94,777 | | | | 94,952 | |
Shareholders’ equity | | | 262,595 | | | | 309,083 | |
| | | | | | | | |
Total liabilities and shareholders’ equity | | $ | 357,372 | | | $ | 404,035 | |
| | | | | | | | |
CONDENSED STATEMENTS OF OPERATIONS
| | | | | | | | | | | | |
Years Ended December 31, | | 2012 | | | 2011 | | | 2010 | |
Interest expense | | $ | (2,594 | ) | | $ | (2,997 | ) | | $ | (4,117 | ) |
Management fee | | | 3,438 | | | | 5,172 | | | | 6,936 | |
Other expenses | | | (3,791 | ) | | | (5,054 | ) | | | (6,734 | ) |
| | | | | | | | | | | | |
Loss before equity in undistributed loss of subsidiaries and income tax benefit | | | (2,947 | ) | | | (2,879 | ) | | | (3,915 | ) |
Equity in undistributed loss of subsidiaries | | | (48,560 | ) | | | (65,614 | ) | | | (182,850 | ) |
Income tax benefit | | | 1,016 | | | | 988 | | | | 1,347 | |
| | | | | | | | | | | | |
Net loss available to common shareholders | | $ | (50,491 | ) | | $ | (67,505 | ) | | $ | (185,418 | ) |
| | | | | | | | | | | | |
79
CONDENSED STATEMENTS OF CASH FLOWS
| | | | | | | | | | | | |
Years Ended December 31, | | 2012 | | | 2011 | | | 2010 | |
Operating activities: | | | | | | | | | | | | |
Net loss | | $ | (50,491 | ) | | $ | (67,505 | ) | | $ | (185,418 | ) |
Adjustments to reconcile net (loss) income to net cash used in operating activities: | | | | | | | | | | | | |
Undistributed loss of subsidiaries | | | 48,561 | | | | 65,614 | | | | 182,849 | |
Stock-based compensation | | | (75 | ) | | | 110 | | | | 2,612 | |
Change in assets and liabilities which provided (used) cash: | | | | | | | | | | | | |
Accrued interest receivable and other assets | | | (1,024 | ) | | | 498 | | | | (61 | ) |
Accounts payable and other liabilities | | | (235 | ) | | | 291 | | | | 555 | |
| | | | | | | | | | | | |
Net cash (used in) provided by operating activities | | | (3,264 | ) | | | (992 | ) | | | 537 | |
| | | | | | | | | | | | |
Investing activities: | | | | | | | | | | | | |
Payments for investments in and advances to subsidiaries | | | (28,000 | ) | | | (64,000 | ) | | | (103,173 | ) |
Net cash used in investing activities | | | (28,000 | ) | | | (64,000 | ) | | | (103,173 | ) |
| | | | | | | | | | | | |
Financing activities: | | | | | | | | | | | | |
Proceeds from issuance of preferred stock and warrant | | | — | | | | — | | | | 88,009 | |
Redemption of preferred stock | | | — | | | | — | | | | (88,009 | ) |
Preferred stock issuance costs | | | — | | | | — | | | | (7,495 | ) |
Proceeds from issuance of common stock | | | 1,612 | | | | 100,077 | | | | 106,839 | |
Net cash provided by financing activities | | | 1,612 | | | | 100,077 | | | | 99,344 | |
| | | | | | | | | | | | |
Net (decrease) increase in cash | | | (29,652 | ) | | | 35,085 | | | | (3,292 | ) |
Cash, beginning of year | | | 47,614 | | | | 12,529 | | | | 15,821 | |
| | | | | | | | | | | | |
Cash, end of year | | $ | 17,962 | | | $ | 47,614 | | | $ | 12,529 | |
| | | | | | | | | | | | |
* * * * * *
80
SUMMARIZED QUARTERLY FINANCIAL DATA (UNAUDITED)
The following table presents summarized quarterly data for 2012 and 2011 (amounts are in thousands, except per share amounts).
QUARTERLY DATA
| | | | | | | | | | | | | | | | |
Three Months Ended | | December 31, | | | September 30, | | | June 30, | | | March 31, | |
2012 | | | | | | | | | | | | | | | | |
Interest income | | $ | 28,155 | | | $ | 28,469 | | | $ | 29,402 | | | $ | 29,407 | |
Interest expense | | | 4,174 | | | | 4,135 | | | | 4,519 | | | | 4,757 | |
| | | | | | | | | | | | | | | | |
Net interest income | | | 23,981 | | | | 24,334 | | | | 24,883 | | | | 24,650 | |
Provision for loan losses | | | 24,154 | | | | 1,868 | | | | 510 | | | | 30,683 | |
Non-interest income | | | 6,816 | | | | 9,588 | | | | 7,527 | | | | 5,519 | |
Non-interest expense | | | 31,597 | | | | 30,860 | | | | 30,587 | | | | 27,564 | |
| | | | | | | | | | | | | | | | |
(Loss) income before income taxes | | | (24,954 | ) | | | 1,194 | | | | 1,313 | | | | (28,078 | ) |
Income tax expense (benefit) | | | — | | | | (34 | ) | | | — | | | | — | |
| | | | | | | | | | | | | | | | |
Net (loss) income available to common shareholders | | $ | (24,954 | ) | | | 1,228 | | | | 1,313 | | | | (28,078 | ) |
| | | | | | | | | | | | | | | | |
Loss per common share – basic | | $ | (0.29 | ) | | $ | 0.01 | | | $ | 0.02 | | | $ | (0.33 | ) |
Loss per common share—diluted | | $ | (0.29 | ) | | $ | 0.01 | | | $ | 0.02 | | | $ | (0.33 | ) |
2011 | | | | | | | | | | | | | | | | |
Interest income | | $ | 30,816 | | | $ | 31,510 | | | $ | 32,305 | | | $ | 32,049 | |
Interest expense | | | 5,087 | | | | 5,329 | | | | 5,813 | | | | 6,923 | |
| | | | | | | | | | | | | | | | |
Net interest income | | | 25,729 | | | | 26,181 | | | | 26,492 | | | | 25,126 | |
Provision for loan losses | | | 6,826 | | | | 2,321 | | | | 4,836 | | | | 60,283 | |
Non-interest income (loss)(1) | | | 6,804 | | | | 5,770 | | | | 4,993 | | | | (4,099 | ) |
Non-interest expense | | | 27,226 | | | | 26,973 | | | | 28,244 | | | | 27,782 | |
| | | | | | | | | | | | | | | | |
(Loss) income before income taxes | | | (1,519 | ) | | | 2,657 | | | | (1,595 | ) | | | (67,038 | ) |
Income tax expense (benefit) | | | — | | | | (23 | ) | | | 4 | | | | 29 | |
| | | | | | | | | | | | | | | | |
Net (loss) income available to common shareholders | | $ | (1,519 | ) | | | 2,680 | | | | (1,599 | ) | | | (67,067 | ) |
| | | | | | | | | | | | | | | | |
Loss per common share – basic | | $ | (.02 | ) | | $ | .03 | | | $ | (.02 | ) | | $ | (1.25 | ) |
Loss per common share—diluted | | $ | (.02 | ) | | $ | .03 | | | $ | (.02 | ) | | $ | (1.25 | ) |
| (1) | During the fourth quarter of 2012, the $24.2 million of provision for loan losses recorded by the Company included $6.7 million relating to accelerated resolutions of three non-performing commercial real estate relationships, $5.9 million for the transfer of commercial real estate loans to held-for sale and $4.3 million for additional reserves required from the impact of Hurricane Sandy. |
| (2) | During the first quarter 2011, the Company recognized negative fair value credit adjustments of $8.4 million and a pre-tax OTTI charge of $250 thousand on a single-issuer trust preferred security. |
Basic and diluted loss per share are computed independently for each of the quarters presented. Consequently, the sum of the quarters may not equal the annual loss per share.
COMMON STOCK PRICE RANGE AND DIVIDENDS (UNAUDITED)
Shares of the Company’s common stock are quoted on the NASDAQ Global Select Market under the symbol “SNBC”. The following table sets forth the high and low sale prices (adjusted for stock dividends) for the common stock for the calendar quarters indicated, as published by the NASDAQ Stock Market.
81
COMMON STOCK PRICE RANGE
| | | | | | | | |
| | | High | | | Low | |
2012 | | | | | | | | |
Fourth Quarter | | $ | 3.55 | | | $ | 2.80 | |
Third Quarter | | $ | 3.39 | | | $ | 2.56 | |
Second Quarter | | $ | 3.62 | | | $ | 2.21 | |
First Quarter | | $ | 3.69 | | | $ | 2.40 | |
2011 | | | | | | | | |
Fourth Quarter | | $ | 3.17 | | | $ | 2.18 | |
Third Quarter | | $ | 3.80 | | | $ | 2.33 | |
Second Quarter | | $ | 3.96 | | | $ | 3.25 | |
First Quarter | | $ | 4.95 | | | $ | 3.05 | |
There were 926 holders of record of the Company’s common stock as of March 8, 2013. This number does not reflect the number of persons or entities who held stock in nominee or “street” name through various brokerage firms. At March 8, 2013, there were 86,258,106 shares of the Company’s common stock outstanding.
To date, the Company has not paid cash dividends on its common stock. Future declarations of dividends by the Board of Directors would depend upon a number of factors, including the Company’s and the Bank’s financial condition and results of operations, investment opportunities available to the Company or the Bank, approval of the OCC, capital requirements, regulatory limitations, tax considerations, the amount of net proceeds retained by the Company and general economic conditions. No assurances can be given that any dividends will be paid or, if payment is made, will continue to be paid.
The ability of the Bank to pay dividends to the Company is controlled by certain regulatory restrictions. Generally, dividends declared in a given year by a national bank are limited to its net profit, as defined by regulatory agencies, for that year, combined with its retained net income for the preceding two years, less any required transfer to surplus or to fund for the retirement of any preferred stock. In addition, a national bank may not pay any dividends in an amount greater than its undivided profits and a national bank may not declare any dividends if such declaration would leave the bank inadequately capitalized. Therefore, the ability of the Bank to declare dividends will depend on its future net income and capital requirements. Also, banking regulators have indicated that national banks should generally pay dividends only out of current operating earnings. Further, per the OCC Agreement, a dividend may only be declared if it is in accordance with the approved capital plan, the Bank remains in compliance with the capital plan following the payment of the dividend and the dividend is approved by the OCC. As a result of these restrictions, the amount available for payment of dividends to the Company by the Bank totaled $0 at December 31, 2012.
STOCK PERFORMANCE (UNAUDITED)
The following table provides a stock performance graph comparing cumulative total shareholders return on the Common Stock with (a) the cumulative total shareholder return on stocks of all U.S. companies that trade on the NASDAQ Stock Market and (b) the cumulative total shareholder return on stocks included in the NASDAQ Bank index, as prepared for the NASDAQ by the Center for Research in Security Prices (“CRSP”) at the University of Chicago. All investment comparisons assume the investment of $100 at December 31, 2007. The cumulative returns for the NASDAQ Stock Market and the NASDAQ Bank index are computed assuming the reinvestment of dividends.
82
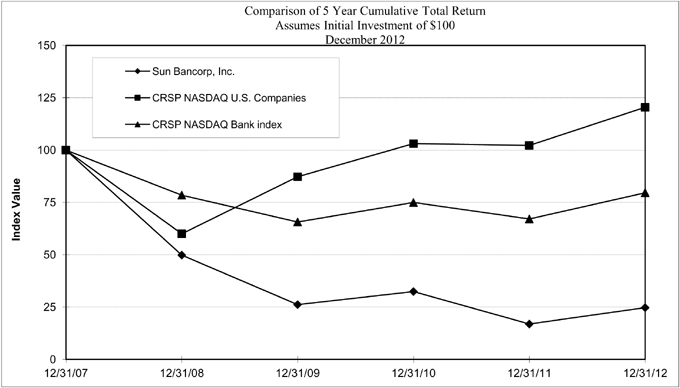
CUMULATIVE TOTAL RETURN
| | | | | | | | | | | | | | | | | | | | | | | | |
December 31, | | 2007 | | | 2008 | | | 2009 | | | 2010 | | | 2011 | | | 2012 | |
CRSP NASDAQ U.S. Companies | | $ | 100.0 | | | $ | 60.0 | | | $ | 87.2 | | | $ | 103.1 | | | $ | 102.3 | | | $ | 120.4 | |
CRSP NASDAQ Bank index | | | 100.0 | | | | 78.5 | | | | 65.7 | | | | 74.9 | | | | 67.1 | | | | 79.6 | |
Sun Bancorp, Inc. (1) | | | 100.0 | | | | 49.8 | | | | 26.2 | | | | 32.4 | | | | 16.9 | | | | 24.7 | |
| (1) | The cumulative return for Sun Bancorp, Inc. reflects a 5% stock dividend paid in May 2007, May 2008 and May 2009 and has been calculated based on the historical closing prices of $15.78, $7.49, $3.75, $4.64, $2.42 and $3.54 on December 31, 2007, 2008, 2009, 2010, 2011 and 2012, respectively. |
There can be no assurance that the Company’s future stock performance will be the same or similar to the historical stock performance shown in the table. The Company neither makes nor endorses any predictions as to the stock performance.
ADDITIONAL INFORMATION
The Company’s Annual Report on Form 10-K (excluding exhibits) for the fiscal year ended December 31, 2012 is available without charge upon written request to Sun Bancorp, Inc. Shareholder Relations, 226 Landis Avenue, Vineland, NJ 08360.
83