Exhibit 99
Sun Bancorp, Inc. Financials as of December 31, 2014 Thomas M. O“Brien President & CEO NASDAQ: SNBC
Caution Regarding Forward-Looking Information During the course of this presentation, management may make forward-looking statements, as defined in the Private Securities Litigation Reform Act of 1995, concerning the financial condition, results of operations and business of Sun Bancorp, Inc. (the “Company”). Forward-looking statements are statements that include projections, predictions, expectations or beliefs about events or results or otherwise are not statements of historical facts, including statements regarding the ability to achieve profitability and peer or better profitability metrics, reducing Company risk and complexity, the goal of the Company and Sun National Bank (the “Bank”) having best in peer group asset quality metrics, executing on the Company“s business strategy, including doing well in commercial and industrial and commercial real estate lending, relationship consumer lending and retail and commercial relationship oriented deposit gathering, deferred tax asset recovery potential, demographics supporting organic growth, projected household income, reducing operating expenses, exiting slow markets, avoiding large costs and adding gains, shrinking the balance sheet to enhance capital ratios, avoiding long term workouts and OREO, remediating all regulatory issues, enhancing performance and efficiency at existing branch locations, transformation occurring over time to a new model, taking market share from major competitors, and completing the transactions covered by the Company“s strategic restructuring plan within the time frame(s) indicated, including completion of future branch closures and sales. Actual results and trends could differ materially from those set forth in such statements and there can be no assurances that we will achieve profitability and peer or better profitability metrics, reduce Company risk and complexity, have best in peer group Company and Bank asset quality metrics, execute on the Company“s business strategy, do well in commercial and industrial and commercial real estate lending, relationship consumer lending and retail and commercial relationship oriented deposit gathering, have a reversal in all or part of the valuation allowance on our deferred tax asset, allowing us to recover any of our net deferred tax asset, achieve organic growth based on demographics, that household income will increase as projected, reduce operating expenses, exit slow markets, avoid large costs and add gains, enhance capital ratios, avoid long term workouts and OREO, remediate all regulatory issues, enhance performance and efficiency at existing branch locations, transform our operations over to our new desired business model, take market share from major competitors, or complete the transactions contemplated in the Company“s strategic restructuring plan when or as desired.

Caution Regarding Forward-Looking Information Factors that could cause actual results to differ from those expressed or implied by such forward-looking statements include, but are not limited to: (i) competition among providers of financial services; (ii) changes in laws and regulations, including without limitation changes in capital requirements under the federal prompt corrective action regulations; (iii) changes in business strategy or an inability to execute strategy due to the occurrence of unanticipated events; (iv) the failure to complete any or all of the transactions contemplated in the Company“s comprehensive strategic restructuring plan on the terms currently contemplated; (v) local, regional and national economic conditions and events and the impact they may have on the Company, the Bank and its customers; (vi) the ability to attract deposits and other sources of liquidity; (vii) changes in the financial performance and/or condition of the Bank“s borrowers; (viii) changes in the level of non-performing and classified assets and charge-offs; (ix) changes in estimates of future loan loss reserve requirements based upon the periodic review thereof under relevant regulatory and accounting requirements; (x) inflation, interest rate, securities market and monetary fluctuations; (xi) changes in consumer spending, borrowing and saving habits; (xii) the ability to increase market share and control expenses; (xiii) volatility in the credit and equity markets and its effect on the general economy; and (xiv) the effect of changes in accounting policies and practices, as may be adopted by the regulatory agencies, as well as the Public Company Accounting Oversight Board, the Financial Accounting Standards Board and other accounting standard setters; and (xv) and those detailed under the headings “Risk Factors” and “Management“s Discussion and Analysis of Financial Condition and Results of Operations” in the Company“s Form 10-K for the fiscal year ended December 31, 2013, and its Form 10-Q for the quarters ended March 31, 2014, June 30, 2014 and September 30, 2014 and in other filings made pursuant to the Securities Exchange Act of 1934, as amended. Therefore, no undue reliance should be placed on any forward-looking statements. The Company does not undertake, and specifically disclaims, any obligation to publicly release the results of any revisions that may be made to any such forward-looking statements to reflect the occurrence of anticipated or unanticipated events or circumstances after the date of such statements.
Non-GAAP Information This presentation contains financial information calculated by methods other than in accordance with Generally Accepted Accounting Principles in the United States of America (“GAAP”). Management uses these “non-GAAP” measures in their analysis of the Company“s performance. Management believes that these non-GAAP financial measures provide a greater understanding of ongoing operations and enhance comparability of results with prior periods as well as demonstrating the effects of significant gains and charges in the current period. The Company believes that a meaningful analysis of its financial performance requires an understanding of the factors underlying that performance. These disclosures should not be viewed as a substitute for operating results determined in accordance with GAAP, nor are they necessarily comparable to non-GAAP performance measures that may be presented by other companies. Management uses these measures to evaluate the underlying performance and efficiency of operations. Management believes these measures reflect core trends of the business. Tangible equity, tangible book value per share, deferred tax asset per share and efficiency ratios are non-GAAP measures. A reconciliation of these adjusted non-GAAP measures to the most directly comparable GAAP measures is included as an appendix to this presentation. References to peer group in this presentation include the following banks : Sterling Bancorp (STL), S&T Bancorp (STBA), Metro Bancorp (METR), Peapack Gladstone (PGC), Hudson Valley Holding (HVB), Sandy Spring Bancorp (SASR), Univest Corporation (UVSP), Lakeland Bancorp (LBAI), Community Bank System (CBU), Tompkins Financial (TMP), NBT Bancorp (NBTB), National Penn Bancshares (NPBC), Financial Institutions (FISI), Cape Bancorp (CBNJ), and First Commonwealth Financial (FCF).
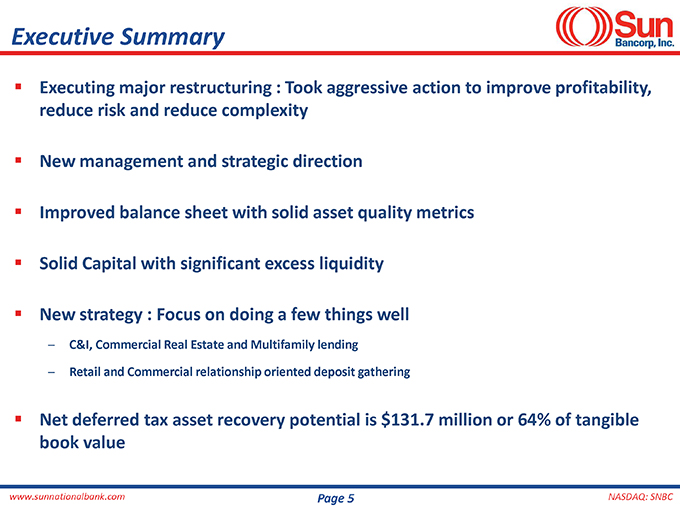
Executive Summary § Executing major restructuring : Took aggressive action to improve profitability, reduce risk and reduce complexity § New management and strategic direction § Improved balance sheet with solid asset quality metrics § Solid Capital with significant excess liquidity § New strategy : Focus on doing a few things well C&I, Commercial Real Estate and Multifamily lending Retail and Commercial relationship oriented deposit gathering § Net deferred tax asset recovery potential is $131.7 million or 64% of tangible book value
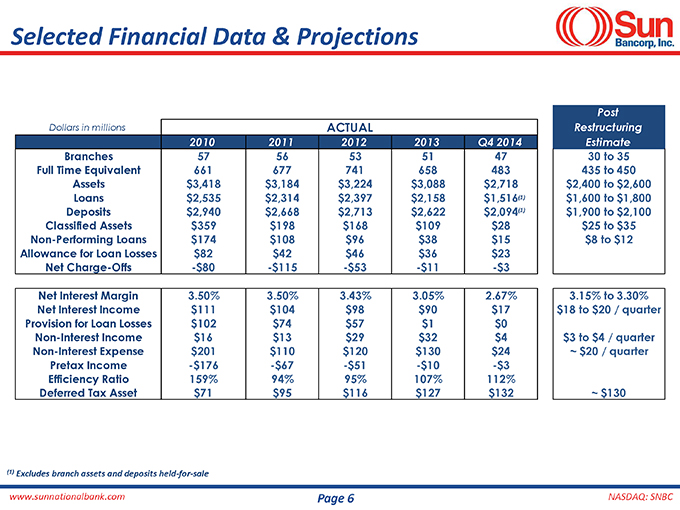
Selected Financial Data & Projections Post Dollars in millions ACTUAL Restructuring 2010 2011 2012 2013 Q4 2014 Estimate Branches 57 56 53 51 47 30 to 35 Full Time Equivalent 661 677 741 658 483 435 to 450 Assets $3,418 $3,184 $3,224 $3,088 $2,718 $2,400 to $2,600 Loans $2,535 $2,314 $2,397 $2,158 $1,516(1) $1,600 to $1,800 Deposits $2,940 $2,668 $2,713 $2,622 $2,094(1) $1,900 to $2,100 Classified Assets $359 $198 $168 $109 $28 $25 to $35 Non-Performing Loans $174 $108 $96 $38 $15 $8 to $12 Allowance for Loan Losses $82 $42 $46 $36 $23 Net Charge-Offs -$80 -$115 -$53 -$11 -$3 Net Interest Margin 3.50% 3.50% 3.43% 3.05% 2.67% 3.15% to 3.30% Net Interest Income $111 $104 $98 $90 $17 $18 to $20 / quarter Provision for Loan Losses $102 $74 $57 $1 $0 Non-Interest Income $16 $13 $29 $32 $4 $3 to $4 / quarter Non-Interest Expense $201 $110 $120 $130 $24 ~ $20 / quarter Pretax Income -$176 -$67 -$51 -$10 -$3 Efficiency Ratio 159% 94% 95% 107% 112% Deferred Tax Asset $71 $95 $116 $127 $132 ~ $130 (1) Excludes branch assets and deposits held-for-sale
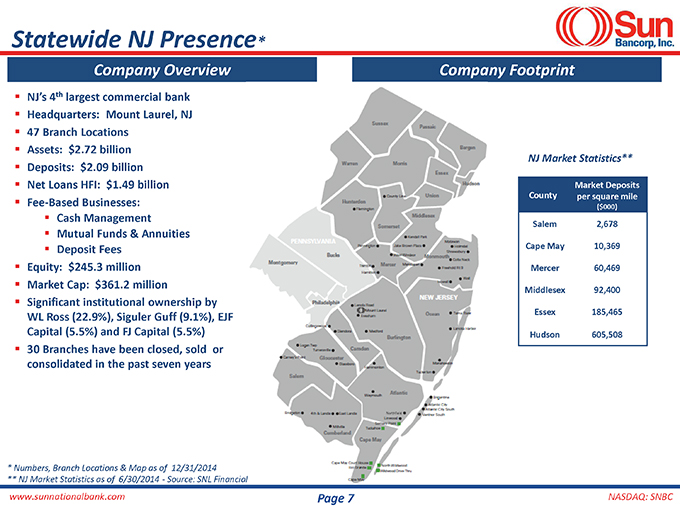
Statewide NJ Presence* Company Overview Company Footprint § NJ“s 4th largest commercial bank § Headquarters: Mount Laurel, NJ § 47 Branch Locations § Assets: $2.72 billion NJ Market Statistics** § Deposits: $2.09 billion § Net Loans HFI: $1.49 billion Market Deposits County per square mile § Fee-Based Businesses: ($000) § Cash Management § Salem 2,678 Mutual Funds & Annuities § Deposit Fees Cape May 10,369 § Equity: $245.3 million Mercer 60,469 § Market Cap: $361.2 million Middlesex 92,400 § Significant institutional ownership by WL Ross (22.9%), Siguler Guff (9.1%), EJF Essex 185,465 Capital (5.5%) and FJ Capital (5.5%) Hudson 605,508 § 30 Branches have been closed, sold or consolidated in the past seven years Map as of 12/31/2014 30/2014—Source: SNL Financial
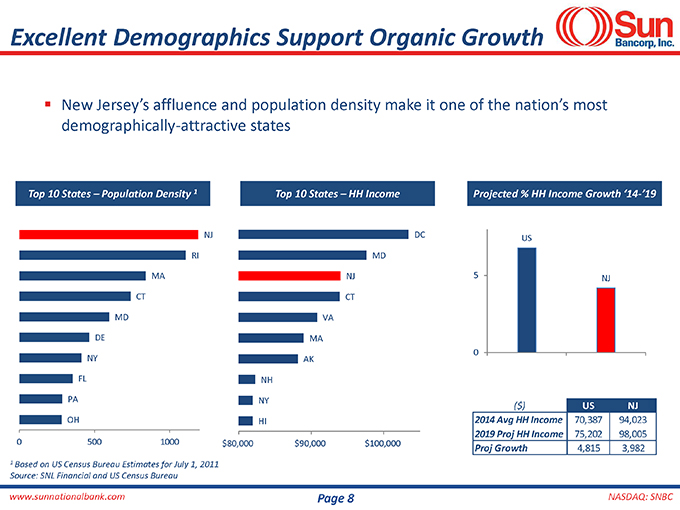
Excellent Demographics Support Organic Growth § New Jersey“s affluence and population density make it one of the nation“s most demographically-attractive states Top 10 States “ Population Density 1 Top 10 States “ HH Income Projected % HH Income Growth “14-“19 NJ DC US RI MD MA NJ 5 NJ CT CT MD VA DE MA 0 NY AK FL NH PA NY ($) US NJ OH HI 2014 Avg HH Income 70,387 94,023 2019 Proj HH Income 75,202 98,005 0 500 1000 $80,000 $90,000 $100,000 Proj Growth 4,815 3,982 1 Based on US Census Bureau Estimates for July 1, 2011 Source: SNL Financial and US Census Bureau
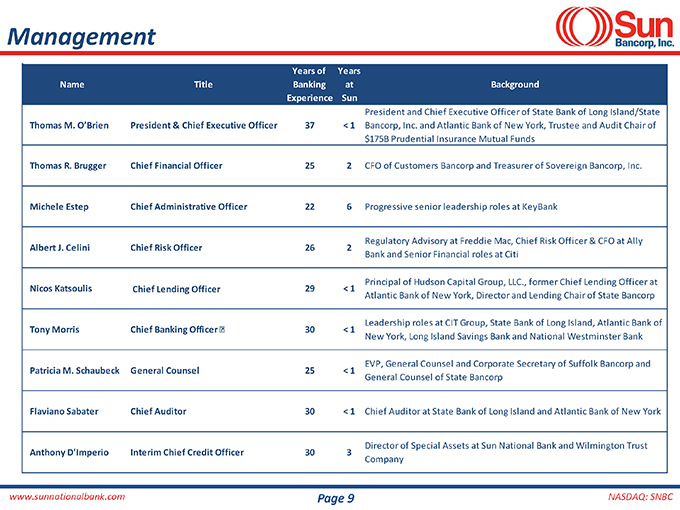
Management Years of Years Name Title Banking at Background Experience Sun President and Chief Executive Officer of State Bank of Long Island/State Thomas M. O“Brien President & Chief Executive Officer 37 < 1 Bancorp, Inc. and Atlantic Bank of New York, Trustee and Audit Chair of $175B Prudential Insurance Mutual Funds Thomas R. Brugger Chief Financial Officer 25 2 CFO of Customers Bancorp and Treasurer of Sovereign Bancorp, Inc. Michele Estep Chief Administrative Officer 22 6 Progressive senior leadership roles at KeyBank Regulatory Advisory at Freddie Mac, Chief Risk Officer & CFO at Ally Albert J. Celini Chief Risk Officer 26 2 Bank and Senior Financial roles at Citi Principal of Hudson Capital Group, LLC., former Chief Lending Officer at Nicos Katsoulis Chief Lending Officer 29 < 1 Atlantic Bank of New York, Director and Lending Chair of State Bancorp Leadership roles at CIT Group, State Bank of Long Island, Atlantic Bank of Tony Morris Chief Banking Officer 30 < 1 New York, Long Island Savings Bank and National Westminster Bank EVP, General Counsel and Corporate Secretary of Suffolk Bancorp and Patricia M. Schaubeck General Counsel 25 < 1 General Counsel of State Bancorp Flaviano Sabater Chief Auditor 30 < 1 Chief Auditor at State Bank of Long Island and Atlantic Bank of New York Director of Special Assets at Sun National Bank and Wilmington Trust Anthony D’Imperio Interim Chief Credit Officer 30 3 Company
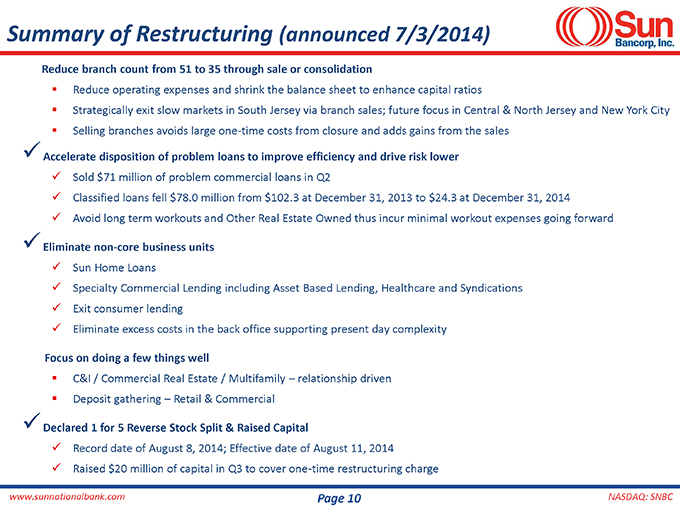
Summary of Restructuring (announced 7/3/2014) Reduce branch count from 51 to 35 through sale or consolidation § Reduce operating expenses and shrink the balance sheet to enhance capital ratios § Strategically exit slow markets in South Jersey via branch sales; future focus in Central & North Jersey and New York City § Selling branches avoids large one-time costs from closure and adds gains from the sales üAccelerate disposition of problem loans to improve efficiency and drive risk lower ü Sold $71 million of problem commercial loans in Q2 ü Classified loans fell $78.0 million from $102.3 at December 31, 2013 to $24.3 at December 31, 2014 ü Avoid long term workouts and Other Real Estate Owned thus incur minimal workout expenses going forward üEliminate non-core business units ü Sun Home Loans ü Specialty Commercial Lending including Asset Based Lending, Healthcare and Syndications ü Exit consumer lending ü Eliminate excess costs in the back office supporting present day complexity Focus on doing a few things well § C&I / Commercial Real Estate / Multifamily “ relationship driven § Deposit gathering “ Retail & Commercial ü Declared 1 for 5 Reverse Stock Split & Raised Capital ü Record date of August 8, 2014; Effective date of August 11, 2014 ü Raised $20 million of capital in Q3 to cover one-time restructuring charge
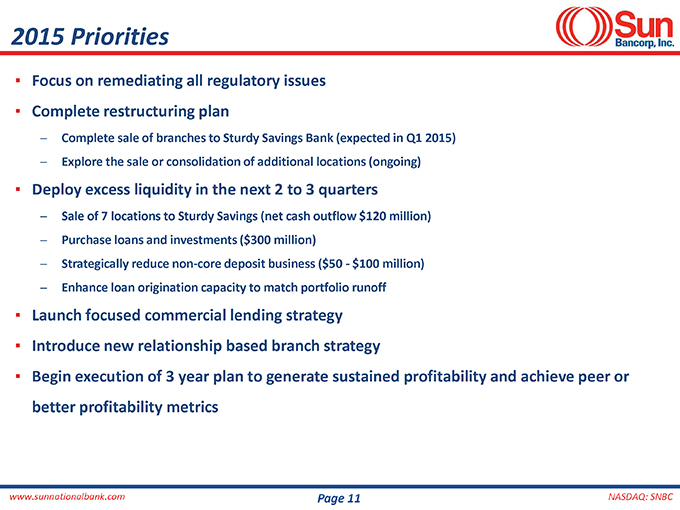
2015 Priorities ª Focus on remediating all regulatory issues ª Complete restructuring plan Complete sale of branches to Sturdy Savings Bank (expected in Q1 2015) Explore the sale or consolidation of additional locations (ongoing) ª Deploy excess liquidity in the next 2 to 3 quarters Sale of 7 locations to Sturdy Savings (net cash outflow $120 million) Purchase loans and investments ($300 million) Strategically reduce non-core deposit business ($50—$100 million) Enhance loan origination capacity to match portfolio runoff ª Launch focused commercial lending strategy ª Introduce new relationship based branch strategy ª Begin execution of 3 year plan to generate sustained profitability and achieve peer or better profitability metrics
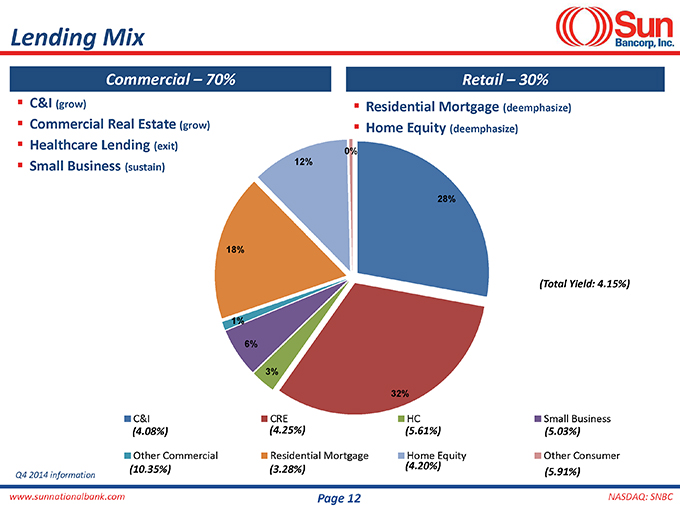
Lending Mix Commercial “ 70% Retail “ 30% § C&I (grow) § Residential Mortgage (deemphasize) § Commercial Real Estate (grow) § Home Equity (deemphasize) § Healthcare Lending (exit) 0% 12% § Small Business (sustain) 28% 18% (Total Yield: 4.15%) 1% 6% 3% 32% C&I CRE HC Small Business (4.08%) (4.25%) (5.61%) (5.03%) Other Commercial Residential Mortgage Home Equity Other Consumer (10.35%) (3.28%) (4.20%) Q4 2014 information (5.91%)
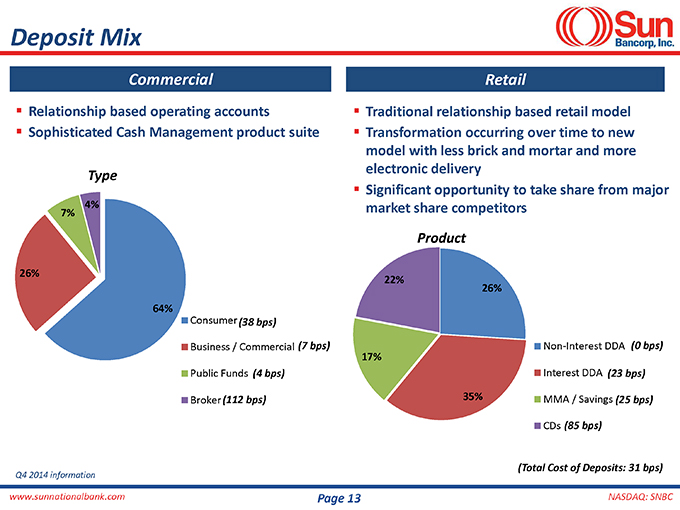
Deposit Mix Commercial Retail § Relationship based operating accounts § Traditional relationship based retail model § Sophisticated Cash Management product suite § Transformation occurring over time to new model with less brick and mortar and more electronic delivery Type § Significant opportunity to take share from major 7% 4% market share competitors Product 26% 22% 26% Consumer(38 bps) Business / Commercial (7 bps) Non-Interest DDA (0 bps) 17% Public Funds (4 bps) Interest DDA (23 bps) Broker(112 bps) 35% MMA / Savings (25 bps) CDs (85 bps) (Total Cost of Deposits: 31 bps) Q4 2014 information
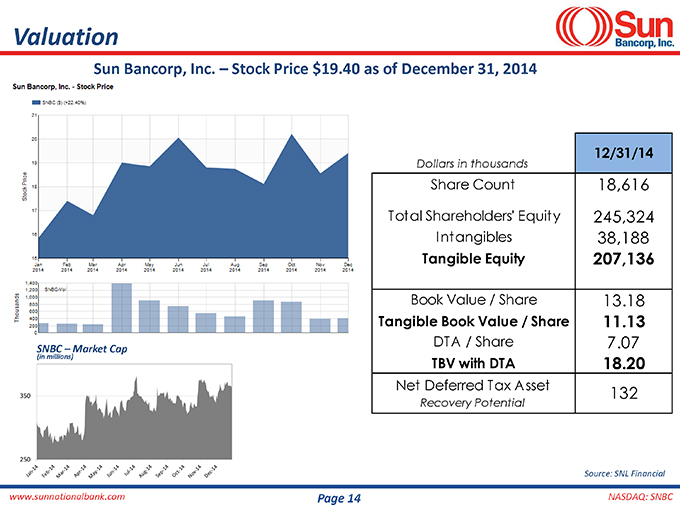
Valuation Sun Bancorp, Inc. “ Stock Price $19.40 as of December 31, 2014 12/31/14 Dollars in thousands Share Count 18,616 Total Shareholders’ Equity 245,324 Intangibles 38,188 Tangible Equity 207,136 Book Value / Share 13.18 Tangible Book Value / Share 11.13 DTA / Share 7.07 SNBC “ Market Cap (in millions) TBV with DTA 18.20 Net Deferred Tax Asset 132 Recovery Potential Source: SNL Financial
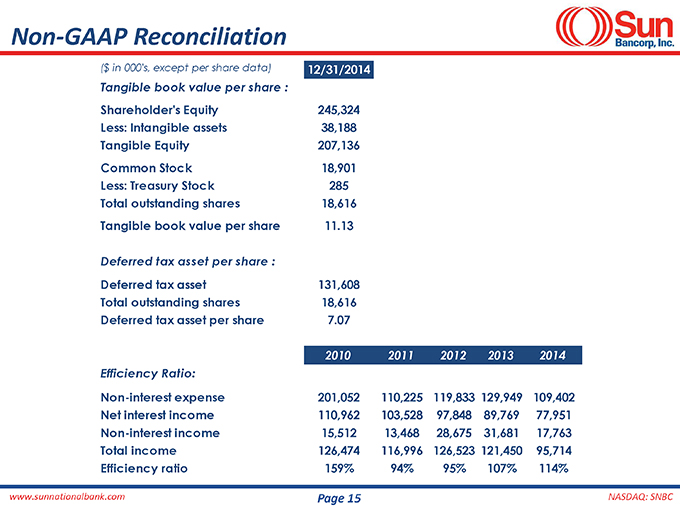
Non-GAAP Reconciliation ($ in 000’s, except per share data) 12/31/2014 Tangible book value per share : Shareholder’s Equity 245,324 Less: Intangible assets 38,188 Tangible Equity 207,136 Common Stock 18,901 Less: Treasury Stock 285 Total outstanding shares 18,616 Tangible book value per share 11.13 Deferred tax asset per share : Deferred tax asset 131,608 Total outstanding shares 18,616 Deferred tax asset per share 7.07 2010 2011 2012 2013 2014 Efficiency Ratio: Non-interest expense 201,052 110,225 119,833 129,949 109,402 Net interest income 110,962 103,528 97,848 89,769 77,951 Non-interest income 15,512 13,468 28,675 31,681 17,763 Total income 126,474 116,996 126,523 121,450 95,714 Efficiency ratio 159% 94% 95% 107% 114%