As filed with Securities Exchange Commission on December 5, 2003
UNITED STATES
SECURITIES AND EXCHANGE COMMISSION
Washington, D.C. 20549
SECURITIES AND EXCHANGE COMMISSION
Washington, D.C. 20549
FORM N-CSR
CERTIFIED SHAREHOLDER REPORT OF REGISTERED MANAGEMENT INVESTMENT COMPANIES
Investment Company Act file number: ( 811-07695)
The Hennessy Mutual Funds, Inc.
(Exact name of registrant as specified in charter)
(Exact name of registrant as specified in charter)
The Courtyard Square, 750 Grant Avenue, Suite 100, Novato, CA 94945
(Address of principal executive offices) (Zip code)
(Address of principal executive offices) (Zip code)
Neil J. Hennessy
Hennessy Advisors, Inc.
The Courtyard Square
750 Grant Avenue
Suite 100
Novato, CA 94945
(Name and address of agent for service)
(Name and address of agent for service)
1-800-966-4354
Registrant's telephone number, including area code
Date of fiscal year end: September 30, 2003
Date of reporting period: September 30, 2003
Item 1. Report to Stockholders.
November 2003
Dear Shareholder:
It seems you can’t open a newspaper recently without reading about a scandal or inappropriate action taken by someone in the financial industry, whether investment banker, brokerage firm or mutual fund company. It is disappointing that these poor decisions, made by a few, are beginning to erode the confidence of investors. In light of this, I want to reaffirm to you our unwavering commitment to manage our funds in the sole interest of our shareholders. That’s the principle that we founded our business on almost 15 years ago and that same principle guides us each day. We refuse to deviate from our investment strategy or our proven formulas in order to manipulate short-term results. And, we will do everything within our control to insure that others do not use our funds to try and profit from rapid trading at the expense of our long-term shareholders. At Hennessy Funds, our goal is to provide a product that investors can have confidence in, knowing their money is invested as promised and managed in their best interest.
In last year’s shareholder report I wrote to you saying that the uncertainties in the market actually presented an excellent buying opportunity for investors. As I write this year’s letter my feelings have not changed. An economy the size of the U.S. doesn’t turn on a dime. It takes time and patience to achieve a sustainable recovery, and that is just what’s happening. Today we are experiencing strong corporate earnings, higher dividends, more corporate spending -- all leading to higher consumer confidence. I believe the market is in great shape to continue its positive momentum, moving the Dow Jones Industrial Average over the 10,000 mark this year.
For the fiscal year ending September 30, 2003 the Hennessy Cornerstone Growth Fund returned a positive 31.67% and the Cornerstone Value Fund returned a positive 19.88% versus the S&P 500 Index returning a positive 24.40% in the same time period. Small cap stocks outperformed large cap stocks during the past fiscal year, helping the Cornerstone Growth Fund beat the S&P 500. For the most recent six-month period (March 31, 2003 to September 30, 2003) both the Cornerstone Growth and Value Funds outperformed the S&P 500. Over that six-month period the Cornerstone Growth Fund returned a positive 33.05% and the Cornerstone Value Fund returned a positive 19.57% versus the S&P 500 returning a positive 18.44%. Again, strong performance of small cap stocks helped fuel the performance of the Cornerstone Growth Fund, as did the Cornerstone Growth stock selection formula, which screened out thousand s of equities before selecting stocks such as Nam Tai Electronics and Avid Technology Inc. In the most recent six-month period, strong performance in the financial
| 1 | ||

and industrial cyclical sectors helped the Cornerstone Value Fund beat the S&P 500, with the Cornerstone Value stock selection formula choosing stocks such as JP Morgan and Caterpillar Inc.
We are equally pleased with the Cornerstone Funds’ longer-term investment results. As of September 30, 2003, the Hennessy Cornerstone Growth Fund’s average annual returns for 5-year and since inception (11/01/96) periods are 20.03% and 15.82%. The Hennessy Cornerstone Value Fund’s average annual returns for the same periods are 5.10% and 5.13% respectively. In the same periods, the S&P 500 Index returned 1.00% and 6.70% respectively.
What does the next 12 months hold in store? No one can know for sure, but I am convinced that our commitment to formula-driven stock selection strategies should produce strong, consistent results for our shareholders over the long run. As I have said in almost every communication with our shareholders, the success to investing is discipline, not letting emotions, whims or newspaper headlines distract you from your commitment to long term investing. At Hennessy Funds, we remain committed to our proven, time-tested stock selection formulas, and foremost to our shareholders. We sincerely appreciate your continued confidence and investment in our funds, and look forward to a long and successful partnership.
Sincerely,

Neil Hennessy
President & Portfolio Manager
Past performance does not guarantee future returns. Investment return and principal value of an investment will fluctuate so that an investor’s shares, when redeemed, may be worth more or less than their original cost. The performance returns assume all dividends and capital gains were reinvested in the Funds.
References to specific securities should not be considered a recommendation to buy or sell any security. Fund holdings are subject to change. Please refer to the Schedule of Investments within the annual report for additional portfolio information, including percentages of holdings. The S&P 500 and Dow Jones Industrial Average are unmanaged indices commonly used to measure the performance of U.S. stocks. One cannot invest directly in an index.
The Funds may hold securities of foreign companies, which may involve volatility, as well as political, economic and currency risks. Small-capitalization companies tend to have limited liquidity and greater price volatility than large-capitalization companies.
Must be preceded or accompanied by a prospectus.
Quasar Distributors, LLC, Distributor. 11/03
| 2 | ||
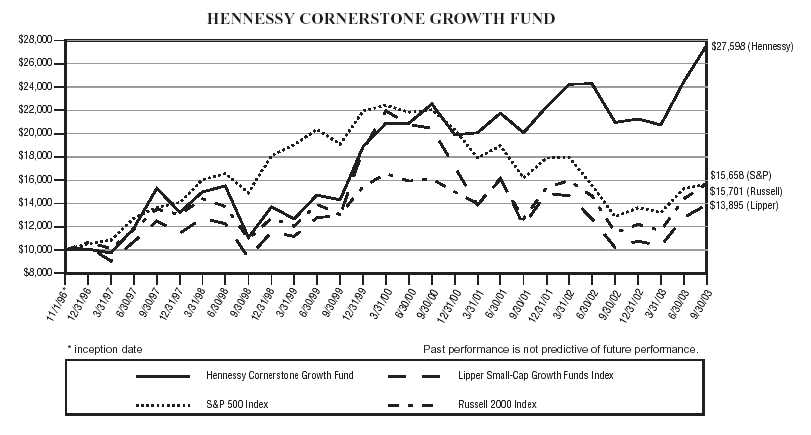
This chart assumes an initial gross investment of $10,000 made on 11/1/96 (commencement of operations). Returns shown include the reinvestment of all dividends. Returns shown do not reflect the deduction of taxes that a shareholder would pay on fund distributions or the redemption of fund shares. In the absence of fee waivers and reimbursements, total return would be reduced. Past performance is not predictive of future performance. Investment return and principal value will fluctuate, so that your shares, when redeemed, may be worth more or less than the original cost.
S&P 500 INDEX – An unmanaged capitalization-weighted index of 500 stocks designed to measure performance of the broad domestic economy through changes in the aggregate market value of the 500 stocks which represent all major industries.
LIPPER SMALL-CAP GROWTH FUNDS INDEX – An unmanaged index which measures the composite performance of the 30 largest “small-cap growth” mutual funds, as categorized by Lipper, Inc.
RUSSELL 2000 INDEX – An unmanaged index which measures the performance of the 2,000 smallest companies in the Russell 3000 Index. The Russell 3000 Index is an unmanaged index which measures the performance of the 3,000 largest U.S. Companies, based on total market capitalization, which represents approximately 98% of the investable U.S. equity market.
AVERAGE ANNUAL TOTAL RETURN PERIODS ENDED SEPTEMBER 30, 2003 | ||||
| Since Inception | ||||
One Year | Five Years | 11/1/96 | ||
| Hennessy Cornerstone Growth Fund | 31.67% | 20.03% | 15.82% | |
| 3 | ||
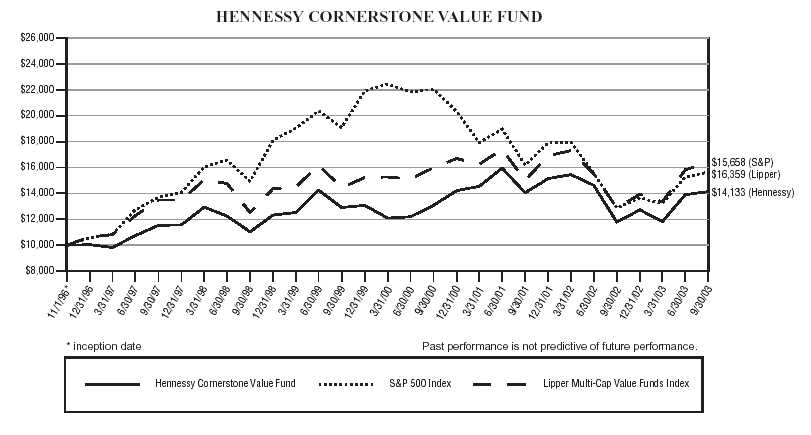
This chart assumes an initial gross investment of $10,000 made on 11/1/96 (commencement of operations). Returns shown include the reinvestment of all dividends. Returns shown do not reflect the deduction of taxes that a shareholder would pay on fund distributions or the redemption of fund shares. In the absence of fee waivers and reimbursements, total return would be reduced. Past performance is not predictive of future performance. Investment return and principal value will fluctuate, so that your shares, when redeemed, may be worth more or less than the original cost.
S&P 500 INDEX – An unmanaged capitalization-weighted index of 500 stocks designed to measure performance of the broad domestic economy through changes in the aggregate market value of the 500 stocks which represent all major industries.
LIPPER MULTI-CAP VALUE FUNDS INDEX – An unmanaged index which measures the composite performance of the 30 largest “multi-cap value” mutual funds, as categorized by Lipper, Inc.
AVERAGE ANNUAL TOTAL RETURN PERIODS ENDED SEPTEMBER 30, 2003 | ||||
| Since Inception | ||||
One Year | Five Years | 11/1/96 | ||
| Hennessy Cornerstone Value Fund | 19.88% | 5.10% | 5.13% | |
| 4 | ||
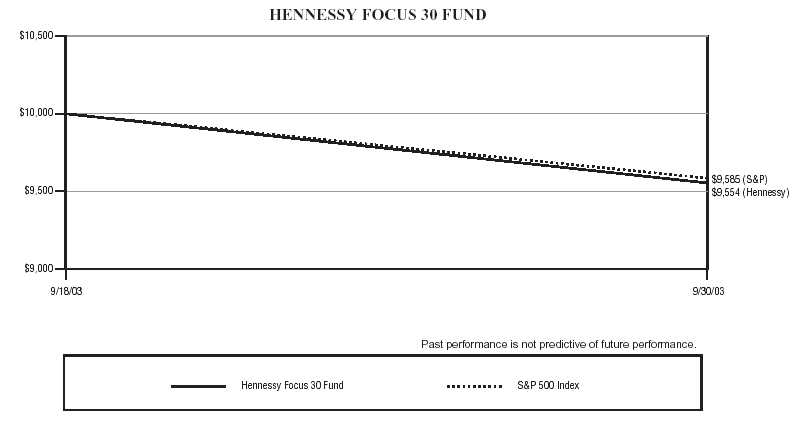
This chart assumes an initial gross investment of $10,000 made on 9/18/03 (commencement of operations). Returns shown include the reinvestment of all dividends. Returns shown do not reflect the deduction of taxes that a shareholder would pay on fund distributions or the redemption of fund shares. In the absence of fee waivers and reimbursements, total return would be reduced. Past performance is not predictive of future performance. Investment return and principal value will fluctuate, so that your shares, when redeemed, may be worth more or less than the original cost.
S&P 500 INDEX – An unmanaged capitalization-weighted index of 500 stocks designed to measure performance of the broad domestic economy through changes in the aggregate market value of the 500 stocks which represent all major industries.
TOTAL RETURN PERIODS ENDED SEPTEMBER 30, 2003 | ||
| Since Inception | ||
9/18/03* | ||
| Hennessy Focus 30 Fund | -4.46% | |
* On September 18, 2003, the SYM Select Growth Fund merged into the Hennessy Focus 30 Fund. Due to the change in advisor and investment technique, performance is being quoted for the period after the merger.
| 5 | ||
STATEMENTS OF ASSETS AND LIABILITIES
September 30, 2003
Hennessy Cornerstone Growth Fund | Hennessy Cornerstone Value Fund | Hennessy Focus 30 Fund | |||
| ASSETS: | |||||
| Investments, at value (cost $717,820,725; | |||||
$20,436,425; and $35,013,071 respectively) (1) | $890,628,824 | $20,399,962 | $33,286,440 | ||
| Cash | 20,361 | — | — | ||
| Income receivable | 323,129 | 53,387 | 5,179 | ||
| Receivable for fund shares sold | 1,897,128 | 30,531 | 50,000 | ||
| Other assets | 66,878 | 19,486 | 5,541 | ||
| Total Assets | 892,936,320 | 20,503,365 | 33,347,160 | ||
| LIABILITIES: | |||||
| Collateral for securities loaned | 139,599,730 | 140,800 | — | ||
| Payable to Adviser | 461,296 | 12,707 | 12,190 | ||
| Payable for fund shares redeemed | 353,436 | — | 19,406 | ||
| Accrued expenses and other payables | 535,554 | 36,207 | 28,290 | ||
| Total Liabilities | 140,950,016 | 189,714 | 59,886 | ||
| NET ASSETS | $751,986,304 | $20,313,651 | $33,287,274 | ||
| NET ASSETS CONSIST OF: | |||||
| Capital stock | $623,297,594 | $24,478,612 | $44,766,887 | ||
| Accumulated undistributed net investment income | — | 372,212 | — | ||
| Accumulated undistributed net realized | |||||
| gain (loss) on investments | (44,119,389) | (4,500,710) | (9,752,982) | ||
| Unrealized net appreciation (depreciation) | |||||
| on investments | 172,808,099 | (36,463) | (1,726,631) | ||
| Total Net Assets | $751,986,304 | $20,313,651 | $33,287,274 | ||
| Shares authorized ($.0001 par value) | 25,000,000,000 | 25,000,000,000 | 25,000,000,000 | ||
| Shares issued and outstanding | 43,635,080 | 1,932,111 | 4,311,703 | ||
| Net asset value, offering price | |||||
| and redemption price per share | $ 17.23 | $ 10.51 | $ 7.72 | ||
(1) Market value of securities on loan $134,886,679, $258 and $0, respectively.
See notes to the financial statements.
| 6 | ||
STATEMENTS OF OPERATIONS
| Hennessy | Hennessy | ||||||||||||
| Cornerstone | Cornerstone | ||||||||||||
| Growth Fund | Value Fund | Hennessy Focus 30 Fund | |||||||||||
10/1/02-9/30/03 | 10/1/02-9/30/03 | 1/1/03-9/30/03 | 1/1/02-12/31/02 | ||||||||||
| INVESTMENT INCOME: | |||||||||||||
| Dividend income (net of withholding | |||||||||||||
| tax of $18,399, $9,339, $510, | |||||||||||||
| and $720, respectively) | $ | 3,241,296 | $ | 661,071 | $ | 184,731 | $ | 473,598 | |||||
| Interest income | 232,114 | 6,847 | 30,794 | 11,845 | |||||||||
| Securities lending income | 53,500 | 3,679 | — | — | |||||||||
| Total investment income | 3,526,910 | 671,597 | 215,525 | 485,443 | |||||||||
| EXPENSES: | |||||||||||||
| Investment advisory fees | 3,912,311 | 137,687 | 232,440 | 362,725 | |||||||||
| Administration, fund accounting, custody | |||||||||||||
| and transfer agent fees | 1,422,319 | 50,237 | 80,685 | 136,914 | |||||||||
| Service fees | 528,691 | 18,606 | — | — | |||||||||
| Federal and state registration fees | 67,902 | 26,693 | 17,896 | 21,255 | |||||||||
| Audit fees | 15,497 | 10,745 | 11,466 | 13,488 | |||||||||
| Legal fees | 16,017 | 14,360 | 5,078 | 6,134 | |||||||||
| Reports to shareholders | 94,318 | 4,606 | 3,336 | 6,099 | |||||||||
| Directors’ fees and expenses | 2,671 | 2,682 | 4,430 | 5,601 | |||||||||
| Transfer agent expenses | 613,825 | 11,876 | 11,122 | — | |||||||||
| Insurance expense | 32,112 | 2,552 | 1,370 | 1,518 | |||||||||
| Other | 675 | 98 | 2,943 | 19,860 | |||||||||
| Total expenses | 6,706,338 | 280,142 | 370,766 | 573,594 | |||||||||
| Expense Reimbursement by Advisor | — | — | (23,219 | ) | (14,966 | ) | |||||||
| Net expenses | 6,706,338 | 280,142 | 347,547 | 558,628 | |||||||||
| NET INVESTMENT INCOME (LOSS) | (3,179,428 | ) | 391,455 | (132,022 | ) | (73,185 | ) | ||||||
| REALIZED AND UNREALIZED | |||||||||||||
| GAINS (LOSSES): | |||||||||||||
| Net realized gain (loss) on investments | (44,057,725 | ) | (1,620,212 | ) | 4,642,882 | (10,144,772 | ) | ||||||
| Change in unrealized | |||||||||||||
| appreciation (depreciation) on investments | 205,396,621 | 4,612,282 | (55,239 | ) | (2,684,534 | ) | |||||||
| Net gain (loss) on investments | 161,338,896 | 2,992,070 | 4,587,643 | (12,829,306 | ) | ||||||||
| NET INCREASE/DECREASE | |||||||||||||
| IN NET ASSETS RESULTING | |||||||||||||
| FROM OPERATIONS | $ | 158,159,468 | $ | 3,383,525 | $ | 4,455,621 | $ | (12,902,491 | ) | ||||
See notes to the financial statements.
| 7 | ||
STATEMENTS OF CHANGES IN NET ASSETS
| Hennessy Cornerstone Growth Fund | |||
Year Ended September 30, 2003 | Year ended September 30, 2002 | ||
| OPERATIONS: | |||
| Net investment loss | $(3,179,428) | $ (1,747,686) | |
| Net realized gain (loss) from security transactions | (44,057,725) | 18,570,496 | |
| Change in unrealized appreciation or depreciation on investments | 205,396,621 | (36,750,049) | |
| Net increase (decrease) in net assets resulting from operations | 158,159,468 | (19,927,239) | |
| DISTRIBUTIONS TO SHAREHOLDERS: | |||
| From net investment income | — | (12) | |
| From net realized gains from security transactions | (15,011,940) | (11,188,807) | |
| Total distributions | (15,011,940) | (11,188,819) | |
| CAPITAL SHARE TRANSACTIONS: | |||
| Proceeds from shares sold | 397,808,244 | 294,063,380 | |
| Shares issued to holders in reinvestment of dividends | 14,479,431 | 10,850,723 | |
| Cost of shares redeemed | (145,812,892) | (86,948,450) | |
| Net increase in net assets derived | |||
| from capital share transactions | 266,474,783 | 217,965,653 | |
| TOTAL INCREASE IN NET ASSETS | 409,622,311 | 186,849,595 | |
| NET ASSETS: | |||
| Beginning of year | 342,363,993 | 155,514,398 | |
| End of year | $751,986,304 | $342,363,993 | |
| Undistributed net investment income, end of year | — | — | |
| CHANGES IN SHARES OUTSTANDING: | |||
| Shares sold | 27,858,357 | 19,354,504 | |
| Shares issued to holders as reinvestment of dividends | 1,039,442 | 820,160 | |
| Shares redeemed | (10,538,371) | (6,025,399) | |
| Net increase in shares outstanding | 18,359,428 | 14,149,265 | |
See notes to the financial statements.
| 8 | ||
STATEMENTS OF CHANGES IN NET ASSETS
| Hennessy Cornerstone Value Fund | ||||||
| Year Ended | Year ended | |||||
| September 30, 2003 | September 30, 2002 | |||||
| OPERATIONS: | ||||||
| Net investment income | $ 391,455 | $ 421,191 | ||||
| Net realized gain (loss) from security transactions | (1,620,212) | 609,964 | ||||
| Change in unrealized appreciation or depreciation on investments | 4,612,282 | (4,014,160) | ||||
| Net increase (decrease) in net assets resulting from operations | 3,383,525 | (2,983,005) | ||||
| DISTRIBUTIONS TO SHAREHOLDERS: | ||||||
| From net investment income | (360,831) | (466,268) | ||||
| From net realized gains from security transactions | — | — | ||||
| Total distributions | (360,831) | (466,268) | ||||
| CAPITAL SHARE TRANSACTIONS: | ||||||
| Proceeds from shares sold | 5,532,084 | 5,517,881 | ||||
| Shares issued to holders in reinvestment of dividends | 349,662 | 447,531 | ||||
| Cost of shares redeemed | (4,366,773) | (7,164,436) | ||||
| Net increase (decrease) in net assets derived | ||||||
| from capital share transactions | 1,514,973 | (1,199,024) | ||||
| TOTAL INCREASE (DECREASE) IN NET ASSETS | 4,537,667 | (4,648,297) | ||||
| NET ASSETS: | ||||||
| Beginning of year | 15,775,984 | 20,424,281 | ||||
| End of year | $20,313,651 | $15,775,984 | ||||
| Undistributed net investment income, end of year | 372,286 | 341,662 | ||||
| CHANGES IN SHARES OUTSTANDING: | ||||||
| Shares sold | 578,931 | 506,523 | ||||
| Shares issued to holders as reinvestment of dividends | 36,806 | 40,173 | ||||
| Shares redeemed | (446,052) | (655,896) | ||||
| Net increase (decrease) in shares outstanding | 169,685 | (109,200) | ||||
See notes to the financial statements.
| 9 | ||
STATEMENTS OF CHANGES IN NET ASSETS
| Hennessy Focus 30 Fund | |||||
Period ended September 30, | Year ended December 31, | January 2, 2001* through December 31, | |||
| 2003 | 2002 | 2001 | |||
| OPERATIONS: | |||||
| Net investment loss | $ (132,022) | $(73,185) | $ (78,518) | ||
| Net realized gain (loss) from security transactions | 4,642,882 | (10,144,772) | (4,251,092) | ||
| Change in unrealized appreciation | |||||
| or depreciation on investments | (55,239) | (2,684,534) | 1,013,142 | ||
| Net increase (decrease) in net assets | |||||
| resulting from operations | 4,455,621 | (12,902,491) | (3,316,468) | ||
| CAPITAL SHARE TRANSACTIONS: | |||||
| Proceeds from shares sold | 6,929,875 | 11,445,318 | 48,432,776 | ||
| Shares issued to holders in reinvestment of dividends | — | — | — | ||
| Cost of shares redeemed | (6,607,587) | (13,262,933) | (1,886,837) | ||
| Net increase (decrease) in net assets derived | |||||
| from capital share transactions | 322,288 | (1,817,615) | 46,545,939 | ||
| TOTAL INCREASE (DECREASE) IN NET ASSETS | 4,777,909 | (14,720,106) | 43,229,471 | ||
| NET ASSETS: | |||||
| Beginning of year | 28,509,365 | 43,229,471 | — | ||
| End of year | $33,287,274 | $28,509,365 | $43,229,471 | ||
| Undistributed net investment income, end of year | — | — | — | ||
| CHANGES IN SHARES OUTSTANDING: | |||||
| Shares sold | 919,363 | 1,465,603 | 4,870,787 | ||
| Shares issued to holders as reinvestment of dividends | — | (1,831,311) | (205,437) | ||
| Shares redeemed | (907,302) | — | — | ||
| Net increase (decrease) in shares outstanding | 12,061 | (365,708) | 4,665,350 | ||
* Commencement of operations.
See notes to the financial statements.
| 10 | ||
FINANCIAL HIGHLIGHTS
| Hennessy Cornerstone Growth Fund | ||||||||||
| Year Ended September 30, | ||||||||||
| 2003 | 2002 | 2001 | 2000 | 1999 | ||||||
| PER SHARE DATA: | ||||||||||
| Net asset value, beginning of year | $13.55 | $13.98 | $19.48 | $12.36 | $ 9.57 | |||||
| Income from investment operations: | ||||||||||
Net investment loss (1) | (0.07) | (0.07) | (0.09) | (0.16) | (0.09) | |||||
| Net realized and unrealized | ||||||||||
| gain (loss) on investments | 4.23 | 0.67 | (1.91) | 7.28 | 2.88 | |||||
| Total from investment operations | 4.16 | 0.60 | (2.00) | 7.12 | 2.79 | |||||
| Less Distributions: | ||||||||||
| From net realized gains | (0.48) | (1.03) | (3.50) | — | — | |||||
| Total distributions | (0.48) | (1.03) | (3.50) | — | — | |||||
| Net asset value, end of year | $17.23 | $13.55 | $13.98 | $19.48 | $12.36 | |||||
| TOTAL RETURN | 31.67% | 4.47% | -10.95% | 57.61% | 29.15% | |||||
| SUPPLEMENTAL DATA AND RATIOS: | ||||||||||
| Net assets, end of year (millions) | $752.0 | $342.4 | $155.5 | $182.5 | $120.8 | |||||
| Ratio of net expenses to average net assets: | ||||||||||
| Before expense reimbursement | 1.27% | 1.10% | 1.11% | 1.18% | 1.15% | |||||
| After expense reimbursement | 1.27% | 1.10% | 1.11% | 1.18% | 1.15% | |||||
| Ratio of net investment loss to average net assets: | ||||||||||
| Before expense reimbursement | -0.60% | -0.73% | -0.60% | -0.90% | -0.84% | |||||
| After expense reimbursement | -0.60% | -0.73% | -0.60% | -0.90% | -0.84% | |||||
| Portfolio turnover rate | 74.80% | 70.33% | 103.33% | 95.28% | 125.19% | |||||
(1) Net investment loss per share is calculated using ending balances prior to consideration for adjustments for permanent book and tax differences.
See notes to the financial statements.
| 11 | ||
FINANCIAL HIGHLIGHTS
| Hennessy Cornerstone Value Fund | |
| Year Ended September 30, |
| 2003 | 2002 | 2001 | 2000 | 1999 | |||||
| PER SHARE DATA: | |||||||||
| Net asset value, beginning of year | $ 8.95 | $10.91 | $10.29 | $11.90 | $10.84 | ||||
| Income from investment operations: | |||||||||
| Net investment income | 0.21 | 0.25 | 0.24 | 0.32 | 0.33 | ||||
| Net realized and unrealized | |||||||||
| gains (losses) on investments | 1.55 | (1.95) | 0.52 | (0.18) | 1.49 | ||||
| Total from investment operations | 1.76 | (1.70) | 0.76 | 0.14 | 1.82 | ||||
| Less Distributions: | |||||||||
| From net investment income | (0.20) | (0.26) | (0.14) | (0.47) | (0.26) | ||||
| From net realized gains | — | — | — | (1.28) | (0.50) | ||||
| Total distributions | (0.20) | (0.26) | (0.14) | (1.75) | (0.76) | ||||
| Net asset value, end of year | $10.51 | $ 8.95 | $10.91 | $10.29 | $11.90 | ||||
| TOTAL RETURN | 19.88% | -16.05% | 7.38% | 1.30% | 17.12% | ||||
| SUPPLEMENTAL DATA AND RATIOS: | |||||||||
| Net assets, end of year (millions) | $20.3 | $15.8 | $20.4 | $17.5 | $26.3 | ||||
| Ratio of net expenses to average net assets: | |||||||||
| Before expense reimbursement | 1.51% | 1.43% | 1.74% | 1.85% | 1.38% | ||||
| After expense reimbursement | 1.51% | 1.43% | 1.74% | 1.85% | 1.38% | ||||
| Ratio of net investment income | |||||||||
| to average net assets: | |||||||||
| Before expense reimbursement | 2.10% | 2.12% | 2.12% | 2.36% | 2.58% | ||||
| After expense reimbursement | 2.10% | 2.12% | 2.12% | 2.36% | 2.58% | ||||
| Portfolio turnover rate | 57.29% | 76.93% | 78.01% | 86.13% | 122.79% |
See notes to the financial statements.
| 12 | ||
FINANCIAL HIGHLIGHTS
Hennessy Focus 30 Fund (1) | ||||||||||
| Nine Months | January 2, 2001* | |||||||||
| ended | Year Ended | through | ||||||||
| September 30, | December 31, | December 31, | ||||||||
2003 (2) | 2002 | 2001 | ||||||||
| PER SHARE DATA: | ||||||||||
| Net asset value, beginning of year | $ | 6.63 | $ | 9.27 | $ | 10.00 | ||||
| Income from investment operations: | ||||||||||
| Net investment income (loss) | (0.03 | ) | (0.02 | ) | (0.02 | ) | ||||
| Net realized and unrealized gains (losses) on investments | 1.12 | (2.62 | ) | (0.71 | ) | |||||
| Total from investment operations | 1.09 | (2.64 | ) | (0.73 | ) | |||||
| Net asset value, end of year | $ | 7.72 | $ | 6.63 | $ | 9.27 | ||||
| TOTAL RETURN | 16.44 | % | (28.48 | %) | (7.30 | %) | ||||
| SUPPLEMENTAL DATA AND RATIOS: | ||||||||||
| Net assets, end of year (millions) | $ | 33.3 | $ | 28.5 | $ | 43.2 | ||||
| Ratio of net expenses to average net assets: | ||||||||||
| Before expense reimbursement | 1.59 | % | 1.54 | % | 1.80 | % | ||||
| After expense reimbursement | 1.49 | %(3) | 1.50 | % | 1.50 | % | ||||
| Ratio of net investment loss to average net assets: | ||||||||||
| Before expense reimbursement | (0.67 | %) | (0.24 | %) | (0.62 | %) | ||||
| After expense reimbursement | (0.57 | %) | (0.20 | %) | (0.32 | %) | ||||
| Portfolio turnover rate | 356.77 | % | 291.00 | % | 210.00 | % | ||||
* Commencement of operations.
(1) The financial highlights set forth herein include the historical financial highlights of the SYM Select Growth Fund. The assets and liabilities of the SYM Select Growth Fund were transferred to and assumed by the Hennessy Focus 30 Fund on September 18, 2003. At the time of merger the Adviser also changed from SYM Financial Corporation to Hennessy Advisors Inc.
(2) All ratios for the period have been annualized, except portfolio turnover and total return.
(3) The Hennessy Focus 30 Fund has instituted an expense cap of 1.45%, which will be in effect through September 30, 2006.
See notes to the financial statements.
| 13 | ||
Hennessy Cornerstone Growth Fund
SCHEDULE OF INVESTMENTS
September 30, 2003
SCHEDULE OF INVESTMENTS
September 30, 2003
| Number | ||||
| of Shares | Value | |||
| COMMON STOCKS — 97.38% | ||||
| Aerospace/Defense — 2.51% | ||||
| 312,000 | Engineered Support Systems, Inc. | $ | 18,872,880 | |
| Agriculture Productions, Crops — 1.57% | ||||
| 428,100 | Bunge Limited+ | 11,772,750 | ||
| Apparel — 1.73% | ||||
| 816,500 | Quiksilver, Inc.* | 13,023,175 | ||
| Beverages — 2.35% | ||||
| 162,800 | Coca-Cola Bottling Co. | 8,164,420 | ||
| 177,300 | Coors (Adolph) | 9,531,648 | ||
| 17,696,068 | ||||
| Chemicals — 1.41% | ||||
| 387,300 | Albermarle Corp. | 10,631,385 | ||
| Commercial Services — 5.23% | ||||
| 529,000 | Dollar Thrifty Automotive Group* | 12,018,880 | ||
| 514,250 | Rent-A-Center, Inc.* | 16,569,135 | ||
| 603,150 | Rollins, Inc.+ | 10,760,196 | ||
| 39,348,211 | ||||
| Computers — 3.78% | ||||
| 284,600 | Imation Corp. | 9,292,190 | ||
| 1,482,000 | Western Digital Corp.*+ | 19,102,980 | ||
| 28,395,170 | ||||
| Consumer Products — 7.71% | ||||
| 716,500 | American Greetings Co.*+ | 13,921,595 | ||
| 546,500 | Central Garden & Pet Co.* | 14,274,580 | ||
| 560,300 | Fossil, Inc.* | 13,615,290 | ||
| 429,900 | Jarden Corp.* | 16,228,725 | ||
| 58,040,190 | ||||
| Electric, Gas, Sanitary Services — 1.71% | ||||
| 443,750 | UGI Corp. | 12,837,688 | ||
| Electronics — 9.75% | ||||
| 285,800 | Ametek, Inc. | 12,249,388 | ||
| 319,100 | Benchmark Electronics, Inc.*+ | 13,488,357 | ||
| 182,400 | Harman International Industries, Inc.+ | 17,939,040 | ||
| 1,091,700 | Nam Tai Electronics, Inc. | 29,617,821 | ||
| 73,294,606 | ||||
See notes to the financial statements.
| 14 | ||
Hennessy Cornerstone Growth Fund
SCHEDULE OF INVESTMENTS — (Continued)
September 30, 2003
SCHEDULE OF INVESTMENTS — (Continued)
September 30, 2003
| Number | ||||
| of Shares | Value | |||
| COMMON STOCKS (Continued) | ||||
| Engineering & Construction — 4.23% | ||||
| 686,100 | Chicago Bridge & Iron Co. | $ | 18,634,476 | |
| 292,800 | Jacobs Engineering Group, Inc. | 13,205,280 | ||
| 31,839,756 | ||||
| Food, Beverage & Tobacco — 2.94% | ||||
| 470,700 | Sensient Technologies Corp. | 9,884,700 | ||
| 221,500 | Whole Foods Market, Inc.*+ | 12,226,800 | ||
| 22,111,500 | ||||
| Gardening — 4.40% | ||||
| 348,900 | Toro Company+ | 15,700,500 | ||
| 528,800 | Tractor Supply Company*+ | 17,349,928 | ||
| 33,050,428 | ||||
| Healthcare-Services — 4.70% | ||||
| 261,000 | Aetna, Inc. | 15,928,830 | ||
| 398,100 | Pacificare Health Systems, Inc.* | 19,427,280 | ||
| 35,356,110 | ||||
| Housing — 2.02% | ||||
| 32,500 | NVR, Inc.*+ | 15,161,250 | ||
| Insurance — 5.10% | ||||
| 409,300 | Fidelity National Financial, Inc.+ | 12,303,558 | ||
| 485,100 | First American Corporation | 12,078,990 | ||
| 305,200 | Landamerica Financial Group, Inc. | 13,990,368 | ||
| 38,372,916 | ||||
| Machinery-Diversified — 1.74% | ||||
| 497,300 | Rockwell International Corp. | 13,054,125 | ||
| Metal Fabricate/Hardware — 1.13% | ||||
| 558,700 | Timken Co. | 8,514,588 | ||
| Miscellaneous Manufacturing — 3.25% | ||||
| 272,400 | Carlisle Cos, Inc. | 11,882,088 | ||
| 321,600 | Clarcor, Inc. | 12,542,400 | ||
| 24,424,488 | ||||
| Oil & Gas Services — 1.49% | ||||
| 662,500 | Varco International, Inc.* | 11,202,875 | ||
See notes to the financial statements.
| 15 | ||
Hennessy Cornerstone Growth Fund
SCHEDULE OF INVESTMENTS — (Continued)
September 30, 2003
SCHEDULE OF INVESTMENTS — (Continued)
September 30, 2003
| Number | ||||
| of Shares | Value | |||
| COMMON STOCKS (Continued) | ||||
| Packaging & Containers — 2.92% | ||||
| 217,400 | Ball Corp.+ | $ | 11,739,600 | |
| 503,700 | Pactiv Corporation* | 10,215,036 | ||
| 21,954,636 | ||||
| Pharmaceuticals — 1.81% | ||||
| 584,200 | NBTY, Inc.* | 13,641,070 | ||
| Retail — 8.87% | ||||
| 870,850 | Pacific Sunwear of California, Inc.*+ | 17,991,761 | ||
| 240,400 | Ross Stores, Inc. | 11,152,156 | ||
| 969,300 | Saks, Inc.* | 11,176,029 | ||
| 995,000 | Select Comfort Corp.*+ | 26,367,500 | ||
| 66,687,446 | ||||
| Savings & Loans — 3.09% | ||||
| 1,013,800 | Flagstar Bancorp, Inc. | 23,266,710 | ||
| Software — 3.61% | ||||
| 511,700 | Avid Technology, Inc.*+ | 27,120,100 | ||
| Transportation — 8.33% | ||||
| 788,700 | EGL, Inc.* | 14,346,453 | ||
| 776,800 | JB Hunt Transport Services, Inc.*+ | 20,212,336 | ||
| 194,000 | Landstar System, Inc.* | 11,837,880 | ||
| 557,900 | Old Dominion Freight Line, Inc.* | 16,229,311 | ||
| 62,625,980 | ||||
Total Common Stocks (Cost $559,488,001) | 732,296,101 | |||
| Principal | ||||
| Amount | ||||
| COMMERCIAL PAPER — 4.12% | ||||
| Investment Banker/Broker — 3.32% | ||||
| $2,996,977 | Danske Bank, C.P., 1.5075%, due 12/22/2003# | 2,996,977 | ||
| 2,996,977 | Leafs, LLC, C.P., 1.3394%, due 04/20/2004# | 2,996,977 | ||
| 3,995,970 | Lehman Brothers, C.P., 1.5175%, due 02/27/2004# | 3,995,970 | ||
| 1,997,985 | Merrill Lynch, C.P., 1.5575%, due 11/18/2003# | 1,997,985 | ||
| 2,996,977 | Morgan Stanley, C.P., 1.5175%, due 01/05/2004# | 2,996,977 | ||
| 3,995,970 | Morgan Stanley, C.P., 1.5175%, due 03/19/2004# | 3,995,970 | ||
| 1,996,691 | Mortgage Interest Network, C.P., due 10/15/2003# | 1,996,691 | ||
| 3,984,932 | Mortgage Interest Network, C.P., due 12/16/2003# | 3,984,932 | ||
| 24,962,479 |
See notes to the financial statements.
| 16 | ||
Hennessy Cornerstone Growth Fund
SCHEDULE OF INVESTMENTS — (Continued)
September 30, 2003
SCHEDULE OF INVESTMENTS — (Continued)
September 30, 2003
| Number | ||||
| of Shares | Value | |||
| COMMERCIAL PAPER (Continued) | ||||
| Special Purpose — 0.80% | ||||
| $2,996,977 | Beta Finance, Inc., C.P., 1.5075%, due 01/16/2004# | $ | 2,996,977 | |
| 2,996,977 | SMM Trust 2002 Note, 1.5040%, 12/15/2003# | 2,996,977 | ||
| 5,993,954 | ||||
Total Commercial Paper (Cost $30,956,433) | 30,956,433 | |||
| Certificates of Deposit — 2.52% | ||||
| 2,996,977 | Deutsche Bank C.D., 1.500%, due 03/22/2004# | 2,996,977 | ||
| 2,996,977 | Metlife Global Funding, 1.1469%, due 04/28/2008# | 2,996,977 | ||
| 2,996,977 | Premium Asset Trust, 0.11014%, due 06/01/2004# | 2,996,977 | ||
| 4,994,962 | Svenska Handlesbank C.D., due 03/15/2004# | 4,994,962 | ||
| 4,994,962 | Wells Fargo Bank C.D., due 10/31/2003# | 4,994,962 | ||
Total Variable Rate Bonds and CD’s (Cost $18,980,855) | 18,980,855 | |||
| Repurchase Agreements — 10.76% | ||||
| 12,986,901 | CS First Boston Repo., 1.1400%, due 10/01/2003# | 12,986,901 | ||
| 17,981,864 | JP Morgan Repo., 1.2875%, due 10/01/2003# | 17,981,864 | ||
| 49,949,621 | Salomon Smith Repo., 1.2375%, due 10/01/2003# | 49,949,621 | ||
Total Variable Rate Bonds and CD’s (Cost $80,918,386) | 80,918,386 | |||
| Variable Rate Demand Notes — 2.49% | ||||
| 2,567,526 | American Family Financial Services, Inc., 0.7407% | 2,567,526 | ||
| 6,990,469 | Wisconsin Corporate Central Credit Union, 0.7900% | 6,990,469 | ||
| 9,175,000 | Federal Home Loan Bank, 0.8500% | 9,175,000 | ||
Total Variable Rate Demand Notes (Cost $18,732,995) | 18,732,995 | |||
| SHORT-TERM INVESTMENTS — 1.17% | ||||
| 2,996,977 | AIM Short Term Liquid Asset Fund, 1.29%# | 2,996,977 | ||
| 5,747,078 | Merrill Lynch Premier Institutional Fund, 1.3513%# | 5,747,078 | ||
Total Short-Term Investments (Cost $8,744,055) | 8,744,055 | |||
Total Investments — 118.44% (Cost $717,820,725) | 890,628,824 | |||
| Liabilities, less Other Assets — (18.44%) | (138,642,520) | |||
| NET ASSETS — 100% | $ | 751,986,304 | ||
* Non-income producing security
# Securities lending collateral
+ This security or a portion of this security is out on loan at September 30, 2003.
See notes to the financial statements.
| 17 | ||
Hennessy Cornerstone Value Fund
SCHEDULE OF INVESTMENTS
September 30, 2003
SCHEDULE OF INVESTMENTS
September 30, 2003
| Number | ||||
| of Shares | Value | |||
| COMMON STOCKS — 97.77% | ||||
| Auto & Truck — 5.96% | ||||
| 43,800 | Delphi Automotive Systems | $ | 396,390 | |
| 37,900 | Ford Motor Company | 408,183 | ||
| 9,900 | General Motors Corporation | 405,207 | ||
| 1,209,780 | ||||
| Building Products-Cement — 2.08% | ||||
| 16,935 | Cemex S.A. de C.V. | 422,528 | ||
| Chemicals — 3.62% | ||||
| 12,300 | The Dow Chemical Company | 400,242 | ||
| 8,400 | E.I. duPont de Nemours and Company | 336,084 | ||
| 736,326 | ||||
| Commercial Banks — 7.52% | ||||
| 19,200 | AmSouth Bancorporation | 407,424 | ||
| 9,600 | BB&T Corporation | 344,736 | ||
| 10,800 | Regions Financial Corporation | 369,900 | ||
| 12,800 | Union Planters Corporation | 404,992 | ||
| 1,527,052 | ||||
| Computer Services — 2.19% | ||||
| 22,000 | Electronic Data Systems Corporation | 444,400 | ||
| Diversified — 1.98% | ||||
| 15,300 | Honeywell International, Inc. | 403,155 | ||
| Drugs — 3.69% | ||||
| 13,000 | Bristol-Myers Squibb Company | 333,580 | ||
| 9,800 | GlaxoSmithKline plc | 415,520 | ||
| 749,100 | ||||
| Electrical Equipment — 1.81% | ||||
| 7,000 | Emerson Electric Co. | 368,550 | ||
| Food, Beverage & Tobacco — 8.87% | ||||
| 16,300 | Albertson’s, Inc. | 335,291 | ||
| 8,900 | Altria Group, Inc. | 389,820 | ||
| 14,900 | Conagra Foods, Inc. | 316,476 | ||
| 4,610 | Del Monte Foods Co.* | 40,153 | ||
| 10,400 | H.J. Heinz Company | 356,512 | ||
| 10,900 | Kellogg Company | 363,515 | ||
| 1,801,767 | ||||
See notes to the financial statements.
| 18 | ||
Hennessy Cornerstone Value Fund
SCHEDULE OF INVESTMENTS — (Continued)
September 30, 2003
SCHEDULE OF INVESTMENTS — (Continued)
September 30, 2003
| Number | ||||
| of Shares | Value | |||
| COMMON STOCKS (Continued) | ||||
| Forest Products & Paper — 4.21% | ||||
| 15,900 | MeadWestvaco Corporation | $ | 405,450 | |
| 7,700 | Weyerhaeuser Company | 450,065 | ||
| 855,515 | ||||
| Insurance — 7.06% | ||||
| 19,300 | AON Corporation | 402,405 | ||
| 27,476 | Aegon NV ADR | 321,469 | ||
| 21,600 | UnumProvident Corporation | 319,032 | ||
| 10,000 | Washington Mutual, Inc. | 393,700 | ||
| 1,436,606 | ||||
| Investment Banker/Broker — 2.60% | ||||
| 15,400 | J.P. Morgan Chase & Co. | 528,682 | ||
| Machinery, Diversified — 4.99% | ||||
| 8,000 | Caterpillar, Inc. | 550,720 | ||
| 17,600 | Rockwell International, Inc. | 462,000 | ||
| 1,012,720 | ||||
| Money Center Banks — 2.14% | ||||
| 6,585 | HSBC Holdings plc | 434,610 | ||
| Office Automation & Equipment — 2.02% | ||||
| 10,700 | Pitney Bowes, Inc. | 410,024 | ||
| Oil & Gas — 13.97% | ||||
| 9,200 | BP plc | 387,320 | ||
| 5,300 | ChevronTexaco Corporation | 378,685 | ||
| 7,200 | ConocoPhillips | 394,200 | ||
| 17,000 | Marathon Oil Corporation | 484,500 | ||
| 12,900 | Occidental Petroleum Corporation | 454,467 | ||
| 8,500 | Royal Dutch Petroleum Company | 375,700 | ||
| 9,600 | Shell Transport & Trading Company plc | 362,496 | ||
| 2,837,368 | ||||
| Photographic Equipment and Supplies — 1.01% | ||||
| 9,800 | Eastman Kodak Company | 205,212 | ||
| Retail — 4.86% | ||||
| 15,400 | The May Department Stores Company | 379,302 | ||
| 13,900 | Sears, Roebuck and Co. | 607,847 | ||
| 987,149 | ||||
See notes to the financial statements.
| 19 | ||
Hennessy Cornerstone Value Fund
SCHEDULE OF INVESTMENTS — (Continued)
September 30, 2003
| Number | ||||||
| of Shares | Value | |||||
| COMMON STOCKS (Continued) | ||||||
| Super-Regional Banks-US — 10.20% | ||||||
| 5,300 | Bank of America Corporation | $ | 413,612 | |||
| 14,500 | FleetBoston Financial Corporation | 437,175 | ||||
| 13,300 | National City Corporation | 391,818 | ||||
| 8,800 | PNC Financial Services Group | 418,704 | ||||
| 17,100 | US Bancorp | 410,229 | ||||
| 2,071,538 | ||||||
| Telecom Equipment — 2.12% | ||||||
| 19,700 | BCE, Inc. | 430,445 | ||||
| Telephone — 4.87% | ||||||
| 13,900 | SBC Communications, Inc. | 309,275 | ||||
| 24,800 | Sprint Corporation | 374,480 | ||||
| 25,800 | Telefonica de Argentina S.A. - ADR*+ | 258 | ||||
| 9,400 | Verizon Communications, Inc. | 304,936 | ||||
| 988,949 | ||||||
Total Common Stocks (Cost $19,897,939) | 19,861,477 | |||||
| Principal | ||||||
| Amount | ||||||
| COMMERCIAL PAPER — 0.15% | ||||||
| Investment Banker/Broker — 0.12% | ||||||
| $3,023 | Danske Bank, C.P., 1.5075%, due 12/22/2003# | 3,023 | ||||
| 3,023 | Leafs, LLC, C.P., 1.3394%, due 04/20/2004# | 3,023 | ||||
| 4,030 | Lehman Brothers, C.P., 1.5175%, due 02/27/2004# | 4,030 | ||||
| 2,015 | Merrill Lynch, C.P., 1.5575%, due 11/18/2003# | 2,015 | ||||
| 3,023 | Morgan Stanley, C.P., 1.5175%, due 01/05/2004# | 3,023 | ||||
| 4,030 | Morgan Stanley, C.P., 1.5175%, due 03/19/2004# | 4,030 | ||||
| 2,014 | Mortgage Interest Network, C.P., due 10/15/2003# | 2,014 | ||||
| 4,019 | Mortgage Interest Network, C.P., due 12/16/2003# | 4,019 | ||||
| 25,177 | ||||||
| Special Purpose — 0.03% | ||||||
| 3,023 | Beta Finance, Inc., C.P., 1.5075%, due 01/16/2004# | 3,023 | ||||
| 3,023 | SMM Trust 2002 Note, 1.5040%, 12/15/2003# | 3,023 | ||||
| 6,046 | ||||||
Total Commercial Paper (Cost $31,223) | 31,223 | |||||
See notes to the financial statements.
| 20 | ||
Hennessy Cornerstone Value Fund
SCHEDULE OF INVESTMENTS — (Continued)
September 30, 2003
| Principal | ||||
| Amount | Value | |||
| Certificate of Deposit — 0.09% | ||||
| $3,023 | Deutsche Bank C.D., 1.500%, due 03/22/2004# | 3,023 | ||
| 3,023 | Metlife Global Funding, 1.1469%, due 04/28/2008# | 3,023 | ||
| 3,023 | Premium Asset Trust, 0.11014%, due 06/01/2004# | 3,023 | ||
| 5,038 | Svenska Handlesbank C.D., due 03/15/2004# | 5,038 | ||
| 5,038 | Wells Fargo Bank C.D., due 10/31/2003# | 5,038 | ||
Total Variable Rate Bonds and CD’s (Cost $19,145) | 19,145 | |||
| Repurchase Agreements — 0.40% | ||||
| 13,099 | CS First Boston Repo., 1.1400%, due 10/01/2003# | 13,099 | ||
| 18,136 | JP Morgan Repo., 1.2875%, due 10/01/2003# | 18,136 | ||
| 50,379 | Salomon Smith Repo., 1.2375%, due 10/01/2003# | 50,379 | ||
Total Variable Rate Bonds and CD’s (Cost $81,614) | 81,614 | |||
| Variable Rate Demand Notes — 1.96% | ||||
| 208,036 | American Family Financial Services, Inc., 0.7407% | 208,036 | ||
| 189,648 | Wisconsin Corporate Central Credit Union, 0.7900% | 189,648 | ||
Total Variable Rate Demand Notes (Cost $397,685) | 397,685 | |||
| SHORT-TERM INVESTMENTS — 0.05% | ||||
| 3,023 | AIM Short Term Liquid Asset Fund, 1.29%# | 3,023 | ||
| 5,796 | Merrill Lynch Premier Institutional Fund, 1.3513%# | 5,796 | ||
Total Short-Term Investments (Cost $8,819) | 8,819 | |||
Total Investments — 100.42% (Cost $20,436,425) | 20,399,962 | |||
| Liabilities, less Other Assets — (0.42%) | (86,312) | |||
| NET ASSETS — 100% | $20,313,651 | |||
* Non-income producing security
# Securities lending collateral
+ This security or a portion of this security is out on loan at September 30, 2003.
See notes to the financial statements.
| 21 | ||
Hennessy Focus 30 Fund
SCHEDULE OF INVESTMENTS
September 30, 2003
| Number | ||||
| of Shares | Value | |||
| COMMON STOCKS — 95.77% | ||||
| Apparel — 3.25% | ||||
| 42,200 | Men’s Warehouse, Inc.* | $ | 1,082,430 | |
| Auto Dealers, Gas Stations — 3.10% | ||||
| 31,600 | Carmax, Inc.* | 1,032,056 | ||
| Chemicals — 3.13% | ||||
| 55,800 | Western Wireless Corp.* | 1,041,786 | ||
| Communications — 3.19% | ||||
| 185,300 | Sprint Corp. - PCS Group* | 1,061,769 | ||
| Computers — 21.99% | ||||
| 63,100 | Avnet, Inc.* | 1,042,412 | ||
| 23,600 | Cummins, Inc. | 1,048,548 | ||
| 181,100 | Gateway, Inc.* | 1,025,026 | ||
| 39,400 | Jabil Circuit, Inc.* | 1,026,370 | ||
| 87,000 | Maxtor Corp.* | 1,058,790 | ||
| 42,600 | Storage Technology Corp.* | 1,028,364 | ||
| 84,600 | Western Digital Corp.* | 1,090,494 | ||
| 7,320,004 | ||||
| Electric, Gas, Sanitary Services — 3.14% | ||||
| 96,600 | Allied Waste Industries, Inc.* | 1,043,280 | ||
| Electronics — 12.93% | ||||
| 103,800 | Avaya, Inc.* | 1,131,420 | ||
| 23,100 | Benchmark Electronics, Inc.* | 976,437 | ||
| 41,600 | Trinity Industries | 1,075,360 | ||
| 11,400 | Harman International | 1,121,190 | ||
| 4,304,407 | ||||
| Engineering & Construction — 3.10% | ||||
| 67,500 | Perkinelmer, Inc. | 1,033,425 | ||
| Healthcare-Services — 3.13% | ||||
| 36,200 | Select Medical Corp.* | 1,042,560 | ||
| Insurance — 3.21% | ||||
| 21,900 | Pacificare Health Services* | 1,068,720 | ||
| Metal Fabricate/Hardware — 3.27% | ||||
| 31,000 | Precision Castparts | 1,088,100 | ||
See notes to the financial statements.
| 22 | ||
Hennessy Focus 30 Fund
SCHEDULE OF INVESTMENTS — (Continued)
September 30, 2003
SCHEDULE OF INVESTMENTS — (Continued)
September 30, 2003
| Number | |||||||||
| of Shares | Value | ||||||||
| COMMON STOCKS (Continued) | |||||||||
| Non-Depository Credit Institutions — 3.40% | |||||||||
| 96,100 | Providian Financial Corp.* | $ | 1,133,019 | ||||||
| Paper & Allied Products — 6.50% | |||||||||
| 77,300 | Louisiana-Pacific Co.* | 1,065,194 | |||||||
| 45,300 | Georgia Pacific Co. | 1,098,072 | |||||||
| 2,163,266 | |||||||||
| Retail — 9.88% | |||||||||
| 33,300 | Freds, Inc. | 1,097,568 | |||||||
| 59,100 | Hasbro, Inc. | 1,103,988 | |||||||
| 210,500 | Rite Aid Corp.* | 1,086,180 | |||||||
| 3,287,736 | |||||||||
| Transportation — 9.52% | |||||||||
| 14,000 | Paccar, Inc. | 1,041,460 | |||||||
| 63,500 | Continental Airlines* | 1,052,830 | |||||||
| 41,300 | J. B. Hunt* | 1,074,626 | |||||||
| 3,168,916 | |||||||||
| Wholesale-Nondurable Goods — 3.03% | |||||||||
| 30,700 | Tractor Supply Company* | 1,007,267 | |||||||
Total Common Stocks (Cost $33,605,372) | 31,878,741 | ||||||||
Principal Amount | |||||||||
| Variable Rate Demand Notes — 4.23% | |||||||||
| $595,429 | American Family Demand Note, 0.7407%, due 12/31/2031 | 595,429 | |||||||
| 812,270 | Wisconsin Corporate Central Credit Union, 0.7900% | 812,270 | |||||||
Total Variable Rate Demand Notes (Cost $1,407,699) | 1,407,699 | ||||||||
Total Investments — 100.00% (Cost $35,013,071) | 33,286,440 | ||||||||
| Assets, less Other Liabilities — 0.00% | 834 | ||||||||
| NET ASSETS — 100% | $33,287,274 | ||||||||
* Non-income producing security
See notes to the financial statements.
| 23 | ||
NOTES TO THE FINANCIAL STATEMENTS
September 30, 2003
1). ORGANIZATION
The Hennessy Mutual Funds, Inc. (the “Company”) was organized as a Maryland corporation on May 20, 1996 and consists of three separate series (the “Funds”): Hennessy Cornerstone Growth Fund (the “Growth Fund”), formerly O’Shaughnessy Cornerstone Growth Fund and Hennessy Cornerstone Value Fund (the “Value Fund”), formerly O’Shaughnessy Cornerstone Value Fund and the Hennessy Focus 30 Fund (the “Focus 30 Fund”), formerly SYM Select Growth Fund. The Funds are open-end, diversified management investment companies registered under the Investment Company Act of 1940, as amended. The Growth Fund and Value Fund commenced operations on November 1, 1996. The Focus 30 Fund commenced operations on January 2, 2001.
2). SIGNIFICANT ACCOUNTING POLICIES
The following is a summary of significant accounting policies consistently followed by the Funds in the preparation of the financial statements. These policies are in conformity with accounting principles generally accepted in the United States of America (“GAAP”).
a). Investment Valuation – Securities which are traded on a national or recognized stock exchange are valued at the last sale price on the securities exchange on which such securities are primarily traded. Exchange-traded securities for which there were no transactions that day and debt securities are valued at the most recent bid prices. Instruments with a remaining maturity of 60 days or less are valued on an amortized cost basis.
b). Federal Income Taxes – Provision for federal income taxes or excise taxes has not been made since the Funds have elected to be taxed as “regulated investment companies” and intend to distribute substantially all taxable income to shareholders and otherwise comply with the provisions of the Internal Revenue Code applicable to regulated investment companies. Net investment income and realized gains and losses for federal income tax purposes may differ from that reported on the financial statements because of temporary book and tax basis differences. Temporary differences are primarily the result of the treatment of wash sales, capital loss carryforwards, and deferred post-October losses for tax reporting purposes. Distributions from net realized gains for book purposes may include short-term capital gains which are included as ordinary income to shareholders for tax purposes. The tax character of distributions paid during the fiscal year ended September 30, 2003 was as follows:
| Growth | Value | Focus | |||
| Fund | Fund | 30 Fund | |||
| Distributions paid from: | |||||
| Ordinary income | $378,851 | $360,831 | $— | ||
| Long-term capital gain | 14,633,089 | — | — | ||
| $15,011,940 | $360,831 | $— | |||
As of September 30, 2003, the components of accumulated earnings (deficit) on a tax basis were:
| Growth | Value | Focus | |||
| Fund | Fund | 30 Fund | |||
| Accumulated capital and post-October losses | $(44,076,803) | $(4,423,019) | $(9,752,982) | ||
| Unrealized appreciation (depreciation) | 172,765,513 | (114,154) | (1,726,631) | ||
| Undistributed income | — | 372,212 | — | ||
| Total accumulated earnings (deficit) | $128,688,710 | $(4,164,961) | $(11,479,613) | ||
Net investment income and realized gains and losses for federal income tax purposes may differ from that reported on the financial statements because of permanent book-to-tax differences. GAAP requires that permanent differences between financial reporting and tax reporting be reclassified between various components of net assets. As a result of permanent book-to-tax differences relating to a net operating loss, accumulated net investment loss has been decreased and paid in
NOTES TO THE FINANCIAL STATEMENTS
(Continued)
September 30, 2003
September 30, 2003
capital has been decreased by $3,179,428 for the Growth Fund and $132,021 for the Focus 30 Fund. The Funds intend to utilize provisions of the federal income tax laws which allow the Funds to carry realized capital losses forward for eight years following the year of loss and offset such losses against any future realized capital gains.
c). Income and Expenses – Dividend income is recognized on the ex-dividend date and interest income is recognized on an accrual basis. The Funds are charged for those expenses that are directly attributable to the portfolio, such as advisory, administration and certain shareowner service fees.
d). Distributions to Shareowners – Dividends from net investment income and net realized capital gains, if any, are declared and paid at least annually.
e). Security Transactions – Investment and shareowner transactions are recorded on the trade date. The Funds determine the gain or loss realized from the investment transactions by comparing the original cost of the security lot sold with the net sale proceeds. Discounts and premiums on securities purchased are accreted/amortized over the life of the respective security.
f). Use of Estimates – The preparation of financial statements in conformity with GAAP requires management to make estimates and assumptions that affect the reported amounts of assets and liabilities and disclosure of contingent assets and liabilities at the date of the financial statements and the reported change in net assets during the reporting period. Actual results could differ from those estimates.
3). INVESTMENT MANAGEMENT FEE AND
OTHER TRANSACTIONS WITH AFFILIATES
Hennessy Advisors, Inc. (the “Manager”) is the manager of the Funds. The Manager provides the Funds with investment management services under a Management Agreement. The Manager furnishes all investment advice, office space, facilities, and provides most of the personnel needed by the Funds. As compensation for its services, the Manager is entitled to a monthly fee from each Fund at the annual rate of 0.74% based upon the average daily net assets of the Funds.
The Manager has agreed to reimburse the Focus 30 Fund to the extent necessary to insure that the “Total Annual Fund Operating Expense” does not exceed 1.45%. The fee waiver that appears in the Statement of Operations for the Focus 30 Fund are fees that were waived by the predecessor fund. There were no fees waived for the period September 18, 2003 through September 30, 2003.
The Board of Directors has approved a Shareholder Servicing Plan which was instituted to compensate the Manager for the non-investment management services it provides the fund. The Plan provides for a monthly fee paid to the Manager at an annual rate of 0.10% of the average daily net assets of the Cornerstone Growth and Cornerstone Value Funds.
U.S. Bancorp Fund Services, LLC (the “Administrator”) acts as the Funds’ Administrator under an Administration Agreement. The Administrator prepares various federal and state regulatory filings, reports and returns for the Funds; prepares reports and materials to be supplied to the directors; monitors the activities of the Funds’ custodian, transfer agent and accountants; coordinates the preparation and payment of the Funds’ expenses and reviews the Funds’ expense accruals. Fees paid to U.S. Bancorp Fund Services, LLC for the year ended September 30, 2003 were $1,422,319, $50,237 and $47,341 for Growth and Value Funds and the nine months ended September 30, 2003 for the Focus 30 Funds, respectively.
The SYM Select Growth Fund was the predecessor fund of the Focus 30 Fund. All performance and operations reported for periods before September 18, 2003, represent the activity of the SYM Select Growth Fund.
SYM Financial Corporation was the manager of the SYM Select Growth Fund. Under the terms of the
| 24 | ||
NOTES TO THE FINANCIAL STATEMENTS
(Continued)
September 30, 2003
September 30, 2003
agreement the Manager received a monthly fee at the annual rate of 1.00% of the Fund’s average daily net assets.
U.S. Bancorp Fund Services, LLC served as the Administrator to the fund. Under the terms of the agreement the Administrator was paid a monthly fee at the following annual rate:
| Under $15 million | $30,000 |
| $15 - 50 million | 0.20% of average daily net assets |
Quasar Distributors, LLC (the “Distributor”) acts as the Funds’ principal underwriter in a continuous public offering of the Funds’ shares. The Distributor is an affiliated company of U.S. Bank, N.A.
4). INVESTMENT TRANSACTIONS
During the year ended September 30, 2003, purchases and sales of investment securities (excluding short-term investments) were as follows:
| Growth | Value | Focus | |
| Fund | Fund | 30 Fund | |
| Purchases | $622,177,144 | $11,620,550 | $85,554,182 |
| Sales | $380,370,289 | $10,209,114 | $84,934,947 |
At September 30, 2003 the cost of investments on a tax basis were as follows:
Growth Fund | Value Fund | Focus 30 Fund | |||||
| Cost for federal income tax purposes | $717,863,311 | $20,514,116 | $35,013,071 | ||||
| Net tax unrealized appreciation (depreciation) | 172,765,513 | (114,154) | (1,726,631) | ||||
| Tax basis gross unrealized appreciation | 183,796,219 | 1,888,292 | 40,313 | ||||
| Tax basis gross unrealized depreciation | (11,030,706) | (2,002,446) | (1,766,944) |
At September 30, 2003, the Value Fund had tax basis capital losses of $2,747,053, which may be carried over to offset future capital gains. Of such losses, $142,288 expire September 30, 2007, $1,000,839 expire September 30, 2008, $1,494,930 expire September 30, 2009, and $108,996 expire September 30, 2011. Also, at September 30, 2003, the Focus 30 Fund had tax basis capital losses of $9,752,982, which may be carried over to offset future capital gains. Of such losses, $1,438,468 expire September 30, 2008 and $8,314,514 expire September 30, 2009.
Additionally, at September 30, 2003, the Value Fund and Growth Fund deferred on a tax basis a post-October loss of $1,675,966 and $44,076,803, respectively.
5). SECURITIES LENDING
The Funds have entered into a securities lending arrangement with the custodian. Under the terms of the agreement, the custodian is authorized to loan securities on behalf of the Funds to approved brokers against the receipt of cash collateral at least 102% of the value of the securities loaned. The cash collateral is invested by the custodian in a money market pooled account approved by the Adviser. Although risk is mitigated by the collateral, the Funds could experience a delay in recovering its securities and possible loss of income or value if the borrower fails to return them. The agreement provides that after predetermined rebates to the brokers, the income generated from lending transactions is allocated 60% to the Fund and 40% to the custodian. As of September 30, 2003, the Gr owth Fund and Value Fund had on loan securities valued at $134,886,679 and $258, respectively, and collateral of $139,599,730 and $140,800, respectively.
6). LINE OF CREDIT
The Growth Fund and Value Fund have $20,000,000 and $500,000 lines of credit, respectively, intended to provide short-term financing, if necessary, subject to certain restrictions, in connection with shareholder redemptions. The credit facility is with its custodian bank, U.S. Bank, N.A. The credit facility requires the payment of a commitment fee equal to 0.10% per annum on the daily unused portion of the credit facility, payable monthly. During the year ended September 30, 2003, neither the Growth Fund or Value Fund borrowed on the line of credit.
| 25 | ||
NOTES TO THE FINANCIAL STATEMENTS
(Continued)
September 30, 2003
September 30, 2003
7). FUND MERGERS
On September 17, 2003 the shareholders of the SYM Select Growth Fund approved the agreement and plan of reorganization providing for the transfer of assets of the SYM Select Growth Fund to the Hennessy Focus 30 Fund and the assumption of the liabilities of the SYM Select Growth Fund by the Hennessy Focus 30 Fund. On September 18, 2003 the merger was transacted. The following table illustrates the specifics of the merger:
Acquired Fund Net Assets | Shares issue to Shareholders of Acquired Fund | Acquiring Fund Net Assets | Combined Net Assets | Tax Status of Transfer |
34,685,965 (1) | 4,290,875 | — | 34,685,965 | Non-taxable |
(1) Includes capital loss carryovers and unrealized appreciation in the amount of $10,008,182 and $75,600 respectively.
8). ADDITIONAL DISCLOSURE REGARDING FUND DIRECTORS (UNAUDITED)
Name, Age and Address | Position(s) Held with the Company | Term of Office and Length of Time Served | Principal Occupation During Past Five Years | # of Funds in Complex overseen by Director | Other Directorships Held by Directors | ||
| Independent Directors | |||||||
Robert T. Doyle, 55 87 Washington St. Novato, CA 94947 | Independent Director | Indefinite Term; Served since January 1996. | Currently the Sheriff of Marin County, California (since 1996) and has been employed in the Marin County Sheriff’s Office in various capacities since 1969. | 5 | Director of The Hennessy Funds, Inc. | ||
J. Dennis DeSousa, 66 340 Singing Brook Circle Santa Rosa, CA 95409 | Independent Director | Indefinite Term; Served since January 1996. | Currently a real estate investor; Owner/director, North Bay Television, Inc. (1985-1999). | 5 | Director of The Hennessy Funds, Inc. | ||
Harry F. Thomas, 55 50 Shields Lane Novato, CA 94945 | Independent Director | Indefinite Term; Served since May 2002. | Currently a retired business executive; Managing Director of Emplifi, Inc. (1999-2001); Vice President and Manager, Employee Benefit Trust Operation of Wells Fargo Bank (1997-1999); and Trust Systems Manager and Vice President of Wells Fargo Bank since 1992. | 5 | Director of The Hennessy Funds, Inc. | ||
| Interested Director | |||||||
Neil J. Hennessy, 47 Hennessy Advisors, Inc. The Courtyard Square 750 Grant Ave., Ste. 100 Novato, CA 94945 | Director, President and Treasurer | Indefinite Term; Served since January 1996. | President of the Manager since 1989; President and Investment Manager of The Hennessy Mutual Funds, Inc. since 1996. | 5 | Director of The Hennessy Funds, Inc. | ||
| 26 | ||
REPORT OF INDEPENDENT ACCOUNTANTS
The Shareholders and Board of Directors
The Hennessy Mutual Funds, Inc.
The Hennessy Mutual Funds, Inc.
We have audited the accompanying statements of assets and liabilities of The Hennessy Mutual Funds, Inc. (comprising, respectively, the Hennessy Cornerstone Growth Fund, the Hennessy Cornerstone Value Fund, and the Hennessy Focus 30 Fund, formerly the SYM Select Growth Fund), collectively referred to as the “Funds”, including the schedules of investments as of September 30, 2003, and the related statements of operations for the year then ended (nine-month period then ended for the Hennessy Focus 30 Fund), the statements of changes in net assets for each of the years in the two-year period then ended (nine-month period then ended for the Hennessy Focus 30 Fund), and the financial highlights for each of the years in the three-year period then ended (nine-month period then ended for the Hennessy Focus 30 Fund). These financial statements and financial highlights are the responsibility of the Fu nds’ management. Our responsibility is to express an opinion on these financial statements and financial highlights based on our audits. The accompanying financial highlights for the Hennessy Cornerstone Growth Fund and the Hennessy Cornerstone Value Fund for the two years ended September 30, 2000 were audited by other auditors whose report thereon dated November 13, 2000, expressed an unqualified opinion on these statements. The accompanying financial statements of the Hennessy Focus 30 Fund including the statements of operations for the year ended December 31, 2002 and the statements of the changes in net assets and the financial highlights for the year ended December 31, 2002 and period January 2, 2001 through December 31, 2001 were audited by other auditors whose report thereon dated January 25, 2003, expressed an unqualified opinion on these statements.
We conducted our audits in accordance with auditing standards generally accepted in the United States of America. Those standards require that we plan and perform the audit to obtain reasonable assurance about whether the financial statements and financial highlights are free of material misstatement. An audit includes examining, on a test basis, evidence supporting the amounts and disclosures in the financial statements. Our procedures included confirmation of securities owned, by correspondence with the custodian and broker. An audit also includes assessing the accounting principles used and significant estimates made by management, as well as evaluating the overall financial statement presentation. We believe that our audits provide a reasonable basis for our opinion.
In our opinion, the financial statements and financial highlights referred to above present fairly, in all material respects, the financial position of the Hennessy Cornerstone Growth Fund, the Hennessy Cornerstone Value Fund, and the Hennessy Focus 30 Fund as of September 30, 2003, and the results of their operations for the year then ended (nine-month period then ended for the Hennessy Focus 30 Fund), the changes in their net assets for each of the years in the two-year period then ended (nine-month period then ended for the Hennessy Focus 30 Fund) and the financial highlights for each of the years in the three-year period then ended (nine-month period then ended for the Hennessy Focus 30 Fund), in conformity with accounting principles generally accepted in the United States of America.

November 14, 2003
Chicago, Illinois
Chicago, Illinois
| 27 | ||
(This Page Intentionally Left Blank.)
| 28 | ||
(This Page Intentionally Left Blank.)
| 29 | ||
(This Page Intentionally Left Blank.)
| 30 | ||
Item 2. Code of Ethics.
The registrant has adopted a code of ethics that applies to the registrant’s principal executive officer and principal financial officer. The registrant has not made any amendments to its code of ethics during the covered period. The registrant has not granted any waivers from any provisions of the code of ethics during the covered period.
The registrant undertakes to provide to any person without charge, upon request, a copy of its code of ethics by mail when they call the registrant at 1-800-966-4354.
Item 3. Audit Committee Financial Expert.
The registrant’s board of directors has determined that there is at least one audit committee financial expert serving on its audit committee. Harry F. Thomas is the audit committee financial expert and is considered to be independent.
Item 5. Audit Committee of Listed Registrants.
Not applicable to open-end investment companies.
Item 6. [Reserved]
Item 7. Disclosure of Proxy Voting Policies and Procedures for Closed-End Management Investment Companies.
Not applicable to open-end investment companies.
Item 8. [Reserved]
Item 9. Controls and Procedures.
(a) The Registrant’s President/Chief Executive Officer and Treasurer/Chief Financial Officer have concluded that the Registrant's disclosure controls and procedures (as defined in Rule 30a-3(c) under the Investment Company Act of 1940 (the “Act”)) are effective as of a date within 90 days of the filing date of the report that includes the disclosure required by this paragraph, based on the evaluation of these controls and procedures required by Rule 30a-3(b) under the Act.
(b) There were no changes in the Registrant's internal control over financial reporting (as defined in Rule 30a-3(d) under the Act) that occurred during the Registrant's last fiscal half-year that has materially affected, or is reasonably likely to materially affect, the registrant's internal control over financial reporting.
Item 10. Exhibits.
(a) (1) Any code of ethics or amendment thereto. Filed herewith.
(2) Certifications pursuant to Section 302 of the Sarbanes-Oxley Act of 2002. Filed herewith.
(b) Certification pursuant to Section 906 of the Sarbanes-Oxley Act of 2002. Furnished herewith.
SIGNATURES
Pursuant to the requirements of the Securities Exchange Act of 1934 and the Investment Company Act of 1940, the registrant has duly caused this report to be signed on its behalf by the undersigned, thereunto duly authorized.
(Registrant) The Hennessy Mutual Funds, Inc.
By (Signature and Title) /s/ Neil J. Hennessy
Neil J. Hennessy, President
Date December 5, 2003
Pursuant to the requirements of the Securities Exchange Act of 1934 and the Investment Company Act of 1940, this report has been signed below by the following persons on behalf of the registrant and in the capacities and on the dates indicated.
By (Signature and Title) /s/ Neil J. Hennessy
Neil J. Hennessy, President, Treasurer
Date December 5, 2003