 www.edgewater.com CJS Securities, Inc. New Ideas for the New Year Conference January 9, 2008 Presentation by: Shirley Singleton Chairman, President & CEO CJS Securities, Inc. New Ideas for the New Year Conference January 9, 2008 Presentation by: Shirley Singleton Chairman, President & CEO Exhibit 99.1 |
 2 www.edgewater.com Safe Harbor Language Certain statements contained in this presentation and in the subsequent discussion that are not statements of historical facts are "forward looking statements" within the meaning of the Private Securities Litigation Reform Act of 1995. The words - "believe," "expect," "anticipate," "intend," "will" and similar expressions are examples of words that identify forward-looking statements. Forward-looking statements include, without limitation, statements regarding our future financial position, growth including acquisitions, potential margin improvements, business strategy, revenue goals and profitability as of today's date. These forward looking statements are based on our current beliefs, as well as assumptions we have made based upon information currently available to us. Actual results could vary significantly from those results implied, stated or projected in any such forward looking statements for a variety of reasons, including those set forth in our press releases and SEC filings, and we are not obligated to update these forward-looking statements made as of today to conform these statements for intervening events. |
 3 www.edgewater.com Edgewater Technology (NASDAQ: EDGW) Edgewater Technology (NASDAQ: EDGW) Technical Management Consulting Firm - Premium Information Technology (IT) Services Market Opportunity - Focused on High Margin Specialty or Premium IT Services - Centered on the middle market, which is where all of the major hardware/software vendors are looking for growth EDGW = Growth Company - Two-pronged strategy • Organic Growth • Acquisitions to accelerate growth |
 4 www.edgewater.com Why Should You Be Interested in Us? Why Should You Be Interested in Us? Compounded Annual Growth Rate (CAGR) - 40% over past 3 years Focused on Strategy Engagements & Moving up the Pyramid of IT Services Doubled CPM Practice during 2007* Continue to Build a National Footprint in Premium IT Services *Includes revenue run rate for CPM practice, including acquisitions of Alecian, Lynx and Vertical Pitch . |
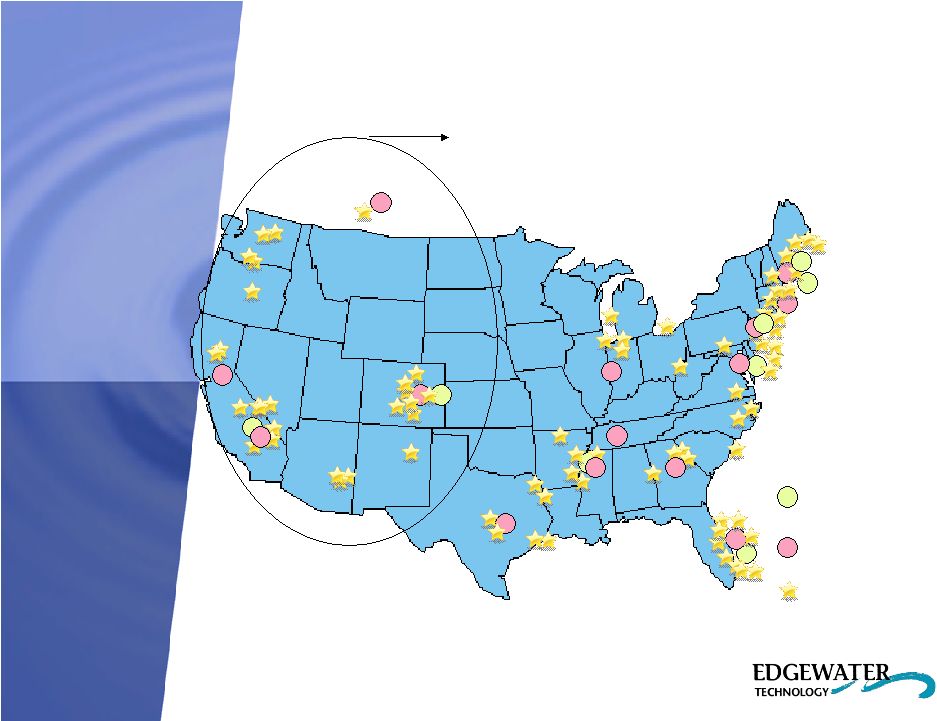 5 www.edgewater.com Geographic Expansion in US Geographic Expansion in US Los Angeles Denver Boston Calgary Office Locations BDM Locations Staff Locations New in 2007 San Francisco Dallas Memphis Manchester Sterling New York |
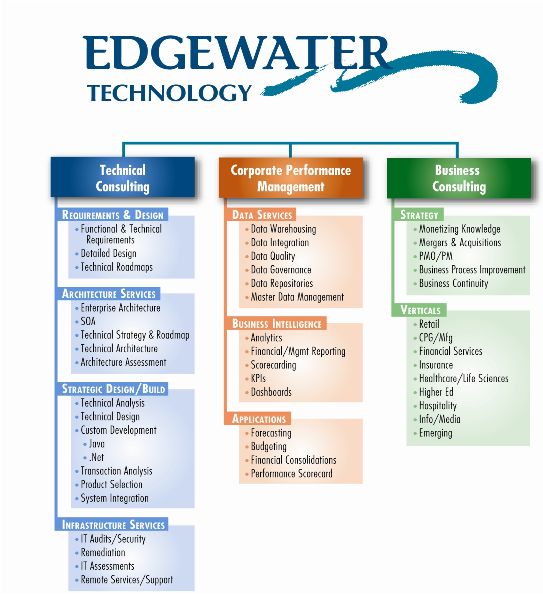 Service Offerings Service Offerings 6 58% of Svs. Revenue 58% of Svs. Revenue 29% of Svs. Revenue 29% of Svs. Revenue 13% of Svs. Revenue 13% of Svs. Revenue (All service revenue percentages are as of 9/30/07.) |
 7 www.edgewater.com Acquisition Strategy Acquisition Strategy Completed Three Strategic Acquisitions in ‘07 - Vertical Pitch, LLC (December ‘07) • CPM/BI/BAM Horizontal • Continues the expansion of Edgewater’s national footprint to West • Accretive - Lynx Business Intelligence Consulting, Inc. (September ’07) • CPM/BI/BAM Horizontal • Enhances CPM/BI Offering and Expands Domestic Geographical footprint to the West Coast • Accretive - Alecian Corporation (July ’07) • CPM/BI/BAM Horizontal • Accretive |
 8 www.edgewater.com 2008 Outlook 2008 Outlook Trends: - Continued high demand for BI / CPM - Emergence of Analytics - Revitalization of Web/Internet Challenges: - Near-term Organic Growth in Tech Consulting - Need CPM Resources to Sustain Growth - Retrain existing staff to keep in line with trends - Competitive Pay Pressure Potential Outcome: - CPM Growth continues to be strong - Continue to focus on strategic acquisitions - Changing Revenue Mix |
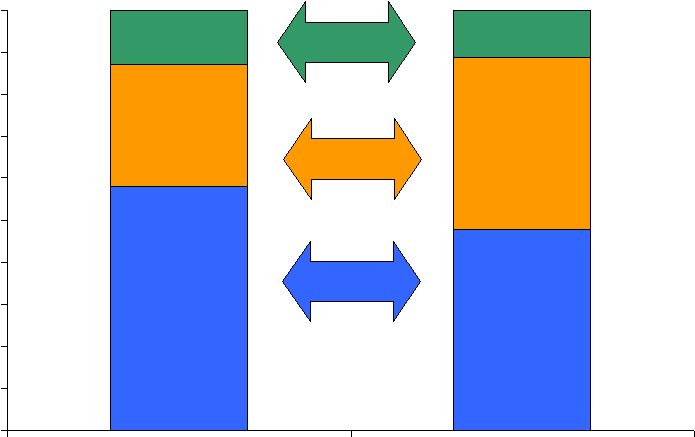 Estimated Change in Service Offerings – Business Mix in 2008 Estimated Change in Service Offerings – Business Mix in 2008 9 58% 48% 29% 41% 13% 11% 0% 10% 20% 30% 40% 50% 60% 70% 80% 90% 100% 2007 2008 Business Consulting CPM Consulting Technical Consulting |
 10 www.edgewater.com Acquisition Strategy Acquisition Strategy Go-forward Acquisition Guidelines - Add to Premium Services - Enhance Geographical Footprint - Additional Vertical Expertise - Target Size - Revenue Size • $5m to $20m - Accretive - Internal Rate of Return > 20% - Target Valuation of 5 – 7 x EBITDA - Combination of Cash and Stock |
 11 www.edgewater.com Edgewater’s Growth Goals Edgewater’s Growth Goals Focus on becoming the Premier Specialty IT Services Company in the US Continue to drive revenue growth in 2008 Continue to focus on business fundamentals and execute strategy Find acquisition(s) to fit into and/or expand our service offerings Target of $100m Revenue Run Rate - Not Guidance but a Meaningful Hurdle - Disciplined Growth Strategy |
 12 www.edgewater.com Investment Considerations Investment Considerations Seasoned Management Team Management Aligned with Shareholders - 18% Officer Ownership (stock & options) - Performance-based Compensation Strong Operating Metrics Strong Balance Sheet (as of 9/30/07) - $100m+ in Total Assets • 13% growth in Working Capital over last 12 Months • $31.8m in Cash & Securities $14m used in the purchase of Vertical Pitch in 12/07 • $16.9m Deferred Tax Asset (NOLs) |
 Financial Graphs & Non-GAAP Earnings Analysis Financial Graphs & Non-GAAP Earnings Analysis |
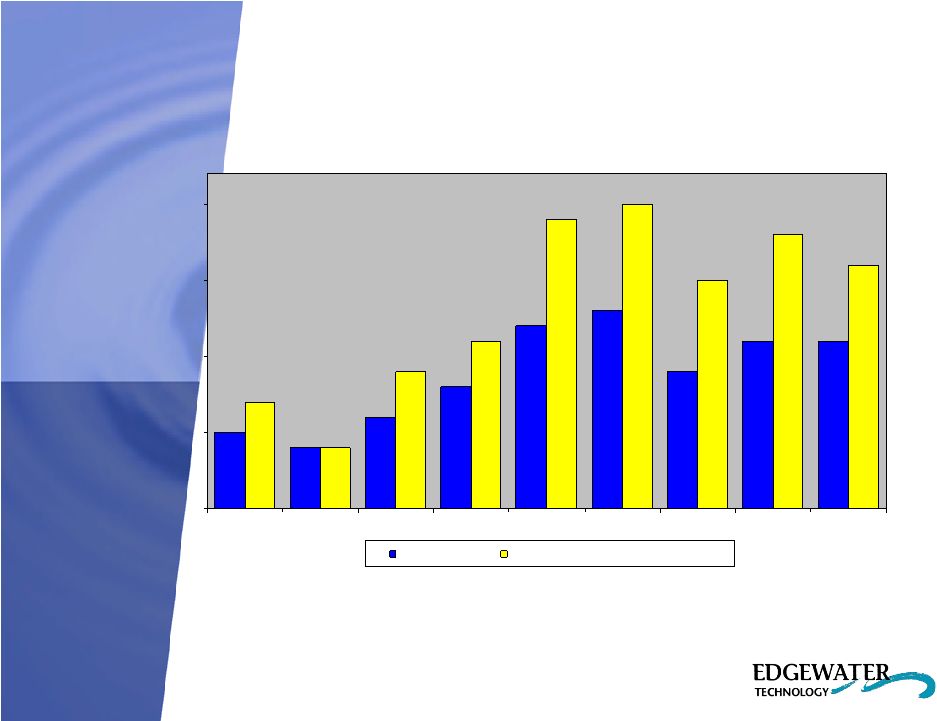
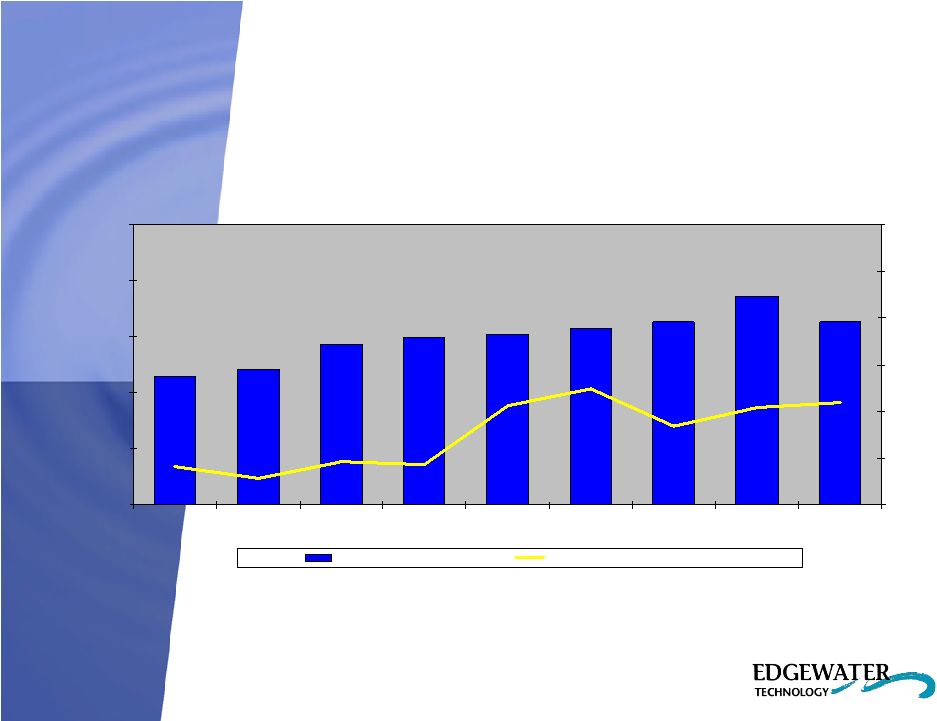 Financial Performance Financial Performance 14 www.edgewater.com 11,496 12,111 14,308 15,163 15,722 16,272 18,577 16,352 1,097 1,046 281 414 460 837 1,244 1,064 460 $0 $5,000 $10,000 $15,000 $20,000 $25,000 Q3 '05 Q4 '05 Q1 '06 Q2 '06 Q3 '06 Q4 '06 Q1 '07 Q2 '07 Q3 '07 $0 $500 $1,000 $1,500 $2,000 $2,500 $3,000 Revenue Income from Continuing Operations Quarterly Revenue & Income from Continuing Operations (000's) |
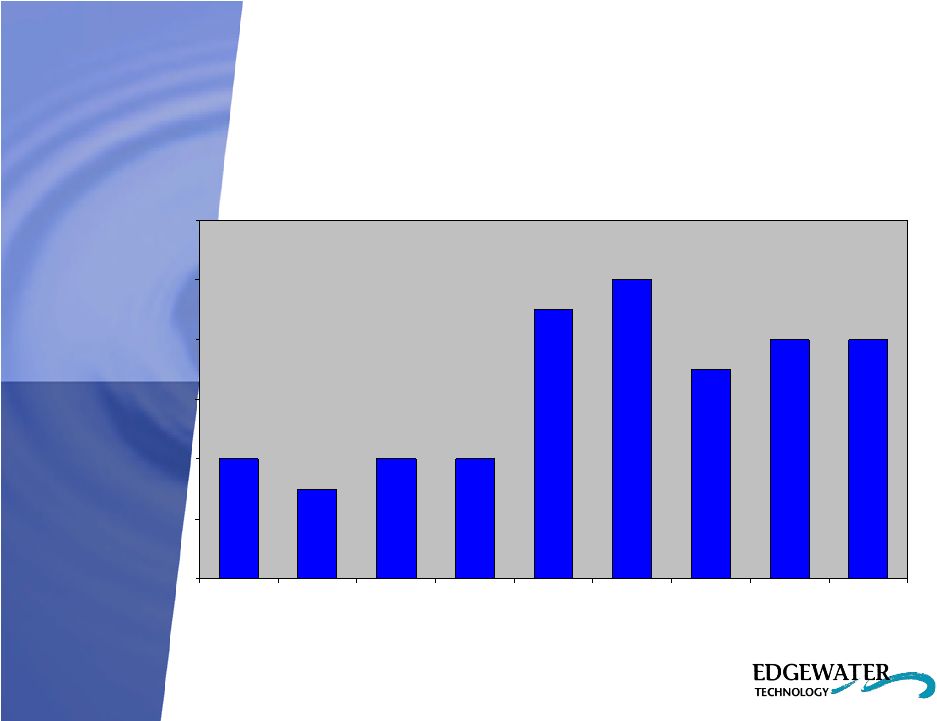 15 www.edgewater.com Financial Performance Financial Performance Quarterly Diluted Income from Continuing Operations per Share $0.04 $0.03 $0.04 $0.04 $0.09 $0.10 $0.07 $0.08 $0.08 $0.00 $0.02 $0.04 $0.06 $0.08 $0.10 $0.12 Q3 '05 Q4 '05 Q1 '06 Q2 '06 Q3 '06 Q4 '06 Q1 '07 Q2 '07 Q3 '07 |
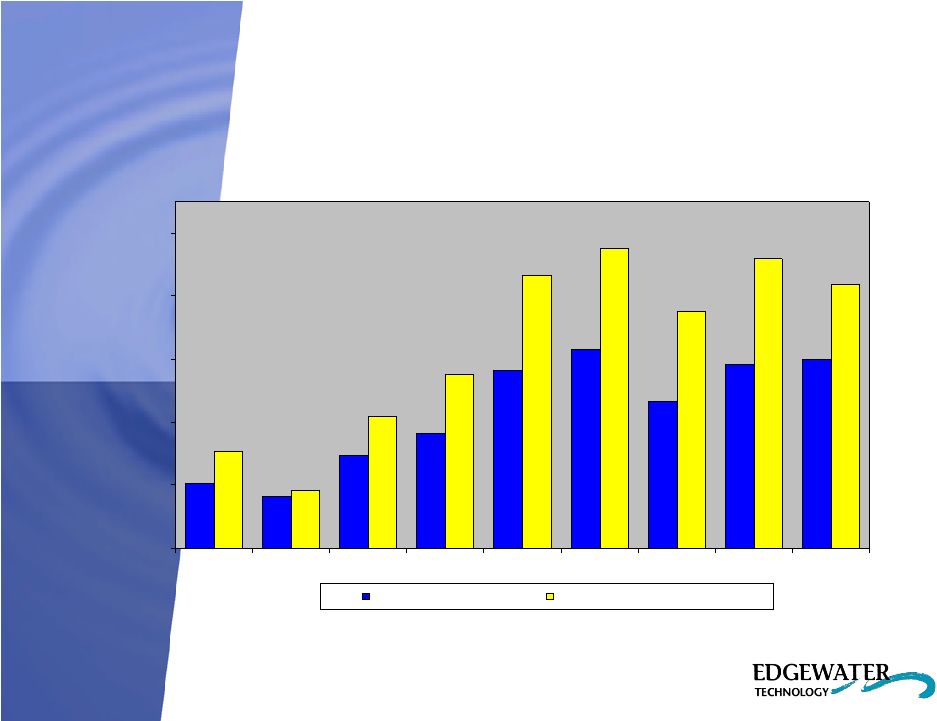 Financial Performance Financial Performance www.edgewater.com 16 407 736 913 1,405 509 1,164 1,579 1,498 1,454 1,377 2,165 2,386 1,878 1,051 769 462 2,298 2,094 $0 $500 $1,000 $1,500 $2,000 $2,500 Q3 '05 Q4 '05 Q1 '06 Q2 '06 Q3 '06 Q4 '06 Q1 '07 Q2 '07 Q3 '07 Cash Net Income Adjusted EBITDA (excludes SBC) Quarterly Cash Net Income & Adjusted EBITDA (000's) Diluted Cash Net Income and Adjusted EBITDA are Non-GAAP financial measures. Refer to the Appendix for a reconciliation of these measures to GAAP Net Income. |
 17 www.edgewater.com Financial Performance Financial Performance Quarterly Diluted Cash EPS & Adjusted EBITDA per Share 0.05 0.040.04 0.06 0.08 0.12 0.13 0.11 0.07 0.09 0.11 0.20 0.18 0.16 0.09 0.11 0.19 0.15 $0.00 $0.05 $0.10 $0.15 $0.20 Q3 '05 Q4 '05 Q1 '06 Q2 '06 Q3 '06 Q4 '06 Q1 '07 Q2 '07 Q3 '07 Cash EPS Adjusted EBITDA EPS (excludes SBC) Diluted Cash EPS and Adjusted EBITDA EPS are Non-GAAP financial measures. Refer to the Appendix for a reconciliation of these measures to GAAP Earnings per Share. |
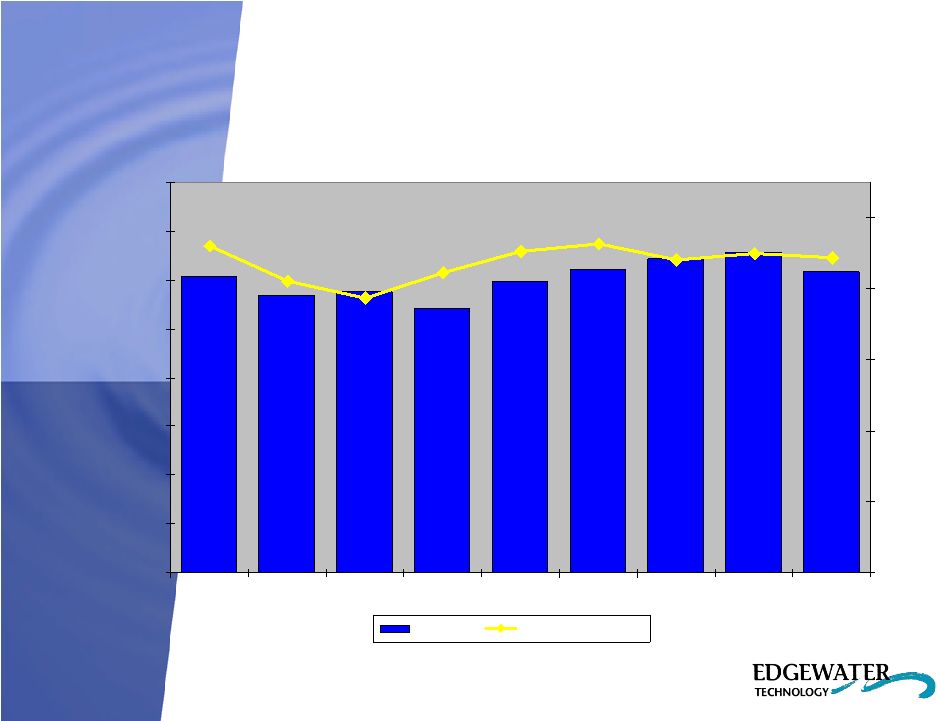 18 www.edgewater.com Financial Performance Financial Performance Target range for Utilization is 78% – 82% 79.9% 82.2% 81.1% 77.0% 78.8% 78.5% 80.3% 82.8% 80.8% 46.3% 45.2% 42.2% 38.7% 41.0% 46.0% 44.0% 44.9% 44.3% 50.0% 55.0% 60.0% 65.0% 70.0% 75.0% 80.0% 85.0% 90.0% Q3 '05 Q4 '05 Q1 '06 Q2 '06 Q3 '06 Q4 '06 Q1 '07 Q2 '07 Q3 '07 0.0% 10.0% 20.0% 30.0% 40.0% 50.0% Utilization Svcs. Gross Profit % Quarterly Utilization & Services Gross Margin |
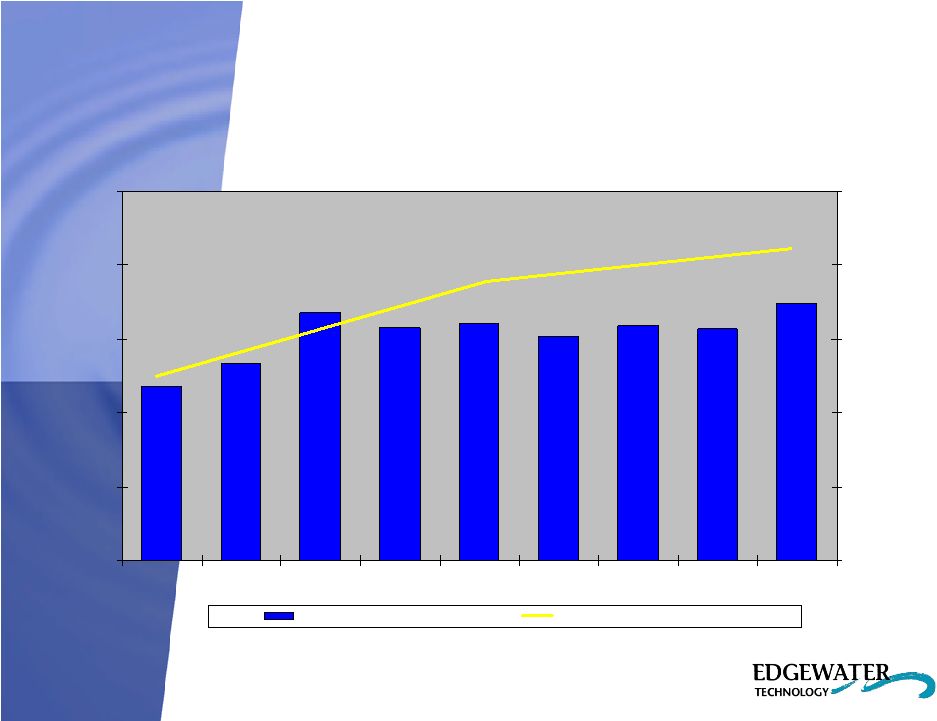 19 www.edgewater.com Financial Performance Financial Performance 274 218 233 268 258 252 259 257 261 $294,132 $264,414 $280,602 100 150 200 250 300 350 Q3 '05 Q4 '05 Q1 '06 Q2 '06 Q3 '06 Q4 '06 Q1 '07 Q2 '07 Q3 '07 $200,000 $225,000 $250,000 $275,000 $300,000 $325,000 Billable Headcount Revenue per Billable Consultant Consultant Headcount & Annual Revenue per Consultant |
 20 www.edgewater.com Q4 and Fiscal 2007 Earnings Results Call Q4 and Fiscal 2007 Earnings Results Call Scheduled : February 27, 2008 Scheduled : February 27, 2008 |
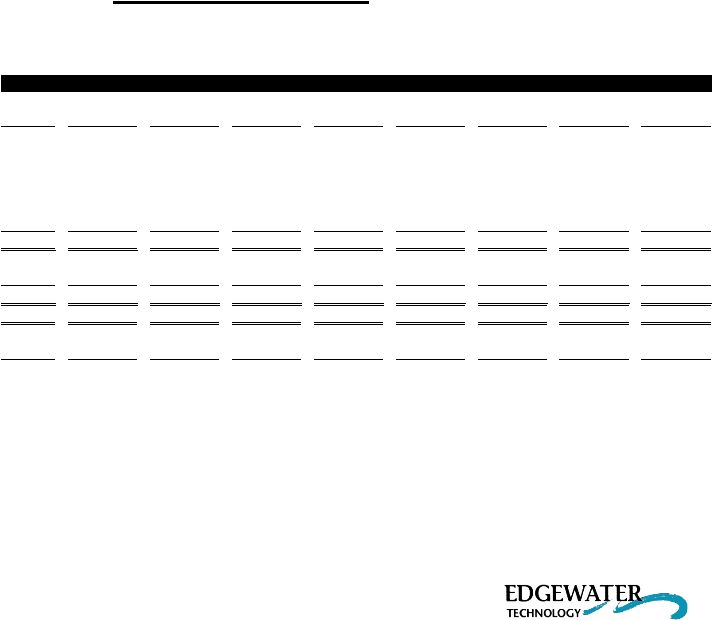
 Appendix Appendix Reconciliation of Non-GAAP Financial Measures Reconciliation of Non-GAAP Financial Measures Note: Cash Net Income and Cash Earnings per Diluted Share are Non-GAAP financial measures and are not intended to be financial measures that should be regarded as an alternative to, or more meaningful than, Net Income or GAAP Diluted Earnings per Share. The Cash Net Income and Cash Earnings per Diluted Share measures presented herein may not be comparable to similarly titled measures presented by other companies. Edgewater’s management believes that cash performance is the primary driver of long-term share value. As such, Edgewater views Cash Net Income and Cash Earnings per Diluted Share as important indicators of performance that help investors gain a meaningful understanding of the Company’s core operating results and future prospects, consistent with the manner in which management measures and forecasts the Company’s performance. www.edgewater.com 21 Sep 30, Dec 31, Mar 31, Jun 30, Sep 30, Dec 31, Mar 31, Jun 30, Sep 30, 2005 2005 2006 2006 2006 2006 2007 2007 2007 Reconciliation of GAAP Net Income to Cash Earnings Per Diluted Share (Non-GAAP): Reported GAAP Net Income 739 281 460 435 1,064 1,242 837 1,046 1,097 Less: Income from DISCO (325) - - - - - - - - Add: Amortization of Intangibles 108 108 217 327 327 314 314 312 324 Add: Stock-based Compensation 50 102 243 469 242 247 257 373 361 Less: Related Tax Effect (63) (84) (184) (318) (228) (224) (244) (277) (284) Cash Net Income 509 $ 407 $ 736 $ 913 $ 1,405 $ 1,579 $ 1,164 $ 1,454 $ 1,498 $ Cash Earnings Per Diluted Share 0.05 $ 0.04 $ 0.06 $ 0.08 $ 0.12 $ 0.13 $ 0.09 $ 0.11 $ 0.11 $ Diluted Shares Outstanding 10,943 11,210 11,335 12,156 11,659 11,839 12,449 13,119 13,134 Quarterly Period Ended |
 Appendix Appendix Reconciliation of Non-GAAP Financial Measures Reconciliation of Non-GAAP Financial Measures Note: EBITDA, Adjusted EBITDA and Adjusted EBITDA per Diluted Share are Non-GAAP financial measures and are not intended to be financial measures that should be regarded as an alternative to, or more meaningful than, either GAAP Operating Income, GAAP Net Income and Net Income per Diluted Share. The EBITDA, Adjusted EBITDA and Adjusted EBITDA per Diluted Share measures presented herein may not be comparable to similarly titled measures presented by other companies. Edgewater’s management believes that cash performance is the primary driver of long-term share value. As such, Edgewater views EBITDA, Adjusted EBITDA and Adjusted EBITDA per Diluted Share as important indicators of performance that help investors gain a meaningful understanding of the Company’s core operating results and future prospects, consistent with the manner in which management measures and forecasts the Company’s performance. www.edgewater.com 22 Sep 30, Dec 31, Mar 31, Jun 30, Sep 30, Dec 31, Mar 31, Jun 30, Sep 30, 2005 2005 2006 2006 2006 2006 2007 2007 2007 Reconciliation of GAAP Net Income to EBTIDA (Non-GAAP): Reported GAAP Net Income 739 281 460 435 1,064 1,242 837 1,046 1,097 Less: Income from DISCO (325) - - - - - - - - Add: Income Tax Provision 275 188 302 294 709 800 624 712 465 Add: Depreciation & Amortization Expense 288 208 345 461 454 495 567 568 599 Less: Interest Income (258) (317) (299) (282) (304) (398) (407) (401) (428) EBITDA 719 $ 360 $ 808 $ 908 $ 1,923 $ 2,139 $ 1,621 $ 1,925 $ 1,733 $ Add: Stock-based Compensation 50 102 243 469 242 247 257 373 361 Adjusted EBITDA 769 $ 462 $ 1,051 $ 1,377 $ 2,165 $ 2,386 $ 1,878 $ 2,298 $ 2,094 $ Adjusted EBITDA per Diluted Share 0.07 $ 0.04 $ 0.09 $ 0.11 $ 0.19 $ 0.20 $ 0.15 $ 0.18 $ 0.16 $ Diluted Shares Outstanding 10,943 11,210 11,335 12,156 11,659 11,839 12,449 13,119 13,134 Quarterly Period Ended |