 www.edgewater.com www.edgewater.com April 4, 2008 Presentation by: Kevin R. Rhodes Chief Financial Officer April 4, 2008 Presentation by: Kevin R. Rhodes Chief Financial Officer Exhibit 99.1 |
 2 www.edgewater.com Safe Harbor Language Certain statements contained in this presentation and in the subsequent discussion that are not statements of historical facts are "forward looking statements" within the meaning of the Private Securities Litigation Reform Act of 1995. The words - "believe," "expect," "anticipate," "intend," "will" and similar expressions are examples of words that identify forward-looking statements. Forward-looking statements include, without limitation, statements regarding our future financial position, growth including acquisitions, potential margin improvements, business strategy, revenue goals and profitability as of today's date. These forward looking statements are based on our current beliefs, as well as assumptions we have made based upon information currently available to us. Actual results could vary significantly from those results implied, stated or projected in any such forward looking statements for a variety of reasons, including those set forth in our press releases and SEC filings, and we are not obligated to update these forward-looking statements made as of today to conform these statements for intervening events. |
 3 www.edgewater.com Edgewater Technology (NASDAQ: EDGW) Edgewater Technology (NASDAQ: EDGW) Technical Management Consulting Firm - Premium Information Technology (IT) Services Market Opportunity - Domestic Specialty IT Services - Example – MIT EDGW = Growth Company (Value Stock) - Two-pronged strategy • Organic Growth • Acquisitions to accelerate growth |
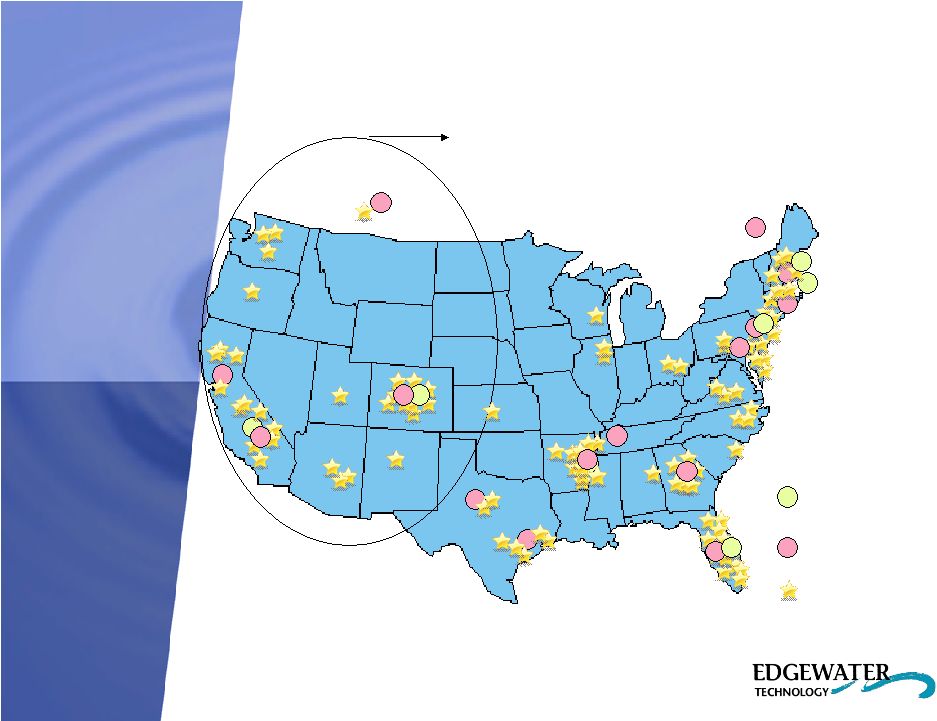 4 www.edgewater.com Geographic Expansion in US Geographic Expansion in US Los Angeles Denver Boston Calgary Office Locations BDM Locations Staff Locations New in 2007 San Francisco Dallas / Houston Memphis Manchester New York Quebec Little Rock |
 5 www.edgewater.com Why Should You Be Interested in Us? Why Should You Be Interested in Us? Growth Company - 3 Year Compounded Annual Growth Rate (CAGR)- 28% - Doubled CPM Practice during 2007* We Believe We are Undervalued Today in the Market - EV – 4.5 x multiple of Cash Flow High End IT Consulting Firm - Moving up the IT Services Pyramid - High Concept, High Value and High Touch *Includes revenue run rate for CPM practice, including acquisitions of Alecian, Lynx and Vertical Pitch . |
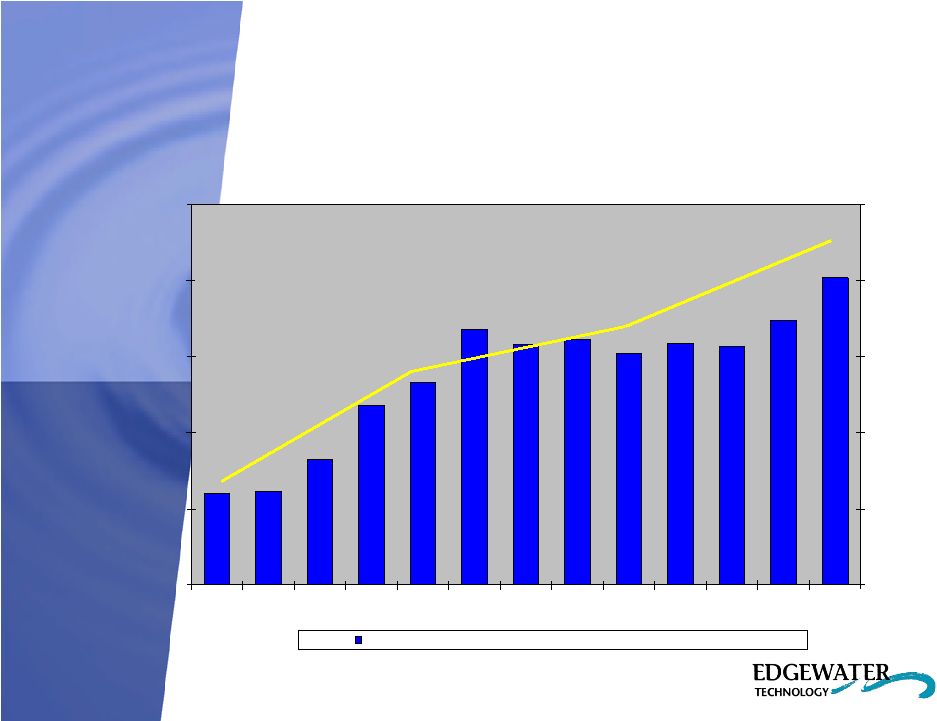 6 www.edgewater.com Consultant Headcount & Revenue Consultant Headcount & Revenue 302 274 257 259 252 160 161 183 218 268 258 261 233 $300,177 $277,548 $224,078 $260,624 100 150 200 250 300 350 Q4 '04 Q1 '05 Q2 ' 05 Q3 '05 Q4 '05 Q1 '06 Q2 '06 Q3 '06 Q4 '06 Q1 '07 Q2 '07 Q3 '07 Q4 '07 $200,000 $222,000 $244,000 $266,000 $288,000 $310,000 Billable Headcount Revenue per Billable Consultant Quarterly Consultant Headcount & Annual Revenue per Consultant |
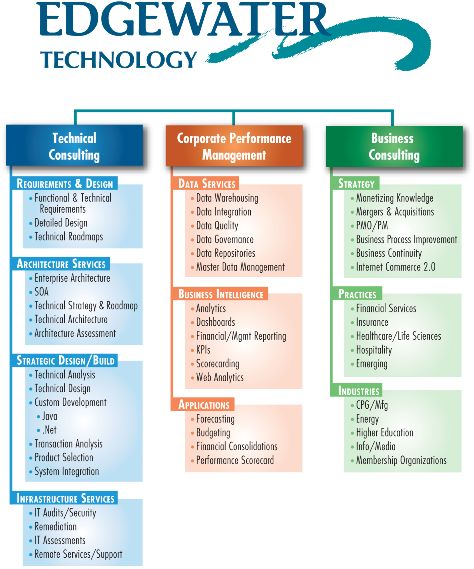 Service Offerings Service Offerings 7 57% of Svs. Revenue 57% of Svs. Revenue 30% of Svs. Revenue 30% of Svs. Revenue 13% of Svs. Revenue 13% of Svs. Revenue (All service revenue percentages are as of 12/31/07.) |
 8 www.edgewater.com 2008 Outlook and Beyond 2008 Outlook and Beyond Core Business – “Hot Areas” - BI/CPM - Vertical Focus (Healthcare & Insurance) - Data Services (“Google your own Data”) New Opportunities for Growth - Web Analytics - Predictive Analytics - Internet Commerce 2.0 Closer to $100m Revenue Run Rate Target - Not Guidance but a Meaningful Hurdle - Disciplined Growth Strategy |
 9 www.edgewater.com Investment Considerations Investment Considerations Seasoned Management Team Management Aligned with Shareholders - 18% Officer Ownership (stock & options) - Performance-based Compensation Strong Growth / Improving Metrics Strong Balance Sheet (as of December 31, 2007) - $120m+ in Total Assets • $23m in Cash & Securities $1.72 per share $14m used in the purchase of Vertical Pitch in 12/10/07 • $22m Deferred Tax Asset (Historical NOLs) $1.67 per share We Believe We are an Undervalued Stock Today in the Market |
 Financial Graphs & Non-GAAP Earnings Analysis Financial Graphs & Non-GAAP Earnings Analysis |
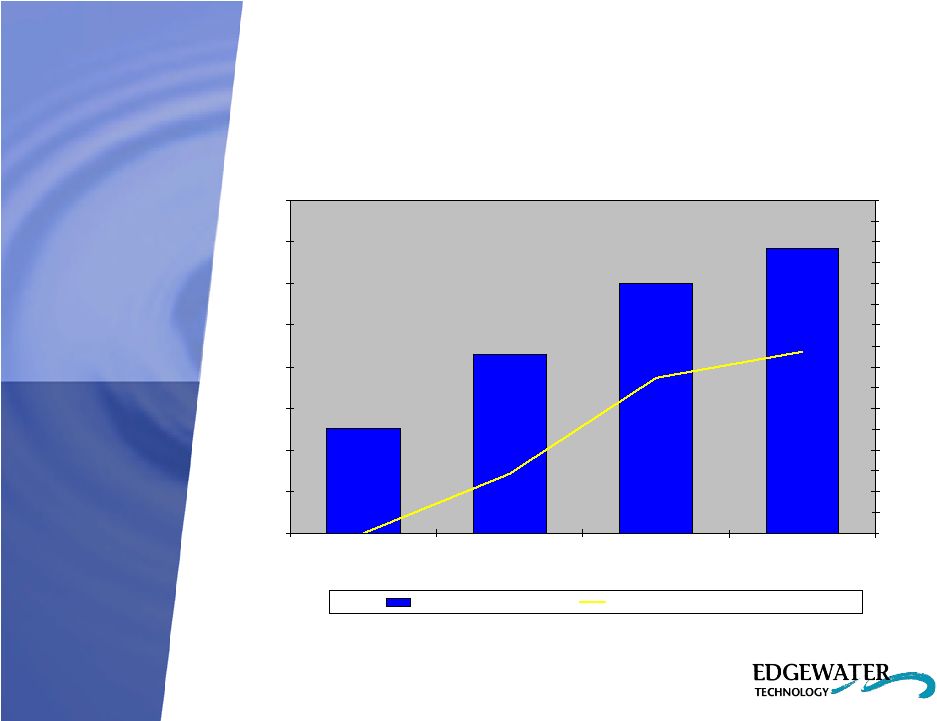 11 www.edgewater.com Annual Revenue Growth (‘04 – ‘07) Annual Revenue Growth (‘04 – ‘07) 25,322 43,126 60,083 68,490 8,242 6,979 -491 2,346 $0 $10,000 $20,000 $30,000 $40,000 $50,000 $60,000 $70,000 $80,000 2004 2005 2006 2007 -$500 $500 $1,500 $2,500 $3,500 $4,500 $5,500 $6,500 $7,500 $8,500 $9,500 $10,500 $11,500 $12,500 $13,500 $14,500 $15,500 Revenue Adjusted EBITDA (excludes SBC) Revenue & Adjusted EBITDA (000's) |
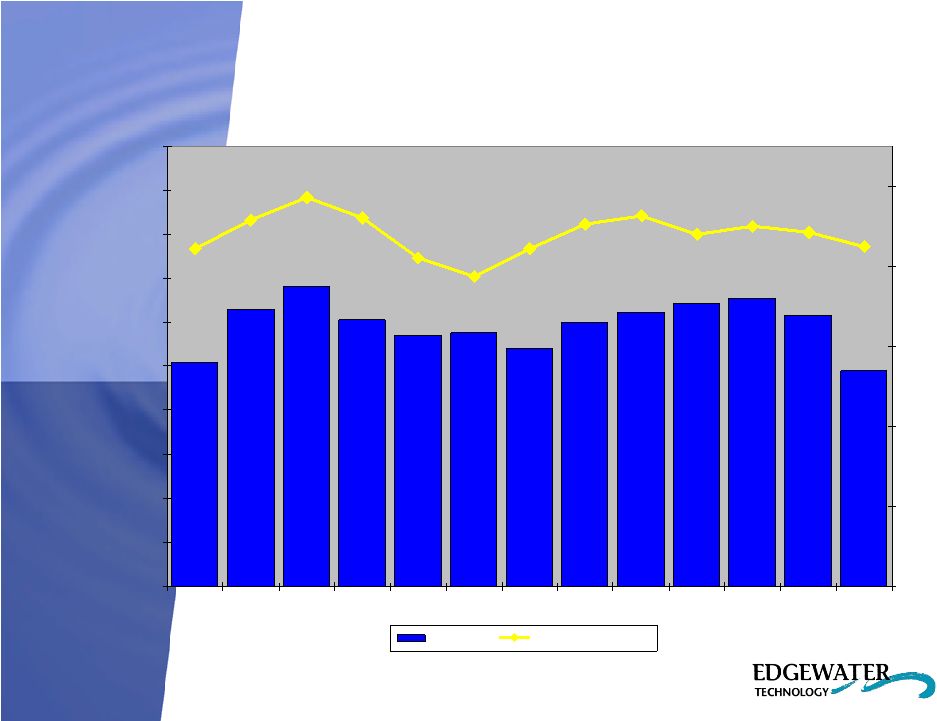 12 www.edgewater.com Financial Performance Financial Performance Target range for Utilization is 78% – 82% 78.5% 77.0% 78.8% 80.3% 84.0% 81.5% 75.4% 79.9% 81.1% 82.2% 82.8% 80.8% 74.5% 38.7% 41.0% 46.0% 48.6% 45.8% 42.2% 42.2% 45.2% 46.3% 44.0% 45.0% 44.3% 42.4% 50.0% 55.0% 60.0% 65.0% 70.0% 75.0% 80.0% 85.0% 90.0% 95.0% 100.0% Q4 '04 Q1 '05 Q2 ' 05 Q3 '05 Q4 '05 Q1 '06 Q2 '06 Q3 '06 Q4 '06 Q1 '07 Q2 '07 Q3 '07 Q4 '07 0.0% 10.0% 20.0% 30.0% 40.0% 50.0% Utilization Svcs. Gross profit % Quarterly Utilization & Services Gross Margin |
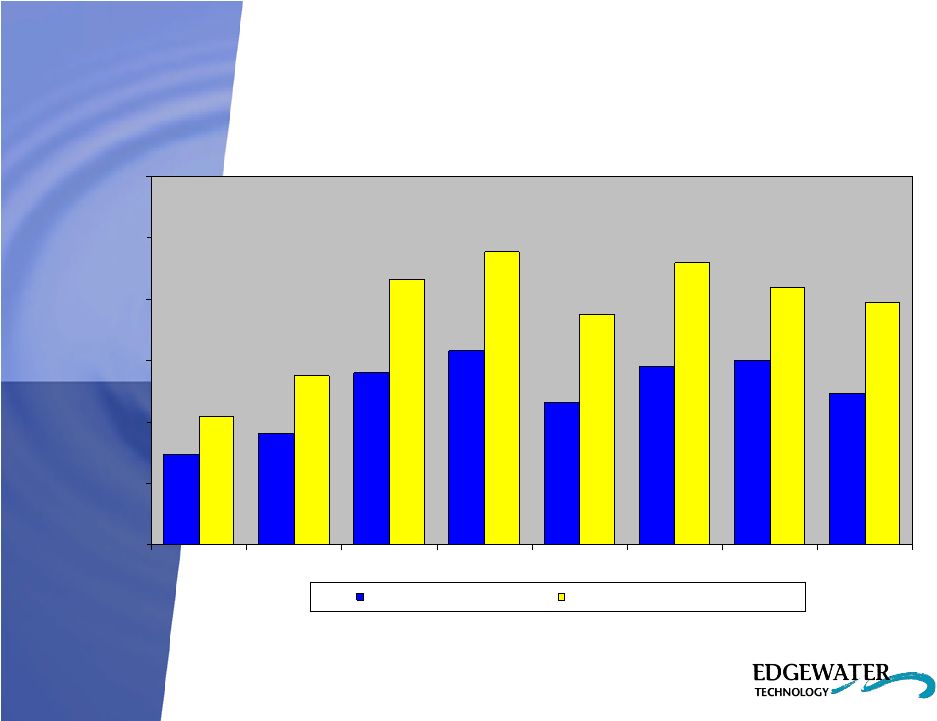 Financial Performance Financial Performance www.edgewater.com 13 736 913 1,405 1,579 1,498 1,454 1,164 1,237 2,386 1,878 2,298 2,094 2,165 1,051 1,377 1,972 $0 $500 $1,000 $1,500 $2,000 $2,500 $3,000 Q1 '06 Q2 '06 Q3 '06 Q4 '06 Q1 '07 Q2 '07 Q3 '07 Q4 '07 Cash Net Income Adjusted EBITDA (excludes SBC) Quarterly Cash Net Income & Adjusted EBITDA (000's) Diluted Cash Net Income and Adjusted EBITDA are Non-GAAP financial measures. Refer to the Appendix for a reconciliation of these measures to GAAP Net Income. |
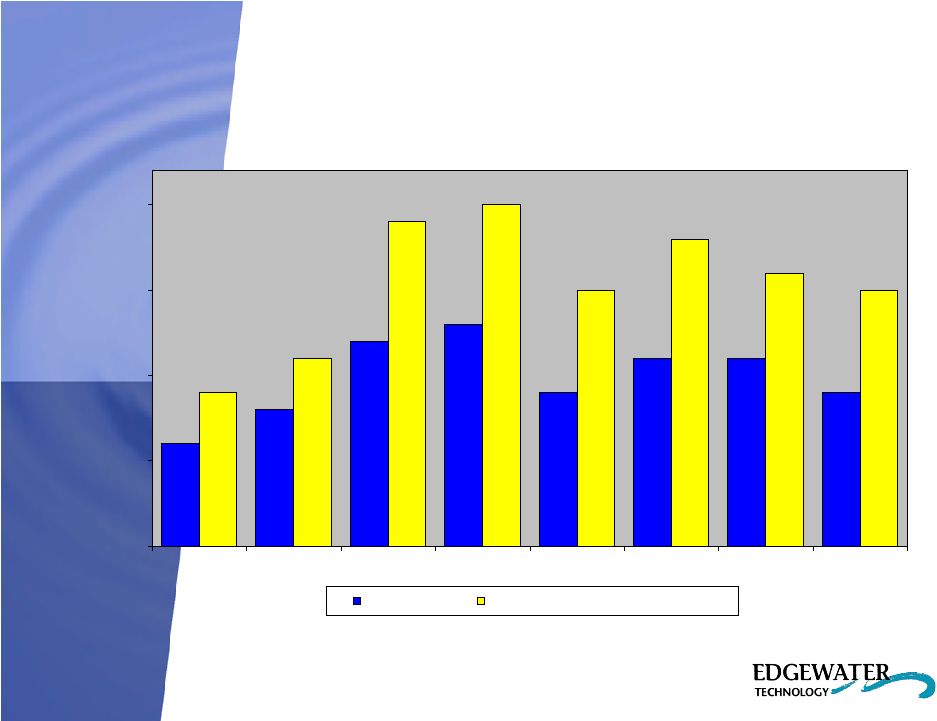 14 www.edgewater.com Financial Performance Financial Performance Quarterly Diluted Cash EPS & Adjusted EBITDA per Share 0.06 0.08 0.12 0.13 0.09 0.11 0.09 0.11 0.19 0.20 0.18 0.15 0.11 0.09 0.15 0.16 $0.00 $0.05 $0.10 $0.15 $0.20 Q1 '06 Q2 '06 Q3 '06 Q4 '06 Q1 '07 Q2 '07 Q3 '07 Q4 '07 Cash EPS Adjusted EBITDA EPS (excludes SBC) Diluted Cash EPS and Adjusted EBITDA EPS are Non-GAAP financial measures. Refer to the Appendix for a reconciliation of these measures to GAAP Earnings per Share. |
 15 www.edgewater.com Q1 2008 Earnings Results Call Q1 2008 Earnings Results Call Scheduled : April 30, 2008 Scheduled : April 30, 2008 |
 Appendix Appendix Reconciliation of Non-GAAP Financial Measures Reconciliation of Non-GAAP Financial Measures Note: Cash Net Income and Cash Earnings per Diluted Share are Non-GAAP financial measures and are not intended to be financial measures that should be regarded as an alternative to, or more meaningful than, Net Income or GAAP Diluted Earnings per Share. The Cash Net Income and Cash Earnings per Diluted Share measures presented herein may not be comparable to similarly titled measures presented by other companies. Edgewater’s management believes that cash performance is the primary driver of long-term share value. As such, Edgewater views Cash Net Income and Cash Earnings per Diluted Share as important indicators of performance that help investors gain a meaningful understanding of the Company’s core operating results and future prospects, consistent with the manner in which management measures and forecasts the Company’s performance. www.edgewater.com 16 Mar 31, Jun 30, Sep 30, Dec 31, Mar 31, Jun 30, Sep 30, Dec 31, 2006 2006 2006 2006 2007 2007 2007 2007 Reconciliation of GAAP Net Income to Cash Earnings Per Diluted Share (Non-GAAP): Reported GAAP Net Income 460 435 1,064 1,242 837 1,046 1,097 5,830 Less: Recorded Tax Benefit - - - - - - - (5,155) Add: Amortization of Intangibles 217 327 327 314 314 312 324 455 Add: Stock-based Compensation 243 469 242 247 257 373 361 488 Less: Related Tax Effect (184) (318) (228) (224) (244) (277) (284) (381) Cash Net Income 736 $ 913 $ 1,405 $ 1,579 $ 1,164 $ 1,454 $ 1,498 $ 1,237 $ Cash Earnings Per Diluted Share 0.06 $ 0.08 $ 0.12 $ 0.13 $ 0.09 $ 0.11 $ 0.11 $ 0.09 $ Diluted Shares Outstanding 11,335 12,156 11,659 11,839 12,449 13,119 13,134 13,309 Quarterly Period Ended |
 Appendix Appendix Reconciliation of Non-GAAP Financial Measures Reconciliation of Non-GAAP Financial Measures Note: EBITDA, Adjusted EBITDA and Adjusted EBITDA per Diluted Share are Non-GAAP financial measures and are not intended to be financial measures that should be regarded as an alternative to, or more meaningful than, either GAAP Operating Income, GAAP Net Income and Net Income per Diluted Share. The EBITDA, Adjusted EBITDA and Adjusted EBITDA per Diluted Share measures presented herein may not be comparable to similarly titled measures presented by other companies. Edgewater’s management believes that cash performance is the primary driver of long- term share value. As such, Edgewater views EBITDA, Adjusted EBITDA and Adjusted EBITDA per Diluted Share as important indicators of performance that help investors gain a meaningful understanding of the Company’s core operating results and future prospects, consistent with the manner in which management measures and forecasts the Company’s performance. www.edgewater.com 17 Mar 31, Jun 30, Sep 30, Dec 31, Mar 31, Jun 30, Sep 30, Dec 31, 2006 2006 2006 2006 2007 2007 2007 2007 Reconciliation of GAAP Net Income to EBTIDA (Non-GAAP): Reported GAAP Net Income 460 435 1,064 1,242 837 1,046 1,097 5,830 Less: Income from DISCO - - - - - - - - Add: Income Tax Provision 302 294 709 800 624 712 465 (4,697) Add: Depreciation & Amortization Expense 345 461 454 495 567 568 599 714 Less: Interest Income (299) (282) (304) (398) (407) (401) (428) (363) EBITDA 808 $ 908 $ 1,923 $ 2,139 $ 1,621 $ 1,925 $ 1,733 $ 1,484 $ Add: Stock-based Compensation 243 469 242 247 257 373 361 488 Adjusted EBITDA 1,051 $ 1,377 $ 2,165 $ 2,386 $ 1,878 $ 2,298 $ 2,094 $ 1,972 $ Adjusted EBITDA per Diluted Share 0.09 $ 0.11 $ 0.19 $ 0.20 $ 0.15 $ 0.18 $ 0.16 $ 0.15 $ Diluted Shares Outstanding 11,335 12,156 11,659 11,839 12,449 13,119 13,134 13,309 Quarterly Period Ended |