 Edgewater Technology, Inc. TechAmerica 2011 Classic Investor Conference November 8, 2011 Exhibit 99.1 |
 Safe Harbor Language 2 11/4/2011 This Presentation contains certain forward-looking statements within the meaning of Section 27A of the Securities Act of 1933, as amended, and Section 21E of the Securities Exchange Act of 1934, as amended, including statements concerning our strategy, revenue goals, growth including acquisitions, profitability, EBITDA and financial position. These forward-looking statements inherently involve certain risks and uncertainties, although they are based on our current plans or assessments which are believed to be reasonable as of the date of this Presentation. Factors that may cause actual results, goals, targets or objectives to differ materially from those contemplated, projected, forecasted, estimated, anticipated, planned or budgeted in such forward-looking statements include, among others, the following possibilities: (1) failure to obtain new customers or retain significant existing customers; (2) the loss of one or more key executives and/or employees; (3) changes in industry trends, such as a decline in the demand for Business Intelligence (“BI”); Enterprise Performance Management (“EPM”) and Enterprise Resource Planning (“ERP”) solutions, custom development and system integration services and/or declines in industry-wide information technology (“IT”) spending, whether on a temporary or permanent basis and/or delays by customers in initiating new projects or existing project milestones; (4) inability to execute upon growth objectives, including new services and growth in entities acquired by our Company; (5) adverse developments and volatility involving economic, geopolitical or technology market conditions; (6) unanticipated events or the occurrence of fluctuations or variability in critical accounting policies and estimates; (7) delays in, or the failure of, our sales pipeline being converted to billable work and recorded as revenue; (8) inability to recruit and retain professionals with the high level of information technology skills and experience needed to provide our services; (9) any changes in ownership of the Company or otherwise that would result in a limitation of the net operating loss carry forward under applicable tax laws; (10) the failure of the marketplace to embrace advisory and product-based consulting services; and/or (11) failure to make a successful claim against the Fullscope escrow account. In evaluating these statements, you should specifically consider various factors described above as well as the risks outlined under Item I “Business – Factors Affecting Finances, Business Prospects and Stock Volatility” in our 2010 Annual Report on Form 10-K filed with the SEC on March 31, 2011. These factors may cause our actual results to differ materially from those contemplated, projected, anticipated, planned or budgeted in any such forward-looking statements. Although we believe that the expectations in the forward-looking statements are reasonable, we cannot guarantee future results, levels of activity, performance, growth, earnings per share or achievements. However, neither we nor any other person assumes responsibility for the accuracy and completeness of such statements. Except as required by law, we undertake no obligation to update any of the forward-looking statements after the date of this Presentation to conform such statements to actual results. |
 |
 • Founded in 1992 • Publicly traded (NASDAQ: EDGW) • Public in 2002 • Co-founders still with the Company • 420+ employees; 75%+ billable consultants • Large North American footprint • New UK presence • Focus on upper-middle and global 2000 markets Edgewater Corporate Overview |
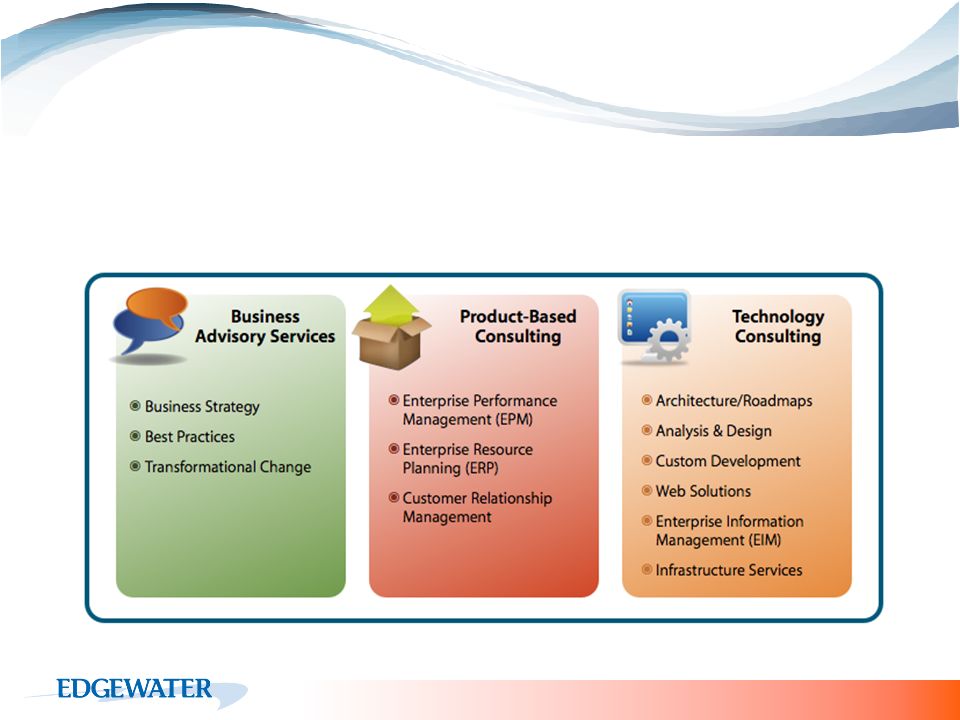 Edgewater Offerings Edgewater offers a comprehensive spectrum of services and expertise to ensure the success of our engagements. |
 • Excellence in Execution • Technology Excellence • Vertical Expertise • Client Focus • Adherence to Operational Metrics Core Competencies and Values “Hire code experts with business expertise. Users should hire firms like Edgewater Technology that provide developers with expertise in the business function being automated. …” - Forrester Research |
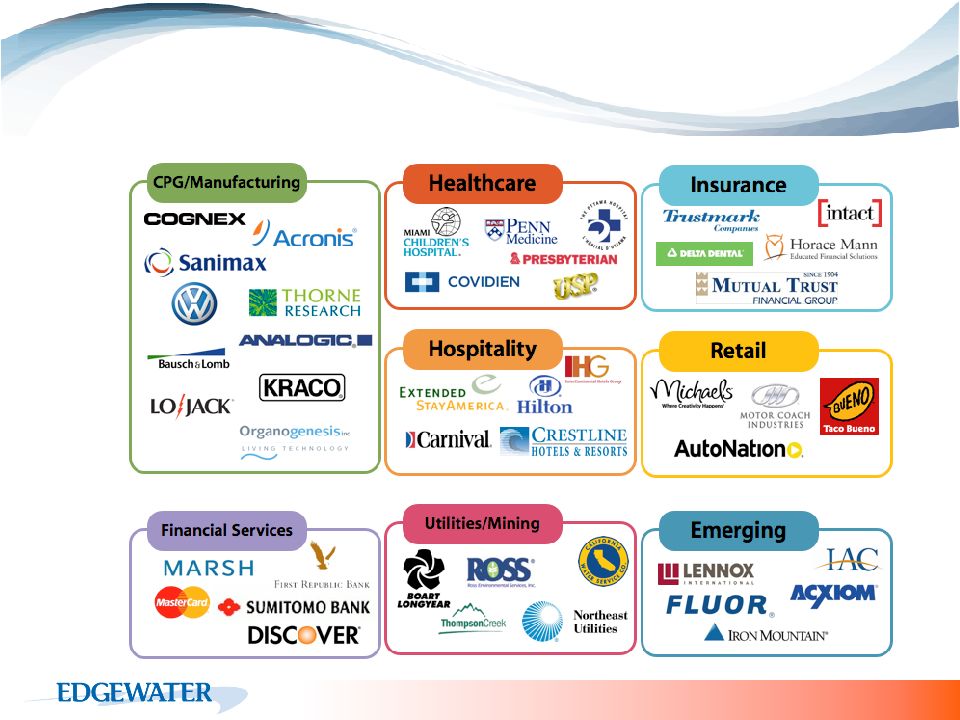 Sampling of Customers |
 Industry Stats Independent Study Demonstrates Productivity Gains and ROI of 243 Percent for Microsoft Dynamics CRM 2011 The Total Economic Impact Of Microsoft Dynamics CRM 2011, Forrester Research, May 2011 Made in the USA, Again: Manufacturing Is Expected to Return to America as China’s Rising Labor Costs Erase Most Savings from Offshoring/Reinvestment During the Next Five Years Could Usher in a ‘Manufacturing Renaissance’ as the U.S. Becomes a Low-Cost Country Among Developed Nations, According to Analysis by The Boston Consulting Group. May 5, 2011 Billionaire Mario Gabelli and his funds led by GAMCO Asset Management Inc. have reported a 19.4% stake in Edgewater Technology Inc. (NASDAQ: EDGW), according to an SEC filing in March 2011 |
 Why Edgewater? Unique Strategy – High value strategic services tailored to ‘C’ level execs – High barrier to entry – High revenue per billable resource – A Consolidator of the Key Technology Replacement Cycle Elements Unique Positioning – Alternative to Big Solution Providers – Many Offerings are Synergistic and Ripe for Cross Selling – Both Channel and Solutions Driven In Growth Mode |
 11/4/2011 10 Important Takeaways Achieving Historical Service Revenue Highs Growth through Organic & Strategic Acquisitive Activities – Recent double digit organic growth – Fullscope, Inc. – December 31, 2009 / Dynamics AX ERP – Meridian Consulting International – May 17, 2010 / Oracle HSF – Developing IP Assets (Dynamics AX Chemical Accelerator) Undervalued Grow Federal Tax-free |
 Fourth Quarter / Full Year 2011 February 29, 2012 Upcoming Earnings Call Information 11 11/4/2011 |
 12 APPENDIX A: Financial Information 11/4/2011 |
 Q3’11 Financial Highlights 11/4/2011 13 Established All-Time High in Service Revenue Double Digit Organic Revenue Growth Improvement in gross margin, Adjusted EBITDA and EPS $13.3 million in cash – Available for “tuck in” acquisitions, internal growth initiatives and stock repurchases $4.2 million in Q3’11 cash flow generated from operations $5.9 million year-to-date (9-months) Repurchased 1.2 million shares of common stock in Q3’11 – Aggregate cost of $3.1 million |
 Q3’11 Financial Results 14 2011 2010 Change 2011 2010 Change Total Revenue 25,048 $ 21,384 $ 17.1% 76,038 $ 65,009 $ 17.0% Service Revenue 20,064 $ 18,075 $ 11.0% 58,398 $ 51,163 $ 14.1% Total Gross Profit 9,366 $ 7,830 $ 19.6% 28,791 $ 23,121 $ 24.5% Total Gross Margin % 37.4% 36.6% 37.9% 35.6% Service Gross Profit 8,145 $ 7,038 $ 15.7% 22,490 $ 19,218 $ 17.0% Service Gross Margin % 40.6% 38.9% 38.5% 37.6% Adjusted EBITDA* 1,357 $ 515 $ 163.5% 5,394 $ 2,143 $ 151.7% Adjusted EBITDA* % 5.4% 2.4% 7.1% 3.3% Net Income 1,545 $ (22,686) $ 106.8% 2,250 $ (23,415) $ 109.6% Net Income % 6.2% (106.1)% 3.0% (36.0)% EPS (Fully Diluted) 0.13 $ (1.86) $ 107.0% 0.18 $ (1.92) $ 109.4% (Dollar Amounts in Thousands) Three Months Ended September 30, Nine Months Ended September 30, * - Adjusted EBITDA is a non-GAAP financial measure and includes stock-based compensation expense. 11/4/2011 |
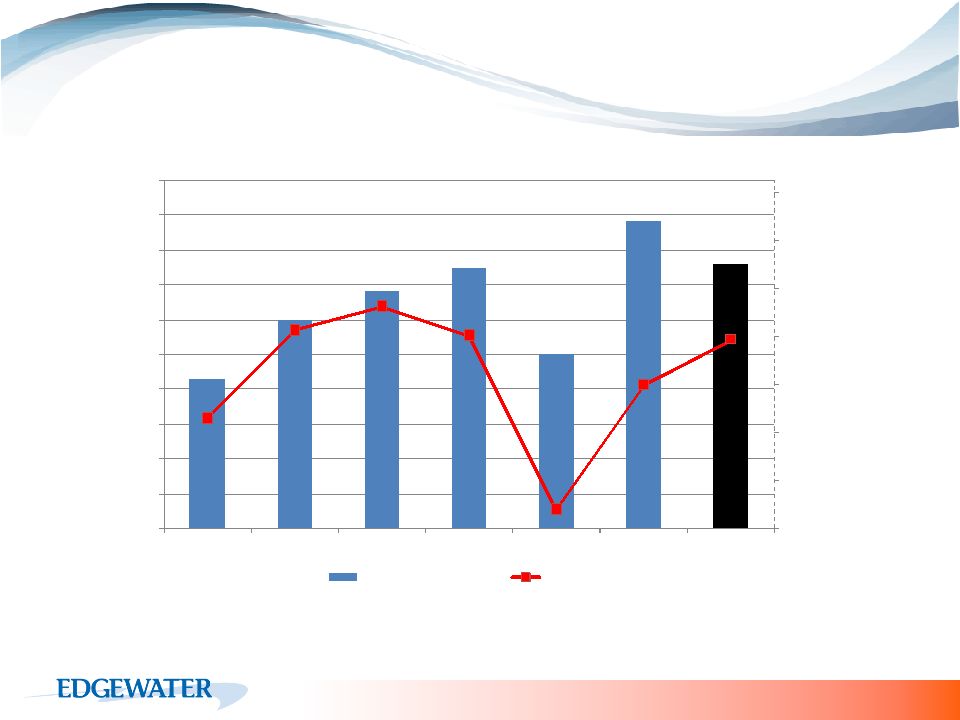 Historical Revenue and Adjusted EBITDA* •- Adjusted EBITDA is a Non-GAAP financial measure. (a) – 2011 Total Revenue and Adjusted EBITDA amounts reflect annualized year-to-date performance. 11/4/2011 15 (Amounts in Thousands) $43,126 $60,083 $68,490 $74,743 $50,085 $88,545 $76,038 ($2,500) ($500) $1,500 $3,500 $5,500 $7,500 $9,500 $11,500 $0 $10,000 $20,000 $30,000 $40,000 $50,000 $60,000 $70,000 $80,000 $90,000 $100,000 2005 2006 2007 2008 2009 2010 2011(YTD) Annual Total Revenue Adjusted EBITDA* |
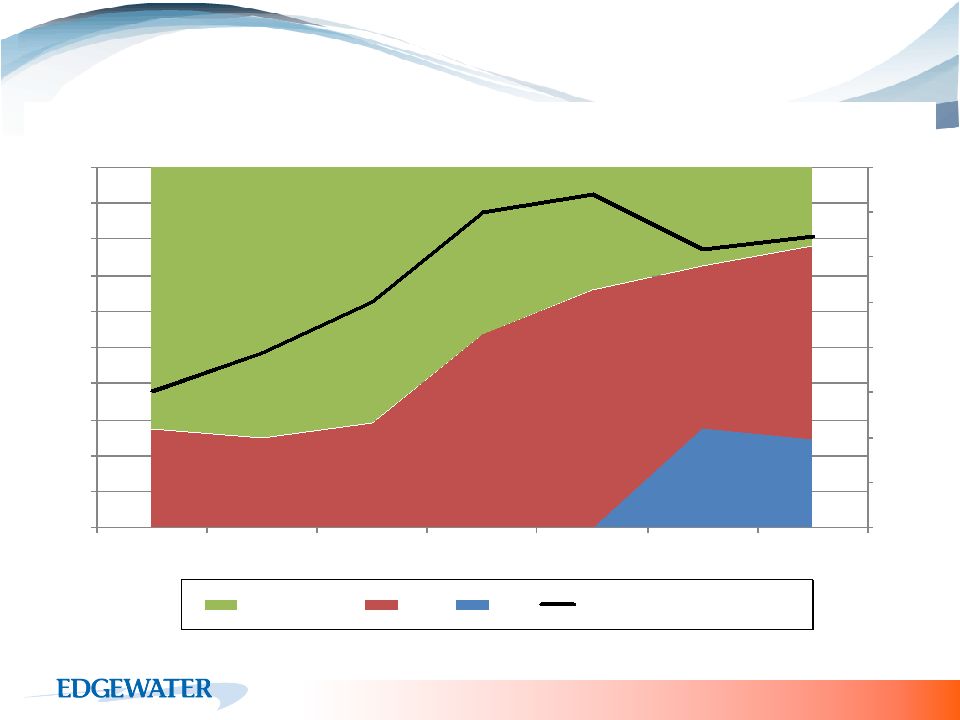 Average Annualized Service Revenue Per Consultant* 16 * - Adjusted for billable consultant utilization. $261 $278 $300 $340 $348 $324 $329 $200 $220 $240 $260 $280 $300 $320 $340 $360 0% 10% 20% 30% 40% 50% 60% 70% 80% 90% 100% 2005 2006 2007 2008 2009 2010 2011 (p) Advisory/Tech EPM ERP Avg Annual Rev Per Consultant Annualized Service Revenue per Consultant Vs Service Revenue Mix (Dollar Amounts in thousands) 11/4/2011 |
 11/4/2011 17 APPENDIX B: Non-GAAP Financial Measures |
 Non-GAAP Financial Measures 18 11/4/2011 Edgewater reports its financial results in accordance with generally accepted accounting principles (“GAAP”). Management believes, however, that certain non-GAAP financial measures used in managing the Company’s business may provide users of this financial information with additional meaningful comparisons between current results and prior reported results. Certain of the information set forth herein and certain of the information presented by the Company from time to time may constitute non-GAAP financial measures within the meaning of Regulation G adopted by the Securities and Exchange Commission. We have presented herein a reconciliation of these measures to the most directly comparable GAAP financial measure. The non-GAAP measures presented herein may not be comparable to similarly titled measures presented by other companies. As noted in the footnote below, the foregoing measures have limitations and do not serve as a substitute and should not be construed as a substitute for GAAP performance, but provide supplemental information concerning our performance that our investors and we find useful. Edgewater views Adjusted EBITDA as an important indicator of performance, consistent with the manner in which management measures and forecasts the Company’s performance. We believe Adjusted EBITDA measures are important performance metrics because they facilitate the analysis of our results, exclusive of certain non-cash items, including items which do not directly correlate to our existing business, providing specialty IT services. For instance, the exit of our former significant unrelated operations in 2000 and 2001 created significant net operating loss carry-forwards and deferred tax assets, and the tax provisions that we take under GAAP, for which there is no corresponding federal tax payment obligation for us, and the adjustments that we make to our deferred tax asset, based on the prospects and anticipated future profitability of our ongoing operations, can be significant and can obscure, either significantly, or in part, period-to-period changes in our core operating results. Likewise, we incur direct transaction costs related to acquisitions which are expensed in our GAAP financial statements. Our Adjusted EBITDA calculation excludes the effects of direct acquisition-related costs to facilitate an understanding of comparative period-to-period changes in our core operating results. Similarly, we incurred, and have excluded from our Adjusted EBITDA calculation, costs associated with the Fullscope Embezzlement Issue as we believe that the non-recurring nature of the costs associated with this issue makes comparison of our current and historical financial results difficult. We believe that Adjusted EBITDA metrics provide qualitative insight into our current performance; we use these measures to evaluate our results the performance of our management team and our management’s entitlement to incentive compensation; and we believe that making this information available to investors enables them to view our performance the way that we view our performance and thereby gain a meaningful understanding of our core operating results, in general, and from period to period. |
 11/4/2011 19 Reconciliation to Non-GAAP Measures 1- Adjusted EBITDA is a Non-GAAP performance measure and is not intended to be a performance measure that should be regarded as an alternative to, or more meaningful than, either GAAP Operating Income or GAAP Net Income. The Adjusted EBITDA measure presented may not be comparable to similarly titled measures presented by other companies. Adjusted EBITDA is defined as net income less interest income and other, net, plus taxes, depreciation and amortization, adjustments to contingent consideration earned, goodwill impairment charges, direct acquisition costs and the Fullscope Embezzlement Issue costs. (Q3'11 YTD) 2005 2006 2007 2008 2009 2010 2011 Reconciliation of GAAP Net Income to Adjustmed EBTIDA 1 (Non-GAAP): Reported GAAP Net Income 1,600 $ 3,203 $ 8,810 $ (47,018) $ (3,839) $ (23,688) $ 2,250 $ Add: Income Tax Provision 850 2,105 (2,896) 712 (1,047) 21,511 651 Add: Loss from Discontinued Operations (325) 0 0 0 0 0 0 Add: Goodwill and Impairment Charge 0 0 0 48,594 0 0 0 Add: Deprecation & Amortization Expense 1,046 1,755 2,448 3,771 2,694 4,023 2,123 Add: Changes in Contingent Earnout Consideration 0 0 0 0 0 100 94 Add: Direct Acquisition Costs 0 0 0 0 617 451 0 Add: Fullscope Embezzlement Costs 0 0 0 0 0 1,137 126 Less: Interest Income and other expense, net (1,054) (1,283) (1,599) (503) (122) (34) 150 Adjusted EBITDA 2,117 $ 5,780 $ 6,763 $ 5,556 $ (1,697) $ 3,500 $ 5,394 $ |
 11/4/2011 20 APPENDIX C: Service Offering Case Studies |
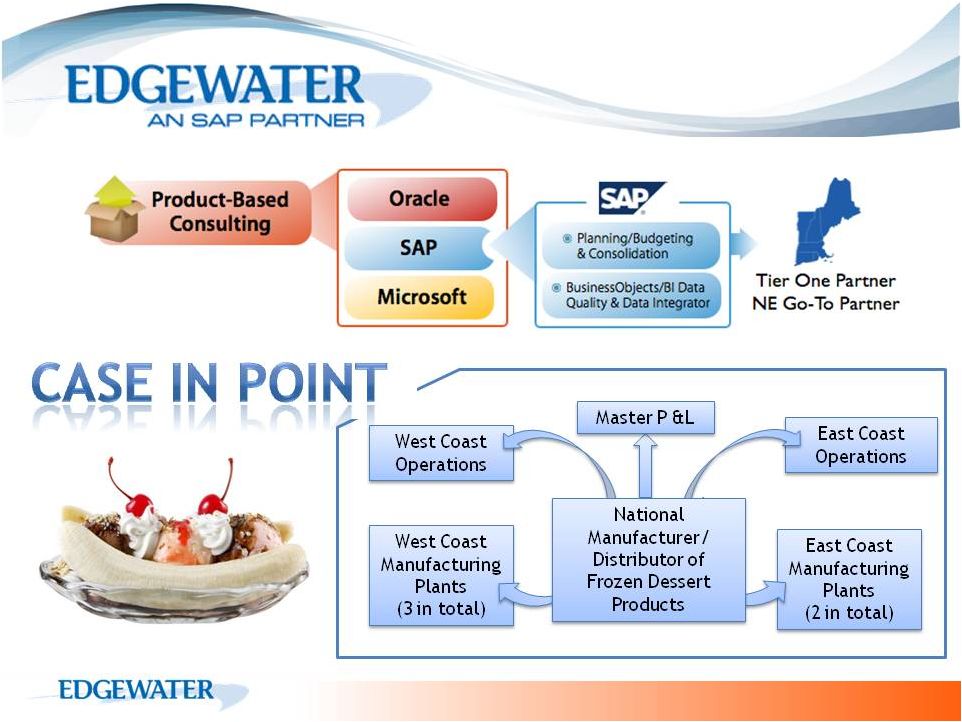
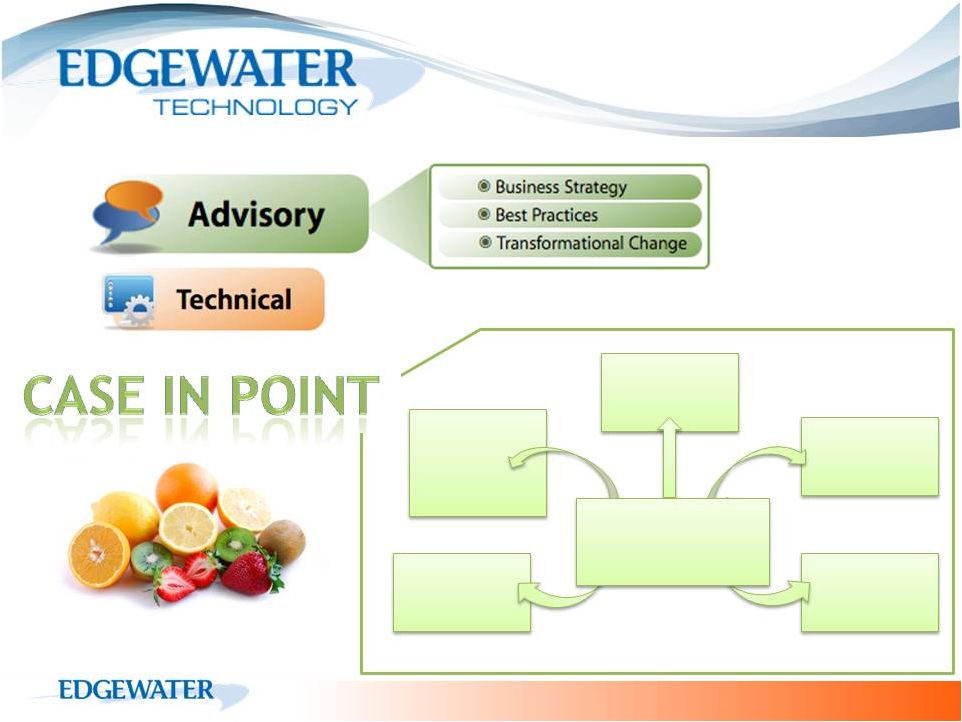 Aggressive Timelines for System, Process, and Staff Migration Establish PMO Data Migration and Integration Leading food manufacturer and distributor Methodology for System integration Acquisition Change Management |
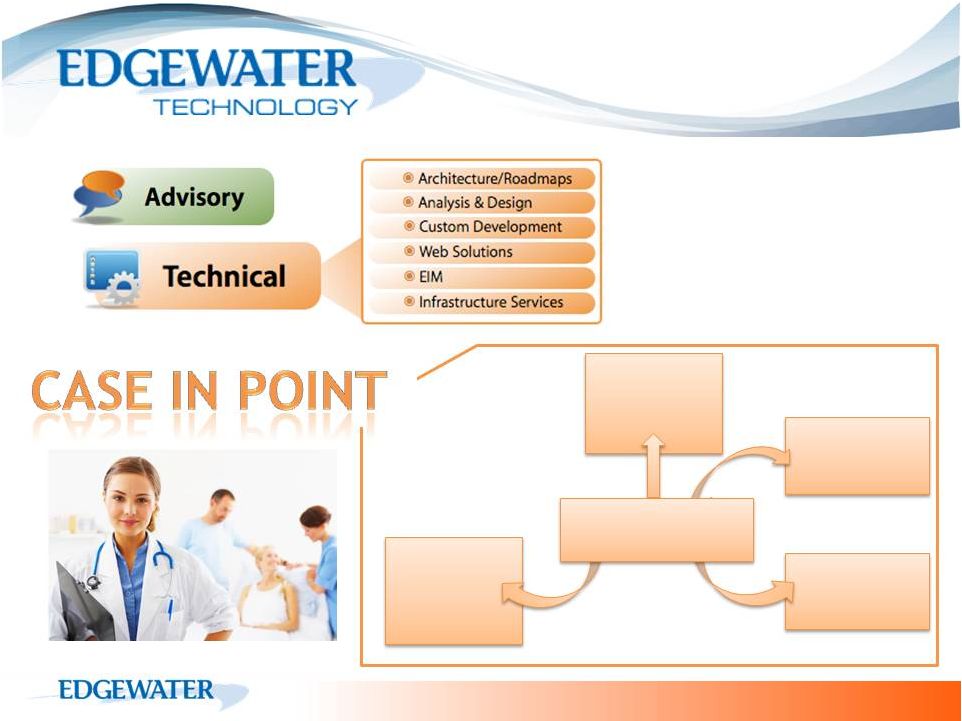 Phase 1: Enterprise Data Strategy Phase 2: Pre-Production Implementation Comprehensive Cancer Center Phase 3: Production Implementation Enterprise Data Warehouse to Support Personalized Medicine |
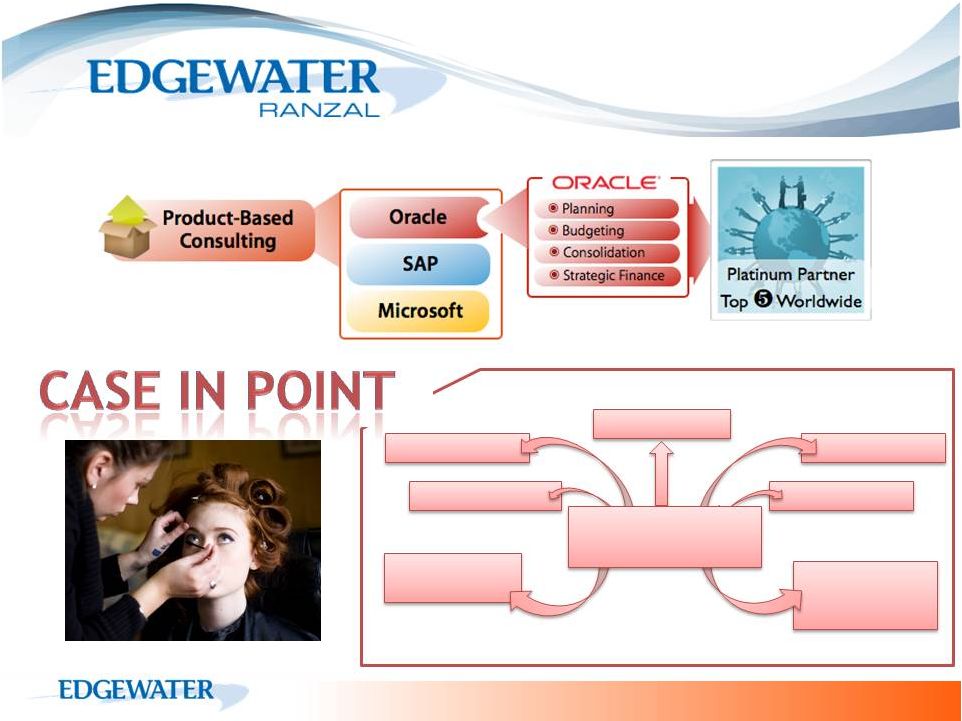 China Western Europe, Middle & East Africa Central & Eastern Europe Latin America North America Asia Pacific Leading Global Beauty Company Master P &L |
 |
 |