 NASDAQ: EDGW Corporate Presentation – Sept 2012 Business Advisory & Product-Based Consulting Exhibit 99.1 |
 Safe Harbor Language Safe Harbor Language 2 This presentation contains certain forward-looking statements within the meaning of Section 27A of the Securities Act of 1933, as amended, and Section 21E of the Securities Exchange Act of 1934, as amended, including statements concerning our strategy, geographical influence, expansion of our Microsoft and Oracle channels, development of cloud-based SaaS products and IP to help verticalize our product suite, balance sheet strength, revenue goals, growth including acquisitions, billable consultant utilization, expected profitability impact in connection with an improvement in billable consultant utilization, profitability, EBITDA and financial position. These forward-looking statements inherently involve certain risks and uncertainties, although they are based on our current plans or assessments which are believed to be reasonable as of the date of this Presentation. Factors that may cause actual results, goals, targets or objectives to differ materially from those contemplated, projected, forecasted, estimated, anticipated, planned or budgeted in such forward-looking statements include, among others, the following possibilities: (1) failure to obtain new customers or retain significant existing customers; (2) the loss of one or more key executives and/or employees; (3) changes in industry trends, such as a decline in the demand for Enterprise Resource Planning and Enterprise Performance Management solutions, custom development and system integration services and/or declines in industry-wide information technology spending, whether on a temporary or permanent basis and/or delays by customers in initiating new projects or existing project milestones; (4) inability to execute upon growth objectives, including new services and growth in entities acquired by our Company; (5) adverse developments and volatility involving geopolitical or technology market conditions; (6) unanticipated events or the occurrence of fluctuations or variability in the matters identified under “Critical Accounting Policies and Estimates” in our most recent Annual Report on Form 10-K; (7) delays in, or the failure of, our sales pipeline being converted to billable work and recorded as revenue; (8) termination by clients of their contracts with us or inability or unwillingness of clients to pay for our services, which may impact our accounting assumptions; (9) inability to recruit and retain professionals with the high level of information technology skills and experience needed to provide our services; (10) failure to expand outsourcing services to generate additional revenue; (11) any changes in ownership of the Company or otherwise that would result in a limitation of the net operating loss carry forward under applicable tax laws; (12) the failure of the marketplace to embrace advisory and product-based consulting services; and/or (13) failure to make a successful claim against the Fullscope escrow account. In evaluating these statements, you should specifically consider various factors described above as well as the risks outlined under Part I - Item IA “Risk Factors” in our 2011 Annual Report on Form 10-K filed with the SEC on March 12, 2012. These factors may cause our actual results to differ materially from those contemplated, projected, anticipated, planned or budgeted in any such forward-looking statements. Although we believe the expectations in the forward-looking statements are reasonable, we cannot guarantee future results, levels of activity, performance, growth, earnings per share or achievements. However, neither we nor any other person assumes responsibility for the accuracy and completeness of such statements. Except as required by law, we undertake no obligation to update any of the forward-looking statements after the date of this Presentation to conform such statements to actual results. This presentation is © 2012 Edgewater Technology, Inc. – All Rights Reserved |
 Who We Are… Who We Are… 3 Edgewater is a leading strategic consulting firm We’re focused on helping upper mid-market & Global 2000 companies leverage our expertise to drive transformational change that: Improves processes Reduces costs Increases revenue Our advisory services and product-based solutions are tailored for the “C-level” executive – typically the CFO As of June 30, 2012: Last 12-Month Revenue of $104M, $0 debt, and free cash flow positive |
 The History of Edgewater The History of Edgewater Edgewater founded by Shirley Singleton & David Clancey 1997 2002 2012 1992 2007 Staffmark acquires Edgewater Edgewater becomes public; Shirley Singleton named President & CEO, David Clancey CTO Acquisition of Ranzal & Assoc. (Oracle EPM service offering) Acquisition of Fullscope (Microsoft ERP service offering) Edgewater annual revenue exceeds $100M 4 Staffmark initiates divestiture & reorganization process Resolution of Staffmark legacy issues |
 Market Drivers Market Drivers 5 Software replacement cycle of the middle market is long overdue (Enterprise Resource Planning (ERP) product and service offerings) The need for operational command & control on budgeting & planning by CFO’s (Oracle channel) Today’s M&A market has created increased demand for our Business Advisory services |
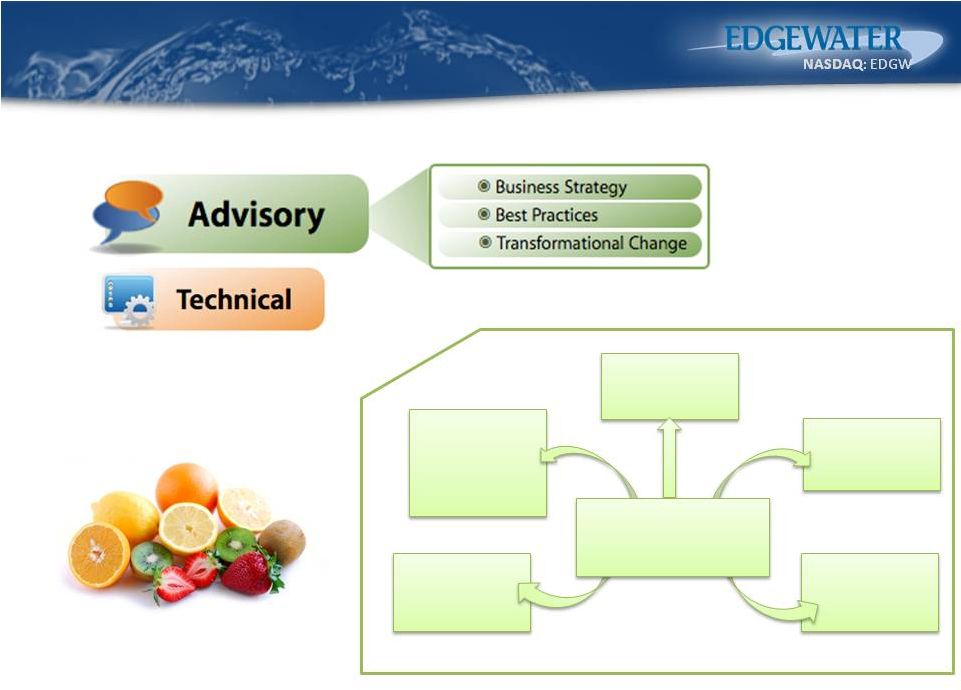
 Our Service Offerings Our Service Offerings Business Advisory Services Technology Consulting Enterprise Software Consulting Business Transformation through Enterprise Software Solutions Enterprise Performance Management (EPM) Enterprise Resource Planning (ERP) Customer Relationship Management (CRM) Custom IT Strategy Solutions & Data Management Custom software design & implementation Cloud integration & phasing solutions Web-based solutions Business Strategy, Best Practices & Process Rejuvenation Used in all ALL verticals Tech expertise and due diligence to M&A, private equity & venture capital NASDAQ: EDGW 6 |
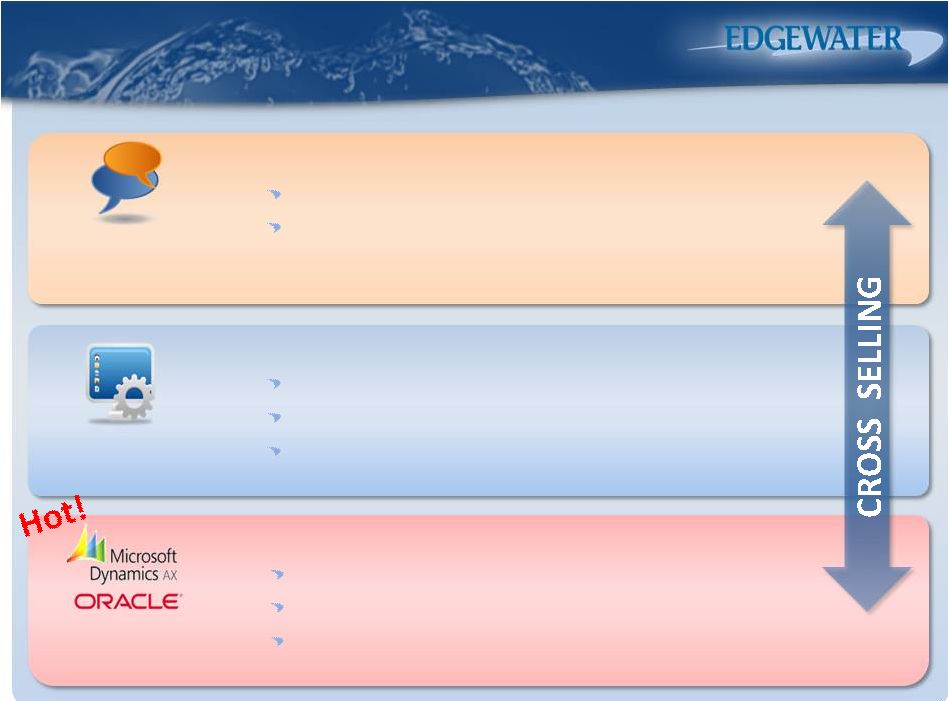
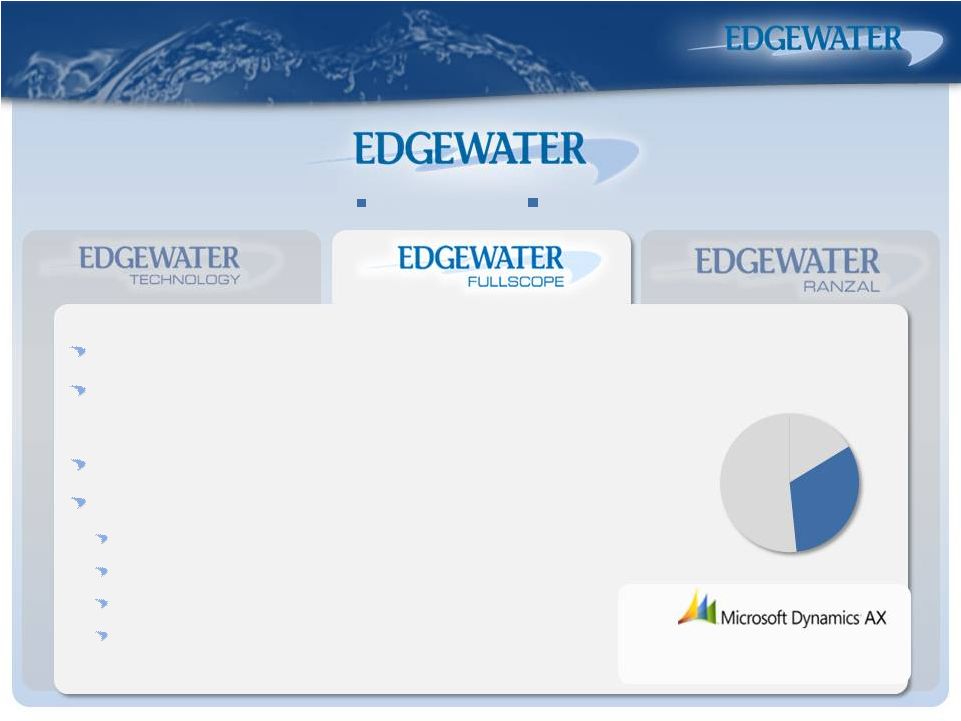
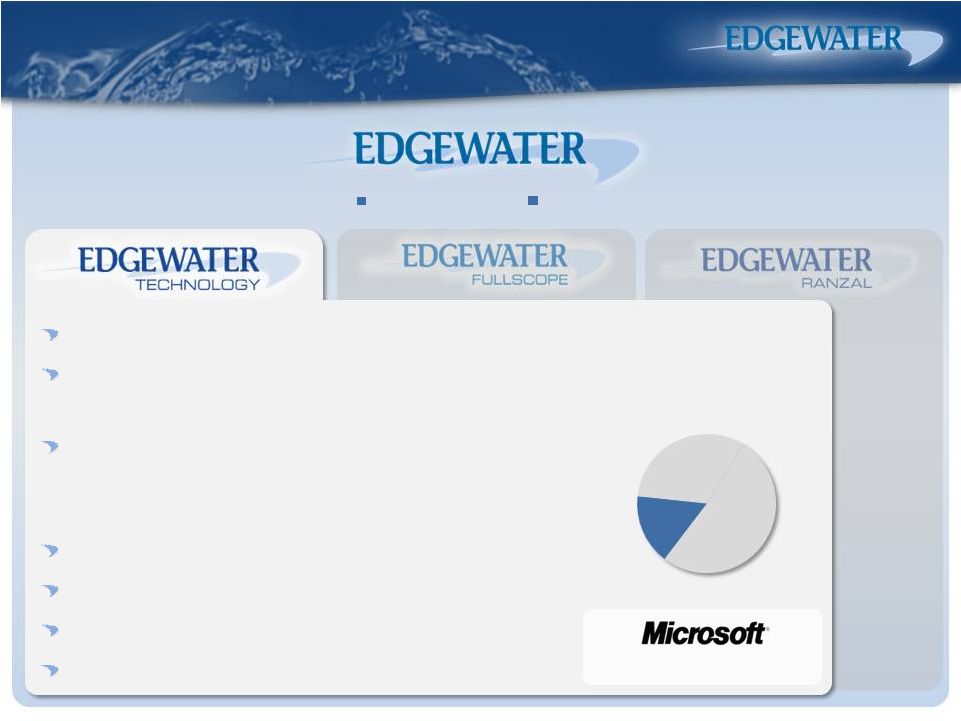 Business advisory Best practices Transformational change We Go To Market Under Well We Go To Market Under Well Established, Recognized Brands Established, Recognized Brands 7 Custom software design & implementation Implement Microsoft SharePoint & CRM solutions Solutions for clients implementing transformational projects that provide a high ROI Technical evaluation & design Cloud integration & phasing solutions Web-based solutions On-going support services 16% Related Revenue LTM@Jun-12 CRM Gold Partner NASDAQ: EDGW |
 Business advisory Best practices Transformational change We Go To Market Under Well We Go To Market Under Well Established, Recognized Brands Established, Recognized Brands 8 Implement Microsoft Dynamics AX ERP Solutions Solutions: facilitate info flow to all functions of an organization Primarily for manufacturers & distributors Revenue Sources: Implementing Microsoft software (ERP) Selling new and/or maintenance products Providing support services Monetizing vertically integrated software for AX products • Licensing & sales to Microsoft 2012 Manufacturing Partner of the Year #1 AX Partner in N. America 32% Related Revenue LTM@Jun-12 NASDAQ: EDGW |
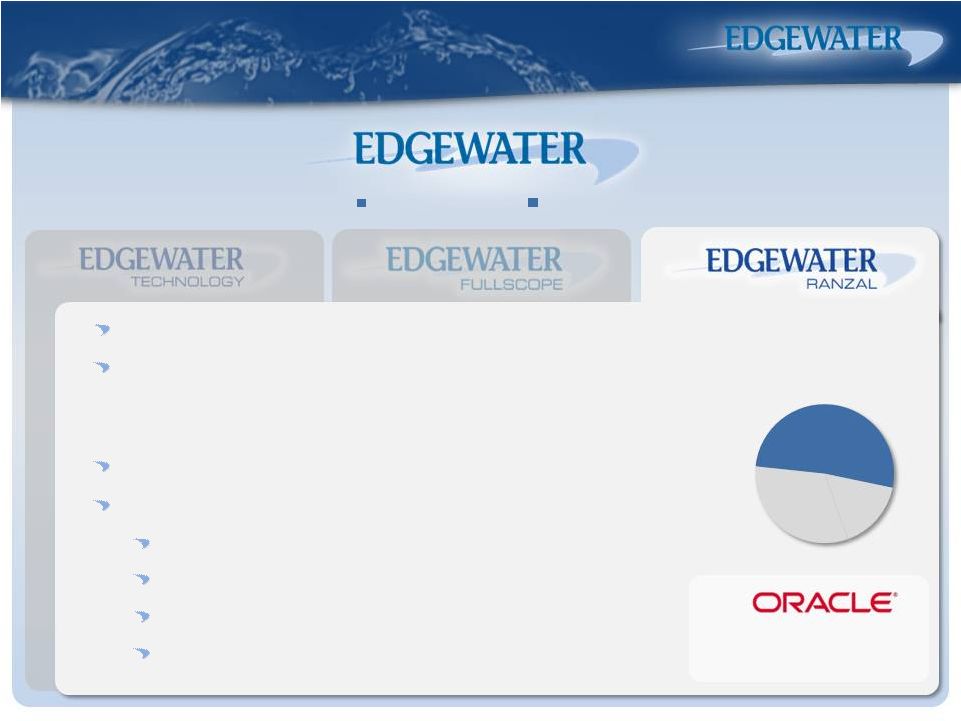 Business advisory Best practices Transformational change We Go To Market Under Well We Go To Market Under Well Established, Recognized Brands Established, Recognized Brands 9 Implement customized Oracle Hyperion EPM solutions Solutions: provide planning, strategic finance, financial reporting, business modeling & master data management Applicable to a wide range of industries Revenue Sources: Implementing Oracle software (EPM) Selling new and/or maintenance products Providing support services Training Oracle Platinum Partner Top 5 Worldwide 52% Related Revenue LTM@Jun-12 NASDAQ: EDGW |
 Why Do Clients Choose Edgewater? Why Do Clients Choose Edgewater? 10 We are experts in developing technology solutions Trust, reliability & value for the money we service both large firms & middle-market companies, but have the depth & ability to quickly deploy specialized solutions NASDAQ: EDGW Edgewater competitive advantage: |
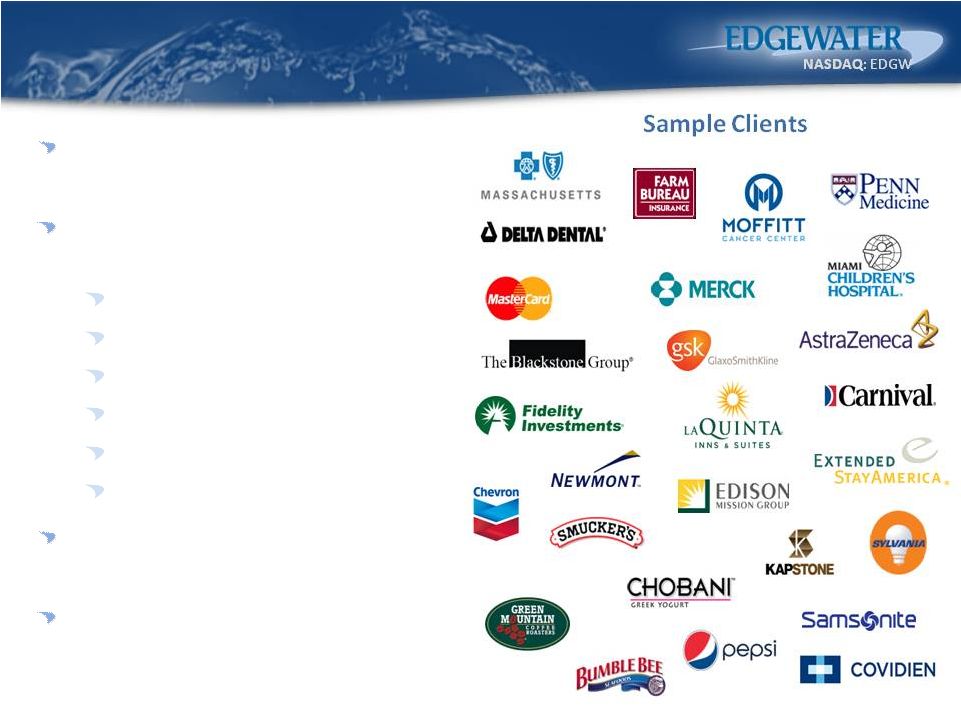 Client Diversity & Retention Are Client Diversity & Retention Are Major Strategic Advantages Major Strategic Advantages Focus on upper-middle & global 2000 markets Diverse range of industry representation: Insurance Healthcare and Life Sciences Energy Hospitality Manufacturing Consumer Products No customer represents >5% of total service revenue¹ High level of repeat business ¹During the six-month period ended June 30, 2012 Sample Clients 11 |
 Where Are We Going? Where Are We Going? 12 Develop and introduce cloud-based Software as a Service (SaaS) offerings Design & develop valuable IP that helps “verticalize” our core product suite Leverage strong balance sheet to build out Microsoft & Oracle channels, both organically and through M&A Build geographic influence and expansion (e.g., United Kingdom, China, Australia) Licensing & service support Training Selling directly to Microsoft & others |
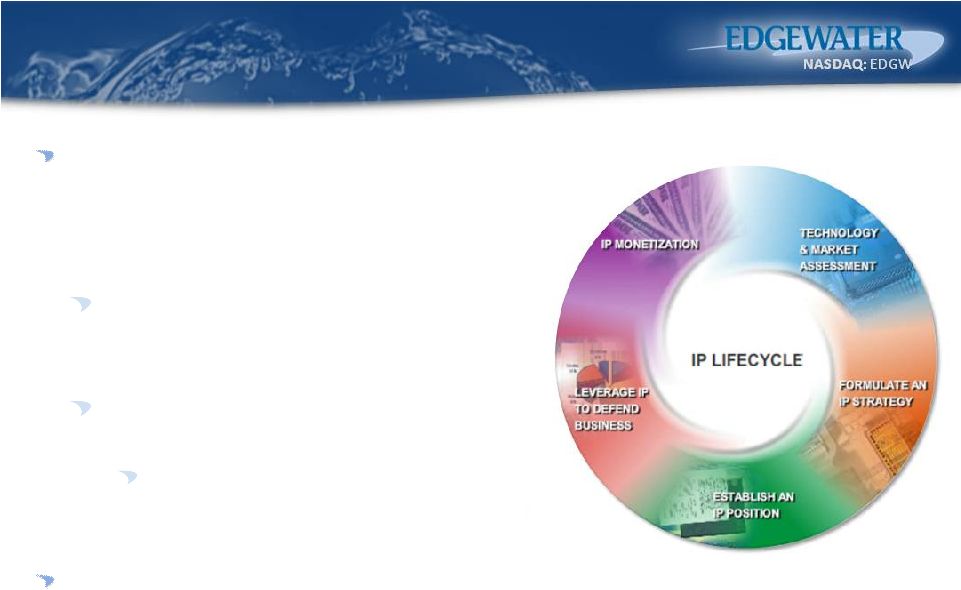 IP Development & Monetization IP Development & Monetization 13 Edgewater has demonstrated how it can leverage its industry experience to develop valuable IP that it can sell to partners: June 2009: sold two software product add-on modules to Microsoft for $7.5M July 2012: sold to Microsoft for $3.25M Solution designed for chemical, life science and food manufacturers using Microsoft Dynamics AX We also package and license our proprietary software solutions via our direct sales force or channel partners (highly leverageable) DEVELOPMENT DEVELOPMENT Fullscope (pre-acquisition) Fullscope Process Industries 2 |
 Financial Overview |
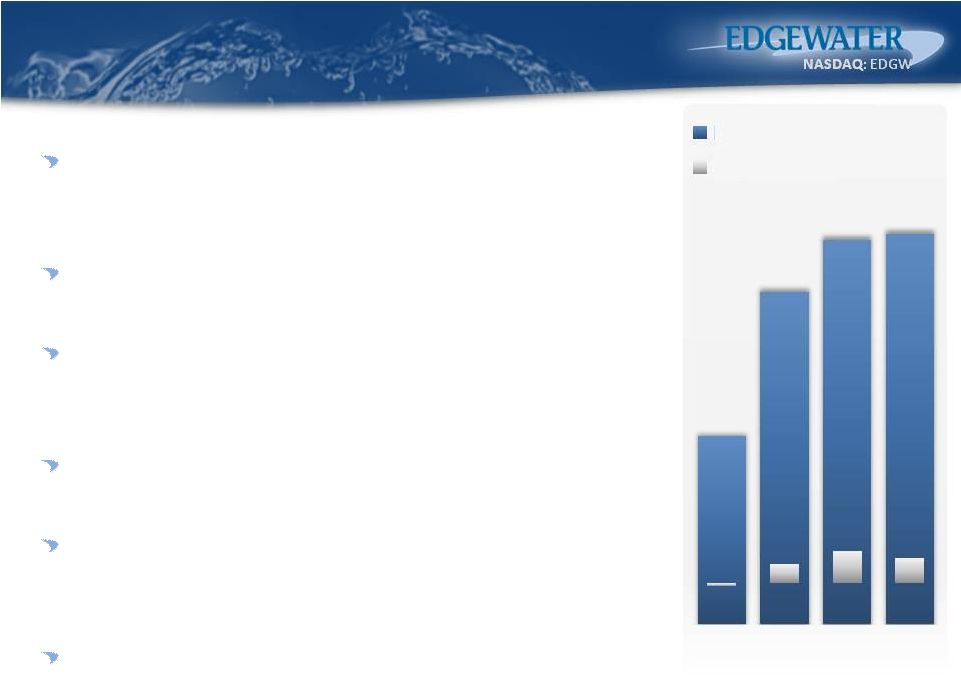
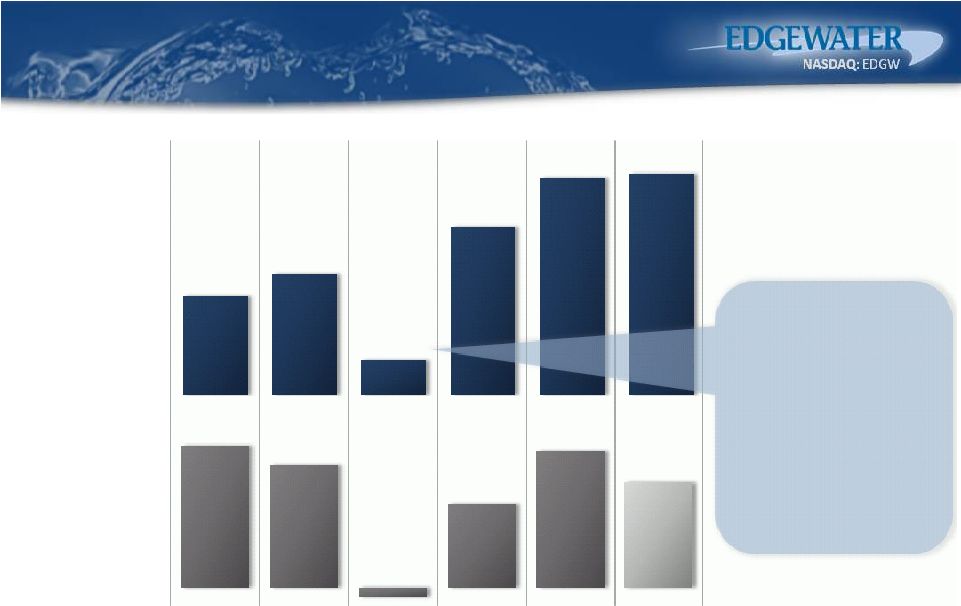 Annual Financial Performance – Annual Financial Performance – Turnaround Underway Turnaround Underway 15 Includes loss of two large clients. However, today no client represents >5% of service revenue (YTD June 30 th ). Annual Total Revenue Adj. EBITDA¹ $68.5M $74.7M $50.1M $88.5M $102.4M $103.9M $8.2M $7.1M ($0.6M) $4.8M $7.9M $6.1M 2007 2008 2009 2010 2011 LTM @ Q2-12 ¹Adjusted EBITDA is a non-GAAP financial measure. See Appendix for a reconciliation to the most comparable GAAP financial measure. |
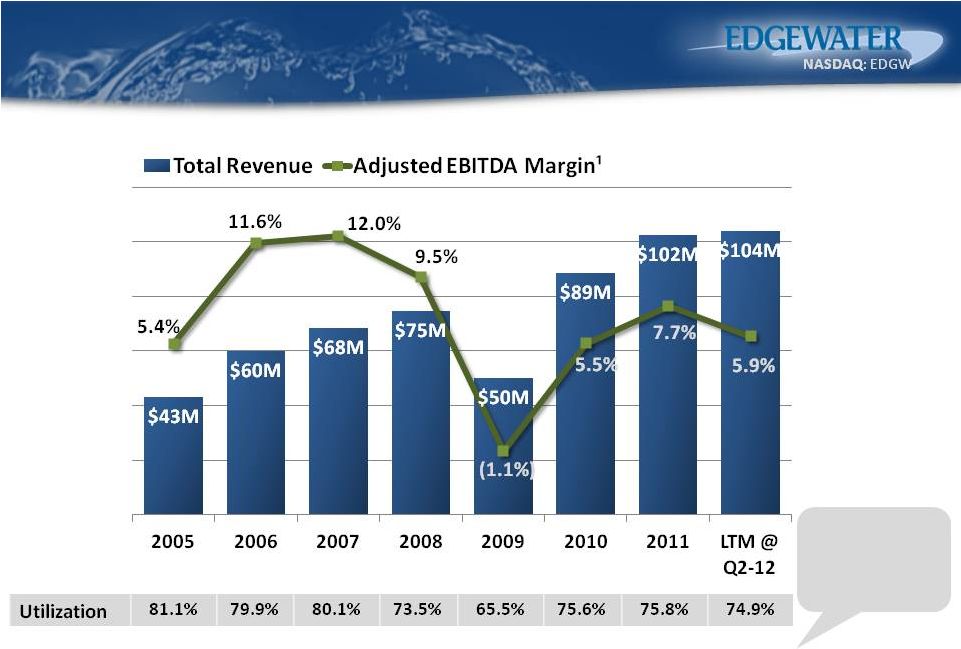 Revenue vs. Adjusted EBITDA Margin Revenue vs. Adjusted EBITDA Margin 16 1% change = $1.2M in revenue ¹Adjusted EBITDA is a non-GAAP financial measure. See Appendix for a reconciliation to the most comparable GAAP financial measure. |
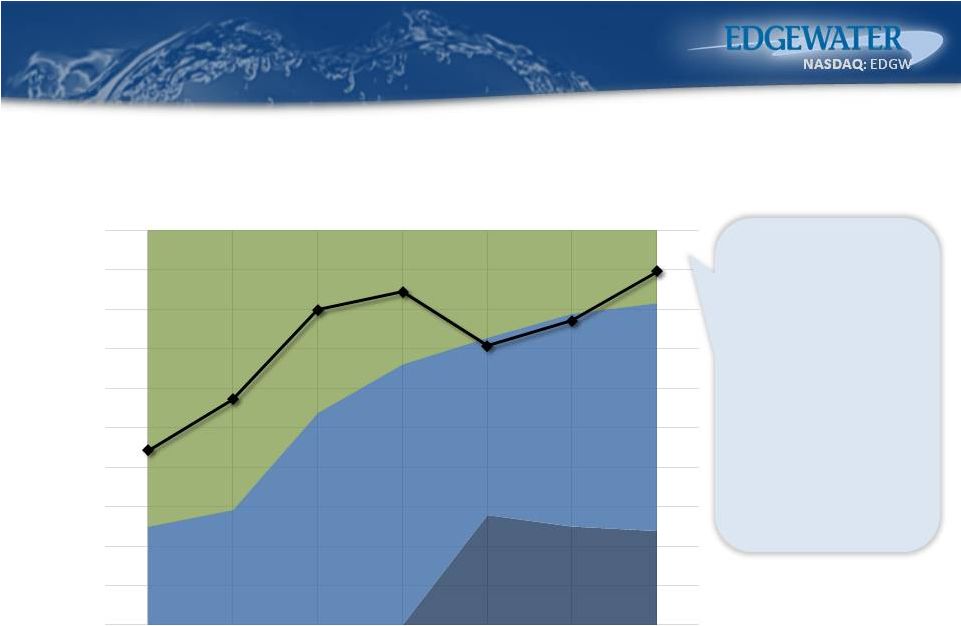 Favorable Shift in Service Revenue Favorable Shift in Service Revenue Mix Mix 17 ¹Annualized revenue per billable consultant is adjusted for utilization. Our shift toward more profitable service offerings—from Advisory/Tech to EPM and ERP—has driven a leading average revenue per consultant. Advisory/Tech EPM ERP 0% 10% 20% 30% 40% 50% 60% 70% 80% 90% 100% 2006 2007 2008 2009 2010 2011 2012 (YTD Jun 30) Average Annualized Service Revenue per Consultant vs. Service Revenue Mix¹ (Per Consultant Revenue in Dollars, Service Revenue Mix in Percentages) $278K $278K $300K $300K $340K $340K $348K 348K $324K $324K $335K $335K $357K $357K |
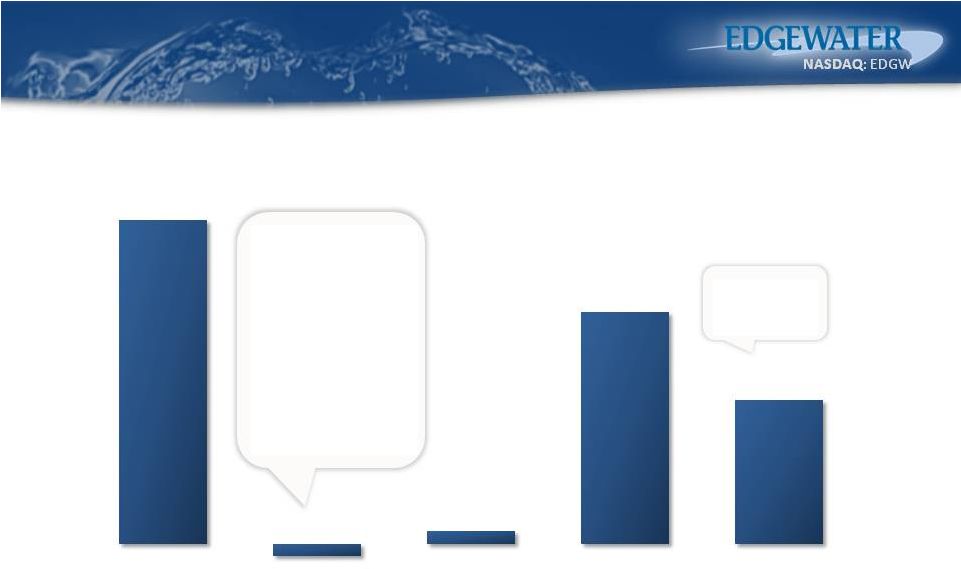 Free Cash Flow Generation, Minimal Free Cash Flow Generation, Minimal Cap Ex¹ Cap Ex¹ 18 ¹Free cash flow is a non-GAAP financial measure and is calculated as operating cash flow minus capital expenditures. See Appendix for a reconciliation to the most comparable GAAP financial measure. ²Free cash flow divided by enterprise value (reflective of the Company’s market capitalization, pricing as of the balance sheet date, less cash and cash equivalents). See Appendix for a calculation of this non-GAAP measure. Includes loss of two large clients. However, in the six-month period ended June 30, 2012, no client represents >5% of service revenue. 9.5% Cash Flow Yield² $7.4M 2008 2009 2010 2011 LTM @ Q2-12 ($0.3M) $0.3M $5.3M $3.3M |
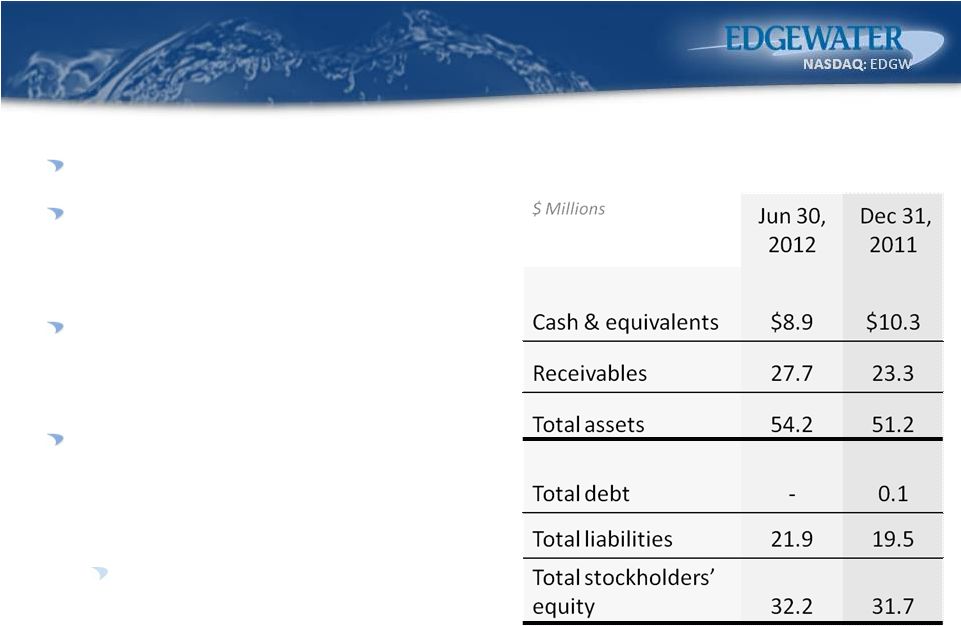 Balance Sheet Highlights¹ Balance Sheet Highlights¹ 19 $8.9M cash, $0 debt Historical net operating loss carry forwards of $50M at Dec 31, 2011 protect future cash flow $39M deferred net tax assets at Dec 31, 2011 (offset by full valuation allowance) Repurchased 1.4M shares since August 2011 for aggregate cost of $4.0M or $2.76 per share (thru Q2’12) – supported by 10b5-1 plan Approximately $2.5M remaining through expiration (Sept 2012) ¹As of June 30, 2012 (except NOL and deferred tax asset figures). Select Balance Sheet Items |
 Key Key Stats Stats (NASDAQ: (NASDAQ: EDGW) EDGW) 20 Trading Data (@ 6-29-12) Stock Price $3.89 52 Week Low/High $2.25/$4.29 Avg. Daily Vol. (3 Month) 15,500 Shares Outstanding 11.2M Public Float, est. 83% Institutional Holdings 71% Insider Holdings 6% Valuation Measures (@ 6-29-12) Market Cap $43.7M Enterprise Value $34.8M EV/Revenue (LTM) 0.3x EV/Adj. EBITDA (LTM) 5.7x Book Value Per Share $2.87 Financial Highlights (@ 6-30-12) Total Revenue (LTM) $103.9M Adj. EBITDA (LTM) $6.1M EPS (LTM) $0.00 $8.9M Total Assets (MRQ) $54.2M Total Debt (MRQ) $0M Total Liabilities (MRQ) $21.9M Total Equity (MRQ) $32.2M Source: Capital IQ $50.1 $88.5 $102.4 $103.9 ($0.6) $4.8 $7.9 $6.1 FY09 FY10 FY11 LTM @ Q2-12 Revenue Adj. EBITDA $ Millions Cash & Equivalents (MRQ) |
 Financial Goals Financial Goals Double-digit service revenue growth in the full year 2012 Continue to drive utilization to historical range of 78%-82% (73.2% today¹) Improvement in utilization range expected to be one of the catalysts to drive >10% Adjusted EBITDA margins (6.1% today¹) Maintain strong balance sheet for “tuck-in” acquisitions, internal growth initiatives & stock repurchases ¹As of the quarter ended June 30, 2012. Adjusted EBITDA is a non-GAAP financial measure. See Appendix for a reconciliation to the most comparable GAAP financial measure . |
 Edgewater Key Takeaways Edgewater Key Takeaways 22 We service large firms & middle-market companies, but have depth & ability to quickly deploy specialized solutions We believe the middle-market software replacement cycle is at a tipping point Powerhouse channel partners (Microsoft & Oracle) & marquee client base substantiate our value proposition Industry expertise leads to IP creation & monetization Profitable, strong cash flow & efficient capital structure allow for non-dilutive growth opportunities Experienced, incentivized management team $50.1 $88.5 $102.4 $103.9 FY10 FY11 LTM @ 12 Revenue Adj. EBITDA Q2- $ Millions FY09 ($0.6) $4.8 $7.9 $6.1 |
 Contact Information Contact Information 23 Edgewater Technology, Inc. 200 Harvard Mill Square, Suite 210 Wakefield, MA 01880 Tel (718) 246-3343 Company Contact Timothy R. Oakes, CFO Investor Relations Liolios Group Cody Slach Tel (949) 574-3860 EDGW@liolios.com |
 Appendix |
 Case Study #1 Case Study #1 25 Leading food manufacturer and distributor Aggressive Timelines for System, Process, and Staff Migration Establish PMO Data Migration and Integration Methodology for System integration Acquisition Change Management |
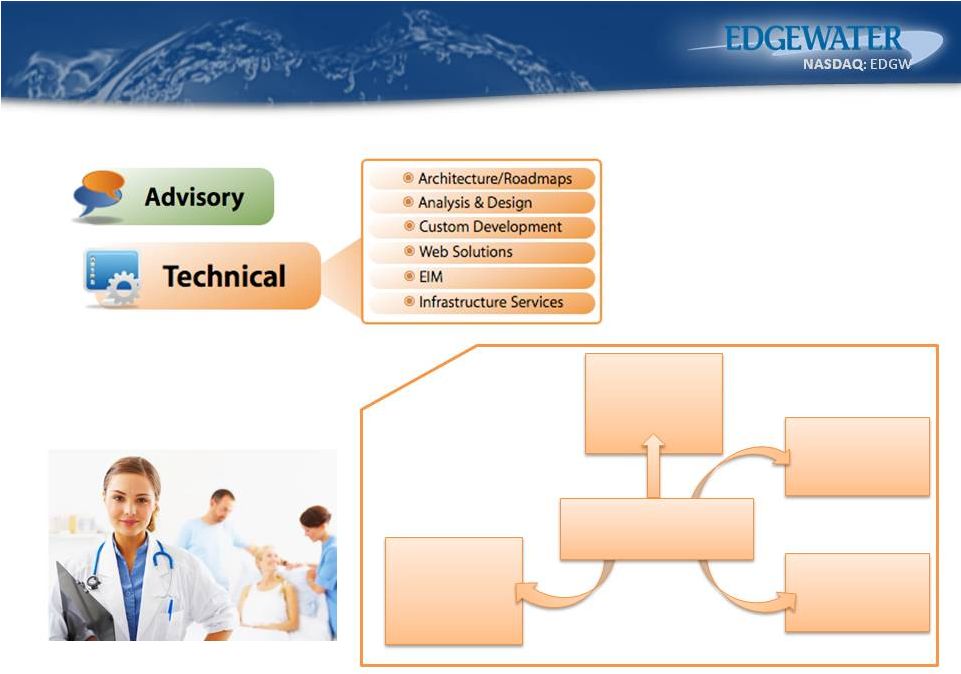 Phase 2: Pre-Production Implementation Phase 3: Production Implementation Enterprise Data Warehouse to Support Personalized Medicine Phase 1: Enterprise Data Strategy Comprehensive Cancer Center Case Study #2 Case Study #2 26 |
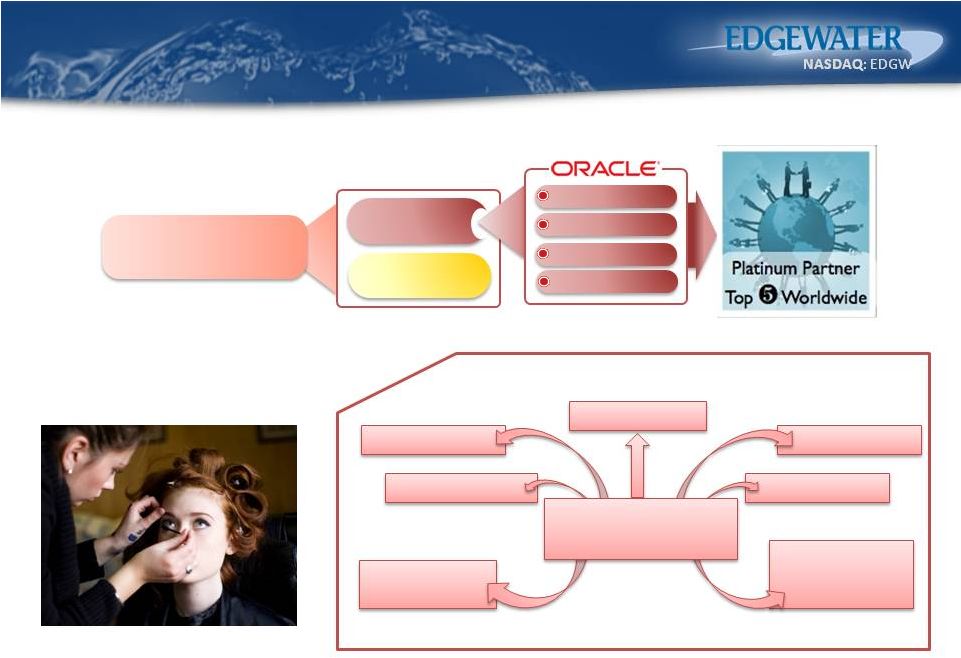 China Western Europe, Middle & East Africa Central & Eastern Europe Latin America North America Asia Pacific Leading Global Beauty Company Master P & L Product-Based Consulting Oracle Microsoft Planning Budgeting Consolidation Strategic Finance Case Study #3 Case Study #3 27 |
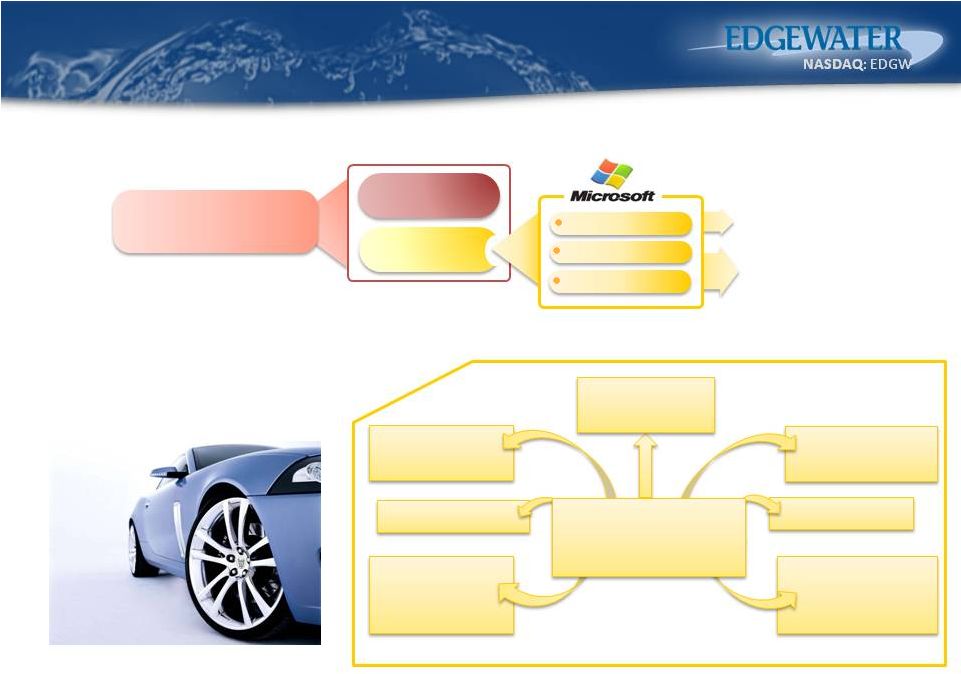 Accounting & Finance Customer Service/Sales Order Processing Marketing Product Development Executive Management Global Sales Global Supply Chain and Logistics Market Leader in Automotive Accessories #1 AX (ERP) in NA CRM/XRM SharePoint CRM/XRM Case Study #4 Case Study #4 28 Dynamics Business Intelligence Collaboration Product-Based Consulting Oracle Microsoft |
 Non-GAAP Financial Measures Non-GAAP Financial Measures 29 Edgewater reports its financial results in accordance with generally accepted accounting principles (“GAAP”). Management believes, however, that certain non-GAAP financial measures used in managing the Company’s business may provide users of this financial information with additional meaningful comparisons between current results and prior reported results. Certain of the information set forth herein and certain of the information presented by the Company from time to time may constitute non-GAAP financial measures within the meaning of Regulation G adopted by the Securities and Exchange Commission. We have presented herein a reconciliation of these measures to the most directly comparable GAAP financial measure. The non-GAAP measures presented herein may not be comparable to similarly titled measures presented by other companies. As noted below, the foregoing measures have limitations and do not serve as a substitute and should not be construed as a substitute for GAAP performance, but provide supplemental information concerning our performance that our investors and we find useful. Edgewater views Adjusted EBITDA and Free Cash Flow as important indicators of performance, consistent with the manner in which management measures and forecasts the Company’s performance. We believe Adjusted EBITDA measures are important performance metrics because they facilitate the analysis of our results, exclusive of certain non-cash items, including items which do not directly correlate to our existing business, providing specialty IT services. For instance, the exit of our former significant unrelated operations in 2000 and 2001 created significant net operating loss carry-forwards and deferred tax assets, and the tax provisions that we take under GAAP, for which there is no corresponding federal tax payment obligation for us, and the adjustments that we make to our deferred tax asset, based on the prospects and anticipated future profitability of our ongoing operations, can be significant and can obscure, either significantly, or in part, period-to-period changes in our core operating results. Likewise, we incur direct transaction costs related to acquisitions which are expensed in our GAAP financial statements. Our Adjusted EBITDA calculation excludes the effects of direct acquisition-related costs to facilitate an understanding of comparative period-to-period changes in our core operating results. Similarly, we incurred, and have excluded from our Adjusted EBITDA calculation, costs associated with the Fullscope Embezzlement Issue as we believe that the non-recurring nature of the costs associated with this issue makes comparison of our current and historical financial results difficult. We believe Free Cash Flow measures are important performance metrics because they provide us with a useful assessment of our liquidity and capital resources. The GAAP measure most directly comparable to Free Cash Flow is cash flow from operations. We use Free Cash Flow for the purpose of determining the amount of cash available for investment in our business, funding strategic acquisitions, repurchasing stock and other purposes. Our Free Cash Flow calculation is the result of cash flow from operations, less purchases of property and equipment. Because Free Cash Flow addresses the effect of capital expenditures that are not reflected in GAAP cash flow from operations, we believes that Free Cash Flow provides a useful assessment of our liquidity and capital resources. |
 Non-GAAP Financial Measures Non-GAAP Financial Measures (Continued) (Continued) We believe that Adjusted EBITDA and Free Cash Flow metrics provide qualitative insight into our current performance; we use these measures to evaluate our results, performance of our management team and our management’s entitlement to incentive compensation (with respect to Adjusted EBITDA); and we believe that making this information available to investors enables them to view our performance the way that we view our performance and thereby gain a meaningful understanding of our core operating results, in general, and from period to period. 30 |
 Reconciliation to Non-GAAP Reconciliation to Non-GAAP Measures Measures 31 1 Adjusted EBITDA is a Non-GAAP financial measure and is not intended to be a financial measure that should be regarded as an alternative to, or more meaningful than, GAAP Net Income (Loss). The Adjusted EBITDA measure presented may not be comparable to similarly titled measures presented by other companies. Adjusted EBITDA is defined as net income less interest income and other, net, plus taxes, depreciation and amortization, stock-based compensation expense, adjustments to contingent consideration earned, goodwill impairment charges, direct acquisition costs, the Fullscope Embezzlement Issue costs and lease abandonment charges. Fiscal Fiscal Fiscal Fiscal Fiscal Fiscal Fiscal Fiscal (YTD) (YTD LTM 2005 2006 2007 2008 2009 2010 2011 2011 Q2'11 Q2'12) Q2'12 Reconciliation of GAAP Net Income (Loss) to Adjusted EBTIDA 1 (Non-GAAP): Reported GAAP Net Income (Loss) 1,600 $ 3,203 $ 8,810 $ (47,018) $ (3,839) $ (23,572) $ 344 $ 344 $ (705) $ 309 $ (52) $ Add: Income Tax Provision 850 2,105 (2,896) 712 (1,047) 21,395 843 843 (352) 219 710 Add: Goodwill and Impairment Charge 0 0 0 48,594 0 0 0 0 0 0 0 Add: Deprecation & Amortization Expense 1,046 1,755 2,448 3,771 2,694 4,023 2,886 2,886 (1,428) 932 2,390 Add: Stock-based compensation expense 229 1,201 1,479 1,555 1,139 1,034 1,202 1,202 (609) 706 1,299 Add: Changes in Contingent Earnout Consideration 0 0 0 0 0 400 144 144 (1,468) 15 (1,309) Add: Direct Acquisition Costs 0 0 0 0 617 451 0 0 0 0 0 Add: Fullscope Embezzlement Costs 0 0 0 0 0 1,137 144 144 (114) 570 600 Add: Lease abandonment charge 0 0 0 0 0 0 2,230 2,230 0 0 2,230 Less: Interest Income and other expense, net (1,054) (1,283) (1,599) (503) (122) (34) 127 127 17 105 249 Adjusted EBITDA 1 2,346 $ 6,981 $ 8,242 $ 7,111 $ (558) $ 4,834 $ 7,920 $ 7,920 $ (4,659) $ 2,856 $ 6,117 $ Fiscal Year LTM (June 30, 2012) (In thousands, except per share data) Reconciliation of Non-GAAP Financial Measures Edgewater Technology, Inc. |
 Reconciliation to Non-GAAP Measures Reconciliation to Non-GAAP Measures 2 Free Cash Flow is a Non-GAAP financial measure and is not intended to be a financial measure that should be regarded as an alternative to, or more meaningful than, GAAP Cash Flow from Operations. The Free Cash Flow measure presented may not be comparable to similarly titled measures presented by other companies. Free Cash Flow is defined as cash flow from operations less purchases of property and equipment. 32 Fiscal Fiscal Fiscal Fiscal Fiscal (YTD) (YTD LTM 2008 2009 2010 2011 2011 Q2'11 Q2'12) Q2'12 Reconciliation of GAAP Cash Flow from Operations to Free Cash Flow 2 : Reported GAAP Cash Flows from Operations 7,742 $ (243) $ 698 $ 5,833 $ 5,833 $ (508) $ (1,680) $ 3,645 $ Less: Purchases of Property & Equipment (307) (32) (368) (518) (518) (199) 389 (328) Free Cash Flow 2 7,435 $ (275) $ 330 $ 5,315 $ 5,315 $ (707) $ (1,291) $ 3,317 $ Calculation of Enterprise Value & Free Cash Flow Yield (@ 6/30/12): Shares Outstanding (In Thousands) 11,235 Stock Price (June 29, 2012) 3.89 $ Market Capitalization 43,704 Less: Cash and Cash Equivalents (8,893) Enterprise Value 34,811 $ Free Cash Flow Yield 9.5% Edgewater Technology, Inc. Reconciliation of Non-GAAP Financial Measures (In Thousands, Except Per Share Amounts) LTM (June 30, 2012) |