QuickLinks -- Click here to rapidly navigate through this document
Exhibit 99.1
RISK FACTORS
Our retail store rollout strategy is subject to a number of risks and uncertainties.
The key driver of our growth strategy is our retail store expansion. In the 12 months ended November 1, 2003, our retail business accounted for 33.0% of total net sales. We began our retail expansion in 1999, and as of November 1, 2003, we had 63 full-line retail stores, 22 of which were opened in fiscal 2003, two resort stores and 17 merchandise clearance outlet stores in 51 markets. We opened an additional three full-line retail stores in November 2003 and currently plan to open 40 to 50 new stores in each of fiscal 2004 and fiscal 2005. There can be no assurance that these stores will be opened, will be opened in a timely manner, or, if opened, that these stores will be profitable. Our ability to open new retail stores depends on a number of factors, many of which are beyond our control, including the following:
- •
- We face competition for premium retail space, and if we encounter difficulty in identifying or securing these sites our expansion may be delayed;
- •
- We may encounter delays in negotiating site leases or be unable to obtain favorable lease terms for the retail store locations we identify;
- •
- We may experience construction delays and cost overruns in connection with the build-out of new stores;
- •
- We may be unable to hire and retain qualified retail sales and management personnel in the areas where our stores are located;
- •
- We are required to make long-term financial commitments when leasing retail store locations, which would make it more costly for us to close or relocate stores;
- •
- The success of our individual stores may depend on the success of the shopping malls or lifestyle centers in which they are located; and
- •
- The demographic and other marketing data we rely on in determining the location of our stores cannot predict future consumer preferences and buying trends with complete accuracy.
We have made numerous refinements in our retail store format since our first full-line store opening in 1999. Our retail model may undergo further refinements as we gain experience operating more stores. In addition, retail store operations entail substantial fixed costs, including costs associated with maintaining inventory levels, leasehold improvements, fixtures, store design, and information and management systems, and we must continue to make these investments to maintain our stores. There can be no assurance that our retail expansion will be successful or that we will be able to address the risks associated with this rapidly expanding portion of our business. Any miscalculations in our retail strategies, shortcomings in our planning, implementation, management and control, or our inability to sufficiently leverage incremental costs could require us to write off significant costs.
We may be unable to manage the costs associated with our catalog business.
We incur substantial costs associated with our catalog mailings, including paper, postage, merchandise acquisition and human resource costs associated with catalog layout and design, production and circulation and increased inventories. Most of these costs are incurred prior to mailing. As a result, we are not able to adjust the costs of a particular catalog mailing to reflect the actual subsequent performance of the catalog. In addition, increases in U.S. Postal Service rates and the cost of paper could significantly increase our catalog production costs and result in lower profits for our catalog business to the extent we are unable to pass these costs onto our customers or implement more cost effective printing, mailing or distribution systems. Because our catalog business accounts for a significant portion of total net sales, any performance shortcomings experienced by our catalog business
would likely have a material adverse effect on our overall business, financial condition, results of operations and cash flows.
Response rates to our catalogs could decline, which would negatively impact our net sales and results of operations.
Response rates to our catalog mailings and, as a result, the net sales generated by each catalog mailing, can be affected by factors beyond our control such as changing consumer preferences, willingness to purchase goods through catalogs, weak economic conditions and uncertainty, and unseasonable weather in key geographic markets. Additionally, a portion of our catalog mailings are to prospective customers. These mailings involve risks not present in mailings to our existing customers, including lower and less predictable response rates. Additionally, it has become more difficult for us and other direct retailers to obtain quality prospecting mailing lists, which may limit our ability to maintain the size of our active catalog customer list. Lower response rates could result in lower-than-expected full-price sales and higher-than-expected clearance sales at substantially reduced margins.
Our e-commerce business is subject to a number of risks that are beyond our control.
Our e-commerce business is vulnerable to a number of factors that are beyond our control, including the following:
- •
- Buying trends related to Internet usage and other risks associated with Internet usage, including consumer privacy concerns, changes in applicable federal and state regulation and security breaches;
- •
- Software filters installed by Internet service providers and businesses that may inhibit our ability to send e-mail messages to our customers; and
- •
- Failures in our website network infrastructure or the systems of third parties.
Any one or more of these factors could result in a reduction in our net sales as well as increased administrative and order processing costs.
Our catalog business depends on the timely mailing of our catalogs.
The timely mailing of our catalogs is critical to the success of our direct business, particularly during our peak holiday selling seasons, and requires the involvement of many different groups within our organization as well as outside vendors. Consequently, we are subject to potential delays at multiple points throughout the process of producing a catalog, many of which we may be unable to prevent. Any delay in mailing a catalog could cause customers to forego or defer purchases from us.
We may be unable to manage expanding operations and the complexities of our multi-channel strategy.
During the past few years, with the implementation of our multi-channel business model, our overall business has become substantially more complex. This increasing complexity has resulted in increased demands on our managerial, operational and administrative resources and has forced us to develop new expertise. For example, as a result of opening retail stores in numerous jurisdictions, we are required to deal with an increasing number of state and local tax authorities with respect to all of our channels. We also face new risks and uncertainties, such as the possibility that some of our direct customers may shift to our retail segment as we open more stores, which may cause our direct sales to
2
decline. In order to manage currently anticipated levels of future demand, we will be required to continue, among other things, to:
- •
- improve and integrate our management information systems and controls, including installing and integrating a new inventory management system;
- •
- expand our distribution capabilities;
- •
- attract, train and retain qualified personnel, including middle and senior management, and manage an increasing number of employees; and
- •
- obtain sufficient manufacturing capacity from vendors to produce our merchandise on a timely basis.
Our continued growth could strain our management, financial, merchandising, marketing, distribution and other resources. Any failure to manage growth effectively could harm our financial condition, results of operations and cash flows.
We may be unable to anticipate changing customer preferences and to respond in a timely manner by adjusting our merchandise offerings, which could result in lower sales.
Our future success will depend on our ability to continually select the right merchandise assortment, maintain appropriate inventory levels and creatively present merchandise in a way that is appealing to our customers. Consumer preferences cannot be predicted with certainty, as they continually change and vary from region to region. On average, we begin the design process for our apparel nine to ten months before merchandise is available to our customers, and we typically begin to make purchase commitments four to six months in advance. These lead times make it difficult for us to respond quickly to changing consumer preferences and amplify the consequences of any misjudgments we might make in anticipating customer preferences. Consequently, if we misjudge our customers' merchandise preferences or purchasing habits, our sales may decline significantly, and we may be required to mark down certain products to significantly lower prices to sell excess inventory, which would result in lower margins.
We depend on key vendors for timely and effective sourcing and delivery of our merchandise.
Our direct business depends largely on our ability to fulfill orders on a timely basis, and our direct and retail businesses largely depend on our ability to keep appropriate levels of inventory in our distribution center and our stores. As we grow our retail business, we may experience difficulties in obtaining sufficient manufacturing capacity from vendors to produce our merchandise. We generally maintain non-exclusive relationships with multiple vendors that manufacture our merchandise. However, we have no contractual assurances of continued supply, pricing or access to new products, and any vendor could discontinue selling to us at any time. If we were required to change vendors or if a key vendor were unable to supply desired merchandise in sufficient quantities on acceptable terms, we may experience delays in filling customer orders or delivering inventory to our stores until alternative supply arrangements are secured, which could result in lost sales and a decline in customer satisfaction. Furthermore, products from alternative sources, if any, may be of a lesser quality and/or more expensive than those we currently purchase.
3
Our increasing reliance on foreign vendors will subject us to a variety of risks and uncertainties.
As we expand our retail stores and our merchandise volume requirements increase, we expect to source merchandise directly from foreign vendors, particularly those located in Asia, which will expose us to new and greater risks and uncertainties, including:
- •
- burdens associated with doing business overseas, including the imposition of, or increases in, tariffs or import duties, or import/export controls or regulation, and the availability of quotas, as well as credit assurances we are required to provide to foreign vendors in connection with our private label merchandise;
- •
- difficulty in identifying and supervising suppliers in foreign countries;
- •
- requirements that we make purchase commitments to foreign vendors earlier than required for domestic vendors, which may prevent us from using a portion of our working capital for other purposes;
- •
- declines in the relative value of the U.S. dollar to other foreign currencies, which could negatively affect the profitability and business prospects of one or more of our foreign vendors and their ability to provide merchandise to us at favorable prices, or at all; and
- •
- changing or uncertain economic conditions in foreign countries resulting in the disruption of trade from exporting countries, restrictions on the transfer of funds or transportation delays or interruptions.
In addition, in certain countries, political uncertainties or unrest, including work stoppages, foreign government regulations, wars and fears of war or political unrest, epidemics or other health risks or weather-related problems may disrupt the ability of foreign vendors to supply merchandise to us in a timely manner. The occurrence of any or all of these factors could substantially increase our costs to source merchandise through foreign vendors. Consequently, there is no assurance that we will be able to achieve any perceived cost savings. Furthermore, although we have fair labor agreements with all of our domestic importers, as we increase our direct imports, we will need to implement additional policies and procedures to ensure vendors comply with our standards. If one or more of our foreign vendors do not adhere to our quality assurance standards or our standards for conducting business (including, for example, fair labor standards and the prohibition on child labor), we could lose customer goodwill.
We may be unable to fill customer orders efficiently, which could harm customer satisfaction.
Our ability to efficiently process and fill customer orders is critical to our business and is subject to a number of risks, many of which are beyond our control:
- •
- failures in the efficient and uninterrupted operation of our customer service call centers or our sole distribution center in Mineral Wells, West Virginia, including system failures caused by telecommunications systems providers and order volumes that exceed our present telephone or Internet system capabilities;
- •
- delays or failures in the performance of third parties, such as shipping companies and the U.S. postal and customs services, including delays associated with labor disputes, labor union activity, inclement weather, natural disasters, health epidemics and possible acts of terrorism; and
- •
- disruptions or slowdowns in our order processing or fulfillment systems resulting from the recently increased security measures implemented by U.S. customs, or from homeland security measures, telephone or Internet down times, system failures, computer viruses, electrical outages, mechanical problems, human error or accidents, fire, natural disasters or comparable events.
4
These events could cause delays in our ability to receive and distribute orders and may cause orders to be lost or to be shipped or delivered late. As a result, customers may cancel or refuse to accept orders, and customer satisfaction could be harmed. Additionally, delays in shipping merchandise to our retail stores could cause us to lose sales if sufficient inventory is not available in stores at the time customers want to purchase the merchandise.
We may be unable to provide adequate levels of customer service, which could result in lost sales.
We believe that our success to date has been largely based on our reputation for superior customer service, and any damage to our customer service reputation could result in reduced sales and harm our operating results. Our ability to provide superior customer service depends, among other things, on our ability to do the following:
- •
- maintain high call response rates in our call centers;
- •
- manage inventory levels to ensure merchandise is available in our stores in the most popular styles, colors and sizes;
- •
- ship merchandise purchased through our catalogs or over the Internet in a timely manner;
- •
- ensure adherence to our strict quality assurance standards by vendors as our merchandise volume requirements grow; and
- •
- hire and train qualified, friendly call center and retail store associates.
Our ability to do these things will be even more difficult as we open more geographically dispersed retail stores. Any failure on our part to successfully manage and perform these activities could harm customer service and reduce our net sales.
We have a liberal merchandise return policy, and we may experience a greater number of returns than we anticipate.
As part of our customer service commitment, we maintain a liberal merchandise return policy that allows customers to return any merchandise, virtually at any time and for any reason, and regardless of condition. We make allowances in our financial statements for anticipated merchandise returns based on historical return rates and our future expectations. These allowances may be exceeded, however, by actual merchandise returns as a result of many factors, including changes in the merchandise mix or consumer preferences or confidence. Any significant increase in merchandise returns or merchandise returns that exceed our allowances could materially adversely affect our financial condition, results of operations and cash flows.
Our quarterly results of operations fluctuate and are impacted by our ability to predict sales trends and by seasonal influences.
As with many apparel retailers, our net sales, operating results, liquidity and cash flows have fluctuated, and will continue to fluctuate, on a quarterly basis, as well as an annual basis, as a result of a number of factors, including, but not limited to, the following:
- •
- the composition, size and timing of our various merchandise offerings, including when we recognize related sales and costs;
- •
- the number and timing of our full-line retail store openings;
- •
- the timing of our catalog mailings and the number of catalogs we mail;
- •
- customer response to merchandise offerings, including the impact of economic and weather-related influences, the actions of our competitors and similar factors;
5
- •
- our ability to accurately estimate and accrue for merchandise returns and the costs of obsolete inventory disposition;
- •
- overall merchandise return rates, including the impact of actual or perceived service and quality issues;
- •
- market price fluctuations in critical materials and services, including paper, production, postage and telecommunications costs;
- •
- the timing of merchandise receiving and shipping, including any delays resulting from labor strikes or slowdowns, adverse weather conditions, health epidemics or national security measures; and
- •
- shifts in the timing of important holiday selling seasons relative to our fiscal quarters, including Valentine's Day, Easter, Mother's Day, Thanksgiving and Christmas, and the day of the week on which certain important holidays fall.
Our results continue to depend materially on sales and profits from the November and December holiday shopping season. In anticipation of traditionally increased holiday sales activity, we incur certain significant incremental expenses, including the hiring of a substantial number of temporary employees to supplement our existing workforce. If, for any reason, we were to realize lower-than-expected sales or profits during the November and December holiday selling season, our financial condition, results of operations, including related gross margins, and cash flows for the entire fiscal year would be materially adversely affected.
We face substantial competition from discount retailers in the women's apparel industry.
We believe our customers are willing to pay slightly higher prices for our unique merchandise and superior customer service. However, we face substantial competition from discount retailers, such as Kohl's and Target, for basic elements in our merchandise lines, and our net sales may decline if we are unable to differentiate our merchandise and shopping experience from these discount retailers. In addition, the retail apparel industry has experienced significant price deflation over the past several years largely due to the downward pressure on retail prices caused by discount retailers. This price deflation may make it more difficult for us to maintain our gross margins and to compete with retailers that have greater purchasing power than we have. Furthermore, because we currently source a significant percentage of our merchandise through intermediaries and from suppliers and manufacturers located in the United States and Canada, where labor and production costs, on average, tend to be higher, our gross margins may be lower than those of competing retailers.
Our success is dependent upon our senior management team.
Our future success depends largely on the efforts of Dennis Pence, Chairman and Chief Executive Officer; Georgia Shonk-Simmons, President and Chief Merchandising Officer; and Dan Griesemer, Senior Vice President of Retail. The loss of any of these individuals or other key personnel could have a material adverse effect on our business. Furthermore, the location of our corporate headquarters in Sandpoint, Idaho may make it more difficult to replace key employees who leave us, or to add qualified employees we will need to manage our further growth.
Prior to joining our company, Melvin Dick, our Executive Vice President and Chief Financial Officer, served as the lead engagement partner for Arthur Andersen's audit of WorldCom's consolidated financial statements for the fiscal year ended December 31, 2001, and its subsequent review of WorldCom's condensed consolidated financial statements for the fiscal quarter ended March 31, 2002. The ongoing investigation of the WorldCom matter may require Mr. Dick's attention, which may impair his ability to devote his full time and attention to our company. Further, Mr. Dick's
6
association with the WorldCom matter may adversely affect customers' or investors' perception of our company.
Lower demand for our merchandise could reduce our gross margins and cause us to slow our retail expansion.
Our merchandise is comprised primarily of discretionary items, and demand for our merchandise is affected by a number of factors that influence consumer spending. Lower demand may cause us to move more full-price merchandise to clearance, which would reduce our gross margins, and could adversely affect our liquidity (including compliance with our debt covenants) and, therefore, slow the pace of our retail expansion. We have maintained conservative inventory levels, which we believe will make us less vulnerable to sales shortfalls. However, low inventory levels also carry the risk that, if demand is stronger than we anticipate, we will be forced to backorder merchandise, which may result in lost sales and lower customer satisfaction.
Our sales tax collection policy may expose us to the risk that we may be assessed for unpaid taxes.
Many states have attempted to require that out-of-state direct marketers and e-commerce retailers whose only contact with the taxing state are solicitations and delivery of purchased products through the mail or the Internet collect sales taxes on sales of products shipped to their residents. The U.S. Supreme Court has held that these states, absent congressional legislation, may not impose tax collection obligations on an out-of-state mail order or Internet company. Although we believe that we have collected sales tax where we are required to do so under existing law, state tax authorities may disagree, and we could be subject to assessments for uncollected sales taxes, as well as penalties and interest and demands for prospective collection of such taxes. Furthermore, if Congress enacts legislation permitting states to impose sales tax collection obligations on out-of-state catalog or e-commerce businesses, or if we are otherwise required to collect additional sales taxes, such tax collection obligations may negatively affect customer response and could have a material adverse effect on our financial position, results of operations and cash flows. In addition, as we open more retail stores, our tax collection obligations will increase significantly and complying with the greater number of state and local tax regulations to which we will be subject may strain our resources.
Our stock price has fluctuated and may continue to fluctuate widely.
The market price for our common stock has fluctuated and has been and will continue to be significantly affected by, among other factors, our quarterly operating results, changes in any earnings estimates publicly announced by us or by analysts, customer response to our merchandise offerings, the size of our catalog mailings, the timing of our retail store openings or of important holiday seasons relative to our fiscal periods, seasonal effects on sales and various factors affecting the economy in general. The reported high and low closing sale prices of our common stock were $11.36 per share and $5.37 per share, respectively, during the fiscal year ended February 1, 2003, and were $13.10 per share and $5.86 per share, respectively, during the first nine months of our 2003 fiscal year. In addition, the Nasdaq National Market has experienced a high level of price and volume volatility and market prices for the stock of many companies have experienced wide price fluctuations not necessarily related to the operating performance of such companies.
7
MANAGEMENT'S DISCUSSION AND ANALYSIS OF
FINANCIAL CONDITION AND RESULTS OF OPERATIONS
We encourage you to read this Management's Discussion and Analysis of Financial Condition and Results of Operations in conjunction with our accompanying consolidated financial statements and their related notes. Our discussion of our results of operations and financial condition includes various forward-looking statements about our markets, the demand for our products and services and our future results. We based these statements on assumptions that we consider reasonable. Actual results may differ materially from those suggested by our forward-looking statements for various reasons including those discussed in the "Risk Factors" included elsewhere in this report.
When we refer to a fiscal year, we mean the calendar year in which the fiscal year begins. On December 16, 2002, our Board of Directors approved a change in our fiscal year end from the Saturday nearest February 28 to the Saturday nearest January 31, effective February 1, 2003. Accordingly, our 2002 fiscal year consisted of an 11-month transition period. We made this decision to align our financial reporting schedule with the majority of other national retail companies.
We currently operate in two reportable segments, our direct segment and our retail segment. Beginning in the quarter ended May 3, 2003, we reclassified our outlet store business and phone and Internet orders that originate in our retail stores from our direct segment to our retail segment. We made these reclassifications to reflect the manner in which our segments are currently managed. We have reclassified prior period financial statements on a consistent basis for fiscal years 2002, 2001 and 2000. These reclassifications had no impact on our consolidated net sales, net income, retained earnings or cash flows for any period. Due to information systems limitations, we did not reclassify periods prior to fiscal 2000 because it was not practicable for us to do so. In addition, management believes that the reclassification of these prior periods would be immaterial.
Unless otherwise indicated, the common stock outstanding, retained earnings and net income per share amounts appearing in this report and the financial statements included herein reflect two 50% stock dividends, each having the effect of a 3-for-2 stock split, declared by our Board of Directors on December 19, 2002 and August 4, 2003, respectively. These stock dividends have the combined effect of a 2.25-for-1 stock split.
Coldwater Creek Profile
Coldwater Creek is a multi-channel, specialty retailer of women's apparel, accessories, jewelry and gift items. Our unique, proprietary merchandise assortment and our retail stores, catalogs and e-commerce website are designed to appeal to women between the ages of 30 and 60, with household incomes in excess of $50,000. We reach our customers through our direct segment, which consists of our catalog and e-commerce businesses, and our rapidly expanding base of retail stores.
Our catalog business is a significant sales channel and acts as an efficient marketing platform to cross-promote our website and retail stores. During the 12 months ended November 1, 2003, we mailed 140.8 million catalogs. We launched our full-scale e-commerce website,www.coldwatercreek.com, in 1999 to cost-effectively expand our customer base and provide another convenient shopping alternative for our customers. We currently have a database of over 2.0 million e-mail addresses to which we regularly send customized e-mails.
Our retail channel is our fastest growing sales channel and represented 33.0% of our total net sales in the 12 months ended November 1, 2003. We expect our retail business to be the key driver of our growth strategy. As of November 1, 2003, we operated 63 full-line retail stores, 22 of which were opened in fiscal 2003, as well as two resort stores and 17 merchandise clearance outlet stores in 51 markets. We opened three additional stores in November 2003 and currently plan to open 40 to 50 new stores in each of fiscal 2004 and fiscal 2005. We closed one outlet store in December 2003. Over the
8
past four years, we have been refining our retail store model and have taken the following steps to support the growth of our retail business and realize the benefits of our multi-channel model:
- •
- testing and developing a scaleable retail store model for national rollout;
- •
- deepening the management team, particularly in our retail segment, by hiring key members of management with extensive retail experience;
- •
- focusing our merchandise offering by refining our product assortment and increasing our investment in key items; and
- •
- integrating our retail and direct merchandise planning and inventory management functions to maintain fashion continuity and brand integrity across all channels.
Direct Segment Operations
Our direct segment includes our catalog and e-commerce businesses. Our direct channel generated $351.5 million in net sales, or approximately 67.0% of our total net sales, for the 12 months ended November 1, 2003. As we continue to rollout our retail stores, we expect our direct segment to decrease as a percentage of total net sales over time. However, we expect our direct segment to continue to be a core component of our operations and brand identity and an important vehicle to promote each of our channels and provide cash flow to support our retail store expansion.
For the 12 months ended November 1, 2003, our catalog business generated $201.4 million in net sales, or 38.4% of total net sales. Historically, we used three catalogs,Northcountry, Spirit andElements, to feature our entire line of full-price merchandise with different assortments for each title to target separate sub-groups of our core demographic. In November 2003, we announced our intention to combine our two smaller catalogs,Spirit andElements, and to re-introduce the combined catalog under theSpirit title in January 2004. Additionally, each year we assemble selected merchandise from the most popular items in our primary merchandise lines and feature them in a festiveGifts-to-Go holiday catalog and on our website.
Since 2000, in an effort to increase the productivity of our direct business and reduce costs, we have reduced our catalog circulation and have been actively promoting the migration of our customers from our catalogs to our more cost-efficient e-commerce website. We have also focused on decreasing the number of mailings to prospective customers because they increasingly produce lower response rates and contribute fewer sales than mailings to active customers. In fiscal 2003, we mailed 117.8 million catalogs, down 35.8% from our peak mailings of 183.6 million catalogs in 2000. We expect to continue to reduce our catalog circulation, particularly to prospective customers, which we believe will continue to have a positive impact on our selling, general and administrative expenses. Although we anticipate losing some potential prospect sales, we believe that optimizing the level of our prospect mailings will have an overall positive impact on our net income.
We launched our full-scale e-commerce website,www.coldwatercreek.com, in July of 1999 to offer a convenient, user-friendly and secure online shopping option for our customers. The website features our entire full-price merchandise offering found in our catalogs and retail stores. It also serves as an efficient promotional vehicle for the disposition of excess inventory.
In the 12 months ended November 1, 2003, online net sales were $150.1 million and represented 28.6% of total net sales. As of November 1, 2003, we had over 2.0 million opt-in e-mail addresses to which we regularly send customized e-mails to drive sales through our website and our other channels.
9
We also participate in a net sales commission-based program whereby numerous popular Internet search engines and consumer and charitable websites provide hotlink access to our website. This affiliate program serves as an effective tool in prospecting for new customers.
Retail Segment Operations
Our retail segment includes our retail and outlet stores and catalog and Internet sales that originate in our retail stores. Our retail channel is our fastest growing sales channel and generated $172.8 million in net sales, or 33.0% of total net sales, for the 12 months ended November 1, 2003.
We opened our first full-line retail store in November 1999 and have since tested and refined our store format and reduced capital expenditures required for build-out. We currently plan to open 40 to 50 new stores in each of fiscal 2004 and fiscal 2005 and believe there is an opportunity to grow to 400 to 500 stores in up to 275 identified markets nationwide over the next six to eight years. The pace, scope and size of our retail store expansion will be influenced by the economic environment, available working capital, our ability to identify and obtain favorable terms on suitable locations for our stores and, if necessary, external financing.
Our core new store model, which we introduced in the second half of 2002, consists of 5,000 to 6,000 square foot stores. These stores reflect improvements in our construction processes, materials and fixtures, merchandise layout and store design and have reduced our initial capital investment per store compared to previously opened stores. This model assumes an average initial net investment per store of approximately $560,000 and anticipates net sales per square foot of approximately $500 in the third year of operations. For the 12 months ended November 1, 2003, our 37 full-line stores that had been open at least 13 months averaged 7,269 square feet and net sales per square foot of $467. Most of these stores have been open for one to two years.
We are also testing a smaller store model of 3,000 to 4,000 square foot stores. We have designed these stores to access smaller markets and to increase our presence in larger metropolitan markets. This model assumes an average initial net investment per store of approximately $400,000 and anticipates net sales per square foot of approximately $600 in the third year of operations. We currently have six stores open in this model, none of which has been open for a full year.
We currently operate 16 outlet stores where we sell excess inventory. We plan to open an additional three outlet stores in fiscal 2004. We generally locate the outlets within clusters of our retail stores to efficiently manage our inventory and clearance activities, but far enough away to avoid significantly diminishing our full-line store sales. Unlike many other apparel retailers, we use our outlet stores only to sell overstocked premium items from our full-line retail stores and do not have merchandise produced directly for them.
10
Results of Operations
The following table sets forth certain information regarding our costs and expenses expressed as a percentage of consolidated net sales:
| | Fiscal Year Ended
| | Nine Months Ended
| | Three Months Ended
| |
|---|
| | March 3,
2001
(53 weeks)
| | March 2,
2002
(52 weeks)
| | Feb. 1,
2003
(48 weeks)
| | November 2,
2002
| | November 1,
2003
| | November 2,
2002
| | November 1,
2003
| |
|---|
| Net sales | | 100.0 | % | 100.0 | % | 100.0 | % | 100.0 | % | 100.0 | % | 100.0 | % | 100.0 | % |
| Cost of sales | | 55.7 | | 58.8 | | 60.1 | | 58.6 | | 60.9 | | 57.2 | | 58.8 | |
| | |
| |
| |
| |
| |
| |
| |
| |
| Gross profit | | 44.3 | | 41.2 | | 39.9 | | 41.4 | | 39.1 | | 42.8 | | 41.2 | |
| Selling, general and administrative expenses | | 39.9 | | 40.7 | | 36.6 | | 39.3 | | 36.3 | | 36.7 | | 34.7 | |
| | |
| |
| |
| |
| |
| |
| |
| |
| Income (loss) from operations | | 4.5 | | 0.5 | | 3.3 | | 2.1 | | 2.8 | | 6.1 | | 6.5 | |
| Interest, net, and other | | 0.2 | | 0.1 | | 0.0 | | 0.0 | | 0.0 | | (0.1 | ) | 0.0 | |
| | |
| |
| |
| |
| |
| |
| |
| |
| Income (loss) before provision for income taxes | | 4.7 | | 0.6 | | 3.3 | | 2.1 | | 2.8 | | 6.0 | | 6.5 | |
| Income tax (benefit) provision | | 1.8 | | 0.2 | | 1.3 | | 0.8 | | 1.0 | | 2.3 | | 2.4 | |
| | |
| |
| |
| |
| |
| |
| |
| |
| Net income (loss) | | 2.9 | % | 0.4 | % | 2.0 | % | 1.3 | % | 1.7 | % | 3.8 | % | 4.1 | % |
| | |
| |
| |
| |
| |
| |
| |
| |
Comparison of the Three- and Nine-Month Periods Ended November 1, 2003 with the Three- and Nine-Month Periods Ended November 2, 2002
Net Sales. Our consolidated net sales in the fiscal 2003 third quarter and first nine months increased by $9.3 million and $22.8 million, respectively. The increase was due primarily to our retail expansion, increased clearance sales and, to a lesser extent, improved full-line retail store performance. For the fiscal 2003 third quarter, our retail segment net sales increased $17.1 million, or 45.9%. Our full-line retail store expansion accounted for 73.1% of this sales growth, with the balance from our clearance outlets and existing full-line retail stores. For the first nine months of fiscal 2003, our retail segment net sales increased $38.5 million, or 43.0%. Our full-line retail store expansion accounted for 70.9% of this sales growth with the balance from our clearance outlets and existing full-line retail stores. These increases were partially offset by decreased net sales from our catalog and e-commerce businesses of $7.8 million, or 8.5%, and $15.7 million, or 6.6%, for the fiscal 2003 third quarter and first nine months, respectively. Please refer to our discussions titled"Three- and Nine-Month Operating Segment Results" below for further details.
Gross Profit. Our consolidated gross profit dollars for the fiscal 2003 third quarter and first nine months increased by $1.7 million, or 3.2%, to $56.9 million, and by $1.2 million, or 0.9%, to $136.7 million, respectively. The increase was primarily due to the increase in our consolidated net sales. Our consolidated gross profit rate for the fiscal 2003 third quarter and first nine months decreased to 41.2% and 39.1%, respectively. The decrease was due primarily to a reduction in merchandise margins of 3.4 percentage points and 3.2 percentage points for the fiscal 2003 third quarter and the first nine months, respectively, on full-price sales from our catalog and e-commerce businesses as we undertook promotional campaigns to reactivate customers and increase average units per order. Our consolidated gross profit was also negatively impacted by direct segment clearance sales, which increased $1.9 million, or 10.8%, at a 0.5 percentage point lower margin in the three months ended November 1, 2003 than in the three months ended November 2, 2002. Our direct segment clearance sales increased $10.6 million, or 25.4%, in the first nine months of fiscal 2003 from the same period in the prior year. We have discontinued many of our promotional campaigns in our direct
11
segment. Additionally, we believe that our inventory levels are now aligned with our retail store growth strategy and do not anticipate disposition activities beyond those typically encountered by retailers. Consequently, we expect that our gross profit rate will stabilize.
These negative impacts on our gross profit rate were partially offset by improved leveraging of full-line retail store occupancy costs and, to a lesser extent, by improved merchandise margins on full-price sales from our retail segment and by improved direct segment sales returns. Our margin was positively impacted by an improvement of 1.4 percentage points and 0.9 percentage points, respectively, in the leveraging of our full-line retail store occupancy costs. We were able to leverage our retail store occupancy costs primarily due to improved net sales at our retail stores. Our margin was also positively impacted by a 1.5 percentage point and 1.8 percentage point improvement in our merchandise margins on full-price sales from our retail segment for the fiscal 2003 third quarter and first nine months, respectively. We attribute our improved margins on full-price retail sales to our decision to reduce the number of days merchandise is discounted before it is moved to our outlet stores. In addition, for the fiscal 2003 third quarter and first nine months, direct segment returns declined as a percentage of sales by 3.4 percentage points and 3.0 percentage points, respectively.
Additionally, we recognized $0.2 million of vendor rebates during the three months ended November 1, 2003 versus $1.1 million in the three months ended November 2, 2002. We recognized $1.5 million of vendor rebates during the first nine months of fiscal 2003 versus $1.1 million in the first nine months of fiscal 2002. These rebates were credited to cost of sales as the related merchandise was sold.
Selling, General and Administrative Expenses. Selling, general and administrative expenses in the fiscal 2003 third quarter were $48.0 million, an increase of $0.7 million over the three-month period ended November 2, 2002, and were $126.9 million in the first nine months of fiscal 2003, a decrease of $1.8 million over the nine month period ended November 2, 2002.
Selling, general and administrative expenses in the fiscal 2003 third quarter and the first nine months of fiscal 2003 were positively impacted by reduced costs associated with catalog mailings of approximately $3.1 million and $7.3 million, respectively. We decreased our catalog mailings by 4.8%, to 92.1 million in the first nine months of fiscal 2003 from 96.7 million in the first nine months of fiscal 2002. We increased our catalog mailings by 3.0 million, or 7.6%, to 42.7 million in the three months ended November 1, 2003 from 39.7 million in the three months ended November 2, 2002. However, the number of catalogs mailed in the three- and nine-month periods ended November 1, 2003, includes our first holiday catalog of the year, which totaled approximately 11.0 million catalogs, and which was timed to arrive in homes during the final three days of the third quarter. The revenues and costs associated with this catalog mailing will, for the most part, be recognized in the fiscal 2003 fourth quarter. In the prior year, this same catalog was sent in the fourth quarter of fiscal 2002. Excluding the 11.0 million holiday catalogs, we mailed approximately 8.0 million, or 20.0%, fewer catalogs in the three months ended November 1, 2003 than in the three months ended November 2, 2002 and approximately 15.7 million, or 16.2%, fewer catalogs in the fiscal 2003 first nine months than in the nine months ended November 2, 2002.
Additionally, we mailed more catalogs to our house file relative to the total catalog mailings in the fiscal 2003 third quarter compared with the three months ended November 2, 2002. We generally realize better response rates to our house file mailings than to our prospecting catalog mailings and have observed falling response rates to our prospecting catalog mailings. The percentage of mailings to our house file increased 7.1 percentage points and 4.9 percentage points in the fiscal 2003 third quarter and first nine months, respectively.
Offsetting the positive impacts of our reduced catalog mailings were increased personnel costs associated with our retail expansion and, to a lesser extent, an accrual of approximately $1.4 million (pre-tax) for expected sales tax liabilities. Personnel costs associated with our retail expansion increased
12
$2.3 million, or 17.6%, for the fiscal 2003 third quarter, and $5.8 million, or 16.3%, for the fiscal 2003 first nine months. The personnel costs primarily included store employee wages, administrative and technical support salaries, related taxes and employee benefits. The majority of the $1.4 million (pre-tax) sales tax accrual resulted from an error in our Canadian tax returns related to refunds of the Canadian Goods and Services Tax, known as the GST. Canada allows refunds for GST paid by retailers, as it imposes a value-added tax that is collected from the consumer or user of the goods and services purchased. During the fiscal 2003 third quarter, we discovered we included Canadian provincial sales tax in our GST refund claims. The provincial sales taxes we were including are not refundable. Since discovering this, we have properly filed our current GST refund claims and we have accrued the amount of taxes we estimate we will need to pay back to Canada. Also, we accrued for sales taxes we estimate are payable to certain counties in one state in which we have a retail presence but did not collect sufficient sales taxes from our customers. This accrual is included in the $1.4 million (pre-tax) amount.
Other Operating Data. Our mailing list grew to 14.9 million names at November 1, 2003 from 14.0 million names at February 1, 2003. Also, our proprietary e-mail address database consisted of 2.1 million names at November 1, 2003 compared with 1.8 million names at February 1, 2003. Our active customers declined slightly to 2.6 million at November 1, 2003 from 2.7 million at February 1, 2003. Our active customers are those customers who have purchased merchandise from us through any of our three sales channels during the preceding 12 months. Active customers do not include retail customers who have not provided identifying information to us.
Income Tax Rate. Our effective income tax rate was 37.3% in the three months ended November 1, 2003 compared with 38.0% in the three months ended November 2, 2002. Our effective income tax rate was 37.4% in the first nine months of fiscal 2003 compared with 39.3% in the first nine months of fiscal 2002. The current year's rate for both the fiscal 2003 third quarter and first nine months was lower because we reversed an accrual for approximately $0.2 million related to certain income taxes. Also, the rate for the fiscal 2002 first nine months was higher than the rate for the fiscal 2003 first nine months because it included the impact of the non-deductibility for tax purposes of the imputed salaries of $0.2 million for Dennis Pence and Ann Pence.
13
Net Sales. The following table summarizes our net sales by segment (in thousands):
| | Three Months Ended
| |
|---|
| |
| |
| |
| |
| | Change
| |
|---|
| | November 2, 2002
| | % of Total
| | November 1, 2003
| | % of Total
| |
|---|
| | $
| | %
| |
|---|
| Catalog | | $ | 52,232 | | 40.5 | % | $ | 44,749 | | 32.4 | % | $ | (7,483 | ) | (14.3 | )% |
| Internet | | | 39,368 | | 30.6 | % | | 39,081 | | 28.3 | % | | (287 | ) | (0.7 | )% |
| | |
| |
| |
| |
| |
| | | |
| | Direct | | | 91,600 | | 71.1 | % | | 83,830 | | 60.7 | % | | (7,770 | ) | (8.5 | )% |
| Retail | | | 37,230 | | 28.9 | % | | 54,322 | | 39.3 | % | | 17,092 | | 45.9 | % |
| | |
| |
| |
| |
| |
| | | |
| Total | | $ | 128,830 | | 100.0 | % | $ | 138,152 | | 100.0 | % | $ | 9,322 | | 7.2 | % |
| | |
| |
| |
| |
| |
| | | |
| | Nine Months Ended
| |
|---|
| |
| |
| |
| |
| | Change
| |
|---|
| | November 2, 2002
| | % of Total
| | November 1, 2003
| | % of Total
| |
|---|
| | $
| | %
| |
|---|
| Catalog | | $ | 133,881 | | 40.9 | % | $ | 123,138 | | 35.2 | % | $ | (10,743 | ) | (8.0 | )% |
| Internet | | | 103,644 | | 31.7 | % | | 98,648 | | 28.2 | % | | (4,996 | ) | (4.8 | )% |
| | |
| |
| |
| |
| |
| | | |
| | Direct | | | 237,525 | | 72.6 | % | | 221,786 | | 63.4 | % | | (15,739 | ) | (6.6 | )% |
| Retail | | | 89,690 | | 27.4 | % | | 128,224 | | 36.6 | % | | 38,534 | | 43.0 | % |
| | |
| |
| |
| |
| |
| | | |
| Total | | $ | 327,215 | | 100.0 | % | $ | 350,010 | | 100.0 | % | $ | 22,795 | | 7.0 | % |
| | |
| |
| |
| |
| |
| | | |
Our direct segment's net sales decreased in both fiscal 2003 periods primarily due to our decision to mail approximately 8.0 million, or 20.0%, fewer catalogs in the fiscal 2003 third quarter and approximately 15.7 million, or 16.2%, fewer catalogs in the fiscal 2003 first nine months, excluding the 11.0 million catalogs sent to arrive in homes in the last three days of the fiscal 2003 third quarter. The revenues and costs associated with this catalog mailing will, for the most part, be recognized in the fiscal 2003 fourth quarter. Also, we believe that our direct segment has been adversely impacted by a continuing softness in the direct mail business.
We believe that our catalog business did not decrease proportionally with the decrease in catalogs mailed due a higher percentage of mailings to our existing customers. We believe that our e-commerce business's net sales were not as severely impacted by the decrease in catalog mailings primarily due to our continued efforts to promote the migration of our customers from our catalogs to our website. For example, we continued to participate in a net sales commission-based "affiliate" website program in which numerous popular search engines and consumer and charitable websites provide hotlink access to our website.
The increase in our retail segment net sales for the three- and nine-month periods in fiscal 2003 primarily reflects incremental sales from the addition of 25 full-line retail stores and five outlet stores since November 2, 2002.
14
Operating Contribution. The following table summarizes our operating contribution by segment (in thousands):
| | Three Months Ended
| |
|---|
| |
| |
| |
| |
| | Change
| |
|---|
| | Nov. 2
2002
| |
| | Nov. 1
2003
| |
| |
|---|
| | %
| | %
| | $
| | %
| |
|---|
| Direct | | $ | 16,477 | | 18.0 | %(1) | $ | 13,208 | | 15.8 | %(1) | $ | (3,269 | ) | (19.8 | )% |
| Retail | | | 4,642 | | 12.5 | %(2) | | 9,262 | | 17.1 | %(2) | | 4,620 | | 99.5 | % |
| Corporate and Other | | | (13,227 | ) | (10.3) | %(3) | | (13,525 | ) | (9.8) | %(3) | | (298 | ) | 2.3 | % |
| | |
| | | |
| | | |
| | | |
| Consolidated income from operations | | $ | 7,892 | | 6.1 | %(3) | $ | 8,945 | | 6.5 | %(3) | $ | 1,053 | | 13.3 | % |
| | |
| | | |
| | | |
| | | |
| | Nine Months Ended
| |
|---|
| |
| |
| |
| |
| | Change
| |
|---|
| | Nov. 2
2002
| |
| | Nov. 1
2003
| |
| |
|---|
| | %
| | %
| | $
| | %
| |
|---|
| Direct | | $ | 39,576 | | 16.7 | %(1) | $ | 33,274 | | 15.0 | %(1) | $ | (6,302 | ) | (15.9 | )% |
| Retail | | | 4,396 | | 4.9 | %(2) | | 13,512 | | 10.5 | %(2) | | 9,116 | | 207.4 | % |
| Corporate and other | | | (37,152 | ) | (11.4 | )%(3) | | (36,923 | ) | (10.5 | )%(3) | | 229 | | (0.6 | )% |
| | |
| | | |
| | | |
| | | |
| Consolidated income from operations | | $ | 6,820 | | 2.1 | %(3) | $ | 9,863 | | 2.8 | %(3) | $ | 3,043 | | 44.6 | % |
| | |
| | | |
| | | |
| | | |
- (1)
- Direct segment operating contribution expressed as a percentage of direct segment net sales.
- (2)
- Retail segment operating contribution expressed as a percentage of retail segment net sales.
- (3)
- Corporate and other segment operating contribution and consolidated income from operations expressed as a percentage of consolidated net sales.
Our direct segment's operating contribution for the fiscal 2003 third quarter was $13.2 million compared with $16.5 million for the three months ended November 2, 2002. Our direct segment's operating contribution for the first nine months of fiscal 2003 was $33.3 million compared with $39.6 million for the nine months ended November 2, 2002. For both fiscal 2003 periods, we primarily attribute the decreases to diminished merchandise margins realized by our full-price catalog and e-commerce businesses of 3.4 percentage points and 3.2 percentage points for the fiscal 2003 third quarter and first nine months, respectively. For the fiscal 2003 first nine months, a 15.1% increase in direct segment clearance activity at a 1.9 percentage point reduced margin also contributed to the decrease in our direct segment's operating contribution. In addition, direct segment sales returns for the fiscal 2003 third quarter and first nine months declined as a percentage of sales by 3.4 percentage points and 3.0 percentage points, respectively.
Our retail segment's operating contribution for the fiscal 2003 third quarter was $9.3 million as compared with $4.6 million for the three months ended November 2, 2002. Our retail segment's operating contribution for the first nine months of fiscal 2003 was $13.5 million as compared with $4.4 million for the nine months ended November 2, 2002. We primarily attribute these increases to the opening of new stores, to improved leveraging of full-line retail store occupancy costs and, to a lesser extent, to increased merchandise margins on our full-price retail sales. For the fiscal 2003 third quarter and first nine months, we experienced an improvement of 1.4 percentage points and 0.9 percentage points, respectively, in the leveraging of our full-line retail store occupancy costs. During these same periods, merchandise margins on full-price sales from our retail segment improved by 1.5 percentage points and 1.8 percentage points, respectively.
Partially offsetting these positive impacts were increased outlet store clearance activity and, to a lesser extent, increased personnel costs associated with our retail expansion. The personnel costs primarily included administrative and technical support salaries, store employee wages, and related
15
taxes and employee benefits. For the fiscal 2003 third quarter and first nine months, outlet store clearance activity increased 56.4% and 48.5%, respectively, primarily because of the increase in the number of our retail stores, and personnel costs associated with our retail expansion increased $2.3 million, or 17.6%, and $5.8 million, or 16.3%, respectively.
Our corporate and other segment's operating contribution for the three months ended November 1, 2003 was $(13.5) million as compared with $(13.2) million for the three months ended November 2, 2002. Our corporate and other segment's operating contribution for the first nine months of fiscal 2003 was $(36.9) million as compared with $(37.2) million for the the nine months ended November 2, 2002. Both the three- and nine-month periods in fiscal 2003 include the accrual of $1.4 million for expected sales tax liabilities. This amount was partially offset in the fiscal 2003 third quarter and entirely offset in the fiscal 2003 first nine months by decreases in other corporate expenses.
Fiscal 2002 Compared with Fiscal 2001:
The following discussions compare an 11-month fiscal year 2002 with a 12-month fiscal year 2001. Fiscal year 2002 is an 11-month transition period attributable to the change in our fiscal year end as of February 1, 2003.
The following table, which sets forth our unaudited results of operations for the one-month and 12-month periods ended March 2, 2002 and the 11-month periods ended February 2, 2002 and February 2, 2003, is provided to assist the reader in assessing differences in our overall fiscal 2001 and 2002 performance.
| | 11 Months
Ended
February 2, 2002
| | One Month
Ended
March 2, 2002
| | 12 Months
Ended
March 2, 2002
| | 11 Months
Ended
February 1, 2003
|
|---|
| | (in thousands)
|
|---|
| Net sales | | $ | 435,741 | | $ | 28,283 | | $ | 464,024 | | $ | 473,172 |
| Cost of sales | | | 254,554 | | | 18,111 | | | 272,665 | | | 284,406 |
| | |
| |
| |
| |
|
| Gross profit | | | 181,187 | | | 10,172 | | | 191,359 | | | 188,766 |
| Selling, general and administrative expenses | | | 176,285 | | | 12,617 | | | 188,902 | | | 173,330 |
| | |
| |
| |
| |
|
| Income (loss) from operations | | | 4,902 | | | (2,445 | ) | | 2,457 | | | 15,436 |
| Interest, net, and other | | | 465 | | | 18 | | | 483 | | | 170 |
| | |
| |
| |
| |
|
| Income (loss) before provision for income taxes | | | 5,367 | | | (2,427 | ) | | 2,940 | | | 15,606 |
| Income tax (benefit) provision | | | 2,079 | | | (939 | ) | | 1,140 | | | 6,249 |
| | |
| |
| |
| |
|
| Net income (loss) | | $ | 3,288 | | $ | (1,488 | ) | $ | 1,800 | | $ | 9,357 |
| | |
| |
| |
| |
|
Our consolidated net sales for fiscal 2002 were $473.2 million, an increase of $9.1 million, or 2.0%, compared with consolidated net sales of $464.0 million during fiscal 2001. Our consolidated net sales increased $37.4 million, or 8.6%, from consolidated net sales of $435.7 in the comparable 11-month period in the prior year. This increase is primarily due to incremental sales of $53.8 million contributed by our retail expansion. These positive impacts were partially offset by a decrease of $28.8 million, or 11.8%, in full-price sales by our direct segment's catalog business.
Our consolidated cost of sales for fiscal 2002 were $284.4 million, an increase of $11.7 million, or 4.3%, from $272.7 million in fiscal 2001. Our consolidated gross profit decreased by $2.6 million, or 1.4%, to $188.8 million for fiscal 2002 from $191.4 million for fiscal 2001, and our consolidated gross margin decreased to 39.9% for fiscal 2002 from 41.2% for fiscal 2001.
16
The decrease in our consolidated gross profit dollars was primarily attributable to a decrease of $10.2 million, or 5.3%, in net sales from there being one less month in fiscal 2002 than in fiscal 2001, partially offset by the increase in consolidated net sales. To a lesser extent, the decrease was mitigated by rebates received from merchandise vendors. These rebates, which were credited to cost of sales as the related merchandise was sold, totaled $2.0 million in fiscal 2002 versus $0.8 million in fiscal 2001.
The decrease in gross profit percentage was primarily attributable to our decision in the fiscal 2002 fourth quarter to conduct a concentrated effort to clear obsolete inventory through our website. Our e-commerce clearance sales increased 3.6% at a 20.6 percentage point reduced margin. Our gross profit rate was also negatively impacted by a 2.3 percentage point decrease in the leveraging of our full-line retail store occupancy costs. These negative impacts were partially offset by a 4.4 percentage point improvement on margins from full-price sales in our retail segment.
Our consolidated selling, general and administrative expenses for fiscal 2002 were $173.3 million, a decrease of $15.6 million, or 8.2%, from $188.9 million for fiscal 2001. Our consolidated selling, general and administrative expenses as a percentage of our consolidated net sales decreased to 36.6% for fiscal 2002 from 40.7% for fiscal 2001.
For fiscal 2002, our selling, general and administrative expenses were positively affected by a $13.9 million decrease in catalog cost amortization, due to our mailing of 24.8 million, or 15.4%, fewer catalogs. Additionally, our selling, general and administrative expenses were approximately $12.6 million lower due to there being one less month in fiscal 2002 compared with fiscal 2001. These positive impacts were partially offset by an increase of $7.1 million, or 45.6%, in personnel-related costs incurred in connection with the continued development and expansion of our retail segment. These costs primarily included administrative and technical support salaries, store employee wages, and related taxes and employee benefits. Additionally, our fiscal 2002 selling, general and administrative expenses were negatively affected by costs of approximately $0.9 million associated with settling a dispute with a former merchandise vendor. Our selling, general and administrative expenses as a percentage of net sales were positively impacted principally by improved response rates to catalogs mailed to our house file of approximately 1.8%. To a lesser extent, we believe our selling, general and administrative expense rate was positively affected by our leveraging of reduced catalog production costs. These positive impacts were partially offset by increased mailings to prospective customers of 3.0 million catalogs, or 6.8%, which resulted in lower customer response rates and lower average order dollars.
We maintained a conservative circulation strategy during fiscal 2002, as we did during fiscal 2001, pending indications of a sustained recovery of the U.S. economy. As a result, our fiscal 2002 catalog mailings were 136.2 million, a decrease of 24.8 million catalogs, or 15.4%, from our 161.0 million catalog mailings in fiscal 2001. Although curtailed, our fiscal 2002 catalog mailings resulted in our proprietary catalog mailing list growing to 14.0 million names at February 1, 2003 from 12.5 million names at March 2, 2002. Our active customers increased slightly to 2.7 million at February 1, 2003 from 2.6 million at March 2, 2002.
As a result of the foregoing, our consolidated income from operations was $15.4 million for fiscal 2002, an increase of $13.0 million, or 528.2%, compared with consolidated income from operations of $2.5 million for fiscal 2001. Expressed as a percentage of net sales, our consolidated income from operations was 3.3% for fiscal 2002 compared with 0.5% for fiscal 2001.
Our consolidated net interest and other income was minimal during both fiscal 2002 and fiscal 2001 as we continued to utilize excess working capital to fund the continued expansion of our retail segment.
For fiscal 2002 our consolidated provision for income taxes was $6.3 million, an increase of $5.1 million, or 448.2%, compared with a consolidated provision for income taxes of $1.1 million for
17
fiscal 2001. Our effective income tax rate for fiscal 2002 increased to 40.0% from 38.8% for fiscal 2001. The increase in our income tax expense was primarily the result of higher pre-tax income. The increase in our effective income tax rate was primarily the result of a 1.0 percentage point increase in our federal statutory rate and a 0.2 percentage point increase in our state income tax rate, net of federal benefits. We attribute the increase in our state income tax rate to our retail segment's expansion into and within states with higher corporate income tax rates. To a lesser extent, the non-deductibility for tax purposes of the fair market value of the imputed salaries of Dennis Pence and Ann Pence also negatively impacted our effective income tax rate.
We completed fiscal 2002 realizing consolidated net income of $9.4 million (net income per basic and diluted share of $0.39) as compared with consolidated net income of $1.8 million (net income per basic and diluted share of $.08 and $.07, respectively) in fiscal 2001, an increase of $7.6 million or 419.8%.
Operating Segment Results
The following table, which sets forth the unaudited impact on net sales by business channel of the one-month and 12-month periods ended March 2, 2002 and the 11-month periods ended February 2, 2002 and February 2, 2003, is provided to assist the reader in assessing differences in our net sales by business channel.
| | 11 Months
Ended
February 2, 2002
| | One Month
Ended
March 2, 2002
| | 12 Months
Ended
March 2, 2002
| | 11 Months
Ended
February 1, 2003
|
|---|
| | (in thousands)
|
|---|
| Catalog | | $ | 234,061 | | $ | 11,988 | | $ | 246,048 | | $ | 200,157 |
| Internet | | | 131,649 | | | 10,224 | | | 141,873 | | | 144,838 |
| | |
| |
| |
| |
|
| | Direct | | | 365,709 | | | 22,212 | | | 387,921 | | | 344,995 |
| | |
| |
| |
| |
|
| Retail | | | 70,032 | | | 6,071 | | | 76,103 | | | 128,177 |
| | |
| |
| |
| |
|
| Total | | $ | 435,741 | | $ | 28,283 | | $ | 464,024 | | $ | 473,172 |
| | |
| |
| |
| |
|
Our direct segment contributed $345.0 million in net sales for fiscal 2002, a decrease of $42.9 million, or 11.1%, from the $387.9 million contributed in fiscal 2001. Our direct segment constituted 72.9% and 83.6% of our consolidated net sales for fiscal 2002 and 2001, respectively.
Our direct segment's catalog business, on a stand-alone basis, contributed $200.2 million in net sales for fiscal 2002, a decrease of $45.9 million, or 18.7%, from the $246.0 million contributed in fiscal 2001. Our catalog business constituted 42.3% and 53.0% of our consolidated net sales, and 58.0% and 63.4% of our direct segment's net sales, for fiscal 2002 and 2001, respectively.
The above decreases in catalog and outlet store net sales primarily reflect significantly lower full-price catalog sales. We attribute the decrease primarily to our mailing of 24.8 million, or 15.4%, fewer catalogs in 2002 than we did in 2001, and soft consumer demand for women's apparel stemming from the generally weak U.S. economy. Additionally, $10.2 million of the decrease is attributable to there being one less month in fiscal 2002 than in fiscal 2001.
We attribute a measure of the above decrease in catalog and outlet store net sales to our migration of full-price merchandise orders out of our catalog sales channel and into our e-commerce sales channel. Our ongoing efforts to promote our website in all of our catalogs and stores is intended to encourage this migration, as our e-commerce business is an efficient and cost-effective sales channel.
Our direct segment's e-commerce business, on a stand-alone basis, contributed $144.8 million in net sales for fiscal 2002, an increase of $3.0 million, or 2.0%, from the $141.9 million in net sales
18
contributed in fiscal 2001. Our e-commerce business constituted 30.6% and 30.6% of our consolidated net sales, and 42.0% and 36.6% of our direct segment's net sales, for fiscal 2002 and 2001, respectively.
We primarily attribute the above increase in e-commerce net sales to new customers obtained through our affiliate website program. Our affiliate website program contributed approximately $19.0 million in sales in fiscal 2002 compared with $6.3 million in fiscal 2001. We believe that our ongoing e-mail promotional efforts with existing customers also contributed to the increase, as did the migration of catalog customers to our e-commerce site. Further, we believe that our e-commerce business is increasingly realizing sales from customers initially obtained through our retail store openings. Another factor contributing to the increase in e-commerce net sales was e-commerce clearance sales, which increased $1.1 million, or 3.6%, in fiscal 2002 as compared with fiscal 2001. Additionally, e-commerce sales returns declined by 1.6% in fiscal 2002 over fiscal 2001. Our mailing of 24.8 million, or 15.4%, fewer catalogs in fiscal 2002 than in fiscal 2001 mitigated the increase in sales, as did our shorter fiscal year in 2002, which we believe had the effect of decreasing our fiscal 2002 e-commerce net sales by approximately $6.2 million. Our proprietary e-mail address database consisted of 1.8 million names at February 1, 2003 compared with 1.5 million names at March 2, 2002.
Our retail segment contributed $128.2 million in net sales for fiscal 2002, an increase of $52.1 million, or 68.4%, from the $76.1 million contributed in fiscal 2001. Our retail segment constituted 27.1% and 16.4% of our consolidated net sales for fiscal 2002 and 2001, respectively.
The above increase in retail net sales primarily reflects incremental sales of $53.8 million contributed by our retail expansion. This increase was mitigated by our shorter fiscal year in 2002, which we believe had the effect of decreasing our fiscal 2002 retail net sales by approximately $5.4 million.
The following table summarizes our operating contribution by segment (in thousands):
| |
| |
| |
| |
| | Change
| |
|---|
| | 11 Months
Ended
Feb. 1, 2003
| |
| | 12 Months
Ended
Mar. 2, 2002
| |
| |
|---|
| | %
| | %
| | $
| | %
| |
|---|
| Direct | | $ | 52,134 | | 15.1 | %(1) | $ | 52,426 | | 13.5 | %(1) | $ | (292 | ) | (0.6 | )% |
| Retail | | | 8,292 | | 6.5 | %(2) | | (6,047 | ) | (7.9 | )%(2) | | 14,339 | | (237.1 | )% |
| Corporate and other | | | (44,990 | ) | (9.5 | )%(3) | | (43,922 | ) | (9.5 | )%(3) | | (1,068 | ) | 2.4 | % |
| | |
| | | |
| | | |
| | | |
| Consolidated income from operations | | $ | 15,436 | | 3.3 | %(3) | $ | 2,457 | | 0.5 | %(3) | $ | 2,979 | | 528.2 | % |
| | |
| | | |
| | | |
| | | |
- (1)
- Direct segment operating contribution expressed as a percentage of direct segment net sales.
- (2)
- Retail segment operating contribution expressed as a percentage of retail segment net sales.
- (3)
- Corporate and other segment operating contribution and consolidated income from operations expressed as a percentage of consolidated net sales.
Our direct segment's operating contribution for fiscal 2002 was $52.1 million as compared with $52.4 million for fiscal 2001. We attribute the slight decrease in our direct segment's operating contribution primarily to a 3.6% increase in e-commerce clearance sales at a margin that was 20.6 percentage points lower than in 2001. To a lesser extent, we attribute the decrease to decreased full-price net sales, as a result of our mailing 24.8 million, or 15.4%, fewer catalogs in fiscal 2002 than in fiscal 2001. The ratio of full-price sales to total sales in our direct segment decreased 1.2 percentage points from fiscal 2001 to fiscal 2002. These negative impacts were partially offset by reduced catalog marketing expenses of approximately $13.9 million related to the mailing of 24.8 million fewer catalogs. Additionally, our catalog and e-commerce sales returns declined by 1.2 percentage points in fiscal 2002 over fiscal 2001.
19
Our retail segment's operating contribution for fiscal 2002 was $8.3 million as compared with $(6.0) million for fiscal 2001. We primarily attribute the improvement in our retail segment's operating contribution to an improvement of 4.4 percentage points in the margins on our full-price retail segment sales and, to a lesser extent, a decrease of $1.6 million in retail store pre-opening expenses. The decrease in retail store pre-opening expenses was due to our opening 14 stores in fiscal 2002 compared with 19 stores in fiscal 2001, combined with overall cost savings in the store pre-opening process. These positive factors were partially offset by a 2.3 percentage point decrease in our leveraging of our full-line retail segment's occupancy costs.
Our corporate and other segment's operating contribution for fiscal 2002 was $(45.0) million as compared with $(43.9) million for fiscal 2001. We primarily attribute the decrease in our corporate and other segment's operating contribution to an increase of $2.1 million in brand marketing expenses and an accrual for $0.9 million to settle a dispute with a former merchandise vendor. Partially offsetting these negative factors was a decrease of $2.5 million, or 13.6%, in employee expenses of which approximately $1.5 million related to the twelfth month of fiscal 2001.
Fiscal 2001 Compared with Fiscal 2000:
Our consolidated net sales for fiscal 2001 were $464.0 million, an increase of $5.6 million, or 1.2%, from $458.4 million in fiscal 2000. Excluding consolidated net sales of approximately $8.1 million attributable to the additional fifty-third week in fiscal 2000, our consolidated net sales for fiscal 2001 increased by $13.7 million, or 3.0%. On a comparative fifty-two week basis, the fiscal 2001 increase in our consolidated net sales primarily was attributable to increased full-price sales in our retail segment of $34.0 million, or 107.3%, and, to a lesser extent, our increased full-price sales of $15.4 million, or 19.2%, in our direct segment's e-commerce business. Increased clearance sales of $8.5 million, or 41.0%, by our e-commerce business also contributed to the overall increase, although at diminished gross margins. These sales increases were substantially offset by a decrease of $49.3 million, or 19.7%, in full-price sales from our direct segment's catalog business and by a decrease of $3.6 million, or 12.0% in clearance sales by our catalog business and outlet stores.
Our consolidated cost of sales for fiscal 2001 was $272.7 million, an increase of $17.5 million, or 6.8%, from $255.2 million in fiscal 2000. Our consolidated gross profit decreased by $11.9 million, or 5.9%, to $191.4 million for fiscal 2001 from $203.3 million in fiscal 2000, and our consolidated gross margin decreased to 41.2% for fiscal 2001 from 44.3% in fiscal 2000. The fiscal 2001 decreases in our consolidated gross profit dollars and margin primarily were attributable to an increase of 41.0% in clearance sales in our e-commerce business at a margin that was 3.8 percentage points higher than in fiscal 2000. The increase in e-commerce clearance sales was the result of our efforts to maintain our conservative inventory position. To a lesser extent, a 1.7 percentage point decrease on merchandise margins realized on full-price sales in our e-commerce business negatively impacted our gross profit dollars and margin. Partially offsetting these negative impacts was an 11.5% decrease in clearance sales made by our outlet stores and clearance catalog.
Our consolidated selling, general and administrative expenses for fiscal 2001 were $188.9 million, an increase of $6.1 million, or 3.4%, from $182.8 million in fiscal 2000. Our consolidated selling, general and administrative expenses as a percentage of consolidated net sales increased to 40.7% for fiscal 2001 from 39.9% in fiscal 2000. The fiscal 2001 increase in our consolidated selling, general and administrative expenses and rate was primarily due a 3.0 percentage point increase in the ratio of catalog marketing expenses to catalog sales. This reduced leveraging of our catalog marketing expenses is discussed more fully in the paragraph below. To a lesser extent, the fiscal 2001 increase in our consolidated selling, general and administrative expenses and rate was also attributable to an increase of $8.5 million, or 25.7%, in personnel costs, and an increase of $1.6 million, or 14.7%, in
20
infrastructure costs, which were incurred in connection with the continued development and expansion of our retail segment and, to a significantly lesser extent, our direct segment's e-commerce business. The associated personnel costs primarily included administrative and technical support salaries, store wages, and related taxes and employee benefits. The associated infrastructure costs primarily consisted of depreciation and other costs associated with incremental administrative support facilities and hardware and software technology. Partially offsetting these incremental costs was a decrease of approximately $12.4 million in catalog marketing expenses, as we mailed 22.6 million, or 12.3%, fewer catalogs in fiscal 2001 than in fiscal 2000. In 2001 we also experienced decreases of $2.4 million, or 65.4%, in incentive-based compensation, $1.4 million, or 13.3%, in direct segment wages, and $1.0 million, or 88.4%, in education and training. Our fiscal 2001 selling, general and administrative expenses also reflect a $0.3 million charge for asset write-downs and outside service costs incurred in connection with our fiscal 2001 fourth quarter decision to close our Sandpoint distribution center. Additionally, the selling, general and administrative expenses reflect a $0.8 million charge for asset write-offs relating to obsolete Internet e-commerce software that was recorded in the fiscal 2001 fourth quarter. We also recorded a $0.2 million charge related to executive severance during the fiscal 2001 fourth quarter.
After observing diminished consumer demand in mid-January 2001, we revised our planned catalog circulation downward for the upcoming fiscal 2001 year. We subsequently made further adjustments to our circulation plan as fiscal 2001 progressed and the U.S. economy further weakened. As a result, we mailed 161.0 million catalogs in fiscal 2001, a decrease of 22.6 million catalogs, or 12.3%, from the 183.6 million catalogs mailed in fiscal 2000, 5.5 million of which were mailed during the additional fifty-third week in fiscal 2000. However, we did not realize a corresponding decrease in our catalog marketing expenses for fiscal 2001 primarily due to the timing of certain large catalog mailings, including a significant number of prospect mailings, made just prior to our preceding fiscal 2000 year-end, the related costs of which were substantially amortized into our fiscal 2001 first quarter selling, general and administrative expenses. To a lesser extent, we also incurred incremental catalog circulation costs in fiscal 2001 as a result of a postal rate increase. Our catalog mailing list grew to 12.5 million names at March 2, 2002, an increase of 1.7 million names, or 15.7%, from 10.8 million names at March 3, 2001. However, our active customers remained constant at 2.6 million.
As a result of the foregoing, our consolidated income from operations decreased by $18.0 million, or 88.0%, to $2.5 million for fiscal 2001 from $20.5 million in fiscal 2000. Expressed as a percentage of consolidated net sales, our consolidated income from operations was 0.5% for fiscal 2001 versus 4.5% for fiscal 2000.
We realized consolidated net interest and other income of $0.5 million for fiscal 2001 as compared to $1.1 million in fiscal 2000. This decrease primarily is attributable to decreased interest income from lower average cash balances and, to a lesser extent, lower interest rates during fiscal 2001.
Consistent with the 86.4% decrease in our consolidated pre-tax income, our consolidated provision for income taxes decreased $7.2 million, or 86.4%, to $1.1 million for fiscal 2001 from $8.4 million in fiscal 2000. Our effective income tax rate for fiscal 2001 was 38.8% as compared to 38.7% for fiscal 2000. Our effective aggregate state income tax rate increased from 3.7% to 4.8% over the prior fiscal year due to our retail expansion. The impact of this was substantially offset primarily by a decrease to 34% from 35% in our federal income tax rate due to our significantly decreased pre-tax income in fiscal 2001.
We completed fiscal 2001 realizing consolidated net income of $1.8 million (net income per basic and diluted share of $0.08 and $0.07, respectively) as compared with $13.2 million (net income per basic and diluted share of $0.56 and $0.54, respectively) in fiscal 2000, a decrease of $11.4 million or 86.4%.
21
Our direct segment contributed $387.9 million in net sales for fiscal 2001, a decrease of $25.2 million, or 6.1%, from the $413.1 million contributed in fiscal 2000. Excluding net sales of approximately $7.4 million attributable to the additional fifty-third week in fiscal 2000, our direct segment's net sales for fiscal 2001 decreased by $17.8 million, or 4.4%. Our direct segment constituted 83.6% and 90.1% of our consolidated net sales for fiscal 2001 and 2000, respectively.
Our direct segment's catalog business contributed $246.0 million, or 53.0% of our consolidated net sales for fiscal 2001, as compared with $300.7 million, or 65.6%, of our consolidated net sales for fiscal 2000. Excluding net sales of approximately $5.3 million attributable to the additional fifty-third week in fiscal 2000, our catalog net sales for fiscal 2001 decreased by $49.4 million, or 16.7%. Our catalog business constituted 63.4% and 72.8% of our direct segment's net sales for fiscal 2001 and 2000, respectively.
Our direct segment's e-commerce business, on a stand-alone basis, contributed $141.9 million, or 30.6%, of our consolidated net sales for fiscal 2001, as compared to $112.4 million, or 24.5%, of our consolidated net sales for fiscal 2000. Excluding net sales of approximately $2.1 million attributable to the additional fifty-third week in fiscal 2000, our e-commerce net sales for fiscal 2001 increased by $31.6 million, or 28.6%. Our e-commerce business constituted 36.6% and 27.2% of our direct segment's net sales for fiscal 2001 and 2000, respectively.
Our retail segment contributed $76.1 million in net sales for fiscal 2001, an increase of $30.8 million, or 67.9%, from the $45.3 million contributed in fiscal 2000. Excluding net sales of approximately $0.6 million attributable to the additional fifty-third week in fiscal 2000, our retail segment's net sales for fiscal 2001 increased by $31.4 million, or 70.2%. Our retail segment constituted 16.4% and 9.9% of our consolidated net sales for fiscal 2001 and 2000, respectively. We primarily attribute the net sales growth realized by our retail channel to the addition of 19 full-line retail stores during fiscal 2001.
We believe that the fiscal 2001 decrease in net sales by our direct segment's catalog business primarily reflects our attempt to shift full-price merchandise orders out of our catalog channel and into our e-commerce channel. Our ongoing efforts to promote our website in all of our catalogs and stores is intended to encourage such migration as our e-commerce business is an efficient and cost effective sales channel. We attribute approximately $22.6 million of the fiscal 2001 net sales decrease realized by our catalog business to our reduced catalog circulation. We also believe that a combination of lower average response rates and lower average order dollars, which we primarily attribute to the weak economic environment, also contributed to the decrease realized by our catalog business. We attribute the majority of the fiscal 2001 net sales increase realized by our e-commerce business to new customers obtained through our participation in affiliate website programs. Our affiliate website program contributed approximately $6.3 million in sales in fiscal 2001 compared with none in fiscal 2000. To a lesser extent, we believe that our targeted advertising in national magazines popular with our core demographic and our ongoing e-mail promotional efforts also contributed to the increase in our e-commerce net sales. With respect to the latter, we grew our proprietary e-mail address database to 1.5 million names at March 2, 2002, including 140,000 purchased names, from 1.2 million names at March 3, 2001. To a significantly lesser extent, we believe that our e-commerce business is increasingly realizing net sales from customers initially obtained by us through our retail store openings.
Our direct segment's operating contribution for fiscal 2001 was $52.4 million as compared with $67.7 million for fiscal 2000 and our retail segment's operating contribution for fiscal 2001 was $(6.0) million as compared with $(2.6) million for fiscal 2000. We attribute these fiscal 2001 decreases primarily to each segment's inability, in light of their full-price, first-line sales shortfalls, to leverage their respective infrastructure costs. Our direct segment's lower operating contribution also reflects an increase of 41.0% in clearance sales in our e-commerce business at a margin that was 3.8 percentage
22
points higher than in fiscal 2000. Our retail segment's negative operating contribution additionally reflects $2.9 million of pre-opening costs for our 19 new stores.
Our corporate and other segment's operating contribution for fiscal 2001 was $(43.9) million as compared with $(44.6) million for fiscal 2000.
A reconciliation of operating contribution to income from operations for our direct, retail and corporate and other segments can be found in Note 17 to our consolidated financial statements for the fiscal year ended February 1, 2003 included elsewhere in this report.
Quarterly Results of Operations and Seasonal Influences
As with many apparel retailers, our net sales, operating results, liquidity and cash flows have fluctuated, and will continue to fluctuate, on a quarterly basis, as well as an annual basis, as a result of a number of factors, including, but not limited to, the following:
- •
- the composition, size and timing of our various merchandise offerings, including when we recognize related sales and costs;
- •
- the number and timing of our full-line retail store openings;
- •
- the timing of our catalog mailings and the number of catalogs we mail;
- •
- customer response to merchandise offerings, including the impact of economic and weather-related influences, the actions of our competitors and similar factors;
- •
- our ability to accurately estimate and accrue for merchandise returns and the costs of obsolete inventory disposition;
- •
- overall merchandise return rates, including the impact of actual or perceived service and quality issues;
- •
- market price fluctuations in critical materials and services, including paper, production, postage and telecommunications costs;
- •
- the timing of merchandise receiving and shipping, including any delays resulting from labor strikes or slowdowns, adverse weather conditions, health epidemics or national security measures; and
- •
- shifts in the timing of important holiday selling seasons relative to our fiscal quarters, including Valentine's Day, Easter, Mother's Day, Thanksgiving and Christmas.
We alter the composition, magnitude and timing of our merchandise offerings based upon our understanding of prevailing consumer demand, preferences and trends. The timing of our merchandise offerings may be further impacted by, among other factors, the performance of various third parties on which we are dependent and the day of the week on which certain important holidays fall. Additionally, the net sales we realize from a particular merchandise offering may impact more than one fiscal quarter and year and the amount and pattern of the sales realization may differ from that realized by a similar merchandise offering in a prior fiscal quarter or year. The majority of net sales from a merchandise offering generally is realized within the first several weeks after its introduction with an expected significant decline in customer orders thereafter.
Our business materially depends on sales and profits from the November and December holiday shopping season. In anticipation of traditionally increased holiday sales activity, we incur certain significant incremental expenses, including the hiring of a substantial number of temporary employees to supplement our existing workforce. Additionally, as gift items and accessories are more prominently represented in our November and December holiday season merchandise offerings, we typically expect, absent offsetting factors, to realize higher consolidated gross margins in the second half of our fiscal year. If, for any reason, we were to realize significantly lower-than-expected sales or profits during the November and December holiday selling season, our financial condition, results of operations, including related gross margins and cash flows for the entire fiscal year will be materially adversely affected. Due to our change in fiscal year end in fiscal 2002, the November and December holiday season falls into our fiscal fourth quarter. Previously, the November portion of the holiday season fell into our fiscal third quarter and the December portion of the holiday season fell into our fiscal fourth quarter. Historically, our fiscal second quarter has generally not been profitable. We expect our results for the second quarter of fiscal 2004 to be consistent with our historical results.
23
Quarterly Financial Data
The following tables contain selected unaudited quarterly consolidated financial data for fiscal 2002 and fiscal 2001 and for the first three quarters of fiscal 2003. The quarterly financial data for fiscal 2001 is based on our prior fiscal year end. In our opinion, this unaudited information has been prepared on the same basis as the audited financial statements presented elsewhere and includes all adjustments necessary to present fairly, in all material respects, the information set forth therein on a consistent basis. The aggregate of certain of the following quarterly amounts may differ from that reported for the full fiscal year due to the effects of rounding.
| | Fiscal 2003
|
|---|
| | First Quarter
Ended
May 3, 2003
(3 months)
| | Second Quarter Ended
August 2, 2003
(3 months)
| | Third Quarter Ended
Nov. 1, 2003
(3 months)
|
|---|
| | (in thousands, except for per share data)
|
|---|
| Net sales | | $ | 115,204 | | $ | 96,654 | | $ | 138,152 |
| Cost of sales | | | 70,055 | | | 62,004 | | | 81,214 |
| | |
| |
| |
|
| Gross profit | | | 45,149 | | | 34,650 | | | 56,938 |
| Selling, general and administrative expenses | | | 42,110 | | | 36,771 | | | 47,993 |
| | |
| |
| |
|
| Income (loss) from operations | | | 3,039 | | | (2,121 | ) | | 8,945 |
| Income tax (benefit) provision | | | 1,256 | | | (941 | ) | | 3,328 |
| Net income (loss) | | $ | 1,914 | | $ | (1,423 | ) | $ | 5,603 |
| | |
| |
| |
|
| Net income (loss) per share — basic | | $ | 0.08 | | $ | (0.06 | ) | $ | 0.23 |
| | |
| |
| |
|
| Net income (loss) per share — diluted | | $ | 0.08 | | $ | (0.06 | ) | $ | 0.23 |
| | |
| |
| |
|
| | Fiscal 2002(a)
|
|---|
| | First Quarter Ended
June 1, 2002
(3 months)
| | Second Quarter Ended
August 31, 2002 (3 months)
| | Third Quarter Ended
Nov. 30, 2002 (3 months)
| | Fourth Quarter Ended
Feb. 1, 2003
(2 months)
|
|---|
| | (in thousands, except for per share data)
|
|---|
| Net sales | | $ | 112,027 | | $ | 92,794 | | $ | 153,802 | | $ | 114,548 |
| Cost of sales | | | 63,035 | | | 56,730 | | | 88,414 | | | 76,225 |
| | |
| |
| |
| |
|
| Gross profit | | | 48,992 | | | 36,064 | | | 65,388 | | | 38,323 |
| Selling, general and administrative expenses | | | 44,322 | | | 37,085 | | | 55,987 | | | 35,937 |
| | |
| |
| |
| |
|
| Income (loss) from operations | | | 4,670 | | | (1,021 | ) | | 9,401 | | | 2,386 |
| Income tax (benefit) provision | | | 1,931 | | | (378 | ) | | 3,735 | | | 962 |
| Net income (loss) | | $ | 2,772 | | $ | (650 | ) | $ | 5,723 | | $ | 1,512 |
| | |
| |
| |
| |
|
| Net income (loss) per share — basic | | $ | 0.11 | | $ | (0.03 | ) | $ | 0.24 | | $ | 0.06 |
| | |
| |
| |
| |
|
| Net income (loss) per share — diluted | | $ | 0.11 | | $ | (0.03 | ) | $ | 0.24 | | $ | 0.06 |
| | |
| |
| |
| |
|
- (a)
- The aggregate of certain of the above quarterly amounts may differ from that reported for the full fiscal year due to the effects of rounding.
24
| | Fiscal 2001(a)
| |
|---|
| | First Quarter (3 months)
| | Second Quarter (3 months)
| | Third Quarter (3 months)
| | Fourth Quarter (3 months)
| |
|---|
| | (in thousands, except for per share data)
| |
|---|
| Net sales | | $ | 112,868 | | $ | 92,848 | | $ | 141,707 | | $ | 116,601 | |
| Cost of sales | | | 63,316 | | | 53,686 | | | 79,404 | | | 76,260 | |
| | |
| |
| |
| |
| |
| Gross profit | | | 49,552 | | | 39,162 | | | 62,303 | | | 40,341 | |
| Selling, general and administrative expenses | | | 47,413 | | | 37,177 | | | 59,832 | | | 44,479 | |
| | |
| |
| |
| |
| |
| Income (loss) from operations | | | 2,139 | | | 1,985 | | | 2,471 | | | (4,138 | ) |
| Income tax (benefit) provision | | | 869 | | | 819 | | | 999 | | | (1,547 | ) |
| Net income (loss) | | $ | 1,377 | | $ | 1,296 | | $ | 1,578 | | $ | (2,451 | ) |
| | |
| |
| |
| |
| |
| Net income (loss) per share — basic | | $ | 0.06 | | $ | 0.05 | | $ | 0.07 | | $ | (0.10 | ) |
| | |
| |
| |
| |
| |
| Net income (loss) per share — diluted | | $ | 0.06 | | $ | 0.05 | | $ | 0.07 | | $ | (0.10 | ) |
| | |
| |
| |
| |
| |
Liquidity and Capital Resources
In recent fiscal years, we have financed our ongoing operations and growth initiatives primarily from cash flow generated by our operations and trade credit arrangements. However, as we produce catalogs, open retail stores and purchase inventory in anticipation of future sales realization and as our operating cash flows and working capital experience seasonal fluctuations, we may occasionally utilize short-term bank credit.
On March 5, 2003, we entered into a credit agreement with a consortium of banks that provides us with a $60 million unsecured revolving line of credit. This line of credit has a $20.0 million sub-limit for letters of credit, a $5 million sub-limit for same day advances and a term standby letter of credit of $0.6 million. The interest rate under the agreement is equal to the London InterBank Offered Rate and is adjusted based on our leverage ratio.
The agreement provides that we must satisfy certain specified EBITDA (Earnings Before Interest Taxes Depreciation and Amortization), EBITDAR (i.e., EBITDA before rental/lease expenses), fixed charge coverage ratio, leverage ratio, current ratio and minimum net worth requirements, as defined in the agreement. The agreement also places restrictions on our ability to, among other things, sell assets, participate in mergers, incur debt, pay dividends, and make investments or guarantees. The credit facility has a maturity date of March 5, 2006. During the fiscal 2003 first quarter, we incurred $0.5 million in financing costs associated with obtaining our new credit facility. At November 1, 2003, we had $0.8 million in outstanding letters of credit under this agreement.
Our operating activities generated $38.4 million, $38.8 million and $18.9 million of positive cash flow during fiscal 2002, 2001 and 2000, during the first nine months of fiscal 2003, our operating activities generated $13.3 million of positive cash flow, a decrease of $2.7 million from the $16.0 million generated during the first nine months of fiscal 2002. Our accounts receivables increased by $12.8 million during the first nine months of 2003 due to an income tax receivable from the filing of our 2002 tax returns as well as seasonal factors, which increased the amounts due from credit card companies for customer purchases and the amounts due from landlords for tenant improvements in new stores. In addition, inventories increased during both years in anticipation of holiday sales and for new stores. Compared with fiscal 2001, the slight decrease in fiscal 2002 primarily reflects the negative cash flow effects of decreased accounts payable and prepaid and deferred catalog costs and increased receivables, offset by the positive cash flow effects of significantly improved net income and, to a lesser extent, increased income taxes payable and accrued liabilities. The fiscal 2001 increase primarily reflects the positive cash flow effects of decreased prepaid and deferred catalog costs, increased accounts payable and, to a significantly lesser extent, decreased inventories and receivables. Our fiscal 2001
25
operating cash flow also benefited from increased non-cash charges primarily for depreciation and amortization and asset impairment charges, which was partially offset by substantially lower net income and, to a significantly lesser extent, decreased accrued liabilities. In addition, the decrease in our operating cash flows for the first nine months of fiscal 2003 compared with the same period in fiscal 2002 reflects decreased accrued liabilities, partially offset by decreased prepaid and deferred catalog costs and increased deferred rents.
Our investing activities consumed $17.8 million, $34.9 million and $25.7 million of cash during fiscal 2002, 2001 and 2000, respectively, and $22.6 million and $16.8 million of cash during the first nine months of fiscal 2003 and 2002, respectively. Cash outlays in these periods were principally for capital expenditures.
Our fiscal 2002 and fiscal 2001 capital expenditures principally reflect the cost of leasehold improvements for 14 and 19 new retail stores, respectively, and, to a substantially lesser extent, various technology hardware and software additions and upgrades. We also incurred costs associated with leasehold improvements for six new outlet stores in fiscal 2002, and for the renovation of a portion of our former Sandpoint, Idaho distribution center to create additional administrative space, including related furnishings and equipment, in fiscal 2001. Our fiscal 2000 capital expenditures primarily reflect the cost of hardware and software additions and upgrades for our corporate systems and e-commerce website, a new point-of-sale computer system for our retail segment, leasehold improvements for six new retail stores and leasehold improvements, furnishings and equipment for our newly leased Coeur d'Alene, Idaho call center.
Our capital expenditures during the first nine months of 2003 primarily reflected the cost of leasehold improvements for 22 new retail stores and, to a lesser extent, furniture and fixtures for both new and existing retail stores, six new outlet stores and various corporate technology hardware and software additions and upgrades. Our capital expenditures during the first nine months of fiscal 2002 primarily reflected the cost of leasehold improvements for 11 new retail stores and, to a lesser extent, furniture and fixtures for both new and existing retail stores, four new outlet stores and various corporate technology hardware and software additions and upgrades. Our investing activities for the first nine months of fiscal 2003 and fiscal 2002 also reflect $0.2 million and $0.4 million, respectively, in repayments of loans from executives.
Our financing activities provided $1.1 million and $3.9 million of cash during fiscal 2002 and fiscal 2000, respectively, whereas they utilized $3.5 million during fiscal 2001, and provided $0.3 million and $0.9 million of cash during the first nine months of fiscal 2003 and 2002, respectively.
The financing activities during the first nine months of 2003 consisted of $0.5 million financing costs associated with our new credit facility offset by $0.8 million in net proceeds from the exercise of previously granted options to purchase 842,683 shares of common stock at an average exercise price of $5.10 per share. The financing activities during the first nine months of fiscal 2002 consisted primarily of $0.9 million in net proceeds from the exercise of previously granted options to purchase 903,107 shares of common stock at an average exercise price of $5.28 per share. Fiscal 2002 primarily reflects $1.1 million in net proceeds from the exercise of previously granted options to purchase 205,857 shares of common stock at an average exercise price of $5.56 per share. Fiscal 2001 primarily reflects the outlay of $4.7 million for treasury stock repurchases, partially offset by $1.3 million in net proceeds from the exercise of previously granted options to purchase 247,968 shares of common stock at an average exercise price of $5.11 per share. Fiscal 2000 primarily reflects $3.9 million in net proceeds from the exercise of previously granted options to purchase 760,454 shares of common stock at an average exercise price of $5.15 per share.
On March 31, 2001, our Board of Directors authorized a stock repurchase program for up to 300,000 outstanding shares of our common stock. During fiscal 2001, we repurchased 209,100 shares of our common stock at an average market price of $22.55 per share, or $10.02 on a dividend-adjusted
26
basis comparable with our current stock price. The 209,100 treasury shares were not impacted by the two 50% stock dividends, each having the effect of a 3-for-2 stock split, declared by our Board of Directors on December 19, 2002 and August 4, 2003, respectively. On July 25, 2003, we retired the 209,100 treasury shares. We currently do not anticipate any additional share repurchases.
As a result of the foregoing, we had $37.4 million in consolidated working capital at February 1, 2003 as compared to $26.7 million at March 2, 2002. Our consolidated current ratio was 1.5 at February 1, 2003 as compared to 1.4 at March 2, 2002. We had $43.5 million in consolidated working capital and our consolidated current ratio was 1.5 at November 1, 2003. We had no outstanding short-term or long-term bank debt at November 1, 2003, February 1, 2003 or March 2, 2002.
In each of fiscal 2004 and fiscal 2005, we currently plan to open 40 to 50 new retail stores. We believe there is an opportunity to open 400 to 500 stores in up to 275 identified markets nationwide over the next six to eight years. The pace, scope and size of our retail store expansion will be influenced by the economic environment, available working capital, our ability to identify and obtain favorable terms on suitable locations for our stores and, if necessary, external financing.
We currently estimate between $4.0 million and $4.5 million in total capital expenditures for the remainder of fiscal 2003, primarily for retail stores we opened in fiscal 2003 and, to a substantially lesser extent, various technology additions and upgrades. These expenditures are expected to be funded from operating cash flows and working capital.
Our core new store model of 5,000 to 6,000 square feet assumes an average initial net investment of $560,000 and anticipates sales per square foot of $500 in the third year of operations. Our smaller store model of 3,000 to 4,000 square feet assumes an average initial net investment of $400,000 and anticipates sales per square foot of $600 in the third year of operations.
We believe that our cash flow from operations and available borrowing capacity under our bank credit facility will be sufficient to fund our current operations and retail store rollout. However, we may be required to seek additional sources of funds for continued or accelerated growth and there can be no assurance that such funds will be available on satisfactory terms or at all. Failure to obtain such financing could delay or prevent our planned growth, which could adversely affect our business, financial position, results of operations and cash flows.
Future Outlook
Due to competition from discount retailers that has put downward pressure on retail prices for women's apparel, the apparel industry has experienced significant retail price deflation over the past several years. We expect this trend to continue.
We expect our retail segment to be the key driver of our growth in the future. In the near term, we do not expect growth in our catalog business as we rollout our retail strategy, and we intend to further reduce our catalog circulation to maximize profitability and reduce costs. In particular, we expect to decrease mailings to prospective customers because they are increasingly less profitable than mailings to our active customers. As our retail business grows, we will add additional overhead. However, we expect our sales growth to outpace our addition of infrastructure. Consequently, we believe that, over time, our retail expansion will increase our overall profitability.
Other Matters
The preparation of consolidated financial statements in conformity with accounting principles generally accepted in the United States requires us to make estimates and assumptions that affect:
- •
- the reported amounts and timing of revenue and expenses;
27
- •
- the reported amounts and classification of assets and liabilities; and
- •
- the disclosure of contingent assets and liabilities.
These estimates and assumptions are based on our historical results as well as our future expectations. Our actual results could vary from our estimates and assumptions.
The accounting policies discussed below are those that we believe are the most critical to a materially accurate portrayal of our financial condition and results of operations. They are also the accounting policies that typically require our most difficult, subjective and complex judgments and estimates, often for matters that are inherently uncertain. However, with respect to our critical accounting policies, even a relatively minor variance between our actual and expected experience can potentially have a materially favorable or unfavorable impact on our subsequent results of operations.
We recognize sales and the related cost of sales either at the time merchandise ordered from a catalog or website is shipped to the customer or at the time a sale is consummated with a customer in a store. We reduce our sales and costs of sales, and establish and maintain a corresponding accrual, for expected sales returns based on our historical experience and our future expectations. Our ability to reasonably estimate sales returns is made more complex by the fact that we offer our customers a return policy whereby they may return merchandise for any reason and at any time without any restrictions as to condition or time. The actual amount of sales returns we subsequently realize may fluctuate from our estimates due to several factors, including size and fit, actual or perceived quality, differences between the actual product and its presentation in our catalog or website, timeliness of delivery and competitive offerings. We continually track our subsequent sales return experience, compile customer feedback to identify any pervasive issues, reassess the marketplace, compare our findings to our previous estimates and adjust our sales return accrual and cost of sales accordingly.
Our inventories consist of merchandise purchased for resale and are reflected, in the aggregate, on our balance sheet at the lower of cost or market. The nature of our business requires that we make substantially all of our merchandising and marketing decisions, and corresponding inventory purchase commitments with vendors, months in advance of the time in which a particular merchandise item is intended to be included in our merchandise offerings. These decisions and commitments are based on, among other possible considerations, historical sales with identical or similar merchandise, our understanding of fashion trends and influences as well as our assessment of likely economic conditions and various competitive factors. We continually make subjective assessments as to whether the carrying cost of our inventory exceeds its market value, and if so, by what dollar amount. The carrying value of our inventory is reduced to its realizable value with a corresponding charge to our cost of sales.
We accumulate all direct costs incurred in the development, production and circulation of our direct mail catalogs on our balance sheet until such time as the related catalog is mailed, at which time, they are subsequently amortized into the marketing component of our selling, general and administrative expenses over the expected sales realization cycle, typically several weeks. Our initial estimation of the expected sales realization cycle for a particular catalog merchandise offering is based on, among other possible considerations, our historical sales and sell-through experience with identical or similar catalog merchandise offerings, our understanding of then prevailing fashion trends and influences, our assessment of prevailing economic conditions, and various competitive factors. We continually track our subsequent sales realization, compile customer feedback for indications of future
28
performance, reassess the marketplace, compare our findings to our previous estimate and adjust our amortization going forward.
Recent Accounting Pronouncements
In June 2001, the FASB issued SFAS No. 143, "Accounting for Asset Retirement Obligations" ("SFAS No. 143"), which sets forth the financial accounting and reporting to be followed for obligations associated with the retirement of tangible long-lived assets and the associated asset retirement costs. SFAS No. 143 requires entities to record the fair value of a liability for an asset retirement obligation in the period in which it is incurred if a reasonable estimate of fair value can be made. We adopted SFAS No. 143, effective February 2, 2003 for our fiscal 2003 consolidated financial statements with no material impact.
In August 2001, the FASB issued SFAS No. 144, "Accounting for the Impairment or Disposal of Long-Lived Assets," which provides for a single accounting model for assets to be disposed of, broadens the scope of businesses to be disposed of that qualify for reporting as discontinued operations and changes the timing of recognizing losses on such operations. We adopted SFAS No. 144 for our fiscal 2003 consolidated financial statements with no material impact.
In June 2002, the FASB issued SFAS No. 146, "Accounting for Costs Associated with Exit or Disposal Activities" ("SFAS No. 146"). SFAS No. 146 addresses financial accounting and reporting for costs associated with exit or disposal activities and nullifies Emerging Issues Task Force (EITF) Issue No. 94-3, "Liability Recognition for Certain Employee Termination Benefits and Other Costs to Exit an Activity (including Certain Costs Incurred in a Restructuring)" ("EITF No. 94-3"). SFAS No. 146 requires that a liability for a cost associated with an exit or disposal activity be recognized when the liability is incurred and initially measured at fair value. EITF No. 94-3 required that a liability for an exit cost (as defined in EITF No. 94-3) was recognized at the date of an entity's commitment to an exit plan. The provisions of SFAS No. 146 are effective for exit or disposal activities that are initiated after December 31, 2002. We would be impacted by SFAS No. 146 only if we were to commit to a plan for an exit or disposal activity. Currently, we have not committed to a plan for an exit or disposal activity.
In December 2002, the FASB issued SFAS No. 148, "Accounting for Stock-Based Compensation—Transition and Disclosure—an amendment of FASB Statement No. 123" (SFAS No. 148). This Statement amends FASB Statement No. 123, "Accounting for Stock-Based Compensation" (SFAS No. 123), to provide alternative methods of transition for a voluntary change to the fair value based method of accounting for stock-based employee compensation. In addition, this Statement amends the disclosure requirements of SFAS No. 123 to require prominent disclosures in both annual and interim financial statements about the method of accounting for stock-based employee compensation and the effect of the method used on reported results. In fiscal 2002, we adopted the disclosure requirements of SFAS No. 148. However, at this time, we do not intend to change to the fair value based method of accounting for stock-based employee compensation.
In January 2003, the FASB issued Interpretation No. 46, "Consolidation of Variable Interest Entities, an interpretation of ARB No. 51" (FIN 46). The primary objectives of FIN 46 are to provide guidance on the identification of, and financial reporting for, entities for which control is achieved through means other than through voting rights; such entities are known as variable-interest entities ("VIEs"). FIN 46 is effective for VIEs which are created after January 31, 2003 and for all VIEs for the first fiscal year or interim period beginning after December 15, 2003. We have evaluated the provisions of FIN 46 and believe that this interpretation will have no material effect on our consolidated financial statements.
29
Off-Balance Sheet Liabilities and Other Contractual Obligations
Our off-balance sheet liabilities primarily are limited to lease payment obligations incurred under operating leases, which are required to be excluded from our consolidated balance sheet by accounting principles generally accepted in the United States. Our only individually significant operating lease is for our distribution center and call center located in Mineral Wells, West Virginia. All of our other operating leases pertain to our retail and outlet stores, our Coeur d'Alene, Idaho call center and to various equipment and technology.
The following tables summarize our minimum contractual commitments and commercial obligations as of November 1, 2003:
| | Payments Due in Period
|
|---|
| | Total
| | Remainder of 2003
| | 2004-2005
| | 2006-2007
| | After 2007
|
|---|
| | (In thousands)
|
|---|
| Contractual Obligations | | | | | | | | | | | | | | | |
| Operating leases | | $ | 188,397 | | $ | 4,660 | | $ | 41,017 | | $ | 41,212 | | $ | 101,508 |
| Purchase orders | | | 82,421 | | | 49,437 | | | 32,984 | | | — | | | — |
| | |
| |
| |
| |
| |
|
| Total | | $ | 270,818 | | $ | 54,097 | | $ | 74,001 | | $ | 41,212 | | $ | 101,508 |
| | |
| |
| |
| |
| |
|
| | Payments Due in Period
|
|---|
| | Total
| | Remainder of 2003
| | 2004-2005
| | 2006-2007
| | After 2007
|
|---|
| | (In thousands)
|
|---|
| Commercial Commitments | | | | | | | | | | | | | | | |
| Letters of credit | | $ | 848 | | $ | 848 | | $ | — | | $ | — | | $ | — |
| | |
| |
| |
| |
| |
|
| Total | | $ | 848 | | $ | 848 | | $ | — | | $ | — | | $ | — |
| | |
| |
| |
| |
| |
|
Additionally, we had inventory purchase commitments of approximately $82.4 million and $85.4 million at November 1, 2003 and November 2, 2002, respectively.
Related Party Transactions
During fiscal 2000 and 2001, the Compensation Committee of our Board of Directors authorized compensation bonus pools totaling $250,000 and $75,000, respectively, as additional incentives to retain certain designated key employees. We are accruing the related compensation expense to each designated key employee on a straight-line basis over a 24-month period based on specified performance criteria. On March 25, 2002, $200,000 of the $250,000 compensation bonus pool was considered earned and subsequently paid in full. On September 25, 2002, the remaining $50,000 of the $250,000 compensation bonus pool was considered earned and subsequently paid in full. The balance in the remaining pool will be payable provided certain specified performance criteria are met over the preceding 24-month period.
On March 15, 2002, the Compensation Committee of the Board of Directors authorized retention compensation incentive agreements for two designated key employees in the aggregate amount of $900,000. On September 1, 2002, the Compensation Committee of the Board of Directors amended the agreements for the two previously designated key employees and authorized one additional key employee to receive a retention compensation incentive. Currently, the aggregate amount of the three agreements is $1,875,000. We accrued the compensation expense related to the original aggregate amount of $900,000 on a straight-line basis through September 1, 2002. We are accruing the remaining portion of the original aggregate amount of $900,000 and the additional amount of $975,000 on a
30
straight-line basis over the re-established 36-month retention period based on specified performance criteria and the current expectation that the specified performance criteria will be met.
Prior to the enactment of the Sarbanes-Oxley Act of 2002, we maintained an Executive Loan Program under which we made, at our sole discretion and with prior approvals from our Chief Executive Officer and the Compensation Committee of our Board of Directors, secured long-term loans to key executives. Our Chief Executive Officer, President and Chief Financial Officer do not have loans under this program. Each loan is secured by the executive's personal net assets, inclusive of all vested stock options in our company, bears interest at three percent per annum, and becomes due and payable on the earlier of (i) the date 10 days before the date on which the vested stock options serving as partial security expire or (ii) 90 days from the date on which the executive's employment with us terminates for any reason. Outstanding loans were $0.5 million both August 2, 2003 and at February 1, 2003. None of the loans outstanding prior to enactment of the Sarbanes-Oxley Act have had any of their terms modified.
In light of our not achieving our financial goals for fiscal 2001, our principal stockholders, Dennis Pence and Ann Pence, declined to accept any salaries for their executive management services from the beginning of fiscal 2002 through September 26, 2002 and through September 1, 2002, respectively. As required by accounting principles generally accepted in the United States, we imputed on a straight-line basis into our consolidated selling, general and administrative expenses fair market value salaries for Mr. Pence and Ms. Pence for these periods with corresponding offsetting credits to our consolidated additional paid-in capital. During the fiscal 2002 first quarter, the imputed salaries were equivalent to Mr. Pence's and Ms. Pence's respective $300,000 salaries for fiscal 2001. However, based on diminished participation by Mr. Pence and Ms. Pence during the fiscal 2002 second quarter, the imputed salaries were reduced to one-half of Mr. Pence's and one-quarter of Ms. Pence's fiscal 2001 salaries. During the fiscal 2002 third quarter, Mr. Pence's imputed salary expense continued at one-half of his fiscal 2001 salary through September 26, 2002 after which date Mr. Pence began receiving cash remuneration for his services equal to a base salary of $600,000 per year. Mr. Pence's salary remains at this level as of the date of this report. Effective September 1, 2002, Ms. Pence retired from her position as our Executive Creative Director. Accordingly, no salary expense related to Ms. Pence's contributed services was imputed after the fiscal 2002 second quarter.
Dennis Pence and Ann Pence personally participate in a jet timeshare program. For flights by them and other corporate executives made exclusively for official corporate purposes, we reimburse Mr. Pence and Ms. Pence for (i) a usage based pro rata portion of the financing costs, (ii) a usage based pro rata portion of monthly maintenance fees, and (iii) actual hourly usage fees. Aggregate expense reimbursements totaled $725,000 and $278,000 for fiscal 2002 and 2001, respectively, $162,000 and $182,000 for the second quarters of fiscal 2003 and 2002, respectively, and $340,000 and $554,000 for the first six months of fiscal 2003 and 2002, respectively.
On June 14, 2003, our Board of Directors approved a charitable contribution of $100,000 to the Morning Light Foundation, Inc, a not-for-profit charitable organization. Dennis Pence is the founder and a Board member of the Morning Light Foundation, Inc.
31
BUSINESS
Coldwater Creek Profile
Coldwater Creek is a specialty retailer of women's apparel, accessories, jewelry and gift items. Founded in 1984 as a catalog company, today we are a multi-channel retailer generating $524.3 million in net sales in the 12 months ended November 1, 2003. We have established a differentiated brand by offering exceptional value through a unique, proprietary merchandise assortment that reflects a sophisticated yet relaxed and casual lifestyle, coupled with superior customer service. Our target customers are women between the ages of 30 and 60, a group that spent in excess of $29 billion on apparel in 2002.
We reach our customers through our direct segment, which encompasses our catalog and e-commerce businesses, and our rapidly expanding base of retail stores. We believe this multi-channel approach allows us to cross-promote the Coldwater Creek brand and meet our customers' apparel and accessory needs by providing them convenient access to our merchandise lines regardless of the preferred shopping channel.
Our catalog business is a significant sales channel and acts as an efficient marketing platform to cross-promote our website and stores. During the 12 months ended November 1, 2003, we sent 140.8 million catalogs. In July 1999, we launched our full-scale e-commerce website,www.coldwatercreek.com, to cost-effectively expand our customer base and provide another convenient shopping alternative for our customers. We now have over 2.0 million e-mail addresses to which we regularly send customized e-mails.
We initiated testing of a full-line retail store model in 1999 based on our belief that the ability to touch and feel merchandise is an important aspect of a consumer's shopping experience. Over the past four years, we have been building the infrastructure to support the growth of our retail business and realize the benefits of our multi-channel model by undertaking the following initiatives:
- •
- testing and developing a scaleable retail store model for national rollout;
- •
- deepening the management team, particularly in our retail segment, by hiring key members of management with extensive retail experience at both the corporate level and in stores;
- •
- focusing our merchandise offering by refining our product assortment and increasing our investment in key items; and
- •
- integrating our retail and direct merchandise planning and inventory management functions to insure consistency of merchandise and our brand message across all channels.
Our retail segment is our fastest growing sales channel and is the key driver in our growth strategy. During the 12 months ended November 1, 2003, our retail business accounted for $172.8 million in net sales, or 33.0% of total net sales. As of November 1, 2003, we operated 63 full-line retail stores, 22 of which were opened in fiscal 2003, as well as two resort stores and 17 merchandise clearance outlet stores in 51 markets.
Business Strategies
We believe our success and future growth will be the result of consistent execution of the following business strategies:
Target a highly desirable, underserved customer. Generally, our target customers are women between the ages of 30 and 60. Women in this age bracket represent approximately 42% of the female population and spent over $29 billion on apparel in 2002. Within this population, our core customer generally has higher than average levels of disposable income, with total household incomes in excess of $50,000. While teens and younger adult female consumers have a relatively broad range of specialty
32
retail brands from which to choose, we believe our core customer has more limited options that cater specifically to her tastes and needs. Furthermore, we believe our customer, who has traditionally shopped at department stores, is migrating away from them, as their product selection and customer service have become less appealing to her over time. For these reasons, we believe that by continuing to make our brand relevant and accessible to this core customer, we will be able to increase our share of the apparel market over time.
Offer a differentiated brand with broad appeal. We believe the Coldwater Creek brand is synonymous with a sophisticated yet relaxed and casual lifestyle that appeals to a broad range of women who lead busy, active lives. We design our merchandise, retail stores, catalogs and website to embody the warmth of this aspirational lifestyle and attitude and to promote the Coldwater Creek brand image. We deliver quality, consistency, convenience and easy care through our proprietary merchandise. Our styles and cuts are conservative, while, at the same time, our colors, novelty designs and textures provide our customer's wardrobe with flare that she cannot easily find elsewhere.
Deliver the brand through an integrated multi-channel model. Our strategy of offering merchandise across three channels enables us to enhance visibility of our brand, accessibility to our merchandise and, consequently, customer loyalty. We integrate our three channels in a number of ways, which allows us to maximize sales and provide superior customer service. These include offering in-store web kiosks to allow customers to purchase items through our website that may not be in stock at stores, accepting returns through any channel regardless of the point of purchase, systematically reallocating inventory between channels and utilizing the data provided by our direct segment to identify new store locations. We continue to identify new ways to develop our multi-channel model to further optimize our business.
Provide an outstanding shopping experience through exceptional customer service. We believe our company-wide focus on exceptional customer service has been integral to our success and has enabled us to build a loyal customer base. In our retail stores, we seek to hire our customers to provide better knowledge and understanding of our customers' needs. We continually monitor service metrics, such as conversion rates, secret shopper scores, answer rates and order fulfillment rates. We have also invested in management information systems that provide our associates with easy access to information, including customer purchasing histories, merchandise availability, product specifications, available substitutes and accessories, and expected shipment dates. By promoting a culture of prompt, knowledgeable and courteous service, no matter how our customers choose to shop, we believe we will continue to attract a growing customer base and build brand loyalty.
Effectively use and leverage extensive business data across all our channels. Through our heritage as a direct marketer, we have the systems and discipline to collect customer data across all of our channels. We have formed a dedicated business intelligence group whose mission is to improve decision making by performing a variety of functions, including data warehousing, reporting and analysis, sales forecasting, statistical modeling and geographic analysis. Using these analyses, we assess customer density to determine where to place stores and more effectively select and allocate merchandise for our stores. We also use this data to personalize our marketing efforts through directed customer communications, including targeted mailings when we open new stores and regular, customized e-mails. Our executive management team meets daily to review and discuss key business metrics produced by this group in order to continually assess performance of the business across channels and merchandise assortments. We believe our access to this information and our effective use of it will allow us to continue to optimize productivity of all our channels.
Execute with an experienced management team. Over the past three years we have built out our team with senior management who have extensive retail, merchandising, brand-building, real estate, information technology and finance experience from a variety of retail, direct marketing and apparel companies, including Gap Inc., Newport News, Spiegel, Federated Department Stores, Williams-Sonoma, J. Crew, Toys "R" Us.com, Amazon.com and Tuesday Morning. We believe our management
33
team is well-rounded in all areas and provides us with a competitive advantage as we execute our growth strategy.
Growth Strategy
Over the last four years, we have continually refined our retail store model and operating strategy. We believe we will continue to realize the benefits of our multi-channel strategy with our retail channel being the primary source of our future growth. Our management team is committed to executing the following key growth strategies:
Expand our retail channel. We believe there is an opportunity for us to grow to 400 to 500 stores in up to 275 identified markets nationwide over the next six to eight years. As of November 1, 2003, we had 63 full-line retail stores, 22 of which were opened in fiscal 2003. We opened an additional three stores in November 2003 and currently plan to open 40 to 50 new stores in each of fiscal 2004 and fiscal 2005. As of November 1, 2003, we have signed leases for 20 store locations for our 2004 plan. The pace, scope and size of our retail store expansion will be influenced by the economic environment, available working capital, our ability to obtain favorable terms on suitable locations for our stores and, if necessary, external financing. Our core new store model is 5,000 to 6,000 square feet and generally located in upscale malls and lifestyle centers. In addition, we are testing a smaller store format of approximately 3,000 to 4,000 square feet. Our goal is to use our smaller stores to access attractive middle markets, fill in major metropolitan markets and take advantage of a greater number of premium real estate locations.
Further strengthen our brand and build customer loyalty. We continue to identify means of leveraging our brand and building customer loyalty. Our multi-channel initiatives include sending promotional wraps on our catalogs to direct customers in the vicinity of new store openings, offering in-store web kiosks to drive improved customer conversion rates and familiarity with our direct channel, and accepting direct returns in our retail stores. These initiatives allow us to introduce our direct customers to our retail channel and give us the opportunity to convert a return to an exchange or an incremental purchase.
As we grow the retail portion of our business, we believe we will continue to identify new and effective ways to improve our brand visibility and build customer loyalty, including:
- •
- introducing a multi-channel gift card for holiday 2003, which will replace our gift certificate program and, we believe, will introduce new customers to our brand;
- •
- introducing a customer loyalty program during the first half of 2004, under which our customers can earn and redeem points through any of our channels; and
- •
- continuing to integrate our three channels to provide multiple, convenient shopping alternatives for our customers.
Improve Profitability. As we grow our business and open new stores, we intend to improve our operating income. Key elements of our profitability improvement strategy include:
- •
- realizing the benefits of an increased sales mix of higher margin retail business;
- •
- leveraging corporate overhead costs over a larger sales base and realizing sales growth that outpaces additional overhead costs;
- •
- lowering cost of goods sold through improving vendor prices as our order quantities grow over time; and
- •
- continuing to optimize mailing and production costs within the catalog business.
34
Merchandising
Our merchandising philosophy reflects a casual, unhurried approach to living. We offer our customers colorful, proprietary designs and novelty items that reflect different aspects of their lifestyles, including casual weekend wear, soft career and special occasion. The products we offer are current but not trendy and address our customers' needs for ease and simplicity. Our "buy-now, wear-now" strategy puts merchandise in front of our customers when it is seasonally appropriate and offers versatile fabrics she can wear for up to nine months out of the year. Our "easy care" fabrics and comfortable styles are designed to facilitate product care.
All of our apparel is designed, developed and sold under the Coldwater Creek label. We differentiate merchandise lines under separate catalog titles to appeal to subtly different lifestyles within our overall core demographic. Our entire collection of merchandise is available through our website. Merchandise for our retail stores is carefully selected to include the best and most popular items, typically about one-third of what is offered in our direct segment.
Product Design and Development. Our in-house design and product development team is responsible for conceptualizing and directing the design of all Coldwater Creek apparel. We believe our in-house team of 21 designers and buyers allows us to exercise significant control over the merchandise development process and the quality of our product to create an overall merchandise assortment that is consistent with the Coldwater Creek brand.
Our design team travels to Europe twice a year to capture key themes that will appear in our collections throughout the upcoming seasons. Working in tandem with outside vendors and fabric designers, our design team creates an overall vision for each season's assortment that is then translated into collections for the season. We believe this approach allows us to introduce fresh products into our catalogs and retail locations every season and to supplement these selections with new items or styles throughout the year.
Planning and Allocation. We employ an integrated inventory planning team for our retail and direct sales channels. This group is responsible for conducting top-down and bottom-up planning and allocation across channels, seasons, collections and promotional events in order to maximize retail store, catalog and website productivity.
Initial planning and allocation decisions are made by assessing historical sales, individual item, store and catalog performance, and anticipated economic outlook. Equipped with distribution center and inventory management systems that allow us to allocate and re-allocate merchandise by channel, our inventory planning group is able to assess sales trends, customer demand and current inventory positions and to allocate items to enhance sales. We track sales at the SKU level on a daily basis and adjust our reorder and markdown strategies accordingly. Working together with our design and product development team, our inventory planning team has allowed us to optimize our overall number of styles of merchandise and SKUs.
Sourcing and Distribution. In the past three years, we have focused on reducing our total number of outside vendors and have concentrated our production with selected vendors who we believe consistently adhere to our quality standards and production demands. We maintain relationships with approximately 300 vendors and source most of our apparel from our top 20 vendors. Approximately 55% of our merchandise is manufactured overseas, most of which we purchase from domestic suppliers. As retail becomes a more important part of our business we anticipate that more of our merchandise will be sourced directly from overseas manufacturers.
We hold our vendors to strict quality standards, testing products for flammability, wash instructions, sizing and durability. Each shipment is checked against a certified sample upon delivery and can be returned if it does not meet our standards. Additionally, we issue monthly vendor "report
35
cards" to our top 75 vendors to provide them with important feedback and evaluation of their performance.
We operate a 600,000 square foot distribution center in Mineral Wells, West Virginia where we receive all of our merchandise. We handle all of our retail store and direct order fulfillment from this facility. Our distribution center is able to ship more than 95% of all in-stock items within 24 hours of an order placement and process more than 80% of all merchandise returns within a 24-hour period. At its current size, we estimate that the distribution center can service an additional 130 stores. This building was designed to allow us to expand up to a total of 930,000 square feet as needed.
Disposition. Relying on ongoing analysis of product performance, we maintain a disciplined approach to promotional selling of our merchandise. We conduct four key seasonal sales events per year in our retail stores, catalog and website. Additionally, items with higher-than-expected inventory counts are cleared through our website or one of our 16 retail outlet locations. Unlike many other retailers that produce items for sale through their outlet locations, we use our outlets exclusively to manage overstocked premium merchandise. We believe this approach to disposition of our merchandise conditions our customer to expect to pay full price for our items, effectively managing the margin impact of off-price selling. Additionally, we have the ability to choose the most efficient channel to use for liquidation at any given time.
Direct Segment Operations
Since the first mailing of ourNorthcountry catalog in 1985, we have grown our direct segment to include both our catalog and e-commerce businesses. Our catalogs and e-commerce website are designed to create a distinctive and easy shopping experience. Merchandise presentations feature full color photographs, graphics and artwork designed to appeal to our target customer. We present our apparel "off-figure", leaving the customer to decide if an item of merchandise is right for her based on the item's inherent style and design. All catalog and website pages are created and designed by an in-house team of artists, copywriters and editors to ensure a consistent presentation of the Coldwater Creek brand.
Our direct channel represented approximately 67.0% of our total net sales for the 12 months ended November 1, 2003. As we continue to rollout our retail stores, we expect our direct segment to decrease as a percentage of net sales over time. It will continue to be a core component of our brand identity and our operations, serving as a valuable source of marketing information, helping promote each of our channels and providing cash flow to support our retail store expansion.
During the 12 months ended November 1, 2003, our catalog business generated $201.4 million in net sales, or 38.4% of total net sales. Historically, we have used three catalog titles,Northcountry, Spirit andElements, to feature our entire full-price line of merchandise using different assortments for each title to target separate sub-groups of our core demographic. In November 2003, we announced our intention to combine our two smaller catalogs,Spirit andElements, and to re-introduce the combined catalog under theSpirit title in January 2004. The newSpirit catalog will combine the sophistication ofSpirit and the mix-and-match versatility ofElements in a format that focuses on the customer's lifestyle. This initiative will allow us to better meet the needs of ourSpirit andElements customers by assembling "head-to-toe" assortments and offering merchandise for a wider range of occasions by combining soft career wear with sportswear and separates.
36
The resulting two catalogs will each be devoted to slightly different lifestyles within our core customer base:
- •
- Northcountry offers the broadest selection of merchandise, including affordable apparel, accessories, jewelry and gift items, reflecting a casual and relaxed lifestyle. The merchandise in ourNorthcountry catalog currently has the broadest market appeal, as it typically has a more sustainable life cycle. Most items are priced between $20 and $100.
- •
- Spirit offers a broad assortment of women's apparel, including sophisticated dresses and sportswear, blouses, shirts, jackets, pants and skirts, versatile basics, casual separates as well as footwear and distinctive, contemporary jewelry. The newSpirit catalog targets the same core customer — the busy woman who is looking for ease and comfort, even in her more dressed-up wardrobe. This lifestyle-oriented approach to merchandising is a direction we have researched over many months, and one that we have found to be very effective in our retail stores. Most items in theSpirit catalog are priced between $20 and $150.
Additionally, to serve the gift-giving needs of our customers and generate incremental sales during the important holiday shopping season, each year we assemble selected merchandise, which is featured in a festiveGifts-to-Go catalog and on our e-commerce website.Gifts-to-Go generally features a varied assortment of the most popular items featured in our primary merchandise lines described above.
Since 2000, in an effort to increase the productivity of our direct business and reduce costs, we have reduced our catalog circulation and have been actively promoting the migration of our customers from our catalogs to our more cost-efficient e-commerce website. We have also focused on decreasing our number of prospect mailings because they increasingly produce lower response rates and contribute fewer sales than catalog mailings to active customers. In fiscal 2003, we mailed 117.8 million catalogs, down 35.8% from our peak mailings of 183.6 million catalogs in 2000. We expect to continue to reduce our catalog circulation, particularly to prospective customers, until we have reached what we believe to be optimal levels.
As part of our effort to provide our customers with new channels of accessibility, we launched our full-scale e-commerce website,www.coldwatercreek.com, in July of 1999. This cost-effective medium is designed to offer a convenient, user-friendly and secure online shopping option for our customers. The website features our entire full-price merchandise offering found in our catalogs and retail stores. It also serves as an efficient vehicle for the disposition of excess inventory.
During 2003, we redesigned the website homepage and site navigation, added product color swatching and zooming views and included personalized product recommendations based on customers' previous purchases. Prior to holiday 2003, we added a new streamlined checkout process and product substitutions. Next spring, we expect to test online catalogs and enhanced search capabilities.
During the 12 months ended November 1, 2003, online sales amounted to $150.1 million and represented 28.6% of total net sales. We have over 2.0 million opt-in e-mail addresses to which we regularly send promotional e-mails. Our promotional e-mails are customized to meet subscribers' shopping preferences and merchandise tastes.
We continue to participate in a net sales commission-based program whereby numerous popular Internet search engines and consumer and charitable websites promote the Coldwater Creek brand to their visitors. These noncompetitive "affiliate" merchants provide convenient hotlink access to our website, which also serves as an effective tool in prospecting for new customers.
37
Retail Segment Operations
Building on our success in the direct channel, we opened our first full-line store in November 1999, and from 1999 to the spring of 2002 we opened 34 additional full-line stores, methodically testing and refining our store format and reducing capital expenditures required for build-out. Today, our retail segment is the fastest growing component of our net sales. As of November 1, 2003, we operated 63 full-line retail stores, two resort stores and 17 outlet stores in 51 markets. We opened three additional stores in November 2003 and plan to open 40 to 50 new stores in each of fiscal 2004 and fiscal 2005. We closed one outlet store in December 2003. During the 12 months ended November 1, 2003, retail sales amounted to $172.8 million and represented 33.0% of total net sales. We expect our retail segment to continue as our primary growth vehicle, as over 90% of women's apparel in the U.S. is purchased in retail stores.
In the second half of 2002, we introduced our scaleable model of 5,000 to 6,000 square foot stores. We have continually improved our construction processes, materials and fixtures, merchandise layout and store design to minimize our initial capital investment per store, while maintaining an overall atmosphere that is comfortable and relevant to our core customers.
Our retail stores are designed to reflect the brand's focus on casual comfort, as well as to highlight merchandise being featured across all channels. Our wide, windowed storefront and forest green logo above a soft archway provide an inviting first impression to our customers. Our store interiors combine an appealing mix of cherry wood, slate and soft, neutral colored carpeting and typically offer a seating area for others who may be accompanying our shoppers.
Our retail stores showcase our apparel assortment and encourage browsing by displaying jewelry, accessories and gifts in a manner that provides the customer with a sense of discovery. We display apparel according to occasion, separating weekend and casual wear from soft career and special occasion wear. We locate our accessories section next to the dressing rooms, which allows our sales associates to encourage incremental purchases as customers try on clothes.
Our 5,000 to 6,000 square foot model makes use of central fixtures and tables to evoke elements of our customers' lives. For example, we may display a cozy sweater and comfortable pants with a chess set or art box, or a colorful cocktail party outfit with a unique set of wine glasses. This presentation method promotes the sale of non-apparel items, facilitates our customers' shopping experiences, further establishes Coldwater Creek as a lifestyle brand and gives our customers an eclectic boutique experience.
We are also testing a 3,000 to 4,000 square foot store model and opened six of these stores in the second half of fiscal 2003. The smaller store format allows us to more effectively take advantage of wall space to display compelling arrangements. We believe the ability to use wall space for key items will afford us greater productivity per square foot. Our goal is to use these stores to access smaller markets as well as fill in the larger markets.
We believe we have developed and refined a scaleable store model for nationwide rollout. Our core new store model of 5,000 to 6,000 square feet assumes an average initial net investment of $560,000 and anticipates sales per square foot of $500 in the third year of operations. For the 12 months ended November 1, 2003, our 37 stores that had been open at least 13 months averaged 7,269 square feet in size and $467 per square foot in net sales. Most of these stores have been open for one to two years. We are also testing a smaller store model of 3,000 to 4,000 square feet. This model assumes an average initial net investment of $400,000 and anticipates sales per square foot of $600 in
38
the third year of operations. We currently have six stores open in this model, none of which has been open for a full year.
In addition to our full-line retail stores, we currently operate 16 outlet stores where we sell excess inventory. We plan to open three outlet stores in fiscal 2004. We generally locate the outlets within clusters of our retail stores to efficiently manage our inventory clearance activities, but far enough away to avoid significantly diminishing our full-line store sales. Unlike many other apparel retailers that produce merchandise directly for their outlet stores, merchandise sold through our outlets is limited to overstocked premium items from our full-line retail stores. We believe this use of our outlet stores enables us to effectively manage our inventory and clearance activities.
We organize our stores into regions and districts, which are overseen by regional and district managers who report to our senior vice president of retail. Each district manager oversees between six and ten store managers. On average, our store managers have 11 years of experience as retail managers. Approximately 24% of our managers have district manager-level experience with major brands in the retail sector.
The following map and table indicates our retail stores as of January 1, 2004 by location.
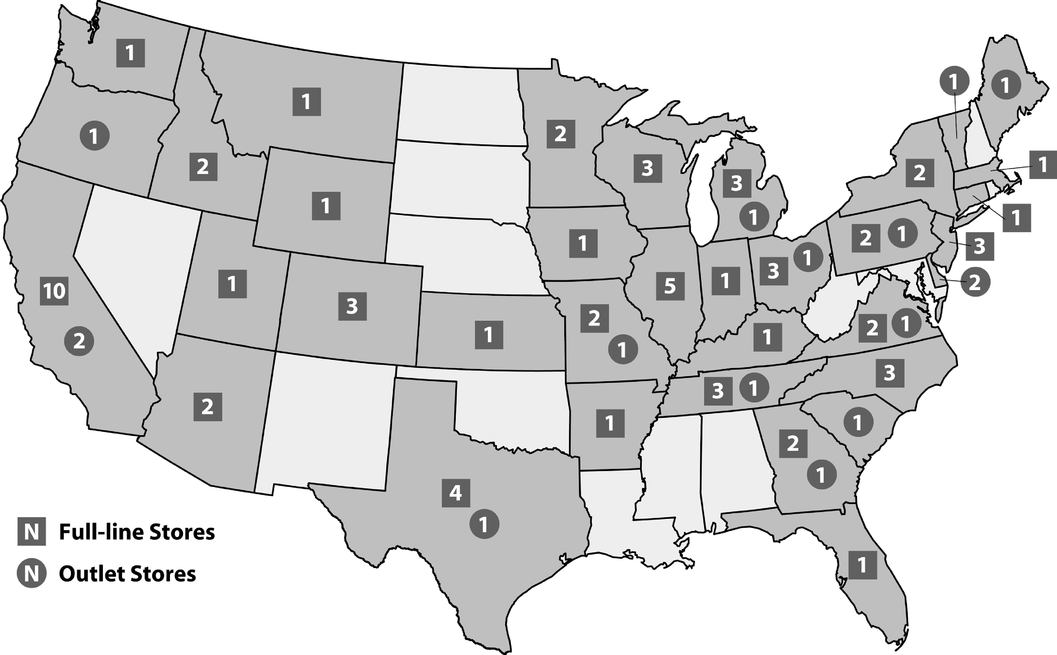
State
| | Store Name
| | City
| | Store Type
| | Open Date
|
|---|
| Arizona | | Park Place | | Tucson | | Mall | | December 14, 2000 |
| | | Kierland Commons | | Scottsdale | | Lifestyle | | September 28, 2001 |
| Arkansas | | Park Plaza Mall | | Little Rock | | Mall | | October 14, 2003 |
| | | | | | | | | |
39
| California | | The Shops at Mission Viejo | | Mission Viejo | | Mall | | November 4, 2000 |
| | | Fashion Square | | Sherman Oaks | | Mall | | June 27, 2001 |
| | | Stanford Shopping Center | | Palo Alto | | Mall | | November 9, 2001 |
| | | Arden Fair | | Sacramento | | Mall | | November 21, 2001 |
| | | Valley Fair | | Santa Clara | | Mall | | March 21, 2002 |
| | | State Street | | Santa Barbara | | Street | | May 21, 2002 |
| | | Broadway Plaza | | Walnut Creek | | Street | | June 4, 2002 |
| | | Carmel Plaza | | Carmel | | Street | | June 10, 2002 |
| | | The Shops on Lake Avenue | | Pasadena | | Street | | November 14, 2002 |
| | | Gilroy Premium Outlets | | Gilroy | | Outlet | | November 25, 2002 |
| | | Desert Hills Premium Outlets | | Cabazon | | Outlet | | October 2, 2003 |
| | | The Forum at La Costa | | Carlsbad | | Lifestyle | | November 26, 2003 |
| Colorado | | Flatiron Crossing | | Broomfield | | Mall | | September 1, 2000 |
| | | Aspen Grove | | Littleton | | Lifestyle | | November 8, 2001 |
| | | The Shops at Briargate | | Colorado Springs | | Lifestyle | | August 14, 2003 |
| Connecticut | | Stamford Town Center | | Stamford | | Mall | | November 6, 2003 |
| Delaware | | The Shipyard Shops | | Wilmington | | Outlet | | May 18, 1999 |
| | | Rehoboth Outlets | | Rehoboth Beach | | Outlet | | August 7, 2003 |
| Florida | | International Plaza | | Tampa | | Mall | | November 7, 2003 |
| Georgia | | The Forum on Peachtree Parkway | | Norcross | | Lifestyle | | April 18, 2002 |
| | | The Avenue at West Cobb | | Marietta | | Lifestyle | | September 18, 2003 |
| | | North Georgia Outlet | | Dawsonville | | Outlet | | October 21, 2003 |
| Idaho | | Cedar Street Bridge | | Sandpoint | | Resort | | May 1, 1988 |
| | | Boise Towne Square | | Boise | | Mall | | May 23, 2001 |
| Illinois | | Deer Park Town Center | | Deer Park | | Lifestyle | | October 20, 2000 |
| | | Old Orchard Center | | Skokie | | Mall | | October 30, 2001 |
| | | Geneva Commons | | Geneva | | Lifestyle | | September 5, 2002 |
| | | The Shoppes at Grand Prairie | | Peoria | | Lifestyle | | August 5, 2003 |
| | | Main Street Promenade | | Naperville | | Street | | September 9, 2003 |
| Indiana | | The Fashion Mall at Keystone | | Indianapolis | | Mall | | July 30, 2002 |
| Iowa | | Northpark Mall | | Davenport | | Mall | | October 14, 2003 |
| Kansas | | Town Center Plaza | | Leawood | | Lifestyle | | November 5, 1999 |
| Kentucky | | Oxmoor Center | | Louisville | | Mall | | May 14, 2003 |
| Maine | | Tanger Outlet Center | | Kittery | | Outlet | | November 28, 1997 |
| Massachusetts | | Natick Mall | | Natick | | Mall | | August 31, 2001 |
| Michigan | | Prime Outlets at Birch Run | | Birch Run | | Outlet | | March 3, 1998 |
| | | The Village of Rochester Hills | | Rochester Hills | | Lifestyle | | October 15, 2002 |
| | | Eastwood Towne Center | | Lansing | | Lifestyle | | November 12, 2002 |
| | | Woodland | | Grand Rapids | | Mall | | May 20, 2003 |
| Minnesota | | Rosedale Center | | Roseville | | Mall | | November 15, 2001 |
| | | The Shoppes at Arbor Lakes | | Maple Grove | | Lifestyle | | September 2, 2003 |
| Missouri | | West County Center | | Des Peres | | Mall | | September 20, 2002 |
| | | Osage Beach Premium Outlets | | Osage Beach | | Outlet | | February 4, 2003 |
| | | | | | | | | |
40
| | | Shops at Boardwalk | | Kansas City | | Lifestyle | | June 17, 2003 |
| Montana | | Rimrock Mall | | Billings | | Mall | | October 27, 2003 |
| New Jersey | | The Promenade at Sagemore | | Marlton | | Lifestyle | | November 1, 2001 |
| | | Garden State Plaza | | Paramus | | Mall | | November 15, 2001 |
| | | Menlo Park Mall | | Edison | | Mall | | May 8, 2002 |
| New York | | Walt Whitman Mall | | Huntington Station | | Mall | | November 21, 2001 |
| | | Eastview Mall | | Victor | | Mall | | November 1, 2003 |
| North Carolina | | South Park Mall | | Charlotte | | Mall | | August 24, 2001 |
| | | Streets at Southpoint | | Durham | | Mall | | March 8, 2002 |
| | | Triangle Town Center | | Raleigh | | Mall | | May 6, 2003 |
| Ohio | | Rookwood Commons | | Cincinnati | | Lifestyle | | August 30, 2000 |
| | | Polaris Fashion Place | | Columbus | | Mall | | October 25, 2001 |
| | | Prime Outlets at Jeffersonville | | Jeffersonville | | Outlet | | October 2, 2002 |
| | | Legacy Village | | Lyndhurst | | Lifestyle | | October 24, 2003 |
| Oregon | | Factory Stores at Lincoln City | | Lincoln City | | Outlet | | June 21, 2002 |
| Pennsylvania | | The Court at King of Prussia | | King of Prussia | | Mall | | October 5, 2001 |
| | | Prime Outlets at Grove City | | Grove City | | Outlet | | September 25, 2002 |
| | | The Shoppes at English Village | | N. Wales | | Lifestyle | | September 30, 2003 |
| South Carolina | | Tanger Factory Outlets at Myrtle Beach | | Myrtle Beach | | Outlet | | June 28, 2002 |
| Tennessee | | CoolSprings Galleria | | Franklin | | Mall | | April 22, 2003 |
| | | The Shops of Saddle Creek | | Germantown | | Lifestyle | | April 29, 2003 |
| | | Tanger Outlet Center at Five Oaks | | Sevierville | | Outlet | | July 25, 2003 |
| | | Wolfchase Galleria | | Memphis | | Mall | | October 20, 2003 |
| Texas | | Stonebriar Centre | | Frisco | | Mall | | August 4, 2000 |
| | | The Woodlands Mall | | The Woodlands | | Mall | | October 26, 2001 |
| | | Highland Village Shopping Center | | Houston | | Lifestyle | | November 8, 2001 |
| | | Tanger Outlet Center | | San Marcos | | Outlet | | November 25, 2002 |
| | | Alamo Quarry Market | | San Antonio | | Lifestyle | | October 7, 2003 |
| Utah | | The Gateway | | Salt Lake City | | Lifestyle | | November 1, 2001 |
| Vermont | | Equinox Square | | Manchester Center | | Outlet | | July 3, 2003 |
| Virginia | | Leesburg Corner Premium Outlets | | Leesburg | | Outlet | | October 26, 1998 |
| | | Tysons Corner Center | | McLean | | Mall | | November 19, 2002 |
| | | Short Pump Town Center | | Richmond | | Mall | | September 4, 2003 |
| Washington | | 5th Ave. & Pine St. | | Seattle | | Street | | November 12, 1999 |
| Wisconsin | | Mayfair Mall | | Wauwatosa | | Mall | | November 21, 2001 |
| | | West Towne Mall | | Madison | | Mall | | April 15, 2003 |
| | | Fox River Mall | | Appleton | | Mall | | September 1, 2003 |
| Wyoming | | Town Square | | Jackson | | Resort | | June 1, 1997 |
41
We locate our new stores primarily in regional shopping malls and lifestyle centers. Lifestyle centers are generally located in affluent suburban areas and feature a clustered assortment of well-known specialty retailers, including bookstores and home goods retailers, other apparel retailers and full service restaurants, in an open-air format. Currently, approximately 58% of our full-line stores are located in traditional malls, 33% in lifestyle centers and 9% in street locations.
We utilize a disciplined, fact-based site selection process to determine our store locations. We believe we are at a competitive advantage to other traditional retailers as we are able to collect significant amounts of data regarding the location and concentration of our customers through our direct segment. This data, combined with additional demographic research, helps us identify markets and target specific locations based on geographic clustering of our direct segment customers.
After a specific location is identified, we evaluate the opportunity based on other factors, including attractiveness of economic and business terms of the lease, overall mix of tenants within the mall or center and proximity to direct competitors. Our real estate committee, comprised of our Chief Executive Officer, President and Chief Merchandising Officer, Executive Vice President and Chief Financial Officer, Senior Vice President of Retail and our Divisional Vice President of Real Estate, must approve each transaction before a lease is signed. We then contract the design, build-out and fixturing of the stores and coordinate directly with vendors and landlords during construction.
Customer Service
Over the past 20 years, we have built a reputation and company-wide culture of providing superior customer service. We view customer service as a critical aspect of our business that can be consistently improved upon. Accordingly, we monitor service metrics for our call center operations, retail stores and distribution center on a daily basis.
A central feature of our commitment to customer service is our unconditional return policy for all of our merchandise. A customer can return an item for any reason at any time through any channel, regardless of the point of purchase. We believe this policy builds customer loyalty and helps overcome any reluctance a customer may have to purchasing merchandise from catalogs or via the Internet.
We have invested in management information systems that provide our associates with easy access to information, including customer purchasing histories, merchandise availability, product specifications, available substitutes and accessories and expected shipment dates, which allows our call center and retail sales associates to answer questions and deal with customer complaints directly.
We have also established the following practices to provide consistently high levels of customer service through our direct channel:
- •
- All of our call center associates receive comprehensive instruction when they are hired and receive regular retraining, along with detailed product orientation and instruction on order processing. We also cross-train more experienced call center associates to communicate with customers on the live chat feature on our website;
- •
- Our toll-free telephone services may be accessed 21 hours a day, seven days a week and our website may be accessed 24 hours a day, seven days a week, to place orders, request a catalog or make merchandise, catalog, website or store location inquiries;
- •
- On average, we answer calls for catalog orders in less than eight seconds during peak ordering seasons, and we have consistently maintained a 99% answer rate, which measures the percentage of calls successfully connected to a call center representative;
42
- •
- We feature an instant help option on our website if a customer has questions about our products, navigating the site or placing and completing orders. Trained call center associates respond to inquiries in an average of 10 to 15 seconds through live-chat technology. Requests or questions sent by e-mail receive a personalized reply, rather than an automated response, in an average of 15 minutes; and
- •
- In each of our call centers, we employ specialized product experts who receive extensive product training and who can respond in real time to detailed product questions from customers.
We have implemented several measures to ensure that we maintain our tradition of superior customer service in our retail stores:
- •
- We seek to hire our customers as retail sales associates. We believe our customers often make excellent employees because they are familiar with our brand, have personally experienced our commitment to customer service and fall within our consumer demographic, which allows them to relate effectively to other customers;
- •
- All of our retail sales associates undergo extensive employee orientation and training programs. These programs include detailed training on the Coldwater Creek "customers first" philosophy and instruction on our products, how to effectively sell and, depending on the employee's title, sales floor layout, presentation and management;
- •
- We employ operations managers at each of our retail stores who are responsible for all back office activities, which allows our sales associates and store managers to devote their full attention to customers;
- •
- To ensure that merchandise is available in our stores when our customers want it, we recently installed an automated system in our distribution center to streamline our shipping process. We are now able to replenish all store locations in one to four days, with daily restocking at top-performing stores; and
- •
- We track store conversion rates, which measure the percentage of customers who enter a store who make a purchase. We gather hourly conversion data at each of our retail stores and reward our store managers based on improvements in their conversion rates.
Marketing and Promotion
Our marketing and promotion initiatives focus on reinforcing our brand message and retaining our existing customers and attracting new customers. As we grow our business and broaden our retail footprint, we intend to increase our mass marketing initiatives to enhance national visibility of the brand.
We believe our ability to effectively design and run each of our marketing and promotional programs is enhanced by our proprietary database of customer information, which includes demographic data, purchasing history by sales channel and their physical proximity to our existing and planned retail stores. This system allows us to segment our customer base according to many variables to analyze each segment's performance and buying patterns. We use the resulting information to prospectively adjust the frequency, timing and content of our various programs and promotions to maximize the productivity of each one.
43
As we have moved to a multi-channel strategy we have implemented the following marketing and promotional initiatives to maximize purchases by our existing customers in all three of our channels, reinforce the Coldwater Creek brand, and encourage customer loyalty:
- •
- We place kiosks linked to our user-friendly, e-commerce website in our retail stores to encourage our customers to explore our website and, if they prefer, place their order over the Internet;
- •
- We prominently display our website address and the location of our retail stores in each of our catalogs;
- •
- We publicize our retail store openings utilizing cover wraps on local catalog mailings, announcement mailings and e-mails and various local advertising media;
- •
- We send customized e-mail messages alerting customers about special sales events and the arrival of new merchandise; and
- •
- We run certain promotional events in our direct and retail channels each month, which are designed to increase order size, clear seasonal merchandise or reactivate customers who have not recently shopped with us.
In November 2003, we launched a multi-channel gift card to replace our gift certificate program. We also anticipate introducing a customer loyalty program in 2004 that allows customers to earn and redeem award points through all our channels.
As part of our e-commerce marketing initiatives, we participate in an affiliate website program. We select popular Internet search engines, consumer and charitable websites to promote the Coldwater Creek brand to their visitors and provide convenient hotlink access to our website in exchange for a commission based on net sales from referred customers.
We also conduct a national magazine advertising campaign to reinforce awareness of Coldwater Creek as we open stores in new markets, draw the attention of potential direct customers and establish national visibility for our brand. We run full-page, color advertisements to promote our three channels in lifestyle and shelter publications consistent with the Coldwater Creek brand, includingBetter Homes and Gardens, Sunset, Country Living andCooking Light. In Spring 2004, we will also begin testing these advertisements in local and regional publications in new and existing retail markets.
Information Technology
We are committed to investing in our information systems to increase operating efficiency, provide superior customer service and support our anticipated growth. Our management information systems consist of a full range of selling channel solutions, including retail point-of-sale, catalog and e-commerce systems, financial and merchandising systems, including inventory planning, distribution and control, sales reporting, credit, accounts payable, merchandise reporting and logistics.
Our systems allow us to monitor hourly and daily performance metrics in our direct and retail channels. These systems enable us to analyze the historical performance of individual merchandise items by various categories and have allowed us to realize increased accuracy in our product performance forecasting, and, as such, better manage our retail inventory, reduce product overstocks and backorders, increase our in-stock levels and realize additional logistic efficiencies.
Our technical infrastructure provides for geographic diversity and redundant computing complexes to serve our growing and expanding multi-channel business. We have data centers located in three of our corporate facilities that provide for instant backup in the event of a telecommunications or systems failure. Our call center telecommunication system is designed to reduce the risk of telephone delays and capacity constraints and allows us to operate our call centers as a single "virtual call center". Calls
44
coming into one location are automatically routed to the other locations if the load is too high or if a call center is unable to receive incoming calls due to factors such as natural disasters, power failures or systems problems. Additionally, we have call center capabilities in our Sandpoint, Idaho facility that we use to capture overflow traffic.
We have also installed network and server load balancing devices that allow customer orders received on our e-commerce website to be routed to the least busy server farm and the least busy server in that farm. We use encryption technology to protect sensitive customer information transmitted on our website. We protect company sensitive information on our servers from unauthorized access using industry standard network security systems in addition to anti-virus and firewall protection.
We expect to continue to make significant investments in our systems and infrastructure to support our retail store expansion, inventory management, merchandising, order taking and customer service, order fulfillment, marketing, product development and financial control and reporting and forecasting.
Competition
The women's retail apparel market is highly competitive. Our competitors range from large multi-channel specialty apparel and accessory retailers with catalog, e-commerce and retail store operations, such as Chico's, Talbots and J. Jill, to small single-sales channel catalog, e-commerce and retail store companies. We also compete with national department stores, such as Bloomingdale's, Macy's, JC Penney, Dillards and Nordstrom, and with discount retailers that offer women's apparel and accessories, such as Kohl's and Target.
We believe that we compete principally on the basis of the distinctive merchandise selection and superior customer service associated with the Coldwater Creek brand, as well as our commitment to understanding and providing merchandise that is relevant to our targeted customer base. With over 90% of women's apparel being purchased in retail stores in 2002, we believe that our retail store expansion will allow us to compete more effectively in the women's apparel market by providing this important aspect of the shopping experience to more of our customers. We also believe that our integrated, multi-channel strategy enhances our ability to compete by allowing our customers to choose the most convenient sales channel and allowing us to reach a broader audience in existing and in new markets and to continue to build Coldwater Creek into a nationally recognized brand.
Employees
As of November 1, 2003, we had 2,141 full-time employees and 1,462 part-time employees. During our peak selling season, which includes the months of November and December, we utilize a substantial number of temporary employees. None of our employees are covered by collective bargaining agreements. We consider our employee relations to be good.
Trademarks
Our registered trademarks include Coldwater Creek®, Coldwater Creek Spirit® and the stylized Coldwater Creek logo. We believe that our registered and common law trademarks have significant value and are instrumental to our ability to create and sustain demand for and market our merchandise.
45
Properties
Our principal executive and administrative offices are located at One Coldwater Creek Drive, Sandpoint, Idaho 83864. Our telephone number is (208) 263-2266. The general location, use and approximate size of our principal properties as of January 1, 2004 are set forth below:
Facility
| | Address
| | Owned/Leased
| | Approximate
Size
|
|---|
| Corporate Offices | | One Coldwater Creek Drive
Sandpoint, Idaho | | Owned | | 231,000 sq. ft. |
| East Coast Operations Center, including Distribution and Call Center | | 100 Coldwater Creek Drive
Mineral Wells, W. Virginia | | Leased | | 600,000 sq. ft. |
| Coeur d'Alene, Idaho Call Center | | 751 West Hanley Avenue
Coeur d'Alene, Idaho | | Leased | | 60,000 sq. ft. |
| 66 Full-Line Retail Stores(a) | | Various U.S. Locations | | Leased | | 419,000 sq. ft. |
| 16 Outlet Stores(b) | | Various U.S. Locations | | Leased | | 102,000 sq. ft. |
| 2 Resort Stores(c) | | Sandpoint, ID and Jackson, WY | | Leased | | 34,000 sq. ft. |
- (a)
- Our full-line retail stores are generally between approximately 4,000 and 9,000 square feet, with six smaller-sized stores between approximately 3,000 to 4,000 square feet. As of January 1, 2004, our full-line retail stores averaged approximately 6,350 square feet per store. Our retail store leases generally have base terms between five and ten years.
- (b)
- Our outlet stores are generally between approximately 5,000 and 7,500 square feet, and averaged approximately 6,375 square feet as of January 1, 2004. Our outlet store leases generally have base terms of five years. We closed our Boise, Idaho outlet store in December 2003.
- (c)
- Our two resort stores average approximately 17,000 square feet, and the base terms of these leases will expire in 2006 and 2004.
We believe that our corporate offices, distribution center and call centers will meet our operational needs for the foreseeable future. Our distribution center was designed to allow us to expand up to an aggregate of 930,000 square feet, as needed. We intend to expand capacity at our distribution center in fiscal 2005 and fiscal 2006 to support our expanding retail store base.
Legal Proceedings
We are, from time to time, involved in various legal proceedings incidental to the conduct of our business. In the opinion of management, our gross liability, if any, and without any consideration given to the availability of insurance or other indemnification, under any pending litigation or administrative proceedings, would not materially affect our consolidated financial position, results of operations or cash flows.
Government Regulation
Our direct business is subject to the Merchandise Mail Order Rule and related regulations promulgated by the Federal Trade Commission. While we believe we are in material compliance with these regulations, no assurance can be given that new laws or regulations will not be enacted or adopted which might adversely affect our operations.
We collect sales taxes from customers transacting purchases in states in which we have physically based some portion of our retailing business. We also pay applicable corporate income, franchise and other taxes, to states in which retail or outlet stores are physically located. Upon entering a new state, we accrue and remit the applicable taxes. As we open more retail stores, we will be subject to an increasing number of state and local taxing jurisdictions. In addition, we accrue use taxes on catalogs used in our stores or at our corporate headquarters or sent to customers with shipments from our
46
distribution center. Although we believe we have properly accrued for these taxes based on our current interpretation of the tax code, state taxing authorities may challenge our interpretation. Failure to properly determine or to timely remit these taxes may result in additional interest and related penalties being assessed.
Various states have attempted to collect back sales and use taxes from direct marketers whose only contacts with the taxing state are solicitations through the mail or the Internet, and whose subsequent delivery of purchased goods is by mail or interstate common carriers, and we may be subject to these attempts in states in which we have no physical presence. However, the U.S. Supreme Court has held that these states, absent congressional legislation, may not impose tax collection obligations on an out-of-state mail order or Internet company. We anticipate that any legislative changes regarding direct marketers, if adopted, would be applied only on a prospective basis.
Many of our products are manufactured outside the United States and are subject to existing or potential duties, tariffs or quotas that may limit the quantity of products we are allowed to import or increase the cost of such products. To date, we have not been restricted by quotas in the operation of our business, and customs duties have not comprised a material portion of the total cost of most of our products. As we expand our retail operations and begin to source more merchandise overseas, however, our business may be impacted by quotas and the imposition of customs duties or tariffs. We are also subject to foreign governmental regulation and trade restrictions, including U.S. retaliation against certain prohibited foreign activities, with respect to our product sourcing.
47
QuickLinks