Exhibit 99.1

Link to searchable text of slide shown above

Link to searchable text of slide shown above

Link to searchable text of slide shown above

Link to searchable text of slide shown above
Link to searchable text of slide shown above
Link to searchable text of slide shown above

Link to searchable text of slide shown above
Link to searchable text of slide shown above
Link to searchable text of slide shown above
Link to searchable text of slide shown above
Link to searchable text of slide shown above
Link to searchable text of slide shown above
Link to searchable text of slide shown above
Link to searchable text of slide shown above
Link to searchable text of slide shown above

Link to searchable text of slide shown above

Link to searchable text of slide shown above

Link to searchable text of slide shown above
Link to searchable text of slide shown above

Link to searchable text of slide shown above

Link to searchable text of slide shown above
Link to searchable text of slide shown above

Link to searchable text of slide shown above

Link to searchable text of slide shown above

Link to searchable text of slide shown above
Link to searchable text of slide shown above
Link to searchable text of slide shown above

Link to searchable text of slide shown above
Link to searchable text of slide shown above
Link to searchable text of slide shown above
Link to searchable text of slide shown above

Link to searchable text of slide shown above
Link to searchable text of slide shown above
Link to searchable text of slide shown above

Link to searchable text of slide shown above
Link to searchable text of slide shown above
Link to searchable text of slide shown above
Link to searchable text of slide shown above
Link to searchable text of slide shown above
Link to searchable text of slide shown above

Link to searchable text of slide shown above
Link to searchable text of slide shown above

Link to searchable text of slide shown above
Searchable text section of graphics shown above
[GRAPHIC]
[LOGO]
Forward-Looking Statement
This presentation includes, and our response to various questions may include, forward-looking statements about the Company’s revenues and earnings and about our future plans and objectives. Any such statements are subject to risks and uncertainties that could cause the actual results and the implementation of the Company’s plans and operations to vary materially. These risks are discussed in the Company’s filings with the S.E.C.
[GRAPHIC]
Company Overview |
| |
• | Established in 1984 |
| |
• | $519 million in net sales in fiscal 2003 |
| |
• | Significant market share in direct channels |
| |
• | Proprietary merchandise |
| |
• | 2.6 million active customers |
Experienced Senior Management Team
Name | | Title | | Years of Experience |
| | | | | |
• | Dennis Pence | | Chairman & Chief Executive Officer | | 29 |
| | | | | |
• | Georgia Shonk-Simmons | | President & Chief Merchandising Officer | | 32 |
| | | | | |
• | Daniel Griesemer | | Executive VP of Retail | | 20 |
| | | | | |
• | Mel Dick | | Executive VP & Chief Financial Officer | | 30 |
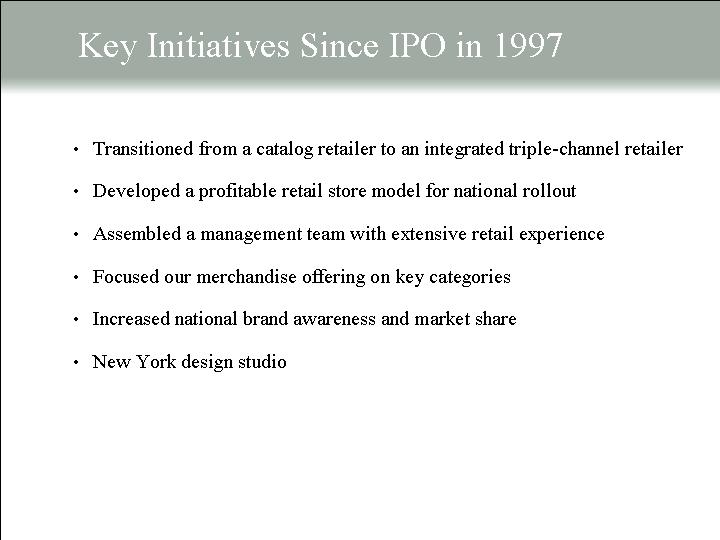
Key Initiatives Since IPO in 1997
• | Transitioned from a catalog retailer to an integrated triple-channel retailer |
| |
• | Developed a profitable retail store model for national rollout |
| |
• | Assembled a management team with extensive retail experience |
| |
• | Focused our merchandise offering on key categories |
| |
• | Increased national brand awareness and market share |
| |
• | New York design studio |
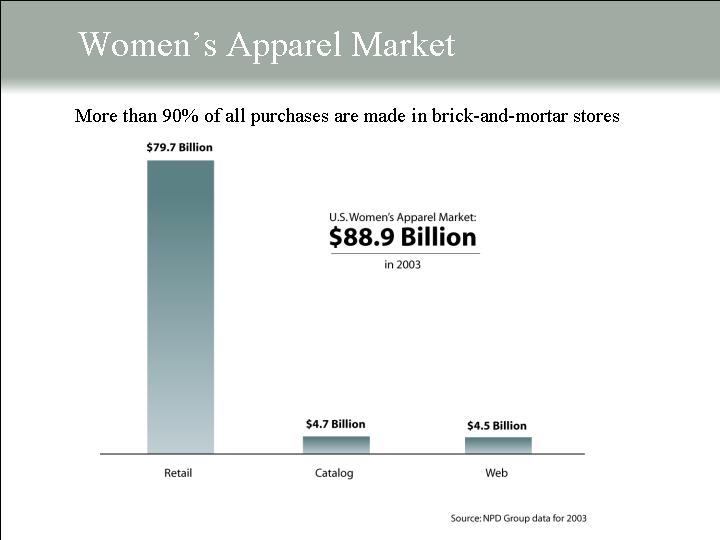
Women’s Apparel Market
More than 90% of all purchases are made in brick-and-mortar stores
U.S. Women’s Apparel Market: $88.9 Billion in 2003
[CHART]
Source: NPD Group data for 2003
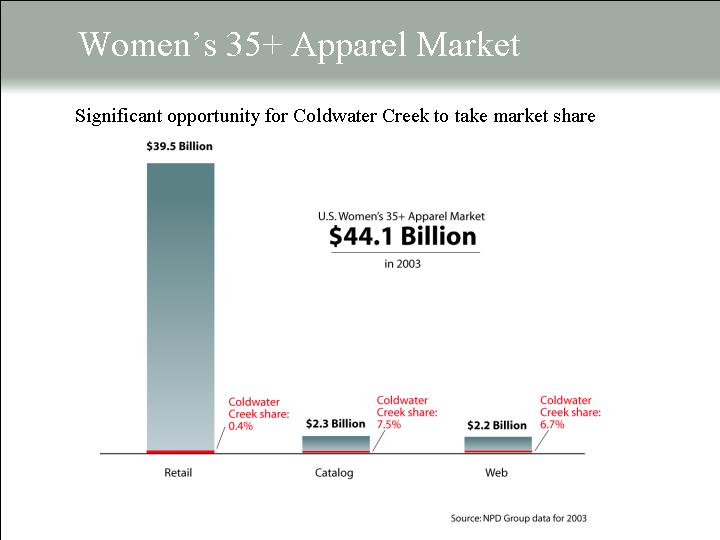
Women’s 35+ Apparel Market
Significant opportunity for Coldwater Creek to take market share
U.S. Women’s 35+ Apparel Market $44.1 Billion in 2003
[CHART]
Source: NPD Group data for 2003
Women’s 35+ Apparel Market
Significant opportunity for Coldwater Creek to take market share
U.S. Women’s 35+ Apparel Market $44.1 Billion in 2003
[CHART]
Source: NPD Group data for 2003
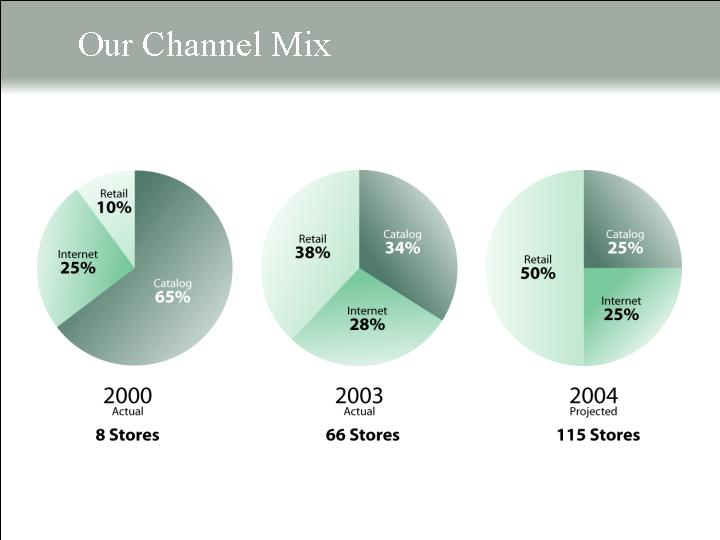
Our Channel Mix
[CHART] | | [CHART] | | [CHART] |
| | | | |
2000 | | 2003 | | 2004 |
Actual | | Actual | | Projected |
| | | | |
8 Stores | | 66 Stores | | 115 Stores |
[GRAPHIC]
Merchandising Overview
[GRAPHIC]
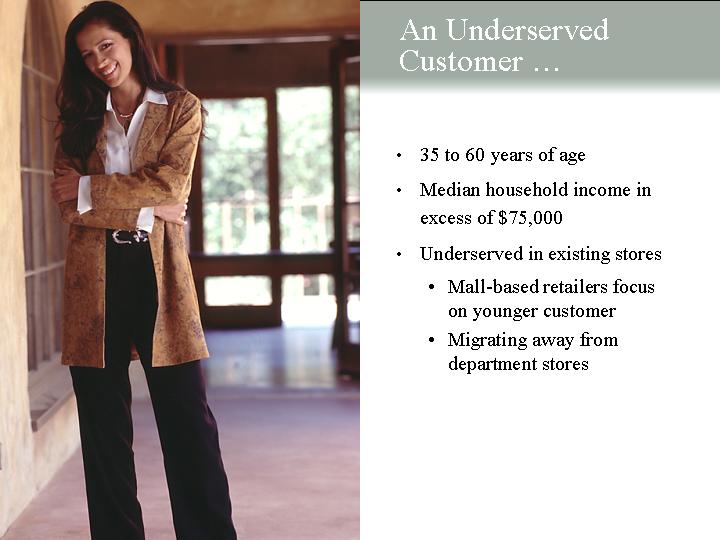
An Underserved Customer . . . |
| |
• | 35 to 60 years of age |
| |
• | Median household income in excess of $75,000 |
| |
• | Underserved in existing stores |
| |
| • | Mall-based retailers focus on younger customer |
| |
| • | Migrating away from department stores |
| | | |
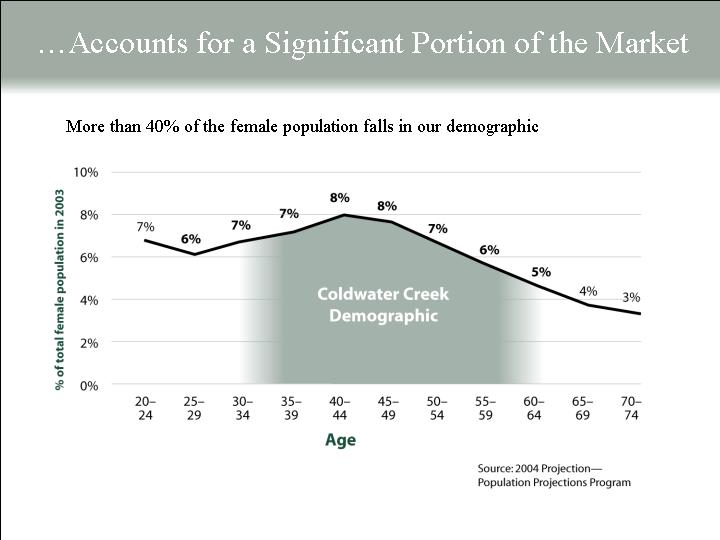
. . . Accounts for a Significant Portion of the Market
More than 40% of the female population falls in our demographic
[CHART]
| Source: 2004 Projection—
Population Projections Program |
[GRAPHIC]
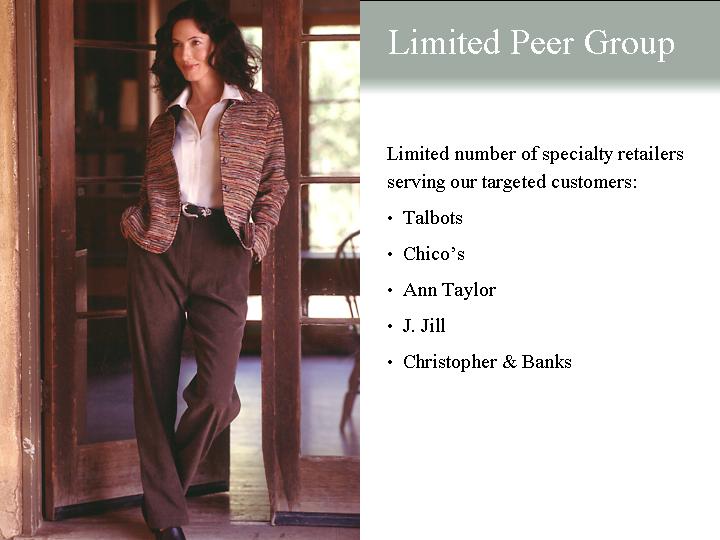
Limited Peer Group | |
| |
Limited number of specialty retailers serving our targeted customers: |
|
• | Talbots |
|
• | Chico’s |
|
• | Ann Taylor |
|
• | J. Jill |
|
• | Christopher & Banks |
| | | |
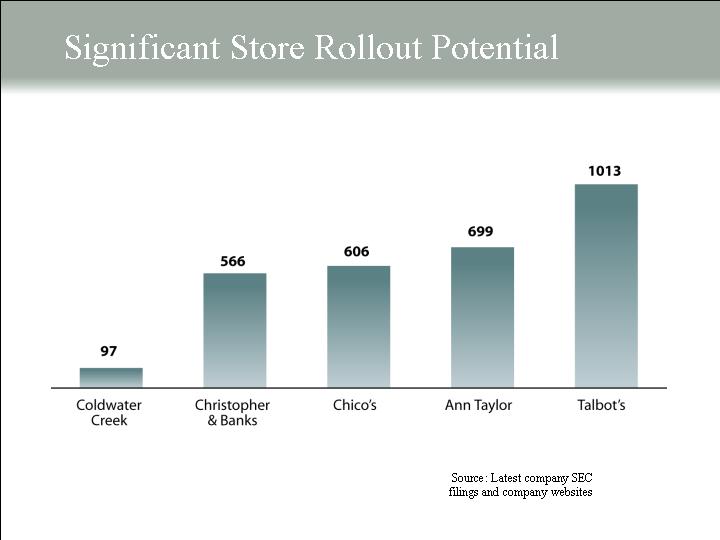
Significant Store Rollout Potential
[CHART]
| Source: Latest company SEC
filings and company websites |
[GRAPHIC]
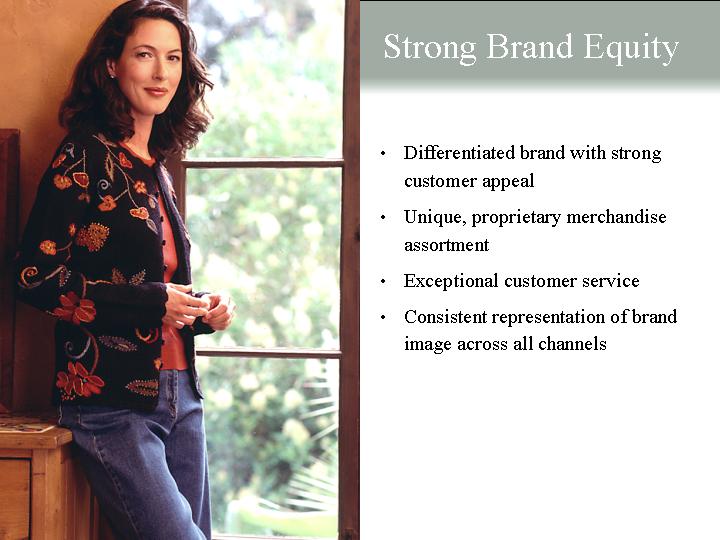
Strong Brand Equity |
| |
• | Differentiated brand with strong customer appeal |
| |
• | Unique, proprietary merchandise assortment |
| |
• | Exceptional customer service |
| |
• | Consistent representation of brand image across all channels |
[GRAPHIC]
Differentiated Merchandise |
| |
• | Colorful and unique proprietary designs that address different aspects of our customer’s lifestyle |
| • Casual weekend wear |
| • Soft career wear |
| • Special occasion |
| • Casual sport apparel |
| |
• | Current but not trendy |
| |
• | Buy now, wear now |
| • Seasonally appropriate |
| • Versatile year-round fabrics |
Integrated Tri-Channel Model
[GRAPHIC]
• | Consistent pricing |
| |
• | Integrated merchandise |
| |
• | Returns across any channel |
| |
• | Store locator on web |
| |
• | Web kiosks in stores |
| |
• | Merchandise assortment tailored specifically for retail stores |
[GRAPHIC]
Retail Growth Opportunities
[GRAPHIC]
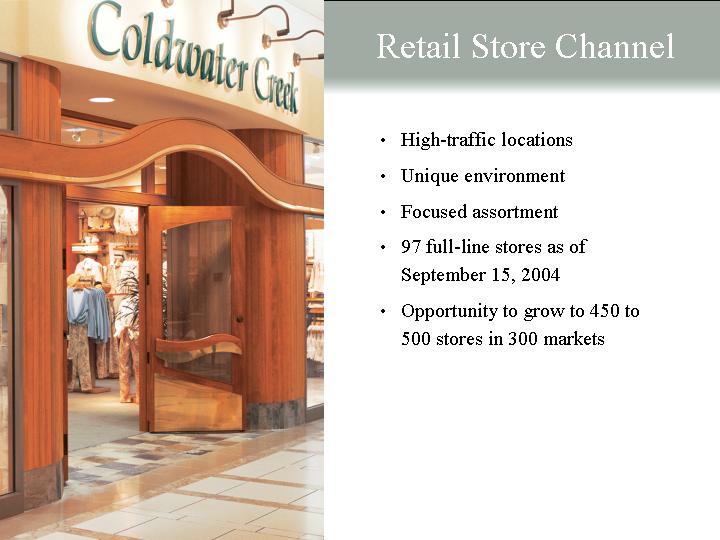
Retail Store Channel |
| |
• | High-traffic locations |
| |
• | Unique environment |
| |
• | Focused assortment |
| |
• | 97 full-line stores as of September 15, 2004 |
| |
• | Opportunity to grow to 450 to 500 stores in 300 markets |
Expanding National Presence
8 full-line stores at the end of fiscal 2000
[GRAPHIC]
Expanding National Presence
27 full-line stores at the end of fiscal 2001
[GRAPHIC]
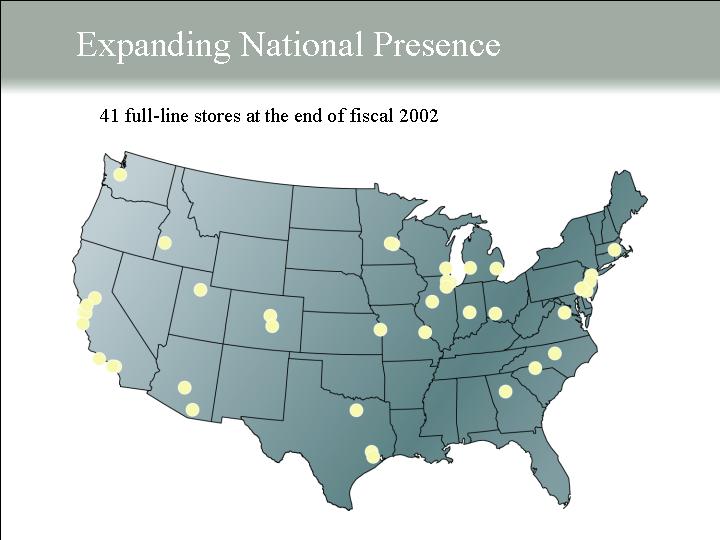
Expanding National Presence
41 full-line stores at the end of fiscal 2002
[GRAPHIC]
Expanding National Presence
66 full-line stores at the end of fiscal 2003
[GRAPHIC]
Expanding National Presence
115 full-line stores planned at the end of fiscal 2004
[GRAPHIC]
Store Economics
| | 5,500 sq. ft. model | | 3,500 sq. ft. model | |
| | | | | |
Annual sales | | $ | 2.78 million | | $ | 2.1 million | |
| | | | | |
Projected 4-wall contribution% | | 22.64 | % | 27.80 | % |
| | | | | |
Net build-out | | $ | 341,000 | | $ | 245,000 | |
| | | | | |
Inventory | | $ | 220,000 | | $ | 154,000 | |
| | | | | |
Total investment | | $ | 561,000 | | $ | 399,000 | |
| | | | | |
Projected payback (months)* | | 11 | | 8 | |
[GRAPHIC]
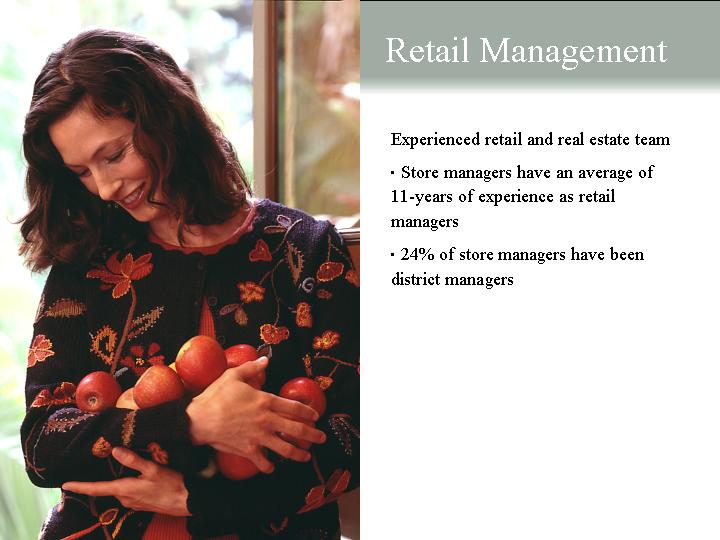
Retail Management |
|
Experienced retail and real estate team |
|
• Store managers have an average of 11-years of experience as retail managers |
|
• 24% of store managers have been district managers |
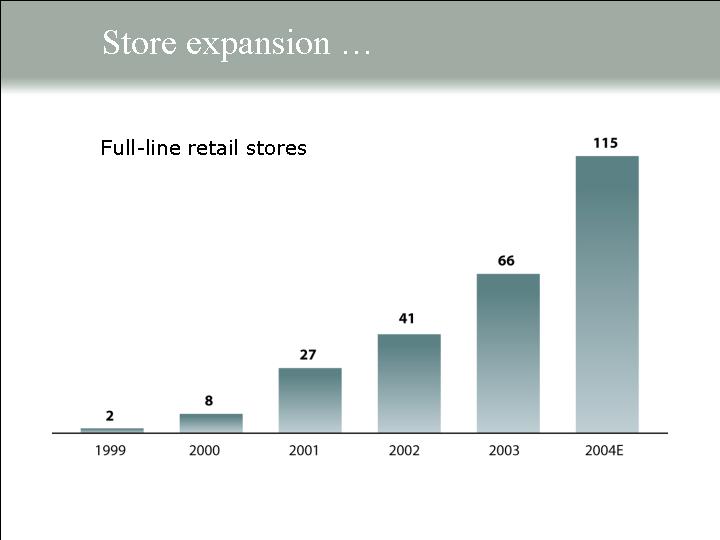
Store expansion .. . .
Full-line retail stores
[CHART]
. . . results in retail store sales growth
$ in millions
[CHART]
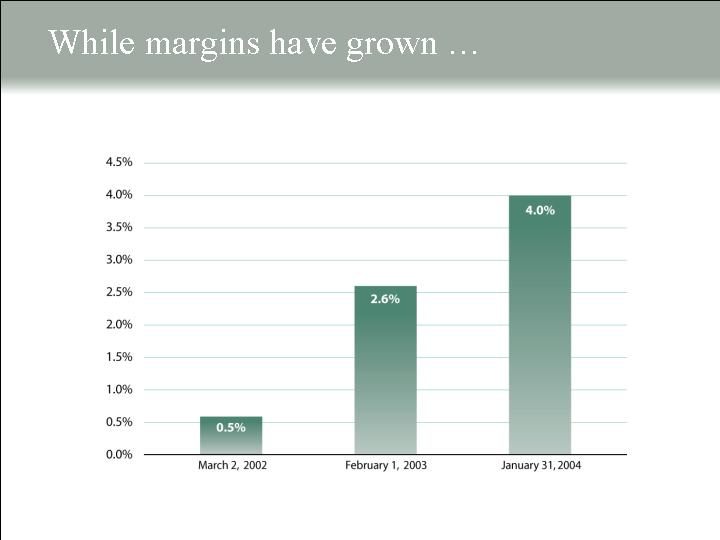
While margins have grown . . .
[CHART]
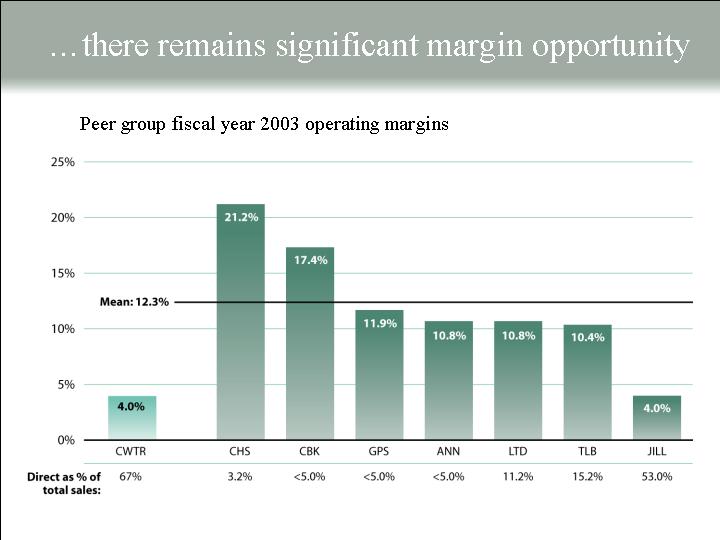
. . . there remains significant margin opportunity
Peer group fiscal year 2003 operating margins
[CHART]
[GRAPHIC]
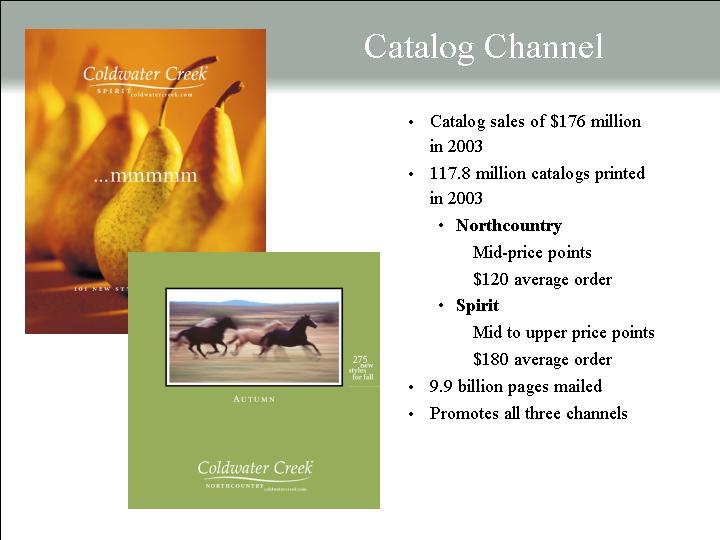
Catalog Channel
• | Catalog sales of $176 million in 2003 |
• | 117.8 million catalogs printed in 2003 |
| • | Northcountry |
| | | Mid-price points |
| | | $120 average order |
| • | Spirit |
| | | Mid to upper price points $180 average order |
• | 9.9 billion pages mailed |
• | Promotes all three channels |
[GRAPHIC]
Internet Channel |
| |
• | Internet sales of $148 million in 2003 |
| |
• | 2.0 million e-mail addresses |
| |
• | Offers entire merchandise assortment |
| |
• | Represents more than 1/2 of our Direct sales |
| |
• | Cost-efficient clearance medium |
[GRAPHIC]
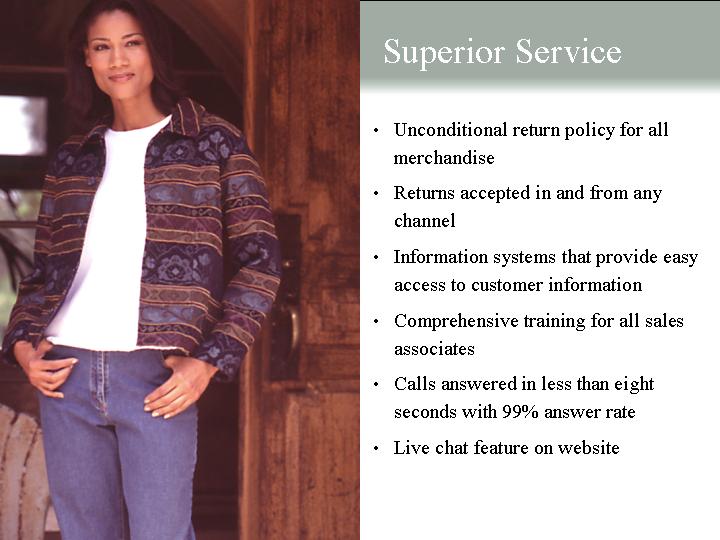
Superior Service |
| |
• | Unconditional return policy for all merchandise |
| |
• | Returns accepted in and from any channel |
| |
• | Information systems that provide easy access to customer information |
| |
• | Comprehensive training for all sales associates |
| |
• | Calls answered in less than eight seconds with 99% answer rate |
| |
• | Live chat feature on website |
[GRAPHIC]
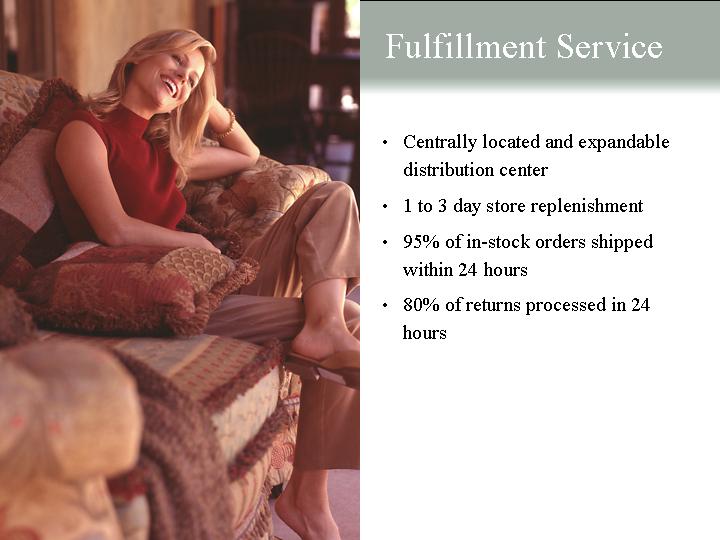
Fulfillment Service |
| |
• | Centrally located and expandable distribution center |
| |
• | 1 to 3 day store replenishment |
| |
• | 95% of in-stock orders shipped within 24 hours |
| |
• | 80% of returns processed in 24 hours |
[GRAPHIC]
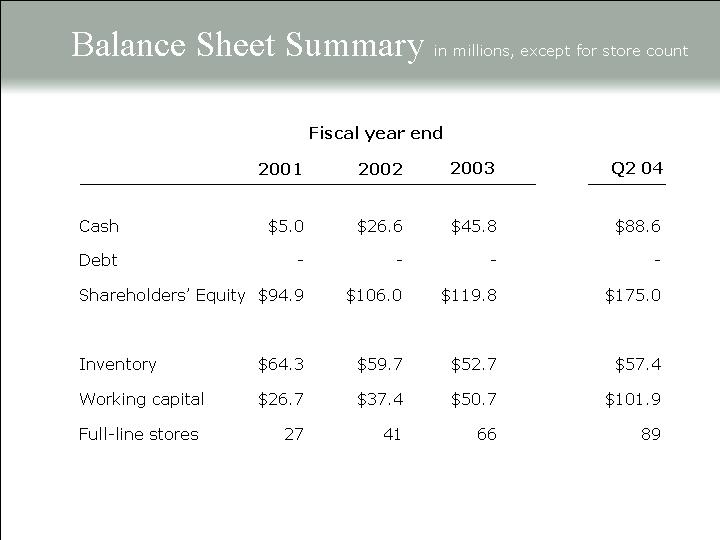
Financial Highlights
Balance Sheet Summary in millions, except for store count
| | Fiscal year end | | | |
| | 2001 | | 2002 | | 2003 | | Q2 04 | |
| | | | | | | | | |
Cash | | $ | 5.0 | | $ | 26.6 | | $ | 45.8 | | $ | 88.6 | |
Debt | | — | | — | | — | | — | |
Shareholders’ Equity | | $ | 94.9 | | $ | 106.0 | | $ | 119.8 | | $ | 175.0 | |
| | | | | | | | | |
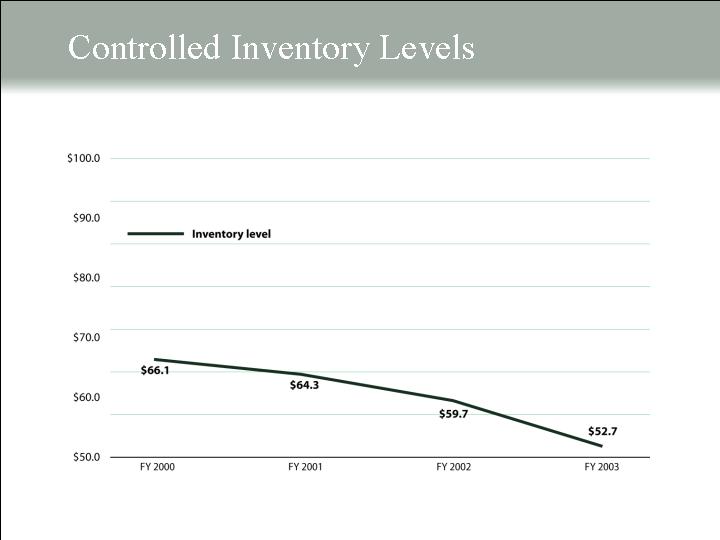
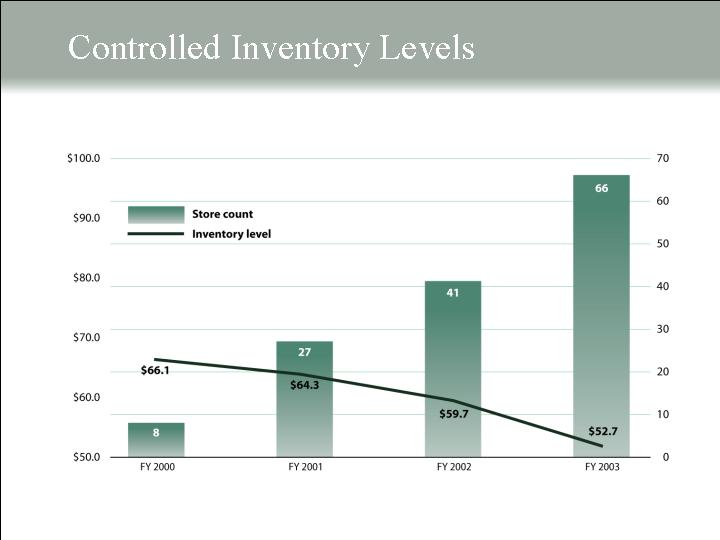
Inventory | | $ | 64.3 | | $ | 59.7 | | $ | 52.7 | | $ | 57.4 | |
Working capital | | $ | 26.7 | | $ | 37.4 | | $ | 50.7 | | $ | 101.9 | |
Full-line stores | | 27 | | 41 | | 66 | | 89 | |
Controlled Inventory Levels
[CHART]
Controlled Inventory Levels
[CHART]
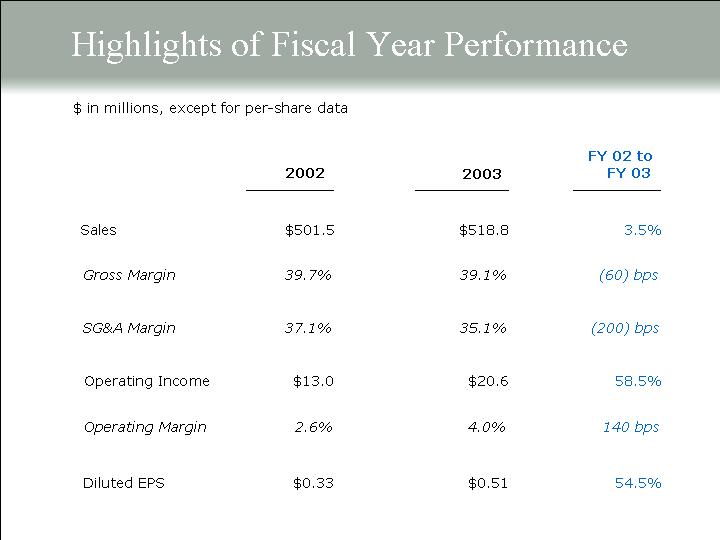
Highlights of Fiscal Year Performance
$ in millions, except for per-share data
| | 2002 | | 2003 | | FY 02 to
FY 03 | |
| | | | | | | |
Sales | | $ | 501.5 | | $ | 518.8 | | 3.5 | % |
| | | | | | | |
Gross Margin | | 39.7 | % | 39.1 | % | (60 | )bps |
| | | | | | | |
SG&A Margin | | 37.1 | % | 35.1 | % | (200 | )bps |
| | | | | | | |
Operating Income | | $ | 13.0 | | $ | 20.6 | | 58.5 | % |
| | | | | | | |
Operating Margin | | 2.6 | % | 4.0 | % | 140 | bps |
| | | | | | | |
Diluted EPS | | $ | 0.33 | | $ | 0.51 | | 54.5 | % |
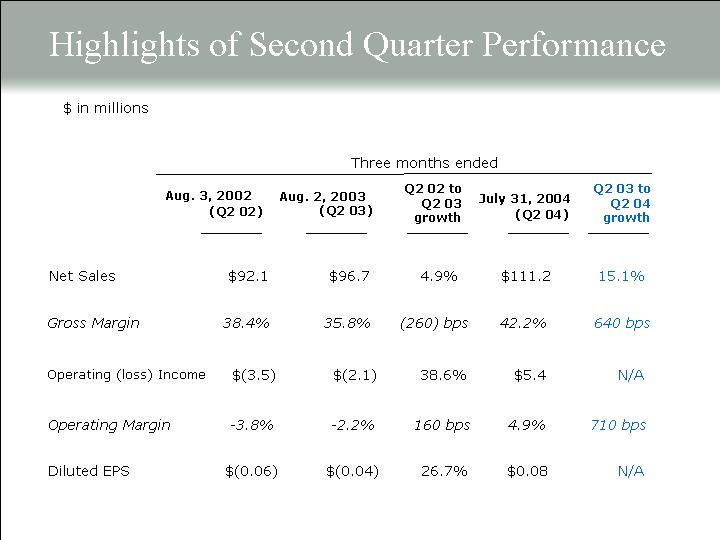
Highlights of Second Quarter Performance
$ in millions
| | Three months ended | |
| | Aug. 3, 2002
(Q2 02) | | Aug. 2, 2003
(Q2 03) | | Q2 02 to
Q2 03
growth | | July 31, 2004
(Q2 04) | | Q2 03 to
Q2 04
growth | |
| | | | | | | | | | | |
Net Sales | | $ | 92.1 | | $ | 96.7 | | 4.9 | % | $ | 111.2 | | 15.1 | % |
| | | | | | | | | | | |
Gross Margin | | 38.4 | % | 35.8 | % | (260 | )bps | 42.2 | % | 640 | bps |
| | | | | | | | | | | |
Operating (loss) Income | | $ | (3.5 | ) | $ | (2.1 | ) | 38.6 | % | $ | 5.4 | | N/A | |
| | | | | | | | | | | |
Operating Margin | | -3.8 | % | -2.2 | % | 160 | bps | 4.9 | % | 710 | bps |
| | | | | | | | | | | |
Diluted EPS | | $ | (0.06 | ) | $ | (0.04 | ) | 26.7 | % | $ | 0.08 | | N/A | |
Highlights of First 6 Months Performance
$ in millions
| | Six months ended | |
| | Aug. 3, 2002
(1H) | | Aug. 2, 2003
(1H) | | 1H 02 to
1H 03
growth | | July 31, 2004
(1H) | | 1H 03 to
1H 04
growth | |
| | | | | | | | | | | |
Net Sales | | $ | 198.4 | | $ | 211.9 | | 6.8 | % | $ | 235.7 | | 11.2 | % |
| | | | | | | | | | | |
Gross Margin | | 40.5 | % | 37.7 | % | (280 | )bps | 43.0 | % | 530 | bps |
| | | | | | | | | | | |
Operating (loss) Income | | $ | (1.1 | ) | $ | 0.9 | | N/A | | $ | 14.4 | | 1,471.8 | % |
| | | | | | | | | | | |
Operating Margin | | -0.5 | % | 0.4 | % | 90 | bps | 6.1 | % | 570 | bps |
| | | | | | | | | | | |
Diluted EPS | | $ | (0.02 | ) | $ | 0.01 | | N/A | | $ | 0.23 | | 2,200.0 | % |
Investment Summary |
| |
• | Target a highly desirable, underserved customer |
| |
• | Established brand equity with consistent image |
| |
• | Highly successful merchandising strategy |
| |
• | Significant store growth potential |
| |
• | Top-line growth and operating margin opportunity to support continued earnings growth |
| |
• | Execute with an experienced management team |
[GRAPHIC]
Thank You