Goldman Sachs Conference
May 21, 2003
William M.Landuyt
Chairman and Chief Executive Officer
Millennim Chemicals

Slide 1 - Logo
Thanks for that intro, and thank all of you for joining us.
In the time reserved for formal remarks, I'm going to try and cover:
- Our major businesses and the important industry dynamics around them; and
- Millennium’s overall strategic direction as we continue to push the concept of running our wholly owned businesses under an operational excellence model in what remain challenging times for the business of chemistry.

Slide 2 - Disclaimer
But before we start, our lawyers asked me to preface with our safe harbor legal statement: The statements made in this presentation relating to matters that are not historical facts are forward looking statements.
Our forward-looking statements are present expectations, and actual events and results may differ materially due to the impact of factors such as industry cyclicality, general economic conditions, production capacity, competitive products and prices and other risks and uncertainties detailed in the Company’s SEC filings. Please note we disclaim any obligation to update our forward-looking statements.
Slide 3 – Strategic Priorities
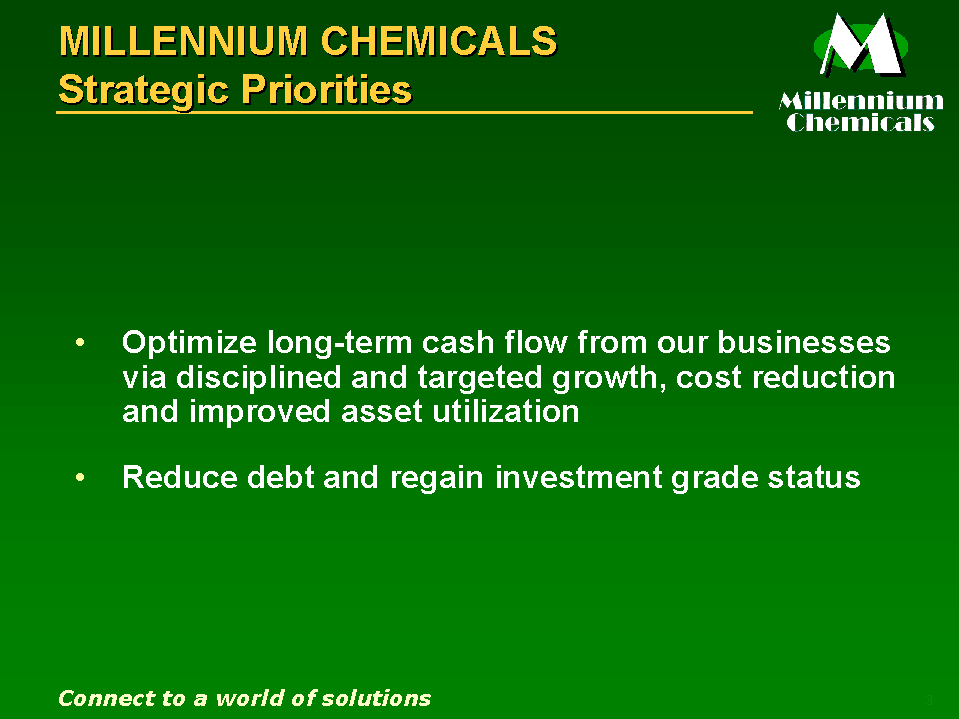
I’ll begin by reminding you what our top priority is: Optimize long-term cash flow from our businesses and our investment in Equistar, so as to reduce leverage and return to investment grade credit status.
Our activities over the past 18 months or so have been directed to the achievement of disciplined and targeted growth, cost reduction and improved asset utilization.
Slide 4 – Revenue
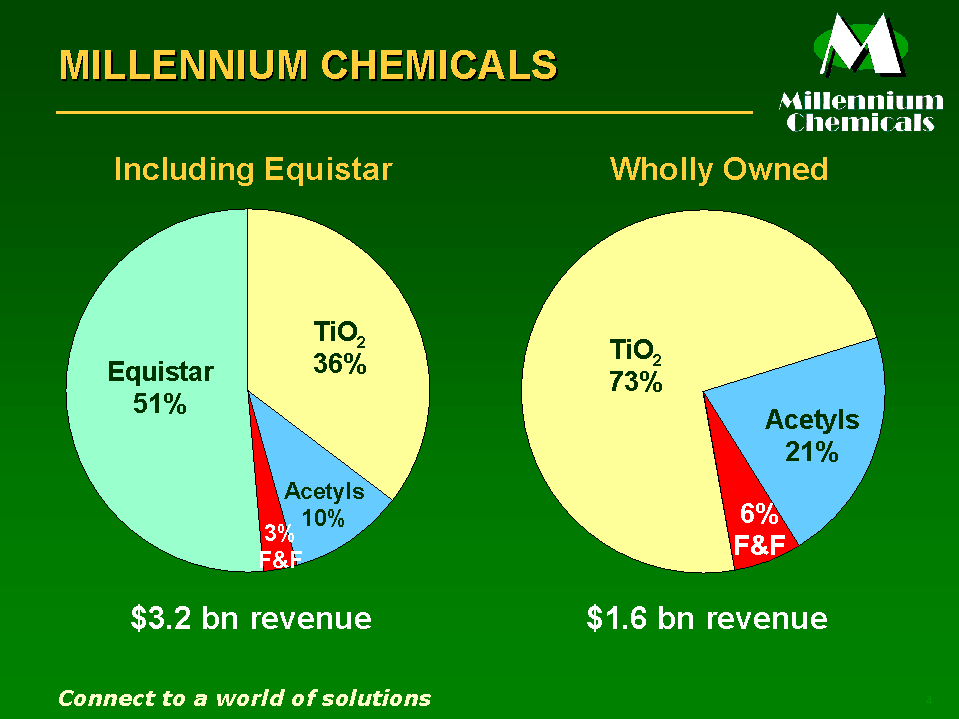
Just as background, Millennium Chemicals is a $3.2 billion business when our 29.5 percent ownership of Equistar is included along with our wholly owned businesses. The three wholly owned businesses comprise approximately half of our company’s pro forma revenue.

Slide 5 – Product Portfolio
We are the world’s second-largest producer of titanium dioxide, or TiO2 based on reported production capacities, behind DuPont. TiO2 is a white pigment used to impart whiteness, brightness and opacity in a wide range of products, including coatings and paints, plastics, paper and rubber.
Specialty non-pigmentary grades of TiO2 are produced and sold by us for their physicochemical characteristics. For example, ultra-fine TiO2 is used to remove nitrous oxide from power plants and sulfur from diesel engine exhaust.
Millennium is also the 3rd largest producer of acetyls in the world and the 2nd largest in North America. This segment generated $60 million of cash earnings or EBITDA for the LTM ending 3/31/01. Its principal products are vinyl acetate monomer and acetic acid used in a variety of adhesive, paint, coatings, and polymer products.
Our Flavors and Fragrances business converts crude sulfate turpentine and other raw materials into abroad array of products for the food and perfume industries to affect taste and smell.
Slide 6 - Financial Performance
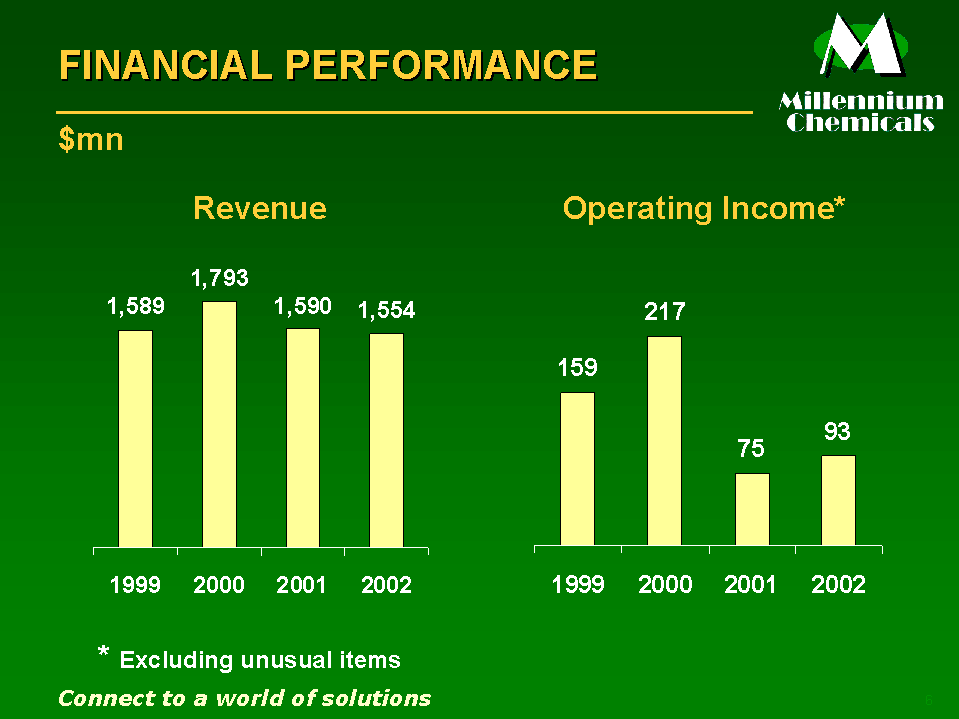
A whole lot of people who have worked in or observed the business of chemistry for a lot longer than me have described the last two years as, “The worst for the chemical industry in over two decades.” Our results reflect these difficult times.
But I’d like to describe how the women and men of Millennium have responded to those conditions as well as give you some feel for why we believe 2003 is shaping up as a better year for our Company.
Slide 7 – S D&A Costs
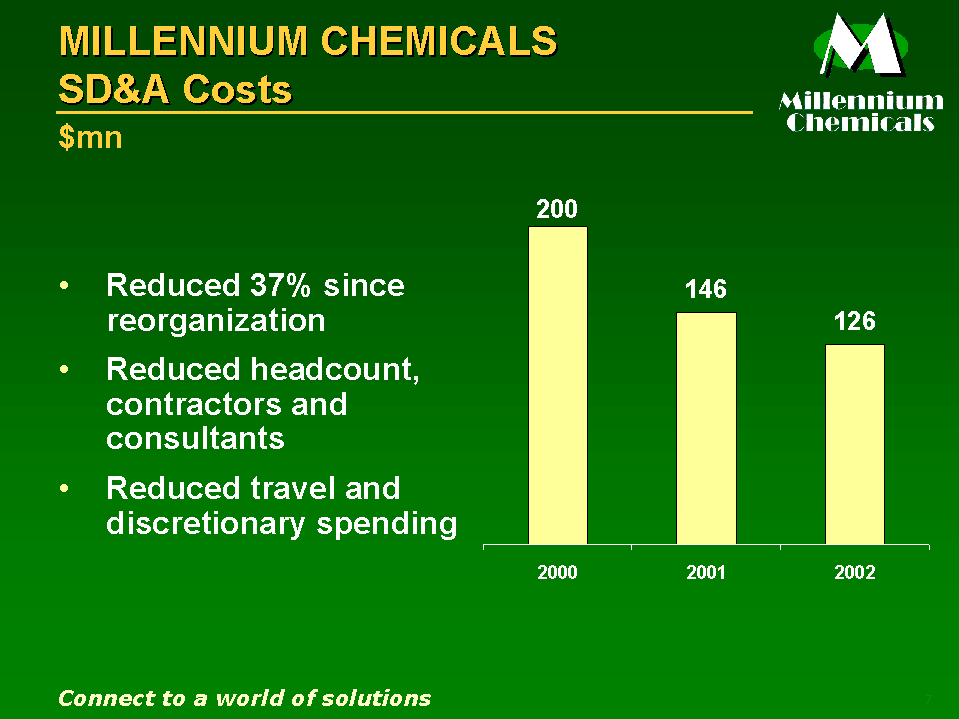
We’ve reduced our overheads by about $74 million from where we were in 2000. Increased pension expense and health care costs will present a challenge for this year, but our focus on efficiency is now a permanent part of our culture.
Slide 8 – Staffing
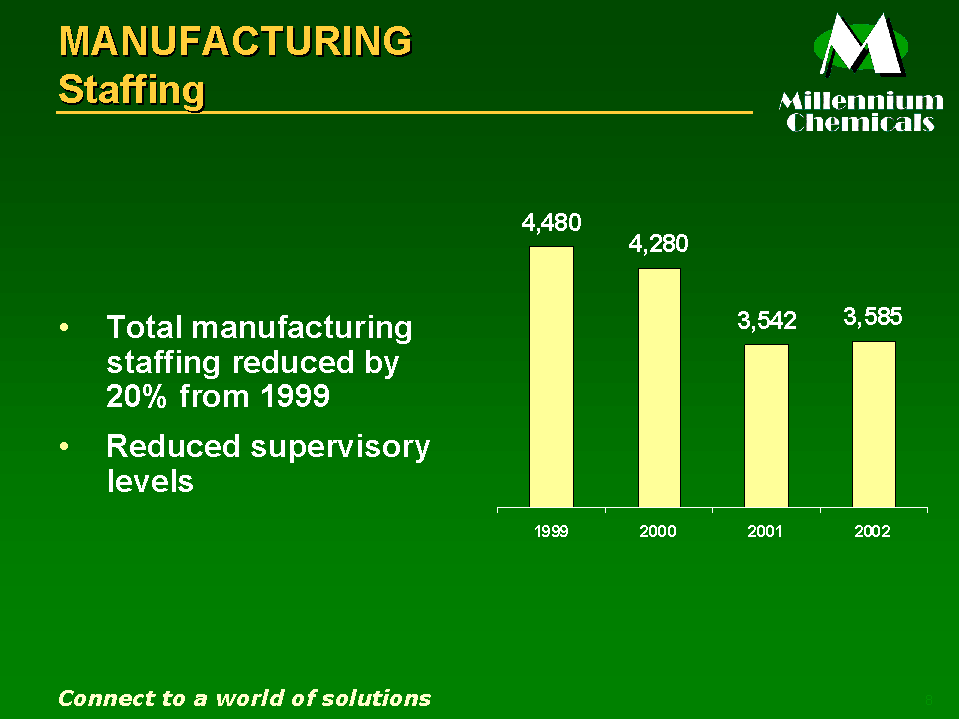
Manufacturing staffing, including full-time contractors has been reduced by 20% over the last three years and yet I’m proud to report that we set new records this year for quality and reliability. TiO2 production was the second highest in our history.
Productivity has been improved by reducing the number of organization levels and by implementing self-directed teams at our manufacturing sites.
Slide 9 – Capital
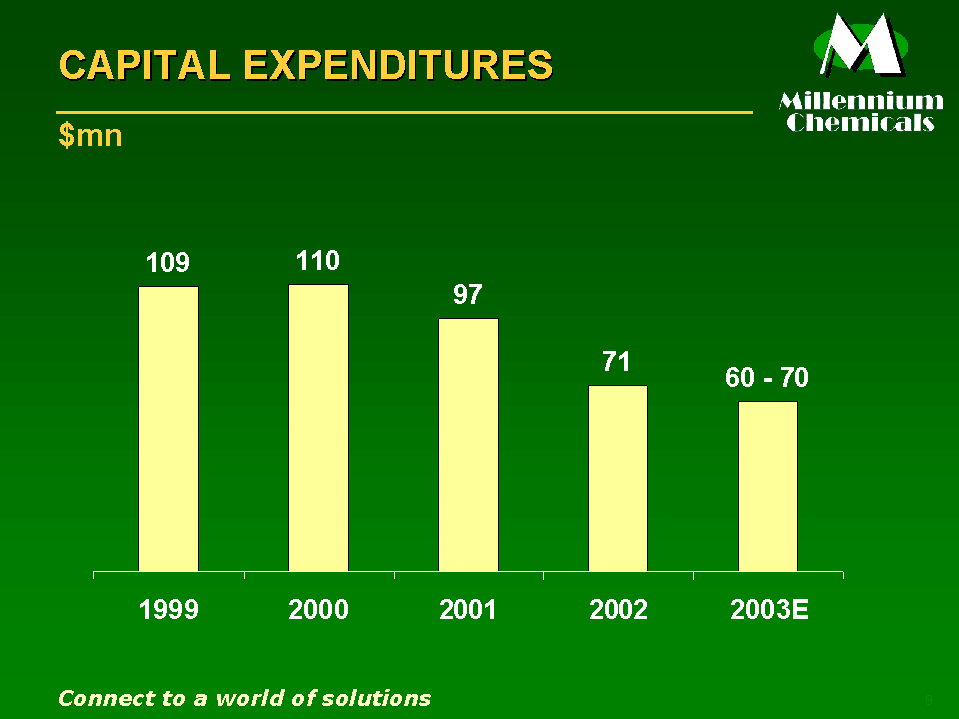
We have worked very hard in controlling capital expenditures without compromising safety and environmental issues and finished at a spending level of $71 million in 2002, quite a bit lower than our trailing three-year average at the beginning of 2002, which was more than $100 million. In 2003 we will continue to be very selective approving projects and expect spending to be in the range of $60-70 million this year.
Let's turn now back to our business segments, starting with Titanium Dioxide.
Slide 10 – 2002 Market Mix
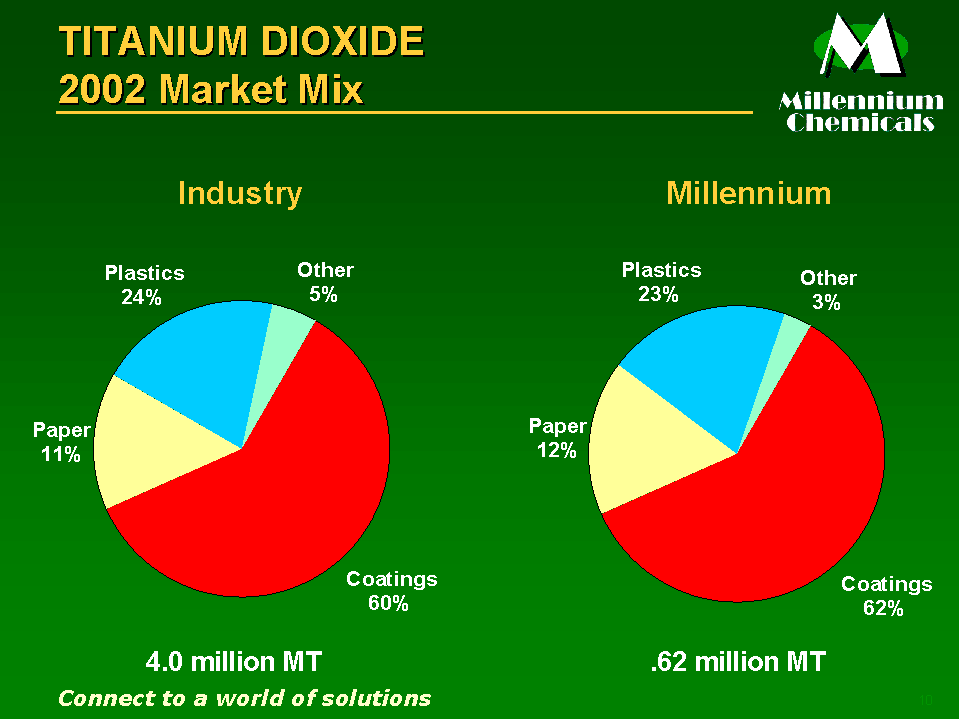
Looking at our customer base, Millennium’s market mix is similar to the industry as a whole. Our mix changed over the last two years as we de-emphasized the North American fine paper market in favor of more profitable coatings and plastics business.
Slide 11 – TiO2 Capacity & Market Share
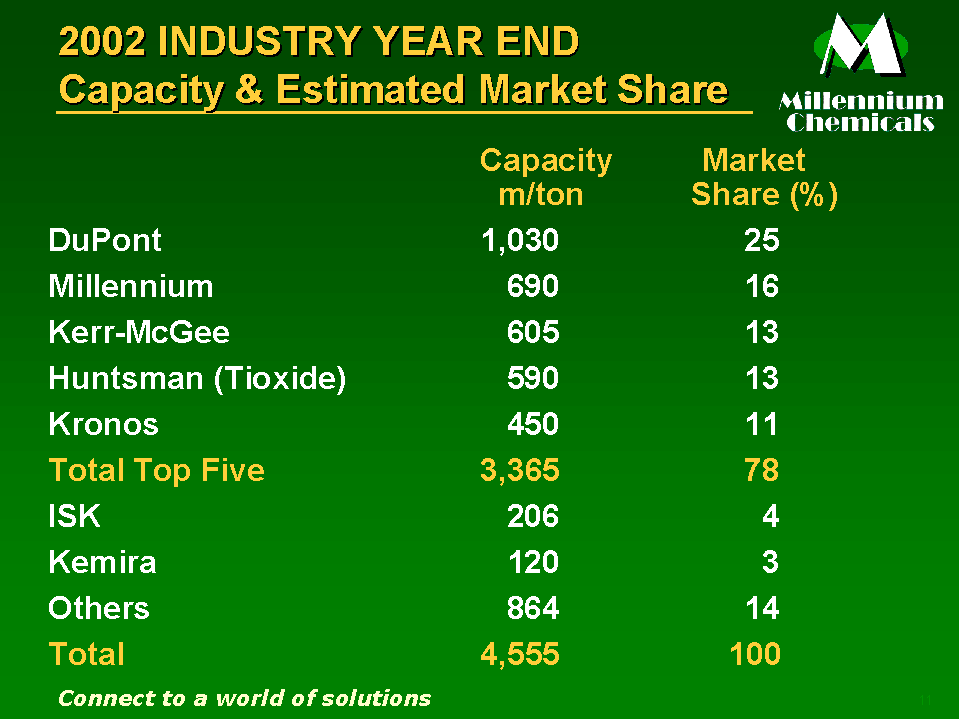
As I mentioned, we’re a solid number two globally. Our industry is certainly competitive, as we’ll see in a minute, but supply is concentrated with almost 80% of capacity in the hands of five global suppliers. Supply is not likely to increase much beyond minor debottleneckings which we estimate will increase capacity by less than one percent per year over the next planning period. This is driven by the very low profitability in the business and the need to improve margins before any significant new capacity capital can be justified.
Most capital will be directed to improving results from existing facilities for such things as better reliability, improving yields, and meeting higher environmental requirements.
Slide 12 – Demand and Supply – TiO2
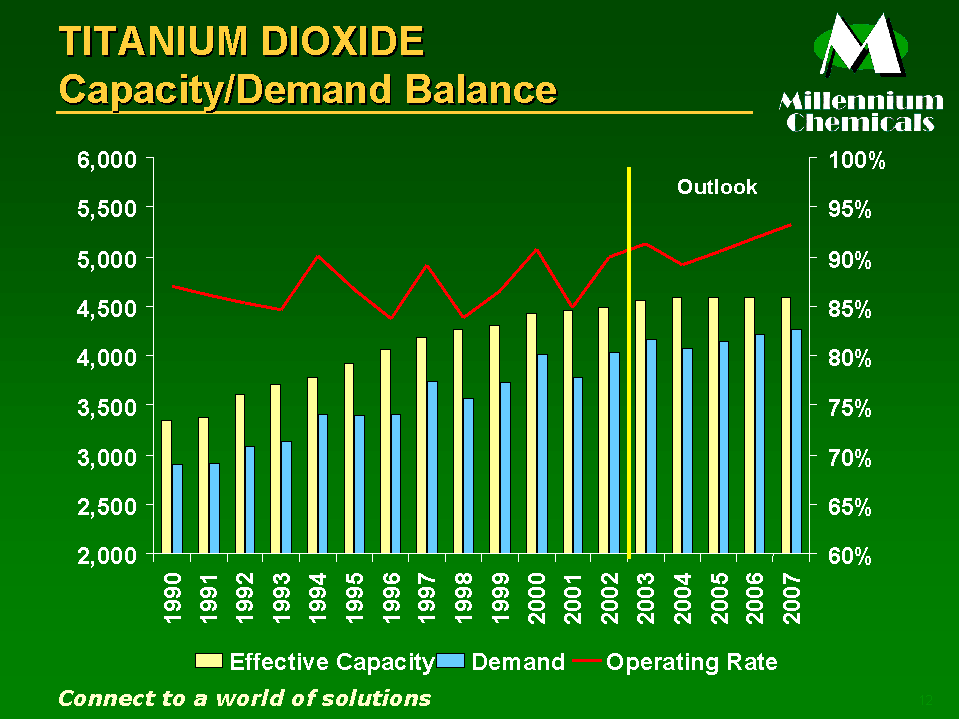
With that as a background, forecasts show a rise to nominal operating rates of 94% by 2007 from about 90% in 2001. We forecast demand growth for bulk TiO2to average 1.8% annually through 2005, with supply growing at about one-half of 1% annually on average over that period.
Operating rates where we are today have proven to be consistent with pricing power for producers, especially coming off of historically low price points similar to those we saw in the first quarter of 2002. Longer term we like the trend shown here, and since the lead time on significant new capacity is a minimum of three years, we’re fairly confident in the supply side of the graph.
Slide 13 – Global Operating Rate
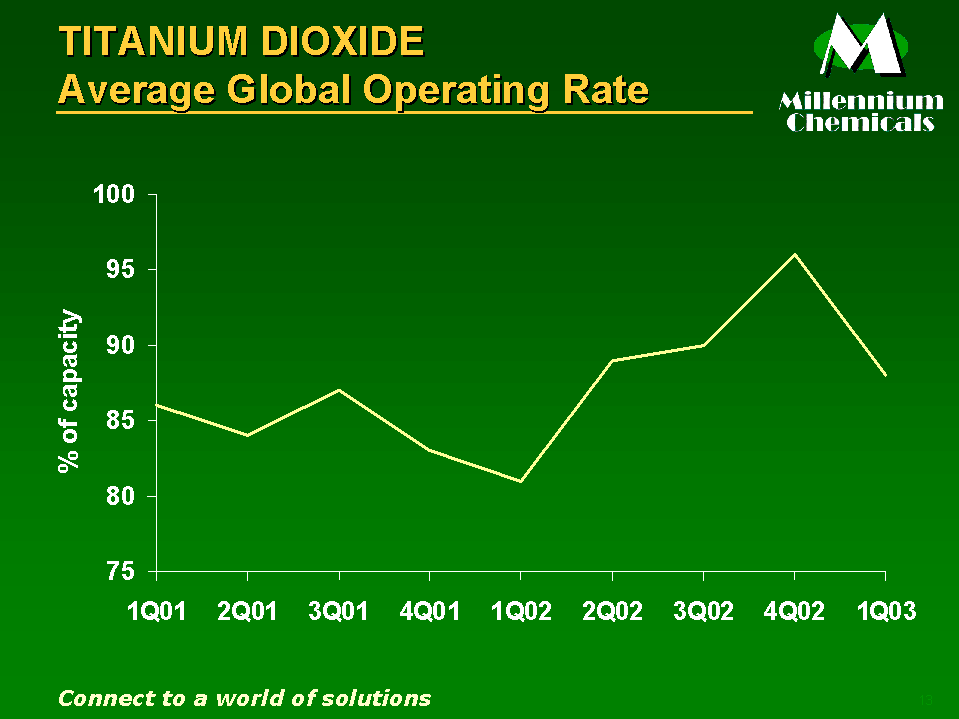
In fact, TiO2 operating rates have been improving both industry-wide and for Millennium specifically, although we had some unscheduled maintenance downtime which affected our first quarter.
As we discussed earlier, with demand increases expected to outstrip very limited capacity additions for the industry as a whole, again, we enter 2003 very favorably positioned, especially when compared to a year ago.
Slide 14 – TiO2 Global Price Trend
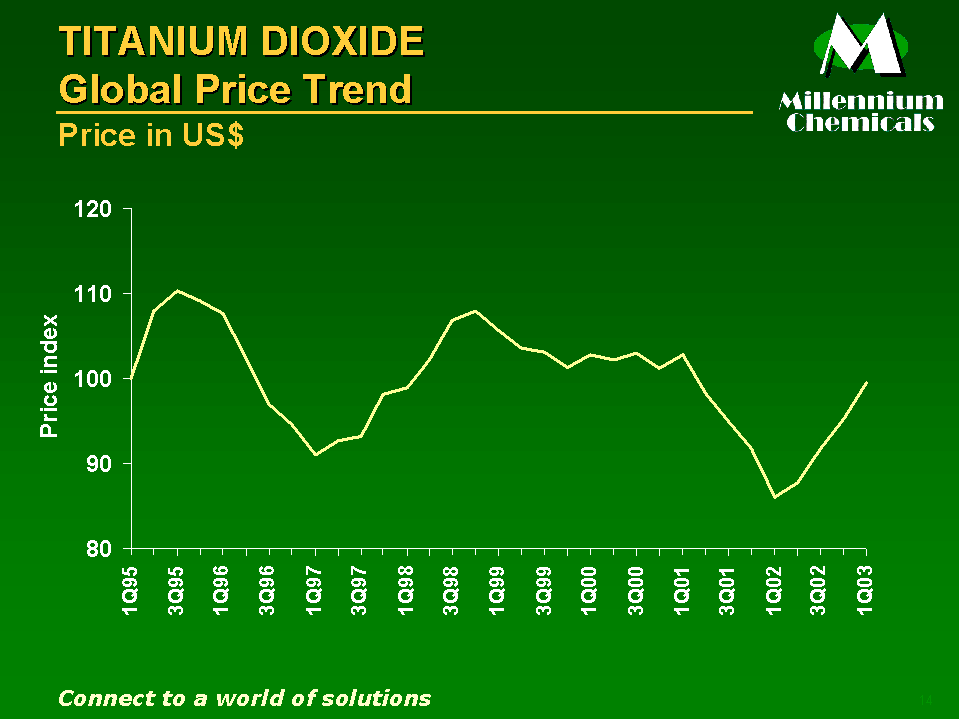
This slide puts TiO2pricing into historical perspective. You can see here that TiO2cycles about 10% around normalized nominal pricing levels. While we went into a steeper drop than that through the first quarter of 2002, there has been pretty steady progress back to historical averages since then, with further price increases on the table
Slide 15 – TiO2 Outlook
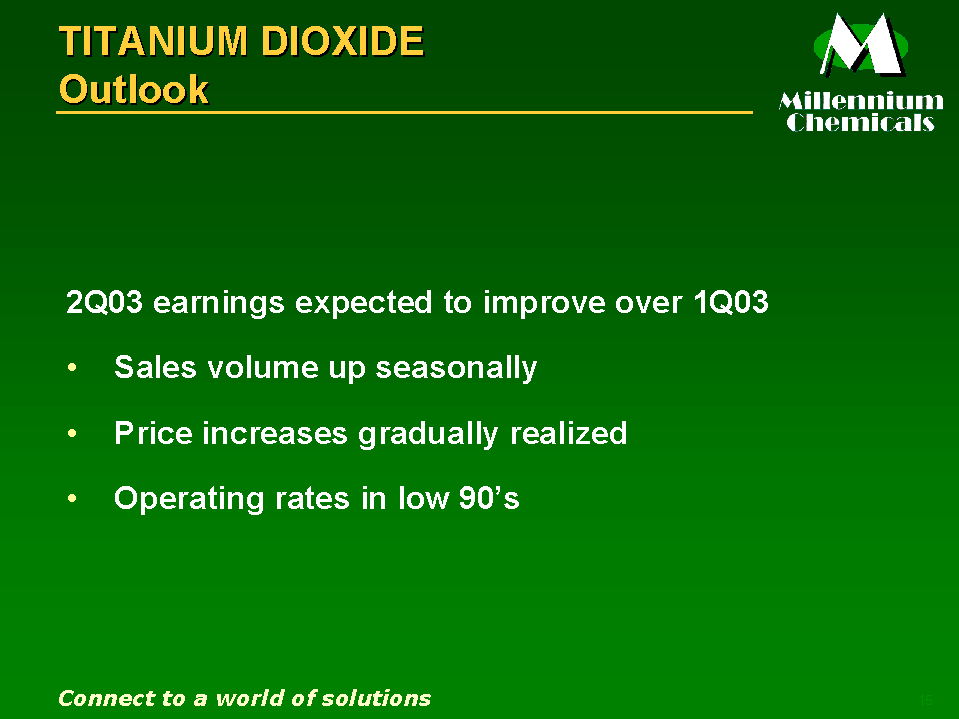
Earnings are expected to improve in the second quarter of 2003 over the first quarter as sales volume should increase seasonally due to the North American and European coatings season and global TiO2price increases should continue to be gradually realized. Operating rates should remain in the low 90s.
Slide 16 – VAM Supply and Demand
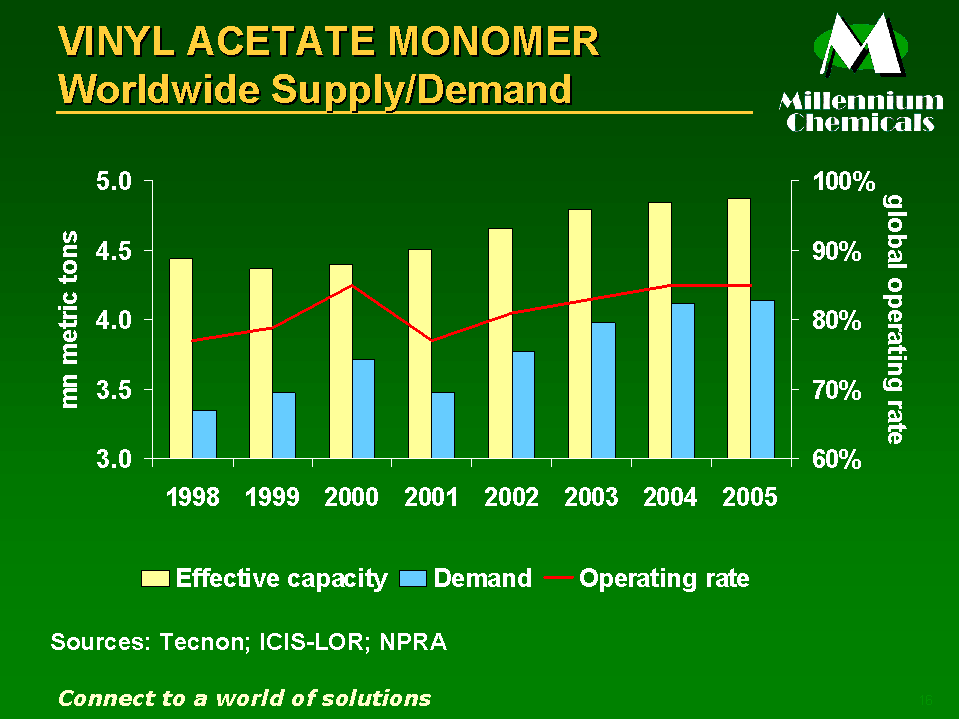
Our second-largest wholly owned business is acetyls. We produce about 225 million gallons of methanol with our 15% partner, Linde, in La Porte Texas. We use a little over one-third of that to produce acetic acid and merchant the rest. Of our 545,000 metric tons of acid, we use about two-thirds of that internally and under a toll arrangement with DuPont to make about 385,000 metric tons of Vinyl Acetate Monomer.
As you can see on this slide, after absorbing significant capacity additions in 2001 and 2002 and the drop in demand that came with the manufacturing sector’s recession, operating rates have been rising and should support price initiatives on the back of rising natural gas raw material costs.
As a reference point, we made about $69 million of EBITDA in 2000, the last time operating rates were at roughly today’s levels.
Slide 17 – Acetyls Highlights
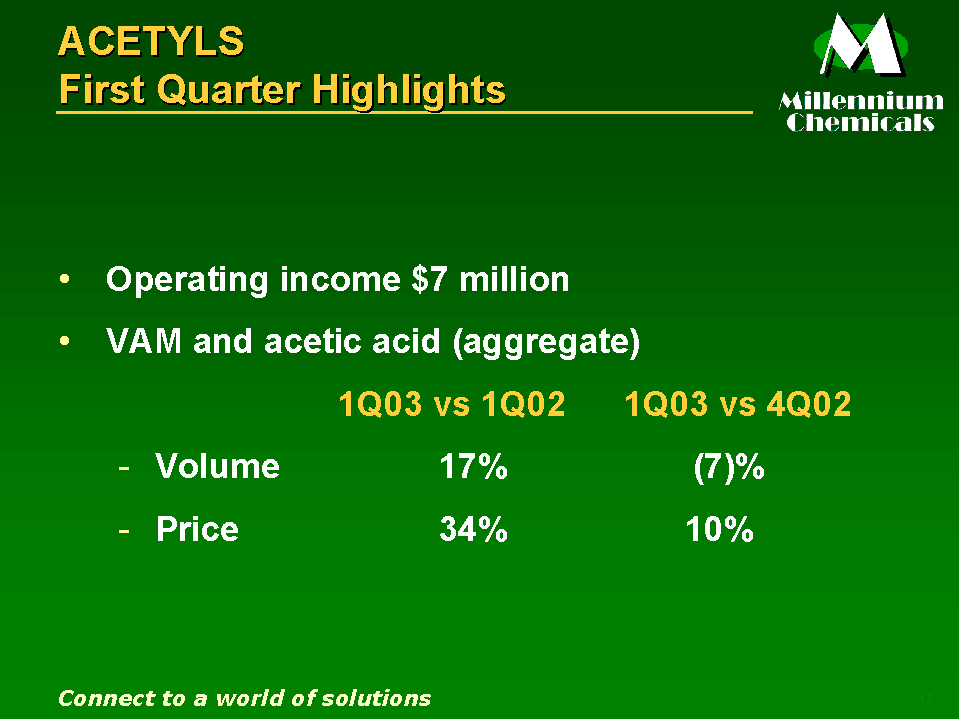
The Acetyls segment reported first quarter operating income of $7 million compared to a loss of $(7) million in the first quarter of 2002 and income of $9 million in the fourth quarter of 2002.
Natural gas and ethylene prices increased significantly in the first quarter of 2003 due to unseasonably cold weather in certain regions of the US and events in the Middle East.
The higher costs helped to support the previously announced price increases for acetyls products, but the price increases have not been sufficient to fully offset rising natural gas prices; accordingly, the profitability of the Acetyls business segment was adversely affected in the first quarter of 2003.
The average US dollar aggregate price for VAM and acetic acid in the first quarter of 2003 increased 34 percent compared to the first quarter of 2002 and 10 percent from the fourth quarter of 2002. Margins for the same periods of time have not similarly increased due to rising natural gas feedstock prices. Aggregate volumes for VAM and acetic acid in the first quarter of 2003 increased 17 percent from the first quarter of 2002 and decreased 7 percent from the fourth quarter of 2002.

Slide 18 – Acetyls Price Increases Announced
This chart shows the acetyls price increases announced in 2003. A majority of these increases have been implemented.
Slide 19 – Acetyls Outlook
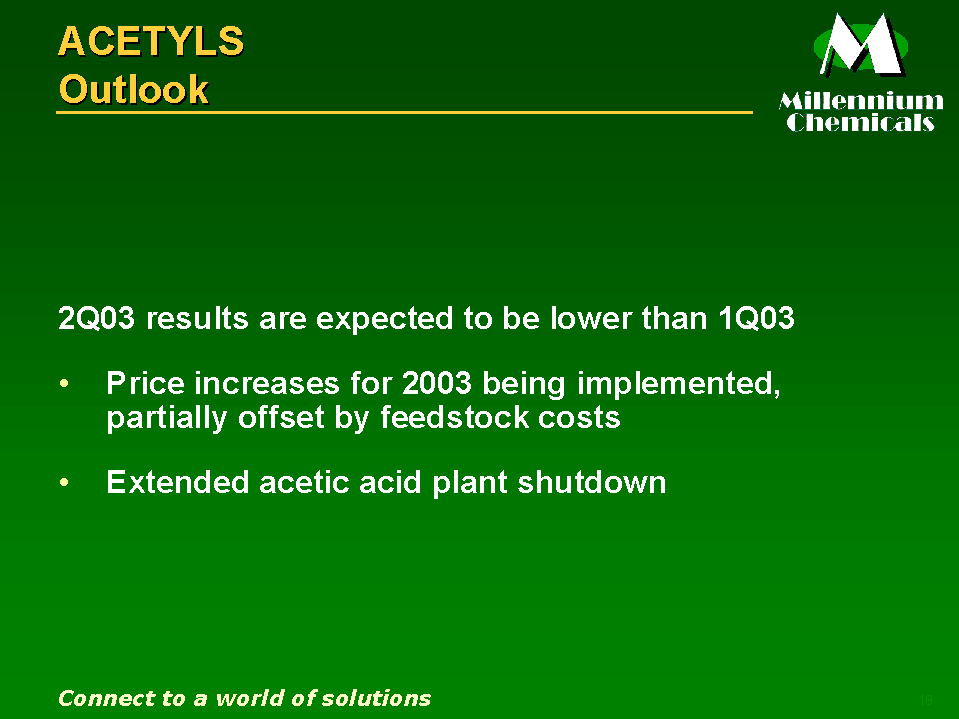
Acetyls profitability in the second quarter of 2003 is expected to be substantially lower than in the first quarter as anticipated lower natural gas feedstock costs are offset by the adverse effects of an extended acetic acid plant shutdown. That plant is now back up and running well.

Slide 20 – Specialty Highlights
The Specialty Chemicals segment reported first quarter operating income of $2 million compared to $4 million in the first quarter of 2002 and a loss of $(2) million in the fourth quarter of 2002. Sales volume increased 7 percent from the first quarter of 2002 and was up 13 percent from the fourth quarter of 2002. Average selling prices decreased less than 1 percent compared to the first quarter of 2002 and increased 8 percent from the fourth quarter of 2002.
Slide 21 – Specialty Outlook
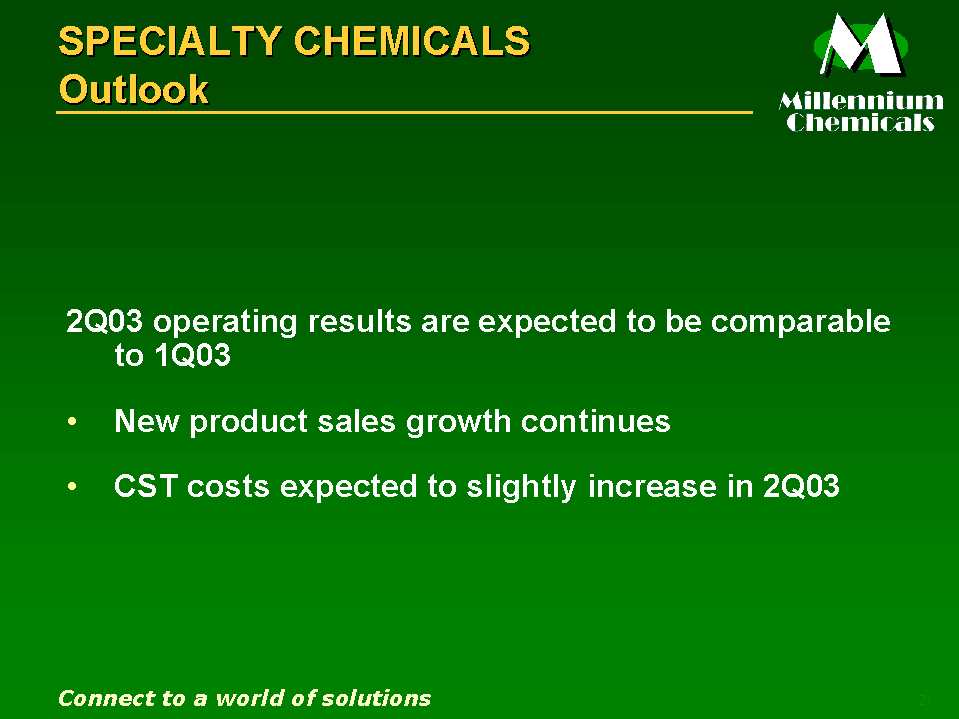
Earnings in the second quarter of 2003 are expected to be comparable to the first quarter of 2003. New product sales growth continues. CST raw material costs are expected to slightly increase in the second quarter.
Slide 22 – Equistar Highlights
Millennium’s 29.5 percent stake in Equistar generated a first quarter post-interest equity loss of $(41) million, excluding a loss on the sale of assets, compared to $(39) million of equity loss in the first quarter of last year and a $(35) million equity loss in the fourth quarter of 2002.
Rapidly escalating natural gas and crude oil prices in the first quarter of 2003 caused the cost of ethylene to increase dramatically from the fourth quarter of 2002. CMAI estimates that in the first quarter of 2003 the cost of ethylene production increased more than 5 cents per pound from the fourth quarter of 2002. While Equistar’s product sales price increases in ethylene, polyethylene and ethylene glycol more than equaled the higher ethylene costs, the timing of the price increases was such that the average product margin in the first quarter of 2003 was lower than the average fourth-quarter 2002 product margin.
Slide 23 – Equistar Outlook
While raw material and energy costs peaked in late February and early March, they have since moderated. This, together with increased prices in Equistar’s ethylene chain and co-products, has improved ethylene chain economics, particularly for production from crude oil-based raw materials.However, the combination of increased product prices and global economic and political uncertainty is negatively impacting Equistar sales volumes early in the second quarter.

Slide 24 – Independent Review Conducted
I will close out my formal remarks by commenting on some of the preliminary conclusions that we have come to as a result of a third-party independent review of our business plan, strategic options and competitive position.
First, our larger majority-owned businesses, specifically TiO2 and acetyls, are structurally attractive and offer an opportunity for above-average returns over the next several years.
Second, the recent progress we have made in improving our cost structure and enhancing our customer offerings must continue in order for us to realize further improvement in global manufacturing productivity, business process efficiency, our organization and our cost structure.
Accordingly, for now our resources will continue to be focused primarily on efforts to increase efficiency and improve profitability.
Third, our interest in Equistar and the resultant tie to the ethylene/polyethylene cycle provides considerable cash generation and debt reduction upside. Our long-term debt maturity schedule, with no substantial maturities before 2006, dovetails nicely with industry projections surrounding the next peak.
At the same time, we will continue to review our strategic options surrounding our Equistar stake.
Fourth, our dividend provides an attractive reason for investors to support Millennium during the bottom of the chemical industry cycle while we improve the cost position of our company and industry conditions hopefully improve. Our incentive plans include direct links to our continued ability to maintain our current dividend policy.
Given the points I’ve made above, and again with outside help, we are currently undertaking a fresh and independent review of our organizational structure to ensure alignment around these priorities.
Slide 25 – Strategy
I’ll end by reminding you what our top priority is: Optimize long-term cash flow from our businesses and our investment in Equistar, so as to reduce debt and increase our financial flexibility.

Slide 26 – Logo
Thanks for your time and attention and in the time left I will be happy to take a few questions.


