UNITED STATES
SECURITIES AND EXCHANGE COMMISSION
Washington, D.C. 20549
FORM N-CSR
CERTIFIED SHAREHOLDER REPORT OF REGISTERED
MANAGEMENT INVESTMENT COMPANIES
Investment Company Act file number | 811-7739 |
|
Harding, Loevner Funds, Inc. |
(Exact name of registrant as specified in charter) |
|
50 Division Street, Somerville, NJ | | 08876 |
(Address of principal executive offices) | | (Zip code) |
|
David R. Loevner, President 50 Division Street, Somerville, NJ 08876 |
(Name and address of agent for service) |
|
Registrant’s telephone number, including area code: | (877) 435-8105 | |
|
Date of fiscal year end: | 10/31 | |
|
Date of reporting period: | 10/31/2005 | |
| | | | | | | | |
Item 1. Reports to Stockholders.
Annual Report | | October 31, 2005 |

HARDING • LOEVNER®
Family of Mutual Funds
• International Equity Portfolio Investor Class
• Emerging Markets Portfolio
Harding Loevner Funds, Inc. |
P.O. Box 642, OPS 22 |
Boston, MA 02117-0642 |
Fax: 617-927-8400 |
1.877.435.8105 • www.hardingloevner.com
Harding, Loevner Funds, Inc.
Table of Contents
For use only when preceded or accompanied by a prospectus. Read the prospectus carefully before you invest or send money.
Harding, Loevner Funds, Inc.
Hypothetical Expense Example
October 31, 2005 (unaudited)
As a shareholder of the Portfolio, you incur two types of costs: (1) transaction costs, including brokerage commissions on purchases and sales of fund shares; and (2) ongoing costs, including management fees and other fund expenses. The following example is intended to help you understand your ongoing costs (in dollars and cents) of investing in a Portfolio and to compare these costs with the ongoing costs of investing in other mutual funds.
The example is based on an investment of $1,000 invested at the beginning of the period and held for the entire period from May 1, 2005 to October 31, 2005 for the Institutional Class of International Equity Portfolio and Emerging Markets Portfolio and from September 30, 2005 (commencement of operations) to October 31, 2005 for the Investor Class of International Equity Portfolio.
Actual Expenses
The first line under each Porfolio in the table below provides information about actual account values and actual expenses. You may use the information in this line, together with the amount you invested, to estimate the expenses that you paid over the period. Simply divide your account value by $1,000 (for example, an $8,600 account value divided by $1,000 = 8.6), then multiply the result by the number in the first line for your Portfolio under the heading entitled “Expenses Paid During Period” to estimate the expenses you paid on your account during this period.
Hypothetical Example for Comparison Purposes
The second line under each Portfolio in the table below provides information about hypothetical account values and hypothetical expenses based on each Portfolio’s actual expense ratio and an assumed rate of return of 5% per year before expenses, which is not the Portfolio’s actual return. The hypothetical account values and expenses may not be used to estimate the actual ending account balance or expenses you paid for the period. You may use this information to compare the ongoing costs of investing in your Portfolio and other funds. To do so, compare this 5% hypothetical example with the 5% hypothetical examples that appear in the shareholder reports of the other funds.
Please note that the expenses shown in the table are meant to highlight your ongoing costs only and do not reflect any transactional costs, such as brokerage commissions paid on purchases and sales of fund shares. Therefore, the second line under each Portfolio in the table is useful in comparing ongoing costs only, and will not help you determine the relative total costs of owning different funds. In addition, if these transactional costs were included, your costs would have been higher.
| | | | | | | | | | |
| | | Beginning
Account Value | | Ending Account
Value | | Annualized | | Expenses Paid
During Period*
(May 1, 2005 to | |
| | | May 1, 2005 | | October 31, 2005 | | Expense Ratio | | October 31, 2005) | |
| International Equity Portfolio, Institutional Class | | | | | | | | | | | | | | | | | |
| Actual | | | $ | 1,000.00 | | | | $ | 1,098.00 | | | | 1.00 | % | | | $ | 5.29 | | |
| Hypothetical (5% return before expenses) | | | 1,000.00 | | | | 1,020.16 | | | | 1.00 | % | | | 5.09 | | |
| Emerging Markets Portfolio | | | | | | | | | | | | | | | | | |
| Actual | | | $ | 1,000.00 | | | | $ | 1,223.30 | | | | 1.68 | % | | | $ | 9.42 | | |
| Hypothetical (5% return before expenses) | | | 1,000.00 | | | | 1,016.73 | | | | 1.68 | % | | | 8.55 | | |
| | | | | | | | | | | | | | | | | | |
* Expenses are calculated using each Portfolio’s annualized expense ratio (as disclosed in the table), multiplied by the average account value for the period, multiplied by number of days in the period (184 days), and divided by the number of days in the year (365 days).
Harding, Loevner Funds, Inc.
Hypothetical Expense Example (continued)
October 31, 2005 (unaudited)
| | | | | | | | | | |
| | | Beginning
Account Value | | Ending Account
Value | | Annualized
Expense | | Expenses Paid
During Period*
(September 30,
2005 to | |
| | | September 30, 2005 | | October 31, 2005 | | Ratio | | October 31, 2005) | |
| International Equity Portfolio, Investor Class | | | | | | | | | | | | | | | | | |
| Actual | | | $ | 1,000.00 | | | | $ | 953.90 | | | | 1.25 | % | | | $ | 1.07 | | |
| Hypothetical (5% return before expenses) | | | 1,000.00 | | | | 1,003.29 | | | | 1.25 | % | | | 1.10 | | |
| | | | | | | | | | | | | | | | | | |
| | | | | | | | | | | | | | | | | | | | | |
* Expenses are calculated using each Portfolio’s annualized expense ratio (as disclosed in the table), multiplied by the average account value for the period, multiplied by number of days in the period (32 days), and divided by the number of days in the year (365 days).
Harding, Loevner Funds, Inc.
International Equity Portfolio — Overview
(unaudited)
| | | | |
| | | Returns for the Period Ended October 31, 2005 | |
| | | Cumulative Total Returns | | Average Annualized
Total Return | |
| FUND NAME | | Last 12 Months | | 5 YR | | 10 YR | | 5 YR | | 10 YR | |
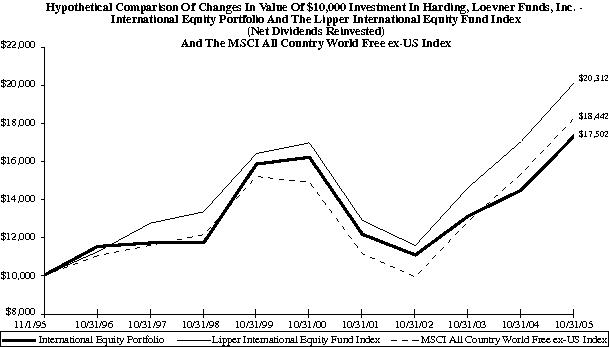
| International Equity Portfolio (11/1/94) | | | 20.58% | | | 7.83% | | 75.02% | | 1.52% | | 5.76% | |
| MSCI All Country World ex USA Free
(Net dividend) | | | 20.06% | | | 23.62% | | 84.42% | | 4.33% | | 6.31% | |
| Lipper International Fund Index | | | 18.90% | | | 19.43% | | 103.12% | | 3.62% | | 7.34% | |
| | | | | | | | | | | | | | |
Performance data quoted represents past performance and does not guarantee future results. The investment return and principal value of an investment will fluctuate so that an investor’s shares, when redeemed, may be worth more or less than their original cost. Performance current to the most recent month end may be lower or higher than the performance quoted and may be obtained by visiting the website at www.hardingloevner.com
Investment return reflects voluntary fee waivers in effect. Absence such waivers, total return would be reduced. The performance provided does not reflect the deduction of taxes that a shareholder would pay on Portfolio distributions.
1
Harding, Loevner Funds, Inc.
International Equity Portfolio — Overview (continued)
(unaudited)
The Institutional share class of the Portfolio rose in value by 20.58% net of fees in the financial year ending October 31, 2005. In comparison, the benchmark MSCI All Country World ex-US Index rose by 20.06%—its value component by 20.38%, and its growth component by 19.75%. Please refer to the preceding page of the report for complete performance information.
Relative performance during the year was positive, though modest. Our quality-and-growth-oriented investment style, which was out of favor in the two preceding years, ceased to be a drag in the year just ended. Stocks of high quality companies, those with strong finances, good management, and the ability both to defend margins and generate growth over long periods of time, held their own against stocks of riskier companies, with more cyclical or less durable businesses. In an environment in which nominal yields remain low, investors hungry for high returns are prepared to seek them in risky assets. Rising interest rates bring reminders of the dangers, and increasing caution. We feel that the extreme relative under pricing of high quality companies (noted emphatically in these pages last year) is at last unwinding, and that our tenacity in adhering to our long-held investment philosophy, which focuses exclusively on such companies, is again being rewarded.
Amidst a benign business environment, corporate earnings growth has been surprisingly strong. We think growth will become increasingly hard to achieve, and thus increasingly valued by investors. US interest rates are rising steadily, gasoline and other energy bills are taking an increasing share of consumers’ wallet, while their confidence is being sapped by evidence that house prices are beginning to wobble. It could be that the much-predicted weakening of US consumer demand is now very close.
Good managements continue to focus on costs, and to seek growth in faster-growing economies in Asia, and Latin America as well as in Central and Eastern Europe. Opportunities to grow in the larger, but far more mature markets in Western Europe are few. We worry that this is a longer term, not just a cyclical phenomenon. Populations are not growing, and immigration is modest, exacerbating the weakness of demand that would in any case be expected when unemployment is high and job security is low.
Japan faces a similar long-term demographic drag, but a brighter near-term cyclical outlook. We have long observed the self-improvement that Japanese companies have undertaken in recent years, but now we observe that the operating environment has also changed for the better. The causes of long-lasting changes in direction of consumer confidence are mysterious (not just to us, but to most forecasters), but it does now appear that there has been a change in the national psyche towards optimism. We believe this change may lead to a long-lasting upturn in consumer spending as well as in corporate investment.
The pace of corporate investment in developing economies has not been an issue. Multi-nationals are seeking sources of growth, governments are flush with cash, especially in emerging Asia, and consumers are increasingly turning from being consistent savers to being consistent spenders. The result has changed the outlook for several global industries, most notably for those in the Materials sector, as well for the capital goods industry as manufacturing capacity is expanded and pent-up demand for better public infrastructure is met.
Our view that companies face difficulty in growing in mature economies and that developing economies will thus be an important source of growth for all companies is not new. Indeed, our world view, formed from the many meetings and contacts we have with companies in all sectors and geographies, has undergone little change in this regard. As a result, the Portfolio is little changed in terms of either geographical or industrial exposure. The companies we bought are from a wide range of industries and geographies, but are, we believe, going to grow fast, and for a long time. In Energy we continued our policy of avoiding the oil majors, with diversified, but lower revenue growth opportunities, in favor of companies with well-defined opportunities: in the case of BG Group from the growth in demand of natural gas, and in the case of Gazprom from increased investment in production and distribution capacity to enable it to monetize its vast quantities of Russian energy reserves. In Financials, too, we sought geographies and segments that can grow fast while the industry as a whole does not. We bought a holding in an Austrian bank, Erste, which is becoming a market leader in Central Europe, as well as a Polish bank, Pekao, where we are directly benefiting from large, and, we think, sustainable growth in consumer demand in that country. Elsewhere in the sector, we bought a new holding in an Indian bank, ICICI, but financed it with a partial sale of its competitor, HDFC Bank. In China, we bought a new holding in port operator, China Merchants. These new emerging market holdings were offset by sales of two Thai companies, cellular operator Advanced Info Services, and Bangkok Bank, so that overall exposure to emerging markets was roughly unchanged. There were a number of other transactions during the year, all driven by company specific or price issues.
It has been a good year for our shareholders. Markets returns have been strong, and Portfolio returns stronger still. Our focus on high quality growth companies is, of course, unchanged. Our conviction that they offer the prospect of returns above those of the market as a whole is also unchanged.
2
Harding, Loevner Funds, Inc.
International Equity Portfolio — Overview (continued)
(unaudited)
Past performance does not guarantee future results.
The Portfolio invests in foreign securities, which will involve greater volatility and political, economic and currency risks and differences in accounting methods. It also invests in emerging markets, which involve unique risks, such as exposure to economies less diverse and mature than the US or other more established foreign markets. Economic and political instability may cause larger price changes in emerging markets securities than other foreign securities.
Fund holdings and/or sector allocations are subject to change at any time and are not recommendations to buy or sell any security.
MSCI All Country World Free ex-US Index includes all developed and emerging markets in the MSCI universe of 48 countries, excluding the US, with Free versions of countries where they exist. Net dividends reinvested.
Lipper International Fund Index, an unmanaged index published by Lipper Analytical Services, Inc., includes 30 funds that are generally similar to the Fund, although some funds in the index may have somewhat different investment policies or objectives.
You cannot invest directly in an Index.
3
Harding, Loevner Funds, Inc.
International Equity Portfolio
Statement of Net Assets
| | Percentage of | |
Industry | | Net Assets | |
Advertising Agencies | | | 2.6 | % | |
Automobiles | | | 1.3 | | |
Automotive | | | 1.7 | | |
Banks | | | 17.2 | | |
Beverages, Food & Tobacco | | | 4.9 | | |
Commercial Banks | | | 2.4 | | |
Construction Materials | | | 1.6 | | |
Cosmetics & Personal Care | | | 1.6 | | |
Discount Stores | | | 1.7 | | |
Diversified Electronics | | | 2.1 | | |
Diversified Food | | | 4.0 | | |
Electric Utilities | | | 1.2 | | |
Electronic Equipment & Instruments | | | 6.3 | | |
Food & Drug Retailing | | | 2.3 | | |
General Diversified | | | 5.8 | | |
Health Care Equipment & Supplies | | | 1.3 | | |
Heavy Machinery | | | 6.2 | | |
Industrial Chemicals & Gases Manufacturers | | | 2.9 | | |
Insurance | | | 1.8 | | |
Integrated International Oil Producers | | | 2.3 | | |
Media | | | 1.8 | | |
Medical Supplies | | | 1.9 | | |
Miscellaneous Retailers | | | 1.0 | | |
Oil & Gas | | | 9.7 | | |
Other Financial Services | | | 1.8 | | |
Parts & Components | | | 1.8 | | |
Pharmaceuticals | | | 6.6 | | |
Real Estate | | | 2.4 | | |
Software | | | 2.0 | | |
Textiles & Apparel | | | 1.0 | | |
Transportation | | | 1.0 | | |
Wholesalers | | | 1.2 | | |
Total Investments | | | 103.4 | | |
Other Assets Less Liabilities | | | (3.4 | ) | |
Net Assets | | | 100.0 | % | |
4
Harding, Loevner Funds, Inc.
International Equity Portfolio
Statement of Net Assets
October 31, 2005 (continued)
| | Shares | | Value (1) | |
Long Term Investments - 97.9% | | | | | |
Common Stocks - 97.9% | | | | | |
Austria - 3.2% | | | | | |
Erste Bank der Oesterreichischen Sparkassen AG (Banks) | | 112,500 | | $ | 5,849,279 | |
Oest Elektrizitatswirts, Class A (Electric Utilities) | | 11,600 | | 3,698,181 | |
| | | | 9,547,460 | |
Bermuda - 1.8% | | | | | |
Bunge Ltd. (Beverages, Food & Tobacco) | | 101,800 | | 5,287,492 | |
Canada - 4.9% | | | | | |
EnCana Corp. (Oil & Gas) | | 169,732 | | 7,783,910 | |
Imperial Oil Ltd. (Integrated International Oil Producers) | | 80,080 | | 7,033,426 | |
| | | | 14,817,336 | |
France - 11.8% | | | | | |
Air Liquide (Industrial Chemicals & Gases Manufacturers) | | 47,075 | | 8,560,629 | |
Carrefour SA (Miscellaneous Retailers) | | 67,560 | | 3,002,721 | |
Dassault Systemes SA (Software) | | 117,800 | | 6,074,996 | |
LVMH Moet Hennessy Louis Vuitton SA (Beverages, Food & Tobacco) | | 75,400 | | 6,105,012 | |
Sanofi-Aventis (Pharmaceuticals) | | 68,000 | | 5,444,716 | |
Schneider Electric SA (Heavy Machinery) | | 76,910 | | 6,315,115 | |
| | | | 35,503,189 | |
Germany - 2.3% | | | | | |
Metro AG (Food & Drug Retailing) | | 151,470 | | 6,888,954 | |
Hong Kong - 6.4% | | | | | |
China Merchants Holdings International Co., Ltd. (Transportation) | | 1,594,000 | | 3,101,576 | |
Denway Motors Ltd. (Automobiles) | | 12,540,000 | | 3,772,783 | |
Hutchison Whampoa Ltd. (General Diversified) | | 609,000 | | 5,780,280 | |
Li & Fung Ltd. (Wholesalers) | | 1,700,000 | | 3,638,616 | |
Yue Yuen Industrial Holdings Ltd. (Textiles & Apparel) | | 1,204,500 | | 3,041,234 | |
| | | | 19,334,489 | |
India - 2.2% | | | | | |
HDFC Bank Ltd. (Banks) | | 235,300 | | 3,172,881 | |
ICICI Bank Ltd. (Banks) | | 300,000 | | 3,319,512 | |
| | | | 6,492,393 | |
Ireland - 1.6% | | | | | |
CRH plc (Construction Materials) | | 188,452 | | 4,709,501 | |
Japan - 18.1% | | | | | |
Daikin Industries Ltd. (Heavy Machinery) | | 256,600 | | 6,679,546 | |
Hirose Electronics Co., Ltd. (Electronic Equipment & Instruments) | | 42,200 | | 4,836,812 | |
JSR Corp. (Automotive) | | 217,700 | | 5,126,393 | |
Kao Corp. (Cosmetics & Personal Care) | | 195,900 | | 4,678,376 | |
Keyence Corp. (Electronic Equipment & Instruments) | | 34,650 | | 8,013,610 | |
Mitsubishi Corp. (General Diversified) | | 600,600 | | 11,761,087 | |
| | | | | | |
See Notes to Financial Statements
5
Harding, Loevner Funds, Inc.
International Equity Portfolio
Statement of Net Assets
October 31, 2005 (continued)
Sumitomo Realty & Development Co., Ltd. (Real Estate) | | 451,000 | | $ | 7,244,824 | |
Yokogawa Electric Corp. (Electronic Equipment & Instruments)† | | 416,000 | | 6,125,727 | |
| | | | 54,466,375 | |
Mexico - 1.7% | | | | | |
Wal-Mart de Mexico SA de CV - ADR (Discount Stores) | | 107,490 | | 5,227,626 | |
Netherlands - 4.2% | | | | | |
Heineken NV (Beverages, Food & Tobacco) | | 105,337 | | 3,336,089 | |
Qiagen NV (Health Care Equipment & Supplies)*† | | 314,400 | | 3,742,210 | |
VNU NV (Media) | | 171,200 | | 5,442,450 | |
| | | | 12,520,749 | |
Poland - 1.0% | | | | | |
Bank Pekao SA - GDR (Banks) | | 62,800 | | 3,021,728 | |
Russia - 2.3% | | | | | |
OAO Gazprom - Sponsored ADR Reg S (Oil & Gas)† | | 115,100 | | 6,803,927 | |
Singapore - 1.1% | | | | | |
DBS Group Holdings Ltd. (Commercial Banks) | | 353,083 | | 3,195,064 | |
South Africa - 2.5% | | | | | |
Sasol Ltd. (Oil & Gas) | | 238,600 | | 7,615,439 | |
South Korea - 2.1% | | | | | |
Samsung Electronics Co., Ltd. - GDR (Diversified Electronics) | | 23,800 | | 6,356,049 | |
Spain - 3.9% | | | | | |
Banco Santander Central Hispano SA (Banks) | | 608,400 | | 7,758,980 | |
Bankinter SA (Commercial Banks) | | 70,000 | | 4,017,757 | |
| | | | 11,776,737 | |
Sweden - 3.6% | | | | | |
Atlas Copco AB, Class A (Heavy Machinery) | | 307,800 | | 5,621,144 | |
Skandinaviska Enskilda Banken AB, Class A (Banks) | | 277,400 | | 5,173,754 | |
| | | | 10,794,898 | |
Switzerland - 11.3% | | | | | |
Actelion Ltd. (Pharmaceuticals)* | | 41,000 | | 4,607,734 | |
Nestle SA - ADR (Diversified Food) | | 99,420 | | 7,392,394 | |
Roche Holding AG - Genusschein (Pharmaceuticals) | | 66,430 | | 9,924,513 | |
Swiss Re - Registered (Insurance) | | 77,800 | | 5,253,206 | |
UBS AG - Registered (Banks) | | 80,210 | | 6,808,679 | |
| | | | 33,986,526 | |
Taiwan - 1.8% | | | | | |
Taiwan Semiconductor Manufacturing Co. (Parts & Components) | | 3,514,794 | | 5,497,465 | |
United Kingdom - 10.1% | | | | | |
BG Group plc (Oil & Gas) | | 791,500 | | 6,945,346 | |
Smith & Nephew plc (Medical Supplies) | | 685,500 | | 5,800,362 | |
Standard Chartered plc (Other Financial Services) | | 252,540 | | 5,302,160 | |
See Notes to Financial Statements
6
Harding, Loevner Funds, Inc.
International Equity Portfolio
Statement of Net Assets
October 31, 2005 (continued)
Unilever plc (Diversified Food) | | 449,400 | | $ | 4,556,237 | |
WPP Group plc (Advertising Agencies) | | 804,730 | | 7,905,265 | |
| | | | 30,509,370 | |
Total Common Stocks (Cost $212,526,933) | | | | 294,352,767 | |
Total Long Term Investments (Cost $212,526,933) | | | | 294,352,767 | |
Short Term Investments - 3.6% | | Face
Amount | | | |
Federal Home Loan Bank, 3.693%, due 11/04/05†† | | 4,908,578 | | 4,908,578 | |
Federal Home Loan Mortgage Corporation, 3.686%, due 11/02/05†† | | 5,839,310 | | 5,839,310 | |
Total Short Term Investments (Cost $10,747,888) | | | | 10,747,888 | |
Repurchase Agreement - 1.9% | | | | | |
Investors Bank & Trust Repurchase Agreement, 2.75%, due 11/01/05 in the
amount of $5,890,577; issued 10/31/05 (collateralized by $5,889,597 par of
FNMA #704534, 3.756%, due 06/31/33, SBA #506124, 7.375%, due 12/25/14
and SBA #506413, 7.325% due 09/25/15 with an aggregate market
value of $6,184,634) (Cost $5,890,127) | | $ | 5,890,127 | | 5,890,127 | |
Total Investments - 103.4% (Cost $229,164,948) | | | | $ | 310,990,782 | |
| | | | | | | |
See Notes to Financial Statements
7
Harding, Loevner Funds, Inc.
International Equity Portfolio
Statement of Net Assets
October 31, 2005 (continued)
| | Value (1) | |
Liabilities, Net of Other Assets - (3.4)% | | | |
Foreign currency (cost $194,055) | | $ 186,756 | |
Dividends receivable | | 356,486 | |
Receivable for fund shares sold | | 5,488 | |
Tax reclaim receivable | | 288,658 | |
Prepaid expenses | | 2,530 | |
Other assets | | 1,571 | |
Collateral for securities loaned ($10,174,788) | | (10,747,888 | ) |
Payable for distribution fees | | (27 | ) |
Payable for fund shares redeemed | | (1,650 | ) |
Payable to investment advisor | | (195,462 | ) |
Other liabilities | | (149,760 | ) |
| | $ (10,253,298 | ) |
Net Assets - 100% | | | |
Institutional Class | | | |
Applicable to 20,144,865 outstanding $.001 par value shares (authorized 250,000,000 shares) | | $ 300,227,412 | |
Net Asset Value, Offering Price and Redemption Price Per Share | | $ 14.90 | |
Investor Class | | | |
Applicable to 34,210 outstanding $.001 par value shares (authorized 250,000,000 shares) | | $ 510,072 | |
Net Asset Value, Offering Price and Redemption Price Per Share | | $ 14.91 | |
Components of Net Assets as of October 31, 2005 were as follows: | | | |
Paid-in capital | | $ 217,624,438 | |
Accumulated undistributed net investment income | | 1,524,829 | |
Accumulated distributions in excess of net realized gain on investments and foreign currency-related transactions | | (212,286 | ) |
Net unrealized appreciation on investments and on assets and liabilities denominated in foreign currencies (Note 4) | | 81,800,503 | |
| | $ 300,737,484 | |
Summary of Abbreviations
ADR | - | American Depository Receipt |
FNMA | - | Federal National Mortgage Association |
GDR | - | Global Depositary Receipt |
SBA | - | Small Business Administration |
(1) | | See Note 2 to Financial Statements |
* | | Non-income producing security |
† | | All or a portion of this security was out on loan at October 31, 2005; the value of the securities loaned amounted to $10,174,788. The value of collateral amounted to $10,747,888 which consisted of cash equivalents. |
†† | | Represents investments of security lending collateral. |
See Notes to Financial Statements
8
Harding, Loevner Funds, Inc.
Emerging Markets Portfolio—Overview
(unaudited)
| | | | |
| | | Returns for the Period Ended October 31, 2005 | |
| | | Cumulative Total Returns | | Average Annualized
Total Return | |
| FUND NAME | | Last 12 Months | | 5 YR | | Inception | | 5 YR | | Inception | |
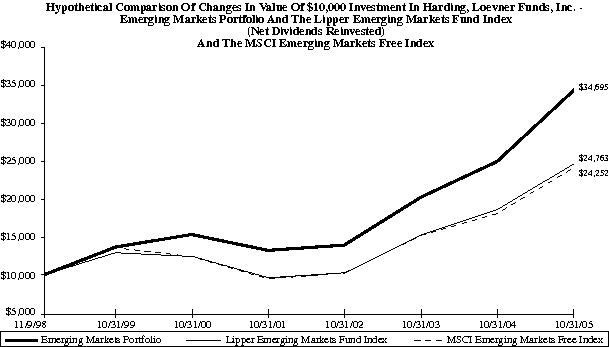
| Emerging Markets Portfolio (11/9/98) | | | 38.76% | | | 126.08% | | 246.95% | | 17.72% | | 19.52% | |
| MSCI Emerging Markets Free (Net dividend) | | | 33.80% | | | 95.19% | | 142.52% | | 14.31% | | 13.54% | |
| Lipper Emerging Markets Funds Index | | | 32.96% | | | 99.90% | | 147.63% | | 14.86% | | 13.88% | |
| | | | | | | | | | | | | | |
Performance data quoted represents past performance and does not guarantee future results. The investment return and principal value of an investment will fluctuate so that an investor’s shares, when redeemed, may be worth more or less than their original cost. Performance current to the most recent month end may be lower or higher than the performance quoted and may be obtained by visiting the website at www.hardingloevner.com.
Investment return reflects voluntary fee waivers in effect. Absence such waivers, total return would be reduced. The performance provided does not reflect the deduction of taxes that a shareholder would pay on Portfolio distributions.
9
Harding, Loevner Funds, Inc.
Emerging Markets Portfolio — Overview (continued)
(unaudited)
The Portfolio rose in value by 38.76% net of fees in the financial year ending October 31, 2005. In comparison, the benchmark MSCI Emerging Markets Index rose by 33.80%. Please refer to the preceding page of the report for complete performance information.
We feel the basic trends favoring the continued progress of the developing markets are powerful. The confluence of growing workforces, improving economic management by governments, and globalization of trade in services as well as goods has led to strong economic performance. Emerging markets economies are growing at around twice the pace of the developed world. Increased foreign exchange reserves have facilitated stable currencies and falling domestic interest rates, which in turn have fuelled the empowerment of emerging markets consumers.
Emerging markets companies (EM) are growing their revenues at approximately three times the rate of their developed markets counterparts. Less well known is the fact that the stocks of these companies are of significantly higher quality than developed markets stocks. While the emerging markets have appreciated significantly over the past three years, the combination of earnings growth and the reducing risk of the EM economies provide the basis for our view of long-term favorable performance.
Over half of the Portfolio is invested in the stocks of companies focused on the “emerging” consumer in their domestic and regional markets. These include our overweights in Consumer Discretionary and Consumer Staples, along with the exposure to retail banks and cellular telephone operators. The dynamics of the development of the EM consumer wallet are specific in each country. For example, the development of mortgage financing in Mexico has fuelled demand for affordable homes, built by Portfolio holdings Concorcio Ara and Urbi Desarrollos Urbanos. In India, Bharti Tele-Ventures continues to roll out its GSM cellular platform, in a country where cellular penetration is currently around 10% and expected to triple. JD Group operates a range of retail formats positioned to benefit from strong household formation in South Africa.
The Emerging Markets are also home to an increasing number of companies that participate in global industries and compete for customers in the developed economies as well as at home. Traditionally, the Emerging Markets have been associated with exporters of natural resources, agricultural products and low-cost manufactured goods. During the year, we cut back our exposure to extractive industries to a significantly underweight position, corresponding to our view that most commodity prices have passed their cyclical peak. Our sales included long-term holding CVRD, the Brazilian iron ore miner, and Yangzhou Coal and the Aluminum Company of China. We continue to be highly selective in our stocks of low-cost manufacturers. For example, we sold Yue Yuen, the manufacturer of athletic footwear, because we anticipated the company’s difficultly in passing through labor and petrochemical feedstock cost increases to customers such as Nike and Adidas. We bought Johnson Electric, the producer of micro-motors, in order to benefit from scale economies and the decreasing costs of steel, a key raw material.
We are underweight in Information Technology overall because, we believe, relatively few businesses are positioned to win over successive technology product cycles. We continue to hold global technology leaders such as Samsung and Taiwan Semiconductor, and added Hon Hai, a Taiwanese electronics contract manufacturer.
Our Energy exposure is focused on companies that, we believe, are positioned to benefit from an environment of generally high energy prices, but we are underweight in stocks directly dependent on the oil price. A notable theme within Energy is the strategic role of Russian producers; holdings include Gazprom, the owner of the world’s largest gas reserves. Other holdings include Sasol, the South African integrated producer, now commercializing its gas-to-liquids petrochemical technology, and sour crude refiners such as Reliance of India.
Our investment process is designed to identify high quality growth companies from which to build a diversified portfolio of 70 or 80 stocks, reflecting our analytic insights. Reassuringly, we observe that the outperformance of the Portfolio this year is attributable primarily to the stock selection arising from our analytic insights, rather than to the results of any geographic ‘bets’.
10
Harding, Loevner Funds, Inc.
Emerging Markets Portfolio — Overview (continued)
(unaudited)
Past performance does not guarantee future results.
The Portfolio invests in foreign securities, which will involve greater volatility and political, economic and currency risks and differences in accounting methods. It also invests in emerging markets, which involve unique risks, such as exposure to economies less diverse and mature than the US or other more established foreign markets. Economic and political instability may cause larger price changes in emerging markets securities than other foreign securities.
Fund holdings and/or sector allocations are subject to change at any time and are not recommendations to buy or sell any security.
MSCI Emerging Markets Free Index includes all emerging markets in the MSCI universe of 26 countries, with Free versions of countries where they exist. Net dividends reinvested.
Lipper Emerging Market Fund Index, an unmanaged index published by Lipper Analytical Services, Inc., includes 30 funds that are generally similar to the Fund, although some funds in the index may have somewhat different investment policies or objectives. You cannot invest directly in this Index.
You cannot invest directly in an Index.
11
Harding, Loevner Funds, Inc.
Emerging Markets Portfolio
Statement of Net Assets
Industry | | Percentage of
Net Assets | |
Aerospace & Defense | | | 1.3 | % | |
Automotive | | | 5.5 | | |
Banks | | | 17.5 | | |
Beverages, Food & Tobacco | | | 2.2 | | |
Brewers | | | 1.7 | | |
Building Materials | | | 2.7 | | |
Commercial Banks | | | 1.6 | | |
Commercial Services & Supplies | | | 1.0 | | |
Computer Software & Processing | | | 1.5 | | |
Computers & Information | | | 0.7 | | |
Discount Stores | | | 1.6 | | |
Diversified Electronics | | | 4.6 | | |
Electrical Equipment | | | 5.1 | | |
Entertainment & Leisure | | | 1.2 | | |
Financial Services | | | 1.2 | | |
Heavy Machinery | | | 1.2 | | |
Home Construction, Furnishings & Appliances | | | 4.2 | | |
Industrial Conglomerates | | | 1.3 | | |
Insurance | | | 1.8 | | |
Metals & Mining | | | 3.6 | | |
National & Regional Food Chains | | | 1.3 | | |
Oil & Gas | | | 11.9 | | |
Parts & Components | | | 3.1 | | |
Pharmaceuticals | | | 1.3 | | |
Real Estate | | | 1.2 | | |
Retailers | | | 2.2 | | |
Securities Brokerage | | | 1.2 | | |
Systems & Subsystems | | | 1.0 | | |
Telephone Systems | | | 11.3 | | |
Transportation | | | 5.5 | | |
Total Investments | | | 101.5 | | |
Other Assets Less Liabilities | | | (1.5 | ) | |
Net Assets | | | 100.0 | % | |
12
Harding, Loevner Funds, Inc.
Emerging Markets Portfolio
Statement of Net Assets
October 31, 2005 (continued)
| | Shares | | Value (1) | |
Long Term Investments - 96.0% | | | | | |
Common Stocks - 89.0% | | | | | |
Brazil - 3.7% | | | | | |
Companhia Brasileira de Distribuicao Grupo Pao de Acucar (National & Regional Food Chains)† | | 315,000 | | $ | 8,681,400 | |
Embraer Aircraft Corp. - ADR (Aerospace & Defense) | | 235,360 | | 9,129,614 | |
Petroleo Brasileiro SA - ADR (Oil & Gas) | | 122,000 | | 7,795,800 | |
| | | | 25,606,814 | |
Cayman Islands - 1.2% | | | | | |
ASM Pacific Technology Ltd. (Heavy Machinery) | | 1,787,000 | | 8,293,373 | |
Chile - 1.2% | | | | | |
Banco Santander - ADR (Banks) | | 208,000 | | 8,122,400 | |
Egypt - 3.1% | | | | | |
Egyptian Mobile Phone Network (Telephone Systems) | | 263,000 | | 8,684,224 | |
Orascom Telecom Holding SAE - GDR (Telephone Systems) | | 260,700 | | 12,792,591 | |
| | | | 21,476,815 | |
Hong Kong - 5.5% | | | | | |
China Merchants Holdings International Co., Ltd. (Transportation) | | 4,856,000 | | 9,448,715 | |
China Mobile HK Ltd. - ADR (Telephone Systems) | | 418,000 | | 9,384,100 | |
Johnson Electric Holdings Ltd. (Electrical Equipment) | | 10,500,000 | | 9,497,524 | |
Techtronic Industries Co. (Electrical Equipment) | | 3,805,000 | | 9,388,084 | |
| | | | 37,718,423 | |
Hungary - 1.6% | | | | | |
Gedeon Richter Rt. (Pharmaceuticals) | | 53,900 | | 8,857,386 | |
MOL Magyar Olaj-es Gazipari Rt. (Oil & Gas) | | 23,075 | | 2,152,106 | |
| | | | 11,009,492 | |
India - 11.5% | | | | | |
Bajaj Auto Ltd. (Automotive) | | 237,000 | | 8,965,875 | |
Bharat Heavy Electricals (Electrical Equipment) | | 383,000 | | 9,788,119 | |
Bharti Tele-Ventures Ltd. (Telephone Systems)* | | 1,938,208 | | 13,889,617 | |
Gujarat Ambuja Cements Ltd. (Building Materials) | | 6,300,000 | | 9,732,965 | |
HDFC Bank Ltd. - ADR (Banks) | | 167,000 | | 7,379,730 | |
ICICI Bank Ltd. (Banks) | | 371,000 | | 4,105,130 | |
ICICI Bank Ltd. - Sponsored ADR (Banks) | | 225,000 | | 5,321,250 | |
Reliance Industries Ltd. - Sponsored GDR (Oil & Gas) | | 300,000 | | 10,069,096 | |
Satyam Computer Services Ltd. (Computer Software & Processing) | | 775,000 | | 10,455,317 | |
| | | | 79,707,099 | |
| | | | | | |
13
Harding, Loevner Funds, Inc.
Emerging Markets Portfolio
Statement of Net Assets
October 31, 2005 (continued)
Indonesia - 0.7% | | | | | |
PT International Nickel Indonesia Tbk (Metals & Mining) | | 3,349,500 | | $ | 4,785,777 | |
Luxembourg - 1.3% | | | | | |
Tenaris SA - ADR (Metals & Mining) | | 84,000 | | 9,227,400 | |
Malaysia - 4.4% | | | | | |
Malaysia International Shipping Corp. Berhad (Transportation) | | 4,106,000 | | 10,327,659 | |
Maxis Communications Berhad (Telephone Systems) | | 2,762,000 | | 6,588,450 | |
Public Bank Berhad (Banks) | | 3,087,200 | | 5,355,876 | |
Resorts World Berhad (Entertainment & Leisure) | | 2,950,000 | | 8,203,911 | |
| | | | 30,475,896 | |
Mexico - 8.7% | | | | | |
America Movil SA de CV, Series L - ADR (Telephone Systems) | | 408,000 | | 10,710,000 | |
Consorcio ARA SA de CV Series (Real Estate) | | 2,323,300 | | 8,575,455 | |
Controladora Comercial Mexicana SA de CV (Retailers) | | 5,145,000 | | 7,723,105 | |
Grupo Aeroportuario del Sureste SA de CV - ADR (Commercial Services & Supplies) | | 223,000 | | 7,247,500 | |
Grupo Financiero Banorte SA de CV, Class O (Financial Services) | | 945,000 | | 8,056,442 | |
Urbi Desarrollos Urbanos SA de CV (Home Construction, Furnishings & Appliances)* | | 1,018,000 | | 6,423,910 | |
Wal-Mart de Mexico SA de CV - ADR (Discount Stores) | | 230,800 | | 11,224,635 | |
| | | | 59,961,047 | |
Philippines - 1.2% | | | | | |
Philippine Long Distance Telephone Co. - Sponsored ADR (Telephone Systems)† | | 271,000 | | 8,170,650 | |
Poland - 2.1% | | | | | |
Bank Pekao SA (Banks) | | 155,400 | | 7,366,712 | |
Polski Koncern Naftowy Orlen SA (Oil & Gas) | | 391,700 | | 6,930,056 | |
| | | | 14,296,768 | |
Russia - 6.3% | | | | | |
Lukoil -Sponsored ADR (Oil & Gas) | | 244,000 | | 13,456,600 | |
OAO Gazprom - Sponsored ADR Reg S (Oil & Gas)† | | 161,500 | | 9,546,778 | |
OAO Gazprom - Sponsored GDR Reg S (Oil & Gas)† | | 142,000 | | 8,392,200 | |
Sberbank of Russia (Banks) | | 13,600 | | 12,104,000 | |
| | | | 43,499,578 | |
South Africa - 12.3% | | | | | |
Bidvest Group Ltd. (Industrial Conglomerates) | | 670,589 | | 8,989,103 | |
Impala Platinum Holdings Ltd. (Metals & Mining) | | 102,400 | | 11,177,529 | |
JD Group Ltd. (Home Construction, Furnishings & Appliances) | | 514,000 | | 5,495,680 | |
MTN Group Ltd. (Telephone Systems) | | 1,012,000 | | 7,537,450 | |
Pretoria Portland Cement Co., Ltd. (Building Materials) | | 200,000 | | 8,943,502 | |
SABMiller plc (Brewers) | | 630,000 | | 11,835,021 | |
Sasol Ltd. (Oil & Gas) | | 391,000 | | 12,479,617 | |
| | | | | | |
14
Harding, Loevner Funds, Inc.
Emerging Markets Portfolio
Statement of Net Assets
October 31, 2005 (continued)
South Africa (continued) | | | | | |
Standard Bank Group Ltd. (Banks) | | 800,769 | | $ | 8,254,855 | |
Steinhoff International Holdings Ltd. (Home Construction, Furnishings & Appliances)* | | 3,940,000 | | 10,317,318 | |
| | | | 85,030,075 | |
South Korea - 14.4% | | | | | |
Daewoo Shipbuilding & Marine Engineering Co., Ltd. (Transportation) | | 500,000 | | 10,020,589 | |
Hankook Tire Co., Ltd. (Automotive) | | 576,000 | | 6,919,727 | |
Hyundai Mobis (Automotive) | | 129,000 | | 10,298,309 | |
Hyundai Motor Co., Ltd. (Automotive) | | 156,800 | | 11,566,512 | |
Kookmin Bank - ADR (Banks) | | 176,500 | | 10,311,130 | |
S1 Corp. (Securities Brokerage) | | 193,000 | | 8,381,946 | |
Samsung Electronics Co., Ltd. - GDR (Diversified Electronics) | | 3,400 | | 902,134 | |
Samsung Electronics Co., Ltd. - GDR (Diversified Electronics) | | 80,750 | | 21,565,166 | |
Samsung Fire & Marine Insurance Co., Ltd. (Insurance) | | 131,500 | | 12,538,337 | |
Shinsegae Co., Ltd. (Retailers) | | 20,150 | | 7,236,547 | |
| | | | 99,740,397 | |
Taiwan - 5.8% | | | | | |
Advantech Co., Ltd. (Computers & Information) | | 2,105,585 | | 4,645,805 | |
Delta Electronics (Electrical Equipment) | | 3,980,168 | | 6,723,402 | |
Hon Hai Precision Industry Co., Ltd. (Parts & Components) | | 2,583,000 | | 11,162,988 | |
Synnex Technology International Corp. (Systems & Subsystems) | | 5,767,890 | | 6,983,350 | |
Taiwan Semiconductor Manufacturing Co. (Parts & Components) | | 6,790,844 | | 10,621,513 | |
| | | | 40,137,058 | |
Thailand - 0.8% | | | | | |
Siam Commercial Bank-Alien (Banks) | | 4,957,000 | | 5,743,459 | |
Turkey - 3.2% | | | | | |
Anadolu Efes Biracilik Ve Malt Sanayii AS (Beverages, Food & Tobacco) | | 273,722 | | 6,686,604 | |
Arcelik AS (Home Construction, Furnishings & Appliances) | | 1,090,000 | | 6,497,525 | |
Turkiye Is Bankasi (Banks) | | 1,300,000 | | 9,012,085 | |
| | | | 22,196,214 | |
Total Common Stocks (Cost $537,357,383) | | | | 615,198,735 | |
Preferred Stock - 7.0% | | | | | |
Brazil - 4.0% | | | | | |
All America Latina Logistica SA (Transportation) | | 204,800 | | 7,911,694 | |
Banco Itau Holding Financeria SA - ADR (Commercial Banks) | | 469,480 | | 11,248,741 | |
Sadia SA (Beverages, Food & Tobacco) | | 3,405,000 | | 8,407,407 | |
| | | | 27,567,842 | |
Russia - 1.7% | | | | | |
Transneft (Oil & Gas)* | | 7,200 | | 11,592,000 | |
| | | | | | |
15
Harding, Loevner Funds, Inc.
Emerging Markets Portfolio
Statement of Net Assets
October 31, 2005 (continued)
South Korea - 1.3% | | | | | |
Samsung Electronics Co., Ltd. - GDR (Diversified Electronics)† | | 45,000 | | $ | 9,192,942 | |
Total Preferred Stock (Cost $35,637,421) | | | | 48,352,784 | |
Total Long Term Investments (Cost $572,994,804) | | | | 663,551,519 | |
Short Term Investments - 2.8% | | Face
Amount | | | |
Federal Home Loan Bank, 3.693%, due 11/04/05†† | | 8,966,996 | | 8,966,996 | |
Federal Home Loan Mortgage Corporation, 3.686%, due 11/02/05†† | | 10,667,258 | | 10,667,258 | |
Total Short Term Investments (Cost $19,634,254) | | | | 19,634,254 | |
Repurchase Agreement - 2.7% | | | | | |
Investors Bank & Trust Repurchase Agreement, 2.75% due 11/01/05 in the
amount of $18,287,083; issued 10/31/05 (collateralized by $17,730,791 par of
SBA #’s 506241, 506323, 506333, and 506707, with rates ranging from 6.625%
to 7.125%, with maturity dates ranging from 09/25/16 to 11/25/28 and an
aggregate market value of $19,199,970). (Cost $18,285,686) | | $ | 18,285,686 | | 18,285,686 | |
Total Investments - 101.5% (Cost $610,914,744) | | | | $ | 701,471,459 | |
| | | | | | | |
16
Harding, Loevner Funds, Inc.
Emerging Markets Portfolio
Statement of Net Assets
October 31, 2005 (continued)
| | Value (1) | |
Liabilities, Net of Other Assets - (1.5)% | | | |
Cash | | $ | 804 | |
Foreign currency (cost $1,348,423) | | 1,345,086 | |
Dividends receivable | | 254,120 | |
Receivable for fund shares sold | | 5,133,636 | |
Receivable for open forward foreign currency contracts | | 3,886,133 | |
Receivable for securities sold | | 3,863,474 | |
Tax reclaim receivable | | 75,752 | |
Prepaid expenses | | 1,284 | |
Other assets | | 3,543 | |
Collateral for securities loaned ($18,780,638) | | (19,634,254 | ) |
Payable for fund shares redeemed | | (189,018 | ) |
Payable to investment advisor | | (627,158 | ) |
Payable for open forward currency exchange contracts | | (3,874,692 | ) |
Payable for securities purchased | | (321,187 | ) |
Other liabilities | | (421,406 | ) |
| | $ | (10,503,883 | ) |
Net Assets - 100% | | | |
Applicable to 22,723,891 outstanding $.001 par value shares (authorized 500,000,000 shares) | | $ | 690,967,576 | |
Net Asset Value, Offering and Redemption Price Per Share | | $ | 30.41 | |
Components of Net Assets as of October 31, 2005 were as follows: | | | |
Paid-in capital | | $ | 597,884,022 | |
Accumulated undistributed net investment income | | 1,217,858 | |
Accumulated undistributed net realized gain on investments and
foreign currency-related transactions | | 1,334,245 | |
Net unrealized appreciation on investments and on assets and liabilities
denominated in foreign currencies (Note 4) | | 90,531,451 | |
| | $ | 690,967,576 | |
Summary of Abbreviations
ADR | - | American Depository Receipt |
FNMA | - | Federal National Mortgage Association |
GDR | - | Global Depositary Receipt |
SBA | - | Small Business Administration |
(1) | | See Note 2 to Financial Statements |
* | | Non-income producing security |
† | | All or a portion of this security was out on loan at October 31, 2005; the value of the securities loaned amounted to $18,780,638. The value of collateral amounted to $19,634,254 which consisted of cash equivalents. |
†† | | Represents investments of security lending collateral. |
See Notes to Financial Statements
17
Harding, Loevner Funds, Inc.
Statements of Operations
Year Ended October 31, 2005
| | International | | Emerging | |
| | Equity | | Markets | |
| | Portfolio | | Portfolio | |
Investment Income | | | | | | | |
Interest | | | $ | 129,384 | | | $ | 195,594 | |
Dividends (net of foreign withholding taxes of $481,788 and $453,524, respectively) | | | 5,482,771 | | | 8,064,111 | |
Security lending income | | | 88,970 | | | 63,028 | |
Total investment income | | | 5,701,125 | | | 8,322,733 | |
Expenses | | | | | | | |
Investment advisory fees (Note 3) | | | 2,418,834 | | | 4,070,400 | |
Administration fees (Note 3) | | | 275,729 | | | 263,349 | |
Distribution fees, Investor Class | | | 27 | | | — | |
Custodian and accounting fees | | | 311,857 | | | 494,617 | |
Directors’ fees and expenses (Note 3) | | | 41,401 | | | 33,516 | |
Shareholder record keeping fees | | | 48,988 | | | 42,715 | |
Printing and postage fees | | | 12,781 | | | 9,006 | |
State registration filing fees | | | 22,798 | | | 27,453 | |
Professional fees | | | 111,611 | | | 95,618 | |
Other fees and expenses | | | 132,504 | | | 442,890 | |
Total expenses | | | 3,376,530 | | | 5,479,564 | |
Waiver of investment advisory fee (Note 3) | | | (151,391 | ) | | — | |
Net expenses | | | 3,225,139 | | | 5,479,564 | |
Net investment income | | | 2,475,986 | | | 2,843,169 | |
Realized and Unrealized Gain (Loss) (Note 4) | | | | | | | |
Net realized gain (loss) — | | | | | | | |
Investment transactions (net of foreign tax expense $281,308 and $66,342, respectively) | | | 41,100,021 | | | 1,316,038 | |
Foreign currency transactions | | | (647,163 | ) | | (1,557,866 | ) |
Net realized gain (loss) | | | 40,452,858 | | | (241,828 | ) |
Change in unrealized appreciation (depreciation) — | | | | | | | |
Investments | | | 18,760,691 | | | 78,617,619 | |
Translation of assets and liabilities denominated in foreign currency | | | (60,534 | ) | | (27,120 | ) |
Net change in unrealized appreciation | | | 18,700,157 | | | 78,590,499 | |
Net realized and unrealized gain | | | 59,153,015 | | | 78,348,671 | |
Net Increase in Net Assets Resulting from Operations | | | $ | 61,629,001 | | | $ | 81,191,840 | |
See Notes to Financial Statements
18
Harding, Loevner Funds, Inc.
Statements of Changes in Net Assets
| | International Equity Portfolio | |
| | Year Ended | | Year Ended | |
| | October 31, | | October 31, | |
| | 2005 | | 2004 | |
Increase in Net Assets from Operations | | | | | |
Net investment income | | $ | 2,475,986 | | $ | 2,907,009 | |
Net realized gain on investments and foreign currency transactions | | 40,452,858 | | 27,521,983 | |
Net change in unrealized appreciation on investments and translation of assets and liabilities denominated in foreign currency | | 18,700,157 | | 4,847,378 | |
Net increase in net assets resulting from operations | | 61,629,001 | | 35,276,370 | |
Distributions to Shareholders from: | | | | | |
Net investment income | | | | | |
Institutional Class | | (1,432,687 | ) | (2,167,605 | ) |
Total distributions to shareholders | | (1,432,687 | ) | (2,167,605 | ) |
Transactions in Shares of Common Stock | | | | | |
Proceeds from sale of shares | | | | | |
Investor Class | | 521,999 | | — | |
Institutional Class | | 11,311,197 | | 49,810,442 | |
Net Asset Value of shares issued to shareholders upon reinvestment of dividends | | | | | |
Institutional Class | | 1,313,542 | | 1,833,540 | |
Cost of shares redeemed | | | | | |
Investor Class | | (14,714 | ) | — | |
Institutional Class | | (88,011,589 | ) | (119,352,363 | ) |
Redemption fees | | | | | |
Institutional Class | | 400 | | — | |
Net Decrease in Net Assets from Fund Share Transactions | | (74,879,165 | ) | (67,708,381 | ) |
Net Decrease in Net Assets | | (14,682,851 | ) | (34,599,616 | ) |
Net Assets | | | | | |
At beginning of year | | 315,420,335 | | 350,019,951 | |
At end of year | | $ | 300,737,484 | | $ | 315,420,335 | |
Accumulated Undistributed Net Investment Income Included in Net Assets | | $ | 1,524,829 | | $ | 1,431,240 | |
See Notes to Financial Statements
19
Harding, Loevner Funds, Inc.
Statements of Changes in Net Assets (continued)
| | Emerging Markets Portfolio | |
| | Year Ended | | Year Ended | |
| | October 31, | | October 31, | |
| | 2005 | | 2004 | |
Increase (Decrease) in Net Assets from Operations | | | | | |
Net investment income | | $ | 2,843,169 | | $ | 219,128 | |
Net realized gain (loss) on investments and foreign currency transactions | | (241,828 | ) | 3,034,920 | |
Net change in unrealized appreciation on investments and translation of assets and liabilities denominated in foreign currency | | 78,590,499 | | 5,541,093 | |
Net increase in net assets resulting from operations | | 81,191,840 | | 8,795,141 | |
Distributions to Shareholders from: | | | | | |
Net investment income | | (120,585 | ) | (62,351 | ) |
Net realized gain from investments and foreign currency-related transactions | | (2,143,956 | ) | — | |
Total distributions to shareholders | | (2,264,541 | ) | (62,351 | ) |
Transactions in Shares of Common Stock | | | | | |
Proceeds from sale of shares | | 601,485,970 | | 30,147,050 | |
Net Asset Value of shares issued to shareholders upon reinvestment of dividends | | 2,223,089 | | 58,908 | |
Cost of shares redeemed | | (58,688,332 | ) | (1,798,399 | ) |
Redemption fees | | 214,731 | | 7,670 | |
Net Increase in Net Assets from Fund Share Transactions | | 545,235,458 | | 28,415,229 | |
Net Increase in Net Assets | | 624,162,757 | | 37,148,019 | |
Net Assets | | | | | |
At beginning of year | | 66,804,819 | | 29,656,800 | |
At end of year | | $ | 690,967,576 | | $ | 66,804,819 | |
Accumulated Undistributed Net Investment Income Included in Net Assets | | $ | 1,217,858 | | $ | 119,482 | |
See Notes to Financial Statements
20
Harding, Loevner Funds, Inc.
Financial Highlights
| | International Equity
Portfolio—
Investor Class | |
| | For the Period
Ended
Oct. 31, 2005(1) | |
Per Share Data | | | | | |
Net Asset Value, Beginning of Period | | | $ | 15.63 | | |
Decrease in Net Assets from Operations | | | | | |
Net investment loss | | | (0.00 | )* | |
Net realized and unrealized loss on investments and foreign currency-related transactions | | | (0.72 | ) | |
Net decrease from investment operations | | | (0.72 | ) | |
Net Asset Value, End of Period | | | $ | 14.91 | | |
Total Return | | | (4.61 | )% | |
Ratios/Supplemental Data: | | | | | |
Net assets, end of period (000’s) | | | $ | 510 | | |
Ratio of net operating expenses to average net assets | | | 1.25 | % | |
Ratio of net investment income (loss), to average net assets | | | (1.25 | )% | |
Decrease reflected in above expense ratios due to waiver of investment advisory and administration fees, and reimbursement of other expenses | | | 0.08 | % | |
Portfolio turnover rate | | | 38 | % | |
(1) | For the period September 30, 2005 (commencement of operations) through October 31, 2005. |
* | Rounds to less than $(0.01). |
See Notes to Financial Statements
21
Harding, Loevner Funds, Inc.
Financial Highlights (continued)
| | Emerging Markets Portfolio | |
| | For the Year | | For the Year | | For the Year | | For the Year | | For the Year | |
| | Ended | | Ended | | Ended | | Ended | | Ended | |
| | Oct. 31, 2005 | | Oct. 31, 2004 | | Oct. 31, 2003 | | Oct. 31, 2002 | | Oct. 31, 2001 | |
Per Share Data | | | | | | | | | | | | | | | | | | | | | |
Net Asset Value, Beginning of Year | | | $ | 22.31 | | | | $ | 18.16 | | | | $ | 12.49 | | | | $ | 11.88 | | | | $ | 14.89 | | |
Increase (Decrease) in Net Assets from Operations | | | | | | | | | | | | | | | | | | | | | |
Net investment income | | | 0.11 | | | | 0.07 | | | | 0.07 | | | | 0.04 | | | | 0.01 | | |
Net realized and unrealized gain (loss) on investments and foreign currency-related transactions | | | 8.43 | | | | 4.12 | | | | 5.60 | | | | 0.58 | | | | (1.89 | ) | |
Net increase (decrease) from investment operations | | | 8.54 | | | | 4.19 | | | | 5.67 | | | | 0.62 | | | | (1.88 | ) | |
Distributions to Shareholders from: | | | | | | | | | | | | | | | | | | | | | |
Net investment income | | | (0.02 | ) | | | (0.04 | ) | | | — | | | | (0.01 | ) | | | — | | |
Net realized gain from investments and foreign currency-related transactions | | | (0.42 | ) | | | — | | | | — | | | | — | | | | (1.13 | ) | |
Total distributions | | | (0.44 | ) | | | (0.04 | ) | | | — | | | | (0.01 | ) | | | (1.13 | ) | |
Net Asset Value, End of Year | | | $ | 30.41 | | | | $ | 22.31 | | | | $ | 18.16 | | | | $ | 12.49 | | | | $ | 11.88 | | |
Total Return | | | 38.76 | % | | | 23.09 | % | | | 45.40 | % | | | 5.22 | % | | | (13.48 | )% | |
Ratios/Supplemental Data: | | | | | | | | | | | | | | | | | | | | | |
Net assets, end of year (000’s) | | | $ | 690,968 | | | | $ | 66,805 | | | | $ | 29,657 | | | | $ | 10,116 | | | | $ | 2,731 | | |
Ratio of net operating expenses to average net assets | | | 1.68 | % | | | 1.75 | % | | | 1.75 | % | | | 1.75 | % | | | 1.75 | % | |
Ratio of net investment income, to average net assets | | | 0.87 | % | | | 0.51 | % | | | 0.76 | % | | | 0.19 | % | | | 0.08 | % | |
Decrease reflected in above expense ratios due to waiver of investment advisory and administration fees, and reimbursement of other expenses | | | — | | | | 0.02 | % | | | 0.08 | % | | | 0.39 | % | | | 1.15 | % | |
Portfolio turnover rate | | | 36 | % | | | 40 | % | | | 58 | % | | | 43 | % | | | 38 | % | |
22
Harding, Loevner Funds, Inc.
Notes to Financial Statements
1. Organization
Harding, Loevner Funds, Inc. (the “Fund”) was organized as a Maryland corporation on July 31, 1996 and is registered under the Investment Company Act of 1940, as amended, as an open-end diversified management investment company. The Fund currently has four Portfolios (individually, “Portfolio”), all of which were active as of October 31, 2005: International Equity Portfolio (“International Equity”); Global Equity Portfolio; Institutional Emerging Markets Portfolio (“Institutional Emerging Markets”); and Emerging Markets Portfolio (“Emerging Markets”). International Equity and Emerging Markets are presented hereinafter. The investment objective of each portfolio is as follows: International Equity—to seek long-term capital appreciation through investments in equity securities of companies based outside the United States; Emerging Markets—to seek long-term capital appreciation through investments in equity securities of companies based in emerging markets.
International Equity commenced operations on October 31, 1996 after acquiring the net assets of Harding, Loevner Management, L.P.’s AMT Capital Fund, Inc. Emerging Markets commenced operations on November 9, 1998. Effective August 5, 2005, International Equity launched the Investor Class Shares and converted existing shareholders to the Institutional Class. Investor Class of International Equity commenced operations on September 30, 2005. The Fund is managed by Harding, Loevner Management, L.P. (the “Investment Adviser”).
2. Summary of Significant Accounting Policies
The accounting policies of the Fund are in conformity with accounting principles generally accepted in the United States (“GAAP”) for investment companies. The following is a summary of the Fund’s significant accounting policies:
Indemnifications
In the normal course of business, the Fund may enter into contracts that contain a variety of representations or that provide indemnification for certain liabilities. The Fund’s maximum exposure under these arrangements is unknown, as this would involve future claims that may be made against the Fund that have not yet occurred. However, the Fund has not had prior claims or losses pursuant to these contracts and expects the risk of loss to be remote.
Estimates
The preparation of financial statements in accordance with GAAP requires management to make estimates and assumptions that affect the reported amounts and disclosures in the financial statements. Actual results could differ from those estimates.
Valuation
The Board of Directors (the “Board”) of the Fund has adopted procedures (“Procedures”) to govern the valuation of the portfolio securities held by each series of the Fund in accordance with the Investment Company Act of 1940, as amended (“1940 Act”). The Procedures incorporate principles set forth in relevant pronouncements of the Securities and Exchange Commission (“SEC”) and its staff, including guidance on the obligations of funds and their Directors to determine, in good faith, the fair value of the fund’s portfolio securities when market quotations are not readily available.
All investments in the Portfolios are valued daily at their market prices, which results in unrealized gains or losses. Securities traded on an exchange are valued at their last sales price on that exchange. Securities for which no sales are reported are valued at the latest bid price obtained from a quotation reporting system or from established market makers. Repurchase agreements are valued at their amortized cost plus accrued interest. Securities for which market quotations are not readily available are fair valued by the Board or its delegate in accordance with the Procedures, although the actual calculations may be done by others. Factors considered in making this determination may include, but are not limited to, information obtained by contacting the issuer, analysts, or the appropriate stock exchange (for exchange-traded securities), analysis of the issuer’s financial statements or other available documents and, if necessary, available information concerning other securities in similar circumstances. The Fund has implemented fair value pricing on a daily basis for all foreign equity securities held by the Portfolios. The fair value pricing utilizes quantitative models developed by an independent pricing service unless the Fund determines that use of another fair valuation methodology is appropriate. If a significant event occurs after the close of trading in a security but before the calculation of the Fund’s net asset value and such significant event has a material impact on the Fund’s net asset value per share (i.e. , more than $0.01 per share), then the security may be fair valued in accordance with the Procedures. As of October 31, 2005, there were no securities in the Fund which required valuation by the Board or its delegate.
23
Harding, Loevner Funds, Inc.
Notes to Financial Statements (continued)
2. Summary of Significant Accounting Policies (continued)
Securities
All securities transactions are recorded on a trade date basis. Interest income and expenses are recorded on an accrual basis. Dividend income is recorded on the ex-dividend date (except for certain foreign dividends that may be recorded as soon as the fund is informed of such dividends). The Fund accretes discount or amortizes premium on a daily basis as adjustments to interest income and the cost of investments. The Fund uses the specific identification method for determining realized gains or losses from sales of securities.
Income Tax
It is the policy of each Portfolio of the Fund to qualify as a regulated investment company, if such qualification is in the best interest of its shareholders, by complying with the applicable provisions of the Internal Revenue Code, and to make distributions of taxable income sufficient to relieve it from substantially all federal income and excise taxes.
Expenses
Expenses directly attributed to a specific Portfolio of the Fund are charged to that Portfolio’s operations; expenses not directly attributable to a specific Portfolio are allocated among the Portfolios either equitably or based on their average daily net assets.
Distribution Plan
Quasar Distributors, LLC serves as the non-exclusive distributor of each class of the Company’s shares. The Company has a distribution plan pursuant to Rule 12b-1 under the 1940 Act with respect to the Investor Class shares of International Equity and Global Equity. Under the terms of the plan, each Portfolio compensates the Distributor at a rate equal to 0.25% of the average daily net assets of the Portfolio attributable to its Investor Class shares for distribution and related services.
Dividends to Shareholders
It is the policy of the Fund to declare dividends from net investment income annually. Net short-term and long-term capital gains distributions for the Portfolios, if any, normally are distributed on an annual basis.
Dividends from net investment income and distributions from net realized gains from investment transactions have been determined in accordance with income tax regulations and may differ from net investment income and realized gains recorded by the Portfolios for financial reporting purposes. Differences result primarily from foreign currency transactions and timing differences related to recognition of income, and gains and losses from investment transactions. To the extent that any differences which are permanent in nature result in overdistributions to shareholders, the amount of the overdistribution is reclassified within the capital accounts based on its federal tax basis treatment. Temporary differences do not require reclassification. To the extent that they exceed net investment income and net realized gains for tax purposes, they are reported as returns of capital.
Currency Translation
Assets and liabilities denominated in foreign currencies and commitments under forward exchange currency contracts are translated into U.S. dollars at the mean of the quoted bid and asked prices of such currencies against the U.S. dollar. Purchases and sales of portfolio securities are translated at the rates of exchange prevailing when such securities were acquired or sold. Income and expenses are translated at exchange rates prevailing when accrued. The Fund does not isolate that portion of the results of operations resulting from changes in foreign exchange rates on investments from the fluctuations arising from changes in market prices of securities held. Such fluctuations are included with the net realized and unrealized gain or loss from investments.
Net realized gains and losses from foreign currency-related transactions arise from sales of foreign currency, currency gains or losses realized between the trade and settlement dates on securities transactions, and the difference between the amounts of dividends, interest, and foreign withholding taxes recorded on the Portfolios books, and the U.S. dollar equivalent of the amounts actually received or paid. Net unrealized appreciation or depreciation on translation of assets and liabilities
24
Harding, Loevner Funds, Inc.
Notes to Financial Statements (continued)
2. Summary of Significant Accounting Policies (continued)
denominated in foreign currencies arise from changes in the value of assets and liabilities other than investments in securities at the period end, resulting from changes in the exchange rate.
Security Lending
Each Portfolio is authorized to lend securities from its investment portfolios to banks, brokers and other financial institutions if it receives collateral in cash, U.S. Government Securities or other liquid investments which will be maintained at all times in an amount equal to at least 102% of the current market value of the loaned securities. The loans will be terminable at any time by the Fund and the Portfolio will then receive the loaned securities within five days. During the period of such a loan, the Portfolio receives the income on the loaned securities and a loan fee and may thereby increase its total return. A Portfolio continues to receive interest or dividends on the securities loaned and simultaneously earns either interest on the investment of the cash collateral or fee income if the loan is otherwise collateralized. However, the Portfolio normally pays lending fees and related expenses from the interest or dividends earned on invested collateral. Should the borrower of the securities fail financially, there is a risk of delay in recovery of the securities or loss of rights in the collateral. However, loans are made only to borrowers which are approved by the Board of Directors and are deemed by Harding Loevner to be of good financial standing. The Portfolio may invest cash collateral it receives in connection with a loan of securities in securities of the U.S. Government and its agencies and other high quality short-term debt instruments. For purposes of complying with the Portfolio’s investment policies and restrictions, collateral received in connection with securities loans will not be deemed an asset of the Portfolio unless otherwise required by law.
For the period ended October 31, 2005, the market value of the securities on loan and the value of the related collateral were as follows:
| | | | | |
Portfolio | | Market Value of
Loaned Securities | | Collateral Value | |
International Equity | | | $ 10,174,788 | | | | $ 10,747,888 | | |
Emerging Markets | | | 18,780,638 | | | | 19,634,254 | | |
3. Significant Agreements and Transactions with Affiliates
The Fund’s Board of Directors has approved investment advisory agreements (the “Agreements”) with the Investment Adviser. The advisory fees are computed daily at an annual rate of 0.75% and 1.25% of the average daily net assets of International Equity and Emerging Markets, respectively.
In addition, the Fund has an administration agreement with Investors Bank & Trust Company, which provides certain accounting, clerical and bookkeeping services, corporate secretarial services and assistance in the preparation and filing of tax returns and reports to shareholders and the Securities and Exchange Commission. Under this agreement, International Equity and Emerging Markets incurred $275,729 and $263,349, respectively, in administration fees and $311,857 and $494,617, respectively, in custodian and accounting fees for the year ended October 31, 2005.
The Investment Adviser has voluntarily agreed to reduce its fee to the extent that aggregate expenses (exclusive of brokerage commissions, other investment expenses, interest on borrowings, taxes and extraordinary expenses) exceed an annual rate of 1.25% and 1.75%, respectively, of the average daily net assets of International Equity and Emerging Markets. For the year ended October 31, 2005, the Investment Adviser voluntarily waived $151,391 in investment advisory fees only from International Equity (Investors class $9).
Directors’ fees and related expenses for International Equity and Emerging Markets amounted to $41,101 and $33,516, respectively, for the year ended October 31, 2005.
The Fund has agreements with various financial intermediaries and “mutual fund supermarkets”, under which customers of these intermediaries may purchase and hold Fund shares. These intermediaries assess fees in consideration for providing certain distribution, account maintenance, record keeping and transactional services. In recognition of the savings of expenses to the Fund arising from the economies of scale associated with these intermediaries’ holding their customers’ shares in a
25
Harding, Loevner Funds, Inc.
Notes to Financial Statements (continued)
3. Significant Agreements and Transactions with Affiliates (continued)
single account with the Fund’s transfer agent, the Portfolio is authorized to pay to each intermediary up to 0.15% of its average daily net assets attributable to that intermediary for providing sub-accounting and related shareholder services (subject to the voluntary expense cap); the balance of the intermediaries’ fees are paid by the Fund. Because of the Fund’s voluntary cap on the Portfolios fees and expenses, the Fund paid a portion or all of each Portfolio’s share of these fees during the year ended October 31, 2005. The Fund may enter into similar arrangements with other intermediaries in the future.
4. Investment Transactions
Cost of purchases and proceeds from sales of investment securities, other than short-term investments, for the year ended October 31, 2005, were as follows for each Portfolio:
| | | | | |
Portfolio | | Purchase Cost of
Investment Securities | | Proceeds from Sales of
Investment Securities | |
International Equity | | | $ 118,695,682 | | | | $ 192,697,474 | | |
Emerging Markets | | | 636,245,353 | | | | 116,952,331 | | |
The cost of investments for federal income tax purposes and the components of net unrealized appreciation on investments at October 31, 2005, for each of the Portfolios were as follows:
| | | | | | | | | |
Portfolio | | Unrealized
Appreciation | | Unrealized
Depreciation | | Net | | Cost | |
International Equity | | | $ 85,204,626 | | | | $ 3,845,005 | | | $ 81,359,621 | | $ 229,631,161 | |
Emerging Markets | | | 94,861,455 | | | | 4,497,337 | | | 90,364,118 | | 611,107,341 | |
The unrealized depreciation on foreign currency for International Equity and Emerging Markets was $(25,331) and $(35,381), respectively, for the year ended October 31, 2005.
During the year ended October 31, 2004, the tax character of distributions paid from ordinary income was $2,167,605 and $62,351, respectively for International Equity and Emerging Markets.
During the year ended October 31, 2005, the tax character of distributions paid from ordinary income was $1,432,687 and $120,585, respectively for International Equity and Emerging Markets. The tax character of distributions paid from long-term capital gains was $2,143,956 for Emerging Markets.
As of October 31, 2005, the components of accumulated earnings/(deficit) on a tax basis were as follows:
Portfolio | | Undistributed
Ordinary
Income | | Undistributed
Long-Term
Capital Gains | | Accumulated
Capital and
Other Losses | | Unrealized
Appreciation/
(Depreciation)* | | Total
Accumulated
Earnings/(Deficit) | |
International Equity | | | $ 1,524,829 | | | | $ 253,927 | | | | $ — | | | | $ 81,334,290 | | | | $ 83,113,046 | | |
Emerging Markets | | | 1,227,975 | | | | 1,526,842 | | | | — | | | | 90,328,737 | | | | 93,083,554 | | |
* The difference between book basis and tax basis unrealized appreciation (depreciation) is attributable to the deferral of losses on wash sales and realization of unrealized appreciation of currency contracts.
At October 31, 2005, International Equity and Emerging Markets had no capital loss carryovers.
The International Equity utilized $40,745,543 of capital loss carryforwards in the current period to offset net realized capital gain for federal tax purposes.
26
Harding, Loevner Funds, Inc.
Notes to Financial Statements (continued)
4. Investment Transactions (continued)
Primarily as a result of differing book/tax treatment of foreign currency transactions and foreign capital gain tax expenses, the Fund made reclassifications among certain capital accounts. The reclassifications have no impact on the net assets of the Fund. As of October 31, 2005, the following reclassifications were made to the Statements of Net Assets.
| | | | | | | |
| | | | Accumulated Undistributed | | | |
| | | | Net Realized Gain/Loss on | | Accumulated | |
| | | | Investments & Foreign | | Undistributed | |
| | | | Currency Related | | Net Investment | |
Portfolio | | Paid-in Capital | | Transactions | | Income | |
International Equity | | | $ 1 | | | | $ 949,709 | | | | $ (949,710 | ) | |
Emerging Markets | | | 2,629 | | | | 1,621,579 | | | | (1,624,208 | ) | |
5. Foreign Exchange Contracts
The Portfolios, on occasion, enter into forward foreign exchange contracts in order to hedge their exposure to changes in foreign currency exchange rates on their foreign portfolio holdings. A forward foreign exchange contract is a commitment to purchase or sell a foreign currency at a future date at a negotiated forward rate. The gain or loss arising from the difference between the cost of the original contracts and the closing of such contracts is included in net realized gains or losses on foreign currency-related transactions. Fluctuations in the value of forward foreign exchange contracts are recorded for book purposes as unrealized appreciation or depreciation on assets and liabilities denominated in foreign currencies by the Portfolios. The Portfolios are also exposed to credit risk associated with counter party nonperformance on these forward foreign exchange contracts which is typically limited to the unrealized gain on each open contract.
The Portfolios enter into foreign currency transactions on the spot markets in order to pay for foreign investment purchases or to convert to dollars the proceeds from foreign investment sales or coupon interest receipts. As of October 31, 2005, the Portfolios had the following open foreign currency transactions to buy or sell currency on the spot markets:
Emerging Markets
| | | | | | | |
Settlement | | | | In Exchange For | | Net Unrealized | |
Date | | Sale | | (in U.S. dollars) | | Appreciation | |
11/4/2005 | | 806,563,668 HUF | | | $ 3,863,251 | | | | $ 11,441 | | |
| | | | | | | | | | | |
HUF Hungarian Forint
6. Capital Share Transactions
Transactions in capital stock for International Equity—Institutional Class were as follows for the years indicated:
| | | | | |
| | Year Ended | | Year Ended | |
| | October 31, 2005 | | October 31, 2004 | |
| | Shares | | Amount | | Shares | | Amount | |
Shares sold | | 803,180 | | $ 11,311,197 | | 4,113,187 | | $ 49,810,442 | |
Shares issued upon reinvestment of dividends | | 98,172 | | 1,313,542 | | 153,692 | | 1,833,540 | |
| | 901,352 | | 12,624,739 | | 4,266,879 | | 51,643,982 | |
Shares redeemed | | (6,174,345 | ) | (88,011,589 | ) | (9,832,119 | ) | (119,352,363 | ) |
Net decrease | | (5,272,993 | ) | $ (75,386,850 | ) | (5,565,240 | ) | $ (67,708,381 | ) |
27
Harding, Loevner Funds, Inc.
Notes to Financial Statements (continued)
6. Capital Share Transactions (continued)
Transactions in capital stock for International Equity—Investor Class were as follows for the period indicated:
| | | |
| | Period From | |
| | September 30, 2005 | |
| | to October 31, 2005 | |
| | Shares | | Amount | |
Shares sold | | 35,213 | | $ 521,999 | |
Shares issued upon reinvestment of dividends | | — | | — | |
| | 35,213 | | 521,999 | |
Shares redeemed | | (1,003 | ) | (14,714 | ) |
Net increase | | 34,210 | | $ 507,285 | |
Transactions in capital stock for Emerging Markets were as follows for the years indicated:
| | | | | |
| | Year Ended | | Year Ended | |
| | October 31, 2005 | | October 31, 2004 | |
| | Shares | | Amount | | Shares | | Amount | |
Shares sold | | 21,717,131 | | $ 601,485,970 | | 1,446,775 | | $ 30,147,050 | |
Shares issued upon reinvestment of dividends | | 90,369 | | 2,223,089 | | 3,013 | | 58,908 | |
| | 21,807,500 | | 603,709,059 | | 1,449,788 | | 30,205,958 | |
Shares redeemed | | (2,078,552 | ) | (58,688,332 | ) | (87,648 | ) | (1,798,399 | ) |
Net increase | | 19,728,948 | | $ 545,020,727 | | 1,362,140 | | $ 28,407,559 | |
Redemptions made within 90 days of purchase are subject to a redemption fee equal to 2% of the amount redeemed. For the year ended October 31, 2004, the Emerging Markets Portfolio received $7,670 in redemption fees, and for the year ended October 31, 2005, Emerging Markets and International Equity - Institutional Class received $214,731 and $400 in redemption fees, respectively, related to transactions in shares of common stock on the Statements of Changes in Net Assets.
7. Repurchase Agreements
Each Portfolio may enter into repurchase agreements under which a bank or securities firm that is a primary or reporting dealer in U.S. Government securities agrees, upon entering into a contract, to sell such securities to a Portfolio and repurchase such securities from such Portfolio at a mutually agreed upon price and date.
Each Portfolio may engage in repurchase transactions with parties selected on the basis of such party’s creditworthiness. Securities purchased subject to repurchase agreements must have an aggregate market value greater than or equal to the repurchase price plus accrued interest at all times. If the value of the underlying securities falls below the value of the repurchase price plus accrued interest, the Portfolio will require the seller to deposit additional collateral by the next business day. If the request for additional collateral is not met, or the seller defaults on its repurchase obligation, the Portfolio maintains the right to sell the underlying securities at market value and may claim any resulting loss against the seller.
8. Concentration of Risk
Investing in securities of foreign issuers and currency transactions may involve certain considerations and risks not typically associated with investments in the United States. These risks include revaluation of currencies, adverse fluctuations in foreign currency values and possible adverse political, social and economic developments, including those particular to a specific industry, country or region, which could cause the securities and their markets to be less liquid and prices more volatile than those of comparable U.S. companies and U.S. government securities. These risks are greater with respect to securities of issuers located in emerging market countries in which the International Equity and Emerging Markets are authorized to invest.
28
Harding, Loevner Funds, Inc.
Report of Independent Registered Public Accounting Firm
Shareholders and Board of Directors
Harding, Loevner Funds, Inc.
We have audited the accompanying statements of net assets of Harding, Loevner Funds, Inc. (comprising, the International Equity Portfolio and the Emerging Markets Portfolio), (collectively the “Portfolios”) as of October 31, 2005, and the related statements of operations for the year then ended, the statements of changes in net assets for each of the two years in the period then ended and the financial highlights for each of the periods indicated therein. These financial statements and financial highlights are the responsibility of the Portfolios’ management. Our responsibility is to express an opinion on these financial statements and financial highlights based on our audits.
We conducted our audits in accordance with the standards of the Public Company Accounting Oversight Board (United States). Those standards require that we plan and perform the audit to obtain reasonable assurance about whether the financial statements and financial highlights are free of material misstatement. We were not engaged to perform an audit of the Portfolios’ internal control over financial reporting. Our audits included consideration of internal control over financial reporting as a basis for designing audit procedures that are appropriate in the circumstances, but not for the purpose of expressing an opinion on the effectiveness of the Portfolios’ internal control over financial reporting. Accordingly, we express no such opinion. An audit also includes examining, on a test basis, evidence supporting the amounts and disclosures in the financial statements and financial highlights, assessing the accounting principles used and significant estimates made by management, and evaluating the overall financial statement presentation. Our procedures included confirmation of securities owned as of October 31, 2005 by correspondence with the custodian and others or by other appropriate auditing procedures where replies from others were not received . We believe that our audits provide a reasonable basis for our opinion.
In our opinion, the financial statements and financial highlights referred to above present fairly, in all material respects, the financial position of each of the respective portfolios comprising Harding, Loevner Funds, Inc. at October 31, 2005, the results of their operations for the year then ended, the changes in their net assets for each of the two years in the period then ended and the financial highlights for each of the indicated periods, in conformity with U.S. generally accepted accounting principles.
| 
|
New York, New York | |
December 6, 2005 | |
29
Harding, Loevner Funds, Inc.
Supplemental Tax Information
International Equity and Emerging Markets paid qualifying foreign taxes of $741,122 and $519,864 and earned $5,053,664 and $7,682,515 foreign source income during the year ended October 31, 2005, respectively. Pursuant to Section 853 of the Internal Revenue Code, International Equity and Emerging Markets designated $0.0367 and $0.0229 per share as foreign taxes paid and $0.2504 and $0.3381 per share as income earned from foreign sources for the year ended October 31, 2005, respectively.
International Equity and Emerging Markets had qualifying dividend income of $3,825,806 and $5,294,163 during the year ended October 31, 2005, respectively.
Emerging Markets had long-term capital gains of $2,143,956 during the year ended October 31, 2005.
30
Harding, Loevner Funds, Inc.
Supplemental Tax Information (continued)
The International Equity and Emerging Markets Portfolios have elected to pass through the credit for taxes paid in foreign countries during its fiscal year ended October 31, 2005. In accordance with current tax laws, the Foreign Income and Foreign Tax per share (for a share outstanding on October 31, 2005) is as follows:
| | International Equity | | | | Emerging Markets |
Country | | Foreign Tax | | Gross Foreign
Dividends | | Country | | Foreign Tax | | Gross Foreign
Dividends |
| | | | | | | | | | |
Bermuda | | 0.0164 | | 0.0000 | | Bermuda | | 0.0060 | | 0.0000 |
Canada | | 0.0067 | | 0.0009 | | Brazil | | 0.0238 | | 0.0006 |
France | | 0.0362 | | 0.0049 | | Cayman Islands | | 0.0044 | | 0.0000 |
Germany | | 0.0108 | | 0.0016 | | Chile | | 0.0071 | | 0.0000 |
Hong Kong | | 0.0195 | | 0.0000 | | Egypt | | 0.0178 | | 0.0000 |
India | | 0.0085 | | 0.0000 | | Hong Kong | | 0.0214 | | 0.0000 |
Ireland | | 0.0048 | | 0.0000 | | Hungary | | 0.0039 | | 0.0006 |
Japan | | 0.0273 | | 0.0019 | | India | | 0.0214 | | 0.0000 |
Mexico | | 0.0035 | | 0.0000 | | Indonesia | | 0.0139 | | 0.0021 |
Netherlands | | 0.0100 | | 0.0015 | | Luxembourg | | 0.0059 | | 0.0000 |
South Africa | | 0.0107 | | 0.0000 | | Mexico | | 0.0212 | | 0.0000 |
South Korea | | 0.0037 | | 0.0001 | | Philippine Islands | | 0.0034 | | 0.0000 |
Spain | | 0.0208 | | 0.0031 | | Poland | | 0.0149 | | 0.0022 |
Sweden | | 0.0170 | | 0.0025 | | Russia | | 0.0087 | | 0.0007 |
Switzerland | | 0.0381 | | 0.0034 | | South Africa | | 0.0611 | | 0.0000 |
Taiwan | | 0.0118 | | 0.0029 | | South Korea | | 0.0183 | | 0.0026 |
Thailand | | 0.0045 | | 0.0138 | | Taiwan | | 0.0479 | | 0.0117 |
| | | | | | Thailand | | 0.0182 | | 0.0024 |
| | | | | | Turkey | | 0.0188 | | 0.0000 |
31
Harding, Loevner Funds, Inc.
Approval of Investment Adviser Agreements
October 31, 2005 (unaudited)
The Board of Directors of the Harding, Loevner Funds, Inc. (the “Fund”), and by a separate vote, the Directors of the Fund (the “Independent Directors”) who are not “interested persons” as defined in the Investment Company Act of 1940, as amended (the “1940 Act”), of the Fund, approved the continuance of the Investment Adviser Agreements between the Fund (on behalf of each of the International Equity Portfolio, the Global Equity Portfolio and the Emerging Markets Portfolio (each a “Portfolio” and collectively the “Portfolios”)) and Harding, Loevner Management, L.P. (“HLM” or “Investment Adviser”) with respect to each Portfolio at a meeting held on September 7, 2005.
As part of its review, the Board carefully considered the following: (i) a memorandum from Dechert, LLP, counsel to the Fund, that explained the Directors’ fiduciary duties and obligations under Sections 15 and 36(b) of the 1940 Act as well as the Fund’s disclosure requirements; (ii) comparative fee and performance information; (iii) information on soft dollar transactions; (iv) code of ethics compliance reports; and (v) HLM’s financial statements for the periods ended June 30, 2004 and June 30, 2005.
The Board also considered the following information: (i) a detailed profitability analysis putting the Fund into the context of HLM’s overall advisory business and highlighting the revenues to and expenses of the Investment Adviser in managing the Fund; (ii) the effect of the fee waivers for the International Equity Portfolio and Global Equity Portfolio on net Fund expenses; (iii) the expenses attributable to the Fund, as compared to the expenses of HLM’s overall business, including the allocation of expenses attributable to the Fund, such as direct and indirect costs, overhead and other expenses; (iv) actual expenses for calendar year 2004 and estimated expenses for calendar year 2005; (v) total expenses before distribution costs, such as communications to third parties and fees paid to intermediaries; (vi) how the ownership structure of the Investment Adviser affects certain elements of the Investment Adviser’s profitability analysis (including that the Investment Adviser was a closely held company owned by employees and that for many employees an important part of their compensation was their ownership of equity in the firm; (vii) the long-term profit and loss summary for HLM; (viii) how overhead operating expenses for marketing were distinguished from distribution costs; and (ix) increases in distribution fees paid to third parties as assets under management increase and as the Portfolios become available on additional platforms.
The Board considered a number of factors in evaluating HLM, including: (i) the nature and quality of services provided; (ii) the investment performance of the Portfolios; (iii) the cost of the services provided; (iv) the profitability of the Investment Adviser; (v) the realization of economies of scale; and (vi) comparison of fees and services.
Quality and Nature of the Services
There was a clear consensus among the Independent Directors that HLM was an organization which placed the interests of the Fund’s shareholders first, did an excellent job of communicating with the Fund’s Board and has demonstrated a positive culture of compliance. These determinations were not based merely on the materials provided at the present meeting, but on the Board’s ongoing dealings with HLM. With regard to these areas, the Board was satisfied that the quality and nature of the services provided by HLM argued in favor of renewing the advisory agreement.
The Board then considered the investment performance for each of the three Fund Portfolios. The Board had available to it the qualifications, background and responsibilities of the Portfolios’ portfolio management team and senior management of HLM and recognized that these persons report to the Board regularly. The Board had been provided by HLM copies of investment performance data obtained from Bloomberg and Morningstar for funds in the Lipper International Funds Index and a number of other international equity funds; funds in the Lipper Global Funds Index and a number of other global equity funds; and funds in the Lipper Emerging Market Funds Index and a number of other emerging market funds (collectively the “Peer Group Data”). The Peer Group Data included fund management fees, total expense ratios, net assets, calendar year-to-date return and 1-, 3- and 5-year returns, as well as median and average data with regard to the foregoing.
With respect to the Emerging Markets Portfolio, the Independent Directors reviewed the Fund’s strong recent and historical performance which, net of fees, has outperformed its benchmarks (the MSCI Emerging Markets Index and the Lipper Emerging Markets Index) over the 1-, 3- and 5-year periods and has performed better than the average and median performance of its Peer Group during those periods. Based on this performance, the Board concluded that performance factors warranted consideration in favor of renewal. With respect to the International Equity and Global Equity portfolios, the Independent Directors determined that HLM had done an excellent job in addressing past performance issues for the Portfolios, noting that a combination of market forces (such as the style cycle favoring the portfolios’ investment strategies)
32
Harding, Loevner Funds, Inc.
Approval of Investment Adviser Agreements (continued)
October 31, 2005 (unaudited)
and reorganization efforts undertaken over the past year by management had shown improved performance over the past year. The Board noted that the Global Equity Portfolio’s one year return net of fees exceeded both the MSCI All Country World Index and Lipper Global Equity Fund index, and also exceeded the median and average performance for the Peer Group. With respect to the International Equity Portfolio, the Board noted that the Portfolio’s performance, net of fees, exceeded both the Portfolio’s two benchmarks (the MSCI All Country ex USA Index and the Lipper International Equity Fund Index) as well as the average and median performance of its peer group.
Based on their review of the data provided by HLM and all other relevant data, the Independent Directors concluded that they were satisfied with the quality of services provided by HLM to shareholders.
Fees and Costs of Providing Services
The Independent Directors considered a number of related factors in assessing the costs proposed by HLM to be charged for providing advisory services to the Fund, including: (i) a comparison of advisory and total Portfolio fees with competing fund products; (ii) a review of HLM’s profitability information; (iii) consideration of whether any benefits or economies of scale are provided to shareholders; and (iv) consideration of whether HLM has received any ancillary or “fall-out” benefits in connection with its management of the portfolios.
The Independent Directors reviewed the Peer Group Data provided by HLM with respect to advisory fees, net assets and total expenses and concluded that HLM charged competitive fees to each of the Portfolios (noting the disadvantage of running a fund the size of Global Equity Portfolio). For the Global Equity Portfolio, management fees were above the Peer Group median and averages, though total expenses were below the median and average of the Peer Group notwithstanding its size. The International Equity Portfolio’s management fee and total expense ratio were below the median and average of the Peer Group. For the Emerging Markets Portfolio, the Board noted that management fees and total expenses were above median and averages for their Peer Group, but took into account the Portfolio’s strong performance records, the Portfolio’s size in comparison to its Peer Group and the fact that there were a number of funds with similar management fees and higher overall expenses. The Independent Directors noted HLM’s ongoing efforts to increase its asset base and discussed the growth in assets for the Emerging Markets Portfolio.
The Independent Directors reviewed the financial statements of HLM and HLM Holdings, Inc. (HLM’s general partner), which showed the net income of both entities, the revenues received and the expenses incurred, including those paid for employee salaries. The Independent Directors considered any ancillary benefits derived by HLM in connection with its management of the portfolios, and reviewed the soft dollar report. The Independent Directors also reviewed a profitability analysis prepared by HLM and concluded that HLM’s profits were reasonable.
Based on the foregoing, the Board concluded that the fees charged by HLM are within the range that might be obtained in an arm’s length negotiation. The Board based their evaluation on all material factors discussed above, including (i) the terms of the agreement; (ii) the reasonableness of the advisory fee in light of the nature and quality of the services provided and any additional benefits received by HLM in connection with providing services to the Fund; (iii) the nature, quality, cost and extent of the services performed by HLM; (iv) the expense ratios of the portfolios as compared to the expense ratios of similar funds; and (v) the overall organization and experience of HLM, as well as HLM’s profitability and financial condition. In arriving at its decision, the Independent Directors did not single out any one factor or group of factors as being more important than other factors, but considered all factors together.
After extensive discussion, both in general session and in executive session of the Independent Directors meeting alone, and based on a consideration of these factors in their totality, the Board, including the Independent Directors voting separately, unanimously determined to continue the Investment Advisory Agreements for each of the International Equity Portfolio, Global Equity Portfolio and Emerging Markets Portfolio.
33
Harding, Loevner Funds, Inc.
Directors and Principal Officers of the Fund
Disinterested Directors:
Name,
Address and
Age | | Position
with the
Fund | | Term of Office
and Length of
Time Served* | | Principal
Occupation(s)
During Past
Five Years | | Number of
Portfolios in
Fund
Complex
Overseen By
Director | | Other
Directorships
Held by
Director |
R. Kelly Doherty
41 Post Road
Bernardsville, NJ 07924 Age, 47 | | Director | | Indefinite;
Director since
2004 | | Cayman Partners (private investment vehicle), Investor,
1/99-present | | 4 | | Cyota Inc.; L.P.
Thebault & Co.;
The Perk School |
Jane A. Freeman
c/o Scientific Learning 300 Frank Ogawa Plaza Oakland, CA
Age, 52 | | Director | | Indefinite;
Director since
1996 | | Scientific Learning Corporation (Education Software), Chief Financial Officer, 1/00-present; Treasurer and Vice President, Finance & Business Development, 9/99-1/00 | | 4 | | None |
Samuel R. Karetsky 900 Third Avenue,
26th Fl.
New York, NY 10022
Age, 60 | | Director | | Indefinite;
Director since
1998 | | The Karetsky Group, LLC (Advisory Firm), 1/03-present; Wetherby Asset Management, 2004-present; European Investors Inc., Managing Director, 11/98-12/02 | | 4 | | None |
Raymond J. Clark 66 Greenway Terrace Princeton, NJ 08540
Age, 70 | | Director | | Indefinite;
Director since
2004 | | The Woodrow Wilson National Fellowship Foundation, Treasurer, 08/04-present; Wellesley College, Interim Vice President of Finance and Treasurer, 10/03-6/04; Princeton University, Treasurer, 1987-2001. | | 4 | | Princeton
Healthcare System;
American Red Cross of Central New Jersey |
Interested Director:
Name,
Address and
Age | | Position
with the
Fund | | Term of Office
and Length Of
Time Served* | | Principal
Occupation(s)
During Past
Five Years | | Number of
Portfolios in
Fund
Complex
Overseen by
Director | | Other
Directorships
Held by
Director |
David R. Loevner** Harding, Loevner Management, L.P.
50 Division Street,
Suite 401
Somerville, NJ 08876
Age, 51 | | Director,
President and Chairman of the Board | | Indefinite;
Director,
President and Chairman of the Board since 1996 | | Harding, Loevner
Management, L.P., President
and CEO, 7/89-present. | | 4 | | None |
* Each director is elected to serve in accordance with the Articles of Incorporation and By-Laws of the Fund until his or her successor is duly elected and qualified.
** David R. Loevner is considered an “interested person” of the Fund as defined in the Investment Company Act of 1940, as amended, because he serves as President and CEO of Harding, Loevner Management, L.P., the Fund’s investment adviser.
34
Harding, Loevner Funds, Inc.
Directors and Principal Officers of the Fund (continued)
Principal Officers of the Fund
Name,
Address and
Age | | Position
with the Fund | | Term of Office
and Length of
Time Served¨ | | Principal
Occupation (s)
During Past
Five Years |
Richard Reiter
Harding, Loevner Management, L.P.
50 Division Street, Suite 401
Somerville, NJ 08876
Age, 39 | | Treasurer and Chief
Financial
Officer | | 1 year; Treasurer and Chief Financial Officer since September 2002 | | Harding, Loevner Management, L.P., Portfolio Manager 1/01-present; Product Information Manager, 4/96-12/00. |
Patrice Singleton
Harding, Loevner Management, L.P.
50 Division Street, Suite 401
Somerville, NJ 08876
Age, 52 | | Vice President | | 1 year; Vice President since 2002 | | Harding, Loevner Management, L.P., Director and Chief Compliance Officer, 7/94-present. |
Susan C. Mosher
Investors Bank & Trust Company
200 Clarendon Street
Boston, MA 02116
Age, 50 | | Secretary and Chief Compliance Officer | | 1 year; Secretary since 1999; Chief Compliance Officer since 2004 | | Investors Bank & Trust Company, Senior Director and Senior Counsel 1/01-present; Director and Counsel 8/95-12/00. |
Brendan J. O’Neill
Investors Bank & Trust Company
200 Clarendon Street
Boston, MA 02116
Age, 37 | | Assistant Treasurer | | 1 year; Assistant Treasurer since 2004 | | Investors Bank & Trust Company, Director 1/05-present; Senior Manager 11/02-12/04; Manager 7/00-10/02. |
Rainer L.C. Frost
Investors Bank & Trust Company
200 Clarendon Street
Boston, MA 02116
Age, 48 | | Assistant Secretary | | 1 year; Assistant Secretary since 2005 | | Investors Bank & Trust Company, Director and Counsel 6/05-present; Principal and General Counsel, Clarity Group 9/00-6/05; Chief Administration Officer, Executive Vice-President and General Counsel, GoldK, Inc. 3/01-6/02; Chief Executive Officer and General Counsel Norfox Software 9/99-9/00. |
¨ Officers are elected to hold such office until their successor is elected and qualified to carry out the duties and responsibilities of their office, or until he or she resigns or is removed from office.
The Fund’s Statement of Additional Information contains additional information about the Directors of the Fund and is available, without charge, upon request, by calling 1-877-435-8105.
35
Harding, Loevner Funds, Inc.
Supplemental Information
Quarterly Form N-Q Portfolio Schedule
Each portfolio will file its complete schedule with the Security and Exchange Commission (“SEC”) on Form N-Q at the end of the first and third fiscal quarters within 60 days of the end of the quarter to which it relates. The Portfolio’s Form N-Q will be available on the SEC’s website at www.sec.gov and may also be reviewed and copied at the SEC’s Public Reference Room. Additionally, they are available upon request by calling 1-877-435-8105.
Proxy Voting Record
The Fund’s proxy voting record relating to the portfolio securities during the most recent 12-month period ended June 30 is available on the Fund’s website at www.hardingloevner.com and on the Commission’s website at www.sec.gov.
Proxy Voting Policies and Procedures
A description of the Fund’s proxy voting policies and procedures are located in the Statement of Additional Information and is available without charge, upon request, by calling 1-877-435-8105 or on the Commission’s website at www.sec.gov.
36
HARDING, LOEVNER FUNDS, INC.
Officers, Directors and Responsible Parties
OFFICERS AND DIRECTORS
Jane A. Freeman
Director of the Fund
Samuel R. Karetsky
Director of the Fund
R. Kelly Doherty
Director of the Fund
Raymond J. Clark
Director of the Fund
David R. Loevner
Director, President and Chairman of the Board of the Fund
Patrice Singleton
Vice President of the Fund
Susan C. Mosher
Secretary and Chief Compliance Officer of the Fund
Richard Reiter
Chief Financial Officer and Treasurer of the Fund
Brendan J. O’Neill
Assistant Treasurer of the Fund
INVESTMENT ADVISOR
Harding, Loevner Management, L.P.
50 Division Street, Suite 401
Somerville, NJ 08876
DISTRIBUTOR
Quasar Distributors, LLC
615 East Michigan Street
Milwaukee, WI 53202
ADMINISTRATOR, CUSTODIAN AND FUND ACCOUNTING AGENT
Investors Bank & Trust Company
P.O. Box 9130
Boston, MA 02117
TRANSFER AND DIVIDEND DISBURSING AGENT
Investors Bank & Trust Company
P.O. Box 9130
Boston, MA 02117
LEGAL COUNCIL
Dechert
1775 Eye Street, N.W.
Washington, D.C. 20006-2401
INDEPENDENT AUDITORS
Ernst & Young LLP
5 Times Square
New York, NY
This report is intended for shareholders of Harding Loevner Funds. It may not be used as sales literature unless preceded or accompanied by the current prospectus, which gives details about charges, expenses, investment objectives, risks and policies of the Portfolios.
Annual Report | | October 31, 2005 |

HARDING • LOEVNER®
Family of Mutual Funds
• International Equity Portfolio Institutional Class
• Institutional Emerging Markets Portfolio
• Global Equity Portfolio Institutional Class
Harding Loevner Funds, Inc.
P.O. Box 642, OPS 22
Boston, MA 02117-0642
Fax: 617-927-8400
1.877.435.8105 • www.hardingloevner.com
Harding, Loevner Funds, Inc.
Table of Contents
For use only when preceded or accompanied by a prospectus. Read the prospectus carefully before you invest or send money.
Harding, Loevner Funds, Inc.
Hypothetical Expense Example
October 31, 2005 (unaudited)
As a shareholder of the Portfolio, you incur two types of costs: (1) transaction costs, including brokerage commissions on purchases and sales of fund shares; and (2) ongoing costs, including management fees and other fund expenses. The following example is intended to help you understand your ongoing costs (in dollars and cents) of investing in the Portfolio and to compare these costs with the ongoing costs of investing in other mutual funds.
The example is based on an investment of $1,000 invested at the beginning of the period and held from May 1, 2005 to October 31, 2005 for the Institutional Class of International Equity Portfolio and the Global Equity Portfolio, from September 30, 2005 (commencement of operations) to October 31, 2005 for the Investor Class of International Equity Portfolio and from October 17, 2005 (commencement of operations) through October 31, 2005 for the Institutional Emerging Markets Portfolio.
Actual Expenses
The first line under the Portfolio in the table below provides information about actual account values and actual expenses. You may use the information in this line, together with the amount you invested, to estimate the expenses that you paid over the period. Simply divide your account value by $1,000 (for example, an $8,600 account value divided by $1,000 = 8.6), then multiply the result by the number in the first line for the Portfolio under the heading entitled “Expenses Paid During Period” to estimate the expenses you paid on your account during this period.
Hypothetical Example for Comparison Purposes
The second line under the Portfolio in the table below provides information about hypothetical account values and hypothetical expenses based on the Portfolio’s actual expense ratio and an assumed rate of return of 5% per year before expenses, which is not the Portfolio’s actual return. The hypothetical account values and expenses may not be used to estimate the actual ending account balance or expenses you paid for the period. You may use this information to compare the ongoing costs of investing in the Portfolio and other funds. To do so, compare this 5% hypothetical example with the 5% hypothetical examples that appear in the shareholder reports of the other funds.
Please note that the expenses shown in the table are meant to highlight your ongoing costs only and do not reflect any transactional costs, such as brokerage commissions paid on purchases and sales of fund shares. Therefore, the second line under the Portfolio in the table is useful in comparing ongoing costs only, and will not help you determine the relative total costs of owning different funds. In addition, if these transactional costs were included, your costs would have been higher.
| | | | | | | | | | |
| | | Beginning
Account Value
May 1, 2005 | | Ending Account
Value
October 31, 2005 | | Annualized
Expense Ratio | | Expenses Paid
During Period*
(May 1, 2005 to
October 31, 2005) | |
| International Equity Portfolio, Institutional Class | | | | | | | | | | | | | | | | | |
| Actual | | | $ | 1,000.00 | | | | $ | 1,098.00 | | | | 1.00 | % | | | $ | 5.29 | | |
| Hypothetical (5% return before expenses) | | | 1,000.00 | | | | 1,020.16 | | | | 1.00 | % | | | 5.09 | | |
| Global Equity Portfolio, Institutional Class | | | | | | | | | | | | | | | | | |
| Actual | | | $ | 1,000.00 | | | | $ | 1,118.70 | | | | 1.25 | % | | | $ | 6.68 | | |
| Hypothetical (5% return before expenses) | | | 1,000.00 | | | | 1,018.90 | | | | 1.25 | % | | | 6.36 | | |
| | | | | | | | | | | | | | | | | | |
* Expenses are calculated using the Portfolio’s annualized expense ratio (as disclosed in the table), multiplied by the average account value for the period, multiplied by number of days in the period (184 days), and divided by the number of days in the year (365 days).
Harding, Loevner Funds, Inc.
Hypothetical Expense Example (continued)
October 31, 2005 (unaudited)
| | | | | | | | | | |
| | | Beginning
Account Value
September 30, 2005 | | Ending Account
Value
October 31, 2005 | | Annualized
Expense Ratio | | Expenses Paid
During Period*
(September 30, 2005 to
October 31, 2005) | |
| International Equity Portfolio, Investor Class | | | | | | | | | | | | | | | | | |
| Actual | | | $ | 1,000.00 | | | | $ | 953.90 | | | | 1.25% | | | | $ | 1.07 | | |
| Hypothetical (5% return before expenses) | | | 1,000.00 | | | | 1,003.29 | | | | 1.25% | | | | 1.10 | | |
| | | | | | | | | | | | | | | | | | |
| | | | | | | | | | | | | | | | | | | | | |
* Expenses are calculated using each Portfolio’s annualized expense ratio (as disclosed in the table), multiplied by the average account value for the period, multiplied by number of days in the period (32 days), and divided by the number of days in the year (365 days).
| | | | | | | | | | |
| | | Beginning
Account Value | | Ending Account
Value | | Annualized | | Expenses Paid
During Period*
(October 17, 2005 to | |
| | | October 17, 2005 | | October 31, 2005 | | Expense Ratio | | October 31, 2005) | |
| Institutional Emerging Markets Portfolio | | | | | | | | | | | | | | | | | |
| Actual | | | $ | 1,000.00 | | | | $ | 993.00 | | | | 1.30% | | | | $ | 0.53 | | |
| Hypothetical (5% return before expenses) | | | 1,000.00 | | | | 1,001.52 | | | | 1.30% | | | | 0.53 | | |
| | | | | | | | | | | | | | | | | | |
| | | | | | | | | | | | | | | | | | | | | |
* Expenses are calculated using the Portfolio’s annualized expense ratio (as disclosed in the table), multiplied by the average account value for the period, multiplied by number of days in the period (15 days), and divided by the number of days in the year (365 days).
Harding, Loevner Funds, Inc.
International Equity Portfolio — Overview
(unaudited)

| | | | |
| | | Returns for the Period Ended October 31, 2005 | |
| | | | | | | | | Average Annualized | |
| | | Cumulative Total Returns | | Total Return | |
| FUND NAME | | Last 12 Months | | 5 YR | | 10 YR | | 5 YR | | 10 YR | |
| International Equity Portfolio (11/1/94) | | | 20.58% | | | 7.83% | | 75.02% | | | 1.52% | | | | 5.76% | | |
| MSCI All Country World ex USA Free (Net dividend) | | | 20.06% | | | 23.62% | | 84.42% | | | 4.33% | | | | 6.31% | | |
| Lipper International Fund Index | | | 18.90% | | | 19.43% | | 103.12% | | | 3.62% | | | | 7.34% | | |
| | | | | | | | | | | | | | | | | | |
Performance data quoted represents past performance and does not guarantee future results. The investment return and principal value of an investment will fluctuate so that an investor’s shares, when redeemed, may be worth more or less than their original cost. Performance current to the most recent month end may be lower or higher than the performance quoted and may be obtained by visiting the website at www.hardingloevner.com.
Investment return reflects voluntary fee waivers in effect. Absence such waivers, total return would be reduced. The performance provided does not reflect the deduction of taxes that a shareholder would pay on Portfolio distributions.
1
Harding, Loevner Funds, Inc.
International Equity Portfolio — Overview (continued)
(unaudited)
The Institutional share class of the Portfolio rose in value by 20.58% net of fees in the financial year ending October 31, 2005. In comparison, the benchmark MSCI All Country World ex-US Index rose by 20.06%—its value component by 20.38%, and its growth component by 19.75%. Please refer to the preceding page of the report for complete performance information.
Relative performance during the year was positive, though modest. Our quality-and-growth-oriented investment style, which was out of favor in the two preceding years, ceased to be a drag in the year just ended. Stocks of high quality companies, those with strong finances, good management, and the ability both to defend margins and generate growth over long periods of time, held their own against stocks of riskier companies, with more cyclical or less durable businesses. In an environment in which nominal yields remain low, investors hungry for high returns are prepared to seek them in risky assets. Rising interest rates bring reminders of the dangers, and increasing caution. We feel that the extreme relative under pricing of high quality companies (noted emphatically in these pages last year) is at last unwinding, and that our tenacity in adhering to our long-held investment philosophy, which focuses exclusively on such companies, is again being rewarded.
Amidst a benign business environment, corporate earnings growth has been surprisingly strong. We think growth will become increasingly hard to achieve, and thus increasingly valued by investors. US interest rates are rising steadily, gasoline and other energy bills are taking an increasing share of consumers’ wallet, while their confidence is being sapped by evidence that house prices are beginning to wobble. It could be that the much-predicted weakening of US consumer demand is now very close.
Good managements continue to focus on costs, and to seek growth in faster-growing economies in Asia, and Latin America as well as in Central and Eastern Europe. Opportunities to grow in the larger, but far more mature markets in Western Europe are few. We worry that this is a longer term, not just a cyclical phenomenon. Populations are not growing, and immigration is modest, exacerbating the weakness of demand that would in any case be expected when unemployment is high and job security is low.
Japan faces a similar long-term demographic drag, but a brighter near-term cyclical outlook. We have long observed the self-improvement that Japanese companies have undertaken in recent years, but now we observe that the operating environment has also changed for the better. The causes of long-lasting changes in direction of consumer confidence are mysterious (not just to us, but to most forecasters), but it does now appear that there has been a change in the national psyche towards optimism. We believe this change may lead to a long-lasting upturn in consumer spending as well as in corporate investment.
The pace of corporate investment in developing economies has not been an issue. Multi-nationals are seeking sources of growth, governments are flush with cash, especially in emerging Asia, and consumers are increasingly turning from being consistent savers to being consistent spenders. The result has changed the outlook for several global industries, most notably for those in the Materials sector, as well for the capital goods industry as manufacturing capacity is expanded and pent-up demand for better public infrastructure is met.
Our view that companies face difficulty in growing in mature economies and that developing economies will thus be an important source of growth for all companies is not new. Indeed, our world view, formed from the many meetings and contacts we have with companies in all sectors and geographies, has undergone little change in this regard. As a result, the Portfolio is little changed in terms of either geographical or industrial exposure. The companies we bought are from a wide range of industries and geographies, but are, we believe, going to grow fast, and for a long time. In Energy we continued our policy of avoiding the oil majors, with diversified, but lower revenue growth opportunities, in favor of companies with well-defined opportunities: in the case of BG Group from the growth in demand of natural gas, and in the case of Gazprom from increased investment in production and distribution capacity to enable it to monetize its vast quantities of Russian energy reserves. In Financials, too, we sought geographies and segments that can grow fast while the industry as a whole does not. We bought a holding in an Austrian bank, Erste, which is becoming a market leader in Central Europe, as well as a Polish bank, Pekao, where we are directly benefiting from large, and, we think, sustainable growth in consumer demand in that country. Elsewhere in the sector, we bought a new holding in an Indian bank, ICICI, but financed it with a partial sale of its competitor, HDFC Bank. In China, we bought a new holding in port operator, China Merchants. These new emerging market holdings were offset by sales of two Thai companies, cellular operator Advanced Info Services, and Bangkok Bank, so that overall exposure to emerging markets was roughly unchanged. There were a number of other transactions during the year, all driven by company specific or price issues.
It has been a good year for our shareholders. Markets returns have been strong, and Portfolio returns stronger still. Our focus on high quality growth companies is, of course, unchanged. Our conviction that they offer the prospect of returns above those of the market as a whole is also unchanged.
2
Harding, Loevner Funds, Inc.
International Equity Portfolio — Overview (continued)
(unaudited)
Past performance does not guarantee future results.
The Portfolio invests in foreign securities, which will involve greater volatility and political, economic and currency risks and differences in accounting methods. It also invests in emerging markets, which involve unique risks, such as exposure to economies less diverse and mature than the US or other more established foreign markets. Economic and political instability may cause larger price changes in emerging markets securities than other foreign securities.
Fund holdings and/or sector allocations are subject to change at any time and are not recommendations to buy or sell any security.
MSCI All Country World Free ex-US Index includes all developed and emerging markets in the MSCI universe of 48 countries, excluding the US, with Free versions of countries where they exist. Net dividends reinvested.
Lipper International Fund Index, an unmanaged index published by Lipper Analytical Services, Inc., includes 30 funds that are generally similar to the Fund, although some funds in the index may have somewhat different investment policies or objectives.
You cannot invest directly in an Index.
3
Harding, Loevner Funds, Inc.
International Equity Portfolio
Statement of Net Assets
| | Percentage of | |
Industry | | Net Assets | |
Advertising Agencies | | | 2.6 | % | |
Automobiles | | | 1.3 | | |
Automotive | | | 1.7 | | |
Banks | | | 17.2 | | |
Beverages, Food & Tobacco | | | 4.9 | | |
Commercial Banks | | | 2.4 | | |
Construction Materials | | | 1.6 | | |
Cosmetics & Personal Care | | | 1.6 | | |
Discount Stores | | | 1.7 | | |
Diversified Electronics | | | 2.1 | | |
Diversified Food | | | 4.0 | | |
Electric Utilities | | | 1.2 | | |
Electronic Equipment & Instruments | | | 6.3 | | |
Food & Drug Retailing | | | 2.3 | | |
General Diversified | | | 5.8 | | |
Health Care Equipment & Supplies | | | 1.3 | | |
Heavy Machinery | | | 6.2 | | |
Industrial Chemicals & Gases Manufacturers | | | 2.9 | | |
Insurance | | | 1.8 | | |
Integrated International Oil Producers | | | 2.3 | | |
Media | | | 1.8 | | |
Medical Supplies | | | 1.9 | | |
Miscellaneous Retailers | | | 1.0 | | |
Oil & Gas | | | 9.7 | | |
Other Financial Services | | | 1.8 | | |
Parts & Components | | | 1.8 | | |
Pharmaceuticals | | | 6.6 | | |
Real Estate | | | 2.4 | | |
Software | | | 2.0 | | |
Textiles & Apparel | | | 1.0 | | |
Transportation | | | 1.0 | | |
Wholesalers | | | 1.2 | | |
Total Investments | | | 103.4 | | |
Other Assets Less Liabilities | | | (3.4 | ) | |
Net Assets | | | 100.0 | % | |
4
Harding, Loevner Funds, Inc.
International Equity Portfolio
Statement of Net Assets
| | Shares | | Value (1) | |
Long Term Investments - 97.9% | | | | | |
Common Stocks - 97.9% | | | | | |
Austria - 3.2% | | | | | |
Erste Bank der Oesterreichischen Sparkassen AG (Banks) | | 112,500 | | $ | 5,849,279 | |
Oest Elektrizitatswirts, Class A (Electric Utilities) | | 11,600 | | 3,698,181 | |
| | | | 9,547,460 | |
Bermuda - 1.8% | | | | | |
Bunge Ltd. (Beverages, Food & Tobacco) | | 101,800 | | 5,287,492 | |
Canada - 4.9% | | | | | |
EnCana Corp. (Oil & Gas) | | 169,732 | | 7,783,910 | |
Imperial Oil Ltd. (Integrated International Oil Producers) | | 80,080 | | 7,033,426 | |
| | | | 14,817,336 | |
France - 11.8% | | | | | |
Air Liquide (Industrial Chemicals & Gases Manufacturers) | | 47,075 | | 8,560,629 | |
Carrefour SA (Miscellaneous Retailers) | | 67,560 | | 3,002,721 | |
Dassault Systemes SA (Software) | | 117,800 | | 6,074,996 | |
LVMH Moet Hennessy Louis Vuitton SA (Beverages, Food & Tobacco) | | 75,400 | | 6,105,012 | |
Sanofi-Aventis (Pharmaceuticals) | | 68,000 | | 5,444,716 | |
Schneider Electric SA (Heavy Machinery) | | 76,910 | | 6,315,115 | |
| | | | 35,503,189 | |
Germany - 2.3% | | | | | |
Metro AG (Food & Drug Retailing) | | 151,470 | | 6,888,954 | |
Hong Kong - 6.4% | | | | | |
China Merchants Holdings International Co., Ltd. (Transportation) | | 1,594,000 | | 3,101,576 | |
Denway Motors Ltd. (Automobiles) | | 12,540,000 | | 3,772,783 | |
Hutchison Whampoa Ltd. (General Diversified) | | 609,000 | | 5,780,280 | |
Li & Fung Ltd. (Wholesalers) | | 1,700,000 | | 3,638,616 | |
Yue Yuen Industrial Holdings Ltd. (Textiles & Apparel) | | 1,204,500 | | 3,041,234 | |
| | | | 19,334,489 | |
India - 2.2% | | | | | |
HDFC Bank Ltd. (Banks) | | 235,300 | | 3,172,881 | |
ICICI Bank Ltd. (Banks) | | 300,000 | | 3,319,512 | |
| | | | 6,492,393 | |
Ireland - 1.6% | | | | | |
CRH plc (Construction Materials) | | 188,452 | | 4,709,501 | |
Japan - 18.1% | | | | | |
Daikin Industries Ltd. (Heavy Machinery) | | 256,600 | | 6,679,546 | |
Hirose Electronics Co., Ltd. (Electronic Equipment & Instruments) | | 42,200 | | 4,836,812 | |
JSR Corp. (Automotive) | | 217,700 | | 5,126,393 | |
Kao Corp. (Cosmetics & Personal Care) | | 195,900 | | 4,678,376 | |
Keyence Corp. (Electronic Equipment & Instruments) | | 34,650 | | 8,013,610 | |
Mitsubishi Corp. (General Diversified) | | 600,600 | | 11,761,087 | |
Sumitomo Realty & Development Co., Ltd. (Real Estate) | | 451,000 | | 7,244,824 | |
Yokogawa Electric Corp. (Electronic Equipment & Instruments)† | | 416,000 | | 6,125,727 | |
| | | | 54,466,375 | |
| | | | | | |
5
Harding, Loevner Funds, Inc.
International Equity Portfolio
Statement of Net Assets
October 31, 2005 (continued)
Mexico - 1.7% | | | | | |
Wal-Mart de Mexico SA de CV - ADR (Discount Stores) | | 107,490 | | $ | 5,227,626 | |
Netherlands - 4.2% | | | | | |
Heineken NV (Beverages, Food & Tobacco) | | 105,337 | | 3,336,089 | |
Qiagen NV (Health Care Equipment & Supplies)*† | | 314,400 | | 3,742,210 | |
VNU NV (Media) | | 171,200 | | 5,442,450 | |
| | | | 12,520,749 | |
Poland - 1.0% | | | | | |
Bank Pekao SA - GDR (Banks) | | 62,800 | | 3,021,728 | |
Russia - 2.3% | | | | | |
OAO Gazprom - Sponsored ADR Reg S (Oil & Gas)† | | 115,100 | | 6,803,927 | |
Singapore - 1.1% | | | | | |
DBS Group Holdings Ltd. (Commercial Banks) | | 353,083 | | 3,195,064 | |
South Africa - 2.5% | | | | | |
Sasol Ltd. (Oil & Gas) | | 238,600 | | 7,615,439 | |
South Korea - 2.1% | | | | | |
Samsung Electronics Co., Ltd. - GDR (Diversified Electronics) | | 23,800 | | 6,356,049 | |
Spain - 3.9% | | | | | |
Banco Santander Central Hispano SA (Banks) | | 608,400 | | 7,758,980 | |
Bankinter SA (Commercial Banks) | | 70,000 | | 4,017,757 | |
| | | | 11,776,737 | |
Sweden - 3.6% | | | | | |
Atlas Copco AB, Class A (Heavy Machinery) | | 307,800 | | 5,621,144 | |
Skandinaviska Enskilda Banken AB, Class A (Banks) | | 277,400 | | 5,173,754 | |
| | | | 10,794,898 | |
Switzerland - 11.3% | | | | | |
Actelion Ltd. (Pharmaceuticals)* | | 41,000 | | 4,607,734 | |
Nestle SA - ADR (Diversified Food) | | 99,420 | | 7,392,394 | |
Roche Holding AG - Genusschein (Pharmaceuticals) | | 66,430 | | 9,924,513 | |
Swiss Re - Registered (Insurance) | | 77,800 | | 5,253,206 | |
UBS AG - Registered (Banks) | | 80,210 | | 6,808,679 | |
| | | | 33,986,526 | |
Taiwan - 1.8% | | | | | |
Taiwan Semiconductor Manufacturing Co. (Parts & Components) | | 3,514,794 | | 5,497,465 | |
United Kingdom - 10.1% | | | | | |
BG Group plc (Oil & Gas) | | 791,500 | | 6,945,346 | |
Smith & Nephew plc (Medical Supplies) | | 685,500 | | 5,800,362 | |
Standard Chartered plc (Other Financial Services) | | 252,540 | | 5,302,160 | |
Unilever plc (Diversified Food) | | 449,400 | | 4,556,237 | |
| | | | | | |
6
Harding, Loevner Funds, Inc.
International Equity Portfolio
Statement of Net Assets
October 31, 2005 (continued)
United Kingdom (continued) | | | | | |
WPP Group plc (Advertising Agencies) | | 804,730 | | $ | 7,905,265 | |
| | | | 30,509,370 | |
Total Common Stocks (Cost $212,526,933) | | | | 294,352,767 | |
Total Long Term Investments (Cost $212,526,933) | | | | 294,352,767 | |
| | Face | | | |
| | Amount | | | |
Short Term Investments - 3.6% | | | | | |
Federal Home Loan Bank, 3.693%, due 11/04/05†† | | $ | 4,908,578 | | 4,908,578 | |
Federal Home Loan Mortgage Corporation, 3.686%, due 11/02/05†† | | 5,839,310 | | 5,839,310 | |
Total Short Term Investments (Cost $10,747,888) | | | | 10,747,888 | |
Repurchase Agreement - 1.9% | | | | | |
Investors Bank & Trust Repurchase Agreement, 2.75%, due 11/01/05 in the amount of $5,890,577; issued 10/31/05 (collateralized by $5,889,597 par of FNMA #704534, 3.756%, due 06/31/33, SBA #506124, 7.375%, due 12/25/14 and SBA #506413, 7.325% due 09/25/15 with an aggregate market value of $6,184,634) (Cost $5,890,127) | | 5,890,127 | | 5,890,127 | |
Total Investments - 103.4% (Cost $229,164,948) | | | | $ | 310,990,782 | |
| | | | | | | |
7
Harding, Loevner Funds, Inc.
International Equity Portfolio
Statement of Net Assets
October 31, 2005 (continued)
| | Value (1) | |
Liabilities, Net of Other Assets - (3.4)% | | | |
Foreign currency (cost $194,055) | | $ | 186,756 | |
Dividends receivable | | 356,486 | |
Receivable for fund shares sold | | 5,488 | |
Tax reclaim receivable | | 288,658 | |
Prepaid expenses | | 2,530 | |
Other assets | | 1,571 | |
Collateral for securities loaned ($10,174,788) | | (10,747,888 | ) |
Payable for distribution fees | | (27 | ) |
Payable for fund shares redeemed | | (1,650 | ) |
Payable to investment advisor | | (195,462 | ) |
Other liabilities | | (149,760 | ) |
| | $ | (10,253,298 | ) |
Net Assets - 100% | | | |
Institutional Class | | | |
Applicable to 20,144,865 outstanding $.001 par value shares (authorized 250,000,000 shares) | | $ | 300,227,412 | |
Net Asset Value, Offering Price and Redemption Price Per Share | | $ | 14.90 | |
Investor Class | | | |
Applicable to 34,210 outstanding $.001 par value shares (authorized 250,000,000 shares) | | $ | 510,072 | |
Net Asset Value, Offering Price and Redemption Price Per Share | | $ | 14.91 | |
Components of Net Assets as of October 31, 2005 were as follows: | | | |
Paid-in capital | | $ | 217,624,438 | |
Accumulated undistributed net investment income | | 1,524,829 | |
Accumulated distributions in excess of net realized gain on investments and foreign currency-related transactions | | (212,286 | ) |
Net unrealized appreciation on investments and on assets and liabilities denominated in foreign currencies (Note 4) | | 81,800,503 | |
| | $ | 300,737,484 | |
Summary of Abbreviations
ADR | - | American Depository Receipt |
FNMA | - | Federal National Mortgage Association |
GDR | - | Global Depositary Receipt |
SBA | - | Small Business Administration |
(1) | | See Note 2 to Financial Statements |
* | | Non-income producing security |
† | | All or a portion of this security was out on loan at October 31, 2005; the value of the securities loaned amounted to $10,174,788. The value of collateral amounted to $10,747,888 which consisted of cash equivalents. |
†† | | Represents investments of security lending collateral. |
See Notes to Financial Statements
8
Harding, Loevner Funds, Inc.
Institutional Emerging Markets Portfolio
Statement of Net Assets
Industry | | Percentage of
Net Assets | |
Aerospace & Defense | | | 1.4 | % | |
Automotive | | | 5.7 | | |
Banks | | | 12.8 | | |
Beverages, Food & Tobacco | | | 2.3 | | |
Brewers | | | 1.8 | | |
Building Materials | | | 2.8 | | |
Commercial Banks | | | 1.6 | | |
Commercial Services & Supplies | | | 1.1 | | |
Computer Software & Processing | | | 1.6 | | |
Computers & Information | | | 0.7 | | |
Discount Stores | | | 1.6 | | |
Diversified Electronics | | | 4.3 | | |
Electrical Equipment | | | 5.4 | | |
Entertainment & Leisure | | | 1.2 | | |
Financial Services | | | 1.2 | | |
Heavy Machinery | | | 1.2 | | |
Home Construction, Furnishings & Appliances | | | 4.4 | | |
Industrial Conglomerates | | | 1.3 | | |
Insurance | | | 1.8 | | |
Metals & Mining | | | 3.8 | | |
National & Regional Food Chains | | | 1.3 | | |
Oil & Gas | | | 12.4 | | |
Parts & Components | | | 3.3 | | |
Pharmaceuticals | | | 1.3 | | |
Real Estate | | | 1.3 | | |
Retailers | | | 2.2 | | |
Securities Brokerage | | | 1.3 | | |
Systems & Subsystems | | | 1.1 | | |
Telephone Systems | | | 11.7 | | |
Transportation | | | 5.5 | | |
Total Investments | | | 99.4 | | |
Other Assets Less Liabilities | | | 0.6 | | |
Net Assets | | | 100.0 | % | |
9
Harding, Loevner Funds, Inc.
Institutional Emerging Markets Portfolio
Statement of Net Assets
October 31, 2005 (continued)
| | Shares | | Value (1) | |
Long Term Investments - 99.0% | | | | | | | |
Common Stocks - 93.2% | | | | | | | |
Brazil - 3.9% | | | | | | | |
Companhia Brasileira de Distribuicao Grupo Pao de Acucar (National & Regional Food Chains) | | | 2,300 | | | $ | 63,388 | |
Embraer Aircraft Corp. - ADR (Aerospace & Defense) | | | 1,780 | | | 69,046 | |
Petroleo Brasileiro SA - ADR (Oil & Gas) | | | 920 | | | 58,788 | |
| | | | | | 191,222 | |
Cayman Islands - 1.2% | | | | | | | |
ASM Pacific Technology Ltd. (Heavy Machinery) | | | 13,000 | | | 60,332 | |
Chile - 1.2% | | | | | | | |
Banco Santander - ADR (Banks) | | | 1,550 | | | 60,527 | |
Egypt - 3.3% | | | | | | | |
Egyptian Mobile Phone Network (Telephone Systems) | | | 2,000 | | | 66,040 | |
Orascom Telecom Holding SAE - GDR (Telephone Systems) | | | 2,000 | | | 98,140 | |
| | | | | | 164,180 | |
Hong Kong - 5.6% | | | | | | | |
China Merchants Holdings International Co., Ltd. (Transportation) | | | 34,000 | | | 66,157 | |
China Mobile HK Ltd. - ADR (Telephone Systems) | | | 3,210 | | | 72,064 | |
Johnson Electric Holdings Ltd. (Electrical Equipment) | | | 77,500 | | | 70,101 | |
Techtronic Industries Co. (Electrical Equipment) | | | 28,500 | | | 70,318 | |
| | | | | | 278,640 | |
Hungary - 1.6% | | | | | | | |
Gedeon Richter Rt. (Pharmaceuticals) | | | 390 | | | 64,089 | |
MOL Magyar Olaj-es Gazipari Rt. (Oil & Gas) | | | 175 | | | 16,321 | |
| | | | | | 80,410 | |
India - 11.8% | | | | | | | |
Bajaj Auto Ltd. (Automotive) | | | 1,780 | | | 67,339 | |
Bharat Heavy Electricals (Electrical Equipment) | | | 2,970 | | | 75,903 | |
Bharti Tele-Ventures Ltd. (Telephone Systems)* | | | 14,100 | | | 101,044 | |
Gujarat Ambuja Cements Ltd. (Building Materials) | | | 46,120 | | | 71,251 | |
HDFC Bank Ltd. - ADR (Banks) | | | 1,210 | | | 53,470 | |
ICICI Bank Ltd. (Banks) | | | 5,790 | | | 64,067 | |
Reliance Industries Ltd. - Sponsored GDR (Oil & Gas) | | | 2,250 | | | 75,518 | |
Satyam Computer Services Ltd. (Computer Software & Processing) | | | 5,850 | | | 78,921 | |
| | | | | | 587,513 | |
Indonesia - 0.6% | | | | | | | |
PT International Nickel Indonesia Tbk (Metals & Mining) | | | 21,000 | | | 30,005 | |
Luxembourg - 1.4% | | | | | | | |
Tenaris SA - ADR (Metals & Mining) | | | 640 | | | 70,304 | |
| | | | | | | | |
10
Harding, Loevner Funds, Inc.
Institutional Emerging Markets Portfolio
Statement of Net Assets
October 31, 2005 (continued)
Malaysia - 4.5% | | | | | | | |
Malaysia International Shipping Corp. Berhad (Transportation) | | | 30,300 | | | $ | 76,212 | |
Maxis Communications Berhad (Telephone Systems) | | | 19,100 | | | 45,561 | |
Public Bank Berhad (Banks) | | | 22,600 | | | 39,208 | |
Resorts World Berhad (Entertainment & Leisure) | | | 21,600 | | | 60,069 | |
| | | | | | 221,050 | |
Mexico - 8.9% | | | | | | | |
America Movil SA de CV, Series L - ADR (Telephone Systems) | | | 3,100 | | | 81,375 | |
Consorcio ARA SA de CV Series (Real Estate) | | | 17,200 | | | 63,486 | |
Controladora Comercial Mexicana SA de CV (Retailers) | | | 37,400 | | | 56,141 | |
Grupo Aeroportuario del Sureste SA de CV - ADR (Commercial Services & Supplies) | | | 1,700 | | | 55,250 | |
Grupo Financiero Banorte SA de CV, Class O (Financial Services) | | | 6,810 | | | 58,058 | |
Urbi Desarrollos Urbanos SA de CV (Home Construction, Furnishings & Appliances)* | | | 7,700 | | | 48,589 | |
Wal-Mart de Mexico SA de CV - ADR (Discount Stores) | | | 1,600 | | | 77,814 | |
| | | | | | 440,713 | |
Philippines - 1.2% | | | | | | | |
Philippine Long Distance Telephone Co. - Sponsored ADR (Telephone Systems) | | | 2,030 | | | 61,205 | |
Poland - 2.1% | | | | | | | |
Bank Pekao SA (Banks) | | | 1,110 | | | 52,619 | |
Polski Koncern Naftowy Orlen SA (Oil & Gas) | | | 2,980 | | | 52,723 | |
| | | | | | 105,342 | |
Russia - 6.6% | | | | | | | |
Lukoil -Sponsored ADR (Oil & Gas) | | | 1,900 | | | 104,785 | |
OAO Gazprom - Sponsored GDR Reg S (Oil & Gas) | | | 2,290 | | | 132,362 | |
Sberbank of Russia (Banks) | | | 100 | | | 89,000 | |
| | | | | | 326,147 | |
South Africa - 13.0% | | | | | | | |
Bidvest Group Ltd. (Industrial Conglomerates) | | | 4,980 | | | 66,756 | |
Impala Platinum Holdings Ltd. (Metals & Mining) | | | 810 | | | 88,416 | |
JD Group Ltd. (Home Construction, Furnishings & Appliances) | | | 3,920 | | | 41,913 | |
MTN Group Ltd. (Telephone Systems) | | | 7,400 | | | 55,116 | |
Pretoria Portland Cement Co., Ltd. (Building Materials) | | | 1,550 | | | 69,312 | |
SABMiller plc (Brewers) | | | 4,700 | | | 88,293 | |
Sasol Ltd. (Oil & Gas) | | | 2,930 | | | 93,517 | |
Standard Bank Group Ltd. (Banks) | | | 6,170 | | | 63,604 | |
Steinhoff International Holdings Ltd. (Home Construction, Furnishings & Appliances)* | | | 30,210 | | | 79,108 | |
| | | | | | 646,035 | |
South Korea - 16.0% | | | | | | | |
Daewoo Shipbuilding & Marine Engineering Co., Ltd. (Transportation) | | | 3,620 | | | 72,549 | |
Hankook Tire Co., Ltd. (Automotive) | | | 4,440 | | | 53,340 | |
Hyundai Mobis (Automotive) | | | 1,000 | | | 79,832 | |
Hyundai Motor Co., Ltd. (Automotive) | | | 1,150 | | | 84,831 | |
Kookmin Bank - ADR (Banks) | | | 1,320 | | | 77,114 | |
S1 Corp. (Securities Brokerage) | | | 1,490 | | | 64,710 | |
| | | | | | | | |
11
Harding, Loevner Funds, Inc.
Institutional Emerging Markets Portfolio
Statement of Net Assets
October 31, 2005 (continued)
South Korea - 16.0% (continued) | | | | | | | |
Samsung Electronics Co., Ltd. - GDR (Diversified Electronics) | | | 800 | | | $ | 213,649 | |
Samsung Fire & Marine Insurance Co., Ltd. (Insurance) | | | 970 | | | 92,488 | |
Shinsegae Co., Ltd. (Retailers) | | | 150 | | | 53,870 | |
| | | | | | 792,383 | |
Taiwan - 6.1% | | | | | | | |
Advantech Co., Ltd. (Computers & Information) | | | 15,000 | | | 33,096 | |
Delta Electronics (Electrical Equipment) | | | 30,000 | | | 50,677 | |
Hon Hai Precision Industry Co., Ltd. (Parts & Components) | | | 19,000 | | | 82,113 | |
Synnex Technology International Corp. (Systems & Subsystems) | | | 44,000 | | | 53,272 | |
Taiwan Semiconductor Manufacturing Co. (Parts & Components) | | | 52,000 | | | 81,333 | |
| | | | | | 300,491 | |
Thailand - 0.9% | | | | | | | |
Siam Commercial Bank-Alien (Banks) | | | 37,570 | | | 43,531 | |
Turkey - 3.3% | | | | | | | |
Anadolu Efes Biracilik Ve Malt Sanayii AS (Beverages, Food & Tobacco) | | | 2,040 | | | 49,834 | |
Arcelik AS (Home Construction, Furnishings & Appliances) | | | 8,270 | | | 49,298 | |
Turkiye Is Bankasi (Banks) | | | 9,330 | | | 64,679 | |
| | | | | | 163,811 | |
Total Common Stocks (Cost $4,650,398) | | | | | | 4,623,841 | |
Preferred Stock - 5.8% | | | | | | | |
Brazil - 4.2% | | | | | | | |
All America Latina Logistica SA (Transportation) | | | 1,500 | | | 57,947 | |
Banco Itau Holding Financeria SA - ADR (Commercial Banks) | | | 3,440 | | | 82,422 | |
Sadia SA (Beverages, Food & Tobacco) | | | 26,000 | | | 64,198 | |
| | | | | | 204,567 | |
Russia - 1.6% | | | | | | | |
Transneft (Oil & Gas)* | | | 50 | | | 80,500 | |
Total Preferred Stock (Cost $283,586) | | | | | | 285,067 | |
Total Long Term Investments (Cost $4,933,984) | | | | | | 4,908,908 | |
Repurchase Agreement - 0.5% | | Face
Amount | | | |
Investors Bank & Trust Repurchase Agreement, 2.75%, due 11/01/05 in the
amount of $26,018, issued 10/31/05 (collateralized by $27,541 par of
FNMA #776848, 5.50%, due 11/01/34 with a market value of $27,317)
(Cost $26,016) | | $ 26,016 | | 26,016 | |
Total Investments - 99.5% (Cost $4,960,000) | | | | $ | 4,934,924 | |
12
Harding, Loevner Funds, Inc.
Institutional Emerging Markets Portfolio
Statement of Net Assets
October 31, 2005 (continued)
| | Value (1) | |
Other Assets, Net of Liabilities - 0.5% | | | |
Dividends receivable | | $ | 1,050 | |
Receivable for open forward foreign currency contracts | | 29,423 | |
Receivable for securities sold | | 29,252 | |
Receivable from investment advisor | | 37,879 | |
Other assets | | 511 | |
Payable for open forward currency exchange contracts | | (29,337 | ) |
Other liabilities | | (42,027 | ) |
| | $ | 26,751 | |
Net Assets - 100% | | | |
Applicable to 500,000 outstanding $.001 par value shares (authorized 500,000,000 shares) | | $ | 4,961,675 | |
Net Asset Value, Offering and Redemption Price Per Share | | $ | 9.92 | |
Components of Net Assets as of October 31, 2005 were as follows: | | | |
Paid-in capital | | $ | 4,990,197 | |
Accumulated net investment loss | | (87 | ) |
Accumulated net realized loss on investments and
foreign currency-related transactions | | (3,221 | ) |
Net unrealized depreciation on investments and on assets and liabilities
denominated in foreign currencies (Note 4) | | (25,214 | ) |
| | $ | 4,961,675 | |
Summary of Abbreviations
ADR | - | American Depository Receipt |
FNMA | - | Federal National Mortgage Association |
GDR | - | Global Depositary Receipt |
(1) | | See Note 2 to Financial Statements |
* | | Non-income producing security |
See Notes to Financial Statements
13
Harding, Loevner Funds, Inc.
Global Equity Portfolio — Overview
(unaudited)
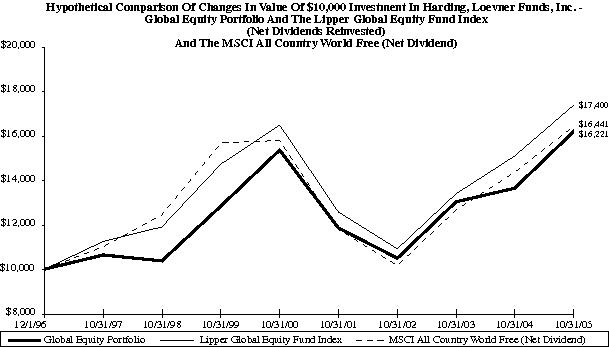
| | | | |
| | | Returns for the Period Ended October 31, 2005 | |
| | | | | | | | | Average Annualized | |
| | | Cumulative Total Returns | | Total Return | |
| FUND NAME | | Last 12 Months | | 5 YR | | 10 YR | | 5 YR | | 10 YR | |
| Global Equity Portfolio (12/1/96) | | | 18.72% | | | 5.48% | | 62.21% | | | 1.07% | | | | 5.57% | | |
| MSCI All Country World Free (Net dividend) | | | 14.33% | | | 3.94% | | 64.41% | | | 0.78% | | | | 5.73% | | |
| Lipper Global Fund Index | | | 15.12% | | | 5.40% | | 74.00% | | | 1.06% | | | | 6.41% | | |
| | | | | | | | | | | | | | | | | | |
Performance data quoted represents past performance and does not guarantee future results. The investment return and principal value of an investment will fluctuate so that an investor’s shares, when redeemed, may be worth more or less than their original cost. Performance current to the most recent month end may be lower or higher than the performance quoted and may be obtained by visiting the website at www.hardingloevner.com.
Investment return reflects voluntary fee waivers in effect. Absence such waivers, total return would be reduced. The performance provided does not reflect the deduction of taxes that a shareholder would pay on Portfolio distributions.
14
Harding, Loevner Funds, Inc.
Global Equity Portfolio — Overview (continued)
(unaudited)
The Portfolio returned 18.72% net of fees in the financial year through October 31, 2005. In comparison, the benchmark MSCI All Country World Index rose 14.33%. Please refer to the preceding page of the report for complete performance information.
We believe the Portfolio benefited in the year from the abating of the hostile environment for high quality stocks, whereby the least profitable companies with the most leveraged balance sheets had seen their stocks rise dramatically relative to those of more profitable, sound, and stable businesses during the two years of recovery since the post-bubble bear market. As a result, the companies we favor are the high quality variety, which tend to have their solid underlying corporate performance reflected in their stock prices. One way to measure this is by looking at the Portfolio’s performance by industrial sector. Our holdings outperformed the benchmark’s sector indices in eight of the nine sectors we held in the year. Thus, we feel, the year’s good performance was not the result of one or two successful ‘big calls’ on an industry, but rather the product of broad-based qualitative differentiation of holdings.
Again this past year, the US market was a laggard to the rest of the world, but unlike the last four years, this was not exacerbated by currency movements. While the US Dollar strengthened against most major currencies (e.g., 6% versus the Euro, and 7% versus the Japanese Yen), the MSCI US Index returned 9% in the year, while the MSCI ACW ex-US Index rose 21%. The Portfolio benefited from a relatively light allocation to US companies, albeit heavier, relative to the benchmark, than the prior year.
The other significant factor in the Portfolio’s strong relative performance was that the capital not allocated to US investments was instead invested in various Emerging Market (‘EM’) companies, which we had identified as being both very high in business quality as well as modest in valuation. We feel that stance was well rewarded, as not only did the average EM stock handily outperform the global benchmark (34% versus 15%), but the high quality companies we chose significantly outperformed the EM benchmark. The combined effect explains half of the out performance of the Portfolio for the year.
The Portfolio is positioned for the coming year with smaller sector or geographic divergence from the benchmark than it has had for some time, except for its continuing emphasis on high quality companies, which is quite different from the average. The Portfolio still carries the substantial Emerging Market holdings and carries a full weight in Japan, but is somewhat lightly weighted in Europe and the US. We remain overweight in Energy, Information Technology, and Industrials, and have been steadily adding to our holdings in the Health Care sector. Compensating for this are quite modest holdings (15%) in the Financials sector, at least in comparison to the very large (24%) weighting in the benchmark, and zero holdings in Utilities. The stances generally reflect our belief that companies have done more to improve their financial positions over the past few years than have individuals, with the result that capital goods expenditures are more likely to grow than are consumer spending and the debt that finances it.
Past performance does not guarantee future results.
The Portfolio invests in foreign securities, which will involve greater volatility and political, economic and currency risks and differences in accounting methods. It also invests in emerging markets, which involve unique risks, such as exposure to economies less diverse and mature than the US or other more established foreign markets. Economic and political instability may cause larger price changes in emerging markets securities than other foreign securities.
Fund holdings and/or sector allocations are subject to change at any time and are not recommendations to buy or sell any security.
MSCI All Country World Free ex-US Index includes all developed and emerging markets in the MSCI universe of 48 countries, excluding the US, with Free versions of countries where they exist. Net dividends reinvested. You cannot invest directly in this Index.
Lipper Global Fund Index, an unmanaged index published by Lipper Analytical Services, Inc., includes 30 funds that are generally similar to the Fund, although some funds in the index may have somewhat different investment policies or objectives. This fund invests at least 25% of its total assets in securities traded outside the US and may own US securities.
The S&P 500 Index is an unmanaged index commonly used to measure performance of U.S. stocks.
You cannot invest directly in an Index.
15
Harding, Loevner Funds, Inc.
Global Equity Portfolio
Statement of Net Assets
| | Percentage of | |
Industry | | Net Assets | |
Automotive | | | 2.7 | % | |
Banks | | | 4.6 | | |
Beverages, Food & Tobacco | | | 3.1 | | |
Chemicals | | | 1.3 | | |
Commercial Banks | | | 2.1 | | |
Commercial Services & Supplies | | | 1.0 | | |
Communications | | | 1.8 | | |
Computer Software & Processing | | | 3.0 | | |
Computers & Information | | | 1.7 | | |
Cosmetics & Personal Care | | | 2.8 | | |
Cosmetics & Toiletries | | | 2.4 | | |
Discount Stores | | | 2.1 | | |
Diversified Electrical Manufacturers | | | 1.1 | | |
Diversified Electronics | | | 1.4 | | |
Diversified Food | | | 2.0 | | |
Diversified Metal Producers | | | 2.9 | | |
Electrical Equipment | | | 3.7 | | |
Electronic Equipment & Instruments | | | 3.5 | | |
Exploration, Drilling Service & Equipment | | | 2.8 | | |
Financial Services | | | 1.1 | | |
General Diversified | | | 1.6 | | |
Health Care Equipment & Supplies | | | 1.8 | | |
Heavy Machinery | | | 3.0 | | |
Industrial Chemicals & Gases Manufacturers | | | 2.3 | | |
Insurance | | | 3.5 | | |
Insurance Companies | | | 4.4 | | |
Integrated International Oil Producers | | | 1.2 | | |
Media | | | 4.2 | | |
Medical Supplies | | | 1.3 | | |
Miscellaneous Printing & Publishing | | | 1.3 | | |
Oil & Gas | | | 8.1 | | |
Other Financial Services | | | 2.3 | | |
Parts & Components | | | 1.3 | | |
Pharmaceuticals | | | 3.5 | | |
Real Estate | | | 3.2 | | |
Retailers | | | 1.2 | | |
Semiconductor Equipment & Products | | | 1.3 | | |
Software | | | 1.5 | | |
Telephone Systems | | | 3.0 | | |
Transportation | | | 2.1 | | |
Wholesalers | | | 2.3 | | |
Total Investments | | | 101.5 | | |
Other Assets Less Liabilities | | | (1.5 | ) | |
Net Assets | | | 100.0 | % | |
16
Harding, Loevner Funds, Inc.
Global Equity Portfolio
Statement of Net Assets
October 31, 2005 (continued)
| | Shares | | Value (1) | |
Long Term Investments - 99.2% | | | | | |
Common Stocks - 99.2% | | | | | |
Australia - 2.9% | | | | | |
Rio Tinto Ltd. (Diversified Metal Producers) | | 17,200 | | $ | 726,486 | |
Austria - 1.0% | | | | | |
Erste Bank der Oesterreichischen Sparkassen AG (Banks) | | 4,900 | | 254,769 | |
Canada - 3.6% | | | | | |
EnCana Corp. (Oil & Gas) | | 19,900 | | 912,614 | |
Egypt - 1.3% | | | | | |
Orascom Telecom Holding SAE - GDR (Telephone Systems) | | 6,500 | | 318,956 | |
France - 8.7% | | | | | |
Air Liquide (Industrial Chemicals & Gases Manufacturers)† | | 1,732 | | 314,966 | |
Dassault Systemes SA (Software) | | 7,500 | | 386,778 | |
L’Oreal SA (Cosmetics & Personal Care) | | 6,920 | | 508,523 | |
LVMH Moet Hennessy Louis Vuitton SA (Beverages, Food & Tobacco) | | 3,314 | | 268,329 | |
Schlumberger Ltd. (Exploration, Drilling Service & Equipment) | | 7,900 | | 717,083 | |
| | | | 2,195,679 | |
Hong Kong - 4.4% | | | | | |
China Merchants Holdings International Co., Ltd. (Transportation) | | 270,000 | | 525,361 | |
Li & Fung Ltd. (Wholesalers) | | 278,000 | | 595,021 | |
| | | | 1,120,382 | |
Japan - 12.0% | | | | | |
Hirose Electronics Co., Ltd. (Electronic Equipment & Instruments) | | 2,400 | | 275,079 | |
JSR Corp. (Automotive) | | 28,800 | | 678,182 | |
Keyence Corp. (Electronic Equipment & Instruments) | | 2,600 | | 601,310 | |
Mitsubishi Corp. (General Diversified) | | 21,100 | | 413,185 | |
Nomura Holdings Inc. (Financial Services) | | 17,600 | | 271,013 | |
Sumitomo Realty & Development Co., Ltd. (Real Estate) | | 50,000 | | 803,196 | |
| | | | 3,041,965 | |
Mexico - 3.8% | | | | | |
America Movil SA de CV, Series L - ADR (Telephone Systems) | | 16,500 | | 433,125 | |
Wal-Mart de Mexico SA de CV - ADR (Discount Stores) | | 10,800 | | 525,243 | |
| | | | 958,368 | |
Netherlands - 4.6% | | | | | |
Heineken NV (Beverages, Food & Tobacco) | | 8,350 | | 264,450 | |
Qiagen NV (Health Care Equipment & Supplies)* | | 37,600 | | 447,542 | |
VNU NV (Media) | | 14,700 | | 467,313 | |
| | | | 1,179,305 | |
South Africa - 1.6% | | | | | |
Sasol Ltd. (Oil & Gas) | | 12,440 | | 397,050 | |
| | | | | | |
17
Harding, Loevner Funds, Inc.
Global Equity Portfolio
Statement of Net Assets
October 31, 2005 (continued)
South Korea - 2.7% | | | | | |
Kookmin Bank - ADR (Banks)† | | 5,400 | | $ | 315,468 | |
Samsung Electronics Co., Ltd. - GDR (Diversified Electronics) | | 1,370 | | 365,873 | |
| | | | 681,341 | |
Spain - 1.2% | | | | | |
Bankinter SA (Commercial Banks) | | 5,400 | | 309,941 | |
Switzerland - 5.7% | | | | | |
Nestle SA - ADR (Diversified Food) | | 6,820 | | 507,102 | |
Novartis AG - Registered (Pharmaceuticals) | | 5,920 | | 318,446 | |
Roche Holding AG - Genusschein (Pharmaceuticals) | | 2,100 | | 313,736 | |
Swiss Re - Registered (Insurance) | | 4,700 | | 317,353 | |
| | | | 1,456,637 | |
Taiwan - 1.3% | | | | | |
Taiwan Semiconductor Manufacturing Co. (Parts & Components) | | 208,762 | | 326,523 | |
United Kingdom - 3.6% | | | | | |
Pearson plc (Miscellaneous Printing & Publishing) | | 28,800 | | 320,181 | |
Standard Chartered plc (Other Financial Services) | | 27,700 | | 581,571 | |
| | | | 901,752 | |
United States - 40.8% | | | | | |
3M Co. (Computers & Information) | | 5,530 | | 420,169 | |
Abbott Laboratories (Pharmaceuticals) | | 6,100 | | 262,605 | |
Air Products & Chemicals Inc. (Industrial Chemicals & Gases Manufacturers) | | 4,500 | | 257,580 | |
American International Group (Insurance Companies) | | 13,300 | | 861,840 | |
Analog Devices (Semiconductor Equipment & Products) | | 9,800 | | 340,844 | |
Automatic Data Processing Inc. (Commercial Services & Supplies) | | 5,400 | | 251,964 | |
Berkshire Hathaway Inc., Class A (Insurance Companies)* | | 3 | | 257,700 | |
Caterpillar Inc. (Heavy Machinery) | | 14,700 | | 773,073 | |
Colgate-Palmolive Co. (Cosmetics & Toiletries) | | 11,400 | | 603,744 | |
Comcast Corp., Class A (Media)* | | 9,200 | | 256,036 | |
Emerson Electric Co. (Electrical Equipment) | | 8,950 | | 622,472 | |
Estee Lauder Companies Inc., Class A (Cosmetics & Personal Care) | | 6,100 | | 202,337 | |
Exxon Mobil Corp. (Integrated International Oil Producers) | | 5,400 | | 303,156 | |
General Electric Co. (Electrical Equipment) | | 9,400 | | 318,754 | |
Kinder Morgan Inc. (Oil & Gas) | | 8,300 | | 754,470 | |
Medco Health Solutions Inc. (Insurance)* | | 10,139 | | 572,853 | |
Medtronic Inc. (Medical Supplies) | | 6,000 | | 339,960 | |
Oracle Corp. (Computer Software & Processing)* | | 59,196 | | 750,605 | |
Praxair Inc. (Chemicals) | | 6,600 | | 326,106 | |
Qualcomm Inc. (Communications) | | 11,600 | | 461,216 | |
The Coca-Cola Company (Beverages, Food & Tobacco) | | 5,980 | | 255,824 | |
TJX Companies Inc. (Retailers) | | 14,400 | | 310,032 | |
Tyco International Ltd. (Diversified Electrical Manufacturers) | | 10,400 | | 274,456 | |
| | | | | | |
18
Harding, Loevner Funds, Inc.
Global Equity Portfolio
Statement of Net Assets
October 31, 2005 (continued)
United States - 40.8% (continued) | | | | | |
Viacom Inc., Class B (Media) | | 10,750 | | $ | 332,928 | |
Wells Fargo & Co. (Commercial Banks) | | 3,500 | | 210,700 | |
| | | | 10,321,424 | |
Total Common Stocks (Cost $18,539,490) | | | | 25,103,192 | |
Total Long Term Investments (Cost $18,539,490) | | | | 25,103,192 | |
Short Term Investments - 1.3% | | Face
Amount | | | |
Federal Home Loan Bank, 3.693%, due 11/04/05†† | | $ | 156,501 | | 156,501 | |
Federal Home Loan Mortgage Corporation, 3.686%, due 11/02/05†† | | 186,176 | | 186,176 | |
Total Short Term Investments (Cost $342,677) | | | | 342,677 | |
Repurchase Agreement - 1.0% | | | | | |
Investors Bank & Trust Repurchase Agreement, 2.75%, due 11/01/05 in the amount of $242,962; issued 10/31/05 (collateralized by $263,857 par of FNMA #797477, 5.00%, due 3/01/2005 with a market value of $255,091) (Cost $242,944) | | 242,944 | | 242,944 | |
Total Investments - 101.5% (Cost $19,125,111) | | | | $ | 25,688,813 | |
| | | | | | | |
19
Harding, Loevner Funds, Inc.
Global Equity Portfolio
Statement of Net Assets
October 31, 2005 (continued)
| | Value (1) | |
Liabilities, Net of Other Assets - (1.5)% | | | |
Dividends receivable | | $ | 32,340 | |
Receivable for fund shares sold | | 1,759 | |
Tax reclaim receivable | | 5,943 | |
Prepaid expenses | | 223 | |
Other assets | | 54 | |
Collateral for securities loaned ($327,088) | | (342,677 | ) |
Payable to investment advisor | | (24,029 | ) |
Other liabilities | | (45,209 | ) |
| | (371,596 | ) |
Net Assets - 100% | | | |
Institutional Class | | | |
Applicable to 1,243,740 outstanding $.001 par value shares (authorized 250,000,000 shares) | | $ | 25,317,217 | |
Net Asset Value, Offering Price and Redemption Price Per Share | | $ | 20.36 | |
Components of Net Assets as of October 31, 2005 were as follows: | | | |
Paid-in capital | | $ | 18,130,562 | |
Accumulated undistributed net investment income | | 76,351 | |
Accumulated undistributed net realized gain on investments and foreign currency-related transactions | | 547,020 | |
Net unrealized appreciation on investments and on assets and liabilities denominated in foreign currencies (Note 4) | | 6,563,284 | |
| | $ | 25,317,217 | |
Summary of Abbreviations
ADR | - | American Depository Receipt |
FNMA | - | Federal National Mortgage Association |
GDR | - | Global Depositary Receipt |
(1) | | See Note 2 to Financial Statements |
* | | Non-income producing security |
† | | All or a portion of this security was out on loan at October 31, 2005; the value of the securities loaned amounted to $327,088. The value of collateral amounted to $342,677 which consisted of cash equivalents. |
†† | | Represents investments of security lending collateral. |
See Notes to Financial Statements
20
Harding, Loevner Funds, Inc.
Statements of Operations
Year Ended October 31, 2005
| | International | | Institutional | | Global | |
| | Equity | | Emerging Markets | | Equity | |
| | Portfolio | | Portfolio (1) | | Portfolio | |
Investment Income | | | | | | | | | | | |
Interest | | | $ | 129,384 | | | | $ | 1,189 | | | $ | 7,809 | |
Dividends (net of foreign withholding taxes of $481,788, $0, and $16,376, respectively) | | | 5,482,771 | | | | 1,045 | | | 435,779 | |
Security lending income | | | 88,970 | | | | — | | | 4,064 | |
Total investment income | | | 5,701,125 | | | | 2,234 | | | 447,652 | |
Expenses | | | | | | | | | | | |
Investment advisory fees (Note 3) | | | 2,418,834 | | | | 2,522 | | | 265,241 | |
Administration fees (Note 3) | | | 275,729 | | | | 2,679 | | | 26,929 | |
Distribution fees, Investor Class | | | 27 | | | | — | | | — | |
Custodian and accounting fees (Note 3) | | | 311,857 | | | | 5,357 | | | 59,375 | |
Directors’ fees and expenses (Note 3) | | | 41,401 | | | | 147 | | | 3,636 | |
Shareholder record keeping fees | | | 48,988 | | | | 1,393 | | | 26,868 | |
Printing and postage fees | | | 12,781 | | | | 1,071 | | | 1,187 | |
State registration filing fees | | | 22,798 | | | | — | | | 6,674 | |
Professional fees | | | 111,611 | | | | 29,039 | | | 29,260 | |
Other fees and expenses | | | 132,504 | | | | 817 | | | 6,704 | |
Total expenses | | | 3,376,530 | | | | 43,025 | | | 425,874 | |
Waiver of investment advisory fee (Note 3) | | | (151,391 | ) | | | (40,401 | ) | | (94,323 | ) |
Net expenses | | | 3,225,139 | | | | 2,624 | | | 331,551 | |
Net investment income (loss) | | | 2,475,986 | | | | (390 | ) | | 116,101 | |
Realized and Unrealized Gain (Loss) (Note 4) | | | | | | | | | | | |
Net realized gain (loss) — | | | | | | | | | | | |
Investment transactions (net of foreign tax expense $281,308, $0, and $13,779, respectively) | | | 41,100,021 | | | | (3,221 | ) | | 2,262,808 | |
Foreign currency transactions | | | (647,163 | ) | | | (9,500 | ) | | (25,882 | ) |
Net realized gain (loss) | | | 40,452,858 | | | | (12,721 | ) | | 2,236,926 | |
Change in unrealized appreciation (depreciation) — | | | | | | | | | | | |
Investments | | | 18,760,691 | | | | (25,076 | ) | | 2,095,291 | |
Translation of assets and liabilities denominated in foreign currency | | | (60,534 | ) | | | (138 | ) | | (1,136 | ) |
Net change in unrealized appreciation (depreciation) | | | 18,700,157 | | | | (25,214 | ) | | 2,094,155 | |
Net realized and unrealized gain (loss) | | | 59,153,015 | | | | (37,935 | ) | | 4,331,081 | |
Net Increase (Decrease) in Net Assets Resulting from Operations | | | $ | 61,629,001 | | | | $ | (38,325 | ) | | $ | 4,447,182 | |
(1) For the period from October 17, 2005 (commencement of operations) through October 31, 2005.
See Notes to Financial Statements
21
Harding, Loevner Funds, Inc.
Statements of Changes in Net Assets
| | International Equity Portfolio | |
| | Year Ended | | Year Ended | |
| | October 31, | | October 31, | |
| | 2005 | | 2004 | |
Increase in Net Assets from Operations | | | | | |
Net investment income | | $ | 2,475,986 | | $ | 2,907,009 | |
Net realized gain on investments and foreign currency transactions | | 40,452,858 | | 27,521,983 | |
Net change in unrealized appreciation on investments and translation of assets and liabilities denominated in foreign currency | | 18,700,157 | | 4,847,378 | |
Net increase in net assets resulting from operations | | 61,629,001 | | 35,276,370 | |
Distributions to Shareholders from: | | | | | |
Net investment income | | | | | |
Institutional Class | | (1,432,687 | ) | (2,167,605 | ) |
Total distributions to shareholders | | (1,432,687 | ) | (2,167,605 | ) |
Transactions in Shares of Common Stock | | | | | |
Proceeds from sale of shares | | | | | |
Investor Class | | 521,999 | | — | |
Institutional Class | | 11,311,197 | | 49,810,442 | |
Net Asset Value of shares issued to shareholders upon reinvestment of dividends | | | | | |
Institutional Class | | 1,313,542 | | 1,833,540 | |
Cost of shares redeemed | | | | | |
Investor Class | | (14,714 | ) | — | |
Institutional Class | | (88,011,589 | ) | (119,352,363 | ) |
Redemption fees | | | | | |
Institutional Class | | 400 | | — | |
Net Decrease in Net Assets from Fund Share Transactions | | (74,879,165 | ) | (67,708,381 | ) |
Net Decrease in Net Assets | | (14,682,851 | ) | (34,599,616 | ) |
Net Assets | | | | | |
At beginning of year | | 315,420,335 | | 350,019,951 | |
At end of year | | $ | 300,737,484 | | $ | 315,420,335 | |
Accumulated Undistributed Net Investment Income Included in Net Assets | | $ | 1,524,829 | | $ | 1,431,240 | |
See Notes to Financial Statements
22
Harding, Loevner Funds, Inc.
Statements of Changes in Net Assets (continued)
| | Institutional
Emerging Markets
Portfolio | |
| | Period Ended
October 31, 2005 (1) | |
Decrease in Net Assets from Operations | | | | | |
Net investment loss | | | $ | (390 | ) | |
Net realized loss on investments and foreign currency transactions | | | (12,721 | ) | |
Net change in unrealized depreciation on investments and translation of assets and liabilities denominated in foreign currency | | | (25,214 | ) | |
Net decrease in net assets resulting from operations | | | (38,325 | ) | |
Transactions in Shares of Common Stock | | | | | |
Proceeds from sale of shares | | | 5,000,000 | | |
Net Increase in Net Assets from Fund Share Transactions | | | 5,000,000 | | |
Net Increase in Net Assets | | | 4,961,675 | | |
Net Assets | | | | | |
At beginning of period | | | — | | |
At end of period | | | $ | 4,961,675 | | |
Accumulated Net Investment Loss Included in Net Assets | | | $ | (87 | ) | |
(1) | For the period from October 17, 2005 (commencement of operations) through October 31, 2005. |
See Notes to Financial Statements
23
Harding, Loevner Funds, Inc.
Statements of Changes in Net Assets (continued)
| | Global Equity Portfolio | |
| | Year Ended | | Year Ended | |
| | October 31, | | October 31, | |
| | 2005 | | 2004 | |
Increase (Decrease) in Net Assets from Operations | | | | | | | | | |
Net investment income | | | $ | 116,101 | | | | $ | 73,476 | | |
Net realized gain on investments and foreign currency transactions | | | 2,236,926 | | | | 1,741,662 | | |
Net change in unrealized appreciation (depreciation) on investments and translation of assets and liabilities denominated in foreign currency | | | 2,094,155 | | | | (554,410 | ) | |
Net increase in net assets resulting from operations | | | 4,447,182 | | | | 1,260,728 | | |
Distributions to Shareholders from: | | | | | | | | | |
Net investment income | | | | | | | | | |
Institutional Class | | | (33,956 | ) | | | (105,080 | ) | |
Total distributions to shareholders | | | (33,956 | ) | | | (105,080 | ) | |
Transactions in Shares of Common Stock | | | | | | | | | |
Proceeds from sale of shares | | | | | | | | | |
Institutional Class | | | 846,308 | | | | 1,297,150 | | |
Net Asset Value of shares issued to shareholders upon reinvestment of dividends | | | | | | | | | |
Institutional Class | | | 20,550 | | | | 66,670 | | |
Cost of shares redeemed | | | | | | | | | |
Institutional Class | | | (5,732,623 | ) | | | (3,317,264 | ) | |
Net Decrease in Net Assets from Fund Share Transactions | | | (4,865,765 | ) | | | (1,953,444 | ) | |
Net Decrease in Net Assets | | | (452,539 | ) | | | (797,796 | ) | |
Net Assets | | | | | | | | | |
At beginning of year | | | 25,769,756 | | | | 26,567,552 | | |
At end of year | | | $ | 25,317,217 | | | | $ | 25,769,756 | | |
Accumulated Undistributed Net Investment Income Included in Net Assets | | | $ | 76,351 | | | | $ | 33,867 | | |
See Notes to Financial Statements
24
Harding, Loevner Funds, Inc.
Financial Highlights
| | International Equity Portfolio - Institutional Class | |
| | For the Year | | For the Year | | For the Year | | For the Year | | For the Year | |
| | Ended | | Ended | | Ended | | Ended | | Ended | |
| | Oct. 31, 2005 | | Oct. 31, 2004 | | Oct. 31, 2003 | | Oct. 31, 2002 | | Oct. 31, 2001 | |
Per Share Data | | | | | | | | | | | | | | | | | | | | | |
Net Asset Value, Beginning of Year | | | $ | 12.41 | | | | $ | 11.30 | | | | $ | 9.58 | | | | $ | 10.55 | | | | $ | 15.22 | | |
Increase (decrease) in Net Assets from Operations | | | | | | | | | | | | | | | | | | | | | |
Net investment gain | | | 0.13 | | | | 0.11 | | | | 0.11 | | | | 0.07 | | | | 0.09 | | |
Net realized and unrealized gain (loss) on investments and foreign currency-related transactions | | | 2.42 | | | | 1.07 | | | | 1.65 | | | | (1.01 | ) | | | (3.61 | ) | |
Net increase (decrease) from investment operations | | | 2.55 | | | | 1.18 | | | | 1.76 | | | | (0.94 | ) | | | (3.52 | ) | |
Distributions to Shareholders from: | | | | | | | | | | | | | | | | | | | | | |
Net investment income | | | (0.06 | ) | | | (0.07 | ) | | | (0.04 | ) | | | (0.03 | ) | | | — | | |
Net realized gain from investments and foreign currency-related transactions | | | — | | | | — | | | | — | | | | — | | | | (1.15 | ) | |
Total distributions | | | (0.06 | ) | | | (0.07 | ) | | | (0.04 | ) | | | (0.03 | ) | | | (1.15 | ) | |
Net Asset Value, End of Year | | | $ | 14.90 | | | | $ | 12.41 | | | | $ | 11.30 | | | | $ | 9.58 | | | | $ | 10.55 | | |
Total Return | | | 20.58 | % | | | 10.46 | % | | | 18.49 | % | | | (8.92 | )% | | | (24.99 | )% | |
Ratios/Supplemental Data: | | | | | | | | | | | | | | | | | | | | | |
Net assets, end of year (000’s) | | | $ | 300,227 | | | | $ | 315,420 | | | | $ | 350,020 | | | | $ | 289,000 | | | | $ | 283,721 | | |
Ratio of net operating expenses to average net assets | | | 1.00 | % | | | 1.00 | % | | | 1.00 | % | | | 1.00 | % | | | 1.00 | % | |
Ratio of net investment income, to average net assets | | | 0.77 | % | | | 0.81 | % | | | 1.10 | % | | | 0.70 | % | | | 0.63 | % | |
Decrease reflected in above expense ratios due to waiver of investment advisory and administration fees, and reimbursement of other expenses | | | 0.05 | % | | | 0.09 | % | | | 0.06 | % | | | 0.06 | % | | | 0.05 | % | |
Portfolio turnover rate | | | 38 | % | | | 37 | % | | | 58 | % | | | 45 | % | | | 46 | % | |
25
Harding, Loevner Funds, Inc.
Financial Highlights (continued)
| | Institutional
Emerging
Markets
Portfolio | |
| | For
the Period
Ended
Oct. 31, 2005 (1) | |
Per Share Data | | | | | |
Net Asset Value, Beginning of Period | | | $ | 10.00 | | |
Decrease in Net Assets from Operations | | | | | |
Net investment loss | | | (0.00 | )* | |
Net realized and unrealized loss on investments and foreign currency-related transactions | | | (0.08 | ) | |
Net decrease from investment operations | | | (0.08 | ) | |
Net Asset Value, End of Period | | | $ | 9.92 | | |
Total Return | | | (0.70 | )% | |
Ratios/Supplemental Data: | | | | | |
Net assets, end of period (000’s) | | | $ | 4,962 | | |
Ratio of net operating expenses to average net assets | | | 1.30 | % | |
Ratio of net investment loss, to average net assets | | | (0.19 | )% | |
Decrease reflected in above expense ratios due to waiver of investment advisory and administration fees, and reimbursement of other expenses | | | 20.02 | % | |
Portfolio turnover rate | | | 1 | % | |
(1) | For the period from October 17, 2005 (commencement of operations) through October 31, 2005. |
* | Rounds to less than $0.01. |
See Notes to Financial Statements
26
Harding, Loevner Funds, Inc.
Financial Highlights (continued)
| | Global Equity Portfolio - Institutional Class | |
| | For the Year | | For the Year | | For the Year | | For the Year | | For the Year | |
| | Ended | | Ended | | Ended | | Ended | | Ended | |
| | Oct. 31, 2005 | | Oct. 31, 2004 | | Oct. 31, 2003 | | Oct. 31, 2002 | | Oct. 31, 2001 | |
Per Share Data | | | | | | | | | | | | | | | | | | | | | |
Net Asset Value, Beginning of Year | | | $ | 17.17 | | | | $ | 16.45 | | | | $ | 13.28 | | | | $ | 15.08 | | | | $ | 21.81 | | |
Increase (Decrease) in Net Assets from Operations | | | | | | | | | | | | | | | | | | | | | |
Net investment income | | | 0.09 | | | | 0.05 | | | | 0.09 | | | | 0.05 | | | | 0.04 | | |
Net realized and unrealized gain (loss) on investments and foreign currency-related transactions | | | 3.12 | | | | 0.74 | | | | 3.11 | | | | (1.79 | ) | | | (4.49 | ) | |
Net increase (decrease) from investment operations | | | 3.21 | | | | 0.79 | | | | 3.20 | | | | (1.74 | ) | | | (4.45 | ) | |
Distributions to Shareholders from: | | | | | | | | | | | | | | | | | | | | | |
Net investment income | | | (0.02 | ) | | | (0.07 | ) | | | (0.03 | ) | | | (0.00 | )* | | | — | | |
Net realized gain from investments and foreign currency-related transactions | | | — | | | | — | | | | — | | | | (0.06 | ) | | | (2.28 | ) | |
Total distributions | | | (0.02 | ) | | | (0.07 | ) | | | (0.03 | ) | | | (0.06 | ) | | | (2.28 | ) | |
Net Asset Value, End of Year | | | $ | 20.36 | | | | $ | 17.17 | | | | $ | 16.45 | | | | $ | 13.28 | | | | $ | 15.08 | | |
Total Return | | | 18.72 | % | | | 4.78 | % | | | 24.19 | % | | | (11.59 | )% | | | (22.77 | )% | |
Ratios/Supplemental Data: | | | | | | | | | | | | | | | | | | | | | |
Net assets, end of year (000’s) | | | $ | 25,317 | | | | $ | 25,770 | | | | $ | 26,568 | | | | $ | 19,732 | | | | $ | 18,524 | | |
Ratio of net operating expenses to average net assets | | | 1.25 | % | | | 1.25 | % | | | 1.25 | % | | | 1.25 | % | | | 1.25 | % | |
Ratio of net investment income, to average net assets | | | 0.44 | % | | | 0.27 | % | | | 0.70 | % | | | 0.38 | % | | | 0.24 | % | |
Decrease reflected in above expense ratios due to waiver of investment advisory and administration fees, and reimbursement of other expenses | | | 0.36 | % | | | 0.18 | % | | | 0.12 | % | | | 0.19 | % | | | 0.22 | % | |
Portfolio turnover rate | | | 35 | % | | | 29 | % | | | 68 | % | | | 55 | % | | | 50 | % | |
* Rounds to less than $0.01.
27
Harding, Loevner Funds, Inc.
Notes to Financial Statements
1. Organization
Harding, Loevner Funds, Inc. (the “Fund”) was organized as a Maryland corporation on July 31, 1996 and is registered under the Investment Company Act of 1940 (“the 1940 Act”), as amended, as an open-end diversified management investment company. The Fund currently has four Portfolios (individually, “Portfolio”), all of which were active as of October 31, 2005: International Equity Portfolio (“International Equity”); Emerging Markets Portfolio (“Emerging Markets”); Institutional Emerging Markets Portfolio (“Institutional Emerging Markets”); and Global Equity Portfolio (“Global Equity”). The International Equity, Institutional Emerging Markets and Global Equity are presented hereinafter. The investment objective of each portfolio is as follows: International Equity-to seek long-term capital appreciation through investments in equity securities of companies based outside the United States; Institutional Emerging Markets-to seek long-term capital appreciation through investments in equity securities of companies based in emerging markets; Global Equity-to seek long-term capital appreciation through investments in equity securities of companies based both inside and outside the United States.
International Equity commenced operations on October 31, 1996 after acquiring the net assets of Harding, Loevner Management, L.P.’s AMT Capital Fund, Inc. Effective August 5, 2005, International Equity launched the Investor Class Shares and converted existing shareholders to the Institutional Class. Investor Class of International Equity commenced operations on September 30, 2005. Institutional Emerging Markets commenced operations on October 17, 2005. Global Equity commenced operations on December 1, 1996 following the acquisition of net assets of Harding, Loevner Management, L.P.’s Global Equity L.P. (“GELP”), a limited partnership, in a tax-free reorganization. Effective August 5, 2005, Global Equity launched the Investor Class Shares and converted existing shareholders to the Institutional Class. Investor Class of Global Equity has not yet commenced operations.
The Fund is managed by Harding, Loevner Management, L.P. (the “Investment Adviser”).
2. Summary of Significant Accounting Policies
The accounting policies of the Fund are in conformity with accounting principles generally accepted in the United States (“GAAP”) for investment companies. The following is a summary of the Fund’s significant accounting policies:
Indemnifications
In the normal course of business, the Fund may enter into contracts that contain a variety of representations or that provide indemnification for certain liabilities. The Fund’s maximum exposure under these arrangements is unknown, as this would involve future claims that may be made against the Fund that have not yet occurred. However, the Fund has not had prior claims or losses pursuant to these contracts and expects the risk of loss to be remote.
Estimates
The preparation of financial statements in accordance with GAAP requires management to make estimates and assumptions that affect the reported amounts and disclosures in the financial statements. Actual results could differ from those estimates.
Valuation
The Board of Directors (the “Board”) of the Fund has adopted procedures (“Procedures”) to govern the valuation of the portfolio securities held by each series of the Fund in accordance with the Investment Company Act of 1940, as amended (“1940 Act”). The Procedures incorporate principles set forth in relevant pronouncements of the Securities and Exchange Commission (“SEC”) and its staff, including guidance on the obligations of Portfolios and their Directors to determine, in good faith, the fair value of the Portfolios securities when market quotations are not readily available.
All investments in the Fund are valued daily at their market prices, which results in unrealized gains or losses. Securities traded on an exchange are valued at their last sales price on that exchange. Securities for which no sales are reported are valued at the latest bid price obtained from a quotation reporting system or from established market makers. Repurchase agreements are valued at their amortized cost plus accrued interest. Securities for which market quotations are not readily available are fair valued by the Board or its delegate in accordance with the Procedures, although the actual calculations may be done by others. Factors considered in making this determination may include, but are not limited to, information obtained by contacting the
28
Harding, Loevner Funds, Inc.
Notes to Financial Statements (continued)
2. Summary of Significant Accounting Policies (continued)
issuer, analysts, or the appropriate stock exchange (for exchange-traded securities), analysis of the issuer’s financial statements or other available documents and, if necessary, available information concerning other securities in similar circumstances. The Fund has implemented fair value pricing on a daily basis for all foreign equity securities held by the Portfolios. The fair value pricing utilizes quantitative models developed by an independent pricing service unless the Fund determines that use of another fair valuation methodology is appropriate. If a significant event occurs after the close of trading in a security but before the calculation of the Fund’s net asset value and such significant event has a material impact on the Fund’s net asset value per share (i.e. , more than $0.01 per share), then the security may be fair valued in accordance with the Procedures. As of October 31, 2005, there were no securities in the Fund which required valuation by the Board or its delegate.
Securities
All securities transactions are recorded on a trade date basis. Interest income and expenses are recorded on an accrual basis. Dividend income is recorded on the ex-dividend date (except for certain foreign dividends that may be recorded as soon as the fund is informed of such dividends). The Fund accretes discount or amortizes premium on a daily basis as adjustments to interest income and the cost of investments. The Fund uses the specific identification method for determining realized gains or losses from sales of securities.
Income Tax
It is the policy of each Portfolio of the Fund to qualify as a regulated investment company, if such qualification is in the best interest of its shareholders, by complying with the applicable provisions of the Internal Revenue Code, and to make distributions of taxable income sufficient to relieve it from substantially all federal income and excise taxes.
Expenses
Expenses directly attributed to a specific Portfolio are charged to that Portfolio’s operations; expenses not directly attributable to a specific Portfolio are allocated among the Portfolios either equitably or based on their average daily net assets.
Dividends to Shareholders
It is the policy of the Fund to declare dividends from net investment income annually. Net short-term and long-term capital gains distributions for the Portfolios, if any, normally are distributed on an annual basis.
Dividends from net investment income and distributions from net realized gains from investment transactions have been determined in accordance with income tax regulations and may differ from net investment income and realized gains recorded by the Portfolios for financial reporting purposes. Differences result primarily from foreign currency transactions and timing differences related to recognition of income, and gains and losses from investment transactions. To the extent that any differences which are permanent in nature result in overdistributions to shareholders, the amount of the overdistribution is reclassified within the capital accounts based on its federal tax basis treatment. Temporary differences do not require reclassification. To the extent that they exceed net investment income and net realized gains for tax purposes, they are reported as returns of capital.
Currency Translation
Assets and liabilities denominated in foreign currencies and commitments under forward exchange currency contracts are translated into U.S. dollars at the mean of the quoted bid and asked prices of such currencies against the U.S. dollar. Purchases and sales of portfolio securities are translated at the rates of exchange prevailing when such securities were acquired or sold. Income and expenses are translated at exchange rates prevailing when accrued. The Fund does not isolate that portion of the results of operations resulting from changes in foreign exchange rates on investments from the fluctuations arising from changes in market prices of securities held. Such fluctuations are included with the net realized and unrealized gain or loss from investments.
Net realized gains and losses from foreign currency-related transactions arise from sales of foreign currency, currency gains or losses realized between the trade and settlement dates on securities transactions, and the difference between the amounts of dividends, interest, and foreign withholding taxes recorded on the Portfolios books, and the U.S. dollar equivalent of the
29
Harding, Loevner Funds, Inc.
Notes to Financial Statements (continued)
2. Summary of Significant Accounting Policies (continued)
amounts actually received or paid. Net unrealized appreciation or depreciation on translation of assets and liabilities denominated in foreign currencies arise from changes in the value of assets and liabilities other than investments in securities at the period end, resulting from changes in the exchange rate.
Security Lending
Each portfolio is authorized to lend securities from its investment portfolios to banks, brokers and other financial institutions if it receives collateral in cash, U.S. Government Securities or other liquid investments which will be maintained at all times in an amount equal to at least 102% of the current market value of the loaned securities. The loans will be terminable at any time by the Fund and the relevant Portfolio will then receive the loaned securities within five days. During the period of such a loan, the Portfolio receives the income on the loaned securities and a loan fee and may thereby increase its total return. A Portfolio continues to receive interest or dividends on the securities loaned and simultaneously earns either interest on the investment of the cash collateral or fee income if the loan is otherwise collateralized. However, the Portfolio normally pays lending fees and related expenses from the interest or dividends earned on invested collateral. Should the borrower of the securities fail financially, there is a risk of delay in recovery of the securities or loss of rights in the collateral. However, loans are made only to borrowers which are approved by the Board of Directors and are deemed by the Fund to be of good financial standing. The Portfolio may invest cash collateral it receives in connection with a loan of securities in securities of the U.S. Government and its agencies and other high quality short-term debt instruments. For purposes of complying with the Portfolio’s investment policies and restrictions, collateral received in connection with securities loans will not be deemed an asset of the Portfolio unless otherwise required by law.
For the year ended October 31, 2005, the market value of the securities on loan and the value of the related collateral was as follows:
| | | | | |
Portfolio | | Market Value of
Loaned Securities | | Collateral Value | |
International Equity | | | $ | 10,174,788 | | | | $ | 10,747,888 | | |
Global Equity | | | 327,088 | | | | 342,677 | | |
3. Significant Agreements and Transactions with Affiliates
The Fund’s Board of Directors has approved investment advisory agreements (the “Agreements”) with the Investment Adviser. The advisory fees are computed daily at an annual rate of 0.75%, 1.25%, and 1.00% of the average daily net assets of International Equity, Institutional Emerging Markets and Global Equity.
In addition, the Fund has an administration agreement with Investors Bank & Trust Company, which provides certain accounting, clerical and bookkeeping services, corporate secretarial services and assistance in the preparation and filing of tax returns and reports to shareholders and the Securities and Exchange Commission. Under this agreement, the International Equity, Institutional Emerging Markets and Global Equity incurred $275,729, $2,679, and $26,929, respectively, in administration fees and $311,857, $5,357, and $59,375, respectively, in custodian and fund accounting fees for the year ended October 31, 2005.
The Investment Adviser has voluntarily agreed to reduce its fee to the extent that aggregate expenses (exclusive of brokerage commissions, other investment expenses, interest on borrowings, taxes and extraordinary expenses) exceed an annual rate of 1.00%, 1.30% and 1.25%, respectively of the average daily net assets, International Equity, Institutional Emerging Markets, and Global Equity. For the year ended October 31, 2005, the Investment Adviser voluntarily waived $151,391 (Institutional class $151,382), $40,401 and $94,323, respectively, of the International Equity, Institutional Emerging Markets, and Global Equity in investment advisory fees from the Portfolios.
Directors’ fees and related expenses for International Equity, Institutional Emerging Markets, and Global Equity amounted to $41,101, $147 and $3,636, respectively for the year ended October 31, 2005.
30
Harding, Loevner Funds, Inc.
Notes to Financial Statements (continued)
3. Significant Agreements and Transactions with Affiliates (continued)
The Fund has agreements with various financial intermediaries and “mutual fund supermarkets”, under which customers of these intermediaries may purchase and hold Fund shares. These intermediaries assess fees in consideration for providing certain distribution, account maintenance, record keeping and transactional services. In recognition of the savings of expenses to the Fund arising from the economies of scale associated with these intermediaries’ holding their customers’ shares in a single account with the Fund’s transfer agent, each Portfolio is authorized to pay to each intermediary up to 0.15% of its average daily net assets attributable to that intermediary for providing sub-accounting and related shareholder services (subject to the voluntary expense cap); the balance of the intermediaries’ fees are paid by the Fund. Because of the Fund’s voluntary cap on the Portfolios fees and expenses, the Fund paid a portion or all of the Portfolio’s share of these fees during the year ended October 31, 2005. The Fund may enter into similar arrangements with other intermediaries in the future.
4. Investment Transactions
Cost of purchases and proceeds from sales of investment securities, other than short-term investments, for the year ended October 31, 2005, were as follows for each Portfolio:
| | | | | |
Portfolio | | Purchase Cost of
Investment Securities | | Proceeds from Sales of
Investment Securities | |
International Equity | | | $ | 118,695,682 | | | | $ | 192,697,474 | | |
Institutional Emerging Markets | | | 4,992,880 | | | | 55,676 | | |
Global Equity | | | 9,122,975 | | | | 13,385,581 | | |
The cost of investments for federal income tax purposes and the components of net unrealized appreciation on investments at October 31, 2005, for each of the Portfolios were as follows:
| | | | | | | | | |
Portfolio | | Unrealized
Appreciation | | Unrealized
Depreciation | | Net | | Cost | |
International Equity | | | $ | 85,204,626 | | | | $ | 3,845,005 | | | $ | 81,359,621 | | $ | 229,631,161 | |
Institutional Emerging Markets | | | 60,676 | | | | 86,533 | | | (25,857 | ) | 4,960,781 | |
Global Equity | | | 6,805,482 | | | | 296,670 | | | 6,508,812 | | 19,180,001 | |
| | | | | | | | | | | | | | | | | |
The unrealized depreciation on foreign currency for International Equity, Institutional Emerging Markets and Global Equity was $(25,331), $(225) and $(418), respectively, for the year and period ended October 31, 2005.
During the year ended October 31, 2004, the tax character of distributions paid from ordinary income was $2,167,605 and $105,080 for International Equity and Global Equity.
During the year ended October 31, 2005, the tax character of distributions paid from ordinary income was $1,432,687 and $33,956, respectively, for International Equity and Global Equity.
As of October 31, 2005, the components of accumulated earnings/(deficit) on a tax basis were as follows:
| | | | | | | | | | | |
Portfolio | | Undistributed
Income
Ordinary | | Undistributed
Long-Term
Capital Gains | | Accumulated
Capital and
Other Losses | | Unrealized
Appreciation/
(Depreciation)* | | Total
Accumulated
Earnings/(Deficit) | |
International Equity | | | $ | 1,524,829 | | | | $ | 253,927 | | | | $ | — | | | | $81,334,290 | | | | $ | 83,113,046 | | |
Institutional Emerging Markets | | | — | | | | — | | | | (2,440 | ) | | | (26,082 | ) | | | (28,522 | ) | |
Global Equity | | | 76,351 | | | | 601,910 | | | | — | | | | 6,508,394 | | | | 7,186,655 | | |
* The difference between book basis and tax basis unrealized appreciation/depreciation is attributable to the deferral of losses on wash sales.
31
Harding, Loevner Funds, Inc.
Notes to Financial Statements (continued)
4. Investment Transactions (continued)
At October 31, 2005, Institutional Emerging Markets Portfolio, for federal income tax purposes, had a capital loss carryover of $2,440, which will reduce the taxable income arising from future net realized gain on investments, if any, to the extent permitted by the Internal Revenue code and thus will reduce the amount of distributions to shareholders which would otherwise be necessary to relieve the Portfolio of any liability for federal income or excise tax. Such capital loss carryovers will expire on October 31, 2013.
International Equity and Global Equity utilized $40,745,543 and $1,623,402, respectively, of capital loss carryforwards in the current period to offset net realized capital gain for federal tax purposes.
Primarily as a result of differing book/tax treatment of foreign currency transactions, foreign capital gain tax expenses and net operating loss, the Fund made reclassifications among certain capital accounts. The reclassifications have no impact on the net assets of the Fund. As of October 31, 2005, the following reclassifications were made to the Statements of Net Assets.
| | | | | | | |
| | | | Accumulated Undistributed | | | |
| | | | Net Realized Gain/Loss on | | Accumulated | |
| | | | Investments & Foreign | | Undistributed | |
| | | | Currency Related | | Net Investment | |
Portfolio | | Paid-in Capital | | Transactions | | Income | |
International Equity | | | $ | 1 | | | | $ | 949,709 | | | | $ | (949,710 | ) | |
Institutional Emerging Markets | | | (9,803 | ) | | | 9,500 | | | | 303 | | |
Global Equity | | | (1 | ) | | | 39,662 | | | | (39,661 | ) | |
5. Foreign Exchange Contracts
The Portfolios, on occasion, enters into forward foreign exchange contracts in order to hedge their exposure to changes in foreign currency exchange rates on their foreign portfolio holdings. A forward foreign exchange contract is a commitment to purchase or sell a foreign currency at a future date at a negotiated forward rate. The gain or loss arising from the difference between the cost of the original contracts and the closing of such contracts is included in net realized gains or losses on foreign currency-related transactions. Fluctuations in the value of forward foreign exchange contracts are recorded for book purposes as unrealized appreciation or depreciation on assets and liabilities denominated in foreign currencies by the Portfolios. The Portfolios are also exposed to credit risk associated with counter party nonperformance on these forward foreign exchange contracts which is typically limited to the unrealized gain on each open contract.
The Portfolios enter into foreign currency transactions on the spot markets in order to pay for foreign investment purchases or to convert to dollars the proceeds from foreign investment sales or coupon interest receipts.
| | | | | | | |
| | | | In Exchange For | | Net Unrealized | |
Settlement Date | | Sale | | (in U.S. dollars) | | Appreciation | |
11/4/2005 | | 6,106,772 HUF | | | $ | 29,250 | | | | $ | 87 | | |
| | | | | | | | | | | | | |
32
Harding, Loevner Funds, Inc.
Notes to Financial Statements (continued)
6. Capital Share Transactions
Transactions in capital stock for International Equity - Institutional Class were as follows for the years indicated:
| | | | | |
| | Year Ended | | Year Ended | |
| | October 31, 2005 | | October 31, 2004 | |
| | Shares | | Amount | | Shares | | Amount | |
Shares sold | | 803,180 | | $ | 11,311,197 | | 4,113,187 | | $ | 49,810,442 | |
Shares issued upon reinvestment of dividends | | 98,172 | | 1,313,542 | | 153,692 | | 1,833,540 | |
| | 901,352 | | 12,624,739 | | 4,266,879 | | 51,643,982 | |
Shares redeemed | | (6,174,345 | ) | (88,011,589 | ) | (9,832,119 | ) | (119,352,363 | ) |
Net decrease | | (5,272,993 | ) | $ | (75,386,850 | ) | (5,565,240 | ) | $ | (67,708,381 | ) |
Transactions in capital stock for International Equity - Investor Class were as follows for the period indicated:
| | | |
| | Period From | |
| | September 30, 2005 | |
| | To October 31, 2005 | |
| | Shares | | Amount | |
Shares sold | | | 35,213 | | | $ | 521,999 | |
Shares issued upon reinvestment of dividends | | | — | | | — | |
| | | 35,213 | | | 521,999 | |
Shares redeemed | | | (1,003 | ) | | (14,714 | ) |
Net increase | | | 34,210 | | | $ | 507,285 | |
Transactions in capital stock for Institutional Emerging Markets were as follows for the period indicated:
| | | |
| | Period from | |
| | October 17, 2005 | |
| | to October 31, 2005 | |
| | Shares | | Amount | |
Shares sold | | 500,000 | | $ | 5,000,000 | |
Shares issued upon reinvestment of dividends | | — | | — | |
| | 500,000 | | 5,000,000 | |
Shares redeemed | | — | | — | |
Net increase | | 500,000 | | $ | 5,000,000 | |
Transactions in capital stock for Global Equity Institutional Class were as follows for the years indicated:
| | | | | |
| | Year Ended | | Year Ended | |
| | October 31, 2005 | | October 31, 2004 | |
| | Shares | | Amount | | Shares | | Amount | |
Shares sold | | 46,031 | | $ | 846,308 | | 76,175 | | $ | 1,297,150 | |
Shares issued upon reinvestment of dividends | | 1,111 | | 20,550 | | 3,913 | | 66,670 | |
| | 47,142 | | 866,858 | | 80,088 | | 1,363,820 | |
Shares redeemed | | (304,635 | ) | (5,732,623 | ) | (194,039 | ) | (3,317,264 | ) |
Net decrease | | (257,493 | ) | $ | (4,865,765 | ) | (113,951 | ) | $ | (1,953,444 | ) |
Redemptions made within 90 days of purchase are subject to a redemption fee equal to 2% of the amount redeemed. For the year ended October 31, 2005, International Equity - Institutional Class received $400 in redemption fees related to transactions in shares of common stock on the Statement of Changes in Net Assets.
33
Harding, Loevner Funds, Inc.
Notes to Financial Statements (continued)
7. Repurchase Agreements
Each Portfolio may enter into repurchase agreements under which a bank or securities firm that is a primary or reporting dealer in U.S. Government securities agrees, upon entering into a contract, to sell such securities to a Portfolio and repurchase such securities from such Portfolio at a mutually agreed upon price and date.
Each Portfolio may engage in repurchase transactions with parties selected on the basis of such party’s creditworthiness. Securities purchased subject to repurchase agreements must have an aggregate market value greater than or equal to the repurchase price plus accrued interest at all times. If the value of the underlying securities falls below the value of the repurchase price plus accrued interest, the Portfolio will require the seller to deposit additional collateral by the next business day. If the request for additional collateral is not met, or the seller defaults on its repurchase obligation, the Portfolio maintains the right to sell the underlying securities at market value and may claim any resulting loss against the seller.
8. Concentration of Risk
Investing in securities of foreign issuers and currency transactions may involve certain considerations and risks not typically associated with investments in the United States. These risks include revaluation of currencies, adverse fluctuations in foreign currency values and possible adverse political, social and economic developments, including those particular to a specific industry, country or region, which could cause the securities and their markets to be less liquid and prices more volatile than those of comparable U.S. companies and U.S. government securities. These risks are greater with respect to securities of issuers located in emerging market countries in which the International Equity, Institutional Emerging Markets and Global Equity are authorized to invest.
34
Harding, Loevner Funds, Inc.
Report of Independent Registered Public Accounting Firm
Shareholders and Board of Directors
Harding, Loevner Funds, Inc.
We have audited the accompanying statements of net assets of Harding, Loevner Funds, Inc. (comprising, the International Equity Portfolio, the Institutional Emerging Markets Portfolio and the Global Equity Portfolio), (collectively the “Portfolios”) as of October 31, 2005, and the related statements of operations for the year then ended, the statements of changes in net assets for each of the two years in the period then ended and financial highlights for each of the periods indicated therein. These financial statements and financial highlights are the responsibility of the Portfolios’ management. Our responsibility is to express an opinion on these financial statements and financial highlights based on our audits.
We conducted our audits in accordance with the standards of the Public Company Accounting Oversight Board (United States). Those standards require that we plan and perform the audit to obtain reasonable assurance about whether the financial statements and financial highlights are free of material misstatement. We were not engaged to perform an audit of the Portfolios’ internal control over financial reporting. Our audits included consideration of internal control over financial reporting as a basis for designing audit procedures that are appropriate in the circumstances, but not for the purpose of expressing an opinion on the effectiveness of the Portfolios’ internal control over financial reporting. Accordingly, we express no such opinion. An audit also includes examining, on a test basis, evidence supporting the amounts and disclosures in the financial statements and financial highlights, assessing the accounting principles used and significant estimates made by management, and evaluating the overall financial statement presentation. Our procedures included confirmation of securities owned as of October 31, 2005 by correspondence with the custodian and others or by other appropriate auditing procedures where replies from others were not received. We believe that our audits provide a reasonable basis for our opinion.
In our opinion, the financial statements and financial highlights referred to above present fairly, in all material respects, the financial position of each of the respective portfolios comprising Harding, Loevner Funds, Inc. at October 31, 2005, the results of their operations for the year then ended, the changes in their net assets for each of the two years in the period then ended and the financial highlights for each of the indicated periods, in conformity with U.S. generally accepted accounting principles.

New York, New York
December 6, 2005
35
International Equity and Global Equity paid qualifying foreign taxes of $741,122 and $30,155, and earned $5,053,664 and $405,882 foreign source income during the year ended October 31, 2005, respectively. Pursuant to Section 853 of the Internal Revenue Code, International Equity and Global Equity designated $0.0367 and $0.0243 per share as foreign taxes paid and $0.2504 and $0.3263 per share as income earned from foreign sources for the year ended October 31, 2005, respectively.
International Equity and Global Equity had qualifying dividend income of $3,825,806 and $336,256 during the year ended October 31, 2005, respectively.
36
International Equity, Institutional Emerging Markets and Global Equity have elected to pass through the credit for taxes paid in foreign countries during its fiscal year ended October 31, 2005. In accordance with current tax laws, the Foreign Income and Foreign Tax per share (for a share outstanding on October 31, 2005) is as follows:
| | International Equity | | | | Global Equity |
| | | | Gross Foreign | | | | | | Gross Foreign |
Country | | Foreign Tax | | Dividends | | Country | | Foreign Tax | | Dividends |
Bermuda | | 0.0164 | | 0.0000 | | Australia | | 0.0124 | | 0.0000 |
Canada | | 0.0067 | | 0.0009 | | Austria | | 0.0030 | | 0.0004 |
France | | 0.0362 | | 0.0049 | | Bermuda | | 0.0291 | | 0.0000 |
Germany | | 0.0108 | | 0.0016 | | Canada | | 0.0056 | | 0.0008 |
Hong Kong | | 0.0195 | | 0.0000 | | Egypt | | 0.0012 | | 0.0000 |
India | | 0.0085 | | 0.0000 | | France | | 0.0239 | | 0.0030 |
Ireland | | 0.0048 | | 0.0000 | | Hong Kong | | 0.0147 | | 0.0000 |
Japan | | 0.0273 | | 0.0019 | | Japan | | 0.0192 | | 0.0013 |
Mexico | | 0.0035 | | 0.0000 | | Mexico | | 0.0071 | | 0.0000 |
Netherlands | | 0.0100 | | 0.0015 | | Netherland Antilles | | 0.0059 | | 0.0000 |
South Africa | | 0.0107 | | 0.0000 | | Netherlands | | 0.0138 | | 0.0021 |
South Korea | | 0.0037 | | 0.0001 | | South Africa | | 0.0092 | | 0.0000 |
Spain | | 0.0208 | | 0.0031 | | South Korea | | 0.0107 | | 0.0000 |
Sweden | | 0.0170 | | 0.0025 | | Spain | | 0.0069 | | 0.0010 |
Switzerland | | 0.0381 | | 0.0034 | | Switzerland | | 0.0209 | | 0.0017 |
Taiwan | | 0.0118 | | 0.0029 | | Taiwan | | 0.0106 | | 0.0027 |
Thailand | | 0.0045 | | 0.0138 | | Thailand | | 0.0053 | | 0.0111 |
Shareholders will receive more detailed information along with their Form 1099-DIV in January, 2006.
37
Harding, Loevner Funds, Inc.
Approval of Investment Adviser Agreements
October 31, 2005 (unaudited)
The Board of Directors of the Harding, Loevner Funds, Inc. (the “Fund”), and by a separate vote, the Directors of the Fund (the “Independent Directors”) who are not “interested persons” as defined in the Investment Company Act of 1940, as amended (the “1940 Act”), of the Fund, approved the continuance of the Investment Adviser Agreements between the Fund (on behalf of each of the International Equity Portfolio, the Global Equity Portfolio and the Emerging Markets Portfolio (each a “Portfolio” and collectively the “Portfolios”)) and Harding, Loevner Management, L.P. (“HLM” or “Investment Adviser”) with respect to each Portfolio at a meeting held on September 7, 2005.
As part of its review, the Board carefully considered the following: (i) a memorandum from Dechert, LLP, counsel to the Fund, that explained the Directors’ fiduciary duties and obligations under Sections 15 and 36(b) of the 1940 Act as well as the Fund’s disclosure requirements; (ii) comparative fee and performance information; (iii) information on soft dollar transactions; (iv) code of ethics compliance reports; and (v) HLM’s financial statements for the periods ended June 30, 2004 and June 30, 2005.
The Board also considered the following information: (i) a detailed profitability analysis putting the Fund into the context of HLM’s overall advisory business and highlighting the revenues to and expenses of the Investment Adviser in managing the Fund; (ii) the effect of the fee waivers for the International Equity Portfolio and Global Equity Portfolio on net Fund expenses; (iii) the expenses attributable to the Fund, as compared to the expenses of HLM’s overall business, including the allocation of expenses attributable to the Fund, such as direct and indirect costs, overhead and other expenses; (iv) actual expenses for calendar year 2004 and estimated expenses for calendar year 2005; (v) total expenses before distribution costs, such as communications to third parties and fees paid to intermediaries; (vi) how the ownership structure of the Investment Adviser affects certain elements of the Investment Adviser’s profitability analysis (including that the Investment Adviser was a closely held company owned by employees and that for many employees an important part of their compensation was their ownership of equity in the firm; (vii) the long-term profit and loss summary for HLM; (viii) how overhead operating expenses for marketing were distinguished from distribution costs; and (ix) increases in distribution fees paid to third parties as assets under management increase and as the Portfolios become available on additional platforms.
The Board considered a number of factors in evaluating HLM, including: (i) the nature and quality of services provided; (ii) the investment performance of the Portfolios; (iii) the cost of the services provided; (iv) the profitability of the Investment Adviser; (v) the realization of economies of scale; and (vi) comparison of fees and services.
Quality and Nature of the Services
There was a clear consensus among the Independent Directors that HLM was an organization which placed the interests of the Fund’s shareholders first, did an excellent job of communicating with the Fund’s Board and has demonstrated a positive culture of compliance. These determinations were not based merely on the materials provided at the present meeting, but on the Board’s ongoing dealings with HLM. With regard to these areas, the Board was satisfied that the quality and nature of the services provided by HLM argued in favor of renewing the advisory agreement.
The Board then considered the investment performance for each of the three Fund Portfolios. The Board had available to it the qualifications, background and responsibilities of the Portfolios’ portfolio management team and senior management of HLM and recognized that these persons report to the Board regularly. The Board had been provided by HLM copies of investment performance data obtained from Bloomberg and Morningstar for funds in the Lipper International Funds Index and a number of other international equity funds; funds in the Lipper Global Funds Index and a number of other global equity funds; and funds in the Lipper Emerging Market Funds Index and a number of other emerging market funds (collectively the “Peer Group Data”). The Peer Group Data included fund management fees, total expense ratios, net assets, calendar year-to-date return and 1-, 3- and 5-year returns, as well as median and average data with regard to the foregoing.
With respect to the Emerging Markets Portfolio, the Independent Directors reviewed the Fund’s strong recent and historical performance which, net of fees, has outperformed its benchmarks (the MSCI Emerging Markets Index and the Lipper Emerging Markets Index) over the 1-, 3- and 5-year periods and has performed better than the average and median performance of its Peer Group during those periods. Based on this performance, the Board concluded that performance factors warranted consideration in favor of renewal. With respect to the International Equity and Global Equity portfolios, the Independent Directors determined that HLM had done an excellent job in addressing past performance issues for the Portfolios, noting that a combination of market forces (such as the style cycle favoring the portfolios’ investment strategies) and reorganization efforts undertaken over the past year by management had shown improved performance over the past year.
38
Harding, Loevner Funds, Inc.
Approval of Investment Adviser Agreements (continued)
October 31, 2005 (unaudited)
The Board noted that the Global Equity Portfolio’s one year return net of fees exceeded both the MSCI All Country World Index and Lipper Global Equity Fund index, and also exceeded the median and average performance for the Peer Group. With respect to the International Equity Portfolio, the Board noted that the Portfolio’s performance, net of fees, exceeded both the Portfolio’s two benchmarks (the MSCI All Country ex USA Index and the Lipper International Equity Fund Index) as well as the average and median performance of its peer group.
Based on their review of the data provided by HLM and all other relevant data, the Independent Directors concluded that they were satisfied with the quality of services provided by HLM to shareholders.
Fees and Costs of Providing Services
The Independent Directors considered a number of related factors in assessing the costs proposed by HLM to be charged for providing advisory services to the Fund, including: (i) a comparison of advisory and total Portfolio fees with competing fund products; (ii) a review of HLM’s profitability information; (iii) consideration of whether any benefits or economies of scale are provided to shareholders; and (iv) consideration of whether HLM has received any ancillary or “fall-out” benefits in connection with its management of the portfolios.
The Independent Directors reviewed the Peer Group Data provided by HLM with respect to advisory fees, net assets and total expenses and concluded that HLM charged competitive fees to each of the Portfolios (noting the disadvantage of running a fund the size of Global Equity Portfolio). For the Global Equity Portfolio, management fees were above the Peer Group median and averages, though total expenses were below the median and average of the Peer Group notwithstanding its size. The International Equity Portfolio’s management fee and total expense ratio were below the median and average of the Peer Group. For the Emerging Markets Portfolio, the Board noted that management fees and total expenses were above median and averages for their Peer Group, but took into account the Portfolio’s strong performance records, the Portfolio’s size in comparison to its Peer Group and the fact that there were a number of funds with similar management fees and higher overall expenses. The Independent Directors noted HLM’s ongoing efforts to increase its asset base and discussed the growth in assets for the Emerging Markets Portfolio.
The Independent Directors reviewed the financial statements of HLM and HLM Holdings, Inc. (HLM’s general partner), which showed the net income of both entities, the revenues received and the expenses incurred, including those paid for employee salaries. The Independent Directors considered any ancillary benefits derived by HLM in connection with its management of the portfolios, and reviewed the soft dollar report. The Independent Directors also reviewed a profitability analysis prepared by HLM and concluded that HLM’s profits were reasonable.
Based on the foregoing, the Board concluded that the fees charged by HLM are within the range that might be obtained in an arm’s length negotiation. The Board based their evaluation on all material factors discussed above, including (i) the terms of the agreement; (ii) the reasonableness of the advisory fee in light of the nature and quality of the services provided and any additional benefits received by HLM in connection with providing services to the Fund; (iii) the nature, quality, cost and extent of the services performed by HLM; (iv) the expense ratios of the portfolios as compared to the expense ratios of similar funds; and (v) the overall organization and experience of HLM, as well as HLM’s profitability and financial condition. In arriving at its decision, the Independent Directors did not single out any one factor or group of factors as being more important than other factors, but considered all factors together.
After extensive discussion, both in general session and in executive session of the Independent Directors meeting alone, and based on a consideration of these factors in their totality, the Board, including the Independent Directors voting separately, unanimously determined to continue the Investment Advisory Agreements for each of the International Equity Portfolio, Global Equity Portfolio and Emerging Markets Portfolio.
39
Harding, Loevner Funds, Inc.
Directors and Principal Officers of the Fund
Disinterested Directors:
Name,
Address and
Age | | Position
with the
Fund | | Term of Office
and Length of
Time Served* | | Principal
Occupation(s)
During Past
Five Years | | Number of
Portfolios in
Fund
Complex
Overseen By
Director | | Other
Directorships
Held by
Director |
R. Kelly Doherty
41 Post Road
Bernardsville, NJ 07924
Age, 47 | | Director | | Indefinite; Director since 2004 | | Cayman Partners (private investment vehicle), Investor, 1/99-present | | 4 | | Cyota Inc.; L.P. Thebault & Co.; The Perk School |
Jane A. Freeman
c/o Scientific Learning
300 Frank Ogawa Plaza
Oakland, CA
Age, 52 | | Director | | Indefinite; Director since 1996 | | Scientific Learning Corporation (Education Software), Chief Financial Officer, 1/00-present; Treasurer and Vice President, Finance & Business Development, 9/99-1/00 | | 4 | | None |
Samuel R. Karetsky
900 Third Avenue,
26th Fl. New York, NY 10022
Age, 60 | | Director | | Indefinite; Director since 1998 | | The Karetsky Group, LLC (Advisory Firm), 1/03-present; Wetherby Asset Management, 2004-present; European Investors Inc., Managing Director, 11/98-12/02 | | 4 | | None |
Raymond J. Clark
66 Greenway Terrace
Princeton, NJ 08540
Age, 70 | | Director | | Indefinite; Director since 2004 | | The Woodrow Wilson National Fellowship Foundation, Treasurer, 08/04-present; Wellesley College, Interim Vice President of Finance and Treasurer, 10/03-6/04; Princeton University, Treasurer, 1987-2001. | | 4 | | Princeton Healthcare System; American Red Cross of Central New Jersey |
Interested Director:
Name,
Address and
Age | | Position
with the
Fund | | Term of Office
and Length of
Time Served* | | Principal
Occupation(s)
During Past
Five Years | | Number of
Portfolios in
Fund
Complex
Overseen by
Director | | Other
Directorships
Held by
Director |
David R. Loevner**
Harding, Loevner
Management, L.P.
50 Division Street,
Suite 401
Somerville, NJ 08876
Age, 51 | | Director,
President and
Chairman of
the Board | | Indefinite;
Director,
President and
Chairman of the
Board since 1996 | | Harding, Loevner Management, L.P., President and CEO, 7/89-present. | | 4 | | None |
* Each director is elected to serve in accordance with the Articles of Incorporation and By-Laws of the Fund until his or her successor is duly elected and qualified.
** David R. Loevner is considered an “interested person” of the Fund as defined in the Investment Company Act of 1940, as amended, because he serves as President and CEO of Harding, Loevner Management, L.P., the Fund’s investment adviser.
40
Harding, Loevner Funds, Inc.
Directors and Principal Officers of the Fund (continued)
Principal Officers of the Fund
Name,
Address and
Age | | Position
with the Fund | | Term of Office
and Length of
Time Served¨ | | Principal
Occupation (s)
During Past
Five Years |
Richard Reiter
Harding, Loevner Management, L.P.
50 Division Street, Suite 401
Somerville, NJ 08876
Age, 39 | | Treasurer and
Chief
Financial
Officer | | 1 year; Treasurer and Chief Financial Officer since September 2002 | | Harding, Loevner Management, L.P., Portfolio Manager 1/01-present; Product Information Manager, 4/96-12/00. |
Patrice Singleton
Harding, Loevner Management, L.P.
50 Division Street, Suite 401
Somerville, NJ 08876
Age, 52 | | Vice President | | 1 year; Vice President since 2002 | | Harding, Loevner Management, L.P., Director and Chief Compliance Officer, 7/94-present. |
Susan C. Mosher
Investors Bank & Trust Company
200 Clarendon Street
Boston, MA 02116
Age, 50 | | Secretary and
Chief
Compliance
Officer | | 1 year; Secretary since 1999; Chief Compliance Officer since 2004 | | Investors Bank & Trust Company, Senior Director and Senior Counsel 1/01-present; Director and Counsel 8/95-12/00. |
Brendan J. O’Neill
Investors Bank & Trust Company
200 Clarendon Street
Boston, MA 02116
Age, 37 | | Assistant
Treasurer | | 1 year; Assistant Treasurer since 2004 | | Investors Bank & Trust Company, Director 1/05-present; Senior Manager 11/02-12/04; Manager 7/00-10/02. |
Rainer L.C. Frost
Investors Bank & Trust Company
200 Clarendon Street
Boston, MA 02116
Age, 48 | | Assistant
Secretary | | 1 year; Assistant Secretary since 2005 | | Investors Bank & Trust Company, Director and Counsel 6/05-present; Principal and General Counsel, Clarity Group 9/00-6/05; Chief Administration Officer, Executive Vice-President and General Counsel, GoldK, Inc. 3/01-6/02; Chief Executive Officer and General Counsel Norfox Software 9/99-9/00. |
¨ Officers are elected to hold such office until their successor is elected and qualified to carry out the duties and responsibilities of their office, or until he or she resigns or is removed from office.
The Fund’s Statement of Additional Information contains additional information about the Directors of the Fund and is available, without charge, upon request, by calling 1-877-435-8105.
41
Harding, Loevner Funds, Inc.
Supplemental Information
Quarterly Form N-Q Portfolio Schedule
Each portfolio will file its complete schedule with the Security and Exchange Commission (“SEC”) on Form N-Q at the end of the first and third fiscal quarters within 60 days of the end of the quarter to which it relates. The Portfolio’s Form N-Q will be available on the SEC’s website at www.sec.gov and may also be reviewed and copied at the SEC’s Public Reference Room. Additionally, they are available upon request by calling 1-877-435-8105.
Proxy Voting Record
The Fund’s proxy voting record relating to the portfolio securities during the most recent 12-month period ended June 30 is available on the Fund’s website at www.hardingloevner.com and on the Commission’s website at www.sec.gov.
Proxy Voting Policies and Procedures
A description of the Fund’s proxy voting policies and procedures are located in the Statement of Additional Information and is available without charge, upon request, by calling 1-877-435-8105 or on the Commission’s website at www.sec.gov.
42
Item 2. Code of Ethics.
As of October 31, 2005, the Registrant has adopted a code of ethics that applies to the Registrant’s President/Chief Executive Officer and Treasurer/Chief Financial Officer. For the year ended October 31, 2005, there were no amendments to a provision of its code of ethics, nor were there any waivers granted from a provision of the code of ethics. A copy of its code of ethics is filed with this Form N-CSR under Item 11(a)(1).
Item 3. Audit Committee Financial Expert.
The Registrant’s Board of Directors has determined that the Registrant has more than one audit committee financial expert serving on its audit committee. The audit committee financial experts serving on the Registrant’s audit committee are Carl Schafer and Jane Freeman, both of whom are independent.
Item 4. Principal Accountant Fees and Services.
(a) AUDIT FEES: The aggregate fees billed for each of the last two fiscal years for professional services rendered by Ernst Young LLP for the audit of the registrant annual financial statements or services that are normally provided by the accountant in connection with statutory and regulatory filings or engagements for those fiscal years are $82,500 in 2005 and $65,600 in 2004.
(b) AUDIT-RELATED FEES: The aggregate fees billed in each of the last two fiscal years for assurance and related services by Ernst Young LLP that are reasonably related to the performance of the audit of the registrant financial statements and are not reported under paragraph (a) of this Item are NONE.
(c) TAX FEES: The aggregate fees billed in each of the last two fiscal years for professional services rendered by Ernst Young LLP for the review of domestic tax returns and the preparation of Indian income-tax returns are $30,000 in 2005 and $20,300 in 2004.
(d) ALL OTHER FEES: The aggregate fees billed in each of the last two fiscal years for products and services provided by Ernst Young LLP, other than the services reported in paragraphs (a) through (c) of this Item are NONE.
(e)(1) Disclose the audit committee pre-approval policies and procedures described in paragraph (c)(7) of Rule 2-01 of Regulation S-X.
The Registrant’s audit committee pre-approves all audit and non-audit services to be performed by Ernst & Young LLP, the Registrant’s independent accountant, before Ernst & Young LLP is engaged by the Registrant to perform such services.
(e)(2) The percentage of services described in each of paragraphs (b) through (d) of this Item that were approved by the audit committee pursuant to paragraph (c)(7)(i)(C) of Rule 2-01 of Regulation S-X are as follows:
(b) Not applicable
(c) 100%
(d) Not applicable
(f) Not applicable.
(g) Not applicable.
(h) Not applicable.
Item 5. Audit Committee of Listed Registrants.
Not applicable to this filing.
Item 6. Schedule of Investments
Not applicable to this filing.
Item 7. Disclosure of Proxy Voting Policies and Procedures for Closed-End Management Investment Companies.
Not applicable to this registrant.
Item 8. Purchases of Equity Securities by Closed-End Management Investment Company and Affiliated Purchasers.
Not applicable to this registrant.
Item 9. Submission of Matters to a Vote of Security Holders.
Not applicable to this filing.
Item 10. Controls and Procedures.
(a) The Registrant’s Principal Executive Officer and Principal Financial Officer concluded that the Registrant’s disclosure controls and procedures (as defined in Rule 30a-3(c) under the Investment Company Act of 1940) were effective as of a date within 90 days prior to the filing date of this report, based on their evaluation of the effectiveness of the Registrant’s disclosure controls and procedures as of the Evaluation Date.
(b) There were no significant changes in the Registrant’s internal control over financial reporting (as defined in Rule 30a-3(d) under the 1940 Act (17 CFR 270.30a-3(d)) that occurred during the second fiscal quarter of the period covered by this report that has materially affected, or is reasonably likely to materially affect, the Registrant’s internal control over financial reporting.
Item 11. Exhibits.
(a)(1) Sox Code of Ethics is attached.
(a)(2) Section 302 Certification letters are attached.
(b) Section 906 Certifications are attached.
Pursuant to the requirements of the Securities Exchange Act of 1934 and the Investment Company Act of 1940, the registrant has duly caused this report to be signed on its behalf by the undersigned, thereunto duly authorized.
Harding, Loevner Funds, Inc. |
|
By: /S/ | |
David R. Loevner, President |
Date: | December 29, 2005 |
| | |
Pursuant to the requirements of the Securities Exchange Act of 1934 and the Investment Company Act of 1940, this report has been signed below by the following persons on behalf of the registrant and in the capacities and on the dates indicated.
By: /S/ | |
David R. Loevner, President |
Date: | December 29, 2005 |
|
|
By: /S/ | |
Richard Reiter, Treasurer and Chief Financial Officer |
Date: | December 29, 2005 |
| | | | |
HARDING, LOEVNER FUNDS, INC.
Officers, Directors and Responsible Parties
OFFICERS AND DIRECTORS
Jane A. Freeman
Director of the Fund
Samuel R. Karetsky
Director of the Fund
R. Kelly Doherty
Director of the Fund
Raymond J. Clark
Director of the Fund
David R. Loevner
Director, President and Chairman of the Board of the Fund
Patrice Singleton
Vice President of the Fund
Susan C. Mosher
Secretary and Chief Compliance Officer of the Fund
Richard Reiter
Chief Financial Officer and Treasurer of the Fund
Brendan J. O’Neill
Assistant Treasurer of the Fund
INVESTMENT ADVISOR
Harding, Loevner Management, L.P.
50 Division Street, Suite 401
Somerville, NJ 08876
DISTRIBUTOR
Quasar Distributors, LLC
615 East Michigan Street
Milwaukee, WI 53202
ADMINISTRATOR, CUSTODIAN AND FUND ACCOUNTING AGENT
Investors Bank & Trust Company
P.O. Box 9130
Boston, MA 02117
TRANSFER AND DIVIDEND DISBURSING AGENT
Investors Bank & Trust Company
P.O. Box 9130
Boston, MA 02117
LEGAL COUNCIL
Dechert
1775 Eye Street, N.W.
Washington, D.C. 20006-2401
INDEPENDENT AUDITORS
Ernst & Young LLP
5 Times Square
New York, NY
This report is intended for shareholders of Harding Loevner Funds. It may not be used as sales literature unless preceded or accompanied by the current prospectus, which gives details about charges, expenses, investment objectives, risks and policies of the Portfolios.