 | 1095 Avenue of the Americas New York, NY 10036-6797 +1 212 698 3500 Main +1 212 698 3599 Fax www.dechert.com
| |
| ||
STEPHEN H. BIER
stephen.bier@dechert.com +1 212 698 3889 Direct +1 202 261 3092 Fax |
February 21, 2017
VIA EDGAR
Ms. Ashley Vroman-Lee
U.S. Securities and Exchange Commission
Division of Investment Management
100 F Street, N.E.
Washington, D.C. 20549
| Re: | Harding, Loevner Funds, Inc. (the “Registrant”) |
File Numbers333-09341 and811-07739
Post-Effective Amendment No. 51 to the Registration Statement on FormN-1A
Dear Ms. Vroman-Lee:
This letter responds to the U.S. Securities and Exchange Commission (“SEC”) staff’s (the “Staff”) comments that you provided with respect to Post-Effective Amendment No. 51 (“PEA No. 51”) to the Registrant’s registration statement filed with the SEC on December 23, 2016. We have reproduced the Staff’s comments below, followed by our responses. Undefined capitalized terms used below have the same meaning as given in PEA No. 51.
PROSPECTUS
Global Equity Portfolio
| 1. | Comment: In light of the use of the term “global” in the Portfolio’s name, please explain how the Portfolio invests its assets in investments that are tied economically to a number of countries throughout the world. Please see footnote 42 in the adopting release for Rule35d-1 under the 1940 Act. |
Response: The Portfolio invests its assets in investments that are tied economically to a number of countries throughout the world by normally holding, as disclosed in the Portfolio’sPrincipal Investment Strategies section, investments across at least 15 countries and normally investing broadly in equity securities of companies domiciled in the following countries and regions: (1) Europe; (2) the Pacific Rim; (3) the United States, Canada and Mexico; and (4) countries with emerging or frontier markets.
| 2. | Comment: Please complete all missing or incomplete information, including the fee table. In addition, please provide a copy of the completed fee table via correspondence letter to the Staff for review at least a week in advance of the filing’s effectiveness. |
Response: The Registrant hereby confirms that all missing or incomplete information will be completed and that a completed fee table is attached.
| 3. | Comment: Please clarify whether Harding Loevner is able to recoup any expenses reimbursed under the Fee Waiver and Expense Reimbursement Agreement. |
Response: The Fee Waiver and Expense Reimbursement Agreement between the Registrant and Harding Loevner does not contain a recoupment provision and, therefore, Harding Loevner will not recoup any reimbursed expenses.
| 4. | Comment: Please include Acquired Fund Fees and Expenses in thePortfolio Summary — Portfolio Fees and Expenses fee table, if applicable. |
Response: The Portfolio does not currently intend to invest in investment companies at such levels to require disclosure of Acquired Fund Fees and Expenses.
| 5. | Comment: In thePortfolio Summary — Principal Risks section, please include value investing risk, depositary receipts risk and the risk of investing in investment companies. |
Response: The Registrant respectfully declines to incorporate this comment as the Portfolio’s investment strategy would not be considered by Harding Loevner to be engaged in “value investing” and the Portfolio is not characterized as a “value” fund by independent third parties who evaluate mutual funds. The Registrant also respectfully declines to include depositary receipts risk in the Principal Risks section because the Portfolio currently discloses the risks related to depositary receipts in the Statement of Additional Information and the Registrant believes the current disclosure is sufficient. In addition, the Registrant does not believe that the risk of investing in investment companies is required in the Principal Riskssection because the Portfolio currently does not intend to invest a significant portion of its assets in investment companies.
| 6. | Comment: If the Portfolio may have to pay the issuer of the participation note, please disclose in the registration statement that the Portfolio will segregate assets to cover that obligation. |
Response: The Portfolio will not have to pay the issuer of the participation note and thus the Portfolio will not be required to segregate assets to cover that obligation.
2
| 7. | Comment:Please provide the average annual total returns via correspondence letter at least a week in advance of the filing’s effectiveness. |
Response: The requested information is attached.
| 8. | Comment: In thePortfolio Summary — Managementsection, please confirm whether Messrs. Baughan and Roll are jointly and primarily responsible for theday-to-day management of the Portfolio and, if not, describe their respective roles. |
Response: The Registrant hereby confirms that Messrs. Baughan and Roll are jointly and primarily responsible for theday-to-day management of the Portfolio.
International Equity Portfolio
| 9. | Comment: In thePortfolio Summary — Principal Risks section, please include value investing risk, depositary receipts risk and the risk of investing in investment companies. |
Response: The Registrant respectfully declines to incorporate this comment as the Portfolio’s investment strategy would not be considered by Harding Loevner to be engaged in “value investing” and the Portfolio is not characterized as a “value” fund by independent third parties who evaluate mutual funds. The Registrant also respectfully declines to include depositary receipts risk in the Principal Risks section because the Portfolio currently discloses the risks related to depositary receipts in the Statement of Additional Information and the Registrant believes the current disclosure is sufficient. In addition, the Registrant does not believe that the risk of investing in investment companies is required in the Principal Riskssection because the Portfolio currently does not intend to invest a significant portion of its assets in investment companies.
International Small Companies Portfolio
| 10. | Comment: In thePortfolio Summary — Principal Investment Strategies section, please revise the first sentence to state that the Portfolio invests “primarily” or “substantially all its assets” in small companies based outside the United States, including companies in emerging and frontier as well as in developed markets. |
Response: The disclosure has been revised to state that the Portfolio invests “primarily” in small companies based outside the United States, including companies in emerging and frontier as well as in developed markets.
3
Institutional Emerging Markets Portfolio
| 11. | Comment: The Staff notes that the Portfolio’s 80% policy should only relate to investments in emerging markets securities, not emerging and frontier markets securities, because the 80% policy should track the Portfolio’s name. Please clarify the disclosure accordingly. |
Response: The Portfolio’s 80% policy will be revised to state that the “Portfolio invests, under normal circumstances, at least 80% of its net assets (plus any borrowings for investment purposes) in emerging markets securities, which includes frontier markets securities.”
| 12. | Comment: In thePortfolio Summary — Principal Risks section, please include the risk of investing in investment companies. |
Response: The Portfolio currently does not intend to invest a significant portion of its assets in investment companies. Accordingly, the Registrant does not believe that the risk of investing in investment companies is required in the Principal Riskssection.
| 13. | Comment: In thePortfolio Summary — Managementsection, please confirm whether Messrs. Johnson and Shaw are jointly and primarily responsible for theday-to-day management of the Portfolio and, if not, describe their respective roles. |
Response: The Registrant hereby confirms that Messrs. Johnson and Shaw are jointly and primarily responsible for theday-to-day management of the Portfolio.
| 14. | Comment: The Staff notes that thePortfolio Summary — Principal Risks section includes financial services sector risk. In thePortfolio Summary — Principal Investment Strategies section, please include corresponding disclosure that the Portfolio invests in securities of issuers in the financial services sector. |
Response: The Registrant respectfully declines to incorporate this comment because it is not the Portfolio’s principal investment strategy to invest in securities of issuers in the financial services sector.
Frontier Emerging Markets Portfolio
| 15. | Comment: In thePortfolio Summary — Principal Risks section, please set forth emerging market risk and separately disclose frontier market risk. |
4
Response: The Registrant respectfully declines to incorporate this comment. The Registrant believes that the current disclosure is sufficient because the risks of investing in emerging markets and in frontier emerging markets are materially the same as frontier emerging markets are a subset of emerging markets. The Registrant has revised the disclosure in “Frontier Emerging Market Risk” to clarify that investing in frontier emerging markets do not involve unique risks. The Registrant also currently includes risk disclosure related to investing in emerging markets in the “Additional Information on Portfolio Investment Strategies and Risks” section.
| 16. | Comment: In thePortfolio Summary — Principal Investment Strategies section, the Prospectus states that because some “emerging market countries do not permit foreigners to participate directly in their securities markets or otherwise present difficulties for efficient foreign investment,” the Portfolio may use participation notes to gain exposure to those countries (emphasis added). Please confirm whether “emerging market countries” should be revised to “frontier emerging market countries.” |
Response: The disclosure has been revised accordingly.
| 17. | Comment: The Staff notes that thePortfolio Summary — Principal Risks section includes concentration risk. In thePortfolio Summary — Principal Investment Strategies section, please include corresponding disclosure that the Portfolio may concentrate. |
Response: The disclosure has been revised accordingly.
| 18. | Comment: In thePortfolio Summary — Principal Risks section, please include the risk of investing in investment companies. |
Response: The Portfolio currently does not intend to invest a significant portion of its assets in investment companies. Accordingly, the Registrant does not believe that the risk of investing in investment companies is required in the Principal Riskssection.
| 19. | Comment: Please make all of the relevant corresponding changes to the Portfolio’s Institutional Class II summary section. |
Response: The Registrant has incorporated this comment.
International Equity Research Portfolio
| 20. | Comment: In thePortfolio Summary — Principal Risks section, please include value investing risk. |
5
Response: The Registrant respectfully declines to incorporate this comment as the Portfolio’s investment strategy would not be considered by Harding Loevner to be engaged in “value investing” and the Portfolio is not characterized as a “value” fund by independent third parties who evaluate mutual funds.
All Portfolios
| 21. | Comment: Please incorporate all applicable comments to each Portfolio. |
Response: The Registrant has incorporated this comment.
| 22. | Comment: In theAdditional Information on Portfolio Investment Strategies and Risks — Other Investment Strategies section, the Prospectus states that each Portfolio may invest up to 20% (or 35% for certain Portfolios) of its total assets in debt securities of domestic and foreign issuers. Please explain why this disclosure is not included in each Portfolio’sPrincipal Investment Strategies section. |
Response: Each Portfolio’s ability to invest in debt securities is not disclosed in thePrincipal Investment Strategies section because none of the Portfolios currently intend to invest in debt securities, except to the extent that participation notes are considered debt securities. Each Portfolio’s ability to invest in participation notes is currently disclosed as a principal investment strategy.
| 23. | Comment: In theAdditional Information on Portfolio Investment Strategies and Risks — Other Investment Strategies section, the Prospectus states that a Portfolio may invest in junk bonds. The Staff notes that if a Portfolio intends to invest in junk bonds, the Portfolio’s ability to invest in junk bonds should be disclosed as a principal investment strategy. |
Response: The Registrant confirms that none of the Portfolios currently intend to invest in junk bonds.
| 24. | Comment: In theAdditional Information on Portfolio Investment Strategies and Risks section, please delineate clearly between principal andnon-principal risks by disclosing the principal risks first followed by the additionalnon-principal risks. |
Response: The Registrant respectfully declines to incorporate this comment because the Registrant believes that each Portfolio’s principal risks are clearly disclosed in thePortfolio Summary section. TheAdditional Information on Portfolio Investment Strategies and Risks section is designed to be read in conjunction with each Portfolio’s principal risk disclosure in thePortfolio Summary section, and provides more detailed information on a Portfolio’s principal risks, as well as information on the additionalnon-principal risks that may apply to the Portfolio.
6
| 25. | Comment: Please confirm that each portfolio manager disclosed in theManagement of the Fund — Portfolio Management section is jointly and primarily responsible for theday-to-day management of the applicable Portfolios in accordance with the requirements of Item 10 of FormN-1A. |
Response: The Registrant hereby confirms that each portfolio managers disclosed in theManagement of the Fund — Portfolio Management section is jointly and primarily responsible for theday-to-day management of the applicable Portfolios in accordance with the requirements of Item 10 of FormN-1A. Certain Portfolios have lead portfolio managers and those lead portfolio managers have been disclosed in this section.
| 26. | Comment: Please make all of the relevant corresponding changes from the Institutional Class Prospectus to the Investor Class and Institutional Class Z Prospectuses. |
Response: The Registrant has incorporated this comment.
* * *
We believe that the foregoing has been responsive to the Staff’s comments. Please call the undersigned at (212)698-3889 if you wish to discuss this correspondence further.
| Best regards, |
| /s/ Stephen H. Bier |
| Stephen H. Bier |
7
SUMMARY |
| |
INVESTMENT OBJECTIVE
The Global Equity Portfolio (the “Portfolio”) seeks long-term capital appreciation through investments in equity securities of companies based both inside and outside the United States.
PORTFOLIO FEES AND EXPENSES
This table describes the fees and expenses that you may pay if you buy and hold shares of the Institutional Class of the Portfolio.
SHAREHOLDER FEES (fees paid directly from your investment) | ||||
| Maximum Sales Charge (Load) Imposed on Purchases (as a percentage of offering price) | None | |||
| Redemption Fee (as a percentage of amount redeemed within 90 days or less from the date of purchase) | 2.00% | |||
ANNUAL PORTFOLIO OPERATING EXPENSES (expenses that you pay each year as a percentage of the value of your investment) | ||||
| Management Fees | 0.80% | |||
| Distribution (12b-1) Fees | None | |||
| Other Expenses | 0.12% | |||
| Total Annual Portfolio Operating Expenses | 0.92% | |||
| Fee Waiver and/or Expense Reimbursement1 | 0.00% | |||
| Total Annual Portfolio Operating Expenses After Fee Waiver and/or Expense Reimbursement1 | 0.92% | |||
| 1Harding Loevner LP has contractually agreed to waive a portion of its management fee and/or reimburse the Institutional Class of the Portfolio for its other operating expenses to the extent Total Annual Portfolio Operating Expenses (excluding dividend expenses, borrowing costs, interest expense relating to short sales, interest, taxes, brokerage commissions and extraordinary expenses), as a percentage of average daily net assets, exceed 0.95% through February 28, 2018. | ||||
Example: This example is intended to help you compare the cost of investing in the Institutional Class of the Portfolio with the cost of investing in other mutual funds. The example assumes that you invest $10,000 in the Institutional Class of the Portfolio for the time periods indicated and then redeem all of your shares at the end of those periods. The example also assumes that your investment has a 5% return each year and that the Institutional Class’s operating expenses remain the same. Although your actual costs may be higher or lower, based on these assumptions your costs would be:
| 1 YEAR | 3 YEARS | 5 YEARS | 10 YEARS | |||
| $94 | $293 | $509 | $1,131 |
PORTFOLIO TURNOVER
The Portfolio pays transaction costs, such as commissions, when it buys and sells securities (or “turns
over” its portfolio). A higher portfolio turnover rate may indicate higher transaction costs and may result in higher taxes when Portfolio shares are held in a taxable account. These costs, which are not reflected in annual portfolio operating expenses or in the Example, affect the Portfolio’s performance. During the most recent fiscal year, the Portfolio’s portfolio turnover rate was 24% of the average value of its portfolio.
PRINCIPAL INVESTMENT STRATEGIES
The Portfolio invests in companies based in the United States and other developed markets, as well as in emerging and frontier markets. Harding Loevner LP (“Harding Loevner”), the Portfolio’s investment adviser, undertakes fundamental research in an effort to identify companies that are well managed, financially sound, fast growing and strongly competitive, and whose shares are under-priced relative to estimates of their value. To reduce its volatility, the Portfolio is diversified across dimensions of geography, industry, currency and market capitalization. The Portfolio normally holds investments across at least 15 countries.
The Portfolio will normally invest broadly in equity securities of companies domiciled in the following countries and regions: (1) Europe; (2) the Pacific Rim; (3) the United States, Canada and Mexico; and (4) countries with emerging or frontier markets. At least 65% of total assets will be denominated in at least three currencies, which may include the U.S. dollar. For purposes of compliance with this restriction, American Depositary Receipts, Global Depositary Receipts, and European Depositary Receipts (collectively, “Depositary Receipts”), will be considered to be denominated in the currency of the country where the securities underlying the Depositary Receipts are principally traded.
The Portfolio invests, under normal circumstances, at least 80% of its net assets (plus any borrowings for investment purposes) in common stocks, preferred stocks, rights and warrants issued by companies that are based both inside and outside the United States, securities convertible into such securities (including Depositary Receipts), and investment companies that invest in the types of securities in which the Portfolio would normally invest.
Because some emerging market countries do not permit foreigners to participate directly in their securities markets or otherwise present difficulties for efficient foreign investment, the Portfolio may use equity derivative securities, and, in particular, participation notes, to gain exposure to those countries.
| 2 |
PRINCIPAL RISKS
The Portfolio is subject to numerous risks, any of which could cause an investor to lose money. The principal risks of the Portfolio are as follows:
Market Risk: Investments in the Portfolio may lose value due to a general downturn in stock markets.
Currency Risk: Foreign currencies may experience steady or sudden devaluation relative to the U.S. dollar, adversely affecting the value of the Portfolio’s investments. Because the Portfolio’s net asset value is determined on the basis of U.S. dollars, if the local currency of a foreign market depreciates against the U.S. dollar, you may lose money even if the foreign market prices of the Portfolio’s holdings rise.
Foreign Investment Risk: Securities issued by foreign entities involve risks not associated with U.S. investments. These risks include additional taxation, political, economic, social or diplomatic instability, and the above-mentioned possibility of changes in foreign currency exchange rates. There may also be less publicly-available information about a foreign issuer. Such risks may be magnified with respect to securities of issuers in frontier emerging markets.
Emerging and Frontier Market Risk: Emerging and frontier market securities involve certain risks, such as exposure to economies less diverse and mature than that of the United States or more established foreign markets. Economic or political instability may cause larger price changes in emerging or frontier market securities than in securities of issuers based in more developed foreign countries.
Participation Notes Risk: Participation notes are issued by banks or broker-dealers or their affiliates and are designed to replicate the return of a particular underlying equity or debt security, currency or market. When the participation note matures, the issuer of the participation note will pay to, or receive from, the Portfolio the difference between the nominal value of the underlying instrument at the time of purchase and that instrument’s value at maturity. Participation notes involve the same risks associated with a direct investment in the underlying security, currency or market. In addition, participation notes involve counterparty risk, because the Portfolio has no rights under participation notes against the issuer(s) of the underlying security(ies) and must rely on the creditworthiness of the issuer of the participation note.
Small- and Mid-Capitalization Risk: The securities of smaller and medium-sized companies have historically exhibited more volatility with a lower degree of liquidity than larger companies.
NAV Risk: The net asset value of the Portfolio and the value of your investment will fluctuate.
PORTFOLIO PERFORMANCE
The following bar chart shows how the Portfolio’s investment results have varied from year to year. The
table that follows shows how the Portfolio’s Institutional Class average annual total returns compare with a broad measure of market performance. Together, these provide an indication of the risks of investing in the Portfolio. How the Institutional Class of the Portfolio has performed in the past (before and after taxes) is not necessarily an indication of how it will perform in the future.
Updated Portfolio performance information is available at www.hardingloevnerfunds.com or by calling (877) 435-8105.
GLOBAL EQUITY PORTFOLIO
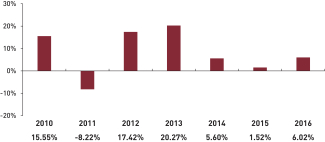
The best calendar quarter return during the period shown above was 15.90% in the 1st quarter of 2012; the worstwas -16.23% in the 3rd quarter of 2011.
AVERAGE ANNUAL TOTAL RETURNS (for the periods ended December 31, 2016) | ||||||||||||
| 1-YEAR | 5-YEAR | SINCE INCEPTION 11/03/09 | ||||||||||
| GLOBAL EQUITY PORTFOLIO - INSTITUTIONAL CLASS | ||||||||||||
Return Before Taxes | 6.02% | 9.93% | 8.43% | |||||||||
Return After Taxes on Distributions1 | 5.68% | 9.42% | 8.01% | |||||||||
Return After Taxes on Distributions and Sale of Portfolio Shares1 | 3.80% | 7.87% | 6.75% | |||||||||
MSCI ALL COUNTRY WORLD (NET) INDEX (reflects no deduction for fees, expenses, or U.S. taxes) | 7.86% | 9.37% | 7.98% | |||||||||
| 1After-tax returns in the table above are calculated using the historical highest individual federal marginal income tax rates and do not reflect the impact of state and local taxes. Actual after-tax returns depend on an investor’s tax situation and may differ from those shown, and after-tax returns shown are not relevant to investors who hold their Portfolio shares through tax-deferred arrangements, such as 401(k) plans or Individual Retirement Accounts. | ||||||||||||
MANAGEMENT
Investment Adviser
Harding Loevner serves as investment adviser to the Portfolio.
Portfolio Managers
Peter Baughan, Ferrill Roll, Christopher Mack and Richard Schmidt serve as the portfolio managers of the
| 3 |
PORTFOLIO SUMMARY | INTERNATIONAL EQUITY PORTFOLIO
| |
INVESTMENT OBJECTIVE
The International Equity Portfolio (the “Portfolio”) seeks long- term capital appreciation through investments in equity securities of companies based outside the United States.
PORTFOLIO FEES AND EXPENSES
This table describes the fees and expenses that you may pay if you buy and hold shares of the Institutional Class of the Portfolio.
SHAREHOLDER FEES (fees paid directly from your investment) | ||||
| Maximum Sales Charge (Load) Imposed on Purchases (as a percentage of offering price) | None | |||
| Redemption Fee (as a percentage of amount redeemed within 90 days or less from the date of purchase) | 2.00% | |||
ANNUAL PORTFOLIO OPERATING EXPENSES1 (expenses that you pay each year as a percentage of the | ||||
| Management Fees | 0.70% | |||
| Distribution (12b-1) Fees | None | |||
| Other Expenses | 0.13% | |||
| Total Annual Portfolio Operating Expenses | 0.83% | |||
| Fee Waiver and/or Expense Reimbursement2 | 0.00% | |||
| Total Annual Portfolio Operating Expenses After Fee Waiver and/or Expense Reimbursement2 | 0.83% | |||
1Expense information in this table has been restated to reflect current management fees, which were reduced effective November 1, 2016. Therefore, the expenses in this table will not correlate to the expenses shown in the Financial Highlights of the Portfolio. 2Harding Loevner LP has contractually agreed to waive a portion of its management fee and/or reimburse the Institutional Class of the Portfolio for its other operating expenses to the extent Total Annual Portfolio Operating Expenses (excluding dividend expenses, borrowing costs, interest expense relating to short sales, interest, taxes, brokerage commissions and extraordinary expenses), as a percentage of average daily net assets, exceed 1.00% through February 28, 2018. |
| |||
Example: This example is intended to help you compare the cost of investing in the Institutional Class of the Portfolio with the cost of investing in other mutual funds. The example assumes that you invest $10,000 in the Institutional Class of the Portfolio for the time periods indicated and then redeem all of your shares at the end of those periods. The example also assumes that your investment has a 5% return each year and that the Institutional Class’s operating expenses remain the same. Although your actual costs may be higher or lower, based on these assumptions your costs would be:
| 1 YEAR | 3 YEARS | 5 YEARS | 10 YEARS | |||
| $85 | $265 | $460 | $1,025 |
PORTFOLIO TURNOVER
The Portfolio pays transaction costs, such as commissions, when it buys and sells securities (or “turns over” its portfolio). A higher portfolio turnover rate may indicate higher transaction costs and may result in higher taxes when Portfolio shares are held in a taxable account. These costs, which are not reflected in annual portfolio operating expenses or in the Example, affect the Portfolio’s performance. During the most recent fiscal year, the Portfolio’s portfolio turnover rate was 22% of the average value of its portfolio.
PRINCIPAL INVESTMENT STRATEGIES
The Portfolio invests primarily in companies based in developed markets outside the United States as well as in established companies in emerging and frontier markets. Harding Loevner LP (“Harding Loevner”), the Portfolio’s investment adviser, undertakes fundamental research in an effort to identify companies that are well managed, financially sound, fast growing and strongly competitive and whose shares are under-priced relative to estimates of their value. To reduce its volatility, the Portfolio is diversified across dimensions of geography, industry, currency and market capitalization. The Portfolio normally holds investments across at least 15 countries.
Factors bearing on whether a company is considered to be “based” outside the United States may include: (1) it is legally domiciled outside the United States; (2) it conducts at least 50% of its business, as measured by the location of its sales, earnings, assets, or production, outside the United States; or (3) it has the principal exchange listing for its securities outside the United States.
The Portfolio will normally invest broadly in equity securities of companies domiciled in the following countries and regions: (1) Europe; (2) the Pacific Rim; (3) Canada and Mexico; and (4) countries with emerging or frontier markets. At least 65% of total assets will be denominated in at least three currencies other than the U.S. dollar. For purposes of compliance with this restriction, American Depositary Receipts, Global Depositary Receipts, and European Depositary Receipts (collectively, “Depositary Receipts”), will be considered to be denominated in the currency of the country where the securities underlying the Depositary Receipts are principally traded.
The Portfolio invests, under normal circumstances, at least 80% of its net assets (plus any borrowings for investment purposes) in common stocks, preferred stocks, rights and warrants issued by companies that are based outside the United States, securities convertible into such securities (including Depositary Receipts), and investment companies that invest in the types of securities in which the Portfolio would normally invest. The Portfolio also
| 5 |
may invest in securities of U.S. companies that derive, or are expected to derive, a significant portion of their revenues from their foreign operations, although under normal circumstances not more than 15% of the Portfolio’s total assets will be invested in securities of U.S. companies.
Because some emerging market countries do not permit foreigners to participate directly in their securities markets or otherwise present difficulties for efficient foreign investment, the Portfolio may use equity derivative securities, and, in particular, participation notes, to gain exposure to those countries.
PRINCIPAL RISKS
The Portfolio is subject to numerous risks, any of which could cause an investor to lose money. The principal risks of the Portfolio are as follows:
Market Risk: Investments in the Portfolio may lose value due to a general downturn in stock markets.
Currency Risk: Foreign currencies may experience steady or sudden devaluation relative to the U.S. dollar, adversely affecting the value of the Portfolio’s investments. Because the Portfolio’s net asset value is determined on the basis of U.S. dollars, if the local currency of a foreign market depreciates against the U.S. dollar, you may lose money even if the foreign market prices of the Portfolio’s holdings rise.
Foreign Investment Risk: Securities issued by foreign entities involve risks not associated with U.S. investments. These risks include additional taxation, political, economic, social or diplomatic instability, and the above-mentioned possibility of changes in foreign currency exchange rates. There may also be less publicly-available information about a foreign issuer. Such risks may be magnified with respect to securities of issuers in frontier emerging markets.
Emerging and Frontier Market Risk: Emerging and frontier market securities involve certain risks, such as exposure to economies less diverse and mature than that of the United States or more established foreign markets. Economic or political instability may cause larger price changes in emerging or frontier market securities than in securities of issuers based in more developed foreign countries.
Participation Notes Risk: Participation notes are issued by banks or broker-dealers or their affiliates and are designed to replicate the return of a particular underlying equity or debt security, currency or market. When the participation note matures, the issuer of the participation note will pay to, or receive from, the Portfolio the difference between the nominal value of the underlying instrument at the time of purchase and that instrument’s value at maturity. Participation notes involve the same risks associated with a direct investment in the underlying security, currency or market. In addition, participation notes involve counterparty risk, because the Portfolio has no rights under participation notes against the issuer(s) of the underlying security(ies) and must rely on the creditworthiness of the issuer of the participation note.
NAV Risk: The net asset value of the Portfolio and the value of your investment will fluctuate.
PORTFOLIO PERFORMANCE
The following bar chart shows how the Portfolio’s investment results have varied from year to year. The table that follows shows how the Portfolio’s Institutional Class average annual total returns compare with a broad measure of market performance. Together, these provide an indication of the risks of investing in the Portfolio. How the Institutional Class of the Portfolio has performed in the past (before and after taxes) is not necessarily an indication of how it will perform in the future.
Updated Portfolio performance information is available at www.hardingloevnerfunds.com or by calling (877) 435-8105.
INTERNATIONAL EQUITY PORTFOLIO
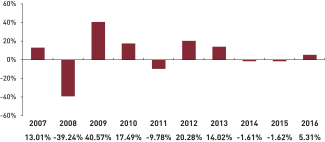
The best calendar quarter return during the period shown above was 21.43% in the 2nd quarter of 2009; the worst was -22.12% in the 4th quarter of 2008.
AVERAGE ANNUAL TOTAL RETURNS (for the periods ended December 31, 2016) | ||||||||||||
| 1-YEAR | 5-YEAR | 10-YEAR | ||||||||||
| INTERNATIONAL EQUITY PORTFOLIO - INSTITUTIONAL CLASS | ||||||||||||
Return Before Taxes | 5.31% | 6.93% | 3.64% | |||||||||
Return After Taxes on Distributions1 | 5.23% | 6.83% | 3.12% | |||||||||
Return After Taxes on Distributions and Sale of Portfolio Shares1 | 3.37% | 5.57% | 2.97% | |||||||||
| MSCI ALL COUNTRY WORLDex-U.S. (NET) INDEX (reflects no deduction for fees, expenses, or U.S. taxes) | 4.50% | 5.00% | 0.97% | |||||||||
| 1After-tax returns in the table above are calculated using the historical highest individual federal marginal income tax rates and do not reflect the impact of state and local taxes. The return after taxes on distributions and sale of Portfolio shares may exceed the Portfolio’s other returns due to an assumed tax benefit from any losses on a sale of Portfolio shares at the end of the measurement period. Actual after-tax returns depend on an investor’s tax situation and may differ from those shown, and after-tax returns shown are not relevant to investors who hold their Portfolio shares through tax-deferred arrangements, such as 401(k) plans or Individual Retirement Accounts. | ||||||||||||
| 6 |
PORTFOLIO SUMMARY | INTERNATIONAL SMALL COMPANIES PORTFOLIO
| |
INVESTMENT OBJECTIVE
The International Small Companies Portfolio (the “Portfolio”) seeks long-term capital appreciation through investments in equity securities of small companies based outside the United States.
PORTFOLIO FEES AND EXPENSES
This table describes the fees and expenses that you may pay if you buy and hold shares of the Institutional Class of the Portfolio.
SHAREHOLDER FEES (fees paid directly from your investment) | ||||
| Maximum Sales Charge (Load) Imposed on Purchases (as a percentage of offering price) | None | |||
| Redemption Fee (as a percentage of amount redeemed within 90 days or less from the date of purchase) | 2.00% | |||
ANNUAL PORTFOLIO OPERATING EXPENSES1 (expenses that you pay each year as a percentage of the value of your investment) | ||||
| Management Fees | 1.15% | |||
| Distribution (12b-1) Fees | None | |||
| Other Expenses | 0.35% | |||
| Total Annual Portfolio Operating Expenses | 1.50% | |||
| Fee Waiver and/or ExpenseReimbursement2 | -0.35% | |||
| Total Annual Portfolio Operating Expenses After Fee Waiver and/or ExpenseReimbursement2 | 1.15% | |||
1Expense information in this table has been restated to reflect current management fees, which were reduced effective November 1, 2016. Therefore, the expenses in this table will not correlate to the expenses shown in the Financial Highlights of the Portfolio. 2Harding Loevner LP has contractually agreed to waive a portion of its management fee and/or reimburse the Institutional Class of the Portfolio for its other operating expenses to the extent Total Annual Portfolio Operating Expenses (excluding dividend expenses, borrowing costs, interest expense relating to short sales, interest, taxes, brokerage commissions and extraordinary expenses), as a percentage of average daily net assets, exceed 1.15% through February 28, 2018. |
| |||
Example: This example is intended to help you compare the cost of investing in the Institutional Class of the Portfolio with the cost of investing in other mutual funds. The example assumes that you invest $10,000 in the Institutional Class of the Portfolio for the time periods indicated and then redeem all of your shares at the end of those periods. The example also assumes that your investment has a 5% return each year and that the Institutional Class’s operating expenses remain the same, except that the example assumes the fee waiver and expense reimbursement agreement pertains only through February 28, 2018. Although your actual costs may be higher or lower, based on these assumptions your costs would be:
| 1 YEAR | 3 YEARS | 5 YEARS | 10 YEARS | |||
| $117 | $440 | $785 | $1,761 |
PORTFOLIO TURNOVER
The Portfolio pays transaction costs, such as commissions, when it buys and sells securities (or “turns over” its portfolio). A higher portfolio turnover rate may indicate higher transaction costs and may result in higher taxes when Portfolio shares are held in a taxable account. These costs, which are not reflected in annual portfolio operating expenses or in the Example, affect the Portfolio’s performance. During the most recent fiscal year, the Portfolio’s portfolio turnover rate was 49% of the average value of its portfolio.
PRINCIPAL INVESTMENT STRATEGIES
The Portfolio invests primarily in small companies based outside the United States, including companies in emerging and frontier as well as in developed markets. Companies considered to be small are those having a market capitalization, at time of purchase, within the range of the market capitalization of companies in the Portfolio’s benchmark index, currently the MSCI All Country World ex-US Small Cap Index (the “Index”). As of December 31, 2016, the range of market capitalization of companies in the Index was US$ [ ] to US$ [ ] billion. To reduce its volatility, the Portfolio is diversified across dimensions of geography, industry and currency. The Portfolio normally holds investments across at least 12 countries.
Factors bearing on whether a company is considered to be “based” outside the United States may include: (1) it is legally domiciled outside the United States; (2) it conducts at least 50% of its business, as measured by the location of its sales, earnings, assets, or production, outside the United States; or (3) it has the principal exchange listing for its securities outside the United States.
The Portfolio will normally invest broadly in equity securities of small companies domiciled in the following countries and regions: (1) Europe; (2) the Pacific Rim; (3) Canada and Mexico; and (4) countries with emerging or frontier markets. At least 65% of total assets will be denominated in at least three currencies other than the U.S. dollar. For purposes of compliance with this restriction, American Depositary Receipts, Global Depositary Receipts and European Depositary Receipts (collectively, “Depositary Receipts”) will be considered to be denominated in the currency of the country where the securities underlying the Depositary Receipts are principally traded.
The Portfolio invests, under normal circumstances, at least 80% of its net assets (plus any borrowings for investment purposes) in common stocks, preferred stocks, rights and warrants issued by small companies that are based outside the United States, securities convertible into such securities (including Depositary
| 8 |
AVERAGE ANNUAL TOTAL RETURNS (for the periods ended December 31, 2016 ) | ||||||||||||
| 1-YEAR | 5-YEAR | SINCE INCEPTION 6/30/2011 | ||||||||||
INTERNATIONAL SMALL COMPANIES PORTFOLIO - INSTITUTIONAL CLASS |
| |||||||||||
Return Before Taxes | 0.30% | 9.27% | 4.05% | |||||||||
Return After Taxes on Distributions1 | -0.58% | 8.59% | 3.44% | |||||||||
Return After Taxes on Distributions and Sale of Portfolio Shares1 | 1.14% | 7.47% | 3.26% | |||||||||
MSCI ALL COUNTRY WORLD ex-U.S. SMALL CAP (NET) INDEX (reflects no deduction for fees, expenses, or U.S. taxes) | 3.92% | 7.73% | 2.82% | |||||||||
| 1After-tax returns in the table above are calculated using the historical highest individual federal marginal income tax rates and do not reflect the impact of state and local taxes. The return after taxes on distributions and sale of Portfolio shares may exceed the Portfolio’s other returns due to an assumed tax benefit from any losses on a sale of Portfolio shares at the end of the measurement period. Actual after-tax returns depend on an investor’s tax situation and may differ from those shown, and after-tax returns shown are not relevant to investors who hold their Portfolio shares through tax-deferred arrangements, such as 401(k) plans or Individual Retirement Accounts. | ||||||||||||
MANAGEMENT
Investment Adviser
Harding Loevner serves as investment adviser to the Portfolio.
Portfolio Managers
Jafar Rizvi serves as the portfolio manager of the International Small Companies Portfolio. Mr. Rizvi has held his position since June 2011.
PURCHASE AND SALE OF PORTFOLIO SHARES
The minimum initial investment in the Institutional Class of the Portfolio is $100,000. Additional purchases may be for any amount. You may purchase or redeem (sell) shares of the Portfolio on any business day through certain authorized brokers and other financial intermediaries or directly from the Portfolio by mail, telephone or wire.
TAX CONSIDERATIONS
The Portfolio’s distributions are generally taxable to you as ordinary income, capital gains, or a combination of the two, unless you are investing through a tax-deferred arrangement, such as a 401(k) plan or an individual retirement account. Upon withdrawal, your investment through a tax-deferred arrangement may become taxable.
PAYMENTS TO BROKERS-DEALERS AND OTHER FINANCIAL INTERMEDIARIES
If you purchase Portfolio shares through a broker-dealer or other financial intermediary (such as a bank), the Portfolio and its related companies may pay the intermediary for the sale of Portfolio shares and related services. These payments may create a conflict of interest by influencing the broker-dealer or other intermediary and your salesperson to recommend the Portfolio over another investment. Ask your salesperson or visit your financial intermediary’s website for more information.
| 10 |
PORTFOLIO SUMMARY | INSTITUTIONAL EMERGING MARKETS PORTFOLIO –
| |
INVESTMENT OBJECTIVE
The Institutional Emerging Markets Portfolio (the “Portfolio”) seeks long-term capital appreciation through investments in equity securities of companies based in emerging markets.
PORTFOLIO FEES AND EXPENSES
This table describes the fees and expenses that you may pay if you buy and hold the Portfolio’s Class I shares.
SHAREHOLDER FEES (fees paid directly from your investment) | ||||
| Maximum Sales Charge (Load) Imposed on Purchases (as a percentage of offering price) | None | |||
| Redemption Fee (as a percentage of amount redeemed within 90 days or less from the date of purchase) | 2.00% | |||
ANNUAL PORTFOLIO OPERATING EXPENSES (expenses that you pay each year as a percentage of the | ||||
| Management Fees | 1.13% | |||
| Distribution (12b-1) Fees | None | |||
| Other Expenses | 0.16% | |||
| Total Annual Portfolio Operating Expenses | 1.29% | |||
| Fee Waiver and/or Expense Reimbursement1 | 0.00% | |||
| Total Annual Portfolio Operating Expenses After Fee Waiver and/or Expense Reimbursement1 | 1.29% | |||
| 1Harding Loevner LP has contractually agreed to waive a portion of its management fee and/or reimburse the Portfolio’s Class I shares for their other operating expenses to the extent Total Annual Portfolio Operating Expenses (excluding dividend expenses, borrowing costs, interest expense relating to short sales, interest, taxes, brokerage commissions and extraordinary expenses), as a percentage of average daily net assets, exceed 1.30% through February 28, 2018. | ||||
Example: This example is intended to help you compare the cost of investing in the Portfolio’s Class I shares with the cost of investing in other mutual funds. The example assumes that you invest $10,000 in the Portfolio’s Class I shares for the time periods indicated and then redeem all of your shares at the end of those periods. The example also assumes that your investment has a 5% return each year and that Class I’s operating expenses remain the same. Although your actual costs may be higher or lower, based on these assumptions your costs would be:
| 1 YEAR | 3 YEARS | 5 YEARS | 10 YEARS | |||
| $131 | $409 | $708 | $1,556 |
PORTFOLIO TURNOVER
The Portfolio pays transaction costs, such as commissions, when it buys and sells securities (or “turns over” its portfolio). A higher portfolio turnover rate may indicate higher transaction costs and may result in higher taxes when Portfolio shares are held in a taxable account.
These costs, which are not reflected in annual portfolio operating expenses or in the Example, affect the Portfolio’s performance. During the most recent fiscal year, the Portfolio’s portfolio turnover rate was 20% of the average value of its portfolio.
PRINCIPAL INVESTMENT STRATEGIES
The Portfolio invests primarily in companies that are based in emerging and frontier markets. Emerging and frontier markets offer investment opportunities that arise from long-term trends in demographics, deregulation, offshore outsourcing and improving corporate governance in developing countries. Harding Loevner LP (“Harding Loevner”), the Portfolio’s investment adviser, undertakes fundamental research in an effort to identify companies that are well managed, financially sound, fast growing and strongly competitive, and whose shares are under-priced relative to estimates of their value. To reduce its volatility, the Portfolio is diversified across dimensions of geography, industry and currency. The Portfolio normally holds investments across at least 15 countries. Emerging and frontier markets include countries that have an emerging stock market as defined by Morgan Stanley Capital International, countries or markets with low- to middle-income economies as classified by the World Bank, and other countries or markets with similar characteristics. Emerging and frontier markets tend to have relatively low gross national product per capita compared to the world’s major economies and may have the potential for rapid economic growth.
Factors bearing on whether a company is considered to be “based” in an emerging or frontier market may include: (1) it is legally domiciled in an emerging or frontier market; (2) it conducts at least 50% of its business, as measured by the location of its sales, earnings, assets, or production, in an emerging or frontier market; or (3) it has the principal exchange listing for its securities in an emerging or frontier market.
The Portfolio will invest broadly in equity securities of companies domiciled in one of at least 15 countries with emerging or frontier markets, generally considered to include all countries except Australia, Austria, Belgium, Canada, Denmark, Finland, France, Germany, Hong Kong, Ireland, Israel, Italy, Japan, the Netherlands, New Zealand, Norway, Portugal, Singapore, Spain, Sweden, Switzerland, the United Kingdom and the United States. At least 65% of the Portfolio’s total assets will be denominated in at least three currencies other than the U.S. dollar. For purposes of compliance with this restriction, American Depositary Receipts, Global Depositary Receipts and European Depositary Receipts (collectively, “Depositary Receipts”) will be considered to be denominated in the currency of the country where the securities underlying the Depositary Receipts are principally traded.
| 11 |
AVERAGE ANNUAL TOTAL RETURNS (for the periods ended December 31, 2016) | ||||||||||||
| 1-YEAR | 5-YEAR | 10-YEAR | ||||||||||
| INSTITUTIONAL EMERGING MARKETS PORTFOLIO - CLASS I | ||||||||||||
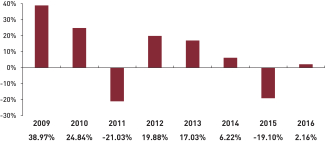
Return Before Taxes | 13.27% | 4.21% | 2.73% | |||||||||
Return After Taxes on Distributions1 | 13.23% | 4.14% | 2.57% | |||||||||
Return After Taxes on Distributions and Sale of Portfolio Shares1 | 7.77% | 3.37% | 2.26% | |||||||||
| MSCI EMERGING MARKETS (NET) INDEX (reflects no deduction for fees, expenses, or U.S. taxes) | 11.20% | 1.27% | 1.83% | |||||||||
| 1After-tax returns in the table above are calculated using the historical highest individual federal marginal income tax rates and do not reflect the impact of state and local taxes. The return after taxes on distributions and sale of Portfolio shares may exceed the Portfolio’s other returns due to an assumed tax benefit from any losses on a sale of Portfolio shares at the end of the measurement period. Actual after-tax returns depend on an investor’s tax situation and may differ from those shown, and after-tax returns shown are not relevant to investors who hold their Portfolio shares through tax-deferred arrangements, such as 401(k) plans or Individual Retirement Accounts. | ||||||||||||
MANAGEMENT
Investment Adviser
Harding Loevner serves as investment adviser to the Portfolio.
Portfolio Managers
G. Rusty Johnson, Craig Shaw, Pradipta Chakrabortty, Scott Crawshaw and Richard Schmidt serve as the portfolio managers of the Institutional Emerging Markets Portfolio. Mr. Johnson has held his position since the Portfolio’s inception in October 2005, Mr. Shaw has held his position since December 2006, Mr. Chakrabortty has held his position since January 2015, Mr. Crawshaw has held his position since June 2014 and Mr. Schmidt has held his position since December 2011. Messrs. Johnson and Shaw are the lead portfolio managers.
PURCHASE AND SALE OF PORTFOLIO SHARES
The minimum initial investment in Class I of the Portfolio is $500,000. Additional purchases may be for any amount. You may purchase or redeem (sell) shares of the Portfolio on any business day through certain authorized brokers and other financial intermediaries or directly from the Portfolio by mail, telephone or wire.
Effective as of the close of business on June 30, 2016, the Portfolio is generally closed to new investors. Current investors will continue to be permitted to purchase shares and certain other investors may still be eligible to purchase shares. For more information, see the section captioned “Shareholder Information—Purchase and Redemption of Shares.”
TAX CONSIDERATIONS
The Portfolio’s distributions are generally taxable to you as ordinary income, capital gains, or a combination of the two, unless you are investing through a tax-deferred arrangement, such as a 401(k) plan or an individual retirement account. Upon withdrawal, your investment through a tax-deferred arrangement may become taxable.
PAYMENTS TO BROKERS-DEALERS AND OTHER FINANCIAL INTERMEDIARIES
If you purchase Portfolio shares through a broker-dealer or other financial intermediary (such as a bank), the Portfolio and its related companies may pay the intermediary for the sale of Portfolio shares and related services. These payments may create a conflict of interest by influencing the broker-dealer or other intermediary and your salesperson to recommend the Portfolio over another investment. Ask your salesperson or visit your financial intermediary’s website for more information.
| 13 |
PORTFOLIO SUMMARY | INSTITUTIONAL EMERGING MARKETS PORTFOLIO –
| |
INVESTMENT OBJECTIVE
The Institutional Emerging Markets Portfolio (the “Portfolio”) seeks long-term capital appreciation through investments in equity securities of companies based in emerging markets.
PORTFOLIO FEES AND EXPENSES
This table describes the fees and expenses that you may pay if you buy and hold the Portfolio’s Class II shares.
SHAREHOLDER FEES (fees paid directly from your investment) | ||||
| Maximum Sales Charge (Load) Imposed on Purchases (as a percentage of offering price) | None | |||
| Redemption Fee (as a percentage of amount redeemed within 90 days or less from the date of purchase) | 2.00% | |||
ANNUAL PORTFOLIO OPERATING EXPENSES (expenses that you pay each year as a percentage of the | ||||
| Management Fees | 1.13% | |||
| Distribution (12b-1) Fees | None | |||
| Other Expenses | 0.11% | |||
| Total Annual Portfolio Operating Expenses | 1.24% | |||
| Fee Waiver and/or Expense Reimbursement1 | -0.11% | |||
| Total Annual Portfolio Operating Expenses After Fee Waiver and/or Expense Reimbursement1 | 1.13% | |||
| 1Harding Loevner LP has contractually agreed to waive a portion of its management fee and/or reimburse the Portfolio’s Class II shares for their other operating expenses to the extent Total Annual Portfolio Operating Expenses (excluding dividend expenses, borrowing costs, interest expense relating to short sales, interest, taxes, brokerage commissions and extraordinary expenses), as a percentage of average daily net assets, exceed the applicable contractual management fee, currently 1.15% on the first $1 billion of average daily net assets, 1.13% on the next $1 billion, 1.11% on the next $1 billion, and 1.09% for average daily net assets over $3 billion, through February 28, 2018. | ||||
Example: This example is intended to help you compare the cost of investing in the Portfolio’s Class II shares with the cost of investing in other mutual funds. The example assumes that you invest $10,000 in the Portfolio’s Class II shares for the time periods indicated and then redeem all of your shares at the end of those periods. The example also assumes that your investment has a 5% return each year and that Portfolio’s Class II’s operating expenses remain the same. Although your actual costs may be higher or lower, based on these assumptions your costs would be:
| 1 YEAR | 3 YEARS | 5 YEARS | 10 YEARS | |||
| $115 | $383 | $670 | $1,490 |
PORTFOLIO TURNOVER
The Portfolio pays transaction costs, such as commissions, when it buys and sells securities (or “turns
over” its portfolio). A higher portfolio turnover rate may indicate higher transaction costs and may result in higher taxes when Portfolio shares are held in a taxable account. These costs, which are not reflected in annual portfolio operating expenses or in the Example, affect the Portfolio’s performance. During the most recent fiscal year, the Portfolio’s portfolio turnover rate was 20% of the average value of its portfolio.
PRINCIPAL INVESTMENT STRATEGIES
The Portfolio invests primarily in companies that are based in emerging and frontier markets. Emerging and frontier markets offer investment opportunities that arise from long-term trends in demographics, deregulation, offshore outsourcing and improving corporate governance in developing countries. Harding Loevner LP (“Harding Loevner”), the Portfolio’s investment adviser, undertakes fundamental research in an effort to identify companies that are well managed, financially sound, fast growing and strongly competitive, and whose shares are under-priced relative to estimates of their value. To reduce its volatility, the Portfolio is diversified across dimensions of geography, industry and currency. The Portfolio normally holds investments across at least 15 countries. Emerging and frontier markets include countries that have an emerging stock market as defined by Morgan Stanley Capital International, countries or markets with low- to middle-income economies as classified by the World Bank, and other countries or markets with similar characteristics. Emerging and frontier markets tend to have relatively low gross national product per capita compared to the world’s major economies and may have the potential for rapid economic growth.
Factors bearing on whether a company is considered to be “based” in an emerging or frontier market may include: (1) it is legally domiciled in an emerging or frontier market; (2) it conducts at least 50% of its business, as measured by the location of its sales, earnings, assets, or production, in an emerging or frontier market; or (3) it has the principal exchange listing for its securities in an emerging or frontier market.
The Portfolio will invest broadly in equity securities of companies domiciled in one of at least 15 countries with emerging or frontier markets, generally considered to include all countries except Australia, Austria, Belgium, Canada, Denmark, Finland, France, Germany, Hong Kong, Ireland, Israel, Italy, Japan, the Netherlands, New Zealand, Norway, Portugal, Singapore, Spain, Sweden, Switzerland, the United Kingdom and the United States. At least 65% of the Portfolio’s total assets will be denominated in at least three currencies other than the U.S. dollar. For purposes of compliance with this restriction, American Depositary Receipts, Global Depositary Receipts and European Depositary Receipts (collectively, “Depositary Receipts”) will be considered to
| 14 |
AVERAGE ANNUAL TOTAL RETURNS (for the periods ended December 31, 2016) | ||||||||
| 1-YEAR | SINCE INCEPTION 3/5/2014 | |||||||
| INSTITUTIONAL EMERGING MARKETS PORTFOLIO - CLASS II | ||||||||
Return Before Taxes | 13.44% | -0.30% | ||||||
Return After Taxes on Distributions1 | 13.36% | -0.38% | ||||||
Return After Taxes on Distributions and Sale of Portfolio Shares1 | 8.10% | -0.01% | ||||||
| MSCI EMERGING MARKETS (NET) INDEX (reflects no deduction for fees, expenses, or U.S. taxes) | 11.20% | -1.25% | ||||||
| 1After-tax returns in the table above are calculated using the historical highest individual federal marginal income tax rates and do not reflect the impact of state and local taxes. The return after taxes on distributions and sale of Portfolio shares may exceed the Portfolio’s other returns due to an assumed tax benefit from any losses on a sale of Portfolio shares at the end of the measurement period. Actual after-tax returns depend on an investor’s tax situation and may differ from those shown, and after-tax returns shown are not relevant to investors who hold their Portfolio shares through tax-deferred arrangements, such as 401(k) plans or Individual Retirement Accounts. | ||||||||
MANAGEMENT
Investment Adviser
Harding Loevner serves as investment adviser to the Portfolio.
Portfolio Managers
G. Rusty Johnson, Craig Shaw, Pradipta Chakrabortty, Scott Crawshaw and Richard Schmidt serve as the portfolio managers of the Institutional Emerging Markets Portfolio. Mr. Johnson has held his position since the Portfolio’s inception in October 2005, Mr. Shaw has held his position since December 2006, Mr. Chakrabortty has held his position since January 2015, Mr. Crawshaw has held his position since June 2014 and Mr. Schmidt has held his position since December 2011. Messrs. Johnson and Shaw are the lead portfolio managers.
PURCHASE AND SALE OF PORTFOLIO SHARES
The minimum initial investment in Class II of the Portfolio is $25,000,000. Additional purchases may be for any amount. You may purchase or redeem (sell) shares of the Portfolio on any business day through certain authorized brokers and other financial intermediaries or directly from the Portfolio by mail, telephone or wire.
Effective as of the close of business on June 30, 2016, the Portfolio is generally closed to new investors. Current investors will continue to be permitted to purchase shares and certain other investors may still be eligible to purchase shares. For more information, see the section captioned “Shareholder Information—Purchase and Redemption of Shares.”
TAX CONSIDERATIONS
The Portfolio’s distributions are generally taxable to you as ordinary income, capital gains, or a combination of the two, unless you are investing through a tax-deferred arrangement, such as a 401(k) plan or an individual retirement account. Upon withdrawal, your investment through a tax-deferred arrangement may become taxable.
PAYMENTS TO BROKERS-DEALERS AND OTHER FINANCIAL INTERMEDIARIES
If you purchase Portfolio shares through a broker-dealer or other financial intermediary (such as a bank), the Portfolio and its related companies may pay the intermediary for the sale of Portfolio shares and related services. These payments may create a conflict of interest by influencing the broker-dealer or other intermediary and your salesperson to recommend the Portfolio over another investment. Ask your salesperson or visit your financial intermediary’s website for more information.
| 16 |
PORTFOLIO SUMMARY | FRONTIER EMERGING MARKETS PORTFOLIO –
| |
INVESTMENT OBJECTIVE
The Frontier Emerging Markets Portfolio (the “Portfolio”) seeks long-term capital appreciation through investments in equity securities of companies based in frontier and smaller emerging markets.
PORTFOLIO FEES AND EXPENSES
This table describes the fees and expenses that you may pay if you buy and hold the Portfolio’s Institutional Class I (formerly known as “Institutional Class”) shares.
SHAREHOLDER FEES (fees paid directly from your investment) | ||||
| Maximum Sales Charge (Load) Imposed on Purchases (as a percentage of offering price) | None | |||
| Redemption Fee (as a percentage of amount redeemed within 90 days or less from the date of purchase) | 2.00% | |||
ANNUAL PORTFOLIO OPERATING EXPENSES1 (expenses that you pay each year as a percentage of the value of your investment) | ||||
| Management Fees | 1.35% | |||
| Distribution (12b-1) Fees | None | |||
| Other Expenses | 0.29% | |||
| Total Annual Portfolio Operating Expenses | 1.64% | |||
| Fee Waiver and/or ExpenseReimbursement2 | 0.00% | |||
| Total Annual Portfolio Operating Expenses After Fee Waiver and/or ExpenseReimbursement2 | 1.64% | |||
1Expense information in this table has been restated to reflect current management fees, which were reduced effective March 1, 2017. Therefore, the expenses in this table will not correlate to the expenses shown in the Financial Highlights of the Portfolio. 2Harding Loevner LP has contractually agreed to waive a portion of its management fee and/or reimburse the Institutional Class I of the Portfolio for its other operating expenses to the extent Total Annual Portfolio Operating Expenses (excluding dividend expenses, borrowing costs, interest expense relating to short sales, interest, taxes, brokerage commissions and extraordinary expenses), as a percentage of average daily net assets, exceed 1.75% through February 28, 2018. |
| |||
Example: This example is intended to help you compare the cost of investing in the Portfolio’s Institutional Class I shares with the cost of investing in other mutual funds. The example assumes that you invest $10,000 in the Portfolio’s Institutional Class I shares for the time periods indicated and then redeem all of your shares at the end of those periods. The example also assumes that your investment has a 5% return each year and that Institutional Class I’s operating expenses remain the same. Although your actual costs may be higher or lower, based on these assumptions your costs would be:
| 1 YEAR | 3 YEARS | 5 YEARS | 10 YEARS | |||
| $167 | $517 | $892 | $1,944 |
PORTFOLIO TURNOVER
The Portfolio pays transaction costs, such as commissions, when it buys and sells securities (or “turns over” its portfolio). A higher portfolio turnover rate may indicate higher transaction costs and may result in higher taxes when Portfolio shares are held in a taxable account. These costs, which are not reflected in annual portfolio operating expenses or in the Example, affect the Portfolio’s performance. During the most recent fiscal year, the Portfolio’s portfolio turnover rate was 47% of the average value of its portfolio.
PRINCIPAL INVESTMENT STRATEGIES
The Portfolio invests primarily in companies that are based in frontier emerging markets, including the smaller traditionally-recognized emerging markets. Frontier emerging markets, with the exception of the oil-producing Gulf States and certain of the smaller traditionally-recognized emerging markets, tend to have relatively low gross national product per capita compared to the larger traditionally-recognized emerging markets and the world’s major developed economies. The frontier emerging markets include the least developed markets even by emerging markets standards. Frontier emerging markets offer investment opportunities that arise from long-term trends in demographics, deregulation, offshore outsourcing and improving corporate governance in developing countries. Harding Loevner LP (“Harding Loevner”), the Portfolio’s investment adviser, undertakes fundamental research in an effort to identify companies that are well managed, financially sound, fast growing and strongly competitive, and whose shares are under-priced relative to estimates of their value. To reduce its volatility, the Portfolio is diversified across dimensions of geography, industry, and currency. The Portfolio normally holds investments across at least 12 countries.
As used herein, frontier emerging markets include countries that are represented in the MSCI Frontier Markets Index or the S&P Frontier Markets BMI, or similar market indices, and the smaller of the traditionally-recognized emerging markets, such as those individually constituting less than 5% of the MSCI Emerging Markets Index or the S&P Emerging Markets BMI. Factors bearing on whether a company is considered to be “based” in a frontier emerging market may include: (1) it is legally domiciled in a frontier emerging market; (2) it conducts at least 50% of its business, as measured by the location of its sales, earnings, assets, or production, in frontier emerging markets; or (3) it has the principal exchange listing for its securities in a frontier emerging market. Frontier emerging markets generally include all countries except Australia, Austria, Belgium, Canada, Denmark, Finland, France, Germany, Hong Kong, Ireland, Israel, Italy, Japan, the Netherlands, New Zealand, Norway, Portugal, Singapore, Spain, Sweden, Switzerland, the United Kingdom and the United States and the larger traditionally-recognized
| 17 |
Portfolio’s Institutional Class I shares average annual total returns compare with a broad measure of market performance. Together, these provide an indication of the risks of investing in the Portfolio. How the Portfolio’s Institutional Class I shares have performed in the past (before and after taxes) is not necessarily an indication of how they will perform in the future.
Updated Portfolio performance information is available at www.hardingloevnerfunds.com or by calling (877) 435-8105.
FRONTIER EMERGING MARKETS PORTFOLIO – INSTITUTIONAL CLASS I
The best calendar quarter return during the period shown above was 37.37% in the 2nd quarter of 2009; the worst was -15.65% in the 3rd quarter of 2011.
AVERAGE ANNUAL TOTAL RETURNS (for the periods ended December 31, 2016) | ||||||||||||
| 1-YEAR | 5-YEAR | SINCE INCEPTION 5/27/2008 | ||||||||||
FRONTIER EMERGING MARKETS PORTFOLIO - INSTITUTIONAL CLASS I |
| |||||||||||
Return Before Taxes | 2.16% | 4.25% | -2.89% | |||||||||
Return After Taxes on Distributions1 | 2.31% | 4.22% | -2.94% | |||||||||
Return After Taxes on Distributions and Sale of Portfolio Shares1 | 1.82% | 3.55% | -2.00% | |||||||||
MSCI FRONTIER EMERGING MARKETS (NET) INDEX (reflects no deduction for fees, expenses, or U.S. taxes) | 4.99% | 3.00% | -4.08% | |||||||||
| 1After-tax returns in the table above are calculated using the historical highest individual federal marginal income tax rates and do not reflect the impact of state and local taxes. The return after taxes on distributions and sale of Portfolio shares may exceed the Portfolio’s other returns due to an assumed tax benefit from any losses on a sale of Portfolio shares at the end of the measurement period. Actual after-tax returns depend on an investor’s tax situation and may differ from those shown, and after-tax returns shown are not relevant to investors who hold their Portfolio shares through tax-deferred arrangements, such as 401(k) plans or Individual Retirement Accounts. | ||||||||||||
MANAGEMENT
Investment Adviser
Harding Loevner serves as investment adviser to the Portfolio.
Portfolio Managers
Pradipta Chakrabortty, Babatunde Ojo and Richard Schmidt serve as the portfolio managers of the Frontier Emerging Markets Portfolio. Mr. Chakrabortty has held his position since December 2008, Mr. Ojo has held his position since June 2014 and Mr. Schmidt has held his position since January 2012. Messrs. Chakrabortty and Ojo are the lead portfolio managers.
PURCHASE AND SALE OF PORTFOLIO SHARES
The minimum initial investment in Institutional Class I of the Portfolio is $100,000. Additional purchases may be for any amount. You may purchase or redeem (sell) shares of the Portfolio on any business day through certain authorized brokers and other financial intermediaries or directly from the Portfolio by mail, telephone or wire.
TAX CONSIDERATIONS
The Portfolio’s distributions are generally taxable to you as ordinary income, capital gains, or a combination of the two, unless you are investing through a tax-deferred arrangement, such as a 401(k) plan or an individual retirement account. Upon withdrawal, your investment through a tax-deferred arrangement may become taxable.
PAYMENTS TO BROKERS-DEALERS AND OTHER FINANCIAL INTERMEDIARIES
If you purchase Portfolio shares through a broker-dealer or other financial intermediary (such as a bank), the Portfolio and its related companies may pay the intermediary for the sale of Portfolio shares and related services. These payments may create a conflict of interest by influencing the broker-dealer or other intermediary and your salesperson to recommend the Portfolio over another investment. Ask your salesperson or visit your financial intermediary’s website for more information.
| 19 |
PORTFOLIO SUMMARY | FRONTIER EMERGING MARKETS PORTFOLIO –
| |
INVESTMENT OBJECTIVE
The Frontier Emerging Markets Portfolio (the “Portfolio”) seeks long-term capital appreciation through investments in equity securities of companies based in frontier and smaller emerging markets.
PORTFOLIO FEES AND EXPENSES
This table describes the fees and expenses that you may pay if you buy and hold the Portfolio’s Institutional Class II shares.
SHAREHOLDER FEES (fees paid directly from your investment) | ||||
| Maximum Sales Charge (Load) Imposed on Purchases (as a percentage of offering price) | None | |||
| Redemption Fee (as a percentage of amount redeemed within 90 days or less from the date of purchase) | 2.00% | |||
ANNUAL PORTFOLIO OPERATING EXPENSES1 (expenses that you pay each year as a percentage of the value of your investment) | ||||
| Management Fees | 1.35% | |||
| Distribution (12b-1) Fees | None | |||
| Other Expenses | 0.40% | |||
| Total Annual Portfolio Operating Expenses | 1.75% | |||
| Fee Waiver and/or Expense Reimbursement1 | -0.40% | |||
| Total Annual Portfolio Operating Expenses After Fee Waiver and/or Expense Reimbursement2 | 1.35% | |||
1”Other Expenses” have been based on estimated amounts for the current fiscal year. 2Harding Loevner LP has contractually agreed to waive a portion of its management fee and/or reimburse the Institutional Class II of the Portfolio for its other operating expenses to the extent Total Annual Portfolio Operating Expenses (excluding dividend expenses, borrowing costs, interest expense relating to short sales, interest, taxes, brokerage commissions and extraordinary expenses), as a percentage of average daily net assets, exceed 1.35% through February 28, 2018. |
| |||
Example: This example is intended to help you compare the cost of investing in the Portfolio’s Institutional Class II shares with the cost of investing in other mutual funds. The example assumes that you invest $10,000 in the Portfolio’s Institutional Class II shares for the time periods indicated and then redeem all of your shares at the end of those periods. The example also assumes that your investment has a 5% return each year and that Institutional Class II’s operating expenses remain the same, except that the example assumes that the fee waiver and expense reimbursement pertains only through February 28, 2018. Although your actual costs may be higher or lower, based on these assumptions your costs would be:
| 1 YEAR | 3 YEARS | 5 YEARS | 10 YEARS | |||
| $137 | $512 | $912 | $2,029 |
PORTFOLIO TURNOVER
The Portfolio pays transaction costs, such as commissions, when it buys and sells securities (or “turns over” its portfolio). A higher portfolio turnover rate may indicate higher transaction costs and may result in higher taxes when Portfolio shares are held in a taxable account. These costs, which are not reflected in annual portfolio operating expenses or in the Example, affect the Portfolio’s performance. During the most recent fiscal year, the Portfolio’s portfolio turnover rate was 47% of the average value of its portfolio.
PRINCIPAL INVESTMENT STRATEGIES
The Portfolio invests primarily in companies that are based in frontier emerging markets, including the smaller traditionally-recognized emerging markets. Frontier emerging markets, with the exception of the oil-producing Gulf States and certain of the smaller traditionally-recognized emerging markets, tend to have relatively low gross national product per capita compared to the larger traditionally-recognized emerging markets and the world’s major developed economies. The frontier emerging markets include the least developed markets even by emerging markets standards. Frontier emerging markets offer investment opportunities that arise from long-term trends in demographics, deregulation, offshore outsourcing and improving corporate governance in developing countries. Harding Loevner LP (“Harding Loevner”), the Portfolio’s investment adviser, undertakes fundamental research in an effort to identify companies that are well managed, financially sound, fast growing and strongly competitive, and whose shares are under-priced relative to estimates of their value. To reduce its volatility, the Portfolio is diversified across dimensions of geography, industry, and currency. The Portfolio normally holds investments across at least 12 countries.
As used herein, frontier emerging markets include countries that are represented in the MSCI Frontier Markets Index or the S&P Frontier Markets BMI, or similar market indices, and the smaller of the traditionally-recognized emerging markets, such as those individually constituting less than 5% of the MSCI Emerging Markets Index or the S&P Emerging Markets BMI. Factors bearing on whether a company is considered to be “based” in a frontier emerging market may include: (1) it is legally domiciled in a frontier emerging market; (2) it conducts at least 50% of its business, as measured by the location of its sales, earnings, assets, or production, in frontier emerging markets; or (3) it has the principal exchange listing for its securities in a frontier emerging market. Frontier emerging markets generally include all countries except Australia, Austria, Belgium, Canada, Denmark, Finland, France, Germany, Hong Kong, Ireland, Israel, Italy, Japan, the Netherlands, New Zealand, Norway, Portugal, Singapore, Spain, Sweden, Switzerland, the United Kingdom and the United States and the larger traditionally-recognized
| 20 |
information shown below is for the Institutional Class I shares of the Portfolio (formerly known as “Institutional Class”). Institutional Class I shares and Institutional Class II shares of the Portfolio would have substantially similar annual returns because both classes of shares invest in the same portfolio of securities, but returns will differ only to the extent that the Institutional Class II shares have lower expenses. The bar chart below shows how the Portfolio’s Institutional Class I investment results have varied from year to year. The table that follows shows how the Portfolio’s Institutional Class I average annual total returns compare with a broad measure of market performance. Together, these provide an indication of the risks of investing in the Portfolio. How the Portfolio’s Institutional Class I has performed in the past (before and after taxes) is not necessarily an indication of how the Portfolio’s Institutional Class II will perform in the future.
Updated Portfolio performance information is available at www.hardingloevnerfunds.com or by calling (877) 435-8105.
FRONTIER EMERGING MARKETS PORTFOLIO – INSTITUTIONAL CLASS I
The best calendar quarter return during the period shown above was 37.37% in the 2nd quarter of 2009; the worst was -15.65% in the 3rd quarter of 2011.
AVERAGE ANNUAL TOTAL RETURNS (for the periods ended December 31, 2016) | ||||||||||||
| 1-YEAR | 5-YEAR | SINCE INCEPTION 5/27/2008 | ||||||||||
| FRONTIER EMERGING MARKETS PORTFOLIO - INSTITUTIONAL CLASS I | ||||||||||||
Return Before Taxes | 2.16% | 4.25% | -2.89% | |||||||||
Return After Taxes on Distributions1 | 2.31% | 4.22% | -2.94% | |||||||||
Return After Taxes on Distributions and Sale of Portfolio Shares1 | 1.82% | 3.55% | -2.00% | |||||||||
| MSCI FRONTIER EMERGING MARKETS (NET) INDEX (reflects no deduction for fees, expenses, or U.S. taxes) | 4.99% | 3.00% | -4.08% | |||||||||
| 1After-tax returns in the table above are calculated using the historical highest individual federal marginal income tax rates and do not reflect the impact of state and local taxes. The return after taxes on distributions and sale of Portfolio shares may exceed the Portfolio’s other returns due to an assumed tax benefit from any losses on a sale of Portfolio shares at the end of the measurement period. Actual after-tax returns depend on an investor’s tax situation and may differ from those shown, and after-tax returns shown are not relevant to investors who hold their Portfolio shares through tax-deferred arrangements, such as 401(k) plans or Individual Retirement Accounts. | ||||||||||||
MANAGEMENT
Investment Adviser
Harding Loevner serves as investment adviser to the Portfolio.
Portfolio Managers
Pradipta Chakrabortty, Babatunde Ojo and Richard Schmidt serve as the portfolio managers of the Frontier Emerging Markets Portfolio. Mr. Chakrabortty has held his position since December 2008, Mr. Ojo has held his position since June 2014 and Mr. Schmidt has held his position since January 2012. Messrs. Chakrabortty and Ojo are the lead portfolio managers.
PURCHASE AND SALE OF PORTFOLIO SHARES
The minimum initial investment in the Institutional Class II of the Portfolio is $10,000,000. Additional purchases may be for any amount. You may purchase or redeem (sell) shares of the Portfolio on any business day through certain authorized brokers and other financial intermediaries or directly from the Portfolio by mail, telephone or wire.
TAX CONSIDERATIONS
The Portfolio’s distributions are generally taxable to you as ordinary income, capital gains, or a combination of the two, unless you are investing through a tax-deferred arrangement, such as a 401(k) plan or an individual retirement account. Upon withdrawal, your investment through a tax-deferred arrangement may become taxable.
PAYMENTS TO BROKERS-DEALERS AND OTHER FINANCIAL INTERMEDIARIES
If you purchase Portfolio shares through a broker-dealer or other financial intermediary (such as a bank), the Portfolio and its related companies may pay the intermediary for the sale of Portfolio shares and related services. These payments may create a conflict of interest by influencing the broker-dealer or other intermediary and your salesperson to recommend the Portfolio over another investment. Ask your salesperson or visit your financial intermediary’s website for more information.
| 22 |
PORTFOLIO SUMMARY | GLOBAL EQUITY RESEARCH PORTFOLIO
| |
INVESTMENT OBJECTIVE
The Global Equity Research Portfolio (the “Portfolio”) seeks long-term capital appreciation through investments in equity securities of companies based both inside and outside the United States.
PORTFOLIO FEES AND EXPENSES
This table describes the fees and expenses that you may pay if you buy and hold shares of the Institutional Class of the Portfolio.
SHAREHOLDER FEES (fees paid directly from your investment) | ||||
| Maximum Sales Charge (Load) Imposed on Purchases (as a percentage of offering price) | None | |||
| Redemption Fee (as a percentage of amount redeemed within 90 days or less from the date of purchase) | 2.00% | |||
ANNUAL PORTFOLIO OPERATING EXPENSES (expenses that you pay each year as a percentage of the value of your investment) | ||||
| Management Fees | 0.80% | |||
| Distribution (12b-1) Fees | None | |||
| Other Expenses1 | 2.16% | |||
| Total Annual Portfolio Operating Expenses | 2.96% | |||
| Fee Waiver and/or Expense Reimbursement2 | -2.06% | |||
| Total Annual Portfolio Operating Expenses After Fee Waiver and/or Expense Reimbursement2 | 0.90% | |||
1”Other Expenses” have been based on estimated amounts for the current fiscal year. 2Harding Loevner LP has contractually agreed to waive a portion of its management fee and/or reimburse the Institutional Class of the Portfolio for its other operating expenses to the extent Total Annual Portfolio Operating Expenses (excluding dividend expenses, borrowing costs, interest expense relating to short sales, interest, taxes, brokerage commissions and extraordinary expenses), as a percentage of average daily net assets, exceed 0.90% through February 28, 2018. |
| |||
Example: This example is intended to help you compare the cost of investing in the Institutional Class of the Portfolio with the cost of investing in other mutual funds. The example assumes that you invest $10,000 in the Institutional Class of the Portfolio for the time periods indicated and then redeem all of your shares at the end of those periods. The example also assumes that your investment has a 5% return each year and that the Institutional Class’s operating expenses remain the same, except that the example assumes the fee waiver and expense reimbursement agreement pertains only through February 28, 2018. Although your actual costs may be higher or lower, based on these assumptions your costs would be:
| 1 YEAR | 3 YEARS | |
| $92 | $721 |
PORTFOLIO TURNOVER
The Portfolio pays transaction costs, such as commissions, when it buys and sells securities (or “turns over” its portfolio). A higher portfolio turnover rate may indicate higher transaction costs and may result in higher taxes when Portfolio shares are held in a taxable account. These costs, which are not reflected in annual portfolio operating expenses or in the Example, affect the Portfolio’s performance. Because the Portfolio had not commenced investment operations during the most recent fiscal year, no portfolio turnover information is presented.
PRINCIPAL INVESTMENT STRATEGIES
The Portfolio invests in companies based in the United States and other developed markets, as well as in established companies in emerging and frontier markets. Harding Loevner LP (“Harding Loevner”), the Portfolio’s investment adviser, undertakes fundamental research in an effort to identify companies that are well managed, financially sound, fast growing and strongly competitive, and whose shares are under-priced relative to estimates of their value. The investment adviser’s analysts, after completing this research, assign a rating to each stock based upon its potential return relative to an appropriate benchmark. The universe of stocks eligible for investment in the Portfolio are those rated for purchase by the analysts and that otherwise meet the investment characteristics and guidelines established for the Portfolio. These guidelines include limits on exposure by geography, industry and currency, and may include other limits, such as market capitalization. To reduce its volatility, the Portfolio is diversified across these elements. The Portfolio may invest in companies in all capitalization ranges, including smaller and medium-sized companies.
The investment adviser expects that a majority of the stocks that its analysts have rated for purchase that meet the Portfolio’s investment characteristics and guidelines will be held in the Portfolio. The portfolio managers may exclude any stock in their discretion based on factors such as trading volumes, market capitalization or geography. In determining the weight of each security in the Portfolio, the portfolio managers will seek to maintain a portfolio that, over time, is generally less volatile than the Portfolio’s benchmark, taking into consideration factors including the relevant security’s predicted relative price performance, the timeliness of investment potential, the implications for portfolio risk and the requirement to observe the investment characteristics and guidelines established for the Portfolio. The portfolio managers will periodically re-balance the portfolio when and as they deem appropriate, to reflect, among other things, changes to securities prices, analysts’ ratings, desired investment characteristics, investment guidelines or assumptions
| 23 |
PORTFOLIO SUMMARY | INTERNATIONAL EQUITY RESEARCH PORTFOLIO
| |
INVESTMENT OBJECTIVE
The International Equity Research Portfolio (the “Portfolio”) seeks long-term capital appreciation through investments in equity securities of companies based outside the United States.
PORTFOLIO FEES AND EXPENSES
This table describes the fees and expenses that you may pay if you buy and hold shares of the Institutional Class of the Portfolio.
SHAREHOLDER FEES (fees paid directly from your investment) | ||||
| Maximum Sales Charge (Load) Imposed on Purchases (as a percentage of offering price) | None | |||
| Redemption Fee (as a percentage of amount redeemed within 90 days or less from the date of purchase) | 2.00% | |||
ANNUAL PORTFOLIO OPERATING EXPENSES (expenses that you pay each year as a percentage of the value of your investment) | ||||
| Management Fees | 0.75% | |||
| Distribution (12b-1) Fees | None | |||
| Other Expenses | 2.79% | |||
| Total Annual Portfolio Operating Expenses | 3.54% | |||
| Fee Waiver and/or Expense Reimbursement1 | -2.64% | |||
| Total Annual Portfolio Operating Expenses After Fee Waiver and/or Expense Reimbursement1 | 0.90% | |||
| 1Harding Loevner LP has contractually agreed to waive a portion of its management fee and/or reimburse the Institutional Class of the Portfolio for its other operating expenses to the extent Total Annual Portfolio Operating Expenses (excluding dividend expense, borrowing costs, interest expense relating to short sales, interest, taxes, brokerage commissions and extraordinary expenses), as a percentage of average daily net assets, exceed 0.90% through February 28, 2018. | ||||
Example: This example is intended to help you compare the cost of investing in the Institutional Class of the Portfolio with the cost of investing in other mutual funds. The example assumes that you invest $10,000 in the Institutional Class of the Portfolio for the time periods indicated and then redeem all of your shares at the end of those periods. The example also assumes that your investment has a 5% return each year and that the Institutional Class’s operating expenses remain the same. Although your actual costs may be higher or lower, based on these assumptions your costs would be:
| 1 YEAR | 3 YEARS | 5 YEARS | 10 YEARS | |||
| $92 | $840 | $1,609 | $3,635 |
PORTFOLIO TURNOVER
The Portfolio pays transaction costs, such as commissions, when it buys and sells securities (or “turns over” its portfolio). A higher portfolio turnover rate may
indicate higher transaction costs and may result in higher taxes when Portfolio shares are held in a taxable account. These costs, which are not reflected in annual portfolio operating expenses or in the Example, affect the Portfolio’s performance. During the most recent fiscal year, the Portfolio’s portfolio turnover rate was 33% of the average value of its portfolio.
PRINCIPAL INVESTMENT STRATEGIES
The Portfolio invests primarily in companies based in developed markets outside the United States as well as in established companies in emerging and frontier markets. Harding Loevner LP (“Harding Loevner”), the Portfolio’s investment adviser, undertakes fundamental research in an effort to identify companies that are well managed, financially sound, fast growing and strongly competitive and whose shares are under-priced relative to estimates of their value. The investment adviser’s analysts, after completing this research, assign a rating to each stock based upon its potential return relative to an appropriate benchmark. The universe of stocks eligible for investment in the Portfolio are those rated for purchase by the analysts and that otherwise meet the investment characteristics and guidelines established for the Portfolio. These guidelines include limits on exposure by geography, industry and currency, and may include other limits, such as market capitalization. To reduce its volatility, the Portfolio is diversified across these elements. The Portfolio may invest in companies in all capitalization ranges, including smaller and medium-sized companies.
The investment adviser expects that a majority of the stocks that its analysts have rated for purchase that meet the Portfolio’s investment characteristics and guidelines will be held in the Portfolio. The portfolio managers may exclude any stock in their discretion based on factors such as trading volumes, market capitalization or geography. In determining the weight of each security in the Portfolio, the portfolio managers will seek to maintain a portfolio that, over time, is generally less volatile than the Portfolio’s benchmark, taking into consideration factors including the relevant security’s predicted relative price performance, the timeliness of investment potential, the implications for portfolio risk and the requirement to observe the investment characteristics and guidelines established for the Portfolio. The portfolio managers will periodically re-balance the portfolio when and as they deem appropriate, to reflect, among other things, changes to securities prices, analysts’ ratings, desired investment characteristics, investment guidelines or assumptions about prospective volatility or tracking error. The portfolio managers will use risk models and other quantitative tools to assist them in determining portfolio weightings.
| 26 |
| AVERAGE ANNUAL TOTAL RETURNS (for the periods ended December 31, 2016) | ||||||||
| 1-YEAR | SINCE INCEPTION 12/17/15 | |||||||
INTERNATIONAL EQUITY RESEARCH PORTFOLIO - INSTITUTIONAL CLASS |
| |||||||
Return Before Taxes | 7.95% | 8.16% | ||||||
Return After Taxes on Distributions1 | 7.38% | 7.61% | ||||||
Return After Taxes on Distributions and Sale of Portfolio Shares1 | 5.51% | 6.51% | ||||||
| MSCI ALL COUNTRY WORLD ex-U.S. (NET) INDEX (reflects no deduction for fees, expenses, or U.S. taxes) | 4.50% | 5.01% | ||||||
| 1After-tax returns in the table above are calculated using the historical highest individual federal marginal income tax rates and do not reflect the impact of state and local taxes. Actual after-tax returns depend on an investor’s tax situation and may differ from those shown, and after-tax returns shown are not relevant to investors who hold their Portfolio shares through tax-deferred arrangements, such as 401(k) plans or Individual Retirement Accounts. | ||||||||
MANAGEMENT
Investment Adviser
Harding Loevner serves as investment adviser to the Portfolio.
Portfolio Managers
Andrew West and Moon Surana serve as the portfolio managers of the International Equity Research Portfolio. Mr. West has been a Portfolio Manager with Harding Loevner since June 2014. Ms. Surana has been an Associate Portfolio Manager with Harding Loevner since June 2015.
PURCHASE AND SALE OF PORTFOLIO SHARES
The minimum initial investment in the Institutional Class of the Portfolio is $100,000. Additional purchases may be for any amount. You may purchase or redeem (sell) shares of the Portfolio on any business day through certain authorized brokers and other financial intermediaries or directly from the Portfolio by mail, telephone or wire.
TAX CONSIDERATIONS
The Portfolio’s distributions are generally taxable to you as ordinary income, capital gains, or a combination of the two, unless you are investing through a tax-deferred arrangement, such as a 401(k) plan or an individual retirement account. Upon withdrawal, your investment through a tax-deferred arrangement may become taxable.
PAYMENTS TO BROKERS-DEALERS AND OTHER FINANCIAL INTERMEDIARIES
If you purchase Portfolio shares through a broker-dealer or other financial intermediary (such as a bank), the Portfolio and its related companies may pay the intermediary for the sale of Portfolio shares and related services. These payments may create a conflict of interest by influencing the broker-dealer or other intermediary and your salesperson to recommend the Portfolio over another investment. Ask your salesperson or visit your financial intermediary’s website for more information.
| 28 |
PORTFOLIO SUMMARY | EMERGING MARKETS RESEARCH PORTFOLIO
| |
INVESTMENT OBJECTIVE
The Emerging Markets Research Portfolio (the “Portfolio”) seeks long-term capital appreciation through investments in equity securities of companies based in emerging markets.
PORTFOLIO FEES AND EXPENSES
This table describes the fees and expenses that you may pay if you buy and hold shares of the Institutional Class of the Portfolio.
SHAREHOLDER FEES (fees paid directly from your investment) | ||||
| Maximum Sales Charge (Load) Imposed on Purchases (as a percentage of offering price) | None | |||
| Redemption Fee (as a percentage of amount redeemed within 90 days or less from the date of purchase) | 2.00% | |||
ANNUAL PORTFOLIO OPERATING EXPENSES (expenses that you pay each year as a percentage of the value of your investment) | ||||
| Management Fees | 1.15% | |||
| Distribution (12b-1) Fees | None | |||
| Other Expenses1 | 2.42% | |||
| Total Annual Portfolio Operating Expenses | 3.57% | |||
| Fee Waiver and/or Expense Reimbursement2 | -2.27% | |||
| Total Annual Portfolio Operating Expenses After Fee Waiver and/or Expense Reimbursement2 | 1.30% | |||
1“Other Expenses” have been based on estimated amounts for the current fiscal year. 2Harding Loevner LP has contractually agreed to waive a portion of its management fee and/or reimburse the Institutional Class of the Portfolio for its other operating expenses to the extent Total Annual Portfolio Operating Expenses (excluding dividend expenses, borrowing costs, interest expense relating to short sales, interest, taxes, brokerage commissions and extraordinary expenses), as a percentage of average daily net assets, exceed 1.30% through February 28, 2018. |
| |||
Example: This example is intended to help you compare the cost of investing in the Institutional Class of the Portfolio with the cost of investing in other mutual funds. The example assumes that you invest $10,000 in the Institutional Class of the Portfolio for the time periods indicated and then redeem all of your shares at the end of those periods. The example also assumes that your investment has a 5% return each year and that the Institutional Class’s operating expenses remain the same, except that the example assumes the fee waiver and expense reimbursement agreement pertains only through February 28, 2018. Although your actual costs may be higher or lower, based on these assumptions your costs would be:
| 1 YEAR | 3 YEARS | |
| $132 | $883 |
PORTFOLIO TURNOVER
The Portfolio pays transaction costs, such as commissions, when it buys and sells securities (or “turns over” its portfolio). A higher portfolio turnover rate may indicate higher transaction costs and may result in higher taxes when Portfolio shares are held in a taxable account. These costs, which are not reflected in annual portfolio operating expenses or in the Example, affect the Portfolio’s performance. Because the Portfolio had not commenced investment operations during the most recent fiscal year, no portfolio turnover information is presented.
PRINCIPAL INVESTMENT STRATEGIES
The Portfolio invests primarily in companies that are based in emerging and frontier markets. Emerging and frontier markets offer investment opportunities that arise from long-term trends in demographics, deregulation, offshore outsourcing and improving corporate governance in developing countries. Harding Loevner LP (“Harding Loevner”), the Portfolio’s investment adviser, undertakes fundamental research in an effort to identify companies that are well managed, financially sound, fast growing and strongly competitive, and whose shares are under-priced relative to estimates of their value. The investment adviser’s analysts, after completing this research, assign a rating to each stock based upon its potential return relative to an appropriate benchmark. The universe of stocks eligible for investment in the Portfolio are those rated for purchase by the analysts and that otherwise meet the investment characteristics and guidelines established for the Portfolio. These guidelines include limits on exposure by geography, industry and currency, and may include other limits, such as market capitalization. To reduce its volatility, the Portfolio is diversified across these elements. The Portfolio may invest in companies in all capitalization ranges, including smaller and medium-sized companies.
The investment adviser expects that a majority of the stocks that its analysts have rated for purchase that meet the Portfolio’s investment characteristics and guidelines will be held in the Portfolio. The portfolio managers may exclude any stock in their discretion based on factors such as trading volumes, market capitalization or geography. In determining the weight of each security in the Portfolio, the portfolio managers will seek to maintain a portfolio that, over time, is generally less volatile than the Portfolio’s benchmark, taking into consideration factors including the relevant security’s predicted relative price performance, the timeliness of investment potential, the implications for portfolio risk and the requirement to observe the investment characteristics and guidelines established for the Portfolio. The portfolio managers will periodically re-balance the portfolio when and as they deem appropriate, to reflect, among other things, changes to
| 29 |
SUMMARY |
| |
INVESTMENT OBJECTIVE
The Global Equity Portfolio (the “Portfolio”) seeks long-term capital appreciation through investments in equity securities of companies based both inside and outside the United States.
PORTFOLIO FEES AND EXPENSES
This table describes the fees and expenses that you may pay if you buy and hold shares of the Advisor Class of the Portfolio.
SHAREHOLDER FEES (fees paid directly from your investment) | ||||
| Maximum Sales Charge (Load) Imposed on Purchases (as a percentage of offering price) | None | |||
| Redemption Fee (as a percentage of amount redeemed within 90 days or less from the date of purchase) | 2.00% | |||
ANNUAL PORTFOLIO OPERATING EXPENSES (expenses that you pay each year as a percentage of the | ||||
| Management Fees | 0.80% | |||
| Distribution (12b-1) Fees | None | |||
| Other Expenses | 0.39% | |||
| Total Annual Portfolio Operating Expenses | 1.19% | |||
| Fee Waiver and/or Expense Reimbursement1 | 0.00% | |||
| Total Annual Portfolio Operating Expenses After Fee Waiver and/or Expense Reimbursement1 | 1.19% | |||
| 1Harding Loevner LP has contractually agreed to waive a portion of its management fee and/or reimburse the Advisor Class of the Portfolio for its other operating expenses to the extent Total Annual Portfolio Operating Expenses (excluding dividend expenses, borrowing costs, interest expense relating to short sales, interest, taxes, brokerage commissions and extraordinary expenses), as a percentage of average daily net assets, exceed 1.25% through February 28, 2018. | ||||
Example: This example is intended to help you compare the cost of investing in the Advisor Class of the Portfolio with the cost of investing in other mutual funds. The example assumes that you invest $10,000 in the Advisor Class of the Portfolio for the time periods indicated and then redeem all of your shares at the end of those periods. The example also assumes that your investment has a 5% return each year and that the Advisor Class’s operating expenses remain the same. Although your actual costs may be higher or lower, based on these assumptions your costs would be:
| 1 YEAR | 3 YEARS | 5 YEARS | 10 YEARS | |||
| $121 | $378 | $654 | $1,443 |
PORTFOLIO TURNOVER
The Portfolio pays transaction costs, such as commissions, when it buys and sells securities (or “turns
over” its portfolio). A higher portfolio turnover rate may indicate higher transaction costs and may result in higher taxes when Portfolio shares are held in a taxable account. These costs, which are not reflected in annual portfolio operating expenses or in the Example, affect the Portfolio’s performance. During the most recent fiscal year, the Portfolio’s portfolio turnover rate was 24% of the average value of its portfolio.
PRINCIPAL INVESTMENT STRATEGIES
The Portfolio invests in companies based in the United States and other developed markets, as well as in emerging and frontier markets. Harding Loevner LP (“Harding Loevner”), the Portfolio’s investment adviser, undertakes fundamental research in an effort to identify companies that are well managed, financially sound, fast growing and strongly competitive, and whose shares are under-priced relative to estimates of their value. To reduce its volatility, the Portfolio is diversified across dimensions of geography, industry, currency and market capitalization. The Portfolio normally holds investments across at least 15 countries.
The Portfolio will normally invest broadly in equity securities of companies domiciled in the following countries and regions: (1) Europe; (2) the Pacific Rim; (3) the United States, Canada and Mexico; and (4) countries with emerging or frontier markets. At least 65% of total assets will be denominated in at least three currencies, which may include the U.S. dollar. For purposes of compliance with this restriction, American Depositary Receipts, Global Depositary Receipts, and European Depositary Receipts (collectively, “Depositary Receipts”), will be considered to be denominated in the currency of the country where the securities underlying the Depositary Receipts are principally traded.
The Portfolio invests, under normal circumstances, at least 80% of its net assets (plus any borrowings for investment purposes) in common stocks, preferred stocks, rights and warrants issued by companies that are based both inside and outside the United States, securities convertible into such securities (including Depositary Receipts), and investment companies that invest in the types of securities in which the Portfolio would normally invest.
Because some emerging market countries do not permit foreigners to participate directly in their securities markets or otherwise present difficulties for efficient foreign investment, the Portfolio may use equity derivative securities, and, in particular, participation notes, to gain exposure to those countries.
| 2 |
PRINCIPAL RISKS
The Portfolio is subject to numerous risks, any of which could cause an investor to lose money. The principal risks of the Portfolio are as follows:
Market Risk: Investments in the Portfolio may lose value due to a general downturn in stock markets.
Currency Risk: Foreign currencies may experience steady or sudden devaluation relative to the U.S. dollar, adversely affecting the value of the Portfolio’s investments. Because the Portfolio’s net asset value is determined on the basis of U.S. dollars, if the local currency of a foreign market depreciates against the U.S. dollar, you may lose money even if the foreign market prices of the Portfolio’s holdings rise.
Foreign Investment Risk: Securities issued by foreign entities involve risks not associated with U.S. investments. These risks include additional taxation, political, economic, social or diplomatic instability, and the above-mentioned possibility of changes in foreign currency exchange rates. There may also be less publicly-available information about a foreign issuer. Such risks may be magnified with respect to securities of issuers in frontier emerging markets.
Emerging and Frontier Market Risk: Emerging and frontier market securities involve certain risks, such as exposure to economies less diverse and mature than that of the United States or more established foreign markets. Economic or political instability may cause larger price changes in emerging or frontier market securities than in securities of issuers based in more developed foreign countries.
Participation Notes Risk: Participation notes are issued by banks or broker-dealers or their affiliates and are designed to replicate the return of a particular underlying equity or debt security, currency or market. When the participation note matures, the issuer of the participation note will pay to, or receive from, the Portfolio the difference between the nominal value of the underlying instrument at the time of purchase and that instrument’s value at maturity. Participation notes involve the same risks associated with a direct investment in the underlying security, currency or market. In addition, participation notes involve counterparty risk, because the Portfolio has no rights under participation notes against the issuer(s) of the underlying security(ies) and must rely on the creditworthiness of the issuer of the participation note.
Small- and Mid-Capitalization Risk: The securities of smaller and medium-sized companies have historically exhibited more volatility with a lower degree of liquidity than larger companies.
NAV Risk: The net asset value of the Portfolio and the value of your investment will fluctuate.
PORTFOLIO PERFORMANCE
The following bar chart shows how the Portfolio’s investment results have varied from year to year. The
table that follows shows how the Portfolio’s Advisor Class average annual total returns compare with a broad measure of market performance. Together, these provide an indication of the risks of investing in the Portfolio. How the Advisor Class of the Portfolio has performed in the past (before and after taxes) is not necessarily an indication of how it will perform in the future.
Updated Portfolio performance information is available at www.hardingloevnerfunds.com or by calling (877) 435-8105.
GLOBAL EQUITY PORTFOLIO
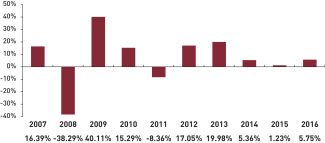
The best calendar quarter return during the period shown above was 20.80% in the 2nd quarter of 2009; the worst was -21.42% in the 4th quarter of 2008.
AVERAGE ANNUAL TOTAL RETURNS (for the periods ended December 31, 2016) | ||||||||||||
| 1-YEAR | 5-YEAR | 10-YEAR | ||||||||||
| GLOBAL EQUITY PORTFOLIO - ADVISOR CLASS | ||||||||||||
Return Before Taxes | 5.75% | 9.64% | 5.35% | |||||||||
Return After Taxes on Distributions1 | 5.44% | 9.18% | 4.98% | |||||||||
Return After Taxes on Distributions and Sale of Portfolio Shares1 | 3.55% | 7.63% | 4.31% | |||||||||
| MSCI ALL COUNTRY WORLD (NET) INDEX (reflects no deduction for fees, expenses, or U.S. taxes) | 7.86% | 9.37% | 3.56% | |||||||||
| 1After-tax returns in the table above are calculated using the historical highest individual federal marginal income tax rates and do not reflect the impact of state and local taxes. Actual after-tax returns depend on an investor’s tax situation and may differ from those shown, and after-tax returns shown are not relevant to investors who hold their Portfolio shares through tax-deferred arrangements, such as 401(k) plans or Individual Retirement Accounts. | ||||||||||||
MANAGEMENT
Investment Adviser
Harding Loevner serves as investment adviser to the Portfolio.
Portfolio Managers
Peter Baughan, Ferrill Roll, Christopher Mack and Richard Schmidt serve as the portfolio managers of the Global Equity Portfolio. Mr. Baughan has held his position since February 2003, Mr. Roll has held his position since January 2001, Mr. Mack has held his
| 3 |
PORTFOLIO SUMMARY | INTERNATIONAL EQUITY PORTFOLIO
| |
INVESTMENT OBJECTIVE
The International Equity Portfolio (the “Portfolio”) seeks long- term capital appreciation through investments in equity securities of companies based outside the United States.
PORTFOLIO FEES AND EXPENSES
This table describes the fees and expenses that you may pay if you buy and hold shares of the Investor Class of the Portfolio.
SHAREHOLDER FEES (fees paid directly from your investment) | ||||
| Maximum Sales Charge (Load) Imposed on Purchases (as a percentage of offering price) | None | |||
| Redemption Fee (as a percentage of amount redeemed within 90 days or less from the date of purchase) | 2.00% | |||
ANNUAL PORTFOLIO OPERATING EXPENSES1 (expenses that you pay each year as a percentage of the | ||||
| Management Fees | 0.70% | |||
| Distribution (12b-1) Fees | 0.25% | |||
| Other Expenses | 0.19% | |||
| Total Annual Portfolio Operating Expenses | 1.14% | |||
| Fee Waiver and/or ExpenseReimbursement2 | 0.00% | |||
| Total Annual Portfolio Operating Expenses After Fee Waiver and/or Expense Reimbursement2 | 1.14% | |||
1Expense information in this table has been restated to reflect current management fees, which were reduced effective November 1, 2016. Therefore, the expenses in this table will not correlate to the expenses shown in the Financial Highlights of the Portfolio. 2Harding Loevner LP has contractually agreed to waive a portion of its management fee and/or reimburse the Investor Class of the Portfolio for its other operating expenses to the extent Total Annual Portfolio Operating Expenses (excluding dividend expenses, borrowing costs, interest expense relating to short sales, interest, taxes, brokerage commissions and extraordinary expenses), as a percentage of average daily net assets, exceed 1.25% through February 28, 2018. |
| |||
Example: This example is intended to help you compare the cost of investing in the Investor Class of the Portfolio with the cost of investing in other mutual funds. The example assumes that you invest $10,000 in the Investor Class of the Portfolio for the time periods indicated and then redeem all of your shares at the end of those periods. The example also assumes that your investment has a 5% return each year and that the Investor Class’s operating expenses remain the same. Although your actual costs may be higher or lower, based on these assumptions your costs would be:
| 1 YEAR | 3 YEARS | 5 YEARS | 10 YEARS | |||
| $116 | $362 | $628 | $1,386 |
PORTFOLIO TURNOVER
The Portfolio pays transaction costs, such as commissions, when it buys and sells securities (or “turns over” its portfolio). A higher portfolio turnover rate may indicate higher transaction costs and may result in higher taxes when Portfolio shares are held in a taxable account. These costs, which are not reflected in annual portfolio operating expenses or in the Example, affect the Portfolio’s performance. During the most recent fiscal year, the Portfolio’s portfolio turnover rate was 22% of the average value of its portfolio.
PRINCIPAL INVESTMENT STRATEGIES
The Portfolio invests primarily in companies based in developed markets outside the United States as well as in established companies in emerging and frontier markets. Harding Loevner LP (“Harding Loevner”), the Portfolio’s investment adviser, undertakes fundamental research in an effort to identify companies that are well managed, financially sound, fast growing and strongly competitive and whose shares are under-priced relative to estimates of their value. To reduce its volatility, the Portfolio is diversified across dimensions of geography, industry, currency and market capitalization. The Portfolio normally holds investments across at least 15 countries.
Factors bearing on whether a company is considered to be “based” outside the United States may include: (1) it is legally domiciled outside the United States; (2) it conducts at least 50% of its business, as measured by the location of its sales, earnings, assets, or production, outside the United States; or (3) it has the principal exchange listing for its securities outside the United States.
The Portfolio will normally invest broadly in equity securities of companies domiciled in the following countries and regions: (1) Europe; (2) the Pacific Rim; (3) Canada and Mexico; and (4) countries with emerging or frontier markets. At least 65% of total assets will be denominated in at least three currencies other than the U.S. dollar. For purposes of compliance with this restriction, American Depositary Receipts, Global Depositary Receipts, and European Depositary Receipts (collectively, “Depositary Receipts”), will be considered to be denominated in the currency of the country where the securities underlying the Depositary Receipts are principally traded.
The Portfolio invests, under normal circumstances, at least 80% of its net assets (plus any borrowings for investment purposes) in common stocks, preferred stocks, rights and warrants issued by companies that are based outside the United States, securities convertible into such securities (including Depositary Receipts), and investment companies that invest in the types of
| 5 |
securities in which the Portfolio would normally invest. The Portfolio also may invest in securities of U.S. companies that derive, or are expected to derive, a significant portion of their revenues from their foreign operations, although under normal circumstances not more than 15% of the Portfolio’s total assets will be invested in securities of U.S. companies.
Because some emerging market countries do not permit foreigners to participate directly in their securities markets or otherwise present difficulties for efficient foreign investment, the Portfolio may use equity derivative securities, and, in particular, participation notes, to gain exposure to those countries.
PRINCIPAL RISKS
The Portfolio is subject to numerous risks, any of which could cause an investor to lose money. The principal risks of the Portfolio are as follows:
Market Risk: Investments in the Portfolio may lose value due to a general downturn in stock markets.
Currency Risk: Foreign currencies may experience steady or sudden devaluation relative to the U.S. dollar, adversely affecting the value of the Portfolio’s investments. Because the Portfolio’s net asset value is determined on the basis of U.S. dollars, if the local currency of a foreign market depreciates against the U.S. dollar, you may lose money even if the foreign market prices of the Portfolio’s holdings rise.
Foreign Investment Risk: Securities issued by foreign entities involve risks not associated with U.S. investments. These risks include additional taxation, political, economic, social or diplomatic instability, and the above-mentioned possibility of changes in foreign currency exchange rates. There may also be less publicly-available information about a foreign issuer. Such risks may be magnified with respect to securities of issuers in frontier emerging markets.
Emerging and Frontier Market Risk: Emerging and frontier market securities involve certain risks, such as exposure to economies less diverse and mature than that of the United States or more established foreign markets. Economic or political instability may cause larger price changes in emerging or frontier market securities than in securities of issuers based in more developed foreign countries.
Participation Notes Risk: Participation notes are issued by banks or broker-dealers or their affiliates and are designed to replicate the return of a particular underlying equity or debt security, currency or market. When the participation note matures, the issuer of the participation note will pay to, or receive from, the Portfolio the difference between the nominal value of the underlying instrument at the time of purchase and that instrument’s value at maturity. Participation notes involve the same risks associated with a direct investment in the underlying security, currency or market. In addition, participation notes involve counterparty risk, because the Portfolio has no rights under participation notes against the issuer(s) of the
underlying security(ies) and must rely on the creditworthiness of the issuer of the participation note.
NAV Risk: The net asset value of the Portfolio and the value of your investment will fluctuate.
PORTFOLIO PERFORMANCE
The following bar chart shows how the Portfolio’s investment results have varied from year to year. The table that follows shows how the Portfolio’s Investor Class average annual total returns compare with a broad measure of market performance. Together, these provide an indication of the risks of investing in the Portfolio. How the Investor Class of the Portfolio has performed in the past (before and after taxes) is not necessarily an indication of how it will perform in the future.
Updated Portfolio performance information is available at www.hardingloevnerfunds.com or by calling (877) 435-8105.
INTERNATIONAL EQUITY PORTFOLIO
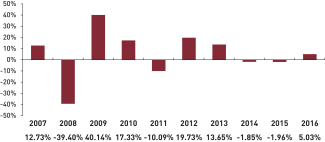
The best calendar quarter return during the period shown above was 21.31% in the 2nd quarter of 2009; the worst was -22.21% in the 4th quarter of 2008.
AVERAGE ANNUAL TOTAL RETURNS (for the periods ended December 31, 2016) | ||||||||||||
| 1-YEAR | 5-YEAR | 10-YEAR | ||||||||||
| INTERNATIONAL EQUITY PORTFOLIO - INVESTOR CLASS | ||||||||||||
Return Before Taxes | 5.03% | 6.58% | 3.34% | |||||||||
Return After Taxes on Distributions1 | 4.97% | 6.51% | 2.86% | |||||||||
Return After Taxes on Distributions and Sale of Portfolio Shares1 | 3.09% | 5.24% | 2.71% | |||||||||
| MSCI ALL COUNTRY WORLDex-U.S. (NET) INDEX (reflects no deduction for fees, expenses, or U.S. taxes) | 4.50% | 5.00% | 0.97% | |||||||||
| 1After-tax returns in the table above are calculated using the historical highest individual federal marginal income tax rates and do not reflect the impact of state and local taxes. Actual after-tax returns depend on an investor’s tax situation and may differ from those shown, and after-tax returns shown are not relevant to investors who hold their Portfolio shares through tax-deferred arrangements, such as 401(k) plans or Individual Retirement Accounts. | ||||||||||||
| 6 |
PORTFOLIO SUMMARY | INTERNATIONAL SMALL COMPANIES PORTFOLIO
| |
INVESTMENT OBJECTIVE
The International Small Companies Portfolio (the “Portfolio”) seeks long-term capital appreciation through investments in equity securities of small companies based outside the United States.
PORTFOLIO FEES AND EXPENSES
This table describes the fees and expenses that you may pay if you buy and hold shares of the Investor Class of the Portfolio.
SHAREHOLDER FEES (fees paid directly from your investment) | ||||
| Maximum Sales Charge (Load) Imposed on Purchases (as a percentage of offering price) | None | |||
| Redemption Fee (as a percentage of amount redeemed within 90 days or less from the date of purchase) | 2.00% | |||
ANNUAL PORTFOLIO OPERATING EXPENSES1 (expenses that you pay each year as a percentage of the | ||||
| Management Fees | 1.15% | |||
| Distribution (12b-1) Fees | 0.25% | |||
| Other Expenses | 0.40% | |||
| Total Annual Portfolio Operating Expenses | 1.80% | |||
| Fee Waiver and/or ExpenseReimbursement2 | -0.40% | |||
| Total Annual Portfolio Operating Expenses After Fee Waiver and/or ExpenseReimbursement2 | 1.40% | |||
1Expense information in this table has been restated to reflect current management fees, which were reduced effective November 1, 2016. Therefore, the expenses in this table will not correlate to the expenses shown in the Financial Highlights of the Portfolio. 2Harding Loevner LP has contractually agreed to waive a portion of its management fee and/or reimburse the investor Class of the Portfolio for its other operating expenses to the extent Total Annual Portfolio Operating Expenses (excluding dividend expenses, borrowing costs, interest expense relating to short sales, interest, taxes, brokerage commissions and extraordinary expenses), as a percentage of average daily net assets, exceed 1.40% through February 28, 2018. |
| |||
Example: This example is intended to help you compare the cost of investing in the Investor Class of the Portfolio with the cost of investing in other mutual funds. The example assumes that you invest $10,000 in the Investor Class of the Portfolio for the time periods indicated and then redeem all of your shares at the end of those periods. The example also assumes that your investment has a 5% return each year and that the Investor Class’s operating expenses remain the same, except that the example assumes the fee waiver and expense reimbursement agreement pertains only through February 28, 2018. Although your actual costs may be higher or lower, based on these assumptions your costs would be:
| 1 YEAR | 3 YEARS | 5 YEARS | 10 YEARS | |||
| $143 | $528 | $938 | $2,083 |
PORTFOLIO TURNOVER
The Portfolio pays transaction costs, such as commissions, when it buys and sells securities (or “turns over” its portfolio). A higher portfolio turnover rate may indicate higher transaction costs and may result in higher taxes when Portfolio shares are held in a taxable account. These costs, which are not reflected in annual portfolio operating expenses or in the Example, affect the Portfolio’s performance. During the most recent fiscal year, the Portfolio’s portfolio turnover rate was 49% of the average value of its portfolio.
PRINCIPAL INVESTMENT STRATEGIES
The Portfolio invests primarily in small companies based outside the United States, including companies in emerging and frontier as well as in developed markets. Companies considered to be small are those having a market capitalization, at time of purchase, within the range of the market capitalization of companies in the Portfolio’s benchmark index, currently the MSCI All Country World ex-US Small Cap Index (the “Index”). As of December 31, 2016, the range of market capitalization of companies in the Index was US$ [ ] to US$ [ ] billion. To reduce its volatility, the Portfolio is diversified across dimensions of geography, industry and currency. The Portfolio normally holds investments across at least 12 countries.
Factors bearing on whether a company is considered to be “based” outside the United States may include: (1) it is legally domiciled outside the United States; (2) it conducts at least 50% of its business, as measured by the location of its sales, earnings, assets, or production, outside the United States; or (3) it has the principal exchange listing for its securities outside the United States.
The Portfolio will normally invest broadly in equity securities of small companies domiciled in the following countries and regions: (1) Europe; (2) the Pacific Rim; (3) Canada and Mexico; and (4) countries with emerging or frontier markets. At least 65% of total assets will be denominated in at least three currencies other than the U.S. dollar. For purposes of compliance with this restriction, American Depositary Receipts, Global Depositary Receipts, and European Depositary Receipts (collectively, “Depositary Receipts”) will be considered to be denominated in the currency of the country where the securities underlying the Depositary Receipts are principally traded.
The Portfolio invests, under normal circumstances, at least 80% of its net assets (plus any borrowings for investment purposes) in common stocks, preferred stocks, rights and warrants issued by small companies that are based outside the United States, securities
| 8 |
AVERAGE ANNUAL TOTAL RETURNS (for the periods ended December 31, 2016) | ||||||||||||
| 1-YEAR | 5-YEAR | SINCE INCEPTION 3/26/07 | ||||||||||
| INTERNATIONAL SMALL COMPANIES PORTFOLIO - INVESTOR CLASS | ||||||||||||
Return Before Taxes | 0.06% | 8.98% | 4.61% | |||||||||
Return After Taxes on Distributions1 | -0.82% | 8.30% | 4.26% | |||||||||
Return After Taxes on Distributions and Sale of Portfolio Shares1 | 0.98% | 7.20% | 3.75% | |||||||||
| MSCI ALL COUNTRY WORLDex-U.S. SMALL CAP (NET) INDEX (reflects no deduction for fees, expenses, or U.S. taxes) | 3.92% | 7.73% | 2.30% | |||||||||
| 1After-tax returns in the table above are calculated using the historical highest individual federal marginal income tax rates and do not reflect the impact of state and local taxes. The return after taxes on distributions and sale of Portfolio shares may exceed the Portfolio’s other returns due to an assumed tax benefit from any losses on a sale of Portfolio shares at the end of the measurement period. Actual after-tax returns depend on an investor’s tax situation and may differ from those shown, and after-tax returns shown are not relevant to investors who hold their Portfolio shares through tax-deferred arrangements, such as 401(k) plans or Individual Retirement Accounts. | ||||||||||||
MANAGEMENT
Investment Adviser
Harding Loevner serves as investment adviser to the Portfolio.
Portfolio Managers
Jafar Rizvi serves as the portfolio manager of the International Small Companies Portfolio. Mr. Rizvi has held his position since June 2011.
PURCHASE AND SALE OF PORTFOLIO SHARES
The minimum initial investment in the Investor Class of the Portfolio is $5,000. Additional purchases may be for any amount. You may purchase or redeem (sell) shares of the Portfolio on any business day through certain authorized brokers and other financial intermediaries or directly from the Portfolio by mail, telephone or wire.
TAX CONSIDERATIONS
The Portfolio’s distributions are generally taxable to you as ordinary income, capital gains, or a combination of the two, unless you are investing through a tax-deferred arrangement, such as a 401(k) plan or an individual retirement account. Upon withdrawal, your investment through a tax-deferred arrangement may become taxable.
PAYMENTS TO BROKERS-DEALERS AND OTHER FINANCIAL INTERMEDIARIES
If you purchase Portfolio shares through a broker-dealer or other financial intermediary (such as a bank), the
Portfolio and its related companies may pay the intermediary for the sale of Portfolio shares and related services. These payments may create a conflict of interest by influencing the broker-dealer or other intermediary and your salesperson to recommend the Portfolio over another investment. Ask your salesperson or visit your financial intermediary’s website for more information.
| 10 |
PORTFOLIO SUMMARY |
| |
INVESTMENT OBJECTIVE
The Emerging Markets Portfolio (the “Portfolio”) seeks long-term capital appreciation through investments in equity securities of companies based in emerging markets.
PORTFOLIO FEES AND EXPENSES
This table describes the fees and expenses that you may pay if you buy and hold shares of the Advisor Class of the Portfolio.
SHAREHOLDER FEES (fees paid directly from your investment) | ||||
| Maximum Sales Charge (Load) Imposed on Purchases (as a percentage of offering price) | None | |||
| Redemption Fee (as a percentage of amount redeemed within 90 days or less from the date of purchase) | 2.00% | |||
ANNUAL PORTFOLIO OPERATING EXPENSES (expenses that you pay each year as a percentage of the | ||||
| Management Fees | 1.13% | |||
| Distribution (12b-1) Fees | None | |||
| Other Expenses | 0.29% | |||
| Total Annual Portfolio Operating Expenses | 1.42% | |||
| Fee Waiver and/or Expense Reimbursement1 | 0.00% | |||
| Total Annual Portfolio Operating Expenses After Fee Waiver and/or Expense Reimbursement1 | 1.42% | |||
| 1Harding Loevner LP has contractually agreed to waive a portion of its management fee and/or reimburse the Advisor Class of the Portfolio for its other operating expenses to the extent Total Annual Portfolio Operating Expenses (excluding dividend expenses, borrowing costs, interest expense relating to short sales, interest, taxes, brokerage commissions and extraordinary expenses), as a percentage of average daily net assets, exceed 1.75% through February 28, 2018. | ||||
Example: This example is intended to help you compare the cost of investing in the Advisor Class of the Portfolio with the cost of investing in other mutual funds. The example assumes that you invest $10,000 in the Advisor Class of the Portfolio for the time periods indicated and then redeem all of your shares at the end of those periods. The example also assumes that your investment has a 5% return each year and that the Advisor Class’s operating expenses remain the same. Although your actual costs may be higher or lower, based on these assumptions your costs would be:
| 1 YEAR | 3 YEARS | 5 YEARS | 10 YEARS | |||
| $145 | $449 | $776 | $1,702 |
PORTFOLIO TURNOVER
The Portfolio pays transaction costs, such as commissions, when it buys and sells securities (or “turns over” its portfolio). A higher portfolio turnover rate may indicate
higher transaction costs and may result in higher taxes when Portfolio shares are held in a taxable account. These costs, which are not reflected in annual portfolio operating expenses or in the Example, affect the Portfolio’s performance. During the most recent fiscal year, the Portfolio’s portfolio turnover rate was 26% of the average value of its portfolio.
PRINCIPAL INVESTMENT STRATEGIES
The Portfolio invests primarily in companies that are based in emerging and frontier markets. Emerging and frontier markets offer investment opportunities that arise from long-term trends in demographics, deregulation, offshore outsourcing and improving corporate governance in developing countries. Harding Loevner LP (“Harding Loevner”), the Portfolio’s investment adviser, undertakes fundamental research in an effort to identify companies that are well managed, financially sound, fast growing and strongly competitive, and whose shares are under-priced relative to estimates of their value. To reduce its volatility, the Portfolio is diversified across dimensions of geography, industry and currency. The Portfolio normally holds investments across at least 15 countries. Emerging and frontier markets include countries that have an emerging stock market as defined by Morgan Stanley Capital International, countries or markets with low- to middle-income economies as classified by the World Bank, and other countries or markets with similar characteristics. Emerging and frontier markets tend to have relatively low gross national product per capita compared to the world’s major economies and may have the potential for rapid economic growth.
Factors bearing on whether a company is considered to be “based” in an emerging or frontier market may include: (1) it is legally domiciled in an emerging or frontier market; (2) it conducts at least 50% of its business, as measured by the location of its sales, earnings, assets, or production, in an emerging or frontier market; or (3) it has the principal exchange listing for its securities in an emerging or frontier market.
The Portfolio will invest broadly in equity securities of companies domiciled in one of at least 15 countries with emerging or frontier markets, generally considered to include all countries except Australia, Austria, Belgium, Canada, Denmark, Finland, France, Germany, Hong Kong, Ireland, Israel, Italy, Japan, the Netherlands, New Zealand, Norway, Portugal, Singapore, Spain, Sweden, Switzerland, the United Kingdom and the United States. At least 65% of the Portfolio’s total assets will be denominated in at least three currencies other than the U.S. dollar. For purposes of compliance with this restriction, American Depositary Receipts, Global Depositary Receipts and European Depositary Receipts (collectively, “Depositary Receipts”) will be considered to be denominated in the currency of
| 11 |
The best calendar quarter return during the period shown above was 32.85% in the 2nd quarter of 2009; the worst was -27.99% in the 4th quarter of 2008.
AVERAGE ANNUAL TOTAL RETURNS (for the periods ended December 31, 2016) | ||||||||||||
| 1-YEAR | 5-YEAR | 10-YEAR | ||||||||||
| EMERGING MARKETS PORTFOLIO - ADVISOR CLASS | ||||||||||||
Return Before Taxes | 13.20% | 4.24% | 2.66% | |||||||||
Return After Taxes on Distributions1 | 13.19% | 3.67% | 2.27% | |||||||||
Return After Taxes on Distributions and Sale of Portfolio Shares1 | 7.75% | 3.53% | 2.32% | |||||||||
| MSCI EMERGING MARKETS (NET) INDEX (reflects no deduction for fees, expenses, or U.S. taxes) | 11.20% | 1.27% | 1.83% | |||||||||
| 1After-tax returns in the table above are calculated using the historical highest individual federal marginal income tax rates and do not reflect the impact of state and local taxes. Actual after-tax returns depend on an investor’s tax situation and may differ from those shown, and after-tax returns shown are not relevant to investors who hold their Portfolio shares through tax-deferred arrangements, such as 401(k) plans or Individual Retirement Accounts. | ||||||||||||
MANAGEMENT
Investment Adviser
Harding Loevner serves as investment adviser to the Portfolio.
Portfolio Managers
G. Rusty Johnson, Craig Shaw, Pradipta Chakrabortty, Scott Crawshaw and Richard Schmidt serve as the portfolio managers of the Emerging Markets Portfolio. Mr. Johnson has held his position since the Portfolio’s inception in November 1998, Mr. Shaw has held his position since December 2006, Mr. Chakrabortty has held his position since January 2015, Mr. Crawshaw has held his position since June 2014 and Mr. Schmidt has held his position since December 2011. Messrs. Johnson and Shaw are the lead portfolio managers.
PURCHASE AND SALE OF PORTFOLIO SHARES
The minimum initial investment in the Advisor Class of the Portfolio is $5,000. Additional purchases may be for any amount. You may purchase or redeem (sell) shares of the Portfolio on any business day through certain authorized brokers and other financial intermediaries or directly from the Portfolio by mail, telephone or wire.
Effective as of the close of business on June 30, 2016, the Portfolio is generally closed to new investors. Current investors will continue to be permitted to purchase shares and certain other investors may still be eligible to purchase shares. For more information, see the section “Shareholder Information—Purchase and Redemption of Shares.”
TAX CONSIDERATIONS
The Portfolio’s distributions are generally taxable to you as ordinary income, capital gains, or a combination of the two, unless you are investing through a tax-deferred arrangement, such as a 401(k) plan or an individual retirement account. Upon withdrawal, your investment through a tax-deferred arrangement may become taxable.
PAYMENTS TO BROKERS-DEALERS AND OTHER FINANCIAL INTERMEDIARIES
If you purchase Portfolio shares through a broker-dealer or other financial intermediary (such as a bank), the Portfolio and its related companies may pay the intermediary for the sale of Portfolio shares and related services. These payments may create a conflict of interest by influencing the broker-dealer or other intermediary and your salesperson to recommend the Portfolio over another investment. Ask your salesperson or visit your financial intermediary’s website for more information.
| 13 |
PORTFOLIO SUMMARY | FRONTIER EMERGING MARKETS PORTFOLIO
| |
INVESTMENT OBJECTIVE
The Frontier Emerging Markets Portfolio (the “Portfolio”) seeks long-term capital appreciation through investments in equity securities of companies based in frontier and smaller emerging markets.
PORTFOLIO FEES AND EXPENSES
This table describes the fees and expenses that you may pay if you buy and hold shares of the Investor Class of the Portfolio.
SHAREHOLDER FEES (fees paid directly from your investment) | ||||
| Maximum Sales Charge (Load) Imposed on Purchases (as a percentage of offering price) | None | |||
| Redemption Fee (as a percentage of amount redeemed within 90 days or less from the date of purchase) | 2.00% | |||
ANNUAL PORTFOLIO OPERATING EXPENSES1 (expenses that you pay each year as a percentage of the value of your investment) | ||||
| Management Fees | 1.35% | |||
| Distribution (12b-1) Fees | 0.25% | |||
| Other Expenses | 0.48% | |||
| Total Annual Portfolio Operating Expenses | 2.08% | |||
| Fee Waiver and/or ExpenseReimbursement2 | -0.08% | |||
| Total Annual Portfolio Operating Expenses After Fee Waiver and/or ExpenseReimbursement2 | 2.00% | |||
1Expense information in this table has been restated to reflect current management fees, which were reduced effective March 1, 2017. Therefore, the expenses in this table will not correlate to the expenses shown in the Financial Highlights of the Portfolio. 2Harding Loevner LP has contractually agreed to waive a portion of its management fee and/or reimburse the investor Class of the Portfolio for its other operating expenses to the extent Total Annual Portfolio Operating Expenses (excluding dividend expenses, borrowing costs, interest expense relating to short sales, interest, taxes, brokerage commissions and extraordinary expenses), as a percentage of average daily net assets, exceed 2.00% through February 28, 2018. |
| |||
Example: This example is intended to help you compare the cost of investing in the Investor Class of the Portfolio with the cost of investing in other mutual funds. The example assumes that you invest $10,000 in the Investor Class of the Portfolio for the time periods indicated and then redeem all of your shares at the end of those periods. The example also assumes that your investment has a 5% return each year and that the Investor Class’s operating expenses remain the same, except that the example assumes the fee waiver and expense reimbursement agreement pertains only through February 28, 2018. Although your actual costs may be higher or lower, based on these assumptions your costs would be:
| 1 YEAR | 3 YEARS | 5 YEARS | 10 YEARS | |||
| $203 | $644 | $1,111 | $2,404 |
PORTFOLIO TURNOVER
The Portfolio pays transaction costs, such as commissions, when it buys and sells securities (or “turns over” its portfolio). A higher portfolio turnover rate may indicate higher transaction costs and may result in higher taxes when Portfolio shares are held in a taxable account. These costs, which are not reflected in annual portfolio operating expenses or in the Example, affect the Portfolio’s performance. During the most recent fiscal year, the Portfolio’s portfolio turnover rate was 47% of the average value of its portfolio.
PRINCIPAL INVESTMENT STRATEGIES
The Portfolio invests primarily in companies that are based in frontier emerging markets, including the smaller traditionally-recognized emerging markets. Frontier emerging markets, with the exception of the oil-producing Gulf States and certain of the smaller traditionally-recognized emerging markets, tend to have relatively low gross national product per capita compared to the larger traditionally-recognized emerging markets and the world’s major developed economies. The frontier emerging markets include the least developed markets even by emerging markets standards. Frontier emerging markets offer investment opportunities that arise from long-term trends in demographics, deregulation, offshore outsourcing and improving corporate governance in developing countries. Harding Loevner LP (“Harding Loevner”), the Portfolio’s investment adviser, undertakes fundamental research in an effort to identify companies that are well managed, financially sound, fast growing and strongly competitive, and whose shares are under-priced relative to estimates of their value. To reduce its volatility, the Portfolio is diversified across dimensions of geography, industry and currency. The Portfolio normally holds investments across at least 12 countries.
As used herein, frontier emerging markets include countries that are represented in the MSCI Frontier Markets Index or the S&P Frontier Markets BMI, or similar market indices, and the smaller of the traditionally-recognized emerging markets, such as those individually constituting less than 5% of the MSCI Emerging Markets Index or the S&P Emerging Markets BMI. Factors bearing on whether a company is considered to be “based” in a frontier emerging market may include: (1) it is legally domiciled in a frontier emerging market; (2) it conducts at least 50% of its business, as measured by the location of its sales, earnings, assets, or production, in frontier emerging markets; or (3) it has the principal exchange listing for its securities in a frontier emerging market. Frontier emerging markets generally include all countries except Australia, Austria, Belgium, Canada, Denmark, Finland, France, Germany, Hong Kong, Ireland, Israel, Italy, Japan, the Netherlands, New Zealand, Norway, Portugal,
| 14 |
PORTFOLIO PERFORMANCE
The following bar chart shows how the Portfolio’s investment results have varied from year to year. The table that follows shows how the Portfolio’s Investor Class average annual total returns compare with a broad measure of market performance. Together, these provide an indication of the risks of investing in the Portfolio. How the Investor Class of the Portfolio has performed in the past (before and after taxes) is not necessarily an indication of how it will perform in the future.
Updated Portfolio performance information is available at www.hardingloevnerfunds.com or by calling (877) 435-8105.
FRONTIER EMERGING MARKETS PORTFOLIO
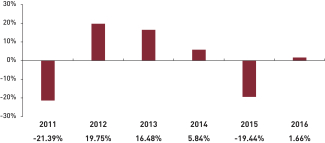
The best calendar quarter return during the period shown above was 10.42% in the 1st quarter of 2012; the worst was -15.70% in the 3rd quarter of 2011.
AVERAGE ANNUAL TOTAL RETURNS (for the periods ended December 31, 2016) | ||||||||||||
| 1-YEAR | 5 YEARS | SINCE INCEPTION 12/31/10 | ||||||||||
| FRONTIER EMERGING MARKETS PORTFOLIO - INVESTOR CLASS | ||||||||||||
Return Before Taxes | 1.66% | 3.87% | -0.84% | |||||||||
Return After Taxes on Distributions1 | 1.74% | 3.81% | -0.90% | |||||||||
Return After Taxes on Distributions and Sale of Portfolio Shares1 | 1.25% | 3.13% | -0.54% | |||||||||
MSCI FRONTIER EMERGING MARKETS (NET) INDEX (reflects no deduction for fees, expenses, or U.S. taxes) | 4.99% | 3.00% | -0.75% | |||||||||
| 1After-tax returns in the table above are calculated using the historical highest individual federal marginal income tax rates and do not reflect the impact of state and local taxes. The return after taxes on distributions and sale of Portfolio shares may exceed the Portfolio’s other returns due to an assumed tax benefit from any losses on a sale of Portfolio shares at the end of the measurement period. Actual after-tax returns depend on an investor’s tax situation and may differ from those shown, and after-tax returns shown are not relevant to investors who hold their Portfolio shares through tax-deferred arrangements, such as 401(k) plans or Individual Retirement Accounts. | ||||||||||||
MANAGEMENT
Investment Adviser
Harding Loevner serves as investment adviser to the Portfolio.
Portfolio Managers
Pradipta Chakrabortty, Babatunde Ojo and Richard Schmidt serve as the portfolio managers of the Frontier Emerging Markets Portfolio. Mr. Chakrabortty has held his position since December 2008, Mr. Ojo has held his position since June 2014 and Mr. Schmidt has held his position since January 2012. Messrs. Chakrabortty and Ojo are the lead portfolio managers.
PURCHASE AND SALE OF PORTFOLIO SHARES
The minimum initial investment in the Investor Class of the Portfolio is $5,000. Additional purchases may be for any amount. You may purchase or redeem (sell) shares of the Portfolio on any business day through certain authorized brokers and other financial intermediaries or directly from the Portfolio by mail, telephone or wire.
TAX CONSIDERATIONS
The Portfolio’s distributions are generally taxable to you as ordinary income, capital gains, or a combination of the two, unless you are investing through a tax-deferred arrangement, such as a 401(k) plan or an individual retirement account. Upon withdrawal, your investment through a tax-deferred arrangement may become taxable.
PAYMENTS TO BROKERS-DEALERS AND OTHER FINANCIAL INTERMEDIARIES
If you purchase Portfolio shares through a broker-dealer or other financial intermediary (such as a bank), the Portfolio and its related companies may pay the intermediary for the sale of Portfolio shares and related services. These payments may create a conflict of interest by influencing the broker-dealer or other intermediary and your salesperson to recommend the Portfolio over another investment. Ask your salesperson or visit your financial intermediary’s website for more information.
| 16 |
PORTFOLIO SUMMARY | GLOBAL EQUITY RESEARCH PORTFOLIO
| |
INVESTMENT OBJECTIVE
The Global Equity Research Portfolio (the “Portfolio”) seeks long-term capital appreciation through investments in equity securities of companies based both inside and outside the United States.
PORTFOLIO FEES AND EXPENSES
This table describes the fees and expenses that you may pay if you buy and hold shares of the Investor Class of the Portfolio.
SHAREHOLDER FEES (fees paid directly from your investment) | ||||
| Maximum Sales Charge (Load) Imposed on Purchases (as a percentage of offering price) | None | |||
| Redemption Fee (as a percentage of amount redeemed within 90 days or less from the date of purchase) | 2.00% | |||
ANNUAL PORTFOLIO OPERATING EXPENSES (expenses that you pay each year as a percentage of the | ||||
| Management Fees | 0.80% | |||
| Distribution (12b-1) Fees | 0.25% | |||
| Other Expenses1 | 7.81% | |||
| Total Annual Portfolio Operating Expenses | 8.86% | |||
| Fee Waiver and/or ExpenseReimbursement2 | -7.71% | |||
| Total Annual Portfolio Operating Expenses After Fee Waiver and/or ExpenseReimbursement2 | 1.15% | |||
1”Other Expenses” have been based on estimated amounts for the current fiscal year. 2Harding Loevner LP has contractually agreed to waive a portion of its management fee and/or reimburse the Investor Class of the Portfolio for its other operating expenses to the extent Total Annual Portfolio Operating Expenses (excluding dividend expenses, borrowing costs, interest expense relating to short sales, interest, taxes, brokerage commissions and extraordinary expenses), as a percentage of average daily net assets, exceed 1.15% through February 28, 2018. |
| |||
Example: This example is intended to help you compare the cost of investing in the Investor Class of the Portfolio with the cost of investing in other mutual funds. The example assumes that you invest $10,000 in the Investor Class of the Portfolio for the time periods indicated and then redeem all of your shares at the end of those periods. The example also assumes that your investment has a 5% return each year and that the Investor Class’s operating expenses remain the same, except that the example assumes the fee waiver and expense reimbursement agreement pertains only through February 28, 2018. Although your actual costs may be higher or lower, based on these assumptions your costs would be:
| 1 YEAR | 3 YEARS | |
| $117 | $1,887 |
PORTFOLIO TURNOVER
The Portfolio pays transaction costs, such as commissions, when it buys and sells securities (or “turns over” its portfolio). A higher portfolio turnover rate may indicate higher transaction costs and may result in higher taxes when Portfolio shares are held in a taxable account. These costs, which are not reflected in annual portfolio operating expenses or in the Example, affect the Portfolio’s performance. Because the Portfolio had not commenced investment operations during the most recent fiscal year, no portfolio turnover information is presented.
PRINCIPAL INVESTMENT STRATEGIES
The Portfolio invests in companies based in the United States and other developed markets, as well as in established companies in emerging and frontier markets. Harding Loevner LP (“Harding Loevner”), the Portfolio’s investment adviser, undertakes fundamental research in an effort to identify companies that are well managed, financially sound, fast growing and strongly competitive, and whose shares are under-priced relative to estimates of their value. The investment adviser’s analysts, after completing this research, assign a rating to each stock based upon its potential return relative to an appropriate benchmark. The universe of stocks eligible for investment in the Portfolio are those rated for purchase by the analysts and that otherwise meet the investment characteristics and guidelines established for the Portfolio. These guidelines include limits on exposure by geography, industry and currency, and may include other limits, such as market capitalization. To reduce its volatility, the Portfolio is diversified across these elements. The Portfolio may invest in companies in all capitalization ranges, including smaller and medium-sized companies.
The investment adviser expects that a majority of the stocks that its analysts have rated for purchase that meet the Portfolio’s investment characteristics and guidelines will be held in the Portfolio. The portfolio managers may exclude any stock in their discretion based on factors such as trading volumes, market capitalization or geography. In determining the weight of each security in the Portfolio, the portfolio managers will seek to maintain a portfolio that, over time, is generally less volatile than the Portfolio’s benchmark, taking into consideration factors including the relevant security’s predicted relative price performance, the timeliness of investment potential, the implications for portfolio risk and the requirement to observe the investment characteristics and guidelines established for the Portfolio. The portfolio managers will periodically re-balance the portfolio when and as they deem appropriate, to reflect, among other things, changes to securities prices, analysts’ ratings, desired investment
| 17 |
PORTFOLIO SUMMARY | INTERNATIONAL EQUITY RESEARCH PORTFOLIO
| |
INVESTMENT OBJECTIVE
The International Equity Research Portfolio (the “Portfolio”) seeks long- term capital appreciation through investments in equity securities of companies based outside the United States.
PORTFOLIO FEES AND EXPENSES
This table describes the fees and expenses that you may pay if you buy and hold shares of the Investor Class of the Portfolio.
SHAREHOLDER FEES (fees paid directly from your investment) | ||||
| Maximum Sales Charge (Load) Imposed on Purchases (as a percentage of offering price) | None | |||
| Redemption Fee (as a percentage of amount redeemed within 90 days or less from the date of purchase) | 2.00% | |||
ANNUAL PORTFOLIO OPERATING EXPENSES (expenses that you pay each year as a percentage of the | ||||
| Management Fees | 0.75% | |||
| Distribution (12b-1) Fees | 0.25% | |||
| Other Expenses1 | 9.91% | |||
| Total Annual Portfolio Operating Expenses | 10.91% | |||
| Fee Waiver and/or Expense Reimbursement1 | -9.76% | |||
| Total Annual Portfolio Operating Expenses After Fee Waiver and/or Expense Reimbursement1 | 1.15% | |||
| 1Harding Loevner LP has contractually agreed to waive a portion of its management fee and/or reimburse the Investor Class of the Portfolio for its other operating expenses to the extent Total Annual Portfolio Operating Expenses (excluding dividend expenses, borrowing costs, interest expense relating to short sales, interest, taxes, brokerage commissions and extraordinary expenses), as a percentage of average daily net assets, exceed 1.15% through February 28, 2018. | ||||
Example: This example is intended to help you compare the cost of investing in the Investor Class of the Portfolio with the cost of investing in other mutual funds. The example assumes that you invest $10,000 in the Investor Class of the Portfolio for the time periods indicated and then redeem all of your shares at the end of those periods. The example also assumes that your investment has a 5% return each year and that the Investor Class’s operating expenses remain the same, except that the example assumes the fee waiver and expense reimbursement agreement pertains only through February 28, 2018. Although your actual costs may be higher or lower, based on these assumptions your costs would be:
| 1 YEAR | 3 YEARS | 5 YEARS | 10 YEARS | |||
| $117 | $2,251 | $4,141 | $7,969 |
PORTFOLIO TURNOVER
The Portfolio pays transaction costs, such as commissions, when it buys and sells securities (or “turns over” its portfolio). A higher portfolio turnover rate may indicate higher transaction costs and may result in higher taxes when Portfolio shares are held in a taxable account. These costs, which are not reflected in annual portfolio operating expenses or in the Example, affect the Portfolio’s performance. During the most recent fiscal year, the Portfolio’s portfolio turnover rate was 33% of the average value of its portfolio.
PRINCIPAL INVESTMENT STRATEGIES
The Portfolio invests primarily in companies based in developed markets outside the United States as well as in established companies in emerging and frontier markets. Harding Loevner LP (“Harding Loevner”), the Portfolio’s investment adviser, undertakes fundamental research in an effort to identify companies that are well managed, financially sound, fast growing and strongly competitive and whose shares are under-priced relative to estimates of their value. The investment adviser’s analysts, after completing this research, assign a rating to each stock based upon its potential return relative to an appropriate benchmark. The universe of stocks eligible for investment in the Portfolio are those rated for purchase by the analysts and that otherwise meet the investment characteristics and guidelines established for the Portfolio. These guidelines include limits on exposure by geography, industry and currency, and may include other limits, such as market capitalization. To reduce its volatility, the Portfolio is diversified across these elements. The Portfolio may invest in companies in all capitalization ranges, including smaller and medium-sized companies.
The investment adviser expects that a majority of the stocks that its analysts have rated for purchase that meet the Portfolio’s investment characteristics and guidelines will be held in the Portfolio. The portfolio managers may exclude any stock in their discretion based on factors such as trading volumes, market capitalization or geography. In determining the weight of each security in the Portfolio, the portfolio managers will seek to maintain a portfolio that, over time, is generally less volatile than the Portfolio’s benchmark, taking into consideration factors including the relevant security’s predicted relative price performance, the timeliness of investment potential, the implications for portfolio risk and the requirement to observe the investment characteristics and guidelines established for the Portfolio. The portfolio managers will periodically re-balance the portfolio when and as they deem appropriate, to reflect, among other things, changes to securities prices, analysts’ ratings, desired investment characteristics, investment guidelines or assumptions
| 20 |
INTERNATIONAL EQUITY RESEARCH PORTFOLIO
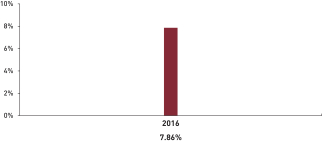
The best calendar quarter return during the period shown above was 6.71% in the 3rd quarter of 2016; the worst was -4.08% in the 4th quarter of 2016.
AVERAGE ANNUAL TOTAL RETURNS (for the periods ended December 31, 2016) | ||||||||
| 1-YEAR | SINCE INCEPTION 12/17/15 | |||||||
| INTERNATIONAL EQUITY RESEARCH PORTFOLIO - INVESTOR CLASS | ||||||||
Return Before Taxes | 7.86% | 7.97% | ||||||
Return After Taxes on Distributions1 | 6.62% | 6.77% | ||||||
Return After Taxes on Distributions and Sale of Portfolio Shares1 | 4.79% | 5.71% | ||||||
| MSCI ALL COUNTRY WORLD ex-U.S. (NET) INDEX (reflects no deduction for fees, expenses, or U.S. taxes) | 4.50% | 5.01% | ||||||
| 1After-tax returns in the table above are calculated using the historical highest individual federal marginal income tax rates and do not reflect the impact of state and local taxes. Actual after-tax returns depend on an investor’s tax situation and may differ from those shown, and after-tax returns shown are not relevant to investors who hold their Portfolio shares through tax-deferred arrangements, such as 401(k) plans or Individual Retirement Accounts. | ||||||||
MANAGEMENT
Investment Adviser
Harding Loevner serves as investment adviser to the Portfolio.
Portfolio Managers
Andrew West and Moon Surana serve as the portfolio managers of the International Equity Research Portfolio. Mr. West has been a Portfolio Manager with Harding Loevner since June 2014. Ms. Surana has been an Associate Portfolio Manager with Harding Loevner since June 2015.
PURCHASE AND SALE OF PORTFOLIO SHARES
The minimum initial investment in the Investor Class of the Portfolio is $5,000. Additional purchases may be for any amount. You may purchase or redeem (sell) shares of the Portfolio on any business day through certain authorized brokers and other financial intermediaries or directly from the Portfolio by mail, telephone or wire.
TAX CONSIDERATIONS
The Portfolio’s distributions are generally taxable to you as ordinary income, capital gains, or a combination of the two, unless you are investing through a tax-deferred arrangement, such as a 401(k) plan or an individual retirement account. Upon withdrawal, your investment through a tax-deferred arrangement may become taxable.
PAYMENTS TO BROKERS-DEALERS AND OTHER FINANCIAL INTERMEDIARIES
If you purchase Portfolio shares through a broker-dealer or other financial intermediary (such as a bank), the Portfolio and its related companies may pay the intermediary for the sale of Portfolio shares and related services. These payments may create a conflict of interest by influencing the broker-dealer or other intermediary and your salesperson to recommend the Portfolio over another investment. Ask your salesperson or visit your financial intermediary’s website for more information.
| 22 |
PORTFOLIO SUMMARY | EMERGING MARKETS RESEARCH PORTFOLIO
| |
INVESTMENT OBJECTIVE
The Emerging Markets Research Portfolio (the “Portfolio”) seeks long-term capital appreciation through investments in equity securities of companies based in emerging markets.
PORTFOLIO FEES AND EXPENSES
This table describes the fees and expenses that you may pay if you buy and hold shares of the Investor Class of the Portfolio.
SHAREHOLDER FEES (fees paid directly from your investment) | ||||
| Maximum Sales Charge (Load) Imposed on Purchases (as a percentage of offering price) | None | |||
| Redemption Fee (as a percentage of amount redeemed within 90 days or less from the date of purchase) | 2.00% | |||
| ANNUAL PORTFOLIO OPERATING EXPENSES (expenses that you pay each year as a percentage of the value of your investment) | ||||
| Management Fees | 1.15% | |||
| Distribution (12b-1) Fees | 0.25% | |||
| Other Expenses1 | 7.86% | |||
| Total Annual Portfolio Operating Expenses | 9.26% | |||
| Fee Waiver and/or Expense Reimbursement2 | -7.71% | |||
| Total Annual Portfolio Operating Expenses After Fee Waiver and/or Expense Reimbursement2 | 1.55% | |||
1“Other Expenses” have been based on estimated amounts for the current fiscal year. 2Harding Loevner LP has contractually agreed to waive a portion of its management fee and/or reimburse the Investor Class of the Portfolio for its other operating expenses to the extent Total Annual Portfolio Operating Expenses (excluding dividend expenses, borrowing costs, interest expense relating to short sales, interest, taxes, brokerage commissions and extraordinary expenses), as a percentage of average daily net assets, exceed 1.55% through February 28, 2018. |
| |||
Example: This example is intended to help you compare the cost of investing in the Investor Class of the Portfolio with the cost of investing in other mutual funds. The example assumes that you invest $10,000 in the Investor Class of the Portfolio for the time periods indicated and then redeem all of your shares at the end of those periods. The example also assumes that your investment has a 5% return each year and that the Investor Class’s operating expenses remain the same, except that the example assumes the fee waiver and expense reimbursement agreement pertains only through February 28, 2018. Although your actual costs may be higher or lower, based on these assumptions your costs would be:
| 1 YEAR | 3 YEARS | |
| $158 | $1,993 |
PORTFOLIO TURNOVER
The Portfolio pays transaction costs, such as commissions, when it buys and sells securities (or “turns over” its portfolio). A higher portfolio turnover rate may indicate higher transaction costs and may result in higher taxes when Portfolio shares are held in a taxable account. These costs, which are not reflected in annual portfolio operating expenses or in the Example, affect the Portfolio’s performance. Because the Portfolio had not commenced investment operations during the most recent fiscal year, no portfolio turnover information is presented.
PRINCIPAL INVESTMENT STRATEGIES
The Portfolio invests primarily in companies that are based in emerging and frontier markets. Emerging and frontier markets offer investment opportunities that arise from long-term trends in demographics, deregulation, offshore outsourcing and improving corporate governance in developing countries. Harding Loevner LP (“Harding Loevner”), the Portfolio’s investment adviser, undertakes fundamental research in an effort to identify companies that are well managed, financially sound, fast growing and strongly competitive, and whose shares are under-priced relative to estimates of their value. The investment adviser’s analysts, after completing this research, assign a rating to each stock based upon its potential return relative to an appropriate benchmark. The universe of stocks eligible for investment in the Portfolio are those rated for purchase by the analysts and that otherwise meet the investment characteristics and guidelines established for the Portfolio. These guidelines include limits on exposure by geography, industry and currency, and may include other limits, such as market capitalization. To reduce its volatility, the Portfolio is diversified across these elements. The Portfolio may invest in companies in all capitalization ranges, including smaller and medium-sized companies.
The investment adviser expects that a majority of the stocks that its analysts have rated for purchase that meet the Portfolio’s investment characteristics and guidelines will be held in the Portfolio. The portfolio managers may exclude any stock in their discretion based on factors such as trading volumes, market capitalization or geography. In determining the weight of each security in the Portfolio, the portfolio managers will seek to maintain a portfolio that, over time, is generally less volatile than the Portfolio’s benchmark, taking into consideration factors including the relevant security’s predicted relative price performance, the timeliness of investment potential, the implications for portfolio risk and the requirement to observe the investment characteristics and guidelines established for the Portfolio. The portfolio managers will periodically re-balance the portfolio when and as they deem appropriate, to reflect, among other things, changes to
| 23 |
SUMMARY |
| |
INVESTMENT OBJECTIVE
The Global Equity Portfolio (the “Portfolio”) seeks long-term capital appreciation through investments in equity securities of companies based both inside and outside the United States.
PORTFOLIO FEES AND EXPENSES
This table describes the fees and expenses that you may pay if you buy and hold the Portfolio’s Institutional Class Z shares.
SHAREHOLDER FEES (fees paid directly from your investment) | ||||
| Maximum Sales Charge (Load) Imposed on Purchases (as a percentage of offering price) | None | |||
| Redemption Fee (as a percentage of amount redeemed within 90 days or less from the date of purchase) | 2.00% | |||
ANNUAL PORTFOLIO OPERATING EXPENSES (expenses that you pay each year as a percentage of the | ||||
| Management Fees | 0.80% | |||
| Distribution (12b-1) Fees | None | |||
| Other Expenses1 | 0.73% | |||
| Total Annual Portfolio Operating Expenses | 1.53% | |||
| Fee Waiver and/or Expense Reimbursement2 | -0.58% | |||
| Total Annual Portfolio Operating Expenses After Fee Waiver and/or Expense Reimbursement2 | 0.95% | |||
1Other expenses are estimated based on estimated amounts for the current fiscal year. 2Harding Loevner LP has contractually agreed to waive a portion of its management fee and/or reimburse the Portfolio’s Institutional Class Z for its other operating expenses to the extent Total Annual Portfolio Operating Expenses (excluding dividend expenses, borrowing costs, interest expense relating to short sales, interest, taxes, brokerage commissions and extraordinary expenses), as a percentage of average daily net assets, exceed 0.95% through February 28, 2018. |
| |||
Example: This example is intended to help you compare the cost of investing in the Portfolio’s Institutional Class Z with the cost of investing in other mutual funds. The example assumes that you invest $10,000 in the Portfolio’s Institutional Class Z shares for the time periods indicated and then redeem all of your shares at the end of those periods. The example also assumes that your investment has a 5% return each year and that the Institutional Class Z’s operating expenses remain the same, except that the example assumes the fee waiver and expense reimbursement agreement pertains only through February 28, 2018. Although your actual costs may be higher or lower, based on these assumptions your costs would be:
| 1 YEAR | 3 YEARS | 5 YEARS | 10 YEARS | |||
| $97 | $426 | $779 | $1,774 |
PORTFOLIO TURNOVER
The Portfolio pays transaction costs, such as commissions, when it buys and sells securities (or “turns over” its portfolio). A higher portfolio turnover rate may indicate higher transaction costs and may result in higher taxes when Portfolio shares are held in a taxable account. These costs, which are not reflected in annual portfolio operating expenses or in the Example, affect the Portfolio’s performance. During the most recent fiscal year, the Portfolio’s portfolio turnover rate was 24% of the average value of its portfolio.
PRINCIPAL INVESTMENT STRATEGIES
The Portfolio invests in companies based in the United States and other developed markets, as well as in emerging and frontier markets. Harding Loevner LP (“Harding Loevner”), the Portfolio’s investment adviser, undertakes fundamental research in an effort to identify companies that are well managed, financially sound, fast growing and strongly competitive, and whose shares are under-priced relative to estimates of their value. To reduce its volatility, the Portfolio is diversified across dimensions of geography, industry, currency and market capitalization. The Portfolio normally holds investments across at least 15 countries.
The Portfolio will normally invest broadly in equity securities of companies domiciled in the following countries and regions: (1) Europe; (2) the Pacific Rim; (3) the United States, Canada and Mexico; and (4) countries with emerging or frontier markets. At least 65% of total assets will be denominated in at least three currencies, which may include the U.S. dollar. For purposes of compliance with this restriction, American Depositary Receipts, Global Depositary Receipts, and European Depositary Receipts (collectively, “Depositary Receipts”), will be considered to be denominated in the currency of the country where the securities underlying the Depositary Receipts are principally traded.
The Portfolio invests, under normal circumstances, at least 80% of its net assets (plus any borrowings for investment purposes) in common stocks, preferred stocks, rights and warrants issued by companies that are based both inside and outside the United States, securities convertible into such securities (including Depositary Receipts), and investment companies that invest in the types of securities in which the Portfolio would normally invest.
Because some emerging market countries do not permit foreigners to participate directly in their securities markets or otherwise present difficulties for efficient foreign investment, the Portfolio may use equity derivative securities, and, in particular, participation notes, to gain exposure to those countries.
| 2 |
PRINCIPAL RISKS
The Portfolio is subject to numerous risks, any of which could cause an investor to lose money. The principal risks of the Portfolio are as follows:
Market Risk: Investments in the Portfolio may lose value due to a general downturn in stock markets.
Currency Risk: Foreign currencies may experience steady or sudden devaluation relative to the U.S. dollar, adversely affecting the value of the Portfolio’s investments. Because the Portfolio’s net asset value is determined on the basis of U.S. dollars, if the local currency of a foreign market depreciates against the U.S. dollar, you may lose money even if the foreign market prices of the Portfolio’s holdings rise.
Foreign Investment Risk: Securities issued by foreign entities involve risks not associated with U.S. investments. These risks include additional taxation, political, economic, social or diplomatic instability, and the above-mentioned possibility of changes in foreign currency exchange rates. There may also be less publicly-available information about a foreign issuer. Such risks may be magnified with respect to securities of issuers in frontier emerging markets.
Emerging and Frontier Market Risk: Emerging and frontier market securities involve unique risks, such as exposure to economies less diverse and mature than that of the United States or more established foreign markets. Economic or political instability may cause larger price changes in emerging or frontier market securities than in securities of issuers based in more developed foreign countries.
Participation Notes Risk: Participation notes are issued by banks or broker-dealers or their affiliates and are designed to replicate the return of a particular underlying equity or debt security, currency or market. When the participation note matures, the issuer of the participation note will pay to, or receive from, the Portfolio the difference between the nominal value of the underlying instrument at the time of purchase and that instrument’s value at maturity. Participation notes involve the same risks associated with a direct investment in the underlying security, currency or market. In addition, participation notes involve counterparty risk, because the Portfolio has no rights under participation notes against the issuer(s) of the underlying security(ies) and must rely on the creditworthiness of the issuer of the participation note.
Small- and Mid-Capitalization Risk: The securities of smaller and medium-sized companies have historically exhibited more volatility with a lower degree of liquidity than larger companies.
NAV Risk: The net asset value of the Portfolio and the value of your investment will fluctuate.
PORTFOLIO PERFORMANCE
Because the Institutional Class Z shares of the Portfolio had not commenced investment operations during the
most recent fiscal year, the performance information shown below is for the Institutional Class shares of the Portfolio, which are not offered in this Prospectus. Institutional Class Z shares and Institutional Class shares of the Portfolio would have substantially similar annual returns because both classes of shares invest in the same portfolio of securities, but returns will differ only to the extent that the Institutional Class Z shares have different expenses. The bar chart below shows how the Portfolio’s Institutional Class investment results have varied from year to year. The table that follows shows how the Portfolio’s Institutional Class average annual total returns compare with a broad measure of market performance. Together, these provide an indication of the risks of investing in the Portfolio. How the Portfolio’s Institutional Class has performed in the past (before and after taxes) is not necessarily an indication of how the Portfolio’s Institutional Class Z will perform in the future.
Updated Portfolio performance information is available at www.hardingloevnerfunds.com or by calling (877) 435-8105.
GLOBAL EQUITY PORTFOLIO
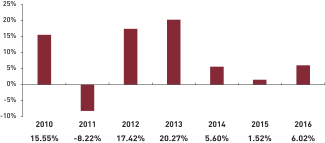
The best calendar quarter return during the period shown above was 15.90% in the 1st quarter of 2012; the worst was -16.23% in the 3rd quarter of 2011.
| AVERAGE ANNUAL TOTAL RETURNS (for the periods ended December 31, 2016) | ||||||||||||
| 1-YEAR | 5-YEAR | SINCE INCEPTION 11/03/09 | ||||||||||
| GLOBAL EQUITY PORTFOLIO - INSTITUTIONAL CLASS | ||||||||||||
Return Before Taxes | 6.02% | 9.93% | 8.43% | |||||||||
Return After Taxes on Distributions1 | 5.68% | 9.42% | 8.01% | |||||||||
Return After Taxes on Distributions and Sale of Portfolio Shares1 | 3.80% | 7.87% | 6.75% | |||||||||
| MSCI ALL COUNTRY WORLD (NET) INDEX (reflects no deduction for fees, expenses, or U.S. taxes) | 7.86% | 9.37% | 7.98% | |||||||||
| 1After-tax returns in the table above are calculated using the historical highest individual federal marginal income tax rates and do not reflect the impact of state and local taxes. Actual after-tax returns depend on an investor’s tax situation and may differ from those shown, and after-tax returns shown are not relevant to investors who hold their Portfolio shares through tax-deferred arrangements, such as 401(k) plans or Individual Retirement Accounts. | ||||||||||||
| 3 |
PORTFOLIO SUMMARY | INTERNATIONAL EQUITY PORTFOLIO
| |
INVESTMENT OBJECTIVE
The International Equity Portfolio (the “Portfolio”) seeks long- term capital appreciation through investments in equity securities of companies based outside the United States.
PORTFOLIO FEES AND EXPENSES
This table describes the fees and expenses that you may pay if you buy and hold Institutional Class Z shares of the Portfolio.
SHAREHOLDER FEES (fees paid directly from your investment) | ||||
| Maximum Sales Charge (Load) Imposed on Purchases (as a percentage of offering price) | None | |||
| Redemption Fee (as a percentage of amount redeemed within 90 days or less from the date of purchase) | 2.00% | |||
ANNUAL PORTFOLIO OPERATING EXPENSES1 (expenses that you pay each year as a percentage of the | ||||
| Management Fees | 0.70% | |||
| Distribution (12b-1) Fees | None | |||
| Other Expenses1 | 0.73% | |||
| Total Annual Portfolio Operating Expenses | 1.43% | |||
| Fee Waiver and/or Expense Reimbursement2 | -0.53% | |||
| Total Annual Portfolio Operating Expenses After Fee Waiver and/or Expense Reimbursement2 | 0.90% | |||
1Other expenses are estimated based on estimated amounts for the current fiscal year. 2Harding Loevner LP has contractually agreed to waive a portion of its management fee and/or reimburse the Portfolio’s Institutional Class Z for its other operating expenses to the extent Total Annual Portfolio Operating Expenses (excluding dividend expenses, borrowing costs, interest expense relating to short sales, interest, taxes, brokerage commissions and extraordinary expenses), as a percentage of average daily net assets, exceed 0.90% through February 28, 2018 |
| |||
Example: This example is intended to help you compare the cost of investing in the Portfolio’s Institutional Class Z with the cost of investing in other mutual funds. The example assumes that you invest $10,000 in the Portfolio’s Institutional Class Z shares for the time periods indicated and then redeem all of your shares at the end of those periods. The example also assumes that your investment has a 5% return each year and that the Institutional Class Z’s operating expenses remain the same, except that the example assumes the fee waiver and expense reimbursement agreement pertains only through February 28, 2018. Although your actual costs may be higher or lower, based on these assumptions your costs would be:
| 1 YEAR | 3 YEARS | 5 YEARS | 10 YEARS | |||
| $92 | $400 | $731 | $1,667 |
PORTFOLIO TURNOVER
The Portfolio pays transaction costs, such as commissions, when it buys and sells securities (or “turns over” its portfolio). A higher portfolio turnover rate may indicate higher transaction costs and may result in higher taxes when Portfolio shares are held in a taxable account. These costs, which are not reflected in annual portfolio operating expenses or in the Example, affect the Portfolio’s performance. During the most recent fiscal year, the Portfolio’s portfolio turnover rate was 22% of the average value of its portfolio.
PRINCIPAL INVESTMENT STRATEGIES
The Portfolio invests primarily in companies based in developed markets outside the United States as well as in established companies in emerging and frontier markets. Harding Loevner LP (“Harding Loevner”), the Portfolio’s investment adviser, undertakes fundamental research in an effort to identify companies that are well managed, financially sound, fast growing and strongly competitive and whose shares are under-priced relative to estimates of their value. To reduce its volatility, the Portfolio is diversified across dimensions of geography, industry, currency and market capitalization. The Portfolio normally holds investments across at least 15 countries.
Factors bearing on whether a company is considered to be “based” outside the United States may include: (1) it is legally domiciled outside the United States; (2) it conducts at least 50% of its business, as measured by the location of its sales, earnings, assets, or production, outside the United States; or (3) it has the principal exchange listing for its securities outside the United States.
The Portfolio will normally invest broadly in equity securities of companies domiciled in the following countries and regions: (1) Europe; (2) the Pacific Rim; (3) Canada and Mexico; and (4) countries with emerging or frontier markets. At least 65% of total assets will be denominated in at least three currencies other than the U.S. dollar. For purposes of compliance with this restriction, American Depositary Receipts, Global Depositary Receipts, and European Depositary Receipts (collectively, “Depositary Receipts”), will be considered to be denominated in the currency of the country where the securities underlying the Depositary Receipts are principally traded.
The Portfolio invests, under normal circumstances, at least 80% of its net assets (plus any borrowings for investment purposes) in common stocks, preferred stocks, rights and warrants issued by companies that are based outside the United States, securities convertible into such securities (including Depositary Receipts, as defined below), and investment companies that invest in
| 5 |
AVERAGE ANNUAL TOTAL RETURNS (for the periods ended December 31, 2016) | ||||||||||||
| 1-YEAR | 5-YEAR | 10-YEAR | ||||||||||
| INTERNATIONAL EQUITY PORTFOLIO - INSTITUTIONAL CLASS | ||||||||||||
Return Before Taxes | 5.31% | 6.93% | 3.64% | |||||||||
Return After Taxes on Distributions1 | 5.23% | 6.83% | 3.12% | |||||||||
Return After Taxes on Distributions and Sale of Portfolio Shares1 | 3.37% | 5.57% | 2.97% | |||||||||
| MSCI ALL COUNTRY WORLD ex-U.S. (NET) INDEX (reflects no deduction for fees, expenses, or U.S. taxes) | 4.50% | 5.00% | 0.97% | |||||||||
| 1After-tax returns in the table above are calculated using the historical highest individual federal marginal income tax rates and do not reflect the impact of state and local taxes. The return after taxes on distributions and sale of Portfolio shares may exceed the Portfolio’s other returns due to an assumed tax benefit from any losses on a sale of Portfolio shares at the end of the measurement period. Actual after-tax returns depend on an investor’s tax situation and may differ from those shown, and after-tax returns shown are not relevant to investors who hold their Portfolio shares through tax-deferred arrangements, such as 401(k) plans or Individual Retirement Accounts. | ||||||||||||
MANAGEMENT
Investment Adviser
Harding Loevner serves as investment adviser to the Portfolio.
Portfolio Managers
Ferrill Roll, Alexander Walsh, Bryan Lloyd, Patrick Todd and Andrew West serve as the portfolio managers of the International Equity Portfolio. Mr. Roll has held his position since October 2004, Mr. Walsh has held his position since January 2001, Mr. Lloyd has held his position since June 2014, Mr. Todd has held his position since January 2017, and Mr. West has held his position since June 2014. Messrs. Roll and Walsh are the lead portfolio managers.
PURCHASE AND SALE OF PORTFOLIO SHARES
Institutional Class Z shares are only available to certain eligible investors and the minimum initial investment is $10 million. Additional purchases may be for any amount. Please see the description of eligible investors under the section called “Shareholder Information”. You may purchase or redeem (sell) shares of the Portfolio on any business day through certain authorized brokers and other financial intermediaries or directly from the Portfolio by mail, telephone or wire.
TAX CONSIDERATIONS
The Portfolio’s distributions are generally taxable to you as ordinary income, capital gains, or a combination of the two, unless you are investing through a tax-deferred arrangement, such as a 401(k) plan or an individual retirement account. Upon withdrawal, your investment through a tax-deferred arrangement may become taxable.
PAYMENTS TO BROKERS-DEALERS AND OTHER FINANCIAL INTERMEDIARIES
If you purchase Institutional Class Z shares through a broker-dealer or other financial intermediary (such as a bank), the Portfolio will not pay the intermediary for the sale of Institutional Class Z shares or any other related services. It is not anticipated that any of the Portfolio’s related companies will make such payments, but if a related company does, the payments may create a conflict of interest by influencing the broker-dealer or other intermediary and your salesperson to recommend the Portfolio over another investment. Ask your salesperson or visit your financial intermediary’s website for more information.
| 7 |
PORTFOLIO SUMMARY | INTERNATIONAL EQUITY RESEARCH PORTFOLIO
| |
INVESTMENT OBJECTIVE
The International Equity Research Portfolio (the “Portfolio”) seeks long-term capital appreciation through investments in equity securities of companies based outside the United States.
PORTFOLIO FEES AND EXPENSES
This table describes the fees and expenses that you may pay if you buy and hold Institutional Class Z shares of the Portfolio.
SHAREHOLDER FEES (fees paid directly from your investment) | ||||
| Maximum Sales Charge (Load) Imposed on Purchases (as a percentage of offering price) | None | |||
| Redemption Fee (as a percentage of amount redeemed within 90 days or less from the date of purchase) | 2.00% | |||
ANNUAL PORTFOLIO OPERATING EXPENSES (expenses that you pay each year as a percentage of the | ||||
| Management Fees | 0.75% | |||
| Distribution (12b-1) Fees | None | |||
| Other Expenses1 | 1.13% | |||
| Total Annual Portfolio Operating Expenses | 1.88% | |||
| Fee Waiver and/or Expense Reimbursement2 | -0.98% | |||
| Total Annual Portfolio Operating Expenses After Fee Waiver and/or Expense Reimbursement2 | 0.90% | |||
1Other expenses are estimated based on estimated amounts for the current fiscal year. 2Harding Loevner LP has contractually agreed to waive a portion of its management fee and/or reimburse the Portfolio’s Institutional Class Z for its other operating expenses to the extent Total Annual Portfolio Operating Expenses (excluding dividend expenses, borrowing costs, interest expense relating to short sales, interest, taxes, brokerage commissions and extraordinary expenses), as a percentage of average daily net assets, exceed 0.90% through February 28, 2018 |
| |||
Example: This example is intended to help you compare the cost of investing in the Portfolio’s Institutional Class Z with the cost of investing in other mutual funds. The example assumes that you invest $10,000 in the Portfolio’s Institutional Class Z shares for the time periods indicated and then redeem all of your shares at the end of those periods. The example also assumes that your investment has a 5% return each year and that the Institutional Class Z’s operating expenses remain the same, except that the example assumes the fee waiver and expense reimbursement agreement pertains only through February 28, 2018. Although your actual costs may be higher or lower, based on these assumptions your costs would be:
| 1 YEAR | 3 YEARS | 5 YEARS | 10 YEARS | |||
| $92 | $496 | $925 | $2,121 |
PORTFOLIO TURNOVER
The Portfolio pays transaction costs, such as commissions, when it buys and sells securities (or “turns over” its portfolio). A higher portfolio turnover rate may indicate higher transaction costs and may result in higher taxes when Portfolio shares are held in a taxable account. These costs, which are not reflected in annual portfolio operating expenses or in the Example, affect the Portfolio’s performance. During the most recent fiscal year, the Portfolio’s portfolio turnover rate was 33% of the average value of its portfolio.
PRINCIPAL INVESTMENT STRATEGIES
The Portfolio invests primarily in companies based in developed markets outside the United States as well as in established companies in emerging and frontier markets. Harding Loevner LP (“Harding Loevner”), the Portfolio’s investment adviser, undertakes fundamental research in an effort to identify companies that are well managed, financially sound, fast growing and strongly competitive and whose shares are under-priced relative to estimates of their value. The investment adviser’s analysts, after completing this research, assign a rating to each stock based upon its potential return relative to an appropriate benchmark. The universe of stocks eligible for investment in the Portfolio are those rated for purchase by the analysts and that otherwise meet the investment characteristics and guidelines established for the Portfolio. These guidelines include limits on exposure by geography, industry and currency, and may include other limits, such as market capitalization. To reduce its volatility, the Portfolio is diversified across these elements. The Portfolio may invest in companies in all capitalization ranges, including smaller and medium-sized companies.
The investment adviser expects that a majority of the stocks that its analysts have rated for purchase that meet the Portfolio’s investment characteristics and guidelines will be held in the Portfolio. The portfolio managers may exclude any stock in their discretion based on factors such as trading volumes, market capitalization or geography. In determining the weight of each security in the Portfolio, the portfolio managers will seek to maintain a portfolio that, over time, is generally less volatile than the Portfolio’s benchmark, taking into consideration factors including the relevant security’s predicted relative price performance, the timeliness of investment potential, the implications for portfolio risk and the requirement to observe the investment characteristics and guidelines established for the Portfolio. The portfolio managers will periodically re-balance the portfolio when and as they deem appropriate, to reflect, among other things, changes to securities prices, analysts’ ratings, desired investment characteristics, investment guidelines or assumptions about prospective volatility or tracking error. The
| 8 |
average annual total returns compare with a broad measure of market performance. Together, these provide an indication of the risks of investing in the Portfolio. How the Portfolio’s Institutional Class has performed in the past (before and after taxes) is not necessarily an indication of how the Portfolio’s Institutional Class Z will perform in the future.
Updated Portfolio performance information is available at www.hardingloevnerfunds.com or by calling (877) 435-8105.
INTERNATIONAL EQUITY RESEARCH PORTFOLIO

The best calendar quarter return during the period shown above was 6.70% in the 3rd quarter of 2016; the worst was -4.08% in the 4th quarter of 2016.
AVERAGE ANNUAL TOTAL RETURNS (for the periods ended December 31, 2016) | ||||||||
| 1-YEAR | SINCE INCEPTION 12/17/15 | |||||||
| INTERNATIONAL EQUITY RESEARCH PORTFOLIO - INSTITUTIONAL CLASS | ||||||||
Return Before Taxes | 7.95% | 8.16% | ||||||
Return After Taxes on Distributions1 | 7.38% | 7.61% | ||||||
Return After Taxes on Distributions and Sale of Portfolio Shares1 | 5.51% | 6.51% | ||||||
| MSCI ALL COUNTRY WORLD ex-U.S. (NET) INDEX (reflects no deduction for fees, expenses, or U.S. taxes) | 4.50% | 5.01% | ||||||
| 1After-tax returns in the table above are calculated using the historical highest individual federal marginal income tax rates and do not reflect the impact of state and local taxes. Actual after-tax returns depend on an investor’s tax situation and may differ from those shown, and after-tax returns shown are not relevant to investors who hold their Portfolio shares through tax-deferred arrangements, such as 401(k) plans or Individual Retirement Accounts. | ||||||||
MANAGEMENT
Investment Adviser
Harding Loevner serves as investment adviser to the Portfolio.
Portfolio Managers
Andrew West and Moon Surana serve as the portfolio managers of the International Equity Research Portfolio. Mr. West has been a Portfolio Manager with Harding Loevner since June 2014. Ms. Surana has been an Associate Portfolio Manager with Harding Loevner since June 2015.
PURCHASE AND SALE OF PORTFOLIO SHARES
Institutional Class Z shares are only available to certain eligible investors and the minimum initial investment is $10 million. Additional purchases may be for any amount. Please see the description of eligible investors under the section called “Shareholder Information”. You may purchase or redeem (sell) shares of the Portfolio on any business day through certain authorized brokers and other financial intermediaries or directly from the Portfolio by mail, telephone or wire.
TAX CONSIDERATIONS
The Portfolio’s distributions are generally taxable to you as ordinary income, capital gains, or a combination of the two, unless you are investing through a tax-deferred arrangement, such as a 401(k) plan or an individual retirement account. Upon withdrawal, your investment through a tax-deferred arrangement may become taxable.
PAYMENTS TO BROKERS-DEALERS AND OTHER FINANCIAL INTERMEDIARIES
If you purchase Institutional Class Z shares through a broker-dealer or other financial intermediary (such as a bank), the Portfolio will not pay the intermediary for the sale of Institutional Class Z shares or any other related services. It is not anticipated that any of the Portfolio’s related companies will make such payments, but if a related company does, the payments may create a conflict of interest by influencing the broker-dealer or other intermediary and your salesperson to recommend the Portfolio over another investment. Ask your salesperson or visit your financial intermediary’s website for more information.
| 10 |
SUMMARY |
| |
The Investor Class of the Emerging Markets Portfolio is not currently available.
INVESTMENT OBJECTIVE
The Emerging Markets Portfolio (the “Portfolio”) seeks long-term capital appreciation through investments in equity securities of companies based in emerging markets.
PORTFOLIO FEES AND EXPENSES
This table describes the fees and expenses that you may pay if you buy and hold shares of the Investor Class of the Portfolio.
SHAREHOLDER FEES (fees paid directly from your investment) | ||||
| Maximum Sales Charge (Load) Imposed On Purchases (as a percentage of offering price) | None | |||
| Redemption Fee (as a percentage of amount redeemed within 90 days or less from the date of purchase) | 2.00% | |||
ANNUAL PORTFOLIO OPERATING EXPENSES (expenses that you pay each year as a percentage of the | ||||
| Management Fees | 1.13% | |||
| Distribution (12b-1) Fees | 0.25% | |||
| OtherExpenses1 | 0.29% | |||
| Total Annual Portfolio Operating Expenses | 1.67% | |||
| Fee Waiver and/or ExpenseReimbursement2 | 0.00% | |||
| Total Annual Portfolio Operating Expenses After Fee Waiver and/or ExpenseReimbursement2 | 1.67% | |||
1Other expenses are estimated based on current expenses of the Advisor Class. 2Harding Loevner LP has contractually agreed to waive a portion of its management fee and/or reimburse the Investor Class of the Portfolio for its other operating expenses to the extent Total Annual Portfolio Operating Expenses (excluding dividend expenses, borrowing costs, interest expense relating to short sales, interest, taxes, brokerage commissions and extraordinary expenses), as a percentage of average daily net assets, exceed 1.75% through February 28, 2017. |
| |||
Example: This example is intended to help you compare the cost of investing in the Investor Class of the Portfolio with the cost of investing in other mutual funds. The example assumes that you invest $10,000 in the Investor Class of the Portfolio for the time periods indicated and then redeem all of your shares at the end of those periods. The example also assumes that your investment has a 5% return each year and that the Investor Class’s operating expenses remain the same. Although your actual costs may be higher or lower, based on these assumptions your costs would be:
| 1 YEAR | 3 YEARS | 5 YEARS | 10 YEARS | |||
| $170 | $526 | $907 | $1,976 |
PORTFOLIO TURNOVER
The Portfolio pays transaction costs, such as commissions, when it buys and sells securities (or “turns over” its portfolio). A higher portfolio turnover rate may indicate higher transaction costs and may result in higher taxes when Portfolio shares are held in a taxable account. These costs, which are not reflected in annual portfolio operating expenses or in the Example, affect the Portfolio’s performance. During the most recent fiscal year, the Portfolio’s portfolio turnover rate was 26% of the average value of its portfolio.
PRINCIPAL INVESTMENT STRATEGIES
The Portfolio invests primarily in companies that are based in emerging and frontier markets. Emerging and frontier markets offer investment opportunities that arise from long-term trends in demographics, deregulation, offshore outsourcing and improving corporate governance in developing countries. Harding Loevner LP (“Harding Loevner”), the Portfolio’s investment adviser, undertakes fundamental research in an effort to identify companies that are well managed, financially sound, fast growing and strongly competitive, and whose shares are under-priced relative to estimates of their value. To reduce its volatility, the Portfolio is diversified across dimensions of geography, industry and currency. The Portfolio normally holds investments across at least 15 countries. Emerging and frontier markets include countries that have an emerging stock market as defined by Morgan Stanley Capital International, countries or markets with low- to middle-income economies as classified by the World Bank, and other countries or markets with similar characteristics. Emerging and frontier markets tend to have relatively low gross national product per capita compared to the world’s major economies and may have the potential for rapid economic growth.
Factors bearing on whether a company is considered to be “based” in an emerging or frontier market may include: (1) it is legally domiciled in an emerging or frontier market; (2) it conducts at least 50% of its business, as measured by the location of its sales, earnings, assets, or production, in an emerging or frontier market; or (3) it has the principal exchange listing for its securities in an emerging or frontier market.
The Portfolio will invest broadly in equity securities of companies domiciled in one of at least 15 countries with emerging or frontier markets, generally considered to include all countries except Australia, Austria, Belgium, Canada, Denmark, Finland, France, Germany, Hong Kong, Ireland, Israel, Italy, Japan, the Netherlands, New Zealand, Norway, Portugal, Singapore, Spain, Sweden, Switzerland, the United Kingdom and the United States. At least 65% of the Portfolio’s total assets will be denominated in at least three currencies other than the
| 2 |
Updated Portfolio performance information is available at www.hardingloevnerfunds.com or by calling (877) 435-8105.
EMERGING MARKETS PORTFOLIO
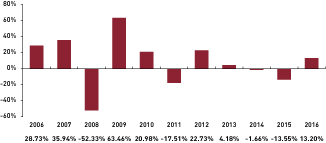
The best calendar quarter return during the period shown above was 32.85% in the second quarter of 2009; the worst was -27.99% in the fourth quarter of 2008.
AVERAGE ANNUAL TOTAL RETURNS (for the periods ended December 31, 2016) | ||||||||||||
| 1-YEAR | 5-YEAR | 10-YEAR | ||||||||||
| EMERGING MARKETS PORTFOLIO - ADVISOR CLASS | ||||||||||||
Return Before Taxes | 13.20% | 4.24% | 2.66% | |||||||||
Return After Taxes onDistributions1 | 13.19% | 3.67% | 2.27% | |||||||||
Return After Taxes on Distributions and Sale of PortfolioShares1 | 7.75% | 3.53% | 2.32% | |||||||||
| MSCI Emerging Markets (net) Index (reflects no deduction for fees, expenses, or U.S. taxes) | 11.20% | 1.27% | 1.83% | |||||||||
| 1After-tax returns in the table above are calculated using the historical highest individual federal marginal income tax rates and do not reflect the impact of state and local taxes. Actual after-tax returns depend on an investor’s tax situation and may differ from those shown, and after-tax returns shown are not relevant to investors who hold their Portfolio shares through tax-deferred arrangements, such as 401(k) plans or Individual Retirement Accounts. | ||||||||||||
MANAGEMENT
Investment Adviser
Harding Loevner serves as investment adviser to the Portfolio.
Portfolio Managers
G. Rusty Johnson, Craig Shaw, Pradipta Chakrabortty, Scott Crawshaw and Richard Schmidt serve as the portfolio managers of the Emerging Markets Portfolio. Mr. Johnson has held his position since the Portfolio’s inception in November 1998, Mr. Shaw has held his position since December 2006, Mr. Chakrabortty has held his position since January 2015, Mr. Crawshaw has held his position since June 2014 and Mr. Schmidt has held his position since December 2011. Messrs. Johnson and Shaw are the lead portfolio managers.
PURCHASE AND SALE OF PORTFOLIO SHARES
The minimum initial investment in the Investor Class of the Portfolio is $5,000. Additional purchases may be for any amount. You may purchase or redeem (sell) shares of the Portfolio on any business day through certain authorized brokers and other financial intermediaries or directly from the Portfolio by mail, telephone or wire.
Effective as of the close of business on June 30, 2016, the Portfolio is generally closed to new investors. Current investors will continue to be permitted to purchase shares and certain other investors may still be eligible to purchase shares. For more information, see the section “Shareholder Information—Purchase and Redemption of Shares.”
TAX CONSIDERATIONS
The Portfolio’s distributions are generally taxable to you as ordinary income, capital gains, or a combination of the two, unless you are investing through a tax-deferred arrangement, such as a 401(k) plan or an individual retirement account. Upon withdrawal, your investment through a tax-deferred arrangement may become taxable.
PAYMENTS TO BROKERS-DEALERS AND OTHER FINANCIAL INTERMEDIARIES
If you purchase Portfolio shares through a broker-dealer or other financial intermediary (such as a bank), the Portfolio and its related companies may pay the intermediary for the sale of Portfolio shares and related services. These payments may create a conflict of interest by influencing the broker-dealer or other intermediary and your salesperson to recommend the Portfolio over another investment. Ask your salesperson or visit your financial intermediary’s website for more information.
| 4 |