Exhibit 13
Five-Year Summary
| (dollars in millions, except per share amounts) | 2018 | 2017 | 2016 | 2015 | 2014 | ||||||||||||||
| For The Year | |||||||||||||||||||
| Net sales | $ | 66,501 | $ | 59,837 | $ | 57,244 | $ | 56,098 | $ | 57,900 | |||||||||
| Research and development | 2,462 | 2,427 | 2,376 | 2,262 | 2,489 | ||||||||||||||
| Restructuring costs | 307 | 253 | 290 | 396 | 354 | ||||||||||||||
Net income from continuing operations 1 | 5,654 | 4,920 | 5,436 | 4,356 | 6,468 | ||||||||||||||
Net income from continuing operations attributable to common shareowners 1 | 5,269 | 4,552 | 5,065 | 3,996 | 6,066 | ||||||||||||||
| Basic earnings per share—Net income from continuing operations attributable to common shareowners | 6.58 | 5.76 | 6.19 | 4.58 | 6.75 | ||||||||||||||
| Diluted earnings per share—Net income from continuing operations attributable to common shareowners | 6.50 | 5.70 | 6.13 | 4.53 | 6.65 | ||||||||||||||
| Cash dividends per common share | 2.84 | 2.72 | 2.62 | 2.56 | 2.36 | ||||||||||||||
| Average number of shares of Common Stock outstanding: | |||||||||||||||||||
| Basic | 800 | 790 | 818 | 873 | 898 | ||||||||||||||
| Diluted | 810 | 799 | 826 | 883 | 912 | ||||||||||||||
| Cash flows provided by operating activities of continuing operations | 6,322 | 5,631 | 6,412 | 6,755 | 6,979 | ||||||||||||||
Capital expenditures 2 | 1,902 | 2,014 | 1,699 | 1,652 | 1,594 | ||||||||||||||
| Acquisitions, including debt assumed & equity issued | 31,142 | 231 | 712 | 556 | 530 | ||||||||||||||
Repurchases of Common Stock 3 | 325 | 1,453 | 2,254 | 10,000 | 1,500 | ||||||||||||||
| Dividends paid on Common Stock (excluding ESOP) | 2,170 | 2,074 | 2,069 | 2,184 | 2,048 | ||||||||||||||
| At Year End | |||||||||||||||||||
Working capital 2, 4 | $ | 4,135 | $ | 8,467 | $ | 6,644 | $ | 4,088 | $ | 5,921 | |||||||||
Total assets 2 | 134,211 | 96,920 | 89,706 | 87,484 | 86,338 | ||||||||||||||
Long-term debt, including current portion 2, 5 | 44,068 | 27,093 | 23,300 | 19,499 | 19,575 | ||||||||||||||
Total debt 2, 5 | 45,537 | 27,485 | 23,901 | 20,425 | 19,701 | ||||||||||||||
Total debt to total capitalization 5 | 53 | % | 47 | % | 45 | % | 41 | % | 38 | % | |||||||||
Total equity 5, 6 | 40,610 | 31,421 | 29,169 | 28,844 | 32,564 | ||||||||||||||
Number of employees 7 | 240,200 | 204,700 | 201,600 | 197,200 | 211,500 | ||||||||||||||
| Note 1 | 2018 amounts include unfavorable tax charges of approximately $744 million primarily related to non U.S. taxes that will become due when earnings of certain international subsidiaries are remitted, a $300 million pre-tax charge resulting from customer contract matters, partially offset by a $799 million pre-tax gain on the sale of Taylor. 2017 amounts include unfavorable tax charges of approximately $690 million related to U.S. tax reform legislation enacted in December, 2017, commonly referred to as the Tax Cuts and Jobs Act of 2017 (TCJA) and a $196 million pre-tax charge resulting from customer contract matters, partially offset by pre-tax gains of approximately $500 million on sales of available for sale securities. 2016 amounts include a $423 million pre-tax pension settlement charge resulting from defined benefit plan de-risking actions. 2015 amounts include pre-tax charges of: $867 million as a result of a settlement with the Canadian government, $295 million from customer contract negotiations at Collins Aerospace Systems, and $237 million related to pending and future asbestos claims. |
| Note 2 | Excludes assets and liabilities of discontinued operations held for sale, for all periods presented. |
| Note 3 | The decrease in share repurchases in 2018 is due to the temporary suspension of activity in connection with the acquisition of Rockwell Collins announced on September 4, 2017, excluding activity relating to our employee savings plans. Share repurchases in 2015 include share repurchases under accelerated repurchase agreements of $2.6 billion in the first quarter of 2015 and $6.0 billion in the fourth quarter of 2015. |
| Note 4 | Working capital in 2018 includes the addition of contract assets and liabilities of $3.5B and $5.7B, respectively in accordance with the New Revenue Standard as well as an increase in current borrowings of $1.8 billion. Working capital in 2015 includes approximately $2.4 billion of taxes payable related to the gain on the sale of Sikorsky, which were paid in 2016. As compared with 2014, 2015 working capital also reflects the reclassification of current deferred tax assets and liabilities to non-current assets and liabilities in connection with the adoption of Accounting Standards Update 2015-17. |
| Note 5 | The increase in the 2018 debt to total capitalization ratio primarily reflects additional borrowings in 2018 used to finance the acquisition of Rockwell Collins. The increase in the 2017 and 2016 debt to total capitalization ratio primarily reflects additional borrowings to fund share repurchases, 2017 discretionary pension contributions, and for general corporate purposes. |
| Note 6 | The increase in total equity in 2018 is due to UTC common stock issued as Merger Consideration for Rockwell Collins. The decrease in total equity in 2015, as compared with 2014, reflects the sale of Sikorsky and the share repurchase program. The decrease in total equity in 2014, as compared with 2013, reflects unrealized losses of approximately $2.9 billion, net of taxes, associated with the effect of market conditions on our pension plans. |
| Note 7 | The increase in employees in 2018 is due to the addition of approximately 30,000 of Rockwell Collins employees. The decrease in employees in 2015, as compared with 2014, primarily reflects the 2015 divestiture of Sikorsky. |
1
Management's Discussion and Analysis of Financial Condition and Results of Operations
BUSINESS OVERVIEW
We are a global provider of high technology products and services to the building systems and aerospace industries. Our operations for the periods presented herein are classified into four principal business segments: Otis, Carrier (formerly referred to as UTC Climate, Controls & Security), Pratt & Whitney, and Collins Aerospace Systems (a combination of the segment formerly referred to as UTC Aerospace Systems and Rockwell Collins). Otis and Carrier are referred to as the "commercial businesses," while Pratt & Whitney and Collins Aerospace Systems are referred to as the "aerospace businesses."
On November 26, 2018, we announced the completion of the acquisition of Rockwell Collins and our intention to separate our commercial businesses into independent entities. The separation will result in three global, industry-leading companies:
| • | United Technologies, comprised of Collins Aerospace Systems and Pratt & Whitney, will be the preeminent systems supplier to the aerospace and defense industry; |
| • | Otis, the world's leading manufacturer of elevators, escalators and moving walkways; and |
| • | Carrier, a global provider of HVAC, refrigeration, building automation, fire safety and security products with leadership positions across its portfolio. |
The proposed separations are expected to be effected through spin-offs of Otis and Carrier that are intended to be tax-free for the Company’s shareowners for U.S. federal income tax purposes, and are expected to be completed by mid-year 2020. Separation of Otis and Carrier from UTC via spin-off transactions will be subject to the satisfaction of customary conditions, including, among others, final approval by the Company’s Board of Directors, receipt of tax rulings in certain jurisdictions and/or a tax opinion from external counsel (as applicable), the filing with the Securities and Exchange Commission (SEC) and effectiveness of Form 10 registration statements, and satisfactory completion of financing.
The commercial businesses generally serve customers in the worldwide commercial and residential property industries, with Carrier also serving customers in the commercial and transport refrigeration industries. The aerospace businesses serve commercial and government aerospace customers in both the original equipment and aftermarket parts and services markets. Our consolidated net sales were derived from the commercial and aerospace businesses as follows:
| 2018 | 2017 | 2016 | ||||||
| Commercial and industrial | 47 | % | 50 | % | 50 | % | ||
| Military aerospace and space | 14 | % | 13 | % | 12 | % | ||
| Commercial aerospace | 39 | % | 37 | % | 38 | % | ||
| 100 | % | 100 | % | 100 | % | |||
Our consolidated net sales were derived from original equipment manufacturing (OEM) and aftermarket parts and services as follows:
| 2018 | 2017 | 2016 | ||||||
| OEM | 54 | % | 53 | % | 55 | % | ||
| Aftermarket parts and services | 46 | % | 47 | % | 45 | % | ||
| 100 | % | 100 | % | 100 | % | |||
Our worldwide operations can be affected by industrial, economic and political factors on both a regional and global level. Our operations include original equipment manufacturing and extensive related aftermarket parts and services in both our commercial and aerospace businesses. Our business mix also reflects the combination of shorter cycles at Carrier and in our commercial aerospace spares businesses, and longer cycles at Otis and in our aerospace OEM and aftermarket maintenance businesses. Our customers are in both the public and private sectors, and our businesses reflect an extensive geographic diversification that has evolved with continued globalization. Refer to Note 19 of the Consolidated Financial Statements for additional discussion of sales attributed to geographic regions.
As part of our growth strategy, we invest in businesses in certain countries that carry high levels of currency, political and/or economic risk, such as Argentina, Brazil, China, India, Indonesia, Mexico, Poland, Russia, South Africa, Turkey, Ukraine and countries in the Middle East. As of December 31, 2018, the net assets in any one of these countries did not exceed 5% of consolidated shareowners' equity.
In a referendum on June 23, 2016, voters in the United Kingdom (the U.K.) voted in favor of the U.K.'s exiting the European Union (the EU). The manner in which the U.K. decides to exit the EU could have negative macroeconomic consequences. Our 2018 full year sales in and from the U.K. were approximately $3 billion and represented less than 5% of our
2
overall sales, and we do not believe the U.K.'s withdrawal from the EU will significantly impact our businesses in the near term.
Organic sales growth was 8% in 2018, reflecting growth across all segments driven by:
| • | higher commercial aftermarket, commercial OEM, and military sales at Pratt & Whitney |
| • | higher commercial aftermarket and military sales, and higher commercial aerospace OEM sales at Collins Aerospace Systems |
| • | growth in North America residential HVAC, global commercial HVAC, and transport refrigeration sales at Carrier |
| • | higher Otis service sales in North America and Asia, and higher Otis new equipment sales in Europe, Asia excluding China, and North America, partially offset by a decline in China |
We expect organic sales growth in 2019 to be 3% to 5%, with foreign exchange expected to have an unfavorable impact of approximately 1%. We continue to invest in new platforms and new markets to position the Company for long-term growth, while remaining focused on innovation, structural cost reduction, disciplined capital allocation and execution to meet or exceed customer and shareowner commitments.
As discussed below in "Results of Operations," operating profit in both 2018 and 2017 includes the impact from activities that are not expected to recur often or that are not otherwise reflective of the underlying operations, such as the beneficial impact of net gains from sales of investments, the unfavorable impact of contract matters with customers, transaction, acquisition and integration costs, and other significant non-recurring and non-operational items. Our earnings growth strategy contemplates earnings from organic sales growth, including growth from new product development and product improvements, structural cost reductions, operational improvements, and incremental earnings from our investments in acquisitions.
As noted above, on November 26, 2018, pursuant to the terms and conditions of the previously announced Agreement and Plan of Merger, dated September 4, 2017 (the “Merger Agreement”), among United Technologies Corporation (the “Company”), Riveter Merger Sub Corp., a Delaware corporation and a wholly owned subsidiary of the Company (“Merger Sub”), and Rockwell Collins, Inc. (“Rockwell Collins”), Merger Sub merged with and into Rockwell Collins (the “Merger”), with Rockwell Collins continuing as the surviving corporation of the Merger. As a result of the Merger, Rockwell Collins has become a wholly owned subsidiary of the Company and each share of common stock, par value $0.01 per share, of Rockwell Collins issued and outstanding immediately prior to the effective time of the Merger (the “Effective Time”) (other than shares held by Rockwell Collins, the Company, Merger Sub or any of their respective wholly owned subsidiaries) was converted into the right to receive (1) $93.33 in cash, without interest, and (2) .37525 shares of Company common stock (together, the “Merger Consideration”), less any applicable withholding taxes, with cash paid in lieu of fractional shares. At the Effective Time, each then-outstanding Rockwell Collins stock option was canceled in exchange for the right to receive the Merger Consideration in respect of each net option share subject to such option, less applicable tax withholding, with the number of net option shares calculated by subtracting from the total number of shares subject to such option a number of shares with a value equal to the aggregate applicable exercise price. At the Effective Time, each then-outstanding Rockwell Collins restricted stock award, and each Rockwell Collins restricted stock unit award, whether performance-based or time-based, granted prior to the date of the Merger Agreement or to a non-employee director of Rockwell Collins, became fully vested and was canceled in exchange for the right to receive the Merger Consideration in respect of each share of Rockwell Collins common stock subject to such award (with the number of shares subject to any performance-based restricted stock unit award deemed to be equal to the target number of shares), less applicable tax withholding. At the Effective Time, each then-outstanding Rockwell Collins restricted stock unit award, whether performance-based or time-based, granted on or after the date of the Merger Agreement was assumed by the Company and converted into a time-based restricted stock unit award of the Company with an equivalent value (as calculated in accordance with the formula set forth in the Merger Agreement, and with any performance-based restricted stock unit award deemed to be achieved at target level). At the Effective Time, each then-outstanding Rockwell Collins deferred stock unit award that was payable by its terms upon the consummation of the Merger was canceled in consideration for the right to receive (i) if payable in cash by its terms, a lump sum cash payment equal to the product of the value of the Merger Consideration and the number of shares of Rockwell Collins common stock relating to such deferred stock unit award, less applicable tax withholding, or (ii) if payable in shares by its terms, the Merger Consideration in respect of each share of Rockwell Collins common stock subject to such award, less applicable tax withholding. At the Effective Time, each then-outstanding Rockwell Collins deferred stock unit award that was not payable by its terms upon the consummation of the Merger was assumed by the Company and converted into a deferred stock unit award of the Company with an equivalent value (as calculated in accordance with the formula set forth in the Merger Agreement).
The total aggregate consideration payable in the Merger was $15.5 billion in cash and 62.2 million shares of Company common stock. In addition, $7.8 billion of Rockwell Collins debt was outstanding at the time of the Merger.
3
In total, our investments in businesses in 2018 and 2017 totaled $31,142 million (including debt assumed of $7,784 million and stock issued of $7,960 million) and $231 million, respectively. In addition to Rockwell Collins, acquisitions completed in 2018 primarily include an acquisition at Carrier and at Pratt & Whitney. Our investments in businesses in 2017 included a number of small acquisitions primarily in our commercial businesses.
Both acquisition and restructuring costs associated with business combinations are expensed as incurred. Depending on the nature and level of acquisition activity, earnings could be adversely impacted due to acquisition and restructuring actions initiated in connection with the integration of businesses acquired. For additional discussion of acquisitions and restructuring, see "Liquidity and Financial Condition," "Restructuring Costs" and Notes 2 and 13 to the Consolidated Financial Statements.
On December 22, 2017 Public Law 115-97 “An Act to Provide for Reconciliation Pursuant to Titles II and V of the Concurrent Resolution on the Budget for Fiscal Year 2018” was enacted. This law is commonly referred to as the Tax Cuts and Jobs Act of 2017 (TCJA). We may consider future opportunities for repatriation of our non-U.S. earnings, and accelerated de-leveraging, in addition to investments in our operations, limited additional share repurchases to offset the effects of dilution related to our stock-based compensation programs - see Note 12.
Discontinued Operations
On November 6, 2015, we completed the sale of Sikorsky to Lockheed Martin Corp. for approximately $9.1 billion in cash. As noted above, the results of operations and the related cash flows of Sikorsky have been reclassified to Discontinued Operations in our Consolidated Statements of Operations, Comprehensive Income and Cash Flows for all periods presented. Proceeds from the sale were used to fund $6 billion of share repurchases through accelerated share repurchase (ASR) agreements entered into on November 11, 2015. In connection with the sale of Sikorsky, we made tax payments of approximately $2.5 billion in 2016. Net income from discontinued operations attributable to common shareowners for the year ended December 31, 2016 reflects the final purchase price adjustment for the sale of Sikorsky, and the net effects of filing Sikorsky's 2015 tax returns.
RESULTS OF OPERATIONS
Net Sales
| (dollars in millions) | 2018 | 2017 | 2016 | ||||||||
| Net sales | $ | 66,501 | $ | 59,837 | $ | 57,244 | |||||
| Percentage change year-over-year | 11 | % | 5 | % | 2 | % | |||||
The factors contributing to the total percentage change year-over-year in total net sales are as follows:
| 2018 | 2017 | ||||
| Organic volume | 8 | % | 4 | % | |
| Foreign currency translation | 1 | % | — | ||
| Acquisitions and divestitures, net | 1 | % | 1 | % | |
| Other | 1 | % | — | ||
| Total % Change | 11 | % | 5 | % | |
All four segments experienced organic sales growth during 2018. Pratt & Whitney sales grew 14% organically, reflecting higher commercial aftermarket, commercial OEM, and military sales. Collins Aerospace Systems grew 8% organically, driven by higher commercial aftermarket and military sales, and higher commercial OEM sales. Organic sales growth of 6% at Carrier was driven by growth in North America residential HVAC, global commercial HVAC, and transport refrigeration sales. Otis sales grew 3% organically, reflecting higher service sales in North America and Asia, and higher new equipment sales in Europe, Asia excluding China, and North America, partially offset by a decline in China.
All four segments also experienced organic sales growth during 2017. Pratt & Whitney sales were up 9% organically, reflecting higher commercial aftermarket sales and higher military sales, partially offset by lower commercial engine sales. Organic sales at Carrier increased 4%, driven by growth in North America residential HVAC, global commercial HVAC, and commercial refrigeration sales. Organic sales at Collins Aerospace Systems grew 2%, primarily driven by an increase in commercial aerospace aftermarket sales partially offset by lower commercial aerospace OEM sales. Otis sales increased 2% organically, reflecting higher service sales in North America and Asia, and higher new equipment sales growth in North America and Europe, partially offset by a decline in China.
4
Cost of Products and Services Sold
| (dollars in millions) | 2018 | 2017 | 2016 | ||||||||
| Total cost of products and services sold | $ | 49,985 | $ | 44,201 | $ | 41,471 | |||||
| Percentage change year-over-year | 13 | % | 7 | % | 3 | % | |||||
The factors contributing to the total percentage change year-over-year in total cost of products and services sold are as follows:
| 2018 | 2017 | ||||
| Organic volume | 9 | % | 7 | % | |
| Foreign currency translation | 1 | % | — | ||
| Acquisitions and divestitures, net | 1 | % | — | ||
| Other | 2 | % | — | ||
| Total % Change | 13 | % | 7 | % | |
The organic increase in total cost of products and services sold in 2018 was primarily driven by the organic sales increases noted above. The 2% increase in Other primarily reflects the impact of the adoption of the New Revenue Standard (1%) and a customer contract settlement at Pratt & Whitney (1%), partially offset by the absence of a prior year customer contract matter at Pratt & Whitney.
The organic increase in total cost of products and services sold in 2017 was primarily driven by the organic sales increases noted above and higher negative engine margin at Pratt & Whitney due to unfavorable mix and ramp-related costs.
Gross Margin
| (dollars in millions) | 2018 | 2017 | 2016 | ||||||||
| Gross margin | $ | 16,516 | $ | 15,636 | $ | 15,773 | |||||
| Percentage of net sales | 24.8 | % | 26.1 | % | 27.6 | % | |||||
The 130 basis point decrease in gross margin as a percentage of sales in 2018, includes a 300 basis point decline in Pratt & Whitney's gross margin driven by the unfavorable year-over-year impact of customer contract matters and higher negative engine margin from higher engine deliveries. Collins Aerospace Systems' gross margin declined 40 basis points as the benefits of higher commercial aftermarket volumes and cost reduction were more than offset by adverse commercial OEM and military OEM mix, and higher warranty expense. Gross margin at Otis declined 140 basis points largely driven by unfavorable price and mix, primarily in China. These declines were partially offset by a 40 basis point increase in Carrier's gross margin as favorable pricing and the favorable year-over-year impact of contract adjustments related to a large commercial project and a prior year product recall program were partially offset by increased commodities and logistics costs.
The 150 basis point decrease in gross margin as a percentage of sales in 2017, as compared with 2016, primarily reflects a 170 basis point decline in Pratt & Whitney's gross margin driven by higher negative engine margin due to unfavorable mix and ramp related costs; a 180 basis point decline in gross margin at Otis driven by unfavorable price and mix, primarily in China; and a 150 basis point decline in gross margin at Carrier reflecting adverse price and mix and the unfavorable impact of a product recall program. These decreases were partially offset by a 10 basis point increase in gross margin at Collins Aerospace driven by higher commercial aftermarket volumes.
Research and Development
| (dollars in millions) | 2018 | 2017 | 2016 | ||||||||
| Company-funded | $ | 2,462 | $ | 2,427 | $ | 2,376 | |||||
| Percentage of net sales | 3.7 | % | 4.1 | % | 4.2 | % | |||||
| Customer-funded | $ | 1,517 | $ | 1,514 | $ | 1,405 | |||||
| Percentage of net sales | 2.3 | % | 2.5 | % | 2.5 | % | |||||
Research and development spending is subject to the variable nature of program development schedules and, therefore, year-over-year variations in spending levels are expected. The majority of the company-funded spending is incurred by the aerospace businesses and relates largely to the next generation engine product family at Pratt & Whitney and the Embraer E-Jet E2, Airbus A320neo, Bombardier Global 7500, Mitsubishi Regional Jet, and Airbus A350 programs at Collins Aerospace
5
Systems. In 2018, company-funded research and development increased 1% over the prior year. This increase was primarily driven by Collins Aerospace (1%) as higher spend across various commercial programs was largely offset by the deferral of certain development costs as contract fulfillment costs in accordance with the New Revenue Standard. Company-funded research and development expense at Pratt & Whitney was consistent with the prior year.
Customer-funded research and development was consistent with the prior year, as a decrease at Collins Aerospace Systems, primarily driven by the deferral of certain development costs as contract fulfillment costs in accordance with the New Revenue Standard, was offset by an increase at Pratt & Whitney, primarily driven by higher research and development expenses on military development programs.
The year-over-year increase in company-funded research and development (2%) in 2017, compared with 2016, is primarily driven by continued investment in new products at Carrier (1%) and increased spending on strategic initiatives at Otis (1%). Customer-funded research and development increased 6% primarily driven by increased spending on U.S. Government development programs at Pratt & Whitney, partially offset by lower spend within Collins Aerospace Systems related to several commercial and military aerospace programs.
Selling, General and Administrative
| (dollars in millions) | 2018 | 2017 | 2016 | ||||||||
| Selling, general and administrative | $ | 7,066 | $ | 6,429 | $ | 5,958 | |||||
| Percentage of net sales | 10.6 | % | 10.7 | % | 10.4 | % | |||||
Selling, general and administrative expenses increased 10% in 2018, but decreased 10 basis points as a percentage of net sales. The increase reflects the impact of incremental selling, general and administrative expenses resulting from the acquisition of Rockwell Collins (1%). In addition, 2018 reflects higher expenses at Collins Aerospace Systems (3%) primarily driven by increased headcount and employee compensation related expenses; an increase at Carrier (2%) primarily driven by employee compensation related expenses; higher expenses at Pratt & Whitney (1%) driven by increased headcount and employee compensation related expenses and costs to support higher volumes; and higher expenses at Otis (1%) resulting from higher labor and information technology costs. The remaining increase includes transaction costs related to the acquisition of Rockwell Collins and the proposed separation of our commercial businesses into independent entities.
Selling, general and administrative expenses increased 8% in 2017 and reflect an increase in expenses related to recent acquisitions (1%) and the impact of higher restructuring expenses (1%). The increase also reflects higher expenses at Pratt & Whitney (2%) driven by increased headcount and employee compensation related expenses; higher expenses at Otis (1%) resulting from higher labor and information technology costs; and higher expenses at Collins Aerospace Systems (1%) and Carrier (3%) primarily driven by employee compensation related expenses.
We are continuously evaluating our cost structure and have implemented restructuring actions as a method of keeping our cost structure competitive. As appropriate, the amounts reflected above include the beneficial impact of restructuring actions on Selling, general and administrative expenses. See Note 13: Restructuring Costs and the Restructuring Costs section of Management's Discussion and Analysis of Financial Condition and Results of Operations for further discussion.
Other Income, Net
| (dollars in millions) | 2018 | 2017 | 2016 | ||||||||
| Other income, net | $ | 1,565 | $ | 1,358 | $ | 782 | |||||
Other income, net includes the operational impact of equity earnings in unconsolidated entities, royalty income, foreign exchange gains and losses as well as other ongoing and infrequently occurring items. The year-over-year increase in Other income, net (15%) is primarily driven by the gain on the sale of Taylor Company (59%), partially offset by the absence of a prior year gain from the sale of Carrier's investments in Watsco, Inc. (28%), lower year-over-year gains on the sale of securities (11%), an impairment of assets related to a previously acquired Collins Aerospace Systems business (4%) and the absence of a prior year gain on the sale of a Carrier business (2%).
Other income, net increased $576 million in 2017, compared with 2016, primarily driven by $379 million of gains resulting from Carrier's sale of its investments in Watsco, Inc. (48%), as well as higher year-over year foreign exchange gains and losses (9%), and higher year-over-year gains on the sale of securities (8%) across the UTC businesses.
6
Interest Expense, Net
| (dollars in millions) | 2018 | 2017 | 2016 | ||||||||
| Interest expense | $ | 1,225 | $ | 1,017 | $ | 1,161 | |||||
| Interest income | (187 | ) | (108 | ) | (122 | ) | |||||
| Interest expense, net | $ | 1,038 | $ | 909 | $ | 1,039 | |||||
| Average interest expense rate - average outstanding borrowings during the year: | |||||||||||
| Short-term borrowings | 1.5 | % | 1.1 | % | 1.3 | % | |||||
| Total debt | 3.5 | % | 3.5 | % | 4.1 | % | |||||
| Average interest expense rate - outstanding borrowings as of December 31: | |||||||||||
| Short-term borrowings | 1.2 | % | 2.3 | % | 0.6 | % | |||||
| Total debt | 3.5 | % | 3.5 | % | 3.7 | % | |||||
Interest expense, net increased 14% in 2018 as compared with 2017. The increase in interest expense reflects the impact of the August 16, 2018 issuance of notes representing $11 billion in aggregate principal; the May 4, 2017 issuance of notes representing $4 billion in aggregate principal; and the May 18, 2018 issuance of Euro-denominated notes representing €2 billion in aggregate principal. These increases were partially offset by the favorable impact of the repayment at maturity of the following: 1.800% notes in June 2017 representing $1.5 billion in aggregate principal; the 6.8% notes in February 2018 representing $99 million of aggregate principal; the Euro-denominated floating rate notes in February 2018 representing €750 million in aggregate principal; and the 1.778% notes in May 2018 representing $1.1 billion of aggregate principal. The average maturity of our long-term debt at December 31, 2018 is approximately 11 years.
The $11 billion in aggregate principal amount of notes issued on August 16, 2018 was primarily used to fund the cash consideration in the acquisition of Rockwell Collins and related fees, expenses and other amounts. The increase in interest income in 2018 as compared with 2017 primarily reflects interest earned on higher cash balances, including interest earned on cash from the $11 billion of notes issued and held prior to funding the acquisition.
The decrease in interest expense during 2017, as compared with 2016, was primarily driven by the absence of a net extinguishment loss of approximately $164 million related to the December 1, 2016 redemption of certain outstanding notes. The unfavorable impact of the May 4, 2017 and November 1, 2016 issuance of notes representing $8 billion in aggregate principal was largely offset by the favorable impact of the significantly lower interest rates on these notes as compared to the 5.375% and 6.125% notes redeemed on December 1, 2016, representing $2.25 billion in aggregate principal, and the favorable impact of these early redemptions and the repayment at maturity of our 1.800% notes due 2017, representing $1.5 billion in aggregate principal. The average maturity of our long-term debt at December 31, 2017 is approximately 11 years. See Note 9 to our Consolidated Financial Statements for further discussion of our borrowing activity.
The year-over-year increase in the weighted-average interest rate for short-term borrowings was primarily driven by increases in LIBOR rates in 2018. The decrease in the weighted-average interest rate for short-term borrowings for 2017 versus 2016 was primarily due to higher average Euro-denominated commercial paper borrowings as compared to 2016. We had no Euro-denominated commercial paper borrowing outstanding at December 31, 2017, resulting in the higher weighted-average interest rate for short-term borrowings as of December 31, 2017, as compared to December 31, 2016.
Income Taxes
| 2018 | 2017 | 2016 | ||||||
| Effective income tax rate | 31.7 | % | 36.6 | % | 23.8 | % | ||
On December 22, 2017 Public Law 115-97 “An Act to Provide for Reconciliation Pursuant to Titles II and V of the Concurrent Resolution on the Budget for Fiscal Year 2018” was enacted. This law is commonly referred to as the Tax Cuts and Jobs Act of 2017 (TCJA).
The 2018 effective tax rate reflects a net charge of $744 million of TCJA related adjustments. The amount primarily relates to non-U.S. taxes that will become due when previously reinvested earnings of certain international subsidiaries are remitted, as discussed in Note 11. The Company has completed its accounting for the TCJA as described in Staff Accounting Bulletin (SAB 118). In 2019, the Company will continue to review and incorporate, as necessary, updates related to forthcoming U.S. Treasury Regulations, other interpretive guidance, and the finalization of the deemed inclusions to be reported on the Company’s 2018 U.S. federal income tax return.
7
The 2017 effective tax rate reflects a tax charge of $690 million attributable to the passage of the TCJA. This amount relates to U.S. income tax attributable to previously undistributed earnings of UTC's international subsidiaries and equity investments, net of foreign tax credits, and the revaluation of U.S. deferred income taxes.
The effective income tax rates for 2017 and 2016 reflect tax benefits associated with lower tax rates on international earnings. The expiration of statutes of limitations during 2017 resulted in a favorable adjustment of $55 million largely offset by the unfavorable impact related to a retroactive Quebec tax law change enacted on December 7, 2017 and the absence of certain credits, tax law changes and audit settlements included in 2016 described below.
The 2016 effective tax rate reflects $206 million of favorable adjustments related to the conclusion of the review by the Examination Division of the Internal Revenue Service of both the UTC 2011 and 2012 tax years and the Goodrich Corporation 2011 and 2012 tax years through the date of its acquisition. In addition, at the end of 2016, France enacted a tax law change reducing its corporate income tax rate which resulted in a tax benefit of $25 million.
For additional discussion of income taxes and the effective income tax rate, see "Critical Accounting Estimates—Income Taxes" and Note 11 to the Consolidated Financial Statements.
Net Income Attributable to Common Shareowners from Continuing Operations
| (dollars in millions, except per share amounts) | 2018 | 2017 | 2016 | ||||||||
| Net income from continuing operations attributable to common shareowners | $ | 5,269 | $ | 4,552 | $ | 5,065 | |||||
| Diluted earnings per share from continuing operations | $ | 6.50 | $ | 5.70 | $ | 6.13 | |||||
To help mitigate the volatility of foreign currency exchange rates on our operating results, we maintain foreign currency hedging programs, the majority of which are entered into by Pratt & Whitney Canada (P&WC). In 2018, foreign currency, including hedging at P&WC, had a favorable impact on our consolidated operational results of $0.02 per diluted share. In 2017, foreign currency, including hedging at P&WC, had a favorable impact on our consolidated operational results of $0.13 per diluted share. In 2016, foreign currency, including hedging at P&WC, had a favorable impact on our consolidated operational results of $0.05 per diluted share. For additional discussion of foreign currency exposure, see "Market Risk and Risk Management—Foreign Currency Exposures."
Net income from continuing operations attributable to common shareowners for the year ended December 31, 2018 includes restructuring charges, net of tax benefit, of $228 million ($307 million pre-tax) as well as a net charge for significant non-operational and/or nonrecurring items, including the impact of taxes, of $668 million. Non-operational and/or nonrecurring items include a tax charge in connection with the passage of the TCJA as described in Note 11 and the unfavorable impact of a customer contract matter at Pratt & Whitney, partially offset by a gain on Carrier's sale of Taylor Company. The effect of restructuring charges and nonrecurring items on diluted earnings per share for the year ended December 31, 2018 was a charge of $1.11 per share.
Net income from continuing operations attributable to common shareowners for the year ended December 31, 2017 includes restructuring charges, net of tax benefit, of $176 million ($253 million pre-tax) as well as the net unfavorable impact of significant non-operational and/or nonrecurring items, net of tax, of $587 million. Non-operational and/or nonrecurring items include a tax charge in connection with the passage of the TCJA as described in Note 11, the unfavorable impact of customer contract matters at Pratt & Whitney, and the unfavorable impact of a product recall program at Carrier, partially offset by gains resulting from Carrier's sale of its investments in Watsco, Inc. The effect of restructuring charges and nonrecurring items on diluted earnings per share for 2017 was a charge of $0.95 per share.
Net income from continuing operations attributable to common shareowners for the year ended December 31, 2016 includes restructuring charges, net of tax benefit, of $192 million ($290 million pre-tax) as well as the net unfavorable impact of significant non-operational and/or non-recurring items, net of tax, of $203 million. Non-operational and/or nonrecurring items include a pension settlement charge resulting from pension de-risking actions, a net extinguishment loss related to the early redemption of certain outstanding notes, and the unfavorable impact of customer contract matters at Pratt & Whitney. These items were partially offset by favorable tax adjustments related to the conclusion of the review by the Examination Division of the Internal Revenue Service of the 2011 and 2012 tax years. The effect of restructuring charges and non-recurring items on diluted earnings per share for the year ended December 31, 2016 was a charge of $0.48 per share.
8
Net Loss Attributable to Common Shareowners from Discontinued Operations
| (dollars in millions, except per share amounts) | 2018 | 2017 | 2016 | ||||||||
| Net loss attributable to common shareowners from discontinued operations | $ | — | $ | — | $ | (10 | ) | ||||
| Diluted earnings per share from discontinued operations | $ | — | $ | — | $ | (0.01 | ) | ||||
Net loss from discontinued operations attributable to common shareowners for the year ended December 31, 2016 reflects the final purchase price adjustment for the sale of Sikorsky, and the net effects of filing Sikorsky's 2015 tax returns.
RESTRUCTURING COSTS
| (dollars in millions) | 2018 | 2017 | 2016 | |||||||||
| Restructuring costs | $ | 307 | $ | 253 | $ | 290 | ||||||
Restructuring actions are an essential component of our operating margin improvement efforts and relate to existing and recently acquired operations. Charges generally arise from severance related to workforce reductions, facility exit and lease termination costs associated with the consolidation of field and manufacturing operations and costs to exit legacy programs. We continue to closely monitor the economic environment and may undertake further restructuring actions to keep our cost structure aligned with the demands of the prevailing market conditions.
2018 Actions. During 2018, we recorded net pre-tax restructuring charges of $207 million relating to ongoing cost reduction actions initiated in 2018. We are targeting to complete in 2019 and 2020 the majority of the remaining workforce and facility related cost reduction actions initiated in 2018. Approximately 95% of the total pre-tax charge will require cash payments, which we have funded and expect to continue to fund with cash generated from operations. During 2018, we had cash outflows of approximately $84 million related to the 2018 actions. We expect to incur additional restructuring and other charges of $79 million to complete these actions. We expect recurring pre-tax savings to increase over the two-year period subsequent to initiating the actions to approximately $270 million annually, of which, approximately $37 million was realized in 2018.
2017 Actions. During 2018 and 2017, we recorded net pre-tax restructuring charges of $94 million and $176 million, respectively, for actions initiated in 2017. We are targeting to complete in 2019 the majority of the remaining workforce and all facility related cost reduction actions initiated in 2017. Approximately 76% of the total pre-tax charge will require cash payments, which we have and expect to continue to fund with cash generated from operations. During 2018, we had cash outflows of approximately $100 million related to the 2017 actions. We expect to incur additional restructuring charges of $91 million to complete these actions. We expect recurring pre-tax savings to increase over the two-year period subsequent to initiating the actions to approximately $240 million annually.
In addition, during 2018, we recorded net pre-tax restructuring costs totaling $6 million for restructuring actions initiated in 2016 and prior. For additional discussion of restructuring, see Note 13 to the Consolidated Financial Statements.
SEGMENT REVIEW
| Net Sales | Operating Profits | Operating Profit Margin | ||||||||||||||||||||||||||||||
| (dollars in millions) | 2018 | 2017 | 2016 | 2018 | 2017 | 2016 | 2018 | 2017 | 2016 | |||||||||||||||||||||||
| Otis | $ | 12,904 | $ | 12,341 | $ | 11,893 | $ | 1,915 | $ | 2,002 | $ | 2,125 | 14.8 | % | 16.2 | % | 17.9 | % | ||||||||||||||
| Carrier | 18,922 | 17,812 | 16,851 | 3,777 | 3,165 | 2,848 | 20.0 | % | 17.8 | % | 16.9 | % | ||||||||||||||||||||
| Pratt & Whitney | 19,397 | 16,160 | 14,894 | 1,269 | 1,300 | 1,501 | 6.5 | % | 8.0 | % | 10.1 | % | ||||||||||||||||||||
| Collins Aerospace Systems | 16,634 | 14,691 | 14,465 | 2,303 | 2,191 | 2,167 | 13.8 | % | 14.9 | % | 15.0 | % | ||||||||||||||||||||
| Total segment | 67,857 | 61,004 | 58,103 | 9,264 | 8,658 | 8,641 | 13.7 | % | 14.2 | % | 14.9 | % | ||||||||||||||||||||
| Eliminations and other | (1,356 | ) | (1,167 | ) | (859 | ) | (236 | ) | (81 | ) | (18 | ) | ||||||||||||||||||||
| General corporate expenses | — | — | — | (475 | ) | (439 | ) | (402 | ) | |||||||||||||||||||||||
| Consolidated | $ | 66,501 | $ | 59,837 | $ | 57,244 | $ | 8,553 | $ | 8,138 | $ | 8,221 | 12.9 | % | 13.6 | % | 14.4 | % | ||||||||||||||
Commercial Businesses
The financial performance of our commercial businesses can be influenced by a number of external factors including fluctuations in residential and commercial construction activity, regulatory changes, interest rates, labor costs, foreign currency exchange rates, customer attrition, raw material and energy costs, credit markets and other global and political factors. Carrier's financial performance can also be influenced by production and utilization of transport equipment, and weather conditions for
9
its residential business. Geographic and industry diversity across the commercial businesses help to balance the impact of such factors on our consolidated operating results, particularly in the face of uneven economic growth. At constant currency and excluding the effect of acquisitions and divestitures, Carrier equipment orders for 2018 increased 8% in comparison to 2017 driven by growth in transport refrigeration (39%) and residential HVAC (11%). At constant currency and excluding the impact of the New Revenue Standard, Otis new equipment orders increased 4% in comparison to the prior year as order growth in North America (11%), and China (6%) was offset by order declines in Europe (3%).
Total commercial business sales generated outside the U.S., including U.S. export sales, were 62% and 63% in 2018 and 2017, respectively. The following table shows sales generated outside the U.S., including U.S. export sales, for each of the commercial business segments:
| 2018 | 2017 | ||||
| Otis | 73 | % | 73 | % | |
| Carrier | 54 | % | 55 | % | |
Otis is the world’s largest elevator and escalator manufacturing, installation and service company. Otis designs, manufactures, sells and installs a wide range of passenger and freight elevators as well as escalators and moving walkways. In addition to new equipment, Otis provides modernization products to upgrade elevators and escalators as well as maintenance and repair services for both its products and those of other manufacturers. Otis serves customers in the commercial, residential and infrastructure property sectors around the world. Otis sells direct and through sales representatives and distributors.
| Total Increase (Decrease) Year-Over-Year for: | |||||||||||||||||||||||||
| (dollars in millions) | 2018 | 2017 | 2016 | 2018 Compared with 2017 | 2017 Compared with 2016 | ||||||||||||||||||||
| Net Sales | $ | 12,904 | $ | 12,341 | $ | 11,893 | $ | 563 | 5 | % | $ | 448 | 4 | % | |||||||||||
| Cost of Sales | 9,192 | 8,612 | 8,085 | 580 | 7 | % | 527 | 7 | % | ||||||||||||||||
| 3,712 | 3,729 | 3,808 | |||||||||||||||||||||||
| Operating Expenses and Other | 1,797 | 1,727 | 1,683 | ||||||||||||||||||||||
| Operating Profits | $ | 1,915 | $ | 2,002 | $ | 2,125 | $ | (87 | ) | (4 | )% | $ | (123 | ) | (6 | )% | |||||||||
| Factors Contributing to Total % Increase (Decrease) Year-Over-Year in: | |||||||||||||||||
| 2018 | 2017 | ||||||||||||||||
| Net Sales | Cost of Sales | Operating Profits | Net Sales | Cost of Sales | Operating Profits | ||||||||||||
| Organic / Operational | 3 | % | 5 | % | (4 | )% | 2 | % | 5 | % | (7 | )% | |||||
| Foreign currency translation | 1 | % | 1 | % | 2 | % | — | — | 1 | % | |||||||
| Acquisitions and divestitures, net | — | — | — | 1 | % | 1 | % | — | |||||||||
| Restructuring costs | — | — | (1 | )% | — | — | — | ||||||||||
| Other | 1 | % | 1 | % | (1 | )% | 1 | % | 1 | % | — | ||||||
| Total % change | 5 | % | 7 | % | (4 | )% | 4 | % | 7 | % | (6 | )% | |||||
2018 Compared with 2017
The organic sales increase of 3% primarily reflects higher service sales (2%), driven by growth in North America and Asia, and higher new equipment sales (1%) driven by growth in Europe, Asia excluding China, and North America (combined, 2%), partially offset by a decline in China (1%).
The operational profit decrease of 4% was driven by:
| • | unfavorable price and mix (8%), primarily in China |
| • | higher selling, general and administrative expenses and research and development costs (3%) |
| • | unfavorable commodity costs (2%) |
| • | unfavorable transactional foreign exchange from mark-to-market adjustments (1%) |
These decreases were partially offset by:
| • | profit contribution from the higher sales volumes noted above (8%) |
| • | favorable productivity (2%) |
10
2017 Compared with 2016
The organic sales increase of 2% primarily reflects higher service sales (1%) driven by growth in North America and Asia, and higher new equipment sales (1%) driven by growth in North America and Europe, partially offset by a decline in China.
The operational profit decrease of 7% was driven by:
| • | unfavorable price and mix (11%), primarily in China |
| • | higher selling, general and administrative expenses (2%), primarily labor and information technology costs |
| • | higher research and development costs (1%) |
These decreases were partially offset by:
| • | profit contribution from the higher sales volumes noted above (4%) |
| • | favorable productivity (3%) |
Carrier is a leading provider of heating, ventilating, air conditioning (HVAC), refrigeration, fire, security, and building automation products, solutions, and services for commercial, government, infrastructure, and residential property applications and refrigeration and transportation applications. Carrier provides a wide range of building systems, including cooling, heating, ventilation, refrigeration, fire, flame, gas, and smoke detection, portable fire extinguishers, fire suppression, intruder alarms, access control systems, video surveillance, and building control systems. Carrier also provides a broad array of related building services, including audit, design, installation, system integration, repair, maintenance, and monitoring services. Carrier also provides refrigeration and monitoring products and solutions to the transport industry.
| Total Increase (Decrease) Year-Over-Year for: | |||||||||||||||||||||||||
| (dollars in millions) | 2018 | 2017 | 2016 | 2018 Compared with 2017 | 2017 Compared with 2016 | ||||||||||||||||||||
| Net Sales | $ | 18,922 | $ | 17,812 | $ | 16,851 | $ | 1,110 | 6 | % | $ | 961 | 6 | % | |||||||||||
| Cost of Sales | 13,337 | 12,630 | 11,695 | 707 | 6 | % | 935 | 8 | % | ||||||||||||||||
| 5,585 | 5,182 | 5,156 | |||||||||||||||||||||||
| Operating Expenses and Other | 1,808 | 2,017 | 2,308 | ||||||||||||||||||||||
| Operating Profits | $ | 3,777 | $ | 3,165 | $ | 2,848 | $ | 612 | 19 | % | $ | 317 | 11 | % | |||||||||||
| Factors Contributing to Total % Increase (Decrease) Year-Over-Year in: | |||||||||||||||||
| 2018 | 2017 | ||||||||||||||||
| Net Sales | Cost of Sales | Operating Profits | Net Sales | Cost of Sales | Operating Profits | ||||||||||||
| Organic / Operational | 6 | % | 6 | % | 6 | % | 4 | % | 5 | % | (1 | )% | |||||
| Foreign currency translation | 1 | % | 1 | % | — | 1 | % | — | — | ||||||||
| Acquisitions and divestitures, net | (1 | )% | (1 | )% | (1 | )% | 1 | % | 2 | % | — | ||||||
| Restructuring costs | — | — | 1 | % | — | — | (2 | )% | |||||||||
| Other | — | — | 13 | % | — | 1 | % | 14 | % | ||||||||
| Total % change | 6 | % | 6 | % | 19 | % | 6 | % | 8 | % | 11 | % | |||||
2018 Compared with 2017
The organic sales increase of 6% was driven primarily by growth in North America residential HVAC (2%), global commercial HVAC (2%), and global refrigeration (2%).
The operational profit increase of 6% was driven by:
| • | profit contribution from the higher sales volumes noted above, net of mix (6%) |
| • | the year-over-year impact of contract adjustments related to a large commercial project (3%) |
| • | favorable pricing, net of commodities (2%) |
These increases were partially offset by:
| • | higher logistics costs (3%) |
| • | higher research and development costs (1%) |
The 13% increase in Other primarily reflects the year-over-year impact of gains on sale of businesses and investments (11%), primarily driven by the sale of Taylor Company in 2018 (25%), partially offset by the absence of the prior year sale of
11
investments in Watsco, Inc. (12%). The remaining increase in Other is largely driven by the year-over-year impact of a prior year product recall program (2%).
2017 Compared with 2016
The organic sales increase of 4% was driven by growth in North America residential HVAC (1%), global commercial HVAC (1%), and commercial refrigeration (1%).
Operational profit decreased by 1% as the profit contribution from higher sales volumes, net of adverse price (6%) and the beneficial impact from restructuring savings (2%), were more than offset by the impact of unfavorable mix (7%) and unfavorable contract adjustments related to a large commercial project (1%). The 14% increase in “other” primarily reflects gains on the sale of investments (16%), primarily Watsco, Inc., and the absence of prior year acquisition and integration costs (1%), partially offset by the impact of a product recall program (3%).
Aerospace Businesses
The financial performance of Pratt & Whitney and Collins Aerospace Systems is directly tied to the economic conditions of the commercial aerospace and defense aerospace industries. In particular, Pratt & Whitney experiences intense competition for new commercial airframe/engine combinations. Engine suppliers may offer substantial discounts and other financial incentives, performance and operating cost guarantees, and participate in financing arrangements in an effort to compete for the aftermarket associated with these engine sales. These OEM engine sales may result in losses on the engine sales, which economically are recovered through the sales and profits generated over the engine's maintenance cycle. At times, the aerospace businesses also enter into development programs and firm fixed-price development contracts, which may require the company to bear cost overruns related to unforeseen technical and design challenges that arise during the development stage of the program. Customer selections of engines and components can also have a significant impact on later sales of parts and service. Predicted traffic levels, load factors, worldwide airline profits, general economic activity and global defense spending have been reliable indicators for new aircraft and aftermarket orders within the aerospace industry. Spare part sales and aftermarket service trends are affected by many factors, including usage, technological improvements, pricing, regulatory changes and the retirement of older aircraft. Our commercial aftermarket businesses continue to evolve as an increasing proportion of our aerospace businesses' customers are covered under Fleet Management Programs (FMPs) and other long-term maintenance programs. FMPs are comprehensive long-term spare part and maintenance agreements with our customers. We expect a continued shift to FMPs in lieu of transactional spare part sales as new engines enter customers' fleets on FMP and legacy fleets are retired. In 2018, as compared with 2017, total commercial aerospace aftermarket sales increased 12% at Pratt & Whitney and 17% at Collins Aerospace Systems.
Our long-term aerospace contracts are subject to strict safety and performance regulations which can affect our ability to estimate costs precisely. Contract cost estimation for the development of complex projects, in particular, requires management to make significant judgments and assumptions regarding the complexity of the work to be performed, availability of materials, the performance by subcontractors, the timing of funding from customers and the length of time to complete the contract. As a result, we review and update our cost estimates on significant contracts on a quarterly basis, and no less frequently than annually for all others, and when circumstances change and warrant a modification to a previous estimate. Changes in estimates relate to the current period impact of revisions to total estimated contract sales and costs at completion. We record changes in contract estimates primarily using the cumulative catch-up method. Operating profits included net unfavorable changes in aerospace contract estimates of approximately $50 million, $110 million and $157 million in 2018, 2017 and 2016, respectively, primarily the result of unexpected increases in estimated costs related to Pratt & Whitney long term aftermarket contracts. In accordance with our revenue recognition policy, losses, if any, on long-term contracts are provided for when anticipated. There were no material loss provisions recorded on OEM contracts in continuing operations in 2018 or 2017.
Performance in the general aviation sector is closely tied to the overall health of the economy. We continue to see growth in a strong commercial airline industry. Airline traffic, as measured by revenue passenger miles (RPMs), grew approximately 7% in the first eleven months of 2018.
Our military sales are affected by U.S. Department of Defense spending levels. Total sales to the U.S. Government were $7.4 billion in 2018, $5.8 billion in 2017, and $5.6 billion in 2016, and were 11% of total UTC sales in 2018, and 10% in both 2017 and 2016. The defense portion of our aerospace business is also affected by changes in market demand and the global political environment. Our participation in long-term production and development programs for the U.S. Government has contributed positively to our results in 2018 and is expected to continue to benefit results in 2019.
Pratt & Whitney is among the world’s leading suppliers of aircraft engines for the commercial, military, business jet and general aviation markets. Pratt & Whitney provides fleet management services and aftermarket maintenance, repair and
12
overhaul services. Pratt & Whitney produces and develops families of large engines for wide- and narrow-body and large regional aircraft in the commercial market and for fighter, bomber, tanker and transport aircraft in the military market. P&WC is among the world's leading suppliers of engines powering general and business aviation, as well as regional airline, utility and military airplanes, and helicopters. Pratt & Whitney and P&WC also produce, sell and service auxiliary power units for commercial and military aircraft. Pratt & Whitney’s products are sold principally to aircraft manufacturers, airlines and other aircraft operators, aircraft leasing companies and the U.S. and foreign governments.
| Total Increase (Decrease) Year-Over-Year for: | |||||||||||||||||||||||||
| (dollars in millions) | 2018 | 2017 | 2016 | 2018 Compared with 2017 | 2017 Compared with 2016 | ||||||||||||||||||||
| Net Sales | $ | 19,397 | $ | 16,160 | $ | 14,894 | $ | 3,237 | 20 | % | $ | 1,266 | 9 | % | |||||||||||
| Cost of Sales | 16,301 | 13,093 | 11,814 | 3,208 | 25 | % | 1,279 | 11 | % | ||||||||||||||||
| 3,096 | 3,067 | 3,080 | |||||||||||||||||||||||
| Operating Expenses and Other | 1,827 | 1,767 | 1,579 | ||||||||||||||||||||||
| Operating Profits | $ | 1,269 | $ | 1,300 | $ | 1,501 | $ | (31 | ) | (2 | )% | $ | (201 | ) | (13 | )% | |||||||||
| Factors Contributing to Total % Increase (Decrease) Year-Over-Year in: | |||||||||||||||||
| 2018 | 2017 | ||||||||||||||||
| Net Sales | Cost of Sales | Operating Profits | Net Sales | Cost of Sales | Operating Profits | ||||||||||||
| Organic* / Operational* | 14 | % | 17 | % | (8 | )% | 9 | % | 12 | % | (12 | )% | |||||
| Foreign currency (including P&WC net hedging)* | — | 1 | % | — | 1 | % | — | 9 | % | ||||||||
| Acquisitions and divestitures, net | — | — | — | — | — | (1 | )% | ||||||||||
| Restructuring costs | — | — | 1 | % | — | — | 3 | % | |||||||||
| Other | 6 | % | 7 | % | 5 | % | (1 | )% | (1 | )% | (12 | )% | |||||
| Total % change | 20 | % | 25 | % | (2 | )% | 9 | % | 11 | % | (13 | )% | |||||
| * | As discussed further in the "Business Overview" and "Results of Operations" sections, for Pratt & Whitney only, the transactional impact of foreign exchange hedging at P&WC has been netted against the translational foreign exchange impact for presentation purposes in the above table. For all other segments, these foreign exchange transactional impacts are included within the organic sales/operational operating profit caption in their respective tables. Due to its significance to Pratt & Whitney's overall operating results, we believe it is useful to segregate the foreign exchange transactional impact in order to clearly identify the underlying financial performance. |
2018 Compared with 2017
The organic sales increase of 14% primarily reflects higher commercial aftermarket sales (6%), higher commercial OEM sales (5%) and increased military sales (3%). The 6% increase in Other primarily reflects the impact of the adoption of the New Revenue Standard (4%) and the absence of a prior year customer contract matter (2%).
The operational profit decrease of 8% was primarily driven by:
| • | lower commercial OEM profit contribution (27%) primarily driven by higher negative engine margin on higher deliveries |
| • | higher selling, general and administrative expenses (5%) |
| • | the absence of the favorable impact from a prior year license agreement (4%) |
| • | higher research and development costs (2%) |
These decreases were partially offset by:
| • | higher commercial aftermarket profit contribution (23%), driven by the sales increase noted above |
| • | higher military profit contribution (5%), driven by the sales increase noted above |
The 5% increase in Other primarily reflects the favorable impact resulting from the adoption of the New Revenue Standard (13%) partially offset by the unfavorable year-over-year impact of contract settlements (8%).
2017 Compared with 2016
The organic sales increase of 9% primarily reflects higher commercial aftermarket sales (8%) and higher military sales (4%), partially offset by lower commercial engine sales (2%), unfavorable year-over-year contract settlements (1%), and the absence of prior year sales of legacy hardware (1%). The 1% decrease in Other reflects the year-over-year impact of customer contract matters.
13
The operational profit decrease of 12% was primarily driven by:
| • | lower OEM profit contribution (27%) reflecting higher negative engine margin and other ramp-related costs and lower volume at P&WC partially offset by the profit contribution from higher military sales |
| • | higher selling, general and administrative expenses and research and development costs (9%) |
| • | unfavorable year-over-year contract settlements (5%) |
| • | the absence of prior year sales of legacy hardware (3%) |
These decreases were partially offset by:
| • | higher aftermarket profit contribution (29%) driven by increases in both commercial and military aftermarket sales |
| • | the favorable impact of a licensing agreement (3%) |
The 12% decrease in Other primarily reflects the year-over-year impact of customer contract matters (7%), the absence of the favorable impact of a prior year program termination (2%), and the absence of a prior year benefit from the licensing of certain intellectual property rights (2%).
Collins Aerospace Systems is a leading global provider of technologically advanced aerospace products and aftermarket service solutions for aircraft manufacturers, airlines, regional, business and general aviation markets, military, space and undersea operations. Collins Aerospace Systems’ product portfolio includes electric power generation, power management and distribution systems, air data and aircraft sensing systems, engine control systems, intelligence, surveillance and reconnaissance systems, engine components, environmental control systems, fire and ice detection and protection systems, propeller systems, engine nacelle systems, including thrust reversers and mounting pylons, interior and exterior aircraft lighting, aircraft seating and cargo systems, actuation systems, landing systems, including landing gear and wheels and brakes, space products and subsystems, integrated avionics systems, precision targeting, electronic warfare and range and training systems, flight controls, communications systems, navigation systems, oxygen systems, simulation and training systems, food and beverage preparation, storage and galley systems, lavatory and wastewater management systems. Collins Aerospace Systems also designs, produces and supports cabin interior, communications and aviation systems and products and provides information management services through voice and data communication networks and solutions worldwide. Aftermarket services include spare parts, overhaul and repair, engineering and technical support, training and fleet management solutions, and information management services. Collins Aerospace Systems sells aerospace products and services to aircraft manufacturers, airlines and other aircraft operators, the U.S. and foreign governments, maintenance, repair and overhaul providers, and independent distributors.
| Total Increase (Decrease) Year-Over-Year for: | |||||||||||||||||||||||||
| (dollars in millions) | 2018 | 2017 | 2016 | 2018 Compared with 2017 | 2017 Compared with 2016 | ||||||||||||||||||||
| Net Sales | $ | 16,634 | $ | 14,691 | $ | 14,465 | $ | 1,943 | 13 | % | $ | 226 | 2 | % | |||||||||||
| Cost of Sales | 12,336 | 10,838 | 10,689 | 1,498 | 14 | % | 149 | 1 | % | ||||||||||||||||
| 4,298 | 3,853 | 3,776 | |||||||||||||||||||||||
| Operating Expenses and Other | 1,995 | 1,662 | 1,609 | ||||||||||||||||||||||
| Operating Profits | $ | 2,303 | $ | 2,191 | $ | 2,167 | $ | 112 | 5 | % | $ | 24 | 1 | % | |||||||||||
| Factors Contributing to Total % Increase (Decrease) Year-Over-Year in: | |||||||||||||||||
| 2018 | 2017 | ||||||||||||||||
| Net Sales | Cost of Sales | Operating Profits | Net Sales | Cost of Sales | Operating Profits | ||||||||||||
| Organic / Operational | 8 | % | 7 | % | 10 | % | 2 | % | 2 | % | 4 | % | |||||
| Foreign currency translation | — | 1 | % | (1 | )% | — | — | — | |||||||||
| Acquisitions and divestitures, net | 5 | % | 6 | % | 1 | % | — | (1 | )% | (1 | )% | ||||||
| Restructuring costs | — | — | (4 | )% | — | — | (2 | )% | |||||||||
| Other | — | — | (1 | )% | — | — | — | ||||||||||
| Total % change | 13 | % | 14 | % | 5 | % | 2 | % | 1 | % | 1 | % | |||||
2018 Compared with 2017
The organic sales growth of 8% primarily reflects higher commercial aftermarket and military sales (combined, 6%) and higher commercial aerospace OEM sales (2%).
14
The increase in operational profit of 10% primarily reflects:
| • | higher commercial aftermarket and military profit contribution (combined, 18%) primarily driven by the commercial aftermarket sales growth noted above |
| • | higher commercial aerospace OEM profit contribution (3%) |
These increases were partially offset by:
| • | higher selling, general, and administrative expenses (7%) |
| • | higher warranty costs (4%) |
2017 Compared with 2016
The organic sales growth of 2% primarily reflects an increase in commercial aerospace aftermarket sales (3%), partially offset by lower commercial aerospace OEM sales (1%).
The increase in operational profit of 4% primarily reflects higher commercial aerospace profit contribution driven by the commercial aftermarket sales growth noted above, partially offset by lower commercial aerospace OEM profit contribution (net, 7%). This net increase was partially offset by higher selling, general, and administrative expenses (3%).
Eliminations and other
| Net Sales | Operating Profits | ||||||||||||||||||||||
| (dollars in millions) | 2018 | 2017 | 2016 | 2018 | 2017 | 2016 | |||||||||||||||||
| Eliminations and other | $ | (1,356 | ) | $ | (1,167 | ) | $ | (859 | ) | $ | (236 | ) | $ | (81 | ) | $ | (18 | ) | |||||
| General corporate expenses | — | — | — | (475 | ) | (439 | ) | (402 | ) | ||||||||||||||
Eliminations and other reflects the elimination of sales, other income and operating profit transacted between segments, as well as the operating results of certain smaller businesses. The year-over-year increase in sales eliminations in 2018 as compared with 2017 reflects an increase in the amount of inter-segment eliminations, principally between our aerospace businesses. The year-over-year decrease in operating profit for 2018 as compared with 2017, is driven by higher inter-segment profit eliminations resulting from increased inter-segment activity amongst our aerospace businesses, transaction costs related to the acquisition of Rockwell Collins and the strategic review of the Company's portfolio of businesses, and lower year-over-year gains on sales of securities.
The year-over-year increase in the amount of sales eliminations in 2017 as compared with 2016 reflects an increase in the amount of inter-segment sales eliminations, principally between our aerospace businesses. The year-over-year increase in operating profit for 2017 as compared with 2016 is largely driven by the absence of a $423 million pension settlement charge resulting from pension de-risking actions taken in the prior year, partially offset by transaction costs related to the merger agreement with Rockwell Collins, and an increase in the amount of inter-segment eliminations between our aerospace businesses. The year-over-year increase in general corporate expenses for 2017, as compared with 2016 primarily reflects higher expenses related to salaries, wages and employee benefits.
LIQUIDITY AND FINANCIAL CONDITION
| (dollars in millions) | 2018 | 2017 | |||||
| Cash and cash equivalents | $ | 6,152 | $ | 8,985 | |||
| Total debt | 45,537 | 27,485 | |||||
| Net debt (total debt less cash and cash equivalents) | 39,385 | 18,500 | |||||
| Total equity | 40,610 | 31,421 | |||||
| Total capitalization (total debt plus total equity) | 86,147 | 58,906 | |||||
| Net capitalization (total debt plus total equity less cash and cash equivalents) | 79,995 | 49,921 | |||||
| Total debt to total capitalization | 53 | % | 47 | % | |||
| Net debt to net capitalization | 49 | % | 37 | % | |||
We assess our liquidity in terms of our ability to generate cash to fund our operating, investing and financing activities. Our principal source of liquidity is operating cash flows from continuing operations. For 2018 our cash flows from continuing operations, net of capital expenditures was $4.4 billion. In addition to operating cash flows, other significant factors that affect our overall management of liquidity include: capital expenditures, customer financing requirements, investments in businesses,
15
dividends, common stock repurchases, pension funding, access to the commercial paper markets, adequacy of available bank lines of credit, redemptions of debt and the ability to attract long-term capital at satisfactory terms.
At December 31, 2018, we had cash and cash equivalents of $6,152 million, of which approximately 72% was held by UTC's foreign subsidiaries. We manage our worldwide cash requirements by reviewing available funds among the many subsidiaries through which we conduct our business and the cost effectiveness with which those funds can be accessed. As previously discussed, on December 22, 2017, the TCJA was enacted. Prior to enactment of the TCJA, with few exceptions, U.S. income taxes had not been provided on undistributed earnings of UTC's international subsidiaries as the Company had
intended to reinvest such earnings permanently outside the U.S. or to repatriate such earnings only when it was tax effective to repatriate. The Company no longer intends to reinvest certain undistributed earnings of its international subsidiaries that have been previously taxed in the U.S. and has recorded non U.S. taxes that will become due when earnings of certain international subsidiaries are remitted to the U.S. For the remainder of the Company’s undistributed international earnings, unless tax effective to repatriate, UTC will continue to reinvest these earnings permanently. We have repatriated $6.2 billion of overseas cash for the year ended December 31, 2018.
On occasion, we are required to maintain cash deposits with certain banks with respect to contractual obligations related to acquisitions or divestitures or other legal obligations. As of December 31, 2018, 2017 and 2016, the amount of such restricted cash was approximately $60 million, $33 million and $32 million, respectively.
On November 26, 2018, we completed the acquisition of Rockwell Collins. Under the terms of the merger agreement, each share of common stock, par value $0.01 per share, of Rockwell Collins issued and outstanding immediately prior to the effective time of the Merger (other than shares held by Rockwell Collins, the Company, Merger Sub or any of their respective wholly owned subsidiaries) was converted into the right to receive (1) $93.33 in cash, without interest, and (2) 0.37525 of a share of Company common stock, par value $1.00 per share, and cash in lieu of fractional shares (together, the “Merger Consideration”), less any applicable withholding taxes. The total aggregate consideration payable in the Merger was $15.5 billion in cash ($14.9 billion net of cash acquired) and 62.2 million shares of Company common stock. In addition, $7.8 billion of Rockwell Collins debt was outstanding as of the acquisition date.
Our domestic pension funds experienced a negative return on assets of 5% during 2018 and a positive return on assets of 15.0% during 2017. Approximately 88% of these domestic pension plans' funds are invested in readily-liquid investments, including equity, fixed income, asset-backed receivables and structured products. The balance of these domestic pension plans' funds (12%) is invested in less-liquid but market-valued investments, including real estate and private equity. As part of our long-term strategy to de-risk our defined benefit pension plans, we made discretionary contributions of approximately $1.9 billion to our domestic defined benefit pension plans in 2017. Across our global pension plans, higher discount rates for pension obligations and the acquisition of Rockwell Collins, partially offset by higher discount rates for interest cost and 2018 actual returns on plan assets, will result in a net periodic pension benefit in 2019 that is expected to be approximately $100 million favorable relative to 2018 amounts. As part of the Rockwell acquisition on November 26, 2018, we assumed approximately $3.7 billion of projected pension benefit obligations and $3.4 billion of plan assets.
Historically, our strong debt ratings and financial position have enabled us to issue long-term debt at favorable market rates. Our ability to obtain debt financing or additional credit facilities at comparable risk-based interest rates is partly a function of our existing debt-to-total-capitalization level as well as our credit standing. Our debt-to-total-capitalization increased 600 basis points from 47% at December 31, 2017 to 53% at December 31, 2018 primarily reflecting additional borrowings in 2018 used to finance the acquisition of Rockwell Collins as well as the acquisition of Rockwell Collins' outstanding debt. The average maturity of our long-term debt at December 31, 2018 is approximately 11 years.
At December 31, 2018, we had revolving credit agreements with various banks permitting aggregate borrowings of up to $4.35 billion pursuant to a $2.20 billion revolving credit agreement and a $2.15 billion multicurrency revolving credit agreement, both of which expire in August 2021. Additionally, on November 26, 2018, we entered into a $1.5 billion revolving credit agreement, which will mature on May 25, 2019. As of December 31, 2018, 2017 and 2016, there were no borrowings under any of these revolving credit agreements. The undrawn portions of our revolving credit agreements are also available to serve as backup facilities for the issuance of commercial paper. In addition to the credit facilities referenced above, we expect to enter into additional credit facilities in 2019 for general corporate purposes, including to pay existing debt.
As of December 31, 2018, our maximum commercial paper borrowing authority was $4.35 billion. Commercial paper borrowings at December 31, 2018 of $1,257 million include approximately €750 million ($858 million) of euro-denominated commercial paper. We use our commercial paper borrowings for general corporate purposes, including the funding of potential acquisitions, discretionary pension contributions, debt refinancing, dividend payments and repurchases of our common stock. The need for commercial paper borrowings arises when the use of domestic cash for general corporate purposes exceeds the sum of domestic cash generation and foreign cash repatriated to the U.S.
We had the following issuances of debt in 2018, 2017 and 2016.
16
(dollars in millions)
| Issuance Date | Description of Notes | Aggregate Principal Balance | ||
| August 16, 2018: | 3.350% notes due 20211 | $ | 1,000 | |
3.650% notes due 20231 | 2,250 | |||
3.950% notes due 20251 | 1,500 | |||
4.125% notes due 20281 | 3,000 | |||
4.450% notes due 20381 | 750 | |||
4.625% notes due 20482 | 1,750 | |||
LIBOR plus 0.65% floating rate notes due 20211 | 750 | |||
| May 18, 2018: | 1.150% notes due 20243 | € | 750 | |
2.150% notes due 20303 | 500 | |||
EURIBOR plus 0.20% floating rate notes due 20203 | 750 | |||
| November 13, 2017: | EURIBOR plus 0.15% floating rate notes due 20192 | € | 750 | |
| May 4, 2017: | 1.900% notes due 20204 | $ | 1,000 | |
2.300% notes due 20224 | 500 | |||
2.800% notes due 20244 | 800 | |||
3.125% notes due 20274 | 1,100 | |||
4.050% notes due 20474 | 600 | |||
| November 1, 2016: | 1.500% notes due 20192 | $ | 650 | |
1.950% notes due 20212 | 750 | |||
2.650% notes due 20262 | 1,150 | |||
3.750% notes due 20462 | 1,100 | |||
LIBOR plus 0.35% floating rate notes due 20192 | 350 | |||
| February 22, 2016: | 1.125% notes due 20213 | € | 950 | |
1.875% notes due 20263 | 500 | |||
EURIBOR plus 0.80% floating rate notes due 20183 | 750 | |||
| 1 | The net proceeds received from these debt issuances were used to partially finance the cash consideration portion of the purchase price for Rockwell Collins and fees, expenses and other amounts related to the acquisition of Rockwell Collins. |
| 2 | The net proceeds from these debt issuances were used to fund the repayment of commercial paper and for other general corporate purposes. |
| 3 | The net proceeds received from these debt issuances were used for general corporate purposes. |
| 4 | The net proceeds received from these debt issuances were used to fund the repayment at maturity of our 1.800% notes due 2017, representing $1.5 billion in aggregate principal and other general corporate purposes. |
We made the following repayments of debt in 2018, 2017 and 2016:
17
(dollars in millions)
| Repayment Date | Description of Notes | Aggregate Principal Balance | ||
| December 14, 2018 | Variable-rate term loan due 2020 (1 month LIBOR plus 1.25%)1 | $ | 482 | |
| May 4, 2018 | 1.778% junior subordinated notes | $ | 1,100 | |
| February 22, 2018 | EURIBOR plus 0.80% floating rate notes | € | 750 | |
| February 1, 2018 | 6.80% notes | $ | 99 | |
| June 1, 2017 | 1.800% notes | $ | 1,500 | |
| December 1, 2016: | 5.375% notes due in 20172 | $ | 1,000 | |
6.125% notes due in 20192 | $ | 1,250 | ||
| 1 | This term loan was assumed in connection with the Rockwell Collins acquisition and subsequently repaid. |
2 These notes were redeemed under our redemption notice issued on November 1, 2016. A combined net extinguishment loss of approximately $164
million was recognized within Interest expense, net in the accompanying Consolidated Statement of Operations.
We believe our future operating cash flows will be sufficient to meet our future operating cash needs. Further, we continue to have access to the commercial paper markets and our existing credit facilities, and our ability to obtain debt or equity financing or additional credit facilities provides potential sources of liquidity should they be required or appropriate.
Cash Flow—Operating Activities of Continuing Operations
| (dollars in millions) | 2018 | 2017 | 2016 | ||||||||
| Net cash flows provided by operating activities of continuing operations | $ | 6,322 | $ | 5,631 | $ | 6,412 | |||||
2018 Compared with 2017
Cash generated from continuing operating activities in 2018 was approximately $691 million higher than 2017. Cash outflows for working capital increased $703 million over the prior period to support higher top line organic growth. Factoring activity resulted in a decrease of approximately $148 million in cash generated from operating activities during the year ended, December 31, 2018, as compared to the prior year. This decrease was primarily driven from lower factoring levels at Pratt & Whitney and Carrier. Factoring activity does not reflect the factoring of certain aerospace receivables performed at customer request for which we are compensated by the customer for the extended collection cycle.
The 2018 cash outflows from working capital were $755 million. Accounts receivable increased approximately $2.4 billion due to an increase in sales volume. Contract assets, current increased $604 million due to costs in excess of billings primarily at Pratt & Whitney driven by military engines, at Otis due to progression on major projects, and at Collins Aerospace Systems. Inventory increased $537 million primarily driven by an increase in production for the Geared Turbofan at Pratt & Whitney, increases at Carrier to support higher sales volume and increases at Collins Aerospace Systems. This was partially offset by decreases in Other assets of $161 million primarily due to tax refunds received, an increase in Accounts payable and accrued liabilities of approximately $2.4 billion, driven by higher inventory purchasing activity at Pratt & Whitney and higher direct material purchases at Collins Aerospace Systems, as well as an increase in Contract liabilities, current of $205 million driven by progress payments on major contracts and seasonal advanced billings at Otis.
The funded status of our defined benefit pension plans is dependent upon many factors, including returns on invested assets, the level of market interest rates and actuarial mortality assumptions. We can contribute cash or UTC shares to our plans at our discretion, subject to applicable regulations. Total cash contributions to our global defined benefit pension plans were $147 million, $2,112 million and $303 million during 2018, 2017 and 2016, respectively. As of December 31, 2018, the total investment by the global defined benefit pension plans in the Company's securities was less than 1% of total plan assets. Our qualified domestic defined benefit pension plans are approximately 97% funded on a projected benefit obligation basis as of December 31, 2018, and we are not required to make additional contributions through the end of 2024. We expect to make total contributions of approximately $100 million to our global defined benefit pension plans in 2019. Contributions to our global defined benefit pension plans in 2019 are expected to meet or exceed the current funding requirements.
18
2017 Compared with 2016
As part of our long-term strategy to de-risk our defined benefit pension plans, we made discretionary contributions of approximately $1.9 billion to our domestic defined benefit pension plans in 2017. Including the effects of this contribution, cash generated from operating activities of continuing operations in 2017 was $781 million lower than 2016. Lower net income and the higher global pension contributions were partially offset by lower investments in working capital of approximately $1.1 billion and approximately $0.6 billion in favorable Other operating activities, net. The 2017 Other operating activities, net was driven by increases in net noncurrent income tax liabilities resulting from the TCJA enacted in December 2017 as discussed above, partially offset by gains on sales of investments included in net income, including Carrier's sale of investments in Watsco, Inc.
The 2017 cash outflows for working capital ($52 million) were primarily driven by increases in inventories of approximately $1.1 billion, primarily in our aerospace businesses supporting an increase in forecasted OEM deliveries and related aftermarket demand, including approximately $200 million of inventory costs attributable to new engine offerings recognized based on the average cost per unit expected over the life of each contract using the units-of-delivery method of percentage of completion accounting, as discussed in Note 6. Accounts receivable increases at Pratt & Whitney were partially offset by declines at Carrier. Factoring activity provided an increase of approximately $700 million in cash generated from operating activities of continuing operations in 2017, as compared to the prior year period. This increase does not reflect the factoring of certain aerospace receivables performed at customer request for which we are compensated by the customer for the extended payment cycle. These increases were largely offset by the net increase in accrued liabilities and accounts payable of approximately $1.6 billion, primarily driven by production volumes at Pratt & Whitney.
For 2016, cash outflows for working capital ($1,161 million) were primarily driven by increases in inventory in our aerospace businesses to support deliveries and other contractual commitments, including approximately $220 million of inventory costs attributable to new engine offerings recognized based on the average cost per unit expected over the life of each contract using the units-of-delivery method of percentage of completion accounting, as discussed in Note 6. Increases in accounts receivable at Pratt & Whitney and our commercial businesses were partially offset by increases in accounts payable and accrued liabilities across all of our businesses.
Cash Flow—Investing Activities of Continuing Operations
| (dollars in millions) | 2018 | 2017 | 2016 | ||||||||
| Net cash flows used in investing activities of continuing operations | $ | (16,973 | ) | $ | (3,019 | ) | $ | (2,509 | ) | ||
2018 Compared with 2017
Cash flows used in investing activities of continuing operations for 2018 and 2017 primarily reflect capital investments/dispositions of businesses, expenditures, cash investments in customer financing assets, payments related to our collaboration intangible assets and contractual rights to provide product on new aircraft platforms and settlements of derivative contracts. The $14 billion increase in cash flows used in investing activities from the prior year primarily relates to the $14.9 billion of cash paid for the acquisition of Rockwell Collins (net of cash acquired) and the absence of $596 million in net proceeds received from Carrier's sale of investments in Watsco, Inc. in 2017, partially offset by proceeds from the sale of Taylor Company in June 2018 by Carrier of $1.0 billion, a decrease in customer financing assets of $593 million and $143 million in receipts from settlements of derivative contracts compared to payments of $317 million in 2017.
Capital expenditures in 2018 ($1,902 million) primarily relate to investments in production capacity at Pratt & Whitney, investments in production capacity and several small projects at Collins Aerospace Systems, and new facilities and investments in products and information technology at Carrier, and investments in digital and information technology at Otis.
Cash investments in businesses (net of cash acquired) in 2018 ($15.4 billion) primarily relate to the acquisition of Rockwell Collins in November 2018. Dispositions of businesses in 2018 of $1.1 billion primarily relate to the sale of Taylor Company.
Customer financing activities, primarily driven by additional Geared Turbofan engines to support customer fleets, were a net use of cash of $382 million and $975 million in 2018 and 2017, respectively. We may also arrange for third-party investors to assume a portion of our commitments. At December 31, 2018, we had commercial aerospace financing and other contractual commitments of approximately $15.5 billion related to commercial aircraft and certain contractual rights to provide product on new aircraft platforms, of which as much as $1.7 billion may be required to be disbursed during 2019. As discussed in Note 1 to the Consolidated Financial Statements, we have entered into certain collaboration arrangements, which may include participation by our collaborators in these commitments. At December 31, 2018, our collaborators' share of these commitments was approximately $5.3 billion of which as much as $468 million may be required to be disbursed to us during
19
2019. Refer to Note 5 to the Consolidated Financial Statements for additional discussion of our commercial aerospace industry assets and commitments.
In 2018, we increased our collaboration intangible assets by approximately $400 million, which primarily relates to payments made under our 2012 agreement to acquire Rolls-Royce's collaboration interests in IAE.
As discussed in Note 14 to the Consolidated Financial Statements, we enter into derivative instruments for risk management purposes only, including derivatives designated as hedging instruments under the Derivatives and Hedging Topic of the Financial Accounting Standards Board (FASB) Accounting Standards Codification (ASC) and those utilized as economic hedges. We operate internationally and, in the normal course of business, are exposed to fluctuations in interest rates, foreign exchange rates and commodity prices. These fluctuations can increase the costs of financing, investing and operating the business. We have used derivative instruments, including swaps, forward contracts and options to manage certain foreign currency, interest rate and commodity price exposures. During the years ended December 31, 2018 and 2017, we had net cash receipts of approximately $143 million and net cash payments of approximately $317 million, respectively, from the settlement of these derivative instruments.
2017 Compared with 2016
Cash flows used in investing activities of continuing operations for 2017 and 2016 primarily reflect capital expenditures, cash investments in customer financing assets, cash investments in businesses, and payments related to our collaboration intangible assets and contractual rights to provide product on new aircraft platforms. In 2017, we realized net proceeds of $596 million from Carrier's sale of investments in Watsco, Inc.
In 2017, we increased our collaboration intangible assets by approximately $380 million, of which approximately $340 million represented payments made under our 2012 agreement to acquire Rolls-Royce's ownership and collaboration interests in IAE. Capital expenditures for 2017 ($2,014 million) primarily relate to investments in production capacity at Pratt & Whitney and Collins Aerospace Systems, as well as new facilities at Pratt & Whitney and Carrier. Cash investments in businesses in 2017 ($231 million) consisted of a number of small acquisitions, primarily in our commercial businesses.
Cash Flow—Financing Activities of Continuing Operations
| (dollars in millions) | 2018 | 2017 | 2016 | ||||||||
| Net cash flows provided by (used in) financing activities of continuing operations | $ | 7,965 | $ | (993 | ) | $ | (1,188 | ) | |||
2018 Compared with 2017
Our financing activities primarily include the issuance and repayment of short term and long term debt, payment of dividends and stock repurchases. Net cash provided by financing activities increased $8,958 million in 2018 compared to the prior year due to an increase in long-term debt issuances of $8.5 billion, including the $11 billion issued in 2018 for the financing of the Rockwell Collins acquisition, and a decrease in repurchases of common stock of $1.1 billion, partially offset by an increase in repayments of long-term debt of $0.9 billion.
Commercial paper borrowings and revolving credit facilities provide short-term liquidity to supplement operating cash flows and are used for general corporate purposes, including the funding of potential acquisitions and repurchases of our stock. We had approximately $1.3 billion of outstanding commercial paper at December 31, 2018.
At December 31, 2018, management had remaining authority to repurchase approximately $2.0 billion of our common stock under the October 14, 2015 share repurchase program. Under this program, shares may be purchased on the open market, in privately negotiated transactions, under accelerated share repurchase programs, and under plans complying with Rules 10b5-1 and 10b-18 under the Securities Exchange Act of 1934, as amended. We may also reacquire shares outside of the program from time to time in connection with the surrender of shares to cover taxes on vesting of restricted stock and in connection with our employee savings plan. We made cash payments of approximately $325 million to repurchase approximately 2.7 million shares of our common stock during the year ended December 31, 2018.
We paid aggregate dividends on common stock of approximately $2.2 billion and $2.1 billion in 2018 and 2017, respectively. On February 4, 2019, the Board of Directors declared a dividend of $0.735 per share payable March 10, 2019 to shareowners of record at the close of business on February 15, 2019.
We have an existing universal shelf registration statement filed with the SEC for an indeterminate amount of debt and equity securities for future issuance, subject to our internal limitations on the amount of debt to be issued under this shelf registration statement.
20
2017 Compared with 2016
The timing and levels of certain cash flow activities, such as acquisitions and repurchases of our stock, have resulted in the issuance of both long-term and short-term debt, including approximately $3.4 billion and $4.0 billion of net long-term debt issuances in 2017 and 2016, respectively. Commercial paper borrowings and revolving credit facilities provide short-term liquidity to supplement operating cash flows and are used for general corporate purposes, including the funding of potential acquisitions and repurchases of our stock. We had approximately $300 million and $522 million of outstanding commercial paper at December 31, 2017 and 2016, respectively. Commercial paper borrowings at December 31, 2016 were comprised of approximately €500 million ($522 million) of Euro-denominated commercial paper. We had no Euro-denominated commercial paper borrowings outstanding at December 31, 2017.
At December 31, 2017, we made cash payments of approximately $1.45 billion to repurchase approximately 12.9 million shares of our common stock during the year ended December 31, 2017. In addition to the transactions under the ASR agreements discussed above, we repurchased approximately 22 million shares of our common stock for approximately $2.25 billion during the year ended December 31, 2016.
In both 2017 and 2016, we paid aggregate dividends on common stock of approximately $2.1 billion.
Cash Flow—Discontinued Operations
| (dollars in millions) | 2018 | 2017 | 2016 | ||||||||
| Net cash flows used in discontinued operations | $ | — | $ | — | $ | (2,526 | ) | ||||
Cash flows used in operating activities of discontinued operations in 2016 primarily reflect the payment of taxes associated with the net gain realized on the sale of Sikorsky to Lockheed Martin Corp. in November 2015.
CRITICAL ACCOUNTING ESTIMATES
Preparation of our financial statements requires management to make estimates and assumptions that affect the reported amounts of assets, liabilities, revenues and expenses. Note 1 to the Consolidated Financial Statements describes the significant accounting policies used in preparation of the Consolidated Financial Statements. Management believes the most complex and sensitive judgments, because of their significance to the Consolidated Financial Statements, result primarily from the need to make estimates about the effects of matters that are inherently uncertain. The most significant areas involving management judgments and estimates are described below. Actual results in these areas could differ from management's estimates.
Long-Term Contract Accounting. Effective January 1, 2018, we adopted ASU 2014-09 and its related amendments (collectively, the New Revenue Standard) and elected the modified retrospective approach. Note 3 of the Consolidated Financial Statements contains further detail regarding the adoption of the New Revenue Standard and its impact on the Consolidated Financial Statements as of and for the year ended December 31, 2018. Under the New Revenue Standard, costs incurred for engineering and development of aerospace products under contracts with customers must be capitalized as contract fulfillment costs, to the extent recoverable from the associated contract margin, and subsequently amortized as the OEM products are delivered to the customer. The estimation of contract margin requires management's judgment. As described in Note 1, the New Revenue Standard changed the revenue recognition practices for a number of revenue streams across our businesses. Several of our businesses which previously accounted for revenue on a point in time basis are now required to use an over-time revenue recognition model when their contracts meet one or more of the mandatory criteria established in the New Revenue Standard. Revenue is now recognized on an over-time basis using an input method for repair contracts within Otis and Carrier; certain U.S. Government and commercial aerospace equipment contracts; and aerospace aftermarket service work. We measure progress toward completion for these contracts using costs incurred to date relative to total estimated costs at completion. This over-time basis using an input method requires estimates of future revenues and costs over the full term of product and/or service delivery. Incurred costs represent work performed, which correspond with and best depict transfer of control to the customer. Contract costs are incurred over a period of time, which can be several years, and the estimation of these costs requires management's judgment.
The long-term nature of these contracts, the complexity of the products, and the strict safety and performance standards under which they are regulated can affect our ability to estimate costs and margin precisely. As a result, we review our cost estimates on significant contracts on a quarterly basis and for others, at least annually or when circumstances change and warrant a modification to a previous estimate. We record changes in contract estimates using the cumulative catch-up method.
Income Taxes. The future tax benefit arising from deductible temporary differences and tax carryforwards was $4.7 billion at December 31, 2018 and $3.8 billion at December 31, 2017. Management believes that our earnings during the periods when the
21
temporary differences become deductible will be sufficient to realize the related future income tax benefits, which may be realized over an extended period of time. For those jurisdictions where the expiration date of tax carryforwards or the projected operating results indicate that realization is not likely, a valuation allowance is provided.
In assessing the need for a valuation allowance, we estimate future taxable income, considering the feasibility of ongoing tax planning strategies and the realizability of tax loss carryforwards. Valuation allowances related to deferred tax assets can be affected by changes to tax laws, changes to statutory tax rates and future taxable income levels. In the event we were to determine that we would not be able to realize all or a portion of our deferred tax assets in the future, we would reduce such amounts through an increase to tax expense in the period in which that determination is made or when tax law changes are enacted. Conversely, if we were to determine that we would be able to realize our deferred tax assets in the future in excess of the net carrying amounts, we would decrease the recorded valuation allowance through a decrease to tax expense in the period in which that determination is made.
In the ordinary course of business there is inherent uncertainty in quantifying our income tax positions. We assess our income tax positions and record tax benefits for all years subject to examination based upon management's evaluation of the facts, circumstances and information available at the reporting date. For those tax positions where it is more likely than not that a tax benefit will be sustained, we have recorded the largest amount of tax benefit with a greater than 50% likelihood of being realized upon ultimate settlement with a taxing authority that has full knowledge of all relevant information. For those income tax positions where it is not more likely than not that a tax benefit will be sustained, no tax benefit has been recognized in the financial statements. See Notes 1 and 11 to the Consolidated Financial Statements for further discussion. Also see Note 18 for discussion of UTC administrative review proceedings with the German Tax Office.
See Note 11 to the Consolidated Financial Statements for additional provision items recorded in regards to TCJA.
Goodwill and Intangible Assets. Our investments in businesses net of cash acquired in 2018 totaled $31.1 billion (including debt assumed of $7.8 billion and stock issued of $8 billion). The assets and liabilities of acquired businesses are recorded under the acquisition method of accounting at their estimated fair values at the dates of acquisition. Goodwill represents costs in excess of fair values assigned to the underlying identifiable net assets of acquired businesses. Intangible assets consist of service portfolios, patents, trademarks/tradenames, customer relationships and other intangible assets including a collaboration asset established in connection with our 2012 agreement to acquire Rolls-Royce's ownership and collaboration interests in IAE, as discussed above and in Note 2 to the Consolidated Financial Statements. As a result of the acquisition of Rockwell Collins, goodwill and intangible assets were recorded in the amount of $20.5 billion and $10.8 billion, respectively. The fair value for acquired customer relationship intangibles is determined as of the acquisition date based on estimates and judgments regarding expectations for the future after-tax cash flows arising from the follow-on revenue from customer relationships that existed on the acquisition date over their estimated lives, including the probability of expected future contract renewals and revenue, less a contributory assets charge, all of which is discounted to present value. The fair value of the tradename intangible assets were determined utilizing the relief from royalty method which is a form of the income approach. Under this method, a royalty rate based on observed market royalties is applied to projected revenue supporting the tradename and discounted to present value using an appropriate discount rate. See Note 2 to the Consolidated Financial Statements for further details.
Also included within other intangible assets are payments made to secure certain contractual rights to provide product on new commercial aerospace platforms. Such payments are capitalized when there are distinct rights obtained and there are sufficient incremental cash flows to support the recoverability of the assets established. Otherwise, the applicable portion of the payments are expensed. Capitalized payments made on these contractual commitments are amortized as a reduction of sales. We amortize these intangible assets based on the pattern of economic benefit, which typically results in an amortization method other than straight-line. In the aerospace industry, amortization based on the pattern of economic benefit generally results in lower amortization expense during the development period with increasing amortization expense as programs enter full production and aftermarket cycles. If a pattern of economic benefit cannot be reliably determined, a straight-line amortization method is used. The gross value of these contractual commitments at December 31, 2018 was approximately $11.3 billion, of which approximately $2.7 billion has been paid to date. We record these payments as intangible assets when such payments are no longer conditional. The recoverability of these intangibles is dependent upon the future success and profitability of the underlying aircraft platforms including the associated aftermarket revenue streams.
Goodwill and intangible assets deemed to have indefinite lives are not amortized, but are subject to annual, or more frequent if necessary, impairment testing using the guidance and criteria described in the Intangibles—Goodwill and Other Topic of the FASB ASC. On July 1, 2017, we early adopted ASU 2017-04, which eliminates Step 2 of the goodwill impairment test, which required a hypothetical purchase price allocation to measure goodwill impairment. A goodwill impairment loss is now measured at the amount by which a reporting unit's carrying value exceeds its fair value, without exceeding the recorded amount of goodwill. In developing our estimates for the fair value of our reporting units, significant judgment is required in the determination of the appropriateness of using a qualitative assessment or quantitative assessment. For these quantitative assessments that are performed, fair value is primarily based on income approaches using discounted cash flow models which
22
have significant assumptions. Such assumptions are subject to variability from year to year and are directly impacted by global market conditions. We completed our annual impairment testing as of July 1, 2018 and determined that no significant adjustments to the carrying value of goodwill or indefinite lived intangible assets were necessary. Although these assets are not currently impaired, there can be no assurance that future impairments will not occur. See Note 2 to the Consolidated Financial Statements for further discussion.
Contingent Liabilities. Our operating units include businesses which sell products and services and conduct operations throughout the world. As described in Note 18 to the Consolidated Financial Statements, contractual, regulatory and other matters, including asbestos claims, in the normal course of business may arise that subject us to claims or litigation. Of note, the design, development, production and support of new aerospace technologies is inherently complex and subject to risk. Since the PurePower PW1000G Geared Turbofan engine entered into service in 2016, technical issues have been identified and experienced with the engine, which is typical for new engines and new aerospace technologies. Pratt & Whitney has addressed these issues through various improvements and modifications. These issues have resulted in financial impacts, including increased warranty provisions, customer contract settlements, and reductions in contract performance estimates. Additional technical issues may also arise in the normal course, which may result in financial impacts that could be material to the Company’s financial position, results of operations and cash flows.
Additionally, we have significant contracts with the U.S. Government, subject to government oversight and audit, which may require significant adjustment of contract prices. We accrue for liabilities associated with these matters when it is probable that a liability has been incurred and the amount can be reasonably estimated. The most likely cost to be incurred is accrued based on an evaluation of then currently available facts with respect to each matter. When no amount within a range of estimates is more likely, the minimum is accrued. The inherent uncertainty related to the outcome of these matters can result in amounts materially different from any provisions made with respect to their resolution.
Employee Benefit Plans. We sponsor domestic and foreign defined benefit pension and other postretirement plans. Major assumptions used in the accounting for these employee benefit plans include the discount rate, expected return on plan assets, rate of increase in employee compensation levels, mortality rates, and health care cost increase projections. Assumptions are determined based on company data and appropriate market indicators, and are evaluated each year at December 31. A change in any of these assumptions would have an effect on net periodic pension and postretirement benefit costs reported in the Consolidated Financial Statements.
In the following table, we show the sensitivity of our pension and other postretirement benefit plan liabilities and net periodic cost to a 25 basis point change in the discount rates for benefit obligations, interest cost and service cost as of December 31, 2018:
| (dollars in millions) | Increase in Discount Rate of 25 bps | Decrease in Discount Rate of 25 bps | ||||||
| Pension plans | ||||||||
| Projected benefit obligation | $ | (1,006 | ) | $ | 1,056 | |||
| Net periodic pension (benefit) cost | (39 | ) | 41 | |||||
Other postretirement benefit plans1 | ||||||||
| Accumulated postretirement benefit obligation | (13 | ) | 14 | |||||
1 The impact on net periodic postretirement (benefit) cost is less than $1M.
These estimates assume no change in the shape or steepness of the company-specific yield curve used to plot the individual spot rates that will be applied to the future cash outflows for future benefit payments in order to calculate interest and service cost. A flattening of the yield curve, from a narrowing of the spread between interest and obligation discount rates, would increase our net periodic pension cost. Conversely, a steepening of the yield curve, from an increase in the spread between interest and obligation discount rates, would decrease our net periodic pension cost.
Pension expense is also sensitive to changes in the expected long-term rate of asset return. An increase or decrease of 25 basis points in the expected long-term rate of asset return would have decreased or increased 2018 pension expense by approximately $87 million.
The weighted-average discount rates used to measure pension liabilities and costs are set by reference to UTC-specific analyses using each plan's specific cash flows and are then compared to high-quality bond indices for reasonableness. For our significant plans, we utilize a full yield curve approach in the estimation of the service cost and interest cost components by applying the specific spot rates along the yield curve used in determination of the benefit obligation to the relevant projected cash flows. Global market interest rates have increased in 2018 as compared with 2017 and, as a result, the weighted-average discount rate used to measure pension liabilities increased from 3.4% in 2017 to 4.0% in 2018. The weighted-average discount
23
rates used to measure service cost and interest cost were 3.3% and 3.0% in 2018, respectively. In December 2009, we amended the salaried retirement plans (qualified and non-qualified) to change the retirement formula effective January 1, 2015. The formula changed from a final average earnings (FAE) and credited service formula to the existing cash balance formula that was adopted in 2003 for newly hired non-union employees and for other non-union employees who made a one-time voluntary election to have future benefit accruals determined under this formula. Employees hired after 2009 are not eligible for any defined benefit pension plan and will instead receive an enhanced benefit under the UTC Savings Plan. As of July 26, 2012 the same amendment was applied to legacy Goodrich salaried employees. Across our global pension plans, higher discount rates for pension obligations and the acquisition of Rockwell Collins, partially offset by higher discount rates for interest cost and 2018 actual returns on plan assets, will result in a net periodic pension benefit in 2019 that is expected to be approximately $100 million favorable relative to 2018 amounts.
See Note 12 to the Consolidated Financial Statements for further discussion.
OFF-BALANCE SHEET ARRANGEMENTS AND CONTRACTUAL OBLIGATIONS
We extend a variety of financial guarantees to third parties in support of unconsolidated affiliates and for potential financing requirements of commercial aerospace customers. We also have obligations arising from sales of certain businesses and assets, including indemnities for representations and warranties and environmental, health and safety, tax and employment matters. Circumstances that could cause the contingent obligations and liabilities arising from these arrangements to come to fruition include changes in an underlying transaction (e.g., hazardous waste discoveries, etc.), nonperformance under a contract, customer requests for financing, or deterioration in the financial condition of the guaranteed party.
A summary of our consolidated contractual obligations and commitments as of December 31, 2018 is as follows:
| Payments Due by Period | ||||||||||||||||||||
| (dollars in millions) | Total | 2019 | 2020-2021 | 2022-2023 | Thereafter | |||||||||||||||
| Long-term debt—principal | $ | 44,416 | $ | 2,876 | $ | 7,587 | $ | 7,433 | $ | 26,520 | ||||||||||
| Long-term debt—future interest | 18,394 | 1,515 | 2,735 | 2,336 | 11,808 | |||||||||||||||
| Operating leases | 2,916 | 683 | 951 | 536 | 746 | |||||||||||||||
| Purchase obligations | 13,948 | 9,926 | 3,693 | 289 | 40 | |||||||||||||||
| Other long-term liabilities | 3,832 | 1,017 | 1,192 | 541 | 1,082 | |||||||||||||||
| Total contractual obligations | $ | 83,506 | $ | 16,017 | $ | 16,158 | $ | 11,135 | $ | 40,196 | ||||||||||
Purchase obligations include amounts committed for the purchase of goods and services under legally enforceable contracts or purchase orders. Where it is not practically feasible to determine the legally enforceable portion of our obligation under certain of our long-term purchase agreements, we include additional expected purchase obligations beyond what is legally enforceable. Approximately 18% of the purchase obligations disclosed above represent purchase orders for products to be delivered under firm contracts with the U.S. Government for which we have full recourse under customary contract termination clauses.
Other long-term liabilities primarily include those amounts on our December 31, 2018 balance sheet representing obligations under product service and warranty policies, performance and operating cost guarantees, estimated environmental remediation costs and expected contributions under employee benefit programs. The timing of expected cash flows associated with these obligations is based upon management's estimates over the terms of these agreements and is largely based upon historical experience.
In connection with the acquisition of Rockwell Collins in 2018 and Goodrich in 2012, we recorded assumed liabilities of approximately $970 million and $2.2 billion, respectively related to customer contractual obligations on certain programs with terms less favorable than could be realized in market transactions as of the acquisition date. These liabilities are being liquidated in accordance with the underlying pattern of obligations, as reflected by the net cash outflows incurred on the contracts. Total consumption of the contractual obligations for the year ended December 31, 2018 was approximately $252 million. Total future consumption of the contractual obligations is expected to be as follows: $381 million in 2019, $295 million in 2020, $217 million in 2021, $163 million in 2022, $134 million in 2023 and $500 million thereafter. These amounts are not included in the table above.
The above table also does not reflect unrecognized tax benefits of $1,619 million, the timing of which is uncertain, except for approximately $30 million that may become payable during 2019. Refer to Note 11 to the Consolidated Financial Statements for additional discussion on unrecognized tax benefits.
24
COMMERCIAL COMMITMENTS
The following table summarizes our commercial commitments outstanding as of December 31, 2018:
| Amount of Commitment Expiration per Period | ||||||||||||||||||||
| (dollars in millions) | Committed | 2019 | 2020-2021 | 2022-2023 | Thereafter | |||||||||||||||
| Commercial aerospace financing commitments | $ | 4,556 | $ | 862 | $ | 1,710 | $ | 1,513 | $ | 471 | ||||||||||
| Other commercial aerospace commitments | 10,914 | 815 | 1,379 | 1,293 | 7,427 | |||||||||||||||
| Commercial aerospace financing arrangements | 348 | — | 21 | 5 | 322 | |||||||||||||||
| Credit facilities and debt obligations (expire 2019 to 2028) | 116 | 101 | — | — | 15 | |||||||||||||||
| Performance guarantees | 55 | 7 | — | 39 | 9 | |||||||||||||||
| Total commercial commitments | $ | 15,989 | $ | 1,785 | $ | 3,110 | $ | 2,850 | $ | 8,244 | ||||||||||
In connection with our 2012 agreement to acquire Rolls-Royce's ownership and collaboration interests in IAE, additional payments are due to Rolls-Royce contingent upon each hour flown through June 2027 by the V2500-powered aircraft in service as of the acquisition date. These flight hour payments, included in "Other commercial aerospace commitments" in the table above, are being capitalized as collaboration intangible assets. The collaboration intangible assets are amortized based upon the pattern of economic benefit as represented by the underlying cash flows.
We also have other contractual commitments, including commitments to secure certain contractual rights to provide product on new aircraft platforms, which are included in "Other commercial aerospace commitments" in the table above. Such payments are capitalized when distinct rights are obtained and there are sufficient incremental cash flows to support the recoverability of the assets established. Otherwise, the applicable portion of the payments are expensed. Capitalized payments made on these contractual commitments are included in intangible assets and are amortized over the term of underlying economic benefit.
Refer to Notes 1, 5 and 17 to the Consolidated Financial Statements for additional discussion on contractual and commercial commitments.
MARKET RISK AND RISK MANAGEMENT
We are exposed to fluctuations in foreign currency exchange rates, interest rates and commodity prices. To manage certain of those exposures, we use derivative instruments, including swaps, forward contracts and options. Derivative instruments utilized by us in our hedging activities are viewed as risk management tools, involve relatively little complexity and are not used for trading or speculative purposes. We diversify the counterparties used and monitor the concentration of risk to limit our counterparty exposure.
We have evaluated our exposure to changes in foreign currency exchange rates, interest rates and commodity prices in our market risk sensitive instruments, which are primarily cash, debt, and derivative instruments, using a value at risk analysis. Based on a 95% confidence level and a one-day holding period, at December 31, 2018, the potential loss in fair value on our market risk sensitive instruments was not material in relation to our financial position, results of operations or cash flows. Our calculated value at risk exposure represents an estimate of reasonably possible net losses based on volatilities and correlations and is not necessarily indicative of actual results. Refer to Notes 1, 9 and 14 to the Consolidated Financial Statements for additional discussion of foreign currency exchange, interest rates and financial instruments.
Foreign Currency Exposures. We have a large volume of foreign currency exposures that result from our international sales, purchases, investments, borrowings and other international transactions. International segment sales, excluding U.S. export sales, averaged approximately $26 billion over the last three years. We actively manage foreign currency exposures that are associated with committed foreign currency purchases and sales, and other assets and liabilities created in the normal course of business at the operating unit level. More than insignificant exposures that cannot be naturally offset within an operating unit are hedged with foreign currency derivatives. We also have a significant amount of foreign currency net asset exposures. As discussed in Note 9 to the Consolidated Financial Statements, at December 31, 2018 we have approximately €4.95 billion of euro-denominated long-term debt and €750 million of euro-denominated commercial paper borrowings outstanding, which qualify as a net investment hedge against our investments in European businesses. As of December 31, 2018, the net investment hedge is deemed to be effective. Currently, we do not hold any derivative contracts that hedge our foreign currency net asset exposures but may consider such strategies in the future.
Within aerospace, our sales are typically denominated in U.S. Dollars under accepted industry convention. However, for our non-U.S. based entities, such as P&WC, a substantial portion of their costs are incurred in local currencies. Consequently,
25
there is a foreign currency exchange impact and risk to operational results as U.S. Dollars must be converted to local currencies such as the Canadian Dollar in order to meet local currency cost obligations. Additionally, we transact business in various foreign currencies which exposes our cash flows and earnings to changes in foreign currency exchange rates. In order to minimize the exposure that exists from changes in the exchange rate of the U.S. Dollar against these other currencies, we hedge a certain portion of sales to secure the rates at which U.S. Dollars will be converted. The majority of this hedging activity occurs at P&WC and Collins Aerospace Systems, and hedging activity also occurs to a lesser extent at the remainder of Pratt & Whitney. At P&WC and Collins Aerospace Systems, firm and forecasted sales for both original equipment and spare parts are hedged at varying amounts for up to 49 months on the U.S. Dollar sales exposure as represented by the excess of U.S. Dollar sales over U.S. Dollar denominated purchases. Hedging gains and losses resulting from movements in foreign currency exchange rates are partially offset by the foreign currency translation impacts that are generated on the translation of local currency operating results into U.S. Dollars for reporting purposes. While the objective of the hedging program is to minimize the foreign currency exchange impact on operating results, there are typically variances between the hedging gains or losses and the translational impact due to the length of hedging contracts, changes in the sales profile, volatility in the exchange rates and other such operational considerations.
Interest Rate Exposures. Our long-term debt portfolio consists mostly of fixed-rate instruments. From time to time, we may hedge to floating rates using interest rate swaps. The hedges are designated as fair value hedges and the gains and losses on the swaps are reported in interest expense, reflecting that portion of interest expense at a variable rate. We issue commercial paper, which exposes us to changes in interest rates. Currently, we do not hold any derivative contracts that hedge our interest exposures, but may consider such strategies in the future.
Commodity Price Exposures. We are exposed to volatility in the prices of raw materials used in some of our products and from time to time we may use forward contracts in limited circumstances to manage some of those exposures. In the future, if hedges are used, gains and losses may affect earnings. There were no significant outstanding commodity hedges as of December 31, 2018.
ENVIRONMENTAL MATTERS
Our operations are subject to environmental regulation by federal, state and local authorities in the United States and regulatory authorities with jurisdiction over our foreign operations. As a result, we have established, and continually update, policies relating to environmental standards of performance for our operations worldwide. We believe that expenditures necessary to comply with the present regulations governing environmental protection will not have a material effect upon our competitive position, results of operations, cash flows or financial condition.
We have identified 741 locations, mostly in the United States, at which we may have some liability for remediating contamination. We have resolved our liability at 352 of these locations. We do not believe that any individual location's exposure will have a material effect on our results of operations. Sites in the investigation, remediation or operation and maintenance stage represent approximately 93% of our accrued environmental remediation reserve.
We have been identified as a potentially responsible party under the Comprehensive Environmental Response Compensation and Liability Act (CERCLA or Superfund) at 128 sites. The number of Superfund sites, in and of itself, does not represent a relevant measure of liability because the nature and extent of environmental concerns vary from site to site and our share of responsibility varies from sole responsibility to very little responsibility. In estimating our liability for remediation, we consider our likely proportionate share of the anticipated remediation expense and the ability of other potentially responsible parties to fulfill their obligations.
At December 31, 2018 and 2017, we had $830 million reserved for environmental remediation. Cash outflows for environmental remediation were $48 million in 2018, $42 million in 2017 and $44 million in 2016. We estimate that ongoing environmental remediation expenditures in each of the next two years will not exceed approximately $100 million.
ASBESTOS MATTERS
As a result of the definitization of the insurance coverage for existing and potential future asbestos claims through the negotiation and establishment of settlement agreements during 2015, as well as the stabilization of company and industry experience, we established a reserve for our potential asbestos exposure, recording a noncash pretax charge to earnings of $237 million in the fourth quarter of 2015.
Our estimated total liability to resolve all pending and unasserted potential future asbestos claims through 2059 is approximately $335 million and is principally recorded in Other long-term liabilities on our Consolidated Balance Sheet as of December 31, 2018. This amount is on a pre-tax basis, not discounted, and excludes the Company’s legal fees to defend the asbestos claims (which will continue to be expensed by the Company as they are incurred). In addition, the Company has an insurance recovery receivable for probable asbestos related recoveries of approximately $155 million, which is included
26
primarily in Other assets on our Consolidated Balance Sheet as of December 31, 2018. See Note 18 "Contingent Liabilities" of our Consolidated Financial Statements for further discussion of this matter.
GOVERNMENT MATTERS
As described in "Critical Accounting Estimates—Contingent Liabilities," our contracts with the U.S. Government are subject to audits. Such audits may recommend that certain contract prices should be reduced to comply with various government regulations, or that certain payments be delayed or withheld. We are also the subject of one or more investigations and legal proceedings initiated by the U.S. Government with respect to government contract matters. See "Legal Proceedings" in Item 1 to this Form 10-K, and Note 11 "Income Taxes" and Note 18 "Contingent Liabilities" of our Consolidated Financial Statements for further discussion of these and other government matters.
27
Cautionary Note Concerning Factors That May Affect Future Results
This 2018 Annual Report to Shareowners (2018 Annual Report) contains statements which, to the extent they are not statements of historical or present fact, constitute "forward-looking statements" under the securities laws. From time to time, oral or written forward-looking statements may also be included in other information released to the public. These forward-looking statements are intended to provide management’s current expectations or plans for our future operating and financial performance, based on assumptions currently believed to be valid. Forward-looking statements can be identified by the use of words such as "believe," "expect," "expectations," "plans," "strategy," "prospects," "estimate," "project," "target," "anticipate," "will," "should," "see," "guidance," "outlook", "confident" and other words of similar meaning in connection with a discussion of future operating or financial performance or the separation transactions. Forward-looking statements may include, among other things, statements relating to future sales, earnings, cash flow, results of operations, uses of cash, share repurchases, tax rates and other measures of financial performance or potential future plans, strategies or transactions of United Technologies or the independent companies following United Technologies’ expected separation into three independent companies, the anticipated benefits of the acquisition of Rockwell Collins or of the separation transactions, including estimated synergies resulting from the Rockwell Collins transaction, the expected timing of completion of the separation transactions, estimated costs associated with such transactions and other statements that are not historical facts. All forward-looking statements involve risks, uncertainties and other factors that may cause actual results to differ materially from those expressed or implied in the forward-looking statements. For those statements, we claim the protection of the safe harbor for forward-looking statements contained in the U.S. Private Securities Litigation Reform Act of 1995. Such risks, uncertainties and other factors include, without limitation:
| • | the effect of economic conditions in the industries and markets in which we operate in the U.S. and globally and any changes therein, including financial market conditions, fluctuations in commodity prices, interest rates and foreign currency exchange rates, levels of end market demand in construction and in both the commercial and defense segments of the aerospace industry, levels of air travel, financial condition of commercial airlines, the impact of weather conditions and natural disasters and the financial condition of our customers and suppliers; |
| • | challenges in the development, production, delivery, support, performance and realization of the anticipated benefits (including expected returns under customer contracts) of advanced technologies and new products and services; |
| • | the scope, nature, impact or timing of the expected separation transactions and other acquisition and divestiture activity, including among other things integration of acquired businesses into UTC's existing businesses and realization of synergies and opportunities for growth and innovation and incurrence of related costs and expenses; |
| • | future levels of indebtedness, including indebtedness that may be incurred in connection with the expected separation transactions, and capital spending and research and development spending; |
| • | future availability of credit and factors that may affect such availability, including credit market conditions and our capital structure; |
| • | the timing and scope of future repurchases of our common stock, which may be suspended at any time due to various factors, including market conditions and the level of other investing activities and uses of cash; |
| • | delays and disruption in delivery of materials and services from suppliers; |
| • | company and customer-directed cost reduction efforts and restructuring costs and savings and other consequences thereof; |
| • | new business and investment opportunities; |
| • | our ability to realize the intended benefits of organizational changes; |
| • | the anticipated benefits of diversification and balance of operations across product lines, regions and industries; |
| • | the outcome of legal proceedings, investigations and other contingencies; |
| • | pension plan assumptions and future contributions; |
| • | the impact of the negotiation of collective bargaining agreements and labor disputes; |
| • | the effect of changes in political conditions in the U.S. and other countries in which we operate, including the effect of changes in U.S. trade policies or the U.K.'s pending withdrawal from the European Union, on general market conditions, global trade policies and currency exchange rates in the near term and beyond; |
| • | the effect of changes in tax (including the U.S. tax reform enacted on December 22, 2017 and is commonly referred to as the Tax Cuts and Jobs Act of 2017 (TCJA)), environmental, regulatory (including among other things import/export) and other laws and regulations in the U.S. and other countries in which we operate; |
| • | negative effects of the Rockwell Collins acquisition or of the announcement or pendency of the separation transactions on the market price of UTC’s common stock and on its financial performance; |
| • | risks relating to the integration of Rockwell Collins, including the risk that the integration may be more difficult, time-consuming or costly than expected or may not result in the achievement of estimated synergies within the contemplated time frame or at all; |
| • | our ability to retain and hire key personnel; |
28
| • | the expected benefits and timing of the separation transactions, and the risk that conditions to the separation transactions will not be satisfied and/or that the separation transactions will not be completed within the expected time frame, on the expected terms or at all; |
| • | the expected qualification of the separation transactions as tax-free transactions for U.S. federal income tax purposes; |
| • | the possibility that any consents or approvals required in connection with the expected separation transactions will not be received or obtained within the expected time frame, on the expected terms or at all; |
| • | expected financing transactions undertaken in connection with the separation transactions and risks associated with additional indebtedness; |
| • | the risk that dissynergy costs, costs of restructuring transactions and other costs incurred in connection with the expected separation transactions will exceed our estimates; and |
| • | the impact of the expected separation transactions on our businesses and the risk that the separation transactions may be more difficult, time-consuming or costly than expected, including the impact on our resources, systems, procedures and controls, diversion of management’s attention and the impact on relationships with customers, suppliers, employees and other business counterparties. |
In addition, our Annual Report on Form 10-K for 2018 includes important information as to risks, uncertainties and other factors that may cause actual results to differ materially from those expressed or implied in the forward-looking statements. See the "Notes to Consolidated Financial Statements" under the heading "Note 18: Contingent Liabilities," the section titled "Management's Discussion and Analysis of Financial Condition and Results of Operations" under the headings "Business Overview," "Results of Operations," "Liquidity and Financial Condition," and "Critical Accounting Estimates," and the section titled "Risk Factors." Our Annual Report on Form 10-K for 2018 also includes important information as to these factors in the "Business" section under the headings "General," "Description of Business by Segment" and "Other Matters Relating to Our Business as a Whole," and in the "Legal Proceedings" section. Additional important information as to these factors is included in this 2018 Annual Report in the section titled "Management's Discussion and Analysis of Financial Condition and Results of Operations" under the headings "Restructuring Costs," "Environmental Matters" and "Governmental Matters." The forward-looking statements speak only as of the date of this report or, in the case of any document incorporated by reference, the date of that document. We undertake no obligation to publicly update or revise any forward-looking statements, whether as a result of new information, future events or otherwise, except as required by applicable law. Additional information as to factors that may cause actual results to differ materially from those expressed or implied in the forward-looking statements is disclosed from time to time in our other filings with the SEC.
29
Management's Report on Internal Control over Financial Reporting
The management of UTC is responsible for establishing and maintaining adequate internal control over financial reporting. Internal control over financial reporting is a process designed to provide reasonable assurance regarding the reliability of financial reporting and the preparation of financial statements for external reporting purposes in accordance with accounting principles generally accepted in the United States of America. Because of its inherent limitations, internal control over financial reporting may not prevent or detect misstatements.
On November 26, 2018, the Company completed its merger of Rockwell Collins. Accordingly, the acquired assets and liabilities of Rockwell Collins are included in our consolidated balance sheet as of December 31, 2018 and the results of its operations and cash flows are reported in our consolidated statements of operations and cash flows from November 26, 2018 through December 31, 2018. We have elected to exclude Rockwell Collins from the scope of our report on internal control over financial reporting as of December 31, 2018. Rockwell Collins is a wholly-owned subsidiary whose total assets and total revenues excluded from the scope of our report represent 5 percent and 1 percent, respectively of the related consolidated financial statement amounts as of and for the year ended December 31, 2018.
Management has assessed the effectiveness of UTC's internal control over financial reporting as of December 31, 2018. In making its assessment, management has utilized the criteria set forth by the Committee of Sponsoring Organizations of the Treadway Commission in its Internal Control—Integrated Framework, released in 2013. Management concluded that based on its assessment, UTC's internal control over financial reporting was effective as of December 31, 2018. The effectiveness of UTC's internal control over financial reporting, as of December 31, 2018, has been audited by PricewaterhouseCoopers LLP, an independent registered public accounting firm, as stated in their report which is included herein.
| /s/ Gregory J. Hayes | |
| Gregory J. Hayes | |
| Chairman, President and Chief Executive Officer | |
| /s/ Akhil Johri | |
| Akhil Johri | |
| Executive Vice President & Chief Financial Officer | |
| /s/ Robert J. Bailey | |
| Robert J. Bailey | |
| Corporate Vice President, Controller | |
30
Report of Independent Registered Public Accounting Firm
To the Shareowners and Board of Directors of United Technologies Corporation
Opinions on the Financial Statements and Internal Control over Financial Reporting
We have audited the accompanying consolidated balance sheets of United Technologies Corporation and its subsidiaries (the “Corporation”) as of December 31, 2018 and 2017, and the related consolidated statements of operations, of comprehensive income, of changes in equity and of cash flows for each of the three years in the period ended December 31, 2018, including the related notes (collectively referred to as the “consolidated financial statements”). We also have audited the Corporation's internal control over financial reporting as of December 31, 2018, based on criteria established in Internal Control - Integrated Framework (2013) issued by the Committee of Sponsoring Organizations of the Treadway Commission (COSO).
In our opinion, the consolidated financial statements referred to above present fairly, in all material respects, the financial position of the Corporation as of December 31, 2018 and 2017, and the results of its operations and its cash flows for each of the three years in the period ended December 31, 2018 in conformity with accounting principles generally accepted in the United States of America. Also in our opinion, the Corporation maintained, in all material respects, effective internal control over financial reporting as of December 31, 2018, based on criteria established in Internal Control - Integrated Framework (2013) issued by the COSO.
Change in Accounting Principles
As discussed in Notes 3 and 12 to the consolidated financial statements, the Corporation changed the manner in which it accounts for revenue from contracts with customers and the manner in which it accounts for net periodic benefit cost in 2018.
Basis for Opinions
The Corporation's management is responsible for these consolidated financial statements, for maintaining effective internal control over financial reporting, and for its assessment of the effectiveness of internal control over financial reporting, included in the accompanying Management’s Report on Internal Control over Financial Reporting. Our responsibility is to express opinions on the Corporation’s consolidated financial statements and on the Corporation's internal control over financial reporting based on our audits. We are a public accounting firm registered with the Public Company Accounting Oversight Board (United States) (PCAOB) and are required to be independent with respect to the Corporation in accordance with the U.S. federal securities laws and the applicable rules and regulations of the Securities and Exchange Commission and the PCAOB.
We conducted our audits in accordance with the standards of the PCAOB. Those standards require that we plan and perform the audits to obtain reasonable assurance about whether the consolidated financial statements are free of material misstatement, whether due to error or fraud, and whether effective internal control over financial reporting was maintained in all material respects.
Our audits of the consolidated financial statements included performing procedures to assess the risks of material misstatement of the consolidated financial statements, whether due to error or fraud, and performing procedures that respond to those risks. Such procedures included examining, on a test basis, evidence regarding the amounts and disclosures in the consolidated financial statements. Our audits also included evaluating the accounting principles used and significant estimates made by management, as well as evaluating the overall presentation of the consolidated financial statements. Our audit of internal control over financial reporting included obtaining an understanding of internal control over financial reporting, assessing the risk that a material weakness exists, and testing and evaluating the design and operating effectiveness of internal control based on the assessed risk. Our audits also included performing such other procedures as we considered necessary in the circumstances. We believe that our audits provide a reasonable basis for our opinions.
As described in Management’s Report on Internal Control over Financial Reporting, management has excluded Rockwell Collins, Inc. from its assessment of internal control over financial reporting as of December 31, 2018 because it was acquired by the Corporation in a purchase business combination during 2018. We have also excluded Rockwell Collins, Inc. from our audit of internal control over financial reporting. Rockwell Collins, Inc. is a wholly-owned subsidiary whose total assets and
31
total revenues excluded from management’s assessment and our audit of internal control over financial reporting represent 5% and 1%, respectively, of the related consolidated financial statement amounts as of and for the year ended December 31, 2018.
Definition and Limitations of Internal Control over Financial Reporting
A corporation’s internal control over financial reporting is a process designed to provide reasonable assurance regarding the reliability of financial reporting and the preparation of financial statements for external purposes in accordance with generally accepted accounting principles. A corporation’s internal control over financial reporting includes those policies and procedures that (i) pertain to the maintenance of records that, in reasonable detail, accurately and fairly reflect the transactions and dispositions of the assets of the corporation; (ii) provide reasonable assurance that transactions are recorded as necessary to permit preparation of financial statements in accordance with generally accepted accounting principles, and that receipts and expenditures of the corporation are being made only in accordance with authorizations of management and directors of the corporation; and (iii) provide reasonable assurance regarding prevention or timely detection of unauthorized acquisition, use, or disposition of the corporation’s assets that could have a material effect on the financial statements.
Because of its inherent limitations, internal control over financial reporting may not prevent or detect misstatements. Also, projections of any evaluation of effectiveness to future periods are subject to the risk that controls may become inadequate because of changes in conditions, or that the degree of compliance with the policies or procedures may deteriorate.
PricewaterhouseCoopers LLP
Hartford, Connecticut
February 7, 2019
We have served as the Corporation’s auditor since 1947.
32
Consolidated Statement of Operations
| (dollars in millions, except per share amounts; shares in millions) | 2018 | 2017 | 2016 | |||||||||
| Net Sales: | ||||||||||||
| Product sales | $ | 45,434 | $ | 41,361 | $ | 40,735 | ||||||
| Service sales | 21,067 | 18,476 | 16,509 | |||||||||
| 66,501 | 59,837 | 57,244 | ||||||||||
| Costs and Expenses: | ||||||||||||
| Cost of products sold | 36,754 | 31,224 | 30,304 | |||||||||
| Cost of services sold | 13,231 | 12,977 | 11,167 | |||||||||
| Research and development | 2,462 | 2,427 | 2,376 | |||||||||
| Selling, general and administrative | 7,066 | 6,429 | 5,958 | |||||||||
| 59,513 | 53,057 | 49,805 | ||||||||||
| Other income, net | 1,565 | 1,358 | 782 | |||||||||
| Operating profit | 8,553 | 8,138 | 8,221 | |||||||||
| Non-service pension (benefit) cost | (765 | ) | (534 | ) | 49 | |||||||
| Interest expense, net | 1,038 | 909 | 1,039 | |||||||||
| Income from continuing operations before income taxes | 8,280 | 7,763 | 7,133 | |||||||||
| Income tax expense | 2,626 | 2,843 | 1,697 | |||||||||
| Net income from continuing operations | 5,654 | 4,920 | 5,436 | |||||||||
| Less: Noncontrolling interest in subsidiaries' earnings from continuing operations | 385 | 368 | 371 | |||||||||
| Income from continuing operations attributable to common shareowners | 5,269 | 4,552 | 5,065 | |||||||||
| Discontinued operations: | ||||||||||||
| Income from operations | — | — | 1 | |||||||||
| Gain on disposal | — | — | 13 | |||||||||
| Income tax expense | — | — | (24 | ) | ||||||||
| Net loss from discontinued operations | — | — | (10 | ) | ||||||||
| Net income attributable to common shareowners | $ | 5,269 | $ | 4,552 | $ | 5,055 | ||||||
| Earnings Per Share of Common Stock—Basic: | ||||||||||||
| Net income from continuing operations attributable to common shareowners | $ | 6.58 | $ | 5.76 | $ | 6.19 | ||||||
| Net income attributable to common shareowners | $ | 6.58 | $ | 5.76 | $ | 6.18 | ||||||
| Earnings Per Share of Common Stock—Diluted: | ||||||||||||
| Net income from continuing operations attributable to common shareowners | $ | 6.50 | $ | 5.70 | $ | 6.13 | ||||||
| Net income attributable to common shareowners | $ | 6.50 | $ | 5.70 | $ | 6.12 | ||||||
| Weighted average number of shares outstanding: | ||||||||||||
| Basic shares | 800.4 | 790.0 | 818.2 | |||||||||
| Diluted shares | 810.1 | 799.1 | 826.1 | |||||||||
See accompanying Notes to Consolidated Financial Statements
33
Consolidated Statement of Comprehensive Income
| (dollars in millions) | 2018 | 2017 | 2016 | |||||||||
| Net income from continuing operations | $ | 5,654 | $ | 4,920 | $ | 5,436 | ||||||
| Net loss from discontinued operations | — | — | (10 | ) | ||||||||
| Net income | 5,654 | 4,920 | 5,426 | |||||||||
| Other comprehensive (loss) income, net of tax | ||||||||||||
| Foreign currency translation adjustments | ||||||||||||
| Foreign currency translation adjustments arising during period | (516 | ) | 620 | (1,089 | ) | |||||||
Less: Reclassification adjustments for gain on sale of an investment in a foreign entity recognized in Other income, net | (2 | ) | (10 | ) | — | |||||||
| (518 | ) | 610 | (1,089 | ) | ||||||||
| Tax (expense) | (4 | ) | — | — | ||||||||
| (522 | ) | 610 | (1,089 | ) | ||||||||
| Pension and postretirement benefit plans | ||||||||||||
| Net actuarial (loss) gain arising during period | (1,819 | ) | 241 | (785 | ) | |||||||
| Prior service (cost) credit arising during period | (22 | ) | 2 | (13 | ) | |||||||
Amortization of actuarial loss and prior service cost | 344 | 529 | 535 | |||||||||
| Other | 105 | (116 | ) | 542 | ||||||||
| (1,392 | ) | 656 | 279 | |||||||||
| Tax benefit (expense) | 326 | (263 | ) | (189 | ) | |||||||
| (1,066 | ) | 393 | 90 | |||||||||
| Unrealized (loss) gain on available-for-sale securities | ||||||||||||
| Unrealized holding gain arising during period | — | 5 | 190 | |||||||||
| Reclassification adjustments for gain included in Other income, net | — | (566 | ) | (94 | ) | |||||||
| ASU 2016-01 adoption impact (Note 10) | (5 | ) | — | — | ||||||||
| (5 | ) | (561 | ) | 96 | ||||||||
| Tax benefit (expense) | — | 213 | (36 | ) | ||||||||
| (5 | ) | (348 | ) | 60 | ||||||||
| Change in unrealized cash flow hedging | ||||||||||||
| Unrealized cash flow hedging (loss) gain arising during period | (307 | ) | 347 | 75 | ||||||||
| (Gain) loss reclassified into Product sales | (16 | ) | (39 | ) | 171 | |||||||
| (323 | ) | 308 | 246 | |||||||||
| Tax benefit (expense) | 78 | (74 | ) | (69 | ) | |||||||
| (245 | ) | 234 | 177 | |||||||||
| Other comprehensive (loss) income, net of tax | (1,838 | ) | 889 | (762 | ) | |||||||
| Comprehensive income | 3,816 | 5,809 | 4,664 | |||||||||
| Less: comprehensive income attributable to noncontrolling interest | (355 | ) | (448 | ) | (324 | ) | ||||||
| Comprehensive income attributable to common shareowners | $ | 3,461 | $ | 5,361 | $ | 4,340 | ||||||
See accompanying Notes to Consolidated Financial Statements
34
Consolidated Balance Sheet
| (dollars in millions, except per share amounts; shares in thousands) | 2018 | 2017 | ||||||
| Assets | ||||||||
| Cash and cash equivalents | $ | 6,152 | $ | 8,985 | ||||
| Accounts receivable (net of allowance for doubtful accounts of $488 and $456) | 14,271 | 12,595 | ||||||
| Contract assets, current | 3,486 | — | ||||||
| Inventories and contracts in progress, net | 10,083 | 9,881 | ||||||
| Other assets, current | 1,511 | 1,397 | ||||||
| Total Current Assets | 35,503 | 32,858 | ||||||
| Customer financing assets | 3,023 | 2,372 | ||||||
| Future income tax benefits | 1,646 | 1,723 | ||||||
| Fixed assets, net | 12,297 | 10,186 | ||||||
| Goodwill | 48,112 | 27,910 | ||||||
| Intangible assets, net | 26,424 | 15,883 | ||||||
| Other assets | 7,206 | 5,988 | ||||||
| Total Assets | $ | 134,211 | $ | 96,920 | ||||
| Liabilities and Equity | ||||||||
| Short-term borrowings | $ | 1,469 | $ | 392 | ||||
| Accounts payable | 11,080 | 9,579 | ||||||
| Accrued liabilities | 10,223 | 12,316 | ||||||
| Contract liabilities, current | 5,720 | — | ||||||
| Long-term debt currently due | 2,876 | 2,104 | ||||||
| Total Current Liabilities | 31,368 | 24,391 | ||||||
| Long-term debt | 41,192 | 24,989 | ||||||
| Future pension and postretirement benefit obligations | 4,018 | 3,036 | ||||||
| Other long-term liabilities | 16,914 | 12,952 | ||||||
| Total Liabilities | 93,492 | 65,368 | ||||||
| Commitments and contingent liabilities (Notes 5 and 18) | ||||||||
| Redeemable noncontrolling interest | 109 | 131 | ||||||
| Shareowners’ Equity: | ||||||||
| Capital Stock: | ||||||||
| Preferred Stock, $1 par value; 250,000 shares authorized; None issued or outstanding | — | — | ||||||
| Common Stock, $1 par value; 4,000,000 shares authorized; 1,446,961 and 1,444,187 shares issued | 22,514 | 17,574 | ||||||
| Treasury Stock— 585,479 and 645,057 common shares at average cost | (32,482 | ) | (35,596 | ) | ||||
| Retained earnings | 57,823 | 55,242 | ||||||
| Unearned ESOP shares | (76 | ) | (85 | ) | ||||
| Total Accumulated other comprehensive loss | (9,333 | ) | (7,525 | ) | ||||
| Total Shareowners’ Equity | 38,446 | 29,610 | ||||||
| Noncontrolling interest | 2,164 | 1,811 | ||||||
| Total Equity | 40,610 | 31,421 | ||||||
| Total Liabilities and Equity | $ | 134,211 | $ | 96,920 | ||||
See accompanying Notes to Consolidated Financial Statements
35
Consolidated Statement of Cash Flows
| (dollars in millions) | 2018 | 2017 | 2016 | |||||||||
| Operating Activities of Continuing Operations: | ||||||||||||
| Net income from continuing operations | $ | 5,654 | $ | 4,920 | $ | 5,436 | ||||||
| Adjustments to reconcile income from continuing operations to net cash flows provided by operating activities of continuing operations: | ||||||||||||
| Depreciation and amortization | 2,433 | 2,140 | 1,962 | |||||||||
| Deferred income tax provision | 735 | 62 | 398 | |||||||||
| Stock compensation cost | 251 | 192 | 152 | |||||||||
| Gain on sale of Taylor Company | (799 | ) | — | — | ||||||||
| Change in: | ||||||||||||
| Accounts receivable | (2,426 | ) | (448 | ) | (941 | ) | ||||||
| Contract assets, current | (604 | ) | — | — | ||||||||
| Inventories and contracts in progress | (537 | ) | (1,074 | ) | (719 | ) | ||||||
| Other current assets | 161 | (101 | ) | 49 | ||||||||
| Accounts payable and accrued liabilities | 2,446 | 1,571 | 450 | |||||||||
| Contract liabilities, current | 205 | — | — | |||||||||
| Global pension contributions | (147 | ) | (2,112 | ) | (303 | ) | ||||||
| Canadian government settlement | (429 | ) | (285 | ) | (237 | ) | ||||||
| Other operating activities, net | (621 | ) | 766 | 165 | ||||||||
| Net cash flows provided by operating activities of continuing operations | 6,322 | 5,631 | 6,412 | |||||||||
| Investing Activities of Continuing Operations: | ||||||||||||
| Capital expenditures | (1,902 | ) | (2,014 | ) | (1,699 | ) | ||||||
| Increase in customer financing assets | (988 | ) | (1,197 | ) | (438 | ) | ||||||
| Decrease in customer financing assets | 606 | 222 | 217 | |||||||||
| Investments in businesses (Note 2) | (15,398 | ) | (231 | ) | (710 | ) | ||||||
| Dispositions of businesses (Note 2) | 1,105 | 70 | 211 | |||||||||
| Proceeds from sale of investments in Watsco, Inc. | — | 596 | — | |||||||||
| Increase in collaboration intangible assets | (400 | ) | (380 | ) | (388 | ) | ||||||
| Receipts (payments) from settlements of derivative contracts | 143 | (317 | ) | 249 | ||||||||
| Other investing activities, net | (139 | ) | 232 | 49 | ||||||||
| Net cash flows used in investing activities of continuing operations | (16,973 | ) | (3,019 | ) | (2,509 | ) | ||||||
| Financing Activities of Continuing Operations: | ||||||||||||
| Issuance of long-term debt | 13,455 | 4,954 | 6,469 | |||||||||
| Repayment of long-term debt | (2,520 | ) | (1,604 | ) | (2,452 | ) | ||||||
| Decrease in short-term borrowings, net | (356 | ) | (271 | ) | (331 | ) | ||||||
| Proceeds from Common Stock issued under employee stock plans | 36 | 31 | 13 | |||||||||
| Dividends paid on Common Stock | (2,170 | ) | (2,074 | ) | (2,069 | ) | ||||||
| Repurchase of Common Stock | (325 | ) | (1,453 | ) | (2,254 | ) | ||||||
| Other financing activities, net | (155 | ) | (576 | ) | (564 | ) | ||||||
| Net cash flows provided by (used in) financing activities of continuing operations | 7,965 | (993 | ) | (1,188 | ) | |||||||
| Discontinued Operations: | ||||||||||||
| Net cash used in operating activities | — | — | (2,532 | ) | ||||||||
| Net cash provided by investing activities | — | — | 6 | |||||||||
| Net cash flows used in discontinued operations | — | — | (2,526 | ) | ||||||||
| Effect of foreign exchange rate changes on cash and cash equivalents | (120 | ) | 210 | (120 | ) | |||||||
| Net (decrease) increase in cash, cash equivalents and restricted cash | (2,806 | ) | 1,829 | 69 | ||||||||
| Cash, cash equivalents and restricted cash, beginning of year | 9,018 | 7,189 | 7,120 | |||||||||
| Cash, cash equivalents and restricted cash, end of year | 6,212 | 9,018 | 7,189 | |||||||||
| Less: Restricted cash, included in Other assets | 60 | 33 | 32 | |||||||||
| Cash and cash equivalents of continuing operations, end of year | $ | 6,152 | $ | 8,985 | $ | 7,157 | ||||||
| Supplemental Disclosure of Cash Flow Information: | ||||||||||||
| Interest paid, net of amounts capitalized | $ | 1,027 | $ | 974 | $ | 1,157 | ||||||
| Income taxes paid, net of refunds | $ | 1,714 | $ | 1,326 | $ | 4,096 | ||||||
See accompanying Notes to Consolidated Financial Statements
36
Consolidated Statement of Changes in Equity
| (dollars in millions, except per share amounts; shares in thousands) | 2018 | 2017 | 2016 | |||||||||
| Equity at January 1 | $ | 31,421 | $ | 29,169 | 28,844 | |||||||
| Common Stock | ||||||||||||
| Balance at January 1 | 17,574 | 17,285 | 16,033 | |||||||||
| Common Stock issued under employee plans | 423 | 331 | 262 | |||||||||
| Common Stock repurchased | — | 1 | 998 | |||||||||
| Common Stock issued for Rockwell Collins outstanding common stock & equity awards | 4,523 | — | — | |||||||||
| (Purchase) sale of subsidiary shares from noncontrolling interest, net | (6 | ) | 4 | (8 | ) | |||||||
| Redeemable noncontrolling interest fair value adjustment | — | (47 | ) | — | ||||||||
| Balance at December 31 | 22,514 | 17,574 | 17,285 | |||||||||
| Treasury Stock | ||||||||||||
| Balance at January 1 | (35,596 | ) | (34,150 | ) | (30,907 | ) | ||||||
| Common Stock issued under employee plans | 6 | 7 | 9 | |||||||||
| Common Stock repurchased | (329 | ) | (1,453 | ) | (3,252 | ) | ||||||
| Common Stock issued for Rockwell Collins outstanding common stock & equity awards | 3,437 | — | — | |||||||||
| Balance at December 31 | (32,482 | ) | (35,596 | ) | (34,150 | ) | ||||||
| Retained Earnings | ||||||||||||
| Balance at January 1 | 55,242 | 52,873 | 49,956 | |||||||||
| Net Income | 5,269 | 4,552 | 5,055 | |||||||||
| Dividends on Common Stock | (2,170 | ) | (2,074 | ) | (2,069 | ) | ||||||
| Dividends on ESOP Common Stock | (71 | ) | (72 | ) | (74 | ) | ||||||
| Redeemable noncontrolling interest fair value adjustment | 7 | (42 | ) | (1 | ) | |||||||
| New Revenue Standard adoption impact | (480 | ) | — | — | ||||||||
| Other | 26 | 5 | 6 | |||||||||
| Balance at December 31 | 57,823 | 55,242 | 52,873 | |||||||||
| Unearned ESOP Shares | ||||||||||||
| Balance at January 1 | (85 | ) | (95 | ) | (105 | ) | ||||||
| Common Stock issued under employee plans | 9 | 10 | 10 | |||||||||
| Balance at December 31 | (76 | ) | (85 | ) | (95 | ) | ||||||
| Accumulated Other Comprehensive (Loss) Income | ||||||||||||
| Balance at January 1 | (7,525 | ) | (8,334 | ) | (7,619 | ) | ||||||
| Other comprehensive (loss) income, net of tax | (1,808 | ) | 809 | (715 | ) | |||||||
| Balance at December 31 | (9,333 | ) | (7,525 | ) | (8,334 | ) | ||||||
| Noncontrolling Interest | ||||||||||||
| Balance at January 1 | 1,811 | 1,590 | 1,486 | |||||||||
| Net Income | 385 | 368 | 371 | |||||||||
| Redeemable noncontrolling interest in subsidiaries' earnings | (4 | ) | (17 | ) | (6 | ) | ||||||
| Other comprehensive (loss) income, net of tax | (30 | ) | 56 | (27 | ) | |||||||
| Dividends attributable to noncontrolling interest | (315 | ) | (336 | ) | (345 | ) | ||||||
| (Purchase) sale of subsidiary shares from noncontrolling interest, net | (23 | ) | — | 24 | ||||||||
| (Disposition) acquisition of noncontrolling interest, net | (8 | ) | 14 | 98 | ||||||||
| Redeemable noncontrolling interest reclassification to noncontrolling interest | — | — | (12 | ) | ||||||||
| Capital contributions | 342 | 135 | — | |||||||||
| Other | 6 | 1 | 1 | |||||||||
| Balance at December 31 | 2,164 | 1,811 | 1,590 | |||||||||
| Equity at December 31 | $ | 40,610 | $ | 31,421 | $ | 29,169 | ||||||
| Supplemental share information | ||||||||||||
| Shares of Common Stock issued under employee plans | 2,775 | 3,205 | 2,485 | |||||||||
| Shares of Common Stock repurchased | 2,727 | 12,900 | 32,300 | |||||||||
| Dividends per share of Common Stock | $ | 2.84 | $ | 2.72 | $ | 2.62 | ||||||
37
Notes to Consolidated Financial Statements
NOTE 1: SUMMARY OF ACCOUNTING PRINCIPLES
The preparation of financial statements requires management to make estimates and assumptions that affect the reported amounts of assets, liabilities, revenues and expenses. Actual results could differ from those estimates. Certain reclassifications have been made to the prior year amounts to conform to the current year presentation.
Consolidation. The Consolidated Financial Statements include the accounts of United Technologies Corporation (UTC) and its controlled subsidiaries. Intercompany transactions have been eliminated.
Cash and Cash Equivalents. Cash and cash equivalents includes cash on hand, demand deposits and short-term cash investments that are highly liquid in nature and have original maturities of three months or less.
On occasion, we are required to maintain cash deposits with certain banks with respect to contractual obligations related to acquisitions or divestitures or other legal obligations. As of December 31, 2018 and 2017, the amount of such restricted cash was approximately $60 million and $33 million, respectively.
Accounts Receivable. Current and long-term accounts receivable as of December 31, 2018 includes retainage of $116 million and unbilled receivables of $678 million, which primarily includes unbilled receivables with commercial aerospace customers. Current and long-term accounts receivable as of December 31, 2017 include retainage of $118 million and unbilled receivables of $2,770 million, which includes approximately $1,109 million of unbilled receivables under commercial aerospace long-term aftermarket contracts. See Note 5 for discussion of commercial aerospace industry assets and commitments.
Retainage represents amounts that, pursuant to the applicable contract, are not due until project completion and acceptance by the customer. Unbilled receivables represent revenues that are not currently billable to the customer under the terms of the contract. These items are expected to be billed and collected in the normal course of business. Upon adoption of Accounting Standards Update (ASU) 2014-09, Revenue from Contracts with Customers, and its related amendments (collectively, the New Revenue Standard) on January 1, 2018, the majority of unbilled receivables have been reclassified to contract assets as described below. Unbilled receivables where we have an unconditional right to payment are included in Accounts receivable as of December 31, 2018.
Contract Assets and Liabilities. Contract assets and liabilities represent the difference in the timing of revenue recognition from receipt of cash from our customers. Contract assets reflect revenue recognized and performance obligations satisfied in advance of customer billing. Performance obligations partially satisfied in advance of customer billings are included in contract assets; prior to the New Revenue Standard, these amounts were included as unbilled receivables in Accounts receivable.
Contract liabilities relate to payments received in advance of the satisfaction of performance under the contract. We receive payments from customers based on the terms established in our contracts. See Note 3 for further discussion of contract assets and liabilities.
Marketable Equity Securities. Equity securities that have a readily determinable fair value and that we do not intend to trade are classified as available-for-sale and carried at fair value.
In January 2016, the FASB issued ASU 2016-01, Financial Instruments - Overall: Recognition and Measurement of Financial Assets and Financial Liabilities. This ASU modifies how entities measure equity investments and present changes in the fair value of financial liabilities. Upon adoption, investments that do not result in consolidation and are not accounted for under the equity method generally must be carried at fair value, with changes in fair value recognized in net income. As discussed in Note 10, we had approximately $5 million of unrealized gains on these securities recorded in Accumulated other comprehensive loss in our Consolidated Balance Sheet as of December 31, 2017. We adopted this standard effective January 1, 2018, with these amounts recorded directly to retained earnings as of that date.
Inventories and Contracts in Progress. Inventories and contracts in progress are stated at the lower of cost or estimated realizable value and are primarily based on first-in, first-out (FIFO) or average cost methods; however, certain Collins Aerospace Systems and Carrier entities use the last-in, first-out (LIFO) method. If inventories that were valued using the LIFO method had been valued under the FIFO method, they would have been higher by $119 million and $106 million at December 31, 2018 and 2017, respectively.
Valuation reserves for excess, obsolete, and slow-moving inventory are estimated by comparing the inventory levels of individual parts to both future sales forecasts or production requirements and historical usage rates in order to identify inventory where the resale value or replacement value is less than inventoriable cost. Other factors that management considers in determining the adequacy of these reserves include whether individual inventory parts meet current specifications and cannot
38
be substituted for a part currently being sold or used as a service part, overall market conditions, and other inventory management initiatives. Manufacturing costs are allocated to current production and firm contracts. Under prior accounting within commercial aerospace, the unit of accounting for certain contracts was the contract, and early-contract OEM unit costs in excess of the average unit costs expected over the contract were capitalized and amortized over lower-cost units later in the contract. As described in the "Revenue Recognition" section of Note 1 below, these costs were eliminated through retained earnings on January 1, 2018 and will not be amortized into future earnings based on the adoption of Accounting Standards Update (ASU) 2014-09, Revenue from Contracts with Customers.
Equity Method Investments. Investments in which we have the ability to exercise significant influence, but do not control, are accounted for under the equity method of accounting and are included in Other assets on the Consolidated Balance Sheet. Under this method of accounting, our share of the net earnings or losses of the investee is included in Other income, net on the Consolidated Statement of Operations since the activities of the investee are closely aligned with the operations of the business segment holding the investment. We evaluate our equity method investments whenever events or changes in circumstance indicate that the carrying amounts of such investments may be impaired. If a decline in the value of an equity method investment is determined to be other than temporary, a loss is recorded in earnings in the current period.
Business Combinations. We account for transactions that are classified as business combinations in accordance with FASB ASC Topic 805, “Business Combinations”. Once a business is acquired, the fair value of the identifiable assets acquired and liabilities assumed is determined with the excess cost recorded to goodwill. As required, a preliminary fair value is determined once a business is acquired, with the final determination of the fair value being completed within the one year measurement period from the date of acquisition.
Goodwill and Intangible Assets. Goodwill represents costs in excess of fair values assigned to the underlying net assets of acquired businesses. Goodwill and intangible assets deemed to have indefinite lives are not amortized. Goodwill and indefinite‑lived intangible assets are subject to annual impairment testing or when a triggering event occurs using the guidance and criteria described in the Intangibles - Goodwill and Other Topic of the FASB ASC. This testing compares carrying values to fair values and, when appropriate, the carrying value of these assets is reduced to fair value.
Intangible assets consist of service portfolios, patents, trademarks/tradenames, customer relationships and other intangible assets including a collaboration asset, as discussed further in Note 2. Acquired intangible assets are recognized at fair value in purchase accounting and then amortized to cost of sales and selling, general & administrative expenses over the applicable useful lives. Also included within other intangible assets are commercial aerospace payments made to secure certain contractual rights to provide product on new aircraft platforms. We classify amortization of such payments as a reduction of sales. Such payments are capitalized when there are distinct rights obtained and there are sufficient incremental cash flows to support the recoverability of the assets established. Otherwise, the applicable portion of the payments are expensed. Consideration paid on these contractual commitments is capitalized when it is no longer conditional.
Useful lives of finite-lived intangible assets are estimated based upon the nature of the intangible asset and the industry in which the intangible asset is used. These intangible assets are amortized based on the pattern in which the economic benefits of the intangible assets are consumed. For both our commercial aerospace collaboration assets and exclusivity arrangements, the pattern of economic benefit generally results in lower amortization during the development period with increasing amortization as programs enter full rate production and aftermarket cycles. If a pattern of economic benefit cannot be reliably determined or if straight-line amortization approximates the pattern of economic benefit, a straight-line amortization method may be used. The range of estimated useful lives is as follows:
| Collaboration assets | 30 years |
| Customer relationships and related programs | 1 to 50 years |
| Purchased service contracts | 5 to 25 years |
| Patents & trademarks | 4 to 40 years |
| Exclusivity assets | 5 to 25 years |
Other Long-Lived Assets. We evaluate the potential impairment of other long-lived assets whenever events or changes in circumstances indicate that the related carrying amounts may not be recoverable. If the carrying value of other long-lived assets held and used exceeds the sum of the undiscounted expected future cash flows, the carrying value is written down to fair value.
Long-Term Financing Receivables. Our long-term financing receivables primarily represent balances related to the aerospace businesses such as long-term trade accounts receivable, leases, and notes receivable. We also have other long-term receivables in our commercial businesses; however, both the individual and aggregate amounts of those other receivables are not significant.
39
Long-term trade accounts receivable, including unbilled receivables related to long-term aftermarket contracts in 2017, are principally amounts arising from the sale of goods and services with a contractual maturity date or realization period of greater than one year and are recognized as "Other assets" in our Consolidated Balance Sheet. Notes and leases receivable represent notes and lease receivables other than receivables related to operating leases, and are recognized as "Customer financing assets" in our Consolidated Balance Sheet. The following table summarizes the balance by class of aerospace business-related long-term receivables as of December 31, 2018 and 2017:
| (dollars in millions) | 2018 | 2017 | ||||||
| Long-term trade accounts receivable | $ | 269 | $ | 973 | ||||
| Notes and leases receivable | 258 | 424 | ||||||
| Total long-term receivables | $ | 527 | $ | 1,397 | ||||
We determine a receivable is impaired when, based on current information and events, it is probable that we will be unable to collect amounts due according to the contractual terms of the receivable agreement. Factors considered in assessing collectability and risk include, but are not limited to, examination of credit quality indicators and other evaluation measures, underlying value of any collateral or security interests, significant past due balances, historical losses, and existing economic conditions.
We determine credit ratings for each customer in our portfolio based upon public information and information obtained directly from our customers. We conduct a review of customer credit ratings, published historical credit default rates for different rating categories, and multiple third-party aircraft value publications as a basis to validate the reasonableness of the allowance for losses on these balances quarterly or when events and circumstances warrant. Customer credit ratings range from customers with an extremely strong capacity to meet financial obligations, to customers whose uncollateralized receivable is in default. There can be no assurance that actual results will not differ from estimates or that consideration of these factors in the future will not result in an increase or decrease to the allowance for credit losses on long-term receivables. Based upon the customer credit ratings, approximately $150 million and $170 million of our long-term receivables were considered to bear high credit risk as of December 31, 2018 and 2017, respectively. See Note 5 for further discussion of commercial aerospace industry assets and commitments.
Reserves for credit losses on receivables relate to specifically identified receivables that are evaluated individually for impairment. For notes and leases receivable, we determine a specific reserve for exposure based on the difference between the carrying value of the receivable and the estimated fair value of the related collateral in connection with the evaluation of credit risk and collectability. For long-term trade accounts receivable, we evaluate credit risk and collectability individually to determine if an allowance is necessary. Our long-term receivables reflected in the table above, which include reserves of $16 million and $17 million as of December 31, 2018 and 2017, respectively, are individually evaluated for impairment. At both December 31, 2018 and 2017, we did not have any significant balances that are considered to be delinquent, on non-accrual status, past due 90 days or more, or considered to be impaired.
Income Taxes. In the ordinary course of business there is inherent uncertainty in quantifying our income tax positions. We assess our income tax positions and record tax benefits for all years subject to examination based upon management's evaluation of the facts, circumstances, and information available at the reporting date. For those tax positions where it is more-likely-than-not that a tax benefit will be sustained, we have recorded the largest amount of tax benefit with a greater than 50% likelihood of being realized upon ultimate settlement with a taxing authority that has full knowledge of all relevant information. For those income tax positions where it is not more-likely-than-not that a tax benefit will be sustained, no tax benefit has been recognized in the financial statements. Where applicable, associated interest expense has also been recognized. We recognize accrued interest related to unrecognized tax benefits in interest expense. Penalties, if incurred, would be recognized as a component of income tax expense.
On December 22, 2017 the TCJA was enacted. The TCJA contains a new law that subjects the Company to a tax on Global Intangible Low-Taxed Income (GILTI), beginning in 2018. GILTI is a tax on foreign income in excess of a deemed return on tangible assets of foreign corporations. The FASB has provided that companies subject to GILTI have the option to account for the GILTI tax as a period cost if and when incurred, or to recognize deferred taxes for temporary differences, including outside basis differences, expected to reverse as GILTI. We have elected to account for GILTI as a period cost, if incurred.
Revenue Recognition. ASU 2014-09 and its related amendments are effective for reporting periods beginning after December 15, 2017. We adopted the New Revenue Standard effective January 1, 2018 and elected the modified retrospective approach. The results for periods before 2018 were not adjusted for the new standard and the cumulative effect of the change in accounting was recognized through retained earnings at the date of adoption. See Note 3 for a discussion of the effect of the New Revenue Standard on our statements of financial position and results of operations.
40
We account for revenue in accordance with Accounting Standards Codification (ASC) Topic 606: Revenue from Contracts with Customers. Under Topic 606, a performance obligation is a promise in a contract with a customer to transfer a distinct good or service to the customer. Some of our contracts with customers contain a single performance obligation, while others contain multiple performance obligations most commonly when a contract spans multiple phases of the product life-cycle such as development, production, maintenance and support. A contract's transaction price is allocated to each distinct performance obligation and recognized as revenue when, or as, the performance obligation is satisfied. When there are multiple performance obligations within a contract, we allocate the transaction price to each performance obligation based on its standalone selling price.
We consider the contractual consideration payable by the customer and assess variable consideration that may affect the total transaction price, including contractual discounts, contract incentive payments, estimates of award fees, unfunded contract value under U.S. Government contracts, and other sources of variable consideration, when determining the transaction price of each contract. We include variable consideration in the estimated transaction price when there is a basis to reasonably estimate the amount. These estimates are based on historical experience, anticipated performance and our best judgment at the time. We also consider whether our contracts provide customers with significant financing. Generally, our contracts do not contain significant financing.
Point in time revenue recognition. Timing of the satisfaction of performance obligations varies across our businesses due to our diverse product and service mix, customer base, and contractual terms. Performance obligations are satisfied as of a point in time for heating, ventilating, air-conditioning and refrigeration systems, certain alarm and fire detection and suppression systems, and certain aerospace components, engines, and spare parts. Revenue is recognized when control of the product transfers to the customer, generally upon product shipment.
Over-time revenue recognition. Performance obligations are satisfied over-time if the customer receives the benefits as we perform work, if the customer controls the asset as it is being produced, or if the product being produced for the customer has no alternative use and we have a contractual right to payment. Revenue is recognized for our construction-type and certain production-type contracts on an over-time basis. We recognize revenue on an over-time basis on certain long-term aerospace aftermarket contracts and aftermarket service work; development, fixed price, and other cost reimbursement contracts in our aerospace businesses; and elevator and escalator sales, installation, service, modernization and other construction contracts in our commercial businesses. For construction and installation contracts within our commercial businesses and aerospace performance obligations satisfied over time, revenue is recognized using costs incurred to date relative to total estimated costs at completion to measure progress. Incurred costs represent work performed, which correspond with and best depict transfer of control to the customer. Contract costs include labor, materials, and subcontractors' costs, or other direct costs, and where applicable on government and commercial contracts, indirect costs.
For certain of our long-term aftermarket contracts, revenue is recognized over the contract period. In the commercial businesses, revenue is primarily recognized on a straight-line basis over the contract period. In the aerospace businesses, we generally account for such contracts as a series of daily obligations to stand ready to provide spare parts and product maintenance and aftermarket services. These arrangements include the sale of spare parts with integral services to our customers, and are generally classified as Service sales, with the corresponding costs classified in Cost of services sold, within the statement of operations. Revenue is primarily recognized in proportion to cost as sufficient historical evidence indicates that the cost of performing services under the contract is incurred on an other than straight-line basis. Aerospace contract modifications are routine and contracts are often modified to account for changes in contract specifications or requirements. Contract modifications that are for goods or services that are not distinct are accounted for as part of the existing contract.
We incur costs for engineering and development of aerospace products directly related to existing or anticipated contracts with customers. Such costs generate or enhance our ability to satisfy our performance obligations under these contracts. We capitalize these costs as contract fulfillment costs to the extent the costs are recoverable from the associated contract margin and subsequently amortize the costs as the original equipment (OEM) products performance obligations are satisfied. In instances where intellectual property does not transfer to the customer, we defer the customer funding of OEM product engineering and development and recognize revenue when the OEM products performance obligations are satisfied. Capitalized contract fulfillment costs are recognized in "Other assets" in our Consolidated Balance Sheet. Costs to obtain contracts are not material.
Loss provisions on OEM contracts are recognized to the extent that estimated contract costs exceed the estimated consideration from the products contemplated under the contractual arrangement. For new commitments, we generally record loss provisions at the earlier of contract announcement or contract signing except for certain contracts under which losses are recorded upon receipt of the purchase order that obligates us to perform. For existing commitments, anticipated losses on contractual arrangements are recognized in the period in which losses become evident. Products contemplated under contractual arrangements include firm quantities of product sold under contract and, in the commercial engine and wheels and brakes businesses, future highly probable sales of replacement parts required by regulation that are expected to be sold subsequently for incorporation into the original equipment. In the commercial engine and wheels and brakes businesses, when the combined
41
original equipment and aftermarket arrangement for each individual sales campaign are profitable, we record original equipment product losses, as applicable, at the time of delivery.
We review our cost estimates on significant contracts on a quarterly basis and for others, no less frequently than annually or when circumstances change and warrant a modification to a previous estimate. We record changes in contract estimates using the cumulative catch-up method. Operating profits included net unfavorable changes in aerospace contract estimates of approximately $50 million, $110 million, and $157 million in 2018, 2017 and 2016, respectively, primarily the result of unexpected increases in estimated costs related to Pratt & Whitney long term aftermarket contracts.
Collaborations: Sales generated from engine programs, spare parts sales, and aftermarket business under collaboration arrangements are recorded consistent with our revenue recognition policies in our consolidated financial statements. Amounts attributable to our collaborators for their share of sales are recorded as cost of sales in our consolidated financial statements based upon the terms and nature of the arrangement. Costs associated with engine programs under collaborative arrangements are expensed as incurred. Under these arrangements, collaborators contribute their program share of engine parts, incur their own production costs and make certain payments to Pratt & Whitney for shared or joint program costs. The reimbursement of a collaborator's share of program costs is recorded as a reduction of the related expense item at that time.
Cash Payments to Customers: Carrier customarily offers its customers incentives to purchase products to ensure an adequate supply of its products in the distribution channels. The principal incentive program provides reimbursements to distributors for offering promotional pricing for our products. We account for incentive payments made as a reduction in sales. In our aerospace businesses, we may make participation payments to certain customers to secure certain contractual rights. To the extent these rights are incremental and are supported by the incremental cash flows obtained, they are capitalized as intangible assets. Otherwise, such payments are recorded as a reduction in sales. We classify the subsequent amortization of the capitalized acquired intangible assets from our customers as a reduction in sales. Contractually stated prices in arrangements with our customers that include the acquisition of intangible rights within the scope of the Intangibles - Goodwill and Other Topic of the FASB ASC and deliverables within the scope of the Revenue Recognition Topic of the FASB ASC are not presumed to be representative of fair value for determining the amounts to allocate to each element of an arrangement.
Research and Development. Research and development costs not specifically covered by contracts and those related to the company sponsored share of research and development activity in connection with cost-sharing arrangements are charged to expense as incurred. Government research and development support, not associated with specific contracts, is recorded as a reduction to research and development expense in the period earned.
Research and development costs incurred under contracts with customers are included as a contract cost and reported as a component of cost of products sold when revenue from such contracts is recognized. Research and development costs in excess of contractual consideration are expensed as incurred.
Foreign Exchange. We conduct business in many different currencies and, accordingly, are subject to the inherent risks associated with foreign exchange rate movements. The financial position and results of operations of substantially all of our foreign subsidiaries are measured using the local currency as the functional currency. Foreign currency denominated assets and liabilities are translated into U.S. Dollars at the exchange rates existing at the respective balance sheet dates, and income and expense items are translated at the average exchange rates during the respective periods. The aggregate effects of translating the balance sheets of these subsidiaries are deferred as a separate component of shareowners' equity.
Derivatives and Hedging Activity. We have used derivative instruments, including swaps, forward contracts and options, to help manage certain foreign currency, interest rate and commodity price exposures. Derivative instruments are viewed as risk management tools by us and are not used for trading or speculative purposes. By their nature, all financial instruments involve market and credit risks. We enter into derivative and other financial instruments with major investment grade financial institutions and have policies to monitor the credit risk of those counterparties. We limit counterparty exposure and concentration of risk by diversifying counterparties. While there can be no assurance, we do not anticipate any material non-performance by any of these counterparties. We enter into transactions that are subject to enforceable master netting arrangements or similar agreements with various counterparties. However, we have not elected to offset multiple contracts with a single counterparty and, as a result, the fair value of the derivative instruments in a loss position is not offset against the fair value of derivative instruments in a gain position.
Derivatives used for hedging purposes may be designated and effective as a hedge of the identified risk exposure at the inception of the contract. All derivative instruments are recorded on the balance sheet at fair value. Derivatives used to hedge foreign currency denominated balance sheet items are reported directly in earnings along with offsetting transaction gains and losses on the items being hedged. Derivatives used to hedge forecasted cash flows associated with foreign currency commitments or forecasted commodity purchases may be accounted for as cash flow hedges, as deemed appropriate. Gains and losses on derivatives designated as cash flow hedges are recorded in other comprehensive income and reclassified to earnings as a component of product sales or expenses, as applicable, when the hedged transaction occurs. Gains and losses on derivatives
42
designated as cash flow hedges are recorded in Other operating activities, net within the Consolidated Statement of Cash Flows. To the extent that a previously designated hedging transaction is no longer an effective hedge, any ineffectiveness measured in the hedging relationship is recorded currently in earnings in the period it occurs. As discussed in Note 14, at December 31, 2018 we have approximately €4.95 billion of euro-denominated long-term debt and €750 million of euro-denominated commercial paper borrowings outstanding, which qualify as a net investment hedge against our investments in European businesses.
To the extent the hedge accounting criteria are not met, the foreign currency forward contracts are utilized as economic hedges and changes in the fair value of these contracts are recorded currently in earnings in the period in which they occur. Additional information pertaining to foreign currency forward contracts and net investment hedging is included in Note 14.
Environmental. Environmental investigatory, remediation, operating and maintenance costs are accrued when it is probable that a liability has been incurred and the amount can be reasonably estimated. The most likely cost to be incurred is accrued based on an evaluation of currently available facts with respect to each individual site, including existing technology, current laws and regulations and prior remediation experience. Where no amount within a range of estimates is more likely, the minimum is accrued. For sites with multiple responsible parties, we consider our likely proportionate share of the anticipated remediation costs and the ability of the other parties to fulfill their obligations in establishing a provision for those costs. Liabilities with fixed or reliably determinable future cash payments are discounted. Accrued environmental liabilities are not reduced by potential insurance reimbursements. See Note 18 for additional details on the environmental remediation activities.
Pension and Postretirement Obligations. Guidance under the Compensation - Retirement Benefits Topic of the FASB ASC requires balance sheet recognition of the overfunded or underfunded status of pension and postretirement benefit plans. Under this guidance, actuarial gains and losses, prior service costs or credits, and any remaining transition assets or obligations that have not been recognized under previous accounting standards must be recognized in other comprehensive income, net of tax effects, until they are amortized as a component of net periodic benefit cost.
Product Performance Obligations. We extend performance and operating cost guarantees beyond our normal service and warranty policies for extended periods on some of our products, particularly commercial aircraft engines. Liability under such guarantees is based upon future product performance and durability. We accrue for such costs that are probable and can be reasonably estimated. In addition, we incur discretionary costs to service our products in connection with product performance issues. The costs associated with these product performance and operating cost guarantees require estimates over the full terms of the agreements, and require management to consider factors such as the extent of future maintenance requirements and the future cost of material and labor to perform the services. These cost estimates are largely based upon historical experience. See Note 17 for further discussion.
Collaborative Arrangements. In view of the risks and costs associated with developing new engines, Pratt & Whitney has entered into certain collaboration arrangements in which sales, costs and risks are shared. Sales generated from engine programs, spare parts, and aftermarket business under collaboration arrangements are recognized in our financial statements when earned. Amounts attributable to our collaborators for their share of sales are recorded as an expense in our financial statements based upon the terms and nature of the arrangement. Costs associated with engine programs under collaborative arrangements are expensed as incurred. Under these arrangements, collaborators contribute their program share of engine parts, incur their own production costs and make certain payments to Pratt & Whitney for shared or joint program costs. The reimbursement of the collaborators' share of program costs is recorded as a reduction of the related expense item at that time. As of December 31, 2018, the collaborators' interests in all commercial engine programs ranged from 13% to 50%, inclusive of a portion of Pratt & Whitney's interests held by other participants. Pratt & Whitney is the principal participant in all existing collaborative arrangements, with the exception of the Engine Alliance (EA), a joint venture with GE Aviation, which markets and manufactures the GP7000 engine for the Airbus A380 aircraft. There are no individually significant collaborative arrangements and none of the collaborators individually exceed a 31% share in an individual program. The following table illustrates the income statement classification and amounts attributable to transactions arising from the collaborative arrangements between participants for each period presented. Selling, general and administrative amounts for 2016 have been revised to present these amounts on a basis consistent with 2017 and 2018 presentation.
43
| (dollars in millions) | 2018 | 2017 | 2016 | ||||||||
| Collaborator share of sales: | |||||||||||
| Cost of products sold | $ | 1,688 | $ | 1,789 | $ | 1,700 | |||||
| Cost of services sold | 1,765 | 929 | 675 | ||||||||
| Collaborator share of program costs (reimbursement of expenses incurred): | |||||||||||
| Cost of products sold | (209 | ) | (143 | ) | (108 | ) | |||||
| Research and development | (225 | ) | (190 | ) | (184 | ) | |||||
| Selling, general and administrative | (87 | ) | (74 | ) | (57 | ) | |||||
Accounting Pronouncements. In October 2016, the FASB issued ASU 2016-16, Income Taxes (Topic 740): Intra-Entity Transfers of Assets Other Than Inventory. This ASU requires the income tax consequences of an intra-entity transfer of an asset, other than inventory, to be recognized when the transfer occurs. Two common examples of assets included in the scope of this update are intellectual property and property, plant, and equipment. The provisions of this ASU are effective for years beginning after December 15, 2017, with early adoption permitted. We adopted the new standard effective January 1, 2018.
In February 2016, the FASB issued ASU 2016- 02, Leases (Topic 842). In 2018, the FASB continued to issue various updates to ASU 2016-02 as follows:
| • | ASU 2018-10, Codification Improvements to Topic 842, Leases - makes various targeted enhancements and clarifications to the leasing standard |
| • | ASU 2018-11, Leases (Topic 842): Targeted Improvements - allows entities to initially apply the new leases standard at the adoption date and recognize a cumulative-effect adjustment to the opening balance of retained earnings in the period of adoption |
ASU 2016-02 and its related updates (collectively, the New Lease Accounting Standard) are effective for reporting periods beginning after December 15, 2018, and interim periods therein, using either of the following transition methods; (i) a full retrospective adoption reflecting the application of the standard in each prior reporting period, or (ii) a prospective adoption election with the cumulative effect of adopting recognized through retained earnings at the date of adoption. We are preparing to adopt the New Lease Accounting Standard effective January 1, 2019 and will use the prospective method of adoption with the cumulative effect of adoption recognized through retained earnings at the date of adoption.
The New Lease Accounting Standard establishes a right-of-use (ROU) model that requires a lessee to record a ROU asset and a lease liability on the balance sheet for all leases with terms longer than 12 months. Leases will be classified as either finance or operating, with classification affecting the pattern of expense recognition in the Consolidated Statement of Operations. In addition, this standard requires a lessor to classify leases as either sales-type, finance or operating. A lease will be treated as a sale if it transfers all of the risks and rewards, as well as control of the underlying asset, to the lessee. If risks and rewards are conveyed without the transfer of control, the lease is treated as financing. If the lessor doesn’t convey risks and rewards or control, the lease is treated as operating.
We plan to elect all of the practical expedients available under the New Lease Accounting Standard upon adoption. Although we continue to evaluate the impact of the New Lease Accounting Standard on our statement of financial position, we do not expect that the standard will have a material effect on our cash flows or results of operations. Upon adoption we will record a ROU asset and lease liability, representing our obligation to make lease payments for operating leases, measured on a discounted basis. The ROU asset and lease liability will also reflect future payments under certain information technology service contracts, which we have determined contain embedded leases, which require balance sheet presentation under the New Lease Accounting Standard. We expect the ROU asset and lease liability recorded will be less than 5% of our total assets. In preparation for the adoption, we are implementing new software solutions and designing new business processes and controls over the financial reporting of leases, which will facilitate our reporting under the New Lease Accounting Standard in the first quarter of 2019.
In January 2017, the FASB issued ASU 2017-01, Business Combinations (Topic 805): Clarifying the Definition of a Business. This ASU provides a new framework that will assist in the evaluation of whether business combination transactions should be accounted for as an acquisition of a business or as a group of assets, and specifies the minimum required inputs and processes necessary to be a business. The provisions of this ASU are effective for years beginning after December 15, 2017, with early adoption permitted. We adopted the new standard effective January 1, 2018. Refer to Note 2: Business Acquisitions.
In May 2017, the FASB issued ASU 2017-09, Compensation—Stock Compensation (Topic 718): Scope of Modification Accounting. This ASU provides that an entity should account for the effects of a modification unless the fair value, the vesting conditions of the modified award and the classification of the modified award (equity or liability instrument) are the same as the
44
original award immediately before the modification. The provisions of this ASU are effective for years beginning after December 15, 2017, with early adoption permitted. We adopted the new standard effective January 1, 2018. The adoption of this standard did not have a material impact on the consolidated financial statements.
In August 2017, the FASB issued ASU 2017-12, Derivatives and Hedging (Topic 815): Targeted Improvements to Accounting for Hedging Activities. This ASU will make more financial and nonfinancial hedging strategies eligible for hedge accounting. It also amends the presentation and disclosure requirements and changes how companies assess effectiveness. It is intended to more closely align hedge accounting with a company’s risk management strategies, simplify the application of hedge accounting, and increase transparency as to the scope and results of hedging programs. The provisions of this ASU are effective for years beginning after December 15, 2018, with early adoption permitted for any interim period after issuance of the ASU. We adopted the new standard effective January 1, 2018. The adoption of this standard did not have a material impact on the consolidated financial statements.
In February 2018, the FASB issued ASU 2018-02, Reclassification of Certain Tax Effects from Accumulated Other Comprehensive Income (Topic 220). The new standard allows companies to reclassify to retained earnings the stranded tax effects in accumulated other comprehensive income (AOCI) from the newly-enacted U.S. Tax Cuts and Jobs Act (TCJA). The new standard is effective for fiscal years beginning after December 15, 2018, including interim periods within those fiscal years, with early adoption permitted. We will elect to reclassify the income tax effects of TCJA from AOCI to retained earnings effective January 1, 2019. We are still evaluating the impact of our pending adoption of the new standard on our consolidated financial statements. We do not expect this ASU to have a material impact on our cash flows and results of operations.
In August 2018, the FASB issued ASU 2018-13, Fair Value Measurement (Topic 820): Disclosure Framework—Changes to the Disclosure Requirements for Fair Value Measurement. The new standard removes the disclosure requirements for the amount of and reasons for transfers between Level 1 and Level 2 of the fair value hierarchy. The provisions of this ASU are effective for years beginning after December 15, 2019, with early adoption permitted. We do not expect this ASU to have a significant impact on our consolidated financial statements, as it only includes changes to disclosure requirements.
In August 2018, the FASB issued ASU 2018-14, Compensation—Retirement Benefits—Defined Benefit Plans—General (Subtopic 715-20): Disclosure Framework—Changes to the Disclosure Requirements for Defined Benefit Plans. The new standard includes updates to the disclosure requirements for defined benefit plans including several additions, deletions and modifications to the disclosure requirements. The provisions of this ASU are effective for years beginning after December 15, 2020, with early adoption permitted. We are currently evaluating the impact of this ASU.
In August 2018, the FASB issued ASU 2018-15, Intangibles—Goodwill and Other—Internal-Use Software (Subtopic 350-40): Customer’s Accounting for Implementation Costs Incurred in a Cloud Computing Arrangement That Is a Service Contract. The new standard provides updated guidance surrounding implementation costs associated with cloud computing arrangements that are service contracts. The provisions of this ASU are effective for years beginning after December 15, 2020, with early adoption permitted. We are currently evaluating the impact of this ASU.
In August 2018, the SEC issued the final rule under SEC Release No. 33-10532, "Disclosure Update and Simplification," that amends certain of its disclosure requirements that have become redundant, duplicative, overlapping, outdated or superseded. The amendments include removing the requirement to disclose the historical and pro forma ratio of earnings to fixed charges (Exhibit 12) and replacing the requirement to disclose the high and low trading prices of entity's ordinary shares with a requirement to disclose the ticker symbol of its shares. Additionally, the final rule extends to interim periods the annual disclosure requirement of presenting changes in each caption of stockholders' equity and the amount of dividends per share. These disclosures are required to be provided for the current and comparative year-to-date interim periods. The final rule is effective for all filings on or after November 5, 2018. The Company has adopted all relevant disclosure requirements for its annual report on Form 10-K for the year ended December 31, 2018.
In October 2018, the FASB issued ASU 2018-17, Consolidation (Topic 810): Targeted Improvements to Related Party Guidance for Variable Interest Entities. The amendments in this Update for determining whether a decision-making fee is a variable interest require reporting entities to consider indirect interests held through related parties under common control on a proportional basis rather than as the equivalent of a direct interest in its entirety (as currently required in GAAP). Therefore, these amendments likely will result in more decision makers not having a variable interest through their decision-making arrangements. These amendments also will create alignment between determining whether a decision making fee is a variable interest and determining whether a reporting entity within a related party group is the primary beneficiary of a VIE. If fewer decision-making fees are considered variable interests, the focus on determining which party within a related party group under common control may have a controlling financial interest will be shifted to the variable interest holders in the group with more significant economic interests. This will significantly reduce the risk that decision makers with insignificant direct and indirect interests could be deemed the primary beneficiary of a VIE. The provisions of this ASU are effective for years beginning after December 15, 2019, with early adoption permitted. We are currently evaluating the impact of this ASU.
45
In November 2018, the FASB issued ASU 2018-18, Collaborative Arrangements (Topic 808): Clarifying the Interaction between Topic 808 and Topic 606. The amendments in this Update make targeted improvements to generally accepted accounting principles (GAAP) for collaborative arrangements as follows: clarify that certain transactions between collaborative arrangement participants should be accounted for as revenue under Topic 606 when the collaborative arrangement participant is a customer in the context of a unit of account. In those situations, all the guidance in Topic 606 should be applied, including recognition, measurement, presentation, and disclosure requirements; add unit-of-account guidance in Topic 808 to align with the guidance in Topic 606 (that is, a distinct good or service) when an entity is assessing whether the collaborative arrangement or a part of the arrangement is within the scope of Topic 606; and require that in a transaction with a collaborative arrangement participant that is not directly related to sales to third parties, presenting the transaction together with revenue recognized under Topic 606 is precluded if the collaborative arrangement participant is not a customer. The provisions of this ASU are effective for years beginning after December 15, 2019, with early adoption permitted. We are currently evaluating the impact of this ASU.
NOTE 2: BUSINESS ACQUISITIONS, DISPOSITIONS, GOODWILL AND INTANGIBLE ASSETS
Business Acquisitions. Our investments in businesses net of cash acquired in 2018, 2017 and 2016 totaled $31,142 million (including debt assumed of $7,784 million and stock issued of $7,960 million), $231 million and $712 million (including debt assumed of $2 million), respectively. Our investments in businesses in 2018 primarily consisted of the acquisition of Rockwell Collins, Inc. (Rockwell Collins). Our investments in businesses in 2017 consisted of a number of small acquisitions, primarily in our commercial businesses. Our investments in businesses in 2016 consisted of the acquisition of a majority interest in an Italian heating products and services company by Carrier, the acquisition of a Japanese services company by Otis and a number of small acquisitions, primarily in our commercial businesses.
On November 26, 2018, we completed the acquisition of Rockwell Collins, a leader in aviation and high-integrity solutions for commercial and military customers as well as leading-edge avionics, flight controls, aircraft interior and data connectivity solutions. Under the terms of the merger agreement, each share of common stock, par value $0.01 per share, of Rockwell Collins issued and outstanding immediately prior to the effective time of the Merger (other than shares held by Rockwell Collins, the Company, Merger Sub or any of their respective wholly owned subsidiaries) was converted into the right to receive (1) $93.33 in cash, without interest, and (2) 0.37525 of a share of Company common stock, par value $1.00 per share, and cash in lieu of fractional shares (together, the “Merger Consideration”), less any applicable withholding taxes. The total aggregate consideration payable in the Merger was $15.5 billion in cash ($14.9 billion net of cash acquired) and 62.2 million shares of Company common stock. In addition, $7.8 billion of Rockwell Collins debt was outstanding at the time of the Merger. This equated to a total enterprise value of $30.6 billion, including the $7.8 billion of Rockwell Collins' outstanding debt.
| (dollars in millions) | Amount | |||
Cash consideration paid for Rockwell Collins outstanding common stock & equity awards1 | $ | 15,533 | ||
| Fair value of UTC common stock issued for Rockwell Collins outstanding common stock & equity awards | 7,960 | |||
| Total consideration transferred | $ | 23,493 | ||
1Cash consideration paid for Rockwell Collins net of cash acquired is $14.9 billion.
The cash consideration utilized for the Rockwell Collins acquisition was partially financed through the previously disclosed issuance of $11 billion aggregate principal notes on August 16, 2018 for net proceeds of $10.9 billion. For the remainder of the cash consideration, we utilized repatriated cash and cash equivalents and cash flow generated from operating activities.
Preliminary Allocation of Consideration Transferred to Net Assets Acquired:
The following amounts represent the preliminary determination of the fair value of identifiable assets acquired and liabilities assumed from the Rockwell Collins acquisition. The final determination of the fair value of certain assets and liabilities will be completed up to a one year measurement period from the date of acquisition as required by FASB ASC Topic 805, “Business Combinations”. As of December 31, 2018, the valuation studies necessary to determine the fair market value of the assets acquired and liabilities assumed are preliminary, including the validation of the underlying cash flows used to determine the fair value of the identified intangible assets. The size and breadth of the Rockwell Collins acquisition necessitates use of the one year measurement period to adequately analyze all the factors used in establishing the asset and liability fair values as of the acquisition date, including, but not limited to, intangible assets, inventory, real property, leases, deferred tax liabilities related to the unremitted earnings of foreign subsidiaries, certain reserves and the related tax impacts of any changes made. Any potential adjustments made could be material in relation to the preliminary values presented below:
46
| (dollars in millions) | |||
| Cash and cash equivalents | $ | 640 | |
| Accounts receivable, net | 1,660 | ||
| Inventory, net | 1,527 | ||
| Contract assets, current | 302 | ||
| Other assets, current | 297 | ||
| Future income tax benefits | 41 | ||
| Fixed assets, net | 1,691 | ||
| Intangible assets: | |||
| Customer relationships | 8,320 | ||
| Tradenames/trademarks | 1,870 | ||
| Developed technology | 600 | ||
| Other assets | 192 | ||
| Total identifiable assets acquired | 17,140 | ||
| Short-term borrowings | 2,254 | ||
| Accounts payable | 378 | ||
| Accrued liabilities | 1,679 | ||
| Contract liabilities, current | 301 | ||
| Long-term debt | 5,530 | ||
| Future pension and postretirement benefit obligation | 502 | ||
| Other long-term liabilities | 3,465 | ||
| Noncontrolling interest | 6 | ||
| Total liabilities acquired | 14,115 | ||
| Total identifiable net assets | 3,025 | ||
| Goodwill | 20,468 | ||
| Total consideration transferred | $ | 23,493 | |
In order to allocate the consideration transferred for Rockwell Collins, the fair values of all identifiable assets and liabilities were established. For accounting and financial reporting purposes, fair value is defined under FASB ASC Topic 820, “Fair Value Measurements and Disclosures” as the price that would be received upon sale of an asset or the amount paid to transfer a liability in an orderly transaction between market participants at the measurement date. Market participants are assumed to be buyers and sellers in the principal (most advantageous) market for the asset or liability. Additionally, fair value measurements for an asset assume the highest and best use of that asset by market participants. Use of different estimates and judgments could yield different results. Fair value adjustments to Rockwell Collins' identified assets and liabilities resulted in an increase in inventory and fixed assets of $282 million and $269 million, respectively. In determining the fair value of identifiable assets acquired and liabilities assumed, a review was conducted for any significant contingent assets or liabilities existing as of the acquisition date. The preliminary assessment did not note any significant contingencies related to existing legal or government action.
The fair values of the customer relationship and related program intangible assets, which include the related aerospace program OEM and aftermarket cash flows, were determined by using an “income approach." Under this approach, the net earnings attributable to the asset or liability being measured are isolated using the discounted projected net cash flows. These projected cash flows are isolated from the projected cash flows of the combined asset group over the remaining economic life of the intangible asset or liability being measured. Both the amount and the duration of the cash flows are considered from a market participant perspective. Our estimates of market participant net cash flows considered historical and projected pricing, remaining developmental effort, operational performance including company specific synergies, aftermarket retention, product life cycles, material and labor pricing, and other relevant customer, contractual and market factors. Where appropriate, the net cash flows are probability-adjusted to reflect the uncertainties associated with the underlying assumptions, as well as the risk profile of the net cash flows utilized in the valuation. The probability-adjusted future cash flows are then discounted to present value using an appropriate discount rate. The customer relationship and related program intangible assets are being amortized
47
on a straight-line basis (which approximates the economic pattern of benefits) over the estimated economic life of the underlying programs of 10 to 20 years. The developed technology intangible asset is being amortized over the economic pattern of benefit. The fair value of the tradename intangible assets were determined utilizing the relief from royalty method which is a form of the income approach. Under this method, a royalty rate based on observed market royalties is applied to projected revenue supporting the tradename and discounted to present value using an appropriate discount rate. The tradename intangible assets have been determined to have an indefinite life. The Intangible assets included above consist of the following:
| (dollars in millions) | Estimated Fair Value | Estimated Life | |||
| Acquired customer relationships | $ | 8,320 | 10-20 years | ||
| Acquired tradenames/trademarks | 1,870 | indefinite | |||
| Acquired developed technology | 600 | 15 years | |||
| $ | 10,790 | ||||
We also identified customer contractual obligations on certain programs with terms less favorable than could be realized in market transactions as of the acquisition date. We measured these liabilities under the measurement provisions of FASB ASC Topic 820, “Fair Value Measurements and Disclosures,” which is based on the price to transfer the obligation to a market participant at the measurement date, assuming that the liability will remain outstanding in the marketplace. Based on the estimated net cash outflows of the programs plus a reasonable contracting profit margin required to transfer the contracts to market participants, we recorded assumed liabilities of approximately $970 million. These liabilities will be liquidated in accordance with the underlying pattern of obligations, as reflected by the expenses incurred on the contracts. Total consumption of the contractual obligation for the next five years is expected to be as follows: $148 million in 2019, $138 million in 2020, $130 million in 2021, $125 million in 2022, and $116 million in 2023.
Acquisition-Related Costs:
Acquisition-related costs have been expensed as incurred. In 2018 and 2017, approximately $112 million and $39 million, respectively, of transaction and integration costs have been incurred. These costs were recorded in Selling, general and administrative expenses within the Consolidated Statement of Operations. In connection with the financing of the Rockwell Collins acquisition, approximately $46 million of net interest costs (interest expense of $114 million and interest income of $68 million) have been recorded in 2018.
Supplemental Pro-Forma Data:
Rockwell Collins' results of operations have been included in UTC’s financial statements for the period subsequent to the completion of the acquisition on November 26, 2018. Rockwell Collins contributed sales of approximately $778 million and operating profit of approximately $11 million for the period from the completion of the acquisition through December 31, 2018. The following unaudited supplemental pro-forma data presents consolidated information as if the acquisition had been completed on January 1, 2017. The pro-forma results were calculated by combining the results of UTC with the stand-alone results of Rockwell Collins for the pre-acquisition periods, which were adjusted to account for certain costs which would have been incurred during this pre-acquisition period:
| Year Ended December 31, | |||||||
| (dollars in millions, except per share amounts; shares in millions) | 2018 | 2017 | |||||
| Net sales | $ | 74,136 | $ | 68,033 | |||
| Net income attributable to common shareowners from continuing operations | $ | 6,064 | $ | 4,662 | |||
| Basic earnings per share of common stock from continuing operations | $ | 6.82 | $ | 5.45 | |||
| Diluted earnings per share of common stock from continuing operations | $ | 6.76 | $ | 5.39 | |||
The unaudited supplemental pro-forma data above includes the following significant adjustments made to account for certain costs which would have been incurred if the acquisition had been completed on January 1, 2017, as adjusted for the applicable tax impact. As our acquisition of Rockwell Collins was completed on November 26, 2018, the pro-forma adjustments in the table below only include the required adjustments through November 26, 2018:
48
| Year Ended December 31, | |||||||
| (dollars in millions) | 2018 | 2017 | |||||
Amortization of inventory and fixed asset fair value adjustment 1 | $ | 58 | $ | (192 | ) | ||
Amortization of acquired Rockwell Collins intangible assets, net 2 | (193 | ) | (202 | ) | |||
Utilization of contractual customer obligation 3 | 16 | 116 | |||||
UTC/Rockwell fees for advisory, legal, accounting services 4 | 212 | (212 | ) | ||||
Interest expense incurred on acquisition financing, net 5 | (199 | ) | (234 | ) | |||
Elimination of capitalized pre-production engineering amortization 6 | 63 | 42 | |||||
Adjustment to net periodic pension cost 7 | 42 | 34 | |||||
Adjustment to reflect the adoption of ASC 606 8 | 106 | — | |||||
Elimination of entities held for sale 9 | (47 | ) | (35 | ) | |||
Inclusion of B/E Aerospace 10 | — | (51 | ) | ||||
| $ | 58 | $ | (734 | ) | |||
1 Reflects the amortization expense on the Rockwell Collins inventory step up which would be completed within the first two quarters of 2017 and
eliminated the inventory step-up amortization recorded by UTC in 2018. Additionally, this adjustment reflects the amortization of the fixed asset fair value adjustment as of the acquisition date.
2 Reflects the additional amortization of the acquired Rockwell Collins intangible assets recognized at fair value in purchase accounting and
eliminates the historical Rockwell Collins intangible asset amortization expense.
3 Reflects the additional amortization of liabilities recognized for acquired contracts with terms less favorable than could be realized in market
transactions as of the acquisition date and eliminates Rockwell Collins historical amortization of these liabilities.
4 Reflects the elimination of transaction-related fees incurred by UTC and Rockwell Collins in connection with the acquisition and assumes all of the
fees were incurred during the first quarter of 2017.
5 Reflects the additional interest expense incurred on debt to finance our acquisition of Rockwell Collins and reduces interest expense for the debt
fair value adjustment which would have been amortized.
6 Reflects the elimination of capitalized pre-production engineering amortization to conform to UTC policy.
7 Reflects adjustments for the elimination of amortization of prior service cost and actuarial loss amortization, which was recorded by
Rockwell Collins, as a result of fair value purchase accounting, net of the impact of the revised pension and post-retirement benefit (expense) as
determined under UTC’s plan assumptions.
8 Reflects adjustments to Rockwell Collins revenue recognition as if they adopted the New Revenue Standard as of January 1, 2018 and
primarily relates to deferral of revenue recognized on OEM product engineering and development, partially offset by changes in timing of sales
recognition for contracts requiring an over time method of revenue recognition.
9 Reflects the elimination of entities required to be sold for regulatory approvals.
10 Reflects adjustments to include the results and related adjustments for B/E Aerospace as if it had been acquired by Rockwell Collins on January 1,
2017.
The unaudited supplemental pro-forma financial information does not reflect the potential realization of cost savings relating to the integration of the two companies. Further, the pro-forma data should not be considered indicative of the results that would have occurred if the acquisition and related financing had been consummated on January 1, 2017, nor are they indicative of future results.
Dispositions. On June 21, 2018, Carrier completed its sale of Taylor Company for proceeds of $1.0 billion resulting in a pre-tax gain of $799 million ($591 million after tax).
In accordance with conditions imposed for regulatory approval of the Rockwell Collins acquisition, Rockwell Collins must dispose of certain businesses. These businesses have been held separate from UTC’s and Rockwell Collins' ongoing businesses pursuant to regulatory requirements. Definitive agreements to sell each of the businesses were entered into prior to the completion of UTC's acquisition of Rockwell Collins. The related assets and liabilities of these businesses have been accounted for as held for sale at fair value less cost to sell. As of December 31, 2018, assets of $175 million are included within Other assets, current and liabilities of $40 million are included within Accrued liabilities on the Consolidated Balance Sheet. The major classes of assets and liabilities primarily include net Inventory of $51 million and net Fixed assets of $37 million. On January 18, 2019, Rockwell Collins completed the sale of one of the businesses which was held for sale as of December 31, 2018 for approximately $20 million. The remaining two businesses are expected in 2019 and are subject to regulatory approvals and other customary closing conditions.
On November 26, 2018, the Company announced its intention to separate into three independent companies. Following the separations, the Company will operate as an aerospace company comprised of Collins Aerospace Systems and the Pratt & Whitney businesses, and Otis and Carrier are each expected to become independent companies. The proposed separations are expected to be effected through spin-offs of Otis and Carrier that are intended to be tax-free for the Company’s shareowners for U.S. federal income tax purposes, and are expected to be completed by mid-year 2020. Separation of Otis and Carrier from UTC via spin-off transactions will be subject to the satisfaction of customary conditions, including, among others, final
49
approval by the Company’s Board of Directors, receipt of tax rulings in certain jurisdictions and/or a tax opinion from external counsel (as applicable), the filing with the Securities and Exchange Commission (SEC) and effectiveness of Form 10 registration statements, and satisfactory completion of financing.
Goodwill. Changes in our goodwill balances for the year ended in 2018 were as follows:
| (dollars in millions) | Balance as of January 1, 2018 | Goodwill resulting from business combinations | Foreign currency translation and other | Balance as of December 31, 2018 | |||||||||||
| Otis | $ | 1,737 | $ | 7 | $ | (56 | ) | $ | 1,688 | ||||||
| Carrier | 10,009 | 194 | (368 | ) | 9,835 | ||||||||||
| Pratt & Whitney | 1,511 | 58 | (2 | ) | 1,567 | ||||||||||
| Collins Aerospace Systems | 14,650 | 20,468 | (117 | ) | 35,001 | ||||||||||
| Total Segments | 27,907 | 20,727 | (543 | ) | 48,091 | ||||||||||
| Eliminations and other | 3 | 18 | — | 21 | |||||||||||
| Total | $ | 27,910 | $ | 20,745 | $ | (543 | ) | $ | 48,112 | ||||||
Collins Aerospace Systems goodwill increased $20.4 billion principally as a result of the Rockwell Collins acquisition. The goodwill results from the workforce acquired with the business as well as the significant synergies that are expected to be realized through the consolidation of manufacturing facilities and overhead functions. No amount of this goodwill is deductible for tax purposes. The goodwill acquired will be allocated to the six reporting units within the Collins Aerospace Systems segment.
The $543 million net reduction in goodwill within Foreign Currency Translation and Other includes a $151 million reduction of goodwill attributable to Carrier's sale of Taylor Company. The $18 million increase in goodwill within Eliminations and other is due to an acquisition of a digital analytics company.
Intangible Assets. Identifiable intangible assets are comprised of the following:
| 2018 | 2017 | ||||||||||||||
| (dollars in millions) | Gross Amount | Accumulated Amortization | Gross Amount | Accumulated Amortization | |||||||||||
| Amortized: | |||||||||||||||
| Service portfolios | $ | 2,164 | $ | (1,608 | ) | $ | 2,178 | $ | (1,534 | ) | |||||
| Patents and trademarks | 361 | (236 | ) | 399 | (233 | ) | |||||||||
| Collaboration intangible assets | 4,509 | (649 | ) | 4,109 | (384 | ) | |||||||||
| Customer relationships and other | 22,525 | (4,560 | ) | 13,352 | (4,100 | ) | |||||||||
| 29,559 | (7,053 | ) | 20,038 | (6,251 | ) | ||||||||||
| Unamortized: | |||||||||||||||
| Trademarks and other | 3,918 | — | 2,096 | — | |||||||||||
| Total | $ | 33,477 | $ | (7,053 | ) | $ | 22,134 | $ | (6,251 | ) | |||||
Customer relationship intangible assets include payments made to our customers to secure certain contractual rights. Such payments are capitalized when distinct rights are obtained and sufficient incremental cash flows to support the recoverability of the assets have been established. Otherwise, the applicable portion of the payments is expensed. We amortize these intangible assets based on the underlying pattern of economic benefit, which may result in an amortization method other than straight-line. In the aerospace industry, amortization based on the pattern of economic benefit generally results in lower amortization expense during the development period with amortization expense increasing as programs enter full production and aftermarket cycles. If a pattern of economic benefit cannot be reliably determined, a straight-line amortization method may be used. We classify amortization of such payments as a reduction of sales. The acquired intangible assets related to Rockwell Collins are primarily being amortized on a straight-line basis which approximates the pattern of economic benefit. Amortization of intangible assets was $976 million, $834 million and $778 million in 2018, 2017 and 2016, respectively. The collaboration intangible assets are amortized based upon the pattern of economic benefits as represented by the underlying cash flows. The following is the expected amortization of total intangible assets for 2019 through 2023, which reflects the pattern of expected economic benefit on certain aerospace intangible assets:
50
| (dollars in millions) | 2019 | 2020 | 2021 | 2022 | 2023 | ||||||||||||||
| Amortization expense | $ | 1,476 | $ | 1,438 | $ | 1,456 | $ | 1,464 | $ | 1,670 | |||||||||
NOTE 3: REVENUE RECOGNITION
ASU 2014-09 and its related amendments (collectively, the New Revenue Standard) are effective for reporting periods beginning after December 15, 2017. We adopted the New Revenue Standard effective January 1, 2018 and elected the modified retrospective approach. The results for periods before 2018 were not adjusted for the new standard and the cumulative effect of the change in accounting was recognized through retained earnings at the date of adoption.
The New Revenue Standard changed the revenue recognition practices for a number of revenue streams across our businesses, although the most significant impacts are concentrated in our aerospace units. Several businesses, which previously accounted for revenue on a point in time basis are now required to use an over-time model when their contracts meet one or more of the mandatory criteria established in the New Revenue Standard. Revenue is now recognized based on an over-time basis using an input method for repair contracts within Otis and Carrier; certain U.S. Government and commercial aerospace equipment contracts; and aerospace aftermarket service work. We measure progress toward completion for these contracts using costs incurred to date relative to total estimated costs at completion. Incurred costs represent work performed, which corresponds with and best depicts the transfer of control to the customer. For these businesses, unrecognized sales related to the satisfied portion of the performance obligations of contracts in process as of the date of adoption of approximately $220 million were recorded through retained earnings. The ongoing effect of recording revenue on an over-time basis within these businesses is not expected to be materially different than the previous revenue recognition method.
In addition to the foregoing, our aerospace businesses, in certain cases, also changed the timing of manufacturing cost recognition and certain engineering and development costs. In most circumstances, our commercial aerospace businesses identify the performance obligation as the individual OEM unit; revenue and cost to manufacture each unit are recognized upon OEM unit delivery. Under the prior accounting, the unit of accounting was the contract and early-contract OEM unit costs in excess of the average unit costs expected over the contract were capitalized and amortized over lower-cost units later in the contract. With the adoption of the New Revenue Standard, deferred unit costs in excess of the contract average of $438 million as of January 1, 2018 were eliminated through retained earnings, and as such, will not be amortized into future earnings.
Under the New Revenue Standard, costs incurred for engineering and development of aerospace products under contracts with customers must be capitalized as contract fulfillment costs, to the extent recoverable from the associated contract margin, and subsequently amortized as the OEM products are delivered to the customer. Under prior accounting, we generally expensed costs of engineering and development of aerospace products. The new standard also requires that customer funding of OEM product engineering and development be deferred in instances where economic benefit does not transfer to the customer and recognized as revenue when the OEM products are delivered. Engineering and development costs which do not qualify for capitalization as contract fulfillment costs are expensed as incurred. Prior to the New Revenue Standard, any customer funding received for such development efforts was recognized when earned, with the corresponding costs recognized as cost of sales.
With the adoption of the New Revenue Standard, we capitalized engineering and development costs of approximately $700 million as contract fulfillment cost assets through retained earnings as of January 1, 2018. We also established previously recognized customer funding of approximately $850 million as a contract liability through retained earnings as of the adoption date.
The New Revenue Standard also requires disclosure of remaining performance obligations, which is a concept that is similar to that of backlog. Beginning in 2018, we replaced our definition of backlog with that of remaining performance obligations under the New Revenue Standard. We have historically included in backlog engine orders from airlines for which such purchase orders have not yet been received from the aircraft manufacturer. Effective with the adoption of the New Revenue Standard, we will no longer include in backlog airline engine orders for which we have not yet received the associated firm manufacturing purchase order.
The New Revenue Standard had an immaterial impact on our 2018 net income. Adoption of the New Revenue Standard has resulted in Statement of Operations classification changes between Net Sales, Cost of sales, Research & development, and Other income. The New Revenue Standard also resulted in the establishment of Contract asset and Contract liability balance sheet accounts, and in the reclassification of balances to these new accounts from Accounts receivable, Inventories and contracts in progress, net, and Accrued liabilities. In addition to the following disclosures, Note 19 provides incremental disclosures required by the New Revenue Standard, including disaggregation of revenue into categories that depict how the nature, amount, timing and uncertainty of revenue and cash flows are affected by economic factors.
51
The following schedules quantify the impact of the New Revenue Standard on the statement of operations for the year ended December 31, 2018. The effect of the new standard represents the increase (decrease) in the line item based on the adoption of the New Revenue Standard.
| (dollars in millions) | Year Ended December 31, 2018, under previous standard 1 | Effect of the New Revenue Standard | Year Ended December 31, 2018 as reported | ||||||||
| Net Sales: | |||||||||||
| Product sales | $ | 45,128 | $ | 306 | $ | 45,434 | |||||
| Service sales | 20,821 | 246 | 21,067 | ||||||||
| 65,949 | 552 | 66,501 | |||||||||
| Costs and Expenses: | |||||||||||
| Cost of products sold | 36,481 | 273 | 36,754 | ||||||||
| Cost of services sold | 13,068 | 163 | 13,231 | ||||||||
| Research and development | 2,549 | (87 | ) | 2,462 | |||||||
| Selling, general and administrative | 7,066 | — | 7,066 | ||||||||
| 59,164 | 349 | 59,513 | |||||||||
| Other income, net | 1,573 | (8 | ) | 1,565 | |||||||
| Operating profit | 8,358 | 195 | 8,553 | ||||||||
| Non-service pension (benefit) | (765 | ) | — | (765 | ) | ||||||
| Interest expense, net | 1,038 | — | 1,038 | ||||||||
| Income from operations before income taxes | 8,085 | 195 | 8,280 | ||||||||
| Income tax expense | 2,577 | 49 | 2,626 | ||||||||
| Net income from operations | 5,508 | 146 | 5,654 | ||||||||
| Less: Noncontrolling interest in subsidiaries' earnings from operations | 380 | 5 | 385 | ||||||||
| Net income attributable to common shareowners | $ | 5,128 | $ | 141 | $ | 5,269 | |||||
1 | Includes the as reported results of Rockwell Collins. Because Rockwell Collins adopted the New Revenue Standard prior to the merger, its reported results have been excluded from the quantification of the effect of the New Revenue Standard shown above for the period from November 26, 2018 through December 31, 2018. |
The New Revenue Standard resulted in an increase to Product and Service sales and Cost of products and services sold primarily due to the change to an over-time revenue model for certain U.S Government and commercial aerospace equipment contracts, and aerospace aftermarket service work at Pratt & Whitney and Collins Aerospace Systems. The New Revenue Standard also resulted in an increase in Cost of products sold primarily related to the timing of manufacturing cost recognition on early-contract OEM units sold, with costs in excess of the contract average unit costs recorded through Cost of products sold.
The lower amounts of research and development expense recognized under the New Revenue Standard reflect the capitalization of costs of engineering and development of aerospace products as contract fulfillment costs under contracts with customers to the extent recoverable.
52
The following schedule quantifies the impact of the New Revenue Standard on our balance sheet as of December 31, 2018.
| (dollars in millions) | December 31, 2018 under previous standard1 | Effect of the New Revenue Standard | December 31, 2018 as reported | ||||||||
| Assets | |||||||||||
| Accounts receivable, net | $ | 15,636 | $ | (1,365 | ) | $ | 14,271 | ||||
| Contract assets, current | 331 | 3,155 | 3,486 | ||||||||
| Inventories | 12,169 | (2,086 | ) | 10,083 | |||||||
| Other assets, current | 1,519 | (8 | ) | 1,511 | |||||||
| Future income tax benefits | 1,614 | 32 | 1,646 | ||||||||
| Intangible assets, net | 26,495 | (71 | ) | 26,424 | |||||||
| Other assets | 6,056 | 1,150 | 7,206 | ||||||||
| Liabilities and Equity | |||||||||||
| Accrued liabilities | $ | 15,522 | $ | (5,299 | ) | $ | 10,223 | ||||
| Contract liabilities, current | 345 | 5,375 | 5,720 | ||||||||
| Other long term liabilities | 15,841 | 1,073 | 16,914 | ||||||||
| Noncontrolling interest | 2,158 | 6 | 2,164 | ||||||||
| Retained earnings | 58,162 | (339 | ) | 57,823 | |||||||
1 | Includes the as reported balance sheet amounts of Rockwell Collins. Because Rockwell Collins adopted the New Revenue Standard prior to the merger, its reported balance sheet amounts have been excluded from the quantification of the effect of the New Revenue Standard shown above. |
The decrease in Retained earnings of $339 million in the table above reflects $480 million of adjustments to the balance sheet as of January 1, 2018, resulting from the adoption of the New Revenue Standard and $141 million higher reported net income under the New Revenue Standard during 2018. The declines in Accounts receivable, net, Inventories, Other assets, current, and Intangible assets, net, reflect reclassifications to contract assets, and specifically for Inventories, earlier recognition of costs of products sold for contracts requiring an over-time method of revenue recognition. The increase in Other assets reflects the establishment of non-current contract assets and contract fulfillment cost assets. Capitalized net contract fulfillment costs as of December 31, 2018 are $914 million.
The decline in accrued liabilities is primarily due to the reclassification of payments from customers in advance of work performed as contract liabilities. The Other long term liabilities increase primarily reflects the establishment of non-current contract liabilities for certain customer funding of OEM product engineering and development, which will be recognized as revenue when the OEM products are delivered to the customer.
Contract Assets and Liabilities. Contract assets reflect revenue recognized and performance obligations satisfied in advance of customer billing. Contract liabilities relate to payments received in advance of the satisfaction of performance under the contract. We receive payments from customers based on the terms established in our contracts. Total contract assets and contract liabilities as of December 31, 2018 are as follows:
| (dollars in millions) | December 31, 2018 | ||
| Contract assets, current | $ | 3,486 | |
| Contract assets, noncurrent (included within Other assets) | 1,142 | ||
| Total contract assets | 4,628 | ||
| Contract liabilities, current | (5,720 | ) | |
| Contract liabilities, noncurrent (included within Other long-term liabilities) | (5,069 | ) | |
| Total contract liabilities | (10,789 | ) | |
| Net contract liabilities | $ | (6,161 | ) |
53
We established contract assets of $3,609 million in connection with our adoption of the New Revenue Standard on January 1, 2018. Contract assets increased $1,019 million from January 1, 2018 to December 31, 2018 as a result of the acquisition of Rockwell Collins ($308 million) and due to revenue recognition in excess of customer billings, primarily on Pratt & Whitney commercial aftermarket and military engines contracts.
We established contract liabilities of $9,974 million in connection with our adoption of the New Revenue Standard. Contract liabilities increased $815 million from January 1, 2018 through December 31, 2018, as a result of the acquisition of Rockwell Collins ($313 million) and due to customer billings in excess of revenue on Otis new equipment contracts and on Pratt & Whitney commercial aftermarket contracts. We recognized revenue of $4,211 million related to contract liabilities as of January 1, 2018.
Remaining performance obligations ("RPO") are the aggregate amount of total contract transaction price that is unsatisfied or partially unsatisfied. As of December 31, 2018, our total RPO is approximately $115.5 billion. Of this total, we expect approximately 46% will be recognized as sales over the following 24 months.
NOTE 4: EARNINGS PER SHARE
| (dollars in millions, except per share amounts; shares in millions) | 2018 | 2017 | 2016 | ||||||||
| Net income attributable to common shareowners: | |||||||||||
| Net income from continuing operations | $ | 5,269 | $ | 4,552 | $ | 5,065 | |||||
| Net loss from discontinued operations | — | — | (10 | ) | |||||||
| Net income attributable to common shareowners | $ | 5,269 | $ | 4,552 | $ | 5,055 | |||||
| Basic weighted average number of shares outstanding | 800.4 | 790.0 | 818.2 | ||||||||
| Stock awards and equity units (share equivalent) | 9.7 | 9.1 | 7.9 | ||||||||
| Diluted weighted average number of shares outstanding | 810.1 | 799.1 | 826.1 | ||||||||
| Earnings Per Share of Common Stock—Basic: | |||||||||||
| Net income from continuing operations | $ | 6.58 | $ | 5.76 | $ | 6.19 | |||||
| Net loss from discontinued operations | — | — | (0.01 | ) | |||||||
| Net income attributable to common shareowners | 6.58 | 5.76 | 6.18 | ||||||||
| Earnings Per Share of Common Stock—Diluted: | |||||||||||
| Net income from continuing operations | $ | 6.50 | $ | 5.70 | $ | 6.13 | |||||
| Net loss from discontinued operations | — | — | (0.01 | ) | |||||||
| Net income attributable to common shareowners | 6.50 | 5.70 | 6.12 | ||||||||
The computation of diluted earnings per share excludes the effect of the potential exercise of stock awards, including stock appreciation rights and stock options, when the average market price of the common stock is lower than the exercise price of the related stock awards during the period because the effect would be anti-dilutive. In addition, the computation of diluted earnings per share excludes the effect of the potential exercise of stock awards when the awards' assumed proceeds exceed the average market price of the common shares during the period. For 2018, 2017 and 2016, there were 5.1 million, 5.9 million and 14.5 million anti-dilutive stock awards excluded from the computation, respectively.
NOTE 5: COMMERCIAL AEROSPACE INDUSTRY ASSETS AND COMMITMENTS
We have receivables and other financing assets with commercial aerospace industry customers totaling $11,695 million and $9,477 million at December 31, 2018 and 2017, respectively. These include customer financing assets related to commercial aerospace industry customers, consisting of products under lease of $2,736 million and $1,913 million, and notes and leases receivable of $299 million and $652 million, at December 31, 2018 and 2017, respectively.
Aircraft financing commitments, in the form of debt or lease financing, are provided to commercial aerospace customers. The extent to which the financing commitments will be utilized is not currently known, since customers may be able to obtain more favorable terms from other financing sources. We may also arrange for third-party investors to assume a portion of these commitments. If financing commitments are exercised, debt financing is generally secured by assets with fair market values equal to or exceeding the financed amounts consistent with market terms and conditions. We may also lease aircraft and subsequently sublease the aircraft to customers under long-term non-cancelable operating leases. Our financing commitments with customers are contingent upon maintenance of certain levels of financial condition by the customers.
54
We have also made residual value and other guarantees related to various commercial aerospace customer financing arrangements. The estimated fair market values of the guaranteed assets equal or exceed the value of the related guarantees, net of existing reserves. We have residual value and other guarantees of $348 million as of December 31, 2018. Refer to Note 17 to the Consolidated Financial Statements for additional discussion on guarantees.
We also have other contractual commitments, including commitments to secure certain contractual rights to provide product on new aircraft platforms, which are included in "Other commercial aerospace commitments" in the table below. Payments made on these contractual commitments are included within other intangible assets and are to be amortized over the term of underlying economic benefit. Our commercial aerospace financing and other contractual commitments as of December 31, 2018 were approximately $15.5 billion. We have entered into certain collaboration arrangements, which may include participation by our collaboration partners in these commitments.
The following is the expected maturity of commercial aerospace industry assets and commitments as of December 31, 2018:
| (dollars in millions) | Committed | 2019 | 2020 | 2021 | 2022 | 2023 | Thereafter | ||||||||||||||||||||
| Notes and leases receivable | $ | 299 | $ | 25 | $ | 97 | $ | 53 | $ | 22 | $ | 23 | $ | 79 | |||||||||||||
| Commercial aerospace financing commitments | $ | 4,556 | $ | 862 | $ | 709 | $ | 1,001 | $ | 873 | $ | 640 | $ | 471 | |||||||||||||
| Other commercial aerospace commitments | 10,914 | 815 | 706 | 673 | 708 | 585 | 7,427 | ||||||||||||||||||||
| Collaboration partners' share | (5,261 | ) | (468 | ) | (448 | ) | (562 | ) | (513 | ) | (412 | ) | (2,858 | ) | |||||||||||||
| Total commercial commitments | $ | 10,209 | $ | 1,209 | $ | 967 | $ | 1,112 | $ | 1,068 | $ | 813 | $ | 5,040 | |||||||||||||
In connection with our 2012 agreement to acquire Rolls-Royce's ownership and collaboration interests in IAE, additional payments are due to Rolls-Royce contingent upon each hour flown through June 2027 by the V2500-powered aircraft in service as of the acquisition date. These flight hour payments, included in "Other commercial aerospace commitments" in the table above, are being capitalized as collaboration intangible assets.
We have long-term aftermarket maintenance contracts with commercial aerospace industry customers for which revenue is recognized over-time in proportion to actual costs incurred relative to total expected costs to be incurred over the respective contract periods. Billings, however, are typically based on factors such as aircraft or engine flight hours. The timing differences between the billings and the maintenance costs incurred generates both Contract assets and Contract liabilities, previously referred to as unbilled receivables and deferred revenue. Additionally, we have other contracts with commercial aerospace industry customers which can result in the generation of Contract assets and Contract liabilities. Contract assets related to long-term aftermarket and other contracts totaled $2,247 million at December 31, 2018 and are included in "Contract assets, current" and "Other assets" in the accompanying Consolidated Balance Sheet. Unbilled receivables totaled $1,109 million at December 31, 2017 and are included in “Accounts receivable” and “Other Assets” in the accompanying Consolidated Balance Sheet.
Contract liabilities totaled $7,083 million and are included in "Contract liabilities, current" and "Other long-term liabilities" in the accompanying Consolidated Balance Sheet. Deferred revenue totaled $5,048 million at December 31, 2017 and are included in "Accrued liabilities" and "Other long-term liabilities" in the accompanying Consolidated Balance Sheet.
In connection with the adoption of the New Revenue Standard, costs for engineering and development of aerospace products have been capitalized as contract fulfillment costs to the extent recoverable. Contract fulfillment costs related to commercial aerospace industry customers is $830 million as of December 31, 2018 and is included in "Other Assets" in the accompanying Consolidated Balance Sheet.
Reserves related to aerospace receivables and financing assets were $245 million and $175 million at December 31, 2018 and 2017, respectively. Reserves related to financing commitments and guarantees were $15 million and $23 million at December 31, 2018 and 2017, respectively.
In addition, in connection with the acquisition of Rockwell Collins in 2018 and Goodrich in 2012, we recorded assumed liabilities of approximately $970 million and $2.2 billion, respectively related to customer contractual obligations on certain programs with terms less favorable than could be realized in market transactions as of the acquisition date. These liabilities are being liquidated in accordance with the underlying pattern of obligations, as reflected by the net cash outflows incurred on the contracts. Total consumption of the contractual obligations for the years ended December 31, 2018 and 2017 was approximately $252 million and $217 million, respectively. The balance of the contractual obligations at December 31, 2018 was $1,690 million, with future consumption expected to be as follows: $381 million in 2019, $295 million in 2020, $217 million in 2021, $163 million in 2022, $134 million in 2023 and $500 million thereafter.
55
NOTE 6: INVENTORIES & CONTRACTS IN PROGRESS, NET
| (dollars in millions) | 2018 | 2017 | |||||
| Raw materials | $ | 3,052 | $ | 2,038 | |||
| Work-in-process | 2,673 | 3,366 | |||||
| Finished goods | 4,358 | 3,845 | |||||
| Contracts in progress | — | 10,205 | |||||
| 10,083 | 19,454 | ||||||
| Less: | |||||||
| Progress payments, secured by lien, on U.S. Government contracts | — | (236 | ) | ||||
| Billings on contracts in progress | — | (9,337 | ) | ||||
| $ | 10,083 | $ | 9,881 | ||||
Raw materials, work-in-process and finished goods are net of valuation reserves of $1,270 million and $1,107 million as of December 31, 2018 and 2017, respectively. Contracts in progress principally relate to elevator and escalator contracts and include costs of manufactured components, accumulated installation costs and estimated earnings on incomplete contracts. Upon adoption of the New Revenue Standard, Contracts in progress have been reclassified to Contract assets.
Inventories as of December 31, 2017 included capitalized contract development costs of $127 million related to certain aerospace programs at Collins Aerospace Systems. Upon adoption of the New Revenue Standard, these costs are recorded as contract fulfillment costs included in Other assets. Under prior accounting within commercial aerospace, the unit of accounting for certain contracts was the contract, and early-contract OEM unit costs in excess of the average unit costs expected over the contract were capitalized and amortized over lower-cost units later in the contract. As of December 31, 2017, inventory included $438 million of such capitalized amounts. As described in the "Revenue Recognition" section of Note 1, upon adoption of the New Revenue Standard, these amounts are no longer included in inventory.
Our sales contracts in many cases are long-term contracts expected to be performed over periods exceeding 12 months. At December 31, 2018 and 2017, approximately 32% and 63% respectively, of total inventories and contracts in progress have been acquired or manufactured under such long-term contracts, with approximately 28% and 38% scheduled for delivery within the succeeding 12 months for 2018 and 2017, respectively. The decline in percentages above is due to the reclassification of Contracts in progress to Contract assets upon adoption of the New Revenue Standard.
NOTE 7: FIXED ASSETS
| (dollars in millions) | Estimated Useful Lives | 2018 | 2017 | ||||||
| Land | $ | 425 | $ | 412 | |||||
| Buildings and improvements | 12-40 years | 6,486 | 5,727 | ||||||
| Machinery, tools and equipment | 3-20 years | 15,119 | 13,476 | ||||||
| Other, including assets under construction | 2,054 | 1,749 | |||||||
| 24,084 | 21,364 | ||||||||
| Accumulated depreciation | (11,787 | ) | (11,178 | ) | |||||
| $ | 12,297 | $ | 10,186 | ||||||
The increase in fixed assets is primarily driven by the acquisition of Rockwell Collins as described in Note 2 to the Consolidated Financial Statements. Depreciation expense was $1,240 million in 2018, $1,178 million in 2017 and $1,105 million in 2016.
56
NOTE 8: ACCRUED LIABILITIES
| (dollars in millions) | 2018 | 2017 | |||||
| Advances on sales contracts and service billings | $ | — | $ | 4,547 | |||
| Accrued salaries, wages and employee benefits | 2,074 | 1,741 | |||||
| Service and warranty accruals | 754 | 629 | |||||
| Interest payable | 637 | 439 | |||||
| Litigation and contract matters | 461 | 435 | |||||
| Income taxes payable | 460 | 285 | |||||
| Accrued property, sales and use taxes | 277 | 258 | |||||
| Canadian government settlement - current portion | 34 | 217 | |||||
| Accrued restructuring costs | 249 | 212 | |||||
| Accrued workers compensation | 142 | 204 | |||||
| Liabilities held for sale | 40 | — | |||||
| Other | 5,095 | 3,349 | |||||
| $ | 10,223 | $ | 12,316 | ||||
The decline in advances on sales contracts and service billings is due to reclassification of amounts to Contract liabilities, current upon adoption of the New Revenue Standard.
On December 30, 2015, P&WC and federal and provincial Canadian government agencies entered into amendments of certain government research and development support arrangements. Under the amendments, P&WC agreed to make four annual payments of approximately CAD 327 million (approximately $243 million at December 2018), commencing in the first quarter of 2016, to fully settle and terminate P&WC's future contractual obligations to pay royalties to these agencies that had previously been contingent upon future engine deliveries and P&WC sales; to maintain its commitments to perform certain assembly, test and manufacturing operations in Canada; and to provide support of innovation and research and development through initiatives with post-secondary institutions and key industry associations in Canada over a 14 year period. As a result of the amendments to these contractual arrangements, Pratt & Whitney recorded a charge and related discounted obligation of $867 million in the fourth quarter of 2015.
The current portion of the Canadian government settlement included in the table above represents the final payment under this agreement to be paid in 2019. There were no Other long-term liabilities related to this settlement in the accompanying Consolidated Balance Sheet as of December 31, 2018 and approximately $256 million as of December 31, 2017.
57
NOTE 9: BORROWINGS AND LINES OF CREDIT
| (dollars in millions) | 2018 | 2017 | |||||
| Short-term borrowings: | |||||||
| Commercial paper | $ | 1,257 | $ | 300 | |||
| Other borrowings | 212 | 92 | |||||
| Total short-term borrowings | $ | 1,469 | $ | 392 | |||
At December 31, 2018, we had revolving credit agreements with various banks permitting aggregate borrowings of up to $4.35 billion pursuant to a $2.20 billion revolving credit agreement and a $2.15 billion multicurrency revolving credit agreement, both of which expire in August 2021. Additionally, on November 26, 2018, we entered into a $1.5 billion revolving credit agreement, which will mature on May 25, 2019. As of December 31, 2018, there were no borrowings on any of these agreements. The undrawn portions of these revolving credit agreements are also available to serve as backup facilities for the issuance of commercial paper. As of December 31, 2018, our maximum commercial paper borrowing limit was $4.35 billion. Commercial paper borrowings at December 31, 2018 include approximately €750 million ($858 million) of euro-denominated commercial paper. We use our commercial paper borrowings for general corporate purposes, including the funding of potential acquisitions, pension contributions, debt refinancing, dividend payments and repurchases of our common stock. The need for commercial paper borrowings arises when the use of domestic cash for general corporate purposes exceeds the sum of domestic cash generation and foreign cash repatriated to the U.S.
At December 31, 2018, approximately $2.2 billion was available under short-term lines of credit with local banks at our various domestic and international subsidiaries. The weighted-average interest expense rates applicable to short-term borrowings and total debt were as follows:
| 2018 | 2017 | ||||
| Average interest expense rate - average outstanding borrowings during the year: | |||||
| Short-term borrowings | 1.5 | % | 1.1 | % | |
| Total debt | 3.5 | % | 3.5 | % | |
| Average interest expense rate - outstanding borrowings as of December 31: | |||||
| Short-term borrowings | 1.2 | % | 2.3 | % | |
| Total debt | 3.5 | % | 3.5 | % | |
Long-term debt consisted of the following as of December 31:
| (dollars in millions) | 2018 | 2017 | |||||
| 6.800% notes due 2018 | $ | — | $ | 99 | |||
EURIBOR plus 0.80% floating rate notes due 2018 (€750 million principal value) 2 | — | 890 | |||||
| 1.778% junior subordinated notes due 2018 | — | 1,100 | |||||
LIBOR plus 0.350% floating rate notes due 2019 3 | 350 | 350 | |||||
1.500% notes due 2019 1 | 650 | 650 | |||||
1.950% notes due 20194 | 300 | — | |||||
EURIBOR plus 0.15% floating rate notes due 2019 (€750 million principal value) 2 | 858 | 890 | |||||
5.250% notes due 20194 | 300 | — | |||||
| 8.875% notes due 2019 | 271 | 271 | |||||
4.875% notes due 2020 1 | 171 | 171 | |||||
4.500% notes due 2020 1 | 1,250 | 1,250 | |||||
1.900% notes due 2020 1 | 1,000 | 1,000 | |||||
EURIBOR plus 0.20% floating rate notes due 2020 (€750 million principal value)2 | 858 | — | |||||
| 8.750% notes due 2021 | 250 | 250 | |||||
3.100% notes due 20214 | 250 | — | |||||
3.350% notes due 20211 | 1,000 | — | |||||
LIBOR plus 0.650% floating rate notes due 20211,3 | 750 | — | |||||
58
1.950% notes due 2021 1 | 750 | 750 | |||||
1.125% notes due 2021 (€950 million principal value) 1 | 1,088 | 1,127 | |||||
2.300% notes due 2022 1 | 500 | 500 | |||||
2.800% notes due 20224 | 1,100 | — | |||||
3.100% notes due 2022 1 | 2,300 | 2,300 | |||||
1.250% notes due 2023 (€750 million principal value) 1 | 858 | 890 | |||||
3.650% notes due 20231 | 2,250 | — | |||||
3.700% notes due 20234 | 400 | — | |||||
2.800% notes due 2024 1 | 800 | 800 | |||||
3.200% notes due 20244 | 950 | — | |||||
1.150% notes due 2024 (€750 million principal value)1 | 858 | — | |||||
3.950% notes due 20251 | 1,500 | — | |||||
1.875% notes due 2026 (€500 million principal value) 1 | 573 | 593 | |||||
2.650% notes due 2026 1 | 1,150 | 1,150 | |||||
3.125% notes due 2027 1 | 1,100 | 1,100 | |||||
3.500% notes due 20274 | 1,300 | — | |||||
| 7.100% notes due 2027 | 141 | 141 | |||||
| 6.700% notes due 2028 | 400 | 400 | |||||
4.125% notes due 20281 | 3,000 | — | |||||
7.500% notes due 2029 1 | 550 | 550 | |||||
2.150% notes due 2030 (€500 million principal value)1 | 573 | — | |||||
5.400% notes due 2035 1 | 600 | 600 | |||||
6.050% notes due 2036 1 | 600 | 600 | |||||
6.800% notes due 2036 1 | 134 | 134 | |||||
| 7.000% notes due 2038 | 159 | 159 | |||||
6.125% notes due 2038 1 | 1,000 | 1,000 | |||||
4.450% notes due 20381 | 750 | — | |||||
5.700% notes due 2040 1 | 1,000 | 1,000 | |||||
4.500% notes due 2042 1 | 3,500 | 3,500 | |||||
4.800% notes due 20434 | 400 | — | |||||
4.150% notes due 2045 1 | 850 | 850 | |||||
3.750% notes due 2046 1 | 1,100 | 1,100 | |||||
4.050% notes due 2047 1 | 600 | 600 | |||||
4.350% notes due 20474 | 1,000 | — | |||||
4.625% notes due 20481 | 1,750 | — | |||||
| Project financing obligations | 287 | 158 | |||||
| Other (including capitalized leases) | 287 | 195 | |||||
| Total principal long-term debt | 44,416 | 27,118 | |||||
| Other (fair market value adjustments, discounts and debt issuance costs) | (348 | ) | (25 | ) | |||
| Total long-term debt | 44,068 | 27,093 | |||||
| Less: current portion | 2,876 | 2,104 | |||||
| Long-term debt, net of current portion | $ | 41,192 | $ | 24,989 | |||
| 1 | We may redeem these notes at our option pursuant to their terms. |
| 2 | The three-month EURIBOR rate as of December 31, 2018 was approximately -0.309%. The notes may be redeemed at our option in whole, but not in part, at any time in the event of certain developments affecting U.S. taxation. |
| 3 | The three-month LIBOR rate as of December 31, 2018 was approximately 2.808%. |
| 4 | Rockwell Collins debt which remained outstanding following the Merger. |
59
The project financing obligations included in the table above are associated with the sale of rights to unbilled revenues related to the ongoing activity of an entity owned by Carrier.
We had the following issuances of debt in 2018 and 2017.
(dollars in millions)
| Issuance Date | Description of Notes | Aggregate Principal Balance | ||
| August 16, 2018: | 3.350% notes due 20211 | $ | 1,000 | |
3.650% notes due 20231 | 2,250 | |||
3.950% notes due 20251 | 1,500 | |||
4.125% notes due 20281 | 3,000 | |||
4.450% notes due 20381 | 750 | |||
4.625% notes due 20482 | 1,750 | |||
LIBOR plus 0.65% floating rate notes due 20211 | 750 | |||
| May 18, 2018: | 1.150% notes due 20243 | € | 750 | |
2.150% notes due 20303 | 500 | |||
EURIBOR plus 0.20% floating rate notes due 20203 | 750 | |||
| November 13, 2017: | EURIBOR plus 0.15% floating rate notes due 20192 | € | 750 | |
| May 4, 2017: | 1.900% notes due 20204 | $ | 1,000 | |
2.300% notes due 20224 | 500 | |||
2.800% notes due 20244 | 800 | |||
3.125% notes due 20274 | 1,100 | |||
4.050% notes due 20474 | 600 | |||
| 1 | The net proceeds received from these debt issuances were used to partially finance the cash consideration portion of the purchase price for Rockwell Collins and fees, expenses and other amounts related to the acquisition of Rockwell Collins. |
| 2 | The net proceeds from these debt issuances were used to fund the repayment of commercial paper and for other general corporate purposes. |
| 3 | The net proceeds received from these debt issuances were used for general corporate purposes. |
| 4 | The net proceeds received from these debt issuances were used to fund the repayment at maturity of our 1.800% notes due 2017, representing $1.5 billion in aggregate principal and other general corporate purposes. |
We made the following repayments of debt in 2018 and 2017:
(dollars in millions)
| Repayment Date | Description of Notes | Aggregate Principal Balance | ||
| December 14, 2018 | Variable-rate term loan due 2020 (1 month LIBOR plus 1.25%)1 | $ | 482 | |
| May 4, 2018 | 1.778% junior subordinated notes | $ | 1,100 | |
| February 22, 2018 | EURIBOR plus 0.80% floating rate notes | € | 750 | |
| February 1, 2018 | 6.80% notes | $ | 99 | |
| June 1, 2017 | 1.800% notes | $ | 1,500 | |
| 1 | This term loan was assumed in connection with the Rockwell Collins acquisition and subsequently repaid. |
The percentage of total short-term borrowings and long-term debt at variable interest rates was 10% and 9% at December 31, 2018 and 2017, respectively. Interest rates on our commercial paper borrowings are considered variable due to their short-term duration and high-frequency of turnover.
60
The average maturity of our long-term debt at December 31, 2018 is approximately 11 years. The schedule of principal payments required on long-term debt for the next five years and thereafter is:
| (dollars in millions) | |||
| 2019 | $ | 2,876 | |
| 2020 | 3,436 | ||
| 2021 | 4,151 | ||
| 2022 | 3,910 | ||
| 2023 | 3,523 | ||
| Thereafter | 26,520 | ||
| Total | $ | 44,416 | |
We have an existing universal shelf registration statement filed with the SEC for an indeterminate amount of debt and equity securities for future issuance, subject to our internal limitations on the amount of debt to be issued under this shelf registration statement.
NOTE 10: EQUITY
A summary of the changes in each component of Accumulated other comprehensive (loss) income, net of tax for the years ended December 31, 2018 and 2017 is provided below:
| (dollars in millions) | Foreign Currency Translation | Defined Benefit Pension and Postretirement Plans | Unrealized Gains (Losses) on Available-for- Sale Securities | Unrealized Hedging (Losses) Gains | Accumulated Other Comprehensive (Loss) Income | |||||||||||||||
| Balance at December 31, 2016 | $ | (3,480 | ) | $ | (5,045 | ) | $ | 353 | $ | (162 | ) | $ | (8,334 | ) | ||||||
| Other comprehensive income before reclassifications, net | 540 | 78 | 3 | 264 | 885 | |||||||||||||||
| Amounts reclassified, pre-tax | (10 | ) | 529 | (566 | ) | (39 | ) | (86 | ) | |||||||||||
| Tax (expense) benefit reclassified | — | (214 | ) | 215 | 9 | 10 | ||||||||||||||
| Balance at December 31, 2017 | $ | (2,950 | ) | $ | (4,652 | ) | $ | 5 | $ | 72 | $ | (7,525 | ) | |||||||
| Other comprehensive loss before reclassifications, net | (486 | ) | (1,736 | ) | — | (307 | ) | (2,529 | ) | |||||||||||
| Amounts reclassified, pre-tax | (2 | ) | 344 | — | (16 | ) | 326 | |||||||||||||
| Tax (expense) benefit reclassified | (4 | ) | 326 | — | 78 | 400 | ||||||||||||||
| ASU 2016-01 adoption impact | — | — | (5 | ) | — | (5 | ) | |||||||||||||
| Balance at December 31, 2018 | $ | (3,442 | ) | $ | (5,718 | ) | $ | — | $ | (173 | ) | $ | (9,333 | ) | ||||||
In January 2016, the FASB issued ASU 2016-01, Financial Instruments - Overall: Recognition and Measurement of Financial Assets and Financial Liabilities. This ASU modifies how entities measure equity investments and present changes in the fair value of financial liabilities. Upon adoption, investments that do not result in consolidation and are not accounted for under the equity method generally must be carried at fair value, with changes in fair value recognized in net income. We had approximately $5 million of unrealized gains on these securities recorded in Accumulated other comprehensive loss in our Consolidated Balance Sheet as of December 31, 2017. We adopted this standard effective January 1, 2018, with these amounts recorded directly to retained earnings as of that date.
Amounts reclassified that relate to our defined benefit pension and postretirement plans include the amortization of prior service costs and actuarial net losses recognized during each period presented. These costs are recorded as components of net periodic pension cost for each period presented (see Note 12 for additional details).
Amounts reclassified that relate to unrealized gains (losses) on available-for-sale securities, pre-tax includes approximately $500 million of previously unrealized gains reclassified to other income as a result of sales of significant investments in available-for-sale securities in 2017, including Carrier's sale of investments in Watsco, Inc.
All noncontrolling interests with redemption features, such as put options, that are not solely within our control (redeemable noncontrolling interests) are reported in the mezzanine section of the Consolidated Balance Sheet, between liabilities and equity, at the greater of redemption value or initial carrying value.
61
NOTE 11: INCOME TAXES
Income Before Income Taxes. The sources of income from continuing operations before income taxes are:
| (dollars in millions) | 2018 | 2017 | 2016 | ||||||||
| United States | $ | 3,630 | $ | 2,990 | $ | 2,534 | |||||
| Foreign | 4,650 | 4,773 | 4,599 | ||||||||
| $ | 8,280 | $ | 7,763 | $ | 7,133 | ||||||
On December 22, 2017 Public Law 115-97 “An Act to Provide for Reconciliation Pursuant to Titles II and V of the Concurrent Resolution on the Budget for Fiscal Year 2018” was enacted. This law is commonly referred to as the Tax Cuts and Jobs Act of 2017 (TCJA).
In 2018, the Company recorded a $744 million charge, representing TCJA related adjustments. The amounts primarily relate to non-U.S. taxes that will become due when previously reinvested earnings of certain international subsidiaries are remitted. The Company has completed its accounting for the TCJA as described in Staff Accounting Bulletin (SAB 118). In 2019, the Company will continue to review and incorporate, as necessary, updates related to forthcoming U.S. Treasury Regulations, other interpretive guidance, and the finalization of the deemed inclusions to be reported on the Company’s U.S. federal income tax returns.
The Company no longer intends to reinvest certain undistributed earnings of its international subsidiaries that have been previously taxed in the U.S. As such, in the fourth quarter, it has recorded the taxes associated therewith. For the remainder of the Company’s undistributed international earnings, unless tax effective to repatriate, UTC will continue to permanently reinvest these earnings. As of December 31, 2018, such undistributed earnings were approximately $18 billion, excluding other comprehensive income amounts. It is not practicable to estimate the amount of tax that might be payable on the remaining amounts.
Provision for Income Taxes. The income tax expense (benefit) for the years ended December 31, 2018, 2017 and 2016 consisted of the following components:
| (dollars in millions) | 2018 | 2017 | 2016 | ||||||||
| Current: | |||||||||||
| United States: | |||||||||||
| Federal | $ | 442 | $ | 1,577 | $ | 30 | |||||
| State | 211 | 64 | (21 | ) | |||||||
| Foreign | 1,238 | 1,140 | 1,290 | ||||||||
| 1,891 | 2,781 | 1,299 | |||||||||
| Future: | |||||||||||
| United States: | |||||||||||
| Federal | 57 | (27 | ) | 318 | |||||||
| State | 62 | 84 | 134 | ||||||||
| Foreign | 616 | 5 | (54 | ) | |||||||
| 735 | 62 | 398 | |||||||||
| Income tax expense | $ | 2,626 | $ | 2,843 | $ | 1,697 | |||||
| Attributable to items credited (charged) to equity | $ | 501 | $ | (128 | ) | $ | (299 | ) | |||
Reconciliation of Effective Income Tax Rate. Differences between effective income tax rates and the statutory U.S. federal income tax rate are as follows:
62
| 2018 | 2017 | 2016 | ||||||
| Statutory U.S. federal income tax rate | 21.0 | % | 35.0 | % | 35.0 | % | ||
| Tax on international activities | 0.9 | % | (6.4 | )% | (8.1 | )% | ||
| Tax audit settlements | — | % | (0.7 | )% | (2.9 | )% | ||
| U.S. tax reform | 9.0 | % | 8.9 | % | — | |||
| Other | 0.8 | % | (0.2 | )% | (0.2 | )% | ||
| Effective income tax rate | 31.7 | % | 36.6 | % | 23.8 | % | ||
The 2018 effective tax rate reflects a net tax charge of $744 million for TCJA related adjustments. The amount primarily relates to non-U.S. taxes that will become due when previously reinvested earnings of certain international subsidiaries are remitted. As noted above, the Company has completed its accounting related to these items as described in Staff Accounting Bulletin (SAB 118). The 2018 effective tax rate reconciliation reflects the corporate rate reduction enacted by the TCJA. The decrease in international activities is primarily related to higher international tax costs compared to the U.S. federal statutory rate.
The 2017 effective tax rate reflects a net tax charge of $690 million, as described above, attributable to the passage of the TCJA. These 2017 provisional amounts, recorded as described in SAB 118, relate to U.S. income tax attributable to previously undistributed earnings of UTC’s international subsidiaries and equity investments, net of foreign tax credits, and the revaluation of U.S. deferred income taxes.
The decrease in the tax audit settlement represents a $55 million favorable adjustment in 2017 related to the expiration of certain statute of limitations offset by the absence of the favorable audit settlements in 2016 described below. The decrease in the benefit associated with international activities is related to international earnings taxed at lower statutory rates offset by the absence of certain credits included in 2016. On December 7, 2017, the province of Quebec enacted a retroactive tax law change resulting in a cost of $48 million offset by the 2016 French law changes described below.
The 2016 effective tax rate reflects $206 million of favorable adjustments related to the conclusion of the review by the Examination Division of the Internal Revenue Service of the UTC 2011 and 2012 tax years and the Goodrich Corporation 2011 and 2012 tax years through the date of its acquisition. In addition, at the end of 2016, France enacted a tax law change reducing its corporate income tax rate, which resulted in a tax benefit of $25 million.
Deferred Tax Assets and Liabilities. Future income taxes represent the tax effects of transactions which are reported in different periods for tax and financial reporting purposes. These amounts consist of the tax effects of temporary differences between the tax and financial reporting balance sheets and tax carryforwards. Future income tax benefits and payables within the same tax paying component of a particular jurisdiction are offset for presentation in the Consolidated Balance Sheet. The amounts have been adjusted for the impact of the TCJA.
The tax effects of temporary differences and tax carryforwards which gave rise to future income tax benefits and payables at December 31, 2018 and 2017 are as follows:
| (dollars in millions) | 2018 | 2017 | |||||
| Future income tax benefits: | |||||||
| Insurance and employee benefits | $ | 1,154 | $ | 928 | |||
| Other asset basis differences | 1,013 | 798 | |||||
| Other liability basis differences | 1,482 | 1,158 | |||||
| Tax loss carryforwards | 583 | 544 | |||||
| Tax credit carryforwards | 1,050 | 948 | |||||
| Valuation allowances | (605 | ) | (582 | ) | |||
| $ | 4,677 | $ | 3,794 | ||||
| Future income taxes payable: | |||||||
| Intangible assets | $ | 4,462 | $ | 2,100 | |||
| Other asset basis differences | 2,159 | 1,315 | |||||
| Other items, net | 123 | 411 | |||||
| $ | 6,744 | $ | 3,826 | ||||
63
Valuation allowances have been established primarily for tax credit carryforwards, tax loss carryforwards, and certain foreign temporary differences to reduce the future income tax benefits to expected realizable amounts.
Tax Credit and Loss Carryforwards. At December 31, 2018, tax credit carryforwards, principally state and foreign, and tax loss carryforwards, principally state and foreign, were as follows:
| (dollars in millions) | Tax Credit Carryforwards | Tax Loss Carryforwards | |||||
| Expiration period: | |||||||
| 2019-2023 | $ | 32 | $ | 286 | |||
| 2024-2028 | 33 | 189 | |||||
| 2029-2038 | 354 | 559 | |||||
| Indefinite | 631 | 1,931 | |||||
| Total | $ | 1,050 | $ | 2,965 | |||
Unrecognized Tax Benefits. At December 31, 2018, we had gross tax-effected unrecognized tax benefits of $1,619 million, of which $1,609 million, if recognized, would impact the effective tax rate. A reconciliation of the beginning and ending amounts of unrecognized tax benefits and interest expense related to unrecognized tax benefits for the years ended December 31, 2018, 2017 and 2016 is as follows:
| (dollars in millions) | 2018 | 2017 | 2016 | ||||||||
| Balance at January 1 | $ | 1,189 | $ | 1,086 | $ | 1,169 | |||||
| Additions for tax positions related to the current year | 192 | 192 | 69 | ||||||||
| Additions for tax positions of prior years | 344 | 73 | 167 | ||||||||
| Reductions for tax positions of prior years | (91 | ) | (91 | ) | (61 | ) | |||||
| Settlements | (15 | ) | (71 | ) | (258 | ) | |||||
| Balance at December 31 | $ | 1,619 | $ | 1,189 | $ | 1,086 | |||||
| Gross interest expense related to unrecognized tax benefits | $ | 37 | $ | 34 | $ | 41 | |||||
| Total accrued interest balance at December 31 | $ | 255 | $ | 215 | $ | 185 | |||||
The 2018 amounts above include amounts related to the acquisition of Rockwell Collins.
We conduct business globally and, as a result, UTC or one or more of our subsidiaries files income tax returns in the U.S. federal jurisdiction and various state and foreign jurisdictions. In the normal course of business we are subject to examination by taxing authorities throughout the world, including such major jurisdictions as Australia, Belgium, Brazil, Canada, China, France, Germany, Hong Kong, India, Italy, Japan, Mexico, Netherlands, Poland, Singapore, South Korea, Spain, Switzerland, the United Kingdom and the United States. With few exceptions, we are no longer subject to U.S. federal, state and local, or non-U.S. income tax examinations for years before 2008.
During the quarter ended September 30, 2017, the Company recognized a noncash gain of approximately $64 million, including a pre-tax interest adjustment of $9 million, as a result of federal, state and non-U.S. tax year closures related to audit resolutions and the expiration of applicable statutes of limitation, including expiration of the U.S. federal income tax statute of limitations for UTC’s 2013 tax year.
During the quarter ended December 31, 2016, the Company recognized a noncash gain of approximately $172 million, including a pre-tax interest adjustment of $22 million, as a result of the closure of the audit by the Examination Division of the Internal Revenue Service (IRS) of UTC tax years 2011 and 2012.
During the quarter ended September 30, 2016, the Company recognized a noncash gain of approximately $58 million, primarily tax, as a result of the closure of the audit by the Examination Division of the IRS of Goodrich Corporation tax years 2011 and 2012 through the date of acquisition by UTC.
As of December 31, 2018, UTC’s tax years 2014, 2015 and 2016 were under audit by the Examination Division of the Internal Revenue Service (IRS) and the audit is expected to conclude during 2019. The Examination Division of the IRS is also auditing the 2014 tax year of a subsidiary acquired as part of UTC’s acquisition of Rockwell Collins and the audit is expected to conclude during 2019. Another subsidiary of the Company is engaged in litigation in Italy which is currently pending before the Italian Supreme Court following favorable lower court decisions. The Italian Tax Authority recently announced an amnesty program; the Company expects to make a decision whether to take part in the first or second quarter of 2019. If we participate,
64
the Company would expect to recognize a non-cash gain, primarily tax, in the range of $90 million to $110 million before the end of the second quarter of 2019.
It is reasonably possible that a net reduction within the range of $470 million to $845 million of unrecognized tax benefits may occur over the next 12 months as a result of additional worldwide uncertain tax positions, the revaluation of current uncertain tax positions arising from developments in examinations, in appeals, or in the courts, or the closure of tax statutes.
See Note 18 "Contingent Liabilities" for discussion regarding uncertain tax positions, included in the above range, related to pending litigation with respect to certain deductions claimed in Germany.
NOTE 12: EMPLOYEE BENEFIT PLANS
We sponsor numerous domestic and foreign employee benefit plans, which are discussed below.
In March 2017, the FASB issued ASU 2017-07, Compensation-Retirement Benefits (Topic 715), Improving the Presentation of Net Periodic Pension Cost and Net Periodic Postretirement Benefit Cost. This ASU requires an employer to report the service cost component of net periodic pension benefit cost in the same line item(s) as other compensation costs arising from services rendered by the pertinent employees during the period, with other cost components presented separately from the service cost component and outside of income from operations. This ASU also allows only the service cost component of net periodic pension benefit cost to be eligible for capitalization when applicable. This ASU was effective for years beginning after December 15, 2017. The Company adopted this standard on January 1, 2018 applying the presentation requirements retrospectively. We elected to apply the practical expedient, which allows us to reclassify amounts disclosed previously in the employee benefit plans note as the basis for applying retrospective presentation for comparative periods as it is impracticable to determine the disaggregation of the cost components for amounts capitalized and amortized in those periods. Provisions related to presentation of the service cost component eligibility for capitalization were applied prospectively.
The effect of the retrospective presentation change related to the net periodic benefit cost of our defined benefit pension and postretirement plans on our consolidated statement of operations was as follows:
| 2017 | |||||||||||
| (dollars in millions) | Previously Reported | Effect of Change Higher/(Lower) | As Revised | ||||||||
| Cost of product sold | $ | 31,027 | $ | 197 | $ | 31,224 | |||||
| Cost of services sold | 12,926 | 51 | 12,977 | ||||||||
| Research and development | 2,387 | 40 | 2,427 | ||||||||
| Selling, general and administrative | 6,183 | 246 | 6,429 | ||||||||
| Non-service pension (benefit) | — | (534 | ) | (534 | ) | ||||||
| 2016 | |||||||||||
| (dollars in millions) | Previously Reported | Effect of Change Higher/(Lower) | As Revised | ||||||||
| Cost of product sold | $ | 30,325 | $ | (21 | ) | $ | 30,304 | ||||
| Cost of services sold | 11,135 | 32 | 11,167 | ||||||||
| Research and development | 2,337 | 39 | 2,376 | ||||||||
| Selling, general and administrative | 6,060 | (102 | ) | 5,958 | |||||||
| Other income | 785 | (3 | ) | 782 | |||||||
| Non-service pension cost | — | 49 | 49 | ||||||||
Employee Savings Plans. We sponsor various employee savings plans. Our contributions to employer sponsored defined contribution plans were $403 million, $351 million and $318 million for 2018, 2017 and 2016, respectively.
Our non-union domestic employee savings plan uses an Employee Stock Ownership Plan (ESOP) for employer matching contributions. External borrowings were used by the ESOP to fund a portion of its purchase of ESOP stock from us. The external borrowings have been extinguished and only re-amortized loans remain between UTC and the ESOP Trust. As ESOP debt service payments are made, common stock is released from an unreleased shares account. ESOP debt may be
65
prepaid or re-amortized to either increase or decrease the number of shares released so that the value of released shares equals the value of plan benefit. We may also, at our option, contribute additional common stock or cash to the ESOP.
Shares of common stock are allocated to employees' ESOP accounts at fair value on the date earned. Cash dividends on common stock held by the ESOP are used for debt service payments. Participants may choose to have their ESOP dividends reinvested or distributed in cash. Common stock allocated to ESOP participants is included in the average number of common shares outstanding for both basic and diluted earnings per share. At December 31, 2018, 24.7 million common shares had been allocated to employees, leaving 9.4 million unallocated common shares in the ESOP Trust, with an approximate fair value of $1.0 billion.
Pension Plans. We sponsor both funded and unfunded domestic and foreign defined benefit pension plans that cover a large number of our employees. Our largest plans are generally closed to new participants. Our plans use a December 31 measurement date consistent with our fiscal year.
66
| (dollars in millions) | 2018 | 2017 | |||||
| Change in Benefit Obligation: | |||||||
| Beginning balance | $ | 36,999 | $ | 34,923 | |||
| Service cost | 372 | 374 | |||||
| Interest cost | 1,117 | 1,120 | |||||
| Actuarial (gain) loss | (2,048 | ) | 1,804 | ||||
| Total benefits paid | (1,932 | ) | (1,782 | ) | |||
| Net settlement, curtailment and special termination benefits | (38 | ) | (49 | ) | |||
| Plan amendments | 65 | 4 | |||||
| Business combinations | 3,694 | — | |||||
| Other | (434 | ) | 605 | ||||
| Ending balance | $ | 37,795 | $ | 36,999 | |||
| Change in Plan Assets: | |||||||
| Beginning balance | $ | 35,689 | $ | 30,555 | |||
| Actual return on plan assets | (1,667 | ) | 4,258 | ||||
| Employer contributions | 238 | 2,188 | |||||
| Benefits paid | (1,932 | ) | (1,782 | ) | |||
| Settlements | (38 | ) | (41 | ) | |||
| Business combinations | 3,355 | — | |||||
| Other | (392 | ) | 511 | ||||
| Ending balance | $ | 35,253 | $ | 35,689 | |||
| Funded Status: | |||||||
| Fair value of plan assets | $ | 35,253 | $ | 35,689 | |||
| Benefit obligations | (37,795 | ) | (36,999 | ) | |||
| Funded status of plan | $ | (2,542 | ) | $ | (1,310 | ) | |
| Amounts Recognized in the Consolidated Balance Sheet Consist of: | |||||||
| Noncurrent assets | $ | 686 | $ | 957 | |||
| Current liability | (88 | ) | (70 | ) | |||
| Noncurrent liability | (3,140 | ) | (2,197 | ) | |||
| Net amount recognized | $ | (2,542 | ) | $ | (1,310 | ) | |
| Amounts Recognized in Accumulated Other Comprehensive Loss Consist of: | |||||||
| Net actuarial loss | $ | 8,606 | $ | 7,238 | |||
| Prior service cost | 139 | 37 | |||||
| Net amount recognized | $ | 8,745 | $ | 7,275 | |||
As part of our long-term strategy to de-risk our defined benefit pension plans, we made discretionary contributions of approximately $1.9 billion to our domestic defined benefit pension plans in the quarter ended September 30, 2017. In 2016, we entered into an agreement to purchase a group annuity contract to transfer approximately $768 million of our outstanding pension benefit obligations related to certain U.S. retirees or beneficiaries, which was finalized on October 12, 2016. We also offered certain former U.S. employees or beneficiaries (generally all former U.S. participants not yet in receipt of their vested pension benefits) an option to take a one-time lump-sum distribution in lieu of future monthly pension payments, which reduced our pension benefit obligations by approximately $935 million. These transactions reduced the assets of our defined benefit pension plans by approximately $1.5 billion. As a result of these 2016 transactions, we recognized a one-time pre-tax pension settlement charge of approximately $423 million in the fourth quarter of 2016.
The amounts included in "Other" in the above table primarily reflect the impact of foreign exchange translation, primarily for plans in the U.K. and Canada.
67
As part of the Rockwell acquisition on November 26, 2018, we assumed approximately $3.7 billion of pension projected benefit obligations and $3.4 billion of plan assets.
As approved in 2016, effective January 1, 2017, a voluntary lump-sum option is available for the frozen final average earnings benefits of certain U.S. salaried employees upon termination of employment after 2016. This option provides participants with the choice of electing to receive a lump-sum payment in lieu of receiving a future monthly pension benefit. This plan change reduced the projected benefit obligation by $170 million as of December 31, 2016.
Qualified domestic pension plan benefits comprise approximately 75% of the projected benefit obligation. Benefits for union employees are generally based on a stated amount for each year of service. For non-union employees, benefits for service up to December 31, 2014 are generally based on an employee's years of service and compensation through December 31, 2014. Benefits for service after December 31, 2014 are based on the existing cash balance formula that was adopted in 2003 for newly hired non-union employees and for other non-union employees who made a one-time voluntary election to have future benefit accruals determined under this formula. Certain foreign plans, which comprise approximately 23% of the projected benefit obligation, are considered defined benefit plans for accounting purposes. Nonqualified domestic pension plans provide supplementary retirement benefits to certain employees and are not a material component of the projected benefit obligation.
We made no contributions to our domestic defined benefit pension plans and made $147 million of cash contributions to our foreign defined benefit pension plans in 2018. In 2017, we made $1.9 billion of cash contributions to our domestic defined benefit pension plans and made $212 million of cash contributions to our foreign defined benefit pension plans.
Information for pension plans with accumulated benefit obligations in excess of plan assets:
| (dollars in millions) | 2018 | 2017 | |||||
| Projected benefit obligation | $ | 25,884 | $ | 22,360 | |||
| Accumulated benefit obligation | 25,455 | 22,159 | |||||
| Fair value of plan assets | 22,803 | 20,438 | |||||
Information for pension plans with projected benefit obligations in excess of plan assets:
| (dollars in millions) | 2018 | 2017 | |||||
| Projected benefit obligation | $ | 28,591 | $ | 27,211 | |||
| Accumulated benefit obligation | 27,968 | 26,560 | |||||
| Fair value of plan assets | 25,362 | 24,944 | |||||
The accumulated benefit obligation for all defined benefit pension plans was $37.0 billion and $36.2 billion at December 31, 2018 and 2017, respectively.
The components of the net periodic pension (benefit) cost are as follows:
| (dollars in millions) | 2018 | 2017 | 2016 | ||||||||
| Pension Benefits: | |||||||||||
| Service cost | $ | 372 | $ | 374 | $ | 383 | |||||
| Interest cost | 1,117 | 1,120 | 1,183 | ||||||||
| Expected return on plan assets | (2,255 | ) | (2,215 | ) | (2,202 | ) | |||||
| Amortization of prior service credit | (41 | ) | (36 | ) | (33 | ) | |||||
| Recognized actuarial net loss | 401 | 575 | 572 | ||||||||
| Net settlement, curtailment and special termination benefits loss | 1 | 3 | 498 | ||||||||
| Net periodic pension (benefit) cost - employer | $ | (405 | ) | $ | (179 | ) | $ | 401 | |||
68
Other changes in plan assets and benefit obligations recognized in other comprehensive loss in 2018 are as follows:
| (dollars in millions) | |||
| Current year actuarial loss | $ | 1,871 | |
| Amortization of actuarial loss | (401 | ) | |
| Current year prior service cost | 65 | ||
| Amortization of prior service credit | 41 | ||
| Net settlement and curtailment loss | 2 | ||
| Other | (108 | ) | |
| Total recognized in other comprehensive loss | $ | 1,470 | |
| Net recognized in net periodic pension (benefit) cost and other comprehensive loss | $ | 1,065 | |
The amount included in "Other" in the above table primarily reflects the impact of foreign exchange translation, primarily for plans in the U.K. and Canada.
The estimated amount that will be amortized from accumulated other comprehensive loss into net periodic pension (benefit) cost in 2019 is as follows:
| (dollars in millions) | |||
| Net actuarial loss | $ | 214 | |
| Prior service cost | 17 | ||
| $ | 231 | ||
Major assumptions used in determining the benefit obligation and net cost for pension plans are presented in the following table as weighted-averages:
| Benefit Obligation | Net Cost | ||||||||||||||
| 2018 | 2017 | 2018 | 2017 | 2016 | |||||||||||
| Discount rate | |||||||||||||||
| PBO | 4.0 | % | 3.4 | % | 3.4 | % | 3.8 | % | 4.1 | % | |||||
Interest cost1 | — | — | 3.0 | % | 3.3 | % | 3.4 | % | |||||||
Service cost1 | — | — | 3.3 | % | 3.6 | % | 3.8 | % | |||||||
| Salary scale | 4.2 | % | 4.2 | % | 4.2 | % | 4.1 | % | 4.2 | % | |||||
| Expected return on plan assets | — | — | 6.8 | % | 7.3 | % | 7.3 | % | |||||||
| Note 1 | The discount rates used to measure the service cost and interest cost applies to our significant plans. The PBO discount rate is used for the service cost and interest cost measurements for non-significant plans. |
In determining the expected return on plan assets, we consider the relative weighting of plan assets, the historical performance of total plan assets and individual asset classes, and economic and other indicators of future performance. In addition, we may consult with and consider the opinions of financial and other professionals in developing appropriate capital market assumptions. Return projections are also validated using a simulation model that incorporates yield curves, credit spreads and risk premiums to project long-term prospective returns.
The plans' investment management objectives include providing the liquidity and asset levels needed to meet current and future benefit payments, while maintaining a prudent degree of portfolio diversification considering interest rate risk and market volatility. Globally, investment strategies target a mix of 50% to 55% of growth seeking assets and 45% to 50% of income generating and hedging assets using a wide set of diversified asset types, fund strategies and investment managers. The growth seeking allocation consists of global public equities in developed and emerging countries, private equity, real estate and multi-asset class strategies. Growth assets include an enhanced alpha strategy that invests in publicly traded equity and fixed income securities, derivatives and foreign currency. Investments in private equity are primarily via limited partnership interests in buy-out strategies with smaller allocations to distressed debt funds. The real estate strategy is principally concentrated in directly held U.S. core investments with some smaller investments in international, value-added and opportunistic strategies. Within the income generating assets, the fixed income portfolio consists of mainly government and broadly diversified high quality corporate bonds.
The plans have continued their pension risk management techniques designed to reduce their interest rate risk. Specifically, the plans have incorporated liability hedging programs that include the adoption of a risk reduction objective as part of the long-term investment strategy. Under this objective the interest rate hedge is dynamically increased as funded
69
status improves. The hedging programs incorporate a range of assets and investment tools, each with varying interest rate sensitivities. As result of the improved funded status of the plans due to favorable asset returns and funding of the plans, the interest rate hedge increased significantly during 2017. The investment portfolios are currently hedging approximately 60% to 65% of the interest rate sensitivity of the pension plan liabilities.
As a result of the shift in the target asset mix in 2017 to higher income generating and hedging assets and lower growth seeking assets, we reduced the expected return on plan assets assumption for 2018 including the assumption of a 7% return on plan assets for our qualified domestic pension plans, down from 7.6% in 2017.
70
The fair values of pension plan assets at December 31, 2018 and 2017 by asset category are as follows:
| (dollars in millions) | Quoted Prices in Active Markets For Identical Assets (Level 1) | Significant Observable Inputs (Level 2) | Significant Unobservable Inputs (Level 3) | Not Subject to Leveling | Total | ||||||||||||||
| Asset Category: | |||||||||||||||||||
| Public Equities | |||||||||||||||||||
| Global Equities | $ | 2,917 | $ | 4 | $ | — | $ | — | $ | 2,921 | |||||||||
Global Equity Commingled Funds1 | 185 | 426 | — | — | 611 | ||||||||||||||
Enhanced Global Equities 2 | 79 | 605 | — | — | 684 | ||||||||||||||
Global Equity Funds at net asset value8 | — | — | — | 7,386 | 7,386 | ||||||||||||||
Private Equities 3,8 | — | — | 133 | 1,194 | 1,327 | ||||||||||||||
| Fixed Income Securities | |||||||||||||||||||
| Governments | 1,789 | 162 | — | — | 1,951 | ||||||||||||||
| Corporate Bonds | — | 11,527 | 18 | 29 | 11,574 | ||||||||||||||
Fixed Income Securities8 | — | — | — | 3,599 | 3,599 | ||||||||||||||
Real Estate 4,8 | — | 13 | 1,387 | 429 | 1,829 | ||||||||||||||
Other 5,8 | — | 262 | — | 2,368 | 2,630 | ||||||||||||||
Cash & Cash Equivalents 6,8 | — | 220 | — | 138 | 358 | ||||||||||||||
| Subtotal | $ | 4,970 | $ | 13,219 | $ | 1,538 | $ | 15,143 | 34,870 | ||||||||||
Other Assets & Liabilities7 | 383 | ||||||||||||||||||
| Total at December 31, 2018 | $ | 35,253 | |||||||||||||||||
| Public Equities | |||||||||||||||||||
| Global Equities | $ | 3,129 | $ | 3 | $ | — | $ | — | $ | 3,132 | |||||||||
Global Equity Commingled Funds1 | — | 1,084 | — | — | 1,084 | ||||||||||||||
Enhanced Global Equities 2 | 213 | 819 | — | — | 1,032 | ||||||||||||||
Global Equity Funds at net asset value 8 | — | — | — | 7,599 | 7,599 | ||||||||||||||
Private Equities 3,8 | — | — | 46 | 1,170 | 1,216 | ||||||||||||||
| Fixed Income Securities | |||||||||||||||||||
| Governments | 1,445 | 69 | — | — | 1,514 | ||||||||||||||
| Corporate Bonds | — | 10,929 | — | — | 10,929 | ||||||||||||||
Fixed Income Securities8 | — | — | — | 3,519 | 3,519 | ||||||||||||||
Real Estate 4,8 | — | 15 | 1,446 | 396 | 1,857 | ||||||||||||||
Other 5,8 | — | 287 | — | 2,509 | 2,796 | ||||||||||||||
Cash & Cash Equivalents 6,8 | — | 79 | — | 498 | 577 | ||||||||||||||
| Subtotal | $ | 4,787 | $ | 13,285 | $ | 1,492 | $ | 15,691 | 35,255 | ||||||||||
Other Assets & Liabilities7 | 434 | ||||||||||||||||||
| Total at December 31, 2017 | $ | 35,689 | |||||||||||||||||
| Note 1 | Represents commingled funds that invest primarily in common stocks. |
| Note 2 | Represents enhanced equity separate account and commingled fund portfolios. A portion of the portfolio may include long-short market neutral and relative value strategies that invest in publicly traded, equity and fixed income securities, as well as derivatives of equity and fixed income securities and foreign currency. |
| Note 3 | Represents limited partner investments with general partners that primarily invest in debt and equity. |
| Note 4 | Represents investments in real estate including commingled funds and directly held properties. |
| Note 5 | Represents insurance contracts and global balanced risk commingled funds consisting mainly of equity, bonds and some commodities. |
| Note 6 | Represents short-term commercial paper, bonds and other cash or cash-like instruments. |
| Note 7 | Represents trust receivables and payables that are not leveled. |
| Note 8 | In accordance with ASU 2015-07, Fair Value Measurement (Topic 820), certain investments that are measured at fair value using the net asset value per share (or its equivalent) practical expedient have not been classified in the fair value hierarchy. The fair value amounts presented in this table are intended to permit reconciliation of the fair value hierarchy to the amounts presented for the total pension benefits plan assets. |
71
Derivatives in the plan are primarily used to manage risk and gain asset class exposure while still maintaining liquidity. Derivative instruments mainly consist of equity futures, interest rate futures, interest rate swaps and currency forward contracts.
Our common stock represents approximately less than 1% of total plan assets at both December 31, 2018 and 2017. We review our assets at least quarterly to ensure we are within the targeted asset allocation ranges and, if necessary, asset balances are adjusted back within target allocations. We employ a broadly diversified investment manager structure that includes diversification by active and passive management, style, capitalization, country, sector, industry and number of investment managers.
The fair value measurement of plan assets using significant unobservable inputs (Level 3) changed due to the following:
| (dollars in millions) | Private Equities | Corporate Bonds | Real Estate | Total | |||||||||||
| Balance, December 31, 2016 | $ | 122 | $ | — | $ | 1,285 | $ | 1,407 | |||||||
| Realized gains | 61 | — | 31 | 92 | |||||||||||
| Unrealized (losses) gains relating to instruments still held in the reporting period | (47 | ) | — | 17 | (30 | ) | |||||||||
| Purchases, sales, and settlements, net | (90 | ) | — | 113 | 23 | ||||||||||
| Balance, December 31, 2017 | 46 | — | 1,446 | 1,492 | |||||||||||
| Plan assets acquired | — | 33 | — | 33 | |||||||||||
| Realized (losses) gains | — | (1 | ) | 10 | 9 | ||||||||||
| Unrealized gains relating to instruments still held in the reporting period | — | 2 | 38 | 40 | |||||||||||
| Purchases, sales, and settlements, net | 87 | (16 | ) | (107 | ) | (36 | ) | ||||||||
| Balance, December 31, 2018 | $ | 133 | $ | 18 | $ | 1,387 | $ | 1,538 | |||||||
Quoted market prices are used to value investments when available. Investments in securities traded on exchanges, including listed futures and options, are valued at the last reported sale prices on the last business day of the year or, if not available, the last reported bid prices. Fixed income securities are primarily measured using a market approach pricing methodology, where observable prices are obtained by market transactions involving identical or comparable securities of issuers with similar credit ratings. Mortgages have been valued on the basis of their future principal and interest payments discounted at prevailing interest rates for similar investments. Investment contracts are valued at fair value by discounting the related cash flows based on current yields of similar instruments with comparable durations. Real estate investments are valued on a quarterly basis using discounted cash flow models which consider long-term lease estimates, future rental receipts and estimated residual values. Valuation estimates are supplemented by third-party appraisals on an annual basis.
Private equity limited partnerships are valued quarterly using discounted cash flows, earnings multiples and market multiples. Valuation adjustments reflect changes in operating results, financial condition, or prospects of the applicable portfolio company. Over-the-counter securities and government obligations are valued at the bid prices or the average of the bid and ask prices on the last business day of the year from published sources or, if not available, from other sources considered reliable, generally broker quotes. Temporary cash investments are stated at cost, which approximates fair value.
As a result of the $1.9 billion contribution in 2017, we are not required to make additional contributions to our domestic defined benefit pension plans through the end of 2024. We expect to make total contributions of approximately $100 million to our global defined benefit pension plans in 2019. Contributions do not reflect benefits to be paid directly from corporate assets.
Benefit payments, including amounts to be paid from corporate assets, and reflecting expected future service, as appropriate, are expected to be paid as follows: $2,371 million in 2019, $2,195 million in 2020, $2,240 million in 2021, $2,292 million in 2022, $2,327 million in 2023, and $11,939 million from 2024 through 2028.
Postretirement Benefit Plans. We sponsor a number of postretirement benefit plans that provide health and life benefits to eligible retirees. Such benefits are provided primarily from domestic plans, which comprise approximately 87% of the benefit obligation. The postretirement plans are primarily unfunded. The assets are invested in approximately 50% growth seeking assets and 50% income generating assets.
72
| (dollars in millions) | 2018 | 2017 | |||||
| Change in Benefit Obligation: | |||||||
| Beginning balance | $ | 767 | $ | 805 | |||
| Service cost | 2 | 2 | |||||
| Interest cost | 26 | 29 | |||||
| Actuarial gain | (52 | ) | (4 | ) | |||
| Total benefits paid | (70 | ) | (87 | ) | |||
| Business combinations | 186 | — | |||||
| Plan amendments | (43 | ) | (6 | ) | |||
| Other | (6 | ) | 28 | ||||
| Ending balance | $ | 810 | $ | 767 | |||
| Change in Plan Assets: | |||||||
| Beginning balance | $ | — | $ | — | |||
| Employer contributions | 69 | 71 | |||||
| Benefits paid | (70 | ) | (87 | ) | |||
| Business combinations | 20 | — | |||||
| Other | 1 | 16 | |||||
| Ending balance | $ | 20 | $ | — | |||
| Funded Status: | |||||||
| Fair value of plan assets | $ | 20 | $ | — | |||
| Benefit obligations | (810 | ) | (767 | ) | |||
| Funded status of plan | $ | (790 | ) | $ | (767 | ) | |
| Amounts Recognized in the Consolidated Balance Sheet Consist of: | |||||||
| Current liability | $ | (61 | ) | $ | (72 | ) | |
| Noncurrent liability | (729 | ) | (695 | ) | |||
| Net amount recognized | $ | (790 | ) | $ | (767 | ) | |
| Amounts Recognized in Accumulated Other Comprehensive Loss Consist of: | |||||||
| Net actuarial gain | $ | (184 | ) | $ | (143 | ) | |
| Prior service credit | (47 | ) | (10 | ) | |||
| Net amount recognized | $ | (231 | ) | $ | (153 | ) | |
As part of our acquisition of Rockwell on November 26, 2018, we assumed approximately $186 million of postretirement benefit obligations and $20 million of plan assets.
We modified the postretirement medical benefits provided to legacy Rockwell employees by eliminating any company subsidy from retirements that occur after December 31, 2019. This resulted in a $43 million reduction in the benefit obligation as of November 26, 2018.
The components of net periodic benefit cost are as follows:
| (dollars in millions) | 2018 | 2017 | 2016 | ||||||||
| Other Postretirement Benefits: | |||||||||||
| Service cost | $ | 2 | $ | 2 | $ | 3 | |||||
| Interest cost | 26 | 29 | 34 | ||||||||
| Amortization of prior service credit | (6 | ) | (1 | ) | — | ||||||
| Recognized actuarial net gain | (10 | ) | (9 | ) | (4 | ) | |||||
| Net periodic other postretirement benefit cost | $ | 12 | $ | 21 | $ | 33 | |||||
73
Other changes in plan assets and benefit obligations recognized in other comprehensive loss in 2018 are as follows:
| (dollars in millions) | |||
| Current year actuarial gain | $ | (52 | ) |
| Current year prior service credit | (43 | ) | |
| Amortization of prior service credit | 6 | ||
| Amortization of actuarial net gain | 10 | ||
| Other | 1 | ||
| Total recognized in other comprehensive loss | $ | (78 | ) |
| Net recognized in net periodic other postretirement benefit cost and other comprehensive loss | $ | (66 | ) |
The estimated amounts that will be amortized from accumulated other comprehensive loss into net periodic benefit cost in 2019 include actuarial net gains of $12 million and prior service credits of $42 million.
Major assumptions used in determining the benefit obligation and net cost for postretirement plans are presented in the following table as weighted-averages:
| Benefit Obligation | Net Cost | |||||||||||||
| 2018 | 2017 | 2018 | 2017 | 2016 | ||||||||||
| Discount rate | 4.1 | % | 3.4 | % | 3.4 | % | 3.8 | % | 4.0 | % | ||||
| Expected return on assets | — | — | 7.0 | % | N/A | N/A | ||||||||
Assumed health care cost trend rates are as follows:
| 2018 | 2017 | ||||
| Health care cost trend rate assumed for next year | 7.0 | % | 7.0 | % | |
| Rate that the cost trend rate gradually declines to | 5.0 | % | 5.0 | % | |
| Year that the rate reaches the rate it is assumed to remain at | 2026 | 2026 | |||
Assumed health care cost trend rates have a significant effect on the amounts reported for the health care plans. A one-percentage-point change in assumed health care cost trend rates would have the following effects:
| 2018 One-Percentage-Point | |||||||
| (dollars in millions) | Increase | Decrease | |||||
| Effect on total service and interest cost | $ | 1 | $ | (1 | ) | ||
| Effect on postretirement benefit obligation | 32 | (28 | ) | ||||
Benefit payments, including net amounts to be paid from corporate assets and reflecting expected future service, as appropriate, are expected to be paid as follows: $81 million in 2019, $75 million in 2020, $72 million in 2021, $67 million in 2022, $61 million in 2023, and $253 million from 2024 through 2028.
Multiemployer Benefit Plans. We contribute to various domestic and foreign multiemployer defined benefit pension plans. The risks of participating in these multiemployer plans are different from single-employer plans in that assets contributed are pooled and may be used to provide benefits to employees of other participating employers. If a participating employer stops contributing to the plan, the unfunded obligations of the plan may be borne by the remaining participating employers. Lastly, if we choose to stop participating in some of our multiemployer plans, we may be required to pay those plans a withdrawal liability based on the underfunded status of the plan.
Our participation in these plans for the annual periods ended December 31 is outlined in the table below. Unless otherwise noted, the most recent Pension Protection Act (PPA) zone status available in 2018 and 2017 is for the plan's year-end at June 30, 2017, and June 30, 2016, respectively. The zone status is based on information that we received from the plan and is certified by the plan's actuary. Our significant plan is in the green zone which represents a plan that is at least 80% funded and does not require a financial improvement plan (FIP) or a rehabilitation plan (RP). An extended amortization provision of ten years is utilized to recognize investment gains or losses for our significant plan.
74
| (dollars in millions) | Pension Protection Act Zone Status | FIP/ RP Status | Contributions | |||||||||||||||||||||
| Pension Fund | EIN/Pension Plan Number | 2018 | 2017 | Pending/ Implemented | 2018 | 2017 | 2016 | Surcharge Imposed | Expiration Date of Collective-Bargaining Agreement | |||||||||||||||
| National Elevator Industry Pension Plan | 23-2694291 | Green | Green | No | $ | 120 | $ | 114 | $ | 100 | No | July 8, 2022 | ||||||||||||
| Other funds | 31 | 31 | 31 | |||||||||||||||||||||
| $ | 151 | $ | 145 | $ | 131 | |||||||||||||||||||
For the plan years ended June 30, 2017 and 2016, respectively, we were listed in the National Elevator Industry Pension Plan's Forms 5500 as providing more than 5% of the total contributions for the plan. At the date these financial statements were issued, Forms 5500 were not available for the plan year ending June 30, 2018.
In addition, we participate in several multiemployer arrangements that provide postretirement benefits other than pensions, with the National Elevator Industry Health Benefit Plan being the most significant. These arrangements generally provide medical and life benefits for eligible active employees and retirees and their dependents. Contributions to multiemployer plans that provide postretirement benefits other than pensions were $20 million, $19 million and $17 million for 2018, 2017 and 2016, respectively.
Stock-based Compensation. UTC's long-term incentive plans authorize various types of market and performance based incentive awards that may be granted to officers and employees. The UTC 2018 Long-Term Incentive Plan (the "2018 LTIP") was approved by shareholders on April 30, 2018 and its predecessor plan (the "Legacy LTIP"), was last amended on February 5, 2016. A total of 184 million shares have been authorized for issuance pursuant to awards under these Plans. There are no equity-based compensation awards granted under any other plan. As of December 31, 2018, approximately 58 million shares remain available for awards under the 2018 LTIP. No shares remain available for future awards under the Legacy LTIP. Neither plan contains an aggregate annual award limit, however, each Plan sets an annual award limit per participant. We expect that the shares awarded on an annual basis will range from 1.0% to 1.5% of shares outstanding. The 2018 LTIP will expire after all authorized shares have been awarded or April 30, 2028, whichever is sooner.
Under both Plans, the exercise price of awards is set on the grant date and may not be less than the fair market value per share on that date. Generally, stock appreciation rights and stock options have a term of ten years and a three-year vesting period, subject to limited exceptions. In the event of retirement, annual stock appreciation rights, stock options, and restricted stock units held for more than one year may become vested and exercisable, subject to certain terms and conditions. LTIP awards with performance-based vesting generally have a minimum three-year vesting period and vest based on actual performance against pre-established metrics. In the event of retirement, performance-based awards held for more than one year, remain eligible to vest based on actual performance relative to target metrics. We have historically repurchased shares of our common stock in an amount at least equal to the number of shares issued under our equity compensation arrangements and will continue to evaluate this policy in conjunction with our overall share repurchase program.
We measure the cost of all share-based payments, including stock options, at fair value on the grant date and recognize this cost in the Consolidated Statement of Operations as follows:
| (dollars in millions) | 2018 | 2017 | 2016 | ||||||||
| Continuing operations | $ | 251 | $ | 192 | $ | 152 | |||||
| Discontinued operations | — | — | 1 | ||||||||
| Total compensation cost recognized | $ | 251 | $ | 192 | $ | 153 | |||||
The associated future income tax benefit recognized was $42 million, $38 million and $49 million for the years ended December 31, 2018, 2017 and 2016, respectively. The amounts have been adjusted for the impact of the TCJA. Please refer to Note 11 for additional detail.
For the years ended December 31, 2018, 2017 and 2016, the amount of cash received from the exercise of stock options was $36 million, $29 million and $17 million, respectively, with an associated tax benefit realized of $59 million, $100 million and $69 million, respectively. In addition, for the years ended December 31, 2018, 2017 and 2016, the associated tax benefit realized from the vesting of performance share units and other restricted awards was $13 million, $12 million and $17 million, respectively. The 2018 amount was computed using current US Federal and State tax rates.
75
At December 31, 2018, there was $240 million of total unrecognized compensation cost related to non-vested equity awards granted under long-term incentive plans, of which $50 million relates to Rockwell Collins awards. This cost is expected to be recognized ratably over a weighted-average period of 2.6 years.
A summary of the transactions under all long-term incentive plans for the year ended December 31, 2018 follows:
| Stock Options | Stock Appreciation Rights | Performance Share Units | Other Incentive Shares/Units | ||||||||||||||||||||
| (shares and units in thousands) | Shares | Average Price* | Shares | Average Price* | Units | Average Price** | |||||||||||||||||
| Outstanding at: | |||||||||||||||||||||||
| December 31, 2017 | 1,745 | $ | 94.35 | 32,722 | $ | 92.54 | 1,876 | $ | 106.38 | 2,182 | |||||||||||||
Granted1 | 255 | 126.94 | 4,579 | 127.37 | 598 | 128.20 | 992 | ||||||||||||||||
| Exercised / earned | (389 | ) | 92.52 | (4,781 | ) | 74.47 | (181 | ) | 115.08 | (406 | ) | ||||||||||||
| Cancelled | (8 | ) | 111.87 | (454 | ) | 110.50 | (487 | ) | 114.99 | (72 | ) | ||||||||||||
Other - Rockwell Collins2 | — | $ | — | — | $ | — | — | $ | — | 351 | |||||||||||||
| December 31, 2018 | 1,603 | $ | 99.89 | 32,066 | $ | 99.95 | 1,806 | $ | 110.41 | 3,047 | |||||||||||||
| * | weighted-average exercise price |
| ** | weighted-average grant stock price |
| 1 | Other Incentive Shares include 193 thousand of units granted post-acquisition to specific Rockwell Collins executives |
| 2 | Represents Rockwell Collins awards converted to UTC RSU shares in accordance with merger acquisition |
The weighted-average grant date fair value of stock options and stock appreciation rights granted during 2018, 2017 and 2016 was $20.24, $17.22 and $14.02, respectively. The weighted-average grant date fair value of performance share units, which vest upon achieving certain performance metrics, granted during 2018, 2017 and 2016 was $131.55, $111.00 and $91.63, respectively. The total fair value of awards vested during the years ended December 31, 2018, 2017 and 2016 was $149 million, $138 million and $165 million, respectively. The total intrinsic value (which is the amount by which the stock price exceeded the exercise price on the date of exercise) of stock options and stock appreciation rights exercised during the years ended December 31, 2018, 2017 and 2016 was $283 million, $320 million and $214 million, respectively. The total intrinsic value (which is the stock price at vesting) of performance share units and other restricted awards vested was $74 million, $49 million and $61 million during the years ended December 31, 2018, 2017 and 2016, respectively.
The following table summarizes information about equity awards outstanding that are vested and expected to vest and equity awards outstanding that are exercisable at December 31, 2018:
| Equity Awards Vested and Expected to Vest | Equity Awards That Are Exercisable | |||||||||||||||||||||||||
| (shares in thousands; aggregate intrinsic value in millions) | Awards | Average Price* | Aggregate Intrinsic Value | Remaining Term** | Awards | Average Price* | Aggregate Intrinsic Value | Remaining Term** | ||||||||||||||||||
| Stock Options/Stock Appreciation Rights | 33,059 | $ | 98.97 | $ | 407 | 5.4 years | 21,761 | $ | 92.08 | $ | 365 | 4.0 years | ||||||||||||||
Performance Share Units/Restricted Stock1 | 4,821 | — | 513 | 1.7 years | ||||||||||||||||||||||
| * | weighted-average exercise price per share |
| ** | weighted-average contractual remaining term in years |
| 1 | Restricted Stock values include Rockwell Collins awards totaling 507 thousand, for which aggregate intrinsic value is 54 million for the remaining term of 2.2 years |
The fair value of each option award is estimated on the date of grant using a binomial lattice model. The following table indicates the assumptions used in estimating fair value for the years ended December 31, 2018, 2017 and 2016. Lattice-based option models incorporate ranges of assumptions for inputs; those ranges are as follows:
| 2018 | 2017 | 2016 | |||||||
| Expected volatility | 17.5% - 21.1% | 19 | % | 20 | % | ||||
| Weighted-average volatility | 18 | % | 19 | % | 20 | % | |||
| Expected term (in years) | 6.5 - 6.6 | 6.5 | 6.5 | ||||||
| Expected dividend yield | 2.2 | % | 2.4 | % | 2.7 | % | |||
| Risk-free rate | 1.3% - 2.7% | 0.5% - 2.5% | 0.2% - 2.6% | ||||||
76
Expected volatilities are based on the returns of our stock, including implied volatilities from traded options on our stock for the binomial lattice model. We use historical data to estimate equity award exercise and employee termination behavior within the valuation model. The expected term represents an estimate of the period of time equity awards are expected to remain outstanding. The risk-free rate is based on the term structure of interest rates at the time of equity award grant.
NOTE 13: RESTRUCTURING COSTS
During 2018, we recorded net pre-tax restructuring costs totaling $307 million for new and ongoing restructuring actions. We recorded charges in the segments as follows:
| (dollars in millions) | |||
| Otis | $ | 69 | |
| Carrier | 80 | ||
| Pratt & Whitney | (7 | ) | |
| Collins Aerospace Systems | 160 | ||
| Eliminations and other | 5 | ||
| Total | $ | 307 | |
Restructuring charges incurred in 2018 primarily relate to actions initiated during 2018 and 2017, and were recorded as follows:
| (dollars in millions) | |||
| Cost of sales | $ | 147 | |
| Selling, general & administrative | 162 | ||
| Non-service pension (benefit) | (2 | ) | |
| Total | $ | 307 | |
2018 Actions. During 2018, we recorded net pre-tax restructuring costs totaling $207 million for restructuring actions initiated in 2018, consisting of $76 million in cost of sales, $133 million in selling, general and administrative expenses and $(2) million in non-service pension benefit. The 2018 actions relate to ongoing cost reduction efforts, including workforce reductions and consolidation of field operations.
We are targeting to complete in 2019 and 2020 the majority of the remaining workforce and all facility related cost reduction actions initiated in 2018. No specific plans for significant other actions have been finalized at this time. The following table summarizes the accrual balances and utilization by cost type for the 2018 restructuring actions:
| (dollars in millions) | Severance | Facility Exit, Lease Termination & Other Costs | Total | ||||||||
| Net pre-tax restructuring costs | $ | 191 | $ | 16 | $ | 207 | |||||
| Utilization, foreign exchange and other costs | (76 | ) | 7 | (69 | ) | ||||||
| Balance at December 31, 2018 | $ | 115 | $ | 23 | $ | 138 | |||||
The following table summarizes expected, incurred and remaining costs for the 2018 restructuring actions by segment:
| (dollars in millions) | Expected Costs | Cost Incurred During 2018 | Remaining Costs at December 31, 2018 | ||||||||
| Otis | $ | 55 | $ | (48 | ) | $ | 7 | ||||
| Carrier | 111 | (64 | ) | 47 | |||||||
| Pratt & Whitney | 3 | (3 | ) | — | |||||||
| Collins Aerospace Systems | 111 | (87 | ) | 24 | |||||||
| Eliminations and other | 6 | (5 | ) | 1 | |||||||
| Total | $ | 286 | $ | (207 | ) | $ | 79 | ||||
77
2017 Actions. During 2018, we recorded net pre-tax restructuring costs totaling $94 million for restructuring actions initiated in 2017, consisting of $72 million in cost of sales and $22 million in selling, general and administrative expenses. The 2017 actions relate to ongoing cost reduction efforts, including workforce reductions and the consolidation of field operations. The following table summarizes the accrual balances and utilization by cost type for the 2017 restructuring actions:
| (dollars in millions) | Severance | Facility Exit, Lease Termination and Other Costs | Total | ||||||||
| Restructuring accruals at January 1, 2018 | $ | 84 | $ | 1 | $ | 85 | |||||
| Net pre-tax restructuring costs | 62 | 32 | 94 | ||||||||
| Utilization, foreign exchange and other costs | (89 | ) | (37 | ) | (126 | ) | |||||
| Balance at December 31, 2018 | $ | 57 | $ | (4 | ) | $ | 53 | ||||
The following table summarizes expected, incurred and remaining costs for the 2017 programs by segment:
| (dollars in millions) | Expected Costs | Costs Incurred During 2017 | Costs Incurred During 2018 | Remaining Costs at December 31, 2018 | |||||||||||
| Otis | $ | 66 | $ | (43 | ) | $ | (20 | ) | $ | 3 | |||||
| Carrier | 77 | (76 | ) | — | 1 | ||||||||||
| Pratt & Whitney | 7 | (7 | ) | — | — | ||||||||||
| Collins Aerospace Systems | 204 | (43 | ) | (74 | ) | 87 | |||||||||
| Eliminations and other | 7 | (7 | ) | — | — | ||||||||||
| Total | $ | 361 | $ | (176 | ) | $ | (94 | ) | $ | 91 | |||||
2016 and Prior Actions. During 2018, we recorded net pre-tax restructuring costs totaling $6 million for restructuring actions initiated in 2016 and prior. As of December 31, 2018, we have approximately $58 million of accrual balances remaining related to 2016 and prior actions.
NOTE 14: FINANCIAL INSTRUMENTS
We enter into derivative instruments primarily for risk management purposes, including derivatives designated as hedging instruments under the Derivatives and Hedging Topic of the FASB ASC and those utilized as economic hedges. We operate internationally and, in the normal course of business, are exposed to fluctuations in interest rates, foreign exchange rates and commodity prices. These fluctuations can increase the costs of financing, investing and operating the business. We have used derivative instruments, including swaps, forward contracts and options, to manage certain foreign currency, interest rate and commodity price exposures.
The four quarter rolling average of the notional amount of foreign exchange contracts hedging foreign currency transactions was $20.1 billion and $19.1 billion at December 31, 2018 and 2017, respectively. Additional information pertaining to foreign exchange and hedging activities is included in Note 1.
78
The following table summarizes the fair value and presentation in the Consolidated Balance Sheets for derivative instruments as of December 31, 2018 and 2017:
| (dollars in millions) | Balance Sheet Location | December 31, 2018 | December 31, 2017 | |||||
| Derivatives designated as hedging instruments: | ||||||||
| Foreign exchange contracts | Asset Derivatives: | |||||||
| Other assets, current | $ | 10 | $ | 77 | ||||
| Other assets | 12 | 101 | ||||||
| Total asset derivatives | $ | 22 | $ | 178 | ||||
| Liability Derivatives: | ||||||||
| Accrued liabilities | (83 | ) | (10 | ) | ||||
| Other long-term liabilities | (111 | ) | (8 | ) | ||||
| Total liability derivatives | $ | (194 | ) | $ | (18 | ) | ||
| Derivatives not designated as hedging instruments: | ||||||||
| Foreign exchange contracts | Asset Derivatives: | |||||||
| Other assets, current | 44 | 70 | ||||||
| Other assets | 19 | 5 | ||||||
| Total asset derivatives | $ | 63 | $ | 75 | ||||
| Liability Derivatives: | ||||||||
| Accrued liabilities | (89 | ) | (57 | ) | ||||
| Other long-term liabilities | (3 | ) | (3 | ) | ||||
| Total liability derivatives | $ | (92 | ) | $ | (60 | ) | ||
The effect of cash flow hedging relationships on accumulated other comprehensive income for the years ended December 31, 2018 and 2017 are presented in the table below. The amounts of gain or (loss) are attributable to foreign exchange contract activity and are recorded as a component of Product sales when reclassified from accumulated other comprehensive income.
| Year Ended December 31, | |||||||
| (dollars in millions) | 2018 | 2017 | |||||
| (Loss) Gain recorded in Accumulated other comprehensive loss | $ | (307 | ) | $ | 347 | ||
| Gain reclassified from Accumulated other comprehensive loss into Product sales | $ | (16 | ) | $ | (39 | ) | |
The table above reflects the effect of cash flow hedging relationships on the Consolidated Statement of Operations for the years ended December 31, 2018 and 2017. The Company utilizes the critical terms match method in assessing derivatives for hedge effectiveness. Accordingly, the hedged items and derivatives designated as hedging instruments are highly effective.
We have approximately €4.95 billion of euro-denominated long-term debt and €750 million of euro-denominated commercial paper borrowings outstanding, which qualify as a net investment hedge against our investments in European businesses. As of December 31, 2018, the net investment hedge is deemed to be effective.
Assuming current market conditions continue, a $48 million pre-tax loss is expected to be reclassified from Accumulated other comprehensive loss into Product sales to reflect the fixed prices obtained from foreign exchange hedging within the next 12 months. At December 31, 2018, all derivative contracts accounted for as cash flow hedges will mature by January 2023.
The effect of derivatives not designated as hedging instruments within Other income, net, on the Consolidated Statement of Operations was as follows:
| Year Ended December 31, | |||||||
| (dollars in millions) | 2018 | 2017 | |||||
| Gain recognized in Other income, net | $ | 115 | $ | 77 | |||
NOTE 15: FAIR VALUE MEASUREMENTS
79
In accordance with the provisions of ASC 820, the following tables provide the valuation hierarchy classification of assets and liabilities that are carried at fair value and measured on a recurring and nonrecurring basis in our Consolidated Balance Sheet as of December 31, 2018 and 2017:
2018 (dollars in millions) | Total | Level 1 | Level 2 | Level 3 | |||||||||||
| Recurring fair value measurements: | |||||||||||||||
| Available-for-sale securities | $ | 51 | $ | 51 | $ | — | $ | — | |||||||
| Derivative assets | 85 | — | 85 | — | |||||||||||
| Derivative liabilities | (286 | ) | — | (286 | ) | — | |||||||||
2017 (dollars in millions) | Total | Level 1 | Level 2 | Level 3 | |||||||||||
| Recurring fair value measurements: | |||||||||||||||
| Available-for-sale securities | $ | 64 | $ | 64 | $ | — | $ | — | |||||||
| Derivative assets | 253 | — | 253 | — | |||||||||||
| Derivative liabilities | (78 | ) | — | (78 | ) | — | |||||||||
Valuation Techniques. Our available-for-sale securities include equity investments that are traded in active markets, either domestically or internationally, and are measured at fair value using closing stock prices from active markets. Our derivative assets and liabilities include foreign exchange contracts that are measured at fair value using internal models based on observable market inputs such as forward rates, interest rates, our own credit risk and our counterparties' credit risks. As of December 31, 2018, there were no significant transfers in or out of Level 1 and Level 2.
As of December 31, 2018, there has not been any significant impact to the fair value of our derivative liabilities due to our own credit risk. Similarly, there has not been any significant adverse impact to our derivative assets based on our evaluation of our counterparties' credit risks.
The following table provides carrying amounts and fair values of financial instruments that are not carried at fair value in our Consolidated Balance Sheet at December 31, 2018 and 2017:
| December 31, 2018 | December 31, 2017 | ||||||||||||||
| (dollars in millions) | Carrying Amount | Fair Value | Carrying Amount | Fair Value | |||||||||||
| Long-term receivables | $ | 334 | $ | 314 | $ | 127 | $ | 121 | |||||||
| Customer financing notes receivable | 272 | 265 | 609 | 596 | |||||||||||
| Short-term borrowings | (1,469 | ) | (1,469 | ) | (392 | ) | (392 | ) | |||||||
| Long-term debt (excluding capitalized leases) | (43,996 | ) | (44,003 | ) | (27,067 | ) | (29,180 | ) | |||||||
| Long-term liabilities | (508 | ) | (467 | ) | (362 | ) | (330 | ) | |||||||
The following table provides the valuation hierarchy classification of assets and liabilities that are not carried at fair value in our Consolidated Balance Sheet as of December 31, 2018 and 2017:
| December 31, 2018 | |||||||||||||||
| (dollars in millions) | Total | Level 1 | Level 2 | Level 3 | |||||||||||
| Long-term receivables | $ | 314 | $ | — | $ | 314 | $ | — | |||||||
| Customer financing notes receivable | 265 | — | 265 | — | |||||||||||
| Short-term borrowings | (1,469 | ) | — | (1,258 | ) | (211 | ) | ||||||||
| Long-term debt (excluding capitalized leases) | (44,003 | ) | — | (43,620 | ) | (383 | ) | ||||||||
| Long-term liabilities | (467 | ) | — | (467 | ) | — | |||||||||
80
| December 31, 2017 | |||||||||||||||
| (dollars in millions) | Total | Level 1 | Level 2 | Level 3 | |||||||||||
| Long-term receivables | $ | 121 | $ | — | $ | 121 | $ | — | |||||||
| Customer financing notes receivable | 596 | — | 596 | — | |||||||||||
| Short-term borrowings | (392 | ) | — | (300 | ) | (92 | ) | ||||||||
| Long-term debt (excluding capitalized leases) | (29,180 | ) | — | (28,970 | ) | (210 | ) | ||||||||
| Long-term liabilities | (330 | ) | — | (330 | ) | — | |||||||||
NOTE 16: VARIABLE INTEREST ENTITIES
Pratt & Whitney holds a net 61% interest in the International Aero Engines AG (IAE) collaboration with MTU Aero Engines AG (MTU) and Japanese Aero Engines Corporation (JAEC) and a 49.5% ownership interest in IAE. IAE's business purpose is to coordinate the design, development, manufacturing and product support of the V2500 engine program through involvement with the collaborators. Additionally, Pratt & Whitney, JAEC and MTU are participants in International Aero Engines, LLC (IAE LLC), whose business purpose is to coordinate the design, development, manufacturing and product support for the PW1100G-JM engine for the Airbus A320neo aircraft and the PW1400G-JM engine for the Irkut MC21 aircraft. Pratt & Whitney holds a 59% net interest and a 59% ownership interest in IAE LLC. IAE and IAE LLC retain limited equity with the primary economics of the programs passed to the participants. As such, we have determined that IAE and IAE LLC are variable interest entities with Pratt & Whitney the primary beneficiary. IAE and IAE LLC have, therefore, been consolidated. The carrying amounts and classification of assets and liabilities for variable interest entities in our Consolidated Balance Sheet as of December 31, 2018 and 2017 are as follows:
| (dollars in millions) | 2018 | 2017 | |||||
| Current assets | $ | 4,732 | $ | 3,976 | |||
| Noncurrent assets | 1,600 | 1,534 | |||||
| Total assets | $ | 6,332 | $ | 5,510 | |||
| Current liabilities | $ | 4,946 | $ | 3,601 | |||
| Noncurrent liabilities | 1,898 | 2,086 | |||||
| Total liabilities | $ | 6,844 | $ | 5,687 | |||
NOTE 17: GUARANTEES
We extend a variety of financial, market value and product performance guarantees to third parties. As of December 31, 2018 and 2017, the following financial guarantees were outstanding:
| December 31, 2018 | December 31, 2017 | ||||||||||||||
| (dollars in millions) | Maximum Potential Payment | Carrying Amount of Liability | Maximum Potential Payment | Carrying Amount of Liability | |||||||||||
| Commercial aerospace financing arrangements (see Note 5) | $ | 348 | $ | 9 | $ | 336 | $ | 8 | |||||||
| Credit facilities and debt obligations (expire 2019 to 2028) | 116 | — | 256 | 15 | |||||||||||
| Performance guarantees | 55 | 5 | 56 | 2 | |||||||||||
We also have obligations arising from sales of certain businesses and assets, including those from representations and warranties and related indemnities for environmental, health and safety, tax and employment matters. The maximum potential payment related to these obligations is not a specified amount as a number of the obligations do not contain financial caps. The carrying amount of liabilities related to these obligations was $175 million and $179 million at December 31, 2018 and December 31, 2017, respectively. For additional information regarding the environmental indemnifications, see Note 18.
We accrue for costs associated with guarantees when it is probable that a liability has been incurred and the amount can be reasonably estimated. The most likely cost to be incurred is accrued based on an evaluation of currently available facts, and where no amount within a range of estimates is more likely, the minimum is accrued. In accordance with the Guarantees Topic of the FASB ASC, we record these liabilities at fair value.
We provide service and warranty policies on our products and extend performance and operating cost guarantees beyond our normal service and warranty policies on some of our products, particularly commercial aircraft engines. In addition, we
81
incur discretionary costs to service our products in connection with specific product performance issues. Liabilities for performance and operating cost guarantees are based upon future product performance and durability, and are largely estimated based upon historical experience. Adjustments are made to accruals as claim data and historical experience warrant. The changes in the carrying amount of service and product warranties and product performance guarantees for the years ended December 31, 2018 and 2017 are as follows:
| (dollars in millions) | 2018 | 2017 | |||||
Balance as of January 11 | $ | 1,146 | $ | 1,199 | |||
| Warranties and performance guarantees issued | 604 | 323 | |||||
| Settlements made | (493 | ) | (207 | ) | |||
Other 2 | 192 | 9 | |||||
| Balance as of December 31 | $ | 1,449 | $ | 1,324 | |||
1 Change in beginning balance due to revenue recognition reclassification of extended warranty to net contract asset/liability.
2 Increase in Other is driven by Rockwell Collins acquisition.
NOTE 18: CONTINGENT LIABILITIES
Except as otherwise noted, while we are unable to predict the final outcome, based on information currently available, we do not believe that resolution of any of the following matters will have a material adverse effect upon our competitive position, results of operations, cash flows or financial condition.
Leases. We occupy space and use certain equipment and assets under lease arrangements. Rental commitments of approximately $2.9 billion at December 31, 2018 under long-term non-cancelable operating leases are payable as follows: $683 million in 2019, $544 million in 2020, $407 million in 2021, $301 million in 2022, $235 million in 2023 and $746 million thereafter. Rent expense was $422 million in 2018, $411 million in 2017 and $386 million in 2016.
Additional information pertaining to commercial aerospace rental commitments is included in Note 5 to the Consolidated Financial Statements.
Environmental. Our operations are subject to environmental regulation by federal, state and local authorities in the United States and regulatory authorities with jurisdiction over our foreign operations. As described in Note 1 to the Consolidated Financial Statements, we have accrued for the costs of environmental remediation activities, including but not limited to investigatory, remediation, operating and maintenance costs and performance guarantees, and periodically reassess these amounts. We believe that the likelihood of incurring losses materially in excess of amounts accrued is remote. As of December 31, 2018 and 2017, we had approximately $830 million reserved for environmental remediation, respectively. Additional information pertaining to environmental matters is included in Note 1 to the Consolidated Financial Statements.
Government. In the ordinary course of business, the Company and its subsidiaries and our properties are subject to regulatory and governmental examinations, information gathering requests, inquiries, investigations and threatened legal actions and proceedings. For example, we are now, and believe that, in light of the current U.S. Government contracting environment, we will continue to be the subject of one or more U.S. Government investigations. Such U.S. Government investigations often take years to complete and could result in administrative, civil or criminal liabilities, including repayments, fines, treble and other damages, forfeitures, restitution or penalties, or could lead to suspension or debarment of U.S. Government contracting privileges. For instance, if we or one of our business units were charged with wrongdoing as a result of any of these investigations or other government investigations (including violations of certain environmental or export laws) the U.S. Government could suspend us from bidding on or receiving awards of new U.S. Government contracts pending the completion of legal proceedings. If convicted or found liable, the U.S. Government could fine and debar us from new U.S. Government contracting for a period generally not to exceed three years. The U.S. Government also reserves the right to debar a contractor from receiving new government contracts for fraudulent, criminal or other seriously improper conduct. The U.S. Government could void any contracts found to be tainted by fraud.
Our contracts with the U.S. Government are also subject to audits. Like many defense contractors, we have received audit reports, which recommend that certain contract prices should be reduced to comply with various government regulations, including because cost or pricing data we submitted in negotiation of the contract prices or cost accounting practices may not have conformed to government regulations, or that certain payments be delayed or withheld. Some of these audit reports involved substantial amounts. We have made voluntary refunds in those cases we believe appropriate, have settled some allegations and, in some cases, continue to negotiate and/or litigate. In addition, we accrue for liabilities associated with those
82
matters that are probable and can be reasonably estimated. The most likely settlement amount to be incurred is accrued based upon a range of estimates. Where no amount within a range of estimates is more likely, then we accrued the minimum amount.
Legal Proceedings.
Cost Accounting Standards Claims
As previously disclosed, in December 2013, a Divisional Administrative Contracting Officer of the United States Defense Contract Management Agency (DCMA) asserted a claim against Pratt & Whitney to recover overpayments of approximately $177 million plus interest (approximately $82.6 million through December 31, 2018). The claim is based on Pratt & Whitney's alleged noncompliance with cost accounting standards from January 1, 2005 to December 31, 2012, due to its method of determining the cost of collaborator parts used in the calculation of material overhead costs for government contracts. On March 18, 2014, Pratt & Whitney filed an appeal to the Armed Services Board of Contract Appeals (ASBCA). We continue to believe that the claim is without merit and the matter is currently scheduled for trial later this year. On December 18, 2018, a Divisional Administrative Contracting Officer of the DCMA issued a second claim against Pratt & Whitney that similarly alleges that its method of determining the cost of collaborator parts does not comply with the cost accounting standards for calendar years 2013 through 2017. This second claim demands payment of $269 million plus interest (approximately $38.9 million), which we also believe is without merit and which Pratt & Whitney appealed to the ASBCA on January 9, 2019.
German Tax Litigation
As previously disclosed, UTC has been involved in administrative review proceedings with the German Tax Office, which concern approximately €215 million (approximately $247 million) of tax benefits that we have claimed related to a 1998 reorganization of the corporate structure of Otis operations in Germany. Upon audit, these tax benefits were disallowed by the German Tax Office. UTC estimates interest associated with the aforementioned tax benefits is an additional approximately €118 million (approximately $135 million). On August 3, 2012, we filed suit in the local German Tax Court (Berlin-Brandenburg). In March 2016, the local German Tax Court dismissed our suit, and we appealed this decision to the German Federal Tax Court (FTC). Following a hearing on July 24, 2018, the FTC remanded the matter to the local German Tax Court for further proceedings. In 2015, UTC made tax and interest payments to German tax authorities of €275 million (approximately $300 million) in order to avoid additional interest accruals pending final resolution of this matter.
Asbestos Matters
As previously disclosed, like many other industrial companies, we and our subsidiaries have been named as defendants in lawsuits alleging personal injury as a result of exposure to asbestos integrated into certain of our products or business premises. While we have never manufactured asbestos and no longer incorporate it in any currently-manufactured products, certain of our historical products, like those of many other manufacturers, have contained components incorporating asbestos. A substantial majority of these asbestos-related claims have been dismissed without payment or were covered in full or in part by insurance or other forms of indemnity. Additional cases were litigated and settled without any insurance reimbursement. The amounts involved in asbestos related claims were not material individually or in the aggregate in any year.
Our estimated total liability to resolve all pending and unasserted potential future asbestos claims through 2059 is approximately $335 million and is principally recorded in Other long-term liabilities on our Consolidated Balance Sheet as of December 31, 2018. This amount is on a pre-tax basis, not discounted, and excludes the Company’s legal fees to defend the asbestos claims (which will continue to be expensed by the Company as they are incurred). In addition, the Company has an insurance recovery receivable for probable asbestos related recoveries of approximately $155 million, which is included primarily in Other assets on our Consolidated Balance Sheet as of December 31, 2018.
The amounts recorded by UTC for asbestos-related liabilities and insurance recoveries are based on currently available information and assumptions that we believe are reasonable. Our actual liabilities or insurance recoveries could be higher or lower than those recorded if actual results vary significantly from the assumptions. Key variables in these assumptions include the number and type of new claims to be filed each year, the outcomes or resolution of such claims, the average cost of resolution of each new claim, the amount of insurance available, allocation methodologies, the contractual terms with each insurer with whom we have reached settlements, the resolution of coverage issues with other excess insurance carriers with whom we have not yet achieved settlements, and the solvency risk with respect to our insurance carriers. Other factors that may affect our future liability include uncertainties surrounding the litigation process from jurisdiction to jurisdiction and from case to case, legal rulings that may be made by state and federal courts, and the passage of state or federal legislation. At the end of each year, the Company will evaluate all of these factors and, with input from an outside actuarial expert, make any necessary adjustments to both our estimated asbestos liabilities and insurance recoveries.
83
Other.
As described in Note 17 to the Consolidated Financial Statements, we extend performance and operating cost guarantees beyond our normal warranty and service policies for extended periods on some of our products. We have accrued our estimate of the liability that may result under these guarantees and for service costs that are probable and can be reasonably estimated.
We also have other commitments and contingent liabilities related to legal proceedings, self-insurance programs and matters arising out of the normal course of business. We accrue contingencies based upon a range of possible outcomes. If no amount within this range is a better estimate than any other, then we accrue the minimum amount. Of note, the design, development, production and support of new aerospace technologies is inherently complex and subject to risk. Since the PurePower PW1000G Geared TurboFan engine entered into service in 2016, technical issues have been identified and experienced with the engine, which is usual for new engines and new aerospace technologies. Pratt & Whitney has addressed these issues through various improvements and modifications. These issues have resulted in financial impacts, including increased warranty provisions, customer contract settlements, and reductions in contract performance estimates. Additional technical issues have been identified, for which a reasonable estimate of the impact cannot currently be made, and such issues may also arise in the normal course, which may result in financial impacts that could be material to the Company’s financial position, results of operations and cash flows.
In the ordinary course of business, the Company and its subsidiaries are also routinely defendants in, parties to or otherwise subject to many pending and threatened legal actions, claims, disputes and proceedings. These matters are often based on alleged violations of contract, product liability, warranty, regulatory, environmental, health and safety, employment, intellectual property, tax and other laws. In some of these proceedings, claims for substantial monetary damages are asserted against the Company and its subsidiaries and could result in fines, penalties, compensatory or treble damages or non-monetary relief. We do not believe that these matters will have a material adverse effect upon our competitive position, results of operations, cash flows or financial condition.
NOTE 19: SEGMENT FINANCIAL DATA
Our operations for the periods presented herein are classified into four principal segments. The segments are generally determined based on the management structure of the businesses and the grouping of similar operating companies, where each management organization has general operating autonomy over diversified products and services.
Otis products include elevators, escalators, moving walkways and service sold to customers in the commercial, residential and infrastructure property sectors around the world.
Carrier products and related services include HVAC and refrigeration systems, building controls and automation, fire and special hazard suppression systems and equipment, security monitoring and rapid response systems, provided to a diversified international customer base principally in the industrial, commercial and residential property and commercial transportation sectors.
Pratt & Whitney products include commercial, military, business jet and general aviation aircraft engines, parts and services sold to a diversified customer base, including international and domestic commercial airlines and aircraft leasing companies, aircraft manufacturers, and U.S. and foreign governments. Pratt & Whitney also provides product support and a full range of overhaul, repair and fleet management services.
Collins Aerospace Systems provides technologically advanced aerospace products and aftermarket service solutions for aircraft manufacturers, airlines, regional, business and general aviation markets, military, space and undersea operations. Products include electric power generation, power management and distribution systems, air data and aircraft sensing systems, engine control systems, intelligence, surveillance and reconnaissance systems, engine components, environmental control systems, fire and ice detection and protection systems, propeller systems, engine nacelle systems, including thrust reversers and mounting pylons, interior and exterior aircraft lighting, aircraft seating and cargo systems, actuation systems, landing systems, including landing gear, wheels and brakes, and space products and subsystems, integrated avionics systems, precision targeting, electronic warfare and range and training systems, flight controls, communications systems, navigation systems, oxygen systems, simulation and training systems, food and beverage preparation, storage and galley systems, lavatory and wastewater management systems. Aftermarket services include spare parts, overhaul and repair, engineering and technical support, training and fleet management solutions, and information management services.
We have reported our financial and operational results for the periods presented herein under the four principal segments noted above, consistent with how we have reviewed our business operations for decision-making purposes, resource allocation and performance assessment during 2018.
84
Segment Information. Total sales by segment include intersegment sales, which are generally made at prices approximating those that the selling entity is able to obtain on external sales. Segment information for the years ended December 31 is as follows:
| Net Sales | Operating Profits | |||||||||||||||||||||||
| (dollars in millions) | 2018 | 2017 | 2016 | 2018 | 2017 | 2016 | ||||||||||||||||||
| Otis | $ | 12,904 | $ | 12,341 | $ | 11,893 | $ | 1,915 | $ | 2,002 | $ | 2,125 | ||||||||||||
| Carrier | 18,922 | 17,812 | 16,851 | 3,777 | 3,165 | 2,848 | ||||||||||||||||||
| Pratt & Whitney | 19,397 | 16,160 | 14,894 | 1,269 | 1,300 | 1,501 | ||||||||||||||||||
| Collins Aerospace Systems | 16,634 | 14,691 | 14,465 | 2,303 | 2,191 | 2,167 | ||||||||||||||||||
| Total segment | 67,857 | 61,004 | 58,103 | 9,264 | 8,658 | 8,641 | ||||||||||||||||||
| Eliminations and other | (1,356 | ) | (1,167 | ) | (859 | ) | (236 | ) | (81 | ) | (18 | ) | ||||||||||||
| General corporate expenses | — | — | — | (475 | ) | (439 | ) | (402 | ) | |||||||||||||||
| Consolidated | $ | 66,501 | $ | 59,837 | $ | 57,244 | $ | 8,553 | $ | 8,138 | $ | 8,221 | ||||||||||||
| Total Assets | Capital Expenditures | Depreciation & Amortization | ||||||||||||||||||||||||||||||||||
| (dollars in millions) | 2018 | 2017 | 2016 | 2018 | 2017 | 2016 | 2018 | 2017 | 2016 | |||||||||||||||||||||||||||
| Otis | $ | 9,374 | $ | 9,421 | $ | 8,867 | $ | 172 | $ | 133 | $ | 94 | $ | 190 | $ | 177 | $ | 171 | ||||||||||||||||||
| Carrier | 22,189 | 22,657 | 21,787 | 263 | 326 | 340 | 357 | 372 | 354 | |||||||||||||||||||||||||||
| Pratt & Whitney | 29,341 | 26,768 | 22,971 | 866 | 923 | 725 | 852 | 672 | 550 | |||||||||||||||||||||||||||
| Collins Aerospace Systems | 73,115 | 34,567 | 34,093 | 515 | 527 | 452 | 883 | 823 | 807 | |||||||||||||||||||||||||||
| Total segment | 134,019 | 93,413 | 87,718 | 1,816 | 1,909 | 1,611 | 2,282 | 2,044 | 1,882 | |||||||||||||||||||||||||||
| Eliminations and other | 192 | 3,507 | 1,988 | 86 | 105 | 88 | 151 | 96 | 80 | |||||||||||||||||||||||||||
| Consolidated | $ | 134,211 | $ | 96,920 | $ | 89,706 | $ | 1,902 | $ | 2,014 | $ | 1,699 | $ | 2,433 | $ | 2,140 | $ | 1,962 | ||||||||||||||||||
Geographic External Sales and Operating Profit. Geographic external sales and operating profits are attributed to the geographic regions based on their location of origin. U.S. external sales include export sales to commercial customers outside the U.S. and sales to the U.S. Government, commercial and affiliated customers, which are known to be for resale to customers outside the U.S. Long-lived assets are net fixed assets attributed to the specific geographic regions.
| External Net Sales | Operating Profits | Long-Lived Assets | ||||||||||||||||||||||||||||||||||
| (dollars in millions) | 2018 | 2017 | 2016 | 2018 | 2017 | 2016 | 2018 | 2017 | 2016 | |||||||||||||||||||||||||||
| United States Operations | $ | 39,481 | $ | 33,912 | $ | 32,335 | $ | 4,941 | $ | 4,126 | $ | 4,304 | $ | 7,111 | $ | 5,323 | $ | 4,822 | ||||||||||||||||||
| International Operations | ||||||||||||||||||||||||||||||||||||
| Europe | 12,857 | 11,879 | 11,151 | 2,141 | 1,959 | 1,826 | 1,908 | 1,817 | 1,538 | |||||||||||||||||||||||||||
| Asia Pacific | 8,847 | 8,770 | 8,260 | 1,476 | 1,491 | 1,486 | 1,349 | 1,113 | 999 | |||||||||||||||||||||||||||
| Other | 6,672 | 6,443 | 6,357 | 706 | 1,082 | 1,025 | 1,363 | 1,389 | 1,325 | |||||||||||||||||||||||||||
| Eliminations and other | (1,356 | ) | (1,167 | ) | (859 | ) | (711 | ) | (520 | ) | (420 | ) | 566 | 544 | 474 | |||||||||||||||||||||
| Consolidated | $ | 66,501 | $ | 59,837 | $ | 57,244 | $ | 8,553 | $ | 8,138 | $ | 8,221 | $ | 12,297 | $ | 10,186 | $ | 9,158 | ||||||||||||||||||
Sales from U.S. operations include export sales as follows:
| (dollars in millions) | 2018 | 2017 | 2016 | |||||||||
| Europe | $ | 6,285 | $ | 5,273 | $ | 5,065 | ||||||
| Asia Pacific | 5,429 | 3,634 | 3,449 | |||||||||
| Other | 2,514 | 2,217 | 2,313 | |||||||||
| $ | 14,228 | $ | 11,124 | $ | 10,827 | |||||||
85
Sales by primary geographical market for the year ended December 31, 2018 is as follows:
| (dollars in millions) | Otis | Carrier | Pratt & Whitney | Collins Aerospace Systems | Total | ||||||||||||||
| Primary Geographical Markets | |||||||||||||||||||
| United States | $ | 3,433 | $ | 9,402 | $ | 14,852 | $ | 11,794 | $ | 39,481 | |||||||||
| Europe | 4,055 | 5,710 | 594 | 2,498 | 12,857 | ||||||||||||||
| Asia Pacific | 4,354 | 2,849 | 1,277 | 367 | 8,847 | ||||||||||||||
| Other | 1,062 | 961 | 2,674 | 1,975 | 6,672 | ||||||||||||||
| Total segment | $ | 12,904 | $ | 18,922 | $ | 19,397 | $ | 16,634 | 67,857 | ||||||||||
| Eliminations and other | (1,356 | ) | |||||||||||||||||
| Consolidated | $ | 66,501 | |||||||||||||||||
Segment sales disaggregated by product type and product versus service for the year ended December 31, 2018 are as follows:
| (dollars in millions) | Otis | Carrier | Pratt & Whitney | Collins Aerospace Systems | Total | ||||||||||||||
| Product Type | |||||||||||||||||||
| Commercial and industrial, non aerospace | $ | 12,904 | $ | 18,922 | $ | 55 | $ | 60 | $ | 31,941 | |||||||||
| Commercial aerospace | — | — | 14,027 | 12,564 | 26,591 | ||||||||||||||
| Military aerospace | — | — | 5,315 | 4,010 | 9,325 | ||||||||||||||
| Total segment | $ | 12,904 | $ | 18,922 | $ | 19,397 | $ | 16,634 | 67,857 | ||||||||||
| Eliminations and other | (1,356 | ) | |||||||||||||||||
| Consolidated | $ | 66,501 | |||||||||||||||||
| Sales Type | |||||||||||||||||||
| Product | $ | 5,636 | $ | 15,682 | $ | 11,410 | $ | 13,915 | $ | 46,643 | |||||||||
| Service | 7,268 | 3,240 | 7,987 | 2,719 | 21,214 | ||||||||||||||
| Total segment | $ | 12,904 | $ | 18,922 | $ | 19,397 | $ | 16,634 | 67,857 | ||||||||||
| Eliminations and other | (1,356 | ) | |||||||||||||||||
| Consolidated | $ | 66,501 | |||||||||||||||||
Major Customers. Net Sales include sales under prime contracts and subcontracts to the U.S. Government, primarily related to Pratt & Whitney and Collins Aerospace Systems products, as follows:
| (dollars in millions) | 2018 | 2017 | 2016 | |||||||||
| Pratt & Whitney | $ | 4,489 | $ | 3,347 | $ | 3,187 | ||||||
| Collins Aerospace Systems | 2,779 | 2,299 | 2,301 | |||||||||
| Other | 175 | 152 | 138 | |||||||||
| $ | 7,443 | $ | 5,798 | $ | 5,626 | |||||||
Net sales to Airbus, primarily related to Pratt & Whitney and Collins Aerospace Systems products, were approximately $10,025 million, $8,908 million and $7,688 million for the years ended December 31, 2018, 2017 and 2016, respectively.
86
SELECTED QUARTERLY FINANCIAL DATA (UNAUDITED)
| 2018 Quarters | 2017 Quarters | |||||||||||||||||||||||||||||||
(dollars in millions, except per share amounts) | First | Second | Third | Fourth | First | Second | Third | Fourth | ||||||||||||||||||||||||
| Net Sales | $ | 15,242 | $ | 16,705 | $ | 16,510 | $ | 18,044 | $ | 13,815 | $ | 15,280 | $ | 15,062 | $ | 15,680 | ||||||||||||||||
| Gross margin | 3,962 | 4,283 | 3,974 | 4,297 | 3,679 | 4,116 | 3,956 | 3,885 | ||||||||||||||||||||||||
| Net income attributable to common shareowners | 1,297 | 2,048 | 1,238 | 686 | 1,386 | 1,439 | 1,330 | 397 | ||||||||||||||||||||||||
| Earnings per share of Common Stock: | ||||||||||||||||||||||||||||||||
| Basic - net income | $ | 1.64 | $ | 2.59 | $ | 1.56 | $ | 0.83 | $ | 1.75 | $ | 1.83 | $ | 1.69 | $ | 0.50 | ||||||||||||||||
| Diluted - net income | $ | 1.62 | $ | 2.56 | $ | 1.54 | $ | 0.83 | $ | 1.73 | $ | 1.80 | $ | 1.67 | $ | 0.50 | ||||||||||||||||
PERFORMANCE GRAPH (UNAUDITED)
The following graph presents the cumulative total shareholder return for the five years ending December 31, 2018 for our common stock, as compared to the Standard & Poor's 500 Stock Index and to the Dow Jones 30 Industrial Average. Our common stock price is a component of both indices. These figures assume that all dividends paid over the five-year period were reinvested, and that the starting value of each index and the investment in common stock was $100.00 on December 31, 2013.
COMPARISON OF CUMULATIVE FIVE YEAR TOTAL RETURN
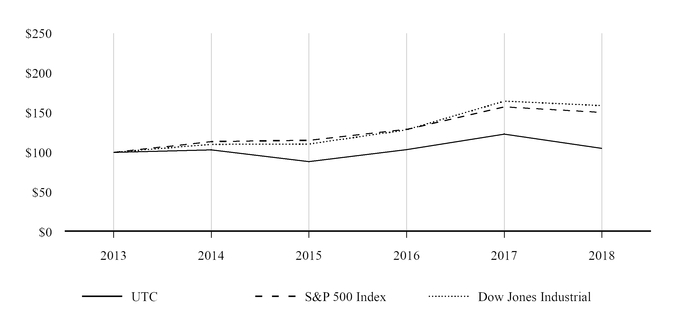
87