Exhibit 13
| (in millions, except per share amounts) | 2009 | 2008 | 2007 | 2006 | 2005 | |||||||||||||||
For the year | ||||||||||||||||||||
Revenues1 | $ | 52,920 | $ | 59,757 | $ | 55,716 | $ | 48,651 | $ | 43,414 | ||||||||||
Research and development | 1,558 | 1,771 | 1,678 | 1,529 | 1,367 | |||||||||||||||
Restructuring and other costs | 830 | 357 | 166 | 288 | 267 | |||||||||||||||
Net income2 | 4,179 | 5,053 | 4,548 | 3,998 | 3,336 | |||||||||||||||
Income attributable to common shareowners before cumulative effect of a change in accounting principle3 | 3,829 | 4,689 | 4,224 | 3,732 | 3,164 | |||||||||||||||
Net income attributable to common shareowners 2 | 3,829 | 4,689 | 4,224 | 3,732 | 3,069 | |||||||||||||||
Earnings per share: | ||||||||||||||||||||
Basic: | ||||||||||||||||||||
Income attributable to common shareowners before cumulative effect of a change in accounting principle3 | 4.17 | 5.00 | 4.38 | 3.81 | 3.19 | |||||||||||||||
Cumulative effect of a change in accounting principle3 | — | — | — | — | (.09 | ) | ||||||||||||||
Net income attributable to common shareowners | 4.17 | 5.00 | 4.38 | 3.81 | 3.10 | |||||||||||||||
Diluted: | ||||||||||||||||||||
Income attributable to common shareowners before cumulative effect of a change in accounting principle3 | 4.12 | 4.90 | 4.27 | 3.71 | 3.12 | |||||||||||||||
Cumulative effect of a change in accounting principle3 | — | — | — | — | (.09 | ) | ||||||||||||||
Net income attributable to common shareowners | 4.12 | 4.90 | 4.27 | 3.71 | 3.03 | |||||||||||||||
Cash dividends per common share | 1.54 | 1.35 | 1.17 | 1.02 | .88 | |||||||||||||||
Average number of shares of Common Stock outstanding: | ||||||||||||||||||||
Basic | 917 | 938 | 964 | 980 | 991 | |||||||||||||||
Diluted | 929 | 956 | 989 | 1,006 | 1,014 | |||||||||||||||
Cash flow from operations | 5,353 | 6,161 | 5,330 | 4,803 | 4,334 | |||||||||||||||
Capital expenditures | 826 | 1,216 | 1,153 | 954 | 929 | |||||||||||||||
Acquisitions, including debt assumed | 703 | 1,448 | 2,336 | 1,049 | 4,583 | |||||||||||||||
Repurchase of Common Stock | 1,100 | 3,160 | 2,001 | 2,068 | 1,181 | |||||||||||||||
Dividends paid on Common Stock4 | 1,356 | 1,210 | 1,080 | 951 | 832 | |||||||||||||||
At year end | ||||||||||||||||||||
Working capital | $ | 5,281 | $ | 4,665 | $ | 4,602 | $ | 3,636 | $ | 1,861 | ||||||||||
Total assets1,5 | 55,762 | 56,837 | 54,888 | 47,382 | 46,159 | |||||||||||||||
Long-term debt, including current portion6 | 9,490 | 10,453 | 8,063 | 7,074 | 6,628 | |||||||||||||||
Total debt6 | 9,744 | 11,476 | 9,148 | 7,931 | 8,240 | |||||||||||||||
Debt to total capitalization2,5,6 | 32% | 41% | 29% | 30% | 32% | |||||||||||||||
Total equity2,5,6 | 20,999 | 16,681 | 22,064 | 18,133 | 17,769 | |||||||||||||||
Number of employees | 206,700 | 223,100 | 225,600 | 214,500 | 218,200 | |||||||||||||||
| • | During 2005, we acquired Kidde, which in conjunction with Chubb (acquired during 2003) forms the UTC Fire & Security segment. |
| • | During 2005, a 2-for-1 split of our common stock was effected in the form of a share dividend. |
| Note 1 | During 2009, we adopted the provisions of the Collaborative Arrangements Topic of the Financial Accounting Standards Board Accounting Standards Codification (FASB ASC) which requires that participants in a collaborative arrangement report costs incurred and revenues generated from such transactions on a gross basis and in the appropriate lines in each company’s financial statements. The provisions of this Topic were applied retrospectively to all periods presented. |
| Note 2 | During 2009, we adopted the provisions under the Consolidation Topic of the FASB ASC as it relates to the accounting and reporting standards for noncontrolling interests (previously referred to as minority interests) in consolidated subsidiaries as reported in consolidated financial statements. These provisions require that the carrying value of noncontrolling interests be removed from the mezzanine section of the balance sheet and reclassified as equity, and that consolidated net income be recast to include net income attributable to the noncontrolling interests. The provisions of this Topic were applied retrospectively to all periods presented. |
| Note 3 | During 2005, we adopted accounting standards related to Asset Retirement and Environmental Obligations and the accounting for Share-Based Payments. |
| Note 4 | Excludes dividends paid on Employee Stock Ownership Plan Common Stock. |
| Note 5 | During 2006, we adopted the accounting related to Employers’ Accounting for Defined Benefit Pension and Other Postretirement Plans which resulted in an approximately $1.8 billion non-cash charge to equity and a $2.4 billion non-cash reduction to total assets. In addition, we early-adopted the measurement date provisions of this standard effective January 1, 2007, which increased shareowners’ equity by approximately $425 million and decreased long-term liabilities by approximately $620 million. |
| Note 6 | The increase in the 2008 debt to total capitalization ratio reflects unrealized losses of approximately $4.2 billion, net of taxes, associated with the effect of market conditions on our pension plans, and the 2008 debt issuances totaling $2.25 billion. The decrease in the 2009 debt to total capitalization ratio, as compared to 2008, reflects the reversal of unrealized losses in our pension plans of approximately $1.1 billion, the beneficial impact of foreign exchange rate movement of approximately $1.0 billion, and the reduction of approximately $1.7 billion of total debt. |
1
Management’s Discussion and Analysis
Management’s Discussion and Analysis of Financial Condition and Results of Operations
Business Overview
We are a global provider of high technology products and services to the building systems and aerospace industries. Our operations are classified into six principal business segments: Otis, Carrier, UTC Fire & Security, Pratt & Whitney, Hamilton Sundstrand and Sikorsky. Otis, Carrier and UTC Fire & Security are collectively referred to as the “commercial businesses,” while Pratt & Whitney, Hamilton Sundstrand and Sikorsky are collectively referred to as the “aerospace businesses.” Certain reclassifications have been made to the prior year amounts to conform to the current year presentation of noncontrolling interests and collaborative arrangements as required by the Consolidation and Collaborative Arrangements Topics, respectively, of the Financial Accounting Standards Board Accounting Standards Codification (FASB ASC). See discussion in Notes 9 and 15, respectively, to the Consolidated Financial Statements. The commercial businesses generally serve customers in the worldwide commercial and residential property industries, although Carrier also serves customers in the commercial and transport refrigeration industries. The aerospace businesses serve commercial and government aerospace customers in both the original equipment and aftermarket parts and services markets. In addition, a portion of these businesses serve customers in certain industrial markets. Our consolidated revenues were derived from the commercial and aerospace businesses as follows (revenues from Hamilton Sundstrand’s and Pratt & Whitney’s industrial markets are included in “commercial and industrial”):
| 2009 | 2008 | 2007 | ||||||
Commercial and industrial | 58% | 61% | 62% | |||||
Military aerospace and space | 21% | 17% | 16% | |||||
Commercial aerospace | 21% | 22% | 22% | |||||
| 100% | 100% | 100% | ||||||
In 2009, approximately 58% of our consolidated sales were original equipment and 42% were aftermarket parts and services, while in 2008 the amounts were 60% and 40%, respectively. The amounts in 2007 were 59% and 41%, respectively. The overall shift in composition noted in the table above largely reflects the decline in commercial revenues resulting from the adverse economic environment and foreign currency translation impact, accompanied by significant growth in military helicopter deliveries as discussed more fully below.
As worldwide businesses, our operations can be affected by industrial, economic and political factors on both a regional and global level. To limit the impact of any one industry or the economy of any single country on our consolidated operating
results, our strategy has been, and continues to be, the maintenance of a balanced and diversified portfolio of businesses. Our businesses include both commercial and aerospace operations, original equipment manufacturing (OEM) businesses with extensive related aftermarket parts and services businesses as noted above, as well as the combination of shorter cycles in our commercial businesses, particularly Carrier, and longer cycles in our aerospace businesses. Our customers include companies in the private sector and governments, and our businesses reflect extensive geographic diversification that has evolved with the continued globalization of world economies. The composition of total revenues from outside the United States, including U.S. export sales, in dollars and as a percentage of total segment revenues, has been as follows:
| (in millions of dollars) | 2009 | 2008 | 2007 | 2009 | 2008 | 2007 | ||||||||||||||
Europe | $ | 12,269 | $ | 15,180 | $ | 13,917 | 23% | 25% | 25% | |||||||||||
Asia Pacific | 7,138 | 8,212 | 7,991 | 13% | 14% | 14% | ||||||||||||||
Other Non-U.S. | 5,040 | 6,619 | 5,783 | 10% | 11% | 10% | ||||||||||||||
U.S. Exports | 6,996 | 7,262 | 6,492 | 13% | 12% | 12% | ||||||||||||||
International segment revenues | $ | 31,443 | $ | 37,273 | $ | 34,183 | 59% | 62% | 61% | |||||||||||
As part of our growth strategy, we invest in businesses in certain countries that carry high levels of currency, political and/or economic risk, such as Argentina, Brazil, China, India, Russia, South Africa and countries in the Middle East. At December 31, 2009, our investment in any one of these countries did not exceed 5% of consolidated shareowners’ equity.
The global economic turmoil that began in 2008 continued throughout 2009 with U.S. unemployment near record highs, severely diminished liquidity and credit availability, and global gross domestic product (GDP) contraction. Most airlines incurred significant losses as both revenue passenger miles (RPM) and average ticket prices declined, while weaker corporate profits contributed to a substantial decline in business jet production. The overall recessionary conditions had a significant adverse impact on the domestic and many international housing markets as well as the worldwide commercial construction markets. As a result of these poor market conditions, 2009 total revenues declined 11%, when compared with 2008, including a 7% organic revenue decline. The decline in organic revenues reflects lower volumes across all business units with the exception of Sikorsky, which continued to experience the benefits of strong government spending and helicopter demand.
In recognition of global economic challenges and expected volume declines, we announced a significant restructuring initiative in early 2009 designed to reduce structural and overhead costs across all of our businesses in order to partially mitigate the adverse volume impact, in addition to better positioning us for a
2
resumption of earnings growth expected in 2010. Restructuring charges in 2009 totaled $830 million and included costs related to headcount reductions of approximately 14,600 employees. Segment operating margin declined 30 basis points year-over-year, from 13.4% in 2008 to 13.1% in 2009. This year-over-year decrease includes the net adverse impact of approximately 80 basis points of restructuring charges and one-time items. Excluding the significant restructuring charges and one-time items, segment operating margin reflects the benefits from an intensive focus on cost reduction and savings realized from actions taken in 2009.
Although there were signs that the challenging and difficult end market environments in which our businesses operated over the past year were beginning to stabilize in the second half of 2009, there is still considerable uncertainty as to the shape and length of any economic recovery. Emerging markets have started to show some indications of recovery, particularly China, India and Brazil, although this recovery reflects, in part, the effects of significant government intervention and stimulus initiatives in those markets. In the U.S., both the financial and housing markets have shown recent signs of stability, but unemployment remains high with both consumer spending and confidence remaining weak. The general lack of global credit, stemming in part from the regulatory pressure on financial institutions to solidify their internal financial positions, is continuing to have an adverse impact on the commercial construction markets with growth in China and the emerging markets partially offsetting the declines in the U.S. and Europe.
Consistent with prior years, our backlog includes both short cycle orders that are expected to be realized in the near term, as well as longer cycle orders that are expected to be recognized over a period of years. With the good conversion of backlog into revenues in 2009, and the amortization profile of the long cycle backlog, we are expecting only flat to slight organic revenue growth in 2010 as compared with 2009. Further, any growth would likely be weighted towards the second half of 2010 and would be dependent upon further recovery in order rates. However, as noted previously, earnings growth is expected to resume in 2010 due to both lower restructuring costs and the savings generated from the restructuring actions we undertook in 2009, and our continued focus on cost containment and operational efficiencies.
As discussed below in “Results of Operations,” operating profit in both 2009 and 2008 benefited from gains related to several business divestiture activities and from certain pretax interest adjustments. Our earnings growth strategy contemplates earnings from organic revenue growth, including growth from new product development and product improvements, and incremental earnings from our investments in acquisitions. We
invested $703 million and $1.4 billion (including debt assumed of $0 and $196 million, respectively) in the acquisition of businesses across the entire Company in 2009 and 2008, respectively. Acquisitions in both 2009 and 2008 consisted principally of a number of small acquisitions in both our aerospace and commercial businesses.
In November 2009, we entered into an agreement with General Electric Company (GE) to purchase the GE Security business for approximately $1.8 billion. Subject to regulatory approvals and the satisfaction of customary closing conditions, the closing is anticipated to take place early in the second quarter of 2010. GE Security, part of GE Technology Infrastructure, supplies security and fire safety technologies for commercial and residential applications through a broad product portfolio that includes fire detection and life safety systems, intrusion alarms, video surveillance and access control systems. We intend to incorporate the GE Security business within the existing UTC Fire & Security segment, which will significantly enhance UTC Fire & Security’s geographic diversity with GE Security’s strong North American presence and increased product and technology offerings.
As a result of the January 1, 2009 adoption of the provisions of the Business Combination Topic of the FASB ASC, both acquisition and restructuring costs associated with a business combination are now expensed subsequent to the acquisition date. Depending upon the nature and level of acquisition activity in 2010, earnings could be adversely impacted due to acquisition and restructuring actions initiated in connection with the integration of the acquisitions.
In December 2009, we agreed to acquire a 49.5% equity stake in Clipper Windpower Plc (Clipper), a California-based wind turbine manufacturer that trades on the AIM London Stock Exchange. This investment is intended to expand our power generation portfolio and allow us to enter the wind power segment by leveraging our expertise in blade technology, turbines and gearbox design. The total cost was £166 million (approximately $270 million) for the purchase of 84.3 million newly issued shares and 21.8 million shares from existing shareowners. We completed the acquisition of this investment on January 12, 2010 and will account for it under the equity method of accounting. Pursuant to our agreement with Clipper, we are prohibited from acquiring additional shares of Clipper within two years of the closing date that would result in an equity stake in excess of 49.9% without prior approval of Clipper.
For additional discussion of acquisitions and restructuring, see “Liquidity and Financial Condition,” “Restructuring and Other Costs” and Notes 2 and 12 to the Consolidated Financial Statements.
3
Results of Operations
Revenues
| (in millions of dollars) | 2009 | 2008 | 2007 | ||||||||
Sales | $ | 52,425 | $ | 59,119 | $ | 54,876 | |||||
Other income, net | 495 | 638 | 840 | ||||||||
Total revenues | $ | 52,920 | $ | 59,757 | $ | 55,716 | |||||
The 11% decline in consolidated revenues in 2009, as compared with 2008, reflects organic revenue contraction (7%), the adverse impact from foreign currency translation (3%) and the impact of net divestitures (1%) resulting from the portfolio rationalization efforts undertaken, principally at Carrier. As discussed in “Business Overview,” the organic decline in revenue reflects volume decreases at most of our businesses resulting from the challenging global economic conditions experienced during 2009. The depressed residential housing and commercial construction markets drove volume declines across all of our commercial businesses, while declines in aerospace aftermarket revenues at both Pratt & Whitney and Hamilton Sundstrand, coupled with the adverse impact from a depressed business jet market, led to an overall decline in aerospace revenues. Record aircraft deliveries at Sikorsky helped to partially mitigate the effect of other aerospace volume losses.
The consolidated revenue increase of $4.0 billion or 7% in 2008 reflected organic revenue growth (5%), growth from net acquisitions (1%), and the favorable impact of foreign currency translation (1%) resulting from the weakness of the U.S. dollar relative to other currencies, particularly the Euro, experienced for most of 2008. All segments, except for Carrier, experienced organic revenue growth in 2008. Organic growth was led by the aerospace businesses which benefited from the general strength of the commercial aerospace OEM, regional and business jet markets, and demand for military helicopters. Commercial aerospace aftermarket growth rates moderated due to declines in large commercial spares orders resulting from the airlines’ consolidation and continued reductions of capacity in response to market conditions. Commercial aerospace OEM growth reflected strong production levels at the airframe manufacturers, while military OEM revenue growth was driven largely by government demand for military helicopters. In the commercial businesses, revenue growth at Otis reflected increases in Europe and North America, led by new equipment sales generated from the strong backlog entering 2008. At Carrier, significantly lower unit shipments of U.S. residential product due to the continued weakness in the North American residential market, and lower customer demand for commercial refrigeration products as a result of weak economic conditions contributed to a decline in organic revenues. UTC Fire & Security revenues increased largely on the strength of fire safety sales in the oil & gas and marine industries as well as growth in Asia.
The decrease in other income in 2009, as compared with 2008, largely reflects the absence of gains from the sale of marketable securities, lower royalty and interest income across the businesses, lower net year-over-year gains on various fixed asset disposals, lower joint venture equity income at Carrier, and lower net year-over-year gains generated from business divestiture activity. These decreases were partially offset by lower net hedging costs on our cash management activities in 2009. Other income in 2009 includes an approximately $60 million gain at Carrier resulting from the contribution of a majority of its U.S. residential sales and distribution businesses into the new venture with Watsco, as well as a $52 million gain recognized at Otis on the re-measurement to fair value of an interest in a joint venture, and $17 million of favorable pretax interest income adjustments pertaining to global tax examination activity related primarily to the completion of our review of the 2004 to 2005 Internal Revenue Service (IRS) audit report.
The decrease in other income in 2008, as compared with 2007, was largely related to the absence of certain gains reflected in 2007. Other income in 2008 included gains generated during 2008 from business divestiture activity, including a $67 million gain at Carrier from the contribution of a business into a new venture operating in the Middle East and the Commonwealth of Independent States, an approximately $37 million non-cash gain recognized on the sale of a partial investment at Pratt & Whitney and a gain of approximately $25 million related to a disposal of a business at Hamilton Sundstrand. Also, other income in 2008 reflected a $38 million gain from the sale of marketable securities and an approximately $12 million favorable pre-tax interest adjustment related to the settlement of disputed adjustments from the 2000 through 2003 examination with the Appeals Division of the Internal Revenue Service (IRS). These gains were partially offset by the adverse impact of increased hedging costs on our cash management activities of approximately $80 million. The balance of other income was comprised of interest and joint venture income, royalties, and other miscellaneous operating activities. Other income for 2007 included approximately $150 million in gains resulting from the sale of marketable securities, an approximately $80 million gain recognized on the sale of land by Otis, gains of approximately $83 million on the disposal of certain non-core businesses, and approximately $28 million in pre-tax interest income relating to a re-evaluation of our tax liabilities and contingencies based on global tax examination activity during 2007, including completion of our review of the 2000 through 2003 IRS audit report and our related protest filing.
Gross Margin
| (in millions of dollars) | 2009 | 2008 | 2007 | ||||||||
Gross margin | $ | 13,564 | $ | 15,482 | $ | 13,997 | |||||
Percentage of sales | 25.9% | 26.2% | 25.5% | ||||||||
4
The 2009 year-over-year decrease in gross margin (product and service sales less the cost of product and services sold) as a percentage of sales of 30 basis points primarily reflects higher year-over-year restructuring charges (50 basis points). Continued focus on cost reduction, savings from previously initiated restructuring actions, net operational efficiencies, margin growth experienced at Otis from lower commodity prices and the continued shift toward higher margin contractual maintenance sales offset the adverse impacts of lower sales volumes, particularly in our higher margin aerospace aftermarket and transport refrigeration businesses.
The improvement in gross margin as a percentage of sales of 70 basis points in 2008 was due largely to the benefit from higher volumes, savings from previously initiated restructuring actions and net operational efficiencies (approximately 60 basis points combined). The absence of the 2007 EU Fine, net of reserves (approximately 40 basis points) was partially offset by the adverse impact of higher commodity costs, net of pricing (approximately 20 basis points) and increased restructuring costs (approximately 10 basis points) contributing to the remainder of the year-over-year change.
Research and Development
| (in millions of dollars) | 2009 | 2008 | 2007 | ||||||||
Company-funded | $ | 1,558 | $ | 1,771 | $ | 1,678 | |||||
Percentage of sales | 3.0% | 3.0% | 3.1% | ||||||||
Customer-funded | $ | 2,095 | $ | 2,008 | $ | 1,872 | |||||
Percentage of sales | 4.0% | 3.4% | 3.4% | ||||||||
The decrease in company-funded research and development in 2009, compared with 2008, principally reflects lower expenditures at Pratt & Whitney and Hamilton Sundstrand resulting from shifts in the timing of program development activities, lower requirements on key development programs, and the continued focus on cost reduction. The decrease at Pratt & Whitney was driven largely by the timing of program development activities, while the decrease at Hamilton Sundstrand primarily reflects lower expenditures on the Boeing 787-8 program with the first flight having taken place in December 2009. The increase in company-funded research and development in 2008, compared with 2007, was led by continued investments in Pratt & Whitney’s next generation product family including the PurePower™ PW1000G (PurePower) engine, which features Geared Turbofan (GTF) technology. General increases across the businesses comprised the remainder of the year-over-year increase. Company-funded research and development spending is subject to the variable nature of program development schedules.
The increase in customer-funded research and development in 2009, compared with 2008, largely reflects increases on various
commercial and space programs at Hamilton Sundstrand, and higher development spending on the CH-53K program at Sikorsky, partially offset by reduced expenditures at Pratt & Whitney on the Joint Strike Fighter development program as it nears completion. The increase in customer-funded research and development spending in 2008, as compared with 2007, relates largely to increased engineering effort in the J-2X propulsion program at Pratt & Whitney Rocketdyne as well as various space programs at Hamilton Sundstrand, while development spending on the Joint Strike Fighter program across the company decreased.
Company-funded research and development spending for 2010 is expected to increase by approximately $100 million from 2009 levels as a result of shifts in timing of program development activities, primarily in the aerospace businesses.
Selling, General and Administrative
| (in millions of dollars) | 2009 | 2008 | 2007 | ||||||||
Selling, general and administrative | $ | 6,036 | $ | 6,724 | $ | 6,109 | |||||
Percentage of sales | 11.5% | 11.4% | 11.1% | ||||||||
The decrease in selling, general and administrative expenses in 2009, as compared with 2008, is due primarily to a continued focus on cost reduction and the impact from restructuring and cost saving initiatives undertaken in 2008 and 2009 in anticipation of adverse economic conditions. As a percentage of sales, selling, general and administrative expenses increased 10 basis points reflecting higher restructuring costs (approximately 30 basis points). The benefit from cost reduction actions in such areas as travel, employee attrition, employee salary related reductions, and the favorable impact of foreign exchange more than offset the adverse impact of the higher restructuring costs.
Increases in selling, general and administrative expenses in 2008 were due primarily to general increases across the businesses in support of higher volumes and the adverse impact of foreign currency translation. The increase in 2008 was further impacted by the effect of increased restructuring charges undertaken in anticipation of the tougher economic climate experienced in 2009, resulting in a 30 basis point increase in selling, general and administrative expenses as a percentage of sales from 2007 to 2008.
Interest Expense
| (in millions of dollars) | 2009 | 2008 | 2007 | ||||||||
Interest expense | $ | 705 | $ | 689 | $ | 666 | |||||
Average interest rate during the year | |||||||||||
Short-term borrowings | 3.1% | 5.6% | 6.2% | ||||||||
Total debt | 5.8% | 5.9% | 6.2% | ||||||||
5
The increase in interest expense in 2009, as compared with 2008, is primarily attributable to higher interest charges related to our deferred compensation plan. Increased interest expense resulting from the issuances of $1.25 billion and $1.0 billion of long-term debt in December and May 2008, respectively, was partially offset by lower interest expense resulting from the redemption of $933 million in notes that were due in 2009 and to the lower cost associated with our commercial paper borrowings. The redemptions and repayments as well as the lower cost of borrowing noted above resulted in a decline in the average interest rate in 2009 as compared with 2008.
Interest expense increased in 2008, as compared with 2007, primarily as a result of the issuances of $1.0 billion of long-term debt in December 2007, bearing interest at 5.375%, and $1.0 billion of long-term debt in May 2008, as noted above. This increase was partially offset by lower interest charges related to our deferred compensation plan and lower interest accrued on unrecognized tax benefits. The issuance of $1.25 billion of long-term debt in December 2008 noted above did not have a significant impact to interest expense in 2008. The average interest rate for commercial paper decreased in 2008 as compared to 2007 generating the decrease in the average short-term borrowing rate. The overall average interest rate declined as the long-term debt issuances noted above were at interest rates lower than existing outstanding obligations.
The weighted-average interest rate applicable to debt outstanding at December 31, 2009 was 4.8% for short-term borrowings and 6.1% for total debt as compared to 5.3% and 5.9%, respectively, at December 31, 2008. The three month LIBOR rate as of December 31, 2009, 2008 and 2007 was 0.3%, 1.4% and 4.7%, respectively.
Income Taxes
| 2009 | 2008 | 2007 | ||||||
Effective income tax rate | 27.4% | 27.1% | 28.8% | |||||
The effective tax rates for 2009, 2008 and 2007 reflect tax benefits associated with lower tax rates on international earnings, which we intend to permanently reinvest outside the United States. The 2009 effective tax rate increased as compared to 2008 due to the absence of certain discrete items which had a net favorable impact in 2008. The 2009 effective tax rate reflects approximately $38 million of tax expense reductions relating to re-evaluation of our liabilities and contingencies based on global examination activity during the year including the IRS’s completion of 2004 and 2005 examination fieldwork and our related protest filing. As a result of the global examination activity, we recognized approximately $18 million of associated pre-tax interest income adjustments during 2009.
The 2008 effective tax rate reflects approximately $62 million of tax expense reductions, principally relating to re-evaluation of our liabilities and contingencies based upon resolution of disputed tax matters with the Appeals Division of the IRS for tax years 2000 through 2003.
The 2007 effective tax rate reflects approximately $80 million of tax expense reductions, principally relating to re-evaluation of our liabilities and contingencies based upon global examination activity, including the IRS’s completion of 2000 through 2003 examination fieldwork and our related protest filing, and development of claims for research and development tax credits. Principal adverse tax impacts to the 2007 effective tax rate related to the previously disclosed EU Fine and enacted tax law changes outside the United States.
We expect our effective income tax rate in 2010 to be approximately 29%, before the impacts of any discrete events.
For additional discussion of income taxes, see “Critical Accounting Estimates – Income Taxes” and Note 10 to the Consolidated Financial Statements.
Net Income and Earnings Per Share
| (in millions of dollars, except per share amounts) | 2009 | 2008 | 2007 | ||||||||
Net income | $ | 4,179 | $ | 5,053 | $ | 4,548 | |||||
Less: Noncontrolling interest in subsidiaries’ earnings | 350 | 364 | 324 | ||||||||
Net income attributable to common shareowners | $ | 3,829 | $ | 4,689 | $ | 4,224 | |||||
Diluted earnings per share | $ | 4.12 | $ | 4.90 | $ | 4.27 | |||||
In addition to the decline in net income associated with the overall decline in revenues in 2009, the general strength of the U.S. dollar against certain currencies, such as the Euro, through most of 2009 as compared with 2008 generated an adverse foreign currency impact on our operational results of $.22 per share in 2009. This year-over-year impact includes a net $.10 per share adverse impact from both foreign currency translation and hedging at P&WC. At P&WC, the strength of the U.S. dollar in 2009 generated positive foreign currency translation impact as the majority of P&WC’s revenues are denominated in U.S. dollars, while a significant portion of its costs are incurred in local currencies. To help mitigate the volatility of foreign currency exchange rates on our operating results, we maintain foreign currency hedging programs, the majority of which are entered into by P&WC. Due to the increase in the strength of the Canadian dollar to the U.S. dollar in early 2008, the hedges previously entered into generated an adverse foreign exchange impact as the U.S. dollar strengthened. As a result of hedging programs currently in place, P&WC’s 2010 full year operating results will include a beneficial impact of foreign currency translation, net of
6
hedging, of approximately $100 million. In 2008 and 2007, foreign currency translation had a favorable impact of $.06 and $.09 per share, respectively. For additional discussion of foreign currency exposure, see “Market Risk and Risk Management – Foreign Currency Exposures.” Diluted earnings per share for 2009 were also favorably impacted by approximately $.03 per share as a result of the shares repurchased since January 1, 2009 under our share repurchase program.
Restructuring and Other Costs
We recorded net pre-tax restructuring and other costs totaling $830 million in 2009 and $357 million in 2008 for new and ongoing restructuring actions. We recorded these charges in the segments as follows:
| (in millions of dollars) | 2009 | 2008 | |||||
Otis | $ | 158 | $ | 21 | |||
Carrier | 210 | 140 | |||||
UTC Fire & Security | 112 | 63 | |||||
Pratt & Whitney | 190 | 116 | |||||
Hamilton Sundstrand | 88 | 16 | |||||
Sikorsky | 7 | — | |||||
Eliminations and other | 62 | 1 | |||||
General corporate expenses | 3 | — | |||||
Total | $ | 830 | $ | 357 | |||
The 2009 charges include $420 million in cost of sales, $364 million in selling, general and administrative expenses and $46 million in other income and, as described below, primarily relate to actions initiated during 2009 and 2008. Restructuring costs reflected in Eliminations and other largely reflect curtailment charges required under our domestic pension plan due to the significant headcount reductions associated with the various restructuring actions. The 2008 charges include $148 million in cost of sales, $205 million in selling, general and administrative expenses and $4 million in other income. The 2008 charges relate principally to actions initiated during 2008 and, to a lesser extent, residual trailing costs related to certain earlier actions.
Restructuring actions are an essential component of our operating margin improvement efforts and relate to both existing operations and those recently acquired. As a result of the severity of the global economic downturn, the level of restructuring initiated in 2009 was significantly in excess of that incurred in prior years. These actions were initiated to help mitigate the impact of the global economic downturn and better position us for a resumption of earnings growth expected in 2010. When completed, these actions will result in global employment reductions, primarily in overhead and selling, general and administrative functions of approximately 14,600. We have also acquired certain businesses at beneficial values in past years,
such as Kidde and Initial Electronic Security Group (IESG), with the expectation of restructuring the underlying cost structure in order to bring operating margins up to expected levels. Restructuring actions focus on streamlining costs through workforce reductions, the consolidation of manufacturing, sales and service facilities, and the transfer of work to more cost-effective locations. For acquisitions prior to January 1, 2009, the costs of restructuring actions at the acquired company contemplated at the date of acquisition are recorded under purchase accounting and actions initiated subsequently are recorded through operating results. However, effective January 1, 2009 under the Business Combinations Topic of the FASB ASC, restructuring costs associated with a business combination are expensed. We expect to incur approximately $350 million of restructuring costs in 2010, including approximately $100 million of trailing costs related to prior actions, associated with our continuing cost reduction efforts and to the integration of acquisitions. Although no specific plans for significant actions have been finalized at this time, we continue to closely monitor the economic environment and may undertake further restructuring actions to keep our cost structure aligned with the demands of the prevailing market conditions.
2009 Actions. During 2009, we initiated restructuring actions relating to ongoing cost reduction efforts, including workforce reductions, the consolidation of field operations and the consolidation of repair and overhaul operations. We recorded net pre-tax restructuring and other charges totaling $802 million as follows: Otis $157 million, Carrier $205 million, UTC Fire & Security $103 million, Pratt & Whitney $174 million, Hamilton Sundstrand $90 million, Sikorsky $7 million, Eliminations and other $63 million and General corporate expenses $3 million. The charges included $389 million in cost of sales, $368 million in selling, general and administrative expenses and $45 million in other income. Those costs included $680 million for severance and related employee termination costs, $69 million for asset write-downs and $53 million for facility exit and lease termination costs.
We expect the 2009 actions to result in net workforce reductions of approximately 14,600 hourly and salaried employees, the exiting of approximately 4.5 million net square feet of facilities and the disposal of assets associated with the exited facilities. As of December 31, 2009, we have completed net workforce reductions of approximately 11,100 employees, and 1.1 million net square feet of facilities have been exited. We are targeting the majority of the remaining workforce and facility related cost reduction actions for completion during 2010 and 2011. Approximately 60% of the total pre-tax charge will require cash payments, which we will fund with cash generated from operations. During 2009, we had cash outflows of approximately $324 million related to the 2009 actions. We expect to incur
7
additional restructuring and other charges of $97 million to complete these actions. We expect recurring pre-tax savings to increase over the two-year period subsequent to initiating the actions to approximately $700 million annually, of which approximately $280 million was realized in 2009.
On September 21, 2009, Pratt & Whitney announced plans to close a repair facility and an engine overhaul facility in Connecticut. For additional information concerning litigation related to Pratt & Whitney’s decision to close these two facilities, see Part I, Item 3, “Legal Proceedings” in our Form 10-K.
2008 Actions. During 2009, we recorded net pre-tax restructuring and other charges and reversals of $26 million for actions initiated in 2008. The 2008 actions relate to ongoing cost reduction efforts, including selling, general and administrative reductions and the consolidation of manufacturing facilities. We recorded the charges (reversals) in 2009 as follows: Otis $1 million, Carrier $5 million, UTC Fire & Security $9 million, Pratt & Whitney $16 million, Hamilton Sundstrand ($4 million) and Eliminations and other ($1 million). The charges and (reversals) included $29 million in cost of sales, ($4 million) in selling, general and administrative expenses and $1 million in other income. Those costs and reversals included $6 million for severance and related employee
termination costs, $1 million for asset write-downs and $19 million for facility exit and lease termination costs.
We expect the 2008 actions to result in net workforce reductions of approximately 6,200 hourly and salaried employees, the exiting of approximately 1.2 million net square feet of facilities and the disposal of assets associated with the exited facilities. As of December 31, 2009, we have completed net workforce reductions of approximately 6,100 employees and exited 700,000 net square feet of facilities. We are targeting the majority of the remaining workforce and all facility related cost reduction actions for completion during 2010. Approximately 65% of the total pre-tax charge will require cash payments, which we will fund with cash generated from operations. During 2009, we had cash outflows of approximately $109 million related to the 2008 actions. We expect to incur additional restructuring and related charges of $2 million to complete these actions. We expect recurring pre-tax savings to increase over the two-year period subsequent to initiating the actions to approximately $400 million annually.
For additional discussion of restructuring, see Note 12 to the Consolidated Financial Statements.
Segment Review
| Revenues | Operating Profits | Operating Profit Margin | ||||||||||||||||||||||||||||||
| (in millions of dollars) | 2009 | 2008 | 2007 | 2009 | 2008 | 2007 | 2009 | 2008 | 2007 | |||||||||||||||||||||||
Otis | $ | 11,779 | $ | 12,949 | $ | 11,885 | $ | 2,447 | $ | 2,477 | $ | 2,321 | 20.8% | 19.1% | 19.5% | |||||||||||||||||
Carrier | 11,413 | 14,944 | 14,644 | 740 | 1,316 | 1,381 | 6.5% | 8.8% | 9.4% | |||||||||||||||||||||||
UTC Fire & Security | 5,531 | 6,462 | 5,754 | 493 | 542 | 443 | 8.9% | 8.4% | 7.7% | |||||||||||||||||||||||
Pratt & Whitney | 12,577 | 14,041 | 13,086 | 1,835 | 2,122 | 2,011 | 14.6% | 15.1% | 15.4% | |||||||||||||||||||||||
Hamilton Sundstrand | 5,599 | 6,207 | 5,636 | 857 | 1,099 | 967 | 15.3% | 17.7% | 17.2% | |||||||||||||||||||||||
Sikorsky | 6,318 | 5,368 | 4,789 | 608 | 478 | 373 | 9.6% | 8.9% | 7.8% | |||||||||||||||||||||||
Total segment | 53,217 | 59,971 | 55,794 | 6,980 | 8,034 | 7,496 | 13.1% | 13.4% | 13.4% | |||||||||||||||||||||||
Eliminations and other | (297) | (214) | (78) | (167) | (1) | (60) | ||||||||||||||||||||||||||
General corporate expenses | — | — | — | (348) | (408) | (386) | ||||||||||||||||||||||||||
Consolidated | $ | 52,920 | $ | 59,757 | $ | 55,716 | $ | 6,465 | $ | 7,625 | $ | 7,050 | 12.2% | 12.8% | 12.7% | |||||||||||||||||
Commercial Businesses
The financial performance of our commercial businesses can be influenced by a number of external factors including fluctuations in residential and commercial construction activity, regulatory changes, interest rates, labor costs, foreign currency exchange rates, customer attrition, raw material and energy costs, tightening of credit markets and other global and political factors. Carrier’s financial performance can also be influenced by production and utilization of transport equipment, and for its residential business, weather conditions. Geographic and industry
diversity across the commercial businesses help to balance the impact of such factors on our consolidated operating results; however, the weak underlying global economic conditions across all markets in 2009 continued to adversely impact the commercial businesses to varying degrees with the most significant effects experienced at Carrier. A stronger U.S. dollar as compared to 2008, weak commercial construction, and weak demand in end markets have all posed operating challenges. While year-over-year order rates have largely stabilized at the end of 2009, with some improvement in the rates of decline compared to those
8
experienced earlier in the year, the commercial construction market globally is expected to remain weak in 2010.
In 2009, 70% of total commercial business revenues were generated outside the United States, as compared to 72% in 2008. The following table shows revenues generated outside the United States for each of the commercial business segments:
| 2009 | 2008 | ||||
Otis | 80% | 80% | |||
Carrier | 55% | 60% | |||
UTC Fire & Security | 82% | 83% | |||
Otis is the world’s largest elevator and escalator manufacturing, installation and service company. Otis designs, manufactures, sells and installs a wide range of passenger and freight elevators for low-, medium- and high-speed applications, as well as a broad line of escalators and moving walkways. In addition to new equipment, Otis provides modernization products to upgrade elevators and escalators as well as maintenance services for both its products and those of other manufacturers. Otis serves customers in the commercial and residential property industries around the world. Otis sells directly to the end customer and, to a limited extent, through sales representatives and distributors.
| Factors Contributing to Total % Change Year-Over-Year in: | |||||||||||
| 2009 | 2008 | ||||||||||
| Revenues | Operating Profits | Revenues | Operating Profits | ||||||||
Organic revenue/ | (6)% | 6% | 7% | 9% | |||||||
Foreign currency translation | (4)% | (4)% | 3% | 5% | |||||||
Acquisitions and divestitures, net | 1% | — | — | — | |||||||
Restructuring | — | (6)% | — | — | |||||||
Other | — | 3% | (1)% | (7)% | |||||||
Total % Change | (9)% | (1)% | 9% | 7% | |||||||
2009 Compared with 2008
Otis’s revenues decreased $1,170 million (9%) in 2009, as compared with 2008. The organic revenue decline was attributable to a decrease in new equipment sales as difficult economic conditions adversely impacted global construction. New equipment orders declined 31% versus the prior year, which contributed to lower new equipment sales across all geographic regions. Otis’s operating profits decreased $30 million (1%) in 2009, as compared with 2008. Operational profit improvement resulted from increased volume and improved margins in the contractual maintenance business, lower commodity costs and the benefits from aggressive cost reduction initiatives. The 3% increase contributed by “Other” in 2009 reflects a gain recognized in the second quarter of 2009 on the re-measurement to fair value of a previously held equity interest in a joint venture resulting from
the purchase of a controlling interest, and the absence of provisions for certain accounting issues discovered at a subsidiary in Brazil in late 2008.
2008 Compared with 2007
Otis’s revenues increased $1,064 million (9%) in 2008, as compared with 2007. Organic revenue growth reflected increased new equipment and service volume, aided by the strong new equipment backlog entering 2008, as well as higher modernization and repair sales in North America and Europe, the latter benefiting from changes to elevator safety laws in France and Spain. The 1% decrease in “Other” reflects the absence of gains on the sale of land and a non-core business recorded in 2007. Otis’s operating profits increased $156 million (7%) in 2008, as compared with 2007. Operational profit improvement resulted from higher volumes, product cost reductions and improved field installation efficiencies as partially offset by higher commodity and labor costs. The 7% decrease contributed by “Other” in 2008, as compared to the same period of the prior year, reflects the absence in 2008 of gains realized on the sale of land and a non-core business in 2007 (combined 5%) and by provisions for certain accounting issues (2%) discovered at a subsidiary in Brazil in late 2008. Otis concluded its investigation into the Brazilian matter in early 2009.
Carrier is the world’s largest provider of HVAC and refrigeration solutions, including controls for residential, commercial, industrial and transportation applications. Carrier also provides installation, retrofit and aftermarket services for the products it sells and those of other manufacturers in the HVAC and refrigeration industries. In 2009, as part of its business transformation strategy, Carrier completed divestitures of several lower-margin businesses, acquired several higher-margin service businesses, and formed ventures in parts of the U.S., Europe, the Middle East and Australia. This included the acquisition of StrionAir, a leading air purification technology company, Logical Automation, a leading building automation controls company, and the formation of Carrier Enterprise, LLC, a venture with Watsco, Inc., to distribute Carrier, Bryant, Payne and Totaline residential and light commercial HVAC products in the U.S. sunbelt region and selected territories in the Caribbean and Latin America. Carrier also integrated into its operations UTC Power’s micro-turbine-based combined cooling, heating and power systems business. Carrier’s products and services are sold under Carrier and other brand names to building contractors and owners, homeowners, transportation companies, retail stores and food service companies. Carrier sells directly to the end customer and through manufacturers’ representatives, distributors, wholesalers, dealers and retail outlets. Certain of Carrier’s HVAC businesses are seasonal and can be impacted by weather. Carrier customarily offers its customers incentives to purchase products to ensure an adequate supply of its products in the distribution channels.
9
| Factors Contributing to Total % Change Year-Over-Year in: | |||||||||||
| 2009 | 2008 | ||||||||||
| Revenues | Operating Profits | Revenues | Operating Profits | ||||||||
Organic revenue/ | (16)% | (34)% | (1)% | (5)% | |||||||
Foreign currency translation | (3)% | (1)% | 2% | 4% | |||||||
Acquisitions and divestitures, net | (5)% | (3)% | 1% | 1% | |||||||
Restructuring | — | (5)% | — | (8)% | |||||||
Other | — | (1)% | — | 3% | |||||||
Total % Change | (24)% | (44)% | 2% | (5)% | |||||||
2009 Compared with 2008
Carrier’s revenues decreased $3,531 million (24%) in 2009, as compared with 2008. The decline in organic revenues is a result of continued weak market conditions across all businesses, particularly the higher-margin transport refrigeration business where organic revenues declined 37% in 2009. Carrier’s operating profits decreased $576 million (44%) in 2009 compared with 2008 as almost all businesses experienced earnings declines due to unfavorable market conditions. The operational profit decrease was primarily due to the volume decline (57%), especially in our higher margin businesses, the adverse cost impact from worldwide currency shifts (5%), and lower equity income from a joint venture in Japan (2%). These adverse impacts were partially offset by the favorable impact from aggressive cost reduction and restructuring actions, and lower net commodity costs (net combined 30%). The 1% decrease in “Other” primarily reflects lower gains from net acquisition and divestiture activities. The decrease contributed by “Acquisitions and divestitures, net” for both revenues and operating profits reflects the net year-over-year operational impact from acquisitions and divestitures completed in the preceding twelve months, including the transaction with Watsco, Inc.
2008 Compared with 2007
Carrier’s revenues increased $300 million (2%) in 2008, as compared with 2007. The decline in organic revenue was due to weak end markets in the Refrigeration business and a decline in the Residential and Light Commercial Systems business in North America resulting from the continued weakness in the U.S. housing market. These decreases more than offset growth in the Building Systems and Services business while the Residential and Light Commercial International business was essentially flat. The year-over-year impact from a gain generated on the contribution of a business into a new venture operating in the Middle East and the Commonwealth of Independent States was essentially offset by the absence of a gain in 2007 on the disposition of Carrier’s Fincoil-teollisuus Oy (Fincoil) heat exchanger business. Carrier’s operating profits decreased $65 million (5%) in 2008, as compared with 2007. The operational profit decrease primarily reflects the adverse impact of higher commodity costs, net of pricing of approximately $71 million. Profit growth in Building
Systems and Services, product cost reductions, and benefits from prior restructuring actions, were more than offset by lower earnings in the Refrigeration and Residential and Light Commercial Systems International businesses and the adverse impact of higher costs on cross border transactions (4%), as a result of significant currency shifts experienced during the year. The 3% increase contributed by “Other” primarily reflects the absence of the adverse impact of a 2007 settlement of a gas furnace litigation matter. A gain generated in 2008 from the contribution of a business to a new venture (5%) was mostly offset by the absence of a gain (4%) recorded in 2007 on the disposition of Fincoil.
UTC Fire & Securityis a global provider of security and fire safety products and services. We created the UTC Fire & Security segment in the second quarter of 2005 upon acquiring Kidde and adding the Kidde industrial, retail and commercial fire safety businesses to the former Chubb segment. UTC Fire & Security provides electronic security products such as intruder alarms, access control systems and video surveillance systems and designs and manufactures a wide range of fire safety products including specialty hazard detection and fixed suppression products, portable fire extinguishers and other firefighting equipment. Services provided to the electronic security and fire safety industries include systems integration, installation, maintenance and inspection services. UTC Fire & Security also provides monitoring, response and security personnel services, including cash-in-transit security, to complement its electronic security and fire safety businesses. In November 2009, we entered into an agreement with GE to purchase the GE Security business. Subject to regulatory approvals and the satisfaction of customary closing conditions, the closing is anticipated to take place early in the second quarter of 2010. GE Security, part of GE Technology Infrastructure, supplies security and fire safety technologies for commercial and residential applications through a broad product portfolio that includes fire detection and life safety systems, intrusion alarms, video surveillance and access control systems. We intend to incorporate the GE Security business within the UTC Fire & Security segment, which will significantly enhance UTC Fire & Security’s geographic diversity with GE Security’s strong North American presence and increased product and technology offerings. UTC Fire & Security products and services are used by governments, financial institutions, architects, building owners and developers, security and fire consultants and other end-users requiring a high level of security and fire protection for their businesses and residences. In 2009, we also completed the acquisition of GST Holdings Limited (GST), a fire alarm provider in China. With the acquisition of the remaining 71% of the outstanding shares of GST, UTC Fire & Security further strengthened its presence in the Chinese fire safety industry. UTC Fire & Security provides its products and services under Chubb, Kidde and other brand names and sells
10
directly to the customer as well as through manufacturer representatives, distributors, dealers and U.S. retail distribution.
| Factors Contributing to Total % Change Year-Over-Year in: | |||||||||||
| 2009 | 2008 | ||||||||||
| Revenues | Operating Profits | Revenues | Operating Profits | ||||||||
Organic revenue/ | (7)% | 4% | 3% | 18% | |||||||
Foreign currency translation | (6)% | (9)% | — | (1)% | |||||||
Acquisitions and divestitures, net | (1)% | 4% | 9% | 11% | |||||||
Restructuring | — | (9)% | — | (5)% | |||||||
Other | — | 1% | — | (1)% | |||||||
Total % Change | (14)% | (9)% | 12% | 22% | |||||||
2009 Compared with 2008
UTC Fire & Security’s revenues decreased $931 million (14%) in 2009, as compared with 2008. Organic revenue contraction (7%) was primarily caused by declines in both the Americas and United Kingdom Fire Safety and Electronic Security businesses. UTC Fire & Security’s operating profits decreased $49 million (9%) in 2009, as compared with 2008. The operational profit improvement (4%) was due principally to the integration of field operations, the benefits of net cost reductions from previous restructuring actions, and the integration and continuing productivity and cost control initiatives which, combined, more than offset the impact of the lower revenues. The increase contributed by acquisitions and divestitures reflects the net year-over-year impact from acquisition and divestitures completed in the preceding twelve months, including the third quarter of 2009 acquisition of additional shares of GST, a fire alarm system provider in China.
2008 Compared with 2007
UTC Fire & Security’s revenues increased $708 million (12%) in 2008, as compared with 2007. Organic revenue growth (3%) was primarily contributed by the North American and European Fire Safety businesses (2%) due to strength in the oil & gas and marine industries and in Asia. UTC Fire & Security’s operating profits increased $99 million (22%) in 2008, as compared with 2007. The operational profit improvement (18%) was due principally to increased sales volume, the benefits of net cost reductions from previous restructuring and integration and continuing productivity initiatives.
Aerospace Businesses
The financial performance of Pratt & Whitney, Hamilton Sundstrand and Sikorsky is directly tied to the economic conditions of the commercial aerospace and defense industries. In particular, Pratt & Whitney experiences intense competition for new commercial airframe/engine combinations. Engine suppliers
may offer substantial discounts and other financial incentives, performance and operating cost guarantees, participation in financing arrangements and maintenance agreements. At times, the aerospace businesses also enter into firm fixed-price development contracts, which may require the company to bear cost overruns related to unforeseen technical and design challenges that arise during the development stage of the program. Customer selections of engines and components can also have a significant impact on later sales of parts and service. Predicted traffic levels, load factors, worldwide airline profits, general economic activity and global defense spending have been reliable indicators for new aircraft and aftermarket orders within the aerospace industry. Spare part sales and aftermarket service trends are affected by many factors, including usage, technological improvements, pricing, regulatory changes and the retirement of older aircraft. Performance in the general aviation sector is closely tied to the overall health of the economy and is positively correlated to corporate profits.
The weak global economic conditions and reduced air travel experienced by the global aerospace industry in 2009 imposed a difficult operating environment and resulted in significant losses for most airlines. As a result, airframers have seen lower levels of orders for aircraft compared to 2008. Due to the weak demand for business and general aviation aircraft, as corporations have cut back on discretionary spending, business jet OEMs experienced lower order levels. Accordingly, business jet OEMs made downward revisions to their production schedules, resulting in additional pressure on P&WC. These factors have led to a 21% decrease in 2009 year-over-year engine shipments at P&WC, with continued declines expected in 2010. In an effort to combat the impact of the economic environment experienced in 2009, airlines slashed ticket prices to lure travelers, reduced capacity by idling some aircraft, retired older and less fuel efficient aircraft, and have delayed orders and deliveries of new planes. Continued weak passenger and cargo traffic, capacity reductions, lower aircraft utilization, and cash conservation measures at some airlines have led to a corresponding decrease in commercial aerospace aftermarket volume at both Pratt & Whitney and Hamilton Sundstrand, and accordingly, consolidated commercial aerospace aftermarket revenue declined 13% in 2009 as compared to 2008. This includes an approximately 25% decline in Pratt & Whitney commercial spares sales in 2009, as compared with 2008. We expect commercial aerospace aftermarket revenues will grow in 2010, although at a moderate rate.
While we have seen improving comparable airline traffic trends in the second half of 2009, full year 2009 airline traffic contracted approximately 3% compared to being essentially flat in 2008. Although we project airline traffic growth in 2010, lower business
11
and first class travel are expected to continue to put significant pressure on airline profitability. As a result, airlines are expected to continue to remain in a cash conservation mode. Our expectation is that the 2010 airframer production rates will be slightly lower than 2009 levels as a result of the pressure on airline profitability and financing issues facing both the airlines and the business jet market.
The contraction in the global liquidity markets has adversely impacted the ability of commercial customers to obtain financing for helicopters. During 2009, there were several cancellations of commercial orders and total commercial helicopter deliveries were down approximately 20%. However, strong government military spending is continuing to drive military helicopter demand and, as a result, Sikorsky’s military backlog remains very strong. Across all segments, military OEM volume increased 20% in 2009, as compared with 2008, led by Sikorsky. As a result of the strong military helicopter demand and our existing backlogs, we expect further growth in helicopter deliveries in 2010. Total sales to the U.S. government of $9.3 billion, $8.0 billion, and $7.5 billion in 2009, 2008, and 2007, respectively, were 18% of total UTC sales in 2009 and 14% in both 2008 and 2007. The defense portion of our aerospace business is affected by changes in market demand and the global political environment. Our participation in long-term production and development programs for the U.S. government has contributed positively to our results in 2009 and is expected to continue to benefit results in 2010.
Pratt & Whitney is among the world’s leading suppliers of aircraft engines for the commercial, military, business jet and general aviation markets. Pratt & Whitney’s Global Services organization provides maintenance, repair and overhaul services, including the sale of spare parts, as well as fleet management services for large commercial engines. Pratt & Whitney produces families of engines for wide and narrow body aircraft in the commercial and military markets. Pratt & Whitney also sells engines for industrial applications and space propulsion systems. P&WC is a world leader in the production of engines powering business, regional, light jet, utility and military aircraft and helicopters. Pratt & Whitney Rocketdyne (PWR) is a leader in the design, development and manufacture of sophisticated aerospace propulsion systems for military and commercial applications, including the U.S. space shuttle program. Pratt & Whitney’s products are sold principally to aircraft manufacturers, airlines and other aircraft operators, aircraft leasing companies, space launch vehicle providers and U.S. and foreign governments. Pratt & Whitney’s products and services must adhere to strict regulatory and market driven safety and performance standards. The frequently changing nature of these standards, along with the long duration of aircraft engine
programs, creates uncertainty regarding engine program profitability. The vast majority of sales are made directly to the end customer and, to a limited extent, through independent distributors and foreign sales representatives.
Both Mitsubishi Heavy Industries Ltd. (MHI) and Bombardier selected Pratt & Whitney’s PurePower engine to exclusively power their new aircraft. Both the Mitsubishi Regional Jet and the Bombardier C Series family of passenger aircraft are scheduled to enter service in 2013. Irkut Corporation selected the PurePower to power their planned new MC-21 single aisle aircraft. The PurePower engine family, featuring Geared Turbofan (GTF) technology targets a significant reduction in fuel burn and noise levels with lower environmental emissions and operating costs than current production of advanced turbofan engines. Ground and flight testing for the PurePower demonstrator engine was successfully completed in 2009. The success of these aircraft and the PurePower engine is dependent upon many factors including technological challenges, aircraft demand, and regulatory approval. Based on these factors, additional investment in the PurePower program will be required, with potential additional investment in the underlying aircraft programs being dependent on successful launch by the air-framers and other conditions.
In view of the risks and costs associated with developing new engines, Pratt & Whitney has entered into collaboration agreements in which revenues, costs and risks are shared. At December 31, 2009, the interests of participants in Pratt & Whitney-directed jet engine programs ranged from 14% to 48%. In addition, Pratt & Whitney has interests in other engine programs, including a 33% interest in the International Aero Engines (IAE) collaboration that sells and supports V2500® engines for the Airbus A320 family of aircraft. At December 31, 2009, a portion of Pratt & Whitney’s interest in IAE (equivalent to 4% of the overall IAE collaboration) was held by other participants. Pratt & Whitney also has a 50% interest in the Engine Alliance (EA), a joint venture with GE Aviation, undertaken to develop, market and manufacture the GP7000 engine for the Airbus A380 aircraft. At December 31, 2009, 40% of Pratt & Whitney’s 50% interest in the EA was held by other participants. During 2009, we also entered into collaboration arrangements for the above mentioned PurePower engine programs. Effective January 1, 2009, we have adopted the Collaborative Arrangements Topic of the FASB ASC, which requires that participants in a collaborative arrangement report costs incurred and revenues generated from the arrangement on a gross basis in the appropriate line items in each company’s financial statements. For additional discussion, see Note 15 to the Consolidated Financial Statements.
12
| Factors Contributing to Total % Change Year-Over-Year in: | |||||||||||
| 2009 | 2008 | ||||||||||
| Revenues | Operating Profits | Revenues | Operating Profits | ||||||||
Organic revenue */ Operational operating profit * | (8)% | (5)% | 7% | 13% | |||||||
Foreign currency (including P&WC net hedging) * | (2)% | (6)% | — | (3)% | |||||||
Restructuring | — | (3)% | — | (3)% | |||||||
Other | — | — | — | (1)% | |||||||
Total % Change | (10)% | (14)% | 7% | 6% | |||||||
| * | As discussed further in the “Business Overview” and “Results of Operations” sections of Management’s Discussion and Analysis of Financial Condition and Results of Operations, for Pratt & Whitney only, the transactional impact of foreign exchange hedging at P&WC has been netted against the translational foreign exchange impact for presentation purposes in the above table. For all other segments, these foreign exchange transactional impacts are included within the organic revenue/operational operating profit caption in their respective tables. Due to its significance to Pratt & Whitney’s overall operating results, we believe it is useful to segregate the foreign exchange transactional impact in order to clearly identify the underlying financial performance. |
2009 Compared with 2008
Pratt & Whitney’s revenues decreased $1,464 million (10%) in 2009, as compared with 2008. The decrease is primarily attributable to decreased engine shipments and lower aftermarket volume at P&WC (4%), lower commercial spares and aftermarket volume (4%), and the adverse impact of net hedging activity (2%). Pratt & Whitney’s operating profits decreased $287 million (14%) in 2009, as compared with 2008. The operational decline (5%) was primarily driven by lower aftermarket volumes and decreased engine shipments in the large commercial engine business (9%) and at P&WC (5%), partially offset by the favorable impact of lower research and development spending (6%) and the profit contribution from higher military engine volumes (2%).
2008 Compared with 2007
Pratt & Whitney’s revenues increased $955 million (7%) in 2008, as compared with 2007. This increase is primarily attributable to higher engine deliveries at P&WC (4%), increased commercial engine revenue and aftermarket services volume, partially offset by commercial spares (net combined 1%), and increased volume at Pratt & Whitney Power Systems (1%). Increased volume at PWR (1%) was offset by lower military engine volumes. Pratt & Whitney’s operating profits increased $111 million (6%) in 2008, as compared with 2007. The operational profit increase (13%) is primarily attributable to the profit contributions from higher engine deliveries and favorable engine mix at P&WC (7%) and increased volume at PWR (2%). The majority of the remainder of the operational profit increase reflects the favorable impact of commercial engine mix, a commercial engine program adjustment, and lower net commodity costs (combined 3%). The 1% decrease in “Other” reflects the absence of the favorable impact of a contract termination in 2007 (3%) partially offset by a gain in 2008 from the sale of a partial investment (2%).
Hamilton Sundstrandis among the world’s leading suppliers of technologically advanced aerospace and industrial products and aftermarket services for diversified industries worldwide. Hamilton Sundstrand’s aerospace products, such as power generation, management and distribution systems, flight systems, engine control systems, environmental control systems, fire protection and detection systems, auxiliary power units and propeller systems, serve commercial, military, regional, business and general aviation, as well as military ground vehicle, space and undersea applications. In 2009, UTC completed the transition of the program management of UTC Power’s space and defense fuel cell power plant business to Hamilton Sundstrand’s energy, space and defense business. Aftermarket services include spare parts, overhaul and repair, engineering and technical support and fleet maintenance programs. Hamilton Sundstrand sells aerospace products to airframe manufacturers, the U.S. and foreign governments, aircraft operators and independent distributors. Hamilton Sundstrand’s principal industrial products, such as air compressors, metering pumps and fluid handling equipment, serve industries involved with chemical and hydrocarbon processing, oil and gas production, water and wastewater treatment and construction. Hamilton Sundstrand sells these products under the Sullair, Sundyne, Milton Roy and other brand names directly to end users, and through manufacturer representatives and distributors.
| Factors Contributing to Total % Change Year-Over-Year in: | |||||||||||
| 2009 | 2008 | ||||||||||
| Revenues | Operating Profits | Revenues | Operating Profits | ||||||||
Organic revenue/ | (7)% | (11)% | 9% | 7% | |||||||
Foreign currency translation | (1)% | (1)% | 1% | 1% | |||||||
Acquisitions and divestitures, net | (2)% | (1)% | (1)% | — | |||||||
Restructuring | — | (7)% | — | 1% | |||||||
Other | — | (2)% | 1% | 5% | |||||||
Total % Change | (10)% | (22)% | 10% | 14% | |||||||
2009 Compared with 2008
Hamilton Sundstrand’s revenues decreased $608 million (10%) in 2009, as compared with 2008. The organic revenue decline reflects lower volumes in both the industrial (4%) and aerospace (3%) businesses. The decrease within aerospace was primarily attributable to aftermarket volume declines. Hamilton Sundstrand’s operating profits decreased $242 million (22%) in 2009, as compared with 2008. The decrease in operational profit reflects declines in the aerospace (13%) and industrial (4%) businesses, partially offset by lower year-over-year research and development costs (6%). The 2% decrease in “Other” primarily reflects the net year-over-year impact of gains recognized in 2008 relating to divestiture activities.
13
2008 Compared with 2007
Hamilton Sundstrand’s revenues increased $571 million (10%) in 2008, as compared with 2007. The organic revenue growth reflects volume growth in both the aerospace (7%) and industrial (2%) businesses. The increase within aerospace was primarily attributable to OEM volume growth. Hamilton Sundstrand’s operating profits increased $132 million (14%) in 2008, as compared with 2007. The increase in operational profit reflects growth in the aerospace (6%) and industrial businesses (2%), partially offset by higher year-over-year research and development costs (1%). The 5% increase contributed by “Other” primarily reflects the favorable impact of gains related to divestiture activity (3%).
Sikorsky is one of the world’s largest manufacturers of military and commercial helicopters and also provides aftermarket helicopter and aircraft parts and services. Current major production programs at Sikorsky include the UH-60M Black Hawk medium-transport helicopters and HH-60M Medevac helicopters for the U.S. and foreign governments, the S-70 Black Hawk for foreign governments, the MH-60S and MH-60R helicopters for the U.S. Navy, the International Naval Hawk for multiple naval missions, and the S-76 and the S-92 helicopters for commercial operations. The UH-60M helicopter is the latest and most modern in a series of Black Hawk variants that Sikorsky has been delivering to the U.S. Army since 1978 and requires significant additional assembly hours relative to the previous variants. In December 2007, the U.S. government and Sikorsky signed a five-year, multi-service contract for 537 H-60 helicopters to be delivered to the U.S. Army and U.S. Navy, which include the UH-60M, HH-60M, MH-60S and MH-60R aircraft. The contract value for expected deliveries over the five year term is approximately $8.2 billion and includes options for an additional 263 aircraft, spares, and kits, with the total contract value potentially reaching $11.6 billion making it the largest contract in UTC and Sikorsky history. Actual production quantities will be determined year by year over the life of the program based on funding allocations set by Congress and Pentagon acquisition priorities. The deliveries of the aircraft are scheduled to be made through 2012. Sikorsky is also developing the CH-53K next generation heavy lift helicopter for the U.S. Marine Corps and the CH-148, a derivative of the H-92 helicopter, a military variant of the S-92 helicopter, for the Canadian government. The latter is being developed under an approximately $3 billion firm, fixed-price contract that provides for the development, production, and 22-year logistical support of 28 helicopters. This is the largest and most expansive fixed-price development contract in Sikorsky’s history. In December 2008, Sikorsky and the Canadian government executed amendments to the contract that revised the delivery schedule and contract specifications. The first test flight was successfully conducted in November 2008 and the contract provides for delivery of the first interim configuration
helicopter in the fourth quarter of 2010. Sikorsky is in discussions with the Canadian government concerning an anticipated delay in completing certain elements of the specification for the interim aircraft. Sikorsky’s aftermarket business includes spare parts sales, overhaul and repair services, maintenance contracts, and logistics support programs for helicopters and other aircraft. Sales are made directly by Sikorsky and by its subsidiaries and joint ventures. Sikorsky is increasingly engaging in logistics support programs and partnering with its government and commercial customers to manage and provide maintenance and repair services.
| Factors Contributing to Total % Change Year-Over-Year in: | |||||||||||
| 2009 | 2008 | ||||||||||
| Revenues | Operating Profits | Revenues | Operating Profits | ||||||||
Organic revenue/ | 18% | 36% | 12% | 31% | |||||||
Acquisitions and divestitures, net | — | — | — | (1)% | |||||||
Restructuring | — | (1)% | — | (1)% | |||||||
Other | — | (8)% | — | (1)% | |||||||
Total % Change | 18% | 27% | 12% | 28% | |||||||
2009 Compared with 2008
Sikorsky’s revenues increased $950 million (18%) in 2009, as compared with 2008. The organic revenue increase was primarily driven by higher volumes of military aircraft deliveries partially offset by a reduction in commercial aircraft sales due to a competitive marketplace. Sikorsky’s operating profits increased $130 million (27%) in 2009, as compared with 2008. The operational profit improvement was primarily attributable to increased aircraft deliveries and favorable aircraft mix (41%) within the military market, partially offset by reduced operational profit (10%) within commercial operations due primarily to a competitive marketplace. The remainder of the increase is primarily comprised of favorable contract adjustments. The 8% decrease in “Other” primarily reflects the adverse impact associated with a new union contract.
2008 Compared with 2007
Sikorsky’s revenues increased $579 million (12%) in 2008, as compared with 2007. The organic revenue increase was due to the higher volume of military aircraft deliveries and a favorable aircraft mix between military and commercial programs. Sikorsky’s operating profits increased $105 million (28%) in 2008, as compared with 2007. The operational profit improvement was primarily attributable to increased military aircraft deliveries and favorable aircraft mix for both military and commercial programs (combined 42%) partially offset by increased selling, general, and administrative expenses (7%) and research and development (6%).
14
Eliminations and other
Eliminations and other reflects the elimination of revenues and operating profit transacted between segments, as well as the operating results of certain smaller businesses such as UTC Power. The revenues reduction of $214 million in 2008 increased to $297 million in 2009 largely as a result of the transfer of certain programs from UTC Power to Carrier, Pratt & Whitney and Hamilton Sundstrand. The increase in the operating profit elimination in 2009, as compared with 2008, is primarily attributable to curtailment charges related to the impact of headcount reductions on the domestic pension plans, and to increased inventory reserves and project related reserves recorded at UTC Power.
General corporate expenses
General corporate expenses declined in 2009 as compared with 2008 as a result of lower corporate office expenses associated with restructuring actions undertaken and a focus on cost reduction efforts during 2009.
Liquidity and Financial Condition
| (in millions of dollars) | 2009 | 2008 | |||||
Cash and cash equivalents | $ | 4,449 | $ | 4,327 | |||
Total debt | 9,744 | 11,476 | |||||
Net debt (total debt less cash and cash equivalents) | 5,295 | 7,149 | |||||
Total equity 1 | 20,999 | 16,681 | |||||
Total capitalization (debt plus equity)1 | 30,743 | 28,157 | |||||
Net capitalization (debt plus equity less cash and cash equivalents)1 | 26,294 | 23,830 | |||||
Debt to total capitalization1 | 32% | 41% | |||||
Net debt to net capitalization1 | 20% | 30% | |||||
| Note 1 | As of January 1, 2009, we adopted the provisions under the Consolidation Topic of the FASB ASC as it relates to the accounting and reporting standards for noncontrolling interests (previously referred to as minority interests) in consolidated subsidiaries as reported in consolidated financial statements. These provisions require that the carrying value of noncontrolling interests be removed from the mezzanine section of the balance sheet and reclassified as equity. As a result of this adoption, we reclassified noncontrolling interests in the amount of $918 million from the mezzanine section to equity in the December 31, 2008 consolidated balance sheet. In addition, we adopted the FASB Accounting Standards Update (ASU) for redeemable equity instruments, applicable for all noncontrolling interests with redemption features, such as put options, that are not solely within our control (redeemable noncontrolling interest). The standards require redeemable noncontrolling interest to be reported in the mezzanine equity section of the consolidated balance sheet at the greater of redemption value or initial carrying value. As a result of this adoption, we have classified certain “redeemable noncontrolling interests” in the mezzanine section in the accompanying consolidated balance sheets and have increased them to redemption value, where required, resulting in a $154 million decrease to equity in the December 31, 2008 consolidated balance sheet. Additional discussion of the accounting for noncontrolling interests is included in Note 9 to the Consolidated Financial Statements. |
Our debt to total capitalization and net debt to net capitalization levels improved substantially during 2009. As discussed further below, total debt was reduced by approximately $1.7 billion, including the repayment of $933 million of notes that were due in
2009. Additionally, our equity position benefited from the reclassification of noncontrolling interests required by the Consolidations Topic of the FASB ASC, and from the reversal of unrealized losses recorded through Accumulated Other Comprehensive Income (Loss) in Equity. Due to the poor global equity market performance in 2008, we recorded $6.5 billion of unrealized losses in equity, reflecting approximately $4.2 billion of pension and postretirement benefit plans losses, resulting from changes in the valuation of pension assets, and approximately $2 billion of negative foreign currency translation adjustments. During 2009, improvements to the equity markets resulted in the reversal of approximately $1.1 billion of these losses. Lastly, with the strength of the U.S. dollar during most of 2009, approximately $1.0 billion of positive foreign currency translation adjustments were recorded through equity.
We assess our liquidity in terms of our ability to generate cash to fund our operating, investing and financing activities. Our principal source of liquidity is operating cash flows, which, after netting out capital expenditures, we target to equal or exceed net income attributable to common shareowners. In addition to operating cash flows, other significant factors that affect our overall management of liquidity include: capital expenditures, customer financing requirements, investments in businesses, dividends, common stock repurchases, pension funding, access to the commercial paper markets, adequacy of available bank lines of credit, and the ability to attract long-term capital at satisfactory terms.
Distress in the financial markets over most of the last two years has had an adverse impact on financial market activities including, among other things, the creation of extreme volatility in security prices, severely diminishing liquidity and credit availability, rating downgrades of certain investments and declining valuations of others. We have assessed the implications of these factors on our current business, are closely monitoring the impact on our customers and suppliers, and have determined that while there has been some impact to working capital, overall there has not been a significant effect on our financial position, results of operations or liquidity during 2009. Our pension plans have not experienced any significant impact on liquidity or counterparty exposure due to the volatility in the credit markets. As a result of losses experienced in the global equity markets in 2008, our domestic pension funds experienced a negative return on assets of approximately 27% in 2008. The negative return on our domestic plans in 2008 combined with a change in discount rate in the prior year increased pension costs by approximately $225 million in 2009 as compared to 2008. The equity markets improved substantially during the course of 2009, resulting in a 21% positive return on assets for 2009. As a result of the positive returns, additional funding during 2009, and a change to the final average earnings formula (as discussed in “Critical Accounting
15
Estimates”), pension expense in 2010 is expected to be slightly lower than 2009 levels.
Approximately 88% of our domestic pension plans are invested in readily-liquid investments, including equity, fixed income, asset backed receivables and structured products. The balance of our domestic pension plans (12%) is invested in less-liquid but market-valued investments, including real estate and private equity.
As discussed further below, our strong debt ratings and financial position have historically enabled us to issue long-term debt at favorable market rates, including the $1.0 billion of long-term debt issuance in May 2008 and $1.25 billion of long-term debt issuance in December 2008. We used the net proceeds from our December 2008 issuance of $1.25 billion in long-term debt to repay a portion of our outstanding commercial paper borrowings at that time, as well as a portion of our outstanding borrowings from our multicurrency revolving credit facility. In February 2009, we redeemed the entire $500 million outstanding principal amount of our LIBOR+.07% floating rate notes that were due June 1, 2009 at a redemption price in U.S. dollars equal to 100% of the principal amount, plus interest accrued. On June 1, 2009, we repaid our $400 million of 6.500% notes due 2009 which matured on the same date. In December 2009, we redeemed the entire $33 million outstanding principal amount of our 7.675% ESOP debt that was due December 10, 2009 at a redemption price in U.S. dollars equal to 100% of the principal amount, plus interest accrued.
Our ability to obtain debt financing at comparable risk-based interest rates is partly a function of our existing cash-flow-to-debt and debt-to-capitalization levels as well as our current credit standing. Our credit ratings are reviewed regularly by major debt rating agencies such as Standard and Poor’s, Moody’s Investors Service and Fitch Ratings. In reports published in 2009, Standard and Poor’s affirmed our short-term debt rating as A-1 and our long-term debt rating as A, respectively. Similarly, in 2009, Moody’s Investors Service also affirmed its corporate rating on our short-term debt rating as P-1 and our long-term debt rating as A2. Fitch Ratings also published data in 2009, affirming UTC’s short-term debt rating as F1 and our long-term debt rating as A+. In November 2009 Standard and Poor’s, Moody’s Investors Service and Fitch Ratings all confirmed their respective ratings and stated those ratings would not change as a result of the pending acquisition of GE Security. We continue to have access to the commercial paper markets and our existing credit facilities, and expect to continue to generate strong operating cash flows. While the impact of continued market volatility cannot be predicted, we believe we have sufficient operating flexibility, cash reserves and funding sources to maintain adequate amounts of liquidity and to meet our future operating cash needs.
Most of our cash is denominated in foreign currencies. We manage our worldwide cash requirements by considering available funds among the many subsidiaries through which we conduct our business and the cost effectiveness with which those funds can be accessed. The repatriation of cash balances from certain of our subsidiaries could have adverse tax consequences; however, those balances are generally available without legal restrictions to fund ordinary business operations. We will continue to transfer cash from those subsidiaries to UTC and to other international subsidiaries when it is cost effective to do so.
We believe our future operating cash flows will be sufficient to meet our future operating cash needs. Further, our ability to obtain debt or equity financing, as well as the availability under committed credit lines, provides additional potential sources of liquidity should they be required.
Cash Flow from Operating Activities
| (in millions of dollars) | 2009 | 2008 | |||||
Net cash flows provided by operating activities | $ | 5,353 | $ | 6,161 | |||
The decrease in cash generated from operating activities in 2009 as compared with 2008, is due largely to the decline in net income attributable to common shareowners, as a result of lower volumes, and the $1.3 billion of contributions to our global defined benefit pension plans made in 2009. This impact was partially mitigated through a focused effort at reducing working capital levels. During 2009, working capital was a source of cash of $1.1 billion, compared to a cash outflow of $230 million during 2008. The year-over-year improvement was largely attributable to significant reductions in inventory and accounts receivable as partially offset by a decline in accounts payable levels. The declines in sales volumes led to inventory reductions across all businesses except Sikorsky, with a nearly $450 million year-over-year reduction at Carrier generating the majority of the improvement. The increase at Sikorsky of approximately $240 million was augmented by a decline in advances of $168 million and reflects the demands of significant growth that Sikorsky is currently experiencing. Accounts receivable provided approximately $1 billion of cash in 2009 as compared with a use of cash of approximately $550 million in 2008. The year-over-year improvement reflects both the decline in volumes as well as a consistently strong focus on collections throughout 2009. Partially offsetting the benefit of reduced inventory and accounts receivable levels was a year-over-year decrease in accounts payable of approximately $1 billion associated with the corresponding declines in volume and inventory levels.
The funded status of our pension plans is dependent upon many factors, including returns on invested assets and the level of market interest rates. We can contribute cash or company stock
16
to our plans at our discretion, subject to applicable regulations. Total cash contributions to our global defined benefit pension plans during 2009 and 2008 were approximately $1.3 billion and $200 million, respectively. We also contributed $250 million in UTC common stock to these plans during 2008. As of December 31, 2009, the total investment by the defined benefit pension plans in our securities is approximately 4% of total plan assets. We expect to make contributions of approximately $600 million to our pension plans in 2010, including approximately $400 million to our domestic plans. Expected contributions to our defined pension plans in 2010 will meet or exceed the current funding requirements.
Cash Flow from Investing Activities
| (in millions of dollars) | 2009 | 2008 | ||||||
Net cash flows used in investing activities | $ | (1,104 | ) | $ | (2,336 | ) | ||
The year-over-year decrease in the net use of cash flows for investing activities is largely a result of lower capital expenditures of $390 million and a decrease of $549 million in acquisitions activity in 2009 as compared with 2008. Capital expenditures have been curtailed across the businesses in line with the volume reductions as a result of the challenging economic climate experienced in 2009.
Customer financing activities was a net use of cash of $91 million in 2009, compared to a net use of cash of $147 million for 2008. While we expect that 2010 customer financing activity will be a net use of funds, actual funding is subject to usage under existing customer financing commitments during the remainder of the year. We may also arrange for third-party investors to assume a portion of our commitments. We had financing and rental commitments of approximately $909 million and $1,142 million related to commercial aircraft at December 31, 2009 and 2008, respectively, of which as much as $116 million may be required to be disbursed during 2010. Refer to Note 4 to the Consolidated Financial Statements for additional discussion of our commercial aerospace industry assets and commitments.
The net investment in businesses in 2009 was $545 million compared with $915 million for 2008. The cash investment in businesses across all of our operations in 2009 was $703 million and primarily consisted of a number of small acquisitions in both our aerospace and commercial businesses, including the acquisition of a controlling interest in GST Holdings Limited (GST), a fire alarm system provider in China. The acquisition of these additional shares in GST was partially funded from cash that was previously restricted. Cash investment in businesses across all of our operations in 2008 was $1,252 million and primarily consisted of a number of small acquisitions in our commercial businesses. We expect total investments in businesses in 2010 to
approximate $3 billion, including the recently announced agreement to purchase the GE Security business from GE for approximately $1.8 billion; however, actual acquisition spending may vary depending upon the timing, availability and appropriate value of acquisition opportunities. Subject to regulatory approvals and the satisfaction of customary closing conditions, the closing of the GE Security acquisition is anticipated to take place early in the second quarter of 2010.
Cash Flow from Financing Activities
| (in millions of dollars) | 2009 | 2008 | ||||||
Net cash flows used in financing activities | $ | (4,191 | ) | $ | (2,238 | ) | ||
The timing and levels of certain cash flow activities, such as acquisitions and repurchases of our stock, have resulted in the issuance of both long-term and short-term debt. Commercial paper borrowings and revolving credit facilities provide short-term liquidity to supplement operating cash flows and are used for general corporate purposes, including the funding of potential acquisitions and repurchases of our stock. At December 31, 2009, we had two committed credit agreements from banks permitting aggregate borrowings of up to $2.5 billion. One credit commitment is a $1.5 billion revolving credit agreement. As of December 31, 2009 there were no borrowings under this revolving credit agreement, which expires in October 2011. We also have a $1.0 billion multicurrency revolving credit agreement that is available for general funding purposes, including acquisitions. During 2009, we repaid approximately $460 million which had been borrowed under the multicurrency revolving credit agreement as of December 31, 2008. At December 31, 2009, there were no borrowings under this revolving credit agreement, which expires in November 2011. The undrawn portions of both the $1.5 billion revolving credit agreement and $1.0 billion multicurrency revolving credit agreement are also available to serve as backup facilities for the issuance of commercial paper. In December 2008, we increased our maximum commercial paper borrowing authority from $1.5 billion to $2.5 billion. In addition, at December 31, 2009, approximately $3.1 billion was available under short-term lines of credit with local banks at our various domestic and international subsidiaries. We had no commercial paper outstanding at December 31, 2009.
In February 2009, we redeemed the entire $500 million outstanding principal amount of our LIBOR+.07% floating rate notes that were due June 1, 2009 at a redemption price in U.S. dollars equal to 100% of the principal amount, plus interest accrued. On June 1, 2009, we repaid our $400 million of 6.500% notes due 2009 which matured on the same date. In December 2009, we redeemed the entire $33 million outstanding principal amount of our 7.675% ESOP debt that was due December 10, 2009 at a redemption price in U.S. dollars equal to 100% of the
17
principal amount, plus interest accrued. In December 2008 and May 2008, we issued $1.25 billion and $1.0 billion, respectively, of long-term debt. The proceeds of the May 2008 issuance were primarily used for general corporate purposes, including financing acquisitions and repurchasing our stock. The proceeds of the December 2008 issuance were primarily used to repay commercial paper borrowings and to repay outstanding borrowings under our multicurrency revolving credit facility described above.
Financing cash outflows for 2009 and 2008 included the repurchase of 19.1 million and 50.4 million shares of our common stock for approximately $1.1 billion and $3.2 billion, respectively, under an existing 60 million share repurchase program. In addition to management’s view that the repurchase of our common stock is a beneficial investment, we also repurchase to offset the dilutive effect of the issuance of stock and options under the stock-based employee benefit programs. At December 31, 2009, we had remaining authority to repurchase approximately 9 million shares under the current program. We expect total share repurchases in 2010 to approximate $1.5 billion; however, total repurchases may vary depending upon various factors including the level of other investing activities.
We paid dividends of $.385 per share in the first quarter of 2009 for a total of $339 million, $.385 per share in the second quarter for a total of $340 million, $.385 per share in the third quarter for a total of $339 million, and $.385 per share in the fourth quarter for a total of $338 million. During 2008, $1,210 million of cash dividends were paid to shareowners.
Critical Accounting Estimates
Preparation of our financial statements requires management to make estimates and assumptions that affect the reported amounts of assets, liabilities, revenues and expenses. Note 1 to the Consolidated Financial Statements describes the significant accounting policies used in preparation of the Consolidated Financial Statements. Management believes the most complex and sensitive judgments, because of their significance to the Consolidated Financial Statements, result primarily from the need to make estimates about the effects of matters that are inherently uncertain. The most significant areas involving management judgments and estimates are described below. Actual results in these areas could differ from management’s estimates.
Long-term Contract Accounting. We utilize percentage of completion accounting on certain of our long-term contracts. The percentage of completion method requires estimates of future revenues and costs over the full term of product and/or service delivery. We also utilize the completed-contract method of accounting on certain lesser value commercial contracts. Under the completed-contract method, sales and cost of sales are recognized when a contract is completed.
Losses, if any, on long-term contracts are provided for when anticipated. We recognize loss provisions on original equipment contracts to the extent that estimated inventoriable manufacturing, engineering, product warranty and product performance guarantee costs, as appropriate, exceed the projected revenue from the products contemplated under the contractual arrangement. For new commitments, we generally record loss provisions at the earlier of contract announcement or contract signing except for certain requirements contracts under which losses are recorded based upon receipt of the purchase order. For existing commitments, anticipated losses on contracts are recognized in the period in which losses become evident. Products contemplated under the contractual arrangement include products purchased under the contract and, in the large commercial engine business, future highly probable sales of replacement parts required by regulation that are expected to be purchased subsequently for incorporation into the original equipment. Revenue projections used in determining contract loss provisions are based upon estimates of the quantity, pricing and timing of future product deliveries. We generally recognize losses on shipment to the extent that inventoriable manufacturing costs, estimated warranty costs and product performance guarantee costs, as appropriate, exceed revenue realized. We measure the extent of progress toward completion on our long-term commercial aerospace equipment and helicopter contracts using units of delivery. In addition, we use the cost-to-cost method for elevator and escalator sales, installation and modernization contracts in the commercial businesses. For long-term aftermarket contracts, we recognize revenue over the contract period in proportion to the costs expected to be incurred in performing services under the contract. Contract accounting also requires estimates of future costs over the performance period of the contract as well as an estimate of award fees and other sources of revenue.
Contract costs are incurred over a period of time, which can be several years, and the estimation of these costs requires management’s judgment. The long-term nature of these contracts, the complexity of the products, and the strict safety and performance standards under which they are regulated can affect our ability to estimate costs precisely. As a result, we review and update our cost estimates on significant contracts on a quarterly basis, and no less frequently than annually for all others, or when circumstances change and warrant a modification to a previous estimate. We record adjustments to contract loss provisions in earnings when identified.
Income Taxes. The future tax benefit arising from net deductible temporary differences and tax carryforwards is $3.8 billion at December 31, 2009 and $5.2 billion at December 31, 2008. Management believes that our earnings during the periods when the temporary differences become deductible will be sufficient to
18
realize the related future income tax benefits. For those jurisdictions where the expiration date of tax carryforwards or the projected operating results indicate that realization is not likely, a valuation allowance is provided.
In assessing the need for a valuation allowance, we estimate future taxable income, considering the feasibility of ongoing tax planning strategies and the realizability of tax loss carryforwards. Valuation allowances related to deferred tax assets can be affected by changes to tax laws, changes to statutory tax rates and future taxable income levels. In the event we were to determine that we would not be able to realize all or a portion of our deferred tax assets in the future, we would reduce such amounts through an increase to tax expense in the period in which that determination is made or when tax law changes are enacted. Conversely, if we were to determine that we would be able to realize our deferred tax assets in the future in excess of the net carrying amounts, we would decrease the recorded valuation allowance through a decrease to tax expense in the period in which that determination is made. Effective with our January 1, 2009 adoption of the provisions of the Business Combinations Topic of the FASB ASC, adjustments for valuation allowances on deferred taxes and acquired tax contingencies associated with a business combination will generally affect income tax expense as opposed to being recorded as an adjustment to goodwill.
In the ordinary course of business there is inherent uncertainty in quantifying our income tax positions. We assess our income tax positions and record tax benefits for all years subject to examination based upon management’s evaluation of the facts, circumstances and information available at the reporting date. For those tax positions where it is more likely than not that a tax benefit will be sustained, we have recorded the largest amount of tax benefit with a greater than 50% likelihood of being realized upon ultimate settlement with a taxing authority that has full knowledge of all relevant information. For those income tax positions where it is not more likely than not that a tax benefit will be sustained, no tax benefit has been recognized in the financial statements. See Notes 1 and 10 to the Consolidated Financial Statements for further discussion.
Goodwill and Intangible Assets. Our investments in businesses in 2009 totaled $703 million, of which there was no debt assumed. The assets and liabilities of acquired businesses are recorded under the purchase method of accounting at their estimated fair values at the dates of acquisition. Goodwill represents costs in excess of fair values assigned to the underlying net assets of acquired businesses. Intangible assets consist of service portfolios, patents and trademarks, customer relationships and other intangible assets.
Goodwill and intangible assets deemed to have indefinite lives are not amortized, but are subject to annual impairment testing. This testing compares carrying values to fair values and, when appropriate, the carrying value of these assets is reduced to fair value. The identification and measurement of goodwill impairment involves the estimation of the fair value of reporting units. The estimates of fair value of reporting units are based on the best information available as of the date of the assessment, which primarily incorporates management assumptions about expected future cash flows and contemplates other valuation techniques. Future cash flows can be affected by changes in industry or market conditions or the rate and extent to which anticipated synergies or cost savings are realized with newly acquired entities. We completed our assessment of goodwill as of July 1, 2009 and determined that no impairment existed at that date. Although no significant goodwill impairment has been recorded to date, there can be no assurances that future goodwill impairments will not occur. However, a 10% decrease in the estimated fair value of any of our reporting units at the date of our 2009 assessment would not have resulted in a goodwill impairment charge. See Note 2 to the Consolidated Financial Statements for further discussion.
Product Performance. We extend performance and operating cost guarantees beyond our normal service and warranty policies for extended periods on some of our products, particularly commercial aircraft engines. Liability under such guarantees is based upon future product performance and durability. In addition, we incur discretionary costs to service our products in connection with product performance issues. We accrue for such costs that are probable and can be reasonably estimated. The costs associated with these product performance and operating cost guarantees require estimates over the full terms of the agreements, and require management to consider factors such as the extent of future maintenance requirements and the future cost of material and labor to perform the services. These cost estimates are largely based upon historical experience. See Note 14 to the Consolidated Financial Statements for further discussion.
Contracting with the U.S. Government. Our contracts with the U.S. government are subject to government oversight and audit. Like many defense contractors, we have received audit reports, which recommend that certain contract prices should be reduced to comply with various government regulations. Some of these audit reports have involved substantial amounts. We have made voluntary refunds in those cases we believe appropriate, have settled some allegations and continue to litigate certain cases. In addition, we accrue for liabilities associated with those government contracting matters that are probable and can be reasonably estimated. The inherent uncertainty related to the outcome of these matters can result in amounts materially different from any provisions made with respect to their resolution. See Note 16 to
19
the Consolidated Financial Statements for further discussion. We recorded sales to the U.S. government of $9.3 billion, $8.0 billion, and $7.5 billion in 2009, 2008, and 2007, respectively.
Employee Benefit Plans. We sponsor domestic and foreign defined benefit pension and other postretirement plans. Major assumptions used in the accounting for these employee benefit plans include the discount rate, expected return on plan assets, rate of increase in employee compensation levels, and health care cost increase projections. Assumptions are determined based on company data and appropriate market indicators, and are evaluated each year at December 31. A change in any of these assumptions would have an effect on net periodic pension and postretirement benefit costs reported in the Consolidated Financial Statements.
In the following table, we show the sensitivity of our pension and other postretirement benefit plan liabilities and net periodic cost to a 25 basis point change in the discount rate as of December 31, 2009.
| (in millions of dollars) | Change in Discount Rate Increase by 25 bps | Change in Discount Rate Decrease by 25 bps | |||||||
Pension plans | |||||||||
Projected benefit obligation | $ | (638 | ) | $ | 660 | ||||
Net periodic pension cost | (64 | ) | 66 | ||||||
Other postretirement benefit plans | |||||||||
Accumulated postretirement benefit obligation | (13 | ) | 14 | ||||||
Net periodic postretirement benefit cost | — | — | |||||||
Pension expense is also sensitive to changes in the expected long-term rate of asset return. An increase or decrease of 25 basis points in the expected long-term rate of asset return would have decreased or increased 2009 pension expense by approximately $50 million.
The weighted-average discount rate used to measure pension liabilities and costs is set by reference to UTC specific analysis using each plan’s specific cash flows and then compared to high-quality bond indices for reasonableness. Global market interest rates have decreased in 2009 as compared with 2008 and, as a result, the weighted-average discount rate used to measure pension liabilities decreased from 6.1% in 2008 to 5.9% in 2009. In December 2009, we amended the salaried retirement plans (qualified and non-qualified) to change the retirement formula effective January 1, 2015. At that time, final average earnings (FAE) and credited service will stop under the formula applicable for hires before July 1, 2002. Employees hired after 2009 will not be eligible for any defined benefit pension plan and will instead receive an enhanced benefit under the UTC Savings Plan. As a result of the change in discount rate, FAE amendment, additional 2009 funding
and positive asset returns generated in 2009, pension expense in 2010 is expected to be slightly lower than 2009 levels. See Note 11 to the Consolidated Financial Statements for further discussion.
Inventory Valuation Reserves. Inventory valuation reserves are established in order to report inventories at the lower of cost or market value on our Consolidated Balance Sheet. The determination of inventory valuation reserves requires management to make estimates and judgments on the future salability of inventories. Valuation reserves for excess, obsolete, and slow-moving inventory are estimated by comparing the inventory levels of individual parts to both future sales forecasts or production requirements and historical usage rates in order to identify inventory where the resale value or replacement value is less than inventoriable cost. Other factors that management considers in determining these reserves include whether individual inventory parts meet current specifications and cannot be substituted for a part currently being sold or used as a service part, overall market conditions, and other inventory management initiatives.
As of December 31, 2009 and 2008 we had $683 million and $497 million, respectively, of inventory valuation reserves recorded. Although management believes these reserves are adequate, any abrupt changes in market conditions may require us to record additional inventory valuation reserves.
Off-Balance Sheet Arrangements and Contractual Obligations
We extend a variety of financial guarantees to third parties in support of unconsolidated affiliates and for potential financing requirements of commercial aerospace customers. We also have obligations arising from sales of certain businesses and assets, including representations and warranties and related indemnities for environmental, health and safety, tax and employment matters. Circumstances that could cause the contingent obligations and liabilities arising from these arrangements to come to fruition are changes in an underlying transaction (e.g., hazardous waste discoveries, etc.), nonperformance under a contract, customer requests for financing, or deterioration in the financial condition of the guaranteed party.
A summary of our consolidated contractual obligations and commitments as of December 31, 2009 is as follows:
| Payments Due by Period | |||||||||||||||||||||
| (in millions of dollars) | Total | Less than 1 Year | 1-3 Years | 3-5 Years | More than 5 Years | ||||||||||||||||
Long-term debt * | $ | 9,490 | $ | 1,233 | $ | 1,082 | $ | 8 | $ | 7,167 | |||||||||||
Operating leases | 1,571 | 420 | 568 | 258 | 325 | ||||||||||||||||
Purchase obligations | 12,854 | 7,885 | 3,827 | 1,069 | 73 | ||||||||||||||||
Other long-term liabilities | 5,742 | 1,274 | 1,606 | 1,605 | 1,257 | ||||||||||||||||
Total contractual obligations | $ | 29,657 | $ | 10,812 | $ | 7,083 | $ | 2,940 | $ | 8,822 | |||||||||||
| * | Principal only; excludes associated interest payments |
20
Purchase obligations include amounts committed under legally enforceable contracts or purchase orders for goods and services with defined terms as to price, quantity, delivery and termination liability. Approximately 31% of the purchase obligations disclosed above represent purchase orders for products to be delivered under firm contracts with the U.S. government for which we have full recourse under normal contract termination clauses.
Other long-term liabilities primarily include those amounts on our December 31, 2009 balance sheet representing obligations under product service and warranty policies, performance and operating cost guarantees, estimated environmental remediation costs and expected contributions under employee benefit programs. The timing of expected cash flows associated with these obligations is based upon management’s estimates over the terms of these agreements and is largely based upon historical experience.
The above table does not reflect unrecognized tax benefits of $793 million, the timing of which is uncertain, except for approximately $40 million that may become payable during 2010. Refer to Note 10 to the Consolidated Financial Statements for additional discussion on unrecognized tax benefits. In addition, the above table does not include approximately $600 million of expected contributions to our global pension plans in 2010, including approximately $400 million to our domestic plans.
Commercial Commitments
| Amount of Commitment Expiration per Period | |||||||||||||||||||||
| (in millions of dollars) | Committed | Less than 1 Year | 1-3 Years | 3-5 Years | More than 5 Years | ||||||||||||||||
Commercial aerospace financing and rental commitments | $ | 909 | $ | 116 | $ | 129 | $ | 13 | $ | 651 | |||||||||||
IAE financing arrangements | 1,186 | 247 | 499 | 127 | 313 | ||||||||||||||||
Unconsolidated subsidiary debt guarantees | 243 | 160 | 8 | — | 75 | ||||||||||||||||
Commercial aerospace financing arrangements | 320 | 1 | 73 | 10 | 236 | ||||||||||||||||
Commercial customer financing arrangements | 229 | 229 | — | — | — | ||||||||||||||||
Performance guarantees | 39 | 33 | 6 | — | — | ||||||||||||||||
Total commercial | $ | 2,926 | $ | 786 | $ | 715 | $ | 150 | $ | 1,275 | |||||||||||
Refer to Notes 4, 14, and 16 to the Consolidated Financial Statements for additional discussion on contractual and commercial commitments.
Market Risk and Risk Management
We are exposed to fluctuations in foreign currency exchange rates, interest rates and commodity prices. To manage certain of those exposures, we use derivative instruments, including swaps, forward contracts and options. Derivative instruments utilized by us in our hedging activities are viewed as risk management tools,
involve little complexity and are not used for trading or speculative purposes. We diversify the counterparties used and monitor the concentration of risk to limit our counterparty exposure.
We have evaluated our exposure to changes in foreign currency exchange rates, interest rates and commodity prices in our market risk sensitive instruments, which are primarily cash, debt and derivative instruments, using a value at risk analysis. Based on a 95% confidence level and a one-day holding period, at December 31, 2009, the potential loss in fair value on our market risk sensitive instruments was not material in relation to our financial position, results of operations or cash flows. Our calculated value at risk exposure represents an estimate of reasonably possible net losses based on volatilities and correlations and is not necessarily indicative of actual results. Refer to Notes 1, 8 and 13 to the Consolidated Financial Statements for additional discussion of foreign currency exchange, interest rates and financial instruments.
Foreign Currency Exposures. We have a large volume of foreign currency exposures that result from our international sales, purchases, investments, borrowings and other international transactions. International segment revenues, including U.S. export sales, averaged approximately $34 billion over the last three years. We actively manage foreign currency exposures that are associated with committed foreign currency purchases and sales and other assets and liabilities created in the normal course of business at the operating unit level. More than insignificant exposures that cannot be naturally offset within an operating unit are hedged with foreign currency derivatives. We also have a significant amount of foreign currency net asset exposures. Currently, we do not hold any derivative contracts that hedge our foreign currency net asset exposures but may consider such strategies in the future.
Within aerospace, our revenues are typically denominated in U.S. dollars under accepted industry convention. However, for our non-U.S. based entities, such as P&WC, a substantial portion of their costs are incurred in local currencies. Consequently, there is a foreign currency exchange impact and risk to operational results as U.S. dollars must be converted to local currencies such as the Canadian dollar in order to meet local currency cost obligations. In order to minimize the exposure that exists from changes in the exchange rate of the U.S. dollar against these other currencies, we hedge a certain portion of revenues to secure the rates at which U.S. dollars will be converted. The majority of this hedging activity occurs at P&WC. At P&WC, firm and forecasted sales for both engines and spare parts are hedged at varying amounts up to 24 months on the U.S. dollar revenue exposure as represented by the excess of U.S. dollar revenues over U.S. dollar denominated purchases. Hedging gains and losses resulting from movements in foreign currency exchange rates are partially offset
21
by the foreign currency translation impacts that are generated on the translation of local currency operating results into U.S. dollars for reporting purposes. While the objective of the hedging program is to minimize the foreign currency exchange impact on operating results, there are typically variances between the hedging gains or losses and the translational impact due to the length of hedging contracts, changes in the revenue profile, volatility in the exchange rates and other such operational considerations.
Interest Rate Exposures. Our long-term debt portfolio consists mostly of fixed-rate instruments. From time to time, we may hedge to floating rates using interest rate swaps. The hedges are designated as fair value hedges and the gains and losses on the swaps are reported in interest expense, reflecting that portion of interest expense at a variable rate. We issue commercial paper, which exposes us to changes in interest rates. Currently, we do not hold any derivative contracts that hedge our interest exposures, but may consider such strategies in the future.
Commodity Price Exposures. We are exposed to volatility in the prices of raw materials used in some of our products and from time to time we may use forward contracts in limited circumstances to manage some of those exposures. In the future, if hedges are used, gains and losses may affect earnings. There were no significant outstanding commodity hedges as of December 31, 2009.
Environmental Matters
Our operations are subject to environmental regulation by federal, state and local authorities in the United States and regulatory authorities with jurisdiction over our foreign operations. As a result, we have established, and continually update, policies relating to environmental standards of performance for our operations worldwide. We believe that expenditures necessary to comply with the present regulations governing environmental protection will not have a material effect upon our competitive position, results of operations, cash flows or financial condition.
We have identified 582 locations, mostly in the United States, at which we may have some liability for remediating contamination. We have resolved our liability at 242 of these locations. We do not believe that any individual location’s exposure will have a material effect on our results of operations. Sites in the investigation, remediation or operation and maintenance stage represent approximately 91% of our accrued environmental liability.
We have been identified as a potentially responsible party under the Comprehensive Environmental Response Compensation and Liability Act (CERCLA or Superfund) at 107 sites. The number of Superfund sites, in and of itself, does not represent a relevant measure of liability because the nature and extent of
environmental concerns vary from site to site and our share of responsibility varies from sole responsibility to very little responsibility. In estimating our liability for remediation, we consider our likely proportionate share of the anticipated remediation expense and the ability of other potentially responsible parties to fulfill their obligations.
At December 31, 2009, we had $539 million reserved for environmental remediation. Cash outflows for environmental remediation were $49 million in 2009 and $46 million in both 2008 and 2007. We estimate that ongoing environmental remediation expenditures in each of the next two years will not exceed approximately $70 million.
Government Matters
As described in the “Critical Accounting Estimates – Contracting with the U.S. government,” our contracts with the U.S. government are subject to audits. Such audits may recommend that certain contract prices should be reduced to comply with various government regulations. We are also the subject of one or more investigations and legal proceedings initiated by the U.S. government with respect to government contract matters.
As previously disclosed, the Department of Justice (DOJ) sued us in 1999 in the U.S. District Court for the Southern District of Ohio, claiming that Pratt & Whitney violated the civil False Claims Act and common law. This lawsuit relates to the “Fighter Engine Competition” between Pratt & Whitney’s F100 engine and General Electric’s F110 engine. The DOJ alleges that the government overpaid for F100 engines under contracts awarded by the U.S. Air Force in fiscal years 1985 through 1990 because Pratt & Whitney inflated its estimated costs for some purchased parts and withheld data that would have revealed the overstatements. At trial of this matter, completed in December 2004, the government claimed Pratt & Whitney’s liability to be $624 million. On August 1, 2008, the trial court judge held that the Air Force had not suffered any actual damages because Pratt & Whitney had made significant price concessions. However, the trial court judge found that Pratt & Whitney violated the False Claims Act due to inaccurate statements contained in the 1983 offer. In the absence of actual damages, the trial court judge awarded the DOJ the maximum civil penalty of $7.09 million, or $10,000 for each of the 709 invoices Pratt & Whitney submitted in 1989 and later under the contracts. Both the DOJ and UTC have appealed the decision. Should the government ultimately prevail, the outcome of this matter could result in a material effect on our results of operations in the period in which a liability would be recognized or cash flows for the period in which damages would be paid.
In December 2008, the Department of Defense (DOD) issued a contract claim against Sikorsky to recover overpayments the DOD
22
alleges it has incurred since January 2003 in connection with cost accounting changes approved by the DOD and implemented by Sikorsky in 1999 and 2006. These changes relate to the calculation of material overhead rates in government contracts. The DOD claims that Sikorsky’s liability is approximately $83 million (including interest through December 2009). We believe this claim is without merit and Sikorsky filed an appeal in December 2009 with the U.S. Court of Federal Claims.
Except as otherwise noted above, we do not believe that resolution of any of these matters will have a material adverse effect upon our competitive position, results of operations, cash flows or financial condition.
Other Matters
Additional discussion of our environmental, U.S. government contract matters, product performance and other contingent liabilities is included in “Critical Accounting Estimates” and Notes 1, 14 and 16 to the Consolidated Financial Statements. For additional discussion of our legal proceedings, see Item 3, “Legal Proceedings,” in our Annual Report on Form 10-K for 2009 (2009 Form 10-K).
New Accounting Pronouncements
In October 2009, the FASB issued ASU No. 2009-13, “Multiple-Deliverable Revenue Arrangements.” This ASU establishes the accounting and reporting guidance for arrangements including multiple revenue-generating activities. This ASU provides amendments to the criteria for separating deliverables, measuring and allocating arrangement consideration to one or more units of accounting. The amendments in this ASU also establish a selling price hierarchy for determining the selling price of a deliverable. Significantly enhanced disclosures are also required to provide information about a vendor’s multiple-deliverable revenue arrangements, including information about the nature and terms, significant deliverables, and its performance within arrangements. The amendments also require providing information about the significant judgments made and changes to those judgments and about how the application of the relative selling-price method affects the timing or amount of revenue recognition. The amendments in this ASU are effective prospectively for revenue arrangements entered into or materially modified in the fiscal years beginning on or after June 15, 2010. Early application is permitted. We are currently evaluating this new ASU.
In October 2009, the FASB issued ASU No. 2009-14, “Certain Revenue Arrangements That Include Software Elements.” This ASU changes the accounting model for revenue arrangements that include both tangible products and software elements that are “essential to the functionality,” and scopes these products out of current software revenue guidance. The new guidance will include factors to help companies determine what software elements are considered “essential to the functionality.” The
amendments will now subject software-enabled products to other revenue guidance and disclosure requirements, such as guidance surrounding revenue arrangements with multiple-deliverables. The amendments in this ASU are effective prospectively for revenue arrangements entered into or materially modified in the fiscal years beginning on or after June 15, 2010. Early application is permitted. We are currently evaluating this new ASU.
In December 2009, the FASB issued ASU No. 2009-16, “Accounting for Transfers of Financial Assets.” This ASU incorporates SFAS No. 166, “Accounting for Transfers of Financial Assets – an amendment of FASB Statement No. 140” (SFAS 166), issued by the FASB in June 2009, within the FASB ASC. This ASU removes the concept of a qualifying special-purpose entity and establishes a new “participating interest” definition that must be met for transfers of portions of financial assets to be eligible for sale accounting, clarifies and amends the derecognition criteria for a transfer to be accounted for as a sale, and changes the amount that can be recognized as a gain or loss on a transfer accounted for as a sale when beneficial interests are received by the transferor. Enhanced disclosures are also required to provide information about transfers of financial assets and a transferor’s continuing involvement with transferred financial assets. This ASU must be applied as of the beginning of an entity’s first annual reporting period that begins after November 15, 2009, for interim periods within that first annual reporting period, and for interim and annual reporting periods thereafter. Earlier application is prohibited. We have evaluated this new ASU and have determined that there are no significant impacts to our financial position or results of operations.
In December 2009, the FASB issued ASU No. 2009-17, “Improvements to Financial Reporting by Enterprises Involved with Variable Interest Entities.” This ASU incorporates SFAS No. 167, “Amendments to FASB Interpretation No. 46(R)” (SFAS 167), issued by the FASB in June 2009, within the FASB ASC. This ASU amends previous accounting related to the Consolidation of Variable Interest Entities to require an enterprise to qualitatively assess the determination of the primary beneficiary of a variable interest entity (VIE) based on whether the entity (1) has the power to direct the activities of a VIE that most significantly impact the entity’s economic performance and (2) has the obligation to absorb losses of the entity or the right to receive benefits from the entity that could potentially be significant to the VIE. Also, this ASU requires an ongoing reconsideration of the primary beneficiary, and amends the events that trigger a reassessment of whether an entity is a VIE. Enhanced disclosures are also required to provide information about an enterprise’s involvement in a VIE. This ASU will be effective as of the beginning of each reporting entity’s first annual reporting period that begins after November 15, 2009, for interim periods within that first annual reporting period, and for interim and annual reporting periods thereafter. Earlier application
23
is prohibited. We have evaluated this new ASU and have determined that our involvement with variable interest entities is not significant and therefore there are no significant impacts to our financial position or results of operations.
Cautionary Note Concerning Factors That May Affect Future Results
This annual report contains statements which, to the extent they are not statements of historical or present fact, constitute “forward-looking statements” under the securities laws. From time to time, oral or written forward-looking statements may also be included in other materials released to the public. These forward-looking statements are intended to provide management’s current expectations or plans for our future operating and financial performance, based on assumptions currently believed to be valid. Forward-looking statements can be identified by the use of words such as “believe,” “expect,” “plans,” “strategy,” “prospects,” “estimate,” “project,” “target,” “anticipate,” “guidance” and other words of similar meaning in connection with a discussion of future operating or financial performance. These include, among others, statements relating to:
| • | future revenues, earnings, cash flow, uses of cash and other measures of financial performance; |
| • | the effect of economic conditions in the United States and globally, including the financial condition of our customers and suppliers; |
| • | new business opportunities; |
| • | restructuring costs and savings; |
| • | the scope, nature or impact of acquisition and divestiture activity including integration of acquired businesses into our existing businesses; |
| • | the development, production and support of advanced technologies and new products and services; |
| • | the anticipated benefits of diversification and balance of operations across product lines, regions and industries; |
| • | the impact of the negotiation of collective bargaining agreements; |
| • | the outcome of contingencies; |
| • | future repurchases of common stock; |
| • | future levels of indebtedness and capital spending; |
| • | future availability of and access to credit markets; |
| • | pension plan assumptions and future contributions; and |
| • | the effect of changes in tax, environmental and other laws and regulations in the United States and other countries in which we operate. |
All forward-looking statements involve risks and uncertainties that may cause actual results to differ materially from those expressed or implied in the forward-looking statements. Our Annual Report
on Form 10-K for 2009 includes important information as to these factors that may cause actual results to vary materially from those stated in the forward-looking statements in the “Business” section under the headings “General,” “Description of Business by Segment” and “Other Matters Relating to Our Business as a Whole,” and in the “Risk Factors” and “Legal Proceedings” sections. For additional information identifying factors that may cause actual results to vary materially from those stated in the forward-looking statements, see our reports on Forms 10-K, 10-Q and 8-K filed with the SEC from time to time.
Management’s Report on Internal Control over Financial Reporting
The management of UTC is responsible for establishing and maintaining adequate internal control over financial reporting. Internal control over financial reporting is a process designed to provide reasonable assurance regarding the reliability of financial reporting and the preparation of financial statements for external reporting purposes in accordance with accounting principles generally accepted in the United States of America. Because of its inherent limitations, internal control over financial reporting may not prevent or detect misstatements. Management has assessed the effectiveness of UTC’s internal control over financial reporting as of December 31, 2009. In making its assessment, management has utilized the criteria set forth by the Committee of Sponsoring Organizations of the Treadway Commission inInternal Control – Integrated Framework. Management concluded that based on its assessment, UTC’s internal control over financial reporting was effective as of December 31, 2009. The effectiveness of UTC’s internal control over financial reporting, as of December 31, 2009, has been audited by PricewaterhouseCoopers LLP, an independent registered public accounting firm, as stated in their report which is included herein.
| /s/ Louis R. Chênevert |
| Louis R. Chênevert |
| Chairman & Chief Executive Officer |
| /s/ Gregory J. Hayes |
| Gregory J. Hayes |
| Senior Vice President and Chief Financial Officer |
| /s/ Margaret M. Smyth |
| Margaret M. Smyth |
| Vice President, Controller |
24
Report of Independent Registered Public Accounting Firm
To the Board of Directors and Shareowners of United Technologies Corporation:
In our opinion, the accompanying consolidated balance sheets and the related consolidated statements of operations, of cash flows and of changes in equity present fairly, in all material respects, the financial position of United Technologies Corporation and its subsidiaries at December 31, 2009 and December 31, 2008, and the results of their operations and their cash flows for each of the three years in the period ended December 31, 2009 in conformity with accounting principles generally accepted in the United States of America. Also in our opinion, the Corporation maintained, in all material respects, effective internal control over financial reporting as of December 31, 2009, based on criteria established inInternal Control—Integrated Framework issued by the Committee of Sponsoring Organizations of the Treadway Commission (COSO). The Corporation’s management is responsible for these financial statements, for maintaining effective internal control over financial reporting and for its assessment of the effectiveness of internal control over financial reporting included in the accompanying Management’s Report on Internal Control Over Financial Reporting. Our responsibility is to express opinions on these financial statements and on the Corporation’s internal control over financial reporting based on our integrated audits. We conducted our audits in accordance with the standards of the Public Company Accounting Oversight Board (United States). Those standards require that we plan and perform the audits to obtain reasonable assurance about whether the financial statements are free of material misstatement and whether effective internal control over financial reporting was maintained in all material respects. Our audits of the financial statements included examining, on a test basis, evidence supporting the amounts and disclosures in the financial statements, assessing the accounting principles used and significant estimates made by management, and evaluating the overall financial statement presentation. Our audit of internal control over financial reporting included obtaining an understanding of internal control over financial reporting, assessing the risk that a material weakness exists, and testing and evaluating the design and operating effectiveness of internal control based on the assessed risk. Our audits also included performing such other procedures as we considered necessary in the circumstances. We believe that our audits provide a reasonable basis for our opinions.
As discussed in the Notes to the consolidated financial statements, the Corporation changed the manner in which it accounts for defined benefit pension and other postretirement plans and uncertain tax positions in 2007. As discussed in the Notes to the consolidated financial statements, the Corporation
changed the manner in which it discloses fair value, the manner in which it accounts for business combinations, noncontrolling interests and collaborative arrangements, and the manner in which it provides disclosures about derivative and hedging activities, subsequent events, and fair value of financial instruments in 2009.
A corporation’s internal control over financial reporting is a process designed to provide reasonable assurance regarding the reliability of financial reporting and the preparation of financial statements for external purposes in accordance with generally accepted accounting principles. A corporation’s internal control over financial reporting includes those policies and procedures that (i) pertain to the maintenance of records that, in reasonable detail, accurately and fairly reflect the transactions and dispositions of the assets of the corporation; (ii) provide reasonable assurance that transactions are recorded as necessary to permit preparation of financial statements in accordance with generally accepted accounting principles, and that receipts and expenditures of the corporation are being made only in accordance with authorizations of management and directors of the corporation; and (iii) provide reasonable assurance regarding prevention or timely detection of unauthorized acquisition, use, or disposition of the corporation’s assets that could have a material effect on the financial statements.
Because of its inherent limitations, internal control over financial reporting may not prevent or detect misstatements. Also, projections of any evaluation of effectiveness to future periods are subject to the risk that controls may become inadequate because of changes in conditions, or that the degree of compliance with the policies or procedures may deteriorate.
/s/ PricewaterhouseCoopers LLP
Hartford, Connecticut
February 11, 2010
25
Consolidated Statement of Operations
| (in millions of dollars, except per share amounts) | 2009 | 2008 | 2007 | ||||||||
Revenues: | |||||||||||
Product sales | $ | 37,332 | $ | 43,234 | $ | 40,182 | |||||
Service sales | 15,093 | 15,885 | 14,694 | ||||||||
Other income, net | 495 | 638 | 840 | ||||||||
| 52,920 | 59,757 | 55,716 | |||||||||
Costs and Expenses: | |||||||||||
Cost of products sold | 28,905 | 32,833 | 30,869 | ||||||||
Cost of services sold | 9,956 | 10,804 | 10,010 | ||||||||
Research and development | 1,558 | 1,771 | 1,678 | ||||||||
Selling, general and administrative | 6,036 | 6,724 | 6,109 | ||||||||
Operating profit | 6,465 | 7,625 | 7,050 | ||||||||
Interest | 705 | 689 | 666 | ||||||||
Income before income taxes | 5,760 | 6,936 | 6,384 | ||||||||
Income tax expense | 1,581 | 1,883 | 1,836 | ||||||||
Net income | 4,179 | 5,053 | 4,548 | ||||||||
Less: Noncontrolling interest in subsidiaries’ earnings | 350 | 364 | 324 | ||||||||
Net income attributable to common shareowners | $ | 3,829 | $ | 4,689 | $ | 4,224 | |||||
Earnings per share of common stock | |||||||||||
Basic | $ | 4.17 | $ | 5.00 | $ | 4.38 | |||||
Diluted | $ | 4.12 | $ | 4.90 | $ | 4.27 | |||||
Dividends per share of common stock | $ | 1.54 | $ | 1.35 | $ | 1.17 | |||||
Average number of shares outstanding: | |||||||||||
Basic shares | 917 | 938 | 964 | ||||||||
Diluted shares | 929 | 956 | 989 | ||||||||
See accompanying Notes to Consolidated Financial Statements
26
| (in millions of dollars, except per share amounts – shares in thousands) | 2009 | 2008 | ||||||
Assets | ||||||||
Cash and cash equivalents | $ | 4,449 | $ | 4,327 | ||||
Accounts receivable (net of allowance for doubtful accounts of $390 and $332) | 8,469 | 9,480 | ||||||
Inventories and contracts in progress, net | 7,509 | 8,340 | ||||||
Future income tax benefits, current | 1,689 | 1,551 | ||||||
Other assets, current | 1,078 | 769 | ||||||
Total Current Assets | 23,194 | 24,467 | ||||||
Customer financing assets | 1,047 | 1,002 | ||||||
Future income tax benefits | 2,102 | 3,633 | ||||||
Fixed assets, net | 6,364 | 6,348 | ||||||
Goodwill | 16,298 | 15,363 | ||||||
Intangible assets | 3,538 | 3,443 | ||||||
Other assets | 3,219 | 2,581 | ||||||
Total Assets | $ | 55,762 | $ | 56,837 | ||||
Liabilities and Equity | ||||||||
Short-term borrowings | $ | 254 | $ | 1,023 | ||||
Accounts payable | 4,634 | 5,594 | ||||||
Accrued liabilities | 11,792 | 12,069 | ||||||
Long-term debt currently due | 1,233 | 1,116 | ||||||
Total Current Liabilities | 17,913 | 19,802 | ||||||
Long-term debt | 8,257 | 9,337 | ||||||
Future pension and postretirement benefit obligations | 4,150 | 6,574 | ||||||
Other long-term liabilities | 4,054 | 4,198 | ||||||
Total Liabilities | 34,374 | 39,911 | ||||||
Commitments and contingent liabilities (Notes 4 and 16) | ||||||||
Redeemable noncontrolling interest | 389 | 245 | ||||||
Shareowners’ Equity: | ||||||||
Capital Stock: | ||||||||
Preferred Stock, $1 par value; 250,000 shares authorized; None issued or outstanding | — | — | ||||||
Common Stock, $1 par value; 4,000,000 shares authorized; 1,381,700 and 1,370,054 shares issued | 11,746 | 11,179 | ||||||
Treasury Stock - 444,958 and 426,113 common shares at cost | (15,408 | ) | (14,316 | ) | ||||
Retained earnings | 27,396 | 25,034 | ||||||
Unearned ESOP shares | (181 | ) | (200 | ) | ||||
Accumulated other comprehensive income (loss): | ||||||||
Foreign currency translation | 379 | (641 | ) | |||||
Other | (3,866 | ) | (5,293 | ) | ||||
Total Accumulated other comprehensive loss | (3,487 | ) | (5,934 | ) | ||||
Total Shareowners’ Equity | 20,066 | 15,763 | ||||||
Noncontrolling interest | 933 | 918 | ||||||
Total Equity | 20,999 | 16,681 | ||||||
Total Liabilities and Equity | $ | 55,762 | $ | 56,837 | ||||
See accompanying Notes to Consolidated Financial Statements
27
Consolidated Statement of Cash Flows
| (in millions of dollars) | 2009 | 2008 | 2007 | |||||||||
Operating Activities: | ||||||||||||
Net income attributable to common shareowners | $ | 3,829 | $ | 4,689 | $ | 4,224 | ||||||
Noncontrolling interest in subsidiaries’ earnings | 350 | 364 | 324 | |||||||||
Net income | 4,179 | 5,053 | 4,548 | |||||||||
Adjustments to reconcile net income to net cash flows provided by operating activities: | ||||||||||||
Depreciation and amortization | 1,258 | 1,321 | 1,173 | |||||||||
Deferred income tax provision | 451 | 45 | 58 | |||||||||
Stock compensation cost | 153 | 211 | 198 | |||||||||
Change in: | ||||||||||||
Accounts receivable | 955 | (546 | ) | (534 | ) | |||||||
Inventories and contracts in progress | 695 | (562 | ) | (1,111 | ) | |||||||
Other current assets | (3 | ) | 35 | 44 | ||||||||
Accounts payable and accrued liabilities | (582 | ) | 843 | 1,633 | ||||||||
Global pension contributions | (1,270 | ) | (193 | ) | (182 | ) | ||||||
Other operating activities, net | (483 | ) | (46 | ) | (497 | ) | ||||||
Net cash flows provided by operating activities | 5,353 | 6,161 | 5,330 | |||||||||
Investing Activities: | ||||||||||||
Capital expenditures | (826 | ) | (1,216 | ) | (1,153 | ) | ||||||
Increase in customer financing assets | (171 | ) | (285 | ) | (411 | ) | ||||||
Decrease in customer financing assets | 80 | 138 | 272 | |||||||||
Investments in businesses | (703 | ) | (1,252 | ) | (2,037 | ) | ||||||
Dispositions of businesses | 158 | 337 | 298 | |||||||||
Other investing activities, net | 358 | (58 | ) | (151 | ) | |||||||
Net cash flows used in investing activities | (1,104 | ) | (2,336 | ) | (3,182 | ) | ||||||
Financing Activities: | ||||||||||||
Issuance of long-term debt | 37 | 2,248 | 1,032 | |||||||||
Repayment of long-term debt | (1,012 | ) | (48 | ) | (330 | ) | ||||||
(Decrease) increase in short-term borrowings, net | (762 | ) | 91 | 191 | ||||||||
Common Stock issued under employee stock plans | 342 | 163 | 415 | |||||||||
Dividends paid on Common Stock | (1,356 | ) | (1,210 | ) | (1,080 | ) | ||||||
Repurchase of Common Stock | (1,100 | ) | (3,160 | ) | (2,001 | ) | ||||||
Other financing activities, net | (340 | ) | (322 | ) | (182 | ) | ||||||
Net cash flows used in financing activities | (4,191 | ) | (2,238 | ) | (1,955 | ) | ||||||
Effect of foreign exchange rate changes on cash and cash equivalents | 64 | (164 | ) | 165 | ||||||||
Net increase in cash and cash equivalents | 122 | 1,423 | 358 | |||||||||
Cash and cash equivalents, beginning of year | 4,327 | 2,904 | 2,546 | |||||||||
Cash and cash equivalents, end of year | $ | 4,449 | $ | 4,327 | $ | 2,904 | ||||||
Supplemental Disclosure of Cash Flow Information: | ||||||||||||
Interest paid, net of amounts capitalized | $ | 704 | $ | 659 | $ | 629 | ||||||
Income taxes paid, net of refunds | $ | 1,396 | $ | 1,912 | $ | 1,818 | ||||||
Non-cash investing and financing activities include: | ||||||||||||
Contributions of UTC Common Stock to domestic defined benefit pension plans of $0, $250 and | ||||||||||||
See accompanying Notes to Consolidated Financial Statements
28
Consolidated Statement of Changes in Equity
| (in millions of dollars) | Common Stock |
Treasury Stock | ||||||
Balance at December 31, 2006 | $ | 9,622 | $ | (9,413 | ) | |||
Effect of changing pension plan measurement date, net of taxes of $193 (Note 11) | ||||||||
Adoption of accounting for uncertainty in income taxes (Note 10) | ||||||||
Adoption of accounting for redeemable noncontrolling interests (Note 9) | ||||||||
Opening balance at January 1, 2007, as adjusted | $ | 9,622 | $ | (9,413 | ) | |||
Comprehensive income (loss): | ||||||||
Net income | ||||||||
Redeemable noncontrolling interest in subsidiaries earnings | ||||||||
Other comprehensive income (loss), net of tax: | ||||||||
Foreign currency translation adjustments | ||||||||
Change in pension and post-retirement benefit plans, net of income taxes of $419 | ||||||||
Adjustment for sale of securities, net of tax benefit of $50 | ||||||||
Unrealized cash flow hedging gain, net of income taxes of $58 | ||||||||
Total other comprehensive income, net of tax | ||||||||
Comprehensive income | ||||||||
Common Stock issued under employee plans (13.8 million shares), net of tax benefit of $130 | 863 | 13 | ||||||
Common Stock contributed to defined benefit pension plans (2.3 million shares) | 87 | 63 | ||||||
Common Stock repurchased (28.3 million shares) | (2,001 | ) | ||||||
Dividends on Common Stock | ||||||||
Dividends on ESOP Common Stock | ||||||||
Dividends attributable to noncontrolling interest | ||||||||
Redeemable noncontrolling interest accretion | ||||||||
Other changes in noncontrolling interest | ||||||||
Balance at December 31, 2007 | $ | 10,572 | $ | (11,338 | ) | |||
Comprehensive income (loss): | ||||||||
Net income | ||||||||
Redeemable noncontrolling interest in subsidiaries earnings | ||||||||
Other comprehensive income (loss), net of tax: | ||||||||
Foreign currency translation adjustments | ||||||||
Change in pension and post-retirement benefit plans, net of tax benefit of $2,512 | ||||||||
Adjustment for sale of securities, net of tax benefit of $41 | ||||||||
Unrealized cash flow hedging loss, net of tax benefit of $127 | ||||||||
Total other comprehensive income (loss), net of tax | ||||||||
Comprehensive income (loss) | ||||||||
Common Stock issued under employee plans (5.7 million shares), net of tax benefit of $32 | 525 | 14 | ||||||
Common Stock contributed to defined benefit pension plans (5.0 million shares) | 82 | 168 | ||||||
Common Stock repurchased (50.4 million shares) | (3,160 | ) | ||||||
Dividends on Common Stock | ||||||||
Dividends on ESOP Common Stock | ||||||||
Dividends attributable to noncontrolling interest | ||||||||
Redeemable noncontrolling interest accretion | ||||||||
Other changes in noncontrolling interest | ||||||||
Balance at December 31, 2008 | $ | 11,179 | $ | (14,316 | ) | |||
Comprehensive income (loss): | ||||||||
Net income | ||||||||
Redeemable noncontrolling interest in subsidiaries earnings | ||||||||
Other comprehensive income (loss), net of tax: | ||||||||
Foreign currency translation adjustments | ||||||||
Change in pension and post-retirement benefit plans, net of income taxes of $569 | ||||||||
Adjustment for sale of securities, net of income taxes of $66 | ||||||||
Unrealized cash flow hedging gain, net of income taxes of $106 | ||||||||
Total other comprehensive income (loss), net of tax | ||||||||
Comprehensive income (loss) | ||||||||
Common Stock issued under employee plans (11.9 million shares), net of tax benefit of $50 | 634 | 8 | ||||||
Common Stock repurchased (19.1 million shares) | (1,100 | ) | ||||||
Dividends on Common Stock | ||||||||
Dividends on ESOP Common Stock | ||||||||
Dividends attributable to noncontrolling interest | ||||||||
Redeemable noncontrolling interest accretion | ||||||||
Purchase of subsidiary shares in noncontrolling interest | (67 | ) | ||||||
Acquired noncontrolling interest | ||||||||
Other changes in noncontrolling interest | ||||||||
Balance at December 31, 2009 | $ | 11,746 | $ | (15,408 | ) | |||
See accompanying Notes to Consolidated Financial Statements
29
| Shareowners’ Equity | ||||||||||||||||||||||
| Retained Earnings | Unearned ESOP Shares | Accumulated Other Comprehensive Income (Loss) | Noncontrolling Interest | Total Equity | Redeemable Noncontrolling Interest | |||||||||||||||||
| $ | 18,754 | $ | (227 | ) | $ | (1,439 | ) | $ | 755 | $ | 18,052 | $ | 81 | |||||||||
| (45 | ) | 470 | 425 | |||||||||||||||||||
| (19 | ) | (19 | ) | |||||||||||||||||||
| (114 | ) | (114 | ) | $ | 114 | |||||||||||||||||
| $ | 18,576 | $ | (227 | ) | $ | (969 | ) | $ | 755 | $ | 18,344 | $ | 195 | |||||||||
| 4,224 | 324 | 4,548 | ||||||||||||||||||||
| (14 | ) | (14 | ) | 14 | ||||||||||||||||||
| 716 | 44 | 760 | 10 | |||||||||||||||||||
| 776 | 776 | |||||||||||||||||||||
| (84 | ) | (84 | ) | |||||||||||||||||||
| 139 | 139 | |||||||||||||||||||||
| 1,591 | ||||||||||||||||||||||
| 6,125 | ||||||||||||||||||||||
| (36 | ) | 13 | 853 | |||||||||||||||||||
| 150 | ||||||||||||||||||||||
| (2,001 | ) | |||||||||||||||||||||
| (1,080 | ) | (1,080 | ) | |||||||||||||||||||
| (47 | ) | (47 | ) | |||||||||||||||||||
| (246 | ) | (246 | ) | (23 | ) | |||||||||||||||||
| (6 | ) | (6 | ) | 6 | ||||||||||||||||||
| (28 | ) | (28 | ) | 1 | ||||||||||||||||||
| $ | 21,631 | $ | (214 | ) | $ | 578 | $ | 835 | $ | 22,064 | $ | 203 | ||||||||||
| 4,689 | 364 | 5,053 | ||||||||||||||||||||
| (19 | ) | (19 | ) | 19 | ||||||||||||||||||
| (1,990 | ) | 1 | (1,989 | ) | 38 | |||||||||||||||||
| (4,153 | ) | (4,153 | ) | |||||||||||||||||||
| (59 | ) | (59 | ) | |||||||||||||||||||
| (310 | ) | (310 | ) | |||||||||||||||||||
| (6,511 | ) | |||||||||||||||||||||
| (1,477 | ) | |||||||||||||||||||||
| (19 | ) | 14 | 534 | |||||||||||||||||||
| 250 | ||||||||||||||||||||||
| (3,160 | ) | |||||||||||||||||||||
| (1,210 | ) | (1,210 | ) | |||||||||||||||||||
| (52 | ) | (52 | ) | |||||||||||||||||||
| (305 | ) | (305 | ) | (20 | ) | |||||||||||||||||
| (5 | ) | (5 | ) | 5 | ||||||||||||||||||
| 42 | 42 | |||||||||||||||||||||
| $ | 25,034 | $ | (200 | ) | $ | (5,934 | ) | $ | 918 | $ | 16,681 | $ | 245 | |||||||||
| 3,829 | 350 | 4,179 | ||||||||||||||||||||
| (17 | ) | (17 | ) | 17 | ||||||||||||||||||
| 1,020 | 8 | 1,028 | (5 | ) | ||||||||||||||||||
| 1,073 | 1,073 | |||||||||||||||||||||
| 99 | 99 | |||||||||||||||||||||
| 255 | 255 | |||||||||||||||||||||
| 2,455 | ||||||||||||||||||||||
| 6,617 | ||||||||||||||||||||||
| (43 | ) | 19 | 618 | |||||||||||||||||||
| (1,100 | ) | |||||||||||||||||||||
| (1,356 | ) | (1,356 | ) | |||||||||||||||||||
| (59 | ) | (59 | ) | |||||||||||||||||||
| (329 | ) | (329 | ) | (17 | ) | |||||||||||||||||
| (9 | ) | (9 | ) | 9 | ||||||||||||||||||
| (25 | ) | (92 | ) | (3 | ) | |||||||||||||||||
| 36 | 36 | 143 | ||||||||||||||||||||
| (8 | ) | (8 | ) | |||||||||||||||||||
| $ | 27,396 | $ | (181 | ) | $ | (3,487 | ) | $ | 933 | $ | 20,999 | $ | 389 | |||||||||
30
Notes to Consolidated Financial Statements
Note 1: Summary of Accounting Principles
The preparation of financial statements requires management to make estimates and assumptions that affect the reported amounts of assets, liabilities, revenues and expenses. Actual results could differ from those estimates. Certain prior year amounts have been reclassified to conform to the current year’s presentation.
Consolidation. The Consolidated Financial Statements include the accounts of UTC and its controlled subsidiaries. Intercompany transactions have been eliminated.
Cash and Cash Equivalents. Cash and cash equivalents includes cash on hand, demand deposits and short-term cash investments that are highly liquid in nature and have original maturities of three months or less.
On occasion, we are required to maintain cash deposits with certain banks in respect to contractual obligations related to acquisitions or divestitures or other legal obligations. As of December 31, 2009 and 2008, the amount of restricted cash was approximately $43 million and $310 million, of which approximately $41 million and $35 million is included in current assets and $2 million and $275 million is included in long-term assets, respectively.
Accounts Receivable. Current and long-term accounts receivable include retainage of $156 million and $154 million and unbilled receivables of $902 million and $852 million as of December 31, 2009 and 2008, respectively.
Retainage represents amounts that, pursuant to the applicable contract, are not due until project completion and acceptance by the customer. Unbilled receivables represent revenues that are not currently billable to the customer under the terms of the contract. These items are expected to be collected in the normal course of business. Long-term accounts receivable are included in other assets in the Consolidated Balance Sheet.
Marketable Equity Securities. Equity securities that have a readily determinable fair value and that we do not intend to trade are classified as available for sale and carried at fair value. Unrealized holding gains and losses are recorded as a separate component of shareowners’ equity, net of deferred income taxes.
Inventories and Contracts in Progress. Inventories and contracts in progress are stated at the lower of cost or estimated realizable value and are primarily based on first-in, first-out (FIFO) or average cost methods; however, certain subsidiaries use the last-in, first-out (LIFO) method. If inventories that were valued using the LIFO method had been valued under the FIFO method, they would have been higher by $147 million and $176 million at December 31, 2009 and 2008, respectively. The year-over-year decline largely results from a decrease in inventories associated with the disposition of certain businesses in our Carrier segment.
Costs accumulated against specific contracts or orders are at actual cost. Inventory in excess of requirements for contracts and current or anticipated orders have been reserved as appropriate. Manufacturing costs are allocated to current production and firm contracts.
Fixed Assets. Fixed assets are stated at cost. Depreciation is computed over the fixed assets’ useful lives using the straight-line method.
Goodwill and Intangible Assets. Goodwill represents costs in excess of fair values assigned to the underlying net assets of acquired businesses. Goodwill and intangible assets deemed to have indefinite lives are not amortized. Goodwill and indefinite-lived intangible assets are subject to annual impairment testing using the guidance and criteria described the Intangibles – Goodwill and Other Topic of the FASB ASC. This testing compares carrying values to fair values and, when appropriate, the carrying value of these assets is reduced to fair value. During 2009, 2008, and 2007, we were not required to record any impairment on goodwill or indefinite-lived intangibles.
Intangible assets consist of service portfolios, patents and trademarks, customer relationships and other intangible assets. Useful lives of finite lived intangible assets are estimated based upon the nature of the intangible asset and the industry in which the intangible asset is used. Estimated useful lives of service portfolios generally range from 5 to 30 years. Estimated useful lives of patents and finite-lived trademarks range from 3 to 40 years. Estimated useful lives of customer relationships and other assets range from 2 to 32 years. These intangible assets are amortized based on the pattern in which the economic benefits of the intangible assets are consumed. If a pattern of economic benefit cannot be reliably determined, a straight-line amortization method is used.
Other Long-lived Assets. We evaluate the potential impairment of other long-lived assets when appropriate. If the carrying value of other long-lived assets exceeds the sum of the undiscounted expected future cash flows, the carrying value is written down to fair value.
Income Taxes. In the ordinary course of business there is inherent uncertainty in quantifying our income tax positions. We assess our income tax positions and record tax benefits for all years subject to examination based upon management’s evaluation of the facts, circumstances, and information available at the reporting date. For those tax positions where it is more-likely-than-not that a tax benefit will be sustained, we have recorded the largest amount of tax benefit with a greater than 50% likelihood of being realized upon ultimate settlement with a taxing authority that has full knowledge of all relevant information. For
31
those income tax positions where it is not more-likely-than-not that a tax benefit will be sustained, no tax benefit has been recognized in the financial statements. Where applicable, associated interest expense has also been recognized. We recognize accrued interest related to unrecognized tax benefits in interest expense. Penalties, if incurred, would be recognized as a component of income tax expense.
Effective January 1, 2007 we adopted the provision of the Income Taxes Topic of the FASB ASC as it relates to the accounting for uncertainty in income taxes. As a result of this adoption, we recognized a charge of approximately $19 million to the January 1, 2007 retained earnings balance. We recognize interest accrued related to unrecognized tax benefits in interest expense. Penalties, if incurred, would be recognized as a component of income tax expense.
Revenue Recognition. Sales under government and commercial fixed-price contracts and government fixed-price-incentive contracts are recorded at the time deliveries are made or, in some cases, on a percentage-of-completion basis. Sales under cost-reimbursement contracts are recorded as work is performed.
Sales under elevator and escalator sales, installation and modernization contracts are accounted for under the percentage-of-completion method.
Losses, if any, on contracts are provided for when anticipated. Loss provisions on original equipment contracts are recognized to the extent that estimated inventoriable manufacturing, engineering, product warranty and product performance guarantee costs, as appropriate, exceed the projected revenue from the products contemplated under the contractual arrangement. For new commitments, we generally record loss provisions at the earlier of contract announcement or contract signing except for certain requirements contracts under which losses are recorded upon receipt of the purchase order. For existing commitments, anticipated losses on contracts are recognized in the period in which losses become evident. Products contemplated under contractual arrangement include products purchased under contract and, in the large commercial engine business, future highly probable sales of replacement parts required by regulation that are expected to be purchased subsequently for incorporation into the original equipment. Revenue projections used in determining contract loss provisions are based upon estimates of the quantity, pricing and timing of future product deliveries. Losses are generally recognized on shipment to the extent that inventoriable manufacturing costs, estimated warranty costs and product performance guarantee costs, as appropriate, exceed revenue realized. Contract accounting requires estimates of future costs over the performance period of the contract as well as estimates of award
fees and other sources of revenue. These estimates are subject to change and result in adjustments to margins on contracts in progress. The extent of progress toward completion on our long-term commercial aerospace equipment and helicopter contracts is measured using units of delivery. In addition, we use the cost-to-cost method for elevator and escalator sales, installation and modernization contracts in the commercial businesses. For long-term aftermarket contracts, revenue is recognized over the contract period in proportion to the costs expected to be incurred in performing services under the contract. We review our cost estimates on significant contracts on a quarterly basis, and for others, no less frequently than annually or when circumstances change and warrant a modification to a previous estimate. Adjustments to contract loss provisions are recorded in earnings upon identification.
Service sales, representing aftermarket repair and maintenance activities, are recognized over the contractual period or as services are performed. In the commercial businesses, revenue is generally recognized on a straight line basis. In the aerospace businesses, revenue is generally recognized in proportion to cost.
Revenues generated from engine programs, spare parts sales, and aftermarket business under collaboration arrangements are recorded as earned in our financial statements. Amounts attributable to our collaborative partners for their share of revenues are recorded as an expense in our financial statements based upon the terms and nature of the arrangement. Costs associated with engine programs under collaborative arrangements are expensed as incurred. Under these arrangements, collaborators contribute their program share of engine parts, incur their own production costs and make certain payments to Pratt & Whitney for shared or joint program costs. The reimbursement of a collaborator’s share of program costs is recorded as a reduction of the related expense item at that time.
Research and Development. Research and development costs not specifically covered by contracts and those related to the company sponsored share of research and development activity in connection with cost-sharing arrangements are charged to expense as incurred. Government research and development support, not associated with specific contracts, is recorded as a reduction to research and development expense in the period earned. Repayment, if any, is in the form of future royalties and is conditioned upon the achievement of certain financial targets.
Research and development costs incurred under contracts with customers are expensed as incurred and are reported as a component of cost of products sold. Revenue from such contracts is recognized as product sales when earned.
32
Foreign Exchange and Hedging Activity. We conduct business in many different currencies and, accordingly, are subject to the inherent risks associated with foreign exchange rate movements. The financial position and results of operations of substantially all of our foreign subsidiaries are measured using the local currency as the functional currency. Foreign currency denominated assets and liabilities are translated into U.S. dollars at the exchange rates existing at the respective balance sheet dates, and income and expense items are translated at the average exchange rates during the respective periods. The aggregate effects of translating the balance sheets of these subsidiaries are deferred as a separate component of shareowners’ equity.
We have used derivative instruments, including swaps, forward contracts and options, to manage certain foreign currency, interest rate and commodity price exposures. Derivative instruments are viewed as risk management tools by us and are not used for trading or speculative purposes. Derivatives used for hedging purposes may be designated and effective as a hedge of the identified risk exposure at the inception of the contract.
All derivative instruments are recorded on the balance sheet at fair value. Derivatives used to hedge foreign-currency-denominated balance sheet items are reported directly in earnings along with offsetting transaction gains and losses on the items being hedged. Derivatives used to hedge forecasted cash flows associated with foreign currency commitments or forecasted commodity purchases may be accounted for as cash flow hedges, as deemed appropriate. Gains and losses on derivatives designated as cash flow hedges are recorded in other comprehensive income and reclassified to earnings in a manner that matches the timing of the earnings impact of the hedged transactions. The ineffective portion of all hedges, if any, is recognized currently in earnings.
Environmental. Environmental investigatory, remediation, operating and maintenance costs are accrued when it is probable that a liability has been incurred and the amount can be reasonably estimated. The most likely cost to be incurred is accrued based on an evaluation of currently available facts with respect to each individual site, including existing technology, current laws and regulations and prior remediation experience. Where no amount within a range of estimates is more likely, the minimum is accrued. For sites with multiple responsible parties, we consider our likely proportionate share of the anticipated remediation costs and the ability of the other parties to fulfill their obligations in establishing a provision for those costs. Liabilities with fixed or reliably determinable future cash payments are discounted. Accrued environmental liabilities are not reduced by potential insurance reimbursements.
Asset Retirement Obligations. We record the fair value of legal obligations associated with the retirement of tangible long-lived assets in the period in which it is determined to exist, if a reasonable estimate of fair value can be made. Upon initial recognition of a liability, we capitalize the cost of the asset retirement obligation by increasing the carrying amount of the related long-lived asset. Over time, the liability is increased for changes in its present value and the capitalized cost is depreciated over the useful life of the related asset. We have determined that conditional legal obligations exist for certain of our worldwide owned and leased facilities related primarily to building materials. As of December 31, 2009 and 2008, the outstanding liability for asset retirement obligations was $157 million and $163 million, respectively.
Pension and Postretirement Obligations.Guidance under the Compensation – Retirement Benefits Topic of the FASB ASC requires balance sheet recognition of the overfunded or underfunded status of pension and postretirement benefit plans. Under this guidance, actuarial gains and losses, prior service costs or credits, and any remaining transition assets or obligations that have not been recognized under previous accounting standards must be recognized in other comprehensive income, net of tax effects, until they are amortized as a component of net periodic benefit cost. This guidance was effective for publicly-held companies for fiscal years ending after December 15, 2006, except for the measurement date provisions, which were effective for fiscal years ending after December 15, 2008. Based on the funded status of our plans as of December 31, 2006, the adoption of this guidance decreased total assets by approximately $2.4 billion, decreased total liabilities by approximately $549 million and reduced total shareowners’ equity by approximately $1.8 billion, net of taxes. This guidance also requires the measurement date (the date at which plan assets and the benefit obligation are measured) to be the company’s fiscal year end. We early-adopted the measurement date provisions of this guidance effective January 1, 2007. The majority of our pension and postretirement plans previously used a November 30 measurement date. All plans are now measured as of December 31, consistent with the company’s fiscal year end. The non-cash effect of the adoption of the measurement date provisions of this guidance increased total shareowners’ equity by approximately $425 million and decreased long-term liabilities by approximately $620 million in 2007. The adoption of this guidance did not affect our results of operations.
Note 2: Business Acquisitions, Goodwill and Intangible Assets
Business Acquisitions. Our investments in businesses in 2009, 2008 and 2007 totaled $703 million, $1.4 billion and $2.3 billion, respectively. Included in the total investments in businesses was $0, $196 million and $300 million of debt assumed in 2009, 2008 and 2007, respectively.
33
In December 2009, we agreed to acquire a 49.5% equity stake in Clipper Windpower Plc (Clipper), a California-based wind turbine manufacturer that trades on the AIM London Stock Exchange. This investment is intended to expand our power generation portfolio and allow us to enter the wind power segment by leveraging our expertise in blade technology, turbines and gearbox design. The total cost was £166 million (approximately $270 million) for the purchase of 84.3 million newly issued shares and 21.8 million shares from existing shareowners. We completed the acquisition of this investment on January 12, 2010 and will account for it under the equity method of accounting. Pursuant to our agreement with Clipper, we are prohibited from acquiring additional shares of Clipper within two years of the closing date that would result in an equity stake in excess of 49.9% without prior approval of Clipper.
In November 2009, we entered into an agreement with General Electric Company (GE) to purchase the GE Security business for approximately $1.8 billion. Subject to regulatory approvals and the satisfaction of customary closing conditions, the closing is anticipated to take place early in the second quarter of 2010. GE Security, part of GE Technology Infrastructure, supplies security and fire safety technologies for commercial and residential applications through a broad product portfolio that includes fire detection and life safety systems, intrusion alarms, and video surveillance and access control systems. We intend to incorporate the GE Security business within our existing UTC Fire & Security segment, which will significantly enhance UTC Fire & Security’s geographic diversity with GE Security’s strong North American presence and increased product and technology offerings.
In August 2009, we completed the acquisition of the remaining 71% interest in GST Holdings Limited (GST), a fire alarm provider in China, for approximately $250 million bringing our total investment in GST to approximately $360 million. We recorded over $200 million of goodwill and approximately $100 million of identified intangibles in connection with GST. With the acquisition of the remaining 71% of GST, UTC Fire & Security further strengthened its presence in the Chinese fire safety industry.
In July 2009, Carrier and Watsco, Inc. (Watsco) formed Carrier Enterprise, LLC, a joint venture to distribute Carrier, Bryant, Payne and Totaline residential and light commercial HVAC products in the U.S. sunbelt region and selected territories in the Caribbean and Latin America. As part of the transaction, Carrier contributed its distribution businesses located in these regions into the new venture. In consideration of its contribution, Carrier received approximately 3 million shares of common stock of Watsco and a 40 percent noncontrolling interest in the new venture, which included a business contributed by Watsco. Watsco owns 60 percent interest in the venture with options to purchase an additional 20 percent interest from Carrier in future years. Carrier
recognized a gain of approximately $60 million in 2009 as a result of its contribution of the majority of its U.S. residential sales and distribution businesses in this new venture.
The 2008 investments consisted primarily of a number of small acquisitions in our commercial businesses. The 2007 investments consisted principally of the acquisition of Initial Electronic Security Group (IESG), a division of Rentokil Initial, plc, and Marioff Corporation, Oy (Marioff) both part of the UTC Fire & Security segment, and a number of small acquisitions in both the commercial and aerospace businesses.
On July 2, 2007, we completed the acquisition of IESG with the exception of the French operations, the acquisition of which was completed on December 27, 2007 after receiving regulatory approval. The total purchase price was approximately $1.2 billion including approximately $250 million of debt assumed. We recorded approximately $1.0 billion of goodwill and approximately $300 million of identified intangible assets in connection with this acquisition. The acquisition of IESG enhances UTC Fire & Security’s scale and capability in the electronic security business in key markets where we have a significant presence. IESG sells integrated security systems, intrusion detection, closed circuit television, access control and security software. It is headquartered in the United Kingdom, with operations in the United Kingdom, the Netherlands, the United States and France.
On August 30, 2007, we completed the acquisition of Marioff, a global provider of water mist fire suppression systems for land and marine applications, for approximately $348 million. We recorded approximately $250 million of goodwill and approximately $70 million of identified intangibles in connection with this acquisition. The acquisition increases UTC Fire & Security’s presence in environmentally friendly water-based suppression systems and will expand the company’s product and service offerings.
We account for business combinations as required by the provisions of the Business Combinations Topic of the FASB ASC, which includes provisions that we adopted effective January 1, 2009. The accounting for business combinations retains the underlying concepts of the previously issued standard in that all business combinations are still required to be accounted for at fair value, but changes the method of applying the acquisition method in a number of significant aspects. Acquisition costs are generally expensed as incurred; noncontrolling interests are valued at fair value at the acquisition date; in-process research and development is recorded at fair value as an indefinite-lived intangible asset at the acquisition date; restructuring costs associated with a business combination are generally expensed subsequent to the acquisition date; and changes in deferred tax
34
asset valuation allowances and income tax uncertainties after the acquisition date generally affect income tax expense. These changes are effective on a prospective basis for all of our business combinations for which the acquisition date is on or after January 1, 2009, with the exception of the accounting for valuation allowances on deferred taxes and acquired tax contingencies. Adjustments for valuation allowances on deferred taxes and acquired tax contingencies associated with acquisitions that closed prior to January 1, 2009 would also apply the revised accounting for business combination provisions.
During the measurement period we will recognize additional assets or liabilities if new information is obtained about facts and circumstances that existed as of the acquisitions date that, if known, would have resulted in the recognition of those assets and liabilities as of that date. The measurement period shall not exceed one year from the acquisition date. Further, any associated restructuring activities will be expensed in future periods and not recorded through purchase accounting as previously done for acquisitions occurring prior to January 1, 2009.
There was no significant impact on our acquisition activity in 2009 from the changes in the provisions of accounting for business combinations.
The assets and liabilities of the acquired businesses are accounted for under the purchase method of accounting and recorded at their fair values at the dates of acquisition. The excess of the purchase price over the estimated fair values of the net assets acquired was recorded as an increase in goodwill of $630 million in 2009, $825 million in 2008, and $1.8 billion in 2007. The results of operations of acquired businesses have been included in the Consolidated Statement of Operations beginning as of the effective date of acquisition.
Goodwill. The changes in the carrying amount of goodwill, by segment, are as follows:
| (in millions of dollars) | Balance as of January 1, 2009 | Goodwill resulting from business combinations | Foreign currency translation and other | Balance as of December 31, 2009 | |||||||||||
Otis | $ | 1,193 | $ | 150 | $ | 39 | $ | 1,382 | |||||||
Carrier | 3,270 | 36 | (54 | ) | 3,252 | ||||||||||
UTC Fire & Security | 5,074 | 259 | 308 | 5,641 | |||||||||||
Pratt & Whitney | 1,037 | 165 | 35 | 1,237 | |||||||||||
Hamilton | 4,423 | 20 | 53 | 4,496 | |||||||||||
Sikorsky | 249 | — | 1 | 250 | |||||||||||
Total Segments | 15,246 | 630 | 382 | 16,258 | |||||||||||
Eliminations and other | 117 | — | (77 | ) | 40 | ||||||||||
| �� | |||||||||||||||
Total | $ | 15,363 | $ | 630 | $ | 305 | $ | 16,298 | |||||||
Intangible Assets. Identifiable intangible assets are comprised of the following:
| 2009 | 2008 | |||||||||||||||
| (in millions of dollars) | Gross Amount | Accumulated Amortization | Gross Amount | Accumulated Amortization | ||||||||||||
Amortized: | ||||||||||||||||
Service portfolios | $ | 1,814 | $ | (833 | ) | $ | 1,625 | $ | (700 | ) | ||||||
Patents and | 369 | (120 | ) | 333 | (103 | ) | ||||||||||
Other, principally customer relationships | 2,624 | (1,047 | ) | 2,460 | (825 | ) | ||||||||||
| 4,807 | (2,000 | ) | 4,418 | (1,628 | ) | |||||||||||
Unamortized: | ||||||||||||||||
Trademarks and other | 731 | — | 653 | — | ||||||||||||
Total | $ | 5,538 | $ | (2,000 | ) | $ | 5,071 | $ | (1,628 | ) | ||||||
Amortization of intangible assets in 2009 and 2008 was $347 million and $363 million, respectively. Amortization of these intangible assets for 2010 through 2014 is expected to approximate $280 million per year.
Note 3: Earnings Per Share
| (in millions of dollars, except per share amounts) | 2009 | 2008 | 2007 | ||||||||
Net income attributable to common shareowners | $ | 3,829 | $ | 4,689 | $ | 4,224 | |||||
Basic weighted average shares outstanding | 917.4 | 937.8 | 963.9 | ||||||||
Stock awards | 11.4 | 18.6 | 24.9 | ||||||||
Diluted weighted average shares outstanding | 928.8 | 956.4 | 988.8 | ||||||||
Earnings per share of Common Stock: | |||||||||||
Basic | $ | 4.17 | $ | 5.00 | $ | 4.38 | |||||
Diluted | $ | 4.12 | $ | 4.90 | $ | 4.27 | |||||
The computation of diluted earnings per share excludes the effect of the potential exercise of stock awards, including stock appreciation rights (SARs) and stock options when the average market price of the common stock is lower than the exercise price of the related SARs and options during the period. These outstanding stock awards are not included in the computation of diluted earnings per share because the effect would have been antidilutive. For 2009 and 2008, the number of stock awards excluded from the computation was 20.2 million and 8.9 million, respectively. There were no antidilutive stock awards outstanding for 2007. Effective January 1, 2009, we adopted the provisions under the Consolidation Topic of the FASB ASC as it relates to the accounting for noncontrolling interests in Consolidated Financial Statements. This Topic requires that the amount of net income attributable to the noncontrolling interests be included in consolidated net income on the face of the income statement. Earnings per share have not been affected as a result of the adoption of the provisions under this Topic. Additional information pertaining to the accounting for noncontrolling interests is included in Note 9.
35
Note 4: Commercial Aerospace Industry Assets and Commitments
We have receivables and other financing assets with commercial aerospace industry customers totaling $3,016 million and $2,636 million at December 31, 2009 and 2008, respectively.
Customer financing assets related to commercial aerospace industry customers consist of products under lease of $675 million and notes and leases receivable of $375 million. The notes and leases receivable are scheduled to mature as follows: $62 million in 2010, $52 million in 2011, $15 million in 2012, $14 million in 2013, $14 million in 2014, and $218 million thereafter.
Financing commitments, in the form of secured debt, guarantees or lease financing, are provided to commercial aerospace customers. The extent to which the financing commitments will be utilized is not currently known, since customers may be able to obtain more favorable terms from other financing sources. We may also arrange for third-party investors to assume a portion of these commitments. If financing commitments are exercised, debt financing is generally secured by assets with fair market values equal to or exceeding the financed amounts with interest rates established at the time of funding. We also may lease aircraft and subsequently sublease the aircraft to customers under long-term noncancelable operating leases. In some instances, customers may have minimum lease terms that result in sublease periods shorter than our lease obligation. Lastly, we have made residual value and other guarantees related to various commercial aerospace customer-financing arrangements. The estimated fair market values of the guaranteed assets equal or exceed the value of the related guarantees, net of existing reserves.
Our commercial aerospace financing and rental commitments as of December 31, 2009 were $909 million and are exercisable as follows: $116 million in 2010, $100 million in 2011, $29 million in 2012, $7 million in 2013, $6 million in 2014, and $651 million thereafter. Our financing obligations with customers are contingent upon maintenance of certain levels of financial condition by the customers.
In addition, we have residual value and other guarantees of $320 million as of December 31, 2009.
We have a 33% interest in International Aero Engines AG (IAE), an international consortium of four shareholders organized to support the V2500 commercial aircraft engine program. Our interest in IAE is accounted for under the equity method of accounting. IAE may offer customer financing in the form of guarantees, secured debt or lease financing in connection with V2500 engine sales. At December 31, 2009, IAE had financing commitments of $863 million and asset value guarantees of $55 million. Our share of IAE’s financing commitments and asset value
guarantees was approximately $281 million at December 31, 2009. In addition, IAE had lease obligations under long-term noncancelable leases of approximately $268 million, on an undiscounted basis, through 2020 related to aircraft, which are subleased to customers under long-term leases. These aircraft have fair market values, which approximate the financed amounts, net of reserves. The shareholders of IAE have guaranteed IAE’s financing arrangements to the extent of their respective ownership interests. In the event of default by a shareholder on certain of these financing arrangements, the other shareholders would be proportionately responsible.
Reserves related to receivables and financing assets were $141 million and $149 million at December 31, 2009 and 2008, respectively. Reserves related to financing commitments and guarantees were $34 million and $30 million at December 31, 2009 and 2008, respectively.
Note 5: Inventories & Contracts in Progress
| (in millions of dollars) | 2009 | 2008 | ||||||
Raw materials | $ | 1,281 | $ | 1,271 | ||||
Work-in-process | 3,097 | 3,295 | ||||||
Finished goods | 2,889 | 3,634 | ||||||
Contracts in progress | 6,479 | 6,113 | ||||||
| 13,746 | 14,313 | |||||||
Less: | ||||||||
Progress payments, secured by lien, on U.S. Government contracts | (264 | ) | (476 | ) | ||||
Billings on contracts in progress | (5,973 | ) | (5,497 | ) | ||||
| $ | 7,509 | $ | 8,340 | |||||
Raw materials, work-in-process and finished goods are net of valuation reserves of $683 million and $497 million as of December 31, 2009 and 2008, respectively. As of December 31, 2009 and 2008, inventory also includes capitalized contract development costs of $862 million and $833 million, respectively, related to certain aerospace programs. These capitalized costs will be liquidated as production units are delivered to the customer. The capitalized contract research and development costs within inventory principally relate to capitalized costs on Sikorsky’s CH-148 contract with the Canadian government. The CH-148 is a derivative of the H-92, a military variant of the S-92.
Contracts in progress principally relate to elevator and escalator contracts and include costs of manufactured components, accumulated installation costs and estimated earnings on incomplete contracts.
Our sales contracts in many cases are long-term contracts expected to be performed over periods exceeding twelve months. At December 31, 2009 and 2008, approximately 73% and 68%,
36
respectively, of total inventories and contracts in progress have been acquired or manufactured under such long-term contracts, a portion of which is not scheduled for delivery within the next twelve months.
Note 6: Fixed Assets
| (in millions of dollars) | Estimated Useful Lives | 2009 | 2008 | ||||||||
Land | $ | 345 | $ | 334 | |||||||
Buildings and improvements | 20-40 years | 4,898 | 4,681 | ||||||||
Machinery, tools and equipment | 3-20 years | 9,941 | 9,486 | ||||||||
Other, including under construction | 493 | 605 | |||||||||
| 15,677 | 15,106 | ||||||||||
Accumulated depreciation | (9,313 | ) | (8,758 | ) | |||||||
| $ | 6,364 | $ | 6,348 | ||||||||
Depreciation expense was $852 million in 2009, $865 million in 2008 and $770 million in 2007.
Note 7: Accrued Liabilities
| (in millions of dollars) | 2009 | 2008 | |||||
Advances on sales contracts and service billings | $ | 5,267 | $ | 5,248 | |||
Accrued salaries, wages and employee benefits | 1,801 | 1,877 | |||||
Litigation and contract matters | 541 | 436 | |||||
Service and warranty accruals | 447 | 526 | |||||
Income taxes payable | 348 | 307 | |||||
Interest payable | 296 | 296 | |||||
Accrued property, sales and use taxes | 196 | 207 | |||||
Accrued restructuring costs | 403 | 213 | |||||
Accrued workers compensation | 181 | 177 | |||||
Other | 2,312 | 2,782 | |||||
| $ | 11,792 | $ | 12,069 | ||||
Note 8: Borrowings and Lines of Credit
| (in millions of dollars) | 2009 | 2008 | |||||
Short-term borrowings: | |||||||
Commercial paper | $ | — | $ | 150 | |||
Revolving credit borrowings | — | 461 | |||||
Other borrowings | 254 | 412 | |||||
Total short-term borrowings | $ | 254 | $ | 1,023 | |||
The weighted-average interest rates applicable to short-term borrowings outstanding at December 31, 2009 and 2008 were 4.8% and 5.3%, respectively. At December 31, 2009, approximately $3.1 billion was available under short-term lines of credit with local banks at our various domestic and international subsidiaries.
At December 31, 2009, we had committed credit agreements from banks permitting aggregate borrowings of up to $2.5 billion under a $1.5 billion revolving credit agreement and a $1.0 billion multicurrency revolving credit agreement, both of which are available for general funding purposes, including acquisitions. As of December 31, 2009, there were no borrowings under either of these revolving credit agreements, which expire in October 2011 and November 2011, respectively. The undrawn portions under both of these agreements are also available to serve as backup facilities for the issuance of commercial paper. We generally use our commercial paper borrowings for general corporate purposes, including the funding of potential acquisitions and repurchases of our Common Stock.
| (in millions of dollars) | 2009 | 2008 | ||||||
Long-term debt: | ||||||||
LIBOR+.07% floating rate notes due 2009 * | $ | — | $ | 500 | ||||
6.500% notes due 2009 * | — | 400 | ||||||
7.675% ESOP debt due 2009 * | — | 33 | ||||||
4.375% notes due 2010 * | 600 | 600 | ||||||
7.125% notes due 2010 * | 500 | 500 | ||||||
6.350% notes due 2011 * | 500 | 500 | ||||||
6.100% notes due 2012 * | 500 | 500 | ||||||
4.875% notes due 2015 * | 1,200 | 1,200 | ||||||
5.375% notes due 2017 * | 1,000 | 1,000 | ||||||
6.125% notes due 2019 * | 1,250 | 1,250 | ||||||
8.875% notes due 2019 | 272 | 272 | ||||||
8.750% notes due 2021 | 250 | 250 | ||||||
6.700% notes due 2028 | 400 | 400 | ||||||
7.500% notes due 2029 * | 550 | 550 | ||||||
5.400% notes due 2035 * | 600 | 600 | ||||||
6.050% notes due 2036 * | 600 | 600 | ||||||
6.125% notes due 2038 * | 1,000 | 1,000 | ||||||
Project financing obligations | 158 | 193 | ||||||
Other (including capitalized leases) | 110 | 105 | ||||||
Total long-term debt | 9,490 | 10,453 | ||||||
Less current portion | (1,233 | ) | (1,116 | ) | ||||
Long-term portion | $ | 8,257 | $ | 9,337 | ||||
| * | We may redeem the above notes, in whole or in part, at our option at any time at a redemption price in U.S. dollars equal to the greater of 100% of the principal amount of the notes to be redeemed or the sum of the present values of the remaining scheduled payments of principal and interest on the notes to be redeemed, discounted to the redemption date on a semiannual basis at the adjusted treasury rate plus 10-50 basis points. The redemption price will also include interest accrued to the date of redemption on the principal balance of the notes being redeemed. |
In February 2009, we redeemed the entire $500 million outstanding principal amount of our LIBOR+.07% floating rate notes that were due June 1, 2009 at a redemption price in U.S. dollars equal to 100% of the principal amount, plus interest accrued. On June 1, 2009, we repaid our $400 million of 6.500% notes due 2009 which matured on the same date. In December 2009, we redeemed the entire $33 million outstanding principal amount of our 7.675% ESOP debt that was due December 10, 2009 at a redemption price in U.S. dollars equal to 100% of the principal amount, plus interest accrued.
37
In December 2008, we issued $1.25 billion of long-term debt, the proceeds of which were used primarily to repay commercial paper borrowings maturing between December 15, 2008 and January 21, 2009 and a portion of the outstanding borrowings under our multicurrency revolving credit facility. The remainder of the net proceeds were used for general corporate purposes.
In May 2008, we issued $1.0 billion of long-term debt, the proceeds of which were primarily used for general corporate purposes, including financing acquisitions and repurchases of our stock.
The project financing obligations noted above are associated with the sale of rights to unbilled revenues related to the ongoing activity of an entity acquired in 2008 by Carrier. The percentage of total debt at floating interest rates was 3% and 15% at December 31, 2009 and 2008, respectively. The three month LIBOR rate as of December 31, 2009 and 2008 was approximately 0.3% and 1.4%, respectively.
The schedule of principal payments required on long-term debt for the next five years are:
| (in millions of dollars) | |||
2010 | $ | 1,233 | |
2011 | 574 | ||
2012 | 508 | ||
2013 | 4 | ||
2014 | 4 | ||
Thereafter | 7,167 | ||
Total | $ | 9,490 | |
We have an existing universal shelf registration statement filed with the Securities and Exchange Commission (SEC) for an indeterminate amount of securities for future issuance, subject to our internal limitations on the amount of debt to be issued under this shelf registration statement.
Note 9: Equity
As of January 1, 2009, we adopted the provisions under the Consolidation Topic of the FASB ASC as it relates to the accounting and reporting standards for noncontrolling interests (previously referred to as minority interests) in consolidated subsidiaries as reported in consolidated financial statements. These provisions require that the carrying value of noncontrolling interests be removed from the mezzanine section of the balance sheet and reclassified as equity, and that consolidated net income be recast to include net income attributable to the noncontrolling interests. The standards require retrospective presentation and disclosure of existing noncontrolling interests. Accordingly, we have presented noncontrolling interests as a separate component of equity and have also presented net income attributable to the
noncontrolling interest in the consolidated statement of operations. As a result of this adoption, we reclassified noncontrolling interests in the amounts of $918 million and $835 million from the mezzanine section to equity in the December 31, 2008 and 2007, balance sheets, respectively.
In conjunction with the adoption of the new provisions under the Consolidation Topic, we adopted the FASB update to the accounting and reporting standards for redeemable equity instruments. The update to the standards is applicable for all noncontrolling interests with redemption features, such as put options, that are not solely within the control of the Company (redeemable noncontrolling interest). The standards require redeemable noncontrolling interest to be reported in the mezzanine equity section of the consolidated balance sheet at the greater of redemption value or initial carrying value. As a result, we have classified $245 million and $203 million of “redeemable noncontrolling interests” in the mezzanine section in the December 31, 2008 and 2007, balance sheets, respectively. These amounts include an initial transition adjustment of $114 million to increase the redeemable noncontrolling interest to redemption value, where required, as of January 1, 2007. The additional accretion to redemption value attributable to certain redeemable noncontrolling interests was not significant in 2009, 2008 or 2007.
Consistent with the requirements under the Business Combinations Topic of the FASB ASC and the accounting for noncontrolling interests in Consolidated Financial Statements, changes in noncontrolling interests that do not result in a change of control and where there is a difference between fair value and carrying value are accounted for as equity transactions. A summary of these changes in ownership interests in subsidiaries and the effect on shareowners’ equity is provided below:
| (in millions of dollars) | 2009 | 2008 | 2007 | |||||||||
Net income attributable to common shareowners | $ | 3,829 | $ | 4,689 | $ | 4,224 | ||||||
Transfers to noncontrolling interests | ||||||||||||
Decrease in common stock for purchase of subsidiary shares | (67 | ) | — | — | ||||||||
Net income attributable to common shareowners after transfers to noncontrolling interests | $ | 3,762 | $ | 4,689 | $ | 4,224 | ||||||
38
Note 10: Income Taxes
| (in millions of dollars) | 2009 | 2008 | 2007 | |||||||||
Current: | ||||||||||||
United States: | ||||||||||||
Federal | $ | 239 | $ | 576 | $ | 490 | ||||||
State | 54 | 51 | 82 | |||||||||
Foreign: | 837 | 1,211 | 1,206 | |||||||||
| 1,130 | 1,838 | 1,778 | ||||||||||
Future: | ||||||||||||
United States: | ||||||||||||
Federal | $ | 370 | $ | 142 | $ | 220 | ||||||
State | 41 | (52 | ) | (60 | ) | |||||||
Foreign: | 40 | (45 | ) | (102 | ) | |||||||
| 451 | 45 | 58 | ||||||||||
Income tax expense | $ | 1,581 | $ | 1,883 | $ | 1,836 | ||||||
Attributable to items (charged) credited to equity and goodwill | $ | (782 | ) | $ | 2,818 | $ | (493 | ) | ||||
Future income taxes represent the tax effects of transactions, which are reported in different periods for tax and financial reporting purposes. These amounts consist of the tax effects of temporary differences between the tax and financial reporting balance sheets and tax carryforwards. Pursuant to the Income Taxes Topic of the FASB ASC, current and non-current future income tax benefits and payables within the same tax jurisdiction are generally offset for presentation in the Consolidated Balance Sheet.
The tax effects of net temporary differences and tax carryforwards which gave rise to future income tax benefits and payables at December 31, 2009 and 2008 are as follows:
| (in millions of dollars) | 2009 | 2008 | ||||||
Future income tax benefits: | ||||||||
Insurance and employee benefits | $ | 2,209 | $ | 3,200 | ||||
Other asset basis differences | (357 | ) | (397 | ) | ||||
Other liability basis differences | 901 | 1,271 | ||||||
Tax loss carryforwards | 764 | 683 | ||||||
Tax credit carryforwards | 1,177 | 1,125 | ||||||
Valuation allowance | (903 | ) | (698 | ) | ||||
| $ | 3,791 | $ | 5,184 | |||||
Future income taxes payable: | ||||||||
Fixed assets | $ | 650 | $ | 523 | ||||
Other items, net | 123 | 290 | ||||||
| $ | 773 | $ | 813 | |||||
Valuation allowances have been established primarily for tax credit, tax loss carryforwards, and certain foreign temporary differences to reduce the future income tax benefits to expected realizable amounts. Upon the January 1, 2009 adoption of the additional guidance issued under the Income Taxes Topic of the FASB ASC related to the accounting for business combinations,
changes in deferred tax asset valuation allowances and income tax uncertainties after the acquisition date generally will affect income tax expense including those associated with acquisitions that closed prior to the date of adoption.
The sources of income before income taxes are:
| (in millions of dollars) | 2009 | 2008 | 2007 | ||||||||
United States | $ | 2,584 | $ | 2,899 | $ | 2,786 | |||||
Foreign | 3,176 | 4,037 | 3,598 | ||||||||
| $ | 5,760 | $ | 6,936 | $ | 6,384 | ||||||
With few exceptions, U.S. income taxes have not been provided on undistributed earnings of international subsidiaries. It is not practicable to estimate the amount of tax that might be payable. Our intention is to reinvest these earnings permanently or to repatriate the earnings only when it is tax effective to do so. Accordingly, we believe that U.S. tax on any earnings that might be repatriated would be substantially offset by U.S. foreign tax credits.
Differences between effective income tax rates and the statutory U.S. federal income tax rates are as follows:
| 2009 | 2008 | 2007 | |||||||
Statutory U.S. federal income tax rate | 35.0 | % | 35.0 | % | 35.0 | % | |||
Tax on international activities | (6.9 | )% | (6.9 | )% | (5.2 | )% | |||
Tax audit settlements | (0.7 | )% | (0.8 | )% | (0.6 | )% | |||
Other | 0.0 | % | (0.2 | )% | (0.4 | )% | |||
Effective income tax rate | 27.4 | % | 27.1 | % | 28.8 | % | |||
The 2009 effective tax rate increased as compared to 2008 due to the absence of certain discrete items which had a net favorable impact in 2008. The 2009 effective tax rate reflects approximately $38 million of tax expense reductions relating to re-evaluation of our liabilities and contingencies based on global examination activity, including the IRS’s completion of 2004 and 2005 examination fieldwork and our related protest filing. As a result of the global examination activity, we recognized approximately $18 million of associated pre-tax interest income adjustments during 2009.
The 2008 effective tax rate reflects $62 million of tax expense reductions, principally related to the resolution of disputes with the Appeals Division of the IRS for tax years 2000 through 2003.
The 2007 effective tax rate reflects approximately $80 million of tax expense reductions, principally relating to re-evaluation of our liabilities and contingencies based upon global examination activity including IRS completion of 2000 through 2003 examination fieldwork and related protest filing, and development of claims for research and development tax credits. Principal
39
adverse tax impacts to the 2007 effective tax rate related to the EU Fine and enacted tax law changes outside the United States.
In the normal course of business, various tax authorities examine us, including the IRS. The IRS review of tax years 2006 through 2008 is ongoing. Although the outcome of these matters cannot be currently determined, we believe adequate provision has been made for any potential unfavorable financial statement impact.
At December 31, 2009, tax credit carryforwards, principally state and federal, were $1,177 million, of which $508 million expire as follows: $25 million expire from 2010–2014, $288 million from 2015–2019, and $195 million from 2020–2029.
At December 31, 2009, tax loss carryforwards, principally state and foreign, were $3,061 million, of which $1,020 million expire as follows: $437 million from 2010-2014, $139 million from 2015-2019, and $444 million from 2020-2029.
As disclosed in Note 1, we adopted the provisions of the Income Taxes Topic of the FASB ASC as it relates to the accounting for uncertainty in income taxes as of January 1, 2007. At December 31, 2009, we had gross tax-effected unrecognized tax benefits of $793 million of which $732 million, if recognized, would impact the effective tax rate. During the years ended December 31, 2009, 2008, and 2007, we recorded interest expense related to unrecognized tax benefits of approximately $21 million, $39 million, and $56 million, respectively. Total accrued interest at December 31, 2009 and 2008 was approximately $142 million and $161 million, respectively. A reconciliation of the beginning and ending amounts of unrecognized tax benefits for the years ended December 31, 2009 and 2008 are as follows:
| (in millions of dollars) | 2009 | 2008 | 2007 | |||||||||
Balance at January 1 | $ | 773 | $ | 798 | $ | 815 | ||||||
Additions for tax positions related to the current year | 90 | 112 | 78 | |||||||||
Additions for tax positions of prior years | 174 | 66 | 93 | |||||||||
Reductions for tax positions of prior years | (20 | ) | (85 | ) | (48 | ) | ||||||
Settlements | (224 | ) | (118 | ) | (140 | ) | ||||||
Balance at December 31 | $ | 793 | $ | 773 | $ | 798 | ||||||
Included in the balances at December 31, 2009 and 2008, are $57 million and $63 million, respectively, of tax positions whose tax characterization is highly certain but for which there is uncertainty about the timing of tax return inclusion. Because of the impact of deferred tax accounting, other than interest and penalties, the timing would not impact the annual effective tax rate but could accelerate the payment of cash to the taxing authority to an earlier period.
We conduct business globally and, as a result, UTC or one or more of our subsidiaries file income tax returns in the U.S. federal
jurisdiction and various state and foreign jurisdictions. In the normal course of business, we are subject to examination by taxing authorities throughout the world, including such major jurisdictions as Australia, Canada, China, France, Germany, Hong Kong, Italy, Japan, South Korea, Singapore, Spain, the United Kingdom and the United States. With few exceptions, we are no longer subject to U.S. federal, state and local, or non-U.S. income tax examinations for years before 1998.
It is reasonably possible that over the next twelve months the amount of unrecognized tax benefits may change within a range of a net decrease of $50 million to a net increase of $190 million resulting from additional worldwide uncertain tax positions, from the re-evaluation of current uncertain tax positions arising from developments in examinations, in appeals, or in the courts, or from the closure of tax statutes. Not included in the range is€198 million (approximately $284 million) of tax benefits that we have claimed related to a 1998 German reorganization. These tax benefits are currently being reviewed by the German Tax Office in the course of an audit of tax years 1999 to 2000. In 2008 the German Federal Tax Court denied benefits to another taxpayer in a case involving a German tax law relevant to our reorganization. The determination of the German Federal Tax Court on this other matter has been appealed to the European Court of Justice (ECJ) to determine if the underlying German tax law is violative of European Union (EU) principles. On September 17, 2009 the ECJ issued an opinion in this case that is generally favorable to the other taxpayer and referred the case back to the German Federal Tax Court for further consideration of certain related issues. After consideration of the ECJ decision, we continue to believe that it is more likely than not that the relevant German tax law is violative of EU principles and we have not accrued tax expense for this matter. As developments in the other taxpayer’s case in the German courts warrant, it may become necessary for us to accrue for this matter, and related interest.
Note 11: Employee Benefit Plans
We sponsor numerous domestic and foreign employee benefit plans, which are discussed below.
As disclosed in Note 1, we adopted the recognition provisions in 2006 and the measurement date provisions effective January 1, 2007 of the guidance reflected under the Compensation-Retirement Benefits Topic of the FASB ASC. Accordingly, we use a December 31 measurement date for our pension and postretirement plans. Prior to 2007, we used a November 30 measurement date for a majority of our pension and postretirement plans.
Employee Savings Plans. We sponsor various employee savings plans. Our contributions to employer sponsored defined contribution plans were $192 million, $212 million and $200 million
40
for 2009, 2008 and 2007, respectively. Effective January 1, 2010, newly hired non-union employees will receive all of their retirement benefits through the defined contribution savings plan.
Our non-union domestic employee savings plan uses an Employee Stock Ownership Plan (ESOP) for employer contributions. External borrowings, guaranteed by us and reported as debt in the Consolidated Balance Sheet, were used by the ESOP to fund a portion of its purchase of ESOP Convertible Preferred Stock (ESOP Preferred Stock) from us. On November 6, 2003, the Trustee and we effected the conversion of all 10.6 million outstanding shares of ESOP Preferred Stock into 85 million shares of common stock. At the time of the conversion, each share of ESOP Preferred Stock was convertible into four shares of common stock, had a guaranteed minimum value of $65, a $4.80 annual dividend and was redeemable by us at any time for $65 per share. Because of its guaranteed value, the ESOP Preferred Stock was classified outside of Shareowners’ Equity. Beginning with the December 31, 2003 balance sheet, common stock held by the ESOP and committed to employees is classified as permanent equity because it no longer has a guaranteed value. Common stock allocated to ESOP participants is included in the average number of common shares outstanding for both basic and diluted earnings per share.
Shares of common stock are allocated to employees’ ESOP accounts at fair value on the date earned. Cash dividends on common stock held by the ESOP are used for debt service payments. Participants receive additional shares in lieu of cash dividends. As ESOP debt service payments are made, common stock is released from an unreleased shares account. ESOP debt may be prepaid or re-amortized to either increase or decrease the number of shares released so that the value of released shares equals the value of plan benefit. We may also, at our option, contribute additional common stock or cash to the ESOP. The external borrowings have been extinguished and only re-amortized loans remain between the Company and the Trust. At December 31, 2009, 37.6 million common shares had been allocated to employees, leaving 22.2 million unallocated common shares in the ESOP Trust, with an approximate fair value of $1.5 billion.
Pension Plans. We sponsor both funded and unfunded domestic and foreign defined benefit pension plans that cover the majority of our employees.
| (in millions of dollars) | 2009 | 2008 | ||||||
Change in Benefit Obligation: | ||||||||
Beginning balance | $ | 21,511 | $ | 21,914 | ||||
Service cost | 429 | 446 | ||||||
Interest cost | 1,285 | 1,263 | ||||||
Actuarial loss | 471 | 111 | ||||||
Total benefits paid | (1,162 | ) | (1,121 | ) | ||||
Net settlement and curtailment gain | (62 | ) | (21 | ) | ||||
Plan amendments | (534 | ) | 13 | |||||
Other | 333 | (1,094 | ) | |||||
Ending balance | $ | 22,271 | $ | 21,511 | ||||
Change in Plan Assets: | ||||||||
Beginning balance | $ | 15,940 | $ | 22,650 | ||||
Actual return on plan assets | 3,004 | (5,095 | ) | |||||
Employer contributions | 1,308 | 492 | ||||||
Benefits paid from plan assets | (1,111 | ) | (1,095 | ) | ||||
Other | 236 | (1,012 | ) | |||||
Ending balance | $ | 19,377 | $ | 15,940 | ||||
Funded Status: | ||||||||
Fair value of plan assets | $ | 19,377 | $ | 15,940 | ||||
Benefit obligations | (22,271 | ) | (21,511 | ) | ||||
Funded status of plan | $ | (2,894 | ) | $ | (5,571 | ) | ||
Amounts Recognized in the Consolidated Balance Sheet Consist of: | ||||||||
Noncurrent assets | $ | 341 | $ | 59 | ||||
Current liability | (72 | ) | (47 | ) | ||||
Noncurrent liability | (3,163 | ) | (5,583 | ) | ||||
Net amount recognized | $ | (2,894 | ) | $ | (5,571 | ) | ||
Amounts Recognized in Accumulated Other Comprehensive Income Consist of: | ||||||||
Net actuarial loss | $ | 6,767 | $ | 7,903 | ||||
Prior service (credit) cost | (313 | ) | 298 | |||||
Transition obligation | 7 | 9 | ||||||
Net amount recognized | $ | 6,461 | $ | 8,210 | ||||
The amounts included in Other in the preceding table reflect the impact of foreign exchange translation, primarily for plans in the United Kingdom and Canada.
Qualified domestic pension plan benefits comprise approximately 75% of the projected benefit obligation. Benefits for union employees are generally based on a stated amount for each year of service. For non-union employees, benefits are generally based on an employee’s years of service and compensation near retirement. Effective January 1, 2015, this formula will change to the existing cash balance formula that was adopted in 2003 for newly hired non-union employees and for other non-union employees who made a one-time voluntary election to have future benefit accruals determined under this formula. This plan change resulted in a $623 million reduction in the projected benefit obligation as of December 31, 2009. Certain foreign plans, which comprise approximately 23% of the projected benefit obligation, are considered defined benefit plans for accounting purposes.
41
Nonqualified domestic pension plans provide supplementary retirement benefits to certain employees and are not a material component of the projected benefit obligation.
We contributed $951 million and $250 million to our domestic defined benefit pension plans during 2009 and 2008, respectively.
Information for pension plans with accumulated benefit obligation in excess of plan assets:
| (in millions of dollars) | 2009 | 2008 | |||||
Projected benefit obligation | $ | 18,327 | $ | 18,910 | |||
Accumulated benefit obligation | 17,342 | 17,224 | |||||
Fair value of plan assets | 15,315 | 13,391 | |||||
The accumulated benefit obligation for all defined benefit pension plans was $20.8 billion and $19.6 billion at December 31, 2009 and 2008, respectively.
The components of the net periodic pension cost are as follows:
| (in millions of dollars) | 2009 | 2008 | 2007 | |||||||||
Pension Benefits: | ||||||||||||
Service cost | $ | 429 | $ | 446 | $ | 438 | ||||||
Interest cost | 1,285 | 1,263 | 1,182 | |||||||||
Expected return on plan assets | (1,634 | ) | (1,663 | ) | (1,546 | ) | ||||||
Amortization of prior service costs | 56 | 49 | 37 | |||||||||
Amortization of unrecognized net transition obligation | 1 | 1 | 1 | |||||||||
Recognized actuarial net loss | 226 | 119 | 253 | |||||||||
Net settlement and curtailment loss (gain) | 102 | 1 | (1 | ) | ||||||||
Net periodic pension cost – employer | $ | 465 | $ | 216 | $ | 364 | ||||||
Other changes in plan assets and benefit obligations recognized in other comprehensive income in 2009 are as follows:
| (in millions of dollars) | ||||
Current year actuarial gain | $ | (910 | ) | |
Amortization of actuarial loss | (226 | ) | ||
Current year prior service credit | (534 | ) | ||
Amortization of prior service costs | (56 | ) | ||
Amortization of transition obligation | (1 | ) | ||
Other | (90 | ) | ||
Total recognized in other comprehensive income | (1,817 | ) | ||
Net recognized in net periodic pension cost and other comprehensive income | $ | 1,352 | ||
The estimated amount that will be amortized from accumulated other comprehensive income into net periodic pension cost in 2010 is as follows:
| (in millions of dollars) | ||||
Net actuarial loss | $ | 284 | ||
Prior service credit | (18 | ) | ||
Transition obligation | 1 | |||
| $ | 267 | |||
Contributions to multiemployer plans were $126 million, $163 million and $145 million for 2009, 2008 and 2007, respectively.
Major assumptions used in determining the benefit obligation and net cost for pension plans are presented in the following table as weighted-averages:
| Benefit Obligation | Net Cost | ||||||||||||||
| (in millions of dollars) | 2009 | 2008 | 2009 | 2008 | 2007 | ||||||||||
Discount rate | 5.9% | 6.1% | 6.1% | 6.0% | 5.4% | ||||||||||
Salary scale | 4.4% | 4.4% | 4.4% | 4.4% | 4.0% | ||||||||||
Expected return on plan assets | — | — | 8.2% | 8.3% | 8.3% | ||||||||||
In determining the expected return on plan assets, we consider the relative weighting of plan assets, the historical performance of total plan assets and individual asset classes and economic and other indicators of future performance. In addition, we may consult with and consider the opinions of financial and other professionals in developing appropriate capital market assumptions. Return projections are also validated using a simulation model that incorporates yield curves, credit spreads and risk premiums to project long-term prospective returns. The 2007 net cost assumptions reflect the early adoption of the measurement change provisions of the Compensation-Retirement Benefits Topic of the FASB ASC, as discussed in Note 1.
Asset management objectives include maintaining an adequate level of diversification, to reduce interest rate and market risk, and to provide adequate liquidity to meet immediate and future benefit payment requirements. The company’s overall investment strategy is to achieve a mix of 64% growth seeking assets and 36% income generating assets using a wide diversification of asset types, fund strategies and investment managers. The growth seeking allocation consists of global public equities in developed and emerging countries, private equity, real estate and balanced market risk strategies. Within global equities, twelve percent of the portfolio is an enhanced equity strategy that invests in publicly traded equity and fixed income securities, derivatives and foreign currency. Investments in private equity are primarily via limited partnership interests in buy-out strategies with smaller allocations in distressed debt funds. The real estate strategy is principally concentrated in directly held U.S. core investments with some smaller investments in international, value-added and opportunistic strategies. Within the income generating assets, the fixed income portfolio consists of a broadly diversified portfolio of high quality corporate bonds which are highly correlated to UTC’s liabilities and hedge a portion of UTC’s interest rate risk. To reduce concentration in individual issuer risk, the portfolio may include a small allocation to U.S. treasuries and securities with credit ratings below investment grade.
42
The fair values of pension plan assets at December 31, 2009, by asset category are as follows:
| Fair Value Measurements at December 31, 2009 | |||||||||||||||
| (in millions of dollars) | Quoted Prices in (Level 1) | Significant Observable Inputs (Level 2) | Significant Unobservable Inputs (Level 3) | Total | |||||||||||
Asset Category | |||||||||||||||
Public Equities | |||||||||||||||
Global Equities | $ | 4,595 | $ | 4 | $ | — | $ | 4,599 | |||||||
Global Equity Commingled Funds (a) | 77 | 2,695 | — | 2,772 | |||||||||||
Enhanced Global | 22 | 1,538 | 11 | 1,571 | |||||||||||
Private Equities (c) | — | — | 1,045 | 1,045 | |||||||||||
Fixed Income Securities | |||||||||||||||
Governments | 149 | 786 | — | 935 | |||||||||||
Corporate Bonds | 76 | 5,620 | — | 5,696 | |||||||||||
Structured Products (d) | — | 1 | — | 1 | |||||||||||
Real Estate (e) | — | 51 | 715 | 766 | |||||||||||
Other (f) | 50 | 1,100 | — | 1,150 | |||||||||||
Cash & Cash Equivalents (g) | 190 | 241 | — | 431 | |||||||||||
Subtotal | $ | 5,159 | $ | 12,036 | $ | 1,771 | 18,966 | ||||||||
Other Assets & | 411 | ||||||||||||||
Total | $ | 19,377 | |||||||||||||
| (a) | This category represents commingled funds that invest primarily in common stocks. |
| (b) | This category represents enhanced equity separate account and commingled fund portfolios. A portion of the portfolio may include long-short market neutral and relative value strategies that invest in publicly traded, equity and fixed income securities, as well as derivatives of equity and fixed income securities and foreign currency. |
| (c) | This category represents limited partner investments with general partners that primarily invest in debt and equity. |
| (d) | This category represents mortgage and asset-backed securities. |
| (e) | This category represents investments in real estate including commingled funds and directly held properties. |
| (f) | This category represents insurance contracts and a global balanced risk commingled fund consisting mainly of equity, bonds and some commodities. |
| (g) | This category represents short-term commercial paper, bonds and other cash or cash-like instruments. |
| (h) | This category represents trust receivables and payables that are not leveled. |
Total assets include $7.2 billion in gross notional derivative and $5.5 billion in net notional derivative exposure. Derivatives in the plan are primarily used to manage risk and gain asset class exposure while still maintaining liquidity. Derivative instruments mainly consist of equity futures, interest rate futures, interest rate swaps and currency forward contracts.
Our common stock represents approximately 4% of total plan assets at both December 31, 2009 and 2008. We review our assets at least quarterly to ensure we are within the targeted asset allocation ranges and, if necessary, asset balances are adjusted back within target allocations. We employ a broadly diversified investment manager structure that includes diversification by active and passive management, style, capitalization, country, sector, industry and number of investment managers.
The fair value measurement of plan assets using significant unobservable inputs (Level 3) changed during 2009 due to the following:
| 2009 Changes in Fair Value Measurements Using Significant Unobservable Inputs (Level 3) | ||||||||||||||||||||||||
| (in millions of dollars) | Global Equity Commingled Funds | Enhanced Global Equities | Private Equities | Corporate Bonds | Real Estate | Total | ||||||||||||||||||
Beginning Balance, December 31, 2008 | $ | 21 | $ | 7 | $ | 990 | $ | 96 | $ | 894 | $ | 2,008 | ||||||||||||
Realized gains/(losses) | (4 | ) | — | (90 | ) | 13 | (35 | ) | (116 | ) | ||||||||||||||
Unrealized gains/(losses) relating to instruments still held in the reporting period | 5 | — | 140 | 30 | (228 | ) | (53 | ) | ||||||||||||||||
Purchases, sales, issuances and settlements (net) | (22 | ) | 4 | 5 | (139 | ) | 84 | (68 | ) | |||||||||||||||
Transfers in/out (net) | — | — | — | — | — | — | ||||||||||||||||||
Ending Balance, December 31, 2009 | $ | — | $ | 11 | $ | 1,045 | $ | — | $ | 715 | $ | 1,771 | ||||||||||||
Quoted market prices are used to value investments when available. Investments in securities traded on exchanges, including listed futures and options, are valued at the last reported sale prices on the last business day of the year or, if not available, the last reported bid prices. Fixed income securities are primarily measured using a market approach pricing methodology, where observable prices are obtained by market transactions involving identical or comparable securities of issuers with similar credit ratings. Mortgages have been valued on the basis of their future
principal and interest payments discounted at prevailing interest rates for similar investments. Investment contracts are valued at fair value by discounting the related cash flows based on current yields of similar instruments with comparable durations. Real estate investments are valued on a quarterly basis using discounted cash flow models which consider long-term lease estimates, future rental receipts and estimated residual values. Valuation estimates are supplemented by third-party appraisals on an annual basis.
43
Private Equity limited partnerships are valued quarterly using discounted cash flows, earnings multiples and market multiples. Valuation adjustments reflect changes in operating results, financial condition, or prospects of the applicable portfolio company. Over-the-counter securities and government obligations are valued at the bid prices or the average of the bid and ask prices on the last business day of the year from published sources or, if not available, from other sources considered reliable, generally broker quotes. Temporary cash investments are stated at cost, which approximates fair value.
Estimated Future Contributions and Benefit Payments
We expect to make contributions of approximately $600 million to our pension plans in 2010, including approximately $400 million to our domestic plans. Contributions do not reflect benefits to be paid directly from corporate assets.
Benefit payments, including amounts to be paid from corporate assets, and reflecting expected future service, as appropriate, are expected to be paid as follows: $1,250 million in 2010, $1,283 million in 2011, $1,335 million in 2012, $1,383 million in 2013, $1,431 million in 2014, and $8,071 million from 2015 through 2019.
Postretirement Benefit Plans. We sponsor a number of postretirement benefit plans that provide health and life benefits to eligible retirees. Such benefits are provided primarily from domestic plans, which comprise approximately 88% of the benefit obligation. The postretirement plans are primarily unfunded. Assets in funded plans are primarily invested in cash and cash equivalents.
| (in millions of dollars) | 2009 | 2008 | ||||||
Change in Benefit Obligation: | ||||||||
Beginning balance | $ | 871 | $ | 971 | ||||
Service cost | 2 | 3 | ||||||
Interest cost | 50 | 53 | ||||||
Actuarial loss (gain) | 20 | (54 | ) | |||||
Total benefits paid | (83 | ) | (90 | ) | ||||
Other | 16 | (12 | ) | |||||
Ending balance | $ | 876 | $ | 871 | ||||
Change in Plan Assets: | ||||||||
Beginning balance | $ | 16 | $ | 27 | ||||
Employer contributions | 73 | 83 | ||||||
Benefits paid from plan assets | (83 | ) | (90 | ) | ||||
Other | 5 | (4 | ) | |||||
Ending balance | $ | 11 | $ | 16 | ||||
Funded Status: | ||||||||
Fair value of plan assets | $ | 11 | $ | 16 | ||||
Benefit obligations | (876 | ) | (871 | ) | ||||
Funded status of plan | $ | (865 | ) | $ | (855 | ) | ||
Amounts Recognized in the Consolidated Balance Sheet Consist of: | ||||||||
Current liability | $ | (81 | ) | $ | (88 | ) | ||
Noncurrent liability | (784 | ) | (767 | ) | ||||
| $ | (865 | ) | $ | (855 | ) | |||
Amounts Recognized in Accumulated Other Comprehensive Income Consist of: | ||||||||
Net actuarial gain | $ | (104 | ) | $ | (123 | ) | ||
Prior service credit | (2 | ) | (4 | ) | ||||
| $ | (106 | ) | $ | (127 | ) | |||
The components of net periodic benefit cost are as follows:
| (in millions of dollars) | 2009 | 2008 | 2007 | |||||||||
Other Postretirement Benefits: | ||||||||||||
Service cost | $ | 2 | $ | 3 | $ | 5 | ||||||
Interest cost | 50 | 53 | 56 | |||||||||
Expected return on plan assets | (1 | ) | (2 | ) | (3 | ) | ||||||
Amortization of prior service credit | (2 | ) | (6 | ) | (8 | ) | ||||||
Recognized actuarial net gain | (3 | ) | — | — | ||||||||
Net periodic other postretirement benefit cost | $ | 46 | $ | 48 | $ | 50 | ||||||
Other changes in plan assets and benefit obligations recognized in other comprehensive income in 2009 are as follows:
| (in millions of dollars) | |||
Current year actuarial loss | $ | 16 | |
Amortization of prior service credit | 2 | ||
Amortization of actuarial net gain | 3 | ||
Total recognized in other comprehensive income | 21 | ||
Net recognized in net periodic benefit cost and other comprehensive income | $ | 67 | |
44
The estimated amounts that will be amortized from accumulated other comprehensive income into net periodic benefit cost in 2010 include actuarial net gains of $1 million and prior service credits of $2 million.
Major assumptions used in determining the benefit obligation and net cost for postretirement plans are presented in the following table as weighted-averages:
| Benefit Obligation | Net Cost | |||||||||||||
| 2009 | 2008 | 2009 | 2008 | 2007 | ||||||||||
Discount rate | 5.5% | 6.0% | 6.0% | 5.9% | 5.5% | |||||||||
Expected return on plan assets | — | — | 5.8% | 7.8% | 7.3% | |||||||||
The 2007 net cost assumptions reflect the early adoption of the measurement change provisions of guidance reflected under the Compensation-Retirement Benefits Topic of the FASB ASC, as discussed in Note 1.
Assumed health care cost trend rates are as follows:
| 2009 | 2008 | ||||
Health care cost trend rate assumed for next year | 8.0% | 8.5% | |||
Rate that the cost trend rate gradually declines to | 5.0% | 5.0% | |||
Year that the rate reaches the rate it is assumed to remain at | 2016 | 2016 | |||
Assumed health care cost trend rates have a significant effect on the amounts reported for the health care plans. A one-percentage-point change in assumed health care cost trend rates would have the following effects:
| 2009 One-Percentage-Point | ||||||||
| (in millions of dollars) | Increase | Decrease | ||||||
Effect on total service and interest cost | $ | 2 | $ | (2 | ) | |||
Effect on postretirement benefit obligation | $ | 44 | $ | (39 | ) | |||
Estimated Future Benefit Payments
Benefit payments, including net amounts to be paid from corporate assets, and reflecting expected future service, as appropriate, are expected to be paid as follows: $83 million in 2010, $80 million in 2011, $77 million in 2012, $74 million in 2013, $71 million in 2014, and $278 million from 2015 through 2019.
Stock-Based Compensation. We have long-term incentive plans authorizing various types of market and performance-based incentive awards that may be granted to officers and employees. Prior to April 13, 2005, our long-term incentive plan provided for the annual grant of awards in an amount not to exceed 2% of the aggregate number of shares of outstanding common stock, treasury shares and potential common stock (as determined by us in the calculation of earnings per share on a diluted basis) for
the preceding year. On April 9, 2008, the shareowners approved an amendment to the 2005 Long Term Incentive Plan (LTIP) which authorized the delivery of up to an additional 33 million shares of common stock pursuant to awards under the LTIP. The amendment increased the maximum number of shares of common stock that may be awarded under the LTIP to 71 million shares. As of December 31, 2009, approximately 27 million shares remain available for awards under the LTIP. The LTIP does not contain an annual award limit. We expect that the shares awarded on an annual basis will range from 1% to 1.5% of shares outstanding. The LTIP will expire after all shares have been awarded or April 30, 2014, whichever is sooner. Following initial approval of the LTIP on April 13, 2005, we may not grant any new awards under previously existing equity compensation plans. Under all long-term incentive plans, the exercise price of awards is set on the grant date and may not be less than the fair market value per share on that date. Generally, stock appreciation rights and stock options have a term of ten years and a minimum three-year vesting period. In the event of retirement, awards held for more than one year shall immediately become vested and exercisable. In addition, under the LTIP, awards with performance-based vesting generally have a minimum three-year vesting period and vest based on performance against pre-established metrics. In the event of retirement, awards held more than one year remain eligible to vest. We have historically repurchased shares in an amount at least equal to the number of shares issued under our equity compensation arrangements and expect to continue this policy.
We measure the cost of all share-based payments, including stock options, at fair value on the grant date and recognize this cost in the statement of operations. For the years ended December 31, 2009, 2008 and 2007, $153 million, $211 million and $198 million, respectively, of compensation cost was recognized in operating results. The associated future income tax benefit recognized was $49 million, $72 million and $67 million for the years ended December 31, 2009, 2008 and 2007, respectively.
For the years ended December 31, 2009, 2008 and 2007, the amount of cash received from the exercise of stock options was $341 million, $163 million and $415 million, respectively, with an associated tax benefit realized of $95 million, $49 million and $174 million, respectively. In addition, the associated tax benefit realized from the vesting of performance share units was $33 million for the year ended December 31, 2009. Also, in accordance with the Compensation – Stock Compensation Topic of the FASB ASC, for the years ended December 31, 2009, 2008 and 2007, $50 million, $32 million and $130 million, respectively, of certain tax benefits have been reported as operating cash outflows with corresponding cash inflows from financing activities.
45
At December 31, 2009, there was $140 million of total unrecognized compensation cost related to non-vested equity awards granted under long-term incentive plans. This cost is expected to be recognized ratably over a weighted-average period of 1.5 years.
A summary of the transactions under all long-term incentive plans for the three years ended December 31, 2009 follows:
| (shares and units in thousands) | Stock Options | Stock Rights | Performance Share Units | Other Incentive Shares/ Units | ||||||||||||||||||||
| Shares | Average Price * | Shares | Average Price * | Units | Average Price ** | |||||||||||||||||||
Outstanding at: | ||||||||||||||||||||||||
December 31, 2006 | 71,976 | $ | 37.71 | 6,860 | $ | 56.78 | 1,141 | $ | 56.53 | 549 | ||||||||||||||
Granted | 275 | 64.49 | 7,578 | 65.33 | 1,085 | 62.81 | 125 | |||||||||||||||||
Exercised/earned | (14,458 | ) | 31.39 | (61 | ) | 45.16 | — | — | (85 | ) | ||||||||||||||
Cancelled | (782 | ) | 39.35 | (491 | ) | 60.22 | (69 | ) | 59.63 | (2 | ) | |||||||||||||
December 31, 2007 | 57,011 | $ | 39.42 | 13,886 | $ | 61.37 | 2,157 | $ | 59.59 | 587 | ||||||||||||||
Granted | 192 | 74.57 | 7,221 | 74.23 | 948 | 75.21 | 174 | |||||||||||||||||
Exercised/earned | (6,095 | ) | 32.65 | (14 | ) | 47.34 | — | — | (144 | ) | ||||||||||||||
Cancelled | (110 | ) | 44.75 | (798 | ) | 66.57 | (111 | ) | 64.59 | (55 | ) | |||||||||||||
December 31, 2008 | 50,998 | $ | 40.35 | 20,295 | $ | 65.75 | 2,994 | $ | 64.35 | 562 | ||||||||||||||
Granted | 325 | 54.95 | 8,239 | 54.92 | 1,302 | 54.95 | 180 | |||||||||||||||||
Exercised/earned | (12,095 | ) | 35.04 | (346 | ) | 56.42 | (1,064 | ) | 56.53 | (96 | ) | |||||||||||||
Cancelled | (332 | ) | 43.54 | (851 | ) | 62.75 | (120 | ) | 63.50 | (15 | ) | |||||||||||||
December 31, 2009 | 38,896 | $ | 42.10 | 27,337 | $ | 62.70 | 3,112 | $ | 63.12 | 631 | ||||||||||||||
| * | weighted-average exercise price |
| ** | weighted-average grant stock price |
The weighted-average grant date fair value of stock options and stock appreciation rights granted during 2009, 2008 and 2007 was $16.01, $21.16 and $19.10, respectively. The weighted-average grant date fair value of performance share units, which vest upon achieving certain performance metrics, granted during 2009, 2008, and 2007 was $61.56, $84.01 and $71.28, respectively. The total fair value of awards vested during the years ended December 31, 2009, 2008 and 2007 was $235 million, $144 million and $216 million, respectively. The total intrinsic value (which is the amount by which the stock price exceeded the exercise price on the date of exercise) of stock options and stock
appreciation rights exercised during the years ended December 31, 2009, 2008 and 2007 was $296 million, $173 million and $575 million, respectively. The total intrinsic value (which is the stock price at vesting) of performance share units vested was $100 million during the year ended December 31, 2009.
The following table summarizes information about equity awards outstanding that are expected to vest and equity awards outstanding that are exercisable at December 31, 2009:
Equity Awards Outstanding Expected to Vest | Equity Awards Outstanding That Are Exercisable | ||||||||||||||||||||||||||
| (shares thousands, aggregate intrinsic value in millions) | Awards | Average Price * | Aggregate Intrinsic Value | Remaining Term ** | Awards | Average Price * | Aggregate Intrinsic Value | Remaining Term ** | |||||||||||||||||||
Stock Options/Stock Appreciation Rights | 65,661 | $ | 50.34 | $ | 1,252 | 5.1 | 45,879 | $ | 44.50 | $ | 1,143 | 3.9 | |||||||||||||||
Performance Share Units/Restricted Stock | 2,419 | — | $ | 168 | 1.4 | ||||||||||||||||||||||
| * | weighted-average exercise price per share |
| ** | weighted-average contractual remaining term in years |
46
The fair value of each option award is estimated on the date of grant using a binomial lattice model. The following table indicates the assumptions used in estimating fair value for the years ended December 31, 2009, 2008 and 2007. Because lattice-based option models incorporate ranges of assumptions for inputs, those ranges are as follows:
| 2009 | 2008 | 2007 | |||||||
Expected volatility | 30% - 42% | 23% - 26% | 22% - 23% | ||||||
Weighted-average volatility | 30% | 23% | 22% | ||||||
Expected term (in years) | 7.4 - 7.9 | 7.9 - 8.7 | 7.8 - 8.2 | ||||||
Expected dividends | 2.1% | 1.6% | 1.6% | ||||||
Risk-free rate | 0% - 2.5% | 2.9% - 4.0% | 4.6% - 5.0% | ||||||
Expected volatilities are based on the returns of our stock, including implied volatilities from traded options on our stock for the binomial lattice model. We use historical data to estimate equity award exercise and employee termination behavior within the valuation model. Separate employee groups and equity award characteristics are considered separately for valuation purposes. The expected term represents an estimate of the period of time equity awards are expected to remain outstanding. The risk-free rate is based on the term structure of interest rates at the time of equity award grant.
Note 12: Restructuring and Other Costs
During 2009, we recorded net pre-tax restructuring and other charges totaling $830 million for new and ongoing restructuring actions. We recorded charges in the segments as follows: Otis $158 million, Carrier $210 million, UTC Fire & Security $112 million, Pratt & Whitney $190 million, Hamilton Sundstrand $88 million, Sikorsky $7 million, Eliminations and other $62 million and General corporate expenses $3 million. The charges include $420 million in cost of sales, $364 million in selling, general and administrative expenses and $46 million in other income. As described below, these charges relate principally to actions initiated during 2009 and, to a lesser extent, to certain actions initiated in 2008 and 2007.
2009 Actions. During 2009, we initiated restructuring actions relating to ongoing cost reduction efforts, including workforce reductions, the consolidation of field operations and the consolidation of repair and overhaul operations. We recorded net pre-tax restructuring and related charges totaling $802 million, including $389 million in cost of sales, $368 million in selling, general and administrative expenses and $45 million in other income.
We expect the 2009 actions that were initiated in the year to result in net workforce reductions of approximately 14,600 hourly and salaried employees, the exiting of approximately 4.5 million net square feet of facilities and the disposal of assets associated
with exited facilities. As of December 31, 2009, net workforce reductions of approximately 11,100 have been completed, and 1.1 million net square feet of facilities have been exited. The majority of the remaining workforce and facility related cost reduction actions are targeted for completion during 2010 and 2011. No specific plans for significant other actions have been finalized at this time.
On September 21, 2009, Pratt & Whitney announced plans to close its Connecticut Airfoil Repair Operations facility in East Hartford, Connecticut by the second quarter of 2010 and its engine overhaul facility in Cheshire, Connecticut by early 2011. On September 22, 2009, the International Association of Machinists (IAM) filed a lawsuit in the U.S. District Court for the District of Connecticut in Hartford, Connecticut alleging that Pratt & Whitney’s decision to close these facilities and transfer certain work to facilities outside Connecticut breached the terms of its collective bargaining agreement. Pratt & Whitney believes that it has fully complied with the collective bargaining agreement and that the IAM’s contentions are without merit. On February 5, 2010, following a trial on merits, the court issued a declaratory judgment that Pratt & Whitney had breached its obligations under the collective bargaining agreement and permanently enjoined Pratt & Whitney from closing the facilities and transferring the work described in the challenged plans for the duration of the current collective bargaining agreement, which expires on December 5, 2010. Pratt & Whitney is reviewing the decision and considering whether to appeal. Pratt & Whitney has recorded $53 million of restructuring costs associated with these planned closures.
The following table summarizes the accrual balances and utilization by cost type for the 2009 restructuring actions:
| (in millions of dollars) | Severance | Asset Write-Downs | Facility Exit and Lease Termination Costs | Total | ||||||||||||
Net pre-tax restructuring charges | $ | 680 | $ | 69 | $ | 53 | $ | 802 | ||||||||
Utilization | (385 | ) | (69 | ) | (36 | ) | (490 | ) | ||||||||
Balance at December 31, 2009 | $ | 295 | $ | — | $ | 17 | $ | 312 | ||||||||
The following table summarizes expected, incurred and remaining costs for the 2009 restructuring actions by type:
| (in millions of dollars) | Severance | Asset Write-Downs | Facility Exit and Lease Termination Costs | Total | ||||||||||||
Expected costs | $ | 713 | $ | 69 | $ | 117 | $ | 899 | ||||||||
Costs incurred during 2009 | (680 | ) | (69 | ) | (53 | ) | (802 | ) | ||||||||
Remaining costs at December 31, 2009 | $ | 33 | $ | — | $ | 64 | $ | 97 | ||||||||
47
The following table summarizes expected, incurred and remaining costs for the 2009 restructuring actions by segment:
| (in millions of dollars) | Expected Costs | Costs Incurred During 2009 | Remaining Costs at December 31, 2009 | ||||||||
Otis | $ | 166 | $ | (157 | ) | $ | 9 | ||||
Carrier | 225 | (205 | ) | 20 | |||||||
UTC Fire & Security | 115 | (103 | ) | 12 | |||||||
Pratt & Whitney | 218 | (174 | ) | 44 | |||||||
Hamilton Sundstrand | 102 | (90 | ) | 12 | |||||||
Sikorsky | 7 | (7 | ) | — | |||||||
Eliminations and other | 63 | (63 | ) | — | |||||||
General corporate expenses | 3 | (3 | ) | — | |||||||
Total | $ | 899 | $ | (802 | ) | $ | 97 | ||||
2008 Actions. During 2009, we recorded net pre-tax restructuring and other charges and (reversals) totaling $26 million, including $29 million in cost of sales and ($4 million) in selling, general and administrative expenses and $1 million in other income. The 2008 actions relate to ongoing cost reduction efforts including selling, general and administrative reductions, principally at Carrier, Pratt & Whitney, and UTC Fire & Security, and the consolidation of manufacturing facilities.
As of December 31, 2009, net workforce reductions of approximately 6,100 employees of an expected 6,200 employees have been completed, and 700,000 net square feet of facilities of an expected 1.2 million net square feet have been exited. The remaining workforce and facility reduction actions are targeted for completion during 2010.
The following table summarizes the restructuring accrual balances and utilization by cost type for the 2008 programs:
| (in millions of dollars) | Severance | Asset Write- Downs | Facility Exit and Lease Termination Costs | Total | ||||||||||||
Restructuring accruals at January 1, 2009 | $ | 152 | $ | — | $ | 7 | $ | 159 | ||||||||
Net pre-tax restructuring charges | 6 | 1 | 19 | 26 | ||||||||||||
Utilization | (116 | ) | (1 | ) | (22 | ) | (139 | ) | ||||||||
Balance at December 31, 2009 | $ | 42 | $ | — | $ | 4 | $ | 46 | ||||||||
The following table summarizes expected, incurred and remaining costs for the 2008 programs by type:
| (in millions of dollars) | Severance | Asset Write- Downs | Facility Exit and Lease Termination Costs | Total | ||||||||||||
Expected costs | $ | 283 | $ | 25 | $ | 47 | $ | 355 | ||||||||
Costs incurred during 2008 | (277 | ) | (24 | ) | (26 | ) | (327 | ) | ||||||||
Costs incurred during 2009 | (6 | ) | (1 | ) | (19 | ) | (26 | ) | ||||||||
Remaining costs at December 31, 2009 | $ | — | $ | — | $ | 2 | $ | 2 | ||||||||
The following table summarizes expected, incurred and remaining costs for the 2008 programs by segment:
| (in millions of dollars) | Expected Costs | Costs Incurred During 2008 | Costs Incurred During 2009 | Remaining Costs at December 31, 2009 | |||||||||||
Otis | $ | 22 | $ | (21 | ) | $ | (1 | ) | $ | — | |||||
Carrier | 146 | (141 | ) | (5 | ) | — | |||||||||
UTC Fire & Security | 69 | (58 | ) | (9 | ) | 2 | |||||||||
Pratt & Whitney | 109 | (93 | ) | (16 | ) | — | |||||||||
Hamilton Sundstrand | 9 | (13 | ) | 4 | — | ||||||||||
Eliminations and other | — | (1 | ) | 1 | — | ||||||||||
Total | $ | 355 | $ | (327 | ) | $ | (26 | ) | $ | 2 | |||||
Note 13: Financial Instruments
We enter into derivative instruments for risk management purposes only, including derivatives designated as hedging instruments under the Derivatives and Hedging Topic of the FASB ASC and those utilized as economic hedges. We operate internationally and, in the normal course of business, are exposed to fluctuations in interest rates, foreign exchange rates and commodity prices. These fluctuations can increase the costs of financing, investing and operating the business. We have used derivative instruments, including swaps, forward contracts and options to manage certain foreign currency, interest rate and commodity price exposures.
By nature, all financial instruments involve market and credit risks. We enter into derivative and other financial instruments with major investment grade financial institutions and have policies to monitor the credit risk of those counterparties. We limit counterparty exposure and concentration of risk by diversifying counterparties. While there can be no assurance, we do not anticipate any material non-performance by any of these counterparties.
Foreign Currency Forward Contracts. We manage our foreign currency transaction risks to acceptable limits through the use of derivatives to hedge forecasted cash flows associated with foreign currency transaction exposures which are accounted for as cash flow hedges, as deemed appropriate. To the extent these derivatives are effective in offsetting the variability of the hedged cash flows, and otherwise meet the hedge accounting criteria of the Derivatives and Hedging Topic of the FASB ASC, changes in the derivatives’ fair value are not included in current earnings but are included in Accumulated other comprehensive loss. These changes in fair value will subsequently be reclassified into earnings as a component of product sales or expenses, as applicable, when the forecasted transaction occurs. To the extent that a previously designated hedging transaction is no longer an effective hedge, any ineffectiveness measured in the hedging relationship is recorded currently in earnings in the period it occurs.
48
To the extent the hedge accounting criteria are not met, the foreign currency forward contracts are utilized as economic hedges and changes in the fair value of these contracts are recorded currently in earnings in the period in which they occur. These include hedges that are used to reduce exchange rate risks arising from the change in fair value of certain foreign currency denominated assets and liabilities (i.e. payables, receivables) and other economic hedges where the hedge accounting criteria were not met.
The four quarter rolling average of the notional amount of foreign exchange contracts hedging foreign currency transactions was $9 billion and $11.2 billion at December 31, 2009 and December 31, 2008, respectively.
Commodity Forward Contracts. We enter into commodity forward contracts to reduce the risk of fluctuations in the price we pay for
certain commodities (for example, nickel) which are used directly in the production of our products, or are components of the products we procure to use in the production of our products. These hedges are economic hedges and the changes in fair value of these contracts are recorded currently in earnings in the period in which they occur. The fair value of commodity contracts were insignificant for the period ended December 31, 2009 and 2008, respectively.
The outstanding notional amount of contracts hedging commodity exposures was insignificant at December 31, 2009 and 2008, respectively.
The following table summarizes the fair value of derivative instruments as of December 31, 2009:
| (in millions of dollars) | Assets Balance Sheet Location | Liabilities Balance Sheet Location | |||||||||
Derivatives designated as hedging instruments: | |||||||||||
Foreign Exchange Contracts | Other Current Assets | $ | 107 | Accrued Liabilities | $ | 31 | |||||
Foreign Exchange Contracts | Other Assets | 33 | Other Long-Term Liabilities | 4 | |||||||
| $ | 140 | $ | 35 | ||||||||
Derivatives not designated as hedging instruments: | |||||||||||
Foreign Exchange Contracts | Other Current Assets | $ | 113 | Accrued Liabilities | $ | 106 | |||||
Foreign Exchange Contracts | Other Assets | 5 | Other Long-Term Liabilities | 3 | |||||||
| $ | 118 | $ | 109 | ||||||||
Total Derivative Contracts | $ | 258 | $ | 144 | |||||||
The impact on Accumulated other comprehensive loss from foreign exchange derivative instruments that qualified as cash flow hedges for the period was as follows:
| (in millions of dollars) | December 31, 2009 | |||
Gain recorded in Accumulated other comprehensive loss | $ | 192 | ||
Loss reclassified from Accumulated other comprehensive loss into Product Sales (effective portion) | (165 | ) | ||
Loss recognized in Other Income, net on derivatives (ineffective portion) | (5 | ) | ||
Assuming current market conditions continue, of the amount recorded in Accumulated other comprehensive loss, a $97 million pre-tax gain is expected to be reclassified into product sales or cost of products sold to reflect the fixed prices obtained from foreign exchange hedging within the next 12 months. Gains and losses recognized in earnings related to the discontinuance or the ineffectiveness of cash flow hedges was $5 million for the period ended December 31, 2009. The ineffectiveness recognized in earnings was the result of certain forecasted product sales transactions no longer occurring. At December 31, 2009, all
derivative contracts accounted for as cash flow hedges mature by December 2014.
The effect on the Consolidated Statement of Operations from foreign exchange contracts not designated as hedging instruments was as follows:
| (in millions of dollars) | December 31, 2009 | |||
Loss recognized in Other Income, net | $ | (59 | ) | |
Fair Value Disclosure. The Fair Value Measurements and Disclosures Topic of the FASB ASC defines fair value, establishes a framework for measuring fair value and expands the related disclosure requirements. The Topic indicates, among other things, that a fair value measurement assumes that the transaction to sell an asset or transfer a liability occurs in the principal market for the asset or liability or, in the absence of a principal market, the most advantageous market for the asset or liability, and also defines fair value based upon an exit price model.
49
We adopted the requirements of the Fair Value Measurements and Disclosure Topic as of January 1, 2008, with the exception of the application to non-recurring nonfinancial assets and nonfinancial liabilities, which was delayed and therefore adopted as of January 1, 2009. As of December 31, 2009, we do not have any significant non-recurring nonfinancial assets and nonfinancial liabilities.
Valuation Hierarchy. The Fair Value Measurements and Disclosure Topic of the FASB ASC establishes a valuation hierarchy for disclosure of the inputs to the valuations used to measure fair value. This hierarchy prioritizes the inputs into three broad levels as follows. Level 1 inputs are quoted prices (unadjusted) in active markets for identical assets or liabilities. Level 2 inputs are quoted prices for similar assets and liabilities in active markets, quoted prices for identical or similar assets in markets that are not active, inputs other than quoted prices that are observable for the asset or liability, including interest rates, yield curves and credit risks, or inputs that are derived principally from or corroborated by observable market data through correlation. Level 3 inputs are unobservable inputs based on our own assumptions used to measure assets and liabilities at fair value. A financial asset or liability’s classification within the hierarchy is determined based on the lowest level input that is significant to the fair value measurement.
The following table provides the assets and liabilities carried at fair value measured on a recurring basis as of December 31, 2009 and 2008:
| (in millions of dollars) | Total Carrying Value at December 31, 2009 | Quoted price in active markets (Level 1) | Significant other observable inputs (Level 2) | Unobservable inputs (Level 3) | |||||||||||
Available-for-sale | $ | 664 | $ | 664 | $ | — | $ | — | |||||||
Derivative assets | 258 | — | 258 | — | |||||||||||
Derivative liabilities | 144 | — | 144 | — | |||||||||||
| (in millions of dollars) | Total Carrying Value at December 31, 2008 | Quoted price in active markets (Level 1) | Significant other observable inputs (Level 2) | Unobservable inputs (Level 3) | |||||||||||
Available-for-sale | $ | 317 | $ | 317 | $ | — | $ | — | |||||||
Derivative assets | 188 | — | 188 | — | |||||||||||
Derivative liabilities | 680 | — | 680 | — | |||||||||||
Valuation Techniques. Our available-for-sale securities include equity investments that are traded in an active market. They are measured at fair value using closing stock prices from active markets and are classified within Level 1 of the valuation hierarchy. Our derivative assets and liabilities include foreign exchange and commodity derivatives that are measured at fair value using observable market inputs such as forward rates,
interest rates, our own credit risk and our counterparties’ credit risks. Based on these inputs, the derivative assets and liabilities are classified within Level 2 of the valuation hierarchy. Based on our continued ability to trade securities and enter into forward contracts, we consider the markets for our fair value instruments to be active.
As of December 31, 2009, there has not been any significant impact to the fair value of our derivative liabilities due to our own credit risk. Similarly, there has not been any significant adverse impact to our derivative assets based on our evaluation of our counterparties’ credit risks.
The carrying amounts and fair values of financial instruments at December 31, 2009 and 2008 are as follows:
| 2009 | 2008 | |||||||||||||||
| (in millions of dollars) | Carrying Amount | Fair Value | Carrying Amount | Fair Value | ||||||||||||
Financial Assets and Liabilities | ||||||||||||||||
Marketable equity | $ | 664 | $ | 664 | $ | 325 | $ | 325 | ||||||||
Long-term | 430 | 408 | 343 | 316 | ||||||||||||
Customer financing notes receivable | 350 | 264 | 316 | 245 | ||||||||||||
Short-term | (254 | ) | (254 | ) | (1,023 | ) | (1,023 | ) | ||||||||
Long-term debt | (9,442 | ) | (10,361 | ) | (10,408 | ) | (11,332 | ) | ||||||||
The above fair values were computed based on comparable transactions, quoted market prices, discounted future cash flows or an estimate of the amount to be received or paid to terminate or settle the agreement, as applicable. Differences from carrying amounts are attributable to interest and or credit rate changes subsequent to when the transaction occurred. The values of marketable equity securities represent our investment in common stock that is classified as available-for-sale and is accounted for at fair value. The fair values of cash and cash equivalents, accounts receivable, net, short-term borrowings, and accounts payable approximate the carrying amounts due to the short-term maturities of these instruments.
We have outstanding financing and rental commitments totaling $909 million at December 31, 2009. Risks associated with changes in interest rates on these commitments are mitigated by the fact that interest rates are variable during the commitment term and are set at the date of funding based on current market conditions, the fair value of the underlying collateral and the credit worthiness of the customers. As a result, the fair value of these financings is expected to equal the amounts funded. The fair value of the commitment itself is not readily determinable and is not considered significant. Additional information pertaining to these commitments is included in Note 4.
50
Note 14: Guarantees
We extend a variety of financial guarantees to third parties. As of December 31, 2009 and 2008 the following financial guarantees were outstanding:
| 2009 | 2008 | ||||||||||||||
| (in millions of dollars) | Maximum Potential Payment | Carrying Amount of Liability | Maximum Potential Payment | Carrying Amount of Liability | |||||||||||
Credit facilities and debt obligations – | $ | 243 | $ | 73 | $ | 208 | $ | 2 | |||||||
IAE’s financing arrangements (See Note 4) | 1,186 | 13 | 1,420 | 14 | |||||||||||
Commercial aerospace financing arrangements (See Note 4) | 320 | 12 | 137 | 10 | |||||||||||
Commercial customer financing arrangements | 229 | 1 | 209 | 5 | |||||||||||
Performance guarantees | 39 | — | 40 | — | |||||||||||
We also have obligations arising from sales of certain businesses and assets, including representations and warranties and related indemnities for environmental, health and safety, tax and employment matters. The maximum potential payment related to these obligations is not a specified amount as a number of the obligations do not contain financial caps. The carrying amount of liabilities related to these obligations was $137 million and $150 million at December 31, 2009 and 2008, respectively. For additional information regarding the environmental indemnifications, see Note 16.
We accrue for costs associated with guarantees when it is probable that a liability has been incurred and the amount can be reasonably estimated. The most likely cost to be incurred is accrued based on an evaluation of currently available facts, and where no amount within a range of estimates is more likely, the minimum is accrued. In accordance with the Guarantees Topic of FASB ASC, we record a liability for the fair value of such guarantees in the balance sheet.
We provide service and warranty policies on our products and extend performance and operating cost guarantees beyond our normal service and warranty policies on some of our products, particularly commercial aircraft engines. In addition, we incur discretionary costs to service our products in connection with specific product performance issues. Liability for performance and operating cost guarantees is based upon future product performance and durability, and is estimated largely based upon historical experience. Adjustments are made to accruals as claim data and historical experience warrant. The changes in the carrying amount of service and product warranties and product performance guarantees for the years ended December 31, 2009 and 2008, are as follows:
| (in millions of dollars) | 2009 | 2008 | ||||||
Balance as of January 1 | $ | 1,136 | $ | 1,252 | ||||
Warranties and performance guarantees issued | 400 | 429 | ||||||
Settlements made | (424 | ) | (551 | ) | ||||
Other | (40 | ) | 6 | |||||
Balance as of December 31 | $ | 1,072 | $ | 1,136 | ||||
Note 15: Collaborative Arrangements
In view of the risks and costs associated with developing new engines, Pratt & Whitney has entered into certain collaboration arrangements in which costs, revenues and risks are shared. Revenues generated from engine programs, spare parts sales, and aftermarket business under collaboration arrangements are recorded as earned in our financial statements. Amounts attributable to our collaborative partners for their share of revenues are recorded as an expense in our financial statements based upon the terms and nature of the arrangement. Costs associated with engine programs under collaborative arrangements are expensed as incurred. Under these arrangements, collaborators contribute their program share of engine parts, incur their own production costs and make certain payments to Pratt & Whitney for shared or joint program costs. The reimbursement of the collaborator’s share of program costs is recorded as a reduction of the related expense item at that time. As of December 31, 2009, the collaborators’ interests in all commercial engine programs ranged from 12 percent to 48 percent. Pratt & Whitney directs those programs and is the principal participant in all existing collaborative arrangements. There are no individually significant collaborative arrangements and none of the partners exceed 31 percent share in an individual program.
51
The following table illustrates the income statement classification and amounts attributable to transactions arising from the collaborative arrangements between participants for each period presented:
| (in millions of dollars) | 2009 | 2008 | 2007 | |||||||||
Collaborator share of revenues: | ||||||||||||
Cost of products sold | $ | 772 | $ | 1,059 | $ | 942 | ||||||
Cost of services sold | 29 | 17 | 15 | |||||||||
Collaborator share of program costs | ||||||||||||
Cost of products sold | (66 | ) | (83 | ) | (87 | ) | ||||||
Research and development | (97 | ) | (61 | ) | (44 | ) | ||||||
Selling, general and administrative | (4 | ) | (11 | ) | (3 | ) | ||||||
The Collaborative Arrangements Topic of the FASB ASC requires that participants in a collaborative arrangement report costs incurred and revenues generated from such transactions on a gross basis and in the appropriate line items in each company’s financial statements. This is pursuant to the guidance in the Revenue Recognition Topic of the FASB ASC that addresses whether an entity should report revenue gross or net depending on whether the entity functions as a principal or agent. The Collaborative Arrangements Topic also requires disclosure of the nature and purpose of the participant’s collaborative
arrangements, the participant’s rights and obligations under these arrangements, the accounting policy for collaborative arrangements, the income statement classification and amounts attributable to transactions arising from collaboration arrangements between participants, and the disclosure related to individually significant collaborative arrangements. These requirements were effective for financial statements issued for fiscal years beginning after December 15, 2008, and interim periods within those fiscal years, and must be applied retrospectively to all prior periods presented for all collaborative arrangements existing as of the effective date.
We adopted the provisions of the Collaborative Arrangements Topic as of January 1, 2009. As required, we have applied the provisions retrospectively for all periods presented. As a result, the collaborators’ share of revenues, which were previously reported on a net basis, are now reported on a gross basis. Certain reclassifications were made to the prior year amounts in both the Consolidated Balance Sheet and Consolidated Statement of Operations. In the Consolidated Balance Sheet, accounts receivable and accounts payable were each increased by $368 million at December 31, 2008, in order to reflect the amounts owed to our collaborative partners for their share of revenues on a gross basis.
The following table illustrates the effect of the retroactive application on our Revenues and Costs and Expenses for all collaborative arrangements existing as of the effective date:
| 2008 | 2007 | ||||||||||||||||||||||
| (in millions of dollars) | As Previously Reported | Effect of Retroactive Application | Currently Reported | As Previously Reported | Effect of Retroactive Application | Currently Reported | |||||||||||||||||
Revenues: | |||||||||||||||||||||||
Product sales | $ | 42,175 | $ | 1,059 | $ | 43,234 | $ | 39,240 | $ | 942 | $ | 40,182 | |||||||||||
Service sales | 15,868 | 17 | 15,885 | 14,679 | 15 | 14,694 | |||||||||||||||||
Other income, net | 638 | — | 638 | 840 | — | 840 | |||||||||||||||||
| 58,681 | 1,076 | 59,757 | 54,759 | 957 | 55,716 | ||||||||||||||||||
Costs and Expenses: | |||||||||||||||||||||||
Cost of products sold | 31,774 | 1,059 | 32,833 | 29,927 | 942 | 30,869 | |||||||||||||||||
Cost of services sold | 10,787 | 17 | 10,804 | 9,995 | 15 | 10,010 | |||||||||||||||||
Research and development | 1,771 | — | 1,771 | 1,678 | — | 1,678 | |||||||||||||||||
Selling, general and administrative | 6,724 | — | 6,724 | 6,109 | — | 6,109 | |||||||||||||||||
Operating profit | $ | 7,625 | $ | — | $ | 7,625 | $ | 7,050 | $ | — | $ | 7,050 | |||||||||||
Note 16: Contingent Liabilities
Leases. We occupy space and use certain equipment under lease arrangements. Rental commitments of $1,571 million at December 31, 2009 under long-term noncancelable operating leases are payable as follows: $420 million in 2010, $337 million in 2011, $231 million in 2012, $155 million in 2013, $103 million in 2014 and $325 million thereafter. Rent expense was $463 million in 2009, $504 million in 2008 and $437 million in 2007.
Additional information pertaining to commercial aerospace rental commitments is included in Note 4.
Environmental. Our operations are subject to environmental regulation by federal, state and local authorities in the United States and regulatory authorities with jurisdiction over our foreign operations. As described in Note 1, we have accrued for the costs of environmental remediation activities and periodically
52
reassess these amounts. We believe that the likelihood of incurring losses materially in excess of amounts accrued is remote. At December 31, 2009, we had $539 million reserved for environmental remediation.
Government. We are now, and believe that in light of the current U.S. government contracting environment we will continue to be, the subject of one or more U.S. government investigations. If we or one of our business units were charged with wrongdoing as a result of any of these investigations or other government investigations (including violations of certain environmental or export laws) the U.S. government could suspend us from bidding on or receiving awards of new U.S. government contracts pending the completion of legal proceedings. If convicted or found liable, the U.S. government could fine and debar us from new U.S. government contracting for a period generally not to exceed three years. The U.S. government could void any contracts found to be tainted by fraud.
Our contracts with the U.S. government are also subject to audits. Like many defense contractors, we have received audit reports, which recommend that certain contract prices should be reduced to comply with various government regulations. Some of these audit reports involved substantial amounts. We have made voluntary refunds in those cases we believe appropriate, have settled some allegations and continue to litigate certain cases. In addition, we accrue for liabilities associated with those matters that are probable and can be reasonably estimated. The most likely settlement amount to be incurred is accrued based upon a range of estimates. Where no amount within a range of estimates is more likely, then we accrued the minimum amount.
As previously disclosed, the Department of Justice (DOJ) sued us in 1999 in the U.S. District Court for the Southern District of Ohio, claiming that Pratt & Whitney violated the civil False Claims Act and common law. This lawsuit relates to the “Fighter Engine Competition” between Pratt & Whitney’s F100 engine and General Electric’s F110 engine. The DOJ alleges that the government overpaid for F100 engines under contracts awarded by the U.S. Air Force in fiscal years 1985 through 1990 because Pratt & Whitney inflated its estimated costs for some purchased parts and withheld data that would have revealed the overstatements. At trial of this matter, completed in December 2004, the government claimed Pratt & Whitney’s liability to be $624 million. On August 1, 2008, the trial court judge held that the Air Force had not suffered any actual damages because Pratt & Whitney had made significant price concessions. However, the trial court judge found that Pratt & Whitney violated the False Claims Act due to inaccurate statements contained in the 1983 offer. In the absence of actual damages, the trial court judge awarded the DOJ the maximum civil penalty of $7.09 million, or $10,000 for each of the 709 invoices Pratt & Whitney submitted in 1989 and
later under the contracts. Both the DOJ and UTC have appealed the decision. Should the government ultimately prevail, the outcome of this matter could result in a material effect on our results of operations in the period in which a liability would be recognized or cash flows for the period in which damages would be paid.
In December 2008, the Department of Defense (DOD) issued a contract claim against Sikorsky to recover overpayments the DOD alleges it has incurred since January 2003 in connection with cost accounting changes approved by the DOD and implemented by Sikorsky in 1999 and 2006. These changes relate to the calculation of material overhead rates in government contracts. The DOD claims that Sikorsky’s liability is approximately $83 million (including interest through December 2009). We believe this claim is without merit and Sikorsky filed an appeal in December 2009 with the U.S. Court of Federal Claims.
Except as otherwise noted above, we do not believe that resolution of any of these matters will have a material adverse effect upon our competitive position, results of operations, cash flows or financial condition.
Other. As described in Note 14, we extend performance and operating cost guarantees beyond our normal warranty and service policies for extended periods on some of our products. We have accrued our estimate of the liability that may result under these guarantees and for service costs, which are probable and can be reasonably estimated.
We have accrued for environmental investigatory, remediation, operating and maintenance costs, performance guarantees and other litigation and claims based on our estimate of the probable outcome of these matters. While it is possible that the outcome of these matters may differ from the recorded liability, we believe the resolution of these matters will not have a material impact on our competitive position, results of operations, cash flows or financial condition.
We also have other commitments and contingent liabilities related to legal proceedings, self-insurance programs and matters arising out of the normal course of business. We accrue contingencies based upon a range of possible outcomes. If no amount within this range is a better estimate than any other, then we accrue the minimum amount.
Note 17: Segment Financial Data
Our operations are classified in six principal segments. The segments are generally determined based on the management of the businesses and on the basis of separate groups of operating companies, each with general operating autonomy over diversified products and services.
53
Otis products include elevators, escalators, moving walkways and service sold to customers in the commercial and residential property industries around the world.
Carrier products include HVAC and refrigeration systems, controls, services and energy efficient products for residential, commercial, industrial and transportation applications.
UTC Fire & Security products include fire and special hazard and suppression systems and firefighting equipment, security, monitoring and rapid response systems and service and security personnel for a diversified international customer base principally in the industrial, commercial and residential property sectors.
Pratt & Whitney products include commercial, military, business jet and general aviation aircraft engines, parts and services, industrial gas turbines, geothermal power systems and space propulsion sold to a diversified customer base, including international and domestic commercial airlines and aircraft leasing companies, aircraft manufacturers, and U.S. and foreign governments. Pratt & Whitney also provides product support and
a full range of overhaul, repair and fleet management services and produces land-based power generation equipment.
Hamilton Sundstrand provides aerospace and industrial products and aftermarket services for diversified industries worldwide. Aerospace products include power generation, management and distribution systems, flight systems, engine control systems, environmental control systems, fire protection and detection systems, auxiliary power units and propeller systems. Industrial products include air compressors, metering pumps and fluid handling equipment.
Sikorsky products include military and commercial helicopters, aftermarket helicopter and aircraft parts and services.
Segment Revenues and Operating Profit. Total revenues by segment include intersegment sales, which are generally made at prices approximating those that the selling entity is able to obtain on external sales. Segment information for the years ended December 31 is as follows:
| Total Revenues | Operating Profits | |||||||||||||||||||||||
| (in millions of dollars) | 2009 | 2008 | 2007 | 2009 | 2008 | 2007 | ||||||||||||||||||
Otis | $ | 11,779 | $ | 12,949 | $ | 11,885 | $ | 2,447 | $ | 2,477 | $ | 2,321 | ||||||||||||
Carrier | 11,413 | 14,944 | 14,644 | 740 | 1,316 | 1,381 | ||||||||||||||||||
UTC Fire & Security | 5,531 | 6,462 | 5,754 | 493 | 542 | 443 | ||||||||||||||||||
Pratt & Whitney | 12,577 | 14,041 | 13,086 | 1,835 | 2,122 | 2,011 | ||||||||||||||||||
Hamilton Sundstrand | 5,599 | 6,207 | 5,636 | 857 | 1,099 | 967 | ||||||||||||||||||
Sikorsky | 6,318 | 5,368 | 4,789 | 608 | 478 | 373 | ||||||||||||||||||
Total segment | 53,217 | 59,971 | 55,794 | 6,980 | 8,034 | 7,496 | ||||||||||||||||||
Eliminations and other | (297 | ) | (214 | ) | (78 | ) | (167 | ) | (1 | ) | (60 | ) | ||||||||||||
General corporate expenses | — | — | — | (348 | ) | (408 | ) | (386 | ) | |||||||||||||||
Consolidated | $ | 52,920 | $ | 59,757 | $ | 55,716 | $ | 6,465 | $ | 7,625 | $ | 7,050 | ||||||||||||
| Total Assets | Capital Expenditures | Depreciation & Amortization | |||||||||||||||||||||||||||||||||
| (in millions of dollars) | 2009 | 2008 | 2007 | 2009 | 2008 | 2007 | 2009 | 2008 | 2007 | ||||||||||||||||||||||||||
Otis | $ | 7,908 | $ | 7,731 | $ | 7,721 | $ | 67 | $ | 150 | $ | 136 | $ | 204 | $ | 203 | $ | 186 | |||||||||||||||||
Carrier | 9,804 | 10,810 | 10,335 | 90 | 191 | 181 | 191 | 194 | 188 | ||||||||||||||||||||||||||
UTC Fire & Security | 10,304 | 10,022 | 11,143 | 72 | 95 | 101 | 214 | 238 | 202 | ||||||||||||||||||||||||||
Pratt & Whitney | 10,063 | 10,018 | 9,586 | 288 | 412 | 384 | 329 | 368 | 307 | ||||||||||||||||||||||||||
Hamilton Sundstrand | 8,509 | 8,648 | 8,965 | 114 | 141 | 160 | 174 | 178 | 163 | ||||||||||||||||||||||||||
Sikorsky | 4,167 | 3,985 | 3,412 | 95 | 165 | 128 | 68 | 62 | 52 | ||||||||||||||||||||||||||
Total segment | 50,755 | 51,214 | 51,162 | 726 | 1,154 | 1,090 | 1,180 | 1,243 | 1,098 | ||||||||||||||||||||||||||
Eliminations and other 1 | 5,007 | 5,623 | 3,726 | 100 | 62 | 63 | 78 | 78 | 75 | ||||||||||||||||||||||||||
Consolidated | $ | 55,762 | $ | 56,837 | $ | 54,888 | $ | 826 | $ | 1,216 | $ | 1,153 | $ | 1,258 | $ | 1,321 | $ | 1,173 | |||||||||||||||||
| 1 | The asset increase from 2007 to 2008 primarily reflects the increase in cash and cash equivalents held at UTC Corporate. |
54
Geographic External Revenues and Operating Profit. Geographic external revenues and operating profits are attributed to the geographic regions based on their location of origin. U.S. external revenues include export sales to commercial customers outside the United States and sales to the U.S. government, commercial and affiliated customers, which are known to be for resale to customers outside the United States. Long-lived assets are net fixed assets attributed to the specific geographic regions.
| External Revenues | Operating Profits | Long-Lived Assets | |||||||||||||||||||||||||||||||||
| (in millions of dollars) | 2009 | 2008 | 2007 | 2009 | 2008 | 2007 | 2009 | 2008 | 2007 | ||||||||||||||||||||||||||
United States Operations | $ | 28,337 | $ | 29,477 | $ | 27,665 | $ | 3,771 | $ | 3,945 | $ | 3,508 | $ | 3,096 | $ | 3,198 | $ | 3,109 | |||||||||||||||||
International Operations | |||||||||||||||||||||||||||||||||||
Europe | 12,269 | 15,180 | 13,917 | 1,743 | 2,219 | 2,204 | 1,346 | 1,347 | 1,356 | ||||||||||||||||||||||||||
Asia Pacific | 7,138 | 8,212 | 7,991 | 990 | 1,037 | 1,041 | 845 | 800 | 762 | ||||||||||||||||||||||||||
Other | 5,040 | 6,619 | 5,783 | 476 | 833 | 743 | 714 | 671 | 803 | ||||||||||||||||||||||||||
Eliminations and other | 136 | 269 | 360 | (515 | ) | (409 | ) | (446 | ) | 363 | 332 | 266 | |||||||||||||||||||||||
Consolidated | $ | 52,920 | $ | 59,757 | $ | 55,716 | $ | 6,465 | $ | 7,625 | $ | 7,050 | $ | 6,364 | $ | 6,348 | $ | 6,296 | |||||||||||||||||
Revenues from U.S. operations include export sales as follows:
| (in millions of dollars) | 2009 | 2008 | 2007 | ||||||||
Europe | $ | 2,089 | $ | 2,180 | $ | 1,858 | |||||
Asia Pacific | 2,430 | 2,221 | 2,387 | ||||||||
Other | 2,477 | 2,861 | 2,247 | ||||||||
| $ | 6,996 | $ | 7,262 | $ | 6,492 | ||||||
Major Customers. Revenues include sales under prime contracts and subcontracts to the U.S. government, primarily related to Pratt & Whitney, Hamilton Sundstrand and Sikorsky products, as follows:
| (in millions of dollars) | 2009 | 2008 | 2007 | ||||||||
Pratt & Whitney | $ | 3,942 | $ | 3,804 | $ | 3,765 | |||||
Hamilton Sundstrand | 1,230 | 1,089 | 948 | ||||||||
Sikorsky | 3,979 | 3,063 | 2,774 | ||||||||
Other | 127 | 35 | 39 | ||||||||
| $ | 9,278 | $ | 7,991 | $ | 7,526 | ||||||
Selected Quarterly Financial Data (Unaudited)
| 2009 Quarters | 2008 Quarters | ||||||||||||||||||||||||||||||
| (in millions of dollars, except per share amounts) | First | Second | Third | Fourth | First | Second | Third | Fourth | |||||||||||||||||||||||
Sales | $ | 12,199 | $ | 13,060 | $ | 13,187 | $ | 13,979 | $ | 13,834 | $ | 15,812 | $ | 14,973 | $ | 14,500 | |||||||||||||||
Gross margin | 3,092 | 3,459 | 3,351 | 3,662 | 3,596 | 4,176 | 4,038 | 3,672 | |||||||||||||||||||||||
Net income attributable to common shareowners | 722 | 976 | 1,058 | 1,073 | 1,000 | 1,275 | 1,269 | 1,145 | |||||||||||||||||||||||
Earnings per share of Common Stock: | |||||||||||||||||||||||||||||||
Basic – net income | $ | .79 | $ | 1.06 | $ | 1.15 | $ | 1.17 | $ | 1.05 | $ | 1.35 | $ | 1.36 | $ | 1.24 | |||||||||||||||
Diluted – net income | $ | .78 | $ | 1.05 | $ | 1.14 | $ | 1.15 | $ | 1.03 | $ | 1.32 | $ | 1.33 | $ | 1.23 | |||||||||||||||
Comparative Stock Data (Unaudited)
| 2009 | 2008 | ||||||||||||||||||||||
| Common Stock | High | Low | Dividend | High | Low | Dividend | |||||||||||||||||
First quarter | $ | 55.51 | $ | 37.40 | $ | .385 | $ | 77.14 | $ | 65.20 | $ | .320 | |||||||||||
Second quarter | $ | 56.99 | $ | 42.06 | $ | .385 | $ | 75.86 | $ | 60.51 | $ | .320 | |||||||||||
Third quarter | $ | 63.72 | $ | 49.00 | $ | .385 | $ | 67.95 | $ | 56.15 | $ | .320 | |||||||||||
Fourth quarter | $ | 70.89 | $ | 59.31 | $ | .385 | $ | 59.96 | $ | 41.76 | $ | .385 | |||||||||||
Our common stock is listed on the New York Stock Exchange. The high and low prices are based on the Composite Tape of the New York Stock Exchange. There were approximately 25,778 registered shareholders at December 31, 2009.
55
Performance Graph (Unaudited)
The following graph presents the cumulative total shareholder return for the five years ending December 31, 2009 for our common stock, as compared to the Standard & Poor’s 500 Stock Index and to the Dow Jones 30 Industrial Average. Our common stock price is a component of both indices. These figures assume that all dividends paid over the five-year period were reinvested, and that the starting value of each index and the investment in common stock was $100.00 on December 31, 2004.
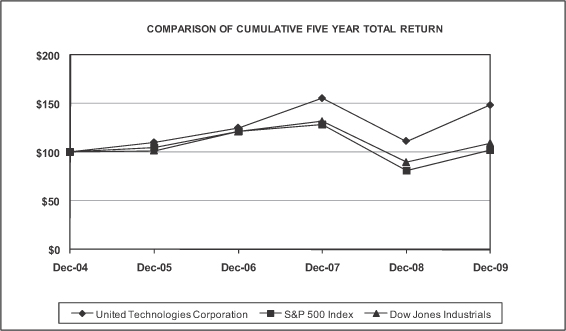
| December | |||||||||||||||||||||||
| 2004 | 2005 | 2006 | 2007 | 2008 | 2009 | ||||||||||||||||||
United Technologies Corporation | $ | 100.00 | $ | 110.05 | $ | 125.08 | $ | 155.65 | $ | 111.40 | $ | 148.48 | |||||||||||
S&P 500 Index | $ | 100.00 | $ | 104.91 | $ | 121.48 | $ | 128.16 | $ | 80.74 | $ | 102.11 | |||||||||||
Dow Jones Industrial Average | $ | 100.00 | $ | 101.75 | $ | 121.11 | $ | 131.85 | $ | 89.77 | $ | 109.34 | |||||||||||
56
Louis R. Chênevert
Chairman & Chief Executive Officer
United Technologies Corporation
(Diversified Manufacturer)
John V. Faraci
Chairman and Chief Executive Officer
International Paper
(Paper, Packaging and Distribution)
Jean-Pierre Garnier
Chief Executive Officer
Pierre Fabre S.A.
(Pharmaceutical and Cosmetic Products)
Jamie S. Gorelick
Partner
WilmerHale
(Law Firm)
Former Deputy Attorney General of the United States
Former General Counsel of the Department of Defense
Carlos M. Gutierrez
Former U.S. Secretary of Commerce
(Government Service)
Former Chairman and CEO
Kellogg Company
(Food Products)
Edward A. Kangas
Former Chairman and CEO,
Deloitte Touche Tohmatsu
(Audit and Tax Services)
Charles R. Lee
Retired Chairman and Co-Chief Executive Officer
Verizon Communications
(Telecommunications)
Richard D. McCormick
Retired Chairman, President and Chief Executive Officer
US West, Inc.
(Telecommunications)
Harold McGraw III
Chairman, President and Chief Executive Officer
The McGraw-Hill Companies
(Global Information Services)
Richard B. Myers
General, U.S. Air Force (Ret.)
and former Chairman of the Joint Chiefs of Staff
(Military Leadership)
H. Patrick Swygert
President Emeritus
Howard University
(Educational Institution)
André Villeneuve
Non-Executive Chairman of LIFFE
(Part of NYSE Euronext Group)
Christine Todd Whitman
President
The Whitman Strategy Group
(Environment and Public Policy Consulting)
Former EPA Administrator
Former Governor of New Jersey
Audit Committee
John V. Faraci, Chair
Edward A. Kangas
Richard D. McCormick
Richard B. Myers
H. Patrick Swygert
André Villeneuve
Committee on Compensation and Executive Development
Jean-Pierre Garnier, Chair
Jamie S. Gorelick
Edward A. Kangas
Charles R. Lee
Richard D. McCormick
Harold McGraw III
H. Patrick Swygert
Executive Committee
Louis R. Chênevert, Chair
Charles R. Lee
Richard D. McCormick
Finance Committee
Charles R. Lee, Chair
Louis R. Chênevert
John V. Faraci
Jamie S. Gorelick
Carlos M. Gutierrez
Richard B. Myers
André Villeneuve
Christine Todd Whitman
Committee on Nominations and Governance
Richard D. McCormick, Chair
John V. Faraci
Jean-Pierre Garnier
Carlos M. Gutierrez
Charles R. Lee
Harold McGraw III
Christine Todd Whitman
Public Issues Review Committee
Christine Todd Whitman, Chair
Jean-Pierre Garnier
Jamie S. Gorelick
Harold McGraw III
Richard B. Myers
H. Patrick Swygert
André Villeneuve
94
Paul R. Adams
Senior Vice President,
Engineering, Pratt & Whitney
David Adler
President,
Sikorsky Aerospace Services
David G. Appel
President,
HVAC EMEA, Carrier
Alain M. Bellemare
President,
Hamilton Sundstrand
Richard H. Bennett, Jr.
Vice President,
Environment, Health & Safety
Anthony C. Black
Senior Vice President,
Operations, UTC Fire & Security
Carey E. Bond
President, Sikorsky Global Helicopters and Chief Marketing Officer
Ari Bousbib
President, Commercial Companies and Executive Vice President, UTC
J. Thomas Bowler, Jr.
Senior Vice President, Human Resources and Organization
Matthew F. Bromberg
Vice President and General Manager,
Customer Service,
Hamilton Sundstrand
William M. Brown
President,
UTC Fire & Security
Louis R. Chênevert
Chairman & Chief Executive Officer
Peter C. Christman, Jr.
President, Pratt & Whitney
Power Systems
Geraud Darnis
President, Carrier
Nancy M. Davis
Vice President and
Chief Information Officer
Pierre Dejoux
President, South Asia Pacific and Gulf, Otis
Philippe Delpech
President, Commercial Refrigeration,
Carrier
John J. Doucette
President, Industrial,
Hamilton Sundstrand
Eileen P. Drake
Vice President, Operations
Michael R. Dumais
Vice President, Operations,
Hamilton Sundstrand
Thomas E. Farmer
President, Military Engines,
Pratt & Whitney
Charles D. Gill, Jr.
Senior Vice President and
General Counsel
David L. Gitlin
President, Auxiliary Power,
Engine & Control Systems,
Hamilton Sundstrand
Bruno Grob
President, North and East Europe and Africa, Otis
Lindsay Harvey
President, United Kingdom and Central Europe, Otis
Gregory J. Hayes
Senior Vice President and
Chief Financial Officer
David P. Hess
President, Pratt & Whitney
Kathleen M. Hopko
Vice President, Secretary and Associate General Counsel
Todd J. Kallman
President, Commercial Engines and Global Services, Pratt & Whitney
Ervin F. Lauterbach
President, Building Systems and Services, North America, Carrier
Robert F. Leduc
President, Flight Systems and U.S. Government Classified
Programs, Hamilton Sundstrand
James G. Maser
President,
Pratt & Whitney Rocketdyne
Michael B. Maurer
Senior Vice President,
Operations, Sikorsky
Robert J. McDonough
President, Residential and
Light Commercial
North America, Carrier
J. Michael McQuade
Senior Vice President,
Science and Technology
Didier Michaud-Daniel
President, Otis
Raymond J. Moncini
Senior Vice President,
Operations, Carrier
Michael A. Monts
Vice President,
Business Practices
David E. Parekh
Vice President, Research, and Director, United Technologies Research Center
Jeffrey P. Pino
President, Sikorsky
Jothi Purushotaman
President, UTC India
Thomas I. Rogan
Vice President, Treasurer
Kelly Romano
Senior Vice President,
Sales and Marketing,
UTC Fire & Security
John Saabas
President,
Pratt & Whitney Canada
Pedro Sainz de Baranda
President, South Europe and Mediterranean, Otis
Ross B. Shuster
President, HVAC Asia, Carrier
Margaret M. Smyth
Vice President, Controller
Scott D. Starrett
President, Sikorsky Military Systems
Tobin J. Treichel
Vice President, Tax
Charles Vo
President,
North Asia Pacific, Otis
Gregg Ward
Senior Vice President,
Government Affairs
Randal E. Wilcox
President, North and
South America, Otis
95
Corporate Office
United Technologies Corporation
United Technologies Building
Hartford, Connecticut 06101
Telephone: 860.728.7000
This report is made available to shareowners in advance of the annual meeting of shareowners to be held at 2 p.m., April 14, 2010, in Indianapolis, Indiana. The proxy statement will be made available to shareowners on or about February 26, 2010, at which time proxies for the meeting will be requested.
Information about UTC, including financial information, can be found at our Web site:www.utc.com.
Stock Listing
New York Stock Exchange
Ticker Symbol
UTX
Transfer Agent and Registrar
Computershare Trust Company, N.A., is the transfer agent, registrar and dividend disbursing agent for UTC’s Common Stock. Questions and communications regarding transfer of stock, replacement of lost certificates, dividends and address changes, and the Direct Stock Purchase and Dividend Reinvestment Plan should be directed to:
Computershare Trust Company, N.A.
250 Royall Street
Canton, Massachusetts 02021
Telephone:
Within the U.S.: 1.800.488.9281
Outside the U.S.: 1.781.575.2724
Web site:www.computershare.com/investor
TDD: 1.800.952.9245
Telecommunications device for the hearing impaired.
Certifications
UTC has included as Exhibit 31 to its Annual Report on Form 10-K for fiscal year 2009 filed with the Securities and Exchange Commission certificates of its principal executive officers and principal financial officers certifying, among other things, the information contained in the Form 10-K.
Annually UTC submits to the New York Stock Exchange (NYSE) a certificate of UTC’s Chief Executive Officer certifying that he was not aware of any violation by UTC of NYSE corporate governance listing standards as of the date of the certification.
Dividends
Dividends are usually paid on the 10th day of March, June, September and December.
Electronic Access
Rather than receiving mailed copies, registered shareowners may sign up at the following Web site for electronic communications, including annual meeting materials, stock plan statements and tax documents:www.computershare-na.com/green.
For annual meeting materials, your enrollment is revocable until a week before each year’s record date for the annual meeting. Beneficial shareowners may be able to request electronic access by contacting their broker or bank, or Broadridge Financial Solutions at:http://enroll.icsdelivery.com/utc.
Additional Information
Shareowners may obtain a copy of the UTC Annual Report on Form 10-K for 2009 filed with the Securities and Exchange Commission by writing to:
Corporate Secretary
United Technologies Corporation
United Technologies Building
Hartford, Connecticut 06101
For additional information about UTC, please contact Investor Relations at the above corporate office address, or visit our Web site at:www.utc.com.
Shareowner Information Services
Our Internet and telephone services give shareowners fast access to UTC financial results. The 24-hour-a-day, toll-free telephone service includes recorded summaries of UTC’s quarterly earnings information and other company news. Callers also may request copies of our quarterly earnings and news releases, by either fax or mail, and obtain copies of the UTC Annual Report and Form 10-K.
To access the service, dial 1.800.881.1914 from any touchtone phone and follow the recorded instructions.
Direct Registration System
If your shares are held in street name through a broker and you are interested in participating in the Direct Registration System, you may have your broker transfer the shares to Computershare Trust Company, N.A., electronically through the Direct Registration System. Interested investors can request a description of this book-entry form of registration by calling Shareholder Direct at: 1.800.881.1914.
Environmentally Friendly Report
This annual report is printed on recycled and recyclable paper.
www.utc.com
www.carrier.com
www.hamiltonsundstrand.com
www.otis.com
www.pw.utc.com
www.sikorsky.com
www.utcfireandsecurity.com
www.utcpower.com
96