|
| | | | | | | |
| |
| |
| |
| |
| |
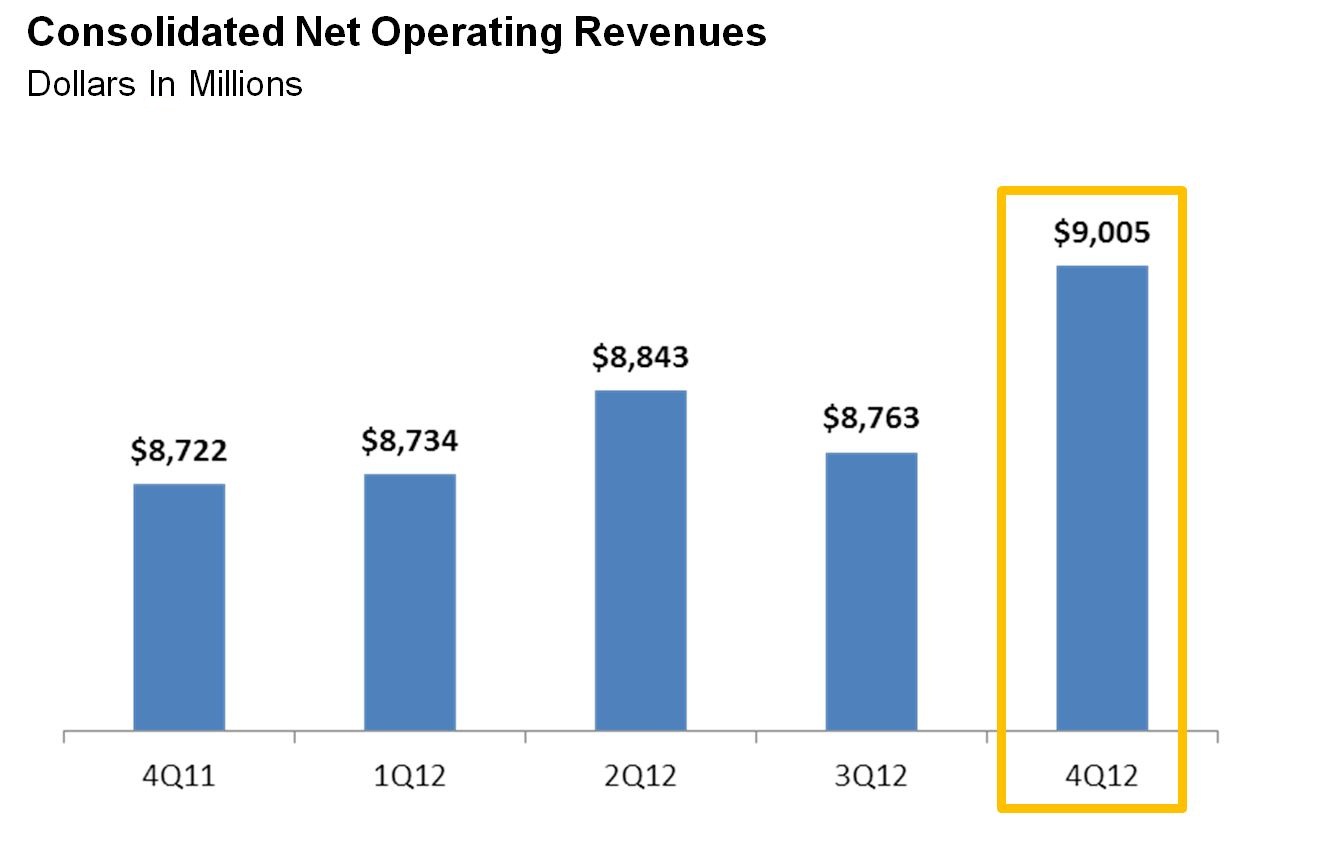
| | | Ÿ | Full year 2012 consolidated net operating revenue of $35.3 billion rose 5 percent year-over-year; annual Sprint platform wireless service revenue of $27.1 billion is the highest ever and increased nearly 15 percent year-over-year; record 2012 Sprint platform postpaid ARPU of $63.05 grew more than 5 percent over 2011 | | | | |
| | | | | | | |
| | | | | | | |
| | | | | | | |
| | | | | | | |
| | | | | | | |
| | | | | | | |
| | | | | | | | |
| | | Ÿ | Annual Operating Loss of $1.8 billion, includes accelerated depreciation of $2.1 billion; annual Adjusted OIBDA* of $4.8 billion; fourth quarter Adjusted OIBDA* of $860 million up 2 percent year-over-year | | | | |
| | | | | | | |
| | | | | | | |
| | | | | | | |
| | | | | | | | |
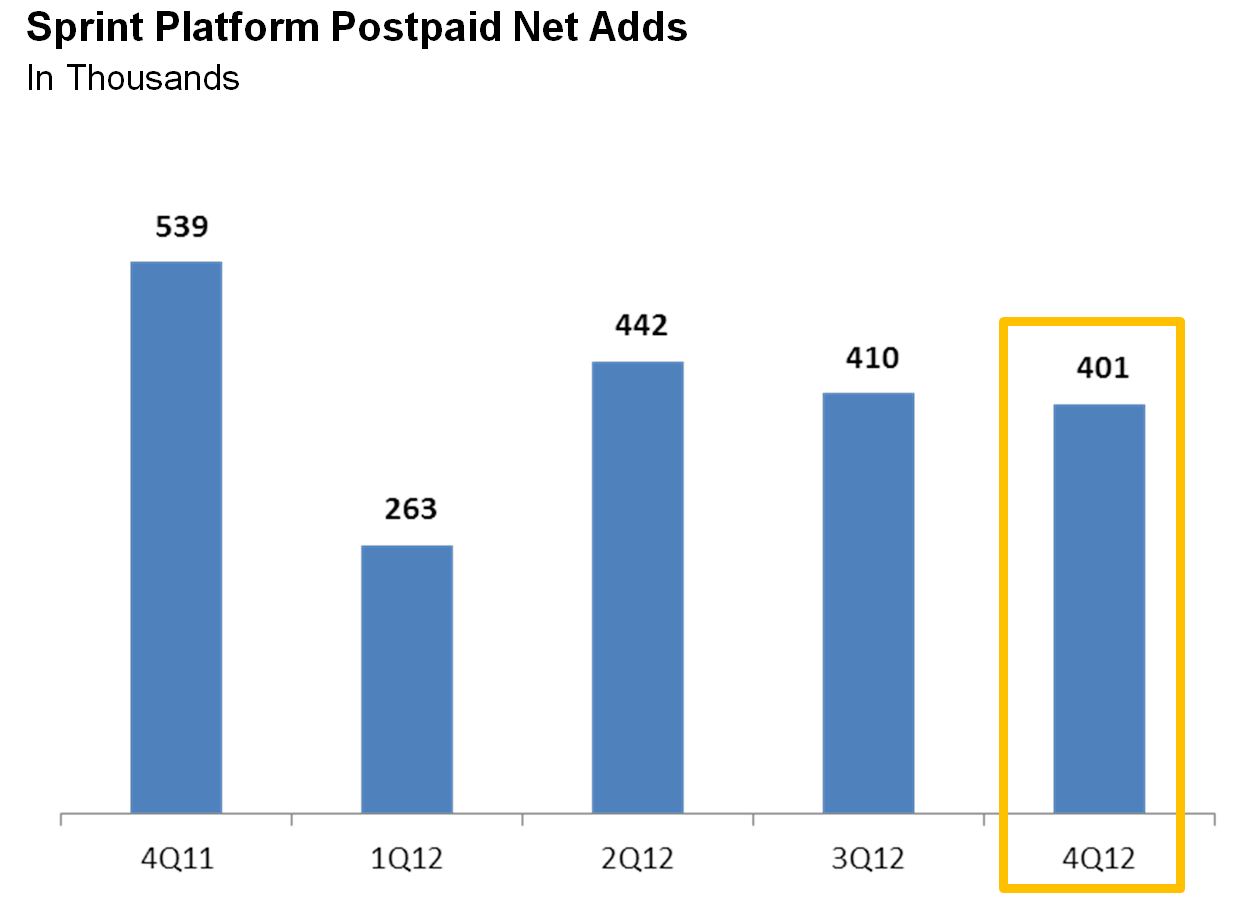
| | | Ÿ | 2012 Sprint platform postpaid net additions up 18 percent year-over-year and highest since 2007 | | | | |
| | | | | | | |
| | | | | | | |
| | | | | | | | |
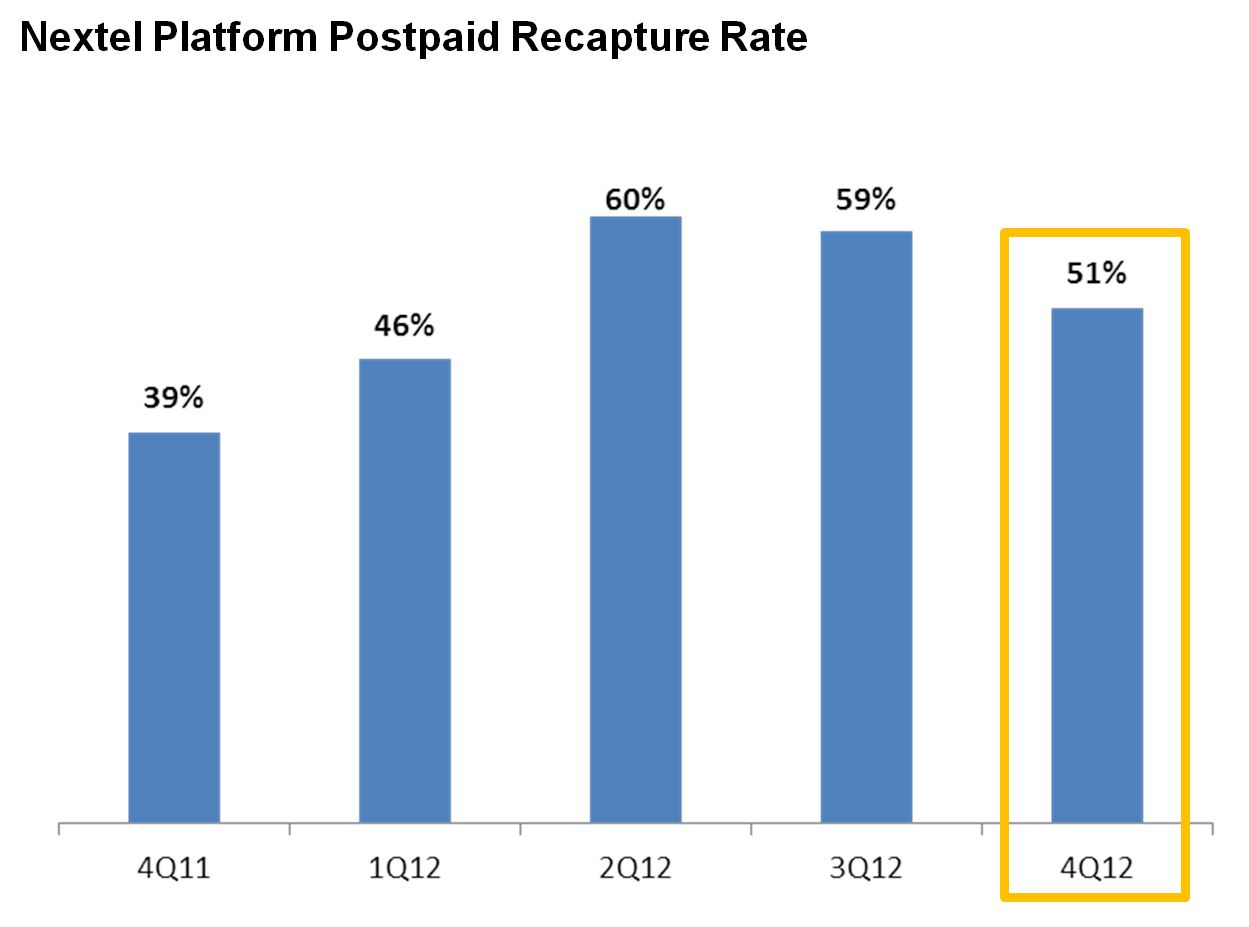
| | | Ÿ | Strong postpaid and prepaid Nextel recapture rates | | | | |
| | | | | | | |
| | | | – 2012 postpaid recapture rate of 55 percent – Fourth quarter postpaid recapture rate of 51 percent – Best ever quarterly prepaid recapture rate of 50 percent | | | | |
| | | | | | | | |
| | | Ÿ | Annual smartphone sales of nearly 20 million | | | | |
| | | | – 2012 iPhone® sales of more than 6.6 million - 40 percent to new customers – Best ever quarterly iPhone sales of approximately 2.2 million - 38 percent to new customers – 89 percent of quarterly Sprint platform postpaid handset sales were smartphones | | | | |
| | | | | | | |
| | | | | | | |
| | | | | | | |
| | | | | | | |
| | | | | | | | |
| | | Ÿ | Network Vision sites on air nearly doubled in last 90 days | | | | |
| | | | – 4G LTE now launched in 58 cities with nearly 170 more expected in coming months – Construction started in nearly 450 cities – More than 19,500 sites now ready for construction – Average current new sites on air per week have grown 83 percent from third quarter – More than 8,000 sites on air | | | | |
| | | | | | | |
| | | | | | | |
| | | | | | | |
| | | | | | | |
| | | | | | | |
| | | | | | | |
| | | | | | | |
| | | | | | | | |
|
| | | | |
| | SPRINT NEXTEL REPORTS FOURTH QUARTER AND FULL YEAR 2012 RESULTS |
| | | | |
| | Sprint Nextel Corp. (NYSE: S) today reported fourth quarter consolidated net operating revenue of $9 billion and full year 2012 consolidated net operating revenue of $35.3 billion. Sprint reported record quarterly and annual Sprint platform wireless service revenues of nearly $7 billion and $27.1 billion, respectively. Driven by increasing postpaid ARPU and continued Sprint platform subscriber growth, wireless service revenues for the Sprint platform grew 12 percent year-over-year for the quarter and nearly 15 percent for the full year. The company reported a net loss of $1.3 billion and a diluted net loss of $.44 per share for the fourth quarter of 2012 as compared to a net loss of $1.3 billion and a diluted net loss of $.43 per share in the fourth quarter of 2011. Sprint's fourth quarter 2012 results include accelerated depreciation of approximately $400 million, or negative $.13 per share (pre-tax), primarily related to Network Vision, including the expected shutdown of the Nextel platform, and $45 million or negative $.01 per share (pre-tax) related to impacts from Hurricane Sandy. The Sprint platform postpaid subscriber base grew for the eleventh consecutive quarter, with net additions of 401,000 driven by a postpaid Nextel recapture rate of 51 percent, or 333,000 subscribers, and strong 4G LTE smartphone sales. Sprint platform prepaid net additions equaled 525,000 due in part to the best ever quarterly prepaid Nextel recapture rate of 50 percent, or 188,000 subscribers. Sprint sold approximately 2.2 million iPhones in the fourth quarter with 38 percent purchased by new customers. As of the end of the fourth quarter, Sprint had sold more than 4 million 4G LTE smartphones. “Sprint's strong performance was fueled by record wireless service revenue on the Sprint platform due to year-over-year postpaid ARPU growth and Sprint platform net additions,” said Dan Hesse, Sprint CEO. “As a result, quarterly Adjusted OIBDA* performance improved year-over-year in spite of significant cost increases related to Network Vision and the iPhone, both of which are key investments for our business that we expect will improve the customer experience and lead to growth in the years ahead.”
|
| |
| |
| |
| |
| |
| |
| |
| |
| |
| |
| |
| |
| |
| |
| |
| |
| | TABLE OF CONTENTS | | |
| | Network Vision Highlights | 3 |
| |
| | Customer Experience and Brand Highlights | 3 |
|
| | Capital Structure | 3 |
|
| | Consolidated Results | 4 |
|
| | Wireless Results | 5 |
|
| | Wireline Results | 8 |
|
| | Forecast | 8 |
|
| | Financial and Operational Results | 9 |
|
| | Notes to Financial Information | 16 |
|
| | Financial Measures | 17 |
|
| | Safe Harbor | 17 |
|
| | | | |
| | SPRINT'S 4Q12 EARNINGS CONFERENCE CALL-8 A.M. TODAY |
| | U.S. or Canada: 800-938-1120 | | |
| | Internationally: 706-634-7849 | | |
| | Conference ID: 87240993 | | |
| | To listen via the Internet: sprint.com/investors | | |
|
| |
| NETWORK VISION HIGHLIGHTS | |
| | |
| Sprint continues to make significant progress on Network Vision deployment. The number of sites that are either ready for construction or already underway has grown to more than 19,500 - approximately half the total number of sites to be upgraded. To date more than 8,000 sites are on air and meeting speed and coverage enhancement targets. Recent weekly construction starts are up 56 percent from the third quarter. Sprint continues to expect to have 12,000 sites on air by the end of the first quarter of 2013. |
| |
As part of Network Vision, Sprint has launched 4G LTE in 58 cities and expects that 4G LTE will be available in nearly 170 additional cities in the coming months. During 2012 Sprint launched 15 4G LTE devices including Apple iPad mini and iPad with Retina Display, LG Optimus G™ and Samsung Galaxy Note® II in the fourth quarter. |
|
| |
| CUSTOMER EXPERIENCE AND BRAND HIGHLIGHTS | |
| | |
| During the fourth quarter, Sprint received the Frost & Sullivan North American Customer Value Enhancement Award in Mobile Communications and Collaboration. Sprint was also named to Connected World magazine's annual list of the 100 most important and influential providers of machine-to-machine services and is number 16 on Chief Executive magazine's 2013 Best Companies for Leaders list. For the fourth straight year, Newsweek's annual Green Rankings recognized Sprint as one of the greenest companies in the U.S., ranking the company third among the greenest companies in America in its 2012 report. Finally, the Global Reporting Initiative verified Sprint is the first U.S. telecom company to deliver an “A+” Corporate Responsibility Performance Report. | |
| | |
During the fourth quarter, Sprint introduced a variety of products and services that benefit customers across its brands. Sprint launched Pinsight Media+™, a new advertising service that gives advertisers the power to reach consumers on their mobile device in a more personalized way. Sprint unveiled Sprint VelocitySM, a pioneering capability that encompasses the development, integration and marketing of in-vehicle communications systems. Automakers can use Sprint Velocity as a complete turnkey solution or on a modular basis to suit their customized needs. Sprint's Global Wholesale & Emerging Solutions group introduced two new products: Sprint Phone Connect for Wholesale, a plug-and-play device product that allows mobile virtual network operators to provide their customers with a low-cost, high-quality home phone service without the need for a landline or broadband service, and Mobile Broadband on Demand, which allows international, retail, travel and hospitality companies to generate new revenue streams through the sale or rental of mobile broadband devices on Sprint's trusted networks. Sprint's Assurance Wireless® brand for eligible low-income consumers, launched service in Idaho and New Mexico in the fourth quarter and its Virgin Mobile USA prepaid brand began offering the award-winning Samsung Galaxy S® II 4G. | |
|
|
| |
| “Sprint's strong performance was fueled by record wireless service revenue on the Sprint platform due to year-over-year postpaid ARPU growth and Sprint platform net additions,” said Dan Hesse, Sprint CEO. “As a result, quarterly Adjusted OIBDA* performance improved year-over-year in spite of significant cost increases related to Network Vision and the iPhone, both of which are key investments for our business that we expect will improve the customer experience and lead to growth in the years ahead.” | CAPITAL STRUCTURE |
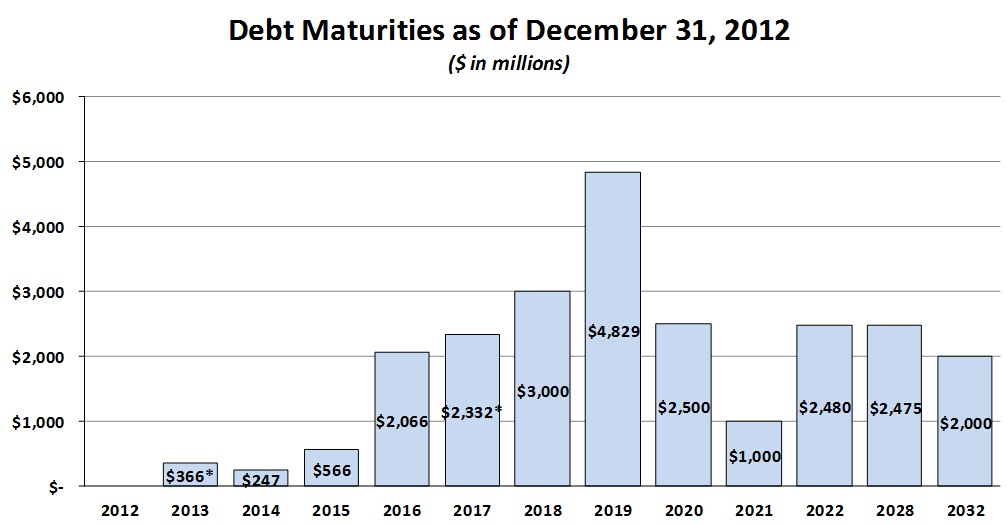
| During the fourth quarter, Sprint raised additional debt financing of nearly $2.3 billion and used the proceeds to retire nearly $1.2 billion of 2014 debt maturities and more than $1.1 billion of 2015 maturities. The remaining outstanding principal balances of Sprint's 2013, 2014 and 2015 maturities are $366 million, $247 million and $566 million, respectively. Sprint also received $3.1 billion from SoftBank in exchange for a newly issued 1 percent, seven-year convertible bond related to the companies' pending merger. |
| |
| As of December 31, 2012, the company's liquidity was approximately $9.5 billion consisting of $8.2 billion in cash, cash equivalents and short-term investments and $1.3 billion of undrawn borrowing capacity available under its revolving bank credit facility. Additionally, the company has borrowed $296 million to-date of available funding under the secured equipment credit facility, reducing the remaining undrawn availability to $704 million. Sprint generated $216 million of cash flow from operating activities and negative Free Cash Flow* of $1.3 billion in the quarter. |
|
| |
| THE SPRINT QUARTERLY INVESTOR UPDATE- 4Q12 | 3 |
CONSOLIDATED RESULTS
Consolidated net operating revenues of $9.0 billion for the quarter were approximately 3 percent higher than in the fourth quarter of 2011 and third quarter of 2012. The quarterly year-over-year improvement was primarily due to higher wireless service and equipment revenues, partially offset by a reduction in wireline revenues. Revenue for the quarter grew sequentially, primarily due to higher equipment revenues.
Operating loss was $705 million (including $45 million of estimated costs related to Hurricane Sandy) compared to an operating loss of $438 million for the fourth quarter of 2011 and $231 million for the third quarter of 2012. The quarterly year-over-year change was primarily driven by items identified below in Adjusted OIBDA* and by accelerated depreciation of approximately $400 million associated with the expected mid-2013 shutdown of the Nextel platform. The sequential change was primarily driven by items identified below in Adjusted OIBDA*.
Adjusted OIBDA* was $860 million for the quarter, compared to $842 million for the fourth quarter of 2011 and $1.28 billion in the third quarter of 2012. The quarterly year-over-year increase in Adjusted OIBDA* was primarily due to higher postpaid and prepaid wireless service revenues and lower total cost of service expense, partially offset by an increase in equipment net subsidy, selling expenses and lower Wireline revenue. Sequentially, Adjusted OIBDA* decreased primarily as a result of an increase in equipment net subsidy and selling expenses.
Capital expenditures(1), excluding capitalized interest of $9 million, were $1.9 billion in the quarter, compared to $900 million in the fourth quarter of 2011 and $1.5 billion in the third quarter of 2012. Wireless capital expenditures were $1.8 billion in the fourth quarter of 2012, compared to $774 million in the fourth quarter of 2011 and $1.4 billion in the third quarter of 2012. During the quarter, the company invested $1.3 billion for Network Vision and approximately $280 million in capacity related to both legacy network and Network Vision equipment. Wireline capital expenditures were $58 million in the fourth quarter of 2012, compared to $34 million in the fourth quarter of 2011 and $60 million in the third quarter of 2012. Corporate capital expenditures were $79 million in the fourth quarter of 2012, compared to $92 million in the fourth quarter of 2011 and $53 million in the third quarter of 2012, primarily related to IT infrastructure to support our Wireless and Wireline businesses.
Net cash provided by operating activities was $216 million for the quarter, compared to $1.1 billion for the fourth quarter of 2011 and $628 million for the third quarter of 2012.
Free Cash Flow* was negative $1.3 billion for the quarter, compared to positive $257 million for the fourth quarter of 2011 and negative $487 million for the third quarter of 2012.
|
| |
| THE SPRINT QUARTERLY INVESTOR UPDATE- 4Q12 | 4 |
WIRELESS RESULTS
| |
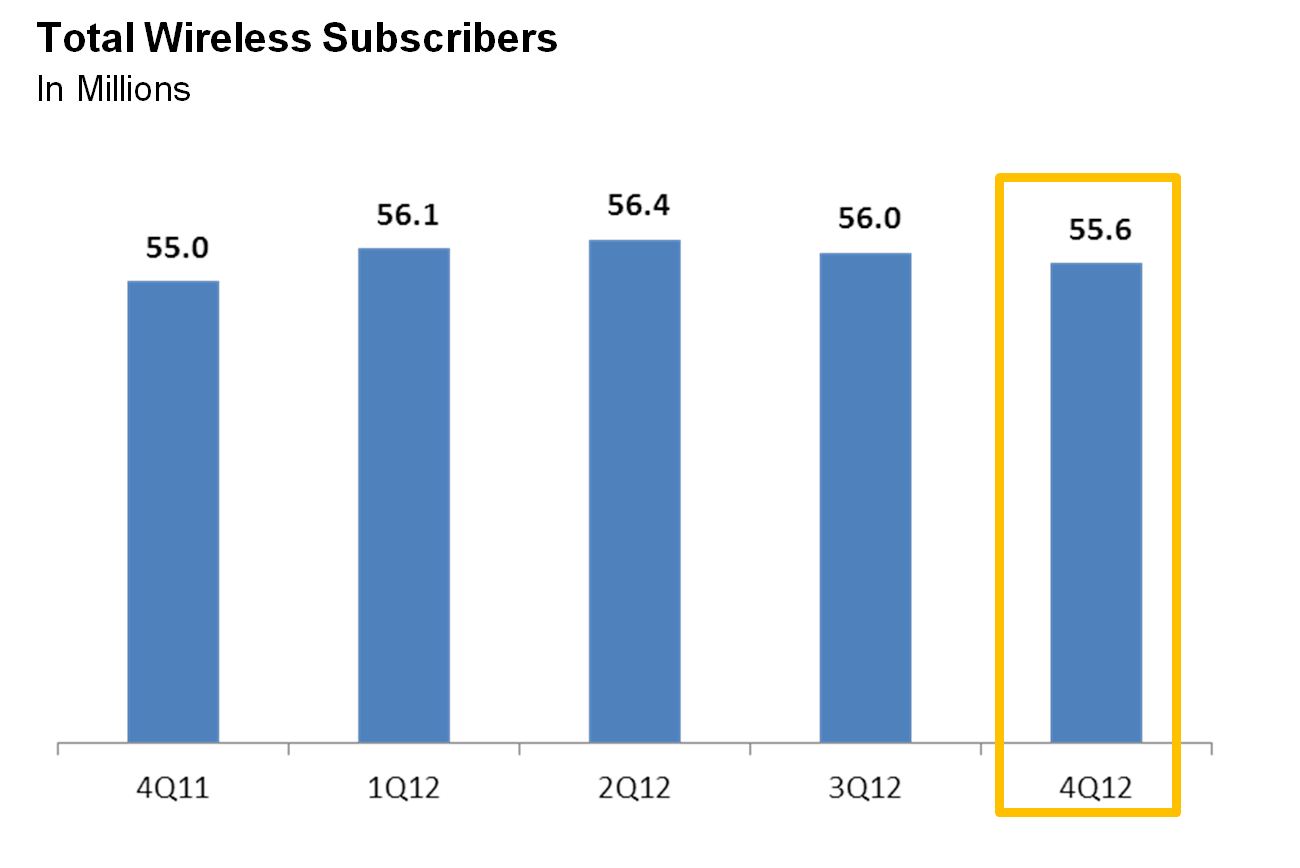
• | The company served more than 55.6 million customers at the end of the fourth quarter of 2012. This includes nearly 31.9 million postpaid subscribers (30.2 million on the Sprint platform and 1.6 million on the Nextel platform), 15.6 million prepaid subscribers (15.1 million on the Sprint platform and 500,000 on the Nextel platform) and approximately 8.2 million wholesale and affiliate subscribers, all of whom utilize the Sprint platform. |
| |
• | The Sprint platform added 401,000 net postpaid customers during the quarter, which include 333,000 net subscribers recaptured from the postpaid Nextel platform. |
| |
• | The Nextel platform postpaid recapture rate was 51 percent of total subscribers who left the postpaid Nextel platform during the period and were recaptured on the postpaid Sprint platform as compared to 39 percent in the fourth quarter of 2011 and 59 percent in the third quarter of 2012. The Nextel platform lost 644,000 net postpaid customers in the quarter, which include 333,000 net subscribers recaptured on the postpaid Sprint platform. |
| |
• | The Sprint platform added 525,000 net prepaid customers during the quarter, which include 188,000 net subscribers recaptured from the prepaid Nextel platform. The Nextel platform lost 376,000 net prepaid customers in the quarter, which include 188,000 net subscribers recaptured on the prepaid Sprint platform. |
| |
• | Wholesale and affiliate net subscriber losses for the quarter were 243,000 subscribers (all of whom are on the Sprint platform). |
| |
• | The credit quality of Sprint's end-of-period postpaid customers was 82 percent prime which is flat when compared to the year-ago period and the third quarter of 2012. |
| |
• | Sprint platform postpaid churn was 1.98 percent, compared to 1.99 percent for the year-ago period and 1.88 percent for the third quarter of 2012. Sprint platform quarterly postpaid churn was essentially flat year-over-year, primarily due to a reduction in involuntary churn, offset by an increase in voluntary churn. The sequential increase in Sprint platform postpaid churn was driven primarily by an increase in voluntary churn. |
| |
| • | Approximately 10 percent of Sprint platform postpaid customers, excluding postpaid Nextel platform recaptures, upgraded their handsets during the fourth quarter of 2012. Including Nextel recaptures, approximately 11 percent of Sprint platform postpaid customers upgraded their handsets during the quarter compared to 9 percent for the year-ago period and 10 percent for the third quarter of 2012. The year-over-year period increase was driven by strong demand for smartphones and subscribers who left the Nextel platform and were |
|
| |
| THE SPRINT QUARTERLY INVESTOR UPDATE- 4Q12 | 5 |
recaptured on the Sprint platform. The sequential increase was primarily driven by strong demand for smartphones.
| |
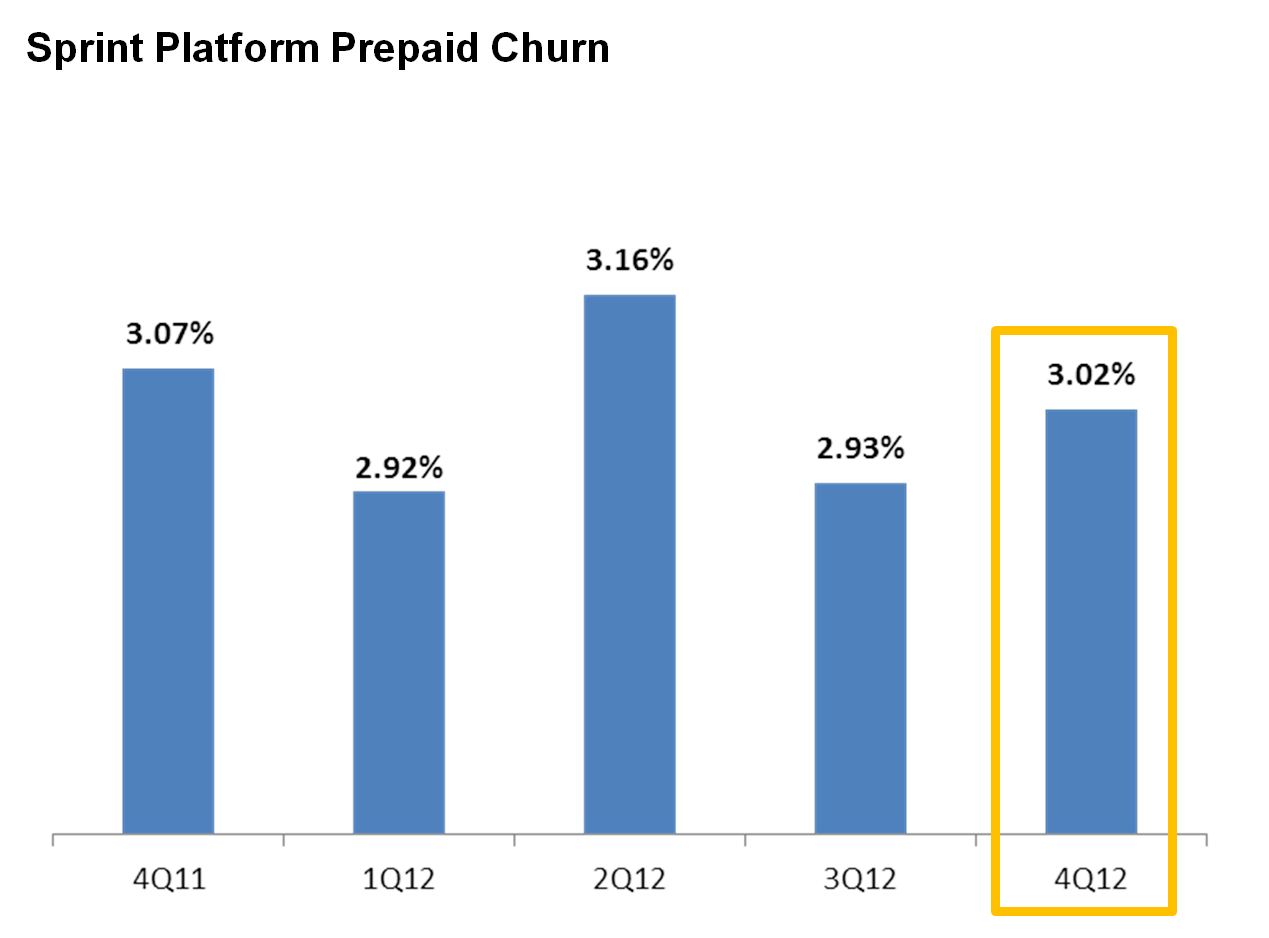
• | Sprint platform prepaid churn for the fourth quarter was 3.02 percent, compared to 3.07 percent for the year-ago period and 2.93 percent for the third quarter of 2012. The quarterly year-over-year improvement in Sprint platform prepaid churn was primarily a result of lower churn for the Boost brand, partially offset by higher churn for Assurance Wireless®. The sequential increase in churn was primarily related to higher Assurance Wireless churn. |
| |
• | Wireless retail service revenues of $7.1 billion for the quarter represent an increase of nearly 3 percent compared to the fourth quarter of 2011 and a decrease of 1 percent compared to the third quarter of 2012. The quarterly year-over-year improvement was primarily due to higher postpaid ARPU as well as an increased number of Sprint platform subscribers, partially offset by lower Nextel subscribers. Sequentially, wireless retail service revenues decreased, primarily as a result of fewer Nextel subscribers. |
| |
• | Wireless postpaid ARPU of $61.47 for the quarter increased year-over-year by $2.88, while sequentially ARPU increased by $.29. Quarterly year-over-year and sequential ARPU benefited from higher monthly recurring revenues, primarily as a result of the premium data add-on charges for smartphones introduced since the first quarter of 2011, partially offset by $.19 per user of customer credits related to Hurricane Sandy (the impact of Hurricane Sandy to Sprint platform postpaid ARPU was $.18 per user). |
| |
• | Prepaid ARPU of $26.69 increased from $26.62 in the fourth quarter of 2011 as a result of improvements in Boost and Virgin Mobile ARPU. Prepaid ARPU was flat sequentially excluding $.08 per user of customer credits related to Hurricane Sandy. |
| |
• | Quarterly wholesale, affiliate and other revenues of $135 million increased by $61 million, compared to the year-ago period and increased by $14 million sequentially. The year-over-year increase is primarily from growth in MVNOs reselling prepaid services. |
| |
• | Total wireless net operating expenses were $9.0 billion in the fourth quarter, compared to $8.4 billion in the year-ago period and $8.3 billion in the third quarter of 2012. |
| |
| • | Wireless equipment net subsidy in the fourth quarter was approximately $2.0 billion (equipment revenue of $1.0 billion, less cost of products of $3.0 billion), compared to approximately $1.7 billion in the year-ago period and approximately $1.6 billion in the third quarter of 2012. The quarterly year-over-year and sequential increase in net subsidy are primarily due to an increased upgrade rate and higher volume |
|
| |
| THE SPRINT QUARTERLY INVESTOR UPDATE- 4Q12 | 6 |
of iPhone and 4G LTE devices, which on average carry a higher subsidy rate per handset as compared to other handsets.
| |
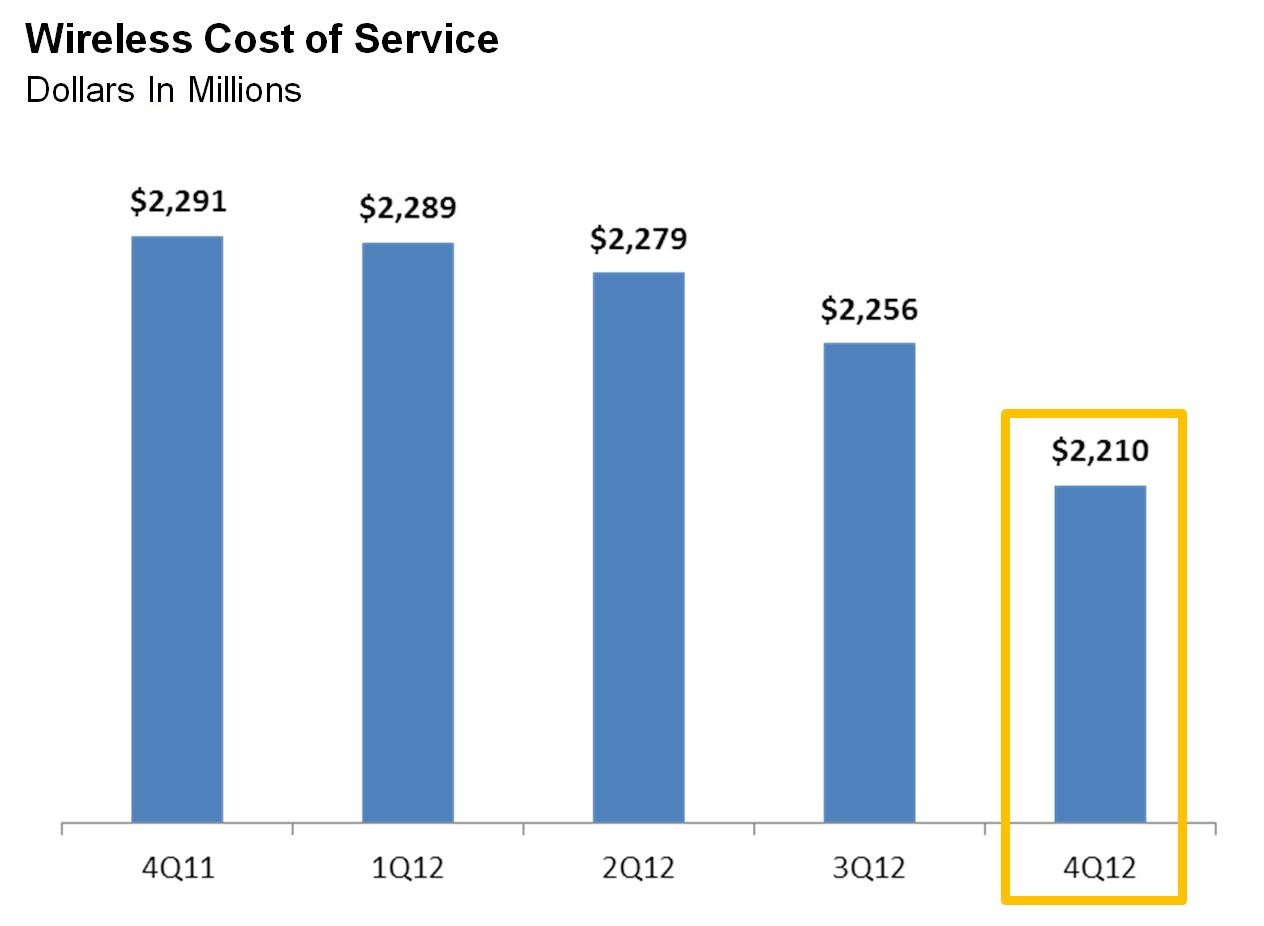
• | Wireless cost of service decreased approximately 4 percent year-over-year primarily due to lower service and repair expense and savings related to Nextel platform sites taken off air as well as lower roaming and license and fee expenses, partially offset by higher estimated Network Vision related expenses. Wireless cost of service decreased 2 percent sequentially, primarily due to lower service and repair expenses and seasonally lower roaming expenses, partially offset by higher estimated Network Vision related expenses. |
| |
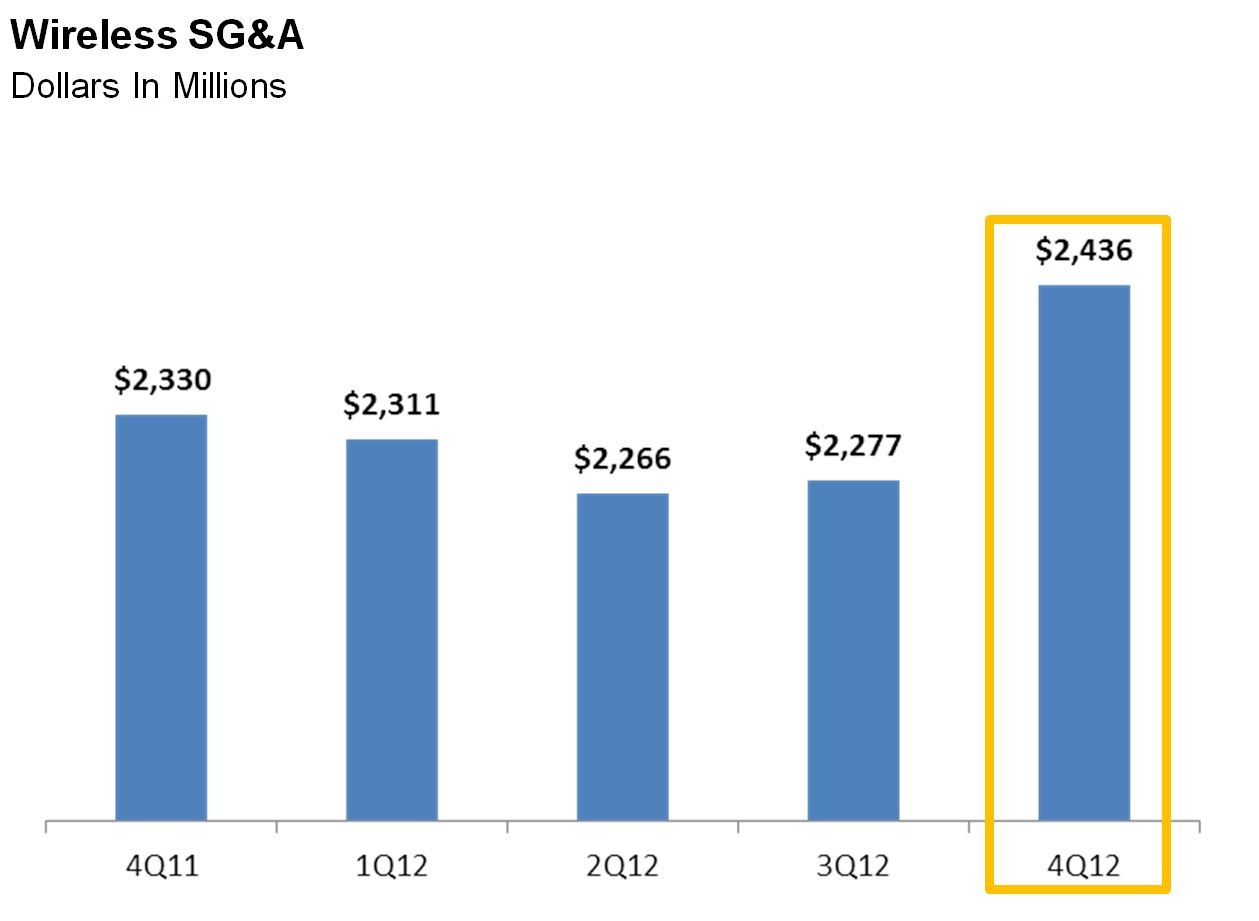
• | Wireless SG&A expenses increased 5 percent year-over-year and 7 percent sequentially. Quarterly year-over-year increases in sales and marketing expenses were partially offset by reductions in customer care and bad debt expenses. Sequentially, SG&A expenses increased primarily as a result of higher sales expenses. |
| |
• | Wireless depreciation and amortization expense increased $321 million year-over-year and $14 million sequentially. The year-over-year increase was primarily related to accelerated depreciation expense associated with the expected mid-2013 shutdown of the Nextel platform. |
|
| |
| THE SPRINT QUARTERLY INVESTOR UPDATE- 4Q12 | 7 |
WIRELINE RESULTS
| |
• | Wireline revenues of $949 million for the quarter declined 10 percent year-over-year, primarily as a result of an intercompany rate reduction based on current market prices for voice and IP services sold to the wireless segment as well as lower voice, data and IP volumes. Sequentially, fourth quarter wireline revenues increased 1 percent, primarily as a result of increased IP volumes. |
| |
• | Total wireline net operating expenses were $878 million in the fourth quarter of 2012. Net operating expenses declined approximately 12 percent year-over-year due to lower cost of service from continued declines in voice volumes and improvement in SG&A expenses. Sequentially, net operating expenses decreased 1 percent as a result of declines in SG&A. |
FORECAST
The company expects 2013 Adjusted OIBDA* to be between $5.2 billion and $5.5 billion.
|
| |
| THE SPRINT QUARTERLY INVESTOR UPDATE- 4Q12 | 8 |
Wireless Operating Statistics (Unaudited)
|
| | | | | | | | | | | | | | | | |
| | Quarter To Date | | Year To Date |
| | 12/31/12 |
| 9/30/12 |
| 12/31/11 |
| | 12/31/12 |
| 12/31/11 |
|
| Net Additions (Losses) (in thousands) | | | | | | |
| Sprint platform: | | | | | | |
Postpaid (2) | 401 |
| 410 |
| 539 |
| | 1,516 |
| 1,283 |
|
Prepaid (3) | 525 |
| 459 |
| 899 |
| | 2,305 |
| 4,293 |
|
| Wholesale and affiliate | (243 | ) | 14 |
| 954 |
| | 944 |
| 2,697 |
|
| Total Sprint platform | 683 |
| 883 |
| 2,392 |
| | 4,765 |
| 8,273 |
|
| Nextel platform: | | | | | | |
Postpaid (2) | (644 | ) | (866 | ) | (378 | ) | | (2,653 | ) | (1,381 | ) |
Prepaid (3) | (376 | ) | (440 | ) | (392 | ) | | (1,507 | ) | (1,781 | ) |
| Total Nextel platform | (1,020 | ) | (1,306 | ) | (770 | ) | | (4,160 | ) | (3,162 | ) |
| | | | | | | |
| Total retail postpaid net (losses) additions | (243 | ) | (456 | ) | 161 |
| | (1,137 | ) | (98 | ) |
| Total retail prepaid net additions | 149 |
| 19 |
| 507 |
| | 798 |
| 2,512 |
|
| Total wholesale and affiliate net (losses) additions | (243 | ) | 14 |
| 954 |
| | 944 |
| 2,697 |
|
| Total Wireless Net (Losses) Additions | (337 | ) | (423 | ) | 1,622 |
| | 605 |
| 5,111 |
|
| | | | | | | |
| End of Period Subscribers (in thousands) | | | | | | |
| Sprint platform: | | | | | | |
Postpaid (2) | 30,245 |
| 29,844 |
| 28,729 |
| | 30,245 |
| 28,729 |
|
Prepaid (3) | 15,133 |
| 14,608 |
| 12,828 |
| | 15,133 |
| 12,828 |
|
| Wholesale and affiliate | 8,162 |
| 8,405 |
| 7,218 |
| | 8,162 |
| 7,218 |
|
| Total Sprint platform | 53,540 |
| 52,857 |
| 48,775 |
| | 53,540 |
| 48,775 |
|
| Nextel platform: | | | | | | |
Postpaid (2) | 1,632 |
| 2,276 |
| 4,285 |
| | 1,632 |
| 4,285 |
|
Prepaid (3) | 454 |
| 830 |
| 1,961 |
| | 454 |
| 1,961 |
|
| Total Nextel platform | 2,086 |
| 3,106 |
| 6,246 |
| | 2,086 |
| 6,246 |
|
| | | | | | | |
| Total retail postpaid end of period subscribers | 31,877 |
| 32,120 |
| 33,014 |
| | 31,877 |
| 33,014 |
|
| Total retail prepaid end of period subscribers | 15,587 |
| 15,438 |
| 14,789 |
| | 15,587 |
| 14,789 |
|
| Total wholesale and affiliate end of period subscribers | 8,162 |
| 8,405 |
| 7,218 |
| | 8,162 |
| 7,218 |
|
| Total End of Period Subscribers | 55,626 |
| 55,963 |
| 55,021 |
| | 55,626 |
| 55,021 |
|
| | | | | | | |
| Supplemental Data - Connected Devices | | | | | | |
| End of Period Subscribers (in thousands) | | | | | | |
| Retail postpaid | 813 |
| 817 |
| 783 |
| | 813 |
| 783 |
|
| Wholesale and affiliate | 2,670 |
| 2,542 |
| 2,077 |
| | 2,670 |
| 2,077 |
|
| Total | 3,483 |
| 3,359 |
| 2,860 |
| | 3,483 |
| 2,860 |
|
| | | | | | | |
| Churn | | | | | | |
| Sprint platform: | | | | | | |
| Postpaid | 1.98 | % | 1.88 | % | 1.99 | % | | 1.89 | % | 1.85 | % |
| Prepaid | 3.02 | % | 2.93 | % | 3.07 | % | | 3.01 | % | 3.28 | % |
| Nextel platform: | | | | | | |
| Postpaid | 5.27 | % | 4.38 | % | 1.89 | % | | 3.24 | % | 1.92 | % |
| Prepaid | 9.79 | % | 9.39 | % | 7.18 | % | | 8.55 | % | 7.10 | % |
| | | | | | | |
| Total retail postpaid churn | 2.18 | % | 2.09 | % | 1.98 | % | | 2.02 | % | 1.86 | % |
| Total retail prepaid churn | 3.30 | % | 3.37 | % | 3.68 | % | | 3.45 | % | 4.05 | % |
| | | | | | | |
ARPU (a) | | | | | | |
| Sprint platform: | | | | | | |
| Postpaid | $ | 63.04 |
| $ | 63.21 |
| $ | 61.22 |
| | $ | 63.05 |
| $ | 59.76 |
|
| Prepaid | $ | 26.30 |
| $ | 26.19 |
| $ | 25.16 |
| | $ | 25.92 |
| $ | 25.43 |
|
| Nextel platform: | | | | | | |
| Postpaid | $ | 37.27 |
| $ | 38.65 |
| $ | 41.91 |
| | $ | 39.65 |
| $ | 43.25 |
|
| Prepaid | $ | 35.59 |
| $ | 34.73 |
| $ | 34.91 |
| | $ | 35.91 |
| $ | 35.17 |
|
| | | | | | | |
| Total retail postpaid ARPU | $ | 61.47 |
| $ | 61.18 |
| $ | 58.59 |
| | $ | 60.84 |
| $ | 57.27 |
|
| Total retail prepaid ARPU | $ | 26.69 |
| $ | 26.77 |
| $ | 26.62 |
| | $ | 26.72 |
| $ | 27.40 |
|
| | | | | | | |
| Nextel Platform Subscriber Recaptures | | | | | | |
Subscribers (in thousands) (4): | | | | | | |
| Postpaid | 333 |
| 516 |
| 168 |
| | 1,508 |
| 508 |
|
| Prepaid | 188 |
| 152 |
| 152 |
| | 620 |
| 724 |
|
Rate (5): | | | | | | |
| Postpaid | 51 | % | 59 | % | 39 | % | | 55 | % | 30 | % |
| Prepaid | 50 | % | 34 | % | 25 | % | | 33 | % | 24 | % |
(a)ARPU is calculated by dividing service revenue by the sum of the average number of subscribers in the applicable service category. Changes in average monthly service revenue reflect subscribers for either the postpaid or prepaid service category who change rate plans, the level of voice and data usage, the amount of service credits which are offered to subscribers, plus the net effect of average monthly revenue generated by new subscribers and deactivating subscribers.
|
| |
| THE SPRINT QUARTERLY INVESTOR UPDATE- 4Q12 | 9 |
CONDENSED CONSOLIDATED STATEMENTS OF OPERATIONS (Unaudited)
(Millions, except per Share Data)
|
| | | | | | | | | | | | | | | | |
| | Quarter To Date | | Year To Date |
| | 12/31/12 |
| 9/30/12 |
| 12/31/11 |
| | 12/31/12 |
| 12/31/11 |
|
| | | | | | | |
| Net Operating Revenues | $ | 9,005 |
| $ | 8,763 |
| $ | 8,722 |
| | $ | 35,345 |
| $ | 33,679 |
|
| Net Operating Expenses | | | | | | |
| Cost of services | 2,659 |
| 2,702 |
| 2,788 |
| | 10,936 |
| 10,958 |
|
| Cost of products | 2,993 |
| 2,391 |
| 2,631 |
| | 9,905 |
| 8,057 |
|
| Selling, general and administrative | 2,557 |
| 2,391 |
| 2,461 |
| | 9,765 |
| 9,592 |
|
| Depreciation and amortization | 1,493 |
| 1,488 |
| 1,174 |
| | 6,543 |
| 4,858 |
|
| Other, net | 8 |
| 22 |
| 106 |
| | 16 |
| 106 |
|
| Total net operating expenses | 9,710 |
| 8,994 |
| 9,160 |
| | 37,165 |
| 33,571 |
|
| Operating (Loss) Income | (705 | ) | (231 | ) | (438 | ) | | (1,820 | ) | 108 |
|
| Interest expense | (432 | ) | (377 | ) | (287 | ) | | (1,428 | ) | (1,011 | ) |
Equity in losses of unconsolidated investments and other, net (6) | (140 | ) | (112 | ) | (472 | ) | | (923 | ) | (1,733 | ) |
| Loss before Income Taxes | (1,277 | ) | (720 | ) | (1,197 | ) | | (4,171 | ) | (2,636 | ) |
| Income tax expense | (44 | ) | (47 | ) | (106 | ) | | (154 | ) | (254 | ) |
Net Loss (7) | $ | (1,321 | ) | $ | (767 | ) | $ | (1,303 | ) | | $ | (4,325 | ) | $ | (2,890 | ) |
Basic and Diluted Net Loss Per Common Share (7) | $ | (0.44 | ) | $ | (0.26 | ) | $ | (0.43 | ) | | $ | (1.44 | ) | $ | (0.96 | ) |
| Weighted Average Common Shares outstanding | 3,007 |
| 3,003 |
| 2,997 |
| | 3,002 |
| 2,995 |
|
| Effective Tax Rate | -3.4 | % | -6.5 | % | -8.9 | % | | -3.7 | % | -9.6 | % |
NON-GAAP RECONCILIATION - NET LOSS TO ADJUSTED OIBDA* (Unaudited)
(Millions)
|
| | | | | | | | | | | | | | | | |
| | Quarter To Date | | Year To Date |
| | 12/31/12 |
| 9/30/12 |
| 12/31/11 |
| | 12/31/12 |
| 12/31/11 |
|
| | | | | | | |
Net Loss (7) | $ | (1,321 | ) | $ | (767 | ) | $ | (1,303 | ) | | $ | (4,325 | ) | $ | (2,890 | ) |
| Income tax expense | (44 | ) | (47 | ) | (106 | ) | | (154 | ) | (254 | ) |
| Loss before Income Taxes | (1,277 | ) | (720 | ) | (1,197 | ) | | (4,171 | ) | (2,636 | ) |
Equity in losses of unconsolidated investments and other, net (6) | 140 |
| 112 |
| 472 |
| | 923 |
| 1,733 |
|
| Interest expense | 432 |
| 377 |
| 287 |
| | 1,428 |
| 1,011 |
|
| Operating (Loss) Income | (705 | ) | (231 | ) | (438 | ) | | (1,820 | ) | 108 |
|
| Depreciation and amortization | 1,493 |
| 1,488 |
| 1,174 |
| | 6,543 |
| 4,858 |
|
| OIBDA* | 788 |
| 1,257 |
| 736 |
| | 4,723 |
| 4,966 |
|
Severance and lease exit costs (8) | (10 | ) | 22 |
| 28 |
| | 196 |
| 28 |
|
Gains from asset dispositions and exchanges (9) | — |
| — |
| — |
| | (29 | ) | — |
|
Asset impairments and abandonments (10) | 18 |
| — |
| 78 |
| | 36 |
| 78 |
|
Spectrum hosting contract termination, net (11) | — |
| — |
| — |
| | (170 | ) | — |
|
Access costs (12) | — |
| — |
| — |
| | (17 | ) | — |
|
Business combinations (13) | 19 |
| — |
| — |
| | 19 |
| — |
|
Hurricane Sandy (14) | 45 |
| — |
| — |
| | 45 |
| — |
|
| Adjusted OIBDA* | 860 |
| 1,279 |
| 842 |
| | 4,803 |
| 5,072 |
|
Capital expenditures (1) | 1,923 |
| 1,489 |
| 900 |
| | 5,370 |
| 2,855 |
|
| Adjusted OIBDA* less Capex | $ | (1,063 | ) | $ | (210 | ) | $ | (58 | ) | | $ | (567 | ) | $ | 2,217 |
|
| Adjusted OIBDA Margin* | 10.7 | % | 16.0 | % | 10.8 | % | | 15.0 | % | 16.5 | % |
| Selected item: | | | | | | |
| Deferred tax asset valuation allowance | $ | 546 |
| $ | 308 |
| $ | 569 |
| | $ | 1,756 |
| $ | 1,223 |
|
|
| |
| THE SPRINT QUARTERLY INVESTOR UPDATE- 4Q12 | 10 |
WIRELESS STATEMENTS OF OPERATIONS (Unaudited)
(Millions)
|
| | | | | | | | | | | | | | | | |
| | Quarter To Date | | Year To Date |
| | 12/31/12 |
| 9/30/12 |
| 12/31/11 |
| | 12/31/12 |
| 12/31/11 |
|
| | | | | | | |
| Net Operating Revenues | | | | | | |
| Service revenue | | | | | | |
| Sprint platform: | | | | | | |
Postpaid (2) | $ | 5,674 |
| $ | 5,625 |
| $ | 5,217 |
| | $ | 22,247 |
| $ | 20,052 |
|
Prepaid (3) | 1,170 |
| 1,127 |
| 929 |
| | 4,377 |
| 3,325 |
|
| Wholesale, affiliate and other | 135 |
| 121 |
| 74 |
| | 483 |
| 261 |
|
| Total Sprint platform | 6,979 |
| 6,873 |
| 6,220 |
| | 27,107 |
| 23,638 |
|
| Nextel platform: | | | | | | |
Postpaid (2) | 218 |
| 311 |
| 563 |
| | 1,454 |
| 2,582 |
|
Prepaid (3) | 68 |
| 108 |
| 227 |
| | 525 |
| 1,170 |
|
| Total Nextel platform | 286 |
| 419 |
| 790 |
| | 1,979 |
| 3,752 |
|
| | | | | | | |
| Equipment revenue | 1,010 |
| 750 |
| 910 |
| | 3,248 |
| 2,911 |
|
| Total net operating revenues | 8,275 |
| 8,042 |
| 7,920 |
| | 32,334 |
| 30,301 |
|
| | | | | | | |
| Net Operating Expenses | | | | | | |
| Cost of services | 2,210 |
| 2,256 |
| 2,291 |
| | 9,034 |
| 8,907 |
|
| Cost of products | 2,993 |
| 2,391 |
| 2,631 |
| | 9,905 |
| 8,057 |
|
| Selling, general and administrative | 2,436 |
| 2,277 |
| 2,330 |
| | 9,290 |
| 9,070 |
|
| Depreciation and amortization | 1,391 |
| 1,377 |
| 1,070 |
| | 6,128 |
| 4,425 |
|
| Other, net | 3 |
| 22 |
| 98 |
| | 28 |
| 98 |
|
| Total net operating expenses | 9,033 |
| 8,323 |
| 8,420 |
| | 34,385 |
| 30,557 |
|
| Operating Loss | $ | (758 | ) | $ | (281 | ) | $ | (500 | ) | | $ | (2,051 | ) | $ | (256 | ) |
| | | | | | | |
| Supplemental Revenue Data | | | | | | |
| Total retail service revenue | $ | 7,130 |
| $ | 7,171 |
| $ | 6,936 |
| | $ | 28,603 |
| $ | 27,129 |
|
| Total service revenue | $ | 7,265 |
| $ | 7,292 |
| $ | 7,010 |
| | $ | 29,086 |
| $ | 27,390 |
|
WIRELESS NON-GAAP RECONCILIATION (Unaudited)
(Millions)
|
| | | | | | | | | | | | | | | | |
| | Quarter To Date | | Year To Date |
| | 12/31/12 |
| 9/30/12 |
| 12/31/11 |
| | 12/31/12 |
| 12/31/11 |
|
| | | | | | | |
| Operating Loss | $ | (758 | ) | $ | (281 | ) | $ | (500 | ) | | $ | (2,051 | ) | $ | (256 | ) |
Severance and lease exit costs (8) | (10 | ) | 22 |
| 25 |
| | 196 |
| 25 |
|
Gains from asset dispositions and exchanges (9) | — |
| — |
| — |
| | (29 | ) | — |
|
Asset impairments and abandonments (10) | 13 |
| — |
| 73 |
| | 31 |
| 73 |
|
Spectrum hosting contract termination, net (11) | — |
| — |
| — |
| | (170 | ) | — |
|
Hurricane Sandy (14) | 42 |
| — |
| — |
| | 42 |
| — |
|
| Depreciation and amortization | 1,391 |
| 1,377 |
| 1,070 |
| | 6,128 |
| 4,425 |
|
| Adjusted OIBDA* | 678 |
| 1,118 |
| 668 |
| | 4,147 |
| 4,267 |
|
Capital expenditures (2) | 1,786 |
| 1,376 |
| 774 |
| | 4,884 |
| 2,416 |
|
| Adjusted OIBDA* less Capex | $ | (1,108 | ) | $ | (258 | ) | $ | (106 | ) | | $ | (737 | ) | $ | 1,851 |
|
| Adjusted OIBDA Margin* | 9.3 | % | 15.3 | % | 9.5 | % | | 14.2 | % | 15.6 | % |
|
| |
| THE SPRINT QUARTERLY INVESTOR UPDATE- 4Q12 | 11 |
WIRELINE STATEMENTS OF OPERATIONS (Unaudited)
(Millions)
|
| | | | | | | | | | | | | | | | |
| | Quarter To Date | | Year To Date |
| | 12/31/12 |
| 9/30/12 |
| 12/31/11 |
| | 12/31/12 |
| 12/31/11 |
|
| Net Operating Revenues | | | | | | |
| Voice | $ | 385 |
| $ | 399 |
| $ | 475 |
| | $ | 1,627 |
| $ | 1,915 |
|
| Data | 96 |
| 95 |
| 103 |
| | 398 |
| 460 |
|
| Internet | 451 |
| 428 |
| 459 |
| | 1,781 |
| 1,878 |
|
| Other | 17 |
| 17 |
| 17 |
| | 75 |
| 73 |
|
| Total net operating revenues | 949 |
| 939 |
| 1,054 |
| | 3,881 |
| 4,326 |
|
| | | | | | | |
| Net Operating Expenses | | | | | | |
| Cost of services and products | 671 |
| 667 |
| 748 |
| | 2,784 |
| 3,005 |
|
| Selling, general and administrative | 100 |
| 114 |
| 128 |
| | 451 |
| 521 |
|
| Depreciation | 102 |
| 106 |
| 109 |
| | 412 |
| 431 |
|
| Other, net | 5 |
| — |
| 9 |
| | (12 | ) | 9 |
|
| Total net operating expenses | 878 |
| 887 |
| 994 |
| | 3,635 |
| 3,966 |
|
| Operating Income | $ | 71 |
| $ | 52 |
| $ | 60 |
| | $ | 246 |
| $ | 360 |
|
WIRELINE NON-GAAP RECONCILIATION (Unaudited)
(Millions)
|
| | | | | | | | | | | | | | | | |
| | Quarter To Date | | Year To Date |
| | 12/31/12 |
| 9/30/12 |
| 12/31/11 |
| | 12/31/12 |
| 12/31/11 |
|
| | | | | | | |
| Operating Income | $ | 71 |
| $ | 52 |
| $ | 60 |
| | $ | 246 |
| $ | 360 |
|
Severance and lease exit costs (8) | — |
| — |
| 3 |
| | — |
| 3 |
|
Asset impairments and abandonments (10) | 5 |
| — |
| 6 |
| | 5 |
| 6 |
|
Access costs (12) | — |
| — |
| — |
| | (17 | ) | — |
|
Hurricane Sandy (14) | 3 |
| — |
| — |
| | 3 |
| — |
|
| Depreciation | 102 |
| 106 |
| 109 |
| | 412 |
| 431 |
|
| Adjusted OIBDA* | 181 |
| 158 |
| 178 |
| | 649 |
| 800 |
|
Capital expenditures (1) | 58 |
| 60 |
| 34 |
| | 242 |
| 158 |
|
| Adjusted OIBDA* less Capex | $ | 123 |
| $ | 98 |
| $ | 144 |
| | $ | 407 |
| $ | 642 |
|
| Adjusted OIBDA Margin* | 19.1 | % | 16.8 | % | 16.9 | % | | 16.7 | % | 18.5 | % |
|
| |
| THE SPRINT QUARTERLY INVESTOR UPDATE- 4Q12 | 12 |
CONDENSED CONSOLIDATED CASH FLOW INFORMATION (Unaudited)
(Millions) |
| | | | | | |
| | Year to Date |
| | 12/31/12 |
| 12/31/11 |
|
| Operating Activities | | |
| Net loss | $ | (4,325 | ) | $ | (2,890 | ) |
| Depreciation and amortization | 6,543 |
| 4,858 |
|
| Provision for losses on accounts receivable | 561 |
| 559 |
|
| Share-based compensation expense | 82 |
| 73 |
|
| Deferred income taxes | 209 |
| 231 |
|
Equity in losses of unconsolidated investments and other, net (6) | 923 |
| 1,733 |
|
| Contribution to pension plan | (108 | ) | (136 | ) |
Spectrum hosting contract termination, net (11) | (170 | ) | — |
|
| Other working capital changes, net | (802 | ) | (877 | ) |
| Other, net | 86 |
| 140 |
|
| Net cash provided by operating activities | 2,999 |
| 3,691 |
|
| | | |
| Investing Activities | | |
Capital expenditures (1) | (4,261 | ) | (3,130 | ) |
| Expenditures relating to FCC licenses | (198 | ) | (258 | ) |
Reimbursements relating to FCC licenses (15) | — |
| 135 |
|
| Change in short-term investments, net | (1,699 | ) | 150 |
|
| Investment in Clearwire | (228 | ) | (331 | ) |
| Other, net | 11 |
| (9 | ) |
| Net cash used in investing activities | (6,375 | ) | (3,443 | ) |
| | | |
| Financing Activities | | |
| Proceeds from debt and financings | 9,176 |
| 4,000 |
|
| Debt financing costs | (134 | ) | (86 | ) |
| Repayments of debt and capital lease obligations | (4,791 | ) | (3,906 | ) |
| Other, net | 29 |
| 18 |
|
| Net cash provided by financing activities | 4,280 |
| 26 |
|
| | | |
| Net Increase in Cash and Cash Equivalents | 904 |
| 274 |
|
| | | |
| Cash and Cash Equivalents, beginning of period | 5,447 |
| 5,173 |
|
| | | |
| Cash and Cash Equivalents, end of period | $ | 6,351 |
| $ | 5,447 |
|
RECONCILIATION TO CONSOLIDATED FREE CASH FLOW* (NON-GAAP) (Unaudited)
(Millions) |
| | | | | | | | | | | | | | | | |
| | Quarter Ended | | Year To Date |
| | 12/31/12 |
| 9/30/12 |
| 12/31/11 |
| | 12/31/12 |
| 12/31/11 |
|
| | | | | | | |
| Net Cash Provided by Operating Activities | $ | 216 |
| $ | 628 |
| $ | 1,089 |
| | $ | 2,999 |
| $ | 3,691 |
|
| | | | | | | |
Capital expenditures (1) | (1,477 | ) | (1,073 | ) | (909 | ) | | (4,261 | ) | (3,130 | ) |
Expenditures relating to FCC licenses, net (15) | (46 | ) | (45 | ) | 76 |
| | (198 | ) | (123 | ) |
| Other investing activities, net | (2 | ) | 3 |
| 1 |
| | 11 |
| (9 | ) |
| Free Cash Flow* | (1,309 | ) | (487 | ) | 257 |
| | (1,449 | ) | 429 |
|
| | | | | | | |
| Debt financing costs | (44 | ) | (33 | ) | (83 | ) | | (134 | ) | (86 | ) |
| Increase in debt and other, net | 3,316 |
| 73 |
| 1,749 |
| | 4,385 |
| 94 |
|
| Investment in Clearwire | (100 | ) | — |
| (331 | ) | | (228 | ) | (331 | ) |
| Other financing activities, net | 8 |
| 14 |
| 4 |
| | 29 |
| 18 |
|
| Net Increase (Decrease) in Cash, Cash Equivalents and | | | | | | |
| Short-Term Investments | $ | 1,871 |
| $ | (433 | ) | $ | 1,596 |
| | $ | 2,603 |
| $ | 124 |
|
|
| |
| THE SPRINT QUARTERLY INVESTOR UPDATE- 4Q12 | 13 |
CONDENSED CONSOLIDATED BALANCE SHEETS (Unaudited)
(Millions)
|
| | | | | | |
| | 12/31/12 |
| 12/31/11 |
|
| Assets | | |
| Current assets | | |
| Cash and cash equivalents | $ | 6,351 |
| $ | 5,447 |
|
| Short-term investments | 1,849 |
| 150 |
|
| Accounts and notes receivable, net | 3,658 |
| 3,206 |
|
| Device and accessory inventory | 1,200 |
| 913 |
|
| Deferred tax assets | 1 |
| 130 |
|
| Prepaid expenses and other current assets | 700 |
| 491 |
|
| Total current assets | 13,759 |
| 10,337 |
|
| | | |
| Investments and other assets | 1,833 |
| 2,609 |
|
| Property, plant and equipment, net | 13,607 |
| 14,009 |
|
| Goodwill | 359 |
| 359 |
|
| FCC licenses and other | 20,677 |
| 20,453 |
|
| Definite-lived intangible assets, net | 1,335 |
| 1,616 |
|
| Total | $ | 51,570 |
| $ | 49,383 |
|
| | | |
| Liabilities and Shareholders' Equity | | |
| Current liabilities | | |
| Accounts payable | $ | 3,487 |
| $ | 2,348 |
|
| Accrued expenses and other current liabilities | 5,008 |
| 4,143 |
|
| Current portion of long-term debt, financing and capital lease obligations | 379 |
| 8 |
|
| Total current liabilities | 8,874 |
| 6,499 |
|
| | | |
| Long-term debt, financing and capital lease obligations | 23,962 |
| 20,266 |
|
| Deferred tax liabilities | 7,047 |
| 6,986 |
|
| Other liabilities | 4,600 |
| 4,205 |
|
| Total liabilities | 44,483 |
| 37,956 |
|
| | | |
| Shareholders' equity | | |
| Common shares | 6,019 |
| 5,992 |
|
| Paid-in capital | 47,016 |
| 46,716 |
|
| Accumulated deficit | (44,815 | ) | (40,489 | ) |
| Accumulated other comprehensive loss | (1,133 | ) | (792 | ) |
| Total shareholders' equity | 7,087 |
| 11,427 |
|
| Total | $ | 51,570 |
| $ | 49,383 |
|
NET DEBT* (NON-GAAP) (Unaudited)
(Millions)
|
| | | | | | |
| | 12/31/12 |
| 12/31/11 |
|
| | | |
| Total Debt | $ | 24,341 |
| $ | 20,274 |
|
| Less: Cash and cash equivalents | (6,351 | ) | (5,447 | ) |
| Less: Short-term investments | (1,849 | ) | (150 | ) |
| Net Debt* | $ | 16,141 |
| $ | 14,677 |
|
|
| |
| THE SPRINT QUARTERLY INVESTOR UPDATE- 4Q12 | 14 |
SCHEDULE OF DEBT (Unaudited)
(Millions)
|
| | | | | |
| | | | 12/31/12 |
| ISSUER | COUPON | MATURITY | PRINCIPAL |
| Sprint Nextel Corporation | | | |
| Export Development Canada Facility (Tranche 2) | 5.393% | 12/15/2015 | $ | 500 |
|
| 6% Senior Notes due 2016 | 6.000% | 12/01/2016 | 2,000 |
|
| 9.125% Senior Notes due 2017 | 9.125% | 03/01/2017 | 1,000 |
|
| 8.375% Senior Notes due 2017 | 8.375% | 08/15/2017 | 1,300 |
|
| 9% Guaranteed Notes due 2018 | 9.000% | 11/15/2018 | 3,000 |
|
| 1% Convertible Bond due 2019 | 1.000% | 10/15/2019 | 3,100 |
|
| 7% Guaranteed Notes due 2020 | 7.000% | 03/01/2020 | 1,000 |
|
| 7% Senior Notes due 2020 | 7.000% | 08/15/2020 | 1,500 |
|
| 11.5% Senior Notes due 2021 | 11.500% | 11/15/2021 | 1,000 |
|
| 9.25% Debentures due 2022 | 9.250% | 04/15/2022 | 200 |
|
| 6% Senior Notes due 2022 | 6.000% | 11/15/2022 | 2,280 |
|
| Sprint Nextel Corporation | | | 16,880 |
|
| | | | |
| Sprint Capital Corporation | | | |
| 6.9% Senior Notes due 2019 | 6.900% | 05/01/2019 | 1,729 |
|
| 6.875% Senior Notes due 2028 | 6.875% | 11/15/2028 | 2,475 |
|
| 8.75% Senior Notes due 2032 | 8.750% | 03/15/2032 | 2,000 |
|
| Sprint Capital Corporation | | | 6,204 |
|
| | | | |
| iPCS Inc. | | | |
| First Lien Senior Secured Floating Rate Notes due 2013 | 2.438% | 05/01/2013 | 300 |
|
| Second Lien Senior Secured Floating Rate Notes due 2014 | 3.563% | 05/01/2014 | 181 |
|
| iPCS Inc. | | | 481 |
|
| | | | |
| EKN Secured Equipment Facility | 2.030% | 03/30/2017 | 296 |
|
| | | | |
| Tower financing obligation | 9.500% | 01/15/2030 | 698 |
|
| Capital lease obligations and other | | 2014 - 2022 | 74 |
|
| TOTAL PRINCIPAL | | | 24,633 |
|
| | | | |
| Beneficial conversion feature on convertible bond | | | (247 | ) |
| Net discounts | | | (45 | ) |
| TOTAL DEBT | | | $ | 24,341 |
|
Supplemental information:
The Company had $1.3 billion of borrowing capacity available under our revolving bank credit facility as of December 31, 2012. Our revolving bank credit facility expires in October 2013.
In May 2012, certain of our subsidiaries entered into a $1.0 billion secured equipment credit facility to finance equipment-related purchases for Network Vision. The facility is equally divided into two consecutive tranches of $500 million, with the drawdown availability contingent upon Sprint's acquisition of equipment-related purchases from Ericsson, up to the maximum of each tranche, ending on May 31, 2013 and May 31, 2014, for the first and second tranche, respectively. Interest and principal are payable semi-annually with a final maturity of March 2017 for both tranches.
*This table excludes (i) our revolving bank credit facility, which will mature in 2013 and has no outstanding balance, (ii) $925 million in letters of credit under our revolving bank credit facility, (iii) any undrawn, available credit under our secured equipment credit facility, which will mature in 2017, and (iv) all capital leases and other financing obligations.
|
| |
| THE SPRINT QUARTERLY INVESTOR UPDATE- 4Q12 | 15 |
SPRINT NEXTEL CORPORATION
Notes to the Financial Information (Unaudited)
(1) Capital expenditures is an accrual based amount that includes the changes in unpaid capital expenditures and excludes capitalized interest. Cash paid for capital expenditures includes total capitalized interest of $9 million, $52 million and $278 million for the fourth and third quarters and year-to-date periods of 2012, respectively, and $109 million and $413 million for the fourth quarter and year-to-date periods of 2011, and can be found in the Condensed Consolidated Cash Flow Information and the Reconciliation to Free Cash Flow*.
(2) Postpaid subscribers on the Sprint platform are defined as retail postpaid subscribers on the CDMA network, including subscribers with PowerSource devices, and those utilizing WiMax and LTE technology. Postpaid subscribers on the Nextel platform are defined as retail postpaid subscribers on the iDEN network.
(3) Prepaid subscribers on the Sprint platform are defined as retail prepaid subscribers and session-based tablet users who utilize CDMA and WiMax technology via our multi-brand offerings. Prepaid subscribers on the Nextel platform are defined as retail prepaid subscribers who utilize iDEN technology.
(4) Nextel Subscriber Recaptures are defined as the number of subscribers that deactivated service from the postpaid or prepaid Nextel platform, as applicable, during each period but remained with the Company as subscribers on the postpaid or prepaid Sprint platform, respectively. Subscribers that deactivate service from the Nextel platform and activate service on the Sprint platform are included in the Sprint platform net additions for the applicable period.
(5) The Postpaid and Prepaid Nextel Recapture Rates are defined as the portion of total subscribers that left the postpaid or prepaid Nextel platform, as applicable, during the period and were retained on the postpaid or prepaid Sprint platform, respectively.
(6) The second quarter of 2012 includes a non-cash impairment of $204 million to reflect a reduction of our investment in Clearwire to its estimated fair value at June 30, 2012. The fourth quarter of 2011 includes a non-cash impairment of $135 million to reflect a reduction of our investment in Clearwire to its estimated fair value at December 31, 2011, and a dilution loss of approximately $27 million associated with the fourth quarter reduction of Sprint's economic interest from 53.5% to 51.5% as a result of Clearwire's fourth quarter 2011 equity offering.
(7) Results include pre-tax, non-cash "Equity in losses of unconsolidated investments and other, net" of $140 million ($.05 per share), $112 million ($.04 per share) and $923 million ($.31 per share) in the fourth and third quarters and year-to-date periods of 2012, respectively, and $472 million ($.16 per share) and $1.7 billion ($.58 per share) in the fourth quarter and year-to-date periods of 2011.
(8) For the fourth and third quarters and year-to-date periods of 2012, lease exit costs are primarily associated with taking Nextel platform sites off air. For the fourth quarter and year-to-date periods of 2011, severance and exit costs are primarily related to work force reductions, lease termination charges, and organizational realignment initiatives.
(9) For the year-to-date period of 2012, gains from asset dispositions and exchanges are primarily due to spectrum exchange transactions.
(10) For the year-to-date period of 2012, asset impairments and abandonments include $18 million related to a change in our backhaul architecture in connection to our Network Vision design from microwave to a more cost effective fiber backhaul. The remaining 2012 activity of $18 million, as well as the year-to-date 2011 activity of $78 million, is primarily related to network asset equipment in our Wireless segment, no longer necessary for management's strategic plans.
(11) On March 16, 2012, we elected to terminate the arrangement with LightSquared LP and LightSquared, Inc. (LightSquared). As we have no future service obligations with respect to the arrangement with LightSquared, we recognized $236 million of the advanced payments as other operating income in the first quarter of 2012. As a result of the termination of the hosting agreement, we impaired capitalized costs specific to LightSquared's 1.6 GHz spectrum that the company no longer intends to deploy which totaled $66 million.
(12) Favorable developments during the first quarter of 2012 relating to disagreements with local exchange carriers resulted in a reduction in expected access costs of $17 million.
(13) For the fourth quarter and year-to-date periods of 2012, included in selling, general and administrative expenses are fees paid to unrelated parties necessary for the proposed transactions with SoftBank and our acquisition of Clearwire.
|
| |
| THE SPRINT QUARTERLY INVESTOR UPDATE- 4Q12 | 16 |
(14) Hurricane Sandy charges for the fourth quarter and year-to-date periods of 2012, represent estimated hurricane-related charges of $45 million, consisting of customer credits, incremental roaming costs, network repairs and replacements.
(15) $135 million in reimbursements were received in the fourth quarter of 2011 from the mobile satellite service (MSS) entrants for their pro rata share of our costs of clearing a portion of the 1.9 GHz spectrum related to spectrum reconfiguration under the FCC's Report and Order.
*FINANCIAL MEASURES
Sprint Nextel provides financial measures determined in accordance with accounting principles generally accepted in the United States (GAAP) and adjusted GAAP (non-GAAP). The non-GAAP financial measures reflect industry conventions, or standard measures of liquidity, profitability or performance commonly used by the investment community for comparability purposes. These measurements should be considered in addition to, but not as a substitute for, financial information prepared in accordance with GAAP. We have defined below each of the non-GAAP measures we use, but these measures may not be synonymous to similar measurement terms used by other companies.
Sprint Nextel provides reconciliations of these non-GAAP measures in its financial reporting. Because Sprint Nextel does not predict special items that might occur in the future, and our forecasts are developed at a level of detail different than that used to prepare GAAP-based financial measures, Sprint Nextel does not provide reconciliations to GAAP of its forward-looking financial measures.
The measures used in this release include the following:
OIBDA is operating income/(loss) before depreciation and amortization. Adjusted OIBDA is OIBDA excluding severance, exit costs, and other special items. Adjusted OIBDA Margin represents Adjusted OIBDA divided by non-equipment net operating revenues for Wireless and Adjusted OIBDA divided by net operating revenues for Wireline. We believe that Adjusted OIBDA and Adjusted OIBDA Margin provide useful information to investors because they are an indicator of the strength and performance of our ongoing business operations, including our ability to fund discretionary spending such as capital expenditures, spectrum acquisitions and other investments and our ability to incur and service debt. While depreciation and amortization are considered operating costs under GAAP, these expenses primarily represent non-cash current period costs associated with the use of long-lived tangible and definite-lived intangible assets. Adjusted OIBDA and Adjusted OIBDA Margin are calculations commonly used as a basis for investors, analysts and credit rating agencies to evaluate and compare the periodic and future operating performance and value of companies within the telecommunications industry.
Free Cash Flow is the cash provided by operating activities less the cash used in investing activities other than short-term investments and equity method investments during the period. We believe that Free Cash Flow provides useful information to investors, analysts and our management about the cash generated by our core operations after interest and dividends, if any, and our ability to fund scheduled debt maturities and other financing activities, including discretionary refinancing and retirement of debt and purchase or sale of investments.
Net Debt is consolidated debt, including current maturities, less cash and cash equivalents, short-term investments and if any, restricted cash. We believe that Net Debt provides useful information to investors, analysts and credit rating agencies about the capacity of the company to reduce the debt load and improve its capital structure.
SAFE HARBOR
This release includes “forward-looking statements” within the meaning of the securities laws. The words “may,” “could,” “should,” “estimate,” “project,” “forecast,” “intend,” “expect,” “anticipate,” “believe,” “target,” “plan,” “providing guidance,” and similar expressions are intended to identify information that is not historical in nature. All statements that address operating performance, events or developments that we expect or anticipate will occur in the future - including statements relating to network performance, subscriber growth, and liquidity, and statements expressing general views about future operating results - are forward-looking statements. Forward-looking statements are estimates and projections reflecting management's judgment based on currently available information and involve a number of risks and uncertainties that could cause actual results to differ materially from those suggested by the
|
| |
| THE SPRINT QUARTERLY INVESTOR UPDATE- 4Q12 | 17 |
forward-looking statements. With respect to these forward-looking statements, management has made assumptions regarding, among other things, development and deployment of new technologies; efficiencies and cost savings of multimode technologies; customer and network usage; customer growth and retention; service, coverage and quality; availability of devices; the timing of various events and the economic environment. Sprint Nextel believes these forward-looking statements are reasonable; however, you should not place undue reliance on forward-looking statements, which are based on current expectations and speak only as of the date when made. Sprint Nextel undertakes no obligation to publicly update or revise any forward-looking statements, whether as a result of new information, future events or otherwise, except as required by law. In addition, forward-looking statements are subject to certain risks and uncertainties that could cause actual results to differ materially from our company's historical experience and our present expectations or projections. Factors that might cause such differences include, but are not limited to, those discussed in the company's Annual Report on Form 10-K for the year ended December 31, 2011 and Quarterly Reports on Form 10-Q for the quarter ended September 30, 2012, which are filed with the U.S. Securities and Exchange Commission and are incorporated herein by reference and when filed Part I, Item IA “Risk Factors” of our Annual Report on Form 10-K for the year ended December 31, 2012. You should understand that it is not possible to predict or identify all such factors. Consequently, you should not consider any such list to be a complete set of all potential risks or uncertainties.
Clearwire's fourth quarter 2012 results from operations have not yet been finalized. As a result, the amount reflected for Sprint's share of Clearwire's results of operations for the quarter and year-to-date ended December 31, 2012, is an estimate and, based upon the finalization of Clearwire's results, may need to be revised if our estimate materially differs from Clearwire's actual results. Changes in our estimate, if any, would affect the carrying value of our investment in Clearwire, net loss, basic and diluted net loss per common share, and comprehensive loss but would have no effect on Sprint's operating income, OIBDA*, Adjusted OIBDA* or consolidated statement of cash flows.
iPad and iPad mini are trademarks of Apple, Inc. LTE is a trademark of ETSI. Other marks are the property of their respective owners.
|
| |
| THE SPRINT QUARTERLY INVESTOR UPDATE- 4Q12 | 18 |