SPRINT REPORTS RESULTS FOR FOURTH FISCAL QUARTER OF 2014

|
| | | |
| ● | Operating Income of $318 million and Adjusted EBITDA* of $1.7 billion | |
| | | |
| ● | 1.2 million Sprint platform net additions compared to net losses of 383,000 in the prior year quarter |
| | ○ | Postpaid net additions of 211,000 compared to net losses of 231,000 in the prior year quarter |
| | ○ | Postpaid phone losses of 201,000 improved sequentially for the fourth consecutive quarter and improved by nearly 500,000 year-over-year |
| | ○ | Prepaid net additions of 546,000 led the industry for second consecutive quarter and compared to net losses of 364,000 in the prior year quarter |
| | ○ | Wholesale net additions of 492,000 increased from 212,000 in the prior year quarter
|
| | | |
| ● | Postpaid net port positive for the quarter - first time in nearly three years |
| | |
| ● | Sprint platform postpaid churn of 1.84 percent improved 46 basis points sequentially from 2.30 percent last quarter |
| |
|
| ● | Expanded company-owned distribution by opening 1,435 co-branded Sprint-RadioShack stores |
| | |
| ● | Launched industry-first Sprint Direct 2 You service |
| | | | |
| ● | 4G LTE coverage now reaches nearly 280 million people equaling 87 percent of U.S. population | |
| | | | |
Financial results in the enclosed tables include a predecessor period related to the results of operations of Sprint Communications, Inc. (formerly Sprint Nextel) prior to the closing of the SoftBank transaction on July 10, 2013, and the applicable successor periods. In order to present financial results in a way that offers investors a more meaningful comparison of the year-to-date results, we have combined the 2013 results of operations for the predecessor and successor periods. For additional information, please reference the section titled Financial Measures. Trended financial performance metrics on a combined basis can also be found at our Investor Relations website at www.sprint.com/investors. |
| | | |
| TABLE OF CONTENTS | |
| Customers | 6 |
|
| Sales | 7 |
|
| Financials | 9 |
|
| Financial and Operational Results Tables | 13 |
|
| Notes to the Financial Information | 21 |
|
| Financial Measures | 22 |
|
| Safe Harbor | 23 |
|
| |
| |
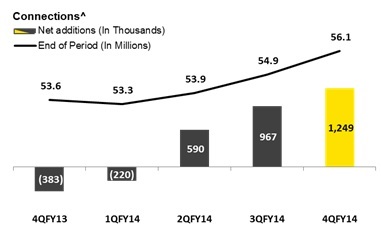
Sprint Corporation (NYSE: S) today reported operating results for the fourth fiscal quarter of 2014, including 1.2 million Sprint platform net additions, the highest number in nearly three years. The company recorded significantly better postpaid churn of 1.84 percent, and for the fourth consecutive quarter, reduced postpaid phone losses. In addition, the company reported operating income of $318 million and Adjusted EBITDA* of $1.7 billion.
“I am proud of the team for successfully executing the first phase of our strategy to stop the decline in customers. We are now one quarter into the second phase, focusing on attracting more quality customers, retaining our customers through a better customer experience and continuously improving the network,” said Sprint CEO Marcelo Claure. “As a result, Sprint platform net additions were the highest in nearly three years, postpaid churn dropped by 46 basis points sequentially, and the network received more awards in major markets, all of which will position the company for profitable growth.”
1.2 Million Sprint Platform Net Additions
| |
| • | Sprint platform net additions of 1.2 million compared to 967,000 in the prior quarter and net losses of 383,000 in the prior year quarter. The year-over-year improvement was mostly driven by growth in the prepaid business and fewer postpaid phone customer losses. |
| |
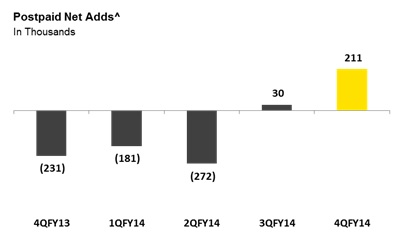
| • | Postpaid net additions of 211,000 compared to 30,000 in the prior quarter and net losses of 231,000 in the prior year quarter. The 442,000 year-over-year improvement was due to both higher prime credit quality gross additions and lower churn. |
| |
| ◦ | Net port positive for the first time in nearly three years. |
| |
| ◦ | Postpaid phone losses of 201,000 compared to losses of 205,000 in the prior quarter and 693,000 in the prior year quarter. The 492,000 year-over-year improvement was driven by lower churn and higher prime credit quality gross additions. |
| |
| ◦ | Postpaid tablet net additions of 349,000 compared to 189,000 in the prior quarter and 516,000 in the prior year quarter. |
| |
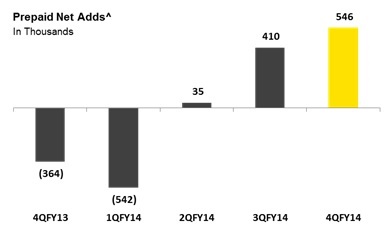
| • | Prepaid net additions of 546,000 led the industry for the second consecutive quarter and compared to 410,000 in the prior quarter and net losses of 364,000 in the prior year quarter. The 910,000 year-over-year improvement was mostly due to growth in the Boost Mobile brand. |
| |
| • | Wholesale net additions of 492,000 compared to 527,000 in the prior quarter and 212,000 in the prior year quarter. The year-over-year growth was mostly driven by connected devices. |
Solid Progress on Customer Retention Efforts
Sprint has focused on reducing postpaid churn by increasing credit standards, embracing customer demand to upgrade to the latest devices and continuing to improve the network experience. The company has also placed greater emphasis on Net Promoter Score (NPS), a measure of customer loyalty, by establishing a chief experience officer dedicated to improving this metric and by linking NPS improvement to every employee’s compensation. These actions, among others, have resulted in improvement in several customer retention metrics during the quarter.
| |
| • | Sprint platform postpaid churn of 1.84 percent improved 46 basis points from 2.30 percent last quarter, the best sequential improvement in nearly seven years. |
| |
| • | Best sequential improvement in Sprint platform postpaid voluntary churn in nearly 11 years. |
| |
| • | NPS improved from a negative score in mid-2014 to the highest level in nearly two years in March. |
|
| |
| THE SPRINT QUARTERLY INVESTOR UPDATE - FISCAL 4Q14 | 3 |
|
| | | |
| Enhancing the Customer Experience | |
| Last month Sprint introduced several new innovative programs and features to further enhance the customer experience. |
| ● | Sprint Direct 2 You is an industry-first program that is expected to transform the mobile phone buying experience by taking the retail store experience to the customer. With this personalized white glove service, a Sprint-trained expert will take a mobile device to a customer's location, set it up and transfer all of their content from their old device. |
| ● | Free International Value Roaming when added to a domestic service plan gives customers the ability to travel to major areas in Latin America, Europe and Japan and roam with up to 2G speeds at no additional charge. Additionally, they can send unlimited text messages for no extra charge and call anywhere in the world from these areas for 20 cents per minute. More international locations are expected to be added to the service over time. |
| ● | Free Wi-Fi Calling for iPhone® dramatically expands coverage and connectivity options for customers with service on iPhone 6, iPhone 6 Plus, iPhone 5c and iPhone 5s. Including the rich portfolio of Wi-Fi calling Android devices, Sprint now has 27 total devices capable of experiencing the benefits of Wi-Fi calling. |
| | | |
| Continuing to Attract Quality Customers |
| Sprint is not only focused on attracting more customers but also better quality customers. With innovative offerings such as the Cut Your Bill in Half event and the industry’s only device leasing program, the company has seen improvement in customer acquisition on the Sprint platform. |
| ● | Postpaid gross additions grew 11 percent year-over-year. |
| ● | Postpaid phone gross additions with prime credit quality grew 65 percent year-over-year. |
| ● | Prepaid gross additions were highest on record, growing 41 percent year-over-year. |
| |
|
| Expanding Distribution |
| Sprint recently doubled its company-owned retail footprint by opening 1,435 Sprint-RadioShack co-branded stores and expects to have the “store-within-a-store” retail model fully operationalized over the next couple of quarters, providing a rapid and cost-effective expansion of the company’s distribution. The company will also continue to seek innovative ways, such as Sprint Direct 2 You, to further expand Sprint-branded distribution and achieve a more competitive position within the industry. |
|
| | |
| | | |
Quarterly Financial Results
| |
| • | Net operating revenues of $8.3 billion were down seven percent year-over-year, as lower wireless service revenues mostly driven by customer shifts to rate plans associated with device financing options were partially offset by higher equipment revenue. |
| |
| • | Consolidated Adjusted EBITDA* of $1.7 billion declined five percent from the prior year period, as lower service revenues were partially offset by lower net subsidy expenses related to the introduction of device financing options, including leasing for which no cost of products expense is recorded at the point of sale, and lower cost of services expense due to the completion of the 3G and voice network replacement. |
| |
| • | Operating income of $318 million was down from $420 million in the year-ago quarter, primarily due to higher depreciation expense. |
| |
| • | Net loss of $224 million, or $.06 per share, compared to a net loss of $151 million, or $.04 per share, in the year-ago period, as lower operating income was partially offset by lower income tax expense. |
|
| |
| THE SPRINT QUARTERLY INVESTOR UPDATE - FISCAL 4Q14 | 4 |
| |
| • | Total liquidity was $7.5 billion at the end of the quarter, including $4.2 billion of cash, cash equivalents and short-term investments and $3.3 billion of undrawn borrowing capacity under the revolving bank credit facility and service receivables facility. The company also currently has $1.4 billion of availability under vendor financing agreements that can be utilized toward the purchase of 2.5 GHz network equipment. Additionally, in April Sprint amended the service receivables facility and increased its size from $1.3 billion to $3.3 billion by including equipment receivables. |
Network Performance #GettingBetterEveryDay
Sprint is focused on leveraging its spectrum portfolio to provide a network that delivers the consistent reliability, capacity and speed that customers demand. During the quarter, Sprint continued to build out 4G LTE on the 800 MHz and 2.5 GHz spectrum and total LTE coverage now reaches nearly 280 million people.
Independent mobile analytics firm RootMetrics® acknowledged the company’s significant network improvements in their second half 2014 Mobile Network Performance Review Report. Since that time, Sprint has been awarded a total of 104 first place (outright or shared) RootScore Awards for overall, reliability, speed, data, call, or text network performance in the 77 markets measured to date in the first half of 2015, including these notable achievements.
|
| | | |
| City | Category | 2H14 Ranking | 1H15 Ranking |
| Pittsburgh, PA | Reliability & Call Performance | 3rd, Shared 2nd | Shared 1st |
| San Antonio, TX | Reliability & Call Performance | Shared 2nd, Shared 1st | Shared 1st |
| St. Louis, MO | Reliability & Call Performance | Shared 3rd, Shared 1st | Shared 1st |
| Jacksonville, FL | Reliability & Call Performance | Shared 3rd, Shared 1st | Shared 1st |
| Miami, FL | Call Performance | 3rd | Shared 1st |
| Las Vegas, NV | Overall Performance | 4th | Shared 1st |
| Denver, CO | Speed | Shared 3rd | Shared 1st |
| Salt Lake City, UT | Speed | Shared 3rd | Shared 1st |
| Dayton, OH | Speed | 4th | Shared 1st |
| Atlanta, GA | Text Performance | 3rd | Shared 1st |
Disclaimer: Rankings based on RootMetrics 2nd Half 2014 Mobile Network Performance Review Report, published February 10, 2015 and 77 RootMetrics (January 1 - April 7, 2015) RootScore Reports for mobile performance as tested on best available plans and devices on four mobile networks across all available network types. The RootMetrics award is not an endorsement of Sprint. Your results may vary. See www.rootmetrics.com for details.
“In our first half 2015 RootMetrics studies, a selection of top population metro areas have seen improvements in Sprint’s network performance, including reliability, call and speed,” said Bill Moore, CEO of independent mobile analytics firm RootMetrics. “This is great news for Sprint customers in these areas who are benefiting from the investment Sprint has made in these markets.”
Outlook
| |
| • | The company expects fiscal 2015 Adjusted EBITDA* to be between $6.5 and $6.9 billion. |
| |
| • | The company expects fiscal 2015 accrued capital expenditures to be approximately $5 billion, excluding the impact of leased devices sold through indirect channels. |
|
| |
| THE SPRINT QUARTERLY INVESTOR UPDATE - FISCAL 4Q14 | 5 |
The company had more than 57 million connections at the end of the quarter, with 56.1 million on the Sprint platform including 29.7 million postpaid, 15.7 million prepaid, and 10.7 million wholesale and affiliate connections. Sprint platform net additions were 1.2 million for the quarter compared to net losses of 383,000 in the year-ago period. The year-over-year improvement was mostly driven by growth in the prepaid business and fewer postpaid phone customer losses.
| |
| • | Retail net additions on the Sprint Platform were 757,000 in the quarter, compared to net losses of 595,000 in the year-ago quarter and net additions of 440,000 in the prior quarter. The year-over-year improvement was driven by both higher gross additions and lower churn, while the sequential improvement was attributable to lower churn. |
| |
| • | Wholesale and affiliate net additions on the Sprint platform were 492,000 in the quarter, compared to 212,000 in the year-ago quarter and 527,000 in the prior quarter. The year-over-year growth was driven by connected devices. |
Postpaid Sprint Platform
| |
| • | Net additions were 211,000 during the quarter compared to 231,000 net losses in the year-ago period and 30,000 net additions in the prior quarter. The year-over-year improvement was driven by both higher prime credit quality gross additions and lower churn, while the sequential improvement was mostly related to lower churn, as gross additions were seasonally lower. Fewer phone losses were a major contributor to the year-over-year improvement in net additions, partially offset by lower tablet additions. The sequential improvement was primarily driven by higher tablet additions. |
| |
| • | Churn was 1.84 percent, compared to 2.11 percent for the year-ago period and 2.30 percent for the prior quarter. The year-over-year decline was primarily attributable to lower voluntary churn as network performance improvements provided a better customer experience. The sequential improvement was driven by both voluntary and involuntary churn. Voluntary churn improved mostly due to network performance improvements and the impact of elevated upgrade activity in the prior quarter. Involuntary churn improved sequentially as the impact of a higher mix of prime credit quality gross additions in the latter half of calendar 2014 drove fewer account defaults. |
^ indicates results specific to Sprint Platform
|
| |
| THE SPRINT QUARTERLY INVESTOR UPDATE - FISCAL 4Q14 | 6 |
| |
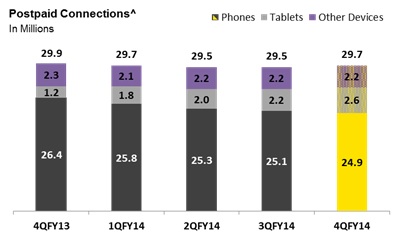
| • | Phone losses were 201,000 in the quarter compared to 693,000 for the year-ago period and 205,000 for the prior quarter. The year-over-year improvement was primarily driven by lower churn and higher prime credit quality gross additions. Sequentially, fewer deactivations were offset by seasonally lower gross additions. The company ended the quarter with 24.9 million phone connections. |
| |
| • | Tablet net additions were 349,000 in the quarter compared to 516,000 for the year-ago period and 189,000 for the prior quarter. The year-over-year decline was due to higher churn and lower gross additions from less promotional activity. The sequential growth was primarily driven by promotional activities resulting in higher gross additions. The company ended the quarter with 2.6 million tablet connections. |
Prepaid Sprint Platform
| |
| • | Net additions were 546,000 during the quarter compared to net losses of 364,000 in the year-ago quarter and net additions of 410,000 in the prior quarter. The year-over-year and sequential growth was primarily driven by strength in our Boost brand. |
| |
| • | Churn was 3.84 percent compared to 4.33 percent for the year-ago period and 3.94 percent for the prior quarter. The 49 basis point year-over-year improvement was primarily driven by lower churn for our Boost customers. |
Retail Sales on the Sprint platform were 7.9 million during the quarter compared to 6.7 million in the year-ago quarter and 9 million in the prior quarter. The year-over-year sales growth was primarily driven by prepaid, while the sequential decline was primarily driven by seasonality in postpaid upgrades.
Postpaid Sprint Platform
| |
| • | Upgrade rate was 7.5 percent during the quarter, compared to 7 percent for the year-ago quarter and 11.5 percent for the prior quarter. The sequential decline in the upgrade rate was driven by seasonality and elevated upgrade levels in the prior period, as the latest iPhone model and new leasing plans were available for the entire quarter. |
|
| |
| THE SPRINT QUARTERLY INVESTOR UPDATE - FISCAL 4Q14 | 7 |
| |
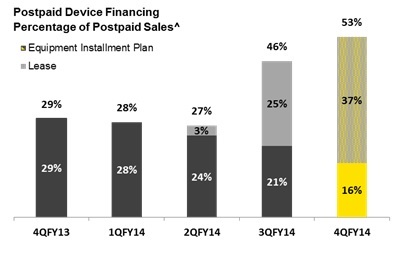
| • | Device financing take rate was 53 percent for the quarter compared to 29 percent for the year-ago period and 46 percent for the prior quarter. Leasing take rate rose to 37 percent of sales in the quarter from 25 percent in the prior quarter. |
| |
| • | Smartphones comprised 97 percent of phones sold in the quarter, a two percentage point increase year-over-year and flat with the prior quarter. At the end of the quarter smartphones represented 88 percent of the 24.9 million ending phone connection base. |
| |
| • | LTE devices represented 73 percent of the 29.7 million ending connection base, compared to 49 percent at the end of the year-ago quarter. The percentage of the smartphone base with LTE capable devices rose to 86 percent at the end of the quarter, a 26 percentage point increase from the year-ago period. |
|
| |
| THE SPRINT QUARTERLY INVESTOR UPDATE - FISCAL 4Q14 | 8 |
Revenues
| |
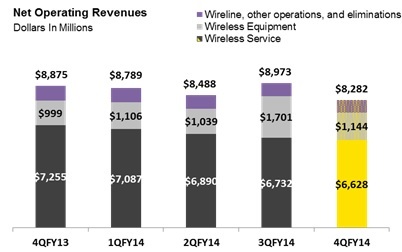
| • | Net operating revenues of $8.3 billion for the quarter were down seven percent when compared to the year-ago quarter and eight percent when compared to the prior quarter. The $593 million year-over-year decline was driven by lower wireless and wireline service revenues, partially offset by higher equipment revenues. The $691 million sequential decline was primarily due to lower equipment and wireless service revenues. |
| |
| • | Wireline revenues of $668 million for the quarter declined $102 million year-over-year and $24 million sequentially. The year-over-year and sequential declines were both driven by lower voice rates and volumes. Additionally, the year-over-year decline was also impacted by the migration of wholesale cable VoIP customers off of Sprint’s IP platform and an intercompany rate reduction based on current market prices for voice and IP services sold to the wireless segment. |
| |
| • | Wireless equipment revenues of $1.1 billion for the quarter increased $145 million year-over-year and declined $557 million sequentially. The year-over-year increase was primarily driven by postpaid device sales mix towards higher end devices and lease revenue, partially offset by lower non-lease sales volumes. Sequentially, the decline was primarily associated with seasonally lower non-lease postpaid sales volumes, partially offset by higher lease revenue. |
| |
| • | Wireless service revenues of $6.6 billion for the quarter were down nine percent year-over-year due to a lower postpaid phone customer base in addition to the rate drivers described below. The sequential decline of two percent was primarily attributable to the rate drivers described below. |
| |
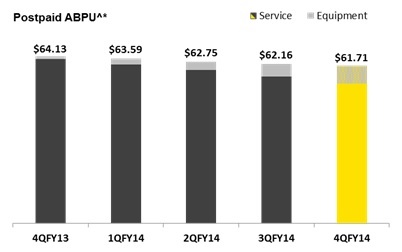
| • | Postpaid ABPU^* of $61.71 for the quarter declined four percent year-over-year and one percent sequentially. The year-over-year decline was primarily related to a higher mix of tablets, which have a lower monthly recurring charge than phones, and a shift to rate plans offered in conjunction with device financing options, partially offset by higher installment billings and lease revenue associated with the introduction of device financing options. Sequentially, the decline was primarily driven by the shift to rate plans offered in conjunction with device financing options, partially offset by growth in equipment billings. |
| |
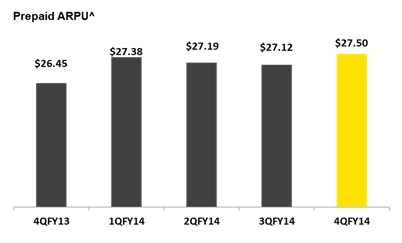
| • | Prepaid ARPU^ of $27.50 for the quarter increased $1.05 year-over-year and $0.38 sequentially. The year-over-year increase was primarily driven by changes in the mix of our customer base among our prepaid brands, partially offset by pricing changes in our Boost brand. The sequential increase was primarily driven by changes in the mix of our customer base among our prepaid brands. |
|
| |
| THE SPRINT QUARTERLY INVESTOR UPDATE - FISCAL 4Q14 | 9 |
Operating Expenses
| |
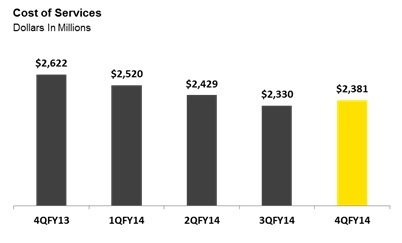
| • | Cost of services of $2.4 billion for the quarter decreased $241 million year-over-year, primarily driven by lower spend related to the completion of the 3G and voice network replacement, lower wireline international rates, and lower wireless postpaid roaming expenses, partially offset by higher wireless service and repair costs. Sequentially, cost of services increased $51 million as higher wireless service and repair costs were partially offset by lower wireless postpaid roaming volumes and lower wireline international rates. |
| |
| • | Cost of products of $1.8 billion for the quarter declined $211 million year-over-year driven by lower non-lease sales volumes as customer preference shifts towards device leasing options, partially offset by changes in device sales mix. Sequentially, wireless cost of products was lower by $1.1 billion primarily driven by lower non-lease sales volumes. |
| |
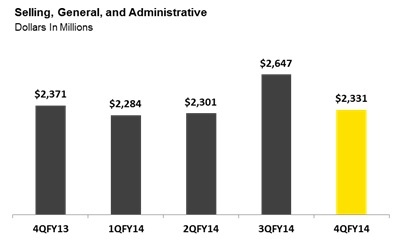
| • | SG&A expenses of $2.3 billion for the quarter declined $40 million year-over-year and $316 million sequentially. The year-over-year decrease was driven by labor reductions and a shift in postpaid sales to more cost effective channels, partially offset by higher prepaid selling expenses. The sequential decline in SG&A was mostly the result of seasonally lower postpaid sales volumes and lower bad debt expense as our customer credit profile improves. |
| |
| • | Depreciation and amortization expense of $1.5 billion for the quarter increased $157 million year-over-year and $134 million sequentially. Both the year-over-year and sequential increases were primarily related to depreciation of devices associated with our leasing options, which were introduced in September 2014. |
|
| |
| THE SPRINT QUARTERLY INVESTOR UPDATE - FISCAL 4Q14 | 10 |
Adjusted EBITDA* & Operating Income (Loss)
| |
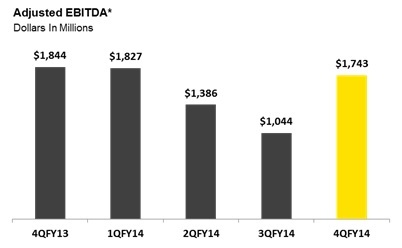
| • | Adjusted EBITDA* was $1.7 billion for the quarter, compared to $1.8 billion in the year-ago quarter and $1 billion in the prior quarter. Adjusted EBITDA* decreased five percent year-over-year as lower wireless service revenues, mostly driven by customer shifts to rate plans associated with device financing options, were partially offset by lower net subsidy expenses related to the introduction of device financing options, including leasing for which no cost of products expense is recorded at the point of sale, and lower cost of service expenses driven by the completion of the 3G and voice network replacement. Sequentially, Adjusted EBITDA* increased $699 million mostly due to seasonally lower postpaid sales volumes driving lower net subsidy and selling expenses. |
| |
| • | Operating income was $318 million in the quarter compared to operating income of $420 million in the year-ago quarter and an operating loss of $2.5 billion in the prior quarter. The year-over-year decrease in operating income was driven by higher depreciation, lower non-recurring expenses, and the items identified above in Adjusted EBITDA*. The prior quarter operating loss included a non-cash impairment charge of $2.1 billion. Excluding this impairment, operating loss in the prior quarter would have been $407 million. |
Capital Expenditures & Free Cash Flow*
| |
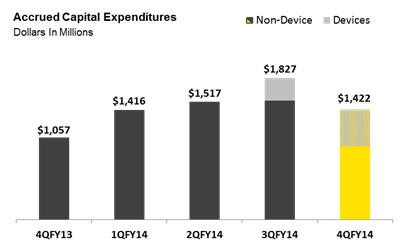
| • | Cash capital expenditures were $2 billion in the quarter, compared to $1.5 billion in the year-ago quarter and $1.6 billion in the prior quarter. Both the year-over-year and sequential changes were primarily driven by the introduction of device leasing options in our indirect channels, which represents approximately $450 million in the current quarter and $150 million in the prior quarter, and increased spending associated with the build out of our 2.5 GHz spectrum. |
| |
| • | Free Cash Flow* was negative $914 million for the quarter, compared to negative $1.1 billion in the year-ago quarter and negative $1.8 billion in the prior quarter. The year-over-year change was impacted by favorable changes to working capital, partially offset by higher capital expenditures. The sequential improvement was driven by higher Adjusted EBITDA* and favorable changes to working capital, partially offset by higher capital expenditures. |
|
| |
| THE SPRINT QUARTERLY INVESTOR UPDATE - FISCAL 4Q14 | 11 |
Liquidity & Debt
| |
| • | The company’s total liquidity position at the end of the quarter was $7.5 billion. This included $4.2 billion of cash, cash equivalents, and short-term investments, $2.8 billion of undrawn borrowing capacity under our revolving bank credit facility, and approximately $500 million in service receivables financing agreement. In addition, the company currently has $1.4 billion of availability under vendor financing agreements that can be utilized toward the purchase of 2.5 GHz network equipment and in April amended the service receivables facility, increasing its size from $1.3 billion to $3.3 billion by including equipment receivables. |
| |
| • | Net Debt* excluding net premiums was $28.5 billion at the end of the quarter. This compares to $25.2 billion in the year-ago quarter and $27.6 billion in the prior quarter. |
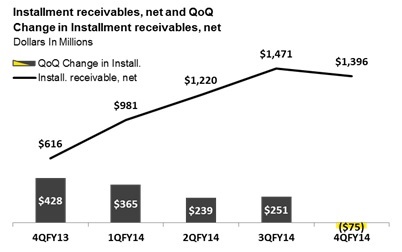
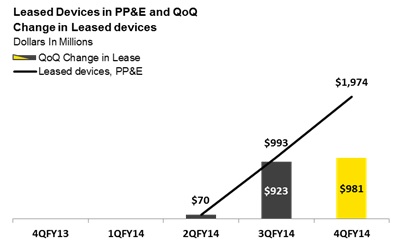
Device Financing
| |
| • | Net Installment receivables at the end of the quarter were $1.4 billion compared to $600 million at the end of the year-ago quarter and $1.5 billion at the end of the prior quarter. The sequential decline was impacted by a smaller differential between new installment billing sales and billings from prior period sales. |
| |
| • | Leased Devices included in PP&E at the end of the quarter were $2 billion. The $1 billion sequential increase was primarily driven by a 37 percent leasing take rate for postpaid sales. Depreciation related to leased devices was $150 million in the quarter. |
|
| |
| THE SPRINT QUARTERLY INVESTOR UPDATE - FISCAL 4Q14 | 12 |
Wireless Operating Statistics (Unaudited) |
| | | | | | | | | | | |
| | Quarter To Date | | Year To Date |
| | 3/31/15 | 12/31/14 | 3/31/14 | | 3/31/15 |
| 3/31/14 |
|
| Net Additions (Losses) (in thousands) | | | | | | |
| Sprint platform: | | | | | | |
Postpaid (2) | 211 |
| 30 |
| (231 | ) | | (212 | ) | (339 | ) |
Prepaid (3) | 546 |
| 410 |
| (364 | ) | | 449 |
| (444 | ) |
| Wholesale and affiliate | 492 |
| 527 |
| 212 |
| | 2,349 |
| 467 |
|
| Total Sprint platform | 1,249 |
| 967 |
| (383 | ) | | 2,586 |
| (316 | ) |
| Nextel platform: | | | | | | |
Postpaid (2) | — |
| — |
| — |
| | — |
| (1,060 | ) |
Prepaid (3) | — |
| — |
| — |
| | — |
| (255 | ) |
| Total Nextel platform | — |
| — |
| — |
| | — |
| (1,315 | ) |
| Transactions: | | | | | | |
Postpaid (2) | (41 | ) | (49 | ) | (102 | ) | | (218 | ) | (583 | ) |
Prepaid (3) | (18 | ) | (39 | ) | (51 | ) | | (189 | ) | (230 | ) |
| Wholesale | 22 |
| 13 |
| 69 |
| | 75 |
| 107 |
|
| Total transactions | (37 | ) | (75 | ) | (84 | ) | | (332 | ) | (706 | ) |
| | | | | | | |
| Total retail postpaid net additions (losses) | 170 |
| (19 | ) | (333 | ) | | (430 | ) | (1,982 | ) |
| Total retail prepaid net additions (losses) | 528 |
| 371 |
| (415 | ) | | 260 |
| (929 | ) |
| Total wholesale and affiliate net additions | 514 |
| 540 |
| 281 |
| | 2,424 |
| 574 |
|
| Total Wireless Net Additions (Losses) | 1,212 |
| 892 |
| (467 | ) | | 2,254 |
| (2,337 | ) |
| | | | | | | |
| End of Period Connections (in thousands) | | | | | | |
| Sprint platform: | | | | | | |
Postpaid (2) | 29,706 |
| 29,495 |
| 29,918 |
| | 29,706 |
| 29,918 |
|
Prepaid (3) | 15,706 |
| 15,160 |
| 15,257 |
| | 15,706 |
| 15,257 |
|
| Wholesale and affiliate | 10,725 |
| 10,233 |
| 8,376 |
| | 10,725 |
| 8,376 |
|
| Total Sprint platform | 56,137 |
| 54,888 |
| 53,551 |
| | 56,137 |
| 53,551 |
|
| Nextel platform: | | | | | | |
Postpaid (2) | — |
| — |
| — |
| | — |
| — |
|
Prepaid (3) | — |
| — |
| — |
| | — |
| — |
|
| Total Nextel platform | — |
| — |
| — |
| | — |
| — |
|
Transactions: (a) | | | | | | |
Postpaid (2) | 368 |
| 409 |
| 586 |
| | 368 |
| 586 |
|
Prepaid (3) | 361 |
| 379 |
| 550 |
| | 361 |
| 550 |
|
| Wholesale | 275 |
| 253 |
| 200 |
| | 275 |
| 200 |
|
| Total transactions | 1,004 |
| 1,041 |
| 1,336 |
| | 1,004 |
| 1,336 |
|
| | | | | | | |
| Total retail postpaid end of period connections | 30,074 |
| 29,904 |
| 30,504 |
| | 30,074 |
| 30,504 |
|
| Total retail prepaid end of period connections | 16,067 |
| 15,539 |
| 15,807 |
| | 16,067 |
| 15,807 |
|
| Total wholesale and affiliate end of period connections | 11,000 |
| 10,486 |
| 8,576 |
| | 11,000 |
| 8,576 |
|
| Total End of Period Connections | 57,141 |
| 55,929 |
| 54,887 |
| | 57,141 |
| 54,887 |
|
| | | | | | | |
| Supplemental Data - Connected Devices | | | | | | |
| End of Period Connections (in thousands) | | | | | | |
| Retail postpaid | 1,320 |
| 1,180 |
| 968 |
| | 1,320 |
| 968 |
|
| Wholesale and affiliate | 5,832 |
| 5,175 |
| 3,882 |
| | 5,832 |
| 3,882 |
|
| Total | 7,152 |
| 6,355 |
| 4,850 |
| | 7,152 |
| 4,850 |
|
| | | | | | | |
| Churn | | | | | | |
| Sprint platform: | | | | | | |
| Postpaid | 1.84 | % | 2.30 | % | 2.11 | % | | 2.09 | % | 2.00 | % |
| Prepaid | 3.84 | % | 3.94 | % | 4.33 | % | | 3.99 | % | 4.04 | % |
| Nextel platform: | | | | | | |
| Postpaid | — |
| — |
| — |
| | — |
| 33.90 | % |
| Prepaid | — |
| — |
| — |
| | — |
| 32.13 | % |
Transactions: (a) | | | | | | |
| Postpaid | 3.87 | % | 4.09 | % | 5.48 | % | | 4.21 | % | 7.05 | % |
| Prepaid | 3.77 | % | 4.95 | % | 5.11 | % | | 5.28 | % | 7.58 | % |
| | | | | | | |
| Total retail postpaid churn | 1.87 | % | 2.33 | % | 2.18 | % | | 2.13 | % | 2.26 | % |
| Total retail prepaid churn | 3.84 | % | 3.97 | % | 4.35 | % | | 4.03 | % | 4.21 | % |
| | | | | | | |
| Nextel Platform Connection Recaptures | | | | | | |
Connections (in thousands) (4): | | | | | | |
| Postpaid | — |
| — |
| — |
| | — |
| 364 |
|
| Prepaid | — |
| — |
| — |
| | — |
| 101 |
|
Rate (5): | | | | | | |
| Postpaid | — |
| — |
| — |
| | — |
| 34 | % |
| Prepaid | — |
| — |
| — |
| | — |
| 39 | % |
(a) We acquired approximately 352,000 postpaid connections and 59,000 prepaid connections through the acquisition of assets from U.S. Cellular when the transaction closed on May 17, 2013. We acquired approximately 788,000 postpaid connections, 721,000 prepaid connections, 93,000 wholesale connections and transferred 29,000 Sprint wholesale connections that were originally recognized through our Clearwire MVNO arrangement to Transactions postpaid connections as a result of the Clearwire acquisition when the transaction closed on July 9, 2013.
|
| |
| THE SPRINT QUARTERLY INVESTOR UPDATE - FISCAL 4Q14 | 13 |
Wireless Operating Statistics (Unaudited) (continued)
|
| | | | | | | | | | | | | | | | | | | | | | | | | | | |
| | Successor | | | | Predecessor | | | | Combined (1) |
| | Quarter to Date | Quarter
to Date | Quarter
to Date | Year
to Date | Year
to Date | | | | 101 Days Ended | | | | Year
to Date |
| | 3/31/15 | 12/31/14 | 3/31/14 | 3/31/15 | 3/31/14 | | | | 7/10/13 | | | | 3/31/14 |
ARPU (b) | | | | | | | | | | | | | |
| Sprint platform: | | | | | | | | | | | | | |
| Postpaid | $ | 56.94 |
| $ | 58.90 |
| $ | 63.52 |
| $ | 59.63 |
| $ | 63.95 |
| | | | $ | 64.25 |
| | | | $ | 64.03 |
|
| Prepaid | $ | 27.50 |
| $ | 27.12 |
| $ | 26.45 |
| $ | 27.30 |
| $ | 26.16 |
| | | | $ | 26.96 |
| | | | $ | 26.38 |
|
| Nextel platform: | | | | | | | | | | | | | |
| Postpaid | $ | — |
| $ | — |
| $ | — |
| $ | — |
| $ | — |
| | | | $ | 36.66 |
| | | | $ | 36.66 |
|
| Prepaid | $ | — |
| $ | — |
| $ | — |
| $ | — |
| $ | — |
| | | | $ | 34.48 |
| | | | $ | 34.48 |
|
Transactions: (a) | | | | | | | | | | | | | |
| Postpaid | $ | 40.28 |
| $ | 39.85 |
| $ | 37.26 |
| $ | 39.69 |
| $ | 36.99 |
| | | | $ | 56.98 |
| | | | $ | 39.21 |
|
| Prepaid | $ | 46.68 |
| $ | 45.80 |
| $ | 43.80 |
| $ | 45.72 |
| $ | 41.65 |
| | | | $ | 18.26 |
| | | | $ | 42.24 |
|
| | | | | | | | | | | | | | |
| Total retail postpaid ARPU | $ | 56.72 |
| $ | 58.63 |
| $ | 62.98 |
| $ | 59.32 |
| $ | 63.29 |
| | | | $ | 63.68 |
| | | | $ | 63.42 |
|
| Total retail prepaid ARPU | $ | 27.95 |
| $ | 27.61 |
| $ | 27.07 |
| $ | 27.81 |
| $ | 26.79 |
| | | | $ | 27.01 |
| | | | $ | 26.87 |
|
| | | | | | | | | | | | | | |
NON-GAAP RECONCILIATION - AVERAGE BILLINGS PER USER (ABPU)* (Unaudited)
(Millions, except ABPU*)
|
| | | | | | | | | | | | |
| | Successor |
| | Quarter to Date | Quarter
to Date | Quarter
to Date | Year
to Date |
| | 3/31/15 | 12/31/14 | 3/31/14 | 3/31/15 |
ABPU* (c) | | | | |
| Sprint platform service revenue | $ | 5,049 |
| $ | 5,202 |
| $ | 5,719 |
| $ | 21,181 |
|
| Add: Installment plan billings and lease revenue | 423 |
| 288 |
| 55 |
| 1,041 |
|
| Total for Sprint platform postpaid connections | $ | 5,472 |
| $ | 5,490 |
| $ | 5,774 |
| $ | 22,222 |
|
| | | | | |
| Sprint platform ABPU* | $ | 61.71 |
| $ | 62.16 |
| $ | 64.13 |
| $ | 62.55 |
|
| | | | | |
(a) We acquired approximately 352,000 postpaid connections and 59,000 prepaid connections through the acquisition of assets from U.S. Cellular when the transaction closed on May 17, 2013. We acquired approximately 788,000 postpaid connections, 721,000 prepaid connections, 93,000 wholesale connections and transferred 29,000 Sprint wholesale connections that were originally recognized through our Clearwire MVNO arrangement to Transactions postpaid connections as a result of the Clearwire acquisition when the transaction closed on July 9, 2013.
(b)ARPU is calculated by dividing service revenue by the sum of the average number of connections in the applicable service category. Changes in average monthly service revenue reflect connections for either the postpaid or prepaid service category who change rate plans, the level of voice and data usage, the amount of service credits which are offered to connections, plus the net effect of average monthly revenue generated by new connections and deactivating connections. Combined ARPU for the year-to-date March 31, 2014 period aggregates service revenue for the 101 days ended July 10, 2013 predecessor period and the year-to-date March 31, 2014 successor period divided by the sum of the average connections during the year-to-date period.
(c)Sprint platform postpaid ABPU* is calculated by dividing service revenue earned from customers plus installment plan billings and lease revenue by the sum of the average number of connections during the period.
|
| |
| THE SPRINT QUARTERLY INVESTOR UPDATE - FISCAL 4Q14 | 14 |
CONDENSED CONSOLIDATED STATEMENTS OF OPERATIONS (Unaudited)
(Millions, except per Share Data)
|
| | | | | | | | | | | | | | | | | | | | | | | | | | | |
| | Successor | | | | Predecessor | | | | Combined (1) |
| | Quarter to Date | Quarter
to Date | Quarter
to Date | Year
to Date | Year
to Date | | | | 101 Days
Ended | | | | Year
to Date |
| | 3/31/15 | 12/31/14 | 3/31/14 | 3/31/15 | 3/31/14 | | | | 7/10/13 | | | | 3/31/14 |
| | | | | | | | | | | | | | |
| Net Operating Revenues |
|
|
|
|
| | | |
| | | |
|
| Service revenue | $ | 7,138 |
| $ | 7,272 |
| $ | 7,876 |
| $ | 29,542 |
| $ | 22,970 |
| | | | $ | 8,915 |
| | | | $ | 31,885 |
|
| Equipment revenue | 1,144 |
| 1,701 |
| 999 |
| 4,990 |
| 2,796 |
| | | | 894 |
| | | | 3,690 |
|
| Total Net Operating Revenues | 8,282 |
| 8,973 |
| 8,875 |
| 34,532 |
| 25,766 |
| | | | 9,809 |
| | | | 35,575 |
|
| Net Operating Expenses | | | | | | | | | | | | | |
| Cost of services | 2,381 |
| 2,330 |
| 2,622 |
| 9,660 |
| 7,796 |
| | | | 3,033 |
| | | | 10,829 |
|
| Cost of products | 1,827 |
| 2,952 |
| 2,038 |
| 9,309 |
| 6,641 |
| | | | 2,579 |
| | | | 9,220 |
|
| Selling, general and administrative | 2,331 |
| 2,647 |
| 2,371 |
| 9,563 |
| 7,198 |
| | | | 2,731 |
| | | | 9,929 |
|
| Depreciation and amortization | 1,454 |
| 1,320 |
| 1,297 |
| 5,349 |
| 4,231 |
| | | | 1,753 |
| | | | 5,984 |
|
Impairments (6) | — |
| 2,133 |
| 75 |
| 2,133 |
| 75 |
| | | | — |
| | | | 75 |
|
| Other, net | (29 | ) | 131 |
| 52 |
| 413 |
| 361 |
| | | | 627 |
| | | | 988 |
|
| Total net operating expenses | 7,964 |
| 11,513 |
| 8,455 |
| 36,427 |
| 26,302 |
| | | | 10,723 |
| | | | 37,025 |
|
| Operating Income (Loss) | 318 |
| (2,540 | ) | 420 |
| (1,895 | ) | (536 | ) | | | | (914 | ) | | | | (1,450 | ) |
| Interest expense | (523 | ) | (506 | ) | (516 | ) | (2,051 | ) | (1,434 | ) | | | | (703 | ) | | | | (2,137 | ) |
Equity in earnings of unconsolidated investments and other, net | 8 |
| 10 |
| 1 |
| 27 |
| 68 |
| | | | 2,665 |
| | | | 2,733 |
|
| (Loss) Income before Income Taxes | (197 | ) | (3,036 | ) | (95 | ) | (3,919 | ) | (1,902 | ) | | | | 1,048 |
| | | | (854 | ) |
| Income tax (expense) benefit | (27 | ) | 657 |
| (56 | ) | 574 |
| (100 | ) | | | | (1,563 | ) | | | | (1,663 | ) |
| Net Loss | $ | (224 | ) | $ | (2,379 | ) | $ | (151 | ) | $ | (3,345 | ) | $ | (2,002 | ) | | | | $ | (515 | ) | | | | $ | (2,517 | ) |
| Basic Net Loss Per Common Share | $ | (0.06 | ) | $ | (0.60 | ) | $ | (0.04 | ) | $ | (0.85 | ) | $ | (0.54 | ) | | | | $ | (0.17 | ) | | | | NM |
|
| Diluted Net Loss Per Common Share | $ | (0.06 | ) | $ | (0.60 | ) | $ | (0.04 | ) | $ | (0.85 | ) | $ | (0.54 | ) | | | | $ | (0.17 | ) | | | | NM |
|
| Basic Weighted Average Common Shares outstanding | 3,962 |
| 3,957 |
| 3,949 |
| 3,953 |
| 3,693 |
| | | | 3,038 |
| | | | NM |
|
| Diluted Weighted Average Common Shares outstanding | 3,962 |
| 3,957 |
| 3,949 |
| 3,953 |
| 3,693 |
| | | | 3,038 |
| | | | NM |
|
| Effective Tax Rate | -13.7 | % | 21.6 | % | -58.9 | % | 14.6 | % | -5.3 | % | | | | 149.1 | % | | | | NM |
|
NON-GAAP RECONCILIATION - NET LOSS TO ADJUSTED EBITDA* (Unaudited)
(Millions) |
| | | | | | | | | | | | | | | | | | | | | | | | | | | |
| | Successor | | | | Predecessor | | | | Combined (1) |
| | Quarter to Date | Quarter
to Date | Quarter
to Date | Year
to Date | Year
to Date | | | | 101 Days
Ended | | | | Year
to Date |
| | 3/31/15 | 12/31/14 | 3/31/14 | 3/31/15 | 3/31/14 | | | | 7/10/13 | | | | 3/31/14 |
| | | | | | | | | | | | | | |
| Net Loss | $ | (224 | ) | $ | (2,379 | ) | $ | (151 | ) | $ | (3,345 | ) | $ | (2,002 | ) | | | | $ | (515 | ) | | | | $ | (2,517 | ) |
| Income tax expense (benefit) | 27 |
| (657 | ) | 56 |
| (574 | ) | 100 |
| | | | 1,563 |
| | | | 1,663 |
|
| (Loss) Income before Income Taxes | (197 | ) | (3,036 | ) | (95 | ) | (3,919 | ) | (1,902 | ) | | | | 1,048 |
| | | | (854 | ) |
| Equity in earnings of unconsolidated investments and other, net | (8 | ) | (10 | ) | (1 | ) | (27 | ) | (68 | ) | | | | (2,665 | ) | | | | (2,733 | ) |
| Interest expense | 523 |
| 506 |
| 516 |
| 2,051 |
| 1,434 |
| | | | 703 |
| | | | 2,137 |
|
| Operating Income (Loss) | 318 |
| (2,540 | ) | 420 |
| (1,895 | ) | (536 | ) | | | | (914 | ) | | | | (1,450 | ) |
| Depreciation and amortization | 1,454 |
| 1,320 |
| 1,297 |
| 5,349 |
| 4,231 |
| | | | 1,753 |
| | | | 5,984 |
|
| EBITDA* | 1,772 |
| (1,220 | ) | 1,717 |
| 3,454 |
| 3,695 |
| | | | 839 |
| | | | 4,534 |
|
Severance and exit costs (7) | (29 | ) | 22 |
| 52 |
| 304 |
| 361 |
| | | | 627 |
| | | | 988 |
|
Impairments (6) | — |
| 2,133 |
| 75 |
| 2,133 |
| 75 |
| | | | — |
| | | | 75 |
|
Litigation (8) | — |
| 91 |
| — |
| 91 |
| — |
| | | | — |
| | | | — |
|
Business combinations (9) | — |
| — |
| — |
| — |
| 100 |
| | | | 53 |
| | | | 153 |
|
Partial pension settlement (10) | — |
| 59 |
| — |
| 59 |
| — |
| | | | — |
| | | | — |
|
Release of assumed liability - U.S. Cellular asset acquisition (11) | — |
| (41 | ) | — |
| (41 | ) | — |
| | | | — |
| | | | — |
|
Hurricane Sandy (12) | — |
| — |
| — |
| — |
| (7 | ) | | | | — |
| | | | (7 | ) |
| Adjusted EBITDA* | $ | 1,743 |
| $ | 1,044 |
| $ | 1,844 |
| $ | 6,000 |
| $ | 4,224 |
| | | | $ | 1,519 |
| | | | $ | 5,743 |
|
| Adjusted EBITDA Margin* | 24.4 | % | 14.4 | % | 23.4 | % | 20.3 | % | 18.4 | % | | | | 17.0 | % | | | | 18.0 | % |
| Selected items: | | | | | | | | | | | | | |
| Increase in deferred tax asset valuation allowance | $ | 114 |
| $ | 500 |
| $ | 82 |
| $ | 911 |
| $ | 790 |
| | | | $ | 1,145 |
| | | | $ | 1,935 |
|
| Accrued capital expenditures | $ | 1,422 |
| $ | 1,827 |
| $ | 1,057 |
| $ | 6,182 |
| $ | 4,624 |
| | | | $ | 2,072 |
| | | | $ | 6,696 |
|
| Cash paid for capital expenditures | $ | 2,047 |
| $ | 1,568 |
| $ | 1,488 |
| $ | 6,004 |
| $ | 5,335 |
| | | | $ | 1,759 |
| | | | $ | 7,094 |
|
|
| |
| THE SPRINT QUARTERLY INVESTOR UPDATE - FISCAL 4Q14 | 15 |
WIRELESS STATEMENTS OF OPERATIONS (Unaudited)
(Millions)
|
| | | | | | | | | | | | | | | | | | | | | | | | | | | |
| | Successor | | | | Predecessor | | | | Combined (1) |
| | Quarter to Date | Quarter
to Date | Quarter
to Date | Year
to Date | Year
to Date | | | | 101 Days Ended | | | | Year
to Date |
| | 3/31/15 | 12/31/14 | 3/31/14 | 3/31/15 | 3/31/14 | | | | 7/10/13 | | | | 3/31/14 |
| | | | | | | | | | | | | | |
| Net Operating Revenues | | | | | | | | | | | | | |
| Service revenue | | | | | | | | | | | | | |
| Sprint platform: | | | | | | | | | | | | | |
Postpaid (2) | $ | 5,049 |
| $ | 5,202 |
| $ | 5,719 |
| $ | 21,181 |
| $ | 16,702 |
| | | | $ | 6,469 |
| | | | $ | 23,171 |
|
Prepaid (3) | 1,272 |
| 1,215 |
| 1,232 |
| 4,905 |
| 3,497 |
| | | | 1,408 |
| | | | 4,905 |
|
| Wholesale, affiliate and other | 189 |
| 191 |
| 145 |
| 724 |
| 393 |
| | | | 146 |
| | | | 539 |
|
| Total Sprint platform | 6,510 |
| 6,608 |
| 7,096 |
| 26,810 |
| 20,592 |
| | | | 8,023 |
| | | | 28,615 |
|
| Nextel platform: | | | | | | | | | | | | | |
Postpaid (2) | — |
| — |
| — |
| — |
| — |
| | | | 74 |
| | | | 74 |
|
Prepaid (3) | — |
| — |
| — |
| — |
| — |
| | | | 17 |
| | | | 17 |
|
| Total Nextel platform | — |
| — |
| — |
| — |
| — |
| | | | 91 |
| | | | 91 |
|
| Transactions: | | | | | | | | | | | | | |
Postpaid (2) | 47 |
| 52 |
| 70 |
| 222 |
| 240 |
| | | | 26 |
| | | | 266 |
|
Prepaid (3) | 52 |
| 54 |
| 75 |
| 236 |
| 236 |
| | | | 2 |
| | | | 238 |
|
| Wholesale | 19 |
| 18 |
| 14 |
| 69 |
| 32 |
| | | | — |
| | | | 32 |
|
| Total transactions | 118 |
| 124 |
| 159 |
| 527 |
| 508 |
| | | | 28 |
| | | | 536 |
|
| | | | | | | | | | | | | | |
| Equipment revenue | 1,144 |
| 1,701 |
| 999 |
| 4,990 |
| 2,796 |
| | | | 894 |
| | | | 3,690 |
|
| Total net operating revenues | 7,772 |
| 8,433 |
| 8,254 |
| 32,327 |
| 23,896 |
| | | | 9,036 |
| | | | 32,932 |
|
| | | | | | | | | | | | | | |
| Net Operating Expenses | | | | | | | | | | | | | |
| Cost of services | 2,006 |
| 1,902 |
| 2,106 |
| 7,945 |
| 6,441 |
| | | | 2,532 |
| | | | 8,973 |
|
| Cost of products | 1,827 |
| 2,952 |
| 2,038 |
| 9,309 |
| 6,641 |
| | | | 2,579 |
| | | | 9,220 |
|
| Selling, general and administrative | 2,242 |
| 2,545 |
| 2,273 |
| 9,179 |
| 6,817 |
| | | | 2,550 |
| | | | 9,367 |
|
| Depreciation and amortization | 1,406 |
| 1,259 |
| 1,224 |
| 5,109 |
| 4,032 |
| | | | 1,636 |
| | | | 5,668 |
|
Impairments (6) | — |
| 1,900 |
| 72 |
| 1,900 |
| 72 |
| | | | — |
| | | | 72 |
|
| Other, net | (29 | ) | 107 |
| 51 |
| 349 |
| 331 |
| | | | 627 |
| | | | 958 |
|
| Total net operating expenses | 7,452 |
| 10,665 |
| 7,764 |
| 33,791 |
| 24,334 |
| | | | 9,924 |
| | | | 34,258 |
|
| Operating Income (Loss) | $ | 320 |
| $ | (2,232 | ) | $ | 490 |
| $ | (1,464 | ) | $ | (438 | ) | | | | $ | (888 | ) | | | | $ | (1,326 | ) |
| | | | | | | | | | | | | | |
| Supplemental Revenue Data | | | | | | | | | | | | | |
| Total retail service revenue | $ | 6,420 |
| $ | 6,523 |
| $ | 7,096 |
| $ | 26,544 |
| $ | 20,675 |
| | | | $ | 7,996 |
| | | | $ | 28,671 |
|
| Total service revenue | $ | 6,628 |
| $ | 6,732 |
| $ | 7,255 |
| $ | 27,337 |
| $ | 21,100 |
| | | | $ | 8,142 |
| | | | $ | 29,242 |
|
WIRELESS NON-GAAP RECONCILIATION (Unaudited)
(Millions)
|
| | | | | | | | | | | | | | | | | | | | | | | | | | | |
| | Successor | | | | Predecessor | | | | Combined (1) |
| | Quarter to Date | Quarter
to Date | Quarter
to Date | Year
to Date | Year
to Date | | | | 101 Days Ended | | | | Year
to Date |
| | 3/31/15 | 12/31/14 | 3/31/14 | 3/31/15 | 3/31/14 | | | | 7/10/13 | | | | 3/31/14 |
| | | | | | | | | | | | | | |
| Operating Income (Loss) | $ | 320 |
| $ | (2,232 | ) | $ | 490 |
| $ | (1,464 | ) | $ | (438 | ) | | | | $ | (888 | ) | | | | $ | (1,326 | ) |
Severance and exit costs (7) | (29 | ) | 21 |
| 51 |
| 263 |
| 331 |
| | | | 627 |
| | | | 958 |
|
Impairments (6) | — |
| 1,900 |
| 72 |
| 1,900 |
| 72 |
| | | | — |
| | | | 72 |
|
Litigation (8) | — |
| 84 |
| — |
| 84 |
| — |
| | | | — |
| | | | — |
|
Business combinations (9) | — |
| — |
| — |
| — |
| 25 |
| | | | — |
| | | | 25 |
|
Partial pension settlement (10) | — |
| 43 |
| — |
| 43 |
| — |
| | | | — |
| | | | — |
|
Release of assumed liability - U.S. Cellular asset acquisition (11) | — |
| (41 | ) | — |
| (41 | ) | — |
| | | | — |
| | | | — |
|
Hurricane Sandy (12) | — |
| — |
| — |
| — |
| (7 | ) | | | | — |
| | | | (7 | ) |
| Depreciation and amortization | 1,406 |
| 1,259 |
| 1,224 |
| 5,109 |
| 4,032 |
| | | | 1,636 |
| | | | 5,668 |
|
| Adjusted EBITDA* | $ | 1,697 |
| $ | 1,034 |
| $ | 1,837 |
| $ | 5,894 |
| $ | 4,015 |
| | | | $ | 1,375 |
| | | | $ | 5,390 |
|
| Adjusted EBITDA Margin* | 25.6 | % | 15.4 | % | 25.3 | % | 21.6 | % | 19.0 | % | | | | 16.9 | % | | | | 18.4 | % |
| Selected items: | | | | | | | | | | | | | |
| Accrued capital expenditures | $ | 1,343 |
| $ | 1,616 |
| $ | 930 |
| $ | 5,589 |
| $ | 4,173 |
| | | | $ | 1,884 |
| | | | $ | 6,057 |
|
| Cash paid for capital expenditures | $ | 1,957 |
| $ | 1,376 |
| $ | 1,343 |
| $ | 5,442 |
| $ | 4,878 |
| | | | $ | 1,570 |
| | | | $ | 6,448 |
|
|
| |
| THE SPRINT QUARTERLY INVESTOR UPDATE - FISCAL 4Q14 | 16 |
WIRELINE STATEMENTS OF OPERATIONS (Unaudited)
(Millions)
|
| | | | | | | | | | | | | | | | | | | | | | | | | | | |
| | Successor | | | | Predecessor | | | | Combined (1) |
| | Quarter to Date | Quarter to Date | Quarter
to Date | Year
to Date | Year
to Date | | | | 101 Days Ended | | | | Year
to Date |
| | 3/31/15 | 12/31/14 | 3/31/14 | 3/31/15 | 3/31/14 | | | | 7/10/13 | | | | 3/31/14 |
| Net Operating Revenues | | | | | | | | | | | | | |
| Voice | $ | 264 |
| $ | 289 |
| $ | 352 |
| $ | 1,174 |
| $ | 1,071 |
| | | | $ | 419 |
| | | | $ | 1,490 |
|
| Data | 52 |
| 52 |
| 62 |
| 213 |
| 200 |
| | | | 94 |
| | | | 294 |
|
| Internet | 335 |
| 333 |
| 345 |
| 1,353 |
| 1,092 |
| | | | 479 |
| | | | 1,571 |
|
| Other | 17 |
| 18 |
| 11 |
| 74 |
| 43 |
| | | | 16 |
| | | | 59 |
|
| Total net operating revenues | 668 |
| 692 |
| 770 |
| 2,814 |
| 2,406 |
| | | | 1,008 |
| | | | 3,414 |
|
| | | | | | | | | | | | | | |
| Net Operating Expenses | | | | | | | | | | | | | |
| Cost of services | 538 |
| 581 |
| 668 |
| 2,338 |
| 1,903 |
| | | | 741 |
| | | | 2,644 |
|
| Selling, general and administrative | 90 |
| 100 |
| 90 |
| 363 |
| 269 |
| | | | 123 |
| | | | 392 |
|
| Depreciation and amortization | 46 |
| 59 |
| 69 |
| 232 |
| 192 |
| | | | 115 |
| | | | 307 |
|
Impairments (6) | — |
| 233 |
| 3 |
| 233 |
| 3 |
| | | | — |
| | | | 3 |
|
| Other, net | (2 | ) | 24 |
| 2 |
| 61 |
| 32 |
| | | | — |
| | | | 32 |
|
| Total net operating expenses | 672 |
| 997 |
| 832 |
| 3,227 |
| 2,399 |
| | | | 979 |
| | | | 3,378 |
|
| Operating (Loss) Income | $ | (4 | ) | $ | (305 | ) | $ | (62 | ) | $ | (413 | ) | $ | 7 |
| | | | $ | 29 |
| | | | $ | 36 |
|
WIRELINE NON-GAAP RECONCILIATION (Unaudited)
(Millions)
|
| | | | | | | | | | | | | | | | | | | | | | | | | | | |
| | Successor | | | | Predecessor | | | | Combined (1) |
| | Quarter to Date | Quarter to Date | Quarter
to Date | Year
to Date | Year
to Date | | | | 101 Days Ended | | | | Year
to Date |
| | 3/31/15 | 12/31/14 | 3/31/14 | 3/31/15 | 3/31/14 | | | | 7/10/13 | | | | 3/31/14 |
| | | | | | | | | | | | | | |
| Operating (Loss) Income | $ | (4 | ) | $ | (305 | ) | $ | (62 | ) | $ | (413 | ) | $ | 7 |
| | | | $ | 29 |
| | | | $ | 36 |
|
Severance and exit costs (7) | (2 | ) | 2 |
| 2 |
| 39 |
| 32 |
| | | | — |
| | | | 32 |
|
Impairments (6) | — |
| 233 |
| 3 |
| 233 |
| 3 |
| | | | — |
| | | | 3 |
|
Litigation (8) | — |
| 6 |
| — |
| 6 |
| — |
| | | | — |
| | | | — |
|
Partial pension settlement (10) | — |
| 16 |
| — |
| 16 |
| — |
| | | | — |
| | | | — |
|
| Depreciation and amortization | 46 |
| 59 |
| 69 |
| 232 |
| 192 |
| | | | 115 |
| | | | 307 |
|
| Adjusted EBITDA* | $ | 40 |
| $ | 11 |
| $ | 12 |
| $ | 113 |
| $ | 234 |
| | | | $ | 144 |
| | | | $ | 378 |
|
| Adjusted EBITDA Margin* | 6.0 | % | 1.6 | % | 1.6 | % | 4.0 | % | 9.7 | % | | | | 14.3 | % | | | | 11.1 | % |
| Selected items: | | | | | | | | | | | | | |
| Accrued capital expenditures | $ | 68 |
| $ | 70 |
| $ | 72 |
| $ | 278 |
| $ | 227 |
| | | | $ | 104 |
| | | | $ | 331 |
|
| Cash paid for capital expenditures | $ | 70 |
| $ | 81 |
| $ | 79 |
| $ | 275 |
| $ | 232 |
| | | | $ | 110 |
| | | | $ | 342 |
|
|
| |
| THE SPRINT QUARTERLY INVESTOR UPDATE - FISCAL 4Q14 | 17 |
CONDENSED CONSOLIDATED CASH FLOW INFORMATION (Unaudited)
(Millions)
|
| | | | | | | | | | | | | | | | | | |
| | Successor | | | | Predecessor | | | | Combined (1) |
| | Year
to Date | Year
to Date | | | | 101 Days Ended | | | | Year
to Date |
| | 3/31/15 | 3/31/14 | | | | 7/10/13 | | | | 3/31/14 |
| Operating Activities | | | | | | | | | | |
| Net loss | $ | (3,345 | ) | $ | (2,002 | ) | | | | $ | (515 | ) | | | | $ | (2,517 | ) |
Impairments (6) | 2,133 |
| 75 |
| | | | — |
| | | | 75 |
|
| Depreciation and amortization | 5,349 |
| 4,231 |
| | | | 1,753 |
| | | | 5,984 |
|
| Provision for losses on accounts receivable | 892 |
| 414 |
| | | | 111 |
| | | | 525 |
|
| Share-based and long-term incentive compensation expense | 86 |
| 133 |
| | | | 20 |
| | | | 153 |
|
| Deferred income tax (benefit) expense | (609 | ) | 79 |
| | | | 1,562 |
| | | | 1,641 |
|
| Gain on previously-held equity interests | — |
| — |
| | | | (2,926 | ) | | | | (2,926 | ) |
| Equity in losses of unconsolidated investments, net | — |
| — |
| | | | 280 |
| | | | 280 |
|
| Amortization and accretion of long-term debt premiums and discounts, net | (303 | ) | (234 | ) | | | | (5 | ) | | | | (239 | ) |
| Other working capital changes, net | (1,736 | ) | (1,470 | ) | | | | 1,004 |
| | | | (466 | ) |
| Other, net | (17 | ) | (763 | ) | | | | 447 |
| | | | (316 | ) |
| Net cash provided by operating activities | 2,450 |
| 463 |
| | | | 1,731 |
| | | | 2,194 |
|
| | | | | | | | | | | |
| Investing Activities | | | | | | | | | | |
| Capital expenditures | (6,004 | ) | (5,335 | ) | | | | (1,759 | ) | | | | (7,094 | ) |
| Expenditures relating to FCC licenses | (163 | ) | (298 | ) | | | | (70 | ) | | | | (368 | ) |
| Reimbursements relating to FCC licenses | 95 |
| — |
| | | | — |
| | | | — |
|
| Change in short-term investments, net | 1,054 |
| (119 | ) | | | | 869 |
| | | | 750 |
|
| Acquisitions, net of cash acquired | — |
| (14,112 | ) | | | | (4,039 | ) | | | | (18,151 | ) |
| Investment in Clearwire (including debt securities) | — |
| — |
| | | | (228 | ) | | | | (228 | ) |
| Proceeds from sales of assets and FCC licenses | 315 |
| 8 |
| | | | 4 |
| | | | 12 |
|
| Other, net | (11 | ) | (8 | ) | | | | (4 | ) | | | | (12 | ) |
| Net cash used in investing activities | (4,714 | ) | (19,864 | ) | | | | (5,227 | ) | | | | (25,091 | ) |
| | | | | | | | | | | |
| Financing Activities | | | | | | | | | | |
| Proceeds from debt and financings | 1,930 |
| 9,500 |
| | | | — |
| | | | 9,500 |
|
| Debt financing costs | (87 | ) | (148 | ) | | | | (1 | ) | | | | (149 | ) |
| Repayments of debt, financing and capital lease obligations | (574 | ) | (3,537 | ) | | | | (303 | ) | | | | (3,840 | ) |
| Proceeds from issuance of common stock and warrants, net | 35 |
| 18,567 |
| | | | 53 |
| | | | 18,620 |
|
| Other, net | — |
| (14 | ) | | | | — |
| | | | (14 | ) |
| Net cash provided by (used in) financing activities | 1,304 |
| 24,368 |
| | | | (251 | ) | | | | 24,117 |
|
| | | | | | | | | | | |
| Net (Decrease) Increase in Cash and Cash Equivalents | (960 | ) | 4,967 |
| | | | (3,747 | ) | | | | 1,220 |
|
| | | | | | | | | | | |
| Cash and Cash Equivalents, beginning of period | 4,970 |
| 3 |
| | | | 6,275 |
| | | | 3,750 |
|
| | | | | | | | | | | |
| Cash and Cash Equivalents, end of period | $ | 4,010 |
| $ | 4,970 |
| | | | $ | 2,528 |
| | | | $ | 4,970 |
|
RECONCILIATION TO CONSOLIDATED FREE CASH FLOW* (NON-GAAP) (Unaudited)
(Millions) |
| | | | | | | | | | | | | | | | | | | | | | | | | | | |
| | Successor | | | | Predecessor | | | | Combined (1) |
| | Quarter to Date | Quarter
to Date | Quarter
to Date | Year
to Date | Year
to Date | | | | 101 Days
Ended | | | | Year
to Date |
| | 3/31/15 | 12/31/14 | 3/31/14 | 3/31/15 | 3/31/14 | | | | 7/10/13 | | | | 3/31/14 |
| | | | | | | | | | | | | | |
| Net Cash Provided by (Used in) Operating Activities | $ | 976 |
| $ | (233 | ) | $ | 522 |
| $ | 2,450 |
| $ | 463 |
| | | | $ | 1,731 |
| | | | $ | 2,194 |
|
| | | | | | | | | | | | | | |
| Capital expenditures | (2,047 | ) | (1,568 | ) | (1,488 | ) | (6,004 | ) | (5,335 | ) | | | | (1,759 | ) | | | | (7,094 | ) |
| Expenditures relating to FCC licenses, net | (42 | ) | (42 | ) | (152 | ) | (68 | ) | (298 | ) | | | | (70 | ) | | | | (368 | ) |
| Proceeds from sales of assets and FCC licenses | 201 |
| 13 |
| 1 |
| 315 |
| 8 |
| | | | 4 |
| | | | 12 |
|
| Other investing activities, net | (2 | ) | (3 | ) | (2 | ) | (11 | ) | (8 | ) | | | | (4 | ) | | | | (12 | ) |
| Free Cash Flow* | (914 | ) | (1,833 | ) | (1,119 | ) | (3,318 | ) | (5,170 | ) | | | | (98 | ) | | | | (5,268 | ) |
| | | | | | | | | | | | | | |
| Debt financing costs | (50 | ) | (37 | ) | (1 | ) | (87 | ) | (148 | ) | | | | (1 | ) | | | | (149 | ) |
| Increase (decrease) in debt and other, net | 1,446 |
| 273 |
| (159 | ) | 1,356 |
| 5,963 |
| | | | (303 | ) | | | | 5,660 |
|
| Acquisitions, net of cash acquired | — |
| — |
| — |
| — |
| (14,112 | ) | | | | (4,039 | ) | | | | (18,151 | ) |
| (Payments for) proceeds from issuance of common stock and warrants, net of payments for shares surrendered for taxes | (15 | ) | 4 |
| — |
| 35 |
| 18,567 |
| | | | 53 |
| | | | 18,620 |
|
| Investment in Clearwire (including debt securities) | — |
| — |
| — |
| — |
| — |
| | | | (228 | ) | | | | (228 | ) |
| Other financing activities, net | — |
| — |
| — |
| — |
| (14 | ) | | | | — |
| | | | (14 | ) |
| Net Increase (Decrease) in Cash, Cash | | | | | | | | | | | | | |
| Equivalents and Short-Term Investments | $ | 467 |
| $ | (1,593 | ) | $ | (1,279 | ) | $ | (2,014 | ) | $ | 5,086 |
| | | | $ | (4,616 | ) | | | | $ | 470 |
|
|
| |
| THE SPRINT QUARTERLY INVESTOR UPDATE - FISCAL 4Q14 | 18 |
CONDENSED CONSOLIDATED BALANCE SHEETS (Unaudited)
(Millions)
|
| | | | | | |
| | Successor |
| | 3/31/15 | 3/31/14 |
| Assets | | |
| Current assets | | |
| Cash and cash equivalents | $ | 4,010 |
| $ | 4,970 |
|
| Short-term investments | 166 |
| 1,220 |
|
| Accounts and notes receivable, net | 2,290 |
| 3,607 |
|
| Device and accessory inventory | 1,359 |
| 982 |
|
| Deferred tax assets | 62 |
| 128 |
|
| Prepaid expenses and other current assets | 1,890 |
| 672 |
|
| Total current assets | 9,777 |
| 11,579 |
|
| | | |
| Investments and other assets | 1,077 |
| 892 |
|
| Property, plant and equipment, net | 19,721 |
| 16,299 |
|
| Goodwill | 6,575 |
| 6,383 |
|
| FCC licenses and other | 39,987 |
| 41,978 |
|
| Definite-lived intangible assets, net | 5,893 |
| 7,558 |
|
| Total assets | $ | 83,030 |
| $ | 84,689 |
|
| | | |
| Liabilities and Stockholders' Equity | | |
| Current liabilities | | |
| Accounts payable | $ | 4,347 |
| $ | 3,163 |
|
| Accrued expenses and other current liabilities | 5,293 |
| 5,544 |
|
| Current portion of long-term debt, financing and capital lease obligations | 1,300 |
| 991 |
|
| Total current liabilities | 10,940 |
| 9,698 |
|
| | | |
| Long-term debt, financing and capital lease obligations | 32,531 |
| 31,787 |
|
| Deferred tax liabilities | 13,898 |
| 14,207 |
|
| Other liabilities | 3,951 |
| 3,685 |
|
| Total liabilities | 61,320 |
| 59,377 |
|
| | | |
| Stockholders' equity | | |
| Common shares | 40 |
| 39 |
|
| Paid-in capital | 27,468 |
| 27,354 |
|
| Treasury shares, at cost | (7 | ) | — |
|
| Accumulated deficit | (5,383 | ) | (2,038 | ) |
| Accumulated other comprehensive loss | (408 | ) | (43 | ) |
| Total stockholders' equity | 21,710 |
| 25,312 |
|
| Total liabilities and stockholders' equity | $ | 83,030 |
| $ | 84,689 |
|
NET DEBT* (NON-GAAP) (Unaudited)
(Millions)
|
| | | | | | |
| | Successor |
| | 3/31/15 | 3/31/14 |
| | | |
| Total Debt | $ | 33,831 |
| $ | 32,778 |
|
| Less: Cash and cash equivalents | (4,010 | ) | (4,970 | ) |
| Less: Short-term investments | (166 | ) | (1,220 | ) |
| Net Debt* | $ | 29,655 |
| $ | 26,588 |
|
|
| |
| THE SPRINT QUARTERLY INVESTOR UPDATE - FISCAL 4Q14 | 19 |
SCHEDULE OF DEBT (Unaudited)
(Millions)
|
| | | | | |
| | | | 3/31/15 |
| ISSUER | COUPON | MATURITY | PRINCIPAL |
| Sprint Corporation | | | |
| 7.25% Notes due 2021 | 7.250% | 09/15/2021 | $ | 2,250 |
|
| 7.875% Notes due 2023 | 7.875% | 09/15/2023 | 4,250 |
|
| 7.125% Notes due 2024 | 7.125% | 06/15/2024 | 2,500 |
|
| 7.625% Notes due 2025 | 7.625% | 02/15/2025 | 1,500 |
|
| Sprint Corporation | | | 10,500 |
|
| | | | |
| Sprint Communications, Inc. | | | |
| Export Development Canada Facility (Tranche 2) | 4.080% | 12/15/2015 | 500 |
|
| Export Development Canada Facility (Tranche 3) | 3.495% | 12/17/2019 | 300 |
|
| 6% Senior Notes due 2016 | 6.000% | 12/01/2016 | 2,000 |
|
| 9.125% Senior Notes due 2017 | 9.125% | 03/01/2017 | 1,000 |
|
| 8.375% Senior Notes due 2017 | 8.375% | 08/15/2017 | 1,300 |
|
| 9% Guaranteed Notes due 2018 | 9.000% | 11/15/2018 | 3,000 |
|
| 7% Guaranteed Notes due 2020 | 7.000% | 03/01/2020 | 1,000 |
|
| 7% Senior Notes due 2020 | 7.000% | 08/15/2020 | 1,500 |
|
| 11.5% Senior Notes due 2021 | 11.500% | 11/15/2021 | 1,000 |
|
| 9.25% Debentures due 2022 | 9.250% | 04/15/2022 | 200 |
|
| 6% Senior Notes due 2022 | 6.000% | 11/15/2022 | 2,280 |
|
| Sprint Communications, Inc. | | | 14,080 |
|
| | | | |
| Sprint Capital Corporation | | | |
| 6.9% Senior Notes due 2019 | 6.900% | 05/01/2019 | 1,729 |
|
| 6.875% Senior Notes due 2028 | 6.875% | 11/15/2028 | 2,475 |
|
| 8.75% Senior Notes due 2032 | 8.750% | 03/15/2032 | 2,000 |
|
| Sprint Capital Corporation | | | 6,204 |
|
| | | | |
| Clearwire Communications LLC | | | |
| 14.75% First-Priority Senior Secured Notes due 2016 | 14.750% | 12/01/2016 | 300 |
|
| 8.25% Exchangeable Notes due 2040 | 8.250% | 12/01/2040 | 629 |
|
| Clearwire Communications LLC | | | 929 |
|
| | | | |
| Secured Equipment Credit Facilities | 1.853% - 2.204% | 2017 - 2022 | 610 |
|
| | | | |
| Tower financing obligation | 6.092% | 09/30/2021 | 275 |
|
| Capital lease obligations and other | | 2015 - 2023 | 127 |
|
| TOTAL PRINCIPAL | | | 32,725 |
|
| | | | |
| Net premiums | | | 1,106 |
|
| TOTAL DEBT | | | $ | 33,831 |
|

*This table excludes (i) our unsecured revolving bank credit facility, which will expire in 2018 and has no outstanding balance, (ii) $470 million in letters of credit outstanding under the unsecured revolving bank credit facility, and (iii) all capital leases and other financing obligations.
|
| |
| THE SPRINT QUARTERLY INVESTOR UPDATE - FISCAL 4Q14 | 20 |
NOTES TO THE FINANCIAL INFORMATION (Unaudited)
(1) Financial results include a Predecessor period from January 1, 2012, through the closing of the SoftBank transaction on July 10, 2013, and a Successor period from October 5, 2012 through March 31, 2014. In order to present financial results in a way that offers investors a more meaningful calendar period-to-period comparison, we have combined results of operations and cash flows for the Predecessor and Successor periods for the twelve-month period ended March 31, 2014. (See Financial Measures for further information).
| |
(2) | Postpaid connections on the Sprint platform are defined as retail postpaid devices with an active line of service on the CDMA network, including connections utilizing WiMax and LTE technology. Postpaid connections previously on the Nextel platform are defined as retail postpaid connections on the iDEN network, which was shut-down on June 30, 2013. Postpaid connections from transactions are defined as retail postpaid connections acquired from U.S. Cellular in May 2013 and Clearwire in July 2013 who had not deactivated or been recaptured on the Sprint platform. Included in Sprint platform net additions are tablets and connected devices, which generally generate a significantly lower ARPU than other postpaid connections. |
| |
(3) | Prepaid connections on the Sprint platform are defined as retail prepaid connections and session-based tablet users who utilize the CDMA network and WiMax and LTE technology via our multi-brand offerings. Prepaid connections previously on the Nextel platform are defined as retail prepaid connections who utilized the iDEN network, which was shut-down on June 30, 2013. Prepaid connections from transactions are defined as retail prepaid connections acquired from U.S. Cellular in May 2013 and Clearwire in July 2013 who had not deactivated or been recaptured on the Sprint platform. |
| |
(4) | Nextel Connection Recaptures are defined as the number of connections that deactivated service from the postpaid or prepaid Nextel platform, as applicable, during each period but remained with the Company as connections on the postpaid or prepaid Sprint platform, respectively. Connections that deactivated service from the Nextel platform and activated service on the Sprint platform are included in the Sprint platform net additions for the applicable period. |
| |
(5) | The Postpaid and Prepaid Nextel Recapture Rates are defined as the portion of total connections that left the postpaid or prepaid Nextel platform, as applicable, during the period and were retained on the postpaid or prepaid Sprint platform, respectively. |
| |
(6) | For the third quarter of fiscal year 2014, impairment losses were recorded after determining that the carrying value exceeded estimated fair value of both the Sprint trade name and Wireline asset group, which consists primarily of property, plant and equipment. |
| |
(7) | Severance and exit costs are primarily associated with work force reductions and exit costs associated with the Nextel platform and access terminations and those related to exiting certain operations of Clearwire. |
| |
(8) | For the third quarter of fiscal year 2014, litigation primarily includes legal reserves and fees incurred in relation to various pending legal suits and proceedings. |
| |
(9) | For the second and first quarters of fiscal year 2013, included in selling, general and administrative expenses are fees paid to unrelated parties necessary for the transactions with SoftBank and our acquisition of Clearwire. |
| |
(10) | The partial pension settlement resulted from amounts paid to eligible terminated participants who voluntarily elected to receive lump sum distributions as a result of an approved plan amendment to the Sprint Retirement Pension Plan by the Board of Directors in June 2014. |
| |
(11) | As a result of the U.S. Cellular asset acquisition, we recorded a liability related to network shut-down costs we agreed to reimburse U.S. Cellular. During the third quarter of fiscal year 2014, we identified favorable trends in actual costs and, as a result, reduced the liability resulting in a gain of approximately $41 million. |
| |
(12) | Hurricane Sandy amounts for the quarter-to-date December 31, 2013 period represent insurance recoveries. |
|
| |
| THE SPRINT QUARTERLY INVESTOR UPDATE - FISCAL 4Q14 | 21 |
*FINANCIAL MEASURES
On July 9, 2013, Sprint Communications, Inc. (formerly Sprint Nextel Corporation) completed its acquisition of Clearwire. On July 10, 2013 we consummated the SoftBank Merger with Starburst II, which immediately changed its name to Sprint Corporation (now referred to as the Company or Sprint). As a result of these transactions, the assets and liabilities of Sprint Communications, Inc. and Clearwire were adjusted to fair value on the respective closing dates. The Company's financial statement presentations herein distinguish between a predecessor period relating to Sprint Communications, Inc. for periods prior to the SoftBank Merger (Predecessor) and a successor period (Successor). The Successor information represents Sprint Corporation, which includes the activity and accounts of Sprint Communications, Inc. as of and for the three and twelve-month periods ended March 31, 2015 and the twelve-month period ended March 31, 2014. The accounts and activity for the successor periods from October 5, 2012 (date of inception) to December 31, 2012 and from January 1, 2013 to July 10, 2013 consist of the activity of Starburst II prior to the close of the SoftBank Merger. The Predecessor information contained herein represents the historical basis of presentation for Sprint Communications, Inc. for all periods prior to the SoftBank Merger date on July 10, 2013. As a result of the valuation of assets acquired and liabilities assumed at fair value at the time of the SoftBank Merger and Clearwire Acquisition, the financial statements for the successor period are presented on a measurement basis different than the predecessor period, which was Sprint Communication Inc.’s historical cost, and are, therefore, not comparable.
In order to present financial results in a way that offers investors a more meaningful calendar period-to-period comparison, we have combined the current and prior year results of operations for the predecessor with successor results of operations on an unaudited combined basis. The combined information for the twelve-month period ended March 31, 2014 does not purport to represent what our consolidated results of operations would have been if the acquisition had occurred as of April 1, 2013.
Sprint provides financial measures determined in accordance with GAAP and adjusted GAAP (non-GAAP). The non-GAAP financial measures reflect industry conventions, or standard measures of liquidity, profitability or performance commonly used by the investment community for comparability purposes. These measurements should be considered in addition to, but not as a substitute for, financial information prepared in accordance with GAAP. Other than the use of non-GAAP combined results as described above, we have defined below each of the non-GAAP measures we use, but these measures may not be synonymous to similar measurement terms used by other companies.
Sprint provides reconciliations of these non-GAAP measures in its financial reporting. Because Sprint does not predict special items that might occur in the future, and our forecasts are developed at a level of detail different than that used to prepare GAAP-based financial measures, Sprint does not provide reconciliations to GAAP of its forward-looking financial measures.
The measures used in this release include the following:
EBITDA is operating income/(loss) before depreciation and amortization. Adjusted EBITDA is EBITDA excluding severance, exit costs, and other special items. Adjusted EBITDA Margin represents Adjusted EBITDA divided by non-equipment net operating revenues for Wireless and Adjusted EBITDA divided by net operating revenues for Wireline. We believe that Adjusted EBITDA and Adjusted EBITDA Margin provide useful information to investors because they are an indicator of the strength and performance of our ongoing business operations. While depreciation and amortization are considered operating costs under GAAP, these expenses primarily represent non-cash current period costs associated with the use of long-lived tangible and definite-lived intangible assets. Adjusted EBITDA and Adjusted EBITDA Margin are calculations commonly used as a basis for investors, analysts and credit rating agencies to evaluate and compare the periodic and future operating performance and value of companies within the telecommunications industry.
ABPU is average billings per user and calculated by dividing service revenue earned from customers plus installment plan billings and lease revenue by the sum of the average number of connections during the period. We believe that ABPU provides useful information to investors, analysts and our management to evaluate average Sprint platform postpaid customer billings as it approximates the expected cash collections, including installment plan billings and lease revenue, per user each month.
Free Cash Flow is the cash provided by operating activities less the cash used in investing activities other than short-term investments, including changes in restricted cash, if any, and amounts included as investments in Clearwire and Sprint Communications, Inc. during the period, if applicable. We believe that Free Cash Flow provides useful information to investors, analysts and our management about the cash generated by our core operations after interest and dividends, if any, and our ability to fund scheduled debt maturities and other financing activities, including discretionary refinancing and retirement of debt and purchase or sale of investments.
Net Debt is consolidated debt, including current maturities, less cash and cash equivalents, short-term investments and, if any, restricted cash. We believe that Net Debt provides useful information to investors, analysts and credit rating agencies about the capacity of the company to reduce the debt load and improve its capital structure.
|
| |
| THE SPRINT QUARTERLY INVESTOR UPDATE - FISCAL 4Q14 | 22 |
SAFE HARBOR
This release includes “forward-looking statements” within the meaning of the securities laws. The words “may,” “could,” “should,” “estimate,” “project,” “forecast,” “intend,” “expect,” “anticipate,” “believe,” “target,” “plan,” “providing guidance,” and similar expressions are intended to identify information that is not historical in nature. All statements that address operating performance, events or developments that we expect or anticipate will occur in the future - including statements relating to our network, connections growth, and liquidity; and statements expressing general views about future operating results - are forward-looking statements. Forward-looking statements are estimates and projections reflecting management’s judgment based on currently available information and involve a number of risks and uncertainties that could cause actual results to differ materially from those suggested by the forward-looking statements. With respect to these forward-looking statements, management has made assumptions regarding, among other things, the development and deployment of new technologies and services; efficiencies and cost savings of new technologies and services; customer and network usage; connection growth and retention; service, speed, coverage and quality; availability of devices; the timing of various events and the economic environment. Sprint believes these forward-looking statements are reasonable; however, you should not place undue reliance on forward-looking statements, which are based on current expectations and speak only as of the date when made. Sprint undertakes no obligation to publicly update or revise any forward-looking statements, whether as a result of new information, future events or otherwise, except as required by law. In addition, forward-looking statements are subject to certain risks and uncertainties that could cause actual results to differ materially from our company's historical experience and our present expectations or projections. Factors that might cause such differences include, but are not limited to, those discussed in Sprint Corporation’s Transition Report on Form 10-K for the period ended March 31, 2014, and, when filed, our Form 10-K for the fiscal year ended March 31, 2015. You should understand that it is not possible to predict or identify all such factors. Consequently, you should not consider any such list to be a complete set of all potential risks or uncertainties.
About Sprint:
Sprint (NYSE: S) is a communications services company that creates more and better ways to connect its customers to the things they care about most. Sprint served more than 57 million connections as of March 31, 2015 and is widely recognized for developing, engineering and deploying innovative technologies, including the first wireless 4G service from a national carrier in the United States; leading no-contract brands including Virgin Mobile USA, Boost Mobile, and Assurance Wireless; instant national and international push-to-talk capabilities; and a global Tier 1 Internet backbone. Sprint has been named to the Dow Jones Sustainability Index (DJSI) North America for the past four years. You can learn more and visit Sprint at www.sprint.com or www.facebook.com/sprint and www.twitter.com/sprint.
###
|
| |
| THE SPRINT QUARTERLY INVESTOR UPDATE - FISCAL 4Q14 | 23 |